san mateo county probation department · client profile 2. risks/needs at entry ... community legal...
TRANSCRIPT
W W W . A P P L I E D S U R V E Y R E S E A R C H . O R G
1871 The Alameda, Ste 180San Jose, CA 95126
(408) 247-8319
CREATING RESULTS WITH YOUTH AND THEIR FAMILIES
San Mateo County Probation Department:Juvenile Justice Crime Prevention Act &Juvenile Probation and Camps Funding
November 17, 2016

A. Review Evaluation Plan
B. Current Year Evaluation Findings
1. Client Profile2. Risks/Needs at Entry
• Criminogenic Risk (pre-JAIS)• Service Needs (CANS)• Other Risk Indicators
3. Services Provided4. Outcomes
• JJCPA Mandated Juvenile Justice• Program-specific
5. Conclusions2
PRESENTATION OVERVIEW
OVERVIEW

3
REVISED EVALUATION PLAN 2015-16
OUTCOMES Decreased
Justice Involvement
Greater Engagement &
Connection to School
Improved
Family Functioning
Reduced
Substance Use
Improved
Emotional Well-Being
JAIS Prescreen
Criminogenic Risk
CANS
Youth Functioning &
Areas of Need
EVALUATION TOOLS
OVERVIEW

4
One-on-One
GroupCase
MgmtParent Ed/Counseling
Outreach
Acknowledge Alliance ✪ ✪
Assessment Center ✪ ✪
Family Preservation Program ✪ ✪ ✪
Fresh Lifelines for Youth ✪ ✪ ✪ ✪
StarVista – Insights ✪ ✪ ✪
Boys and Girls Clubs of the Peninsula ✪ ✪
Community Legal Services of EPA ✪ ✪ ✪
El Centro de Libertad ✪ ✪ ✪ ✪
Pyramid – Strengthen our Youth ✪ ✪ ✪ ✪
YMCA – School Safety Advocates ✪ ✪ ✪ ✪ ✪
Parent Programs ✪
JJC
PA
Gra
nte
es
JPC
F G
rante
es
SERVICES PROVIDED
ARRAY OF SERVICES OF JJCPA AND JPCF PROGRAMS
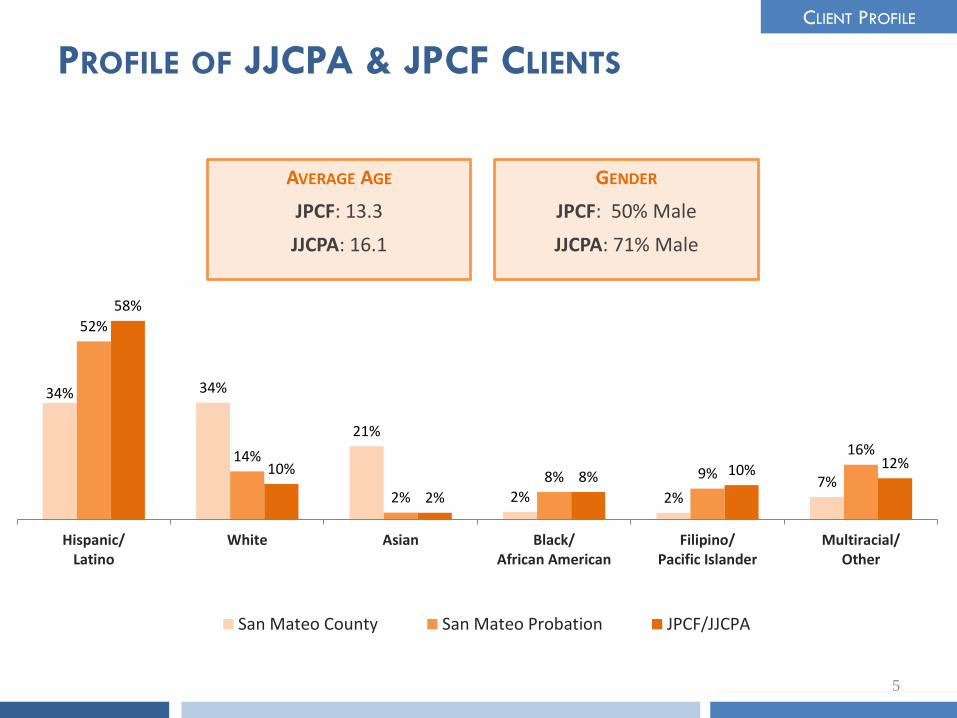
PROFILE OF JJCPA & JPCF CLIENTS
5
AVERAGE AGE
JPCF: 13.3
JJCPA: 16.1
GENDER
JPCF: 50% Male
JJCPA: 71% Male
34% 34%
21%
2% 2%7%
52%
14%
2%
8% 9%
16%
58%
10%
2%
8% 10% 12%
Hispanic/Latino
White Asian Black/African American
Filipino/Pacific Islander
Multiracial/Other
San Mateo County San Mateo Probation JPCF/JJCPA
CLIENT PROFILE

Clients by region:
• North (39%)
• South (38%)
• Mid (19%)
• Coast (5%)
6
East Palo Alto
(19.0%)
South San Francisco
(20.1%)
Daly City
(14.7%)
San Mateo
(14.9%)
Redwood City
(14.1%)
10% – 15%
> 15 %
< 1%
1% – 5%
0%
GEOGRAPHIC LOCATION
CLIENT PROFILE

7
PRE-JAIS RESULTS
RISKS & NEEDS
AA 61
AC 248
FPP 48
FLY 38
SV 46
CLSEPA 10
El Centro 12 Pyramid 84
Acknowledge Alliance Assessment Center
Family Preservation Fresh Lifelines
StarVista Insights Community Legal Services
El Centro Pyramid Alternatives
NUMBER ASSESSED
Total = 547

PRE-JAIS RESULTS
8
53%
89%
60%
35%
6%
29%
12% 6% 11%
JJCPA Programs JPCF Programs All Programs
High Moderate Low
RISK LEVEL
RISKS & NEEDS
JPCF programs served lower risk youth than JJCPA programs

9
CHILD/ADOLESCENT NEEDS AND STRENGTHS (CANS)
CANS
Mental Health
SubstanceUse
Relation-ships
Pro-Social
Family
School
RISKS & NEEDS

10
CANS RESULTS
RISKS & NEEDS
NUMBER ASSESSED
AA 47
FLY 40
SV 44
BGCP 7
CLSEPA 18
Pyramid 83
Acknowledge Alliance Fresh Lifelines
StarVista Insights Boys & Girls Clubs
Community Legal Services Pyramid Alternatives
Total = 239
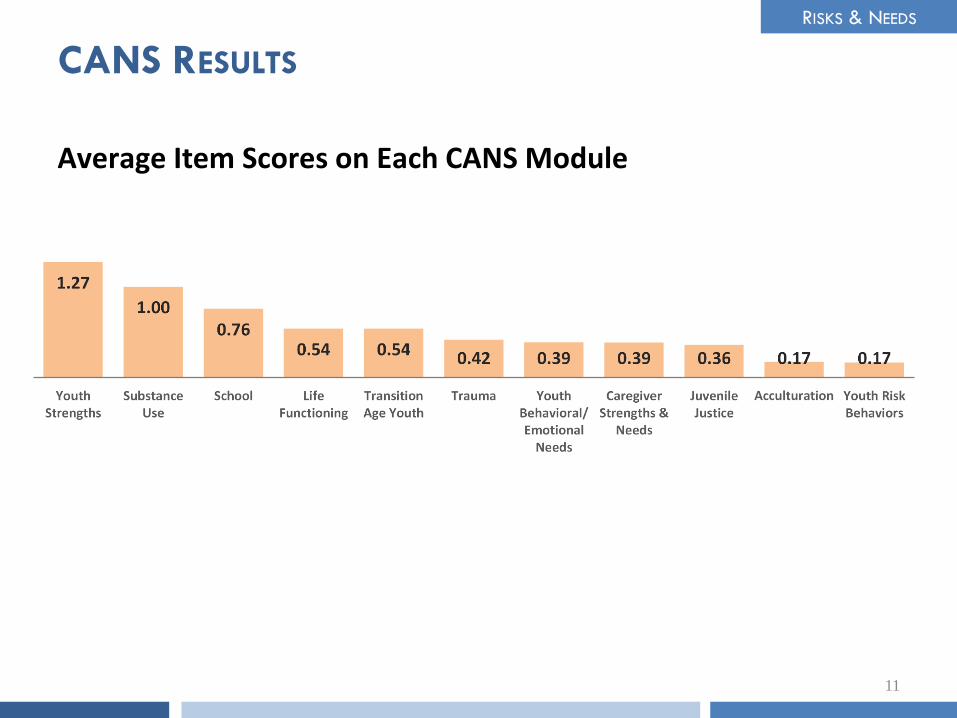
CANS RESULTS
11
RISKS & NEEDS
Average Item Scores on Each CANS Module
12
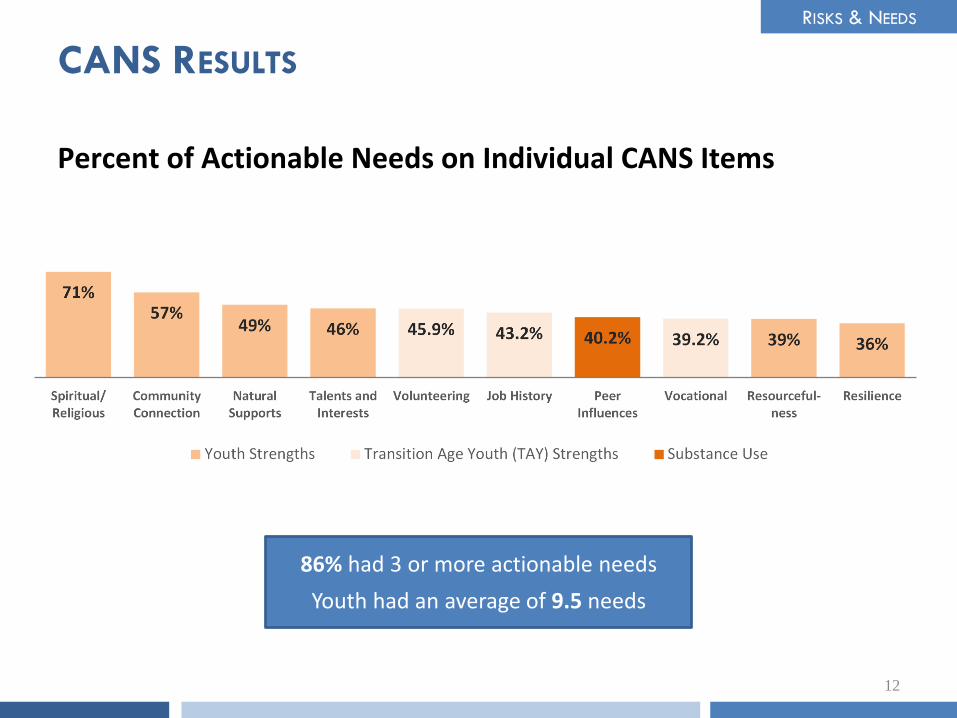
CANS RESULTS
RISKS & NEEDS
86% had 3 or more actionable needs
Youth had an average of 9.5 needs
Percent of Actionable Needs on Individual CANS Items
13
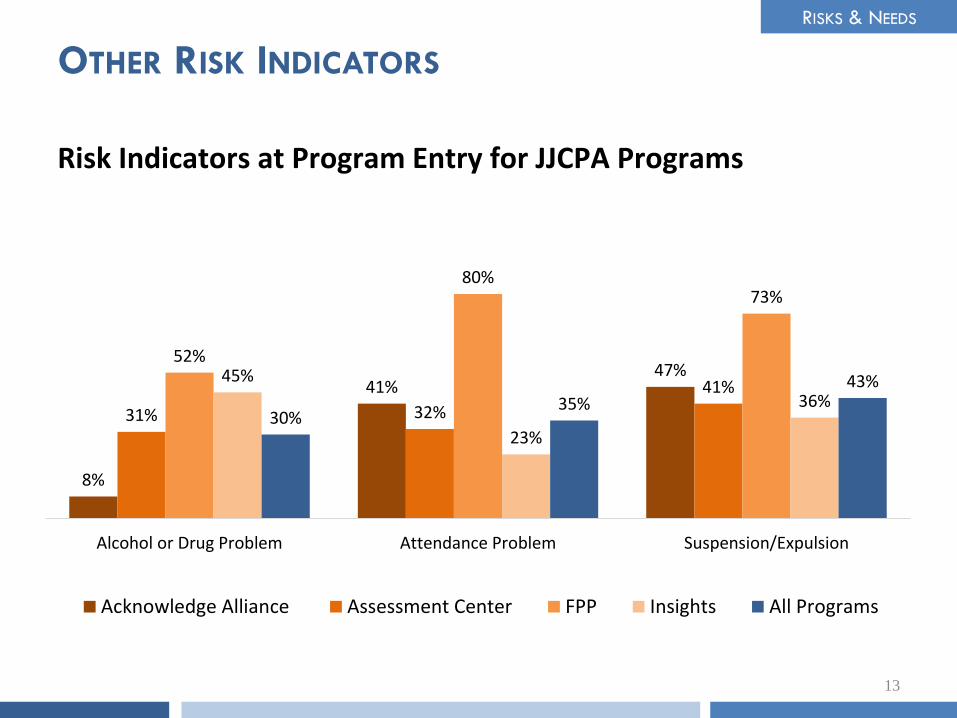
OTHER RISK INDICATORS
8%
41%47%
31% 32%
41%
52%
80%73%
45%
23%
36%30%
35%43%
Alcohol or Drug Problem Attendance Problem Suspension/Expulsion
Acknowledge Alliance Assessment Center FPP Insights All Programs
Risk Indicators at Program Entry for JJCPA Programs
RISKS & NEEDS

JJCPA MANDATED OUTCOMES
14
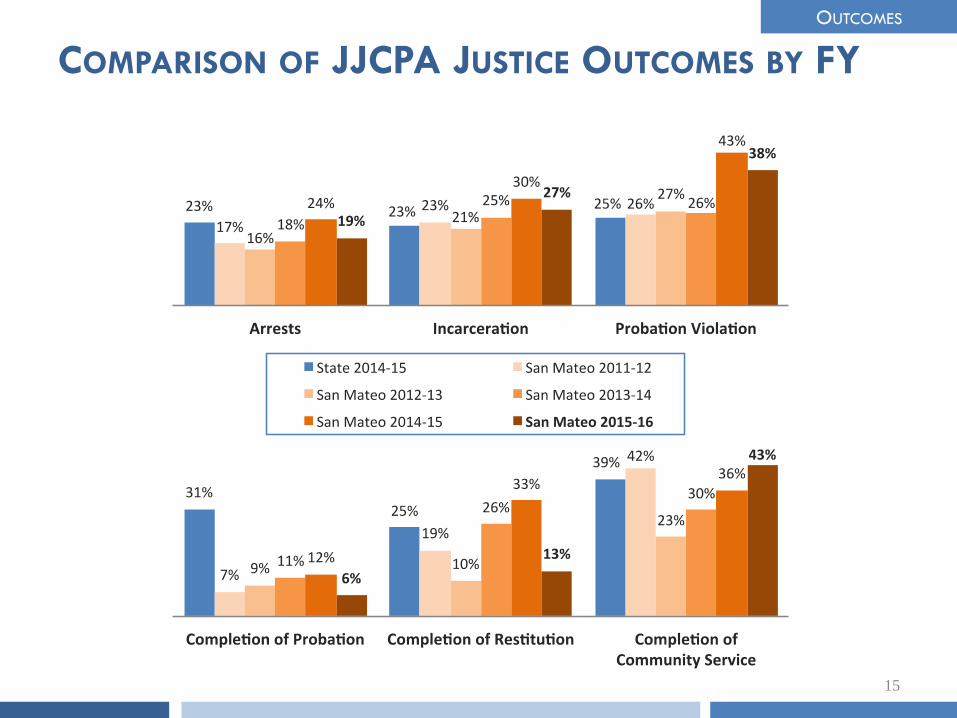
Outcomes Important notes
1. Arrest rate for new law violation Filed charges vs. sustained charges
2. Incarceration rate Reasons for incarceration
3. Probation violation rate Reasons for probation violation filings
4. Court-ordered probation
completion rate
Number of youth on probation varies by program;
not completed ≠ Fail
5. Court-ordered restitution
completion rateRestitution amounts vary; Not completed ≠ Fail
6. Court-ordered community service
completion rateNot completed ≠ Fail
Note: Number of cases varies with each outcome and program
OUTCOMES
15
COMPARISON OF JJCPA JUSTICE OUTCOMES BY FY
OUTCOMES

JUVENILE HALL POPULATION
16
The average daily Juvenile Hall population, a local outcome for the Assessment Center, has been decreasing over time, down 52% since FY 2008-09 and 11% since FY 2014-15.
OUTCOMES
162 159
125123
111
87 8878
2008-09 2009-10 2010-11 2011-12 2012-13 2013-14 2014-15 2015-16
↓ 52%

OUTCOMES
PROGRAM-SPECIFIC OUTCOMES
Acknowledge Alliance
125 youth assessed showed an 11% increase
in global functioning from pre to post
Family Preservation Program
Only 1 out of 48 youth was given an out-of-
home placement order
StarVista Insights
98% of youth made progress on a self-
identified goal;
67% showed improved decision-making and
relationships skills
Boys & Girls Clubs of the Peninsula
343 youth surveyed had mostly favorable views
of the safety and academic rigor of the
program
Community Legal Services of EPA
Benefits of services included: prevented loss
of housing (30%), enforced housing rights
(24%) and economic advancement (19%)
Probation Parent Programs
41 parents surveyed improved on items related to enforcing
consequences, parent-child relationship and
communication
Reaching the most over-represented groups in the Juvenile Justice system
Serving youth with lower recidivism risk in JPCF programs and higher risk youth in JJCPA programs
– Low risk on pre-JAIS: JPCF (89%) vs. JJCPA (53%)
– Remaining challenge: Data not necessarily representative of all programs, CBOs need to improve completeness of data
Serving youth with needs across domains of functioning, especially related to lack of strengths, substance use and school functioning
‒ Highest scores on CANS modules (Youth Strengths, Substance Use, School) confirmed with data on other risk factors (JJCPA only)
‒ Remaining challenge: Need more complete CANS data and post-test data to evaluate changes in needs and functioning over time
18
CONCLUSIONS
IN CONCLUSION, OUR PROGRAMS ARE:

Helping to keep youth out of Juvenile Hall
‒ Average daily population has declined 52% since 2008-09; arrests below state rate for 2014-15
‒ Remaining challenge: Though rates for incarceration and probation violations declined slightly in FY 2015-16, they remain above state rate
19
CONCLUSIONS
IN CONCLUSION, OUR PROGRAMS ARE:


THANK YOU!
21
THANK YOU