san mateo county congestion management program 2011...
TRANSCRIPT

San Mateo County Congestion Management Program
2011
Appendices

APPENDIX A
Detailed Inventory of CMP Roadways and Intersections

A-1
Appendix A Detailed Inventory of CMP Roadways and Intersections The following pages describe the functional classifications and numbers of lanes of the California State Highways within San Mateo County and the other roadways and intersections included in the 1997 CMP Roadway System. The information described here was collected by conducting field surveys and recording data. The numbers of lanes and roadway types are described for the following State Highways:
SR 1 Between the county lines of Santa Cruz and San Francisco Counties;
SR 35 Between the San Francisco and Santa Clara County lines;
SR 82 Between the county lines of Santa Clara and San Francisco Counties;
SR 84 From SR 1 to the Alameda County line;
SR 92 From SR 1 to the Alameda County line;
U.S. 101 Between the county lines of Santa Clara and San Francisco Counties;
SR 109 From Kavanaugh Drive to SR 84;
SR 114 From U.S. 101 to Bayfront Expressway (SR 84);
I-280 Between the county lines of Santa Clara and San Francisco Counties; and
I-380 Between I-280 and North Access Road (east of U.S. 101).
The numbers of lanes and classifications of the other roadways and the lane configurations and signal phasings of the intersections included in the CMP network were also determined. This information was obtained from the cities in which the facilities are located and from field surveys. SR 1 From the Santa Cruz County line north to Linda Mar Boulevard, SR 1 is a two-lane conventional highway. Between Linda Mar Boulevard and Westport Drive (just south of Sharp Park Road), SR 1 is a four-lane highway. North of Westport Drive, SR 1 is a four-lane freeway until it reaches its junction with SR 35, where it becomes a six-lane freeway. At its junction with I-280, SR 1 joins I-280 to travel north until John Daly Boulevard. SR 1 then continues northward, as a six-lane freeway, across the San Francisco County line.

Appendix A - Detailed Inventory of CMP Roadways
A-2
SR 35 North of I-280 (near Crestmoor Drive in San Bruno), SR 35 is a two- to four-lane arterial and four-lane expressway which extends northward across the San Francisco County line. The variations in the numbers of lanes and roadway types are described briefly below.
• SR 35 is a four-lane expressway from the I-280 interchange north becoming a two-lane arterial south of San Bruno Avenue.
• SR 35 is a two-lane arterial to the signalized intersection of Sneath Lane, then a four-
lane arterial north of Sneath Lane to Sharp Park Road, and a two-lane arterial north of Sharp Park Road to Hickey Boulevard.
• North of Hickey Boulevard, SR 35 becomes a four-lane arterial, and then a four-lane
freeway as it passes through the SR 1 interchange.
• Approximately one mile north of the SR 1 interchange, SR 35 becomes a four-lane expressway, and continues as such into San Francisco County.
South of Bunker Hill Drive, SR 35 becomes a two-lane rural road. After a short section where SR 92 and SR 35 share the same roadway, SR 35 becomes Skyline Boulevard south to Santa Clara County. SR 82 (El Camino Real/Mission Street) SR 82 is a four- to six-lane arterial which extends north from the Santa Clara County line across the San Francisco County line. The following street segments are not six lanes wide:
Roble Avenue to Glenwood Avenue Four lanes
SR 84 overpass to Whipple Avenue Four lanes
Whipple Avenue to F Street Two lanes northbound, and (in San Mateo) three lanes southbound
F Street to 42nd Street Four lanes
42nd Street to Hillsdale Boulevard Two lanes northbound, and
three lanes southbound
East Third Avenue to south of Trousdale Drive Four lanes
Hickey Boulevard to Mission Road Four lanes

Appendix A-Detailed Inventory of CMP Roadways
A-3
Westlake Avenue to John Daly Boulevard Four lanes SR 84 SR 84 (Woodside Road) is a four-lane arterial between I-280 and SR 82 (except for a short segment between San Carlos Avenue and Santa Clara Avenue which is six-lanes wide). SR 84 is a four-lane expressway between SR 82 and Bay Road. East of Bay Road to U.S. 101, SR 84 is a six-lane expressway. At its junction with U.S. 101, SR 84 joins U.S. 101 to travel south until the Marsh Road exit, where SR 84 follows the Bayfront Expressway to the Dumbarton Bridge. The Bayfront Expressway is six-lane wide from Marsh Road to east of University Avenue. SR 84 is a two-lane conventional highway from west of I-280 to SR 1. (Note: Signs on U.S. 101 still indicate Willow Road (SR 114) to be SR 84.) SR 92 SR 92 is a four-lane freeway between I-280 and U.S. 101. SR 92 is a six-lane freeway between U.S. 101 and the Alameda County Line, across the San Mateo Bridge. West of I-280 to SR 1, SR 92 is a two-lane conventional highway. U.S. 101 U.S. 101 is an eight- to ten-lane freeway in San Mateo County. The lane changes for this north/south facility are as follows:
• U.S. 101 is an eight-lane freeway from the Santa Clara County line to the Whipple Avenue interchange comprising six mixed-flow lanes and two High Occupancy Vehicle (HOV) lanes.
• U.S. 101 is an eight-lane freeway from the Whipple Avenue interchange to the San
Francisco County line, with the following two exceptions:
1. Between Marsh Road and Hillsdale Blvd, an auxiliary lane has been added in each direction.
2. Northbound U.S. 101 is six lanes wide between the SR 92 and Kehoe Avenue off-
ramps, and five lanes wide between the Kehoe Avenue and Third Avenue off-ramps. Southbound U.S. 101 remains four lanes wide.
3. U.S. 101 is a ten-lane freeway from north of the Millbrae Avenue interchange ramps to
south of the I-380 interchange ramps. SR 109

Appendix A - Detailed Inventory of CMP Roadways
A-4
University Avenue has been designated as SR 109 between SR 84 and Kavanaugh Drive. SR 109 is a four-lane arterial. SR 114 Willow Road, which has been designated as SR 114 between U.S. 101 and Bayfront Express-way, is a four-lane arterial. I-280 I-280 is a 6- to 12-lane freeway in San Mateo County. The variations in the number of lanes on this north/south facility are described below. * I-280 is an eight-lane freeway from the Santa Clara County line north to the I-280/SR 1
interchange in Daly City, with the following exceptions:
1. Between Edgewood Road and the interchange with SR 92, I-280 contains five north-bound and five southbound lanes. Each five-lane segment is approximately two miles long and signed: “Slow Vehicles Keep Right”.
2. Through the I-380 interchange, northbound I-280 has only three lanes, while south-
bound I-280 widens to include a fifth, auxiliary lane. * I-280 is a 12-lane freeway, north of the SR 1 interchange (south) to the SR 1 interchange
(north). * I-280 is a six-lane freeway, north of its northern junction with SR 1 to the San Francisco
County line, where the freeway widens to eight lanes. I-380 I-380 is an east/west freeway which connects I-280 and U.S. 101, and extends east of U.S. 101 to provide access to the San Francisco International Airport. Between I-280 and U.S. 101, I-380 is four lanes wide in the westbound direction and three lanes wide in the eastbound direction. East of U.S. 101, I-380 is a freeway ramp, narrowing down to two lanes in each direction and terminating at North Access Road (by United Airlines Maintenance Facility.)

Appendix A-Detailed Inventory of CMP Roadways
A-5
Other CMP Roadways The CMP roadway system also includes three roadways which are not state highways. These arterials, all located in Daly City, are described briefly below:
• Mission Street is a four-lane arterial that extends from SR 82 (San Jose Avenue) to the northeast, across the San Francisco County line.
• Bayshore Boulevard is an arterial that extends southward from its junction with U.S. 101
in San Francisco County through Brisbane, where it becomes Airport Boulevard. The CMP network only includes the segment of Bayshore Boulevard between the San Francisco County line and Geneva Avenue. This segment is three lanes wide in the northbound direction and two lanes wide in the southbound direction.
• Geneva Avenue is a four-lane arterial that extends to the northwest from Bayshore
Boulevard across the San Francisco County line to Mission Street. CMP Intersections The CMP roadway system also includes 16 intersections. These were not included in the 1991 CMP and were added for the 1993 CMP. The 16 intersections are:
Geneva Avenue and Bayshore Boulevard SR 35 (Skyline Boulevard) and John Daly Boulevard SR 82 (Mission Street) and John Daly Boulevard/Hillside Boulevard SR 82 (El Camino Real) and San Bruno Avenue SR 82 (El Camino Real) and Millbrae Avenue SR 82 (El Camino Real) and Broadway SR 82 (El Camino Real) and Peninsula Avenue SR 82 (El Camino Real) and Ralston Avenue SR 82 (El Camino Real) and Holly Street SR 82 (El Camino Real) and Whipple Avenue SR 84 (Bayfront Expressway) and SR 109 (University Avenue) SR 84 (Bayfront Expressway) and SR 114 (Willow Road) SR 84 (Bayfront Expressway) and Marsh Road SR 84 (Woodside Road) and Middlefield Road SR 92 and SR 1 SR 92 and Main Street.

APPENDIX B
Traffic Level of Service Calculation Methods

B-1
Appendix B Traffic Level of Service Calculation Methods Level of service (LOS) is a term used to qualitatively describe the operating conditions of a roadway based on factors such as speed, travel time, maneuverability, delay, and safety. The level of service of a facility is designated with a letter, A to F, with A representing the best operating conditions and F the worst. There are many methods available to calculate the levels of service for the various types of roadways and intersections that comprise San Mateo County's designated Congestion Management Program (CMP) system. The components of the CMP Roadway System include freeways, such as U.S. 101 and I-280; multilane highways; two-lane highways, such as State Route 1 (SR 1), south of Linda Mar; major arterials, such as SR 82 (El Camino Real); and major intersections. Operational analyses of specific weaving sections and ramp junctions have not been included in the CMP but may be added for subsequent CMPs. AB 471 and AB 1963, the CMP legislation, require that methods of calculating levels of service defined either by the latest version of the Highway Capacity Manual (HCM) or by the Transpor-tation Research Board's Circular 212 be used for the analysis of CMP roadways. San Mateo County has been using the level of service methods specified in the HCM published in 1994 for freeways, multilane highways, two-lane highways, arterials, freeway weaving sections, ramp junctions, signalized intersections, and unsignalized intersections. The TRB's Circular 212 describes methods for signalized and unsignalized intersections. The level of service (LOS) calculation methods found in the 1994 HCM for freeways, multilane highways, two-lane highways, and arterials and the calculation for signalized intersections based on TRB's Circular 212 method are described in this appendix. Level of Service Calculation Methods The methods selected to calculate levels of service for the roadway (freeway, multilane highway, two-lane highway, and arterial) segments and intersections included in the CMP network are described below: Freeways A freeway is defined as a divided highway facility with two or more lanes in each direction and full control of access and egress. It has no intersections; access and egress are provided by ramps at interchanges. According to the Highway Capacity Manual (1994 HCM), the LOS of freeway segments is based on the density of vehicles, expressed in passenger cars per mile per lane. The LOS can also be evaluated with volume-to-capacity (V/C) ratios, average travel speeds, and maximum service flow rates. The specific LOS criteria for freeways are presented in Table B-1. Illustrations of the various levels of service are presented on Figure B-1.

B-2 .
The selected LOS method for freeway segments is based on calculating V/C ratios for each direction of travel, wherein the traffic volume for each segment is divided by the capacity of the segment. The volumes are obtained from counts for existing conditions or from a travel forecasting model for future conditions. The capacity is estimated as the number of lanes multiplied by 2,200 vehicles per hour per lane four four-lane freeway segments and 2,300 vehicles per hour per lane for segments with six or more lanes. The V/C ratios are calculated and related to LOS based on the relationships presented in Table B-1. Another method of calculating a freeway segment's level of service is to determine the average travel speed from floating car runs. Descriptions of the average travel speeds for each LOS designation are also presented in Table B-1. Multilane Highways Multilane highways generally have posted speed limits of between 40 and 55 miles per hour (mph). They usually have four or six lanes, often with physical medians or two-way left-turn lane medians, although they may also be undivided (have no median). Unlike freeways, multilane highways are interrupted by intersections or driveways. The level of service criteria for multilane highways are similar to the criteria for freeways. The specific criteria from the HCM are presented in Table B-2. The LOS calculation method is identical to the calculation method for freeways. The only difference is the range of V/Cs and speeds for each LOS designation. The maximum ideal lane capacity for a multilane highway segment is 2,200 vehicles per hour. Two-Lane Highways A two-lane highway is defined as a two-lane roadway with one lane for use by traffic in each direction. Passing of slower vehicles requires use of the opposing lane. As volumes or geomet-ric constraints increase, the ability to pass decreases and platoons of vehicles are formed. The delay experienced by motorists also increases. The LOS for two-lane highways is based on mobility. The specific LOS criteria from the 1994 HCM are presented in Table B-3. For two-lane highways, the selected method, based on V/Cs, takes into account the volume in both directions. The total volume is divided by the total capacity of 2,800 vehicles per hour. The corresponding V/C is correlated to a LOS based on the V/C ranges in Table B-3. Average travel speeds for each LOS designation are also presented in this table.

Table B-1 1994 HCM Level of Service Criteria for Basic Freeway Sections
70 mph Free-Flow Speed
65 mph
Free-Flow Speed
60 mph
Free-Flow Speed
LOS
Densitya (pc/mi/ln)
Speedb (mph)
Maximumc
V/C
MSFd
(pcphpl)
Densitya (pc/mi/ln)
Speedb (mph)
Maximumc
V/C
MSFd
(pcphpl)
Densitya (pc/mi/ln)
Speedb (mph)
Maximumc
V/C
MSFd
(pcphpl)
A
10.0
70.0
0.318/0.304
700
10.0
65.0 0.295/0.283
650
10.0
60.0
0.272/0.261
600
B
16.0
70.0
0.509/0.487
1,120
16.0
65.0
0.473/0.457
1,040
16.0
60.0
0.436/0.412
960
C
24.0
68.5
0.747/0.715
1,644
24.0
64.5
0.704/0.673
1,548
24.0
60.0
0.655/0.626
1,440
D
32.0
63.0
0.916/0.876
2,015
32.0
61.0
0.887/0.849
1,952
32.0
57.0
0.829/0.793
1,824
E
36.7/39.7
60.0/58.0
1.000
2,200/2,300
39.3/43.4
56.0/53.0
1.000
2,200/2,300
41.5/46.0
53.0/50.0
1.000
2,200/2,300
F
Variable
Variable
Variable
Variable
Variable
Variable
Variable
Variable
Variable
Variable
Variable
Variable
a Density in passenger cars per mile per lane. b Average travel speed in miles per hour. c Maximum volume-to-capacity ratio. d Maximum service flow rate under ideal conditions in passenger cars per hour per lane.
less than or equal to greater than or equal to
Note: In table entries with split values, the first value is for four-lane freeways, and the second is for six- and eight-lane freeways. Source: Transportation Research Board, Highway Capacity Manual, Special Report 209 (Washington, D.C., 1994), pp. 3-9.

Table B-2 Level of Service Criteria for Multilane Highways
60 mph Free-Flow Speed
55 mph
Free-Flow Speed
50 mph
Free-Flow Speed
LOS
Densitya (pc/mi/ln)
Speedb (mph)
Maximumc
V/C
MSFd
(pcphpl)
Densitya (pc/mi/ln)
Speedb (mph)
Maximumc
V/C
MSFd
(pcphpl)
Densitya (pc/mi/ln)
Speedb (mph)
Maximumc
V/C
MSFd
(pcphpl)
A
12
60
0.33
720
12
55
0.31
660
12
50
0.30
600
B
20
60
0.55
1,200
20
55
0.52
1,100
20
50
0.50
1,000
C
28
59
0.75
1,650
28
54
0.72
1,510
28
50
0.70
1,400
D
34
51
0.89
1,940
34
53
0.86
1,800
34
49
0.84
1,670
E
40
55
1.00
2,200
41
51
1.00
2,100
43
47
1.00
2,000
F
> 40e
< 55e
-e
-e
> 41e
< 51e
-e
-e
> 43e
< 47d
-e
-e
a Density in passenger cars per mile per lane. b Average travel speed in miles per hour. c Maximum volume-to-capacity ratio. d Maximum service flow rate under ideal conditions in passenger cars per hour per lane. e Highly variable, unstable.
less than or equal to greater than or equal to
Source: Transportation Research Board, Highway Capacity Manual, Special Report 209 (Washington, D.C., 1994), pp. 7-8.

Table B-3 Level of Service Criteria for General Two-Lane Highway Segments
V/C Ratioa
Level Terrain
Rolling Terrain
Mountainous Terrain
% No-Passing Zone
% No-Passing Zone
% No-Passing Zone
LOS
% Time Delay
Avg.b Speed
0
20
40
60
80
100
Avg.b Speed
0
20
40
60
80
100
Avg.b Speed
0
20
40
60
80
100
A
30
58
0.15
0.12
0.09
0.07
0.05
0.04
57
0.15
0.10
0.07
0.05
0.04
0.03
56
0.14
0.09
0.07
0.04
0.02
0.01
B
45
55
0.27
0.24 0.21
0.19
0.17
0.16
54
0.26
0.23
0.19
0.17
0.15
0.13
54
0.25
0.20
0.16
0.13
0.12
0.10
C
60
52
0.43
0.39 0.36
0.34
0.33
0.32
51
0.42
0.39
0.35
0.32
0.30
0.28
49
0.39
0.33
0.28
0.23
0.20
0.16
D
75
50
0.64
0.62 0.60
0.59
0.58
0.57
49
0.62
0.57
0.52
0.48
0.46
0.43
45
0.58
0.50
0.45
0.40
0.37
0.33
E
> 75
45
1.00
1.00 1.00
1.00
1.00
1.00
40
0.97
0.94
0.92
0.91
0.90
0.90
35
0.91
0.87
0.84
0.82
0.80
0.78
F
100
< 45
--
--
--
--
--
--
< 40
--
--
--
--
--
--
< 35
--
--
--
--
--
--
a Ratio of flow rate to an ideal capacity of 2,800 passenger cars per hour in both directions. b Average travel speed of all vehicles (in mph) for highways with design speed 60 mph; for highways with lower design speeds, reduce speed by 4 mph for
each 10-mph reduction in design speed below 60 mph; assumes that speed is not restricted to lower values by regulation.
less than or equal to greater than or equal to
Source: Transportation Research Board, Highway Capacity Manual, Special Report 209 (Washington, D.C., 1994), pp. 8-5.

Appendix B
B-6
CTraffic Level of Service Calculation Methods
Arterials Levels of service for arterials are dependent on the arterial class denoted as Type I, II, or III. Type I arterials are principal arterials with suburban design, 1 to 5 signals per mile, no parking, and free-flow speeds of 35 to 45 miles per hour (mph). Type III arterials have urban designs, with 6 to 12 signals per mile, parking permitted, and are undivided with free-flow speeds of 25 to 35 miles per hour. Type II arterials fall between Type I and III and have free-flow speeds of 30 to 35 miles per hour. The LOS for an arterial is based on maneuverability, delays, and speeds. As the volume increases, the probability of stopping at an intersection due to a red signal indication increases and the LOS decreases. The specific LOS criteria from the HCM are presented in Table B-4. For the CMP, a calculation method based on V/C was selected. Volumes on each roadway segment in each direction are divided by the capacity, estimated to be 1,100 vehicles per hour per lane. The capacity was estimated based on a saturation flow rate of 1,900 vehicles per lane and the assumption that El Camino Real would receive 60 percent of the green time.1 With the assumption that streets perpendicular to El Camino Real would receive 40 percent of each intersection's green time, the reduction in El Camino Real's capacity due to intersecting streets has been accounted for in the method used to analyze levels of service of arterial streets. Except for the 16 designated intersections, the operations of individual intersections, which are the locations where a street capacity is most constrained, are not analyzed for the CMP. Therefore, the levels of service presented for various roadway segments along El Camino Real are likely to be better than the level of service of individual intersections. The V/C for arterials is correlated to LOS based on the information in Table B-5. The average speeds for each LOS designation are presented in Table B-4.
1The estimated capacity for El Camino Real was calculated by multiplying 1,900 vehicles per hour per lane by 0.6, to arrive at 1,140 vehicles per hour per lane which was then rounded off to 1,100 vehicles per hour per lane.

Appendix BCTraffic Leve
B-7
Table B-4 Level of Service Criteria for Arterials
Arterial Class
I
II
III
Range of Free-Flow peeds (mph) S
45 to 35
35 to 30
35 to 25
Typical Free-Flow peed (mph) S
40 mph
33 mph
27 mph
Level of Service
Av rage Travel Speed (mph)e
A
35
30
25
B
28
24
19 C
22
18
13
D
17
14
9
E
13
10
7
F
< 13
< 10
< 7
mph miles per hour
less than or equal to greater than or equal to
Source: Transportation Research Board, Highway Capacity Manual, Special Report 209
(Washington, D.C., 1994), pp. 11-4.
Appendix BCTraffic Level of Service Calculation Methods
B-8
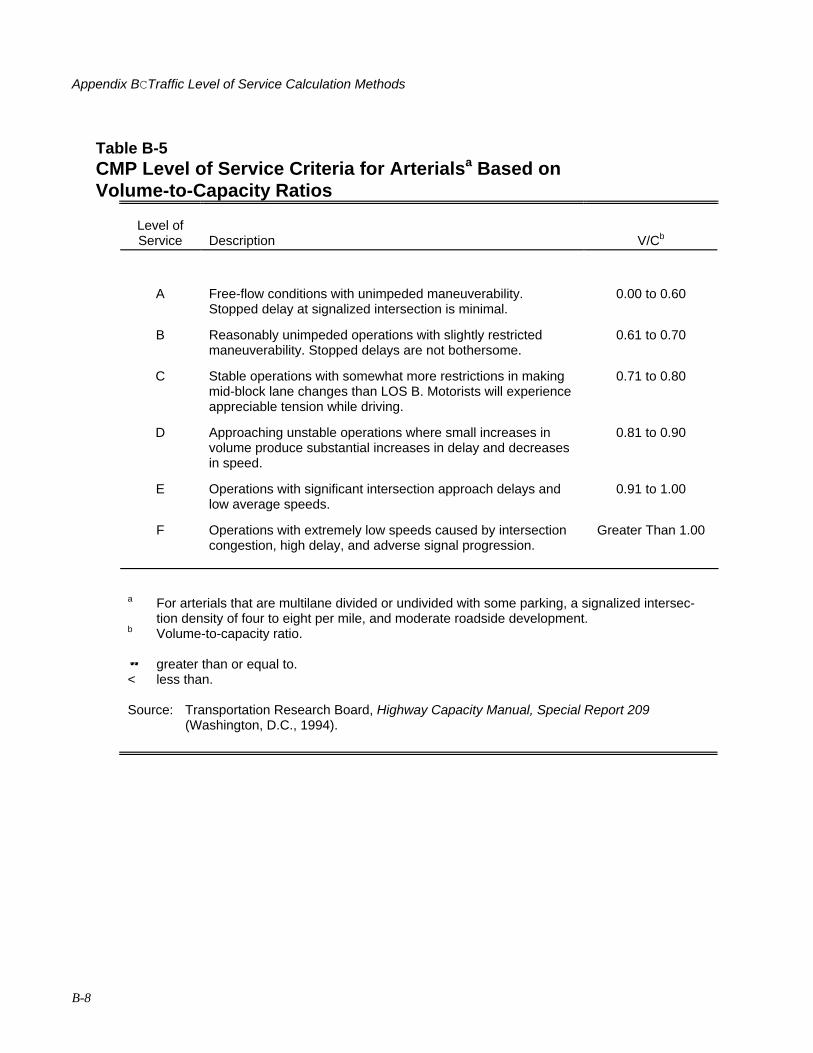
Table B-5 CMP Level of Service Criteria for Arterialsa Based on Volume-to-Capacity Ratios
Level of Service
Description
V/Cb
A
Free-flow conditions with unimpeded maneuverability. Stopped delay at signalized intersection is minimal.
0.00 to 0.60
B
Reasonably unimpeded operations with slightly restricted maneuverability. Stopped delays are not bothersome.
0.61 to 0.70
C
Stable operations with somewhat more restrictions in making mid-block lane changes than LOS B. Motorists will experience appreciable tension while driving.
0.71 to 0.80
D
Approaching unstable operations where small increases in volume produce substantial increases in delay and decreases in speed.
0.81 to 0.90
E
Operations with significant intersection approach delays and low average speeds.
0.91 to 1.00
F
Operations with extremely low speeds caused by intersection congestion, high delay, and adverse signal progression.
Greater Than 1.00
a For arterials that are multilane divided or undivided with some parking, a signalized intersec-
tion density of four to eight per mile, and moderate roadside development. b Volume-to-capacity ratio.
greater than or equal to. < less than. Source: Transportation Research Board, Highway Capacity Manual, Special Report 209
(Washington, D.C., 1994).

Appendix BCTraffic Leve
B-9
Signalized Intersections The TRB Circular 212 Planning method is the selected level of service calculation method for the designated intersections in the San Mateo County's CMP Roadway System. A signalized intersection's level of service, according to the method described in TRB Circular 212, is based on dividing the sum of the critical volumes by the intersection's capacity. This calculation yields the volume-to-capacity ratio (V/C). The critical movements are the combinations of through movements plus right-turn movements if there is no exclusive right-turn lane, and opposing left-turn movements that represent the highest per-lane volumes. Descriptions of levels of service for signalized intersections, together with their correspond-ing V/Cs, are presented in Table B-6. Table B-6 Intersection Level of Service Definitions
Level of Service
Interpretation
V/C Ratio
A
Uncongested operations; all queues clear in a single signal cycle.
Less Than 0.60
B
Very light congestion; an occasional approach phase is fully utilized.
0.60 to 0.69
C
Light congestion; occasional backups on critical ap-proaches.
0.70 to 0.79
D
Significant congestion on critical approaches, but inter-section functional. Cars required to wait through more than one cycle during short peaks. No long-standing queues formed.
0.80 to 0.89
E
Severe congestion with some long-standing queues on critical approaches. Blockage of intersection may occur if traffic signal does not provide for protected turning movements. Traffic queue may block nearby intersec-tions(s) upstream of critical approach(es).
0.90 to 0.99
F
Total breakdown, stop-and-go operation.
1.00 and Greater
In the TRB Circular 212 method, the capacity of an intersection is based on an average saturation flow rate and percent lost time. The saturation flow rate is the maximum number of vehicles per lane that can pass a fixed point in one hour with 100 percent green time. The

Appendix BCTraffic Level of Service Calculation Methods
B-10
average saturation flow rate measured in San Mateo County is 1,980 vehicles per hour of green per lane (vphpgpl). The lost time is the time when vehicles are not entering the intersection due to changes in signal indications. Percent lost time is the lost time divided by the cycle length. The average percent lost time measured in San Mateo County for intersec-tions with four or more phases is 12 percent. The intersection capacities, based on San Mateo County data, for signalized intersections with two, three, and four or more signal phases are presented in Table B-7. These capacities are used with the Circular 212 Planning method to evaluate the levels of service for San Mateo County's CMP intersec-tions. Table B-7 Intersection Capacities
Number of
Signal Phases
Capacity (in vph)
2
1,850
3
1,760
4 or more
1,700

APPENDIX C
BAAQMD’s Deficiency List


APPENDIX D
Guidelines for Deficiency Plan


APPENDIX E
Descriptions of Transportation Control Measures (TCM)

M E T R O P O L I T A N T R A N S P O R T A T I O N C O M M I S S I O N 131
* Deleted by EPA action from 1999 Ozone Attainment Plan
** Deleted by EPA action from 1999 Ozone Attainment Plan, but retained in Carbon Monoxide Maintenance Plan
TCM Number Federal Transportation Control Measure
appendix three
Federal TCMs in the State Implementation Plan
Original TCMs from 1982 Bay Area Air Quality Plan
TCM 1 Reaffirm commitment to 28 percent transit ridership increase between 1978 and 1983
TCM 2 Support post-1983 improvements in the operators’ five-year plans and, after consultation with the operators, adopt ridership increase target for the period 1983 through 1987
TCM 3 Seek to expand and improve public transit beyond committed levels
TCM 4 High-occupancy-vehicle (HOV) lanes and ramp metering
TCM 5 Support RIDES efforts
TCM 6* Continue efforts to obtain funding to support long-range transit improvements
TCM 7 Preferential parking
TCM 8 Shared-use park-and-ride lots
TCM 9 Expand commute alternatives program
TCM 10 Information program for local governments
TCM 11** Gasoline Conservation Awareness Program (GasCAP)
TCM 12** Santa Clara County commuter transportation program
Contingency Plan TCMs Adopted by MTC in February 1990 (MTC Resolution 2131)
TCM 13 Increase bridge tolls to $1.00 on all bridges
TCM 14 Bay Bridge surcharge of $1.00
TCM 15 Increase state gas tax by 9 cents
TCM 16* Implement MTC Resolution 1876, Revised — New Rail Starts
TCM 17 Continue post-earthquake transit services
TCM 18 Sacramento-Bay Area Amtrak service
TCM 19 Upgrade Caltrain service
TCM 20 Regional HOV System Plan
TCM 21 Regional transit coordination
Transportation Control Measures (TCMs) are strategies to reduce vehicle emissions. The federal TCMs shown below were added
over successive revisions to the State Implementation Plan (SIP). With the exception of the five new TCMs (A-E), the original set
of 28 TCMs has been completed.
transportation control measures
(Continues on next page)

T R A N S P O R T A T I O N 2 0 3 0 P L A N F O R T H E S A N F R A N C I S C O B A Y A R E A 132
appendix three
TCM Number Federal Transportation Control Measure
TCM 22 Expand Regional Transit Connection ticket distribution
TCM 23 Employer audits
TCM 24 Expand signal timing program to new cities
TCM 25 Maintain existing signal timing programs
TCM 26 Incident management on Bay Area freeways
TCM 27 Update MTC guidance on development of local Transportation Systems Management (TSM) programs
TCM 28 Local TSM Initiatives
New TCMs in 2001 Ozone Attainment Plan (Being Implemented)
TCM A Regional Express Bus Program
TCM B Bicycle/Pedestrian Program
TCM C Transportation for Livable Communities
TCM D Expansion of Freeway Service Patrol
TCM E Transit access to airports
transportation control measures

M E T R O P O L I T A N T R A N S P O R T A T I O N C O M M I S S I O N 133
TCM Number State Transportation Control Measure Implementation Steps
State TCMs Proposed in the Draft 2005 Bay Area Ozone Strategy
TCM 1 Support voluntary employer-based tripreduction programs
• Provide core support for employer programs, based on an assessment of employer needs and the level ofemployer interest. Potential support includes assistance in developing or enhancing employer programs,information and referrals, employer networks, and programs to recognize outstanding employer programs.
• Support legislation to maintain and expand incentives for employer programs, such as tax deductions and/ortax credits for employer efforts to promote ridesharing, transit, and other commute alternatives
• Seek legislation to create stronger voluntary programs for all employers or to require certain minimum elements for public employers
TCM 2 Adopt employer-based trip reduction rule TCM deleted — Health and Safety Code Section 40929 does not permit air districts to require mandatoryemployer-based trip reduction programs.
TCM 3 Improve local and areawide bus service • Replace worn-out transit buses with clean-fuel buses and retrofit existing diesel buses with diesel emissioncontrol technology
• Sustain the existing Regional Express Bus Program
• Assist further planning work on enhanced bus and Bus Rapid Transit concepts
• Sustain transit service to airports
• Restore local bus routes that were eliminated due to economic recession
• Implement new Enhanced Bus and Bus Rapid Transit services and additional Lifeline Transit services, andexpand of Regional Express Bus Programs as funds become available
TCM 4 Upgrade and expand local and regional rail service
• Upgrade and expand local and regional rail service
• Implement MUNI Metro Third Street Light Rail initial operating segment from Downtown SF to Hunter’s Point
• Implement Caltrain Express/Rapid Rail Phase 1 (“Baby Bullet”) to San Francisco
• Extend Tasman East and Vasona light-rail transit (LRT) in Santa Clara County
• Extend BART to Warm Springs, eBART to Eastern Contra Costa County, tBART to Livermore/Amador Valleyand implement Silicon Valley Rapid Transit Corridor and an Oakland International Airport connector
• Implement MUNI Metro Central Subway in San Francisco
• Implement Caltrain Downtown Extension/rebuild TransBay Terminal
• Implement Downtown East Valley LRT in Santa Clara County
• Implement new Marin/Sonoma Commuter Rail Service between Cloverdale and a San Francisco-bound ferry service
• Implement an additional Capitol Corridor peak-period commuter service between Vacaville and Oakland
• Implement Dumbarton Rail Service connecting BART and Caltrain over a rebuilt Dumbarton rail bridge
TCM 5 Improve access to rail and ferries • Develop demonstration program for station car and bike station concepts at select regional transit centers
• Determine long-term funding needs for existing shuttles and examine funding options
• Implement Safe Routes to Transit to improve bicycle and pedestrian access
• Complete Regional Transit Connectivity Plan
• Develop a master plan for innovative secure bicycle storage strategies at key transit hubs
The 19 proposed state Transportation Control Measures (TCMs) in the Draft 2005 Bay Area Ozone Strategy have been updated
pursuant to the requirements of the California Clean Air Act (CCAA). The proposed TCMs include transit service improvements,
rideshare programs, bicycle and pedestrian enhancements, and land-use, pricing, and traffic management strategies. The implementa-
tion steps outlined for each TCM include both near-term and long-term implementation. A full description of these state TCMs will
be included in the Draft 2005 Bay Area Ozone Strategy publication, available in Summer 2005.
(Continues on next page)

T R A N S P O R T A T I O N 2 0 3 0 P L A N F O R T H E S A N F R A N C I S C O B A Y A R E A 134
TCM Number State Transportation Control Measure Implementation Steps
TCM 6 Improve interregional rail service • Implement additional interregional rail service in Capitol (Auburn–Sacramento–Oakland–San Jose) Corridorand track enhancements
• Implement additional Altamont Corridor Express rail service and track enhancements
• Implement high-speed rail service between Los Angeles and the Bay Area
TCM 7 Improve ferry service • Conduct initial planning for new ferry service
• Implement new high-speed low emission ferry to service Vallejo to San Francisco route
• Expand existing ferry service between: Oakland/Alameda and San Francisco, and Larkspur and San Francisco
• Implement new ferry service between Berkeley/Albany and San Francisco, and South San Francisco and San Francisco
• Implement new intermodal transit hub at Vallejo Ferry Terminal
• Expand berthing capacity at the San Francisco Ferry Terminal
• Implement hydrogen fuel cell ferry demonstration project from Treasure Island to San Francisco
• Assist ferry operators in converting vessel engines to lower emission engines
• Study and potentially implement new service between Richmond, Hercules/Rodeo, Martinez, Redwood Cityand San Francisco; Port Sonoma and San Francisco; and Oakland and San Francisco airports
TCM 8 Construct carpool/express bus lanes on freeways
• Expand existing HOV network, based on 2003 Transportation Improvement Program, where beneficial to airquality. Special attention should be paid to express bus operations to maximize benefits for transit. Monitorand adjust occupancy requirements and hours of operation to maximize air quality and mobility benefits.
• Implement HOV support facilities such as park & ride lots at various locations
• Implement additional HOV lanes and support infrastructure identified in the Regional Transportation Plan,where beneficial to air quality
TCM 9 Improve bicycle access and facilities • Fund Regional Bicycle Plan and Safe Routes to Transit improvements
• Continue Transportation Development Act (TDA) Article 3, Transportation for Livable Communities (TLC) andTransportation Fund for Clean Air (TFCA) funding for bike improvements
• Develop on-line bicycle mapping tool as part of the regional 511 traveler information number
• Promote Bike to Work Week/Day
• Encourage local jurisdictions to develop safe and convenient bicycle lane and route networks, provide securebike racks and storage, and require bicycle access and amenities as conditions of approval of developmentprojects
• Encourage public education about bicycle safety for both bicyclists and motorists
TCM 10 Youth transportation • Encourage walking and bicycling to school through the Safe Routes to Schools Program
• Establish special carpool formation services for parents, students and staff at Bay Area elementary and secondary schools
• Replace school buses with clean-fuel vehicles
• Offer transit ride discounts to youth and students
TCM 11 Install freeway traffic management systems
• Integrate traffic management features into new freeway construction projects
• Maintain current level of Freeway Service Patrol (FSP)
• Maintain 511 transit information service and improve and customer convenience
• Extend ramp metering in major freeway corridors
• Seek funding for full deployment of Caltrans’ Traffic Operation System/Traffic Management Center project
• Expand FSP to other routes and times of the day
TCM 12 Arterial management measures • Maintain current technical assistance program for local jurisdictions that seek to retime signals, including theevaluation of bus priority treatments
• Continue TFCA program to fund arterial management projects where air quality benefits can be demonstrated
• Coordinate the timing of an additional 1,200 signals and continue updating timing plans
• Work with bus operators to provide priority treatment along major bus routes
appendix three
transportation control measures

M E T R O P O L I T A N T R A N S P O R T A T I O N C O M M I S S I O N 135
TCM Number State Transportation Control Measure Implementation Steps
TCM 13 Transit use incentives • Implement Translink® (universal fare card) on transit systems throughout the region
• Implement improvements to the 511 transit information service
• Encourage employers, transit operators, local governments and others to promote and expand employer-based transit subsidy programs like the Commuter Check and EcoPass programs
• Improve signage at transit transfer hubs
• Deploy real-time transit arrival information
• Increase passenger amenities at transit hubs and stops
• Complete Alameda and Contra Costa County transit centers identified in AC Transit’s Comprehensive Service Plan
TCM 14 Carpool and vanpool services and incentives
• Maintain current programs of the Regional Ridesharing Program and increase efficiency in delivering services
• Explore innovative concepts such as real-time ridematching and more formal pick-up/drop-off locations forcasual carpoolers
• Explore options for expanding medium-distance (15–30 miles) vanpools
TCM 15 Local land-use planning and develop-ment strategies
MTC will:
• Implement its 5-point transportation and land-use platform including a new planning grant program to fundstation area plans around major transit facilities
• Maintain funding for expanded TLC planning and capital grant programs and HIP program
• Continue providing Transportation Planning and Land-Use Solutions (T-PLUS) funding to congestion manage-ment agencies to promote community revitalization projects
• Utilize a Caltrans grant to examine opportunities for transit-oriented development along major transit corridors
• Develop incentives and conditions to promote supportive land use policies around major new transit investments
BAAQMD will:
• Continue to fund bicycle projects, traffic-calming, shuttles, low emission vehicles, trip reduction programsand other clean air projects through the TFCA program
• Continue to provide technical assistance to local jurisdictions on air quality analyses in the environmentalreview process
• Continue to encourage cities and counties to reduce emissions from sources other than motor vehicles including lawn and garden equipment, wood stoves and fireplaces, and residential and commercial uses
ABAG will:
• Periodically monitor and update its Smart Growth demographic projections
• Promote multi-jurisdiction planning along select transit corridors to encourage transit-oriented development
MTC, ABAG and the BAAQMD will:
• Develop financial and other incentives and technical assistance to encourage innovative parking strategiessuch as reduced parking, parking fees, parking cash-out, shared parking and other parking programs
• Pursue legislative changes to remove barriers and provide incentives for smart growth
• Promote carsharing as a way to reduce parking requirements
• Monitor indirect source mitigation programs in other regions for Bay Area feasibility
• Provide technical assistance to local government agencies
• Publicize noteworthy examples of local clean air plans, policies and programs, as well as endorse noteworthydevelopment projects
• Study opportunities to promote location efficient mortgages (LEMs) to encourage home purchases near transit
(Continues on next page)

TCM 16 Public education/intermittent control measures
• Continue Spare the Air (STA) notices to media, employers, public agencies and individuals, with an emphasison reactive organic gases (ROG) reductions, obeying freeway speed limits in electronic freeway signs andother outreach efforts
• Expand STA notices to add emphasis on ROG reductions, obeying freeway speed limits, and discouraging use of pleasure craft
• Expand the Clean Air consortium to include cities and counties, as well as other public agencies
• Target major commercial airports and their tenants for greater participation in the STA program
• Increase coordination between the Bay Area’s STA program with the San Joaquin Valley’s STA program
• Continue public education program on the proper maintenance and operation of motor vehicles to reduce air pollution
• Study effectiveness and costs of free transit on Spare the Air days
• Explore possible legislative approaches to formalize and strengthen episodic approaches
TCM 17 Conduct demonstration projects • Promote demonstration projects to develop new strategies to reduce motor vehicle emissions. Potential projects include:
– Low and zero emission vehicles (LEV) and refueling infrastructure
– Parts replacement program for middle-aged cars
– Heavy duty diesel vehicle idling
– Carsharing
• Monitor Phase 1 projects and expand depending on effectiveness and resources available
TCM 18 Implement transportation pricing reform • Advocate for legislative authority to develop and promote revenue measures for:
– Congestion pricing on bridges
– High-occupancy/toll lanes
– Regional and state gas tax increases of up to $.50 per gallon
– Regional vehicle miles traveled (VMT) fees
– Taxes on diesel fuel
– Emissions-based vehicle registration fees
TCM 19 Improve pedestrian access and facilities • Review and comment on general/specific plan policies to promote development patterns that encourage walking and circulation policies. Emphasize pedestrian travel and encourage amending zoning ordinances toinclude pedestrian-friendly design standards.
• MTC will continue to fund local pedestrian improvement projects through the TLC program, and support thePedestrian Safety Task Force and associated pedestrian safety programs.
• TFCA program will continue to fund pedestrian improvement projects to reduce motor vehicle trips and emissions.
• Continue to identify and fund planning projects that enhance pedestrian movement in neighborhoods, downtowns and near transit stops
• Continue funding specific improvements through a variety of funding sources
• Support Safe Routes to Schools
TCM 20 Promote traffic-calming measures • Promote traffic-calming measures
• Fund traffic-calming projects such as pedestrian-exclusive streets, residential and neighborhood traffic calming measures, and arterial and major route traffic-calming measures
• Include traffic-calming strategies in the transportation and land use elements of general and specific plans
• Encourage area-wide traffic-calming plans and programs
• Include traffic-calming strategies in capital improvements programs
T R A N S P O R T A T I O N 2 0 3 0 P L A N F O R T H E S A N F R A N C I S C O B A Y A R E A 136
TCM Number State Transportation Control Measure Implementation Steps
appendix three
transportation control measures

APPENDIX F
2011 CMP Monitoring Report

Submitted to:
Level of Service and Performance Measure Monitoring Report - 2011
September 19, 2011
Submitted by:
300 Frank H. Ogawa Plaza, Suite 10
Oakland, CA 94612

September 19, 2011 City/County Association of Governments of San Mateo County County Office Building 555 County Center Fifth Floor Redwood City, California 94063 Attention: John Hoang, Program Manager Re: Level of Service and Performance Measure Monitoring Report - 2011 Dear Mr. Hoang: Jacobs Engineering Group Inc. (Jacobs) is pleased to submit the report for the 2011 LOS and Performance Measure Monitoring to support of the 2011 Congestion Management Program for the City/County Association of Governments of San Mateo County (C/CAG). Jacobs conducted the 2011 study for C/CAG utilizing the latest technology for performing CMP studies. Our extensive and unique experience provides a cost-effective and cutting edge process to obtain and analyze traffic data. Jacobs has developed a methodology including GPS and GIS over the past 10 years with exciting results. The addition of the GIS linear reference system has added a component that has never before been applied to network analyses. For the first time, C/CAG now has an extensive database integrated in GIS for easy access and historic comparisons. C/CAG has taken a major step forward in having the ability to take the GIS data, in addition to the historic tables, and integrate the digital data with your travel demand model. The speeds, roadway attributes, etc can be conflated with the model to produce a very robust and comprehensive system. This was not available in the past because the methodology used with tables and charts did not produce the value added products of this 2011 study. Jacobs will continue to support C/CAG to produce the best value that not only meets the intended LOS monitoring requirements to allow historic comparisons of this project, but produces the results in a form that can be used by many other areas within the county and by its members. Sincerely, Jacobs Engineering Group Inc. Steve T. Taylor, P.E., PTOE Project Manager

LOS and Performance Measure Monitoring Report - 2011
TABLE OF CONTENTS
A. Executive Summary .......................................................................................................... 1
B. Introduction ...................................................................................................................... 2
C. Methodology ..................................................................................................................... 5
D. Evaluation ......................................................................................................................... 7
E. Roadway Level of Service (LOS) .................................................................................... 10
F. Reduction in Volumes Due to Interregional Trips ........................................................ 18
G. Deficient CMP Segments ............................................................................................... 19
H. Intersections .................................................................................................................... 21
I. 2011 Mulit-Modal Performance Monitoring Program .................................................... 25
Appendix
Technical Appendix

1
LOS and Performance Measure Monitoring Report - 2011
A. EXECUTIVE SUMMARY
The City/County Association of Governments of San Mateo County (C/CAG) has an established Congestion Management Program (CMP) to monitor the transportation network within the county. All roadways included in the CMP network are evaluated for conformity at least every two years.
The goal of the monitoring program is to improve the performance of the transportation system by identifying congested areas and related transportation deficiencies. This information is then used to help prioritize transportation funding decisions based on system performance, land use factors, multimodal characteristics, and other considerations. This year‘s monitoring study was conducted in the spring 2011 with data collection between April and May including travel time runs on approximately 163.3 directional miles of freeways and arterials, 72-hour counts on 23 segments representing 301.4 centerline miles of arterials, and 16 intersection turning movement counts. This is the first monitoring cycle during which the C/CAG has used Global Positioning System (GPS) technology integrate in a geographic information system (GIS) to monitor Level of Service (LOS) on the CMP network. The primary tasks completed as part of this study include:
Mapping of the CMP network
Travel time data collection
LOS Analysis With the 2011 monitoring cycle, C/CAG is calculating LOS based on two methodologies—Highway Capacity Manual (HCM) 1994 and HCM 2000. This dual reporting facilitates historical comparisons while also reporting LOS based on the more current methodology. For freeways, only HCM 1994 LOS is reported, as the HCM 2000 methodology requires traffic volume information for all unique freeway segments and ramps. The HCM 2000 criteria was used only for the intersection LOS using the collected peak period turning movement counts analyzed in Synchro. Collection of comprehensive freeway traffic volumes is beyond the scope of the CMP monitoring effort. By HCM 1994 standards, only one official freeway segment evaluated during the PM peak period was found to operate at LOS F. That segment is SR 92 between I-280 and US 101. With the introduction and use of GIS, included in this years monitoring report, comes the ability to determine LOS for various smaller intersection segments and not only the longer summary segments as determined in the past. Intersection segment results were also calculated in addition to the (generally longer) official CMP segment results. By subdividing the CMP segments into intersection-level results, localized congestion can be quickly identified along the route segment. This helps identify locations of intense congestion. Improvements such as traffic signal upgrade/coordination, dedicated transit lanes, access management, and/or pedestrian and bicycle improvements could be considered for the intersection segments that exhibit high degrees of localized traffic congestion.

2
LOS and Performance Measure Monitoring Report - 2011
B. INTRODUCTION
History of the Congestion Management Program
C/CAG has an established Congestion Management Program (CMP) to monitor the transportation network within the county. All roadways included in the CMP network are evaluated for conformity at least every two years by the agency, which is the designated Congestion Management Agency (CMA) for San Mateo County. The goal of the monitoring program is to improve the performance of the transportation system by identifying congested areas and related transportation deficiencies. This information is then used to help prioritize transportation funding decisions in light of system performance, land use factors, multimodal characteristics, and other considerations. This year‘s study was conducted in the spring of 2011 with travel time runs between April and May of 2011. The most recent assessment prior to this study was performed in March 2009. The primary tasks completed as part of this study include:
Mapping of the CMP network
Travel time data collection
Level of Service Analysis
Study Background
This year‘s monitoring study was conducted in the spring 2011 with data collection between April and May including travel time runs on approximately 163.3 directional miles of freeways and arterials, 72-hour counts on 23 segments representing 301.4 centerline miles of arterials, and 16 intersection turning movement counts. CMP legislation requires that state highways (including freeways) and principal arterials be included in the CMP network. The network must be useful to track the transportation impacts of land development decisions, as well as to help assess the congestion management implications of proposed transportation projects. C/CAG‘s network therefore includes numerous local thoroughfares since most urban traffic occurs on city arterials (rather than on the freeways). Figure 1 shows the routes that were monitored.
All of the study roadways were evaluated during the AM and PM peak period between the hours of 7 AM - 9 AM and 4 PM - 7 PM. As in previous studies, both time periods are considered when determining the LOS to be reported. The directionality of the segment is not reported in many of the summary tables, but the worst LOS found for either direction for either AM or PM peak period is shown as the official result. In most cases, the PM period is the focus of the CMP since consistently, the PM period results in higher volumes, slower speeds, and more congestion. The methodology used included performing floating car travel time studies, 72-hour traffic counts, and intersection turning movement counts.
The total directional miles and number of route segments for each roadway type are shown in Table 1.

3
LOS and Performance Measure Monitoring Report - 2011
Figure 1 – Spring 2011 CMP Monitored Routes

4
LOS and Performance Measure Monitoring Report - 2011
Table 1 – Total Study Miles Summary
Roadway Type Total
Directional Miles
Arterial / State Routes
301.4
Freeway 163.3
Total 464.7
This monitoring report focused on the five performance measures established in the San Mateo County Congestion Management Program. These performance measures are:
1. Roadway Level of Service
a: Travel Time – Average Speed b. 72-hour traffic counts – V/C for rural arterials
2. Intersection LOS 3. Travel Time for various modes (single occupant, carpools, and transit) 4. Pedestrian and Bicycle Improvements 5. Ridership / Person Throughput for Transit
As noted, the ―Roadway Level of Service and Intersection LOS‖ are the primary CMP performance measures; therefore, a mitigation plan is required if the resulting LOS is below the established minimum standard. The following sections focus on each of the above performance measures with emphasis on the Roadway and Intersection LOS. The other items are included to provide some alternative views to help explain the changes in performance and the opportunities for improvement.

5
LOS and Performance Measure Monitoring Report - 2011
C. METHODOLOGY
Mapping of CMP Network
Global Positioning System (GPS)
Historically, CMP travel time runs were done manually. Jacobs introduced the use of GPS and GIS to C/CAG in 2011. In general, the equipment used by Jacobs received consistent GPS signals across the County. Before performing the travel time runs, all roadways were mapped using GPS technology. The Haicom-BT Bluetooth receiver was mounted on a vehicle and used in the mapping. The receiver uses differential GPS (DGPS) to provide position information to sub-meter accuracy. These receivers were used in combination with the controlling software developed by Jacobs while driving each roadway to inventory all roadway attributes related to speed. The data collection process was made more efficient by collecting data electronically using GPS technology. The methodology provided C/CAG with background mapping and traffic-related elements that can be integrated with the agency‘s GIS/travel demand model for future use.
Mapping Runs
The roadway mapping was done in-vehicle using the Haicom-BT GPS equipment and software. Mapping was done in one direction for each roadway segment during off-peak periods. Certain traffic elements were recorded such as the posted speed limit, presence of traffic signals, number of through lanes, and construction areas. This information could be used later to determine the segment lengths and theoretical travel times, and to provide better insight into the resulting travel time runs.
Video on Mapping Runs
The roadway segments were videotaped during the mapping process in order to provide a reference of the conditions. The digital videos were later linked to the GIS results for future reference. This provides a video log of the CMP network roadways. These video logs can be invaluable for future tasks such as asset management where all traffic items can easily be viewed.

6
LOS and Performance Measure Monitoring Report - 2011
Travel Time Data Collection
Travel time runs were conducted using the floating car method. In the floating car method, the driver of the test vehicle ―floats‖ with the traffic to represent the average vehicle by attempting to safely pass as many vehicles that pass the test vehicle. Travel time runs were conducted during the morning and afternoon peak periods on all roadway segments; runs were only conducted on Tuesdays, Wednesdays, or Thursdays, and school district spring break periods were avoided. A minimum of five (5) runs were made in each direction during each peak period. During the travel time runs, the Haicom BT GPS equipment recorded position and time at one-second intervals into a Dell Personal Digital Assistant (PDA) using Bluetooth technology. The driver of the test vehicle drove the speed limit if no other cars were present and at the school zone speed limit if a school zone speed limit was in effect at the time of the travel time run.

7
LOS and Performance Measure Monitoring Report - 2011
D. EVALUATION
LOS Analysis – HCM 1994
The tables in the Appendix highlight the 2011 CMP route segments that had LOS lower than the established standard during the AM or PM Peak by HCM 1994 standards directly from the travel time runs or 72-hour counts. The CMP enabling legislation allows for the reduction in volume for those interregional trips for those segments that have a LOS lower than the established standard; i.e. those trips that originate from outside the county and either pass through the county or have a destination within San Mateo County.
Other Performance Measures Results Apart from average speeds aggregated to the CMP route segments level, intersection segment level average speeds were also calculated in 2011 for all routes. These results are available in the GIS tables provided to C/CAG. An example from the 2011 monitoring cycle that illustrates the utility of Intersection Segment level results is presented here. The segments included as official CMP segments are illustrated in Figure 2. If the analysis focused only on these segments, much of the corridors highlighted would be missed. Historically, the surface streets have not been evaluated using travel time runs. The performance review has focused either on the traffic counts at various intersections or on link 72-hour traffic counts on the rural arterials. For demonstration this year, travel time runs were completed on SR 82 (El Camino Real) in addition to the intersection turning movement counts. Figure 3 illustrates the benefit of this methodology to highlight the delays that occur at the local level and may not be reflected in the results when only relying on the traffic counts. The intersections have been evaluated only on an isolated level and consideration was not given for the benefits of coordinate signal timing. Travel time runs when illustrated in GIS, paint a clear picture as to the efficiency of the existing signal timing for progression.

8
LOS and Performance Measure Monitoring Report - 2011
Figure 2 – Example CMP Segment – SR 82 between 3rd Street and Trousdale

9
LOS and Performance Measure Monitoring Report - 2011
Figure 3 – 21 Included Intersection Segments on SR 82 between 3rd Street and Trousdale

10
LOS and Performance Measure Monitoring Report - 2011
E. ROADWAY LEVEL OF SERVICE (LOS)
Traffic Flow
The Highway Capacity Manual (HCM) defines capacity as ―…the maximum hourly rate at which persons or vehicles reasonably can be expected to traverse a point or a uniform section of a lane or roadway during a given time period under prevailing roadway, traffic, and control conditions.‖ The vehicle capacity and operational characteristics of a roadway are a function of a number of elements including: the number of lanes and lane widths, shoulder widths, roadway alignment, access, traffic signals, grades, and vehicle mix. Generally, roadways with wider travel lanes, fewer traffic control devices, straight alignments, etc. allow faster travel speeds and therefore greater vehicle flow per unit time.
Level of Service
The HCM defines level of service (LOS) as ―…a quality measure describing operational conditions within a traffic stream, generally in terms of such service measures as speed and travel time, freedom to maneuver, traffic interruptions, and comfort and convenience.‖ ―Six LOS are defined for each type of facility that has analysis procedures available. Letters designate each level, from A to F, with LOS A representing the best operating conditions and LOS F the worst. Each level of service represents a range of operating conditions and the driver‘s perception of those conditions.‖ In accordance with CMP legislation, the county and city governments are required to show that all CMP route segments within their jurisdiction are operating at or above the CMP traffic LOS standard. Section 65089(b)(1)(B) of the California Government Code states that ―In no case shall the LOS standards established be below the LOS E or the current level, whichever is farthest from LOS A. When the level of service on a segment or at an intersection fails to attain the established level of service standard, a deficiency plan shall be adopted pursuant to section 65089.4.‖ All CMP network segments were evaluated in the spring 2011 monitoring cycle. In addition to the base methodology historically used to evaluate SR 82 which included intersection turning movement counts and 72-hour link counts, the corridor was also monitored for the first time using floating car travel time runs for reference and planning purposes. These results using the floating car results are not subject to performance requirements. All freeway segments in the network, as included in Figure 4, were monitored using the floating vehicle method, which allows for determination of LOS on the basis of average operating speed. C/CAG primarily uses the 1994 and 2000 HCM methodology to monitor LOS on the CMP network, as this methodology was utilized in the baseline monitoring cycle and is necessary to maintain historical comparisons, identify exempt segments, and monitor

11
LOS and Performance Measure Monitoring Report - 2011
potential network deficiencies. The specific methodologies used for monitoring freeway and arterial segments are listed below per HCM definitions:
Freeway Segments (HCM 1994 - Chapter 3) – All freeway segments were evaluated using the ―basic freeway sections‖ methodology of HCM 1994 where the LOS for each freeway segment was determined using its average travel speed.
Freeway LOS was not calculated based on HCM 2000 methodology. In order to evaluate all freeway segments using the HCM 2000 methodology, the volumes on all freeway sections (mainline) with distinct characteristics (e.g., quantity of lanes), as well as on entrances and exits would be required. Changes to the methodology will be considered along with the next update cycle when the HCM 2010 may be incorporated. Until then, the methodology of previous updates was followed to maintain the historical context for comparisons of the results.
Multilane, Two-Lane and Arterial Segments (HCM 1994 – Chapters 7, 8, and 11) – All non-freeway surface street segments were evaluated based on the volume to capacity ratio (V/C) dependant on the local free-flow speed, cross-section, number of lanes, % no-passing zones, and functional class.
Multilane and Two-Lane highways were evaluated primarily based on the current volumes as measured through 72-hour traffic counts at 23 locations throughout the county. These counts and resulting V/C were then compared to the applicable criteria in the HCM 1994 to determine the respective LOS.
Many arterial segments used by C/CAG for CMP purposes (called "CMP Segments") span several blocks and include multiple signals and/or stop controlled intersections. If an Intersection Segment is defined as a segment from one controlled intersection to the next, the CMP segments are a collection of consecutive Intersection Segments. Jacobs methodology of travel time estimation can calculate average speeds at the Intersection Segment level and these data can be aggregated to calculate the average speeds at the CMP segment level. The average speed on each CMP segment is computed as the ratio of total length of the segment to the sum of average travel time on each individual intersection segment within the CMP segment. The average travel time on each intersection segment is computed as the arithmetic mean of travel times of individual floating car runs on that segment. The travel times of individual floating car runs are calculated by measuring the time taken by a floating car to travel from the middle of one controlled intersection to the middle of the next controlled intersection. The average speed thus accounts for time in motion and time spent at the signals or stop signs.
Table 2 shows the relationship between average travel speed and level of service for basic freeways according to HCM 1994. There are four (4) freeway categories based on the free-flow speed of the facility (ranging from 55-70 mph).

12
LOS and Performance Measure Monitoring Report - 2011
Figure 4 –2011Routes and LOS Methodologies – Magenta 72-hour Counts (HCM 1994), Blue Freeways and SR 82 using Floating Car (HCM 1994), Yellow Intersections using Peak Period Turning Movement Counts (HCM 2000)

13
LOS and Performance Measure Monitoring Report - 2011
Table 2 – Example LOS from Freeway with Free-Flow Speed of 65 mph (HCM 1994)
Roadway Type Basic
Freeway
Free Flow Speed (mph) Range 65
A > 65
B > 65
C > 64.5
D > 61
E > 56/53
F < 56
Roadway Segment LOS Analysis Results
Table 3 summarizes the current year roadway segment LOS. Additionally, Figures 6 and 7 illustrate the results graphically. As highlighted in Table 3, there are 13 segments found to be below the established minimum. Table 3 includes a summary of the historic results since 1999. All results included in this update have consistently used the HCM 1994 for all roadway types and the HCM 2000 for the intersections. Variations in the LOS results may be explained through capital improvements, construction, use of transit and other modes,
and reduction in traffic volumes due to the economy. The values included in Table 3
reflect the lowest LOS for either direction on the segment in either the AM or PM peak
period. Basically, it is the worst case LOS for the link in either direction in either time of
day.

14
LOS and Performance Measure Monitoring Report - 2011
Table 3 – CMP Roadway Segment Monitoring Results (Lowest LOS)
1
E F B F3/ F
4F
3/ F
4F
3/ F
4
1
E D - D D D
1
E E - E E E
1D B - B B C
35
E A - C C C
35 F F - E F F
35 B C B B B C/C
35 B B - B B B
35 E B - B B B
82
E A - A A A
82
E A - A A A
82 E A - A C A
82 E A - A B A
82 E B - A A A
82 E A - A A A
82 E A - B B B
82 E B - B B B
82 E A - B B A
82 E C - C D D
82 E B - C C C
82 E B - B B B
82
E B - B C D
82
E A - B B C
84 C C - C C C
84 E B - B B B
84
C D C C D/A C
84
E E - E E E
84
D B - E/E C B
84
E F C F/E F/F F/F
84F F - F F F
92 E E - E E E
92 D F F E3/D
4F
3/D
4F
3/ E
4
92E F A A/B
3A/B
3A/B
3
2011 CMP Roadway Segment Levels of Service
2005 LOS2
2009 LOS2
Without
Exemption3
With
Exemption 2007 LOS2
2011 LOS
Santa Cruz Avenue to Santa Clara
County Line
SR 1 to Portola Road
Portola Road to I-280
U.S. 101 to Alameda County Line
Glenwood Avenue to Santa Cruz
Avenue
I-280 to U.S. 101
SR 1 to I-280
University Avenue to Alameda County
Line
Willow Road to University Avenue
U.S. 101 to Willow Road
Alameda de las Pulgas to U.S. 101
I-280 to Alameda de las Pulgas
SR 84 to Glenwood Avenue
Whipple Avenue to SR 84
Holly Street to Whipple Avenue
42nd
Avenue to Holly Street
Hillside Avenue to 42nd
Avenue
SR 92 to Hillside Avenue
3rd
Avenue to SR 92
Trousdale Drive to 3rd
Avenue
I-380 to Trousdale Drive
Hickey Boulevard to I-380
John Daly Boulevard to Hickey
Boulevard
San Francisco County Line to John
Daly Blvd
SR 84 to Santa Clara County Line
SR 92 to SR 84
I-280 to SR 92
Sneath Lane to I-280
San Francisco county Line to Sneath
Lane
Miramontes Road to Santa Cruz
County Line
Frenchmans Creek Road to
Miramontes Road
Linda Mar Blvd. to Frenchmans Creek
Road
San Francisco County Line to Linda
Mar Blvd.
Route Roadway Segment
LOS
Standard

15
LOS and Performance Measure Monitoring Report - 2011
Table 3 (‗cont) – CMP Roadway Segment Monitoring Results (Lowest LOS)
101
E F A D3
E3
D3
101
E F C D3
F3/C
4F
3/ D
4
101
E F C F3/C
4F
3/C
4F
3/ D
4
101
E F C F3/D
4F
3/C
4F
3/ D
4
101
F F - F3
F3
F3
101
E F D F3/E
4F
3/D
4F
3/ E
4
101
F F - F3
F3
F3
109
E C - D D C
114
E B - C C B
280
E E - F3/D
4F
3/A E
3
280
E A/B - E E E3
280
D F D E3/D
4F
3/C
4F
3/ E
4
280
D D - E3/C
4A/B
3A/B
3
280 D A/B - D3
D3
D3
280D E A D
3D
3E
3/ C
4
380 F F - F3
F3
E3
380C A - B
3D
3/C A
3
Mission StE A - A A A
Geneva
Ave. E A - A A A
Bayshore
Blvd. E A - A A A
2011 CMP Roadway Segment Levels of Service
2005 LOS2
2009 LOS2
Without
Exemption3
With
Exemption 2007 LOS2
2011 LOS
SR 92 to Whipple Avenue
Peninsula Avenue to SR 92
San Francisco County Line to
Bayshore Blvd.
SR 1 (north) to SR 1 (south)
San Francisco County Line to SR 1
(north)
U.S. 101 to SR 84 (Bayfront
Expressway)
Kavanaugh Drive to SR 84 (Bayfront
Expwy.)
SR 92 to SR 84
San Bruno Avenue to SR 92
SR 1 (south) to San Bruno Avenue
Whipple Avenue to Santa Clara
County Line
San Francisco County Line to SR 82
U.S. 101 to Airport Access Road
I-280 to U.S. 101
SR 84 to Santa Clara County Line
LOS Standard violations (after application of exemptions) are highlighted in red
LOS based on 1994 Highway Capacity Manual Methodology.
Broadway to Peninsula Avenue
Millbrae Avenue to Broadway
I-380 to Millbrae Avenue
San Francisco County Line to I-380
2 The first value represents LOS without exemptions, and the second value represents LOS with exemptions.
3 Based on average speed from travel time surveys.
4 Exemptions applied to volume-to-capacity ratios estimated from average speeds.
"-" = not applicable. LOS standard is not violated. Therefore, exemptions were not applied.
Notes:
San Francisco County Line to Geneva
Avenue
Route Roadway Segment
LOS
Standard

16
LOS and Performance Measure Monitoring Report - 2011
Figure 5 – LOS Results (before Exemptions)
17
LOS and Performance Measure Monitoring Report - 2011
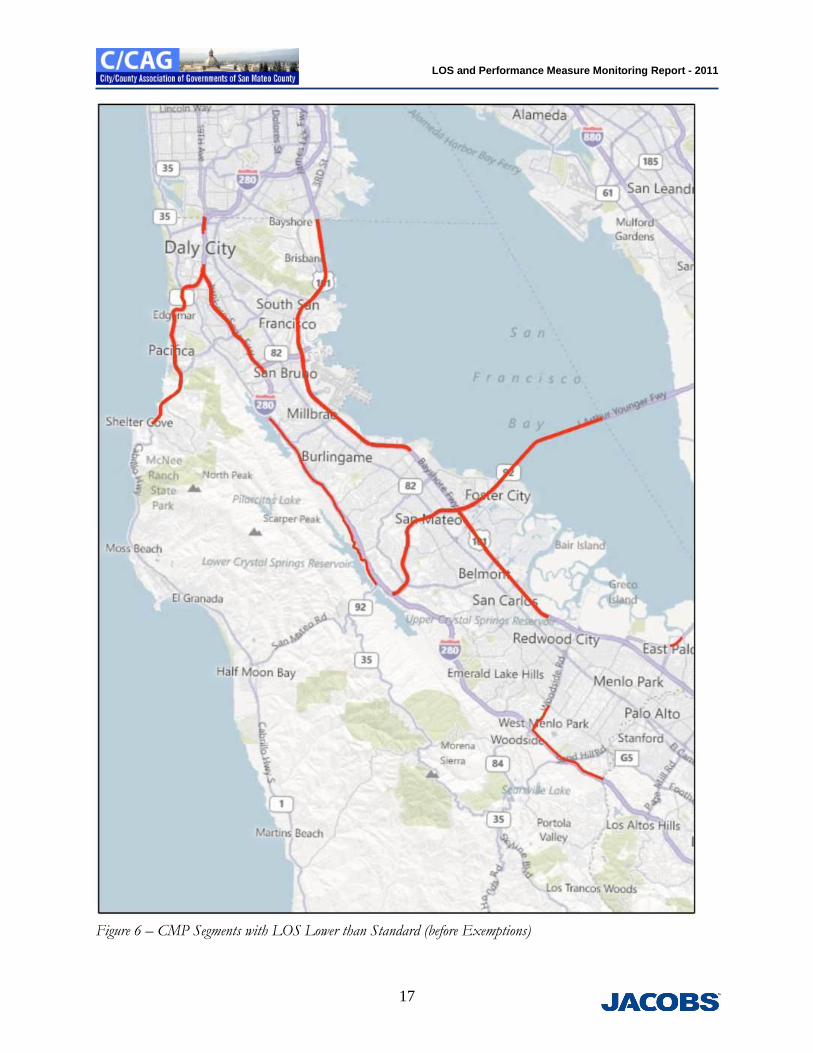
Figure 6 – CMP Segments with LOS Lower than Standard (before Exemptions)

18
LOS and Performance Measure Monitoring Report - 2011
F. REDUCTION IN VOLUMES DUE TO INTERREGIONAL TRIPS
The CMP-enabling legislation allows for the reduction in volume for those trip that are interregional. In this case, ―interregional‖ are those trips that originate from outside the county. That is those that either traverse the county or have a destination within the county. For those CMP segments found with a LOS below the standard, the county travel demand model is used to determine the proportion of the volume estimated to be from interregional travel. As shown in Table 3, there were 13 segments that had at least one direction in either the AM or PM peak period that had a lower LOS than the established standard. Table 4 includes the resulting percentage of traffic from the travel demand model that is estimated to be interregional by segment.
Table 4 – Interregional Trips for Segments with LOS Lower than Standard
When applying reductions, they can be deducted directly for those where V/C is the performance measure used, but for those segments that use floating car to determine the average speed of a segment, a few extra steps are required to reflect the exemption. As mentioned earlier, freeway LOS is primarily determined based on density, but historically, the LOS Monitoring Study has made use of the LOS tables as included in the HCM 1994 that include reference speeds for given free-flow speeds and LOS. In order to reflect the reduction, the V/C must first be estimated from the same tables. This adds a level of error given that density is the preferred performance measure and the methodology is to use a secondary measure to estimate another secondary measure, take the reduction, and then reverse the calculation using the V/C and determine the adjusted LOS with the exemption.

19
LOS and Performance Measure Monitoring Report - 2011
G. DEFICIENT CMP SEGMENTS
After incorporating the reduction in volume for those segments found to have a LOS lower than the standard, only one segment was found to be deficient, as shown in Figure 7. This segment is also highlighted in Table 3 and is SR 92 between I-280 and US 101. The LOS standard is D and was found to be LOS F with and without the interregional traffic exemption of 45% during the PM peak period.

20
LOS and Performance Measure Monitoring Report - 2011
Figure 7 – Deficient Segment after Exemption

21
LOS and Performance Measure Monitoring Report - 2011
H. INTERSECTIONS
Sixteen intersection were analyzed as part of the 2011 LOS Monitoring. These intersections
have been included in previous studies since 1999 and are included in Table 5 for reference.
The performance measure for intersection is LOS, but different from freeways and highways, the
HCM 2000 was used to determine the LOS. Turning movement counts were collected for each
intersection during the AM and PM peak periods and modeled in Synchro. The intersections
were analyzed as if they were isolated (not coordinated or in a signal system) and optimized
given the existing geometry. The modeled results provide an estimate of the optimized LOS and
may not represent the actual conditions if the intersection is either using less than optimal
phasing, splits or cycle length. In past reports, the LOS results using Circular 212 was also
included, but this year it was eliminated given that it is more applicable to planning studies
where limited data is available. The LOS as included with this method in previous studies
commonly underestimated the LOS when compared to the methodology of the HCM 1994. Table 5 includes the results for the 2011 study as well as those back to 2005 using the HCM 2000 methods (other results are included for years back to 1999 using the Circular 212 Method). As highlighted in the table, one intersection was found to be operating at a LOS less than the standard. Intersections 11, 12, 13, and 16 have a LOS standard of F while the others are E. Therefore, intersection #5 – SR 92 at Millbrae is operating at a LOS of F but following the 14.2% reduction in volume based on the current travel demand model, as shown in Table 4, the intersection improves to LOS D and is no longer deficient.

22
LOS and Performance Measure Monitoring Report - 2011
Table 5 – Intersection LOS
Figures 8 and 9 illustrate the finding for the intersection LOS. Each intersection is represented with two circles. The larger one is the base and is the LOS Standard. The smaller circle in the middle is the resulting peak period LOS for the respective time period.

23
LOS and Performance Measure Monitoring Report - 2011
Figure 8 – AM Intersection LOS (Underlying Color is LOS Standard)

24
LOS and Performance Measure Monitoring Report - 2011
Figure 9 – PM Intersection LOS (Underlying Color is LOS Standard)

25
LOS and Performance Measure Monitoring Report - 2011
I. 2011 MULTI-MODAL PERFORMANCE MEASURE MONITORING PROGRAM
Beginning in 1995, the Transit LOS Standard element of the San Mateo County CMP was replaced with the Performance Measure element. Four Performance Measures were selected and incorporated in the 1997 CMP Update and used each update cycle through 2009. The four measures are used to measure the performance of the overall multi-modal transportation system, including non-automotive modes. They are:
Level of service,
Travel times from single-occupant automobiles, carpools, and transit,
Pedestrian and bicycle improvements, and
Ridership / person throughput for transit. This section presents the 2011 measurements of these performance measures and includes the historic results for context. Level of Service The levels of service of the CMP corridors and segments are included in the previous sections of this monitoring report. The results show that one roadway exceeded the respective LOS standard following reflection of the interregional trips. For the 16 intersections included in the CMP network, all intersections were found to operated at or better than the established standard after incorporating exemptions. Travel Times for Single-Occupant Automobiles, Carpools, and Transit This multi-modal performance measure compares the travel time of the various modes available in the US 101 corridor from the Santa Clara County line to the San Francisco County line. Those include using the general purpose lanes, using the carpool lane for the limits available, or using transit via SamTrans or Caltrain. The general purpose travel times previously presented early in this report will represent the average time and speed for those using the general purpose lanes for the full length of the county along US 101. The current limits of the carpool lane in San Mateo County are from the Santa Clara County line to Whipple Avenue. For those that are able to use this lane during the peak hours, the remainder of the run will take place in the general purpose lane. Travel times for those using transit include the option to access SamTrans route KX along the US 101 corridor or Caltrain. The travel times for the transit options are represented based on the published schedules. Actual data collection for these routes was not performed but is shown consistent with methods used in previous LOS monitoring studies.

26
LOS and Performance Measure Monitoring Report - 2011
The travel times for the various mode options are included in Table 6 below. The table includes the respective travel times, listed by direction and peak periods, for the current reporting period as well as previous years back to 2005.
Table 6 – Average Travel Time in US 101 Corridor (in minutes)
Between San Francisco and Santa Clara County Lines
The AM and PM northbound auto travel times in the general purpose lanes have remained unchanged since 2009. In contrast, the southbound runs in the same general purpose lanes have increased in both the AM and PM periods by as much as 38% (from 29 to 40 minutes in the PM period). The carpool travel times have increase slightly in all cases other than the northbound AM period. Caltrain has maintained its schedules since 2009 on the Baby Bullet express that was introduced in 2005, thus the travel times remain unchanged. The published schedule for SamTrans Route KX indicate a shorter schedule by as much as 11 minutes for the southbound PM route. Pedestrian and Bicycle Improvements
The purpose of this performance measure is to maintain a focus on non-vehicular alternatives. This should be reflected in connectivity to transit and other modes to not only make connections convenient, but safe and attractive. During the CMP update process, seven-year Capital Improvement Program (CIP) projects are identified and evaluated. The top-ranked projects are forwarded to MTC to be evaluated in the regional process for State and Federal funding. C/CAG developed the San Mateo County Comprehensive Bicycle and Pedestrian Plan (September 2011) to address the planning, design, funding, and implementation of bicycle and pedestrian projects of countywide significance. The Plan includes a policy framework to guide and evaluate implementation of projects identified by the local implementing cities and the County. To maximize funding available for bikeway projects, the Plan emphasizes projects that improves safety, promote access to jobs, and located within high population as well as employment densities. The Plan also establishes geographical focus areas for countywide investment in pedestrian infrastructure.

27
LOS and Performance Measure Monitoring Report - 2011
Ridership / Person Throughput for Transit
The purpose of this performance measure is to document the number of patrons using the available transit options. Within San Mateo County, there are three options including SamTrans, Caltrain, and BART. BART has three stops that serve the county including the SFO Airport extension that opened in 2005, Colma, and Daly City. The 2011 transit ridership data for SamTrans, Caltrain, and BART (Bay Area Rapid Transit) is included in Table 7. The FY 2011 data indicates annual and average weekday ridership for SamTrans has decreased approximately 10% whereas Caltrain ridership has remained relatively the same when compared to FY 2009. Data for BART indicates a slight decrease for the Colma and Daly City stations and an increase of 2% for the SFO Extension stations. Total transit ridership indicates a decrease of about 3% (annually and average weekday) when compared with FY 2009.
Table 7 – Transit Ridership

28
LOS and Performance Measure Monitoring Report - 2011
APPENDIX
AM and PM Roadway LOS Tabular Results

34
LOS and Performance Measure Monitoring Report - 2011
TECHNICAL APPENDIX
The technical details, database and support documents are included in a separate geographic information system (GIS) deliverable

APPENDIX G
Status of Capital Improvement Projects

STATUS OF CAPITAL IMPROVEMENT PRJOECTS
Program
Year
Program Type Jursidiction Project Description Amount Funding Obligation
Pending
Funding Fully
Obligated
Under Construction Completed
1997/98 Demonstration Freeway San Mateo Route 92 and El Camino Real
interchange improvements
2.8 M X
1997/98 Demonstration,
SAFETEA-LU (HPP)
Pacifica San Pedro Creek Bridge project at
Route 1
1.2 M, 2.2M X
1997/98 STIP Freeway Half Moon Bay Route 92 and Main Street
intersection improvements: Route 92
widening and realignment
2.8M X
2004/05 MTC HIP 2nd cycle
Transp
Bike/Ped South San Francisco BART Linear Park Project (Park
Station Lofts Project)
304,800 X
2004/05 MTC RBPP Bike Ped Daly City Lake Merced Blvd Bike Lane (PSE) 74,000 X
2004/05 MTC TLC Bike/Ped South San Francisco BART Linear Park Project 970,000 X
2004/05 SAFETEA-LU (HPP) Bike/Ped Belmont US101 pedestrian bridge 1.7248M & 880,000 X
2004/05 SAFETEA-LU (HPP) Other Roadway
Improvements
C/CAG Dumbarton Bridge to US 101
connection improvement study
352,000 X
2004/05 SAFETEA-LU (HPP) Freeway SMCTA Route 101 Auxiliary Lanes: San
Mateo 3rd Ave to Millbrae Ave
2.64M X
2004/05 TOD 3rd Cycle (Co
CMAQ)
Ped Daly City American Baptist Homes of the West
(Mission St Ped improve)
54,530 X
2004/05 TOD 3rd Cycle (Co
CMAQ)
Ped Daly City Landmark Plaza Development
(Mission St Ped improvement)
238,470 X
2004/05 TOD 3rd Cycle (Co
CMAQ)
Bike Ped San Mateo Palm Residences (Delaware Street
Improvement)
37,000 X
2004/05 TOD 3rd Cycle (Co TE) Bike Ped South San Francisco SSF BART Station Transit Village
(Park Station)
117,012 X
2004/05 TOD Incentive Community Improvement Daly City Landmark Plaza Development
Project
486,200 X
2004/05 TOD Incentive Community Improvement Daly City Hillcrest Senior Housing 129,100 X
2004/05 TOD Incentive Community Improvement Daly City Mission Street/John Daly Boulevard
Pedestrian Plaza
615,300 X
2004/05 TOD Incentive Community Improvement Redwood City Villa Montgomery Housing
Development streetscape
improvements
387,900 X
2004/05 TOD Incentive Community Improvement San Bruno El Camino Real/San Bruno Avenue
Streetscape Improvement Project
103,800 X
2004/05 TOD Incentive Community Improvement San Mateo County Colma Transit Village Apartments
connections
1,078,800 X
2005/06 CMIA, SAFETEA-LU
(HPP)
Freeway SMCTA Route 101 Auxiliary Lanes: Marsh
Road to Santa Clara County
60M, 1.58M X
2011 CMP - San Mateo County (Appendix G) 1 of 11 October 2011

STATUS OF CAPITAL IMPROVEMENT PRJOECTS
Program
Year
Program Type Jursidiction Project Description Amount Funding Obligation
Pending
Funding Fully
Obligated
Under Construction Completed
2005/06 STIP Operational
Improvements
C/CAG San Mateo County Intelligent
Transportation System (ITS) Project
1.977M X
2005/06 STIP Operational
Improvements
Caltrans El Camino Real Signal Coordination 5.0M X
2005/06 STIP R.R. Grade Separations
/Crossing Improve
SMCTA Tilton Avenue and E. Poplar Avenue
RR Grade Separations
9.103M X
2005/06 STP Road Pavement East Palo Alto Bay Road rehabilitation 122,000 X
2005/06 STP Road Pavement San Bruno Various streets rehabilitation 294,000 X
2005/06 STP Road Pavement San Mateo Alameda de las Pulgas rehabilitation 448,000 X
2006/07 CMAQ Ramp Meter San Mateo County US 101 San Mateo Ramp Metering
(CON)
500,000 X
2006/07 MTC RBPP Bike Ped Daly City Lake Merced Blvd. Bicycle Lane
Project (CON)
463,000 X
2006/07 MTC RBPP Bike Ped Daly City Lake Merced Blvd Bike Lane project 537,000 X
2006/07 MTC TLC Bike Ped SSF BART Linear Park (CON) 1,933,000 X
2006/07 STP Road Pavement Belmont Old County Road Rehabilitation (PE) 14,000 X
2006/07 STP Road Pavement Daly City Mission Street rehabilitation 395,000 X
2006/07 STP Road Pavement Foster City Chess Drive rehabilitation 128,000 X
2006/07 STP Road Pavement South San Francisco Grand Ave Rehabilitation (CON) 290,000 X
2006/07 STP 2nd Cycle Other Roadway
Improvements
Belmont Old County Road rehabilitation 134,000 X
2006/07 STP 2nd Cycle Road Pavement Menlo Park Sand Hill Road rehabilitation 184,000 X
2006/07 STP 2nd Cycle Road Pavement Millbrae Millbrae Avenue rehabilitation 110,000 X
2006/07 STP 2nd Cycle Road Pavement San Mateo County Various streets rehabilitation 500,000 X
2006/07 STP 2nd Cycle Road Pavement South San Francisco Grand Avenue rehabilitation 290,000 X
2006/07 STP 3rd Cycle Road Pavement Atherton Valparaiso Avenue Rehabilitation
(CON)
470,000 X
2011 CMP - San Mateo County (Appendix G) 2 of 11 October 2011

STATUS OF CAPITAL IMPROVEMENT PRJOECTS
Program
Year
Program Type Jursidiction Project Description Amount Funding Obligation
Pending
Funding Fully
Obligated
Under Construction Completed
2006/07 STP 3rd Cycle Road Pavement Daly City East Market & Hillside Blvd
Rehabilitation (CON)
350,000 X
2006/07 STP 3rd Cycle Road Pavement Menlo Park Sand Hill Road
Rehabilitation/Resurfacing (CON)
707,000 X
2006/07 STP 3rd Cycle Road Pavement Pacifica Palmetto Avenue Rehabilitation
(CON)
405,000 X
2006/07 STP 3rd Cycle Road Pavement Redwood City Alameda de las Pultgas/Bay Road
Rehabilitation combined w/ Bay
Rd/Florence St (CON)
900,000 X
2006/07 STP 3rd Cycle (backfill) Road Pavement Half Moon Bay SR 92 / Main Street Widening (CON) 1,544,000 X
2007/08 Regional Bike /Ped Bike Ped County El Granada (Coastside) bicycle & pedestrian trail 181,287 X
2007/08 Regional Bike /Ped Bike Ped Daly City Mission Street pedestrian
improvements
500,000 X
2007/08 Regional Bike /Ped Bike Ped Pacifica San Pedro Terrace multi-purpose
trail
1,000,000 X
2007/08 Regional Bike /Ped Bike Ped San Mateo Delaware Street bicycle and
pedestrian improvements
282,600 X
2007/08 Regional Bike /Ped Bike Ped SSF Linear Park trail 537,950 X
2007/08 STIP ITS Caltrans El Camino Real Signa Interconnect
and Upgrade
7,135,000 X
2007/08 STIP Highway Caltrans/SMCTA Auxiliary lanes - 3rd Ave to Millbrae
Ave
100,000,000 X
2007/08 STP 3rd Cycle Road Pavement Burlingame Calif Dr Resurfacing 103,000 X
2007/08 STP 3rd Cycle Road Pavement Burlingame Hillside Dr Resurfacing 72,000 X
2007/08 STP 3rd Cycle Road Pavement Burlingame Rollins Rd Resurfacing 103,000 X
2007/08 STP 3rd Cycle Road Pavement County Bay Road Resurfacing 250,000 X
2007/08 STP 3rd Cycle Road Pavement Foster City Foster City Blvd Resurfacing 337,000 X
2007/08 STP 3rd Cycle Road Pavement Foster City Shell Blvd Resurfacing 140,000 X
2007/08 STP 3rd Cycle Road Pavement Menlo Park Oak Grove Ave. Resurfacing 109,000 X
2007/08 STP 3rd Cycle Road Pavement Millbrae Skyline Blvd. Pavement repair 124,000 X
2011 CMP - San Mateo County (Appendix G) 3 of 11 October 2011

STATUS OF CAPITAL IMPROVEMENT PRJOECTS
Program
Year
Program Type Jursidiction Project Description Amount Funding Obligation
Pending
Funding Fully
Obligated
Under Construction Completed
2007/08 STP 3rd Cycle Road Pavement Pacifica Sharp Park Rd rehab 165,000 X
2007/08 STP 3rd Cycle Road Pavement Pacifica Terra Nova Blvd rehab 175,000 X
2007/08 STP 3rd Cycle Road Pavement Pacifica Oddstadd Blvd rehab 150,000 X
2007/08 STP 3rd Cycle Road Pavement San Mateo J. Hart Clinton Rehab 575,000 X
2007/08 STP 3rd Cycle Road Pavement San Mateo Poplar Ave. Rehab 325,000 X
2007/08 TDA Art 3 Bike Ped Brisbane Bayshore Corridor North-South
Bikeway Project (Class II)
550,000 X
2007/08 TDA Art 3 Bike Ped Burlingame California Drive: Shared-Lane Bike
Route (Class III)
25,387 X
2007/08 TDA Art 3 Bike Ped Burlingame In-Pavement Illuminated Crosswalk
System at Broadway & Paloma
40,000 X
2007/08 TDA Art 3 Bike Ped Burlingame Howard Avenue Bike Lane (Class II) 50,467 X
2007/08 TDA Art 3 Bike Ped Daly City Soutgate Avenue Bike Lanes (Class
II & III)
100,000 X
2007/08 TDA Art 3 Bike Ped Daly City Traffic Accessibility Modifications
(Audible and Countdown)
40,000 X
2007/08 TDA Art 3 Bike Ped Half Moon Bay Highway 1 Bicycle Trail Project -
Class I
500,000 X
2007/08 TDA Art 3 Bike Ped Menlo Park Install Video Detection Systems for
Bicycles at Intersections
110,000 X
2007/08 TDA Art 3 Bike Ped San Mateo County Parks Crystal Springs Regional Trail
Design/Construction Documents
105,000 X
2007/08 TDA Art 3 Bike Ped South San Francisco Bikeway Connections and Kiosk 25,738 X
2008/09 CMAQ Operational
Improvements
C/CAG Traffic Incident Management (PE) 367,000 X
2008/09 CMAQ Pedestrian Colma D' Street Pedestrian Enhance (CON) 235,000 X
2008/09 CMAQ Pedestrian Colma D' Street Pedestrian Enhance (CON) 250,000 X
2008/09 CMAQ Pedestrian Daly City Mission St. Ped. Improvements. Ph.
I (CON)
47,000 X
2008/09 CMAQ Pedestrian Daly City Mission St. Ped. Improvements. Ph.
I (CON)
499,000 X
2011 CMP - San Mateo County (Appendix G) 4 of 11 October 2011

STATUS OF CAPITAL IMPROVEMENT PRJOECTS
Program
Year
Program Type Jursidiction Project Description Amount Funding Obligation
Pending
Funding Fully
Obligated
Under Construction Completed
2008/09 CMAQ Pedestrian Daly City Mission St. Ped. Improvements. Ph.
I (CON)
293,000 X
2008/09 CMAQ Pedestrian Daly City Mission St. Ped. Improvements. Ph.
I (CON)
123,000 X
2008/09 CMAQ Pedestrian Daly City Mission St. Ped. Improvements. Ph.
I (CON)
900,000 X
2008/09 CMAQ Pedestrian Pacifica San Pedro Terrace multi-purpose
trail (CON)
150,000 X
2008/09 CMAQ Pedestrian Pacifica San Pedro Terrace multi-purpose
trail (CON)
450,000 X
2008/09 CMAQ Pedestrian Pacifica San Pedro Terrace multi-purpose
trail (PE)
50,000 X
2008/09 CMAQ Streetscape Redwood City ECR/Broadway Streetscape (CON) 8,000 X
2008/09 CMAQ Streetscape Redwood City ECR/Broadway Streetscape (CON) 251,000 X
2008/09 CMAQ Streetscape Redwood City ECR/Broadway Streetscape (CON) 380,000 X
2008/09 CMAQ Streetscape San Mateo Delaware Street Improvements
(CON)
70,000 X
2008/09 CMAQ San Mateo County Mirada Surf Coastal Trail (CON) 181,000 X
2008/09 CMAQ San Mateo County Colma - 'F' Street Sidewalk and
streetscape (CON)
X
2008/09 CMAQ San Mateo County Menlo Park - Santa Cruz Ave Ped
Improv (CON)
27,000 X
2008/09 CMAQ Bike San Mateo County Westborough Blvd Bike lanes
improve
18,000 X
2008/09 CMAQ San Mateo County Install Permanent Traffic Calming
Advisory signs
40,000 X
2008/09 CMIA Highway Caltrans/SMCTA Auxiliary lanes - Marsh to
Embarcadero
74,221,000 X
2008/09 STIP ITS CCAG San Mateo County Smart Corridors 11,000,000 X
2008/09 STP Road Pavement Belmont Old County Rd Rehab (CON) 120,000 X
2008/09 STP Road Pavement Foster City Shell Blvd Rehab X
2008/09 TDA Art 3 Bike Ped Belmont Curb ramps 40,000 X
2011 CMP - San Mateo County (Appendix G) 5 of 11 October 2011

STATUS OF CAPITAL IMPROVEMENT PRJOECTS
Program
Year
Program Type Jursidiction Project Description Amount Funding Obligation
Pending
Funding Fully
Obligated
Under Construction Completed
2008/09 TDA Art 3 Bike Ped County of San Mateo -
Parks
Mirada Surf Coastal Trail 100,000 X
2008/09 TDA Art 3 Bike Ped Daly City Install sidewalk bulb-outs 50,000 X
2008/09 TDA Art 3 Bike Ped Daly City New sidewalk and curb ramps 55,000 X
2008/09 TDA Art 3 Bike Ped East Palo Alto Convert Rail Spur into a ped trail 100,000 X
2008/09 TDA Art 3 Bike Ped Half Moon Bay Class I trail on Hwy 1 100,000 X
2008/09 TDA Art 3 Bike Ped San Bruno Install Class II Bike Lanes 32,500 X
2008/09 TDA Art 3 Bike Ped San Bruno Specialized routing signs 9,000 X
2008/09 TDA Art 3 Bike Ped San Carlos Class III Bike Routes and racks 65,000 X
2008/09 TDA Art 3 Bike Ped San Mateo Pedestrian Countdown Signal Heads 15,808 X
2008/09 TDA Art 3 Bike Ped South San Francisco Video Detection for bicyclist 76,667 X
2008/09 TDA Art 3 Bike Ped South San Francisco Bike route signs 40,000 X
2008/09 TDA Art 3 Bike Ped South San Francisco Install 2 in-ground lighted crosswalks 40,000 X
2008/09 TDA Art 3 Bike Ped Woodside Reconfigure Woodside Rd lanes 25,000 X
2008/09 TDA Art 3 Bike Ped Woodside Modify bike lane drainage inlet 12,000 X
2008/09 TLSP ITS CCAG San Mateo County Smart Corridors 10,000,000 X
2009/10 ARRA Road Pavement Atherton Atherton Roadway Rehabilitation 718,000 X
2009/10 ARRA Road Pavement Belmont 2009 Belmont Overlay 564,000 X
2009/10 ARRA Bike Ped Belmont Belmont Bike Pedestrian Bridge 4,500,000 X
2009/10 ARRA Road Pavement Brisbane Brisbane - Bayshore Blvd Overlay 231,000 X
2009/10 ARRA Road Pavement Burlingame Burlingame Various Streets
Resurfacing
551,000 X
2011 CMP - San Mateo County (Appendix G) 6 of 11 October 2011

STATUS OF CAPITAL IMPROVEMENT PRJOECTS
Program
Year
Program Type Jursidiction Project Description Amount Funding Obligation
Pending
Funding Fully
Obligated
Under Construction Completed
2009/10 ARRA Road Pavement Colma Colma - Serramonte Blvd Pavement
Rehabilitation
217,000 X
2009/10 ARRA Road Pavement County of San Mateo San Mateo County Various Streets
Resurfacing
1,726,000 X
2009/10 ARRA Road Pavement Daly City Street Resurfacing 2009 1,363,000 X
2009/10 ARRA Road Pavement East Palo Alto East Palo Alto Various Streets
Rehabilitation and Resurfacing
421,000 X
2009/10 ARRA Road Pavement Foster City Foster City Blvd Resurfacing Project 440,000 X
2009/10 ARRA Road Pavement Half Moon Bay Half Moon Bay Downtown Streets
Rehabilitation
210,000 X
2009/10 ARRA Road Pavement Hillsborough Hillsborough 2009 Asphalt Overlay 813,000 X
2009/10 ARRA Road Pavement Menlo Park Menlo Park Various Resurfacing of
Various Federal Aid Routes
710,000 X
2009/10 ARRA Road Pavement Millbrae Millbrae 2009 Various Streets Repair 565,000 X
2009/10 ARRA Road Pavement Pacifica City of Pacifica Various Fed Aid
Street Pavement Rehabilitation
Project
777,000 X
2009/10 ARRA Road Pavement Portola Valley Portola Valley FY 2008-09 Various
Streets Resurfacing
196,000 X
2009/10 ARRA Road Pavement Redwood City Redwood City - various streets
overlay
736,000 X
2009/10 ARRA Bike Ped Redwood City Redwood City - El Camino
Real/Broadway Streetscape
1,423,000 X
2009/10 ARRA Road Pavement San Bruno San Bruno Various Roadway
Resurfacing and Overlays
959,000 X
2009/10 ARRA Bike Ped San Carlos 2009 Pedestrian Improvement
Project
559,000 X
2009/10 ARRA Road Pavement San Mateo City of San Mateo FY 2008-09
Various FAU/MTS Streets
Rehabilitation
1,545,000 X
2009/10 ARRA ITS San Mateo San Mateo County Smart Corridors 1,000,000 X
2009/10 ARRA Road Pavement South San Francisco South San Francsico FY 2008-09
Various Streets Resurfacing
1,661,000 X
2009/10 STIP (TE) Bike Ped San Mateo County County Bike Lane 200,000 X
2009/10 STIP (TE) San Bruno Median Landscape on El Camino
Real
779,000 X
2011 CMP - San Mateo County (Appendix G) 7 of 11 October 2011

STATUS OF CAPITAL IMPROVEMENT PRJOECTS
Program
Year
Program Type Jursidiction Project Description Amount Funding Obligation
Pending
Funding Fully
Obligated
Under Construction Completed
2009/10 STIP (TE) Half Moon Bay Route 1 median landscaping 223,000 X
2009/10 STIP (TE) Bicycle Brisbane Bayshore Bike Lane 803,000 X
2009/10 TDA Art 3 Bike Ped Burlingame Ped/Bike Bridge Connection 136,000 X
2009/10 TDA Art 3 Bike Ped Burlingame Bike Route Signs 7,500 X
2009/10 TDA Art 3 Bike Ped Half Moon Bay Class I Bike/Ped Trail 300,000 X
2009/10 TDA Art 3 Bike Ped Menlo Park Bike Route Signage 4,000 X
2009/10 TDA Art 3 Bike Ped Redwood City Crosswalks & Curb Ramps 33,584 X
2009/10 TDA Art 3 Bike Ped Redwood City Bike Route Sign/Detectors/Racks 42,792 X
2009/10 TDA Art 3 Bike Ped Redwood City In-Roadway Warning Light System 64,860 X
2009/10 TDA Art 3 Bike Ped San Bruno Pedestrian Sidewalk Access Ramps 160,000 X
2009/10 TDA Art 3 Bike Ped San Carlos Bikeway Sign/Detectors/Class II & III 83,500 X
2009/10 TDA Art 3 Bike Ped South San Francisco In-Ground Lighted Crosswalk 47,000 X
2009/10 TDA Art 3 Bike Ped South San Francisco Bay Trail Improvements 131,000 X
2010/11 CMAQ SR2S CCAG San Mateo County Safe Routes to
School Program
1,279,000 X
2010/11 CMAQ Road Pavement Millbrae El Camino Real/Victoria Ave
Pedestrian
355,000 X
2010/11 CMAQ San Carlos East Side Community Transit (PE) 425,696 X
2010/11 CMAQ Bicycle San Mateo Delaware Street Bike Lane (PE) 60,000 X
2010/11 STP Burlingame Burlingame - Federal Grant Street 308,000 X
2010/11 STP SR2S CCAG San Mateo County Safe Routes to
School Program
150,000 X
2010/11 STP Road Pavement Daly City Street Rehab Program 1,058,000 X
2011 CMP - San Mateo County (Appendix G) 8 of 11 October 2011

STATUS OF CAPITAL IMPROVEMENT PRJOECTS
Program
Year
Program Type Jursidiction Project Description Amount Funding Obligation
Pending
Funding Fully
Obligated
Under Construction Completed
2010/11 STP Road Pavement Pacifica Pavement Rehab 383,000 X
2010/11 STP Road Pavement Redwood City 2010-11 Street 946,000 X
2010/11 STP Road Pavement San Bruno Various Streets resurfacing 398,000 X
2010/11 STP Road Pavement San Mateo Street Rehab of Various Fed. 1,255,000 X
2010/11 STP Road Pavement San Mateo County Pavement Program 1,416,000 X
2010/11 STP Road Pavement San Mateo County Resurfacing of Pescadero Creek
Road (PE)
84,989 X
2010/11 STP Road Pavement South San Francisco Various Streets resurfacing 712,000 X
2010/11 TDA Art 3 Bike Ped C/CAG San Mateo County Comprehensive
Bicycle and Pedestrian Plan
200,000 X
2011/12 CMAQ Burlingame Burlingame Ave. and Broadway
District
301,000 X
2011/12 CMAQ Daly City Citywide Accessibility 420,000 X
2011/12 CMAQ Half Moon Bay Hwy 1 Bicycle Pedestrian Trail 420,000 X
2011/12 CMAQ Redwood City Bair Island Bay Trail Improvement 337,000 X
2011/12 CMAQ Bicycle Redwood City Skyway/Shoreline Bike Route 218,000 X
2011/12 CMAQ Bicycle Redwood City Skyway/Shoreline Bike Route (PE) 38,000 X
2011/12 CMAQ San Bruno Street Median and Grand 654,000 X
2011/12 CMAQ San Bruno Transit Corridor Pedestrian 263,000 X
2011/12 CMAQ San Carlos East Side Community Transit 1,795,304 X
2011/12 CMAQ Bicycle San Mateo Delaware Street Bike Lane 545,000 X
2011/12 CMAQ San Mateo El Camino Real Phase 1
Improvement
203,000 X
2011/12 CMAQ San Mateo County CSRT South of Dam Conversion 300,000 X
2011 CMP - San Mateo County (Appendix G) 9 of 11 October 2011

STATUS OF CAPITAL IMPROVEMENT PRJOECTS
Program
Year
Program Type Jursidiction Project Description Amount Funding Obligation
Pending
Funding Fully
Obligated
Under Construction Completed
2011/12 CMAQ South San Francisco Regional Gap 261,000 X
2011/12 STIP Highway Caltrans Aux lane landscaping #700B - 2-yr
plant establishment
33,000 X
2011/12 STIP Highway SMCTA US 101/Willow Interchange
Reconstruction
4,500,000 X
2011/12 STIP Highway SMCTA/Pacifica Hwy 1 San Pedro Creek Bridge
Replacement
3,000,000 X
2011/12 STP Road Pavement Menlo Park 2010/11 Resurfacing 385,000 X
2011/12 STP Road Pavement San Carlos Pavement Rehab Program 319,000 X
2011/12 STP San Mateo County Resurfacing of Pescadero Creek
Road
985,011 X
2011/12 TDA Art 3 Bike Ped County of San Mateo Crystal Springs Regional Trail South
of Highway 92
194,549 X
2011/12 TDA Art 3 Bike Ped County of San Mateo Crystal Springs Regional Trail South
of Highway 92
194,549 X
2011/12 TDA Art 3 Bike Ped Half Moon Bay Highway 1 Trail Extension - Seymour
to Wavecrest Road
250,000 X
2011/12 TDA Art 3 Bike Ped Menlo Park Alpine Road Bike Lane
Improvements
78,000 X
2011/12 TDA Art 3 Bike Ped Redwood City Brewster Avenue Bicycle
Improvements
107,640 X
2011/12 TDA Art 3 Bike Ped San Mateo Bay to Transit Trail - Phase 1 312,000 X
2011/12 TDA Art 3 Bike Ped San Mateo Downtown Bicycle Parking 98,783 X
2011/12 TDA Art 3 Bike Ped San Mateo Downtown Bicycle Parking 98,783 X
2011/12 TDA Art 3 Bike Ped South San Francisco Pedestrian Crossing Improvements
at El Camino H.S.
98,000 X
2012/13 STIP Highway C/CAG San Mateo County Smart Corridor -
Segment 3
1,977,000 X
2013/14 STIP Highway SMCTA US 101/Willow Interchange
Reconstruction
1,471,000 X
2013/14 STIP Highway SMCTA US 101/ Broadway Interchange 19,000,000 X
2013/14 STIP Highway SMCTA/Pacifica Calera Parkway Project 6,900,000 X
2011 CMP - San Mateo County (Appendix G) 10 of 11 October 2011
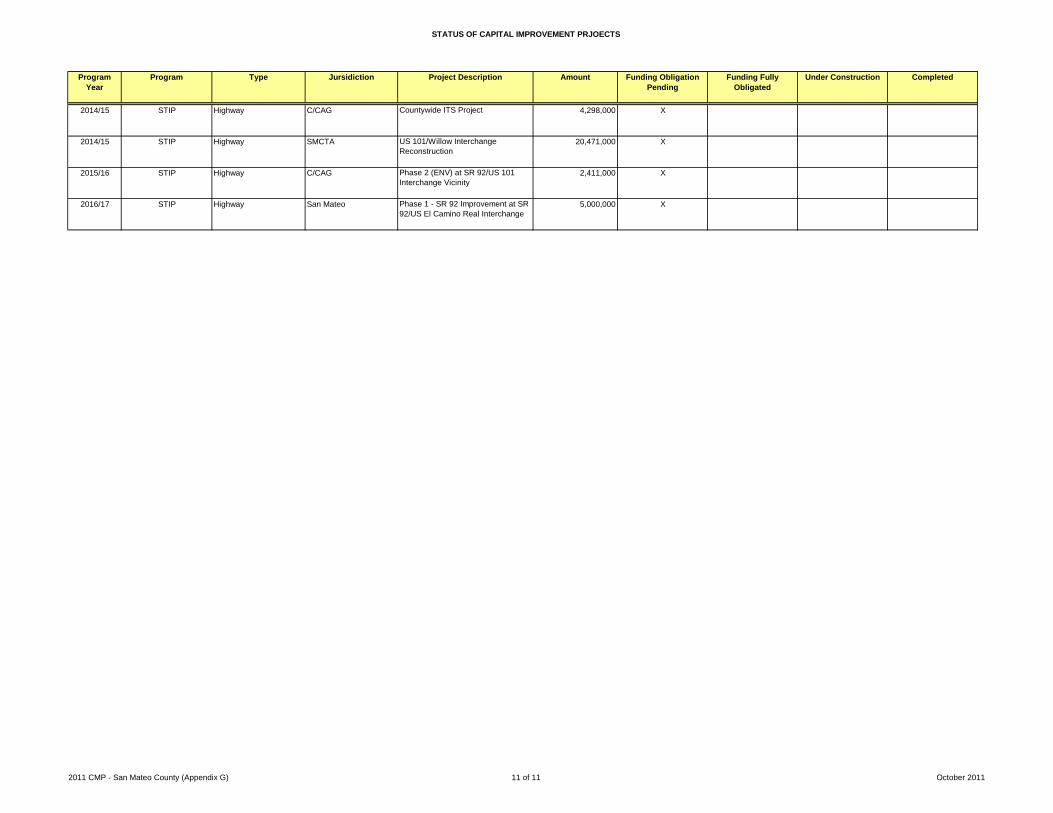
STATUS OF CAPITAL IMPROVEMENT PRJOECTS
Program
Year
Program Type Jursidiction Project Description Amount Funding Obligation
Pending
Funding Fully
Obligated
Under Construction Completed
2014/15 STIP Highway C/CAG Countywide ITS Project 4,298,000 X
2014/15 STIP Highway SMCTA US 101/Willow Interchange
Reconstruction
20,471,000 X
2015/16 STIP Highway C/CAG Phase 2 (ENV) at SR 92/US 101
Interchange Vicinity
2,411,000 X
2016/17 STIP Highway San Mateo Phase 1 - SR 92 Improvement at SR
92/US El Camino Real Interchange
5,000,000 X
2011 CMP - San Mateo County (Appendix G) 11 of 11 October 2011

APPENDIX H
Measure A Program Strategic Plan

CHAPTER 3
2009-2033Measure A Program
TA STRATEGIC PLAN 2009-2013

TA STRATEGIC PLAN 2009-2013
10
On January 1, 2009, the 2009 – 2033 Measure A Program will commence, continuing the generation of sales tax revenues in San Mateo County for transporta-tion facilities, services and programs. The voter-approved Expenditure Plan sets the program categories and percentage split of the sales tax revenues to each of the program categories described below. Additionally, the guidelines and requirements contained in the Expenditure Plan are highlighted in this section.
3.1 2004 Expenditure Plan Goals The goals of the 2004 Expenditure Plan Program are:
Reduce commute corridor congestion•
Make regional connections•
Enhance safety•
Meet local mobility needs•
Meeting these goals involves investment in multiple transportation modes. Funding is identifi ed for six primary program categories: Transit, Highways, Local Streets/Transportation, Grade Separations, Pedestrian and Bicycle, and Alternative Congestion Relief programs. Each category is designated for a percentage share of the total projected revenues which are currently estimated at $1.5 billion (in 2004 dollars) over the life of the Measure A Program, as illustrated in Figure 2 .
The 2004 Expenditure Plan outlines restrictions in the use of Measure A funds to target funding to transporta-tion projects in San Mateo County and maximize the leveraging of other funding. The restrictions include:
Measure A funds may not be used to replace or • supplant existing funds and resources on projects
Measure A funds may only be used for transportation • facilities and services
Measure A funds may only be used for projects within • San Mateo County, with exception to the systemwide costs for Caltrain Improvements, and for Highway projects that minimally extend into adjacent counties
3.2 Program Category DetailsThe Measure A Program includes six programs: Transit, Highways, Local Streets/Transportation, Grade Separations, Pedestrian and Bicycle, and Alternative Congestion Relief programs. Funding can be used for planning, design development, construction projects or operations in San Mateo County.
Table 3 lists the total estimated sales tax revenue over the life of the measure for each program category and matching funds from potential local, state and federal sources.
The defi nition and purpose of each program area are described in the following paragraphs. Also indicated for each program area, if applicable, are key parameters identifi ed in the 2004 Expenditure Plan.
Figure 2. 2004 Expenditure Plan
3.0 2009 – 2033 Measure A Program
30.0% Transit
27.5% Highways
22.5% Local Streets & Transportation
15.0% Grade Separation
3.0% Pedestrian & Bicycle
1.0% Administration
1.0% Alternative Congestion Relief

11
Program Category % Share Estimated Sales Tax(in 2004 dollars)
Estimated Match(in 2004 dollars)
Transit (30%)
Caltrain 16.0% $240.0 million $250 million
Local Shuttles 4.0% $60.0 million $60 million
Accessible Services 4.0% $60.0 million $228 million
Ferry 2.0% $30.0 million $92 million
Dumbarton Corridor 2.0% $30.0 million $415 million
BART 2.0% $30.0 million $120 million
Highways (27.5%)
Key Congested Areas 17.3% $260.0 million $260 million
Supplemental 10.2% $153.0 million $65 million
Local Streets / Transportation 22.5% $337.5 million $527 million
Grade Separations 15.0% $225.0 million $125 million
Pedestrian and Bicycle 3.0% $45.0 million $25 million
Alternative Congestion Relief Programs 1.0% $15.0 million $15 million
TOTAL 100.0%* $1,500 million* $2,200 million*
*Note: Includes up to 1% for Program Administration
TA STRATEGIC PLAN 2009-2013
Transit The Transit Program provides funding for multiple modes of transit including Caltrain, Local Shuttles, Accessible Services, Ferry, the Dumbarton Corridor and BART.
Caltrain –Caltrain is a 77-mile, 32 station commuter rail system that provides service in the counties of San Francisco, San Mateo and Santa Clara. Caltrain operates 98 weekday trains with less frequent service on week-ends, serving nearly 12 million customers a year. The purpose of the Caltrain program is to fund system upgrades and service expansions. Up to 50 percent of the funding can be used for operating expenses.
Local Shuttle –Local shuttle services are transit shuttle services provided with vehicles that are typically larger than vans and smaller than buses. The purpose of the Local Shuttle program is to meet local mobility needs and provide access to regional transit. These services are envisioned to complement fi xed-route bus and rail services.
Accessible Services –Accessible Services are targeted for paratransit and other transportation services to accommodate people with disabilities, seniors with mobility limitations, and those who need assistance using the existing transporta-tion services. The purpose of the Accessible Services program is to fund Americans with Disabilities Act (ADA) paratransit services, such as Redi-Wheels, and support the operating and capital needs of additional new
Table 3. Transportation Expenditure Plan Program Categories

TA STRATEGIC PLAN 2009-2013
12
programs for eligible seniors and people with disabilities. The ADA requires transit agencies to provide accessible services to people who are unable to use fi xed-route bus or rail service.
Ferry –Ferries provide transit service via waterways. The purpose of the Ferry program is to invest in cost-effective ferry services in San Mateo County, where currently, there is no ferry service. These services will increase transit options to meet daily transportation needs and also provide countywide transportation relief (and transport of emergency personnel) during times of emergencies. These services will be operated by the San Francisco Bay Area Water Emergency Transportation Authority (WETA), a regional transportation agency created by the California Legislature to develop ferry transit and waterborne emer-gency response services for the San Francisco Bay Area. Two ferry projects, one in Redwood City and the other in South San Francisco, have been identifi ed in the 2004 Expenditure Plan and are the two projects that are eligible to be funded by this program.
Dumbarton Corridor –The Dumbarton Corridor, which connects the Peninsula to the East Bay, has been identifi ed as a key corridor for future commuter rail service. This corridor provides a critical component of establishing a regional rail network as identifi ed in the Metropolitan Transportation Commission (MTC) Regional Rail Plan. Building on the investment of purchasing the Dumbarton Corridor right of way with funding from the 1988 Measure A Program, the purpose of this program is to fund station facilities and rail corridor enhancements in East Palo Alto, Menlo Park and Redwood City.
The Dumbarton commuter rail project, which is over-seen by the Dumbarton Rail Corridor Policy Advisory Committee (DRCPAC) and project managed by Caltrain, is currently at 10 percent design and in the environmental clearance phase. Once these tasks are complete, the DRCPAC will focus on solidifying the funding plan before defi ning specifi c projects to be funded by this program.
Bay Area Rapid Transit District (BART) –BART is a heavy rail system that operates throughout the counties of San Francisco, San Mateo, Alameda and Contra Costa. BART serves more than 362,000 riders on a typical weekday on its network of 104 miles and 43 stations. The purpose of this program is to fund capi-tal investments and operating expenditures associated with the San Mateo County BART extension, which was completed in 2003.
As outlined in an agreement between BART, SamTrans and the TA, 2 percent of Measure A sales tax revenues will be allocated to BART on an annual basis to fund a portion of the BART operating costs in San Mateo County. Within the general guidelines of the Measure A Program, specifi c projects to be funded by this program are to be defi ned by BART consistent with and within the parameters of the agreement between BART, SamTrans and the TA.
HighwaysThe purpose of this program is to reduce congestion on roadways within San Mateo County. This program is divided into two categories: Key Congested Areas are focused on removing bottlenecks in the most congested highway commute corridors; and Supplemental Roadways are focused on reducing congestion and improving throughput along secondary commute corridors.

13
TA STRATEGIC PLAN 2009-2013
Key Congested Areas –The 2004 Expenditure Plan allocates a specifi ed amount of sales tax revenue to fi ve key congested corridors in San Mateo County. Below is the list of eligible projects as identifi ed in the 2004 Expenditure Plan:
Highway 280 North Improvements•
Reconstruct I-280/Route 1 Interchange –(Daly City)Construct Auxiliary Lanes between I-380 –and Hickey Boulevard (Daly City, South San Francisco, San Bruno)
Coastside Highway Improvements•
Route 1/San Pedro Creek Bridge Replacement –(Pacifi ca)Route 1/Manor Drive overcrossing improvement –and widening (Pacifi ca) Route 1 and 92 safety and operational improvements –(within and in the proximity of Half Moon Bay)
Highway 92 Improvements•
Auxiliary lanes and interchange improvements –between I-280 and the San Mateo Hayward Bridge (San Mateo County, Foster City)
Highway 101 Mid-county Improvements•
Reconstruction of the Highway 101-Broadway –Interchange (Burlingame)Modifi cation of the Highway 101/Peninsula Avenue –Interchange (San Mateo, Burlingame)Operational improvements on Highway 101 –from Hillsdale to Route 92 (San Mateo)
Highway 101 South Improvements•
Reconstruct the Highway 101/Woodside Road –Interchange (Redwood City)Highway 101 improvements between Highway 84 and –the Santa Clara County line and access improvements to the Dumbarton Bridge (Redwood City, Menlo Park, East Palo Alto)
Supplemental Roadways –The 2004 Expenditure Plan includes a partial list of specifi c projects eligible to receive Measure A funding. Other projects (not listed in the plan) can be considered. Below is the partial list of candidate projects as identifi ed in the 2004 Expenditure Plan:
Route 35 (I-280-Sneath Lane) widening (San Bruno)•
US 101/Produce Avenue Interchange • (South San Francisco)
Route 92 (I-280/Route 35) truck climbing lane • (San Mateo)
Willow Road adaptive signal control system • (Menlo Park)
US 101 (Sierra Point Parkway – SF/SM County Line) • auxiliary lanes (South San Francisco, Brisbane)
Geneva Avenue extension (Daly City, Brisbane)•
I-280/John Daly Boulevard Overcrossing (north side) • widening (San Bruno)
Junipero Serra Boulevard Improvements (Daly City, • Colma, South San Francisco)
US 101/Candlestick Point Interchange (Brisbane)•
US 101 (Sierra Point Parkway – San Bruno Avenue) • auxiliary lanes (Brisbane, South San Francisco)
I-280/I-380 local access improvement (San Bruno)•
Highway 101/Sierra Point Pkwy Interchange • replacement and Lagoon Way extension (Brisbane)
Triton Drive widening (Foster City) •
Sand Hill Road signal coordination (Menlo Park)•
Woodside Road widening (US 101-El Camino Real) • (Redwood City)

Local Jurisdiction Allocation (%)
Estimated Funding ($2004)
Atherton 1.886 $ 6,365,250
Belmont 3.543 $ 11,957,625
Brisbane 0.818 $ 2,760,750
Burlingame 4.206 $ 14,195,250
Colma 0.299 $ 1,009,125
Daly City 10.413 $ 35,143,875
East Palo Alto 3.215 $ 10,850,625
Foster City 3.364 $ 11,353,500
Half Moon Bay 1.596 $ 5,386,500
Hillsborough 3.000 $ 10,125,000
Menlo Park 4.851 $ 16,372,125
Millbrae 2.917 $ 9,844,875
Pacifi ca 5.174 $ 17,462,250
Portola Valley 1.488 $ 5,022,000
Redwood City 9.612 $ 32,440,500
San Bruno 5.034 $ 16,989,750
San Carlos 4.271 $ 14,414,625
San Mateo 11.797 $ 39,814,975
S. San Francisco 7.949 $ 25,815,375
Woodside 1.683 $ 5,680,125
San Mateo Co. 13.184 $ 44,496,000
TA STRATEGIC PLAN 2009-2013
14
Local Streets and TransportationThe purpose of this program is to provide funding to the 20 cities and the County of San Mateo for the improve-ment and maintenance of local transportation facilities and services. This program provides money to local jurisdictions based on the following formula: 50 percent by population and 50 percent by the number of road miles within the jurisdiction. Annually, the TA will update the road miles and population fi gures based on California Department of Transportation and Department of Finance data. Table 4 below summarizes the estimated allocation and funding over the next 25 years (in 2004 dollars).
Grade SeparationThe Grade Separation program involves eliminating at-grade railroad crossings. This can be done by raising or lowering roads and/or train tracks at different eleva-tions. The purpose of this program is to provide funding for the construction or upgrade of grade separations along the Caltrain and Dumbarton rail lines in San Mateo County to improve safety and relieve local traffi c congestion. The rail crossings to be considered for Measure A funding are listed in the 2004 Expenditure Plan and are located in the cities of South San Francisco, San Bruno, Millbrae, Burlingame, San Mateo, Redwood City, Atherton, East Palo Alto and Menlo Park.
Pedestrian and BicyclesBicycling and walking are sustainable forms of transpor-tation. The purpose of this program is to fund specifi c projects to encourage and improve bicycling and walk-ing conditions. Qualifi ed expenditures include paths, trails and bridges over roads and highways. The 2004 Expenditure Plan includes a partial list of eligible bicycle and pedestrian projects which are listed below. Other projects will be considered.
Route 1/Santa Rosa Avenue Pedestrian Overcrossing • (Pacifi ca)
Route 1 pedestrian/bike trail from Montara through • Half Moon Bay (San Mateo County, Half Moon Bay)
Route 35/Route 1 pedestrian/bike overcrossing • (Daly City)
Millbrae Avenue/US 101 pedestrian/bike • overcrossing (Millbrae)
Hillcrest Boulevard/US 101 pedestrian/bike • overcrossing to Bay Trail (Millbrae)
US 101 near Hillsdale Boulevard pedestrian/bike • overcrossing (San Mateo)
Ralston Avenue/US 101 pedestrian/bike • overcrossing (Belmont)
Willow Road/Bayfront Expressway pedestrian/bike • tunnel upgrade (Menlo Park)
Willow Road/US 101 pedestrian/bike overcrossing • (Menlo Park)
Portola Road pedestrian/bike path paving • (San Mateo County)
Table 4. Estimated Annual Distribution toSan Mateo County and Cities

15
TA STRATEGIC PLAN 2009-2013
Alternative Congestion ReliefThe Alternative Congestion Relief program promotes transit and non-traditional methods of commuting to reduce reliance on the automobile and use of Intelligent Transportation Systems (ITS) to promote effi cient use of the transportation network. Commute alternatives receive 0.8 and ITS projects receive 0.2 percent of the Alternative Congestion Relief funds. Example projects include carpool services, transit subsidies, car shar-ing and telecommuting. The program also utilizes information technology to assist in effi cient use of the transportation network. Example projects include travel time signage on highways, accident alerts and rerouting information. This program is essential in completing a multimodal program to maximize transportation options and effi ciencies.

Program Category Description Purpose Project Parameters
Transit
Caltrain Existing commuter rail system providing train service in San Francisco, San Mateo and Santa Clara Counties
Upgrade and expand Caltrain services in San Mateo County; Fund systemwide improvements and safety
Up to 50% funding for operations
Local Shuttles Transit services provided with vehicles that are typically larger than vans and smaller than buses
Meet local mobility needs and provide access to regional transit
n/a
Accessible Services
Targeted transportation services for people that have special mobility needs
Provide paratransit and other transportation services to eligible seniors and people with disabilities
n/a
Ferry Transit service provided by vessels on waterways
Establish ferry services in San Mateo County
For services in Redwood City and South San Francisco
Dumbarton Corridor
A key corridor connecting the East Bay with the Peninsula identifi ed for future commuter rail service
Construct stations and rail enhancements in East Palo Alto, Menlo Park and Redwood City
n/a
BART Existing heavy rail system providing train services in San Francisco, San Mateo, Alameda and Contra Costa Counties
Maintain and operate BART extension to San Mateo County
Projects to be programmed by BART
Highways
Key Congested Areas
Highways in San Mateo County
Reduce congestion and increase throughput on highways
Projects to be selected from eligible project list
Supplemental Local, collector, arterial, state route roadways in San Mateo County
Reduce congestion and increase throughput on roadways
n/a
Local Streets / Transportation
Transportation services, roadways owned and maintained by the cities and County of San Mateo
Improve and maintain local transportation facilities and services
Projects to be programmed by cities and/or county
Grade Separations Eliminate at-grade railroad crossings
Improve safety and relieve local traffi c congestion
n/a
Pedestrian and Bicycle
Pedestrians and bicycle facilities
Encourage walking and bicycling n/a
Alternative Congestion Relief Programs
Commute alternatives and Intelligent Transportation Systems (ITS)
Effi ciently use transportation network and reduce reliance on automobiles
0.8 percent is for commute alternatives and 0.2 percent for ITS projects
TA STRATEGIC PLAN 2009-2013
16
Table 5. Program Category Details

APPENDIX I
Land Use Guidelines and Compliance Monitoring

455 COUNTY CENTER, 2ND FLOOR, REDWOOD CITY, CA 94063 • F 650/363-1867 • FAX: 650/363-4849
(FRM00440.DOC)
C/CAG CITY/COUNTY ASSOCIATION OF GOVERNMENTS
OF SAN MATEO COUNTY
Atherton • Belmont • Brisbane • Burlingame • Colma • Daly City • East Palo Alto • Foster City • Half Moon Bay • Hillsborough • Menlo Park • Millbrae Pacifica • Portola Valley • Redwood City • San Bruno • San Carlos • San Mateo • San Mateo County • South San Francisco • Woodside
September 21, 2004 TO: City Managers, Planning Directors, and Public Works Directors FROM: Tom Madalena, Planner II, City/County Association of Governments SUBJECT: REVISED C/CAG GUIDELINES FOR THE IMPLEMENTATION OF THE
LAND USE COMPONENT OF THE CONGESTION MANAGEMENT PROGRAM
At the C/CAG meeting on September 9, 2004, the Board adopted revised guidelines for the land use component of the Congestion Management Program. We would like to keep you informed of all changes to this policy. The purpose of this revision is to increase the number of options for reducing the impacts of traffic, to provide clarity for the stakeholders involved in the imple-mentation of this policy, and to reallocate the credits associated with some of the transportation demand management measures. All of the revisions to the guidelines are noted in bold text. These revisions will take effect immediately. As a reminder, the Congestion Management Program policy and guidelines must be followed for all projects that meet the following criteria: 1. The project will generate a net 100 or more peak hour trips on the Congestion
Management Program roadway network. 2. The project is subject to CEQA review. If you have a project that meets these criteria, you should follow these steps: 1. Review the guidelines with the project applicant and determine if a combination
of the acceptable options/measures will fully reduce the net number of trips that this project is anticipated to generate on the CMP roadway network.
2. If yes, include this information as part of the environmental documents that are
circulated and adopted by the local jurisdiction Board. 3. If no, or if new or revised measures are being proposed, contact Tom Madalena
for C/CAG review and approval as early in the process as possible so that the agreed upon plan can be included in the environmental documents placed in circulation.

4. If agreement is not reached with C/CAG staff on the plan, an immediate review by the C/CAG Board will be scheduled so that the local jurisdiction project approval process will not be delayed.
As an ongoing and living document, we welcome any suggestions that you may have for the guidelines. Please contact Tom Madalena at 650/363-1867 ([email protected]) if you have any questions or comments. Attachment

GUIDELINES FOR IMPLEMENTING THE LAND USE COMPONENT OF THE CONGESTION MANAGEMENT PROGRAM
All land use changes or new developments that require a negative declaration or an Environmental Impact Report (EIR) and that are projected to generate a net (subtracting existing uses that are currently active) 100 or more trips per hour at any time during the a.m. or p.m. peak hour period, must be reported to C/CAG within ten days of completion of the initial study prepared under the California Environmental Quality Act (CEQA). Peak period includes 6:00 a.m. to 10:00 a.m. and 3:00 p.m. to 7:00 p.m. Peak hour is defined as the hour when heaviest daily traffic volume occurs and generally occurs during morning and afternoon commute times. Traffic counts are obtained during AM and PM peak periods and the volume from the heaviest hour of AM or PM traffic is used to define peak hour for those time periods. The highest number of net trips resulting from AM or PM peak hour will be used. Net trips are calculated by subtracting trips for existing uses from those generated by the new project. Although projects that generate less than 100 peak hour trips are not subject to these guidelines, local jurisdictions are strongly encouraged to apply them to all projects, particularly where the jurisdiction has determined that the impacts of the project will have an adverse effect on traffic in that jurisdiction. These guidelines are not intended to establish a Countywide threshold of significance of 100 peak hour trips for CEQA purposes. The determination of what level of traffic results in a significant impact is left in the first instance to the local jurisdiction. These guidelines do contemplate, however, that all trips resulting from projects that are reviewed by C/CAG and fall under these guidelines will be mitigated, whether or not it rises to a level of significance under CEQA. Local jurisdictions must ensure that the developer and/or tenants will reduce the demand for all new peak hour trips (including the first 100 trips) projected to be generated by the development. The local jurisdiction can select one or more of the options that follow or may propose other methods for mitigating the trips. It is up to the local jurisdiction working together with the project sponsor to choose the method(s) that will be compatible with the intended purpose of the project and the community that it will serve. The options identified in these guidelines are not intended to limit choices. Local jurisdictions are encouraged to be creative in developing options that meet local needs while accomplishing the goal of mitigating new peak hour trips. The additional measures that are not specifically included in these guidelines should be offered for review by C/CAG staff in advance of approving the project. Appeals to the decisions by C/CAG staff will be taken to the full C/CAG Board for consideration. The Congestion Management Program roadway network includes all state highways and selected principal arterials. When considering land use projects, local jurisdictions may either require that mitigation for impacts to the Congestion Management Program roadway network be finally determined and imposed as a condition of approval of the project, or may conditionally approve such project, conditioned on compliance with the requirements to mitigate the impacts to the Congestion Management Program roadway network. In those instances where conditional approval is given, a building permit may not be issued for the project until the required mitigation is determined and subsequently imposed on the project.

Some of the choices for local jurisdictions include: 1. Reduce the scope of the project so that it will generate less than 100 net peak hour trips. 2. Build adequate roadway and/or transit improvements so that the added peak hour trips
will have no measurable impact on the Congestion Management Program roadway network.
3. If a local jurisdiction currently collects traffic mitigation fees, any portion of the fees that are used to mitigate the impacts of the project’s traffic on the Congestion Management Program roadway network will count as a credit toward the reduction in the demand for trips required under the Congestion Management Program. The developer may also contribute a one-time only payment of $20,000 per peak hour trip (including the first 100 trips) to a special fund for the implementation of appropriate transportation demand management system measures at that development. These funds will be used to implement transportation demand management programs that serve the development making the contribution.
4. Require the developer and all subsequent tenants to implement Transportation Demand Management programs that have the capacity to fully reduce the demand for new peak hour trips. The developer/tenants will not be held responsible for the extent to which these programs are actually used. The developer shall pay for a monitoring program for the first three years of the development. The purpose of the monitoring program is to assess the compliance of the project with the final TDM plan. The following is a list of acceptable programs and the equivalent number of trips that will be credited as reduced. Programs can be mixed and matched so long as the total mitigated trips is equal to or greater than the new peak hour trips generated by the project. These programs, once implemented, must be on going for the occupied life of the development. Programs may be substituted with prior approval of C/CAG, so long as the number of mitigated trips is not reduced. Additional measures may be proposed to C/CAG for consideration. Also there may be special circumstances that warrant a different amount of credit for certain measures. For example, a developer may elect to contract with the Alliance or another provider of TDM services to meet this requirement. These situations can also be submitted to C/CAG in advance for consideration. It is up to each local jurisdiction to use its best judgment to determine the extent to which certain measures are “reasonable and effective.” For example, there will be a point where additional showers will not result in more people riding bicycles or walking to work.
5. Adopt Congestion Management Program guidelines for projects within its jurisdiction and submit those guidelines for approval by C/CAG. The local jurisdiction would then apply these guidelines to the appropriate level of project and provide an annual report describing affected projects and guidelines applied. C/CAG would review the jurisdiction’s efforts on an annual basis and could require amendments to the jurisdiction’s guidelines if the jurisdiction’s guidelines were not meeting Congestion Management Program goals.

6. Adopt the C/CAG guidelines for application to the appropriate level of project in the jurisdiction, and submit an annual report describing affected projects and guidelines applied. C/CAG would review the jurisdiction’s efforts on an annual basis and could require amendments to the jurisdiction’s guidelines if the jurisdiction’s guidelines were not meeting Congestion Management Program goals.
7. Negotiate with C/CAG staff for other acceptable ways to mitigate the trips for specific developments on a case-by-case basis.
8. C/CAG recognizes that for retail or special uses appropriate TDM measures may be difficult to implement. Please contact C/CAG to develop appropriate measures for these types of projects.
Transportation Demand
Management Measure
Number of Trips Credited Rationale
Secure bicycle storage
One peak hour trip will be creditedfor every 3 new bike lockers/racks installed and maintained. Lockers/racks must be installed within 100 feet of the building.
Experience has shown that bicycle commuters will average using this mode one-third of the time, especially during warmer summer months.
Showers and changing rooms.
Ten peak hour trips will be credited for each new combination shower and changing room installed. An additional 5 peak hour trips will be credited when installed in combination with at least 5 bike lockers
10 to 1 ratio based on cost to build and the likelihood that bicycle utilization will increase.
Operation of a dedicated shuttle service during the peak period to a rail station or an urban residential area. Alternatively the development could buy into a shuttle consortium.
One peak hour trip will be creditedfor each peak-hour round trip seat on the shuttle. Increases to two trips if a Guaranteed Ride Home Program is also in place. Five additional trips will be credited if the shuttle stops at a child-care facility enroute to/from the worksite.
Yields a one-to-one ratio (one seat in a shuttle equals one auto trip reduced); utilization increases when a guaranteed ride home program is also made available.

Charging employees for parking.
Two peak hour trips will be credited for each parking spot charged out at $20 per month for one year. Money shall be used for TDM measures such as shuttles or subsidized transit tickets.
Yields a two-to-one ratio
Subsidizing transit tickets for employees.
One peak hour trip will be credited for each transit pass that is subsidized at least $20 per month for one year. One additional trip will be credited if the subsidy is increased to $75 for parents using transit to take a child to childcare enroute to work.
Yields a one-to-one ratio (one transit pass equals one auto trip reduced).
Subsidizing pedestrians/bicyclists who commute to work.
One peak hour trip will be credited for each employee that is subsidized at least $20 per month for one year.
Yields a one-to-one ratio (One pedestrian/bicyclist equals one auto trip reduced.
Creation of preferential parking for carpoolers.
Two peak hour trips will be credited for each parking spot reserved.
Yields a two-to-one ratio (one reserved parking spot equals a minimum of two auto trips reduced).
Creation of preferential parking for vanpoolers.
Seven peak hour trips will be credited for each parking spot reserved.
Yields a seven-to-one ratio (one reserved parking spot equals a minimum of seven auto trips reduced).
Implementation of a vanpool program.
Seven peak hour trips will be credited for each vanpool arranged by a specific program operated at the site of the development. Increases to ten trips if a Guaranteed Ride Home Program is also in place.
The average van capacity is seven.

Operation of a commute assistance center, offering on site,one stop shopping for transit and commute alternatives information, preferably staffed with a live person to assist building tenants with trip planning.
One peak hour trip will be credited for each feature added to the information center; and an additional one peak hour trip will be credited for each hour the center is staffed with a live person, up to 20 trips per each 200 tenants. Possible features may include:
Transit information brochure rack
Computer kiosk connected to Internet
Telephone (with commute and transit information numbers)
Desk and chairs (for personalized trip planning)
On-site transit ticket sales Implementation of flexible
work hour schedules that allow transit riders to be 15-30 minutes late or early (due to problems with transit or vanpool).
Quarterly educational programs to support commute alternatives
This is based on staff’s best estimate. Short of there being major disincentives to driving, having an on site TDM program offering commute assistance is fundamental to an effective TDM program.
Survey Employees to examine use and best practices.
Three peak hour trips will be credited for a survey developed to be administered twice yearly
This is based on staff’s best estimate with the goal of finding best practices to achieve the mode shift goal.
Implementation of a parking cash out program.
One peak hour trip will be credited for each parking spot where the employee is offered a cash payment in return for not using parking at the employment site.
Yields a one-to-one ratio (one cashed out parking spot equals one auto trip reduced.

Implementation of ramp metering.
Three hundred peak hour trips will be credited if the local jurisdiction in cooperation with CalTrans, installs and turns on ramp metering lights during the peak hours at the highway entrance ramp closest to the development.
This is a very difficult and costly measure to implement and the reward must be significant.
Installation of high bandwidth connections in employees’ homes to the Internet to facilitate home telecommuting
One peak hour trip will be credited for every three connections installed. This measure is not available as credit for a residential development.
Yields a one-to-three ratio.
Installation of video conferencing centers that are available for use by the tenants of the facility.
Five peak hour trips will be credited for a center installed at the facility.
This is based on staff’s best estimate.
Implementation of a compressed workweek program.
One peak hour trip will be credited for every 5 employees that are offered the opportunity to work four compressed days per week.
The workweek will be compressed into 4 days; therefore the individual will not be commuting on the 5th day.
Flextime: Implementation of an alternate hours workweek program.
One peak hour trip will be credited for each employee that is offered the opportunity to work staggered work hours. Those hours can be a set shift set by the employer or can be individually determined by the employee.
This is based on staff’s best estimate.
Provision of assistance to employees so they can live close to work.
If an employer develops and offers a program to help employees find acceptable residences within five miles of the employment site, a credit of one trip will be given for each slot in the program.
This assumes that a five-mile trip will generally not involve travel on the freeways.

Implementation of a program that gives preference to hiring local residents at the new development site.
One peak hour trip will be credited for each employment opportunity reserved for employees recruited and hired from within five miles of the employment site.
This assumes that a five-mile trip will generally not involve travel on the freeways.
Provision of on-site amenities/accommodations that encourage people to stay on site during the workday, making it easier for workers to leave their automobiles at home.
Five peak hour trips will be credited for each feature added to the job site. Possible features may include:
banking grocery shopping clothes cleaning exercise facilities child care center
This is based on staff’s best estimate.
Provide use of motor vehicles to employees who use alternate commute methods so they can have access to vehicles during breaks for personal use.
Five peak hour trips will be credited for each vehicle provided.
This is based on staff’s best estimate.
Provide use of bicyclesto employees who use alternate commute methods so they can have access to bicycles during breaks for personal use.
One peak hour trip will be credited for every four bicycles provided.
This is based on staff’s best estimate.
Provision of child care services as a part of the development
One trip will be credited for every two child care slots at the job site. This amount increases to one trip for each slot if the child care service accepts multiple age groups (infants=0-2yrs, preschool=3&4 yrs, school-age=5 to 13 yrs).
This is based on staff’s best estimate.

Developer/property owner may join an employer group to expand available child care within 5 miles of the job site or may provide this service independently
One trip will be credited for each new child care center slot created either directly by an employer group, by the developer/property owner, or by an outside provider if an agreement has been developed with the developer/property owner that makes the child care accessible to the workers at the development.
This is based on staff’s best estimate.
Join the Alliance’s guaranteed ride home program.
Two peak hour trips will be credited for every 2 slots purchased in the program.
Experience shows that when a Guaranteed Ride Home Program is added to a TDM program, average ridership increases by about 50%.
Combine any ten of these elements and receive an additional credit for five peak hour trips.
Five peak hour trips will be credited.
Experience has shown that offering multiple and complementary TDM components can magnify the impact of the overall program.
Work with the Alliance to develop/ implement a Transportation Action Plan.
Ten peak hour trips will be credited.
This is based on staff's best estimate.
The developer can provide a cash legacy after the development is complete and designate an entity to implement any (or more than one) of the previous measures before day one of occupancy.
Peak hour trip reduction credits will accrue as if the developer was directly implementing the items.
Credits accrue depending on what the funds are used for.
Encourage infill development.
Two percent of all peak hour trips will be credited for each infill development.
Generally acceptable TDM practices (based on research of TDM practices around the nation and reported on the Internet).

Encourage shared parking.
Five peak hour trips will be credited for an agreement with an existing development to share existing parking.
Generally acceptable TDM practices (based on research of TDM practices around the nation and reported on the Internet).
Participate in/create/sponsor a Transportation Management Association.
Five peak hour trips will be credited.
Generally acceptable TDM practices (based on research of TDM practices around the nation and reported on the Internet).
Coordinate Transportation Demand Management programs with existing developments/ employers.
Five peak hour trips will be credited.
This is based on staff’s best estimate.
For employers with multiple job sites, institute a proximate commuting program that allows employees at one location to transfer/trade with employees in another location that is closer to their home.
One peak hour trip will be credited for each opportunity created.
Yields a one-to-one ratio.
Pay for parking at park and ride lots or transit stations.
One peak hour trip will be credited for each spot purchased.
Yields a one-to-one ratio.
Additional Measures for Residential Developments

Develop schools, convenience shopping, recreation facilities, and child care centers in new subdivisions.
Five peak hour trips will be credited for each facility included.
This is based on staff’s best estimate.
Provision of child care services at the residential development and/or at a nearby transit center
One trip will be credited for every two child care slots at the develop-ment/transit center. This amount increases to one trip for each slot if the child care service accepts multiple age groups (infants, preschool, school-age).
This is based on staff’s best estimate.
Make roads and streets more pedestrian and bicycle friendly.
Five peak hour trips will be credited for each facility included.
This is based on staff’s best estimate.
Revise zoning to limit undesirable impacts (noise, smells, and traffic) instead of limiting broad categories of activities.
Five peak hour trips will be credited.
This is based on staff’s best estimate.
Create connections for non-motorized travel, such as trails that link dead-end streets.
Five peak hour trips will be credited for each connection make.
This is based on staff’s best estimate.
Create alternative transportation modes for travel within the development and to downtown areas - bicycles, scooters, electric carts, wagons, shuttles, etc.
One peak hour trip will be credited for each on-going opportunity created (i.e. five bicycles/ scooters/wagons = five trips, two-seat carts = two trips, seven passenger shuttle = seven trips).
This is based on staff’s best estimate.
Design streets/roads that encourage pedestrian and bicycle access and discourage automobile access.
Five trips will be credited for each design element.
This is based on staff’s best estimate.
Install and maintain Five trips will be credited for each This is based on staff’s best

alternative transportation kiosks.
kiosk. estimate.
Install/maintain safety and security systems for pedestrians and bicyclists.
Five trips will be credited for each measure implemented.
This is based on staff’s best estimate.
Implement jitneys/ vanpools from residential areas to downtowns and transit centers.
One trip will be credited for each seat created.
Yields a one-to-one ratio.
Locate residential development within one-third mile of a fixed rail passenger station.
All trips from a residential development within one-third mile of a fixed rail passenger station will be considered credited due to the location of the development.
This is based on staff’s best estimate.
The local jurisdiction must also agree to maintain data available for monitoring by C/CAG, that supports the on-going compliance with the agreed to trip reduction measures.

Jurisdiction Project Measures Taken C/CAG ComplianceDaly City Landmark Plaza Project TDM plan incorporated into Draft
EIRTDM Plan approved by C/CAG
Redwood City Abbott Labs TDM plan incorporated into Draft EIR
TDM Plan approved by C/CAG
East Palo Alto YMCA TDM plan submitted to C/CAG for review
TDM plan approved by C/CAG
Burlingame Peninsula Medical Center Replacement Project
TDM is included as a condition of approval
TDM Plan approved by C/CAG
Brisbane One Quarry Road None yet None yet
Pacifica Cypress Walk Residential Project
None yet None yet
Redwood City Bayside Gardens Final EIR states TDM plan will be submitted to C/CAG prior to final project approval
TDM plan to be sent to C/CAG for review
Redwood City High Tech High Bayshore TDM provided by the project sponsor
TDM plan approved
Half Moon Bay Cabrillo Corners Commercial Project
None yet None yet
Menlo Park Safeway TDM plan submitted to C/CAG by consultant
TDM plan will be approved by C/CAG as long as it is included as a condition of approval that is to be met prior to occupancy
Daly City Westlake Shopping Center TDM plan is required as a condition of approval to be met prior to occupancy
TDM plan to be submitted to C/CAG for review
South San Francisco Genentech B 33 & B 37 TDM Plan incorporated into Genentech Corporate Facilities Master Plan
South San Francisco's TDM Ordinance exceeds C/CAG's requirements
South San Francisco 333 Oyster Point Blvd. TDM plan was incorporated with a requirement to achieve 35% mode shift and was incuded as a condition of approval
South San Francisco's TDM Ordinance exceeds C/CAG's requirements
South San Francisco Genentech B 31 TDM Plan to be incorporated into Genentech Corporate Facilities Master Plan
South San Francisco's TDM Ordinance exceeds C/CAG's requirements
South San Francisco 180 Oyster point Blvd. TDM provided by the project sponsor
TDM Plan approved by C/CAG
Foster City Bayside Towers III TDM provided by the project sponsor
TDM Plan approved by C/CAG
South San Francisco 681 Gateway Boulevard Project
TDM plan submitted to C/CAG by consultant
TDM Plan approved by C/CAG
South San Francisco Home Depot Project TDM plan submitted to C/CAG by consultant
TDM Plan approved by C/CAG
City County Association of Governments * Congestion Mangement ProgramLand Use Impact Analysis Program Compliance
August 9, 2011

Jurisdiction Project Measures Taken C/CAG Compliance
City County Association of Governments * Congestion Mangement ProgramLand Use Impact Analysis Program Compliance
August 9, 2011
Redwood City Stanford Outpatient Center TDM plan submitted to C/CAG by consultant
TDM Plan approved by C/CAG
South San Francisco 249 East Grand Ave. Office/R&D Project
TDM plan submitted to C/CAG by consultant
TDM Plan approved by C/CAG
South San Francisco Lowe's Project TDM provided by the project sponsor
TDM Plan approved by C/CAG
South San Francisco East Jamie Court Project TDM plan submitted to C/CAG by consultant
TDM Plan approved by C/CAG
South San Francisco 333-351 Allerton Ave. Project TDM plan submitted to C/CAG by consultant
TDM Plan approved by C/CAG
South San Francisco 285 East Grand Ave. Project TDM plan submitted to C/CAG by consultant
TDM Plan approved by C/CAG
City of San Carlos Palo Alto Medical Foundation TDM plan submitted to C/CAG by consultant
TDM Plan approved by C/CAG
City of Menlo Park Sand Hill Road Hotel and Office Project
TDM plan submitted to C/CAG by consultant
TDM Plan approved by C/CAG
City of Brisbane Sierra Point Project TDM plan submitted to C/CAG by consultant
TDM Plan approved by C/CAG
City of South San Francisco
Terrabay Phase III TDM plan submitted to C/CAG by consultant
TDM Plan approved by C/CAG
City of South San Francisco
213 East Grand Ave. TDM plan submitted to C/CAG by consultant
TDM Plan approved by C/CAG
City of South San Francisco
Hyatt Place Hotel TDM plan submitted to C/CAG by consultant
TDM Plan approved by C/CAG
City of South San Francisco
Britannia Modular Labs 4 TDM plan submitted to C/CAG by consultant
TDM Plan approved by C/CAG
City of South San Francisco
1070 & 1080 San Mateo Avenue
TDM plan submitted to C/CAG by consultant
TDM Plan approved by C/CAG
County of San Mateo Big Wave Wellness Center and Office Park Project
None yet None yet
City of South San Francisco
Oyster Point Specific Plan Environmental Impact Report
TDM plan submitted to C/CAG by consultant
TDM Plan approved by C/CAG

APPENDIX J
Regional Transportation Plan Projects

114 M E T R O P O L I T A N T R A N S P O R T A T I O N C O M M I S S I O N
21602 Reconstruct U.S. 101/Broadway interchange $ 59.5 $ 28.0 $ 31.5
21603 Modify U.S. 101/Woodside Road interchange $ 50.3 $ 30.3 $ 20.0
21604 Construct auxiliary lanes (one in each direction) on U.S. 101 from Sierra Pointto San Francisco County line
$ 6.7 $ 3.2 $ 3.5
21606 Reconstruct U.S. 101/Willow Road interchange $ 53.8 $ 53.8 $ 0.0
21607 Modify University Avenue overcrossing of U.S. 101 to improve operationalefficiency and safety (includes widening of overcrossing, constructing newsouthbound off-ramp and auxiliary lane, and adding bicycle lanes)
$ 6.4 $ 2.1 $ 4.3
21608 Construct auxiliary lanes (one in each direction) on U.S. 101 from Marsh Road toEmbarcadero Road
$ 119.9 $ 119.9 $ 0.0 Partially funded with Proposition 1B CorridorMobility Improvement Account funds
21609 Improve local access from Sneath Lane and San Bruno Avenue to I-280/I-380interchange (study phase only)
$ 2.0 $ 2.0 $ 0.0
21610 Construct auxiliary lanes (one in each direction) on U.S. 101 from San BrunoAvenue to Grand Avenue
$ 57.5 $ 26.6 $ 30.9
21612 Improve access to/from west side of Dumbarton Bridge on Route 84 connectingto U.S. 101 (includes flyovers, interchange improvements and conversion ofWillow Road between Route 84 and U.S. 101 to expressway)
$ 92.4 $ 80.4 $ 12.0 2004 Measure A sales tax project
21613 Improve Route 92 from San Mateo-Hayward Bridge to I-280 (includes wideningand uphill passing lane from U.S. 101 to I-280)
$ 85.6 $ 50.6 $ 35.0 2004 Measure A sales tax project
21615 Reconstruct I-280/Route 1 interchange, including ramps $ 70.0 $ 53.0 $ 17.0 1988 and 2004 Measure A sales tax project
21623 Improve Caltrain stations (includes upgrades/relocation of platforms, newplatforms, pedestrian tunnels, pedestrian crossings and parking improvements)
$ 139.0 $ 119.1 $ 19.9 1988 Measure A sales tax project
21624 Implement an incentive program to support transit-oriented developments within1/2-mile of Caltrain stations that have a minimum density of 40 units per acre
$ 19.6 $ 3.3 $ 16.3
21626 Implement Caltrain grade separation program in San Mateo County $ 714.2 $ 629.2 $ 85.0 1988 and 2004 Measure A sales tax project
21892 Widen Woodside Road from 4 to 6 lanes from El Camino Real to Broadway $ 16.6 $ 7.7 $ 8.9
21893 Widen Route 92 from Half Moon Bay city limits and Pilarcitos Creek (includeswidening shoulders and travel lanes to standard widths and straightening curves)
$ 40.1 $ 24.5 $ 15.6
Reference Total Committed DiscretionaryNumber Project/Program Project Cost Funds1 Funds2 Project Notes
San Mateo County(In millions of year-of-expenditure dollars)
1 Committed Funds have been reserved by law for specific uses, or allocated by MTC action prior to the development of the Transportation 2035 Plan.
2 Discretionary Funds are flexible funds available to MTC (and not already programmed in Committed Funds) for assignment to projects via the Transportation 2035 Plan planning process.

22120 Construct ferry terminal at Redwood City $ 15.0 $ 15.0 $ 0.0
22226 Construct Bayshore Intermodal Facility for Caltrain, Muni light rail, and Muni andSamTrans buses (includes cross-platform transit transfers between Muni ThirdStreet light-rail station and Caltrain Bayshore station)
$ 36.5 $ 27.3 $ 9.2
22227 Extend Geneva Avenue to the U.S. 101/Candlestick Point interchange (includesCaltrain grade separation at Tunnel Avenue and other local streetimprovements)
$ 44.2 $ 22.1 $ 22.1
22229 Reconstruct U.S. 101/Sierra Point Parkway interchange (includes extension ofLagoon Way to U.S. 101)
$ 30.7 $ 26.3 $ 4.4
22230 Construct auxiliary lanes (one in each direction) on I-280 from I-380 toHickey Boulevard
$ 87.7 $ 53.6 $ 34.1 2004 Measure A sales tax project
22232 Construct streetscape improvements on Mission Street (Route 82) from JohnDaly Boulevard to San Pedro Road
$ 3.4 $ 3.4 $ 0.0
22239 Widen Manor Drive overcrossing at Route 1 (includes new traffic signals atintersection)
$ 22.0 $ 10.1 $ 11.9 2004 Measure A sales tax project
22261 Replace San Pedro Creek Bridge over Route 1 $ 6.8 $ 3.7 $ 3.1
22268 Provide countywide shuttle service between Caltrain stations and major activitycenters (includes purchase of vehicles)
$ 175.0 $ 154.1 $ 20.9 2004 Measure A sales tax project
22271 Widen Skyline Boulevard (Route 35) from 2 to 4 lanes between I-280 andSneath Lane
$ 6.4 $ 3.9 $ 2.5
22274 Install an Intelligent Transportation System (ITS) and a Traffic Operation System(TOS) countywide
$ 73.7 $ 39.8 $ 33.9 2004 Measure A sales tax project
22279 Construct new U.S. 101/Produce Avenue interchange (includes replacement ofProduce Avenue on- and off-ramps and South Airport Boulevard ramps to U.S.101 at Wondercolor Lane)
$ 16.4 $ 8.2 $ 8.2
22282 Improve U.S. 101 operations near Route 92 $ 49.8 $ 23.0 $ 26.8 2004 Measure A sales tax project
22615 Improve station facilities and other rail improvements in Redwood City, MenloPark and East Palo Alto in conjunction with the Dumbarton Rail Corridor
$ 39.3 $ 39.3 $ 0.0 2004 Measure A sales tax project
22726 Implement ferry service between South San Francisco and Alameda/Oakland $ 51.2 $ 51.2 $ 0.0 Resolution 3434 Regional Transit ExpansionProgram
115T R A N S P O R T A T I O N 2 0 3 5 P L A N
San Mateo CountyReference Total Committed DiscretionaryNumber Project/Program Project Cost Funds1 Funds2 Project Notes
(In millions of year-of-expenditure dollars)
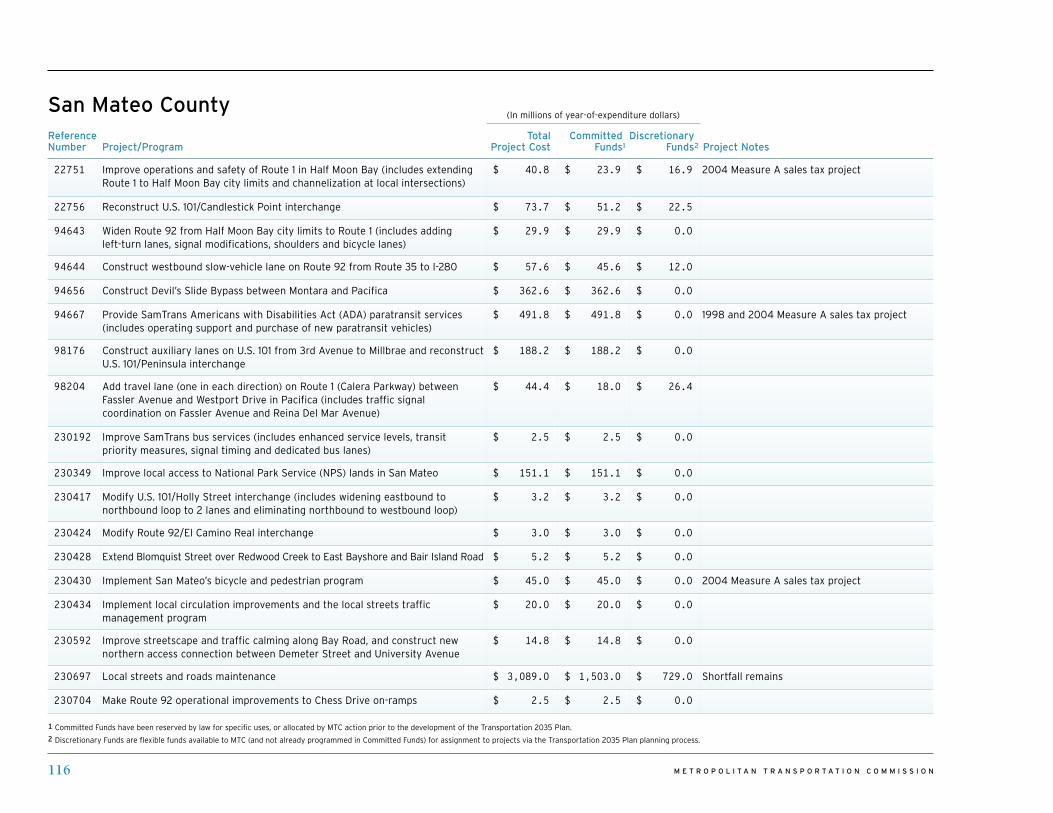
116 M E T R O P O L I T A N T R A N S P O R T A T I O N C O M M I S S I O N
22751 Improve operations and safety of Route 1 in Half Moon Bay (includes extendingRoute 1 to Half Moon Bay city limits and channelization at local intersections)
$ 40.8 $ 23.9 $ 16.9 2004 Measure A sales tax project
22756 Reconstruct U.S. 101/Candlestick Point interchange $ 73.7 $ 51.2 $ 22.5
94643 Widen Route 92 from Half Moon Bay city limits to Route 1 (includes addingleft-turn lanes, signal modifications, shoulders and bicycle lanes)
$ 29.9 $ 29.9 $ 0.0
94644 Construct westbound slow-vehicle lane on Route 92 from Route 35 to I-280 $ 57.6 $ 45.6 $ 12.0
94656 Construct Devil’s Slide Bypass between Montara and Pacifica $ 362.6 $ 362.6 $ 0.0
94667 Provide SamTrans Americans with Disabilities Act (ADA) paratransit services(includes operating support and purchase of new paratransit vehicles)
$ 491.8 $ 491.8 $ 0.0 1998 and 2004 Measure A sales tax project
98176 Construct auxiliary lanes on U.S. 101 from 3rd Avenue to Millbrae and reconstructU.S. 101/Peninsula interchange
$ 188.2 $ 188.2 $ 0.0
98204 Add travel lane (one in each direction) on Route 1 (Calera Parkway) betweenFassler Avenue and Westport Drive in Pacifica (includes traffic signalcoordination on Fassler Avenue and Reina Del Mar Avenue)
$ 44.4 $ 18.0 $ 26.4
230192 Improve SamTrans bus services (includes enhanced service levels, transitpriority measures, signal timing and dedicated bus lanes)
$ 2.5 $ 2.5 $ 0.0
230349 Improve local access to National Park Service (NPS) lands in San Mateo $ 151.1 $ 151.1 $ 0.0
230417 Modify U.S. 101/Holly Street interchange (includes widening eastbound tonorthbound loop to 2 lanes and eliminating northbound to westbound loop)
$ 3.2 $ 3.2 $ 0.0
230424 Modify Route 92/El Camino Real interchange $ 3.0 $ 3.0 $ 0.0
230428 Extend Blomquist Street over Redwood Creek to East Bayshore and Bair Island Road $ 5.2 $ 5.2 $ 0.0
230430 Implement San Mateo’s bicycle and pedestrian program $ 45.0 $ 45.0 $ 0.0 2004 Measure A sales tax project
230434 Implement local circulation improvements and the local streets trafficmanagement program
$ 20.0 $ 20.0 $ 0.0
230592 Improve streetscape and traffic calming along Bay Road, and construct newnorthern access connection between Demeter Street and University Avenue
$ 14.8 $ 14.8 $ 0.0
230697 Local streets and roads maintenance $ 3,089.0 $ 1,503.0 $ 729.0 Shortfall remains
230704 Make Route 92 operational improvements to Chess Drive on-ramps $ 2.5 $ 2.5 $ 0.0
Reference Total Committed DiscretionaryNumber Project/Program Project Cost Funds1 Funds2 Project Notes
San Mateo County(In millions of year-of-expenditure dollars)
1 Committed Funds have been reserved by law for specific uses, or allocated by MTC action prior to the development of the Transportation 2035 Plan.
2 Discretionary Funds are flexible funds available to MTC (and not already programmed in Committed Funds) for assignment to projects via the Transportation 2035 Plan planning process.
APPENDIX K
Checklist for Modeling Consistency

1
MTC Checklist for Modeling Consistency for CMPs
2011 Submittal
Prepared for City/County Association of Governments of San Mateo County
In cooperation with the Santa Clara Valley Transportation Authority
October 24, 2011
Introduction
The purpose of this document is to provide the checklist of deliverables requested by the Metropolitan
Transportation Commission (MTC) to establish that the City/County Association of Governments of San
Mateo County (C/CAG) travel demand models apply a regionally consistent model set for the
development of travel demand forecasts. The specific checklist of product deliverables was defined by
MTC in the 2011 County Congestion Management Plans: Updated MTC Guidance and Review Process
Resolution No. 3000, Revised, Attachment B. The required checklist products are provided in the
following sections.
Product 1
Description of the C/CAG Model
The current C/CAG model had its origin in the corridor model developed for the Grand Boulevard
Initiative (GBI) Multi-model Corridor Study by the Santa Clara VTA in 2009. The GBI study evaluated the
impacts of enhanced transit service (bus rapid transit) and enhanced developed strategies in the El
Camino Real corridor to transform an existing auto-oriented commercial transportation corridor into a
more transit-oriented, mixed-use transportation corridor. The GBI model was essentially the VTA
Countywide model with added zone and network detail to improve upon what was network and zone
detail based on the MTC regional models for San Mateo County. The basis for the network and zone
refinements applied within San Mateo County was the C/CAG Countywide models originally developed
in the mid-1990s.
For the updated C/CAG model development, the GBI model was revised to produce an updated base
year 2005 calibration and validation with selected model enhancements. These enhancements included
calibration of the auto ownership models to American Community Survey (ACS) 2005 county-level data,
addition of bicycle network infrastructure (bike lanes and paths) in the networks, travel time skims,
mode choice and bicycle assignments and development of a toll modeling procedure to estimate

2
express lane vehicle volumes. The model was validated to year 2005 screenline volumes for the AM and
PM peak periods and to year 2005 observed transit boardings.
Consistency with MTC Model
As noted previously, the C/CAG model was designed to be consistent with the previous MTC Travel
Demand Model forecasting system BAYCAST-90 model. This section provides a general overview of the
C/CAG models and also describes several basic modeling characteristics that are shared between the
models.
Transportation Analysis Zones (TAZ’s) — The current CMP model has a more refined zone system in San
Mateo County and Santa Clara County than the MTC regional models. Additional zones were added to
more accurately reflect and support the added roadway network and to provide more detail in transit
rich corridors and dense central business districts. In all, an additional 156 zones were added in San
Mateo County and an additional 1,122 zones were added in Santa Clara County. The new model
maintains the use of MTC’s zone system in the remaining seven Bay Area counties, but enlarges the full
model region and zones to include Santa Cruz, San Benito, Monterey, and San Joaquin Counties.
Highway Network and Transit Network — The roadway network used by the C/CAG model includes
additional detail in both San Mateo and Santa Clara Counties. The current CMP model also includes
detailed stop, station and route detail in the transit network for San Mateo and Santa Clara Counties,
and maintains the MTC roadway and transit networks in the remaining Bay Area counties. The
Association of Monterey Bay Area Governments (AMBAG) provided the basis for roadway networks in
Monterey, San Benito, and Santa Cruz counties and the San Joaquin County COG provided roadways for
San Joaquin County, however, the detailed networks was simplified to match the coarser zone structure
in each of those four added counties. Express lane facilities, representing the MTC ‘Backbone’ express
lanes system for 2035, were also coded in the network with a toll facility indicator based on the highway
corridor segment and the direction of travel. Differential toll facility codes were required in order to
apply specific toll rates to optimize utilization of the express lanes to preserve level-of-service for free
carpool users. The C/CAGmodel also includes a representation of the bicycle network infrastructure in
the base year and 2035 forecast year for San Mateo, Santa Clara, San Francisco and southern Alameda
Counties, explicitly representing existing and future bike lanes and bike paths in travel time
development, mode choice and bicycle assignments.
Capacities and Speed — The current C/CAG model incorporates the area type and assignment group
classification system published by MTC in BAYCAST-90. Input free-flow speeds for expressways are
slightly lower in the C/CAG models to more accurately match the travel time for the expressway
segments during model validation and improve the assignment match of estimated to observed
expressway volumes.

3
Trip Purposes — The current C/CAG model uses the same trip purposes used in the BAYCAST-90 model
and also uses additional trip purposes not modeled by MTC. C/CAG model trip purposes include the
following:
Home-based work trips
Home-based shop and other trips
Home-based social/recreation trips
Non-home-based trips
Home-based school: grade school, high school, and college trips
Light, medium and heavy duty internal to internal zone truck trips
The C/CAG model uses MTC BAYCAST-90 trip generation equations for trip production and trip
attraction functions for all trip purposes listed above. In order to address special markets not included in
the MTC trip purposes, the C/CAG model includes several additional trip purposes beyond those
modeled by MTC, including:
Air-passenger trips to San Francisco Intenational (SFO) Airport and San Jose/Mineta International Airport (SJC) and
Light, medium and heavy-duty external truck trips
Market Segments — The C/CAG model adopts the BAYCAST-90 disaggregate travel demand model four
income group market segments for the home-based work trip purpose in trip generation, distribution
and mode choice. In addition, the C/CAG model also maintains the three workers per household (0, 1
and 2+ workers) and three auto ownership markets (0, 1 and 2+ autos owned) used in the MTC
worker/auto ownership models. Trips by peak and off-peak time period are also stratified in the trip
distribution, mode choice and highway and transit assignment models.
External Trips — The C/CAG model uses a different approach for incorporating inter-regional
commuting estimates than MTC. For external zones coincident with the MTC model, MTC interregional
vehicle volumes were applied for base year 2000 and adjusted to the future by assuming a 1 percent
growth rate per year. For external gateways from San Joaquin County and Santa Cruz, Monterey and San
Benito Counties, the incorporation of those counties as internal modeled areas obviated the
development of external vehicle volumes for those areas of the C/CAG models.
Pricing — The C/CAG model uses MTC pricing assumptions for transit fares, bridge tolls, parking charges,
and auto operating costs as assumed in the current MTC Regional Transportation Plan (RTP) and
Sustainable Community Strategies (SCS) update. All prices are expressed in year 1990 dollar values in the
models. The C/CAG model also uses regional express lane toll charges for the AM and PM peak periods
that are based on optimizing the level-of-service in the carpool lanes. Depending on the level of
utilization, these toll charges would vary by direction, time of day and by specific corridor.

4
Auto Ownership — The current C/CAG model applies BAYCAST-90 for auto ownership models to
estimate the number of households with 0, 1, and 2+ autos by four income groups in each traffic
analysis zone. Walk to transit accessibility measures were incorporated in the auto ownership models
consistent with MTC BAYCAST-90 to more logically associate low auto ownership households with
transit services. The auto ownership models were recently calibrated to the 2005-2009 American
Community Survey to match workers per household and auto ownership by county.
Mode Choice — The mode choice models for BAYCAST-90 include the use of nested structures for most
trip purposes, however, explicit estimation of nested structures to consider transit submodes were not
included in the model specification.1 The C/CAG model adds a nesting structure for transit submodes of
local bus, express bus, Bus Rapid Transit (BRT), light rail, heavy rail and commuter rail underneath the
MTC BAYCAST-90 nested structures. Consistent with the BAYCAST-90, mode choice coefficients are
preserved by constraining the model to the BAYCAST-90 parameters, except those in transit submode
structure.2 The C/CAG model includes a transit submode nest for Bus Rapid Transit (BRT), which is an
emerging transit technology in the region. Submode constants for BRT were developed from a market
analysis and state preference survey that compared the relative tradeoffs between bus, light rail and
hypothetical BRT service. The resulting BRT constants were between the calibrated submode constants
applied to local bus service and light rail service, implying that BRT service is perceived as more
attractive than local bus service, but not as attractive as light rail service.
Peak Hour and Peak Periods for Highway Assignments —The highway assignments produce AM and PM
peak hour volumes, AM and PM peak period volumes (5 AM to 9 AM and 3 PM to 7 PM, respectively –
each coincident with the time periods of operation for carpool lanes), midday volumes (9 AM to 3 PM)
and evening volumes (7 PM to 5 AM). The four time period volumes are then added together to
develop daily vehicle volumes.
Vehicle and Transit Assignments — The current C/CAG model incorporates a methodology analogous to
the MTC “layered,” equilibrium assignment process, which distinguishes standard mixed-flow lanes from
high-occupancy-vehicle (HOV) lanes. The equilibrium assignment process used in the current CMP
model is functionally equivalent to the MTC methodology. The C/CAG model includes additional vehicle
classes in the highway assignments for park-and-ride vehicles and drive-alone and carpool toll vehicles.
Drive-alone and carpool toll vehicles for AM and PM peak periods are estimated using a toll model post-
processor that estimates toll volumes based on a comparison of the non-toll and toll travel times and
costs. This procedure assumes that toll choice occurs after the decision to choose auto versus transit
has already been considered, and therefore does not influence transit mode choice. A toll choice
constant for drive-alone and carpool modes was developed based on a calibration of toll volumes
estimated by application of the toll model to the I-680 Express Lane facility and comparison of estimated
to observed express lane volumes. It should be noted that by 2035, in order to maintain the operational
feasibility of implementing regional express toll lanes, it was assumed that only 3+ occupant carpools
1 A nested structure partitions the alternatives into groups (nests) of similarity. The groups can be further
generalized into subgroups (subnests) and so on, which has the form of an inversed tree.

5
would be allowed to travel in the carpool lanes for free. This was assumed for all carpool facilities in the
C/CAG model region.
In the current CMP model, transit passengers are assigned with a methodology analogous to that used
by MTC, with separate assignments for each transit submode and access mode. Assignments are also
performed separately for peak and off-peak conditions. A total of eighteen separate transit assignments
are run to cover the full combination of transit submode and access modes as well as to estimate transit
ridership for air-passengers and external home-based work transit trips from the San Joaquin (ACE,
BART and San Joaquin SMART bus) and AMBAG (Caltrain and Monterey Express) model regions.
Model Validation with 2005 Traffic and Transit Volumes — The current C/CAG model is validated to
year 2005 traffic volumes for county-level screenlines and specific major transportation facilities. Two
time periods are validated for county screenlines: AM peak period (5 AM to 9 AM) and PM peak period
(3 PM to 7 PM). Peak hour validation was performed for US 101 and SR 82 (El Camino Real) using traffic
counts provided by Caltrans. Daily transit boardings were validated for the year 2005 at the system level
for major regional transit operators (Caltrain, BART, MUNI, VTA and AC Transit) and at the route level for
SamTrans express and local routes.
Product 2
Description of Demographic Forecasts
The C/CAG model uses the Association of Bay Area Governments (ABAG) Projections 2009 data series
for the base year 2005 and the ABAG Current Regional Plans scenario as the basis for the 2035 long-
range forecasts for San Mateo County, as provided by MTC at the MTC 1454 zone level. The MTC zone
level allocations were sub-allocated to the smaller C/CAG zones (including finer zones for both San
Mateo and Santa Clara Counties) based on local development information and parcel level data. As
such, the C/CAG socioeconomic data inputs are consistent at both the MTC zone level and the ABAG
census tract level, however, slight differences do exist in San Mateo and Santa Clara Counties due to
rounding errors resulting from the allocation process. Key ABAG land use variables used in the San
Mateo C/CAG models do not differ by more than one percent at the county level for any of the 9 MTC
region counties. No differences exist at the census tract level outside of San Mateo and Santa Clara
Counties for any of the remaining MTC counties.

6
Product 3 ABAG County-Level Estimates for Population, Households, Jobs, and Employed Residents
Year 2005, Current Regional Plans (v 0.1) ABAG Projections 2009
County Population Households Jobs Employed Residents
San Francisco 795,792 338,923 553,073 388,097
San Mateo 721,890 260,066 337,344 318,599
Santa Clara 1,762,986 595,720 872,820 733,989
Alameda 1,505,308 543,776 730,264 705,906
Contra Costa 1,023,390 368,323 379,021 459,606
Solano 421,600 142,039 150,513 194,903
Napa 133,695 49,256 70,690 64,102
Sonoma 479,203 181,786 220,442 237,700
Marin 252,605 103,188 135,473 122,204
Bay Area 7,096,469 2,583,077 3,449,640 3,225,106
San Mateo C/CAG Trip-based Models
County Population Households Jobs Employed Residents
San Francisco 795,792 338,923 553,073 388,097
San Mateo 721,900 260,072 337,313 319,235
Santa Clara 1,762,957 595,716 872,248 733,965
Alameda 1,505,308 543,776 730,264 705,906
Contra Costa 1,023,390 368,323 379,021 459,606
Solano 421,600 142,039 150,514 194,903
Napa 133,695 49,256 70,690 64,102
Sonoma 479,203 181,786 220,442 237,700
Marin 252,605 103,188 135,473 122,204
Bay Area 7,096,450 2,583,079 3,449,038 3,225,718
Percent Difference
County Population Households Jobs Employed Residents
San Francisco 0.00% 0.00% 0.00% 0.00%
San Mateo 0.00% 0.00% -0.01% 0.20%
Santa Clara 0.00% 0.00% -0.07% 0.00%
Alameda 0.00% 0.00% 0.00% 0.00%
Contra Costa 0.00% 0.00% 0.00% 0.00%
Solano 0.00% 0.00% 0.00% 0.00%
Napa 0.00% 0.00% 0.00% 0.00%
Sonoma 0.00% 0.00% 0.00% 0.00%
Marin 0.00% 0.00% 0.00% 0.00%
Bay Area 0.00% 0.00% -0.02% 0.02%

7
Product 3, continued ABAG County-Level Estimates for Population, Households, Jobs, and Employed Residents
Year 2035, Current Regional Plans (v 0.1) MTC Tour-based Models
County Population Households Jobs Employed Residents
San Francisco 980,071 417,997 698,793 472,195
San Mateo 893,067 322,624 442,850 392,101
Santa Clara 2,433,531 827,254 1,212,948 1,054,001
Alameda 1,958,248 705,343 906,300 963,499
Contra Costa 1,323,390 480,474 469,462 603,803
Solano 504,331 171,284 173,057 220,100
Napa 148,517 54,642 86,961 71,000
Sonoma 572,443 212,784 262,078 258,396
Marin 269,179 110,673 147,872 102,999
Bay Area 9,082,777 3,303,075 4,400,321 4,138,094
San Mateo C/CAG Trip-based Models
County Population Households Jobs Employed Residents
San Francisco 980,071 417,997 698,793 472,195
San Mateo 893,066 322,620 442,858 392,097
Santa Clara 2,433,551 827,261 1,212,959 1,054,016
Alameda 1,958,248 705,343 906,300 963,499
Contra Costa 1,323,390 480,474 469,462 603,803
Solano 504,331 171,284 173,057 220,100
Napa 148,517 54,642 86,961 71,000
Sonoma 572,443 212,784 262,078 258,396
Marin 269,179 110,673 147,872 102,999
Bay Area 9,082,796 3,303,078 4,400,340 4,138,105
Percent Difference County Population Households Jobs Employed Residents
San Francisco 0.00% 0.00% 0.00% 0.00%
San Mateo 0.00% 0.00% 0.00% 0.00%
Santa Clara 0.00% 0.00% 0.00% 0.00%
Alameda 0.00% 0.00% 0.00% 0.00%
Contra Costa 0.00% 0.00% 0.00% 0.00%
Solano 0.00% 0.00% 0.00% 0.00%
Napa 0.00% 0.00% 0.00% 0.00%
Sonoma 0.00% 0.00% 0.00% 0.00%
Marin 0.00% 0.00% 0.00% 0.00%
Bay Area 0.00% 0.00% 0.00% 0.00%

8
Product 4
Identification of Differences between CMA and ABAG Census Tract Level
C/CAG socioeconomic data inputs are consistent at both the MTC zone level and the ABAG census tract
level for the Current Regional Plans scenario for the year 2035. The MTC zone level data was provided
by MTC subsequent to a meeting of the Regional Model Working Group 3. Data at the MTC zone level in
San Mateo and Santa Clara Counties was allocated to the smaller San Mateo C/CAG model zones using
local land use development patterns, however, MTC zone level, and by default ABAG census-tract level,
control totals were preserved in the allocation process.
3 Provided by email from MTC to the Regional Model Working Group members on March 25, 2011.

9
Product 5
Region-Level Auto Operating Cost, Key Transit Fares and Bridge Tolls
Year 2035, Current Regional Plans (v 0.1)
MTC Tour-based Models Pricing Assumption 2035 Value in 2000 dollars 2035 Value in 2010 dollars
Auto Operating Cost per Mile $0.222 $0.280
Bridge Tolls Toll schedule starting July 1, 2012 Toll schedule starting July 1, 2012
Transit Fares --- ---
Muni Local Bus $1.606 $2.000
AC Transit Local Bus $1.606 $2.000
VTA Local Bus $1.606 $2.000
SamTrans Local Bus $1.606 $2.000
San Mateo C/CAG Trip-based Models Pricing Assumption 2035 Value in 2000 dollars4 2035 Value in 2010 dollars5
Auto Operating Cost per Mile 6 $0.24 $0.30
Bridge Tolls Toll schedule starting July 1, 2010 Toll schedule starting July 1, 2010
Transit Fares --- ---
Muni Local Bus $1.55 $1.97
AC Transit Local Bus $1.55 $1.97
VTA Local Bus $1.55 $1.97
SamTrans Local Bus $1.55 $1.97
4 Source for Inflation Rates : http://www.bls.gov/data/inflation_calculator.htm
5 Source for Inflation Rates : http://www.bls.gov/data/inflation_calculator.htm
6 Source: Plan/Bay Area: Technical Summary of Predicted Traveler Responses to First Round Scenarios, Technical
Report, Metropolitan Transportation Commission, March 22, 2011, p.14.

10
Product 6 Highway Network and Transit Network — The roadway network used by the San Mateo C/CAG model
includes additional detail in both San Mateo and Santa Clara Counties. The current CMP model also
includes detailed stop, station and route detail in the transit network for San Mateo and Santa Clara
Counties, and maintains the MTC roadway and transit networks in the remaining Bay Area counties. The
Association of Monterey Bay Area Governments (AMBAG) provided the basis for roadway networks in
Monterey, San Benito, and Santa Cruz counties and the San Joaquin County COG provided roadways for
San Joaquin County, however, the detailed networks was simplified to match the coarser zone structure
in each of those four added counties. Express lane facilities, representing the MTC ‘Backbone’ express
lanes system for 2035, were also coded in the network with a toll facility indicator based on the highway
corridor segment and the direction of travel. Differential toll facility codes were required in order to
apply specific toll rates to optimize utilization of the express lanes to preserve level-of-service for free
carpool users.
For model consistency reporting purposes, the San Mateo C/CAG models assume committed project as
defined in the MTC 2035 Regional Transportation Plan in San Mateo County and all other counties, with
the exception that HOV lanes are assumed on US 101 from Whipple Road north the San Mateo/San
Francisco County line by conversion of the auxiliary lanes. The 2035 forecasts produced by the San
Mateo C/CAG models also assumes that only 3+ person carpools are allowed to travel in the carpool
lanes without a charge for the entire model region. The C/CAG model includes a representation of the
bicycle network infrastructure in the base year and 2035 forecast year for San Mateo, Santa Clara, San
Francisco and southern Alameda Counties, explicitly representing existing and future bike lanes and bike
paths in travel time development, mode choice and bicycle assignments.

11
Product 7 Households by Number of Automobiles, by County
Year 2035, Current Regional Plans (v 0.1)
MTC Tour-based Models
County Zero One Two + Total Zero One Two + Total
San Francisco 132,684 192,192 116,364 441,240 30.1% 43.6% 26.4% 100.0%
San Mateo 18,812 116,608 198,216 333,636 5.6% 35.0% 59.4% 100.0%
Santa Clara 62,264 268,396 528,788 859,448 7.2% 31.2% 61.5% 100.0%
Alameda 86,828 235,696 415,844 738,368 11.8% 31.9% 56.3% 100.0%
Contra Costa 19,860 153,448 317,904 491,212 4.0% 31.2% 64.7% 100.0%
Solano 10,868 50,216 121,300 182,384 6.0% 27.5% 66.5% 100.0%
Napa 4,044 19,240 37,200 60,484 6.7% 31.8% 61.5% 100.0%
Sonoma 14,996 68,860 146,316 230,172 6.5% 29.9% 63.6% 100.0%
Marin 6,992 43,332 72,116 122,440 5.7% 35.4% 58.9% 100.0%
ALL 357,348 1,147,988 1,954,048 3,459,384 10.3% 33.2% 56.5% 100.0%
San Mateo C/CAG Trip-based Models County Zero One Two + Total Zero One Two + Total
San Francisco 130,076 170,563 117,323 417,962 31.1% 40.8% 28.1% 100.0%
San Mateo 25,297 113,422 183,777 322,496 7.8% 35.2% 57.0% 100.0%
Santa Clara 73,775 250,650 501,913 826,338 8.9% 30.3% 60.7% 100.0%
Alameda 116,722 257,910 330,664 705,296 16.5% 36.6% 46.9% 100.0%
Contra Costa 33,991 159,328 287,157 480,476 7.1% 33.2% 59.8% 100.0%
Solano 8,270 49,035 113,991 171,296 4.8% 28.6% 66.5% 100.0%
Napa 2,771 17,703 34,167 54,641 5.1% 32.4% 62.5% 100.0%
Sonoma 13,600 75,388 123,801 212,789 6.4% 35.4% 58.2% 100.0%
Marin 5,004 41,293 64,354 110,651 4.5% 37.3% 58.2% 100.0%
ALL 409,506 1,135,292 1,757,147 3,301,945 12.4% 34.4% 53.2% 100.0%

12
Product 8 Number of Trips by Tour Purpose
Year 2035, Current Regional Plans (v 0.1)
MTC Tour-based Models Purpose Tour-based Share
Work 9,095,396 30.2%
University 674,228 2.2%
School 3,182,584 10.6%
At-Work 2,146,148 7.1%
Eat Out 1,269,852 4.2%
Escort 2,878,708 9.6%
Shopping 4,323,304 14.3%
Social 921,024 3.1%
Other 5,650,824 18.7%
ALL 30,142,068 100.0%
San Mateo C/CAG Trip-based Models Purpose Trip-based Share
Home-based Work 6,257,144 23.3%
Home-based Shopping/Other 7,481,587 27.9%
Home-based Social-Recreational 3,211,923 12.0%
Non-home-based 7,417,766 27.7%
Home-based College 576,940 2.2%
Home-based High School 558,042 2.1%
Home-based Elementary School 1,316,026 4.9%
ALL 26,819,428 100.0%

13
Product 9 Average Trip Distance by Tour Purpose
Year 2035, Current Regional Plans (v 0.1)
MTC Tour-based Models
Tour Purpose Average Trip Distance,
Miles
Work 10.40
University 6.84
School 3.96
At-Work 3.35
Eat Out 5.42
Escort 4.34
Shopping 4.20
Social 4.87
Other 5.00
All 6.25
San Mateo C/CAG Trip-based Models
Trip Purpose Average Trip Distance,
Miles
Home-based Work 12.80
Home-based Shopping/Other 6.91
Home-based Social-Recreational 7.45
Non-home-based 6.75
Home-based College 10.52
Home-based High School 4.85
Home-based Elementary School 4.06
ALL 8.20

14
Product 10 Journey to Work, County-to-County Usual Workplace
Year 2035, Current Regional Plans (v 0.1)
MTC Tour-based Models
Origin County San
Francisco San
Mateo Santa Clara
Alameda Contra
Costa Solano Napa Sonoma Marin All
San Francisco 358,844 55,696 5,884 31,312 7,080 708 312 1,112 12,428 473,376
San Mateo 82,972 206,644 63,104 29,564 4,416 324 156 516 5,152 392,848
Santa Clara 12,508 57,712 915,460 71,272 4,960 196 80 72 780 1,063,040
Alameda 119,536 70,684 130,732 558,332 68,668 3,272 1,240 1,068 12,576 966,108
Contra Costa 64,288 16,448 17,164 139,560 315,164 18,848 5,512 2,596 19,012 598,592
Solano 11,408 2,212 1,108 15,512 31,900 126,024 17,728 5,572 8,060 219,524
Napa 2,020 484 176 2,556 4,408 7,428 44,116 7,844 3,104 72,136
Sonoma 4,948 1,204 212 1,844 1,988 2,196 8,172 215,416 20,828 256,808
Marin 20,756 3,992 512 6,240 4,676 1,052 872 6,544 58,796 103,440
Bay Area 677,280 415,076 1,134,352 856,192 443,260 160,048 78,188 240,740 140,736 4,145,872
San Mateo C/CAG Trip-based Models
Origin County San
Francisco San
Mateo Santa Clara
Alameda Contra
Costa Solano Napa Sonoma Marin All
San Francisco 352,045 48,851 17,360 22,807 6,088 716 578 2,434 11,508 462,387
San Mateo 86,314 229,097 52,114 21,146 2,910 721 194 1,824 2,254 396,574
Santa Clara 18,879 61,803 934,384 58,247 6,404 2,571 580 4,993 2,925 1,090,785
Alameda 124,842 60,321 93,259 605,272 60,016 6,869 1,618 6,525 14,239 972,960
Contra Costa 63,679 9,479 14,024 110,362 354,358 16,113 4,175 3,790 20,254 596,234
Solano 10,779 2,117 1,626 11,086 24,916 134,855 13,836 5,871 7,383 212,470
Napa 1,202 333 249 929 1,827 5,091 55,957 4,167 1,279 71,035
Sonoma 5,443 738 745 1,210 1,368 1,676 2,897 220,959 20,267 255,302
Marin 20,699 1,661 552 2,765 2,208 587 389 4,570 68,789 102,220
Bay Area 683,882 414,400 1,114,313 833,823 460,095 169,199 80,225 255,133 148,897 4,159,967

15
Product 11 Region-Level Mode Share by Tour Purpose
Year 2035, Current Regional Plans (v 0.1)
MTC Tour-based Models
Tour Purpose Automobile Walk Bicycle Transit All Modes
Work 81.8% 5.3% 1.5% 11.3% 100.0%
University 63.7% 13.8% 1.3% 21.2% 100.0%
School 69.6% 20.7% 1.6% 8.1% 100.0%
At-Work 69.4% 29.3% 0.7% 0.6% 100.0%
Eat Out 81.1% 15.4% 1.3% 2.3% 100.0%
Escort 93.8% 5.7% 0.3% 0.2% 100.0%
Shopping 87.0% 10.0% 1.1% 2.0% 100.0%
Social 78.7% 15.8% 1.7% 3.8% 100.0%
Other 85.6% 10.2% 1.5% 2.7% 100.0%
All Purposes 81.7% 11.2% 1.3% 5.8% 100.0%
San Mateo C/CAG Trip-based Models Trip Purpose Automobile Walk Bicycle Transit All Modes
Home-based Work 83.5% 3.4% 1.3% 11.8% 100.0%
Home-based Shopping/Other 84.1% 9.9% 0.7% 5.3% 100.0%
Home-based Social-Recreational 81.2% 10.7% 3.6% 4.5% 100.0%
Non-home-based 82.5% 12.9% 0.9% 3.7% 100.0%
Home-based College 66.6% 9.3% 5.3% 18.8% 100.0%
Home-based High School 55.5% 21.4% 4.4% 18.7% 100.0%
Home-based Grade School 52.9% 31.2% 6.3% 9.6% 100.0%
All Purposes 80.7% 12.5% 1.7% 5.1% 100.0%

16
Product 12 Region-Level VMT and VHT by Facility Type and Time Period
Year 2035, Current Regional Plans (v 0.1)
MTC Tour-based Models
VMT
Facility Type
Time Period Freeways Expressways Major Arterials Collectors Other All Facilities
Early AM (3 a.m. - 6 a.m.) 5,504,092 544,464 1,158,156 381,730 354,247 7,942,689
AM Peak (6 a.m. - 10 a.m.) 26,675,579 2,918,973 9,919,154 3,048,868 3,437,135 45,999,709
Midday (10 a.m. - 3 p.m.) 26,067,097 3,063,934 10,925,935 3,047,571 4,407,032 47,511,570
PM Peak (3 p.m. - 7 p.m.) 28,630,722 3,380,237 12,261,677 3,558,105 4,461,626 52,292,367
Evening (7 p.m. - 3 a.m.) 17,572,988 1,820,157 5,900,622 1,744,592 2,237,126 29,275,485
Daily 104,450,478 11,727,765 40,165,545 11,780,866 14,897,167 183,021,820
VHT
Facility Type
Time Period Freeways Expressways Major Arterials Collectors Other All Facilities
Early AM (3 a.m. - 6 a.m.) 90,089 11,137 34,596 13,125 22,837 171,784
AM Peak (6 a.m. - 10 a.m.) 565,113 69,017 331,877 119,925 208,660 1,294,591
Midday (10 a.m. - 3 p.m.) 461,465 65,853 357,347 118,317 254,178 1,257,160
PM Peak (3 p.m. - 7 p.m.) 600,243 80,725 419,721 147,321 256,638 1,504,646
Evening (7 p.m. - 3 a.m.) 294,320 37,677 183,263 61,581 129,425 706,267
Daily 2,011,229 264,408 1,326,803 460,269 871,738 4,934,448
San Mateo C/CAG Trip-based
Models
VMT
Facility Type
Time Period Freeways Expressways Major Arterials Collectors Other All Facilities
AM Peak (5 a.m. - 9 a.m.) 23,254,078 2,296,635 7,889,177 1,803,260 4,748,694 39,991,844
Midday (9 a.m. - 3 p.m.) 33,882,129 2,808,072 9,945,821 2,488,415 7,186,680 56,311,117
PM Peak (3 p.m. - 7 p.m.) 28,035,161 3,460,308 12,253,081 3,003,551 6,555,756 53,307,857
Evening (7 p.m. - 5 a.m.) 21,284,834 1,507,476 4,050,705 1,024,120 1,024,120 28,891,255
Daily 106,456,202 10,072,491 34,138,784 8,319,346 19,515,250 178,502,073
VHT
Facility Type
Time Period Freeways Expressways Major Arterials Collectors Other All Facilities
AM Peak (5 a.m. - 9 a.m.) 557,271 77,891 294,386 100,785 195,611 1,225,944
Midday (9 a.m. - 3 p.m.) 655,232 86,735 369,138 141,306 292,117 1,544,528
PM Peak (3 p.m. - 7 p.m.) 812,268 127,094 524,676 199,404 284,232 1,947,674
Evening (7 p.m. - 5 a.m.) 345,015 41,581 139,328 44,753 129,816 700,493
Daily 2,369,786 333,301 1,327,528 486,248 901,776 5,418,639

17
Product 13 Region-Level Average Speed (VMT/VHT) by Facility Type and Time Period
Year 2035, Current Regional Plans (v 0.1)
MTC Tour-based Models Facility Type
Time Period Freeways All Other Facilities All Facilities
Early AM (3 a.m. - 6 a.m.) 61.1 29.9 46.2
AM Peak (6 a.m. - 10 a.m.) 47.2 26.5 35.5
Midday (10 a.m. - 3 p.m.) 56.5 27.0 37.8
PM Peak (3 p.m. - 7 p.m.) 47.7 26.2 34.8
Evening (7 p.m. - 3 a.m.) 59.7 28.4 41.5
Daily 51.9 26.9 37.1
San Mateo C/CAG Trip-based Models Facility Type
Time Period Freeways All Other Facilities All Facilities
AM Peak (5 a.m. - 9 a.m.) 41.7 25.0 32.6
Midday (9 a.m. - 3 p.m.) 51.7 25.2 36.5
PM Peak (3 p.m. - 7 p.m.) 34.5 22.3 27.4
Evening (7 p.m. - 5 a.m.) 61.7 21.4 41.2
Daily 44.9 23.6 32.9

APPENDIX L
Traffic Impact Analysis (TIA) Policy

August 10, 2006
F:\USERS\CCAG\WPDATA\CMP-Traffic Imact Analysis Policy\Adopted TIA Policy.doc
C/CAG
CITY/COUNTY ASSOCIATION OF GOVERNMENTS OF SAN MATEO COUNTY
Atherton Belmont Brisbane Burlingame Colma Daly City East Palo Alto Foster City Half Moon Bay Hillsborough Menlo Park
Millbrae Pacifica Portola Valley Redwood City San Bruno San Carlos San Mateo San Mateo County South San Francisco Woodside
Policy on Traffic Impact Analysis (TIA) To Determine Traffic Impacts on the Congestion Management Program (CMP) Roadway Network Resulting From Roadway Changes, General Plan
Updates, and Land Use Development Projects

Section I INTRODUCTION
As the Congestion Management Agency for San Mateo County, C/CAG is responsible for maintaining the performance and standards of the Congestion Management Program (CMP) roadway network. The CMP roadway network is of countywide significance, and their performance must be preserved. Traffic Impact Analysis (TIA) is the term used in the study of the expected effects of projects and land use decisions on transportation facilities. The study’s purpose is to determine whether the transportation system can accommodate the traffic generated by the projects or land use decisions. And to help decision makers to make improvements needed to the roadways, bike routes, sidewalks, and transit services affected by the project. This helps decision makers determine whether to approve the project and what conditions to impose on the project. This document includes the following sections:
• Section I: Introduction • Section II: Definition & Purpose • Section III: Policy
1. Roadway Modification Projects 2. General Plan and Specific Plans 3. Land Use Development Projects
• Section IV: Scope and Parameters of Traffic Impact Analysis • Section V: Definition of CMP Impact
Page 1 of 14 August 10, 2006
F:\USERS\CCAG\WPDATA\CMP-Traffic Imact Analysis Policy\Adopted TIA Policy.doc

Section II DEFINITION & PURPOSE
Definition This document states policy and establishes procedures to determine cumulative capacity impacts on the CMP roadway network (impacts on the quality of traffic services) from the following three types of projects: 1. Roadway modification projects:
a. Projects that change the traffic capacity of CMP roadway. b. Projects near the CMP roadway and impact the CMP roadway network.
2. General Plan and Specific Plans. a. New General Plan or General Plan updates which include land use changes that would
cause an impact on the CMP roadway network. b. Specific Plans, Specific Area Plans, Precise Plans, which include land use changes that
would cause an impact on the CMP roadway network. 3. Land use development project. Purpose The purpose of this policy is to ensure uniform procedures for performing Traffic Impact Analysis to evaluate impacts on the CMP roadway resulting from land use and project decisions in San Mateo County. The intent of this policy is to preserve acceptable performance on the CMP roadway network, and to establish community standards for consistent system-wide transportation review. Preservation of CMP roadway and intersection performance will require an evaluation of the near and long term impacts of General Plan updates, land use development proposals, as well as proposed roadway modifications that will either reduce the capacity of the CMP network, or cause additional traffic on the CMP network. It is not intended that the Traffic Impact Analysis guided by this document will provide all information required for California Environmental Quality Act (CEQA) purposes. Traffic impact analysis to determine traffic impacts on the CMP network may be conducted as part of the CEQA process. This policy will be reviewed and integrated into the 2007 Congestion Management Program for San Mateo County. It will be reviewed subsequently in two years.
Page 2 of 14 August 10, 2006
F:\USERS\CCAG\WPDATA\CMP-Traffic Imact Analysis Policy\Adopted TIA Policy.doc

Section III POLICY
This policy provides an avenue to assess the cumulative traffic impacts on the Congestion Management (CMP) roadway network, of General Plan decisions made by local jurisdictions. It provides direction to local jurisdictions on how to analyze CMP traffic impacts resulting from roadway changes or land use decisions, determine feasible and appropriate mitigations. Land use development proposals and proposed roadway modifications must be consistent with the jurisdiction’s adopted General Plan, unless the proposal is to be amended into the General Plan before final approval by the jurisdiction. Local jurisdictions must evaluate traffic impacts of proposed revisions to their jurisdiction-wide General Plans and Specific Area Plans on the CMP network. 1. Roadway Modification Projects Project sponsor, in consultation with C/CAG staff, shall determine if a roadway modification project on or near a CMP roadway will have potential near-term and long-term traffic impacts on the CMP roadway network. Section 4, Scope and Parameters of Traffic Impact Analysis, and more specifically the definition of impacts in Section 5, Definition of CMP Impacts should be used in developing initial thresholds (e.g. change in intersection or lane volumes) to determine significant traffic impacts on a CMP roadway. If initial assessment indicates that significant traffic impact on the CMP network may result from the proposed project, its sponsor must conduct traffic impact analysis consistent with this policy to determine traffic impacts on the CMP roadway system. Moreover, a travel demand forecasting model must be used to determine long-term traffic impacts if the project is to modify the CMP roadway. See “Travel Demand Forecasting” requirements below. For near term analysis, if the travel demand forecasting model does not provide the level of detail desired, then the use of manual assignment models, micro-simulation models or other tools to provide a more detailed and informative analysis of a roadway project is acceptable.
Mitigation:
Proposed roadway changes to the CMP roadway that are determined to have a CMP traffic impacts for current or future years cannot be considered in conformity with the Congestion Management Program unless mitigated to no CMP impact. This mandatory mitigation requirement applies only to roadway projects on the CMP network. More latitude is provided for mitigating impacts to the CMP network that result from local land use decisions as described in sections 2 and 3 of this policy. CMP traffic impacts could be mitigated through modifications of the proposed project. The level of service analysis or simulation can often be used to identify elements of the project that, if modified, will reduce the project impacts.
Page 3 of 14 August 10, 2006
F:\USERS\CCAG\WPDATA\CMP-Traffic Imact Analysis Policy\Adopted TIA Policy.doc

Page 4 of 14 August 10, 2006
F:\USERS\CCAG\WPDATA\CMP-Traffic Imact Analysis Policy\Adopted TIA Policy.doc
Mitigation measures may also include roadway improvements, operational changes, or a provision for alternate routes. For example, adding a turn lane at the intersection, modifying or eliminating on street parking may improve travel times. All mitigation measures shall first be discussed with and reviewed by C/CAG staff. This policy does not prohibit a local jurisdiction from mitigating impacts on local streets that result from congestion on a CMP roadway.
2. General Plan and Specific Plans Project sponsor, in consultation with C/CAG staff, shall determine if a General Plan change or a Specific Plan will have potential traffic impacts on the Congestion Management Program (CMP) roadway network. Jurisdictions must conduct travel demand forecasting and traffic impact analysis to determine long term cumulative traffic impacts on the CMP roadway system. See “Travel Demand Forecasting” requirements below. For scope and parameters of traffic impact analysis, see Section 4. For definition of traffic impacts on the CMP system, see Section 5. If a jurisdiction makes small and incremental amendments to its General Plan to include land use changes, and that each individual land use change would not have CMP traffic impact, then flexibility is provided that the travel demand forecasting model needs to be run every two years to account for the cumulative list of projects and site specific General Plan changes.
Mitigation: General Plan updates or Specific Plans that are determined to have CMP traffic impacts must consult C/CAG staff to identify feasible mitigations.
Cumulative development traffic impacts identified in the evaluation of a jurisdiction may be mitigated in a variety of ways. Clearly, revising the allowable land use intensities is the most direct way to mitigate traffic impacts to the CMP network. However, it is recognized that this may not be consistent with the jurisdiction’s economic development plans. As alternatives, the jurisdiction may adopt a trip reduction policy that requires new development to make measurable reductions in their trip generation. These trip reduction requirements should be incorporated in the standard Conditions of Approval. The local jurisdiction should also implement a plan to monitor or sample actual trip generation to ensure that the trip reduction conditions are being met following project occupancy. Alternatively, jurisdictions may elect to provide capital improvements to reduce the traffic impact of cumulative development. To be viable, this type of mitigation must include a reliable funding mechanism such as a traffic mitigation fee program that includes, at a minimum, partial funding for the impacted CMP roadways. Where the impact is on the freeway system it will usually not be feasible to fully fund a needed improvement through a local fee. However, the fee program should provide a minimum of funding that would meet likely local share requirements, if approved by the jurisdiction.

Page 5 of 14 August 10, 2006
F:\USERS\CCAG\WPDATA\CMP-Traffic Imact Analysis Policy\Adopted TIA Policy.doc
All mitigation measures shall first be discussed with and reviewed by C/CAG staff before they are included in the report.
3. Land Use Development Projects Project sponsor shall comply with the “Land Use Impact Analysis Program” guidelines in the latest Congestion Management Program (CMP) for San Mateo County. Project sponsors shall consult C/CAG staff regarding land use development projects that are determined to have traffic impacts on the CMP roadway network.
Mitigations: Adopted General Plan trip reduction requirements should ultimately be implemented at the project level through Conditions of Approval. As with the General Plan mitigations, the trip reduction program should include a plan for monitoring trip generation and procedures to determine if established targets are met or exceeded. The option to reduce the intensity of a project to eliminate significant impacts to the CMP network should also be considered. If physical mitigation is desired, the jurisdiction should determine whether the project can and should be required to construct the mitigation project or whether funding the project’s pro rata share is appropriate, and paid to the jurisdiction.
Travel Demand Forecasting Requirements It is the intent of this policy that the cumulative traffic impacts to the CMP roadway system be evaluated consistently throughout the County. Toward this end, the C/CAG Countywide Travel Demand Forecasting Model must be used to forecast traffic demand for the analysis of the long-term cumulative traffic impacts of CMP roadway modification projects, General Plan updates, and Specific Area Plans. Long Term Cumulative Analysis The long-term cumulative analysis must be based on C/CAG or C/CAG derivative model forecasts. C/CAG will periodically update the model to provide travel demand forecasts under a 15 to 20 year planning horizon. This does not, necessarily require individual cumulative model runs for each land use development project. For example, a project that is consistent with the City’s existing General Plan may not require a new model run. Previous General Plan consistent model results can be used. The alternative methods used for near term analysis or individual development projects as described in the next section may be used to modify the existing model results to illustrate conditions with and without the proposed project. If alternative methods are used to modify cumulative model forecasts, comparison must be made with long-range C/CAG model forecasts to ensure consistency. This type of minor adjustments to the C/CAG model results is permitted for individual land use development projects or minor changes to an existing General Plan. However new C/CAG model runs are required at least every two years1, for
1 The biennial update of the C/CAG model runs can be postponed until they are needed for the analysis of a

Page 6 of 14 August 10, 2006
F:\USERS\CCAG\WPDATA\CMP-Traffic Imact Analysis Policy\Adopted TIA Policy.doc
Specific Plans and for major General Plan updates. Updating the C/CAG model runs is necessary to ensure that the cumulative impacts both within each jurisdiction as well as from neighboring jurisdictions are represented in the model results. A C/CAG derivative model that is consistent with the C/CAG model may also be used; however, it must be reviewed and approved by C/CAG staff in advance. Derivative models must be updated periodically to maintain a 15 to 20 year planning horizon. Approval of a C/CAG derivative model includes the demonstration to C/CAG staff that the model yields similar output as the C/CAG model given the same input assumptions. In addition, the land use assumptions and transportation network assumptions incorporated in a C/CAG derivative model must be consistent with the most recent C/CAG model in order to be eligible for consideration. The C/CAG Countywide Travel Demand Forecasting Model runs must be reviewed by C/CAG. C/CAG may hire its travel demand model consultant to conduct the review, and costs incurred will be borne by the project sponsor. Near Term Analysis The use of C/CAG Countywide Travel Forecasting Model or a C/CAG derivative model is not mandatory for near term analysis of projects. The use of methodologies that are widely accepted by the traffic engineering profession such as applying established growth factors to existing traffic volumes, manual assignment models (e.g. TRAFFIX) are also allowable for these analysis scenarios. However, alternative methods for near term impact or individual development project analysis do not replace the requirement for a long-term cumulative impact analysis consistent with this Traffic Impact Analysis Policy. C/CAG Review for Conformance For roadway modification projects, C/CAG staff shall review for consistency with this Traffic Impact Analysis (TIA) policy and determine conformity with the Congestion Management Program (CMP). For General Plan updates, Specific Plans, and land use development projects, C/CAG staff shall review TIA reports for consistency with this TIA policy. This review shall not constitute approval or disapproval of the project that is the subject of the report. C/CAG does not have the authority to approve or reject projects. That decision rests with the lead agency. However, the CMP establishes community standards and guidelines for consistent system-wide transportation review and provides comments to the lead agency on the TIA report based on staff review. Compliance with the Congestion Management Program may be enforced through the withholding of apportionments under Section 2105 of the Streets & Highways Code as well as declaring a local agency ineligible for future transportation funds.
development, planning or CMP roadway project. Therefore, in communities with limited development activity, the two-year-old model runs need only be updated when there is a land use or roadway project to be analyzed.

Section IV
SCOPE AND PARAMETERS FOR TRAFFIC IMPACT ANALYSIS (TIA)
Project sponsors must initiate consultation between the lead agency, C/CAG, Caltrans (if applicable), and those preparing the Traffic Impact Analysis (TIA) before commencing work on the study to establish the appropriate traffic impact analysis scope. At a minimum, the TIA should include the following:
A. Boundaries of the TIA The boundaries of a TIA must not only include the immediate project area but also areas outside of the project area that may be impacted by the project. For example, the boundaries of an arterial segment, for analysis purposes, may be defined as at least one signalized intersection beyond the project limits on either end. If modification to a segment between intersections will affect the up-stream or down-stream intersection, then average travel time or average travel speed for a segment covering the up- and down-stream intersections must be analyzed. Boundaries of a TIA must be agreed upon by the lead agency and C/CAG before commencing work on the analysis. Consultation with Caltrans is recommended, if applicable. However, if the project proposes to change a State owned facility, then the boundaries of analysis must be agreed upon by Caltrans as well. B. Traffic Analysis Scenarios Consultation between the lead agency, C/CAG, Caltrans (if applicable), and those preparing the TIA is recommended to determine the appropriate scenarios for the analysis. The following scenarios should be addressed as a minimum:
• Existing background condition (includes already approved developments and roadway network changes)
• Existing condition plus Project • Future (152 to 20 year horizon) background without Project (no-build) • Future (20 year horizon) background condition plus project
C. Analysis Period Consultation between the lead agency, C/CAG, Caltrans (if applicable), and those preparing the TIA is recommended to determine the appropriate analysis periods. The TIA shall include, at a minimum, an analysis of transportation conditions in the AM and PM peak hours.
Page 7 of 14 August 10, 2006
F:\USERS\CCAG\WPDATA\CMP-Traffic Imact Analysis Policy\Adopted TIA Policy.doc
2 20-year Model forecasts are assumed to be updated every 5 years so forecast horizon may be as short as 15 years.

Page 8 of 14 August 10, 2006
F:\USERS\CCAG\WPDATA\CMP-Traffic Imact Analysis Policy\Adopted TIA Policy.doc
D. Facilities To Be Included In the Analysis
1. A CMP intersection shall be included in a TIA if it is expected to be impacted by the proposed project.
2. A non-CMP intersection that is along a CMP segment shall be included in a TIA if it is expected to be impacted by the proposed project.
3. A freeway segment shall be included in a TIA if it is expected to be impacted by the proposed project.
4. A CMP arterial segment shall be included in a TIA if it is expected to be impacted by the proposed project.
E. Report Format Traffic Impact Analysis reports must present findings for the various analysis scenarios and analysis periods as described above in the following units of measurement: Intersections: LOS and delay time Freeway segments: LOS and volume-to-capacity ratio Arterial segments: LOS and average travel speed

Section V DEFINITION OF CMP IMPACT
A project is considered to have a CMP impact if it causes one or more of the following: 1. CMP Intersection currently in compliance with the adopted LOS standard:
A. A project will be considered to have a CMP impact if the project will cause the CMP intersection to operate at a level of service that violates the standard adopted in the current Congestion Management Program (CMP).
B. A project will be considered to have a CMP impact if the cumulative analysis
indicates that the combination of the proposed project and future cumulative traffic demand will result in the CMP intersection to operate at a level of service that violates the standard adopted in the current Congestion Management Program (CMP) and the proposed project increases average control delay at the intersection by four (4) seconds or more.
2. CMP Intersection currently not in compliance with the adopted LOS standard:
A project is considered to have a CMP impact if the project will add any additional traffic to the CMP intersection that is currently not in compliance with its adopted level of service standard as established in the CMP.
3. Freeway segments 3 currently in compliance with the adopted LOS standard:
A. A project is considered to have a CMP impact if the project will cause the freeway segment to operate at a level of service that violates the standard adopted in the current Congestion Management Program (CMP).
B. A project will be considered to have a CMP impact if the cumulative analysis
indicates that the combination of the proposed project and future cumulative traffic demand will result in the freeway segment to operate at a level of service that violates the standard adopted in the current Congestion Management Program (CMP) and the proposed project increases traffic demand on the freeway segment by an amount equal to one (1) percent or more of the segment capacity, or causes the freeway segment volume-to-capacity (v/c) ratio to increase by one (1) percent.
4 Freeway segments currently not in compliance with the adopted LOS standard:
A project is considered to have a CMP impact if the project will add traffic demand equal to one (1) percent or more of the segment capacity or causes the freeway segment volume-to-capacity (v/c) ratio to increase by one (1) percent, if the freeway segment is
Page 9 of 14 August 10, 2006
F:\USERS\CCAG\WPDATA\CMP-Traffic Imact Analysis Policy\Adopted TIA Policy.doc
3 Freeway segments are as defined in the Congestion Management Program Monitoring Program and are directional.

Page 10 of 14 August 10, 2006
F:\USERS\CCAG\WPDATA\CMP-Traffic Imact Analysis Policy\Adopted TIA Policy.doc
currently not in compliance with the adopted LOS standard.
5 CMP Arterial Segments:
The analysis of arterial segments is only required when a jurisdiction proposes to reduce the capacity of a CMP designated arterial through reduction in the number of lanes, adding or modifying on-street parking, or other actions that will affect arterial segment performance. A project is considered to have a CMP impact if it causes mid-block queuing, parking maneuver resulting in delays or other impacts that result in any segment intersection to operate at a level of service that violates the adopted LOS standard set for the nearest CMP intersection. Analysis of the segment using a calibrated micro-simulation model may be required by C/CAG staff to evaluate non-intersection impacts of the proposed project. CMP impact is determined if, based on the micro-simulation model, the average travel speed for the arterial segment is reduced by 4 miles per hour (mph) or more. Segments with average speeds that indicate LOS E or worse (based on Exhibit 15-2, HCM2000) cannot be modified by local jurisdictions if the proposed modifications would further reduce travel speeds on the segment.

To determine CMP impact on a CMP Intersection
Page 11 of 14 August 10, 2006
F:\USERS\CCAG\WPDATA\CMP-Traffic Imact Analysis Policy\Adopted TIA Policy.doc
Yes
No No Yes Yes No Yes No Yes No
Is the Intersection currently in compliance with the adopted CMP standard?
Will the project cause the intersection to violate the adopted CMP standard?
Will project add any additional traffic to the intersection?
Will the combination of project and future cumulative traffic demand cause the intersection to violate the adopted CMstandard?
P
CMP Impact
No CMP Impact
Will project increase average control delay at the intersection by 4 seconds or more?

To determine CMP impact on a Freeway Segment
Page 12 of 14 August 10, 2006
F:\USERS\CCAG\WPDATA\CMP-Traffic Imact Analysis Policy\Adopted TIA Policy.doc
No Yes No No Yes Yes Yes Yes No No
Is the freeway segment currently in compliance with the adopted CMstandard?
P
Will the project cause the freeway segment to violate the adopted CMP standard?
Will project increase the volume to capacity (v/c) ratio on the freeway segment by 1% or more?
Will the combination of project and future cumulative traffic demand cause the freeway segment to violate the adopted CMP standard?
CMP Impact
No CMP Impact
will project increase the volume to capacity (v/c) ratio on the freeway segment by 1% or more?

To determine CMP impact on Arterial Segment
Page 13 of 14 August 10, 2006
F:\USERS\CCAG\WPDATA\CMP-Traffic Imact Analysis Policy\Adopted TIA Policy.doc
No Yes Yes Yes No Yes No Yes No
No CMP Impact
Will the project reduce the average travel speed for the CMP arterial segment by 4 MPH or more?
Will the combination of project and future cumulative traffic demand cause any segment intersection to violate the adopted CMP standard set for the nearest CMP intersection?
CMP Impact
Does the average speed for the CMP arterial segment indicate LOS E or worse based on cumulative traffic demand?
No arterial analysis is needed.
Will project reduce the capacity of a CMP Segment (i.e., by reduction in number of lanes, modify on-street parking, etc.)?


APPENDIX M
Measure M Implementation Plan

1
Measure M Implementation Plan $10 Vehicle Registration Fee
March 2011
PURPOSE OF THE IMPLEMENTATION PLAN
The Measure M Implementation Plan describes the various programs identified in the Expenditure Plan in more detail and established percentages of funds allocated to each of the Countywide Transportation Programs. The Implementation Plan also identifies specific projects and programs under each category that would be eligible to receive funds along with identifying the targeted performance measures for each activity. The Implementation Plan, which requires adoption by the C/CAG Board, is developed at the onset of the 25-Year Measure M Program and will be updated every 5 years.
COLLECTION OF THE FEE
The $10 Vehicle Registration Fee (VRF) will be collected for a period of 25 years, beginning on May 2, 2011 and ending on May 1, 2036. Beginning approximately July 2011 and every month thereafter for the duration of the fee, the Department of Motor Vehicles (DMV) will issue C/CAG a monthly check for revenues collected from the prior month. The estimated revenue is $6.7 million annually and $33.5 million over the initial 5-year implementation period. This amount takes into consideration the DMV’s administrative fee charge of approximately $0.005 (one-half of a cent) for each check issued to C/CAG. IMPLEMENTATION STRATEGY
As indicated in the approved Measure M Expenditure Plan, up to 5% of the proceeds is allocated for administration with 50% of the net revenue allocated to the Local Streets and Roads category and 50% of the net revenue allocated to the Countywide Transportation Programs which includes the following programs: Transit Operations and/or Senior Transportation, Intelligent Transportation System (ITS) and Smart Corridors, Safe Routes to Schools (SR2S), and National Pollutant Discharge Elimination System (NPDES) and Municipal Regional Permit.
The general categories, detailed programs and projects guidelines, and respective performance measures contained in Measure M are further described as follows.
PROGRAM ADMINISTRATION (Up to 5%)
Allocation of funds to be taken off the top.
A portion of the funds will be used for routine program administration activities.
In addition to routine administration, funds will be used to reimburse C/CAG for the following costs.
o Payment to the County Registrar of Voters for placing Measure M on the November 2, 2010 ballot. (These costs are not counted towards the 5% limit on administration costs and may be amortized over a period of years, as needed)
o Payment to the DMV for the initial setup and programming for the collection of a ten-dollar ($10) fee imposed on motor vehicles registered in San Mateo County.
Any unused administration funds would be redistributed to the Local Streets and Roads and/or Countywide Program categories as appropriate.

2
LOCAL STREETS AND ROADS (50% of Net Revenue)
Allocations to local jurisdictions (20 cities and the County) for congestion mitigation and stormwater pollution mitigation programs.
Allocation to be on a cost reimbursement basis utilizing a distribution formula consisting of 50% population and 50% road miles for each jurisdiction modified for a minimum guaranteed amount of $75,000 for each jurisdiction. (Exhibit A)
Allocations will be made two times a year, at a minimum every 6 months.
Jurisdictions have the flexibility on use of the funds between the categories and projects; therefore, there are no requirements to split the funds evenly between the categories.
Measure M should not be used to supplant existing city general funds.
Category Programs/Projects Description Performance Measure
Traffic Congestion Management
Local Shuttles/transportation
Road resurfacing/reconstruction
Deployment of local Intelligent Transportation System (ITS)
Roadway operations (e.g., restriping, signal timing/coordination, signage
Replacement and/or upgrading of traffic signal hardware and/or software
Number of passengers transported
Miles/fraction of miles of roads improved.
Number of ITS components installed/ implemented.
Miles/fraction of miles of roads improved.
Number of units replaced and/or upgraded.
Stormwater Pollution Prevention
Street Sweeping;
Roadway storm inlet cleaning
Street side runoff treatment
Auto repair shop inspections
Managing runoff from street/parking lot
Small capital projects such as vehicle related runoff management/controls
Capital purchases for motor vehicle related runoff management/controls
Additional used oil drop off locations
Motor vehicle fluid recycling programs
Installation of new pervious surface medium strips in roadways
Miles of streets swept
Number of storm inlets cleaned
Square feet of surfaces managed
Number of auto repair shops inspected
Square feet of surfaces managed annually
Number of projects implemented
Number of pieces of equipment purchased and installed
Number of locations implemented/ operated; oil quantity collected
Number of programs implemented/ operated; fluid quantity collected
Square footage of new pervious surface medium strips installed

3
COUNTYWIDE TRANSPORTATION PROGRAMS (50% of Net Revenue)
Allocations for the four (4) Countywide Programs are as follows:
o Transit Operations and/or Senior Transportation - 22%
o Intelligent Transportation System (ITS) and Smart Corridors - 10%
o Safe Routes to Schools (SR2S) - 6%
o National Pollutant Discharge Elimination System (NPDES) and Municipal Regional Permit (MRP) for administration and projects - 12%
Allocation to be on a cost reimbursement basis.
Up to a maximum of 4% may be transferred between the ITS/Smart Corridors, SR2S, and NPDES/MRP within the 5-year period taking into consideration actual expenditures, unused allocations, program shortfalls, and program needs.
The ITS and NPDES projects to be selected by a competitive “call for project” process.
The Transit Operations and/or Senior Transportation programs to be sponsored by SamTrans or Caltrain. Proposed projects to be submitted to C/CAG annually for approval.
The SR2S Program to be administered by the C/CAG through the County Office of Education (COE)
The ITS/Smart Corridors and NPDES/MRP Programs to be administered by C/CAG
Category Programs/Projects Description Performance Measure
Transit Operations and/or Senior Transportation
SamTrans Paratransit operations and maintenance (Caltrain projects are also eligible)
Senior Mobility Management projects that complement paratransit (e.g., Mobility Ambassadors, Van Sharing)
Senior Mobility Education (e.g. Senior Mobility Guide, Website Management)
Operating costs and fare revenue; Usage; Operating Efficiency; Reliability and Safety; Customer satisfaction; Cost effectiveness
To be determined
To be determined
ITS and
Smart Corridors
Deployment of projects having regional and countywide significance
Maintenance and operations of the Smart Corridors specific equipment located within the San Mateo County jurisdictions’ right-of-way
Number of ITS components installed and implemented
Number of instances and duration that the equipment (directional signs, CCTV, communications, power supply line and equipment) is inoperable; Operability and activation of equipment
SR2S San Mateo County SR2S Program provides modularized activities enable children to walk and bicycle to school through education, outreach, encouragement, evaluation and enforcement activities
Number of schools participating in the Program; Number of programs, projects, and activities implemented

4
COUNTYWIDE TRANSPORTATION PROGRAMS (Continue)
Category Programs/Projects Description Performance Measure
NPDES and MRP
Street and Road Repair and Maintenance
Green Street projects
Control mobile sources
Public outreach events
Trash load reduction and hot spot cleanup
Vehicle brake pad pollution impacts
Number of guidance documents developed; area/length of roadways managed
Number of projects completed, area of impervious surface managed with low impact development measures
Number of guidance documents developed, outreach events or materials distributed, or mobile source properly managed
Number of materials/events developed, distributed, and/or attended; Number of people contacted
Number of guidance documents developed; quantity of area addressed by trash management measures; amount of trash loading reduced/prevented through implementation of management measures
Number of guidance documents developed and/or quantity of pollutants addressed by management measures

5
EXHIBIT A
The table below provides an estimated distribution for the Local Streets and Roads allocation based a formula consisting of 50% population and 50% road miles for each jurisdiction modified for a minimum guaranteed amount of $75,000 for each jurisdiction.
Jurisdiction % of Total Allocation
Estimated Net Annual Revenue
Estimated Net 5-Year Revenue
San Mateo County 12.15% 386,806$ 1,934,032$
San Mateo 11.02% 350,562$ 1,752,810$
Daly City 9.62% 305,999$ 1,529,995$
Redwood City 8.82% 280,747$ 1,403,733$
South San Francsico 7.17% 228,162$ 1,140,812$
Pacifica 4.84% 153,891$ 769,454$
San Bruno 4.76% 151,514$ 757,570$
Menlo Park 4.50% 143,095$ 715,475$
San Carlos 4.03% 128,341$ 641,707$
Burlingame 3.95% 125,668$ 628,338$
Belmont 3.29% 104,574$ 522,872$
Foster City 3.12% 99,227$ 496,134$
East Palo Alto 3.06% 97,444$ 487,222$
Hillsborough 2.81% 89,423$ 447,115$
Millbrae 2.74% 87,046$ 435,232$
Atherton 2.36% 75,000$ 375,000$
Woodside 2.36% 75,000$ 375,000$
Half Moon Bay 2.36% 75,000$ 375,000$
Portola Valley 2.36% 75,000$ 375,000$
Brisbane 2.36% 75,000$ 375,000$
Colma 2.36% 75,000$ 375,000$
Total 100% 3,182,500$ 15,912,499$
Notes: 1. Population totals are updated based on the State of California Department of Finance estimates 2. Figures may be slightly off due to rounding off errors. 3. Assumes constant annual revenue over the 5-year Implementation Plan period. 4. Final net distribution amounts will take into account deductions for one-time election costs (which could be
amortized over a period of years) and DMV initial set up and programming costs.