san joaquin valley unified air pollution control district ... draft bps - april... · unified air...
TRANSCRIPT

BPS i.e.
San Joaquin Valley Unified Air Pollution Control District
Draft Best Performance Standard (BPS) x.x.xx
Date: April 15, 2010
Class and Category
Cogeneration – Topping Cycle Plants Subcategories:
1. Natural Gas-Fired IC Engines 2. Natural Gas-Fired Turbines (not including oilfield
cogeneration units) 3. Oilfield Natural Gas-Fired Turbines
Best Performance Standard
1. Natural Gas-Fired IC Engines
Emissions Performance Standard of 700 lb-CO2e per MWh of Useful Energy
2. Natural Gas-Fired Turbines (not including oilfield cogeneration units)
Emissions Performance Standard of 800 lb-CO2e per MWh of Useful Energy
3. Oilfield Natural Gas-fired Turbines
Emissions Performance Standard of 800 lb-CO2e per MWh of Useful Energy
Percentage Achieved GHG Emission Reduction Relative
to Baseline Emissions
1. Natural Gas-Fired IC Engines: 36.4%
2. Natural Gas-Fired Turbines (not including oilfield cogeneration units): 27.3%
3. Oilfield Natural Gas-Fired Turbines: 27.3%
District Project Number C1100393
Evaluating Engineer James Harader
Lead Engineer Rupi Gill
Initial Public Notice Date April 15, 2010
Final Public Notice Date May 10, 2010
Determination Effective Date TBD

0
TABLE OF CONTENTS
Page
I. Best Performance Standard (BPS) Determination Introduction ......................... 1
A. Purpose ............................................................................................................... 1
B. Definitions............................................................................................................ 1
C. Determining Project Significance Using BPS ...................................................... 2
II. Summary of BPS Determination Phases .............................................................. 2
III. Class and Category ............................................................................................... 3
IV. BPS Development ................................................................................................. 4
STEP 1. Establish Baseline Emissions Factor for Class and Category ................... 4
STEP 2. List Technologically Feasible GHG Emission Control Measures ............... 7
STEP 3. Identify all Achieved-in-Practice GHG Emission Control Measures......... 11
STEP 4. Quantify the Potential GHG Emission and Percent Reduction for Each Identified Achieved-in-Practice GHG Emission Control Measure 14
STEP 5. Rank all Achieved-in-Practice GHG emission reduction measures by order of % GHG emissions reduction................................................................ 17
STEP 6. Establish the Best Performance Standard (BPS) for this Class and Category .................................................................................................. 18
STEP 7. Eliminate All Other Achieved-in-Practice Options from Consideration as Best Performance Standard..................................................................... 19
V. Appendices........................................................................................................... 20
Appendix I Initial Public Process Appendix II Public Review Process Appendix III Reserved for Public Comments Received and District Responses Appendix IV Survey Results for Natural Gas-Fired IC Engine Cogeneration
Systems Appendix V Survey Results for Natural Gas-fired Turbine Cogeneration
Systems (non-oilfield) Appendix VI Survey Results for Oilfield Natural Gas-Fired Turbine
Cogeneration Systems

1
I. Best Performance Standard (BPS) Determination Introduction A. Purpose To assist permit applicants, project proponents, and interested parties in assessing and reducing the impacts of project specific greenhouse gas emissions (GHG) on global climate change from stationary source projects, the San Joaquin Valley Air Pollution Control District (District) has adopted the policy: District Policy – Addressing GHG Emission Impacts for Stationary Source Projects Under CEQA When Serving as the Lead Agency. This policy applies to projects for which the District has discretionary approval authority over the project and the District serves as the lead agency for CEQA purposes. Nonetheless, land use agencies can refer to it as guidance for projects that include stationary sources of emissions. The policy relies on the use of performance-based standards, otherwise known as Best Performance Standards (BPS) to assess significance of project specific greenhouse gas emissions on global climate change during the environmental review process, as required by CEQA. Use of BPS is a method of streamlining the CEQA process of determining significance and is not a required emission reduction measure. Projects implementing BPS would be determined to have a less than cumulatively significant impact. Otherwise, demonstration of a 29 percent reduction in GHG emissions, from business-as-usual, is required to determine that a project would have a less than cumulatively significant impact. B. Definitions Best Performance Standard for Stationary Source Projects for a specific Class and Category is the most effective, District approved, Achieved-in-Practice means of reducing or limiting GHG emissions from a GHG emissions source, which is also economically feasible per the definition of Achieved-in-Practice. BPS includes equipment type, equipment design, and operational and maintenance practices for the identified service, operation, or emissions unit class and category. Business-as-Usual is the emissions for a type of equipment or operation within an identified class and category projected for the year 2020, assuming no change in GHG emissions per unit of activity as established for the baseline period, 2002-2004. To relate BAU to an emissions generating activity, the District proposes to establish emission factors per unit of activity, for each class and category, using the 2002-2004 baseline period as the reference. Category is a District approved subdivision within a “class” as identified by unique operational or technical aspects. Class is the broadest District approved division of stationary GHG sources based on fundamental type of equipment or industrial classification of the source operation.

2
C. Determining Project Significance Using BPS Use of BPS is a method of determining significance of project specific GHG emission impacts using established specifications. BPS is not a required mitigation of project related impacts. Use of BPS would streamline the significance determination process by pre-quantifying the emission reductions that would be achieved by a specific GHG emission reduction measure and pre-approving the use of such a measure to reduce project-related GHG emissions. GHG emissions can be directly emitted from stationary sources of air pollution requiring operating permits from the District, or they may be emitted indirectly, as a result of increased electrical power usage, for instance. For traditional stationary source projects, BPS includes equipment type, equipment design, and operational and maintenance practices for the identified service, operation, or emissions unit class and category.
II. Summary of BPS Determination Phases The District has established Topping Cycle Cogeneration as a separate class and category that requires implementation of a Best Performance Standard (BPS) pursuant to the District’s Climate Change Action Plan (CCAP). The District’s determination of the BPS for this class and category has been made using the phased BPS development process established in the District’s Final Staff Report, Addressing Greenhouse Gas Emissions under the California Environmental Quality Act. A summary of the specific implementation of the phased BPS development process for this specific determination is as follows:

3
BPS Development Process Phases for Topping Cycle Cogeneration
Phase Description Date Comments
1 Initial Public
Process 2/09/10 The District’s intent notice is attached as Appendix I.
2 BPS
Development 4/15/10 See Section IV of this evaluation document.
3 Public Review 4/15/2010 The District’s BPS determination notice and a list of
individuals receiving notification are attached as Appendix II.
4 Public
Comments 5/10/2010
The public comment period ended on the date given. All public comments received and the District's responses are
attached as Appendix III.
III. Class and Category The District has established cogeneration as a separate class and category of source that requires implementation of a Best Performance Standard (BPS) pursuant to the District’s Climate Change Action Plan (CCAP). Cogeneration, also referred to as Combined Heat and Power (CHP), is the generation of electricity and useful thermal energy or mechanical work from a single fuel source. Cogeneration units are typically categorized as either topping cycle systems or bottoming cycle systems. A topping cycle cogeneration system is a cogeneration system that uses input energy (usually fuel) to first produce electricity, with a portion or all of the reject heat then used as useful thermal energy or as useful mechanical energy. Conversely, a bottom cycle cogeneration system uses the input energy (usually fuel) to first produce useful thermal energy for a process, with the residual thermal energy used for electricity production. Most of the cogeneration units located within the San Joaquin Valley Air Pollution Control District can be categorized as topping cycle units; therefore, this BPS determination will be limited to topping cycle cogeneration units.

4
Topping cycle cogeneration units can be further divided into subcategories based on the type of combustion unit used in the cogeneration operation. This BPS evaluation will be limited to the two most commonly permitted topping cycle cogeneration systems, natural gas-fired turbines and natural gas-fired IC engines. Finally, oilfield cogeneration facilities that are associated with enhanced oil recovery (EOR) are distinctly different than other cogeneration facilities. EOR cogeneration facilities are typically “once through” devices that generally do not include condensers or cooling towers, as well as have other features that distinguish them from other cogeneration facilities. Therefore, the turbine category will be further subdivided into non-oilfield and oilfield subcategories. In summary, the final cogeneration subcategories that will be addressed by this analysis are:
1. Natural Gas-Fired Internal Combustion Engines 2. Natural Gas-Fired Turbines (not including oilfield cogeneration units) 3. Oilfield Natural Gas-Fired Turbines
IV. BPS Development STEP 1. Establish Baseline Emissions Factor for Class and Category
The Baseline Emission Factor (BEF) is defined as the three-year average (2002-2004) of GHG emissions for a particular class and category of equipment, expressed as annual GHG emissions per unit of activity. The term CO2e, used throughout this document, refers to carbon dioxide equivalent emissions. Carbon dioxide equivalent is a measure for describing how much global warming a given type or amount of greenhouse gas may cause, using the functionally equivalent amount or concentration of carbon dioxide (CO2) as the reference. A. Representative Baseline Operation For cogeneration operations, the representative baseline operation for 2004/2005 has already been evaluated and established by the California Public Utilities Commission (CPUC) as part of their 2007 greenhouse gas emission standard1. The baseline emissions factor for cogeneration units will be based on the previous work completed by the CPUC.
1 See http://docs.cpuc.ca.gov/PUBLISHED/FINAL_DECISION/64072.htm

5
B. Basis and Assumptions • The 2004/2005 baseline emissions reported by the California Public Utilities
Commission is representative of the 2002 and 2003 baseline years.
• GHG emissions are stated as “CO2 equivalents” (CO2e) which includes the global warming potential of methane and nitrous oxide emissions associated with gaseous fuel combustion.
C. Unit of Activity To relate Business-as-Usual to an emissions generating activity, it is necessary to establish an emission factor per unit of activity, for the established class and category. Cogeneration operations can generate useful electricity, useful thermal energy, and/or useful mechanical energy. Therefore, the chosen unit of activity should account for all three possible types of energy output. California Assembly Bill 1613 and Assembly Bill 2791 directed the California Energy Commission, Public Utilities Commission (CPUC), and the Air Resources Board (ARB) to implement the Waste Heat and Carbon Emissions Reduction Act. As required by the Assembly Bills, the California Energy Commission published “Guidelines for Certification of Combined Heat and Power Systems Pursuant to the Waste Heat and Carbon Emissions Reduction ACT, Public Utilities Code, Section 2840 ET SEQ.”, modified in January 2010. In their guidelines, the California Energy Commission utilized MWh useful energy output as the unit of activity for cogeneration units. To be consistent with the CEC guideline, the emissions factor per unit of activity chosen for cogeneration operations will be expressed as lb-CO2e/useful energy output (MWh). The unit of activity, represented in equation form, is shown below:
)Output(MWhEnergy Useful
eCOlbActivity ofUnit 2−
=
The useful energy output is the sum of the useful electrical energy, useful thermal energy, and useful mechanical energy generated by a cogeneration plant, each expressed in units of MWh. Useful thermal energy and useful mechanical energy are typically not measured in units of MWh. The following conversion factors are used to convert useful thermal energy and useful mechanical energy into MWh. Useful Thermal Energy Conversion Factor: 1 MWh / 3.412 MMBtu Useful Mechanical Energy Conversion Factor: 1 MWh / 1,341 hp-hr

6
D. Baseline Emission Factor Determination Pursuant to SB 1368, in 2007 the California Public Utilities Commission adopted an interim greenhouse gas Emissions Performance Standard (EPS)2 of 1,100 pounds of carbon dioxide equivalent (CO2e) per megawatt hour of useful energy. Pursuant to the rulemaking document,
“Based on the record in this proceeding, we find that this level reflects the intent of the Legislator to base the EPS on representative combined cycle gas turbine emission rates. As discussed in this decision, a 1,100 lb-CO2e/MWh standard reasonable accounts for potential CCGT plant “outliers” from the average data on CCGT emission rates to accommodate those units that utilize dry cooling technologies, are smaller-sized facilities, or are located in the desert or at high altitudes. At the same time, our adopted level avoids establishing a performance standard that is representative of the most inefficient, older CCGT power plants currently in operation…”
In other words, CPUC determined that the 1,100 lb-CO2e/MWh standard was representative of the baseline emissions level for the time period they evaluated. Further investigation of the CPUC’s rulemaking shows that the 1,100 lb-CO2e/MWh emission standard adopted by the California Public Utilities Commission was based on 2004/2005 baseline data and is applicable to cogeneration plants. Since the population of cogeneration plants does not change significantly from year to year, it is assumed that the 2004/2005 baseline data would closely resemble the 2002 – 2004 baseline data, and the 1,100 lb-CO2e/MWh value is an appropriate baseline emissions factor. It should be noted that other GHG emissions from cogeneration systems, such as N2O and CH4, were determined by PUC to be insignificant compared to the greenhouse gas contribution of CO2 emissions. Additionally, the California Energy Commission (CEC) has developed certification guidelines for combined heat and power (CHP) systems. Pursuant to their draft modified “Guidelines for Certification of Combined Heat and Power Systems Pursuant to the Waste Heat and Carbon Emissions Reduction Act, Public Utilities Code, Section 2840 ET SEQ.” (January 2010)3, the greenhouse emissions standard for certification of a CHP system is 1,100 lb-CO2e/MWh.
2 See http://docs.cpuc.ca.gov/PUBLISHED/FINAL_DECISION/64072.htm
3 http://energy.ca.gov/2009publications/CEC-200-2009-016/CEC-200-2009-016-CMF-REV1.PDF

7
Based on the CPUC and CEC determinations, the baseline emissions factor for this cogeneration BPS is determined to be 1,100 lb-CO2e/MWh of useful energy. Note, this baseline emissions factor will be applied to all of the topping cycle cogeneration subcategories covered by this BPS (natural gas-fired IC engines, natural gas-fired turbines, and oilfield natural gas-fired turbines).
STEP 2. List Technologically Feasible GHG Emission Control Measures The following findings or considerations are applicable to topping cycle cogeneration systems: Two methods of determining the applicable GHG emissions Best Performance Standard for cogeneration units were examined. The first method considered is to perform a detailed analysis to determine the possible GHG control measures for each possible cogeneration system component. While this method could result in the most efficient cogeneration system possible, pinning down specific performance parameters would be very difficult since cogeneration systems often include custom components that are specifically tailored to meet the unique heat and power generation demands of each installation. The second method considered is to evaluate each entire cogeneration system and determine the lb-CO2e/MWh rating for each whole system. This approach would result in the development of a single BPS emissions standard for a cogeneration system, rather than specifying efficiency requirements for individual cogeneration system components. This second method has been chosen for development of the cogeneration BPS for the following reasons: 1. This method is consistent with the approach used by the California Public
Utilities Commission to adopt their interim GHG emissions performance standard.
2. This approach is consistent with that used to develop the certification requirements for combined heat and power systems that have been adopted by the California Energy Commission.
3. CPUC and CEC have already developed a framework for determining and enforcing an overall GHG emissions performance standard.
4. This approach allows for flexibility in the design of custom cogeneration components.
The following GHG Control Measures, or in this case potential emission standards, have been identified for each subcategory of the topping-cycle cogeneration system class of emission unit.

8
Natural Gas-Fired IC Engines Based on a review of available technology and with consideration of data supplied from industry, manufacturers, and other members of the public, the following is determined to be the technologically feasible GHG emission reduction measures for the topping cycle cogeneration class and category, Natural Gas-Fired IC Engines subcategory:
Technologically Feasible GHG Control Measures for a Topping-Cycle Cogeneration Plant – Natural Gas-Fired IC Engine
Control Measure Qualifications
Emissions Performance Standard of 1,100 lb-CO2e per MWh of Useful Energy
This proposed emissions level is identical to the emissions performance standard adopted by the CPUC for cogeneration units and identical to the emissions performance standard for certification of a combined heat and power system with the
CEC.
Emissions Performance Standard of 700 lb-CO2e per MWh of Useful Energy
This proposed emissions level is based on the results of the District’s survey of existing natural gas-fired IC engine cogeneration plants located
within the SJVAPCD, allowing for some variation of GHG emissions between
cogeneration plant designs and utilization. For a copy of the survey results, please refer to
Appendix IV.
None of the identified GHG emission standards listed above is expected to result in an increase in emissions of criteria pollutants.

9
Natural Gas-Fired Turbines Based on a review of available technology and with consideration of data supplied from industry, manufacturers, and other members of the public, the following is determined to be the technologically feasible GHG emission reduction measures for the topping cycle cogeneration class and category, Natural Gas-Fired Turbines category, not including oilfield cogeneration turbines:
Technologically Feasible GHG Control Measures for a Topping-Cycle Cogeneration Plant – Natural Gas-Fired Turbine
(not including oilfield cogeneration turbines)
Control Measure Qualifications
Emissions Performance Standard of 1,100 lb-CO2e per MWh of Useful Energy
This proposed emissions level is identical to the emissions performance standard adopted by the CPUC for cogeneration units and identical to the
emissions performance standard for certification of a combined heat and power system with the CEC.
Emissions Performance Standard of 800 lb-CO2e per MWh of Useful Energy
This proposed emissions level is based on the results of the District’s survey of existing turbine
cogeneration plants (not including oilfield cogeneration) located within the SJVAPCD, allowing
for some variation of GHG emissions between cogeneration plants. For a copy of the survey
results, see Appendix V.
None of the identified GHG emission standards listed above is expected to result in an increase in emissions of criteria pollutants.

10
Oilfield Natural Gas-Fired Turbines Based on a review of available technology and with consideration of data supplied from industry, manufacturers, and other members of the public, the following is determined to be the technologically feasible GHG emission reduction measures for the topping cycle cogeneration class and category, Natural Gas-Fired Turbines (oilfield cogeneration units) category:
Technologically Feasible GHG Control Measures for a Topping-Cycle Cogeneration Plant – Oilfield Natural Gas-Fired Turbine
Control Measure Qualifications
Emissions Performance Standard of 1,100 lb-CO2e per MWh of Useful Energy
This proposed emissions level is identical to the emissions performance standard adopted by the CPUC for cogeneration units and identical to the
emissions performance standard for certification of a combined heat and power system with the CEC.
Emissions Performance Standard of 800 lb-CO2e per MWh of Useful Energy
This proposed emissions level is based on the results of the District’s survey of existing oilfield turbine cogeneration plants located within the
SJVAPCD, allowing for some variation of GHG emissions between cogeneration plants. For a copy
of the survey results, see Appendix VI.4
None of the identified GHG emission standards listed above is expected to result in an increase in emissions of criteria pollutants.
4 Note, while some oilfields have emission levels lower than 600 lb-CO2,equivalent/MWh, there was
noticeable variation in the GHG emissions of cogeneration plants from one oilfield to the next, and even between identical units located in the same oilfield. This variation is believed to be caused by differences in the type and temperature of incoming feedwater available at each site, the size of the cogeneration unit that may be utilized at each site, and the varying utilization rates of each specific cogeneration unit. The 800 lb-CO2,equivalent value was chosen as it allows for variation in these parameters, which individual facilities may not be able to control (I.E. feedwater availability or size of the cogeneration unit).

11
STEP 3. Identify all Achieved-in-Practice GHG Emission Control Measures For all technologically feasible GHG emission reduction measures, all GHG reduction measures determined to be Achieved-in-Practice are identified. Achieved-in-Practice is defined as any equipment, technology, practice or operation available in the United States that has been installed and operated or used at a commercial or stationary source site for a reasonable period of time sufficient to demonstrate that the equipment, the technology, the practice or the operation is reliable when operated in a manner that is typical for the process. In determining whether equipment, technology, practice or operation is Achieved-in-Practice, the District will consider the extent to which grants, incentives or other financial subsidies influence the economic feasibility of its use. Natural Gas-Fired IC Engines Based on a review of available technology and with consideration of input from industry, manufacturers and other members of the public, the following is determined to be the Achieved-in-Practice GHG emission reduction measures for this class and category:
Achieved-in-Practice GHG Control Measures for a Topping-Cycle Cogeneration Plant – Natural Gas-Fired IC Engine
Control Measure Achieved-in-Practice Qualifications
Emissions Performance Standard of 1,100 lb-CO2e per MWh of Useful Energy
This proposed emissions level is identical to the emissions performance standard adopted by the CPUC for cogeneration units and identical to the emissions performance standard for certification of a combined heat and power system with the
CEC. Therefore, this emissions level is considered Achieved in Practice.
Emissions Performance Standard of 700 lb-CO2e per MWh of Useful Energy
Several existing engines identified in the District’s survey (Appendix IV) of natural gas-
fired IC engine cogeneration systems are currently operating at levels below this
emissions level. Therefore, this emissions level is considered Achieved in Practice.

12
Natural Gas-Fired Turbines (not including oilfield cogeneration units) Based on a review of available technology and with consideration of input from industry, manufacturers and other members of the public, the following is determined to be the Achieved-in-Practice GHG emission reduction measures for this class and category:
Achieved-in-Practice GHG Control Measures for a Topping-Cycle Cogeneration Plant – Natural Gas-Fired Turbine
(not including oilfield cogeneration turbines)
Control Measure Achieved-in-Practice Qualifications
Emissions Performance Standard of 1,100 lb-CO2e per MWh of Useful Energy
This proposed emissions level is identical to the emissions performance standard adopted by the CPUC for cogeneration units and identical to the emissions performance standard for certification of a combined heat and power system with the
CEC. Therefore, this emissions level is considered Achieved in Practice.
Emissions Performance Standard of 800 lb-CO2e per MWh of Useful Energy
Several existing turbines identified in the District’s survey (Appendix V) of natural gas-fired turbine cogeneration plants are currently operating at levels below this emissions level. Therefore, this emissions level is considered
Achieved in Practice.

13
Oilfield Natural Gas-Fired Turbines Based on a review of available technology and with consideration of input from industry, manufacturers and other members of the public, the following is determined to be the Achieved-in-Practice GHG emission reduction measures for this class and category:
Achieved-in-Practice GHG Control Measures for a Topping-Cycle Cogeneration Plant – Oilfield Natural Gas-Fired Turbine
Control Measure Achieved-in-Practice Qualifications
Emissions Performance Standard of 1,100 lb-CO2e per MWh of Useful Energy
This proposed emissions level is identical to the emissions performance standard adopted by the CPUC for cogeneration units and identical to the emissions performance standard for certification of a combined heat and power system with the
CEC. Therefore, this emissions level is considered Achieved in Practice.
Emissions Performance Standard of 800 lb-CO2e per MWh of Useful Energy
Several existing turbines identified in the District’s survey (Appendix VI) of oilfield natural
gas-fired turbine cogeneration plants are currently operating at levels below this
emissions level. Therefore, this emissions level is considered Achieved in Practice.

14
STEP 4. Quantify the Potential GHG Emission and Percent Reduction for Each Identified Achieved-in-Practice GHG Emission Control Measure
A. Basis and Assumptions:
No assumptions are necessary as the candidate emission performance standards are already in units of GHG emissions per unit of activity.
B. Calculation of Potential GHG Emissions per Unit of Activity (Ga):
The candidate emission performance standards are already in units of GHG emissions per unit of activity.
C. Calculation of Potential GHG Emission Reduction as a Percentage of the Baseline Emission Factor (Gp):
Natural Gas-Fired IC Engines
The following table shows the GHG Emission Reduction Percentage Calculations for each Achieved-in-Practice GHG emission control measure.
GHG Emission Reduction Percentage for Control Measures for a Topping-Cycle Cogeneration Plant – Natural Gas-Fired IC Engine
Control Measure Percent GHG Reduction from Baseline
Emissions Performance Standard of
1,100 lb-CO2e per MWh of Useful Energy
x100%
MWh
COlb1,100
MWh
COlb1,100
MWh
eCOlb1,100
%Reduction2e
2e2
−
−−
−
=
Emission Reduction = 0%
Emissions Performance Standard of
700 lb-CO2e per MWh of Useful Energy
x100%
MWh
COlb1,100
MWh
COlb700
MWh
eCOlb1,100
%Reduction2e
2e2
−
−−
−
=
Emission Reduction = 36.4%
15
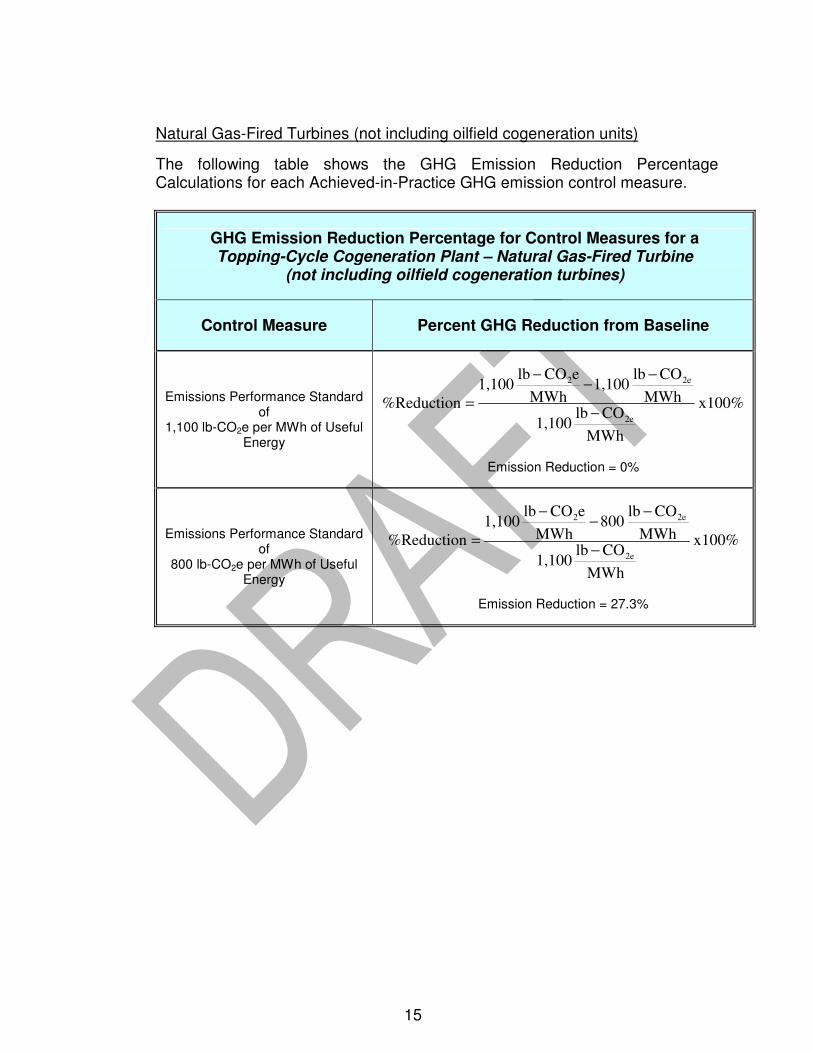
Natural Gas-Fired Turbines (not including oilfield cogeneration units)
The following table shows the GHG Emission Reduction Percentage Calculations for each Achieved-in-Practice GHG emission control measure.
GHG Emission Reduction Percentage for Control Measures for a Topping-Cycle Cogeneration Plant – Natural Gas-Fired Turbine
(not including oilfield cogeneration turbines)
Control Measure Percent GHG Reduction from Baseline
Emissions Performance Standard of
1,100 lb-CO2e per MWh of Useful Energy
x100%
MWh
COlb1,100
MWh
COlb1,100
MWh
eCOlb1,100
%Reduction2e
2e2
−
−−
−
=
Emission Reduction = 0%
Emissions Performance Standard of
800 lb-CO2e per MWh of Useful Energy
x100%
MWh
COlb1,100
MWh
COlb800
MWh
eCOlb1,100
%Reduction2e
2e2
−
−−
−
=
Emission Reduction = 27.3%

16
Oilfield Natural Gas-Fired Turbines The following table shows the GHG Emission Reduction Percentage Calculations for each Achieved-in-Practice GHG emission control measure.
GHG Emission Reduction Percentage for Control Measures for a Topping-Cycle Cogeneration Plant – Oilfield Natural Gas-Fired Turbine
Control Measure Percent GHG Reduction from Baseline
Emissions Performance Standard of
1,100 lb-CO2e per MWh of Useful Energy
x100%
MWh
COlb1,100
MWh
COlb1,100
MWh
eCOlb1,100
%Reduction2e
2e2
−
−−
−
=
Emission Reduction = 0%
Emissions Performance Standard of
800 lb-CO2e per MWh of Useful Energy
x100%
MWh
COlb1,100
MWh
COlb800
MWh
eCOlb1,100
%Reduction2e
2e2
−
−−
−
=
Emission Reduction = 27.3%

17
STEP 5. Rank all Achieved-in-Practice GHG emission reduction measures by order of % GHG emissions reduction
Natural Gas-Fired IC Engines Based on the calculations presented in Section II.4 above, the Achieved-in Practice GHG emission reduction measures are ranked in the table below:
Ranking of Achieved-in-Practice GHG Emission Control Measures for a Topping-Cycle Cogeneration Plant – Natural Gas-Fired IC Engine
Rank Control Measure
Potential GHG Emission per Unit
of Activity (Ga) (lb-CO2e/ton)
Potential GHG Emission Reduction as a Percentage of the Baseline Emission
Factor (Gp)
1 Emissions Performance Standard of
700 lb-CO2e per MWh of Useful Energy
700 36.4%
2 Emissions Performance Standard of
1,100 lb-CO2e per MWh of Useful Energy
1,100 0%
Natural Gas-Fired Turbines (not including oilfield cogeneration units) Based on the calculations presented in Section II.4 above, the Achieved-in Practice GHG emission reduction measures are ranked in the table below:
Ranking of Achieved-in-Practice GHG Emission Control Measures for a Topping-Cycle Cogeneration Plant – Natural Gas-Fired Turbine
(not including oilfield cogeneration turbines)
Rank Control Measure
Potential GHG Emission per Unit
of Activity (Ga) (lb-CO2e/ton)
Potential GHG Emission Reduction as a Percentage of the Baseline Emission
Factor (Gp)
1 Emissions Performance Standard of
800 lb-CO2e per MWh of Useful Energy
800 27.3%
2 Emissions Performance Standard of
1,100 lb-CO2e per MWh of Useful Energy
1,100 0%

18
Oilfield Natural Gas-Fired Turbines Based on the calculations presented in Section II.4 above, the Achieved-in Practice GHG emission reduction measures are ranked in the table below:
Ranking of Achieved-in-Practice GHG Emission Control Measures for a Topping-Cycle Cogeneration Plant – Oilfield Natural Gas-Fired Turbines
Rank Control Measure
Potential GHG Emission per Unit
of Activity (Ga) (lb-CO2e/ton)
Potential GHG Emission Reduction as a Percentage of the Baseline Emission
Factor (Gp)
1 Emissions Performance Standard of
800 lb-CO2e per MWh of Useful Energy
800 27.3%
2 Emissions Performance Standard of
1,100 lb-CO2e per MWh of Useful Energy
1,100 0%
STEP 6. Establish the Best Performance Standard (BPS) for this Class and Category For Stationary Source Projects for which the District must issue permits, Best Performance Standard is – “For a specific Class and Category, the most effective, District approved, Achieved-In-Practice means of reducing or limiting GHG emissions from a GHG emissions source, that is also economically feasible per the definition of achieved-in-practice. BPS includes equipment type, equipment design, and operational and maintenance practices for the identified service, operation, or emissions unit class and category”. Based on the definition above and the ranking given in Table 3 from Section II.5, Best Performance Standard (BPS) for this class and category is determined as:

19
Best Performance Standards for Topping Cycle Cogeneration Systems
Draft Best Performance Standards for Topping-Cycle Cogeneration Plants
Subcategory Control Measure
Natural Gas-Fired IC Engine Emissions Performance Standard of
700 lb-CO2e per MWh of Useful Energy
Natural Gas-Fired Turbine (not including oilfield cogeneration units)
Emissions Performance Standard of 800 lb-CO2e per MWh of Useful Energy
Oilfield Natural Gas-Fired Turbine Emissions Performance Standard of
800 lb-CO2e per MWh of Useful Energy
STEP 7. Eliminate All Other Achieved-in-Practice Options from Consideration as Best Performance Standard
The following Achieved-in-Practice GHG control measure, identified in Section II.4 and ranked in Section II.5 has been eliminated from consideration as Best Performance Standard for each subcategory since the GHG control efficiency that are less than that of the selected Best Performance Standard for each subcategory stated in Section II.6:
• Emissions Performance Standard of 1,100 lb-CO2e per MWh of Useful Energy

20
V. Appendices
Appendix I Initial Public Process Appendix II Public Review Process Appendix III Public Comments Received and District Responses Appendix IV Survey Results for Natural Gas-Fired IC Engine Cogeneration
Systems Appendix V Survey Results for Natural Gas-Fired Turbine Cogeneration
Systems (non-oilfield) Appendix VI Survey Results for Natural Gas-Fired Turbine Cogeneration
Systems (oilfield)

0
Appendix I Initial Public Process

0
Appendix II Public Review Process

0
Appendix III Reserved for Public Comments and District Response

1
Appendix IV Survey Results for Natural Gas-Fired IC Engine Cogeneration Systems

2
Survey Results for Natural Gas-Fired IC Engine Cogeneration Systems
The District conducted a survey of the permitted natural gas-fired IC engine cogeneration systems that are currently located in the District. This survey included the collection of fuel usages, useful electricity production, useful thermal energy production, and useful mechanical energy production. Using the provided information and the conversion factors presented in the main body of this document, the District calculated the CO2 equivalent emissions per unit of activity for each of the permitted cogeneration units for the facilities that responded to the survey. The District identified ten natural gas-fired IC engine cogeneration units and obtained information from six of the units using the survey. The facilities have asked that the raw data and the identity of the facilities be kept confidential; therefore, only the results of the District’s analysis are shown below:
Survey Results for Natural Gas IC Engines
(based on current configuration)
Unit lb-CO2e/MWh
Confidential Unit #1 816.5
Confidential Unit #2 555.3
Confidential Unit #3 629.0
Confidential Unit #4 475.0
Confidential Unit #5 687.2
Confidential Unit #6 490.2

0
Appendix V Survey Results for Natural Gas-Fired Turbine Cogeneration Systems
(non-oilfield)

1
Survey Results for Natural Gas-Fired Turbine Cogeneration Systems (non-oilfield)
The District conducted a survey of the permitted natural gas-fired non-oilfield turbine cogeneration systems that are currently located in the District. This survey included the collection of fuel usages, useful electricity production, useful thermal energy production, and useful mechanical energy production. Using the provided information and the conversion factors presented in the main body of this document, the District calculated the CO2 equivalent emissions per unit of activity for each of the permitted cogeneration units for the facilities that responded to the survey. The District obtained information from four non-oilfield units using the survey. The facilities have asked that the raw data and the identity of the facilities be kept confidential; therefore, only the results of the District’s analysis are shown below:
Survey Results for Natural Gas-Fired Turbines
(non-oilfield) (based on current configuration)
Unit lb-CO2e/MWh
Confidential Unit #1 683
Confidential Unit #2 825
Confidential Unit #3 809
Confidential Unit #4 746

0
Appendix VI Survey Results for Oilfield Natural Gas-Fired Turbine Cogeneration Systems
1
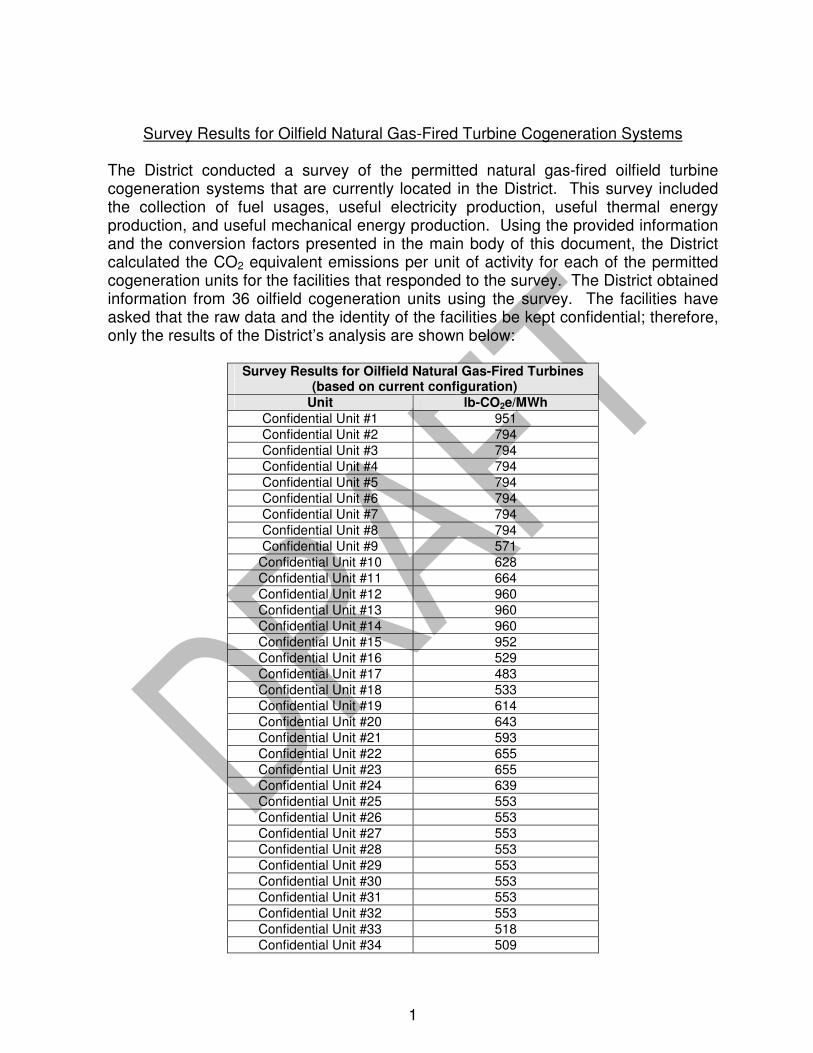
Survey Results for Oilfield Natural Gas-Fired Turbine Cogeneration Systems
The District conducted a survey of the permitted natural gas-fired oilfield turbine cogeneration systems that are currently located in the District. This survey included the collection of fuel usages, useful electricity production, useful thermal energy production, and useful mechanical energy production. Using the provided information and the conversion factors presented in the main body of this document, the District calculated the CO2 equivalent emissions per unit of activity for each of the permitted cogeneration units for the facilities that responded to the survey. The District obtained information from 36 oilfield cogeneration units using the survey. The facilities have asked that the raw data and the identity of the facilities be kept confidential; therefore, only the results of the District’s analysis are shown below:
Survey Results for Oilfield Natural Gas-Fired Turbines
(based on current configuration)
Unit lb-CO2e/MWh
Confidential Unit #1 951
Confidential Unit #2 794
Confidential Unit #3 794
Confidential Unit #4 794
Confidential Unit #5 794
Confidential Unit #6 794
Confidential Unit #7 794
Confidential Unit #8 794
Confidential Unit #9 571
Confidential Unit #10 628
Confidential Unit #11 664
Confidential Unit #12 960
Confidential Unit #13 960 Confidential Unit #14 960 Confidential Unit #15 952
Confidential Unit #16 529
Confidential Unit #17 483
Confidential Unit #18 533
Confidential Unit #19 614
Confidential Unit #20 643
Confidential Unit #21 593
Confidential Unit #22 655
Confidential Unit #23 655 Confidential Unit #24 639
Confidential Unit #25 553
Confidential Unit #26 553
Confidential Unit #27 553
Confidential Unit #28 553
Confidential Unit #29 553
Confidential Unit #30 553
Confidential Unit #31 553
Confidential Unit #32 553
Confidential Unit #33 518
Confidential Unit #34 509

2
Confidential Unit #35 454
Confidential Unit #36 492