san bernardino valley college strategic plan · pdf filesan bernardino valley college ......
TRANSCRIPT

STRATEGIC PLAN
Version 6.1Prepared by James E. Smith, Ph.D.Dean of Research, Planning, and Institutional Effectiveness8/15/2015
San Bernardino Valley College
This planning document includes the goals and measurable objectives that the campus and community stakeholders defined for the college over the next five years.
2014-2019
INTENTIONALLY BLANK
1

San Bernardino Valley College Strategic Plan
I. IntroductIon
ten years the school can expect a larger number of unprepared students who need access to educational opportunities.
SBVC enjoys one of the most ethnically diverse student populations in the country, with 62% Hispanic, 14% Black, 15% White, 5% Asian, and .3% Native American (CCCCO Data-Mart 2012-2013). The average head count is 12,000 students per semester. In recent years, the campus experienced a slight enrollment drop, but this is considered to be temporary and part of a normal cycle. The campus is classified as a medium size community college because of its full-time equivalency for students (FTES), normally between 9,000 and 10,000 (see Figure 2).
In 2014, SBVC celebrated its 88th year serving students of the San Bernardino area. The campus occupies 85 acres in one of the most densely populated parts of the Inland Empire, close to the cities of Colton, Rialto, San Bernardino, Riverside, and Redlands. The campus is part of a two campus district, located in an area of the state with the largest projected population growth over the next two decades. SBVC’s sister campus, Crafton Hills College, is located approximately 12 miles east of SBVC (See Figure 1). The campus is facing an important set of demographic challenges, which include being located adjacent to zip codes that are among the lowest achieving K-12 systems in the state. Demographic studies forecast a smaller number of high school graduates, but a larger number of college aged residents (Madrid, 2013). For at least the next
Figure 1. Map of the Service Area with a 30-mile Buffer
Source: SBVC Office of Research & Planning & Institutional Effectiveness (2014)
2

San Bernardino Valley College Strategic Plan
SBVC enrolls approximately 2.200 new freshmen each year. Most are from ten major feeder campuses in San Bernardino, Colton, Rialto, Redlands, Bloomington, and Fontana. However, the campus serves a large number of returning adult students as well: the average age is 28. Many students are returning for career changes and pursuing Career Technical Education (CTE) options.1 Approximately three quarters of the students take part-time course loads of less than 12 units. The college has a number of unique characteristics, which include a large number of CTE programs and a Middle College High School campus facility adjacent to the campus. As an early adopter of distance education, SBVC is a leader in the state with over 17% of the sections delivered through distance education. SBVC also has a number of grant-funded programs that have led to unique approaches to basic skills success. The programs include accelerated math courses that allow students to complete their math requirements in half the normal time, contextual learning programs that allow students to pair basic skills courses with their content areas in
CTE, and numerous learning communities for basic skills, science, technology, engineering, and several combinations of humanities and math (STEM) students/courses.
Figure 2. SBVC FTES
10,500.00
10,000.00
9,500.00
9,000.00
8,500.00
8,000.00
Source: DatatelNote: FTES is full time equivelency for students
SBVC FTES
08-09 09-10 10-11 11-12 12-13
FTES
1Approximately 33% of course offerings are classified as CTE or occupational.3
San Bernardino Valley College Strategic Plan
campus-wide surveys, campus data archives on student success (Datatel), and statewide data sources maintained by the state chancellor’s office (ARCC Report) and, (5) it reduced the time horizon from 15 years to 5 years.
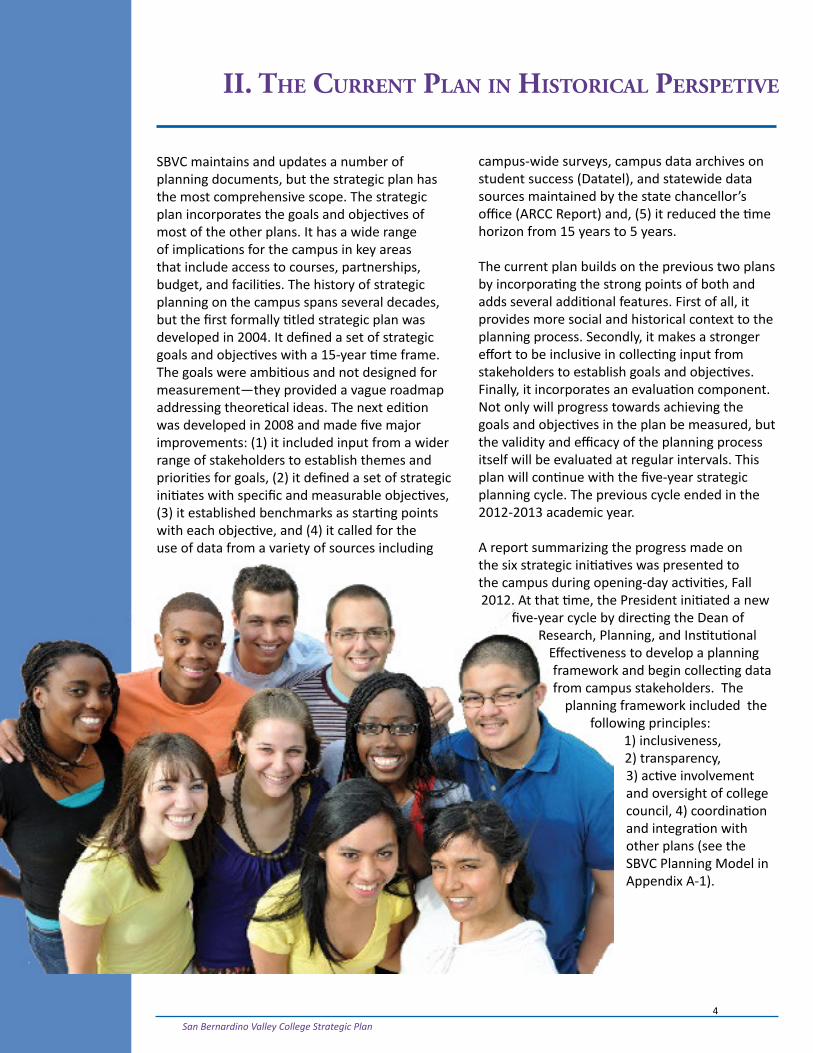
The current plan builds on the previous two plans by incorporating the strong points of both and adds several additional features. First of all, it provides more social and historical context to the planning process. Secondly, it makes a stronger effort to be inclusive in collecting input from stakeholders to establish goals and objectives. Finally, it incorporates an evaluation component. Not only will progress towards achieving the goals and objectives in the plan be measured, but the validity and efficacy of the planning process itself will be evaluated at regular intervals. This plan will continue with the five-year strategic planning cycle. The previous cycle ended in the 2012-2013 academic year.
A report summarizing the progress made on the six strategic initiatives was presented to the campus during opening-day activities, Fall 2012. At that time, the President initiated a new
five-year cycle by directing the Dean of Research, Planning, and Institutional
Effectiveness to develop a planning framework and begin collecting data from campus stakeholders. The
planning framework included the following principles:
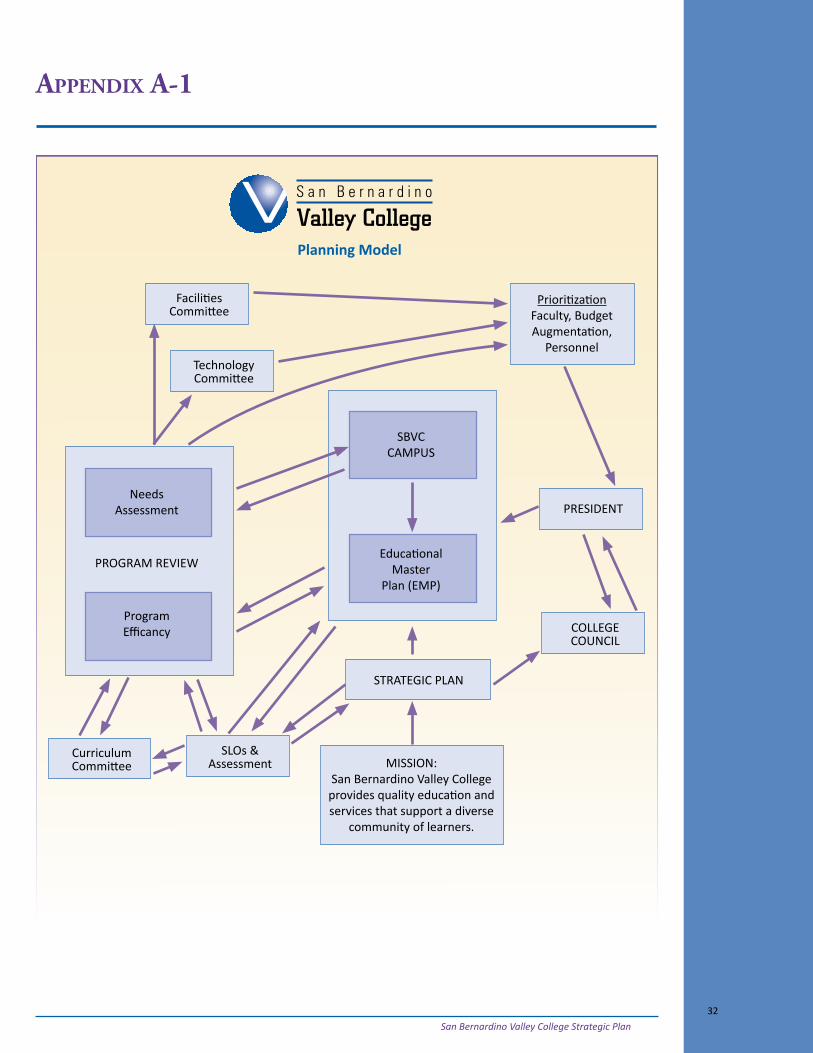
1) inclusiveness, 2) transparency, 3) active involvement and oversight of college council, 4) coordination and integration with other plans (see the SBVC Planning Model in Appendix A-1).
SBVC maintains and updates a number of planning documents, but the strategic plan has the most comprehensive scope. The strategic plan incorporates the goals and objectives of most of the other plans. It has a wide range of implications for the campus in key areas that include access to courses, partnerships, budget, and facilities. The history of strategic planning on the campus spans several decades, but the first formally titled strategic plan was developed in 2004. It defined a set of strategic goals and objectives with a 15-year time frame. The goals were ambitious and not designed for measurement—they provided a vague roadmap addressing theoretical ideas. The next edition was developed in 2008 and made five major improvements: (1) it included input from a wider range of stakeholders to establish themes and priorities for goals, (2) it defined a set of strategic initiates with specific and measurable objectives, (3) it established benchmarks as starting points with each objective, and (4) it called for the use of data from a variety of sources including
II. the current Plan In hIstorIcal PersPetIve
4
San Bernardino Valley College Strategic Plan
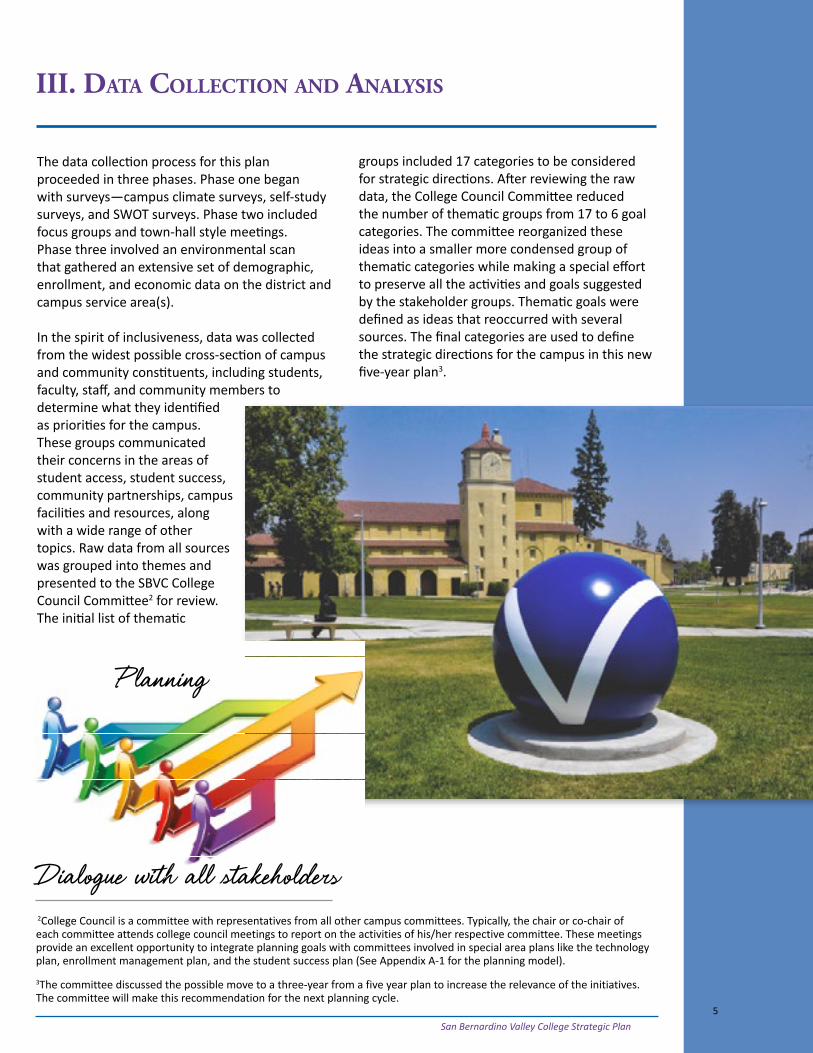
groups included 17 categories to be considered for strategic directions. After reviewing the raw data, the College Council Committee reduced the number of thematic groups from 17 to 6 goal categories. The committee reorganized these ideas into a smaller more condensed group of thematic categories while making a special effort to preserve all the activities and goals suggested by the stakeholder groups. Thematic goals were defined as ideas that reoccurred with several sources. The final categories are used to define the strategic directions for the campus in this new five-year plan3.
The data collection process for this plan proceeded in three phases. Phase one began with surveys—campus climate surveys, self-study surveys, and SWOT surveys. Phase two included focus groups and town-hall style meetings. Phase three involved an environmental scan that gathered an extensive set of demographic, enrollment, and economic data on the district and campus service area(s).
In the spirit of inclusiveness, data was collected from the widest possible cross-section of campus and community constituents, including students, faculty, staff, and community members to determine what they identified as priorities for the campus. These groups communicated their concerns in the areas of student access, student success, community partnerships, campus facilities and resources, along with a wide range of other topics. Raw data from all sources was grouped into themes and presented to the SBVC College Council Committee2 for review. The initial list of thematic
III. data collectIon and analysIs
2College Council is a committee with representatives from all other campus committees. Typically, the chair or co-chair of each committee attends college council meetings to report on the activities of his/her respective committee. These meetings provide an excellent opportunity to integrate planning goals with committees involved in special area plans like the technology plan, enrollment management plan, and the student success plan (See Appendix A-1 for the planning model).
3The committee discussed the possible move to a three-year from a five year plan to increase the relevance of the initiatives. The committee will make this recommendation for the next planning cycle.
Planning
Dialogue with all stakeholders
5
San Bernardino Valley College Strategic Plan
Iv. the PlannIng Process
(3) Solicited Input From all Stakeholders: The Office of Research, Planning and Institutional Effectiveness collected input from a wide range of stakeholders on and off campus. Over 2,000 on-campus stakeholders responded to requests for input. These stakeholders included faculty, students, classified staff, managers, foundation members, and SBCCD Board Members. Nearly 1,000 off-campus stakeholders responded, including community residents, business leaders, K-12 representatives, and political officials. Surveys, focus groups, community forums, SWOT questionnaires, and individual interviews were used to collect and gather responses.
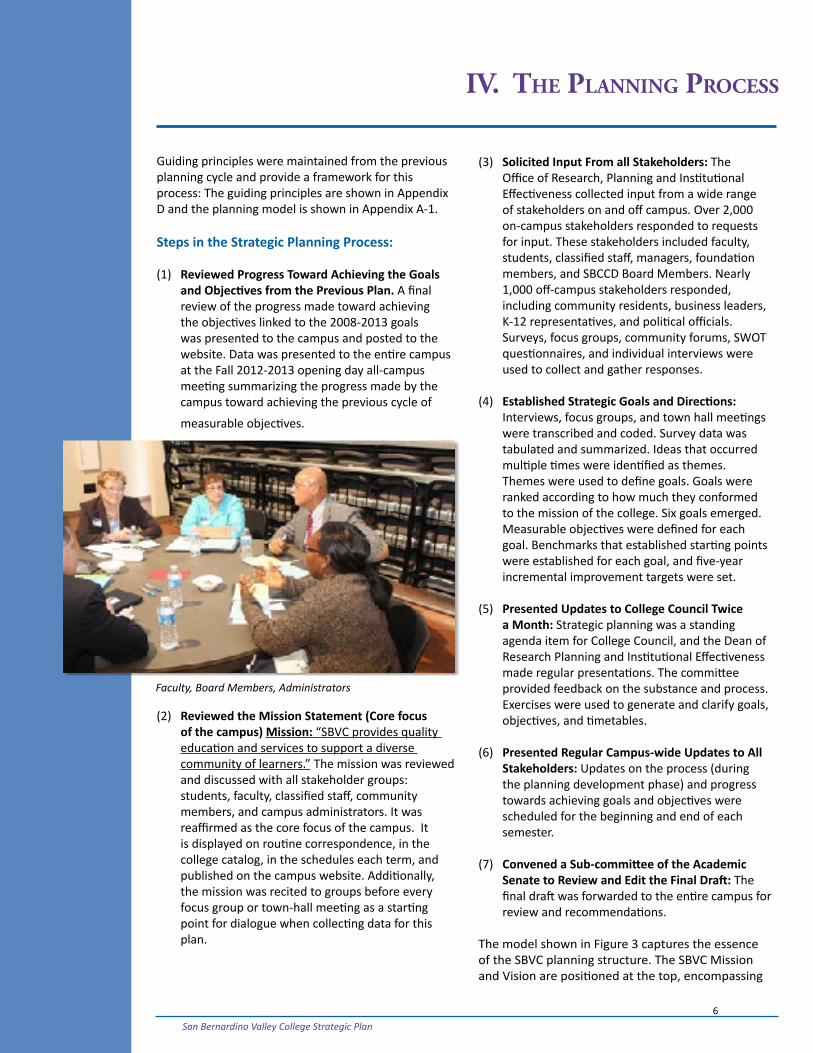
(4) Established Strategic Goals and Directions: Interviews, focus groups, and town hall meetings were transcribed and coded. Survey data was tabulated and summarized. Ideas that occurred multiple times were identified as themes. Themes were used to define goals. Goals were ranked according to how much they conformed to the mission of the college. Six goals emerged. Measurable objectives were defined for each goal. Benchmarks that established starting points were established for each goal, and five-year incremental improvement targets were set.
(5) Presented Updates to College Council Twice a Month: Strategic planning was a standing agenda item for College Council, and the Dean of Research Planning and Institutional Effectiveness made regular presentations. The committee provided feedback on the substance and process. Exercises were used to generate and clarify goals, objectives, and timetables.
(6) Presented Regular Campus-wide Updates to All Stakeholders: Updates on the process (during the planning development phase) and progress towards achieving goals and objectives were scheduled for the beginning and end of each semester.
(7) Convened a Sub-committee of the Academic Senate to Review and Edit the Final Draft: The final draft was forwarded to the entire campus for review and recommendations.
The model shown in Figure 3 captures the essence of the SBVC planning structure. The SBVC Mission and Vision are positioned at the top, encompassing
Guiding principles were maintained from the previous planning cycle and provide a framework for this process: The guiding principles are shown in Appendix D and the planning model is shown in Appendix A-1.
Steps in the Strategic Planning Process:
(1) Reviewed Progress Toward Achieving the Goals and Objectives from the Previous Plan. A final review of the progress made toward achieving the objectives linked to the 2008-2013 goals was presented to the campus and posted to the website. Data was presented to the entire campus at the Fall 2012-2013 opening day all-campus meeting summarizing the progress made by the campus toward achieving the previous cycle of
measurable objectives.
(2) Reviewed the Mission Statement (Core focus of the campus) Mission: “SBVC provides quality education and services to support a diverse community of learners.” The mission was reviewed and discussed with all stakeholder groups: students, faculty, classified staff, community members, and campus administrators. It was reaffirmed as the core focus of the campus. It is displayed on routine correspondence, in the college catalog, in the schedules each term, and published on the campus website. Additionally, the mission was recited to groups before every focus group or town-hall meeting as a starting point for dialogue when collecting data for this plan.
Faculty, Board Members, Administrators
6

San Bernardino Valley College Strategic Plan
all other elements. All aspects of the plan are driven by the mission and vision of the campus. Strategic initiatives are on the next level and define the commitments necessary to achieve the mission. Goals within each initiative define specific areas to support the more general and abstract initiatives. Objectives provide measurability. Each objective is accompanied by activities, timetables, targets, and they identify responsibility centers (See the data table in Appendix A).
All these features come together in Appendix A with the logic model4 table entitled “Strategic Goals, Objectives, and Strategies with Institution-Set Standards.” This table represents a tool for recordkeeping to measure progress and signal alarms if the campus falls too low on any given measure.
Integrating the Planning Objectives at Every Level of Planning
As stated in the introduction, the goals and objectives
Mission and Vision
Strategic Initiatives
Goals
Figure 3. Links between objectives and mission
Objectives
4Logic models are tools used by planners and evaluators to assess the effectiveness of institutional activities. They illustrate the relationships between goals, resources, activities, and outcomes.
Figure 4. Integrated Planning with Larger and Smaller Systems
*Although the sustainability plan is a district-level plan, it is also a special area plan for SBVC.
Strategic Plan from the State Chancellor’s Office
SBVC Strategic Plan
Campus-level plans: Educational Master Plan, Technology Plan, Matriculation plan, Enrollment Management Plan, Student Equity Plan; Grants Plan, Facilities Plan, Budget Plan, Marketing and Public Relation Plan, *Sustainability Plan, etc.
SBCCD Strategic PlanSBCCD Board Imperatives
of the SBVC strategic plan must align with a number of larger and smaller plans. The larger plans include the state and district strategic plans; the smaller plans include the campus-level plans shown in Figure 4.
Many campus-level plans overlap with each other as well as with the campus strategic plan. Examples of this can be seen in Figures 5 and 6. One example of this is the overlap between the enrollment management plan, matriculation plan, and student equity plan.
These plans share numerous goals in the areas of student access and student success. They all share the goal of improved student tracking and better evaluation with the research plan. When progress is achieved for goals in one of the initiatives, it is recorded in all plans that share the goals and objectives. The committees or departments that oversee the special-area plans become the natural responsibility centers to monitor progress of the related goals in the strategic plan. Consequently, they are accountable to manage messaging, encourage success, and determine the need for intervention when we fall below the campus-set standards. The Office of Research, Planning, and Institutional Effectiveness provides annual reports to all committees, where dialogue and analysis occur.
7

San Bernardino Valley College Strategic Plan
Technology plan
EnrollmentManagement
Student Equity plan
Researchplan
ProfessionalDevelopment
plan
Matriculationplan
Grantsplan
StrategicPlan
Figure 6. Integrated Planning Model
Figure 5. Overlapping goals of four special area campus plans
EnrollmentManagement
Student Equityplan
Researchplan
Matriculationplan
Environmental Scan Findings
The environmental scan provides the campus with the ability to match community needs to campus resources and plan for the future. An environmental scan was conducted during the fall semester of 2013 to assess the character of the residential community and the nature of the business environment. The findings were divided into seven general categories: (1) Service area characteristics, (2) Demographics, (3) Psychograhic profiles of neighborhoods, (4) List of colleges, universities, and trade schools within a 30 mile radius, (5) Current employment opportunities, (6) Top employers and business clusters, and (7) Job projections (See Appendix D for a summary of the Report).
This report helps the campus define the needs of the community we serve and identify job possibilities for our graduates. The needs of the community are linked to the socio-economic status (SES) of the residents. Due to the relatively small percentage of households in our area with a college graduate, SBVC can expect to enroll a large number of first-generation students. Since our service area is projecting an increase in the number of high school drop-outs, SBVC can expect to have a continuing need for basic skills coursework. Due to the overwhelming need for blue-collar workers in this community, SBVC can expect to have a strong demand for Career-Technical-Education (CTE). By examining the residential enrollment patterns among the four-year colleges and universities in the area, SBVC can better advise our students who have plans to pursue higher level degrees.
8

San Bernardino Valley College Strategic Plan
This data was discussed at numerous campus committee and planning meetings and contributed to the identification of threats and opportunities for the campus. Data from the vendor who produced the report was made available to produce reports for other campus planning.
The themes defined in College Council along with the strategic initiatives are listed in table one. These themes were derived from the data collections procedure. The initiatives were constructed to capture the spirit of theme.
Evaluation of Planning Process and Planning Objectives:Evaluation of this plan is scheduled to occur on three levels by three planning bodies. Two of these evaluations will occur annually, the third will occur on a five-year cycle. The three levels are: (1) evaluate progress towards meeting measurable objectives, (2) assess the validity of the measurable objectives, method of measurement, and appropriateness of timetables, (3) evaluate the goals and initiatives—refined or reconstruction of the entire plan as needed every five years. The three planning bodies that will evaluate the plan are: 1) college council, (2) collegial consultation committees associated with each goal and objective—these committees typically oversee the
Access SBVC will improve the application, registration, and enrollment procedures for all students.
SBVC will Increase course success, program success, access to employment, and transfer rates by enhancing student learning.
SBVC will promote a collegial campus culture with open lines of communication between all stake-holder groups on and off campus.
SBVC will maintain capable leadership and provide professional development to a staff who will need skills to function effectively in an evolving educational environment.
SBVC will improve institutional effectiveness through a process of evaluation and continuous improvement.
SBVC will support the construction and maintenance of safe, efficient, functional Facilities and infrastructure to meet the needs of students, employees, and community.
1
2
3
4
5
6 Facilities
Effective Evaluation & Accountability
Leadership & Professional Development
Communication, Culture, & Climate
Student Success
Table 1. Goals and Initiatives that resulted from themes identified by stakeholders5
Goals Strategic Initiative
5Measurable objectives, expanded strategies, and target dates are located in Appendix A
campus level plans linked to particular goals, (3) Office of Research, Planning, and Institutional Effectiveness.
Evaluation Cycles and LevelsLevel-1. All appropriate objectives in Appendix A will be assessed to evaluate progress toward meeting the goals and strategic initiatives. This will typically be done by measuring each objective. Although not all goals and objectives lend themselves to empirical measurement, we made every effort to craft objectives in a way they could be measured. The data table in Appendix A represents a logic-model style tool to track and record progress. Most strategic objectives have identified benchmarks with annual and long-term targets. Level-2. This higher level assessment will examine the relevance and validity of objectives, targets and measurement procedures. College Council conducts an annual meta-evaluation to assess the relevance of objectives, measurement processes, and timetables. The recommendations to improve measurement and process are made annually. Level-3. This level involves evaluating the relevance and applicability of the basic structure of the plan itself. This is scheduled to occur on a five-year cycle and results in a fundamental reexamination of the goals and strategic initiatives. The review sometimes results in a change to the planning time cycle—the original strategic planning cycles as ten years before it
9
San Bernardino Valley College Strategic Plan
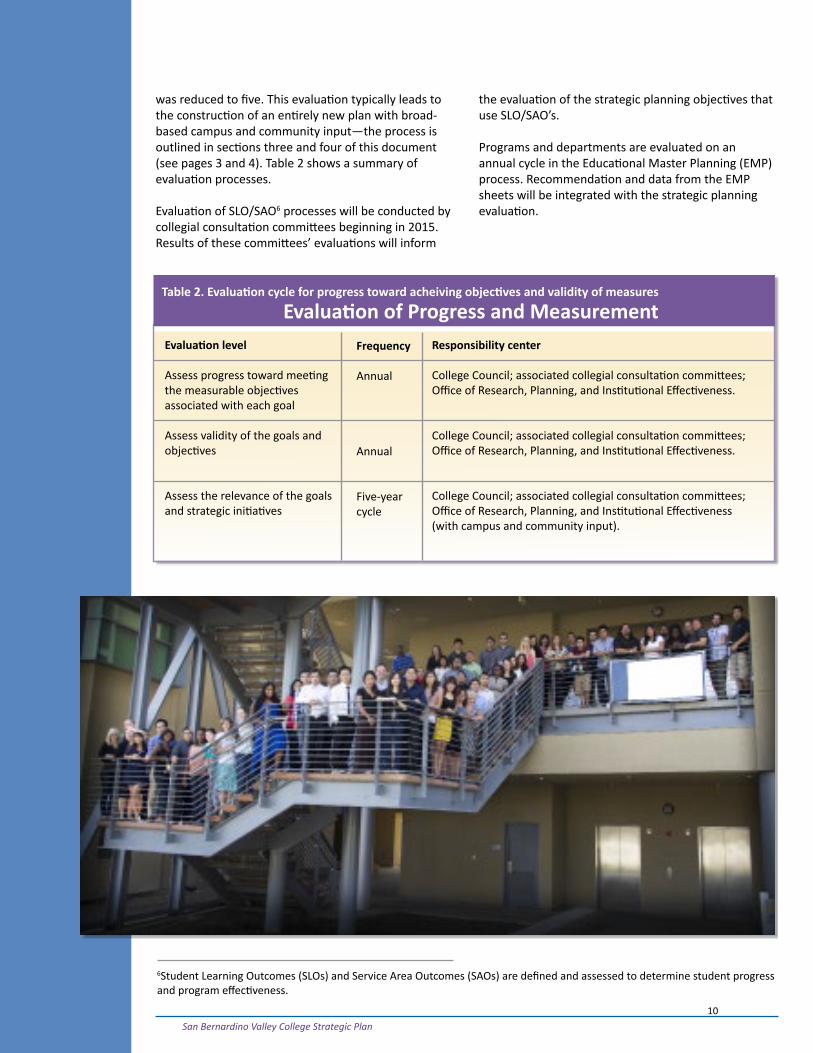
Table 2. Evaluation cycle for progress toward acheiving objectives and validity of measures
Evaluation of Progress and Measurement
was reduced to five. This evaluation typically leads to the construction of an entirely new plan with broad-based campus and community input—the process is outlined in sections three and four of this document (see pages 3 and 4). Table 2 shows a summary of evaluation processes.
Evaluation of SLO/SAO6 processes will be conducted by collegial consultation committees beginning in 2015. Results of these committees’ evaluations will inform
the evaluation of the strategic planning objectives that use SLO/SAO’s.
Programs and departments are evaluated on an annual cycle in the Educational Master Planning (EMP) process. Recommendation and data from the EMP sheets will be integrated with the strategic planning evaluation.
6Student Learning Outcomes (SLOs) and Service Area Outcomes (SAOs) are defined and assessed to determine student progress and program effectiveness.
Evaluation level
Assess progress toward meeting the measurable objectives associated with each goal
Assess validity of the goals and objectives
Assess the relevance of the goals and strategic initiatives
Responsibility center
College Council; associated collegial consultation committees; Office of Research, Planning, and Institutional Effectiveness.
College Council; associated collegial consultation committees;Office of Research, Planning, and Institutional Effectiveness.
College Council; associated collegial consultation committees;Office of Research, Planning, and Institutional Effectiveness (with campus and community input).
Frequency
Annual
Annual
Five-yearcycle
10
SBVC Strategic Initiatives 1-6
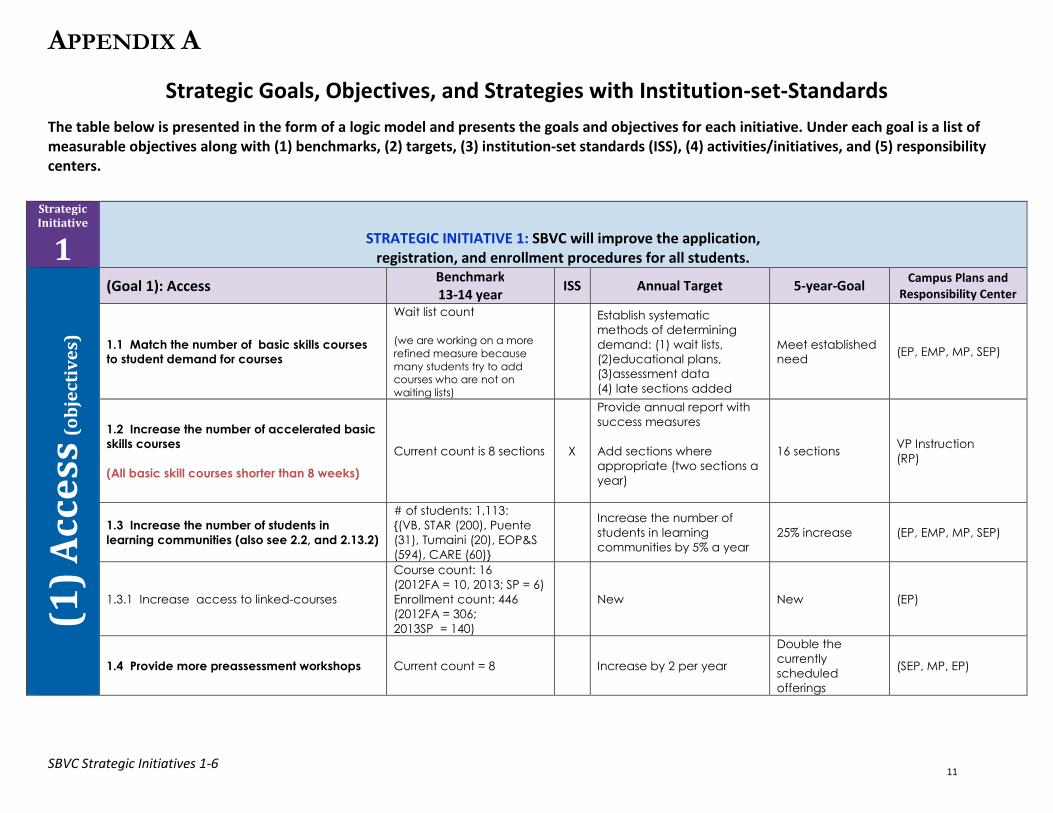
APPENDIX A
Strategic Goals, Objectives, and Strategies with Institution-set-Standards
The table below is presented in the form of a logic model and presents the goals and objectives for each initiative. Under each goal is a list of
measurable objectives along with (1) benchmarks, (2) targets, (3) institution-set standards (ISS), (4) activities/initiatives, and (5) responsibility
centers.
Strategic
Initiative
1 STRATEGIC INITIATIVE 1: SBVC will improve the application,
registration, and enrollment procedures for all students.
(1)
Ac
ce
ss
(o
bje
cti
ve
s)
(Goal 1): Access Benchmark
13-14 year ISS Annual Target 5-year-Goal
Campus Plans and
Responsibility Center
1.1 Match the number of basic skills courses
to student demand for courses
Wait list count
(we are working on a more
refined measure because
many students try to add courses who are not on
waiting lists)
Establish systematic
methods of determining
demand: (1) wait lists,
(2)educational plans,
(3)assessment data
(4) late sections added
Meet established
need (EP, EMP, MP, SEP)
1.2 Increase the number of accelerated basic
skills courses
(All basic skill courses shorter than 8 weeks)
Current count is 8 sections X
Provide annual report with
success measures
Add sections where
appropriate (two sections a
year)
16 sections VP Instruction
(RP)
1.3 Increase the number of students in
learning communities (also see 2.2, and 2.13.2)
# of students: 1,113:
{(VB, STAR (200), Puente
(31), Tumaini (20), EOP&S
(594), CARE (60)}
Increase the number of
students in learning
communities by 5% a year
25% increase (EP, EMP, MP, SEP)
1.3.1 Increase access to linked-courses
Course count: 16
(2012FA = 10, 2013; SP = 6)
Enrollment count: 446
(2012FA = 306;
2013SP = 140)
New New (EP)
1.4 Provide more preassessment workshops Current count = 8 Increase by 2 per year
Double the
currently
scheduled
offerings
(SEP, MP, EP)
11
SBVC Strategic Initiatives 1-6
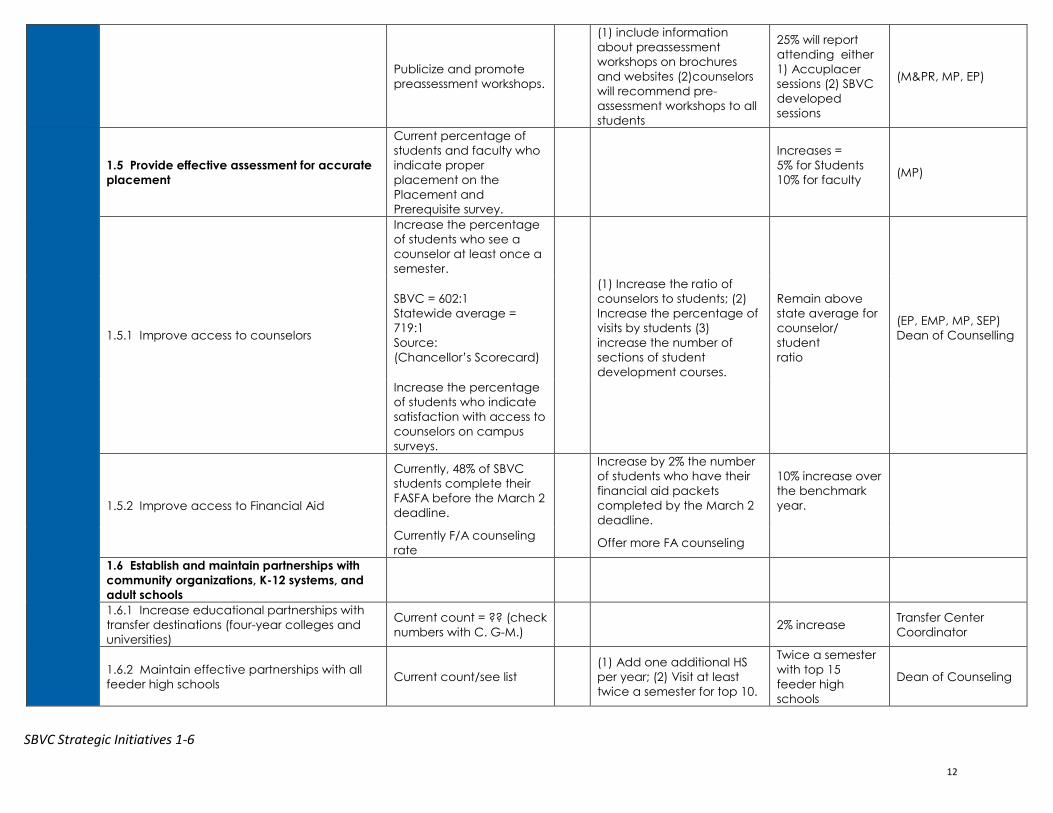
Publicize and promote
preassessment workshops.
(1) include information
about preassessment
workshops on brochures
and websites (2)counselors
will recommend pre-
assessment workshops to all
students
25% will report
attending either
1) Accuplacer
sessions (2) SBVC
developed
sessions
(M&PR, MP, EP)
1.5 Provide effective assessment for accurate
placement
Current percentage of
students and faculty who
indicate proper
placement on the
Placement and
Prerequisite survey.
Increases =
5% for Students
10% for faculty
(MP)
1.5.1 Improve access to counselors
Increase the percentage
of students who see a
counselor at least once a
semester.
SBVC = 602:1
Statewide average =
719:1
Source:
(Chancellor’s Scorecard)
(1) Increase the ratio of
counselors to students; (2)
Increase the percentage of
visits by students (3)
increase the number of
sections of student
development courses.
Remain above
state average for
counselor/
student
ratio
(EP, EMP, MP, SEP)
Dean of Counselling
Increase the percentage
of students who indicate
satisfaction with access to
counselors on campus
surveys.
1.5.2 Improve access to Financial Aid
Currently, 48% of SBVC
students complete their
FASFA before the March 2
deadline.
Increase by 2% the number
of students who have their
financial aid packets
completed by the March 2
deadline.
10% increase over
the benchmark
year.
Currently F/A counseling
rate Offer more FA counseling
1.6 Establish and maintain partnerships with
community organizations, K-12 systems, and
adult schools
1.6.1 Increase educational partnerships with
transfer destinations (four-year colleges and
universities)
Current count = ?? (check
numbers with C. G-M.) 2% increase
Transfer Center
Coordinator
1.6.2 Maintain effective partnerships with all
feeder high schools Current count/see list
(1) Add one additional HS
per year; (2) Visit at least
twice a semester for top 10.
Twice a semester
with top 15
feeder high
schools
Dean of Counseling
12

SBVC Strategic Initiatives 1-6
1Perkins funding refers to the program initiated by Carl Perkins to assist needy students and finance the cost of postsecondary education for students pursuing vocational-technical goals.
1.6.3 Increase the percentage of high school
graduates who enroll at SBVC immediately
after graduation from high school—among the
SBVC feeder high schools.
30% attend college after
high school
18% attend SBVC after
high school
Maintain current
counselor presence at HS
1.7 Explore and expand on-line advising
opportunities.
14
1.7.1 Implement and expand online
scheduling of all counseling appointments
Current count Increase count by 2% 10% increase
1.7.2 Expand the use of online academic
advising for Education Plans
Increase by 10% a year
1.8 Improve access to transfer courses. (check numbers with C.
G-M.)
Reduce waiting list count by
3% a year for high demand
courses
15% decrease (EP, EMP)
1.8.1 Conduct study to examine course
scheduling and sequencing—implement
recommendations
Spring & Summer 2015
Indicators
Identify appropriate
indicators and conduct a
pilot study during Spring
2015
Submit
recommend-
dations for future section cuts that
minimize the impact
on students—
include them in Enrollment
Management plan
(MP, EP)
1.9 Increase access to courses required for
CTE certificates
Spring 2015
Waiting list count for high
demand courses
Reduce waiting list count by
10% a year for high demand
courses
(EP, EMP, MP, SEP)
1.9.1 Match the number of Career Technical
Education (CTE) sections to demand for
courses
Spring 2014
Waiting list count for high
demand CTE courses
Reduce waiting list count by
10% a year for high demand
courses
1.9.2 Increase access to Perkin’s funds1 Current Perkin’s
count=579
Increase the number of
Perkin’s surveys by 5% a
year
Increase the
number of
Perkin’s surveys by
20% a year
(RP)
1.10 Improve access to courses that students
need for graduation
(EP, EMP, MP, SEP)
13

SBVC Strategic Initiatives 1-6
2Community service courses are not-for-credit programs that provide community members with fee-based training in subjects for personal growth. Students typically pay the full cost of
the class. 3Non-credit courses are courses that carry no college credit. Unlike not-for-credit courses, student fees do not need to cover the full-cost of the course.
1.10.1 Improve access to classes for students
who need a flexible schedule
88.1% agree or strongly
agree (2014—Campus
Climate Survey)
X
70% will indicate that
scheduling met their needs
*Increase the number of
online courses
*Maintain Saturday offerings
80% will indicate
that scheduling
met their needs
(EP, EMP, MP, SEP)
1.11 Promote lifelong learning
(EP,SEP)
1.11.1 Explore the use of audit courses
Discuss in district assembly Define a policy
1.11.2 Explore the use of community service
courses (not for credit)2
Discuss in district assembly Define a policy
1.11.3 Explore the expansion of non-credit
courses3
Discuss in district assembly Define a policy
1.11.4 Make better use of web content for
online and traditional courses
Explore online applications
in Professional Development
committee meetings
(SEP, MP, EP, RP, TP)
1.12 Maintain balance between transfer and
CTE programs offerings
33% CTE (SEP, MP, EP)
1.13 Improve access to campus technology
Current computer to
students ratio
Increase device access by
5% per year Increase by 25% (TP)
1.13.1 Explore implementing Virtual Internet
lab to allow students access to lab classes in
an online environment.
Discuss this issue in on-line
committee (TP)
1.13.2 Improve internet access on campus
(TP)
14

SBVC Strategic Initiatives 1-6
Strategic
Initiative
2 STRATEGIC INITIATIVE 2: SBVC will Increase course success, program success,
access to employment, and transfer rates by enhancing student learning.
(2)
Stu
de
nt
Su
cc
es
s (
Ob
jec
tiv
es
)
(Goal 2:) Student Success Benchmark
12-13 year ISS Annual Target 5-year-Goal
Campus Plans and
Responsibility Center
2.1 Increase the percentage of students who
succeed in basic skills courses
(For activities and initiatives see objectives 1.2;
1.3; 1.3.; 1.5; 1.5.1 1.6.2; 2.1.1; 2.17)
Pass Rate = 61.4%
Make use of early alert
(2.4.2)
Increase access to tutoring
(see 1.#)
.5% per year
Improve partnerships with
high schools to improve
course alignment student
preparation.
2.5%
(SEP, MP, EP)
2.1.1 Provide more tutoring opportunities
1,032 hrs. of tutoring Fall
2012 term Increase by 2% per year Increase 10% (SEP, MP, EP)
2.1.2 Increase the number of students
receiving tutoring (SARS sign-in count)
4,420 visits per year Establish benchmarks using
sign-ins from SARS database Increase 10%
2.2 Promote learning communities 2012-13 count
(see 1.3)
Increase the number of
students participating in
learning communities 5%
per year
25% increase (SEP, MP, EP)
2.3 Produce and present annual reports that
assess student success (see Initiative 5.7)
Scorecard and EMP
Presentations
Office of Research and
Planning (ORP) will make
annual reports to
Academic Senate.
(ORP) will make
annual reports to
Academic Senate
and campus
forums
2.4 Expand the use of the early alert systems
(SEP, MP, EP)
2.4.1 Fully implement SARS early alert system Purchased the software
(Spring 2014) X
Faculty and staff will
complete software training
Completely
implement for use
in all courses
(MP)
2.4.2 Increase the number of faculty who
submit reports by 10% a year
Count:
2010-11 = 27
2012-13 =2
Inform faculty about the
scheduling and importance
Train counselors and faculty
on the new system
15

SBVC Strategic Initiatives 1-6
4The Student Success Scorecard is an annual report provided by the California State Chancellor’s Office that tracks the progress of first-time students in cohorts over six (6) years on seven
(7) measures including persistence, completion of 30 units, remedial math, English, and ESL success, CTE success, and over all completion (SPAR). 5The Student Success Scorecard is an annual report provided by the California State Chancellor’s office that tracks the progress of first-time students in cohorts over six (6) years on seven
(7) measures including persistence, completion of 30 units, remedial math, English, and ESL success, CTE success, and over all completion (SPAR).
2013-14 = 0
2.5 Improve performance on all Student
Success Scorecard measures4
(See 2.5.1 to 2.5.55
X (SEP, MP, EP)
2.5.1 Completions 35.6% X
Remain one standard
deviation above the five
year average
Remain above our peer
group average
One standard
deviation above
the five year
average
(SEP, MP, EP)
2.5.1.1 Degrees (calculated separately)
Remain one standard
deviation above the five
year average
One standard
deviation above
the five year
average
(SEP, MP, EP)
2.5.1.2 Transfer (calculated separately)
Remain one standard
deviation above the five
year average
One standard
deviation above
the five year
average
(SEP, MP, EP)
2.5.2 Persistence (three consecutive
semesters) 55.5% X
Remain one standard
deviation above the five
year average
One standard
deviation above
the five year
average
(SEP, MP, EP)
2.5.3 30 units 58.5% X
Remain one standard
deviation above the five
year average
One standard
deviation above
the five year
average
(SEP, MP, EP)
2.5.4 Remedial Math (to 095) 28.8% X
Remain one standard
deviation above the five
year average
One standard
deviation above
the five year
average
(SEP, MP, EP)
2.5.5 Remedial English 25.2% X
Remain one standard
deviation above the five
year average
One standard
deviation above
the five year
average
(SEP, MP, EP)
2.5.6 Remedial ESL X
Remain one standard
deviation above the five
year average
One standard
deviation above
the five year
average
(SEP, MP, EP)
16

SBVC Strategic Initiatives 1-6
2.6 Increase individual student course-success
measures 69.13%
Remain one standard
deviation above the five
year average
One standard
deviation above
the five year
average
(SEP, MP, EP)
2.6.1 Increase online success rates compared
to traditional course format
X
Maintain a success rate
higher than the state
average in online
*2.6.2 Increase the graduation rate (degrees
and certificates)
1,225 degrees &
certificates
Remain one standard
deviation above the five
year average (SEP, MP, EP)
*2.6.3 Increase the transfer rate
Remain one standard
deviation above the five
year average
25 % increase,
relative to the
cohort
(SEP, MP, EP)
*2.6.3.1 Increase rate to CSU 202
Remain one standard
deviation above the five
year average
*2.6.3.2 Increase rate to UC 27
Remain one standard
deviation above the five
year average
*2.6.3.3 Increase rate to private and out-of-
state schools
364
Remain one standard
deviation above the five
year average
2.6.4 Increase success rate in online courses
compared to state average
Fall 2012
SBVC = 61.41%
State = 60.71%
X Maintain a higher success
rate than the state.
Maintain a higher
success rate than
the state.
(SEP, MP, EP)
2.6.5 Increase success rate of transfer level
courses
X (SEP, MP, EP)
2.6.6 Increase the percentage of students
who succeed in CTE courses and programs
52% X Scorecard (SEP, MP, EP)
2.7 Increase the use of low-cost and free
online resources
Conduct focus group
w/faculty and students to
identify opportunities
(TP)
2.8 Expand the number of partnerships
17
SBVC Strategic Initiatives 1-6
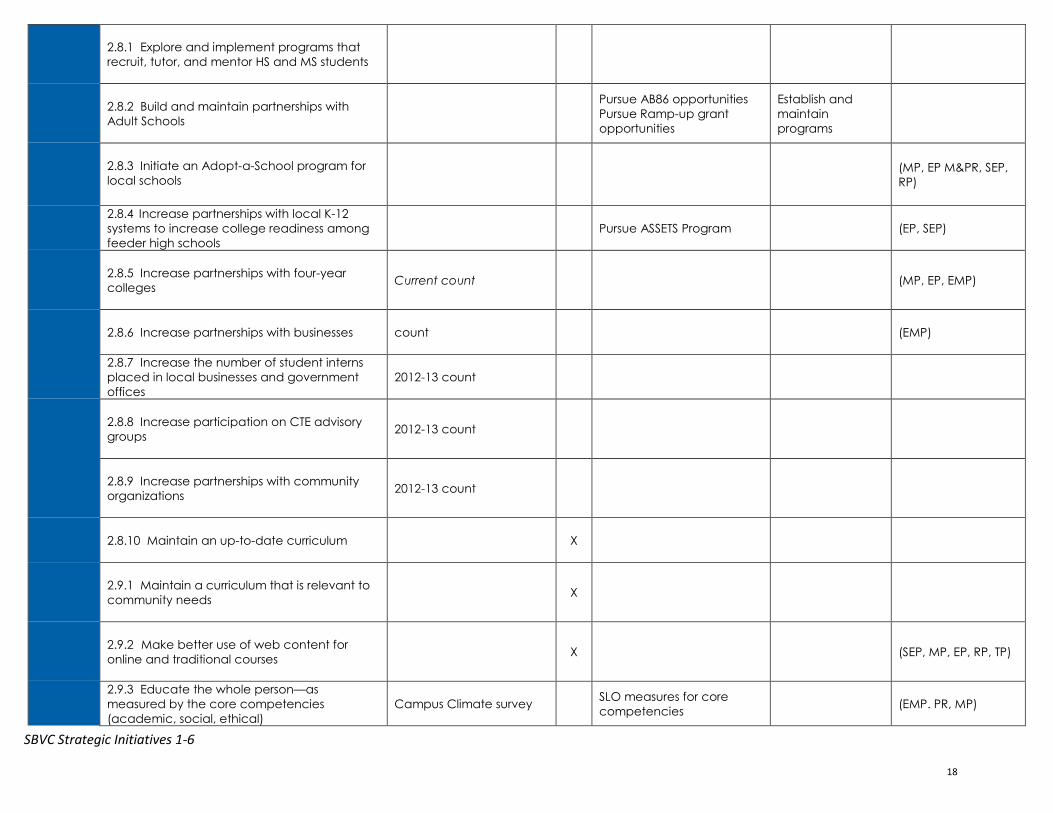
2.8.1 Explore and implement programs that
recruit, tutor, and mentor HS and MS students
2.8.2 Build and maintain partnerships with
Adult Schools
Pursue AB86 opportunities
Pursue Ramp-up grant
opportunities
Establish and
maintain
programs
2.8.3 Initiate an Adopt-a-School program for
local schools
(MP, EP M&PR, SEP,
RP)
2.8.4 Increase partnerships with local K-12
systems to increase college readiness among
feeder high schools
Pursue ASSETS Program (EP, SEP)
2.8.5 Increase partnerships with four-year
colleges
Current count (MP, EP, EMP)
2.8.6 Increase partnerships with businesses
count (EMP)
2.8.7 Increase the number of student interns
placed in local businesses and government
offices
2012-13 count
2.8.8 Increase participation on CTE advisory
groups
2012-13 count
2.8.9 Increase partnerships with community
organizations
2012-13 count
2.8.10 Maintain an up-to-date curriculum
X
2.9.1 Maintain a curriculum that is relevant to
community needs
X
2.9.2 Make better use of web content for
online and traditional courses
X (SEP, MP, EP, RP, TP)
2.9.3 Educate the whole person—as
measured by the core competencies
(academic, social, ethical)
Campus Climate survey SLO measures for core
competencies (EMP. PR, MP)
18

SBVC Strategic Initiatives 1-6
2.10 Encourage greater full-time enrollment
Current count (SSI, MP, EP)
2.11 Use SLOs/SAOs in an ongoing, systematic
cycle of continuous quality improvement
(EMP, PR, MP,SLO)
2.11.1 Reach and maintain 100% assessment
in active courses in the college catalog,
offered on the schedule in some rotation.
2012-2013 count 90%
2.11.2 Reach and maintain 100% assessment
of SLO’s and evaluation as per the Student
Learning Outcomes Plan (course and
program)
100% (EMP. PR, MP)
2.12 Increase the number of students with
terminal education plans―reach and maintain
100%
Current count 100% (EMP. PR, MP)
2.13 Empower students
Provide clear and accurate
information about campus
policies and activities
Increase access to
childcare
(MP, SEP,GP)
2.13.1 Increase the number of students who
participate in campus clubs and organizations
28% (Campus Climate
Survey) -10% +3 +15
2.13.2 Increase the number of students who
participate in learning committees
2012-2013 count -5% 5% percent increase per
year 25% MP, SEP
2.13.3 Increase the number of personal growth
workshops
2012-2013 count
2.14 Maintain and establish the appropriate
ratio of full-time to part-time faculty
2012FA: (148/484) = 31% FT
2013FA: (146/490) = (30%) FT
Maintain state average– (16,953/56,899) = 2013FA = 30% FT http://datamart.cccco.edu/Faculty-
Staff/Staff_Demo.aspx
2.15 Increase the number of grant
opportunities to support student success
Current proposal count
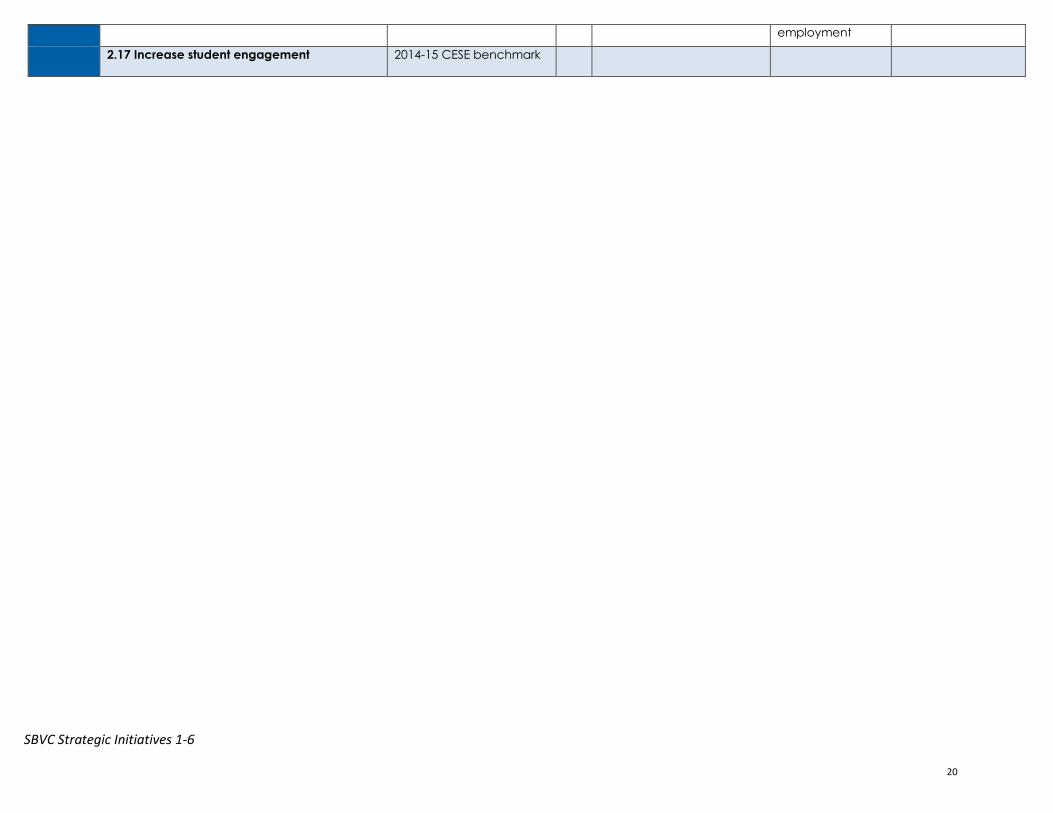
2.16 Improve student tracking (Initiative 5) Current data tracking
procedures
Offer more training in
Datatel and Informer
90% accuracy for
students while
they are on our
campus, 80% for
transfers, 60% to
19
SBVC Strategic Initiatives 1-6
employment
2.17 Increase student engagement
2014-15 CESE benchmark
20

SBVC Strategic Initiatives 1-6
(3)
Co
mm
un
ica
tio
n, C
ult
ure
, & C
lim
ate
(Ob
jec
tiv
es
) Strategic Initiative 3: SBVC will promote a collegial campus culture with
open lines of communication between all stakeholder groups on and off campus
(Goal 3:) Communication, Culture, and
Climate
Benchmark
12-13 year ISS Annual Target 5-year-Goal
Campus Plans and
Responsibility Center
3.1 Promote a sense of community and
solidarity within the campus (students, staff,
faculty)
(M&PR, MP, PDP,FD)
3.1.1 Sponsor regular alumni events.
No events 2 per year 4 per year
3.1.1 Encourage campus organizations,
alumni association, foundation, etc., to
sponsor more faculty and staff type events
(bowling with alumni, pizza night, happy hour)
No events 2 per year 4 per year
3.1.2 Publicize campus events in local
newspapers to improve the visibility of college
sports, cultural events, and educational
programs
2012-13
Count* One news release a week
At least 52 news
releases a year (M&PR)
3.1.4 Provide Increased access to campus
information
SBVC Website HP page-views:
364,121 Unique HP page-views
(unduplicated): 1,768,993
50% increase in website
and social media traffic
Double the
website and social
media traffic
(M&PR, MP, PDP,
MP, TP)
3.1.5 Increase the use of social networking
tools, e.g., Facebook; Twitter ; LinkedIn, etc.
*Count for total weekly
likes = 7,484 *Count for average weekly
engaged users=313
50% increase in likes;
50% increase in engaged
users;
Double the
website and social
media traffic
(M&PR, MP, PDP,
MP, TP)
3.1.6 Provide a user-friendly website.
85% of students agree 1% increase per year
90% of students
and employees
will say
3.2 Promote budgetary transparency (regular
updates)
3.2.1 Inform employees about the SBVC and
District budget
2012-13 CC Survey
80% of employees
will say that they
are informed
3.2.2 Provide regular campus communiques
about budget and planning
Current count Provide one budget
summary a semester
Provide one
budget summary a
semester
(M&PR, BP)
2012-13 count Distribute board minutes Distribute board (M&PR)
21

SBVC Strategic Initiatives 1-6
3.2.3 Improve access to regular board of
Trustees meeting updates
after every meeting minutes after every
meeting
3.2.4 Hold campus-wide information forums
2012-13 count Increase by 2 per semester Minimum of 3
forums a semester (M&PR, EMP, RP)
3.3 Disseminate committee minutes and all
plans online
2012-13 count
increase count of
committee minutes by 25%
a year
100%
3.4 Build community recognition and
networks by capitalizing on the deep roots
and history of the campus
Community survey 2013-14
(3.6)
Establish new benchmark
w/t Fall 2014 community
awareness survey
(M&PR, TP, RP)
3.5 Expand and enhance local business and
community awareness of the campus
Community survey 2013-14
(3.6)
Increase community
awareness by 5% with every
survey
25% increase in
awareness of
campus and
programs
(M&PR, MP)
3.6 Establish a SBVC historical archive in the
library—accessible online
(M&PR, RP, librarian)
3.6.1 Conduct community surveys to measure
awareness of campus and programs.
Golden & Golden 2005 Bi-annual
community surveys
3.7 Increase partnerships with local
businesses and community organizations
(also see 2.8)
(M&PR, MP, EP)
3.7.1 Partner with local vendors for services
they can provide–encourage them to offer
bids
Current partnership count Increase count by 10% per
year.
Increase count by
50% per year. (BP)
3.7.2 Explore an Adopt-a-Business program
Present the idea to advisory
group members (M&PR, RP)
3.7.3 Explore an Adopt-a-Student Program for
businesses
Present the idea to advisory
group members
3.7.4 Encourage all members of the campus
community to participate in local community
organizations
Distribute a survey to
establish Increase by 10% per year Increase by 50% (M&PR, SEP, PDP)
3.8 Build stronger relationship with the SBVC
foundation
Increase the number of
presentations to foundation
board form campus; from
foundation members to the
campus
22

SBVC Strategic Initiatives 1-6
3.9 Ensure good customer service in all
campus offices
CC survey results
3.10 Identify a clear identity for the campus Improve branding
responses by 20% a year
Increase by 100%
the positive survey
responses
regarding
branding
(M&PR)
3.11 Work with District to streamline and
expedite campus hiring practices
3.12 Improve campus morale 20% report high morale
Increase the number of
employees who report high
morale by 10% a year
Increase by 50%
3.13 Promote and embrace diversity
(students, staff, and faculty)
83% Increase satisfaction with
diversity by 2% a year Increase by 10%
(M&PR, TP, RP, SEP,
EP)
24

SBVC Strategic Initiatives 1-6
Strategic
Initiative
4 STRATEGIC INITIATIVE 4: SBVC will maintain capable leadership and provide professional development
to a staff that will need skills to function effectively in an evolving educational environment. (4
) L
ea
de
rsh
ip &
Pr
ofe
ssio
na
l
De
ve
lop
me
nt (Objectives)
(Goal 4:) Leadership and Professional
Development
Benchmark
12-13 year ISS Annual Target 5-year-Goal
Campus Plans and
Responsibility Center
4.1 Reduce the manager turnover--fewer
interims/more permanent managers
4.1.1 Complete a district salary study and
implement recommendations
Review the study
4.1.2 Identify and achieve recommended
ratio of managers to FTES/FTEF
4.1.3 Increase the average tenure of
managers
2012-13 measures
4.1.4 Provide career ladder information
4.1.5 Institute a mentorship program
4.2 Improve access to a wide variety of
professional development activities that keep
pace with a changing educational and
technology environment
(PDP)
4.2.1 Provide up-to-date training on campus
policies and procedures
Provide ongoing workshops
through professional
development
Provide sessions
each semester (PDP)
4.2.2 Provide ongoing training to faculty who
teach online courses that keeps pace with
emerging technology
Blackboard
Provide ongoing workshops
through professional
development
Provide sessions
each semester (PDP)
4.2.3 Provide leadership training
Annual managers training
and Classified Senate
Leadership Conference
(CCLC)
Provide annual training
opportunities
4.2.4 Provide training in partnership with
technology department
2012-13 10% 50%
25
SBVC Strategic Initiatives 1-6
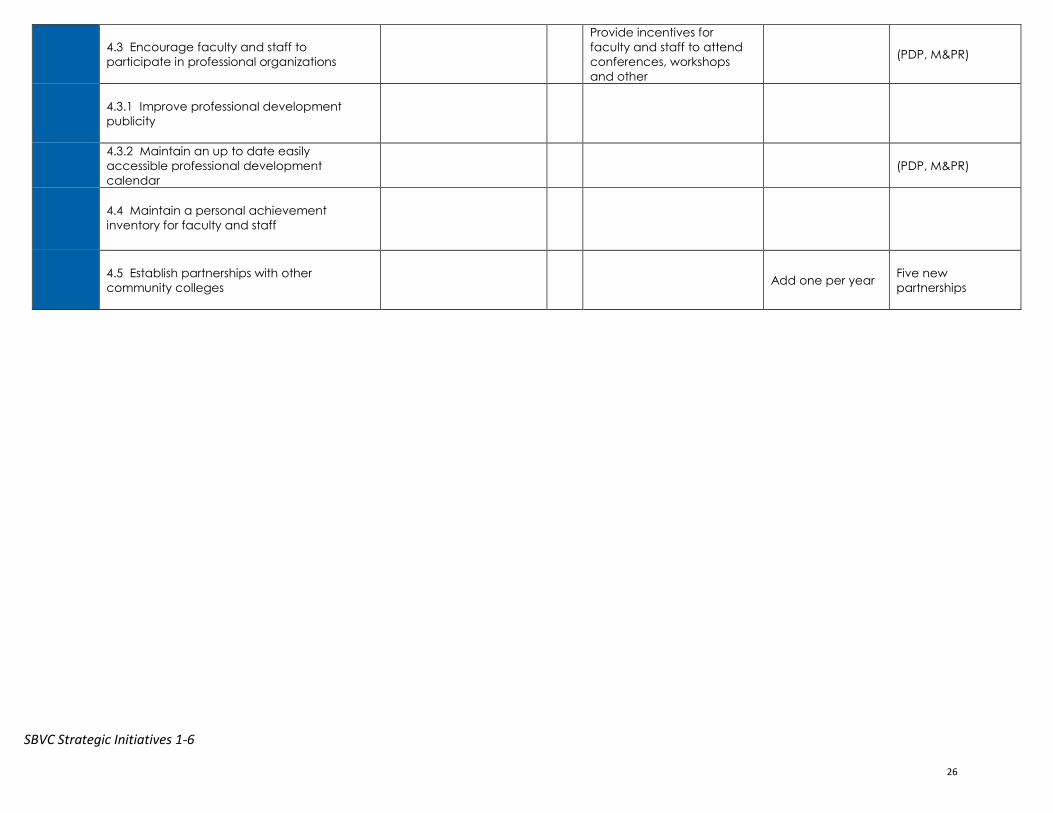
4.3 Encourage faculty and staff to
participate in professional organizations
Provide incentives for
faculty and staff to attend
conferences, workshops
and other
(PDP, M&PR)
4.3.1 Improve professional development
publicity
4.3.2 Maintain an up to date easily
accessible professional development
calendar
(PDP, M&PR)
4.4 Maintain a personal achievement
inventory for faculty and staff
4.5 Establish partnerships with other
community colleges
Add one per year Five new
partnerships
26
SBVC Strategic Initiatives 1-6
Strategic
Initiative
5
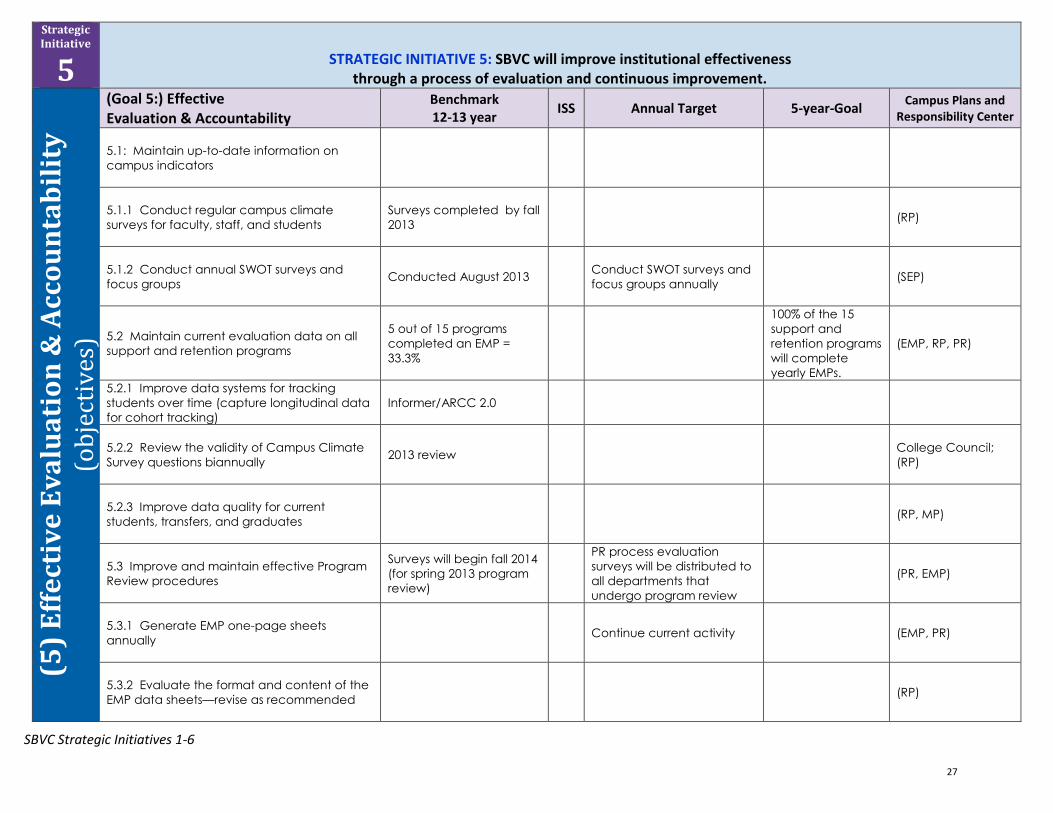
STRATEGIC INITIATIVE 5: SBVC will improve institutional effectiveness
through a process of evaluation and continuous improvement.
(5)
Eff
ec
tiv
e E
va
lua
tio
n &
Ac
co
un
tab
ilit
y
(objectives)
(Goal 5:) Effective
Evaluation & Accountability Benchmark
12-13 year ISS Annual Target 5-year-Goal
Campus Plans and
Responsibility Center
5.1: Maintain up-to-date information on
campus indicators
5.1.1 Conduct regular campus climate
surveys for faculty, staff, and students
Surveys completed by fall
2013 (RP)
5.1.2 Conduct annual SWOT surveys and
focus groups
Conducted August 2013 Conduct SWOT surveys and
focus groups annually (SEP)
5.2 Maintain current evaluation data on all
support and retention programs
5 out of 15 programs
completed an EMP =
33.3%
100% of the 15
support and
retention programs
will complete
yearly EMPs.
(EMP, RP, PR)
5.2.1 Improve data systems for tracking
students over time (capture longitudinal data
for cohort tracking)
Informer/ARCC 2.0
5.2.2 Review the validity of Campus Climate
Survey questions biannually
2013 review College Council;
(RP)
5.2.3 Improve data quality for current
students, transfers, and graduates
(RP, MP)
5.3 Improve and maintain effective Program
Review procedures
Surveys will begin fall 2014
(for spring 2013 program
review)
PR process evaluation
surveys will be distributed to
all departments that
undergo program review
(PR, EMP)
5.3.1 Generate EMP one-page sheets
annually
Continue current activity (EMP, PR)
5.3.2 Evaluate the format and content of the
EMP data sheets—revise as recommended
(RP)
27

SBVC Strategic Initiatives 1-6
5.3.3 Conduct annual needs and efficacy
reviews of scheduled programs
(PR), RP)
5.3.4 Produce annual reports analyzing
employment data
5.3.5 Produce annual reports analyzing
enrollment trends and local demographic
trends (Goal 5)
5.4 Evaluate all campus plans regularly
(RP)
5.4.1 Regularly evaluate data quality and
recommend methods for improvement
5.4.2 Maintain a library of campus
effectiveness measures in a form accessible
to the campus
5.4.3 Evaluate the validity of strategic
objectives, measurement procedures, and
time-tables for long-term targets
Use a rating system to
conduct an annual
evaluation of the validity of
each strategic initiative
measure.
5.4.4 Evaluate the validity of strategic goals &
initiatives every five years
Hold campus-wide and
community meetings to
evaluate and reset goals
CC
5.5 Maintain up-to-date accreditation self-
study evidence (RP)
RP
5.6 Produce and present annual reports that
assess student success (see Initiative 2.3)
5.7 Improve customer service
Constituents’ average: 54%
Breakdown:
*Manager: 63%,
*Faculty: 53%,
*Classified: 30%,
*Student: 68%)
75% of students
and employees
will indicate that
they are satisfied
with the customer
service they
receive.
(PDP, RP)
28
SBVC Strategic Initiatives 1-6
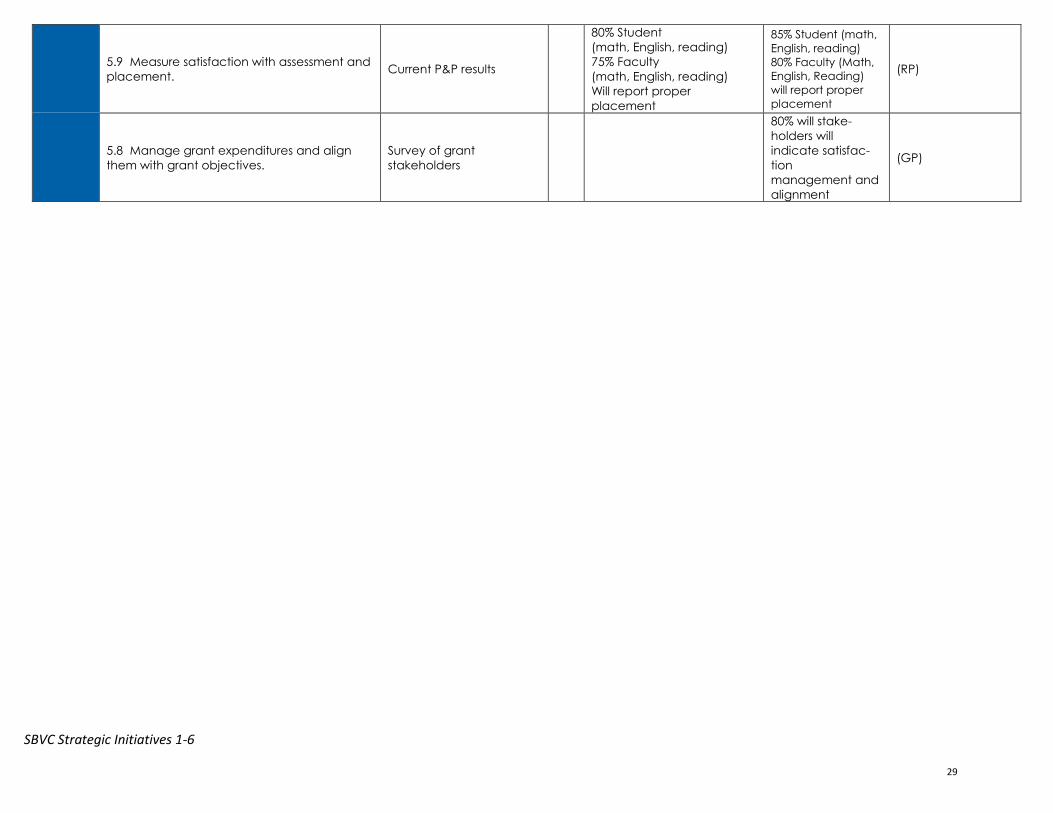
5.9 Measure satisfaction with assessment and
placement. Current P&P results
80% Student
(math, English, reading)
75% Faculty
(math, English, reading)
Will report proper
placement
85% Student (math,
English, reading)
80% Faculty (Math,
English, Reading)
will report proper
placement
(RP)
5.8 Manage grant expenditures and align
them with grant objectives.
Survey of grant
stakeholders
80% will stake-
holders will
indicate satisfac-
tion
management and
alignment
(GP)
29

SBVC Strategic Initiatives 1-6
Strategic
Initiative
6 STRATEGIC INITIATIVE 6: SBVC will support the construction and maintenance of safe, efficient,
functional facilities and infrastructure to meet the needs of students, employees, and community. (6
) F
ac
ilit
ies
(Objectives)
(Goal 6:) Facilities Benchmark
12-13 year ISS Annual Target 5-year-Goal
Campus Plans and
Responsibility Center
6.1 Conserve resources
6.1.1 Define, advertise, and expand our
recycling program
(SP, FP)
6.1.2 Explore the possibility of Installing solar
power collectors
6.1.3 Improve heating and cooling system
(SP, FP
6.1.4 Maintain landscaping that is attractive
and well suited to the climate
(SP, FP)
6.1.5 Support the sustainability committee
(integrate sustainability planning objectives
into this plan)
Incomplete plan
Complete the plan and
integrate objectives into this
Strategic Plan
(SP, FP)
6.1.6 Expand the use of the campus garden
by the culinary program
Dormant Revive the garden and
maintain it
Continuous
maintenance (SP)
6.1.7 Encourage the use of digital archiving
to minimize the unnecessary use of paper
filing
6.2 Maintain a safe and secure environment Current count
Install more surveillance
cameras around campus (2)
Provide more police patrol
(3) Conduct a minimum of 2
preparedness drills a year
(4)Maintain visible and
working emergency phones
around campus
6.3 Improve campus signage Signs count
CC survey about sign
(increase level of satisfaction
by 5% per year
(FP)
30

SBVC Strategic Initiatives 1-6
6.4 Continue with facilities improvement plan
(1) Upgrade technical
building (2) Build/improve
gym complex (3) Explore
plans to restore the
swimming pool facilities
(FP)
6.5 Develop and maintain adequate parking Classified: 55%
75% of students and
employees will indicate that
they are satisfied with the
parking availability.
6.6 Provide exemplary technology and
support while maintaining fiscal and
environmental responsibilities
All Campus Climate
Surveys: 72%
*Manager: 85%, *Faculty: 70%,
*Classified: 60%
6.6.1 Provide adequate hardware and
software for employees
514 staff computers/
719 staff = 72% have their own computers
492 current OS & apps/
514 computer = 96% are up
to date
6.6.2 Maintain up-to-date versions of
hardware and software for employees
1,094 computers/ 11,781 students = 1064
Current OS/1,094
computers = 97% of OS
are up to date
6.6.3 Maintain up-to-date versions of
hardware and software for students
11,781 students/
1,094 computers
1,064 current OS/
1,094 computers = 97% of OS are up to date
6.6.4 Explore a technology fee
Discussion resulted in no
plans for a technology
fee
Place item on the agenda in
College Council
6.6.5 Pursue grant opportunities for facilities
expansion
Review grant opportunities
for appropriateness each
year
Submit at least one
proposal
PLAN CODE
-(EMP) Educational Master Plan -(RP) Research Plan
-(EP) Enrollment Management Plan -(SEP) Student Equity Plan
-(GP) Grants Plan -(TP) Technology Plan
-(MP) Matriculation Plan -(SP) Sustainability Plan
-(M&PR) Marketing and Public Relations -(BSP) Basic Skills Plan -(PDP) Professional Development Plan -(SLO) SLO Plan
31
San Bernardino Valley College Strategic Plan
aPPendIx a-1
Valley CollegeS a n B e r n a r d i n o
Planning Model
MISSION:San Bernardino Valley College
provides quality education and services that support a diverse
community of learners.
STRATEGIC PLAN
PrioritizationFaculty, BudgetAugmentation,
Personnel
COLLEGE COUNCIL
SLOs &Assessment
Technology Committee
FacilitiesCommittee
CurriculumCommittee
PRESIDENT
PROGRAM REVIEW
NeedsAssessment
SBVCCAMPUS
ProgramEfficancy
EducationalMaster
Plan (EMP)
30
32

San Bernardino Valley College Strategic Plan
aPPendIx B
Plan Alignment
California System Strategic Goals • College Awareness and
Access • Student Success and
Readiness • Partnerships for Economic and
Workforce Development
• System Effectiveness • Resource Development
SBCCD District Strategic Goals • Student Success • Enrollment and Access • Partnerships of Strategic Importance • District Operational
Systems
SBVC Campus Goals
• Access
• Student Success
• Communication, Culture, & Climate
• Leadership & Professional
Development
• Effective Evaluation and Accountability
• Facilites
SBVC and SBCCD are linked to the California Community College System strategic goals.
33
San Bernardino Valley College Strategic Plan
aPPendIx c
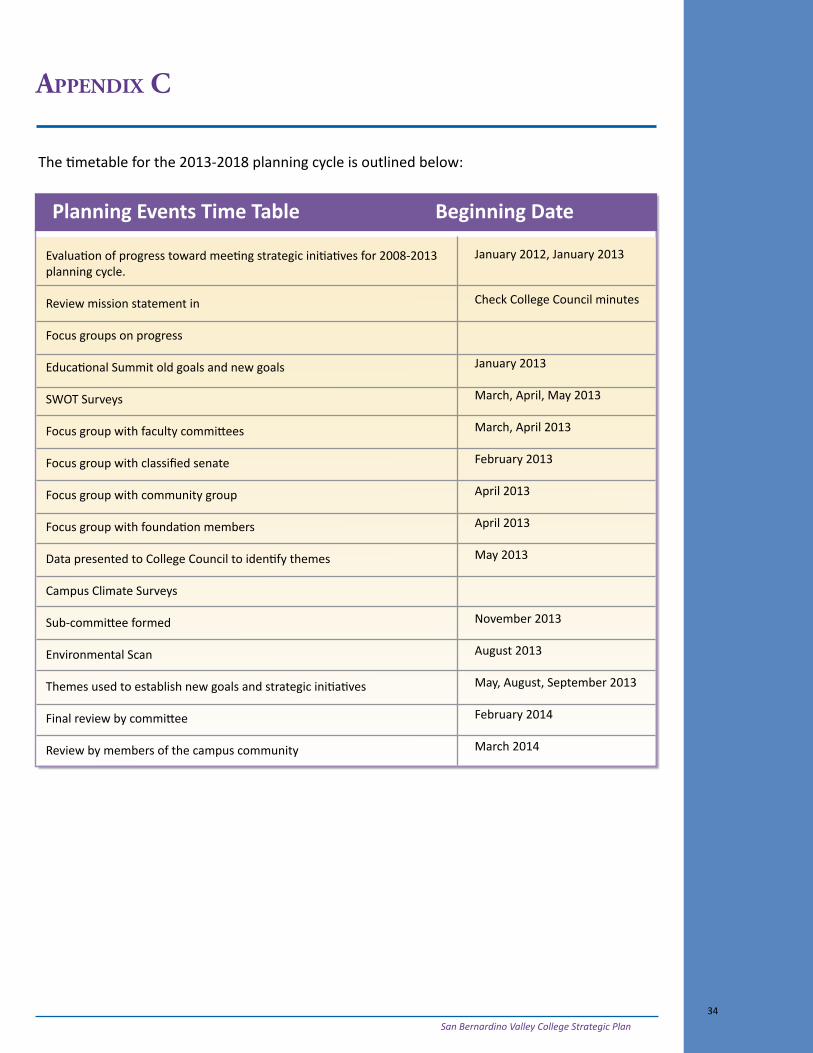
Planning Events Time Table Beginning Date
January 2012, January 2013
Check College Council minutes
January 2013
March, April, May 2013
March, April 2013
February 2013
April 2013
April 2013
May 2013
November 2013
August 2013
May, August, September 2013
February 2014
March 2014
The timetable for the 2013-2018 planning cycle is outlined below:
Evaluation of progress toward meeting strategic initiatives for 2008-2013 planning cycle.
Review mission statement in
Focus groups on progress
Educational Summit old goals and new goals
SWOT Surveys
Focus group with faculty committees
Focus group with classified senate
Focus group with community group
Focus group with foundation members
Data presented to College Council to identify themes
Campus Climate Surveys
Sub-committee formed
Environmental Scan
Themes used to establish new goals and strategic initiatives
Final review by committee
Review by members of the campus community
34

San Bernardino Valley College Strategic Plan
aPPendIx d
Diversity Statement
San Bernardino Valley Community College recognizes the inherent dignity of all individuals. We believe that students and staff are enriched by interaction with others whose backgrounds and perspectives are different from their own. We will continue to celebrate diversity and foster an environment of mutual respect, appreciation, and tolerance for differing values, beliefs, and backgrounds. We encourage the application of ethical practices and policies. We are committed to welcoming and extending the privileges of academic life to all. We value the cultural and intellectual diversity of the populations we serve because it enriches our lives and the community as a whole, promoting access, equity, and excellence. (Adapted from the statements of Texas Technical University (TTU) and the University of California, Riverside (UCR)).
35

San Bernardino Valley College Strategic Plan
aPPenIdx e
SAN BERNARDINO VALLEY COLLEGEAdopted by College Council, May 23, 2007
Institutional Guiding Principle: We are committed to quality and excellence in all of our efforts.
Guiding PrinciplesWe are committed to:
• providing opportunities for acquiring educational and support services.
• providing a safe, welcoming, culturally rich learning-centered environment.
• upholding standards of accountability, continuous improvement, and
conscientious resource management.• encouraging community involvement and dialog.
• helping students succeed in their educational and career goals.
• creating An educational environment which utilizes state-of-the-art technology.
Our Mission: San Bernardino Valley College provides quality education and services that support a diverse
community of learners.
36
San Bernardino Valley College Strategic Plan
references
Dooris, Michael J.; Kelley, John M.; Trainer, James Eds., New Directions for Institutional Research: Successful Strategic planning. (2004), Wiley Periodical Inc.
Dodd, Ann, Accreditation as a catalyst for institutional effectiveness, Chapter 2, New Directions for Institutional Research: Successful Strategic planning. (2004), Wiley Periodical Inc.
Hernandez, Mario (2000). Using logic models and program theory to build outcome accountability. Education and Treatment of Children, 23(1), 24-41.\
Madrid, Henry (2013)
McLaughlin, J. A., & Jordan, G. B. (1999). Logic models: A tool for telling your program's performance story. Evaluation and Program Planning, 22(1), 65-72.
Seymour, Daniel; Kelley, John m, John Jasinski, Linking Planning, Quality Improvement, and Institutional research, chapter 5, New Directions for Institutional Research: Successful Strategic planning. (2004), Wiley Periodical Inc.
Stinchcomb, Jeanne B. (2001). Using logic modeling to focus evaluation efforts: Translating operational theories into practical measures. Journal of Offender Rehabilitation, 33(2), 47-65.
37