samsung heavy industries · 6 risk management construction event time gap (months) 12 5 3 10...
TRANSCRIPT

May 2013 ※ Inpex CPF(Central Processing Facility) for Ichthys field in Austrailia
Samsung Heavy
Industries

• Company Overview • Global Markets • Future Strategy
Contents
※ Shell LNG FPSO 468m x 74m x 42m

3
· Business Highlights
· Order & Backlog
· Risk Management
· Financial Results
· Construction Business
※ Geoje Shipyard
Company Overview
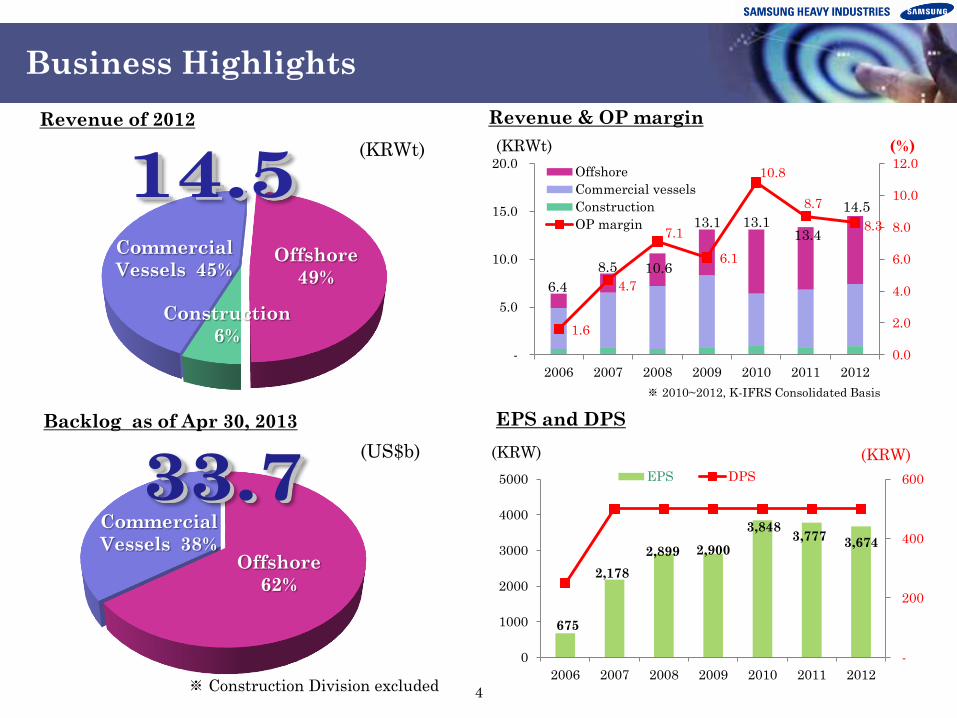
1.6
4.7
7.1
6.1
10.8
8.7
8.3
0.0
2.0
4.0
6.0
8.0
10.0
12.0
-
5.0
10.0
15.0
20.0
2006 2007 2008 2009 2010 2011 2012
Offshore
Commercial vessels
Construction
OP margin
Revenue & OP margin
(KRWt) (%)
4
Business Highlights
Revenue of 2012
Offshore
49%
Commercial
Vessels 45%
Construction
6%
(KRWt)
Backlog as of Apr 30, 2013
※ Construction Division excluded
Offshore
62%
Commercial
Vessels 38%
(US$b)
EPS and DPS
(KRW) (KRW)
※ 2010~2012, K-IFRS Consolidated Basis
8.5 10.6
13.1 13.1 14.5
6.4
13.4
675
2,178
2,899 2,900
3,848 3,777
3,674
-
200
400
600
0
1000
2000
3000
4000
5000
2006 2007 2008 2009 2010 2011 2012
EPS DPS

'06 '07 '08 '09 '10 '11 '12 13.Apr
Offshore
Commercial Vessels
'06 '07 '08 '09 '10 '11 '12 '13.Apr
Rigs
Production
LNGC
Container
Tanker
Others(Ferry, WTI)
5
Order & Backlog
(US$b)
Order Backlog
2013 New Order Details
※ As of Apr 30, 2013
Containership
(13%)
14.9 15.3 13.5
21.2
1.4
(US$b)
New Order
9.7 $3.1Bil
(17 Units)
Drillship
(19%)
LNG
Carrier
(63%)
Order Backlog Trend (US$b)
26.3
42.1 48.7
37.2 39.3 40.7
Drillship
(36%)
Production
Facilities
(26%)
LNG
Carrier
(21%)
Tanker
( 4%)
9.6
38.3
3.1
33.7
Container
-ship
(18%)

6
Risk Management
6
Construction Event
Time Gap (Months) 12 5 3 10
Currency
Receivables
Payables
Raw Materials
Main Engine
Machineries
Steel Plate
Bulk Parts
■ SHI focuses on minimizing profit volatility
Contract Steel cutting Keel laying Launching Delivery
: Hedging, order : Execution, delivery
Foreign currency exposure is fully covered through forward transaction at the stage of shipbuilding contract.
Main Engine and machinery are ordered within 1~2 months of contract signing.
No Hedge tools available for Steel plates, SHI put buffer in bidding price to cope with unexpected price hike.

7
Financial Results
(KRWb) ■ Income Statement
2009 2010 2011 2012
2013 1Q 4Q Total
Sales 13,095 13,146 13,391 3,540 14,490 3,888
Shipbuilding
Construction
12,261
834
12,160
986
12,319
1,072
3,344
196
13,634
856
-
-
Operating Profit
(Margin)
794
(6.1%)
1,432
(10.8%)
1,160
(8.7%)
264
(7.5%)
1,206
(8.3%)
440
(11.3%)
Pre-Tax Income 855 1,298 1,150 119 1,045 383
Non-OP Income
Non-OP Expenses
6,222
6,161
85
219
204
214
1,755
1,900
4,534
4,695
-
-
Net Income 670 1,000 851 73 796 300
※ 2010~2013, K-IFRS Consolidated Basis

■ Balance Sheet
8
(KRWb)
Financial Results
2008 2009 2010 2011 (A) 2012(B) B-A
Total Assets 26,084 20,188 18,850 16,414 16,635 221
Cash & equiv.
Account Receivable
Advance Payments
Hedge related
Inventories
2,490
1,999
2,880
12,796
778
1,085
3,814
2,405
6,916
579
1,255
5,449
1,638
3,370
607
1,289
4,078
1,675
2,592
540
1,163
5,091
1,501
2,064
699
-126
1,013
-174
-528
159
Total Liabilities 23,760 17,347 14,718 11,770 11,352 -418
Advance Receipts
Debts
Hedge related
8,632
158
12,518
5,658
2,780
6,817
5,431
2,838
3,578
5,602
1,784
2,452
3,967
3,193
1,458
-1,635
1,409
- 994
Total Equity 2,324 2,841 4,132 4,644 5,283 639
Paid in Capital
Treasury Shares
1,154
-674
1,154
-671
1,154
-662
1,154
-661
1,154
-661
-
-
Total Liab. & Eqty 26,084 20,188 18,850 16,414 16,635 221
※ 2010~2012, K-IFRS Consolidated Basis

9
■ Business Overview ■ Business Areas
※ As of Apr 30, 2013
Revenue and Profit
Order Backlog
Tril KRW
Building & Housing
70%
Civil & Plant
30%
(KRWb)
Construction Business
(%)
-4
-2
0
2
4
6
8
10
0
200
400
600
800
1000
1200
2006 2007 2008 2009 2010 2011 2012
Revenue OPM
Road Apartment
Office Building
Hotel Townhouse
Incineration Plant
Museum
10
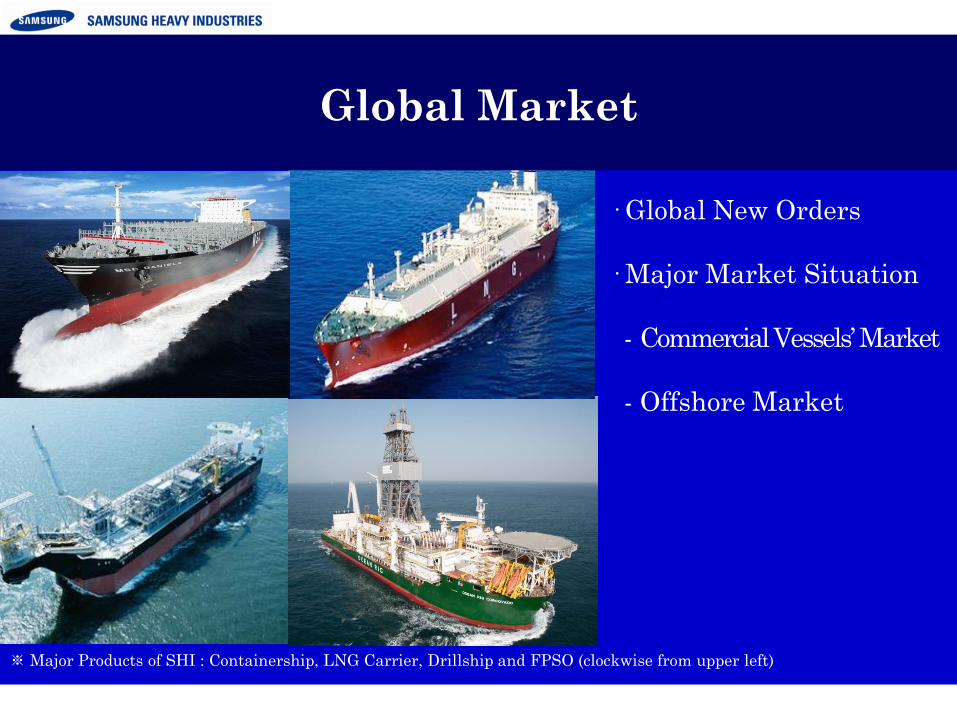
· Global New Orders
· Major Market Situation
- Commercial Vessels’ Market
- Offshore Market
※ Major Products of SHI : Containership, LNG Carrier, Drillship and FPSO (clockwise from upper left)
Global Market

-
20
40
60
80
100
120
140
160
180
'99 '00 '01 '02 '03 '04 '05 '06 '07 '08 '09 '10 '11 '12 '13.Mar
LNG Carrier
Containership
Tanker
Bulker
Other
11
(Mil. GT)
46
35
77 74 69
116
177
111
30
AVG : 36
30 31
AVG : 73
AVG : 135
Increasing sea trade volume coupled with Chinese effect had lead huge orders during 2003~2008.
After sharp decrease in 2009, new orders has been normalized at around 50mil. GT in average.
While the commercial market has been struggling, orders for specialized vessels such as Drillship and
LNG Carriers have been stable.
76
50
Historical Orders by Shiptype and Countries
Korea
China
Japan
Global New Orders
34
13
AVG : 53

1,660 1,670 1,740
3,240
1,170
90
580
1,780
450 300
-
500
1,000
1,500
2,000
2,500
3,000
3,500
'04 '05 '06 '07 '08 '09 '10 '11 '12 '13.Apr '14E '15E
New Orders 13
11
11
10
4
-9
12
8
4 6
7 8
9 10
13
17
14 13
6
10 11 10
4
1
-10
-5
0
5
10
15
20 Trade Growth
Fleet Growth
Commercial Vessels : A Gradual Recovery
12
Containership: Rebound in 2013 Source: Clarkson
Recovery
(,000 TEU) (%)
* Trade Growth (‘13~): Clarkson Forecast, Fleet Growth(‘13~): Current Fleet + Annual Supply – Annual Scrapping in Avg.
0
50
100
150
200
250
'08 '09 '10 '11 '12 '13 '14 '15 '16 '17 '18 '19 '20 0
20
40
60
80
100
'08 '09 '10 '11 '12 '13 '14 '15 '16 '17 '18 '19 '20
0
20
40
60
80
100
'08 '09 '10 '11 '12 '13 '14 '15 '16 '17 '18 '19 '20
Recovery Recovery Recovery
(Mil.DWT) (Mil.DWT ) (Mil.DWT)
* Supply: Current Fleet + Annual Delivery of Backlog – Annual Demolition in Avg. , Demand: Trading
Tankers: Slow Recovery by sizes
Supply
Demand Supply
Demand
Supply
Demand
< A-Max > < VLCC > < S-Max>

50
70
90
110
130
150
170
190
210
Korea Japan China
203
67 14 73
5 9
Delivery Backlog
LNG Demand & LNGC Fleet Forecast
13
Energy Consumption & LNG Trading
Source: BP
(Mil. Ton)
2.4 Bil.Ton (Consumption)
Pipeline
510 (68%)
Trading
753
(Mil.Ton, ’11)
LNG
243 (32%)
Source: BP, Andy Flower
Economical
Eco-Friendly
LNGC Global M/S
(Unit)
84% 6% 10%
Source: SHI, 2000~2013.Apr
LNG Carrier : Solid Demand
-
2,000
4,000
6,000
8,000
10,000
12,000
14,000
'00 '01 '02 '03 '04 '05 '06 '07 '08 '09 '10 '11
Oil (34%)
Natural Gas (24%)
Coal (30%)
Hydro Electricity(7%)
Nuclear (5%)
100 110
130 154
165
221
248 279
316
359
410
128 139 176
223
299
363
429 495
574
662
749
-
100
200
300
400
500
600
700
800
-
50
100
150
200
250
300
350
400
450
'00 '02 '04 '06 '08 '10 '12 '14F '16F '18F '20F
LNG Demand
LNG Fleets
(Mil. Ton) (Units)

14
LNG Production & Supply Chain
LNG Derivatives : Convergence of Technology & Business

15
LNG FPSO
Amount 5 Bil $/ vessel
(Subject to change)
Target Field Prelude (Australia)
Capacity 3.5 mtpa
Storage 450k cbm
Why LNG FPSO?
CAPEX Forecast for FLNG
Source: FLEX LNG
Natural Gas
Pre-Treatment
Liquefaction
Shell 1st LNG FPSO Project
LNG FPSO
Less CAPEX
[25%]
Mobility
[Easily Relocate]
Traditional Onland Plant
+
LNG FPSO Market – New Business Opportunity
0
3
6
9
12
15
18
21
'10 '11 '12 '13(E) '14(E) '15(E) '16(E) '17(E) '18(E) '19(E) '20(E)
(US$b)
* Construction started in 2012.Oct

Offshore Market – Why Deep Water?
Supply Increase in Deep Water
1930 1950 1972 1993 2007 2014 2030
Global Oil Supply 1930~2030 (Mil Barrels Oil/d)
Conventional Onshore
Deep Water
Shallow Water
Oil Sands
<Deep Water Supply Ratio>
‘00 ‘10 ’25(E)
2% 8.5% 13%
0
5
10
15
20
25
30
35
2000 2005 2010 2015F 2020F 2025F 2030F
shallow water
(mil. barrels oil/d) (mil. barrels oil/d)
16
14
12
10
8
6
4
2
0
Source: Douglas Westwood, 2011.May
Global CAPEX for Deep water
Global Oil Price Forecast
($/Barrel)
(110~160)
(90~110)
(70~90)
Source: EIA 16
Source: Douglas Westwood, Energyfiles
Shallow water
Deep water
-
20
40
60
80
100
120
140
160
2006 2007 2008 2009 2010 2011 2012 2013F 2014F 2015F
(US$b)
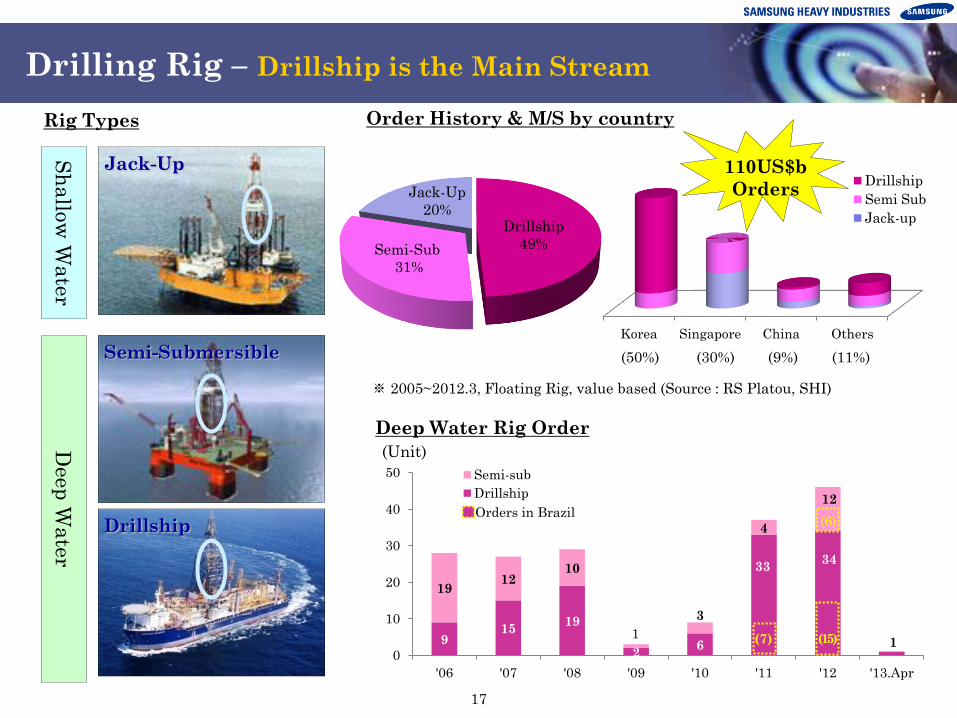
9 15
19
2 6
33 34
1
19 12
10
3
4
12
0
10
20
30
40
50
'06 '07 '08 '09 '10 '11 '12 '13.Apr
Semi-sub
Drillship
17
Jack-Up
Drillship
Semi-Submersible
Rig Types
Deep
Wate
r S
hallo
w W
ate
r
Order History & M/S by country
Jack-Up
20% Drillship
49% Semi-Sub
31%
※ 2005~2012.3, Floating Rig, value based (Source : RS Platou, SHI)
(50%) (30%) (11%) (9%)
110US$b
Orders
Deep Water Rig Order
Drilling Rig – Drillship is the Main Stream
Korea Singapore China Others
Drillship
Semi Sub
Jack-up
(Unit)
1 (7) (15)
(6) Orders in Brazil

Korea Singapore China Japan Others
Barge TLP
Semi FPSO
18
FPU
FPSO
Fixed Platform
Facility Types
Deep
Wa
ter
Sh
allo
w W
ate
r
FPSO 64%
Semi 17%
TLP 13%
Barge 7%
※ 1996~2012.3, Floating Facilities, number based (Source : IMA, Clarkson)
154 Units
Order
(44%) (28%) (2%) (14%) (12%)
Order History & M/S by Country
Production Facility – Following the Rigs
Order Forecast for Deep Water Production Facilities
Source: Douglas Westwood, 2012.Dec
2013(F) 2014(F) 2015(F) 2016(F) 2017(F)
Demand ( *) 31 20 12 22 24
Order Forecast 15 10 6 11 12
Amount(US$b) 23 14 8 16 17
*: New Construction 50%, Conversion 50%
(Unit)

19
· Technological Leadership
· Green Future
· Vision & Growth Strategy
· Appendix
※ Sakhalin Fixed Platform built by SHI
Future Strategy

20
Growing environmental awareness is creating eco-friendly product markets.
Innovative technology and shrinking oil reserves are triggering new arctic oil production era.
Increasing demand for new products provides SHI with new business opportunities.
Ice Drillship Icebreaking Tanker Ice Containership
Technological Leadership
LNG FSRU LNG FPSO LNG Fuelled Vessels

21
Green Future – A Chance for Better Marketing
* ‘90~’00 Avg : $90/ton Technological Development
* Hull Design & Structure
*Energy Saving Devices
Propeller Rudder Saver-Fin
- Beyond the EEDI requirements
- 10% ~ 22% improved fuel efficiency
- For both commercial & special vessels
Samsung “ GF ” launched in 2011
* A new brand to differentiate the technologies that
SHI provides
* More marketing chances in fuel-saving oriented
market * Fuel Efficiency 17% improved “GF” Drillship for Ensco

22
Vision 2020
Vision
Objectives
Business
Stream
Revenue : 31 Tril. KRW OP margin : ↑ 10%
Stable Growth Growth Engine
GLOBAL LEADER of OCEAN & POWER in 2020
Reinforcing Shipbuilding & Offshore business and expanding Heavy Electric Machinery business
to consolidate future growth
<LNG
FPSO>
<LNG Fuelled Vessel>
<Electricity Powered Vessel>
<Floaters>
<Subsea Plant>
<Offshore Wind Power >
<Converter, Inverter etc.>
Seeds for Future

Growth Strategy
Shipbuilding
Business Structure in 2020
Shipbuilding
(20%) Heavy Electric
Machinery
(30%)
Offshore
(50%)
Revenue
31 Tril. KRW
High End & Specialized Vessels with Eco-Friendly
and Innovative technologies
Optimized Global Production System
Shipbuilding Business
Improvement of Offshore Engineering abilities
Diversification related with Offshore Business (Subsea Etc.)
Offshore Business
Offshore Wind Power Business
Converter, Inverter Etc.
Automated Robots for special purposes
Heavy Electric Machinery Business
23
Subsea plants

24
Global production and engineering bases enable SHI to meet various needs for customers.
Block Factories
in China
Ningbo (Since 1997) – 250,000 tons in 2010
Rongcheng (Since 2007) – 300,000 tons in 2010
Offshore Engineering
Centers
Houston – ASOG (J/V with AMEC, SECL)
India – Basic Design Center
Appendix – Global Network
Oslo
London
Athens
Tokyo
Koje
Shipyard
Dubai
Rongcheng
Ningbo
Singapore
Houston
Malaysia
Houston
India
Moscow
Brazil
Lagos
Shanghai
New York
Shipyard
Block Factory
Engineering Center
Branch Office

25
■ Site 4.0million ㎡
■ Quay Wall Length: 7.9Km
Berthing Capacity: 24vessels
■ Dock 1 Dock : 283m x 46m
2 Dock : 390m x 65m
3 Dock : 640m x 98m
G1 Dock: 270m x 52m
G2 Dock: 400m x 55m
G3 Dock: 400m x 70m
G4 Dock: 420m x 70m
G5 Dock: 158m x 150m ( for offshore only)
Offshore Facilities
Dry Dock No.2
Floating Dock 3
Dry Dock No.3
Floating Dock 2
Floating Dock 4
Main Building
Dry Dock No. 1
Floating Crane
3,000 ton
3,600 ton
8,000 ton
ShinHanne Factory
Floating Dock 1
Appendix - Shipyard View
Floating Dock 5

26
This presentation has been prepared by Samsung Heavy Industries Co., Ltd. and
contains forward-looking statements, that are subject to risks, uncertainties, and
assumptions. The presentation is solely for your information, subject to change
without notice, and makes no representation or warranty, expressed or implied and no
reliability should be placed on the accuracy, fairness, or completeness of the information
presented herein. The Company, its affiliates or representatives accept no liability for
any losses arising from any information contained in the presentation.
The contents of this presentation may not be reproduced, redistributed or circulated,
directly or indirectly, to any other person or organization, or published, in whole or in
part, for any purpose.
Disclaimer