sampling of contaminants from product gases of biomass ... · keywords gasification, biomass,...
TRANSCRIPT

VTT TIEDOTTEITA – MEDDELANDEN – RESEARCH NOTES 1903
TECHNICAL RESEARCH CENTRE OF FINLANDESPOO 1998
Sampling of contaminantsfrom product gasesof biomass gasifiers
Pekka Ståhlberg, Maija Lappi, Esa Kurkela, Pekka Simell,Pia Oesch & Matti Nieminen
VTT Energy

ISBN 951–38–5297–0 (nid.)ISSN 1235–0605 (nid.)
ISBN 951–38–5298–9 (URL: http://www.inf.vtt.fi/pdf/)ISSN 1455–0865 (URL: http://www.inf.vtt.fi/pdf/)
Copyright © Valtion teknillinen tutkimuskeskus (VTT) 1998
JULKAISIJA – UTGIVARE – PUBLISHER
Valtion teknillinen tutkimuskeskus (VTT), Vuorimiehentie 5, PL 2000, 02044 VTT
puh. vaihde (09) 4561, faksi (09) 456 4374
Statens tekniska forskningscentral (VTT), Bergsmansvägen 5, PB 2000, 02044 VTT
tel. växel (09) 4561, fax (09) 456 4374
Technical Research Centre of Finland (VTT), Vuorimiehentie 5, P.O.Box 2000, FIN–02044 VTT, Finland
phone internat. + 358 9 4561, fax + 358 9 456 4374
VTT Energia, Uudet energiatekniikat, Biologinkuja 3–5, PL 1601, 02044 VTT
puh. vaihde (09) 4561, faksi (09) 460 493
VTT Energi, Nya energiteknologier, Biologgränden 3–5, PB 1601, 02044 VTT
tel. växel (09) 4561, fax (09) 460 493
VTT Energy, New Energy Technologies, Biologinkuja 3–5, P.O.Box 1601, FIN–02044 VTT, Finland
phone internat. + 358 9 4561, fax + 358 9 460 493
Technical editing Maini Manninen
Oy EDITA Ab, ESPOO 1998

3
Ståhlberg, Pekka, Lappi, Maija, Kurkela, Esa, Simell, Pekka, Oesch, Pia & Nieminen, Matti. Sampling ofcontaminants from product gases of biomass gasifiers. Espoo 1998, Technical Research Centre of Finland,VTT Tiedotteita – Meddelanden – Research Notes 1903. 49 p. + app. 46 p.
Keywords gasification, biomass, combustion products, gas sampling, air contaminants, environ-mental protection, air pollution
Abstract
Reliable sampling and analysis of products from biomass gasification are essential for thesuccessful process development and economical operation of commercial gasifiers. One ofthe most important and most difficult analytical tasks is to characterise the emissions fromthe gasifiers. This report presents a review of the sampling and analytical systemsemployed and developed when doing research on coal and biomass gasification. Inaddition to the sampling systems published in the literature, experiences obtained invarious biomass gasification R&D projects of VTT in 1985 - 1995 are described. Thepresent sampling methods used for different gas contaminants at VTT are also brieflypresented.
This report focuses mainly on the measurement of tars, nitrogen compounds and sulphurgases. Isokinetic and non-isokinetic sampling train systems are described and, in addition,special sampling apparatus based on liquid-quenched probe and gas dilution is brieflyoutlined. Sampling of tars with impinger systems and sampling of heavy tars with filtertechniques are described in detail.
Separate sampling of particulates is briefly discussed. From inorganic compounds thesampling systems used for H2S and other sulphur gases, NH3 and HCN and HCl arepresented. Proper storage of the samples is also included in the report.

4
Preface
This review on sampling of contaminants from biomass gasifiers has been preparedwithin the Gasification and Analytical Groups of VTT Energy. The literature review ofthe study was conducted in 1991 - 1994 as the Finnish contribution to the Thermal Gasi-fication of Biomass Activity of the IEA Bioenergy Agreement. This Activity was led byDr. Suresh P. Babu of Insititute of Gas Technology, U.S.A.
In addition to the sampling systems published in literature, the experiences obtained invarious biomass gasification R&D projects of VTT in 1985 - 1995 are described. Thepresent sampling methods used for different gas contaminants at VTT are also brieflypresented. As the literature review work was mainly conducted in 1991 - 1993, the mostrecent developments carried out elsewhere are not included in this study.
The work on this study was conducted within several gasification projects financed pri-marily by the Finnish Ministry of Trade and Industry (KTM) and the Technology De-velopment Centre Finland (Tekes) as well as by VTT Energy and the Finnish industry.
Espoo, March 1998
Authors
5
Contents
Abstract 3
Preface 4
1. Introduction 71.1 Biomass gasification effluents 71.2 Particulates 91.3 Tars 101.4 Nitrogen compounds 131.5 Other effluents (S, HCl, Metals) 13
2. Sampling systems 152.1 Introduction 152.2 Isokinetic sampling trains 152.3 Non-isokinetic sampling trains 182.4 Separate sampling of particulates 202.5 Sampling with a liquid-quenched probe 212.6 Sampling using gas dilution 23
3. Sampling of tars 253.1 Impinger systems 253.2 Sampling of polyaromatic compounds 273.3 Other systems 29
4. Sampling of inorganic compounds 314.1 Sampling of H2S and other sulphur gases 314.2 Sampling of NH3 and HCN 344.3 Sampling of HCl 36
5. Storage of samples 38
6. Conclusions and suggestions 39
References 42
Appendix A: Gas samples, sampling. Sampling linesAppendix B: Tar samples, samplingAppendix C: Heavy tar samples, samplingAppendix D: Tar samples, analysis

6
7
1. Introduction
Reliable sampling and analysis of products from biomass gasification are essential for thesuccessful process development and economical operation of commercial gasifiers. One ofthe most important and most difficult analytical tasks is to characterise the emissions fromthe gasifiers. This report presents a review of the sampling systems employed anddeveloped when doing research on biomass and coal gasification. It focuses mainly on themeasurement of tars, nitrogen compounds and sulphur gases. Sampling of particulates andother types of effluents is only briefly outlined.
1.1 Biomass gasification effluents
When biomass or other solid fuels are gasified to produce a gaseous fuel, gas impurities ofdifferent types are also formed. These effluents may cause problems in downstreamprocess equipment or they may be environmentally harmful. The effluents can be dividedinto the following categories:
• Particulates entrained from the gasifier• Low- and high-molecular-mass organic compounds (tars)• H2S, COS and other sulphur gases• NH3, HCN and other nitrogen-containing impurities• Other gaseous impurities such as HCl and vapour-phase metals (alkali and heavy
metals).
The wide variety of biomass fuels includes feedstocks of different types from very cleanwoody biomass to more problematic waste materials containing considerable amounts ofnitrogen and/or sulphur, as can be seen from Table 1, which shows compositions typical ofsome selected biomass types. Some agricultural residues and wood wastes also containhigh amounts of chlorine. Generally biomass feedstocks are low-sulphur fuels with a muchhigher volatile matter content than in the coal grades. Hence, the formation of gaseouseffluents in biomass gasification is highly dependent on the decomposition of thevolatilisation products in gasification processes.
Different types of gasifiers have been constructed for experimental and commercial use.Most of the gasifiers fall in four categories based on the contact type of the feedstock andon the gasification agent. The four main types are: 1) fixed-bed updraft, 2) fixed-beddown-draft, 3) fluidised-bed and 4) entrained-flow. The yields of tars, particulates andother effluents depend greatly on the gasifier type. The basic types of gasifiers are shownschematically in Figure 1.

8
Table 1. Examples of ultimate analyses for selected biomass materials and peat (wt% drybasis) (Baker 1986, Simell et al. 1994, Wiltsee 1992, Saviharju 1990).
Material C H O N S AshPine saw dustPine barkBlack liquor1
PoplarWheat strawS. cane bagasseRice husksLow-mire peat
50.254.539.049.548.545.937.854.5
6.15.94.05.96.45.74.75.6
43.437.033.443.640.242.933.633.6
0.10.30.10.50.71.70.21.8
0.0 0.054.50.00.10.00.30.2
0.21.7
190.54.13.8
23.44.3
1 Spent pulping liquor (ash = sodium content)
Figure 1. Schematics of the basic gasifier types.
GAS
SLAG
FUEL OXYGEN& STEAM
ENTRAINED BED
DRYING
PYROLYSIS
GAS
AIRAIR
FUEL
DOWNDRAFT
DRYING
REDUCTIONOXIDATION
PYROLYSIS
GAS
AIR
FUEL
UPDRAFT
FUEL
AIR
GAS
ASH
FLUIDIZED BED
REDUCTION OXIDATION

9
In the fixed-bed updraft gasifier, the fuel is fed from the top and it flows down slowlythrough drying, pyrolysis, gasification and combustion zones. Gasification agents (air/O2
and steam) are introduced from the bottom and the product gas is removed from the top ofthe gasifier. This counter-current flow of fuel and gas together with a long feedstockresidence time and low gas velocities result in product yields and composition that arecompletely different from those of any other gasifier types. One advantage of the fixed-bedgasifier is the low entrainment of particulates, since the fuel has to be mainly piece-shapedand the gas velocities are low. On the other hand, the pyrolysis products and fuel moistureare drawn more or less directly into the product gas without thermal decompositionreactions. This results in much higher concentrations of condensable tars and oils in theproduct gas than in other types of gasifiers. Since the product gas temperature is generallyvery low (70 - 300 °C), the bulk of pyrolysis organics is present as tar aerosols, which setslimits to the usability of product gas of this type. For this reason, the reliable sampling andanalysis of the effluents from the updraft gasifier is also a more challenging task than inother types of gasifiers.
In the other types of gasifiers, the tar formation temperature is generally much higher thanin updraft gasification and consequently, the pyrolysis products are thermally decomposedto yield a different gas composition. After thermal decomposition, most of the tars leavethe gasifier in a gas phase, which makes it easier to separate particulates from othereffluents in sampling systems. However, these gasifiers also produce a wide variety oforganic compounds from light oils to high-molecular-weight polyaromatic hydrocarbons,and careful and well designed sampling strategies are required for the reliable analysis ofgasifier effluents. The particulate loading in fluidised-bed and entrained-flow gasifiers isgenerally higher than that in fixed-bed gasifiers, which normally means that efficientparticulate filters are also needed in all sampling trains designed for collecting gaseousimpurities.
1.2 Particulates
The particulate emissions of gasifiers vary a lot depending on numerous factors, includingthe type of the gasifier, feedstock properties and gasifier operation conditions. Hence, nogeneral figures for particulate emissions can be given. However, typical ranges for fixed-bed and fluidised-bed gasifiers, which are the main gasifier types used for biomassgasification, are shown in Figure 2.
The size of particulates carried out with the product gas depends primarily on gas velocity,gasifier type and feedstock properties. Quite large particles (of the order of 100 microns)can be elutriated from the fluidised-bed reactors, while the particles escaping from correct-ly operating fixed-bed gasifiers are much smaller. However, the fluidised-bed gasifiers arenormally equipped with cyclones, which separate most of the larger particles. From

10
cyclones the particles are returned back to the gasifier. Thus, the main particle size afterthe recycling cyclone(s) of the fluidised-bed gasifier is generally less than 10 microns.
Particulates from gasifiers of different types are comprised of inorganic constituents of thefeedstock, partly converted or unconverted feedstock and soot. There may be greatvariations in the particle size and density as well as in other properties of particles ofdifferent origin, which creates some problems to be handled in particulate sampling andseparation. In updraft gasifiers, the particulate sampling gives a mixed sample composedof 'real' particulates and tar aerosols, and it is rather difficult to separate these from eachother.
1.3 Tars
Tar that is formed in gasification is a complex mixture of organic compounds rangingfrom light compounds like benzene to heavy polyaromatic hydrocarbons. Formationconditions affect the tar composition resulting in variation of the composition of tar indifferent processes. Thus quite a number of different meanings can be offered for thedefinition of 'tar'. It can refer to a sum of components with boiling points higher than150 °C (Brown et al. 1986) or it can be based on vacuum evaporation residue obtained at50 °C and 2 kPa (Brage et al. 1996). The sampling and analytical systems used for tarcharacterisation have also varied from simple "colour of the cotton wool" type of methods(Walawender et al. 1985) to sophisticated and complicated systems, by which differentcomponents from light oils to high-molecular-weight PAH components can be collectedand analysed (Brage et al. 1996).
Different levels of information on tars are required for different purposes. Most detailedinformation, including all compounds, is needed in scientific research and often also inorder to calculate accurate elemental material balances for gasifiers. On the other hand,only the concentrations of heaviest tar compounds have to be determined when evaluatingpotential problems in using product gas in applications which do not require cold gascleaning steps. In the gasification research of VTT (Kurkela et al. 1993), benzene isusually presented separately as it stays in the gas phase in the majority of potentialapplications of biomass gasification. Compounds heavier than benzene are usually dividedinto light oils, naphthalene and tar compounds heavier than naphthalene. In this report, thegeneric term tar is used for the sum of organic compounds from benzene (C6H6) to high-molecular-weight components.
The temperature at which fuel pyrolysis takes place has a very pronounced effect on tarcomposition and accordingly tars can be divided to low- and high-temperature tars(Aristoff et al. 1981, McNeil 1981). Low-temperature tar is formed at temperatureslower than about 650 °C and it is composed mainly of components that are primary

11
decomposition products of the fuel structure (Aristoff et al. 1981). Hence, the feedstockused has a strong influence on the composition of low-temperature tar (Aristoff et al.1981). High-temperature tar in turn refers to a high temperature of tar formation typicalof fluidised-bed and downdraft gasifiers and is composed of mono-and polyaromaticcompounds formed mainly in secondary reactions of the primary pyrolysis products offuel (McNeil 1981).
Each type of gasifier has different reaction conditions and, consequently, different tarcompositions and production yields. Figure 2 presents typical tar loadings in biomassgasifiers as reported by Brown et al. (1986). The updraft fixed-bed gasifier generates ahigh yield of tar, which is a mixture of the original low-temperature-pyrolysis products andmore thermally processed products from the lower parts of the pyrolysis zone. Typical tarconcentrations in updraft gasification range 100 - 200 g/m3, i.e., about 20 wt% of the inputcarbon of the wood is converted into liquids. The gas outlet temperature generally ranges70 - 300 °C. At these temperatures, the tars mostly appear as condensed droplets in the gasphase. In updraft gasification the gas condensate sample is divided into two liquid phases:an aqueous phase containing very oxygenated, water-soluble organic compounds, and aseparate heavy organic tar phase containing components typically found in the "settled tar"from charcoal manufacture. The lighter aqueous phase is highly acidic and contains a largeamount (20 - 25 wt%) of dissolved organic material much like "pyroligneous acid".
Figure 2. Typical particulate and tar loadings in biomass gasifiers (Brown et al. 1986). Inthis figure, tar refers to compounds boiling higher than at 150 °C.
CONCENTRATION mg/m³
1 000
Fixed BedUpdraft
Fixed BedDowndraft
Fluid Bed
Entrained Bed
10010
ParticulatesTar
10 000 100 000
n

12
Tar formation temperature is high in down-draft and fluidised-bed gasifiers, which usuallygenerate relatively low amounts of tar (content < 20 g/m3). These tars are mainly in the gasphase at the gasifier outlet temperatures. In a correctly operating down-draft gasifier thepyrolysis products pass through a hot char containing combustion zone, in which the tarsare cracked thermally and oxidised. In theory, the organic vapours from down-draftgasifiers should be decomposed totally, while in practice the amount of tars is mainly afunction of the temperature, the efficiency of the combustion zone and the channelling ofthe bed. The fluidised-bed gasifiers operate almost isothermally. The high temperature(700 - 1 000 °C) and the good gas-solid contact result in partial cracking of the tarrypyrolysis products. The final tar concentration with a particular feedstock is a function ofreaction temperature, pressure and residence time.
Table 2 shows an example of the biomass tar characterisation results obtained by Elliott(1983, 1985, 1986, 1987), who analysed tar condensates from different biomass gasifica-tion and pyrolysis plants. Elliott found out that the tar compositions are a continuous chainfrom an oxygenated "pyrolysis tar", obtained with a short contact time at 500 °C, to ahighly aromatic oxygen free "high-temperature tar". The more severe the reactionconditions (high temperature and high pressure), the more aromatic the tars. The tarmeasurements of VTT made in the pressurised fluidised-bed PDU gasification tests withvarious fuels (at 5 - 7 bar) showed that at temperatures above 850 oC, the tars are almostentirely composed of aromatic compounds (Kurkela 1996).
Table 2. Results of the biomass tar characterisation. (Elliott 1985, 1986, 1987).
Fluidised bed/Entrained flow Updraft Downdraft
480 °C 880 °C Tar Aqueous Tar AqueousCarbon, % 52.7* 84.0* 70.9* 11.3 67.2* - 0** 7.0 - 0.5Hydrogen, % 6.2 5.7 7.2 - 5.8 - 0 -Oxygen, % 40.5 8.7 21.7 - 25.0 - 0 -Ash, % 0.6 1.6 0.2 0.1 2.0 - 0 1.4 - 0.02pH - - - 2.1 - 3.0 - 5.3Viscosity, cps 220 - 1 300 9 800 - 26 800 410 - 7 500 - 41 000 -
@ 40 °C @ 51 °C @ 40 °C - @ 78 °C -Moisture, wt-% 16.00 20 - 28 8.00 - 12 - 13 -Density, g/ml 1.26 -1.28 1.14 - 1.16 1.13 - 1.16 -
* elemental and ash analyses for tars are reported on a dry basis** downdraft gasifiers may or may not produce a separate tar phase depending on the
specific operation
13
1.4 Nitrogen compounds
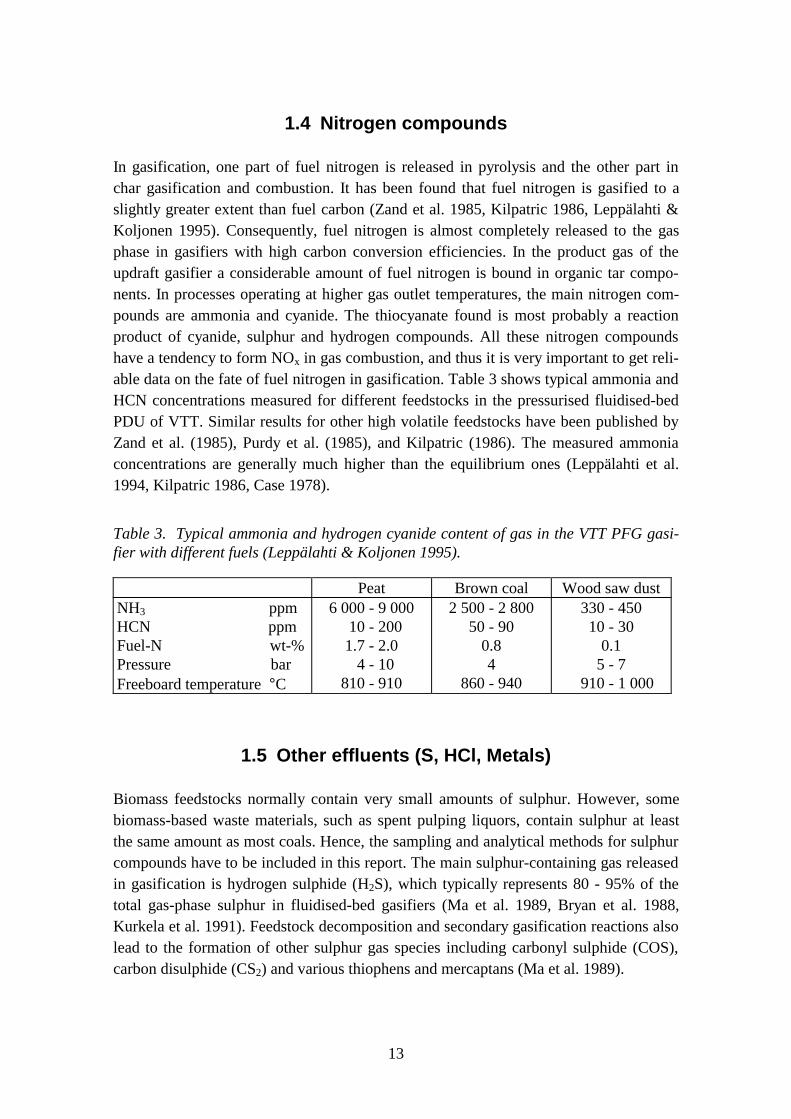
In gasification, one part of fuel nitrogen is released in pyrolysis and the other part inchar gasification and combustion. It has been found that fuel nitrogen is gasified to aslightly greater extent than fuel carbon (Zand et al. 1985, Kilpatric 1986, Leppälahti &Koljonen 1995). Consequently, fuel nitrogen is almost completely released to the gasphase in gasifiers with high carbon conversion efficiencies. In the product gas of theupdraft gasifier a considerable amount of fuel nitrogen is bound in organic tar compo-nents. In processes operating at higher gas outlet temperatures, the main nitrogen com-pounds are ammonia and cyanide. The thiocyanate found is most probably a reactionproduct of cyanide, sulphur and hydrogen compounds. All these nitrogen compoundshave a tendency to form NOx in gas combustion, and thus it is very important to get reli-able data on the fate of fuel nitrogen in gasification. Table 3 shows typical ammonia andHCN concentrations measured for different feedstocks in the pressurised fluidised-bedPDU of VTT. Similar results for other high volatile feedstocks have been published byZand et al. (1985), Purdy et al. (1985), and Kilpatric (1986). The measured ammoniaconcentrations are generally much higher than the equilibrium ones (Leppälahti et al.1994, Kilpatric 1986, Case 1978).
Table 3. Typical ammonia and hydrogen cyanide content of gas in the VTT PFG gasi-fier with different fuels (Leppälahti & Koljonen 1995).
Peat Brown coal Wood saw dustNH3 ppmHCN ppmFuel-N wt-%Pressure barFreeboard temperature °C
6 000 - 9 000 10 - 2001.7 - 2.0 4 - 10
810 - 910
2 500 - 2 80050 - 90
0.84
860 - 940
330 - 45010 - 30
0.15 - 7
910 - 1 000
1.5 Other effluents (S, HCl, Metals)
Biomass feedstocks normally contain very small amounts of sulphur. However, somebiomass-based waste materials, such as spent pulping liquors, contain sulphur at leastthe same amount as most coals. Hence, the sampling and analytical methods for sulphurcompounds have to be included in this report. The main sulphur-containing gas releasedin gasification is hydrogen sulphide (H2S), which typically represents 80 - 95% of thetotal gas-phase sulphur in fluidised-bed gasifiers (Ma et al. 1989, Bryan et al. 1988,Kurkela et al. 1991). Feedstock decomposition and secondary gasification reactions alsolead to the formation of other sulphur gas species including carbonyl sulphide (COS),carbon disulphide (CS2) and various thiophens and mercaptans (Ma et al. 1989).

14
Some biomass feedstocks are also abundant in chlorine, which is released mainly as HClin gasification. Especially some heavily fertilised agricultural residues (straw) may con-tain as much as 0.5 wt% of chlorine. Very little data is published on typical HCl con-centrations in biomass gasification. Aqueous phases from different biomass gasifiershave been found to contain 8 - 44 ppm of chloride (Elliott 1986). Hardwood tar from theBCL fluidised-bed PRU gasifier has contained 110 ppm of chlorine (Elliott 1985).Concentrations peaking up to 90 ppm HCl in gasification gas have been reported bySimell et al. (1996).
The heavy metal contents of biomass feedstocks are generally very low compared tothose of coal or peat. However, the biomass raw materials often contain relatively highamounts of alkali metals, which are potential sources for high-temperature corrosion ingas treatment lines and gas turbines. Part of the alkali metals are released to the gasphase in gasification and part of them stay in condensed phase and are removed with theparticulate removal or with the bottom ash. Sampling of the sub-ppm concentrations ofvapour-phase alkali metals from hot product gases is a problematic task and is not han-dled in this report. Information can be found from publications by Kurkela et al. (1993),Mojtahedi et al. (1987, 1990), Ciliberti (1984), Haas et al. (1984), Ma et al. (1989) andHäyrinen & Hernberg (1996).

15
2. Sampling systems
2.1 Introduction
The greatest difficulties in sampling in gasification processes are commonly related,according to VTT’s experience, to the separation of particulates, water and tars in thesystem. In general, three different phases are formed: 1) solid particulate matter, 2) tar and3) water phase, all more or less mixed with each other in the different parts of thesampling facility. To get a complete tar analysis every phase has to be treated withsolvents.
The problems related to the separation of tars from the particulates and to the blocking ofthe sampling lines due to tar condensation can be minimised by considering the followingaspects:
1. The sampling probe for tars should be constructed preferably after some particulateremoval equipment (e. g., after process cyclones).
2. The final particulate removal from the sample gas should be carried out preferably atthe process temperature with a ceramic filter positioned at the tip of the probe [SiC is asuitable material, since it has very little or no catalytic effects on tar decomposition(Simell et al. 1994)]. This method is suitable for high-temperature sampling tasks,where the tars are completely in gas phase.
3. An isokinetic sampling is needed for low-temperature sampling points, where part ofthe tars are as aerosols in the gas. Then, the sampling system should be designed so thatall parts can be washed by a proper solvent.
4. A continuous gas flow and heating is necessary in the sampling systems for biomassgasification tars.
5. Blocking problems can be minimised by using two parallel sampling lines equippedwith facilities for purging and solvent washing.
2.2 Isokinetic sampling trains
Most of the sampling methods used in the gasification research and development projectsin different parts of the world originate from the different versions of the EPA Method 5,illustrated in Figure 3 (EPA 1979, 1983, 1987). This method was originally designed forsampling particulate emissions from combustion flue gases. In addition to particulatesampling, this method is used for collecting gas and organic liquid samples from stackgases. Several modifications have to be done, when this method is used in differentbiomass gasification systems. For example, a cyclone pre-separator for particulates is often

16
Figure 3. The standardised EPA method for collecting particulates from combustionstack gases (EPA 1983).
needed to reach long enough sampling times without blocking the filter or the samplinglines. The concentrations and vapour pressures of tars are often several orders ofmagnitude higher in biomass gasification than in combustion flue gases. That is why thetemperature of the probe and the filter must often be higher in gasification applicationsthan in the standard EPA method.
The EPA Method 5 has been the basis for the Canadian (McDonald et al. 1983, Esplin etal. 1985) and American systems (Freeburn & Houck 1989) for comprehensive sampling ofbiomass gasifiers. By these systems, particulate, condensate and gas samples can be taken.The major modifications to the standardised procedures are hot gas flow measurementwith a heated orifice, a pre-separator cyclone for particles removal and an additionalbackup resin trap for trapping the most of the volatiles (Freeburn & Houck 1989). Theadvantage of the hot orifice meter is that the isokinetic rate at the probe nozzle is moreeasy to adjust, because gas moisture is not removed. For a successful flow measurement,however, the conventional orifice meters require relatively constant flow conditions andsufficient flow rates. These may be sometimes difficult to attain, if gasifier streams arefluctuating or variable or if there are liquid impingers on line. Neither does the 0-probeused in sampling of particulates work well with inferior sample flows.
The protocol initially developed in the Canadian ENFOR project (ENFOR 1983,McDonald et al. 1983, Esplin et al. 1985) has been successfully used for isokinetic
THERMOMETERS
PROBE
STACKWALL HEATED
AREA
FILTERHOLDER
IMPINGER TRAIN OPTIONAL MAY BE REPLACEDBY AN EQUIVALENT CONDENSER
THERMOMETERCHECKVALVE
VACUUMLINEICE BATHIMPINGER
VACUUMGAUGE
MAINVALVE
BY-PASSVALVE
ORIFICE
DRY TESTMETER
AIR - TIGHTPUMP
REVERSE TYPEPITOT TUBE
17
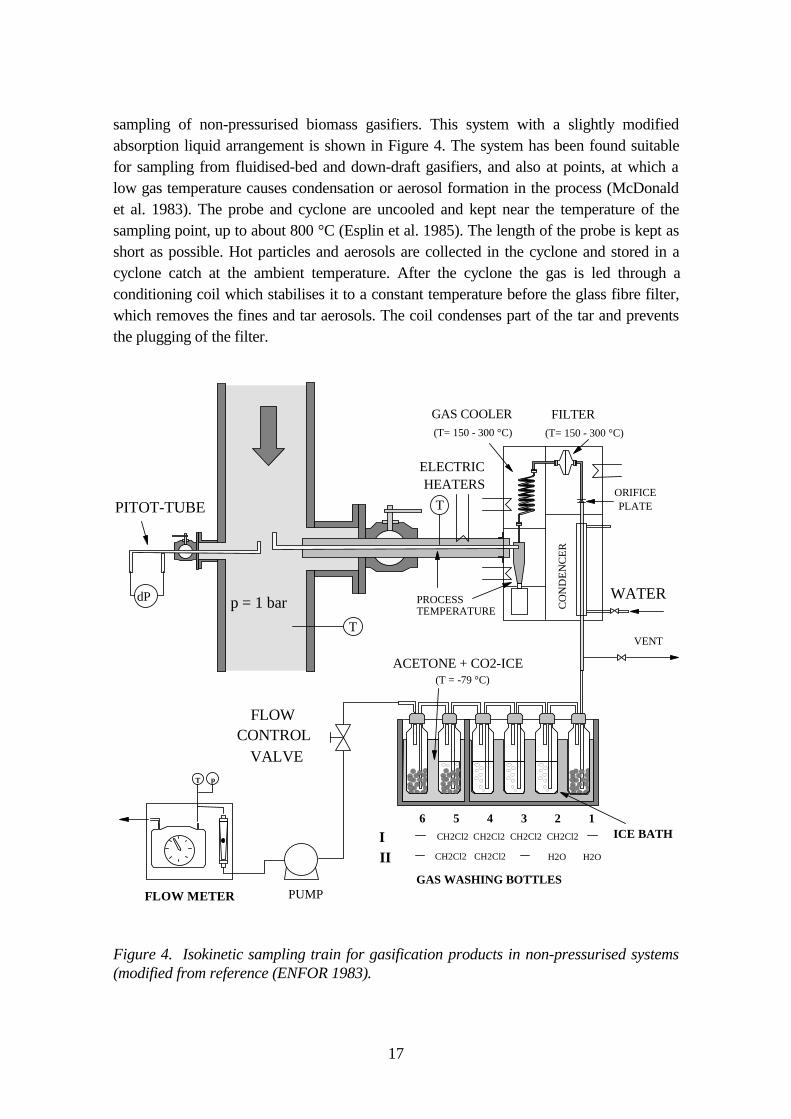
sampling of non-pressurised biomass gasifiers. This system with a slightly modifiedabsorption liquid arrangement is shown in Figure 4. The system has been found suitablefor sampling from fluidised-bed and down-draft gasifiers, and also at points, at which alow gas temperature causes condensation or aerosol formation in the process (McDonaldet al. 1983). The probe and cyclone are uncooled and kept near the temperature of thesampling point, up to about 800 °C (Esplin et al. 1985). The length of the probe is kept asshort as possible. Hot particles and aerosols are collected in the cyclone and stored in acyclone catch at the ambient temperature. After the cyclone the gas is led through aconditioning coil which stabilises it to a constant temperature before the glass fibre filter,which removes the fines and tar aerosols. The coil condenses part of the tar and preventsthe plugging of the filter.
Figure 4. Isokinetic sampling train for gasification products in non-pressurised systems(modified from reference (ENFOR 1983).
ACETONE + CO2-ICE
ELECTRICHEATERS
dP
PITOT-TUBE
FILTER
CO
ND
EN
CE
R
WATER
PUMP
CONTROLVALVE
FLOW
GAS COOLER
p = 1 bar
(T= 150 - 300 °C) (T= 150 - 300 °C)
VENT
PROCESS TEMPERATURE
(T = -79 °C)
ORIFICEPLATE
ICE BATH
GAS WASHING BOTTLES
123456
CH2Cl2 H2OCH2Cl2
CH2Cl2CH2Cl2 CH2Cl2CH2Cl2III H2O
FLOW METER
T p
T
T

18
If the filter temperature can be kept high enough the pre-condensation of gas might not benecessary. In a closely similar atmospheric-pressure sampling system (Freeburn & Houck1989) the probe is controlled via an external water cooling to allow long periods ofsampling at high temperatures. Hence, the gas temperature is lowered already in the probeand is not maintained close to the process conditions. A mildly heated cyclone and aheated quartz fibre filter (about 175 °C) are positioned after the probe. This relatively low-temperature arrangement may lead to premature condensation of tar on surfaces of theprobe and the cyclone.
In most processes tar condensation cannot be avoided after the temperature letdown. Thelower the filter temperature the higher the tar accumulation rate. The temperature of thefilter is critical and has to be chosen as high as possible to prevent filter plugging causedby the tar build-up, but low enough to prevent further reactions of tar on the filter surface.Consequently, temperatures from 150 to 300 °C have been used. In the applicationsmentioned earlier they have been in the range 160 - 200 °C (Esplin et al. 1985, Mann etal. 1985, Freeburn & Houck 1989, Ellman et al. 1979), whereas VTT has used tempera-tures in the range of 200 - 300 °C (Kurkela et al. 1993).
The use of the sampling system shown in Figure 4 for collecting tars from biomassgasification is somewhat tedious, since tars partly condense in the coil, partly are collectedby the filter and finally collected into a solvent. All parts of the sampling system have tobe carefully washed by the solvent after each sample.
2.3 Non-isokinetic sampling trains
The sampling strategy generally used for high temperature gasifiers is based on separatesampling of particulates and gaseous effluents (Pochan & Massey 1978, Piernock 1979).Isokinetic sampling with realistic probe dimensions requires, even at ambient pressures,very high flow rates, e.g., 25 - 30 dm3
n/min. Especially high flow rates are needed inpressurised systems to maintain isokinetic conditions and this is unpractical for impingersampling using liquids. Therefore, a non-isokinetic sampling arrangement shown in Figure5 has been used for condensables from pressurised systems at temperatures above thecondensation point, e.g., > 450 °C. Systems of this kind have been widely used forsampling organic and inorganic constituents from pressurised coal gasification streams(see, e.g., Pochan & Massey 1978, Piernock 1979).
In non-isokinetic sampling the alignment of the probe in relation to the gas flow as well asthe shape of the probe nozzle can be designed more freely to prevent the nozzle fromblocking. This is important, since the probe cannot be removed from the gas line duringpressurised operation. The probe is headed either along with the flow or positioned at an90° angle to it. Both straight-ended nozzles and those angled at 45° are used (Page 1978,Mayer et al. 1979). The sampling line is heat-traced at the process temperature over the

19
Figure 5. A non-isokinetic sampling train for high temperature gasification applicationsand pressurised systems: a) filter in the source, b) filter at a reduced temperature.
A) FILTER " IN THE SOURCE"
B) FILTER "OFF THE SOURCE"
PURGE(nitrogen)
CONTROL VALVESHUT-OFF
VALVE
T
T
ELECTRICHEATER
CERAMICFILTER
p > 1 bar
P
TP
VENT
PRESSURE LET DOWN
200 - 400 °C
T= 150 - 200 °C
PTFE -TUBE
PURGE(nitrogen)
SHUT-OFFVALVE
T
T
ELECTRICHEATER
T
ELECTRICHEATER
FILTERCATCH
p > 1 bar
P P
VENT( T= 150 - 300 °C )
PROCESS
CONTROLVALVE
PRESSURE LET DOWN
ACETONE + CO2-ICE(T = -79 °C)
ICE BATH
GAS WASHING BOTTLES
1 2 3 4 5 6
CH2Cl2H2O CH2Cl2
CH2Cl2 CH2Cl2CH2Cl2 CH2Cl2III H2O
Tp
FLOW METER
ELECTRICHEATER
TEMPERATURE
PURGE(nitrogen)
GAS WASHING BOTTLES

20
pressure relief valve, after which it is cooled for the fibre filter and impingers. Theimpingers are the same as in the isokinetic sampling train.
In the non-isokinetic systems improvements were made for reducing the accumulation ofparticles and tar on the sampling lines and on the filter. This was first accomplished byreplacing the cyclone, the cyclone catch and the ceramic or glass fibre filter of thesampling line with a ceramic primary filter straight inside the unit and at the processtemperature, as seen in Figure 5. The unpractically large and complex surface areas for thetar to stick were also minimised by removing the gas conditioning coil present in theisokinetic sampling train. The sampling line was thus made more compact and short. Afterthe filter and before the absorption bottles the gas is quenched in a heat exchanger and ledthrough a series of impingers containing proper absorption liquids. The condensing unit iswashed with the same liquids.
The ceramic filter can be equipped with a pressurised reversed flow N2 purging to cleanoff the cake of particles. In process conditions with a very high loading of solids, e.g.,when lime/dolomite is used for sulphur removal, an impermeable cake may block thisfilter surface too quickly. In such cases the 'filter in the source' method has to be replacedwith the conventional combination of cyclone and secondary filter for the removal ofparticles (Figure 5).
2.4 Separate sampling of particulates
Sampling arrangements for particulates from atmospheric pressure producer gas systemsfollow typically the principles of the EPA methods described in section 2.2. In order to getreliable results particles must be sampled at an isokinetic flow rate. From non-pressurisedgasifiers particles and condensables can be usually sampled simultaneously with only oneprobe but in pressurised systems the most practical arrangement is based on two samplinglines: one isokinetic and one non-isokinetic line. In the PDU-scale pressurised fluid-bedgasification tests of VTT (Kurkela et al.1993) the particulates were sampled from twopoints of the product gas line: the first point was located directly after hot cyclones and theother after the ceramic filter unit. Sampling is carried out with an 0-probe (balancedpressure) type system (Figure 6). When the sample is taken from a pressurised gas stream,in which the solids content is high, the straight 0-type probe has been found to operatemost reliably. The O-probe technique described above has been commonly used forsampling particulates (Nguyen et al. 1989, Narjes 1964, 1965). The particulate sample iscollected on a quartz-fibre filter placed in a heated casing. The temperature of the samplefilter is kept in the range of 200 - 300 °C during sampling that lasts typically 1 - 3 minutesat the first sampling point (after the second cyclone) and 5 - 60 minutes after the ceramicfilter vessel.

21
Figure 6. Isokinetic sampling probe (0-probe) for measuring particulate concentration.
Each sample filter is weighed both before and after the sampling and the difference is usedto calculate the particulate concentration. Before weighing the sample filters are dried at110 °C for two hours and cooled to ambient temperature in an exsiccator.
Selected particulate samples after the ceramic filter are also analysed for solubles. Thesample filters are extracted in dichloromethane to determine the amount of tars in thesample. A general problem of this type of extractive particulate sampling is that part of theparticles collected by the sample filter may have been in gaseous form in the product gas.This has turned out to be especially problematic in biomass gasification at the secondsampling point located after the ceramic filter. At this point the concentration of "real"particulates is of the order of 10 mg/m3
n or less, while the amount of heavy tars may beeven higher that 1 000 mg/m3
n. Part of these tars condense on the sample filter and theymay also polymerise creating soot particles in the sampling probe or on the filter. Inaddition, part of the heaviest tar compounds are insoluble in dichloromethane. This type ofproblem is typical of biomass gasification only, while the tar concentrations in coalgasification are so low that similar problems do not exist (Kurkela et al. 1993). The 0-probe technique described above has been commonly used for sampling of particulates(Nguyen et al. 1989, Narjes 1964, 1965).
2.5 Sampling with a liquid-quenched probe
Instead of the conventional sampling train with liquid impingers and a considerabledistance between the 'source' and the trapping solution, a sampling probe based on acontinuously flowing liquid introduced right to the gas exit could in principle be used forinorganic as well organic effluents. This type of system called "Liqued Quenched Probe"was developed at the International Flame Research Foundation for collecting NH3 andHCN from combustion gases without the fear of secondary reactions in the probe and in
SHUT-OFFVALVE
dP = 0
P(static)2
P(static)2P(static)1
P(static)1 P(static)2
T T
QUARTZ FIBRE FILTER
HEATING
T= 200 - 300 °C
dP

22
the sampling lines (IFRF 1987). The principle can also be applied to other inorganic gasspecies, like H2S, HCl, as well as to organics provided that they are trapped quantitativelyin the chosen liquid. In the IFRF system the sampling rate of the gas was 3 - 3.5 dm3/minand the trapper solution flow rate about 0.08 dm3/min. A filter was located at the inlet sideof the trapper solution line to prevent recycling of solids to the probe tip and obviatingblockages. The solution (with particles) passed into a sample container. If necessary thesolution was recycled to obtain a sufficient concentration for analysis. The total volume ofgases extracted was measured using a positive displacement gas meter.
Corresponding sample probe systems operating at a liquid quenching principle have alsobeen utilised in making a total gas, liquid, and solid sample collection from coalgasification and combustion processes (Smoot & Hedman 1979, Price et al. 1983,Burkinshaw et al. 1983).
One possible arrangement, which can also be used in pressurised gasifiers, is shownschematically in Figure 7. In this application the hot raw gas is filtered at the source by aSiC filter and the particle-free sample gas is quenched by the solvent solution. This type ofprobe might be very applicable in sampling high-molecular-weight tars, which are difficultto collect without any potential for probe reactions. The absorption liquid should be anorganic solvent that has a relatively high boiling point and a low vapour pressure andshould be thermally stable. The development of the 'tar' probe would, however, requireconsiderable experimental work on different solvents and in variable conditions.
Figure 7. A principle of the Liquid Quenched Probe [modified from IFRF (1987)].
CERAMICFILTER
GAS IN
GAS IN
COOLING WATER IN
SAMPLE FLOW OUT
TRAPPER SOLUTION IN
PUMP
CIRCULATING
TRAPPER SOLUTION
PUMPGAS OUTLET
COOLING WATER OUT
VOLUME FLOW METER
T p
23
This method has also been tested at VTT by using a sampling apparatus constructedaccording to Figure 7. It was constructed in connection to the pressurised fluidised bedgasifier test rig. The total flow rate of the sample gas was 5 - 6 dm3
n/min and the flow rateof the solvent (CH2Cl2) was 13 - 20 ml/min. Liquid samples of 1 dm3 in size wereobtained and they were analysed by GC as normal tar samples. Promising initial resultswere obtained indicating that tar main components were trapped as reliably as with thereference method shown in Figure 5. However, the development work was not continuedmainly because the reliability of the ordinary and more simple methods (Figure 5) wasfound to be high enough in the studied high-temperature gasification application and therewas no real need for this more sophisticated method.
2.6 Sampling using gas dilution
Conventional stack and exhaust sampling trains occasionally use gas dilution to preventthe condensation of high-molecular-weight compounds before the sampling point (EPA1987). After dilution the condensables are collected on a glass fibre filter at a reducedtemperature (Williams 1990).
Raw gas dilution has also been tried for sampling coal gasification gases (Hanson et al.1982, Newton et al. 1979). The product gas was mixed with dry nitrogen by a radiallyinjected diluter to yield an aerosol. For particle and vapour-phase collection the diluted gaswas led through a glass fibre filter and a Tenax GC polymer adsorbent at a flow rate of12 dm3/min. No evaluation of the operation has been presented. Supposedly, this methodis suitable for relatively clean gases with low contents of tar and particulates.
VTT has also developed a diluting sampling system that has been employed in themeasurement of hydrogen sulphide, carbonylsulphide (COS) and ammonia (Ståhlberg etal. 1995). This system is shown schematically in Figure 8. It was assembled in connectionwith the PDU-scale pressurised fluidised bed gasifier. In the sampling system gas isdiluted with heated N2 to such an extent that the dew point of the gas decreases to below10 °C allowing the condensation of the heaviest tar fraction. After this step gas is cooledand filtered and slightly heated up to a temperature level that prevents fouling of theanalysers. This system has been successfully tested in gasification tests for the measure-ment of H2S and COS (Ståhlberg et al. 1995), but preliminary results with NH3 indicatethat slightly higher gas cooling temperatures should have been needed (to avoid coldsurface temperatures.

24
Figure 8. The principle of the diluting sampling system of VTT used for H2S, COS andNH3 measurements.
Preheater
T
T
T
T FTIR analyser
Heating
Filter
Dilution chamber
T
Calibration gas
Dilution nitrogen
Gas cooling
Gasfiltration
PID GC
Column
Detector
Gas chromatograph
T
p > I bar
TT
Gas pipe

25
3. Sampling of tars
3.1 Impinger systems
The sampling method most often used for biomass gasification tars is based on the use ofan impinger train arranged according to one of the alternatives shown in Figures 4 and 5.The detailed sampling arrangement depends most of all on the gasifier type and on thetemperature of the sampling point. A complicated sampling system is needed with updraftgasifiers and mild gasification applications if complete tar analysis is required. In theseprocesses the tar contains a lot of compounds of different chemical nature including anabundance of water-soluble compounds. In high-temperature gasifiers the tar compositionis not so sophisticated and a simplified set-up of the sampling system can also beemployed.
The tars are analysed for the combined samples mainly by GC methods described, e.g., byHartung & Lies (1990), Simell & Bredenberg (1990), Brage et al. (1996) and Oesch et al.(1996). The use of simple gravimetric methods based on evaporating the solvent andweighing the tar residue often leads to incorrect results, since the "tar concentration"depends very much on the evaporation temperature and time, tar composition and tarconcentration in the solvent (Simell 1988). Sample contamination, such as water con-densation and particles, can also cause errors in gravimetric analyses.
A rather complicated sampling system is required for the most extensive and reliable taranalysis. A series of water impingers in an ice bath followed by CH2Cl2 impingers inacetone/CO2 bath (temperature -79°C) (Figures 4 and 5) have been used for sampling low-temperature tars. The pre-cooled sample gas is cooled to below 5 °C in the waterimpingers, which hold most of the water-soluble tars and part of other compounds. TheCH2Cl2 solvent after the water impingers traps quantitatively the rest of the tars includingthose with the highest vapour pressures, e.g., benzene. The last step is a backup containerbeing either a) an empty bottle at a cryogenic temperature, or b) a bottle filled with CH2Cl2and at a cryogenic temperature, or c) contains adsorption resin like XAD-2 at, e.g., 0 °C.The flow rate of the sample gas has to be low enough to allow sufficient cooling and agood gas-liquid contact in the impingers (typically less than 10 dm3
n/min).
According to VTT’s experience the arrangement shown in Figure 5A (filter in the source)has proved to be practical, if the temperature of the sampling point is high enough to keepthe tars in the gas phase. The sample line after the filter is also heated until the pressureletdown (in pressurised systems). Then, the sample is pre-cooled to a constant temperaturein a simple tube, which is easily washed by the solvent after each sample. The finalcooling takes place in the first impinger bottles. The potential problems of this samplingsystem, such as reactions of tars in stainless steel (AISI 310 and AISI 316) probes, in SiC
26
filters and in the dust cake formed on the sample gas filter, were systematically tested byVTT in a three-year project (Ståhlberg et al. 1994, 1995, 1996). These studies were carriedout using product gases derived from wood, peat and coal in a pressurised fluidised-bedgasifier operating at gas outlet temperatures of 850 - 1 000 °C. With this type of highlyaromatic tar, it was concluded that the sampling probes and the SIC filters can be safelyheated up to 600 - 800 °C without any signs of change in the concentrations of tarcompounds. However, if the gas contains a lot of catalytically active particulates (e.g.,CaO), the temperature of the sampling line should be limited to below 700 °C or adifferent dust removal method should be applied (cyclone and filter of the source asillustrated in Figure 5B).
At low-temperature sampling points, where part of tars may be in the form of aerosols, anisokinetic system (Figure 4) is required for the complete collection of tars. Specialattention should be paid to the effective solvent washing of the whole sampling device.This is quite easy to arrange in atmospheric processes, but extremely difficult in pressur-ised systems. When using the sampling system shown in Figure 4, different particulate andcondensate samples are obtained that have to be separated from each others:
1. solvent-washed cyclone catch
2. prefilter wash, i.e., combined solvent wash of particulates and all parts before the filter
3. filter extract
4. post-filter wash, i.e., combined solvent wash from all parts after the filter in which mostof the tar is trapped.
5. light part of the tar plus condensed water are scrubbed in an absorption liquid, includ-ing water as the first phase and solvent as the second phase.
Instead of CH2Cl2, other solvents such as acetone and methanol can be used for collectingtars. Methanol and acetone are polar solvents and thus efficient for the polar tarcomponents (abundant in low temperature tar) and water. Methylene chloride is, however,practically insoluble in water resulting in two separate phases in sampling. If samplingcondensables of lower molecular weight than benzene, CH2Cl2 has to be replaced by ahigher boiling solvent. In GC methods methylene chloride overlaps the most volatilecompounds. E.g., benzyl alcohol (b.p. 205 °C) has been used for this purpose. Benzylalcohol dissolves 8.4 wt% of water; the solvent might be used for sampling the mostwater-soluble low-molecular-weight compounds, which are otherwise lost or analyseddirectly from the water phase.
In sampling of high-temperature tars, that have a poor solubility in water, all liquidimpingers are filled with CH2Cl2 [impingers II in Figure 4 (Hanson et al. 1982, Farzam etal. 1985, Kurkela et al. 1993)]. The first absorption bottles are kept at 0 °C and the last

27
ones at a cryogenic temperature, e.g., -79 °C (Hanson et al. 1982, Newton et al. 1979).This means that the organics soluble in the water phase become extracted with CH2Cl2 andthe water is neglected without analysis. The impingers filled with an organic solvent trapmore effectively large tar amounts from producer gases than the corresponding aqueousabsorbents or polymeric resins. Glass pearls or steel wool is used to disperse the gas flow.A backup Tenax resin is unnecessary when using several impingers in series.
A detailed description of the tar sampling and characterisation methods of VTT is given inappendices A, B and D.
3.2 Sampling of polyaromatic compounds
Polyaromatic compounds (PAC) may exist in gasification conditions either in the liquid orin the gas phase or as adsorbed onto particulates. They are often present in complexmixtures associated with other organic and inorganic gasification products. PAC occurover a wide boiling point range, e.g., naphthalene with two aromatic rings has a boilingpoint of 218 °C and coronene with seven aromatic rings has a boiling point of 525 °C.These compounds can be sampled together with other tar compounds by using the systemsdescribed in chapters 2.2, 2.3 and 3.1. However, systems originally developed for theemission measurements of diesel engines and other combustion applications can also beemployed for PAC collection.
The high vapour pressure of PAC means that even at ambient temperatures significantconcentrations of PAC with boiling points up to 400 °C can be present in the gas phase.Hence, the sampling strategies should include a collection of liquid-phase, solid adsorbedand gas-phase PAC. This is usually achieved by using glass fibre or quartz filters anddownstream solvent traps, cold traps or organic polymeric resin traps. An example of thesesystems is shown in Figure 9. In PAC sampling a third sample may be formed from theseparating condensable water, which contains water-soluble compounds.
The distribution of polyaromatic compounds between filter trapping and cold or resintrapping is dependent on the sample temperature at the filter. Figure 10 shows thedistribution between filter and organic polymeric resin trap for coke oven emissionscollected at 50 °C.
In the gasification gases aromatic compounds with 1 - 4 rings are still mainly in the gasphase at the sampling temperature of 200 °C. Hence, during sampling all parts of thesampling system should be kept heated at the sampling temperature. This filter tempera-ture is high enough to prevent water condensation as well. After sampling all surfacesbecoming in contact with the gas at a lower than the process temperature are washed withproper solvents, and the washes are combined with the actual sample.

28
Figure 9. Sampling system for PAC compounds according to Williams (1990).
Figure 10. Distribution of PAC compounds between a filter at 50°C and a downstreamcold polymeric resin (XAD-s) (Williams 1990).
PROBE
HOT FILTER
SMOKESTACKWALL
ADSORBENTSAMPLER
COOLANT
TO PUMP
COOLINGIMPINGER
COOLANT
DRYINGIMPINGER
GASMETER
IndeneNaphthalene
MethylnaphthaleneAcenaphthalene
BiphenylMethylbiphenyl
AnthraceneFluoranthene
PyreneMethylpyrenes
BenzphenanthrenesChrysene
MethylchryseneDibenzanthracenesBenzfluoranthenes
BenzpyrenesMethylbenzpyrenes
IndenopyrenesBenzperylenes
Coronene
0 10 20 30 40 50 60 70 80 90 100Percentage retained
FILTER ABSORBER

29
Dilution with hot inert gas, nitrogen, is commonly used to minimise sample condensationbefore the traps. After filtration, the constituents in the gas phase are either washed by asolvent in an impinger system or trapped in Amberlite XAD-2 or Tenax GC polymericresin. The temperature of the resin should be kept low (< 50 °C) to prevent decrease insampling capacity. The resin is then extracted with an organic solvent (Nelson 1989). Themost common solvents used for (Soxhlet) extraction of PAC compounds (2 - 4 rings) havebeen dichloromethane, cyclohexane and mixtures of benzene and methanol. Equally goodextraction efficiencies have been found for PACs, while benzene/methanol extracts morealkanes than the other solvents do (Williams et al. 1986). Diethyl ether has been foundmore efficient than toluene for extracting heavy PAH compounds (Claessens et al. 1991).The result of the PAH analysis of samples containing particulates, like char or sootcollected on fibrous filters, is highly dependent on the extraction method used for thePAHs (Claessens et al. 1991). It has been reported that the PAHs adsorbing on sootparticles may degrade during the sampling procedure (Williams 1990). The filter-trappedPAH/PAC compounds also tend to change under storage. The tendency to filter-particulateinteractions related to the filtering 'in the source' is not known.
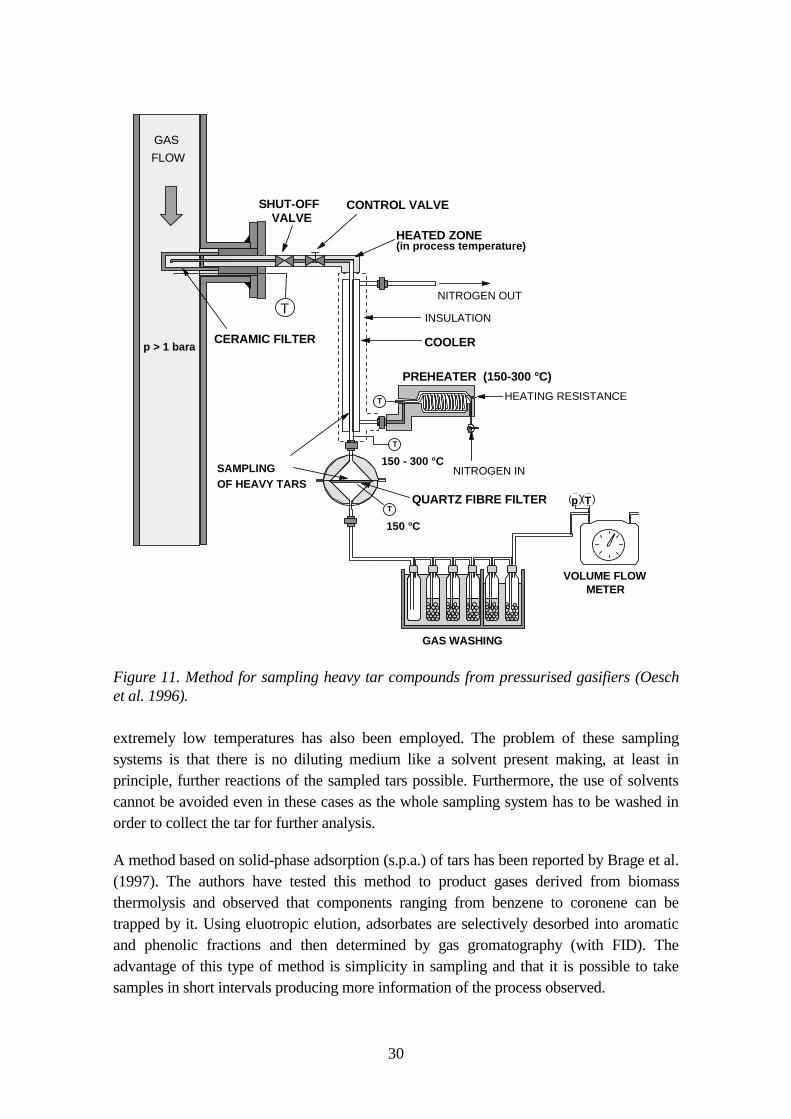
The sampling system for PAC based on condensing of tars at 150 °C was taken into use inwood gasification tests at VTT in 1991 (Kurkela et al. 1993). This system is illustrated inFigure 11 and it has been described in detail by Oesch et al. (1996). The sample gas is firstfiltered at the process temperature and pressure. Then, after the pressure letdown, thesample gas is cooled in a cooling tube to 150 °C. Part of the condensables are thuscollected on the walls of the tube and rest of the condensed tar aerosols on a quartz-fibrefilter, which is placed in a heated casing (150 °C). Immediately after the sampling thedevices are cooled to ambient temperature and then tars are washed by CH2Cl2. Aftersampling, the total amount of "heavy tars" is determined gravimetrically in the laboratory.The tar-containing solvent is first filtered to remove any particles and then the solvent isevaporated at room temperature. The tar residue weighed corresponds to the total amountof the tars condensing at 150 °C in atmospheric pressure. Hence, the amount of tarobtained is dependent on the vapour pressures of the components and does not give thecorrect concentration for compounds that have a considerable vapour pressure at 150 °C.Generally the samples contain mainly compounds heavier than fluoranthene and they canbe partly analysed by gas-chromatography in addition to the gravimetric determination.
A detailed description of the heavy tar sampling and characterisation methods of VTT isgiven in appendices A, C and D.
3.3 Other systems
Other tar collecting arrangements than impingers have also been used. Evans et al. (1985)and Farzam et al. (1985) collected tars in empty pressurised stainless-steel containers oper-ated at reduced temperature. Direct condensation of the liquid effluent in cold traps at
30
Figure 11. Method for sampling heavy tar compounds from pressurised gasifiers (Oeschet al. 1996).
extremely low temperatures has also been employed. The problem of these samplingsystems is that there is no diluting medium like a solvent present making, at least inprinciple, further reactions of the sampled tars possible. Furthermore, the use of solventscannot be avoided even in these cases as the whole sampling system has to be washed inorder to collect the tar for further analysis.
A method based on solid-phase adsorption (s.p.a.) of tars has been reported by Brage et al.(1997). The authors have tested this method to product gases derived from biomassthermolysis and observed that components ranging from benzene to coronene can betrapped by it. Using eluotropic elution, adsorbates are selectively desorbed into aromaticand phenolic fractions and then determined by gas gromatography (with FID). Theadvantage of this type of method is simplicity in sampling and that it is possible to takesamples in short intervals producing more information of the process observed.
HEATED ZONE(in process temperature)
GAS WASHING
Tp
PREHEATER (150-300 °C)
HEATING RESISTANCE
NITROGEN IN
COOLER
NITROGEN OUT
T
T
INSULATION
QUARTZ FIBRE FILTER
150 °C
150 - 300 °CSAMPLINGOF HEAVY TARS
VOLUME FLOWMETER
T
SHUT-OFFVALVE
CONTROL VALVE
p > 1 bara
GAS
FLOW
T
CERAMIC FILTER

31
4. Sampling of inorganic compounds
The reliable sampling and analysis of all polar inorganic compounds, like H2S, NH3 andHCl, is difficult, as these compounds are particularly sensitive to reactions with the sur-faces of the sampling system as well as with the moisture and other impurities of the gas.The special features of sampling sulphur compounds, nitrogen gases and HCl are dis-cussed separately in the following chapters.
4.1 Sampling of H 2S and other sulphur gases
Material aspects are of primary importance in sampling reactive sulphur compounds, likeH2S and thiols containing a reactive SH group. Selective adsorption of reactive sulphurcompounds on glass or metal surfaces is a common problem in low concentrations andwith moist gas streams (Lindgren 1990, Deprez et al. 1986, Graydon & Grob 1983). Inprinciple this problem could be avoided by using only inert materials (ceramics anddifferent PTFE, e.g. teflon, types of materials) in the sampling lines. However, since it isalmost impossible to avoid the use of stainless steel in the high-temperature part of thesampling system, the following solutions have been used to minimise the adsorptionproblems.
• The stainless steel part have been designed as short as possible followed by inert PTFEparts immediately when the gas temperature is low enough (De Souza 1987, De Souzaet al. 1978).
• The sample gas flow has been maintained continuous and the flow rate high enough tokeep the sulphur adsorption in control. Flow rates of 2 - 3 dm3
n/min in a 6 mm (1/4")tubing have been sufficient to avoid severe adsorption problems. Moisturecondensation in the sampling lines has been prevented by heating the lines (Clemons etal. 1981, Lindgren 1990).
• The sampling line has been reconditioned when a considerable concentration changehas taken place in the product gas. This means that the analysis has not been started toosoon after changing the operating conditions. Occasionally, for example, between twosampling periods, the sampling line has been back-flushed by nitrogen.
• An electrochemically polished, low-porosity and low-specific surface stainless steeltubing with chromium oxide surface has been used successfully at VTT in the hot partsof the sampling system shown in Figure 9.
Another problem is the removal of particulates, tars and water vapour from the samplegas. The information available in the literature on the effects of water and tar removalfrom the product gas prior to H2S analysis is contradictory. For example, Beckers (1988)found out that moisture causes problems to the H2S detection, and got best results when

32
water was cold-trapped from the sample gas immediately before the analysis. Lindgren(1990), De Souza (1987) and De Souza et al. (1978), used heated sampling lines and nowater condensation in their successful systems for H2S analysing systems.
Robbie and Paterson (1981) have observed that carbonaceous dust adsorbs effectively H2Sat the ambient temperature. Hence, for a successful H2S analysis, the particulate mattershould be removed at such a high temperature that H2S is desorbed from the char.Temperatures between 400 - 800 °C have been used (Robbie & Paterson 1981). Anysupplementary traps should be avoided, because H2S is held easily by condensed moisture,glass wool and other materials, like tar and char dust on the filter, especially at loweredtemperatures. Stainless steel filters have also been used for the hot particulate removal(Page 1978, Robbie & Paterson 1981) although there is a risk for sulphur reactions withthe filter material especially at lower temperatures. On the other hand, some researchers(Krabbe & Hobucher 1982) have found out that the particulate removal at 200 °C by aglass fibre filter does not interfere with the analysis of inorganic species. This experiencewas from coal gasification, and it is quite evident that different particulates behavedifferently.
The conventional wet chemical methods for H2S capture in aqueous alkaline and cadmiumabsorbents are no more widely used due to the instability of the sample, toxicity of the Cdabsorbent and tediousness of the preparation and analysis. Moreover, carbonyl sulphideCOS is not held quantitatively in aqueous solutions and it is most easily analysed from thegas phase.
H2S and other sulphur compounds are most commonly analysed by gas chromatography.If on-line gas analysis by GC is not possible, the samples should be collected preferably inPTFE bags and analysed as soon as possibly. In addition to PTFE bags, good results havebeen achieved with aluminium-coated sample bags, which Arendt (1988) has found to besafe and non-problematic for sampling sulphur, chlorine and fluorine compounds. Glassbulbs or any other glass parts should not be used, since H2S is very reactive with glasssurfaces. Different inertising methods for glass materials have been tried but with a verylimited success. Glass surfaces have been coated with silylating agents, likedichlorodimethylsilane (Tangerman 1986) or hexamethyldisilazane (HMDS) (Mann et al.1985). With moist gases this surface treatment has not been found satisfactory forsampling hydrogen sulphide. The OH groups of water react readily with the silylated layerof the glass transforming the surface again active for H2S. COS and CS2 sampling is not asproblematic (Page 1978). Other experiences from the trials to inertise glass surface havebeen described by Deprez et al. (1986), Page (1978) and Farwell & Gluck (1989). Nosatisfactory deactivation was achieved by coating glass surfaces by permanent films ofCarbowax materials or by any other material.

33
According to the experience gained at VTT, H2S and other sulphur gases are most reliablyanalysed by on-line gas chromatography. In fluidised-bed gasification tests with biomass,peat and coal at VTT, good material balance closures for sulphur were achieved by thesystem shown in Figure 12. The particulates are removed at the process temperature andpressure by a SiC sampling filter. The filter can be back-flushed by nitrogen to remove thedust cake. After a short stainless steel part, where the gas is cooled to below 250 °C, therest of the sampling line is of teflon-lined steal tubing. The second quartz filter shown inFigure 10 is just for protecting the gas chromatograph from the particulates in case offailure in the first-high temperature filter. Teflon solenoid valves are used for alternationand the chromatograph is equipped with heated PTFE lines for the sample gas inlet. Theconstruction of the sampling and conditioning system is such that both the calibration andprocess gas can be taken automatically through the same gas pathway. This operated
Figure 12. Sampling train for semi-continuous analysis of sulphur compounds in the gasphase.
PURGE(nitrogen)
CONTROL VALVESHUT-OFFVALVE
T
T
ROTAMETER
ELECTRICHEATING
CERAMICFILTER
p > 1 bar
P
T
P
PRESSURE LET DOWN
T= 150 - 300 °C
T= 150 - 200 °CPTFE -TUBE
(depending on process pressure)
orp = 1 bar
ELECTRIC HEATER
FPD GC
COLUMN
HEATED VALVEDETECTOR
CARRIER GAS
PUMP
SAMPLING LOOP
VENT
SOLENOID VALVE PRESSURE
CONTROL VALVE
CONDENSER
PUMP
(ICE BATH)
STAINLESS STEEL TUBE
3 -WAY FILTER
SECONDARY
34
very well in peat and coal gasification, while tar condensation caused problems andyielded a lot of tars in some wood gasification conditions. Reliable results were thenachieved by taking the samples into PTFE bags through the heated line used for the semi-continuous sampling. When the gas bags were cooled to room temperature most of themoisture and part of the tars condensed on the walls of the bags and then the samples weresuccessfully analysed without tar problems in the GC-system (the samples were analysedwithin 5 hours).
The best solution to avoid tar and moisture condensation problems is perhaps the use ofdilution with heated nitrogen. This together with heated sampling lines should enable theanalysis of biomass-derived gases without moisture or tar removal (see chapter 2.6). Thisis, however, difficult to attain when gas tar content is high and the process is operated atatmospheric pressure.
The apparatus shown in Figure 5B was tested by VTT and proved to be quite unreliablefor sulphur sampling. In this system the particulates were removed at a reducedtemperature (200 - 300 °C) and the whole sampling line was made of stainless steel (AISI316).
4.2 Sampling of NH 3 and HCN
The outlines for the design of sampling lines and materials for H2S sampling should ingeneral be applied to nitrogen compounds as well. The probe reactions as well as theinteraction between nitrogen compounds and other gas impurities and the materials of thesampling systems are, however, even less studied than those of the sulphur gases. It shouldbe mentioned that in some conditions (high pressure, certain temperature range and thepresence of catalysing surfaces) ammonia may be formed in the sampling systems throughammonia synthesis reaction (Case 1978).
In conventional sampling protocols for gaseous inorganic nitrogen containing species(Piernock 1979, Pochan & Massey 1978), these compounds are sampled in parallelaqueous impingers with an arrangement shown in Figure 13. Ammonia as a basiccompound is generally sampled in acidic solutions, e.g., dilute sulphuric acid, and acidiccompound HCN in basic solutions, e.g., dilute NaOH. Basic inorganic compounds mayalso be collected in HCl instead of H2SO4. The concentrations of the absorption solutionshave varied in a wide range depending, e.g., on the gas composition and sampling time.Quite strong concentrations are generally needed to keep the pH of the sample in the rightrange. Ferrell et al. (1980) used the following concentrations in a coal gasification study:NH3 was absorbed in 5% H2SO4 solution, and HCN plus SCN in 5% NaOH solution. ForpH sustainability strong NaOH solutions are necessary when sampling gas streamscontaining high amounts of CO2. The recommendation for ammonia collection is to keeppH below 1.0 and for HCN to keep pH >10 (Pochan & Massey 1978). For HCN and SCN

35
Figure 13. Impinger system for collecting inorganic effluents form biomass gasification.
even pH of 12 and higher have been suggested (Piernock 1979). The absorption efficiencyof NH3 in an H2SO4 solution is practically 100% and that of HCN in NaOH 97.7% (Smart& Maalman 1987).
VTT has successfully used the arrangement shown in Figure 13 for collecting differentinorganic effluents from biomass, peat and coal gasification streams. The effluents arecollected depending on the sampled compound into neutral, basic or acidic solutions in thefirst three impingers placed in an ice-water bath. The concentrations of 5% H2SO4 (forNH3) and 5% NaOH (for HCN) have in most cases been satisfactory also in wood, peatand coal gasification experiments carried out at VTT. The fourth bottle contains acetoneand the fifth CH2Cl2. The final sixth bottle is empty. The last two impingers are placed inan acetone/ CO2 ice bath. This final step is needed to remove all the remaining tars beforethe flow measurement (to protect the equipment). The acetone bottle is needed to preventice build-up in the fifth bottle.
The reliability of the NH3 and HCN sampling systems of VTT has been studied byStåhlberg (1995, 1996). According to the study stainless steel probes can be safely used at
VOLUME FLOW METER
GAS WASHING BOTTLES
1 2 3 4 5 6ICE BATH
ACETONE +CO2 -ICE
T
CH2Cl2
ACETONE
P
VENT
T= 150 - 200 °CPTFE -TUBE
PUMP
(T = -79 °C)BASIC/ACIDICAQUEOUS SOLUTIONS
Tp

36
least in the sampling of fluidised-bed gasifiers. No significant probe reactions were foundin the temperature range of 300 - 800 °C.
A semi-continuous monitoring system in Figure 12 was designed primarily for the analysisof gaseous sulphur compounds. However, it can also be applied to all such inorganicspecies, like ammonia, that can be separated and detected by gas chromatography. Thistype of arrangement requires particulate-free sample gas and is described in detail, e.g., byMayer et al. (1979) and Lindgren (1990).
4.3 Sampling of HCl
In gasification processes chlorine and fluorine are released mainly as hydrogen halo-genides. Hydrogen chloride is extremely soluble in aqueous solutions. Its aqueous solutionis a strong acid, and in water HCl is practically completely dissociated into chloride ions.Hence, chloride may be easily trapped quantitatively in any aqueous solution: neutral,acidic or basic. The trapping liquid is normally chosen according to the requirements ofthe subsequent analytical method. In ion chromatography (IC) the most suitable solventsare distilled water and dilute sulphuric acid (0.5% H2SO4). Alkaline NaOH solutionsrequire the removal of Na+ ions before IC analysis (IEA 1992).
Gas-phase HCl is a very aggressive gas and reacts very easily with surfaces in gasifier andin down stream components. This leads easily to the loss of HCl until surfaces havereached more or less equilibrium conditions. In practice this results in a "memory effect",which means, that a stable operation of several hours or days is usually required before thestable HCl level is reached. The phenomenon is of special importance when changingfrom strong concentrations to dilute gases, as the adsorbed HCl is released (Huston &Wachter 1989). For example, a continuous stable operation of 3 - 4 days is required inVTT’s pressurised gasifier until the stable HCl level is reached at the sampling pointlocated after the hot gas filter. Due to the high corrosiveness and reactivity of HCl in thepresence of moisture, inert materials, like quartz and PTFE, should be used in thesampling train. In general, principles similar to those described earlier for H2S should beapplied in the design of sampling systems for HCl too.
An interesting sampling method for an on-line measurement of HCl from high-tempera-ture and high-pressure coal gasification processes has been presented by Huston &Wachter (1989). Sampling was performed in the presence of all matrix componentsformed in the fluidised-bed oxygen-blown gasification of coal. The sample gas comingfrom the process was maintained at about 500 °C to prevent the formation of NH4Cl andthen led into a long Ni-tubing kept at 1 000 °C, at which the tars and ammonia wereeffectively decomposed (aided by the catalytic effects of the nickel material). After thispoint the sampling line was maintained above the dew point, at 150 °C, and the tar-free

37
gas was led through analysers without condensation and soot problems. However, carefulflow rate measurements are needed, since the cracking of tars and light hydrocarbons willincrease the total gas flow rate quite substantially in biomass gasification applications,which has to be taken into account when calculating the concentration of HCl in theoriginal raw gas.
A vapour-phase halogen (HCl, HF) sampling system developed by VTT is shown inFigure 14. It is based on the use of quartz liners everywhere inside the sampling tubes,also in the parts that are under process pressure. The only point where gas can be incontact with a metal surface is the valve chamber where gas is fed through the valveopening. After pressure letdown the valve gas is cooled and scrubbed by injecting puri-fied halogen-free water (flow rate 10 ml/min) into the opening of the quartz liner imme-diately after the valve. The flow rate of the sample gas is 5 dm3
n/min and it is washed infour stages after cooling. The first washing stage also collects the water injected into theliner. The first stage washing is able to capture more than 98% of the total halides cap-tured and only the content of the first stage washing bottle is analysed. A capillary elec-trophoresis system is applied for halide analyses. This sampling system has been suc-cessfully used in gasification tests, both in pressurised and atmospheric processes since1995.
Figure 14. Vapour-phase halogen sampling system of VTT Energy.
Main washingbottle
Waterpump
Halogenfree H2O
SiO2-liner
Cooling
Water injection 10 ml/min
Gas from filter
Sampleflow5 ln/min
T
By passheating flow
P T
Flow meterGas washing Gas drying
32467

38
5. Storage of samples
According to sample stability tests carried out at VTT (Ståhlberg at al. 1995, 1996) tarsamples solved in dichloromethane can be stored in a cold (< 5 °C) and dark place with-out changes for months. The right storing vessel for tar samples is made of glass.
Instructions for storing and treating aqueous samples are given in, e.g., ISO 5667/3 andNPR 6601 standards (ISO 1985, Smart & Maalman 1987). According to these HCN andSCN solutions can be stored for a maximum of 24 h (ISO 1985). Shorter storage time,in maximum 6 h, is used in ASTM D2036-82 (ASTM 1982). However, according totests performed at VTT HCN should be analysed preferably immediately after sampling(Ståhlberg et al. 1994, 1995). HCN samples are stored at pH 11 - 12.5 (SFS 1975, Karstet al. 1980). Thiocyanate, SCN, is biodegradable, and samples that may contain bacteriaare stored acidified at pH < 2 (Franson et al. 1985).
Despite the fact that ISO 5667/3 recommends a short storage time also for NH3, the ex-periences in practice show that ammonia samples can be stored for a longer time thanHCN samples ( Skinner 1985, Mann et al. 1985). According to the stability tests carriedout at VTT ammonia samples can be stored in a cold and dark place without changes atleast for a month (Ståhlberg et al. 1996). Ammonia samples should be stored at 2 - 5 °Cand acidified with H2SO4 to pH 2 (ISO 1985).
Certain inorganic compounds, like cyanides and sulphides, must be stabilised for stor-age. When sampling CO2-rich gases, like gasification effluents, the samples are stabi-lised with lime (Franson et al. 1985, ASTM 1982). Following the instructions of ISOstandards the stabilisation for cyanide determination is necessary already at the samplingsite (ISO 1985). In cyanide sampling sulphide makes an interference and it is removedby precipitation with lead or zinc acetate or lead carbonate (Smart & Maalman 1987,IFRF 1987). The oxidation products of sulphide convert HCN into SCN in a short time,especially at high pH values. HCN has been found to disintegrate even at a rate of 50%per hour, when the sulphide concentration in a solution was 500 mg/l. Precipitates arefiltered off before pH stabilisation. Other oxidising agents are removed with sodiumsulphite Na2SO3 (SFS 1975). Most interferences are removed by distilling HCN offfrom an acidified sample solution (IGT 1986, Ferrell et al. 1980, Mann et al. 1985, EPA1979). Conventionally, all sulphur and nitrogen compounds are analysed separately us-ing specific analytical methods for each (Karst et al. 1980).
Borosilicate or sodium-lime glass may release cations in an aqueous solution, and met-als can be adsorbed on the containers walls. However, it is recommendable to use glassvessels instead of plastic ones (except for PTFE teflon), as plastic material is less inert.If plastic is used, polyethylene containers should be pretreated by letting them stand in1 mol/l HNO3 or HCl for 1 - 2 days. Freezing improves the storage stability of the sam-ples. Plastic vessels are used in freezers (ISO 1985).
39
6. Conclusions and suggestions
Taking a representative sample from an elevated-temperature gas stream, which containscarbon particles, complex organics including high-molecular-weight polyaromatic com-pounds (PAC), water vapour as well as sulphur and nitrogen compounds, offers a difficultproblem for the development of an effective sampling method. The withdrawal of asample along the length of a probe and through a filter may cause chemical interactions,involving, e.g., transformations from gas to particulates.
At present there are no standardised overall sampling methods available, which wouldmeet all the requirements of the different gasification applications. The heterogeneity ofgasification processes and feedstocks results in a formation of a wide variety of productsof different chemical nature. The required level of information about the gasification prod-ucts also depends on the end use of the gas. In some applications a very rough estimate ofthe gas heating value is sufficient for successful operation while very detailed chemicalcharacterisation of the effluents may be needed in another application. That is why thesampling and analysing systems have to be more or less tailor-made for each application.
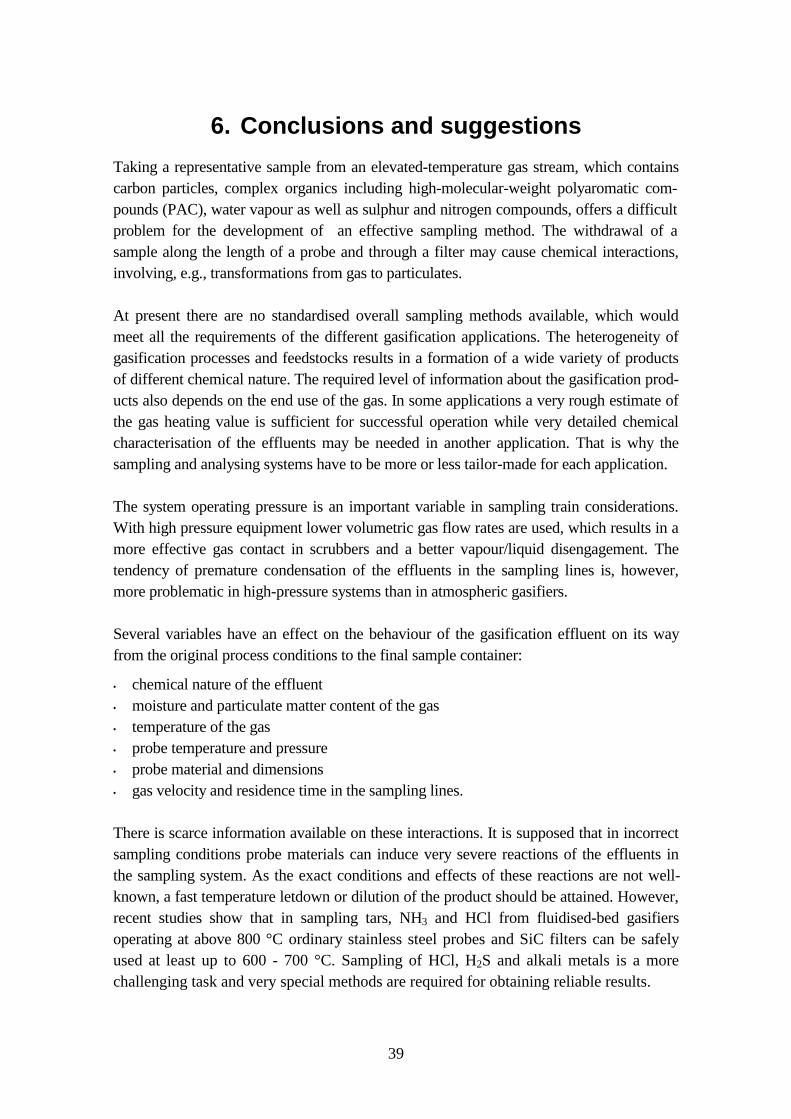
The system operating pressure is an important variable in sampling train considerations.With high pressure equipment lower volumetric gas flow rates are used, which results in amore effective gas contact in scrubbers and a better vapour/liquid disengagement. Thetendency of premature condensation of the effluents in the sampling lines is, however,more problematic in high-pressure systems than in atmospheric gasifiers.
Several variables have an effect on the behaviour of the gasification effluent on its wayfrom the original process conditions to the final sample container:
• chemical nature of the effluent• moisture and particulate matter content of the gas• temperature of the gas• probe temperature and pressure• probe material and dimensions• gas velocity and residence time in the sampling lines.
There is scarce information available on these interactions. It is supposed that in incorrectsampling conditions probe materials can induce very severe reactions of the effluents inthe sampling system. As the exact conditions and effects of these reactions are not well-known, a fast temperature letdown or dilution of the product should be attained. However,recent studies show that in sampling tars, NH3 and HCl from fluidised-bed gasifiersoperating at above 800 °C ordinary stainless steel probes and SiC filters can be safelyused at least up to 600 - 700 °C. Sampling of HCl, H2S and alkali metals is a morechallenging task and very special methods are required for obtaining reliable results.

40
Although it is not possible to design one universal sampling method for all gasificationapplications, the following general design issues should be considered when planning aprotocol for reliable sampling of gasifier effluents:
1. The filtering temperature should be kept so high that solids are cleanly separated fromthe volatile material, i.e., the volatiles do not condense on filters. In non-particulatesampling the primary ceramic filter is at best positioned at the sampling point, i.e.,inside the gasifier or in the gas pipe. The initial filter is kept at or near the processtemperature. Reverse flow, high-pressure nitrogen purge should be available to cleanthe filter from particulates.
2. The probe is kept near the process temperature, but above tar condensing temperature,to prevent any condensation in the probe. Rapid quenching or dilution of the effluent assoon as possible is preferable after the sampling point to maintain the original productcomposition.
3. If the sample gas has to be filtered at a lowered temperature, the temperature of thefilter should be in the range 175 - 600 °C. Too low a temperature can plug the filter andterminate sampling, whereas too high temperatures can result in the thermal or catalyticcracking of tars.
4. Gas contact times with hot parts of the sampling line should be kept as short aspossible; especially hot metal surfaces are a potential risk to the 'nativity' of the gas.Inert refractory materials (ceramics, quartz) should be used as probe materials when-ever possible.
5. The condensate should be collected in a solvent (supplemented with a backupadsorbent resin), preferably not in an cold trap in which there is no 'diluting surround-ings' to suppress further reactivity.
The available stack gas sampling protocols for gaseous, liquid and solid products are notvery suitable for sampling hot and heavily tar-contaminated product gases. The up-to-date sampling systems for biomass gasifiers are modified from the EPA method forsampling emissions from combustion systems (EPA 1979). The protocol initially devel-oped in the Canadian ENFOR project (Esplin et al. 1985) is recommended for isokineticsampling of condensables and particles from non-pressurised biomass gasifiers, whichproduce gases with a high content of particulates and tar (Figure 4, chapter 2.2).
For the non-isokinetic sampling of condensables from pressurised gasifiers and high-temperature product gases, the sampling lines shown in Figure 5 are recommended. Forsampling particles from pressurised systems an O-type probe configuration (as in Figure6), combined with the pre-separation cyclone (and a conditioning coil) shown in Figure4, depending on the temperature required, is the best choice. This type of probe has beenfound to operate relatively well under pressure. The O-probe is also suitable for sam-

41
pling particles from non-pressurised systems. The temperature of the downstream sec-ondary fibre filters cannot be fixed, but is chosen according to the process conditions(temperature, pressure, raw material) and is variable at least between 150 and 400 °C .
Direct condensation of the liquid effluent without diluting media, e.g., with cold trap-ping can result in further reactions of the trapped compounds. The reactivity is sup-pressed by using a diluent like a diluting gas, an absorbing liquid or an adsorbent resin.

42
References
Arendt, G. 1988. Analytical procedures for landfill gas. TM Tech. Mess., vol. 55, no. 5,pp. 172 - 176.
Aristoff, E., Rieve, R. W. and Shalit, H. 1981. Low-Temperature Tar. In: Elliot, M. A.(ed.) Chemistry of Coal Utilization. New York: John Wiley & Sons, pp. 983 - 1002.
ASTM. 1982. ASTM D 2036-82. Cyanides in water. Philadelphia: ASTM.
Baker, E. G. et al. 1986. Engineering analysis of biomass gasifier product gas cleaningtechnology. Richland, PNL-5534, DE 86015282. 100 p.
Beckers, K. 1988. An automated measuring system for the determination of hydrogensulfide concentrations in process waste gas. Brennstoff-Wärme-Kraft, vol. 40, no. 3, pp.M20 - M23.
Brage, C., Qizhuang, Y. & Sjöström, K. 1996. Characteristics of evolution of tar fromwood pyrolysis in a fixed-bed reactor. Fuel, vol. 75, pp. 213 - 219.
Brage, C., Qizhuang, Y., Guanxing, C. & Sjöström, K. 1997. Use of amino phase ad-sorbent for biomass tar sampling and separation. Fuel, vol. 76, pp. 137 - 142.
Brown, M. D. et al. 1986. Evaluation of processes for removal of particulates, tars, andoils from biomass gasifier product gases. In: Proc. Energy from Biomass & Wastes X.London-New York: Elsevier Sci. Pp. 655 - 676.
Bryan, B. G. et al. 1988. Results of in-situ desuphurization tests in the U-gas coal gasi-fication process. Chicago: Institute of Gas Technology. 25 p. (CONF-880915-1.)
Burkinshaw, J. R. et al. 1983. Analysis of sulfur and nitrogen pollutants in three-phasecoal combustion effluent samples. Ind. Eng. Chem. Fundam., vol. 22, pp. 292 - 298.
Case, G. 1978. Chemistry of hot gas cleanup in coal gasification and combustion. Mor-gantown: Morgantown Energy Technology Center. 224 p. (METRC/SP-7812.).
Ciliberti, D. F. et al. 1984. Gas characterization from fluidized-bed coal gasification -final report. Pittsburgh: Westinghouse R&D Center. 221 p. (DOE/MC/16024-1549.)
Claessens, H. A. et al. 1991. Comparison of extraction methods for the determination ofpolycyclic aromatic hydrocarbons in soot samples. Chromatographia, vol. 31, no. 11/12,pp. 569 - 574.
Clemons, J. et al. 1981. Separation and determination of trace sulfur compounds. Anal.Instrum., vol. 19, pp. 69 - 80.

43
De Souza, T. L. C. et al. 1978. Automatic gas chromatograph continuously monitorssulphur gases from kraft mill recovery furnaces. Pulp & Paper Canada, vol. 79, pp. T242- T248.
De Souza, T. L. C. 1987. Dedicated, automatic gas chromatograph for monitoring sul-phur gases. J. Chromatogr., vol. 385, pp. 413 - 422.
Deprez, P. P. et al. 1986. Determination of reduced sulfur gases in antarctic lakes andseawater by gas chromatography after solid adsorbent preconcentration. J. Chromatogr.,vol. 362, p. 21.
Elliott, D. C. 1983. Analysis and upgrading of biomass liquefaction products, final re-port. In: IEA Co-Operative Project D-1, Biomass Liquefaction Test. Vol. 4. Springfield,Virginia: National Technical Information Service.
Elliott, D. C. 1985. Analysis and comparison of biomass pyrolysis/gasification conden-sates - an interim report. Richland, WA: Battelle Pacific North West Laboratory. 91 p.(PNL - 5555.)
Elliott, D. C. 1986. Comparative analysis of gasification/pyrolysis condensates. In:Proc. 1985 Biomass Thermochemical Conversion Contractors Meeting. Richland, WA:Battelle Pacific North West Laboratory. Pp. 361 - 381.
Elliott, D. C. 1987. Analysis of medium-BTU gasification condensates June 1985 -June 1986. Richland, WA: Battelle Pacific North West Laboratory. 34 p. (PNL-5979).
Ellman, R. C. et al. 1979. Slagging fixed-bed gasification: project status at the grandForks Energy Technology Center. In: Kube, W. R. & Gronhovd, G. H. (eds.). Technol-ogy and use of lignite. Proc. 10. Biennial Lignite Symp., Grand Forks, ND, 1979. GrandForks: Grand Forks Energy Technology Center. Pp. 136 - 277.
ENFOR. 1983. ENFOR Project C-172. A workbook for biomass gasifier sampling andanalysis. Washington: EPA/ENFOR.
EPA. 1979. EPA Method 5H. Determination of particulate emissions from wood heat-ers from a stack location. Washington: EPA.
EPA. 1983. EPA Federal Register 36, No. 247, 24878. Method 5. Determination of par-ticulate emissions from stationary sources. In: 40 Code of Federal Regulations, Part 60,App. A - Reference methods. Revised 1 July 1983. Washington: EPA. Pp. 437 - 452.
EPA. 1987. EPA Method 5G. Determination of particulate emissions from wood heat-ers from a dilution tunnel sampling location. Methods for chemical analysis of waterand wastes. Cincinnati, Ohio: EPA Environmental Monitoring and Support Laboratory.

44
1979. In: 40 Code of Federal Regulations, Part 60, Standards of Performance for NewSources; Residential Wood Heaters, 18 Febr. 1987. Washington: EPA. Pp. 4994 - 5066.
Esplin, G. J. et al. 1985. Development of sampling and analytical procedures for bio-mass gasifiers. Can. J. of Chem. Eng., vol. 64, pp. 946 - 953.
Evans, R. J. et al. 1985. Operating results from a pressurized fluidized bed biomassgasification process. In: Proc. Energy from Biomass and Wastes IX. Chicago: Instituteof Gas Technology. Pp. 573 - 594.
Farwell, S. O. & Gluck, S. J. 1989. Glass surface deactivants for sulfur-containinggases. Anal. Chem., vol. 52, no. 12, pp. 1968 - 1971.
Farzam, A. Z. et al. 1985. Analysis of nitrogenous compounds in the effluent streamsfrom a fluidized bed coal gasification reactor. Fuel. Proc. Technol., vol. 10, pp. 249 -259.
Ferrell, J. K. et al. 1980. Coal gasification/gas cleanup test facility. Vol 1. Descriptionand operation. Raleigh: North Carolina State Univ. 98 p. (EPA-600/7-80-046.)
Franson, M. A. H. et al. (eds.) 1985. Standard methods for the examination of waterand wastewater. 16th ed. Washington: American Public Health Association. 1268 p.
Freeburn, S. A. & Houck, J. E. 1989. Wood gasification facility: sampling plan, facilitylocated at North Powder, Oregon. Pacific Northwest and Alaska Regional Biomass En-ergy Program, Bonneville Power Administration. Washington: DOE. 53 p.(DOE/BP/62790-2, DE90 004546.)
Graydon, J. W. & Grob, K. 1983. J. Chromatogr., vol. 254, p. 265.
Haas, W. J. Jr. et al. 1984. Real-time alkali-monitoring for fluidized-bed combustorflue gas. In: Proc. 4th Ann. Contractors Meeting on Contaminant Control in Coal De-rived Gas Streams, Morgantown, 1984. Washington: DOE. Pp. 275 - 296. (DOE/MTEC-85-3.)
Hanson, R. L. et al. 1982. Chemical fractionation and analysis of organic compounds inprocess streams of low btu gasifier effluents. Washington, DC: American Chemical So-ciety. Pp. 205 - 223. (ACS Symp. Ser. 205).
Hartung, A. & Lies, K.-H. 1990. Rapid determination of selected polycyclic aromatichydrocarbons in motor vehicle exhaust. Motortechnische Zeitschrift, vol. 54, no. 1, pp.13 - 17.

45
Häyrinen, V. & Hernberg, R. 1996. Alkali measurements using plasma excited alkalireseonance line spectroscopy. High temperature gas cleaning. Universität Karlsruhe,Germany, pp. 694-705.
Huston, G. Sr. & Wachter, J. K. 1989. Development of an extractive continuous moni-tor for hydrogen chloride (HCl) analyses of coa-derived process streams. Anal. Lett.,vol. 22, no. 1, pp. 269 - 292.
IEA. 1992. IEA MSW Conversion. IEA Bioenergy Agreement, Task VII MSW Conver-sion. Review of emission and performance monitoring of municipal solid waste incin-erators. Willowdale, Ontario: A. J. Chandler & Associates Ltd. 183 p. + app. 11 p.
IFRF. 1987. Measurement Techniques NH3 and HCN. IJmuiden: International FlameResearch Foundation. 4 p. (IFRF Doc. No. F72/a/16.)
IGT. 1986. U-Gas process pilot plant test with Finnish peat. IGT Project No. 40248.Chicago: Institute of Gas Technology. 34 p.
ISO. 1985. ISO 5667/3 Water quality - sampling. Part 3. Guidance on the preservationand handling of samples. Geneve: International Organisation for Standardisation. 13 p.
Karst, R. H. et al. 1980. Environmental assessment of the HYGAS process. Vol. III.Interim report on HYGAS environmental characterization: manual of methods for char-acterization of HYGAS pilot plant solids, liquids and gases. Chicago: Institute of GasTechnology. 126 p. (NTIS Report FE-2433-26.)
Kilpatric, M. 1986. Coal gasification environmental data summary: sulphur and nitro-gen species. Austin: Radian Corporation. 80 p. (EPA/600/7-86/0156.)
Krabbe, H. J. & Hobucher, H. E. 1982. Sampling and sampling errors with respect togases loaded with coke dust from coal gasification plants concerning the sulfur and sya-nide content. Staub-Reinhalt-Luft, vol. 42, no. 6, pp. 231 - 232.
Kurkela, E., Hepola, J., Ståhlberg, P. & Lappi, M. 1991. Sulphur removal by calcium-based sorbents in fluidized-bed gasification. In: Kainlauri, E. et al. (eds.). ISEE Int.Symp. On Energy and Environment, 25 - 28 August 1991, Espoo. Atlanta, Georgia:American Society of Heating, Refrigerating and Air-Conditioning Engineers, Inc. Pp.267 - 276.
Kurkela, E. Ståhlberg, P. & Laatikainen, J. 1993. Pressurized fluid-bed gasification ex-periments with wood, peat and coal at VTT in 1991 - 1992. Part 1. Test facilities andgasification experiments with sawdust. Espoo: Technical Research Centre of Finland. 55p. + app. 2 p. (VTT Publications 161).

46
Kurkela, E. 1996. Formation and removal of biomass-derived contaminants in flu-idized-bed gasification processes. Espoo: VTT Energy. 47 p. + app. 103 p. (VTT Publi-cations 287.)
Leppälahti, J., Kurkela, E., Simell, P. & Ståhlberg, P. 1994. Formation and removal ofnitrogen compounds in gasification processes. In: Bridgwater, A. V. (ed.) Proc. Conf.Advances in Thermochemical Biomass Conversion, Interlaken, 11 - 15 May 1992. Vol. 1.Glasgow: Blackie Academic & Professional.. Pp. 160 - 174.
Leppälahti, J. & Koljonen, T. 1995. Nitrogen evolution from coal, peat and wood duringgasification: Literature review. Fuel Proc. Tech., vol 43, pp. 1 - 45.
Lindgren, E. R. 1990. Fuel rich sulfur capture. Dissertation. Salt Lake Valley: Universityof Utah, Dept of Chemical Engineering. 110 p.
Ma, R. P., Felder, R. M. & Ferrel, J. K. 1989. Evolution of hydrogen sulphide in afluidized-bed coal gasification reactor. Ind. Eng. Chem. Res., vol. 28, pp. 27 - 33.
Mann, R. M. et al. 1985. Environmental, health and safety data base for the KRW CoalGasification Process Development unit. Vol. II (Aug 82 - June 85). Chicago: GasResearch Institute.
Mayer, G. G. et al. 1979. Correlating process parameters and tar/water production for aslagging fixed-bed gasifier. In: Proc. 1979 Symp. On Instrumentation and Control forFossil Energy Processes, Denver. Pp. 399 - 413.
McDonald, E. C., Aiken, M. & Esplin, G. 1983. Development of analytical methodologyfor biomass gasification products. Washington DC: EPA/ENFOR. 29 p. (ENFOR ProjectC-172.)
McNeil, D. 1981. High temperature coal tar. In: Elliot, M. A. (ed.) Chemistry of CoalUtilization. New York: John Wiley & Sons, pp. 1003 - 1083.
Mojtahedi, W., Kurkela, E. & Nieminen, M. 1987. Alkali-metal control in coalcombustion and gasification. Kemia-Kemi, vol. 13, no. 10, pp. 835 - 840.
Mojtahedi, W., Kurkela, E. & Nieminen, M. 1990. Release of sodium and potassium inpressurised fluidised-bed gasification of peat. J. of the Institute of Energy, vol. 63, no.456, pp. 95 - 100.
Narjes, L. 1964. Anwendung neuartiger Nulldrucksonden zur quasiisokinetischen Staub-probennahme bei hoher Staubstromdichte. Teil I und II. V1286-15 und V1286-16Mitteilung.

47
Narjes, L. 1965. Anwendung neuartiger Nulldrucksonden zur quasiisokinetischenStaubprobenahme in Dampraftanlagen. Staub, vol. 25, no. 4, pp. 148 - 153.
Nelson, P. F. 1989. Combustion-generated polycyclic aromatic hydrocarbons in dieselexhaust emissions. Fuel, vol. 68, pp. 283 - 286.
Newton, G. J. et al. 1979. Sampling of process streams for physical and chemicalcharacterization of respirable aerosols. In: Proc. Symp. Potential Health andEnvironmental Effects of Synthetic Fossil Fuel Technologies, 25 - 28 Sept 1978.Springfield: NTIS. Pp. 78 - 94. (VA, NTIS, ORNL CONF-780903.)
Nguyen, T. et al. 1989. An improved isokinetic sampling probe for measuring local gasvelocity and particle mass flux of gas-solid suspension flows. Powder Technology, vol. 59,pp. 18 - 189.
Oesch, P., Leppämäki, E. & Ståhlberg, P. 1996. Sampling and characterization of high-molecular-weight polyaromatic tar compounds formed in the pressurized fluidized-bedgasification of biomass. Fuel, vol. 75, pp. 1406 - 1412.
Page, G. C. 1978. Environmental assessment: source test and evaluation report -Chapman low-Btu gasification. Washington DC: EPA. 240 p. (EPA-600/7-78-202.)
Piernock, J. L. 1979. Methodology for the determination of gas phase effluent rates in coalgasification systems. Pittsburgh: Carnegie-Mellon Univ. 121 p. (DOE/ET/10249-103.)
Pochan, M. J. & Massey, M. J. 1978. Design and operation of a sampling train for theanalysis of effluents in coal gasification gas-phase process streams. Pittsburgh: Carnegie-Mellon Univ. 50 p. (EPA Interim Report FE-2496-34.)
Price, T. D. et al. 1983. Measurement of nitrogen and sulfur pollutants in an entrained-coal gasifier. Ind. Eng. Chem. Fundam., vol. 22, no. 1, pp. 110 - 116.
Purdy, M. et al. 1985. Fluidized-bed gasification of peat, lignite and subbituminous coal.Raleigh: Environmental Protection Agency. 92 p. (EPA-600/7-84-018.)
Robbie, S. S. & Paterson, P. McC. 1981. Gas sampling from a hot, dirty gas stream. Fuel,vol. 60, pp. 1096 - 1098.
Saviharju, K. 1990. Combustion of low grade fuels in Finland. Proc. Symp. on Low-Grade Fuels, Helsinki, 12 - 14 June 1989. Espoo: Technical Research Centre of Finland.Pp. 67 - 80. (VTT Symposium 107.)
SFS. 1975. SFS 3039. Determination of total cyanides in water. Helsinki: FinnishStandard Organisation. 5 p.

48
Simell, P. 1988. Kotimaisten polttoaineiden kaasutuksessa syntyvät tervamaiset epä-puhtaudet. (Tarry impurities developed in the gasification of indigenous fuels.) Espoo:Technical Research Centre of Finland. 53 p. + app. 22 p. (VTT Research Reports 531.)(In Finnish.)
Simell, P. A. & Bredenberg, J. B. 1990. Catalytic purification of tarry fuel gas. Fuel, vol.69, pp. 1219 - 1225
Simell, P., Kurkela, E. & Ståhlberg, P. 1994. Formation and catalytic decomposition oftars from fluidized-bed gasification. In: Bridgwater, A. V. (ed.) Proc. Conf. Advances inThermochemical Biomass Conversion, Interlaken, 11 - 15 May 1992. Vol. 1. Glasgow:Blackie Academic & Professional. Pp. 265 - 279.
Simell, P. Ståhlberg, P., Solantausta, Y., Hepola, J. & Kurkela, E. 1996. Gasification gascleaning with nickel monolith catalyst. In: Bridgwater, A. V. & Boocock, D. G. B. (eds.).Developments in thermochemical biomass conversion. Vol. 2. Glasgow: BlackieAcademic & Professional. Pp. 1103 - 1116.
Skinner, F. D. 1985. Characterization of raw gas from a low-temperature lignite test at theKRW coal gasification process development unit. Austin. 21 p. (DE-AC21-84MC21046.)
Smart, J. P. & Maalman, T. 1987. An analytical procedure for the quantitativedetermination of NH3 and HCN in combustion systems. IJmuiden: International FlameResearch Foundation. 4 p. (F72/a/16.)
Smoot, L. D. & Hedman, P. O. 1979. Mixing and kinetic processes in pulverized coalcombustors. Provo: Brigham Young University. 23 p. (EPRI Report No. FP-806, EPRIContract No. 304-1.)
Ståhlberg, P., Leppämäki, E., Pitkänen, P. & Nieminen, M. 1994. Paineistettujen kaasutus-prosessien näytteenottomenetelmien ja erityisanalytiikan kehittäminen (Development ofsampling and analytical systems for pressurized gasification processes). In: Hupa, M. &Matinlinna, J. (eds.). Yearbook of the Liekki Programme 1994. Åbo: Åbo AkademiUniversity, 1994. Pp. 675 - 690. (In Finnish).
Ståhlberg, P., Leppämäki, E., Pitkänen, P. & Nieminen, M. 1995. Paineistettujen kaa-sutusprosessien näytteenottomenetelmien ja erityisanalytiikan kehittäminen (Developmentof sampling and analytical systems for pressurized gasification processes). In: Hupa, M. &Matinlinna, J. (eds.). Yearbook of the Liekki Programme 1995. Åbo: Åbo AkademiUniversity, 1995. Pp. 829 - 847.
Ståhlberg, P., Oesch, P., Leppämäki, E., Moilanen, A. & Korhonen, J. 1996. Paineistettu-jen kaasutusprosessien näytteenottomenetelmien ja erityisanalytiikan kehittäminen(Development of sampling and analytical systems for pressurized gasification processes).

49
In: Hupa, M. & Matinlinna, J. (eds.). Yearbook of the Liekki Programme 1996. Åbo: ÅboAkademi University, 1996. Pp. 631 - 651.
Tangerman, A. 1986. Determination of volatile sulphur compounds in air at the parts pertrillion level by Tenax trapping and gas chromatography. J. Chromatography, vol. 366, pp.205 - 216.
Walawender, W. P., Chern, S. M. & Fan, L. T. 1985.Wood chip gasification in acommercial downdarft gasifier. In: Overend, R. P., Milne, T. A. & Mudge, L. K. (eds.)Fundamentals of Thermochemical Biomass Conversion. London: Elsevier, pp. 911 - 921.
Williams, P. T. et al. 1986. The relation between polycyclic aromatic compounds in dieselfuels and exhaust particulates. Fuel, vol. 65, pp. 1150 - 1158.
Williams P. T. 1990. Sampling and analysis of polycyclic aromatic compounds fromcombustion systems: a review. J. of the Institute of Energy, vol. 63, pp. 22 - 30.
Wiltsee, G. 1992. Biomass energy fundamentals. Interim report. EPRI Panel of BiomassGasification Experts, Palo Alto, 24 Jan. 1992. (EPRI RP3295-1).
Zand, A., Felder, R. & Feller, J. 1985. Analysis of nitrogenous compounds in the effluentstreams from a fluidized-bed coal gasification reactor. Fuel Proc. Tech., vol. 10, pp. 249 -259.

METHOD DESCRIPTIONENERGY POV KN 01/90
New Energy Technologies 16 January 1990P.O.Box 1601, FIN-02044 VTT Latest update: 27 March 1998
A/1
APPENDIX A:
GAS SAMPLES, SAMPLING
SAMPLING LINES
1. Object
This method is applied for conducting a sample gas flow from the product gas formed inthermal reactors either to on-line analysers or into a sampling vessel.
2. Scope of application
The method is suitable for moist product gas formed in continuously operating thermalreactors. The product gas may contain solids and condensing impurities (e.g., tar). Thesampling point may be at overpressure or at low pressure.
The method cannot be applied to gases that adsorb on metal, plastic and glass surfacesof the sampling line or that react with these materials or with solids deposited on thefilters.
3. References
Mann, R. et al. Environmental, health and safety data base for the KRW coal gasifica-tion process development unit. Final report. Chicago: Gas Research Institute,1985.
Segeler, C. G. (ed.). Gas engineers handbook. Fuel gas engineering practices. Section 6,Chapter 1. New York: The Industrial Press, 1966.
Ferrell, J. et al. Coal gasification/gas cleanup test fasility. Vol. V. North Carolina: NorthCarolina State University, Dept of Chemical Engineering, 1983. 89 s.
4. Definitions
Subscript n : standard state, p = 1.013 bar, T= 273 K

METHOD DESCRIPTIONENERGY POV KN 01/90
New Energy Technologies 16 January 1990P.O.Box 1601, FIN-02044 VTT Latest update: 27 March 1998
A/2
5. Sampling lines
5.1 Preparation
5.1.1 Cleaning of sampling line
The sampling lines are rinsed with a solvent, water or steam and/or flushing with air ornitrogen. If the sampling line is connected with a gas line containing combustible gases,inert rinsing agents have to be used.
5.1.2 Checking the tightness of the sampling line
The sampling line is pressurised either with gas from process pressure or from a gascylinder, and possible leaks are detected by leak indicators or organoleptically (odour,auditory perception).
If the gas mixture to be studied does not contain oxygen, the leaks can be detected by anoxygen analyser connected to the sampling line.
5.2 Principle of sampling
Prior to sampling the sampling line is filled with the sample gas. If the sample is col-lected into a gas bag or a gas bulb with flow-through, the gas is let to flow a sufficientlylong time (= the amount of gas flown through is at least 10-fold compared with the vol-ume of the whole sampling line) through the gas bulb or the gas bag before shutting offthe gas flow.
If flow-through cannot be employed when filling the sampling line (e.g., 1-valve gasbags, gas absorption), the sample gas is let to flow, a sufficiently long time, through theby-pass line located in the sampling line immediately prior to gas collection (ref. theprevious chapter) to make sure that the sampling line is filled with the gas to be studied.
The gas sample is led through the sampling line either with the aid of process pressureor a pump included in the sampling line to analysers or to a sample vessel. The flow rateof the sample gas is monitored during sampling. If necessary, the total amount of samplegas and the temperature and pressure of the gas just prior to the flow meter are recorded.

METHOD DESCRIPTIONENERGY POV KN 01/90
New Energy Technologies 16 January 1990P.O.Box 1601, FIN-02044 VTT Latest update: 27 March 1998
A/3
5.3 Description of sampling lines
5.3.1 General
The sampling line shall always be as short, small in volume and simple as possible. Ad-ditional joints, valves, filters, etc., should be avoided due to leak risks. When designingthe sampling line, cleaning of the line, sufficient cleaning of sample gas and preventionof condensation shall be considered. Examples of sampling line construction are shownin Figures 1 - 3.
The sampling line in Figure 1 can be applied for clean gases, if the cold trap can beplaced close to (1 - 2 m) the sampling connector. An example of a long sampling linesuitable for a sample gas containing solids and an abundance of condensing substances(water, tar) is shown in Figure 2. In Figure 3, an example of sampling line for pressur-ised gas containing an abundance of solids and condensing substances is shown.
5.3.2 Sampling line for clean gases
The sampling line in Figure 1 can be used when
− the sampling line is short (1 - 2 m) and can be made inclining (when condensing wa-ter does not form a “water lock” in the hose),
− the solids content of the sample gas is <1 g/m3n, (absorption: solids content ∼ 0 g/m3
n
− the tar content of the sample gas is <10 g/m3n.
If the sampling point is at normal atmospheric (= 1.013 bar) or low pressure, no controlvalve is required at the beginning of the sampling line. If the sampling point is at over-pressure, neither a pump nor a control valve are required.

METHOD DESCRIPTIONENERGY POV KN 01/90
New Energy Technologies 16 January 1990P.O.Box 1601, FIN-02044 VTT Latest update: 27 March 1998
A/4
Figure 1. Sampling line for clean gas.
− The tip of the sampling line is installed in the gas line either co-current or right-angleto the gas flow (reduces the solids content of the sample gas).
− Pressure and temperature of gas at the sampling point are measured.
− Sample gas is led through a PTFE or silicone hose into the cold trap. If the sample iscollected by absorbing in the liquid, the cold trap is replaced by a sample vessel. Thesampling line shall be as short as possible and washable with the liquid used for ab-sorbing.
− Water vapour and the heaviest tar components are condensed in the cold trap bycooling the gas to 2 - 5 °C. For example, an ice bath or a compression cooler can beused as cold trap.

METHOD DESCRIPTIONENERGY POV KN 01/90
New Energy Technologies 16 January 1990P.O.Box 1601, FIN-02044 VTT Latest update: 27 March 1998
A/5
− The flow of sample gas is controlled by flow control valve 2 (from a pressurisedprocess, pressure relief and flow control with control valve 1).
− By-pass lines are used when filling the sampling line with the sample gas in caseflow-through cannot be applied.
− Gas flow during filling of the sample line and during sampling is monitored with arotameter.
− The sample is led into the sample vessel or to gas analysers.
− The sampling lines, cold trap and filter are cleaned when necessary.
− The exhaust gases from by-pass lines and sample gas are led safely outside the sam-pling room.
5.3.3 Sampling line for unclean gases
Figure 2 shows a heated sampling line in which the solids are removed with a hot quartzfibre filter. Electric heating prevents both water vapour and tar from condensing on thesurfaces of long sampling lines.
This kind of sampling line can be used when
− the sampling line is long and/or twisting (the cold sampling line is clogged by con-densing water vapour and tar)
− the solids content of sample gas is < 5 g/m3n
− the tar content of sample gas is <150 g/m3n
The temperature of sample gas in the gas line and hot filter is regulated at 150 - 350 °Cby electrical heating or by steam. The temperature level is dependent on the condensingimpurities in the gas (ref. chapter 5.4). Otherwise the sampling is carried out as pre-sented in chapter 5.3.2.

METHOD DESCRIPTIONENERGY POV KN 01/90
New Energy Technologies 16 January 1990P.O.Box 1601, FIN-02044 VTT Latest update: 27 March 1998
A/6
Figure 2. Sampling line for gases containing solid and gaseous impurities.
Figure 3 shows a sampling line with electric heating, which allows an on-line samplingof several days from pressurised process gas containing an abundance of solid and gase-ous impurities. This kind of sampling line can be used when
− the sampling line is long and/or twisting (the sampling line is clogged by condensingwater vapour and tar)
− the solids content of the sample gas is < 50 g/m3n
− the tar content of the sample gas is < 150 g/m3n
GAS PIPE
= HEATING
GAS SAMPLING
GAS
BY-PASS
PUMP
QUARTZ FIBRE
FLOW CONTROL
VALVE 2
FILTER
FLOW CONTROL
VALVE 1SHUT-OFF VALVE
PURGE
GAS ANALYZERS
BY-PASS
VENT
T,p
FILTER
FILTER
PAG
GAS
BULB
PUMP GAS WASHING BOTTLESGAS METER
T,p
FLOW CONTROLVALVE 2
ROTAMETER
CONDENSER
METHOD DESCRIPTIONENERGY POV KN 01/90
New Energy Technologies 16 January 1990P.O.Box 1601, FIN-02044 VTT Latest update: 27 March 1998
A/7
Figure 3. An example of sampling line for a pressurised process.
PUMP GAS WASHING BOTTLESGAS METER
FLOW CONTROLVALVE 2
GAS SAMPLING BULB GAS BAG
BY-PASS
FLOW
METER
FLOW CONTROL
FILTER
= CONTROL VALVE
= SHUT-OFF VALVE
= HEATING
FLOW CONTROL
QUARTZ FIBRE
FILTER
P
P
P
T
T T
T
T
P
GAS PIPE
CYCLONE
FILTERS
VENTPURGE PURGE
VENT
GAS ANALYZERS
CERAMIC
FILTER
T
BY-PASST,p
CONDENSER

METHOD DESCRIPTIONENERGY POV KN 01/90
New Energy Technologies 16 January 1990P.O.Box 1601, FIN-02044 VTT Latest update: 27 March 1998
A/8
− The tip of the sampling line is installed in the gas line either co-current or right-angleto the gas flow (reduces the solids content of the sample gas).
− The pressure and temperature of gas at the sampling point is measured.
− There shall be a shut-off valve first in the sampling line for shutting off the line atany time (also in case of leaks). This valve should be resistant to process tempera-ture.
− Removal of solids with cyclone, ceramic hot filter and cold trap. The parallel hotfilter lines enable on-line sampling and change of filter in clogging situations. Thetype and number of particulate separators in the sampling line is chosen on the basisof solids contents in the sample gas (ref. chapter 5.3). Quartz and fibreglass filterscan also be used as hot filters.
− If the sample gas is absorbed into liquid, the cold trap is replaced by the absorptionliquid, and a hot quartz fibre filter is added to the sampling line (before absorption).
− Pressure relief is carried out in stages with three manual control valves. It can also beperformed with one valve only (flow control), but a steadier pressure relief andhigher reliability in service (leaks due to contamination of valves) are achieved by in-stalling several valves.
− Pressure relief and clogging in the sampling line are monitored by pressure measure-ments.
− Nitrogen flush lines are placed in such a mode that the most important valves and gaslines can be cleaned in both directions.
− By-pass lines are used for cleaning gas lines, regulating pressures and filling the gasline with the sample gas.
− Condensation of water vapour and condensable gases (clogging of the sampling line)before the cold trap is prevented by electric heating keeping the gas at 150 - 350 °C.
− The flow of sample gas is regulated by the last control valve of the line, from whichthe gas is led through as short a silicone or PTFE hose, or through a glass pipe intothe cold trap or the absorption vessel.
− In the cold trap, water and tars are condensed from gas by cooling the gas to 2 - 5 °C.
− For example, an ice bath or a compression cooler can be used as the cold trap.
− The gas flow during the removal of flushing gases and essential sampling is moni-tored with a rotameter.

METHOD DESCRIPTIONENERGY POV KN 01/90
New Energy Technologies 16 January 1990P.O.Box 1601, FIN-02044 VTT Latest update: 27 March 1998
A/9
− The sample gas is led either to analysers or to a gas bulb or a gas bag.
− The sampling lines, the cold trap and the filters are cleaned when necessary.
− The exhaust gases from by-pass lines and sample gas are led safely outside the sam-pling room.
5.4 Operating conditions
The method can be used for sampling gases at 0.8 - 50 bar (abs.) and < 850 °C.
The filtration methods of sample gas and the temperature level of electric heating areprimarily dependent on the solids content of the product gas and on the amount andquality of condensing substances. In addition, they are also affected by the placing of thecold trap with regard to the sampling connector, the density and duration of sampling,and the cleanability of sampling lines, filters and cold trap between samplings.
If the gas contains solids, a fibre filter (absolute filter) shall always be used prior to ab-sorption in the sampling based on absorption.
In long-term continuous sampling, a fibre filter is required before the cold trap when thesolids content 1 g/m3n. Smaller solids contents can be removed in the cold trap (ice bath)and then with cotton wool and/or fibre filters. In addition, the on-line analysers alwaysrequire filters of their own.
If the solids content exceeds 5 g/m3n, a ceramic filter is required as a pre-filter, and if thesolids content exceeds 20 g/m3
n, additionally an cyclone filter is required.
The temperature in the sampling line of the product gas of the updraft gasifier is kept at250 - 350 °C, in downdraft and fluidised-bed gasification at 200 - 250 °C and for fluegases at 150 - 200 °C.
5.5 Equipment and materials
Sampling lines with Acid-proof steel, AISI 316electric coveringheating:Cold sampling lines: Silicone or PFTE hosesCold trap: Acid-proof steel, AISI 316,
Gas volume 4 x 0.4 l, ice bathCompression cooler, e.g., H&B CGEK 4

METHOD DESCRIPTIONENERGY POV KN 01/90
New Energy Technologies 16 January 1990P.O.Box 1601, FIN-02044 VTT Latest update: 27 March 1998
A/10
Filters: Munktell MK 360, quartz fibre, 30 x 77mm,
Max. temperature 950 °C
Retention capacity 99.998% (0.3 m), DOP-stand.
Munktell MG 160, fibreglass, 30 x 77 mm
Max. temperature 500 °C
Retention capacity 99.998 % (0.3 m), DOP-stand.
Ceramic filter: Silicon carbide, 50 x 30 x 135 mm
H&B order no. 23005-4-0874725
Pumps (e.g.): Sartorius GmbH, membrane pump
Type SM 16612, 120 W
Sartorius GmbH, membrane pump
Type SM 16692, 80 W
Rotameters (e.g.): Fischer & Porter D10A1017
Gas meter: Ritter NB 3 (dry)
KIMMON N3
5.6 Safety
The sample gases are often combustible and poisonous.
Sampler: Eye protectors, personal CO alarm device, safety gloves,
additionally
pressurised processes: helmet, face shield
Sampling site: Good air-conditioning, exhaust gases shall be led outside work
rooms, staying in the vicinity of pressurised lines shall be
avoided.
6. Assessment of the methodWeaknesses of the method:− It is difficult to detect leaks in atmospheric sampling (low pressure in the sampling
line).
− Part of gases may adsorb on the sampling line or on solids deposited on filters or theymay condense.

METHOD DESCRIPTIONENERGY ENE KN 04/94
New Energy Technologies 15 February 1995P.O.Box 1601, FIN-02044 VTT Last update: 27 March 1998
B/1
APPENDIX B:
TAR SAMPLES, SAMPLING
1. Object
This method is used for determining the content of condensable organic compounds(tars) in gas. It can be applied for collecting compounds having molecular weight rangefrom benzene (C6H6, MW 78 g/mol) up to pyrene (C16H10, MW 202 g/mol). Tars in thiscontext comprise compounds heavier than benzene.
2. Scope of application
The method is suitable for separating organic compounds formed in gasification of solidfuels from the gas phase to a solvent. The gas to be sampled may contain solids andwater vapour, in addition to gaseous components. The organics may exist as gas phasecomponents and/or as aerosols.
The method has been applied for atmospheric updraft, downdraft and fluidised-bed gasi-fication processes and for pressurised fluidised-bed gasification processes. The tem-perature of gas has ranged 50 - 900 °C in these processes. The sampling line to be usedis selected by the process, while tar absorption is in principle always carried out in thesame way.
If the temperature of the gas under study is so low at the sampling site that the organiccompounds are condensed and form aerosols and/or drops, isokinetic sampling shouldbe applied. In such a case instructions given in the standards ISO 9096 or VDI 2066 forsampling of flue gases should be followed.
The sampling lines should be heated in order to prevent tar compounds from condens-ing. However, to avoid thermal decomposition of compounds, the temperature shouldnot be too high. In updraft gasification the temperature should be below 400 °C, whilein downdraft and fluidised-bed gasification it can rise to nearly 800 °C at the tip of thesampling probe, if catalytic substances decomposing tar (i.e. dolomite, limestone) arenot collected on the filters. According to experiences in practice, 200 - 300 °C is suit-able gas temperature in the sampling line before tar absorption.

METHOD DESCRIPTIONENERGY ENE KN 04/94
New Energy Technologies 15 February 1995P.O.Box 1601, FIN-02044 VTT Last update: 27 March 1998
B/2
3. References
1. Kurkela, E., Ståhlberg, P. & Laatikainen, J. Pressurized fluidized-bed gasificationexperiments with wood, peat, and coal at VTT in 1991 - 1992. Part 1. Test facilitiesand gasification experiments with sawdust. Espoo: Technical Research Centre ofFinland, 1993. (VTT Publications 161).
2. Simell, P. Tarry impurities developed in the gasification of indigenous fuels. Espoo:Technical Research Centre of Finland, 1988. (VTT Research Reports 531). In Fin-nish.
3. Environmental Protection Agency (EPA) Method 5. Determination of particulateemissions from stationary sources. Federal Register, 1971. Vol. 36, No. 247, p.24888 -24895.
4. SFS 3866. Determination of dust emission. Helsinki: Finnish Standards Association,1978.
5. Niskanen, V. & Puustinen, M. Emission measurements at VTT's Laboratory ofHeating and Conditioning. Espoo: Technical Research Centre of Finland, 1982.(VTT Research Notes 129). In Finnish.
4. Definitions
Subscript n: standard state, pressure p = 1.013 bar and temperature T = 273.15 K
Light tar compounds: molar mass 79 - 202 g/mol
Heavy tar compounds: molar mass >200 g/mol.
5. Sampling
5.1 Preparation
Preparation of sampling lines is described in method description POVKN 01/90.
The sampling probe or the gas line is heated to its set value.
The solvent used for tar absorption (dichloromethane) and the glass beads used for im-proving material and heat transfer are dosed in gas wash bottles. The bottles are placedin the cold bath and let to cool to the temperature of the bath (min. 10 min).

METHOD DESCRIPTIONENERGY ENE KN 04/94
New Energy Technologies 15 February 1995P.O.Box 1601, FIN-02044 VTT Last update: 27 March 1998
B/3
5.2 Principle
Gas is led from the reactor or the gas pipe via the sampling line to the gas bottles in thecold bath. The organic compounds are absorbed to the solvent in the bottles. Theamount, temperature, pressure and flow rate of the gas flowing through the equipmentare measured after the bottles.
After sampling the contents of the impinger bottles, including the glass beads, are de-canted into a storage bottle, which is stored tightly closed at cool, <5 °C, temperature forlater analysis (see Method description ENEKA 102/94 Analysis of tar samples).
5.3 Sampling equipment
The sampling equipment is presented in detail in method description POVKN 01/90.The principle of the sampling system is shown in Figures 1 - 3.
In atmospheric sampling the probe is loosened and cleaned after each sampling. As it isnot possible to loosen the probe between samplings in pressurised conditions, the probeand the filters are cleaned by nitrogen purge.
The impinger train comprises of six bottles connected in series:
- The first and the sixth bottle are half-filled with glass beads.
- The second, third and fourth bottle contain 70 ml solvent.
- The fifth bottle is half-filled with glass beads and contains 30 ml solvent.
- The first four bottles are placed in an ice bath, temperature 0 oC.
- The two last bottles are placed in an acetone-CO2 ice bath, temperature <70 °C.
If the aim is to determine water-soluble compounds for the sample gas, ion-exchangedor distilled water is used in the first two bottles (see Figure 2) .
The dimensions of the gas wash bottles are given in chapter 5.5 and Figure 4, and thestructure of the ice and dry ice bath is shown in Figure 3.

METHOD DESCRIPTIONENERGY ENE KN 04/94
New Energy Technologies 15 February 1995P.O.Box 1601, FIN-02044 VTT Last update: 27 March 1998
B/4
5.4 Operating conditions
The volume of the gas drawn to the tar sample is dependent on the tar content of the gas.A suitable sample volume in pressurised fluidised-bed gasification (tar <20 g/m3
n) is 50- 100 dm3
n and in updraft gasification (tar 100 - 200 g/m3n) 30 - 50 dm3
n. The total con-tent of tar in the solvent should be about 10 g/dm3 for gravimetric determination andabout 2 g/dm3 for gas chromatographic analysis. However, the detection limit is signifi-cantly lower for single components (0.25 ppm).
The gas flow rate in sampling cannot exceed 15 dm3n /min with the impingers and sol-vent amounts applied. Normally the flow rate is significantly lower, being in the rangeof 5 - 10 dm3
n /min. In isokinetic sampling the flow rate of gas can be affected by thechoice of the tip diameter of the probe.
The maximum temperature of the gas can be slightly above 800 °C at the sampling site.In the sampling line, the gas temperature is kept at 350 - 400 °C, from which it de-creases to about 200 °C prior to the impingers. In the ice and dry ice baths the gas is thenfurther cooled. Problems can arise, if the ambient temperature is below 0 °C, as waterand tar are condensed and frozen in bends and joints connecting the impinger bottles.
5.5 Materials
Sample lines: (pump, measuring apparatus, etc.), see ENEKN 01/90
Probe: Acid-proof steel, AISI 316 or
Fire-proof steel, AISI 310
Filtration: Filter holder: Acid-proof steel, AISI 316
Filter 1: Munktell MK 360, quarz fibre 30 · 77 mm
max. temperature 950 ºC, retention capacity 99.998%
Filter 2: Sampling filter
Silicon carbide, o.d. 12.7 mm, i.d. 20.5 mm, length 100 - 300 mm
Manufacturer: Refractron Technologies Corporation
Gas wash bottles:a) bottle
volume 250 ml, o.d. 40 mm, i.d. 34 mm, length 300 mm
inside conical ground joint NS 24/29
ground stopper

METHOD DESCRIPTIONENERGY ENE KN 04/94
New Energy Technologies 15 February 1995P.O.Box 1601, FIN-02044 VTT Last update: 27 March 1998
B/5
b) inside
pipe, o.d. 12 mm, i.d. 10 mm
outside conical ground joint NS 24/29
inside ball ground joint S 19/7 and 13/5 (gas in)
outside ball ground joint S 13/5 (gas out)
c) glass bends
length about 60 mm
inside and outside ball ground joint S 13/5
Material is standard laboratory glass.
Glass beads: o.d. 6 mm
Solvent: dichloromethane (methylene chloride), p.a.
Cold bath: Acid-proof steel, AISI 316
CO2 ice, preferably pellets
Acetone, technical
Sample bottles: 500 ml storage bottle with PPN screw plug (GL45) and pouring ring
5.6 Safety
The sample gases are combustible and poisonous.
Dichloromethane is readily vaporised, is a respiratory poison, causes headache, dizzi-ness and nausea. Solvent vapours irritate mucous membranes (sore throat) and eyes, seeInformation about operational safety.
Acetone is readily vaporised and inflammable, irritates mucous membranes and eyes,see Information about operational safety.
Sampler: Eye protectors, personal CO alarm device, safety gloves, respiratormask when working with solvents, helmet and face shield in pressur-ised processes
Sampling site: good air-conditioning, exhaust gases must be led outside workrooms,staying in the vicinity of pressurised lines shall be avoided.
Solvent handling: good air-conditioning, the inflammability of acetone should be con-sidered.

METHOD DESCRIPTIONENERGY ENE KN 04/94
New Energy Technologies 15 February 1995P.O.Box 1601, FIN-02044 VTT Last update: 27 March 1998
B/6
6. Assessment of the method
The heaviest tar components can be condensed on the walls of the sampling lines in theconditions presented above. Solids derived from unfiltrated gas may deposit in particu-lar in bends and chokes.
Safety hazards due to solvents should be considered. Wash bottles should be filled andsamples recovered in an air-conditioned room, for example in a fume cupboard of thelaboratory.

METHOD DESCRIPTIONENERGY ENE KN 04/94
New Energy Technologies 15 February 1995P.O.Box 1601, FIN-02044 VTT Last update: 27 March 1998
B/7
T
T
GAS WASHING BOTTLES
123456
ELECTRICHEATING
dP
PITOT-TUBE
VALVECONTROL
III H2OCH2Cl2 H2OCH2Cl2
CH2Cl2CH2Cl2 CH2Cl2CH2Cl2
p = 1 bar 150 - 400 °C
PUMP
GLASS or PTFE TUBE
VOLUME FLOW (for absorbing tars to solvent)
(as short as possible)
QUARTZ FIBERFILTER
WATER+ICE
ACETONE+CO2 -ICE
T p
T
METERS
BALL VALVE
GLASS-BEADS
Figure 1. Atmospheric and isokinetic sampling of tars.

METHOD DESCRIPTIONENERGY ENE KN 04/94
New Energy Technologies 15 February 1995P.O.Box 1601, FIN-02044 VTT Last update: 27 March 1998
B/8
SHUTT-OFF and
VALVES
T
GAS WASHING BOTTLES
1 2 3 4 5 6WATER+ICE
ACETONE +CO2 -ICE
ELECTRICHEATING
p > 1 bar
P
CH2Cl2H2O CH2Cl2
CH2Cl2 CH2Cl2CH2Cl2 CH2Cl2
150 - 400 °C
GLASS or
III H2O
(depending on process temperature)
(for absorbing tars to solvent)
VOLUME FLOW
STAINLESS STEEL(acid-proof or fire-proof)
PTFE TUBE-
CONTROL
PUMP
METERS
T
PURGE (nitrogen)
METHOD DESCRIPTION: ENEKN 04/94
APPENDIX 1 2(2)
FIGURE 2. Tar sampling from solids free (fil tered) gas.
PURGE (nitrogen)
FLOW CONTROL
SHUT-OFFVALVE
T
T
1 2 3 4 5 6
ELECTRICHEATING
CERAMICFILTER
p > 1 bar
P
CH2Cl2H2O CH2Cl2
CH2Cl2 CH2Cl2CH2Cl2 CH2Cl2
150 - 400 °C
III H2O
Tp
T
FIGURE 3. Tar sampling from pressurised, solids containing gas.
Tp
STAINLESS STEEL(acid-proof or fire-proof)
(depending on process temperature)
GLASS or
PTFE TUBE
VOLUME FLOWMETERS
ACETONE +CO2 -ICE
WATER+ICE
GAS WASHING BOTTLES(for absorbing tars to solvent)
GLASS-BEADS
Figure 2. Tar sampling from solids free (filtered) gas.
Figure 3. Tar sampling from pressurised gas containing solids.

METHOD DESCRIPTIONENERGY ENE KN 04/94
New Energy Technologies 15 February 1995P.O.Box 1601, FIN-02044 VTT Last update: 27 March 1998
B/9
Ball ground joints:1. Bottle 19 x 7
Other bottles 13 x 5Ball ground
13 x 5
Conical ground joints24/29
Din= 34 mms= 3 - 5 mm
Din= 9 mms= 1.5 mm
~260 mm
Gas flow in Gas flow out
50 - 55
40
Din= 5 mms= 1.5 mm
joints1. Bottle, Din= 9, s= 1.5Other bottles: Din= 5, s= 1.5
Figure 4. The gas washing bottle and the glass blend.

METHOD DESCRIPTIONENERGY ENE KN 04/94
New Energy Technologies 15 February 1995P.O.Box 1601, FIN-02044 VTT Last update: 27 March 1998
B/10
Figure 5. The gas washing bottles and the cold bath.
T H E GAS W A SH I NG BOTTLES
APPENDI X 3
and TH E COLD BA T H
35 20
35
280
110190
272 272
~390
240
35
35
The width of the lid support = 12 mm
45 45 45
40
40 40
Din= 34 Din= 10
26
0
PLASTIC LID
WAL LINSUL ATED
INSULATION
Gas in
Gas out
1
2 3
4 5
6
Ball ground
13 x 5
Conical ground
24/29
joints joints

METHOD DESCRIPTIONENERGY ENE KN 06/95
New Energy Technologies 28 February 1995P.O.box 1601, FIN-02044 VTT Last update: 27 March 1998
C/1
APPENDIX C:
HEAVY TAR SAMPLES, SAMPLING
1. Object
This method is used for the measurement of the content of condensable polyaromaticcompounds (heavy tars) in gas. The heavy tars comprise in this context compounds witha molar mass higher than 200 g/mol and a boiling point higher than 350 °C. The methodcan be applied in the determination of the total content and composition of tar com-pounds condensable at 150 °C.
2. Scope of application
The method is suitable for sampling organic compounds formed in the gasification ofsolid fuels with a molar mass higher than 200 g/mol. Sampling is carried out by con-densing compounds from the gas phase on the surface of a cooling pipe and on a filter.The gas may contain solids in addition to gaseous components. The method cannot beapplied for compounds that are condensable or form aerosols in the process conditionsprevailing at the sampling site.
As the condensation of different compounds at different temperatures is affected by theircontent/vapour pressure in the gas, compounds with a molar mass of 120 - 200 g/mol(naphthalene 128 g/mol) are also often condensed in the sampling. These compounds inthe heavy tar sample are analysed by gas chromatography. In addition to the content ofthe tar compounds and the vapour pressure, condensation is affected by the pressure andthe temperature of the process. The temperature should be above 400 °C at the samplingsite of heavy tars. To prevent tar compounds from condensing too early, the samplingline prior to the collecting equipment should be heated to the process temperature.
The method has been applied for pressurised fluidised-bed gasification processes, but itis also applicable, with the restrictions given above, for atmospheric fluidised bed,downdraft and updraft gasification processes.

METHOD DESCRIPTIONENERGY ENE KN 06/95
New Energy Technologies 28 February 1995P.O.box 1601, FIN-02044 VTT Last update: 27 March 1998
C/2
3. References
The method has been modified for gasification gases by the Gasification ResearchGroup of VTT Energy. A similar method has been used for determining polycyclic aro-matic compounds (PAC) in flue gases and car exhaust gases.
1. Williams, P. T. Sampling and analysis of polycyclic compounds from combustionsystems: a review. J. of Institute of Energy, 1990. March, pp. 22 - 30.
2. Kurkela, E., Ståhlberg, P. & Laatikainen, J. Pressurized fluidized-bed gasificationexperiments with wood, peat, and coal at VTT in 1991 - 1992. Part 1. Test facilitiesand gasification experiments with sawdust. Espoo: Technical Research Centre ofFinland, 1993. (VTT Publications 161).
4. Definitions
Subscript n: standard state, pressure p = 1.013 bar and temperature T = 273.15 K
Light tar compounds: MW 79 - 202 g/mol
Heavy tar compounds: MW >200 g/mol.
5. Sampling
5.1 Preparation
Preparation of sampling lines is described in method description POVKN 01/90.
The temperature of process gas at the sampling site is measured, and the sampling probeand the gas line are heated to the set values.
The temperature of the gas cooling pipe is set 10 - 30 °C above that (150 °C) of the filterused in sampling by leading hot nitrogen into the mantle pipe of the cooling pipe.
Weighed filters, weighing precision 0.0001 g, are used for condensing the heavy tars.Prior to weighing the filters are dried at 110 +/- 5 °C for 2 hour and then cooled to roomtemperature in an exsiccator for 1 hour. The filter is heated to the condensing tempera-ture prior to sampling.

METHOD DESCRIPTIONENERGY ENE KN 06/95
New Energy Technologies 28 February 1995P.O.box 1601, FIN-02044 VTT Last update: 27 March 1998
C/3
5.2 Principle
Sample gas is led via the sampling line kept at the process temperature into the coolingpipe and further to the quartz fibre filter kept at the standard temperature of 150 °C. Theheavy tar compounds contained in the gas are condensed both in the cooling pipe and onthe filter. After filtering the remaining light tar and heavy tar compounds and water va-pour are removed either in a cold tarp or in impinger bottles, and the gas is led to me-tering. After sampling, the cooling pipe is washed and the filter is extracted with di-chloromethane. The solvent used in the wash of the cooling pipe is recovered and com-bined with that used in the extraction of the filter. The combined solvent is placed in astorage bottle, which is stored tightly closed in cool place (<5 °C) for later analysis (seeMethod description ENEKA 102/94, Analysis of tar samples).
5.3 Sampling equipment
The so-called hot part (at process temperature) of the sampling equipment should al-ways be as short, small in volume and simple as possible.
The main components of the sampling assemblies listed in Figures 1 - 3 are:- Ceramic filter- Electrically heated probe- Shut-off valve- Pressure relief/constant flow valve- Gas cooling pipe and preheater of cooling nitrogen- Sampling filter (quartz fibre filter)- Condenser (ice bath), gas wash bottles (see method description ENE KN 04/94- Gas pressure, temperature and flow meteringThe sampling assemblies showed in Figures 1 - 3 differ from each other only at the siteof the ceramic hot filter. The filter cannot be placed at the tip of the sampling line, if thetemperature of the sampling site exceeds 700 °C.
5.4 Operating conditions
The volume of the gas drawn to the tar sample is dependent on the tar content of the gas.A suitable sample volume in pressurised fluidised-bed gasification (tar <20 g/m3
n) is100 - 600 dm3
n and flow rate 4 - 6 dm3n /min. The total content of tar in the solventshould be about 10 g/dm3 for gravimetric determination and about 2 g/dm3 for gaschromatographic analysis. However, the limit of detection is significantly lower for sin-gle components (0.25 ppm).

METHOD DESCRIPTIONENERGY ENE KN 06/95
New Energy Technologies 28 February 1995P.O.box 1601, FIN-02044 VTT Last update: 27 March 1998
C/4
The temperature of the gas can be 400 - 850 °C at the sampling site. When the tem-perature exceeds 700 °C, the temperature of the gas in the sampling probe can be low-ered to 650 - 700 °C. The ceramic hot filter of the sampler is placed at the site, wherethe temperature of the gas is below 700 °C. This prevents the catalytic solids (e.g.,dolomite) possibly deposited on the filter from affecting tar compounds.
5.5 Materials
Sample lines: (pump, measuring apparatus, etc.)see POVKN 01/90
Probe: Acid-proof steel, AISI 316 orFire-proof steel, AISI 310
Hot filtration: Filter holder: Acid-proof steel, AISI 316Filter 1: Munktell MK 360, quarz fibre, o.d. 90 mm
max. temperature 950 ºC, retention capacity 99.998%Filter 2: Sampling filter
Silicon carbide, o.d. 12.7 mm, i.d. 20.5 mm,length 100 - 300 mmManufacturer: Refractron Technologies Corporation
Condenser: Acid-proof steel, AISI 316(ice bath)Solvent: dichloromethane (methylene chloride), p.a.Sample bottles: 500 ml or 1 000 ml storage bottles with PPN screw plug (GL45)and pouring ring
5.6 Safety
- The sample gases are combustible and poisonous.
- The operation and condition of the sampler should be controlled over the whole sam-pling time.
- Staying in the immediate vicinity of hot and pressurised sampling lines should beavoided.
Dichloromethane is readily vaporised. It is a respiratory poison and causes head-ache,dizziness and nausea. Solvent vapours irritate mucous membranes (sore throat) andeyes, see Information about operational safety.

METHOD DESCRIPTIONENERGY ENE KN 06/95
New Energy Technologies 28 February 1995P.O.box 1601, FIN-02044 VTT Last update: 27 March 1998
C/5
Sampler: Eye protectors, personal CO alarm device, safety gloves, respiratormask when working with solvents, helmet and face shield in pres-surised processes
Sampling site: good air-conditioning, exhaust gases must be led outside work-rooms, staying in the vicinity of pressurised lines shall be avoided.
Solvent handling: good air-conditioning, the inflammability of acetone should be con-sidered.
6. Assessment of the method
The heaviest tar components can be easily condensed on the walls of the sampling linesin the conditions presented above. However, good results have been obtained with themethod, considering how difficult the compounds are to collect.
Safety hazards due to the solvents should be considered. The probe should be washedwith dichloromethane in a well air-conditioned room, and it should be cooled thor-oughly prior to washing.
Sample analysis: Method description ENE KA102/94.

METHOD DESCRIPTIONENERGY ENE KN 06/95
New Energy Technologies 28 February 1995P.O.box 1601, FIN-02044 VTT Last update: 27 March 1998
C/6
SAM PLI NG TRAI N for HEAVY TARS
HEATED ZONE(in process temperature)
PREHEATER (100-300 °C)
NITROGEN IN
COOLER
NITROGEN OUT
T
T
QUART Z FI BRE FI LTER
150 °C
160 - 180 °CSAM PL I NG
OF HEAVY TARS
T
SHUT-OFFVAL VE
CONTROL VAL VE
p > 1 bar(a)
GASFLOW
T
CERAM I C FI LTER
ELECTR I CHEAT I NG
T
CONDENSER
(I CE BATH)
FLOW M ETER
Tp
Figure 1. Sampling train for heavy tars.

METHOD DESCRIPTIONENERGY ENE KN 06/95
New Energy Technologies 28 February 1995P.O.box 1601, FIN-02044 VTT Last update: 27 March 1998
C/7
Figure 2. Sampling train for heavy tars.
HEATED ZONE(in process temperature)
PREHEATER (100-300 °C)
NITROGEN IN
COOLER
NITROGEN OUT
T
T
QUARTZ FIBRE FILTER
160 - 180 °C
SAMPLING
OF HEAVY TARS
T
SHUT-OFFVALVE
CONTROL
p > 1 bar(a)
GAS
FLOW
T
FILTERELECTR IC
HEATING
SAMPLING TRAIN for HEAVY TARS
VALVE
APPENDEIX 1 2(2)
CONDENSER
(ICE BATH)
FLOW METER
Tp

METHOD DESCRIPTIONENERGY ENE KN 06/95
New Energy Technologies 28 February 1995P.O.box 1601, FIN-02044 VTT Last update: 27 March 1998
C/8
Figure 3. Sampling train for heavy and light tars.
HEATED ZONE(in process temperature)
PREHEATER (100-300 °C)
NITROGEN IN
COOLER
NITROGEN OUT
T
T
QUARTZ FIBRE FILTER
150 °C
160 - 180 °CSAMPLI NG
OF HEAVY TARS
T
SHUT-OFFVALVE
CONTROL VALVE
p > 1 bar(a)
GAS
FLOW
T
CERAMIC FILTER
ELECTR IC
HEATING
SAMPLIN G TRAIN for HEAVY and LIGHT TARS
T
GAS WASHING BOTTLES
1 2 3 4 5 6 ACETONE +CO2 -ICE
CH2Cl2H2O CH2Cl2
CH2Cl2 CH2Cl2CH2Cl2 CH2Cl2III H2O
ICE BATH
CONDENSER
(ICE BATH)
FLOW METER
Tp
GLASS-BEADS
APPENDEIX 1 3(3)

METHOD DESCRIPTIONENERGY ENEKN 102/94
New Energy Technologies 15 February 1995P.O.Box 1601, FIN-02044 VTT Last update: 27 March 1998
D/1
APPENDIX D:
TAR SAMPLES, ANALYSIS
1. Object
These methods are used for determining the content of condensable organic compounds(tars) in samples absorbed in a solvent.
2. Scope of application
The methods are suitable for tar samples drawn from the product gas of the gasificationof solid fuel by absorbing tar compounds in a solvent. In addition to the solvent and or-ganic tar components, the sample may contain solids and water. In this method descrip-tion, tar means organic compounds heavier than benzene (C6H6, molar mass 78 g/mol).The gas chromatographic method for light tars is also suited for the analysis of benzene.
The method of analysis to be applied is dependent on the way of formation and the con-tent of the tarry substance to be determined. Gas chromatographic analyses are suitablefor samples consisted of volatile organic compounds. Such samples are obtained fromprocesses, in which the tarry substances are formed at high temperature (>700 °C), forexample in fluidised bed and downdraft gasification. The total content of analysablecompounds is usually less than 20 g/m3
n in these processes.
Gravimetric methods are suitable for monitoring the tar content of samples that aredrawn from peat and biomass gasification and contain poorly volatile and heavy organiccompounds, and for evaluating and comparing the total tar content. Vaporisation atroom temperature is suitable only for samples that do not contain water or tar com-pounds lighter than phenanthrene (C14H10, molar mass 178 g/mol).
In updraft gasification the content of the heavy tar fraction analysed gravimetrically hastypically been >10 g/m3n, and the total tar content >50 g/m3
n. In downdraft and flui-dised-bed gasification the amount of heavy tar compounds is usually less than 3 g/m3n,while the total tar content is about 20 g/m3
n.
METHOD DESCRIPTIONENERGY ENEKN 102/94
New Energy Technologies 15 February 1995P.O.Box 1601, FIN-02044 VTT Last update: 27 March 1998
D/2
3. References
1. Kurkela, E., Ståhlberg, P. & Laatikainen, J. Pressurized fluidized-bed gasificationexperiments with wood, peat, and coal at VTT in 1991 - 1992. Part 1. Test facilitiesand gasification experiments with sawdust. Espoo: Technical Research Centre ofFinland, 1993. (VTT Publications 161).
2. Simell, P. Tarry impurities developed in the gasification of indigenous fuels. Espoo:Technical Research Centre of Finland, 1988. (VTT Research Reports 531). In Fin-nish.
4. Definitions
Subscript n and NTP: standard state, pressure p = 1.013 bar and temperature T = 273 K
Light tar compounds: molar mass 79 - 202 g/mol
Heavy tar compounds: molar mass >200 g/mol.
5. Sampling
Sampling of light tar compounds is specified in method description ENEKN 04/94 andsampling of heavy tars in method description ENEKN 06/95.
6. Analysis
6.1 Principle
Water and possible solids are separated from the mixture of tar and solvent obtained insampling. The volume of the sample solution is measured. The tar contained in the sol-vent is analysed by gas chromatography and/or gravimetrically, depending on the qualityof the sample.
Tar consists of volatile organic compounds and is formed in gas phase reactions at hightemperature, for example, in fluidised-bed and downdraft gasification. It is analysedboth by capillary gas chromatography with flame-ionisation detector (FID detector) andgravimetrically. A mass selective detector (MSD) is used for the identification of the tarcompounds. Two gas chromatographic methods are used for quantitative analysis: 1)light tar and 2) heavy tar method.

METHOD DESCRIPTIONENERGY ENEKN 102/94
New Energy Technologies 15 February 1995P.O.Box 1601, FIN-02044 VTT Last update: 27 March 1998
D/3
The content of tar (or tar fraction) that contains poorly volatile compounds can be de-scribed with gravimetric methods based on the evaporation of the solvent in standard con-ditions and on weighing of the evaporation residue. Tar of this kind is formed abun-dantly in updraft gasification, and minor amounts also in downdraft and fluidised-bedgasification.
The evaporation residue obtained in oven at 105 °C represents the content of the tarfraction formed by heavy and high-boiling (b.p. >300 °C) compounds. The distillationresidue contains more lighter compounds and hence corresponds more closely to thetotal amount of tar. This factor has been discussed in further detail in reference [2]. Ifthe heavy tar sample has been taken according to method description ENEKN 06/95 (onhot filter 150 °C) the evaporation can be carried out at room temperature.
6.2 Equipment and materials
6.2.1 Sample preparation
− graduated flask 500 ml or 1 000 ml
− Büchner funnel
− storage bottle 500 ml
− glass fibre filter paper (Whatman GF/A)
− filter flask 1 000 ml
− dichloromethane (p.a.)
6.2.2 Gas chromatographic analysis
a) Sample preparation- pipette 5 and 20 ml- graduaded flask 25 and 200 ml- disposable pipette- GC sample flask with stopper- dichloromethane (p.a.)
b) ISTD solution- graduated flask 1 000 ml- decanter 10 ml- funnel- dodecane (C12H26), GC quality (99.5%)- dichloromethane (p.a.)

METHOD DESCRIPTIONENERGY ENEKN 102/94
New Energy Technologies 15 February 1995P.O.Box 1601, FIN-02044 VTT Last update: 27 March 1998
D/4
c) Model compound solution- pipette 1 ml- graduated flask 1 000 ml- funnel- decanter 10 ml- spattle- dichloromethane (p.a.)- model compounds (p.a., see Enclosure)
d) Gas chromatographic analysis- GC column HP Ultra 2 (50 m x 0.32 mm i.d., phase 0.52 mm) for light tar com-
pounds, or HP Ultra 2 (25 m x 0.32 mm i.d., phase 0.52 mm) for heavy tar com-pounds
- HP 19251-60540 split-splitless liner- gas chromatograph (HP 5890A) and integrator (HP 3396A)- Sperry 3070-09 PC, or other MS-DOC PC with HP SERVER.EXE program.
6.2.3 Gravimetric analysesa) Evaporation at 105 °C
- pipette 50 ml- evaporating dish 60 ml- exsiccator- fume cupboard- heating chamber, 105 °C- analytical balance
b) Evaporation at room temperature- pipette 50 ml- round-bottomed flask 100 ml- funnel- cotton wool- fume cupboard- analytical balance- dichloromethane (p.a.)

METHOD DESCRIPTIONENERGY ENEKN 102/94
New Energy Technologies 15 February 1995P.O.Box 1601, FIN-02044 VTT Last update: 27 March 1998
D/5
c) Distillation 75 °C- pipette 50 ml- conic flask 10 ml- exsiccator- drop funnel- Liebig cooler- distillation lamp- Erlenmeyer flask 100 ml- water bath, 75 °C- analytical balance
6.3 Sample preparation
1. The samples are allowed to warm up to room temperature.
2. Büchner funnel is placed on the graduated flask and the sample with glass beads ispoured into the funnel.
3. The sample flask and the glass beads in the funnel are rinsed with a small amount ofdichloromethane.
4. The volume of the sample and the amount of water in the sample are recorded.
5. The samples are stored in a cool place (<5 °C).
If the sample contains an abundance of solids, it is filtered prior to pouring into thegraduated flask. The sample is filtered through a glass fibre filter paper placed in theBüchner funnel into the filter flask. Slight suction is applied when necessary. However,care should be taken not to let dichloromethane and light tar compounds to vaporise infiltration.
6.4 Gas chromatographic analysis
6.4.1 Preparation of internal standard solution (ISTD)
1. A small amount of dichloromethane is placed at the bottom of the 1 000 ml graduatedflask.
2. The 10 ml decater is tared on the analytical balance.
3. 1 g dodecane is weighed into the decanter, the exact amount is recorded.
4. Dodecane is poured into the graduated flask by rising with dichloromethane.
5. Dichloromethane is added to the graduated flask up to the mark.

METHOD DESCRIPTIONENERGY ENEKN 102/94
New Energy Technologies 15 February 1995P.O.Box 1601, FIN-02044 VTT Last update: 27 March 1998
D/6
6.4.2 Preparation of the model compound solution
(see Enclosure)
1. A small amount of dichloromethane is placed at the bottom of the 1 000 ml graduatedflask.
2. Each component of the model compound is weighed in its own decanter in the fol-lowing way:- 10 ml decanter is tared on the analytical balance.- Model compound is weighed in the flask and the exact amount is recorded (the
amount of each component should be as close as possible to that of the actualsample).
- Model compound is poured into the graduated flask by rinsing with di-chloromethane.
Note! The lightest model substances, being readily volatile, should be treated quickly.
6.4.3 Analytical preparations
1. 5.0 ml of solution containing internal standard and 20.0 ml of sample at room tem-perature are pipeted into the graduated flask of 25 ml. The flask is shaked lightly andmarked.
2. Sample is drawn from the 25 ml flask to the GC sample flask, the flask is shut andlabelled clearly with the name of the sample.
3. A dilution is prepared from the model compound solution for calibration by pipeting20.0 ml into the 200 ml graduated flask and by diluting with dichloromethane up tothe mark.
4. A sample is prepared from the dilution of model compound solution for GC analysisas from tar samples (20 ml of solution is pipeted into the 25 ml graduated flask + 5ml ISTD).
Separate measuring equipment shall be reserved for each sample!
6.4.4 Gas chromatographic analysis
Note! Exact instructions for the operation of the gas chromatograph are given in theoperator's manual.

METHOD DESCRIPTIONENERGY ENEKN 102/94
New Energy Technologies 15 February 1995P.O.Box 1601, FIN-02044 VTT Last update: 27 March 1998
D/7
1. Capillary column HP Ultra 2 is put into use as follows:- It is installed when the oven is at room temperature.- One end of the column is fastened to the injector- Helium flow is switched on, the column pressure is adjusted to 146 kPa for the
light tar analysis and to 88 kPa for the determination of heavy tars.- The column is rinsed with carrier gas for 15 min.- The oven is heated: from 30 °C to 300 °C (3 oC/min) and hold at 300 °C (60 min).- The oven can be kept at >200 °C over night to recover the column.- As soon as the oven has cooled the other end of the column is fastened to the FID
detector.
Note! The maximum temperature of the oven is 325 °C for HP Ultra 2.
2. The septum of GC and the needle of the autosampler are checked. Make sure thatthere is solvent in the wash bottles and the so-called split-splitless liner in the gaschromatograph.
3. The valves of the gas lines (synthetic air, N2 and H2) are opened and the flame of FIDignited. The helium flow (flow A ~24 ml/min for light tars or ~21 ml/min for heavytars) and the column pressure (see point 1) are checked.
4. The sample bottles are placed in the sampler tray and the sample identification data istyped in the integrator (EDIT SEQ).
5. The run programme (*.MET) and the calibration data (*.CAL) of the gas chroma-tograph are loaded in the integrator from the 3.5 in diskdrive connected to it. A sepa-rate manual is available on the use of the calibration programs.
6. A 3.5" DD diskette is formatted with the integrator and a 5.25" diskette with the PCfor saving the results. The PC is connected through its serial port to the serial port ofthe integrator. HP fileserver program SERVER.EXE is booted from the PC, and thenits hard disk operates as the drive unit H: of the integrator. The BASIC programs ofthe integrator, used for handling the integrator report, are on the hard disk of the PC.When analysing light tars, the program to be booted after the run in the integrator,STERVA6.BAS is determined by writing command ASSIGN 0,H:STERVA6.BAS inthe integrator. The corresponding program for heavy tars is RTERVA6.BAS. Thenumber given in the title of the programs is the number of version in use, and canlater be changed when the programs are updated.
7. Before the samples, a pure ISTD solution is run to verify the consistency of retentiontimes with calibration. If necessary, the flow of helium gas in the column is adjusted.
METHOD DESCRIPTIONENERGY ENEKN 102/94
New Energy Technologies 15 February 1995P.O.Box 1601, FIN-02044 VTT Last update: 27 March 1998
D/8
8. To check the condition of the column, pure solvent is initially run.
9. The run with the samples is started with the command keys: SEQ START.
6.5 Gravimetric analysis
6.5.1 Evaporation residue of tar in the heating chamber at 105 °C
1. The evaporating dishes are tared by keeping them in the heating chamber at 105 °Cfor about half an hour and then in the exsiccator for two hours. The dishes areweighed on the analytical balance.
2. 50 ml of tar sample at room temperature is pipeted to a tared evaporating dish. Fiveparallel determinations is made for each sample.
3. The blank test is carried out with pure dichloromethane.
4. The evaporating dishes are kept in the fume cupboard overnight.
5. The next day the dishes are moved to a fumed heating chamber at 105 °C for onehour (1.0 h).
6. The dishes are cooled in the exsiccator (~ 2 h) and are weighed exactly in the sameway as when tared.
6.5.2 Evaporation residue of tar at room temperature
1. A clean glass flask is weighed accurately three times on the analytical balance.
2. 50.0 ml of heavy tar sample is measured and poured into the flask through cottonwool to filter the solids.
3. The wool is rinsed with dichloromethane and the flask is placed in the fume cup-board.
4. The solvent is evaporated over about 24 hours, and the flask is reweighed (weighingresult is the mean of three weighings).
5. Parallel determinations are carried out for the samples.

METHOD DESCRIPTIONENERGY ENEKN 102/94
New Energy Technologies 15 February 1995P.O.Box 1601, FIN-02044 VTT Last update: 27 March 1998
D/9
6.5.3 Distillation residue of tar
1. The distillation equipment is installed in the fume cupboard (see Enclosure) in such away that it is easy to remove from the water bath. The temperature of the water bathis adjusted to 75 oC.
2. The conical flask of 10 ml with the stopper is tared by drying it in the exsiccator atleast over two hours, and then it is weighed on the analytical balance.
3. The tared flask is connected to the distillation equipment.
4. 50.0 ml of tar sample at room temperature is pipeted into the drop funnel. Samplesolution is poured into the flask half full and the equipment is immersed in the waterbath. A distillate collection flask, e.g., an Erlenmeyer flask of 100 ml, is placed.
5. As soon as distillation begins the valve of the drop funnel is opened in such a waythat the flask is continuously half-filled with sample solution. The suitable rate ofdistillation is on average 1 drop/s. Distillation takes about 30 min.
6. When distillation has stopped the flask is let to be coupled to the distillation appara-tus and to stay in the water bath over three minutes, after which it is loosened andshut with the stopper.
7. The stopped flask is placed in the exsiccator for at least two hours, and then it isweighed as when tared.
8. The blank test is carried out with dichloromethane.
6.6 Calculation of results
6.6.1 Gas chromatographic analysis
The tar compounds are identified by the mass selective detector (MSD) in the gas chro-matograph (GC) and by running model compounds. The GC-MS run data and other dataused for identification are kept in the gas chromatography room.
The calculation of analysis results is carried out as follows: The report of the calibratedgas chromatographic analysis is saved as EXTENDED REPORT in the hard disc of thePC, from which it is read line by line back to the integrator and handled with the BASICprogram of the integrator. The program modifies the .RTP-ending file and saves themodified file as .UA2-ending file, which can be read directly to spreadsheet programs.

METHOD DESCRIPTIONENERGY ENEKN 102/94
New Energy Technologies 15 February 1995P.O.Box 1601, FIN-02044 VTT Last update: 27 March 1998
D/10
The program requires data on the gas collecting conditions of the sample in certain formfor the sequence sample sheet. In column REPORT MEMO, the collecting data on eachsample is given according to the following example: K=99,T=25.2,L=520,. The deci-mals are set off by full stop and data by comma. The last value is also followed bycomma. In the example K=99 means that the collecting volume of gas has been 99 l,T=25.2 gives the temperature of the gas meter (°C), i.e. the temperature of gas whenmeasured, and L=520 is the total liquid volume of washing bottles (ml).
The gas chromatograph is calibrated to give the concentrations of the sample solutionsin mg/l. The program calculates the contents for the gas sample in NTP conditions ac-cording to ideal gas laws. In addition, the program has data statements that contain theelemental analysis of the calibrated substances in calibration order. At the end of theUA2-ending report the calculated elemental analysis of the whole sample is given. If theorder of calibration is modified or new substances are added to calibration, the DATAstatements of the programs shall also be updated.
In the timetable data of the integrator, the integration is started after the solvent peak. Atthis point the BASIC program is able to give data on the proportion of identified sub-stances on the basis of the area relations of the chromatogram. The correctness of thisdata is significantly dependent on the starting time of integration.
The printout of the BASIC programs are kept in the gas chromatograph room. The pro-grams are saved on the hard discs of the PCs coupled to the integrators as well as onbackup copy diskettes.
The integrator reports (.RPT) and calculated results (.UA2) are saved on the hard disc ofthe PC. The .UA2-ending files are copied on the diskette of the PC, after which the filescan be deleted from the hard disc. The .UA2-ending files are read by SYMPHONYcommand File - Import - Structured. The sheet obtained does not contain any calculationformulas, i.e. when modifying some concentration value the sum and the results of theelemental analysis are not updated.
6.6.2 Gravimetric analysis
Tar content of gas is calculated from the evaporation residue:
C = mka x vTL x (TKN+273)/(v1 x VKN x 273)
METHOD DESCRIPTIONENERGY ENEKN 102/94
New Energy Technologies 15 February 1995P.O.Box 1601, FIN-02044 VTT Last update: 27 March 1998
D/11
where C is tar content of gas (g/m3n)
mka evaporation residue as the mean of parallel samples (g)
v1 volume of the tar solution sample analysed (ml)
vTL total volume of the tar solution sampled (ml)
VKN volume of sample gas (m3)
TKN temperature of gas in sampling (°C).
The evaporation residue is calculated from the mean of at least four determinations, andthe result of the blank test, being also the mean of at least four determinations, is re-duced from it. The distillation residue is calculated from the mean of at least two deter-minations and the result of the blank test is reduced from it.
6.7 Accuracy and repeatability
Error sources of tar analysis:- tar loss in sample preparation stages- sample residuals in glass beads (despite rinsing)- measuring, weighing and pipeting errors- identification errors of compounds in gas chromatographic analysis.
A typical error in parallel tar sample determinations in gas chromatographic analysis hasbeen less than 3% for single components.
6.8 REPORTING
The contents of compounds analysed by gas chromatography are given in mg/m3n, to thenearest 1 mg.
The result of gravimetric tar determination is given in g/m3n, to the nearest tenth. The
evaporation temperature and time applied are also given.
6.9 Safety at work
Dichloromethane, used as solvent, is readily vaporised and a respiratory poison. Thesolvent vapours irritate mucous membranes (sore throat) and eyes and cause headache,dizziness and nausea (see safety information).

METHOD DESCRIPTIONENERGY ENEKN 102/94
New Energy Technologies 15 February 1995P.O.Box 1601, FIN-02044 VTT Last update: 27 March 1998
D/12
Tar contains benzene and polyaromatic hydrocarbons (PAH compounds), which maycause occupational cancer. Most of the tar model substances are especially dangerous tohealth (see safety information).
All sample handling shall be carried out in the fume cupboard. Safety gloves and respi-rator masks shall be used.
7. Assessment of methods
The gas chromatographic analysis is laborious, and requires high expertise and experi-ence from the operator. The automatically starting BASIC program requires that the runconditions of the chromatograph stay very stable. Identification of peaks shall bechecked with a model solution prior to each series of analysis, and the calibration dataof the integrator is edited accordingly when necessary.
Starting values of gas collection cannot be corrected in the report of analysis if fed in-correctly in the sample sheet. The data shall be corrected in the sample sheet, and a newchromatographic analysis shall be carried out. On the other hand, if calibration datashould be corrected, a new .UA2 report can be formed by the ANALYZE command ofthe integrator without any new gas chromatographic analysis.
The gravimetric determinations are suitable for characterising the total content of theheaviest tar compounds, for example, when monitoring variations in the tar content in acertain process. The results are affected by the concentration and composition of thesample solution, and consequently, the measuring results obtained for different types ofprocesses or for samples taken by different methods are not necessary comparable witheach other.

METHOD DESCRIPTIONENERGY ENEKN 102/94
New Energy Technologies 15 February 1995P.O.Box 1601, FIN-02044 VTT Last update: 27 March 1998
D/13

METHOD DESCRIPTIONENERGY ENEKN 102/94
New Energy Technologies 15 February 1995P.O.Box 1601, FIN-02044 VTT Last update: 27 March 1998
D/14

METHOD DESCRIPTIONENERGY ENEKN 102/94
New Energy Technologies 15 February 1995P.O.Box 1601, FIN-02044 VTT Last update: 27 March 1998
D/15

METHOD DESCRIPTIONENERGY ENEKN 102/94
New Energy Technologies 15 February 1995P.O.Box 1601, FIN-02044 VTT Last update: 27 March 1998
D/16

METHOD DESCRIPTIONENERGY ENEKN 102/94
New Energy Technologies 15 February 1995P.O.Box 1601, FIN-02044 VTT Last update: 27 March 1998
D/17

METHOD DESCRIPTIONENERGY ENEKN 102/94
New Energy Technologies 15 February 1995P.O.Box 1601, FIN-02044 VTT Last update: 27 March 1998
D/18