sample group truncated 2005 - brs-seattle.com · brs' clients include some of the world’s...
TRANSCRIPT

Benchmark Study
Compiled by:
Profit Mastery PO Box 219Hobart, Washington 98025 USA Phone – 206.284.5102 Fax – 206.282.4092 Email [email protected] www.profitmastery.net
The material and contents provided in this report are informative in nature only. The report is distributed with the understanding that neither Printers, Inc. nor Business Resource Services, Inc. is engaged in providing legal or accounting assistance. Legal and accounting aid, if needed, should be sought from professionals in those fields.
©BRS 2018 ALL RIGHTS RESERVED
… SAMPLE. …

i
PREFACE The selected sample pages you find in this Sample Benchmark Study represent several key components of our comprehensive study. We have selected these pages to showcase our approach to measuring the financial performance of a network.
The Table of Contents shown is also a sample, and is reflective of what a completed BRS Benchmark Study would contain.
We thank you in advance for your interest in our financial education and benchmarking products, programs and services. We firmly believe that our Fiscal Physical® process brings an incredibly powerful opportunity to improve the cash flow, profits and financial literacy of your network. For more information, visit our web-site at www.brs-seattle.com or e-mail us at [email protected].
Enjoy the study!
©2018 BRS

ii
FOREWORD This study represents the second consecutive year in which Business Resource Services has measured the financial performance for Color Centers, Inc. franchisees. Our process has:
• revealed key issues for the financial management of Color Centers, Inc.,• established benchmarks for evaluating the financial performance of individual franchises,
and• established benchmarks for evaluating the financial performance of the Color Centers, Inc.
franchise system.
This report describes the key issues, presents the benchmarks, and provides a framework for integrating financial benchmarking into a management planning strategy for franchises.
Using This Study as a Management Tool This report is not just a collection of interesting statistics about Color Centers, Inc.– it is a powerful management tool. It provides franchisees with guidelines against which to measure their own financial performance, and suggest specific actions which, when implemented, can contribute to increased profits and cash flow.
As with any tool, this study will be most effective when used properly. The following approach is suggested for gaining maximum benefit from the study.
Steps for Effective Use of the Color Centers, Inc.
Benchmark Study Step 1: Take the time to read Section I to familiarize yourself with the formats that are used to present information in the report. Then review the brief summary of key financial performance issues at Section II.
Step 2: Review the actual statistics and analysis in Section III Operating Results. Section III also includes the Executive Summary of the financial study.
Step 3: If you participated in the survey you will also have received a consulting report for your company. Review it to compare your company’s ratios with the study results and to evaluate your strengths and weaknesses. Then read Section IV – Action Plans for Success for some specific suggestions on how to improve your company’s performance in any problem areas.
Step 4: Follow the steps outlined in Section V – What to Do Next for a step-by-step approach for integrating financial cause-and-effect analysis into the ongoing process of managing your business.
The study provides franchisees with guidelines against which to measure their own financial performance, and suggests specific actions which, when implemented, can contribute to increased profits and cash flow.
©2018 BRS

iii
Table of Contents PAGE
I. BACKGROUND INFORMATION
About Business Resource Services, Inc. .......................................................... About The Benchmark Study ............................................................................. Overview of the Three Basic Statements .........................................................
II. KEY FINANCIAL PERFORMANCE ISSUES
Critical Areas to Manage .................................................................................. III. OPERATING RESULTS
General Information About the Centers Participating in the Study .................... How the Top 25% Were Selected...................................................................... Executive Summary........................................................................................... Sales Analysis .................................................................................................. *
IV. ACTION PLANS FOR SUCCESS
Possible Causes of Specific Problems and Action Plans for Success ............. * Planning for Profitability .............................................................. * Planning for Productivity ............................................................. * Planning for Financial Position .................................................... * Planning for Cash Flow ............................................................... *
V. WHAT TO DO NEXT
The "Fiscal Physical" Action Plan for Effective Financial Management ............
APPENDICES
Appendix A – Financial Statistics for All Centers and the Top 25% Median Financial Operating Ratios ............................................. Average Common-Sized Profit and Loss .................................... Average Common-Sized Balance Sheet .....................................
Appendix B – Financial Statistics by Sales Categories Median Financial Operating Ratios ............................................. Average Common-Sized Profit and Loss .................................... Average Common-Sized Balance Sheet .....................................
Appendix C – What the Benchmarks Mean and How They Are Used .............. * Appendix D – Financial Statements as Working Tools .................................... * Appendix E – Financial Cause and Effect "Road Map" .................................... *
* Full Scope Study only – not included in Limited Scope Study.
©2018 BRS

Section I - Background Information About Business Resource Services, Inc. and Their Work with Color Centers, Inc.
Business Resource Services, or BRS, specializes in financial management education for the owners and managers of independent businesses. The BRS team includes leading speakers and consultants in the area of small business finance, with backgrounds in banking, finance, accounting, and small business start-ups. BRS' clients include some of the world’s largest and most successful associations, corporations and banking institutions, including the American Rental Association, Anheuser-Busch, Westpac, Chase Manhattan Bank, and the International Franchise Association.
In the spring of 2003 Color Centers, Inc. contracted with BRS to assist in the development of a comprehensive financial management process that would strengthen and develop frachisees’ financial decision-making resources as a means for improving their profitability. The process that was developed included:
1) Providing education for franchisees in financial analysis, profit planning, pricingtechniques, capital needs forecasting and strategic business planning;
2) Identifying key financial performance issues affecting profitability and cash flow;3) Establishing benchmarks for measuring future improvements in financial performance;4) Consistently applying a process of performance measurement.
BRS has developed educational programs based on study results and the practical use of the study as a management tool. These programs will be available at annual conventions and special sessions. Continuing this process will give franchisees tools for evaluating the changes in the industry as they interpret the changes in their own financial results.
About The Benchmarking Study A benchmarking study is a compilation of a group of financial statements within one industry in order to highlight key financial and operating characteristics. Similar companies within an industry evolve specific financial characteristics -- depending on the nature of the businesses -- including productivity, profitability, capital intensity, labor intensity, technology and competition to name a few. This study has been compiled to provide franchisees with accurate and useful information, highlighting the specific financial characteristics of Color Centers, Inc. franchisees participating in the study.
How the Information Was Gathered All Color Centers, Inc. franchisees in North America were invited to participate in this benchmarking study. The survey form consisted of a questionnaire focused on demographics and non-financial statistics, a balance sheet, and a profit and loss. This information was compiled and is reported in formats that are standard for the industry.
Accuracy of the Information In preparing this survey, we have exercised the utmost professional care compiling the information received. While we have tested the information for clerical accuracy, the data supplied was not necessarily based on audited financial statements. Neither Color Centers Inc. nor Business Resource Services, Inc. makes any assurances, representations, or warranties with respect to the data upon which the contents of this report were based.
Time Period Covered The information upon which this survey is based on the years ended December 2004 and 2005.
©2018 BRS

Overview of the Three Basic Statements The information gathered in the survey is summarized and presented in three basic statements:
median financial operating ratios
average common-sized balance sheet – percent of total assets
average common-sized Income Statement – percent of total sales
Median Financial Operating Ratios Financial statement information can be used to measure the health and progress of a business and the efficiency of its financial management. These measurements are quantified in standard financial operating ratios.
A ratio is simply a comparison of one number to another. By comparing certain numbers from the financial statements, key financial issues can be evaluated, such as: a) efficiency in generating sales from assets, b) efficiency in generating profits from sales, or c) efficiency in structuring liabilities and net worth. For definitions and explanations of the financial operating ratios presented in this report, see Appendix C.
The figures presented on Appendix A-2 and B-2 represent median ratios. The median is determined by computing the ratio for each center and then ranking the results in order from highest to lowest. The ratio that falls in the exact middle of the list is at the median. The median is preferred to an average value, since it is not distorted by a few unusually high or low values.
Median ratios are useful management information because they designate the "half-way point" of the respondents. Comparing an individual center’s ratio to the median reveals whether its performance places it in the top or bottom half of the group for the specific condition being measured.
What Is A Common-Sized Statement? Common-sizing financial statement information is a process by which each item on the financial statement is reduced to its relationship to the whole statement. For example, the average balance sheet presents each balance sheet item as a percentage of total assets. The average income statement presents each item as a percentage of total sales.
The average common-sized statement is computed by determining an average value for the entire group of respondents. For example, when computing the average common-sized balance sheet for all companies, a common-sized balance sheet was created for each participant as described above. Then all of the common-sized balance sheets were combined and the results were divided by the number of participants. The result is the “average” common-sized statement for the group.
The result of this process is an average common-sized statement. As was previously discussed, average values can be distorted by one unusual center. This possibility should be considered when using average common-sized statements in the analysis process.
©2018 BRS

Average Common-Sized Balance Sheet The balance sheet represents the most important information about a business with respect to its financial health and its ability to continue operations. While the profit and loss measures performance for one year, the balance sheet displays the financial condition of the business after all its years of operations. The sections of the balance sheet are:
ASSETS – what the business owns.
LIABILITIES AND NET WORTH – what the business owes (to those who supplied the funds to buy the assets – the creditors and the owners).
The key financial issues related to the balance sheet include solvency, liquidity, risk and efficiency of generating sales, profits and cash flow from assets. For an overview of how ratios can be used to measure these items, refer to Appendix C.
Average Common-Sized Income Statement The income statement measures the results of operations for a specific period of time (in this case, one year). The key financial issues relating to the profit and loss are pricing, gross margin maintenance, staff costs control and operating expense control.
The average common-sized profit and loss displays each item as a percentage of total sales. By focusing on the relationship to sales, this statement shows how much of each sales dollar is spent on the various expenses.
For example, where cost of goods sold are 24.5%, for every $1.00 in sales, about 25 cents (24.5% of $1.00) is spent on direct costs, leaving 75 cents to cover all other expenses and any profit for the owner. By using this average profit and loss, centers with different sales volumes can be evaluated for profitability and expense control in common-sized or comparable terms.
©2018 BRS

Section II – Key Financial Performance Issues Critical Areas to Manage
Financial performance is measured by making comparisons between items found on the profit and loss or balance sheet and sometimes by using other non-financial statistics. Comparing one number to another produces a ratio. This report contains a number of ratios that help to evaluate the financial health of a business in these four basic areas:
• profitability – gross profits, net profits and expense control• productivity – staff and facilities• financial position – efficiency of asset use and in managing debt• cash flow – managing the working capital (cash flow) cycle
Profitability – Efficiency in generating profits from sales. Savings through managing costs of goods sold fall straight to the bottom line as increased net profits. Other opportunities for increasing profits include controlling staff costs, operating expenses and interest expense. Benchmarks for measuring profitability include gross profit margin, and owner’s discretionary profit. Expense controls improve profitability, so expenses and groups of expenses are also measured (as a percentage of sales).
Productivity – Managing staff efficiency.
Maintaining reasonable levels of staff for a given sales volume and controlling staff costs represent key areas of financial efficiency. Optimum productivity is the result of efficiency in staff cost control, balanced with effective results. Staff costs per employee or as a percentage of sales are benchmarks for measuring cost control or efficiency. Sales per employee is a benchmark for measuring the effectiveness of staff efforts.
Financial Position – Asset management and controlling debt. We compare sales to assets to measure how efficiently the center generates sales from its assets. Debt management is measured by the debt to worth ratio. Interest represents the cost of financing assets, and it is measured as a percentage of sales.
Cash Flow – Managing working capital and the uses of cash and liquid assets in the ongoing operations of the business.
Inventory, accounts receivable and trade creditors are controllable items and management efficiencies in these areas can be measured. The common benchmarks for evaluating these efficiencies are inventory turn days, average accounts receivable collection days and average trade creditors’ days. The liquidity, or short-term solvency of the center, is measured by the current ratio.
The executive summary (Section III) describes how Color Centers Inc franchisees performed in these areas, and the characteristics of centers at various sales volumes. The executive summary also emphasizes the specific management efficiencies of the most profitable centers.
©2018 BRS

Section III – Operating Results
General Study Information Location * For the financial year ended December 31, 2005 there were 200 businesses included in the study (182 single centers plus 6 multiple center groups representing 18 centers.) For 2004 there were 198 businesses included in the study (181 single centers plus 7 multiple center groups representing 17 centers.) For 2005 the average center occupied 187 square feet (165 square feet for financial year 2004).
Age of Center * Here is the age breakdown of the participating centers:
2004 2005 Five years and under 25% 28% Six to ten years 34% 32% Eleven to fourteen years 24% 26% Fifteen years and over 17% 14%
100% 100%
The average age of the centers responding was 9 years for both study periods.
Sales Participating Centers had total sales in these ranges:
2004 2005 Under $400,000 19% 21% $400,000 to $600,000 31% 27% $600,000 to $1million 32% 30% Over $1million 18% 22%
100% 100%
Employment Respondents reported full-time equivalent employees working as of December 31. Average responses follow:
2004 2005 Printing 2.61 2.73Graphic Design and Typesetting .48 .60 Outside Sales .42 .48 Inside Sales and Counter Sales 1.06 1.08 Bookkeeping and Administration .39 .34 Total Non-Owner Employees 4.96 5.23 Working Owners 1.56 1.53 Total Working Personnel 6.52 6.76
Prepress Operations * Respondents reported decreased reliance on outside service bureaus for prepress operations:
• 35% reported artwork was generated predominately by outside bureaus (44% in 2004)• 42% reported artwork was generated predominantly by center employees (39% in 2004)• 23% reported that artwork was generated by a combination of center employees and
outside bureaus (17% in 2004)
* Full Scope Study only – not included in Limited Scope Study.
©2018 BRS

How the Top 25% Were Selected
To determine which centers would be included in each quartile, the owner's discretionary profit percentage for each center was calculated:
Net Profit Before Tax + Owner Compensation
Sales
Once each center's owner’s discretionary profit percentage was computed the amounts were listed in order from highest to lowest. The respondents were then separated into quartiles based on their owner's discretionary profit percentage. The top 25% of the respondents were included in the top quartile. The goal of this process is to identify the management efficiencies that exist in the top 25% and to evaluate the differences between centers experiencing differing levels of profitability. This helps us to identify the primary drivers of profitability and success.
The various quartiles included centers achieving owner's discretionary profit in the following ranges:
Owner's Discretionary Profit
2004 2005 Top 25%................................................Over 18% Over 21% Third quartile .......................................16% to 18% 19% to 21% Second quartile ....................................5% to 16% 10% to 19% Bottom 25%...........................................Under 5% Under 10%
Median Ratios The statistics presented on the pages entitled "Median Financial Operating Ratios" represent the median ratios (mid-point) of the group of centers presented. These figures are referred to frequently throughout this report.
REMEMBER: Median ratios indicate a "half-way point," thereby dividing all those reporting into two halves: a top half (centers having a ratio higher than the median) and a bottom half (centers having a ratio lower than the median). Comparing ratios of an individual center to median ratios will indicate specific areas where improvement is desired, based on its ranking compared to the group. For example, if your sales per employee ratio is lower than the median ratio you may want to implement some actions that will improve your employees’ productivity.
Common-sized financial statements provide another method of evaluating results, but they do not divide the group into halves. Instead, they present average figures that could be distorted by a few unusual centers. These statements do, however, give a general guideline for comparison when evaluating more detailed statistics.
©2018 BRS

Executive Summary
This executive summary describes the operating results for Color Centers, Inc. franchisees for these critical areas.
• profitability -- gross profits, net profits, and expense control• productivity -- staff efficiency• financial position – asset management and controlling debt• cash flow -- managing the working capital cycle
Profitability .
The chart below shows what happens to each sales dollar of the “average” center versus that of the average “top 25%” center. This chart is based on figures from the "average" common-sized profit and loss from Appendix A-3, which will not be exactly the same as the median ratios shown on Appendix A-2. To learn more about median ratios and the averages shown in the common-size profit and loss, refer to the overview of the three basic statements in Section I.
Average for All Centers Average For Top 25% Centers
Operating Expenses Excluding Royalty
24%
Cost of Goods Sold30%
Staff Costs21%
Royalty5%
Tax and Other
Expenses2%
Profit to Owners
18% Royalty5%
Tax and Other
Expenses1%
Profit to Owners
24%
Staff Costs21%
Cost of Goods Sold29%
Operating Expenses
Except Royalty
20%
Source: Common-Sized Profit and Loss, Appendix A-3.
Top performers have 24% in net profit before tax plus owner compensation, compared to 18% for all centers. This 6% difference represents more than 40% more in profit dollars to the top performers (profit to owners was derived by adding net profit after tax to owner compensation). Their profit advantage comes primarily from managing cost of goods sold and operating expenses (overhead).
Cost of Good Sold Management Cost of goods sold is a combination of ink, chemicals, supplies, shipping, delivery and outsourcing costs. Here is a breakdown of the items that make up average costs of goods sold on the common-sized profit and loss.
©2018 BRS

Cost of Goods Sold
All Centers Top 25% 2004 2005 2004 2005
Red Product Costs (Ink, supplies, materials) 15.8% 14.4% 13.6% 12.5% Green Product Costs 4.4 4.9 4.4 4.2 Blue Product Costs 2.1 2.3 2.4 2.4 Yellow Product Costs 2.3 2.1 1.4 1.4 Outsourced Services 3.8 4.8 4.2 7.0 Shipping and Delivery .1 .2 .1 .3 Shop Supplies .4 .3 .3 .4 Miscellaneous .1 .2 .1 .1Total Cost of Goods Sold 29.4% 29.7% 26.8% 28.6%
The top 25% have lower costs in printing as a percentage of sales. This would be expected, since their emphasis in printing is lower than the average for all companies. Both groups showed increasing total cost of goods, driven by rising outsource services costs that were only partially offset by reduced red product costs. For a better understanding of the trends and how the groups differ, we must also evaluate their changing sales mix.
Sales by Product Type All Centers Top 25%
2004 2005 2004 2005 Red Products 56.5% 52.6% 52.1% 48.7% Blue Products 22.4 23.2 23.9 22.5Yellow Products 9.4 10.8 12.3 11.6Green Products 5.7 5.6 5.3 5.3Outsourced Services 5.8 7.6 6.2 11.7Total Sales 100.0% 100.0% 100.0% 100.0%
Both groups show decreasing emphasis in red products, offset by increased outsourced services. Centers in the top 25% had about 4% less in red product sales. For 2004 these sales were offset by higher blue and yellow product sales. For 2005 the top 25% had substantially the same emphasis on yellow products as did “All Companies” but had higher emphasis on outsourced services. To evaluate the profitability of centers by product type, we took each cost item as a percentage of the related total sales. Here is what we found:
Profit Margins by Product Type – All Centers Red
ProductsBlue
ProductsYellow
ProductsGreen
Products Outsourced
Services Sales 100.0% 100.0% 100.0% 100.0% 100.0%Costs of Goods 21.5 21.3 21.7 37.9 64.0 2005 Gross Profit 72.5% 78.7% 78.3% 62.1% 36.0% 2004 Gross Profit 73.4% 78.6% 75.1% 57.0% 31.75%
Note: Two-Year comparison available for Full Scope Studies only. Not included in Limited Scope Study.
©2018 BRS

Profit Margins by Product Type – Top 25%
Red Products
Blue Products
Yellow Products
Green Products Outsourcing
Sales 100.0% 100.0% 100.0% 100.0% 100.0% Costs of Goods 25.7 18.7 20.9 26.9 60.0 2005 Gross Profit 74.3% 81.37% 79.1% 73.1% 40.0% 2004 Gross Profit 75.9% 79.6% 77.6% 69.5% 30.1%
Top centers had higher margins in every area. Both groups showed decreased margins on red products and increased or unchanged margins in all other areas. Since we were unable to allocate shipping and delivery, shop supplies and miscellaneous expenses to the various product types, not all costs are accounted for in the table above (totaling .8% for all companies and .9% for the top 25% for 2005). While the above analysis does not present a complete accounting for all costs, it does give an overall sense of profitability by product type.
Operating Expense Management
Operating expenses include the royalties, advertising, sales and administration for the center. The top 25% had median operating expenses of 25.8%, nearly 3% lower than the median operating expenses for all centers (28.9%, per Median Financial Operating Ratios, Appendix A-2). While 3% seems small, when applied to median sales of $625,000 (all companies) the savings represents the potential for $18,750 more in profits for centers that can meet the efficiencies of the top 25%.
As shown by the common-sized profit and loss on Appendix A-3, the top 25% spent just a little less on nearly every type of operating expense (as a percentage of sales), and noticeably less on rent (3.8% of sales compared to 5.0% for all centers). It is noteworthy that while median rent per square foot for top 25% is actually higher than that for all centers ($16 for the top 25%, compared to $13 for all centers), rent expenses as a percentage of sales are lower. The top 25% operate from more costly, and likely more desirable space. They also use the space more productively, generating sales of $800 per square foot, compared to $600 for all companies.
Operating at or near maximum capacity has a major impact on operating expenses as a percentage of sales. Timing expansion is imperative to efficient operating expense management. A center is the most efficient when at maximum capacity. When volume forces expansion, expenses increase. Immediately after expansion, the business is the least efficient in terms of expense management and profitability. Balancing expansion with sales growth is a key factor in operating expense control. When setting your own goals for operating expense percentage, be sure to consider your current position in the expansion cycle. If you have just expanded, your expense percentage may be high. If you are at maximum capacity for your facility and equipment your expenses should be low (as a percentage of sales).
Note: Departmental details available in Full Scope Studies only. Not available in Limited Scope Study.
©2018 BRS
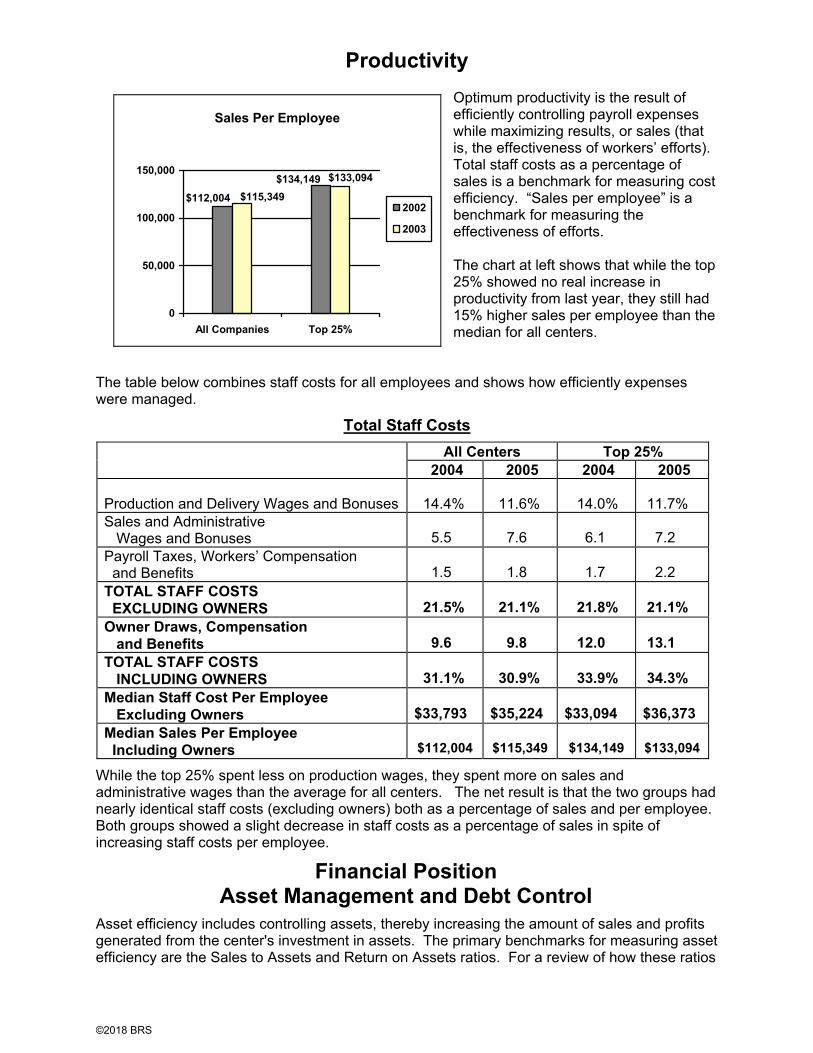
Productivity Optimum productivity is the result of efficiently controlling payroll expenses while maximizing results, or sales (that is, the effectiveness of workers’ efforts). Total staff costs as a percentage of sales is a benchmark for measuring cost efficiency. “Sales per employee” is a benchmark for measuring the effectiveness of efforts.
The chart at left shows that while the top 25% showed no real increase in productivity from last year, they still had 15% higher sales per employee than the median for all centers.
The table below combines staff costs for all employees and shows how efficiently expenses were managed.
Total Staff Costs All Centers Top 25%
2004 2005 2004 2005
Production and Delivery Wages and Bonuses 14.4% 11.6% 14.0% 11.7% Sales and Administrative Wages and Bonuses 5.5 7.6 6.1 7.2 Payroll Taxes, Workers’ Compensation and Benefits 1.5 1.8 1.7 2.2 TOTAL STAFF COSTS EXCLUDING OWNERS 21.5% 21.1% 21.8% 21.1%
Owner Draws, Compensation and Benefits 9.6 9.8 12.0 13.1 TOTAL STAFF COSTS
INCLUDING OWNERS 31.1% 30.9% 33.9% 34.3% Median Staff Cost Per Employee Excluding Owners $33,793 $35,224 $33,094 $36,373 Median Sales Per Employee Including Owners $112,004 $115,349 $134,149 $133,094
While the top 25% spent less on production wages, they spent more on sales and administrative wages than the average for all centers. The net result is that the two groups had nearly identical staff costs (excluding owners) both as a percentage of sales and per employee. Both groups showed a slight decrease in staff costs as a percentage of sales in spite of increasing staff costs per employee.
Financial Position Asset Management and Debt Control
Asset efficiency includes controlling assets, thereby increasing the amount of sales and profits generated from the center's investment in assets. The primary benchmarks for measuring asset efficiency are the Sales to Assets and Return on Assets ratios. For a review of how these ratios
Sales Per Employee
$134,149
$112,004
$133,094
$115,349
0
50,000
100,000
150,000
All Companies Top 25%
2002
2003
©2018 BRS

are computed and interpreted, refer to Appendix C.
Asset Efficiency Ratios All Centers Top 25%
2004 2005 2004 2005 Sales to Assets 2.13 2.22 2.29 2.25 Return on Assets 35.0% 32.0% 47.0% 50.0%
For 2004 the top performers generate $2.29 in sales for every dollar invested in assets, compared to the median for all centers of $2.13. This higher asset productivity, combined with their higher profitability resulted in substantially higher return on assets (50% compared to the median for all centers of 47%). For 2005, increased asset investments resulted in a decreasing sales-to-assets ratio for the top 25%.
Another way of measuring the efficiency of assets is to evaluate the annual asset costs as a percentage of sales. We calculated the median capital asset costs (interest, depreciation, and operating lease payments on equipment as a percentage of sales) to help franchisees evaluate the cost of their choice to lease or buy capital assets. The top 25% spent approximately 1% less on these “capital asset costs” at 8.9% as compared to the median for all companies of 9.7%.
Debt Management For purposes of this study all owner loans were treated as equity when computing debt to worth and return on investment ratios. Bankers and other financiers may agree to this reclassification, which can have a big impact on their risk and return analysis. They may also ask for a subordination agreement in this case. This agreement limits loan payments to the owner until the bank has been paid and may also limit owner salaries. When measuring the financial position of the business, an owner should evaluate whether the shareholder loans are in substance permanent equity contributions, or debt that will be repaid. If a repayment schedule exists the shareholder loan should be included in liabilities, and the debt to worth and return on net asset ratios should be recalculated.
Ratio Computation All Centers Top 25% 2004 2005 2004 2005
Debt To Worth Total Liabilities - Shareholder Loans Net Worth + Shareholder Loans 2.03 2.59 .96 1.29
Return on Investment
Owner’s Discretionary Profit Net Worth + Shareholder Loans 67.0% 65.0% 97.0% 98.0%
The debt to worth ratio for the top 25% shows that for every dollar owners have invested in the center, the creditors have provided $1.29 (up from 96 cents in 2004). The median for all centers shows that for every dollar owners have invested, the creditors have invested $2.59 cents. The top 25% are “less risky” than the median for all companies. Further, even though the top 25% are operating with more of their own money (a bigger investment) their higher profits result in a return on net assets ratio that is nearly 50% higher than the median for all companies.
Remember: Equipment acquired through operating leases does not appear as an asset on the balance sheet, nor does the related obligation appear as a liability. This “off-balance sheet financing” creates obligations that are not, then, measured by the debt to worth ratio. This type of financing reduces the need for measured liabilities and thereby keeps the debt to worth ratios low, even though there is real economic risk that goes unmeasured.
©2018 BRS
Cash Flow
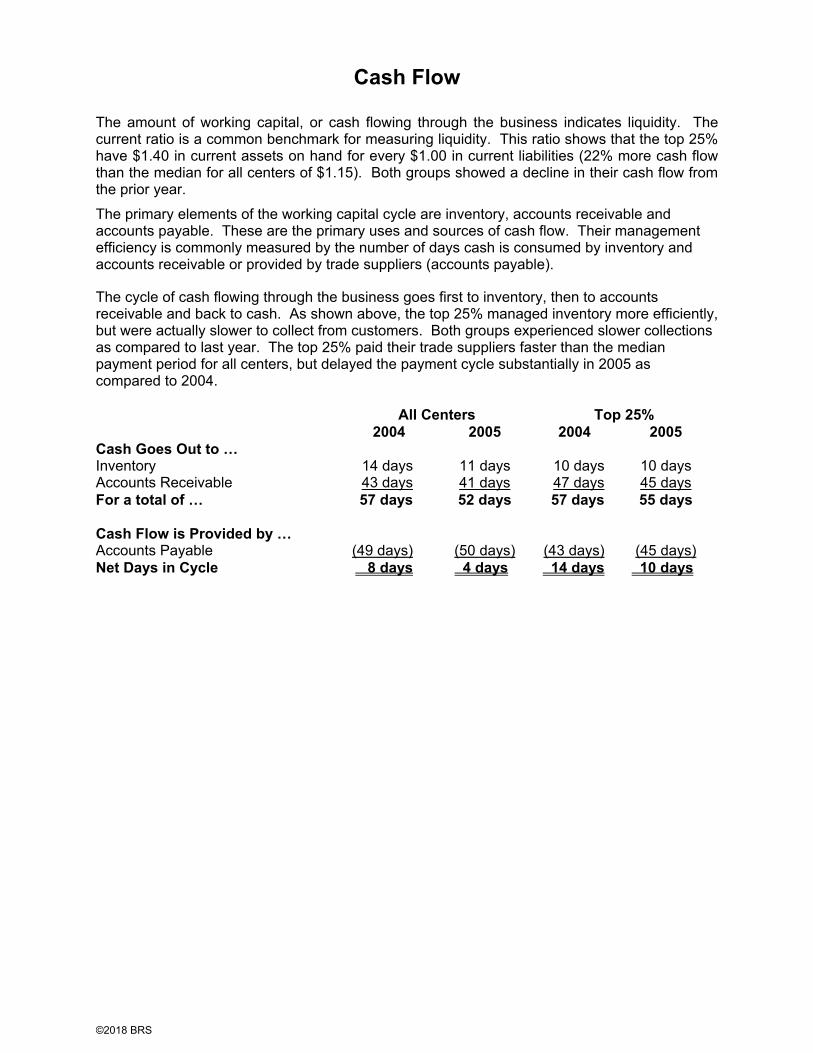
The amount of working capital, or cash flowing through the business indicates liquidity. The current ratio is a common benchmark for measuring liquidity. This ratio shows that the top 25% have $1.40 in current assets on hand for every $1.00 in current liabilities (22% more cash flow than the median for all centers of $1.15). Both groups showed a decline in their cash flow from the prior year.
The primary elements of the working capital cycle are inventory, accounts receivable and accounts payable. These are the primary uses and sources of cash flow. Their management efficiency is commonly measured by the number of days cash is consumed by inventory and accounts receivable or provided by trade suppliers (accounts payable).
The cycle of cash flowing through the business goes first to inventory, then to accounts receivable and back to cash. As shown above, the top 25% managed inventory more efficiently, but were actually slower to collect from customers. Both groups experienced slower collections as compared to last year. The top 25% paid their trade suppliers faster than the median payment period for all centers, but delayed the payment cycle substantially in 2005 as compared to 2004.
All Centers Top 25% 2004 2005 2004 2005
Cash Goes Out to … Inventory 14 days 11 days 10 days 10 days Accounts Receivable 43 days 41 days 47 days 45 days For a total of … 57 days 52 days 57 days 55 days
Cash Flow is Provided by … Accounts Payable (49 days) (50 days) (43 days) (45 days) Net Days in Cycle 8 days 4 days 14 days 10 days
©2018 BRS

Sales Analysis (Full Scope Study only – not included in Limited Scope)
Sales indicate the size of the center and can influence financial performance. To determine how a center’s ratios change as sales increase, we sorted the participants into four separate groups based on their annual sales. The three basic statements (median financial operating ratios, common-sized balance sheet and common-sized profit and loss) appear in Appendix B for the following sales categories.
• Less than $400,000• $400,000 to $600,000• $600,000 to $1,000,000• More than $1,000,000
This information shows some significant trends. Our observations follow.
Productivity
Staff productivity as measured by the sales per employee ratio increases with sales. This would be expected, as centers grow and operate near capacity. As centers grow, a greater percentage of their sales come from sales people, and this has a significant impact on cost structure.
The table below combines staff costs for all employees and shows how costs increase as sales increase.
Staff Costs Under $400k
$400k to $600k
$600k to $1 mm
Over $1mm
Production and Delivery Wages and Bonuses 11.9% 11.1% 12.4% 11.1% Sales and Administrative Wages and Bonuses 6.5 7.2 6.7 10.5 Payroll Taxes, Workers’ Compensation and Benefits
1.6 1.4 2.0 2.0TOTAL STAFF COSTS EXCLUDING OWNERS 20.1 19.8 21.2 23.7 Owner Draws, Compensation and Benefits 6.9 11.9 11.5 7.8 TOTAL STAFF COSTS INCLUDING OWNERS 27.0% 31.8% 32.7% 31.5%
Median staff cost per employee (excluding owners) $34,636 $30,787 $36,290 $37,014 Median sales per employee $98,818 $100,088 $124,612 $144,235
As sales increase, sales and administrative staff costs increase substantially, reflecting the cost of a dedicated sales staff. Approximately one-third of the companies having sales greater than $1 million were reporting for multiple locations, which causes higher administrative costs (due to the additional management staff required).
Sales Per Employee
$144,235
$124,612
$100,088$98,818
0
50,000
100,000
150,000
Under$400k
$400k to$600k
$600 to$1mm
Over$1mm
©2018 BRS

Sales by Product Type
Under $400k
$400k to $600k
$600k to $1 mm
Over $1mm
Red Products 55.7% 56.6% 52.8% 42.3% Blue Products 22.3 21.9 22.6 27.3 Yellow Products 9.2 8.1 12.0 14.1 Green Products 5.7 6.2 4.8 6.4 Outsourced Services 6.8 7.0 7.6 9.7 Total Sales 100.0% 100.0% 100.0% 100.0%
The largest centers had significantly higher emphasis on blue products. As shown below, they also earned better margins on those sales.
Gross Profit Margins by Product Type
Under $400k
$400k to $600k
$600k to $1 mm
Over $1mm
Red Products 73.4% 71.4% 74.7% 68.0% Blue Products 78.1% 79.9% 75.3% 82.4% Yellow Products 72.0% 76.4% 77.5% 84.0% Green Products 55.4% 61.8% 61.9% 71.2% Outsourced Services 34.7% 40.4% 34.6% 35.9% Average Total Gross Profit Margin 69.9% 70.2% 70.5% 70.2%
As mentioned earlier, since we were unable to allocate shipping and delivery, shop supplies and miscellaneous expenses to the various product types, not all costs are accounted for in the table. While the above analysis does not present a complete accounting for all costs, it does give an overall sense of profitability by product type.
Profitability in the Growing Center As sales increase, staff costs also increase as a percentage of sales. Operating expenses (overhead items inclusive of royalty) are highest as a percentage of sales when sales are low, as would be expected. The charts below show these trends.
Managing profitability in a growing center requires careful timing of expansion. As the center grows and operates near maximum capacity, it is at its highest level of efficiency and profitability.
Once the center reaches maximum capacity, any additional sales require expansion. Whether
Operating Expenses
27.7% 28.3% 26.9%
36.40%
0.00%
10.00%
20.00%
30.00%
40.00%
Under$400k
$400k to$600k
$600k to$1mm
Over$1mm
Staff Costs (Except Owners)
20.51%
23.73%
21.31%19.97%
0.00%
5.00%
10.00%
15.00%
20.00%
25.00%
Under$400k
$400k to$600k
$600k to$1mm
Over$1mm
©2018 BRS

the expansion is more people, space or equipment, it comes with higher fixed expenses. These expenses tend to “stair-step” up, and to expand you must take the next step. Just after expansion, the center is at its lowest level of efficiency, operating below its new capacity, and is at its least profitable level. The charts below show the effect of a “step up” (a profitability step down) occurring as centers go over the $1 million sales mark.
As sales near $1 million, centers become less efficient with respect to profits as a percentage of sales. For this reason, it is critical that centers having $400,000 to $600,000 in annual sales get their profitability and productivity under control, as they should at this point earn their highest profit percentages.
More Profit Dollars to Owners
High-volume centers earn the lowest profits as a percentage of sales, as is shown above. However, when the lower percentage is applied to the higher sales, the net result is more profit dollars available to owners.
Owner's Discretionary Profit %
17.7%
22.7%
21.6%
14.9%
0.0%
5.0%
10.0%
15.0%
20.0%
25.0%
30.0%
Under$400k
$400k to$600k
$600k to$1mm
Over$1mm
Median Sales
$500,000
$1,500,000
$735,000
$350,000
$0
$500,000
$1,000,000
$1,500,000
Under$400k
$400k to$600k
$60k to1mm
Over$1mm
Owner's Discretionary Profit Dollars
$48,500
$147,000
$260,000
$118,000
$0
$50,000
$100,000
$150,000
$200,000
Under 400k $400k to$600k
$600k to$1mm
Over $1mm
©2018 BRS

Section IV – Action Plans For Success (Full Scope Study only – not included in Limited Scope)
The first step toward getting financial control of your business is to evaluate how your center compares to the industry in the four key financial performance areas: profitability, productivity, financial position and cash flow. Comparing your results to the benchmarks in this report will help you to identify specific strengths and weaknesses of your business. Once the specific areas of concern are identified, you can focus your plans for corrective action.
In order to improve on any given condition or problem, the cause of the problem must first be identified. At Appendix E you will find a "Cause and Effect Road Map" which is designed to help you consider a number of possible causes for some specific problems. Follow the directions for using the Road Map to help identify the causes of problems in your business. Once you identify what caused a problem, you can then develop an appropriate action plan to correct it.
On the following pages is yet another tool for identifying the causes of specific problems business owners and managers encounter. This listing of specific problems, potential causes for those problems, and suggested goals and action plans is designed to help you find things you can do differently in your business to improve profits and cash flow.
Suggestions are separated into the four key financial performance areas:
• Planning for Profitability - efficiently generating profits from sales
• Planning for Productivity - managing staff efficiency
• Planning for Financial Position – controlling debt and efficiently generating salesand profits from your investment in assets
• Planning for Cash Flow - managing working capital in the ongoing operations of thebusiness
Here are some hints for getting the most from this section:
1. Compare your own ratios and common-sized statements to the benchmarks in this study(if available refer to your Company’s Consulting Report that you received with theBenchmarking Study) to identify the strengths and weaknesses of your business.
2. Determine which of the four key financial performance areas require your attentionbased on your situation – profitability productivity, financial position or cash flow.
3. Review the sample goals and action plans related to those areas on the following pagesand determine what you could do to improve your situation.
4. Write down your goals and plans and begin implementation.
5. Assess progress towards goals monthly.
©2018 BRS

Planning for Profitability (Full Scope Study only – not included in Limited Scope)
Profitability - efficiently generating profits from sales
Problems: Low Sales High Staff Costs (see Planning for Productivity) Low Gross Margin High Operating Expenses High Hidden Costs Low Net Profits
Possible Cause for Low Sales:
Inconsistent approach to the selling process Lack of organized marketing plan or implementation Insufficient new customer development efforts Underselling to existing customers
Goal: Make basic selling activities your personal highest priority
Possible Action Plans: Assess whether you are consistently following up on important sales activities. Follow up on quotes and find out reasons for lost jobs. Make sure you’re having regular personal contact with clients and prospects. Get to know your clients and assess their value to focus on those most worth
keeping. Ask your clients for more business. Ask your clients for referrals. Ask where customers heard about you to determine whether there are more
opportunities to sell in that “channel”. Send packet of information about the services you provide with all credit
applications. Get your center database up to date by making public relations calls to promote
business. Promote your services with consistent regular mailings to your center database and
with inserts to customers’ account statements. Share promotion pieces and ideas with other center owners. Allocate your own workload effectively to allow sufficient time for selling activities.
Have reliable key employees to whom you can delegate operational issues, allowing you to focus on selling.
Get out of the center to sell so that your staff can learn to manage operations and understand the importance of your focus on selling. For better or for worse, your attitude toward selling is contagious.
Keep morale high in your center – for both you and your staff – by acknowledging effort and achievement regularly.
Make sure your center is a clean and attractive place to do business. Make sure your delivery vehicle is clean and neat. Make sure all counter people are alert to opportunities to increase counter sales. Set a high goal for front counter daily sales and celebrate your staff’s achievements
to acknowledge their efforts. Hire and manage an outside sales person(s).
©2018 BRS

Planning for Productivity (Full Scope Study only – not included in Limited Scope)
Productivity – managing staff and materials efficiently
Problem: High Payroll Expenses Low Sales Per Employee
Possible Causes for High Payroll Expenses and Low Sales Per Employee:
Sales volume not sufficient to support minimum level of employees needed Too many employees at your level of sales Lack of incentive pay plans Low productivity of employees Poor quality control resulting in costly re-do’s High management staff due to sales volume, multiple locations or non-working
owners
Goal: Operate using the optimum level of staff
Possible Action Plans: Review the mix of employees (sales, production, counter, etc.) and reallocate staff
cost dollars by changing roles or hiring practices, if necessary. If you have multiple locations, consider whether you need to reallocate staff between
locations. Consider closing low-volume locations if key customers can be retained. Monitor sales per employee and sales per press operator to determine reasonable
levels of staff productivity and capacity. If you have too many employees for the current workload, lay somebody off rather
than assuming that the sales volume to support them is just around the corner. Use “variable cost” labor force – maintain a list of part-time workers on-call for large
projects (students, homemakers, retirees and handicapped workers can be good candidates).
Implement cross training program(s) for employees. Have written job descriptions and procedure manuals.
Goal: Provide incentives for increased productivity
Possible Action Plans: Review your existing compensation system to determine whether adequate
incentives are built in to assure diligent job performance. Focus incentive pay programs on production gains, controlling rework or profitability
– not on sales volume. Develop production standards for your own center that can be used as benchmarks
for goal setting. Then reward employees for improved performance. Set measurable goals for each employee and hold them accountable for their
performance. Give small incentive bonus ($2.00) to any employee who catches an error on an
order before it goes to the customer. Then issue a “caught it” coupon for that employee which is entered in a pool from which a monthly or quarterly drawing is taken for a special incentive, such as a dinner gift certificate.
©2018 BRS

Appendix A
Appendix A Financial Statistics for
All Centers and Top 25% In this Appendix the performance of all centers is compared and contrasted with that of the top 25%. The top 25% is made up of the most profitable companies defined by their Owner’s Discretionary Profit Percentage, as follows:
Net Profit Before Tax + Owner Compensation = Owner’s Discretionary Profit Percentage Sales
Once each center's owner’s discretionary profit was computed the amounts were listed in order from highest to lowest. The respondents were then separated into quartiles based on their owner's discretionary profit. The top 25% of the respondents were included in the top quartile. The goal of this process is to segregate the most profitable centers so we can identify the management efficiencies that exist in the top 25%. Then we can evaluate the differences between centers experiencing differing levels of profitability.
Profitability of centers has increased over the two years studied.
2004 2005 Top 25% Over 18% Over 21% Median 16% 19%Bottom 25% Under 5% Under 10%
Median Ratios The statistics presented at Appendix A-2 are the median ratios (mid-point) of the group of centers presented. These figures are referred to frequently throughout this report.
REMEMBER: Median ratios indicate a "half-way point," thereby dividing all those reporting into two halves: a top half (centers having a ratio higher than the median) and a bottom half (centers having a ratio lower than the median). Comparing ratios of an individual center to median ratios will indicate specific areas where improvement is desired, based on its ranking compared to the group. For example, if your sales per employee ratio is lower than the median ratio you may want to implement some actions that will improve your employees’ productivity.
Common-sized financial statements provide another method of evaluating results, but they do not divide the group into halves. Instead, they present average figures that could be distorted by a few unusual centers. These statements do, however, give a general guideline for comparison when evaluating more detailed statistics.
©2018 BRS

Appendix A
Color Centers, Inc. Median Financial Operating Ratios
All Centers Top 25% 2004 2005 2004 2005
PROFITABILITY (Number of Responses) (200) (200) (50) (50)
Cost Of Goods Sold* Cost of Goods Sold Sales 28.5% 28.6% 27.5% 27.0%
Gross Margin Gross Profit Sales 71.5% 71.4% 72.5% 72.9%
Staff Costs Excluding Owners
Non-Owner Salaries, PR Taxes, Benefits Sales
21.1% 21.4% 20.8% 21.0%
Operating Expenses Operating Expenses Sales
29.6% 28.8% 25.8% 25.8%
Net Profit Margin* Net Income Before Tax Sales 3.7% 8.2% 6.3% 9.2%
Owner’s Discretionary Profit Margin
Net Income Before Tax Plus Owner Salary Sales 16.2% 19.2% 22.4% 24.6%
Owner’s Discretionary Profit Dollars
Net Income Before Tax Plus Owner Salary $98,000 $120,000 $240,000 $285,000
PRODUCTIVITY Sales Per Employee Including Owners
Sales Number of Employees $112,004 $115,349 $134,149 $133,094
Staff Costs Per Employee Staff Costs Excluding Owners Number of Employees $33,793 $35,224 $33,094 $36,373
Sales Per Square Foot* Sales Total Square Feet $ $ $ $
Rent Per Square Foot* Rent Expense Total Square Feet $11 $13 $12 $16
Median Sales Group Middle Point $600,000 $625,000 $1,100,000 $1,200,000
FINANCIAL POSITION Sales-To-Assets Sales
Total Assets 2.13 2.22 2.29 2.25
Return On Assets* Owner’s Discretionary Profit Total Assets 35.0% 37.0% 47.0% 50.0%
Return On Investment* Owner’s Discretionary Profit Net Worth + Shareholder Loans 67.0% 65.0% 97.0% 98.0%
Debt-To-Worth Total Liabilities - Shareholder Loans Net Worth + Shareholder Loans 2.03 2.59 .96 1.29
CASH FLOW Current Current Assets
Current Liabilities 1.28 1.15 1.68 1.40
Quick* Cash + Accounts Receivable Current Liabilities .85 .92 1.27 1.12
Inventory Turnover* Cost of Goods Sold Inventory 25.44 33.25 34.98 34.68
Inventory Turn Days 365 Inventory Turnover 14 days 11 days 10 days 10 days
Accounts Receivable Turnover*
365 Accounts Receivable 8.5 8.9 7.8 8.1
Average Accounts Receivable Days
365 Accounts Receivable 43 days 41 days 47 days 45 days
Accounts Payable Turnover*
365 Accounts Payable 7.4 7.3 8.5 8.1
Average Accounts Payable Days
365 Accounts Payable Turnover 49 days 50 days 43 days 45 days
*Selection of additional ratios for Full Scope Study determined in the design phase. Not included in Limited Scope Study.
©2018 BRS

Appendix A
Color Centers, Inc. Common-Sized Profit and Loss
Percentage of Total Sales All Centers Top 25%
2004 2005 2004 2005 SALES ..................................................................................... 100.0% 100.0% 100.0% 100.0 COST OF GOODS SOLD........................................................ 33.4 29.7 30.8 28.6 GROSS PROFIT...................................................................... 66.5 70.3 69.1 71.3
STAFF COSTS Production and Delivery Wages and Bonuses ........................ 14.4 11.6 14.0 11.7 Sales and Administrative Wages and Bonuses....................... 5.5 7.6 6.1 7.2 Payroll Taxes, Workers’ Compensation and Benefits ............. 1.5 1.8 1.7 2.2
Staff Costs Except Owners.............................................. 21.5 21.1 21.8 21.1
Owner Draws, Compensation and Benefits............................. 9.6 9.8 12.0 13.1 TOTAL INCLUDING OWNERS ........................................... 31.1 30.9 33.9 34.3
OPERATING EXPENSES Royalties .................................................................................. 5.0 5.1 4.9 4.9 Rent.......................................................................................... 5.4 5.0 3.7 3.8 Equipment Operating Leases and Rents................................. 6.9 6.9 6.8 6.6 Equipment Depreciation........................................................... 2.1 2.2 2.0 1.2 Accounting and Legal .............................................................. .7 0.8 .5 0.7 Advertising ............................................................................... .4 0.4 .3 0.3 Bad Debts ................................................................................ .1 0.1 .1 0.1 Bank Charges .......................................................................... .6 0.6 .5 0.5 Computer Expenses ................................................................ .3 0.5 .3 0.3 Electricity/Gas .......................................................................... .5 0.5 .4 0.3 Insurance ................................................................................. .4 0.5 .4 0.4 Automobile Expense ................................................................ 1.6 1.6 1.1 1.4 Office Supplies......................................................................... .3 0.3 .2 0.2 Freight and Postage................................................................. .4 0.3 .5 0.3 Taxes and Licenses ................................................................. .2 0.2 .1 0.1 Repairs, Maintenance and Cleaning........................................ 1.1 1.1 .9 1.0 Seminars, Conference and Training ........................................ .3 0.2 .2 0.2 Telephone ................................................................................ 1.2 1.2 .9 0.9 General and Other Administrative Expenses .......................... 1.4 1.3 1.2 1.1 TOTAL OPERATING EXPENSES .......................................... 29.5 29.4 25.9 25.1
OPERATING PROFIT ............................................................. 5.8 9.8 9.3 11.8
OTHER INCOME AND EXPENSE Interest Expense ...................................................................... 1.4 1.2 1.0 0.9 Interest Income ........................................................................ (.5) (0.4) (.2) (0.6) Other Expense ......................................................................... .4 0.5 .9 0.3 Other Income ........................................................................... .00 (0.0) .0 (0.1) TOTAL OTHER INCOME AND EXPENSE............................. 1.4 1.2 1.7 0.6 PROFIT BEFORE TAX............................................................ 4.4% 8.5% 7.6% 11.2%
Actual categories determined in design phase of project.
©2018 BRS

Appendix A
Color Centers, Inc. Common-Sized Balance Sheet
Percentage of Total Assets
ASSETS All Centers Top 25% 2004 2005 2004 2005
CURRENT ASSETS Cash and Cash Equivalents ................... .9 0.8 2.7 4.4 Accounts Receivable .............................. 31.5 33.5 32.7 30.5 Inventory ................................................. 3.0 2.4 2.3 2.3Other Current Assets .............................. 7.9 5.5 6.9 6.8 Total Current Assets............................. 43.4 42.2 44.9 44.2
Net Fixed Assets................................... 33.6 31.7 28.0 31.1 Other Assets.......................................... 22.9 25.9 27.0 24.6 TOTAL ASSETS..................................... 100.0% 100.0% 100.0% 100.0%
LIABILITIES AND OWNERS’ EQUITY
CURRENT LIABILITIESNotes Payable Within One Year ............. 9.8 9.2 10.6 12.0 Accounts Payable ................................... 15.0 18.0 11.9 14.1 Other Current Liabilities .......................... 13.7 8.6 8.9 5.6 Total Current Liabilities........................ 38.6 35.9 31.5 31.7
LONG TERM LIABILITIES Notes Payable to Owners ....................... 23.7 15.7 18.2 10.4 Other Long-Term Liabilities .................... 25.3 29.9 20.3 31.2 Total Long Term Liabilities .................. 49.0 45.7 38.5 41.6
TOTAL LIABILITIES .............................. 87.7 81.6 70.0 73.3 TOTAL OWNERS’ EQUITY ................... 12.3 18.4 29.9 26.6 TOTAL LIABILITIES AND EQUITY ....... 100.0% 100.0% 100.0% 100.0%
©2018 BRS

Appendix B
Appendix B Financial Statistics by Sales Category
Sales volume can indicate the size of the center and can influence financial performance. To determine how center’s ratios change as sales increase, we sorted the participants into four separate groups based on their annual turnover.
• Less than $400,000• $400,000 to $600,000• $600,000 to $1,000,000• More than $1,000,000
The three basic statements (median financial operating ratios, and the common-sized balance sheet and profit and loss) appear on the pages that follow. This information shows some significant trends. Our observations are included in Section III - Operating Results.
©2018 BRS

Appendix B
Color Centers, Inc. Median Financial Operating Ratios
By Sales Category
PROFITABILITY RATIOS Under $400k
$400k to $600k
$600k to $1mm
Over $1mm
(Number Of Responses) (40) (53) (65) (40)
Cost Of Goods Sold* 29.4% 28.6% 29.7% 29.6% Gross Margin 70.5% 71.4% 70.2% 70.4% Staff Costs Excluding Owners 19.9% 20.5% 21.3% 23.7% Operating Expenses 36.4% 27.7% 28.3% 26.9% Net Profit Margin* 4.9% 9.7% 6.2% 9.4% Owner’s Discretionary Profit Margin 14.9% 22.7% 21.6% 17.6% Owner’s Discretionary Profit Dollars $48,500 $118,000 $147,000 $260,000
PRODUCTIVITY RATIOS Sales Per Employee Including Owners $98,818 $100,088 $124,612 $144,235
Staff Costs Per Employee $34,636 $30,787 $36,290 $37,074 Sales Per Square Foot* $ $ $ $ Rent Per Square Foot* $13 $13 $12 $23 Median Sales $350,000 $500,000 $735,000 $1,500,000
FINANCIAL POSITION RATIOS Sales-To-Assets 2.10 2.65 2.38 2.27Capital Asset Costs* 12.4% 9.3% 9.6% 9.5% Return On Assets* 20.0% 48.0% 34.0% 30.0% Return On Net Assets 25.0% 70.0% 75.0% 50.0% Debt-To-Worth 2.50 1.77 1.60 1.14
CASH FLOW RATIOS
Current 1.03 1.23 1.14 1.27Quick* .60 1.17 .92 1.05Inventory Turnover* 27.2 26.9 35.9 43.0 Inventory Turn Days* 13 days 14 days 12 days 8 days Accounts Receivable Turnover* 8.9 7 7.3 7.3Average Account Receivable Collection Days 41 days 52 days 50 days 50 days
Accounts Payable Turnover* 7.6 7 6.8 6.6Average Accounts Payable Payment Days 48 days 52 days 54 days 55 days
For a description of how each ratio is calculated and interpreted refer to Appendix C. *Selection of additional ratios for Full Scope Study determined in the design phase. Not included in Limited Scope Study.
©2018 BRS

Appendix B
Color Centers, Inc. Common-Sized Profit and Loss
Percentage of Total Sales - By Sales Category Under $400k
$400k to $600k
$600k to $1mm
Over $1mm
SALES...................................................................... 100.0% 100.0% 100.0% 100.0% COST OF GOODS SOLD......................................... 30.1 29.6 29.4 29.7 GROSS PROFIT....................................................... 69.9 70.3 70.5 70.2 STAFF COSTS Production and Delivery Wages and Bonuses.......... 11.9 11.1 12.4 11.1 Sales and Administrative Wages and Bonuses ........ 6.5 7.2 6.7 10.5 Payroll Taxes, Workers’ Compensation and Benefits 1.6 1.4 2.0 2.0
Staff Costs Except Owners................................ 20.1 19.8 21.2 23.7 Owner Draws, Compensation and Benefits .............. 6.9 11.9 11.5 7.8
TOTAL INCLUDING OWNERS............................. 27.0 31.8 32.7 31.5
OPERATING EXPENSES Royalties ................................................................... 5.4 5.1 5.0 5.9 Rent .......................................................................... 7.3 4.4 4.6 4.0 Equipment Operating Leases and Rents .................. 7.4 5.6 6.8 8.2 Equipment Depreciation ........................................... 3.6 1.8 2.3 1.2 Accounting and Legal ............................................... 0.9 1.1 0.5 0.5 Advertising ................................................................ 1.0 0.2 0.3 0.2 Bad Debts ................................................................. 0.2 0.1 0.1 0.1 Bank Charges ........................................................... 0.8 0.6 0.6 0.5 Computer Expenses ................................................. 0.6 0.4 0.3 0.6 Electricity/Gas........................................................... 0.7 0.5 0.4 0.4 Insurance .................................................................. 0.7 0.6 0.4 0.4 Automobile Expense................................................. 1.8 1.8 1.8 0.8 Office Supplies.......................................................... 0.3 0.4 0.3 0.2 Freight and Postage ................................................. 0.2 0.3 0.4 0.3 Taxes and Licenses.................................................. 0.2 0.3 0.1 0.1 Repairs, Maintenance and Cleaning......................... 1.1 1.0 1.3 0.9 Seminars, Conference and Training ......................... 0.1 0.2 0.1 0.3 Telephone................................................................. 1.6 1.2 1.1 1.0 General and Other Administrative Expenses............ 0.9 0.8 1.6 1.7 TOTAL OPERATING EXPENSES ........................... 34.6 27.1 28.7 27.1 OPERATING PROFIT .............................................. 8.3 12.3 8.9 11.5 OTHER INCOME AND EXPENSE Interest Expense....................................................... 1.7 1.3 1.0 0.9 Interest Income ......................................................... (0.3) (0.5) (0.3) (0.5) Other Expense.......................................................... 0.6 0.0 0.5 0.9 Other Income ............................................................ (0.0) (0.0) 0.0 (0.0) TOTAL OTHER INCOME AND EXPENSE .............. 2.0 0.7 1.3 1.2 PROFIT BEFORE TAX............................................. 6.3% 11.6% 7.6% 10.3%
©2018 BRS

Appendix B
Color Centers, Inc. Common-Sized Balance Sheet
Percentage of Total Assets - By Sales Category
ASSETS
CURRENT ASSETS Under $400k
$400k to $600k
$600k to $1mm
Over $1mm
Cash and Cash Equivalents ......................... 2.6 (0.7 (0.9) 2.8 Accounts Receivable .................................... 23.6 45.5 33.8 29.7 Inventory ....................................................... 1.7 2.9 2.5 2.2Other Current Assets .................................... 4.1 2.7 9.2 5.4Total Current Assets................................... 32.1 50.5 44.6 40.3
Net Fixed Assets......................................... 39.9 33.4 24.8 30.4 Other Assets................................................ 27.9 16.0 30.5 29.2 TOTAL ASSETS........................................... 100.0% 100.0% 100.0% 100.0%
LIABILITIES AND OWNERS’ EQUITY
CURRENT LIABILITIESNotes Payable Within One Year ................... 10.3 10.8 7.7 8.5 Accounts Payable ......................................... 14.8 16.6 17.3 15.3 Other Current Liabilities ................................ 15.4 8.0 9.2 10.8 Total Current Liabilities.............................. 40.6 34.4 34.2 34.6
LONG TERM LIABILITIES Notes Payable to Owners ............................. 26.3 6.0 14.2 17.6 Other Long-Term Liabilities .......................... 32.8 33.5 28.4 25.1 Total Long Term Liabilities ........................ 59.2 39.5 42.6 42.8
TOTAL LIABILITIES .................................... 99.8 73.9 76.8 77.4 TOTAL OWNERS’ EQUITY ......................... 0.2 26.1 23.3 22.6 TOTAL LIABILITIES AND EQUITY ............. 100.0% 100.0% 100.0% 100.0%
©2018 BRS

Appendix C
Appendix C What the Ratios Mean and How They Are Used
Using Ratio Data to Measure Your Own Franchise
Whenever talk turns to sports, fans usually go to statistics to argue about individual performance and "who was best." A quarterback's pass completion record is an example of a ratio. Ratios help to measure performance in comparative terms; that is, they allow a comparison between two different values -- for example the number of pass completions in relation to those attempted. Using ratios, players who have passed a different number of times can be compared using a consistent standard, and evaluated for the efficiency of their performances.
Likewise, ratios allow you to focus on financial relationships in your business, rather than just on absolute numbers -- such as annual sales. Ratios let you compare your franchise's financial operating performance at different points of sales activity. Franchise and industry ratios can be used to accomplish three critical management tasks:
1. Compare current franchise performance against past performance to determineinternal strengths and weaknesses -- and their causes.
2. Compare current and past franchise performance (trends) against industryperformance (as described in this study) to determine competitive strengths andweaknesses -- and their causes.
3. Identify the causes of possible problems and design action plans to correct theconditions, thereby controlling the course of the franchise.
Key Influences on Financial Position Ratios
Most Franchisees are familiar with the profit and loss statement -- that's where the "bottom line" is. But the profit and loss statement only shows how well a business has performed during one season. As we mentioned earlier, the balance sheet shows the cumulative results of a franchise's operations from the day it opened.
Like a ball player's lifetime batting average, the balance sheet shows strength (or weakness) over time. Anyone can have one good season, but it takes more talent or more luck to keep repeating good performance year after year.
Investment in accounts receivable and inventory puts management pressure on owners if businesses lack capital. Low cash can cause loss of discounts from trade vendors, and may cause high borrowing. Both of these may cause profits to decline. Investment in equipment requires profits over time to recover its costs. Managing items on the balance sheet has a major impact on profits and planning for growth.
Risk As we noted earlier, the debt to worth ratio measures the relationship of capital supplied by creditors to capital supplied by the owner. To the extent that earnings are not sufficient to cover capital needs, then those needs will be met with increased debt. As more capital is supplied by creditors, the franchise becomes more leveraged. Increasing leverage, therefore, means
©2018 BRS

Appendix C
increasing debt, and increasing debt means increasing risk. Leverage equates to financial risk because:
1. Debt (as reflected in the interest and principal that comes due on a regular basis)is a "fixed" cost -- it must be repaid, even if sales or profits drop off.
2. Besides facing reduced total net profits in a down cycle, businesses frequentlycut prices to maintain market share -- thus cutting profit margins as well, andfurther reducing total profits.
3. When profits are reduced, the franchise may not have sufficient cash flow to beable to repay the debt -- and, obviously, the more debt a franchise has, thegreater the problem will be. In the most severe situations, a franchise may beforced into bankruptcy.
4. In addition, most bank debt is tied to variable interest rates -- if rates rise in aperiod of decreased sales (as they did in the early 1980's), high leverage willpose additional threats to the franchise's existence.
A strong balance sheet (with a high proportion of equity) implies that a franchise has "staying power." However, a prolonged recession or mismanagement can erode even the strongest of franchises. This threat is a continuing, long-term consideration. Often by the time management realizes that profits are not sufficient to support continuing operations, it's too late.
A Note of Caution . . . Many managers have been trained to evaluate performance strictly in terms of Return on Investment. Care must be taken in evaluating R.O.I. (which is expressed as Net Profits divided by Net Worth). A high R.O.I. figure can be produced by a combination of high profits or low net worth; but low net worth implies high liabilities, which, in turn, implies high risk.
©2018 BRS

Appendix C
PROFITABILITY RATIOS Ratio How to Calculate What it Means In Dollars and Cents
COST OF GOODS SOLD PERCENTAGE
Cost of Good Sold Sales
Measures efficiency—the number of dollars spent on ink, supplies and materials for every $1 of Sales. For example: a cost of goods sold percentage of 27.0% means that for every $1 of sales, the franchise spends 27 cents on supplies, damages, direct labor, and truck expense
GROSS MARGIN
Gross Profit Sales
Measures profitability at the gross profit level—the number of dollars of gross profit produced for every $1 of sales (after paying for cost of goods sold). For example: gross margin of 72.9% means that for every $1 of sales, the franchise produces about 73 cents of gross margin after paying for ink, supplies and materials.
STAFF COSTS EXCLUDING OWNERS
Non-Owner Salaries, Payroll Taxes, Benefits
Sales
Measures efficiency—the number of dollars in staff payroll expenses (customer service and support staff wages and benefits) spent for every $1 of sales. For example: staff costs of 21.0% means that for every $1 of sales, the franchise spends 21 cents on customer services and support staff wages, benefits and payroll taxes.
OPERATING EXPENSE PERCENTAGE
Operating ExpensesSales
Measures efficiency—the number of dollars on ”overhead” items for every $1 of sales. For example: a operating expense percentage of 25.8% means that for every $1 of sales, the franchise spends about 26 cents on operating expenses, such as facilities expense, advertising, insurance and other overhead items.
NET PROFIT MARGIN
Net Income Before Tax
Sales
Measures profitability—the number of dollars generated at the bottom line (but before income taxes) for every $1 of sales. For example: a net profit margin 9.2 means that for every $1 of sales, the franchise produces about 9 cents of net profit before tax.
OWNER'S DISCRETIONARY PROFIT MARGIN
Net Profit Before Tax Plus
Owner's Salary Sales
Measures profitability (including owner's salary) at the net profit level--the number of dollars of net profit produced for every dollar of sales. For example: an owner's discretionary profit margin of 24.6% means that for every $1 of sales, the franchise produces about 25 cents of owner's discretionary profit.
OWNER'S DISCRETIONARY PROFIT DOLLARS
Net Profit Before Tax Plus Owner's
Salary
Measures profitability (including owner's salary) at the net profit level--the number of dollars of net profit produced. For example: an owner's discretionary profit of $285,000 means that the franchises net profit before and before any payments were made to owners was $285,000.
©2018 BRS

Appendix D
Appendix D Financial Statements as Working Tools
Although financial statements represent the past, accurate and current financial statements provide extremely valuable clues to the condition of any business, making them indispensable tools in planning for the future. Here is an overview of the balance sheet and profit and loss, and an explanation of how the two tools work together.
Basic Tools: The Parts of the Statements
A Balance Sheet represents a "snapshot" of the franchise at a point in time. It lists the following:
Assets: what the business owns. Liabilities: what the business owes to it creditors. Net Worth: the difference between assets and liabilities -- which represents the equity of the owner(s).
In contrast, the income statement (also known as the profit and loss or "P & L") represents the business activity for a given period -- usually one year, but possibly a quarter or a month. The income statement shows the following:
Sales: the total sales for the period.
Cost of Goods Sold: the costs of producing product for customers during the period that are directly associated with coloring the jobs.
Gross Profit: sales minus cost of goods sold.
Staff Costs: wages, salaries, bonuses, benefits and worker’s compensation.
Operating Expenses: costs of business administration and management, office management, and sales (other than staff costs).
Operating Profit: gross profit minus staff costs and operating expenses. This is the profit from operations, without regard to interest expense (which is the cost of financing, not operating) and other non-operating items, such as interest income, other income and expense and income taxes.
Other Income and Expense: costs or revenues related to activities other than operations, such as financing or investing.
Profit Before Tax: operating profit plus or minus other income or expense.
©2018 BRS 30

Appendix D
How the Statements Work Together
The balance sheet and the income statement are directly related -- and together they show the economic functioning of the business. We can examine this financial operating flow by starting with assets and "working around" the financial operation of the business.
You own assets in order to make sales and you make sales in order to make profits. In the long run, a business must generate enough profits to accomplish three functions: to pay out to the Franchisees, to pay off liabilities, and to pay for new assets. Of course, all three of these purposes tie back to the balance sheet to net worth, to liabilities, and to assets. Remember to recognize what you're doing. If a business can't pay out to its owners, it's not a business -- it's a hobby.
The fact is, both the balance sheet and the profit and loss are needed for effective financial analysis -- one is relatively useless without the other. Here is a visual representation of the relationship between the balance sheet and the profit and loss -- and of the dynamic financial cycle that operates in every business.
PROFIT AND LOSS BALANCE SHEET
Sales
Net Profit
Assets = Liabilities + Net Worth
EFFICIENCY
Assets Liabilities Net Worth
3. To pay out to the owners.2. To pay off liabilities.1. To pay for new assets.
Back to: Uses of Profits:
THE FINANCIAL OPERATING CYCLE
©2018 BRS 31

Appendix E
Appendix E Financial Cause and Effect "Road Map"
Reading the "Road Map"
Businesses generally identify three major financial problems: low cash, low gross margin and/or low net profit.
The three situations, however, are not the causes of financial problems, they are the effects -- or symptoms -- of other hidden financial problems. To find causes we must trace back from the effects to examine a variety of possible causes for the symptoms.
To read the map, start at any box and work backward against the arrows, inserting the phrase "is caused by" between the categories in the boxes. For example: Low Gross Margin "is caused by" No Cash Discounts on Payables, Low Productivity, Bookkeeping Errors, etc. or, High Hidden Cost "is caused by" High Accounts Receivable, Too Much Inventory, etc.
The next step is to review your own business to determine if any of the possible causes are having an effect . . . and, if so, what actions you can take to improve the situation.
TWO IMPORTANT REMINDERS
1. Remember that profitability is also a function of efficiency -- so manage andmonitor both your balance sheet ratios and your productivity ratios.
2. In addition, constantly monitor cash flow. Use cash projection worksheets topredict cash shortages and develop a plan to provide for needed funds.Recognize the time difference between net profits and cash flow. It's a crucialone!
©2018 BRS 32

Appendix E
TH
E “
RO
AD
MA
P”
Cau
se -
and
- Eff
ect R
elat
ions
hips
Lea
ding
to F
inan
cial
Dis
tres
s
HIG
H C
UR
RE
NT
LIA
BIL
ITIE
S
HIG
H
LIA
BIL
ITIE
S
HIG
H
BO
RR
OW
ING
HIG
H
INTE
RE
ST
LOW
RE
TAIN
ED
E
AR
NIN
GS
NO
CA
SH
DIS
CO
UN
TS
ON
PA
YA
BLE
S
BO
OK
KE
EP
ING
E
RR
OR
S
SH
RIN
KA
GE
P
OO
R
BU
YIN
G
LOW
P
RO
DU
CTI
VIT
Y
PO
OR
INV
EN
TOR
Y
CO
NTR
OL
PO
OR
P
RIC
ING
NO
T E
NO
UG
H C
US
TOM
ER
CR
ED
IT:
LOW
AC
CO
UN
TS R
EC
EIV
AB
LE
NO
T E
NO
UG
H
INV
EN
TOR
Y
TOO
MU
CH
CU
STO
ME
R C
RE
DIT
: H
IGH
AC
CO
UN
TS R
EC
EIV
AB
LE
TOO
MU
CH
IN
VE
NTO
RY
LOW
GR
OSS
MAR
GIN
H
IGH
H
IDD
EN
CO
STS
P
OO
R E
XPE
NS
E
CO
NTR
OL
LOW
S
ALE
S LO
W N
ET P
RO
FITS
LOW
CAS
H
©2018 BRS 33