sample credit recommendation
TRANSCRIPT

Relative Value Recommendation – IG Non US Banks July 2013 Recommendation: Buy BCOCPE 5.75% 01/18/17 Summary
Downside Risks:
Less spread pick up that most other names
Peruvian economy could underperform
Political risks due to leadership
Nearly all LT borrowing is in USD
Significant rise in UST yield curve may impact cost of LT borrowing in the next 2-3 years.
Upside Risks:
Regional economy is among strongest analyzed
3mo to 5yr spread in local yield curve is rising
Strongest profitability, credit quality, and better than average liquidity vs. comparables
239bps Z-spread
3yr duration (among shortest of the comparables)
Security Selection Methodology
1. Guidance on criteria suggested by the Portfolio Manager / Director of Research a. IG, USD denominated debt b. Issuer Industry Group: financial services c. 4yr to 30yr maturities, fixed coupon
2. Initial screening via Bloomberg (“SRCH<GO>”)
a. S&P Issuer rating of BBB- or better b. Amount outstanding > US$100M and Amount issued > $250M c. Years to maturity > 3 (excluding perpetual bonds) d. Issuer country of domicile: any, excluding USA e. Industry group: Banking, commercial banks, consumer finance (excluded insurance, real estate, other
financial services) The criteria related to amounts issued and amounts outstanding were used to improve the probability that the results of the screen would provide investable issues with appropriate liquidity and size. The criteria on industry groups included only banks because, including the entire financial services sector would have lead to a much larger and more time consuming analysis. The results of this initial screening process yielded over 600 securities, representing over 40 countries and over 150 issuers (Results will be provided upon request). To further limit the universe of potential securities, a brief analysis of the interest rate and yield curve risk was applied to the results. See the following section.
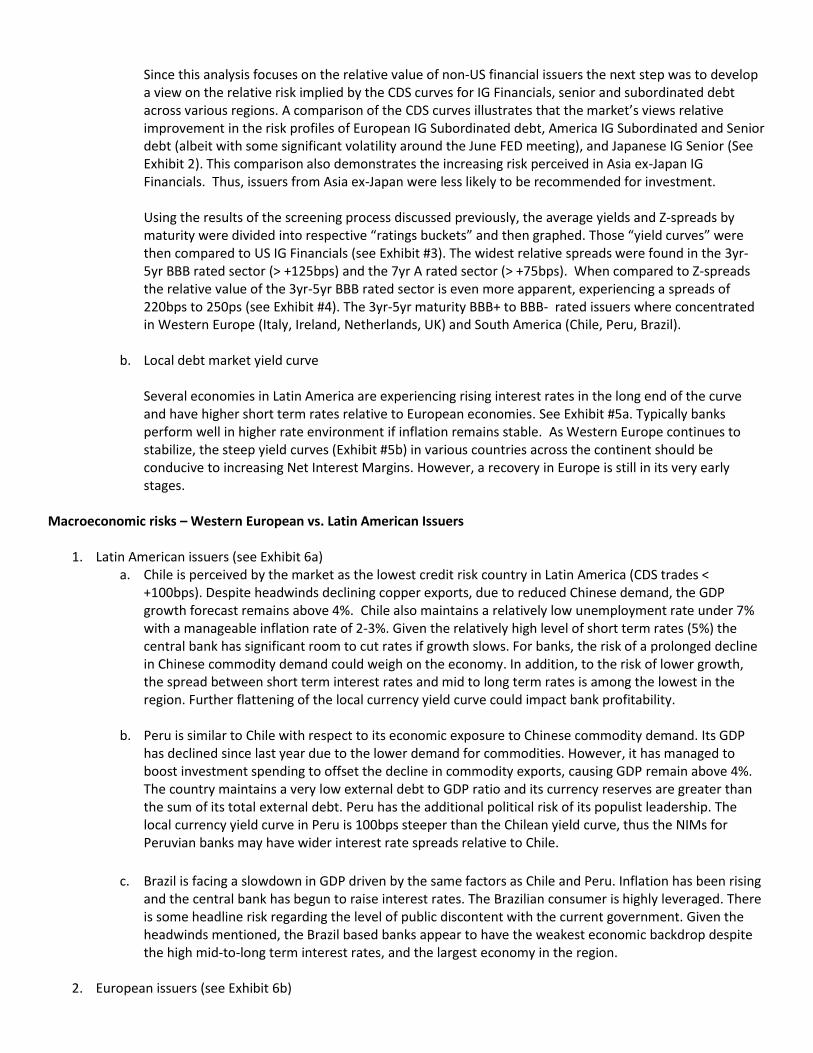
3. Interest rates and yield curve considerations
a. UST yield curve, Spreads vs. Treasuries, & CDS Security selection will be further limited to the shorter end of the yield curve. US Treasury and swap curves impact on the risk profile of any US Dollar denominated debt instrument. Given the indications from the FED and the trend in longer term yields, the likely assumption is for higher rates going forward. Over the last six months 5yr and 10yr rates have risen 58bps and 67bps, respectively. Conversely, short rates with maturities less than 1yr have fallen approximately 3 bps. (See Exhibit 1) As rates rise, longer dated, fixed coupon bonds (longer durations) are at greater risk than shorter date and floating rate bonds. Thus, it would be appropriate to limit the selection criteria further by focusing on the shorter maturities within the confines of the guidance found in Part #1 of this analysis. The focus of this analysis will be on subordinated debt issues of Europe and South America. This decision on region and capital structure was driven primarily by an analysis of CDS spreads and a yield curve derived from the results the screening process discussed above.
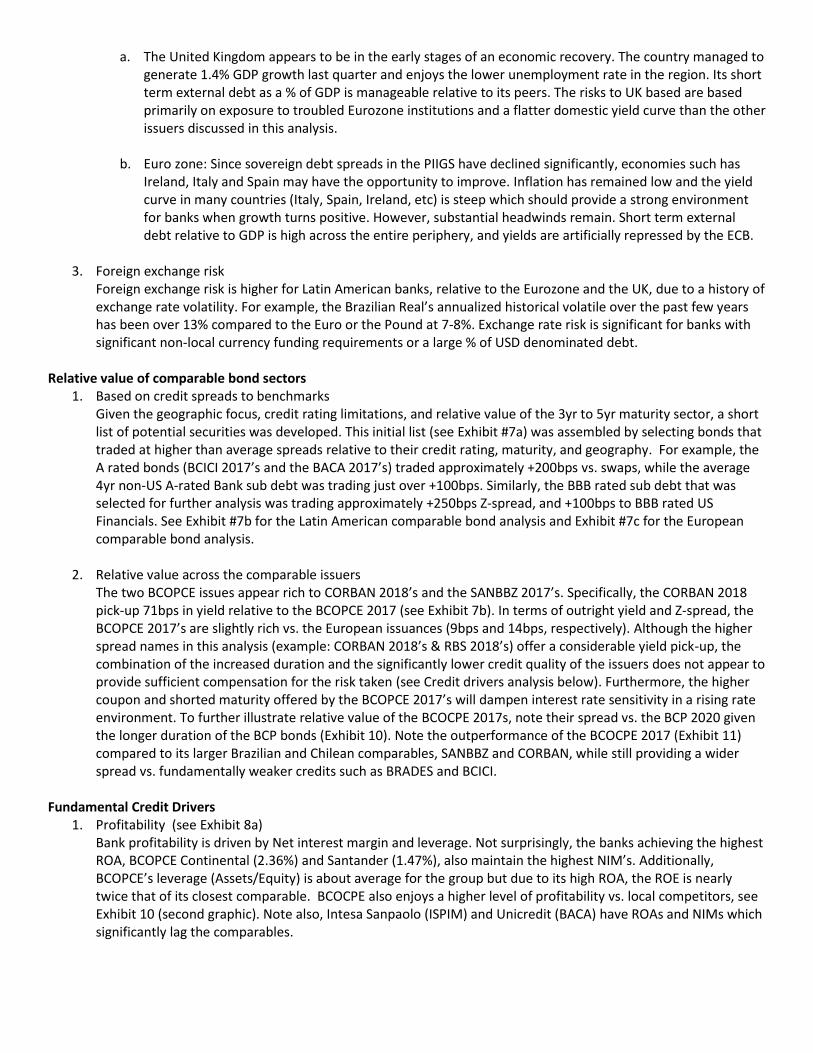
Since this analysis focuses on the relative value of non-US financial issuers the next step was to develop a view on the relative risk implied by the CDS curves for IG Financials, senior and subordinated debt across various regions. A comparison of the CDS curves illustrates that the market’s views relative improvement in the risk profiles of European IG Subordinated debt, America IG Subordinated and Senior debt (albeit with some significant volatility around the June FED meeting), and Japanese IG Senior (See Exhibit 2). This comparison also demonstrates the increasing risk perceived in Asia ex-Japan IG Financials. Thus, issuers from Asia ex-Japan were less likely to be recommended for investment. Using the results of the screening process discussed previously, the average yields and Z-spreads by maturity were divided into respective “ratings buckets” and then graphed. Those “yield curves” were then compared to US IG Financials (see Exhibit #3). The widest relative spreads were found in the 3yr-5yr BBB rated sector (> +125bps) and the 7yr A rated sector (> +75bps). When compared to Z-spreads the relative value of the 3yr-5yr BBB rated sector is even more apparent, experiencing a spreads of 220bps to 250ps (see Exhibit #4). The 3yr-5yr maturity BBB+ to BBB- rated issuers where concentrated in Western Europe (Italy, Ireland, Netherlands, UK) and South America (Chile, Peru, Brazil).
b. Local debt market yield curve Several economies in Latin America are experiencing rising interest rates in the long end of the curve and have higher short term rates relative to European economies. See Exhibit #5a. Typically banks perform well in higher rate environment if inflation remains stable. As Western Europe continues to stabilize, the steep yield curves (Exhibit #5b) in various countries across the continent should be conducive to increasing Net Interest Margins. However, a recovery in Europe is still in its very early stages.
Macroeconomic risks – Western European vs. Latin American Issuers
1. Latin American issuers (see Exhibit 6a) a. Chile is perceived by the market as the lowest credit risk country in Latin America (CDS trades <
+100bps). Despite headwinds declining copper exports, due to reduced Chinese demand, the GDP growth forecast remains above 4%. Chile also maintains a relatively low unemployment rate under 7% with a manageable inflation rate of 2-3%. Given the relatively high level of short term rates (5%) the central bank has significant room to cut rates if growth slows. For banks, the risk of a prolonged decline in Chinese commodity demand could weigh on the economy. In addition, to the risk of lower growth, the spread between short term interest rates and mid to long term rates is among the lowest in the region. Further flattening of the local currency yield curve could impact bank profitability.
b. Peru is similar to Chile with respect to its economic exposure to Chinese commodity demand. Its GDP
has declined since last year due to the lower demand for commodities. However, it has managed to boost investment spending to offset the decline in commodity exports, causing GDP remain above 4%. The country maintains a very low external debt to GDP ratio and its currency reserves are greater than the sum of its total external debt. Peru has the additional political risk of its populist leadership. The local currency yield curve in Peru is 100bps steeper than the Chilean yield curve, thus the NIMs for Peruvian banks may have wider interest rate spreads relative to Chile.
c. Brazil is facing a slowdown in GDP driven by the same factors as Chile and Peru. Inflation has been rising and the central bank has begun to raise interest rates. The Brazilian consumer is highly leveraged. There is some headline risk regarding the level of public discontent with the current government. Given the headwinds mentioned, the Brazil based banks appear to have the weakest economic backdrop despite the high mid-to-long term interest rates, and the largest economy in the region.
2. European issuers (see Exhibit 6b)
a. The United Kingdom appears to be in the early stages of an economic recovery. The country managed to generate 1.4% GDP growth last quarter and enjoys the lower unemployment rate in the region. Its short term external debt as a % of GDP is manageable relative to its peers. The risks to UK based are based primarily on exposure to troubled Eurozone institutions and a flatter domestic yield curve than the other issuers discussed in this analysis.
b. Euro zone: Since sovereign debt spreads in the PIIGS have declined significantly, economies such has
Ireland, Italy and Spain may have the opportunity to improve. Inflation has remained low and the yield curve in many countries (Italy, Spain, Ireland, etc) is steep which should provide a strong environment for banks when growth turns positive. However, substantial headwinds remain. Short term external debt relative to GDP is high across the entire periphery, and yields are artificially repressed by the ECB.
3. Foreign exchange risk
Foreign exchange risk is higher for Latin American banks, relative to the Eurozone and the UK, due to a history of exchange rate volatility. For example, the Brazilian Real’s annualized historical volatile over the past few years has been over 13% compared to the Euro or the Pound at 7-8%. Exchange rate risk is significant for banks with significant non-local currency funding requirements or a large % of USD denominated debt.
Relative value of comparable bond sectors
1. Based on credit spreads to benchmarks Given the geographic focus, credit rating limitations, and relative value of the 3yr to 5yr maturity sector, a short list of potential securities was developed. This initial list (see Exhibit #7a) was assembled by selecting bonds that traded at higher than average spreads relative to their credit rating, maturity, and geography. For example, the A rated bonds (BCICI 2017’s and the BACA 2017’s) traded approximately +200bps vs. swaps, while the average 4yr non-US A-rated Bank sub debt was trading just over +100bps. Similarly, the BBB rated sub debt that was selected for further analysis was trading approximately +250bps Z-spread, and +100bps to BBB rated US Financials. See Exhibit #7b for the Latin American comparable bond analysis and Exhibit #7c for the European comparable bond analysis.
2. Relative value across the comparable issuers
The two BCOPCE issues appear rich to CORBAN 2018’s and the SANBBZ 2017’s. Specifically, the CORBAN 2018 pick-up 71bps in yield relative to the BCOPCE 2017 (see Exhibit 7b). In terms of outright yield and Z-spread, the BCOPCE 2017’s are slightly rich vs. the European issuances (9bps and 14bps, respectively). Although the higher spread names in this analysis (example: CORBAN 2018’s & RBS 2018’s) offer a considerable yield pick-up, the combination of the increased duration and the significantly lower credit quality of the issuers does not appear to provide sufficient compensation for the risk taken (see Credit drivers analysis below). Furthermore, the higher coupon and shorted maturity offered by the BCOPCE 2017’s will dampen interest rate sensitivity in a rising rate environment. To further illustrate relative value of the BCOCPE 2017s, note their spread vs. the BCP 2020 given the longer duration of the BCP bonds (Exhibit 10). Note the outperformance of the BCOCPE 2017 (Exhibit 11) compared to its larger Brazilian and Chilean comparables, SANBBZ and CORBAN, while still providing a wider spread vs. fundamentally weaker credits such as BRADES and BCICI.
Fundamental Credit Drivers
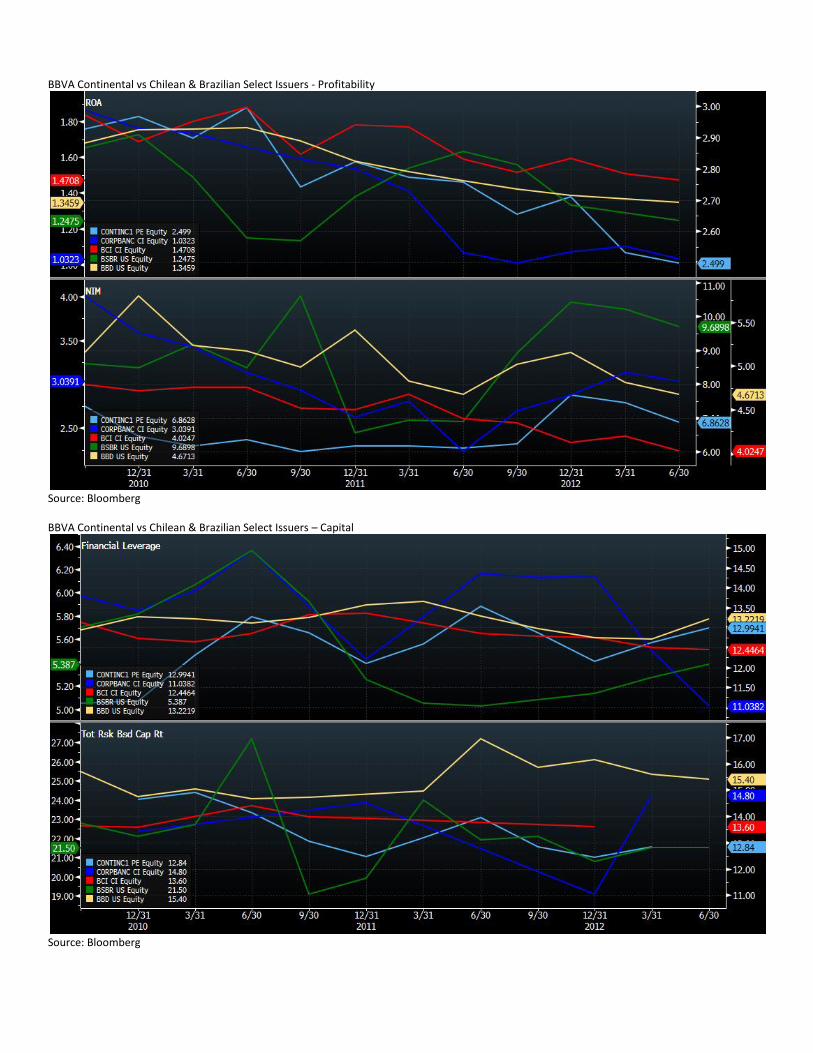
1. Profitability (see Exhibit 8a) Bank profitability is driven by Net interest margin and leverage. Not surprisingly, the banks achieving the highest ROA, BCOPCE Continental (2.36%) and Santander (1.47%), also maintain the highest NIM’s. Additionally, BCOPCE’s leverage (Assets/Equity) is about average for the group but due to its high ROA, the ROE is nearly twice that of its closest comparable. BCOCPE also enjoys a higher level of profitability vs. local competitors, see Exhibit 10 (second graphic). Note also, Intesa Sanpaolo (ISPIM) and Unicredit (BACA) have ROAs and NIMs which significantly lag the comparables.

2. Capital (see Exhibit 8a) Corpbanca and Santander the most under-levered banks in the group. Santander, due to a very high Common Equity to Assets ratio has less than 1/3 the leverage of RBS. Incidentally, both of the previously mentioned names are outliers relative to the comparable issuers. Corpbanca and BCICI appear to be the most reasonable leverage among the comparable issuers. However, a flaw in this analysis is that a detailed breakdown of the capital structure of each issuer was not done. Knowing the relative levels of Tier 1 capital, Tier 2 capital and long-term borrowing, is is useful in determining the interest rate sensitivity and the loss absorption capacity of the right hand side of the balance sheet.
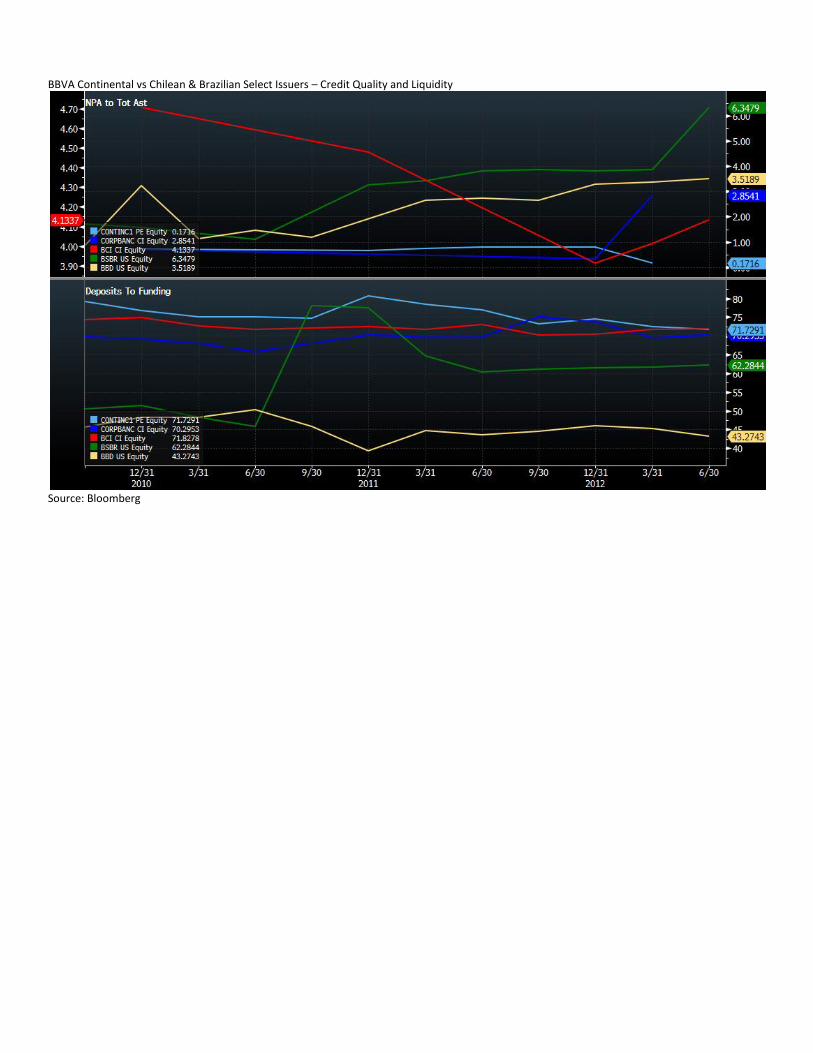
3. Credit Management (see Exhibit 8b)
Without strong credit management and coverage ratios, even small changes to loan spreads or in the credit quality of the loan book a may lead to credit impairments. BCOPCE’s credit quality ratios outperformed the other comparable banks. BCOPCE achieved a Texas ratio (nonperforming assets to common equity and loan loss reserves) of only 6.91% and a NPA/Total Asset ratio of under 0.20%, relative to the comparable averages of 57% (Texas) and 5.08% (NPA/Total Asset), respectively. Overall BCOPCE’s capital base appears relatively strong despite its reliance on USD denominated debt issuances to fund nearly all of its long term borrowings. Relative to local competitors, BCOCPE maintains a higher quality loan portfolio (see Exhibit 10, fourth and fifth graphs). Note Intesa Sanpaolo (ISPIM) and Unicredit (BACA) underperform in terms of credit quality with 13%-14% of their total loans in the non-performing category, a very high percentage relative the comparables.
4. Liquidity (see Exhibit 8c)
Cash availability and the ratio of interest-bearings liabilities to deposits determine how much flexibility a bank has in funding its operations and growing its asset base. Note that all the banks except for BCOPCE have loan to deposit ratios of well over 100%. A high ratio indicates these banks all must seek interest bearing funding sources to further grow assets, unless they are able to raise deposits. High ratios of deposits to assets, as experienced by BCOPCE (64.2%) and Corpbanca (59.6%), are indicative of greater flexibility than ratios well below 50% (ISPIM).
The ratio of interest earning assets to interest bearing liabilities and the % Free Funding may be a proxy for the degree of interest rate sensitivity of a bank’s balance sheet. Low ratios may indicate reliance on debt for expanding the loan book, or an excess amount of cash (yielding 0%) is sitting on the balance sheet. High ratios are preferable, thus Corpbanca (116%) and BCICI (132%) outperformed BCOPCE in this regard. However, BCOPCE’s deposit to funding ratio is the highest among the comparable issuers. This ratio indicates BCOPCE relatively lower reliance on LT debt (vs. shorter term sources) to fund itself.
Where this recommendation may require additional analysis/investigation
1. Subordination/debt distribution: In the interest of providing a timely response the request for a credit analysis sample, I did not attempt to look into the subordination and covenants of each debt issue. However, with more time, an analysis coverage ratios and structural subordination (parent vs. subs) would have been appropriate.
2. Trend analysis and balance sheet model: This recommendation would have benefitted from an analysis of the
historical trends of the capital and liquidity ratios to have a better sense of their relative “direction”.
3. A gap analysis of the maturities of the asset and liabilities should be conducted to further define interest rate sensitivity.
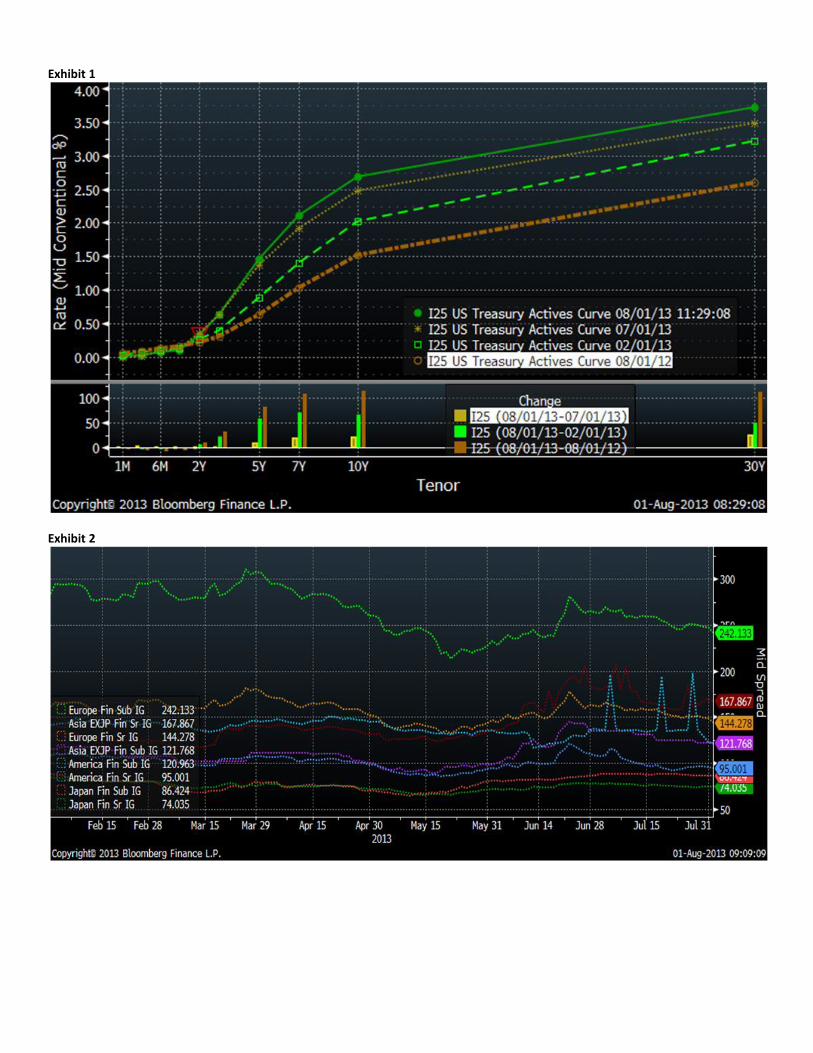
Exhibit 1
Exhibit 2
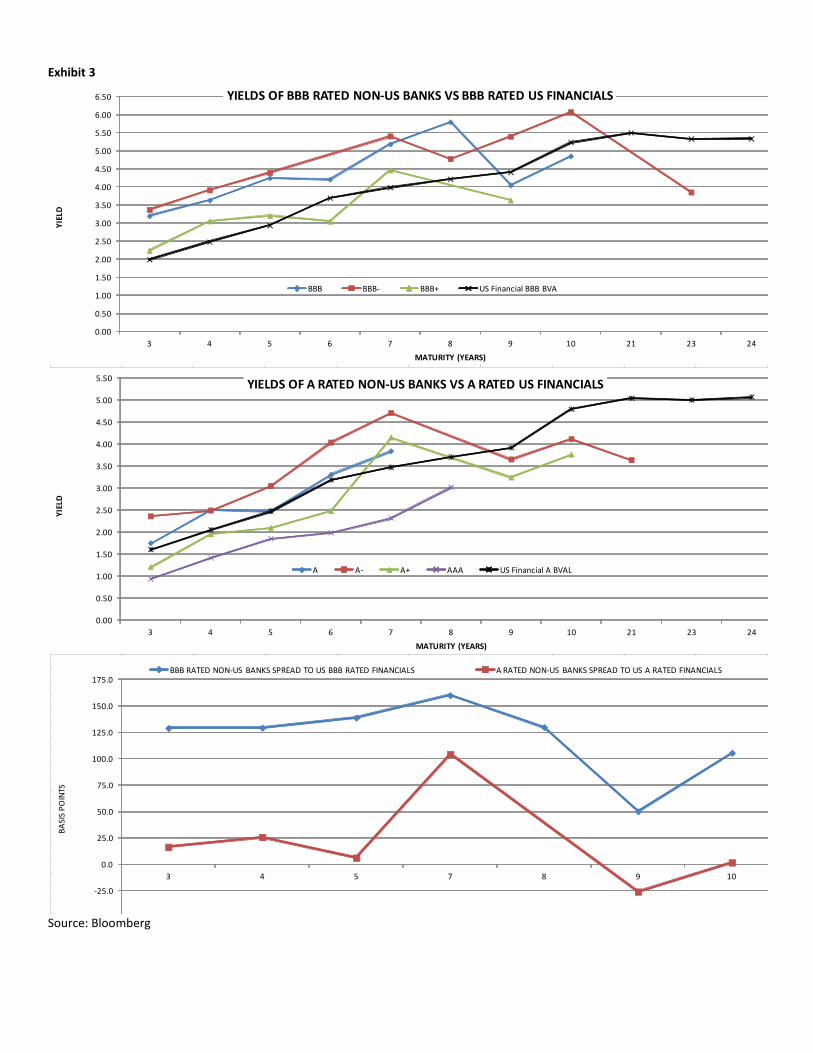
Exhibit 3
Source: Bloomberg
-50.0
-25.0
0.0
25.0
50.0
75.0
100.0
125.0
150.0
175.0
3 4 5 7 8 9 10
BA
SIS
PO
INTS
BBB RATED NON-US BANKS SPREAD TO US BBB RATED FINANCIALS A RATED NON-US BANKS SPREAD TO US A RATED FINANCIALS
0.00
0.50
1.00
1.50
2.00
2.50
3.00
3.50
4.00
4.50
5.00
5.50
3 4 5 6 7 8 9 10 21 23 24
YIE
LD
MATURITY (YEARS)
YIELDS OF A RATED NON-US BANKS VS A RATED US FINANCIALS
A A- A+ AAA US Financial A BVAL
0.00
0.50
1.00
1.50
2.00
2.50
3.00
3.50
4.00
4.50
5.00
5.50
6.00
6.50
3 4 5 6 7 8 9 10 21 23 24
YIE
LD
MATURITY (YEARS)
YIELDS OF BBB RATED NON-US BANKS VS BBB RATED US FINANCIALS
BBB BBB- BBB+ US Financial BBB BVA

Exhibit 4
Source: Bloomberg Exhibit 5a
0
50
100
150
200
250
300
3.00 4.00 5.00 6.00 7.00 9.00 10.00 21.00
BA
SIS
PO
INTS
MATURITY (YEARS)
A RATED NON-US BANKS' Z-SPREAD TO US SWAPS
0
50
100
150
200
250
300
350
400
450
3.00 4.00 5.00 6.00 7.00 8.00 9.00 10.00 23.00
BA
SIS
PO
INTS
MATURITY (YEARS)
BBB RATED NON-US BANKS' Z-SPREAD TO US SWAPS
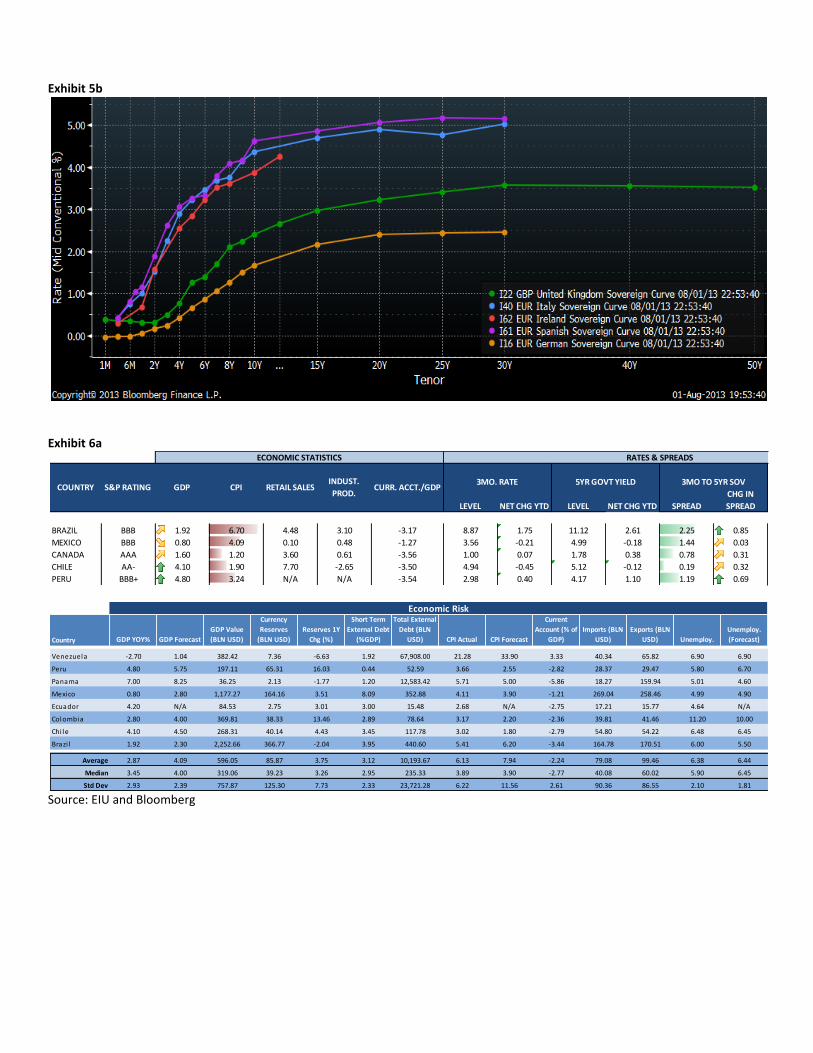
Exhibit 5b
Exhibit 6a
Source: EIU and Bloomberg
ECONOMIC STATISTICS
3MO. RATE 5YR GOVT YIELD 3MO TO 5YR SOV 10YR GOVT YIELD
LEVEL NET CHG YTD LEVEL NET CHG YTD SPREAD
CHG IN
SPREAD
BRAZIL BBB 1.92 6.70 4.48 3.10 -3.17 8.87 1.75 11.12 2.61 2.25 0.85
MEXICO BBB 0.80 4.09 0.10 0.48 -1.27 3.56 -0.21 4.99 -0.18 1.44 0.03
CANADA AAA 1.60 1.20 3.60 0.61 -3.56 1.00 0.07 1.78 0.38 0.78 0.31
CHILE AA- 4.10 1.90 7.70 -2.65 -3.50 4.94 -0.45 5.12 -0.12 0.19 0.32
PERU BBB+ 4.80 3.24 N/A N/A -3.54 2.98 0.40 4.17 1.10 1.19 0.69
COUNTRY
RATES & SPREADS
S&P RATING GDP CPI RETAIL SALESINDUST.
PROD.CURR. ACCT./GDP
Country GDP YOY% GDP Forecast
GDP Value
(BLN USD)
Currency
Reserves
(BLN USD)
Reserves 1Y
Chg (%)
Short Term
External Debt
(%GDP)
Total External
Debt (BLN
USD) CPI Actual CPI Forecast
Current
Account (% of
GDP)
Imports (BLN
USD)
Exports (BLN
USD) Unemploy.
Unemploy.
(Forecast)
Venezuela -2.70 1.04 382.42 7.36 -6.63 1.92 67,908.00 21.28 33.90 3.33 40.34 65.82 6.90 6.90
Peru 4.80 5.75 197.11 65.31 16.03 0.44 52.59 3.66 2.55 -2.82 28.37 29.47 5.80 6.70
Panama 7.00 8.25 36.25 2.13 -1.77 1.20 12,583.42 5.71 5.00 -5.86 18.27 159.94 5.01 4.60
Mexico 0.80 2.80 1,177.27 164.16 3.51 8.09 352.88 4.11 3.90 -1.21 269.04 258.46 4.99 4.90
Ecuador 4.20 N/A 84.53 2.75 3.01 3.00 15.48 2.68 N/A -2.75 17.21 15.77 4.64 N/A
Colombia 2.80 4.00 369.81 38.33 13.46 2.89 78.64 3.17 2.20 -2.36 39.81 41.46 11.20 10.00
Chi le 4.10 4.50 268.31 40.14 4.43 3.45 117.78 3.02 1.80 -2.79 54.80 54.22 6.48 6.45
Brazi l 1.92 2.30 2,252.66 366.77 -2.04 3.95 440.60 5.41 6.20 -3.44 164.78 170.51 6.00 5.50
Average 2.87 4.09 596.05 85.87 3.75 3.12 10,193.67 6.13 7.94 -2.24 79.08 99.46 6.38 6.44
Median 3.45 4.00 319.06 39.23 3.26 2.95 235.33 3.89 3.90 -2.77 40.08 60.02 5.90 6.45
Std Dev 2.93 2.39 757.87 125.30 7.73 2.33 23,721.28 6.22 11.56 2.61 90.36 86.55 2.10 1.81
Economic Risk

Exhibit 6b
Source: EIU and Bloomberg Exhibit 7a
Source: Bloomberg Exhibit 7b
Source: Bloomberg
ECONOMIC STATISTICS
3MO. RATE 5YR GOVT YIELD 3MO TO 5YR SOV 10YR GOVT YIELD
LEVEL NET CHG YTD LEVEL NET CHG YTD SPREAD
CHG IN
SPREAD
EUROZONE -1.10 1.60 -0.10 -1.30 1.40 0.23 0.04 0.69 0.36 0.46 0.32
GERMANY AAA -1.40 1.90 -2.80 -1.00 7.12 -0.02 0.03 0.69 0.36 0.71 0.33
FRANCE AA+ -0.40 0.90 0.40 0.40 -2.33 0.05 0.06 1.17 0.52 1.13 0.46
ITALY BBB -2.40 1.10 -1.13 -4.20 0.09 0.18 0.08 3.19 -0.15 3.01 -0.23
IRELAND BBB+ -0.90 0.70 -1.50 -8.00 6.34 0.20 -0.35 2.87 -0.45 2.67 -0.10
NETHERLANDS AAA -1.80 2.90 -0.60 -1.80 8.55 0.18 0.08 0.89 0.43 0.71 0.35
SPAIN BBB -1.70 1.80 -7.00 -1.30 3.59 0.18 0.08 3.27 -0.86 3.09 -0.94
BRITAIN AAA 1.40 2.90 2.10 -2.30 -3.90 0.51 0.00 1.33 0.45 0.82 0.45
COUNTRY
RATES & SPREADS
S&P RATING GDP CPI RETAIL SALESINDUST.
PROD.CURR. ACCT./GDP
Country GDP YOY% GDP Forecast
GDP Value
(BLN USD)
Currency
Reserves
(BLN USD)
Reserves 1Y
Chg (%)
Short Term
External Debt
(%GDP)
Total External
Debt (BLN
USD) CPI Actual CPI Forecast
Current
Account (% of
GDP)
Imports (BLN
USD)
Exports (BLN
USD) Unemploy.
Unemploy.
(Forecast)
United Kingdom 0.30 1.00 2,435.17 90.16 4.88 5.68 10,093.00 2.84 2.70 -2.57 435.93 301.63 6.47 7.90
Spain -1.40 -1.60 1,349.35 35.45 -0.19 17.87 2,311.34 2.44 1.60 3.59 0.62 211.12 25.08 27.00
Portugal -3.23 -2.70 212.45 2.75 23.76 16.71 508.29 2.78 0.60 1.06 46.90 37.90 16.33 18.00
Ita ly -2.40 -1.80 2,013.26 50.76 -2.02 22.02 2,492.94 3.31 1.50 0.09 1.15 327.43 12.10 12.10
Ireland 0.18 0.80 210.33 51.35 2.44 5.27 2,163.33 1.93 0.95 3.99 0.20 45.69 14.65 13.80
Germany 0.70 0.40 3,399.59 66.11 -2.50 7.93 5,718.98 2.14 1.60 4.73 2.51 911.59 6.82 6.90
France 0.00 -0.20 2,612.88 51.35 2.44 15.68 5,164.51 2.23 1.10 0.05 1.88 380.95 10.26 10.95
Finland -0.13 0.30 250.02 8.00 -3.04 3.04 599.32 -1.76 2.20 -1.81 49.66 50.52 7.50 8.20
Denmark -0.38 0.53 314.24 82.24 0.14 7.22 587.62 5.65 1.20 4.83 60.88 67.56 6.40 6.05
Austria 3.63 0.80 399.65 11.83 2.08 10.39 808.14 2.48 2.10 2.31 115.89 112.43 5.10 4.85
Average -0.27 -0.25 1,319.70 45.00 2.80 11.18 3,044.75 2.40 1.56 1.63 71.56 244.68 11.07 11.58
Median -0.07 0.35 874.50 51.06 1.11 9.16 2,237.34 2.46 1.55 1.69 24.70 161.77 8.88 9.58
Std Dev 1.87 1.31 1,210.27 30.42 7.79 6.42 3,098.31 1.81 0.64 2.67 133.60 267.39 6.22 6.73
Economic Risk
SECURITY COUNTRY S&P RATING YIELD MID
YEARS TO
MATURITY
YAS YIELD
SPREAD YAS Z-SPREAD DURATION MID
CORBAN 3 1/8 01/15/18 CHILE BBB+ 5.03 4.00 345.5 357.0 4.16
BCICI 3 09/13/17 CHILE A 3.29 4.00 175.8 198.2 3.85
BACA 7 1/4 02/15/17 AUSTRIA AA- 3.14 4.00 161.1 204.1 3.11
ISPIM 3 7/8 01/16/18 ITALY BBB 4.43 4.00 299.3 332.3 4.12
SANBBZ 4 5/8 02/13/17 BRAZIL BBB 3.75 4.00 230.4 278.6 3.23
BCOCPE 5 3/4 01/18/17 PERU BBB 3.59 3.00 206.8 252.7 3.18
RBS 4.65 06/04/18 BRITAIN BBB- 4.28 5.00 284.1 290.6 4.35
Security S&P Price Ask YTW Spread to Bench Benchmark Z-Spread
+/- Bps vs. 1yr
Avg.
# Sigma vs 1yr
Avg. Mod. Duration Amt Out Amt Issued CUSIP
BANBOG 5 01/17 BBB- 105.01 2.94 196 T 1 ⅜ 07/31/18 244 65 2.00 3.15 600MM 600MM 059514AA7
BCICI 3 09/17 A 99.19 3.75 172 T 1 ⅜ 07/31/18 193 79 2.40 3.78 600MM 600MM 05956NAB8
BCOCPE 3 ¼ 04/18 BBB 98.18 4.00 219 T 1 ⅜ 07/31/18 217 93 1.90 4.25 500MM 500MM 05537GAC9
BCOCPE 5 ¾ 01/17 BBB 107.6 3.40 191 T 1 ⅜ 07/31/18 239 86 2.50 3.13 500MM 500MM EI9546629
BRADES 4 ½ 01/17 BBB 105.05 5.17 146 T 1 ⅜ 07/31/18 194 69 2.00 3.17 800MM 800MM 05947KAM2
CORBAN 3 ⅛ 01/18 BBB+ 93 4.11 341 T 1 ⅜ 07/31/18 348 -66 -2.50 4.06 800MM 800MM 21987AAB6
DAVIVI 2.95 01/18 BBB- 95.15 5.05 266 T 1 ⅜ 07/31/18 271 72 2.20 4.13 500MM 500MM EJ5273549
GLBACO 4 ¾ 10/17 BBB 100.38 3.21 316 T 1 ⅜ 07/31/18 336 86 1.90 3.68 200MM 200MM 37952PAA2
SANBBZ 4 ⅝ 02/17 BBB 102.85 2.70 227 T 1 ⅜ 07/31/18 272 66 2.50 3.16 1.35MMM 1.35MMM 05966TAP2
TANNER 4 ⅜ 03/18 BBB- 97.25 3.60 356 T 1 ⅜ 07/31/18 359 37 1.40 4.04 250MM 250MM EJ5839992
Average 3.79 243 267 3.66

Exhibit 7c
Source: Bloomberg
Exhibit 8a
Source: Bloomberg
Exhibit 8b
Source: Bloomberg
Exhibit 8c
Source: Bloomberg
Security S&P Price Ask YTW Spread to Bench Benchmark Z-Spread
+/- Bps vs. 1yr
Avg.
# Sigma vs 1yr
Avg. Mod. Duration Amt Out Amt Issued CUSIP
BBVASM 4.664 10/15 BBB- 103.62 2.93 261 T 0 ¼ 07/31/15 237 -35 -1.1 2.04 2MMM 2MMM 055299AL5
ISPIM 3 ⅛ 01/16 BBB 99.53 3.33 269 T 0 ⅝ 07/15/16 268 -34 -0.9 2.33 2MMM 2MMM 46115HAG2
ISPIM 3 ⅞ 01/18 BBB 98.95 4.13 265 T 1 ⅜ 07/31/18 272 -30 -0.9 4.03 1.5MMM 1.5MMM 46115HAJ6
RBS 4.65 06/18 BBB- 99.99 4.65 316 T 1 ⅜ 07/31/18 309 -54 -1.6 4.25 499MM 499.29MM 00080QAB1
SANTAN 5.911 06/16 BBB- 106.33 3.57 293 T 0 ⅝ 07/15/16 279 -6 0.9 2.63 300MM 300MM 80281TAC2
SOCGEN 5 ¾ 04/16 BBB+ 107.72 2.77 213 T 0 ⅝ 07/15/16 204 -61 -1.4 2.48 518MM 1MMM 83364LAB5
BACA 7 ¼ 02/17 AA- 113.89 3.06 158 T 1 ⅜ 07/31/18 204 -24 0.9 3.06 700MM 700MM 060587AB8
Average 3.49 254 253 2.97
Issuance Institution Name
Annualized
ROA
Annualized
ROE
Net Interest
Margin (%)
Net Interest
Spread (%) Efficiency Ratio
CORBAN 3 1/8 01/15/18 Corpbanca 0.86 10.66 3.13 2.45 57.91
BCICI 3 09/13/17 Banco De Credito E Inversion 1.20 15.05 4.20 3.08 49.55
BACA 7 1/4 02/15/17 Unicredit Spa 0.20 2.87 1.59 1.61 68.95
ISPIM 3 7/8 01/16/18 Intesa Sanpaolo 0.18 2.47 1.43 1.91 52.65
SANBBZ 4 5/8 02/13/17 Banco Santander Brasil-Ads 1.47 7.78 10.21 9.78 37.86
BCOCPE 5 3/4 01/18/17 Bbva Banco Continental Sa-Co 2.36 29.76 8.13 7.99 34.19
RBS 4.65 06/04/18 Royal Bank Of Scotland Group 0.12 2.27 1.45 - 44.31
Issuance Institution Name
Tier 1 Risk-
Based Capital
Ratio (%)
Total Risk-
Based Capital
Ratio (%)
Common
Equity/ Total
Assets (%) Assets/ Equity
Avg Equity/ Avg
Assets (%)
Tang Com
Equity/ Risk-
Wtd Assets (%)
CORBAN 3 1/8 01/15/18 Corpbanca 6.33 11.05 9.17 10.46 8.24 4.00
BCICI 3 09/13/17 Banco De Credito E Inversion 9.62 13.60 8.09 12.37 7.89 9.07
BACA 7 1/4 02/15/17 Unicredit Spa 11.44 14.52 6.83 13.71 6.73 11.06
ISPIM 3 7/8 01/16/18 Intesa Sanpaolo 12.10 13.60 7.40 13.36 7.48 11.69
SANBBZ 4 5/8 02/13/17 Banco Santander Brasil-Ads 19.32 20.80 18.60 5.36 19.30 15.94
BCOCPE 5 3/4 01/18/17 Bbva Banco Continental Sa-Co - 12.43 7.37 13.57 7.29 9.90
RBS 4.65 06/04/18 Royal Bank Of Scotland Group 12.40 14.50 5.40 18.38 5.31 12.72
Capital
Profitability
Issuance Texas Ratio (%)
Annualized Net
Chg-Offs/ Avg
Tot Loans
Prov Loan
Losses/ Total
Loans (%)
Actual Loan
Losses/
Provisions (%)
Loan Loss
Coverage
Rsrv for Loan
Losses/ Tot
Loans (%)
Loan Loss Res/
NPA's (bps)
NPA's/ Total
Assets (%)
NPA's/ Total
Loans(%)
CORBAN 3 1/8 01/15/18 7.08 0.63 0.13 77.17 3.50 1.69 44.75 2.85 3.77
BCICI 3 09/13/17 42.84 0.96 0.14 68.10 3.56 2.44 44.73 4.01 5.46
BACA 7 1/4 02/15/17 96.51 0.30 0.81 19.00 5.05 6.72 47.49 8.93 14.15
ISPIM 3 7/8 01/16/18 84.14 0.05 0.40 4.60 36.50 6.57 48.93 7.65 13.42
SANBBZ 4 5/8 02/13/17 25.38 5.70 0.23 961.23 0.92 7.05 89.93 3.87 7.84
BCOCPE 5 3/4 01/18/17 6.91 0.01 0.43 0.38 1,170.36 4.57 1,693.41 0.17 0.27
RBS 4.65 06/04/18 54.31 - 0.31 402.50 0.01 4.71 52.10 3.14 9.04
Credit Quality
Issuance Institution Name
Total Loans/
Total Deposits
(%)
Total Loans/
Total Assets (%)
Deposits/ Assets
(%)
Deposits/
Funding (%)
Free Funding
(%)
Earning Assets/
Int Bear Liab
(%)
CORBAN 3 1/8 01/15/18 Corpbanca 126.86 75.67 59.65 69.48 19.44 116.29
BCICI 3 09/13/17 Banco De Credito E Inversion 123.02 73.57 59.80 71.69 28.31 132.96
BACA 7 1/4 02/15/17 Unicredit Spa 141.30 63.11 44.67 59.00 33.12 190.50
ISPIM 3 7/8 01/16/18 Intesa Sanpaolo 195.96 57.02 29.10 40.71 29.18 192.20
SANBBZ 4 5/8 02/13/17 Banco Santander Brasil-Ads 109.26 49.32 45.14 61.65 21.66 107.23
BCOCPE 5 3/4 01/18/17 Bbva Banco Continental Sa-Co 99.06 63.60 64.20 72.47 25.31 100.74
RBS 4.65 06/04/18 Royal Bank Of Scotland Group 103.73 34.68 33.44 57.91 - -
Liquidity
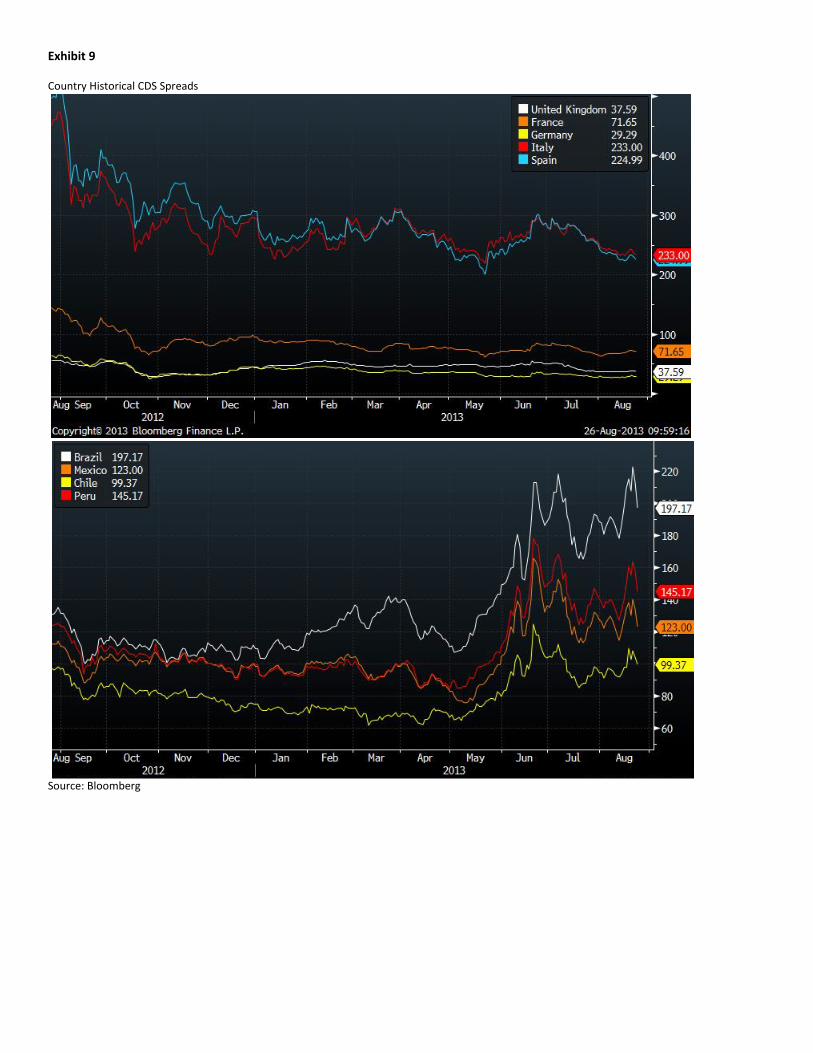
Exhibit 9 Country Historical CDS Spreads
Source: Bloomberg

Exhibit 10
BBVA Continental vs. Local Competition –Spread over Treasuries
Source: Bloomberg BBVA Continental vs. Local Competition – Profitability
Source: Bloomberg

BBVA Continental vs. Local Competition – Capital
BBVA Continental vs Local Competition – Credit Quality
Source: Bloomberg

BBVA Continental vs Local Competition – Liquidity
Source: Bloomberg
Exhibit 11 BBVA Continental vs Chilean & Brazilian Select Issuers
Source: Bloomberg
BBVA Continental vs Chilean & Brazilian Select Issuers - Profitability
Source: Bloomberg BBVA Continental vs Chilean & Brazilian Select Issuers – Capital
Source: Bloomberg
BBVA Continental vs Chilean & Brazilian Select Issuers – Credit Quality and Liquidity
Source: Bloomberg