sample costs to produce organic strawberries
TRANSCRIPT

UNIVERSITY OF CALIFORNIA COOPERATIVE EXTENSION
2014
SAMPLE COSTS TO PRODUCE ORGANIC STRAWBERRIES
FRESH MARKET
CENTRAL COAST Santa Cruz Monterey and San Benito Counties
Mark Bolda Farm Advisor UC Cooperative Extension Santa Cruz County Laura Tourte Farm Advisor UC Cooperative Extension Santa Cruz County Karen M Klonsky Cooperative Extension Specialist Department of Agricultural and Resource
Economics University of California Davis Richard L De Moura Research Associate Department of Agricultural and Resource Economics
University of California Davis Kabir P Tumber Research Associate Department of Agricultural and Resource Economics
University of California Davis
UNIVERSITY OF CALIFORNIA COOPERATIVE EXTENSION CENTRAL COAST - Santa Cruz Monterey and San Benito Counties 2014
SAMPLE COSTS TO PRODUCE ORGANIC STRAWBERRIES
CONTENTS
INTRODUCTION 2 ASSUMPTIONS 3 Production Cultural Practices and Material Inputs 3 Labor Interest Equipment 6 Cash Overhead 7 Non-Cash Overhead8
REFERENCES 10 Table 1 Cost Per Acre to Produce Organic Strawberries 11 Table 2 Costs and Returns per Acre to Produce Organic Strawberries 13 Table 3 Monthly Cash Costs Per Acre to Produce Organic Strawberries 15 Table 4 Ranging Analysis 17 Table 5 Whole Farm Annual Equipment Investment and Business Overhead Costs 18 Table 6 Hourly Equipment Costs 19 Table 7 Operations with Equipment amp Materials 20
Acknowledgements Thank you to the participating growers industry representatives and businesses associated with the strawberry industry for their cooperation and contributions to this study
INTRODUCTION
Organic production as defined by the USDArsquos Organic Food Production Act of 1990 as amended (USC 6501 et seq) is a ldquoproduction system that is managed in accordance with the Act and associated regulations to respond to site-specific conditions by integrating cultural biological and mechanical practices that foster cycling of resources promote ecological balance and conserve biodiversityrdquo
Sample costs to produce organic strawberries in the Central Coast Region - Santa Cruz Monterey and San Benito Counties - are presented in this study The study is intended as a guide only and can be used to make production decisions determine potential returns prepare budgets and evaluate production loans The practices described are based on production procedures considered typical for this crop and area and will not apply to every farm Sample costs for labor materials equipment and custom services are based on current figures A blank column titled Your Cost is provided to enter your actual costs on Tables 1 and 2
The hypothetical farm operation production practices overhead and calculations are described under assumptions For additional information or explanation of calculations used in the study call the Department of Agricultural and Resource Economics University of California Davis (530) 752-5489 UC Cooperative Extension Santa Cruz County Mark Bolda (831) 763-8025 and Laura Tourte (831) 763-8005 or the UC Cooperative Extension office in your county
Current and archived ldquoSample Cost of Production Studiesrdquo for many commodities can be downloaded at httpcoststudiesucdavisedu requested through the Department of Agricultural and Resource Economics UC Davis at (530) 752-1515 or obtained from selected county UC Cooperative Extension offices
The University of California is an affirmative actionequal opportunity employer
2014 Strawberries Organic Costs and Returns Study Central Coast UC Cooperative Extension 2
ASSUMPTIONS
The following assumptions refer to Tables 1 to 7 and pertain to sample costs to produce organic strawberries in the Central Coast Region - Santa Cruz Monterey and San Benito Counties The cultural practices described and materials used are considered typical for organic strawberry production in the region The costs practices and materials will not be applicable to all situations in every production year Cultural practices materials and organic strawberry production costs vary by grower and region and differences can be significant The practices and inputs used in the cost study serve as a guide only Organic growers should be certain that any material inputs and applications meet the regulatory requirements of state and national programs and their certifying agent(s) The use of trade names and cultural practices in this report does not constitute an endorsement or recommendation by the University of California nor is any criticism implied by omission of other similar products or cultural practices
Conventional strawberries represent approximately 85 percent of total strawberry acreage along the Central Coast according to 2014 California Strawberry Commission data Many of the practices that are used in organic production are also used in conventional production Differences between the two production systems are found primarily though not exclusively in crop fertilization and pest management
Farm This study assumes a farm operation size of 30 contiguous acres of rented land Organic strawberries are planted on 27 acres roads the irrigation system and on-farm buildings account for the remaining three acres In this area arrangements are often made with other farmers and owners of organically certified land to rotate strawberries with vegetable and other berry crops In some cases organic strawberries may be planted on the same land for more than one year The grower rents the land which includes a small shop for $2700 per acre per year and owns the machinery and equipment used Farming on sloped or hilly land may result in varying costs for land rent and cultural practices
Production Cultural Practices and Material Inputs
To gain certified organic status growers must farm on land to which no synthetically formulated fertilizers andor pesticides have been applied for a minimum of three years Organic farmers generally use a ldquosystems managementrdquo approach to farming by including a suite of production practices such as crop rotation diversification cover crops and organic matter additions to help build soil fertility and manage pests Organic strawberries are rotated with other crops to assist with disease and weed control and for long-term improvements to soil fertility
Land Preparation Pre-Plant Fertilization and Irrigation Two soil samples for the planted 27 acres are taken for analysis in the fall before land preparation to help determine fertilization practices This study assumes that in September a previously planted cover or cash crop is disced twice to incorporate plant residue Compost at five tons per acre is purchased and spread by a custom operator immediately after incorporating the cover crop Fields are sprinkler irrigated with one acre-inch of water once during this time to assist with weed management and soil preparation The field is then subsoiled five times leveled disked four times and chiseled twice In October blood meal as a fertilizer and gypsum as a soil amendment are spread by a custom operator and incorporated into the soil at the rate of 500 pounds and 2 tons per acre respectively In mid-to-late October 48-inch wide beds are listed shaped sprinkler irrigated with 05 acre inches of water and then re-listed and re-shaped Drip irrigation tape at two lines per bed is installed immediately after and the beds are covered with black plastic mulch using a mulch laying implement
2014 Strawberries Organic Costs and Returns Study Central Coast UC Cooperative Extension 3
Plant Establishment Prior to planting a slotting implement is used to open the plastic mulch at appropriate intervals to prepare for transplanting Strawberry plants are delivered to the field edge and then transplanted into two rows 12 inches apart for a per acre plant density of 21780 Planting takes approximated 50 hours per acre Several strawberry varieties such as Seascape Albion Chandler Sweet Anne and a number of proprietary varieties are suitable for organic production in the region but no specific variety is assumed in this study Fields are irrigated with roughly one acre-inch of water immediately after planting Typically five percent of the field or 1089 plants per acre is replanted in the weeks and months that follow because of poor planting and field conditions
Post-Plant Fertilization From February to September (eight months) the grower applies a series of foliar sprays including Biomin Calcium (2-0-0-7 a calcium supplement) and Maxi Crop Seaweed Extract once per month at a rate of one gallon per acre and 25 pounds per acre per application respectively These materials are used to ensure that a balance of nitrogen phosphorus and potassium (NPK) and micronutrients are supplied to the plants
From March to September liquid fertilizers are applied to the soil through the drip irrigation system Agrothrive LF a fish emulsion is the applied twice per month at the rate of five gallons each per acre per application for a total of fourteen applications Fertilization materials and rates will vary by grower and year depending soil tests and plant needs
Post-Plant Irrigation From March through September (seven months) strawberries are drip irrigated two to three times per week using a total of 24 acre-inches of water over the entire growing season Including the 25 acre inches applied by sprinkler irrigation earlier in the season a total of 265 acre inches is applied to the field The cost of pumping water is estimated at $270 per acre-foot or $2250 per acre-inch Effective rainfall is not taken into account The amount and cost of water can differ substantially from farm to farm in the area depending on factors such as climatic conditions soil type well depth and irrigation district cost
Pest Management The pesticides and rates mentioned in this cost study are listed in the UC Integrated Pest Management Guidelines Strawberries For more information on pesticides pest identification monitoring and management visit the UC IPM website at httpipmucdavisedu or contact your local UCCE farm advisor Pesticide use permits and regulatory information are available through the local county agricultural commissionerrsquos office Pesticides mentioned in this study are used to calculate rates and costs applications timing and materials vary according to pest pressure The pesticide program in this report is considered typical but organic practices vary considerably within the region the effectiveness of practices depends upon field and environmental conditions
Pest Control Adviser (PCA) To assist with pest management decisions in this study the grower contracts with a PCA at an estimated cost of $125 per acre per year Pest Control Advisers write pest management recommendations and monitor the fields for production nutrition and pest problems
Weeds Weed management is especially challenging for organic strawberry production because soil fumigation and synthetic herbicides are not allowed under organic regulations For 10 months beginning in December and ending in September weeds in and around plants are managed by hand Although weeding times vary by grower and month the study assumes an average of 20 hours of hand weeding per acre per month Weeds in furrows between beds are controlled using mechanical cultivations
Vertebrates Rodents such as pocket gophers (Thomomys spp) cause damage in strawberry fields by feeding on the plant roots digging tunnels into the beds and also gnawing holes in the drip irrigation tape They may be
2014 Strawberries Organic Costs and Returns Study Central Coast UC Cooperative Extension 4
controlled in organic strawberry fields by trapping and other means throughout the growing season Labor cost is estimated at two hours per acre for the season
Insects and mites Pests common to strawberries in this area include lygus bug (Lygus hesperus) light brown apple moth (LBAM [Epiphyas postvittana]) two-spotted spider mite (Tetranychus urticae) greenhouse whitefly (Trialeurodes vaporariorum) Western flower thrips (Frankliniella occidentalis) vinegar flies (generic) and certain species of aphids and other Lepidoptera (worms)
Lygus bug is considered to be one of the most challenging pests to manage in strawberry production including organic production To assist with management growers use a bug vacuum twice per week beginning in April and ending in October (or end of the season)
To assist with the control of two-spotted spider mite a predatory mite (Phytoseiulis persimilis) is released four times during the season twice in February and twice in March for a total of 80000 mites per acre per year Application time is estimated at one hour per acre per release Lepidopterous pests (worms) are managed using four applications of Dipel (Bacillus thuringiensis [Bt]) applied at a rate of one pound per acre per application in May and June LBAM is managed using three applications of Entrust one each in May June and September at the rate of 25 ounces per acre The Entrust applications also assist with management of vinegar flies as does the culling of fruit mentioned below
Diseases Powdery mildew (Sphaerotheca macularis fsp fragariae) and Botrytis fruit rot (Botrytis cinerea) are the two diseases most common to strawberries in this area Micronized sulfur (Kumulus) is applied for powdery mildew control at the rate of five pounds per acre per application every three weeks beginning in late March and ending in early October totaling nine applications per year Because no organically acceptable fungicide has proven consistently effective for Botrytis fruit rot the associated disease pressure is minimized by culling diseased fruit by hand during harvest It is assumed to be included in harvest costs
Harvest The crop is harvested twice per week from April Table A Percent Crop Harvested by Month through early October with peak harvest in June July and April May June July Aug Sept Oct August The percent of the total crop harvested each month is Harvest 5 12 25 25 18 12 3 shown in Table A Crew size will vary according to the amount of fruit ready for harvest In this study it is assumed that the grower will use a 30 person crew early in the season with two 30 person crews during peak harvest labor availability may dictate exact crew size and number throughout the season The grower hires a ranch supervisor (shown under Cash Overhead) to manage the harvest and other operations Fruit is harvested into a tray on a picking cart that contains eight one-pound-sized clamshells At the same time that strawberries are harvested Botrytis infected bronzed overripe and misshapen fruit is culled and discarded in the furrows Other container types and sizes are used but are not included in this study Harvest rates per picker range from 3 trays per hour early and late in the season and 5 to 8 trays per hour during the peak harvest Additional field labor includes one field person to check for proper picking and one card puncher per crew (the foreman may perform this work) to count the trays harvested by each picker To load and haul the fruit one truck loader stacks the trays on a flat bed truck and the driver delivers the strawberries to the cooler The grower uses two one-ton flatbed trucks that each alternately holds two pallets at 120 trays per pallet for prompt delivery to the cooler Trays per pallet will vary by container types The truck driver takes about one hour per load to deliver the filled trays to the cooler and return to the farm Labor costs vary by grower and with crop yield In this study the picker is paid an hourly wage early and late in the season During the peak harvest the picker is paid a piecework hourly wage plus an amount per tray (see Labor section) For ease in calculating hourly wages are paid to an average crew size of 15 crews (45 people)
2014 Strawberries Organic Costs and Returns Study Central Coast UC Cooperative Extension 5
Yields Yields for organic strawberries vary depending on season and growing conditions In this area yields typically range from 3500 to 5000 eight-pound trays per acre however some varieties may produce higher yields This study uses an average yield of 4250 trays per acre
Returns For this study the unit price to growers for organic fruit is $15 per tray This price falls within the $8 to $26 per tray range of the Salinas-Watsonville 2014 shipping point averages of the USDA Agricultural Marketing Service reports Fresh market fruit harvested early and late in the season is generally sold at prices higher than fruit harvested mid-season Estimated returns for a range of prices and yields are shown on Table 4
California Strawberry Commission (CSC) Assessments The CSC charges an assessment of $004 per tray to the grower to support the commissionrsquos goals focusing on production and nutrition research trade relations public relations and public policy
SalesMarketing Selling costs for fresh market 6 to 12 pound trays are calculated as 8 of selling price or $120 ($15 x 8) per tray The selling cost is deducted from the grower returns and the grower receives the net proceeds ($1380)
Cooling Costs Cooling costs vary by cooler and grower volume Growers are responsible for these costs which may be negotiable with a cooler The estimated cost used in this study is $070 per tray
Post-Harvest Cleanup After all harvest operations have been completed the plants are mowed The plastic mulch and drip tape are removed from the field by the grower and hauled to a disposal site The field is then disked twice in preparation for the next crop
Labor Equipment and Interest
Labor Labor rates of $1910 per hour for machine operators and $1237 for general labor includes payroll overhead of 33 The basic hourly wages are $1435 for machine operators and $930 for general labor Typically the pickers are paid an hourly labor rate early and late in the season During the peak harvest period pickers are usually paid an hourly base pay plus piecework The piece rate during the peak season (June July and August) in this study is calculated at $525 per hour plus $110 per tray Adding 33 for overhead the piece rate is $698 per hour and $146 per tray Labor rates at harvest will vary from grower to grower in the region depending on variety planted production conditions and fruit load The overhead includes the employersrsquo share of federal and California state payroll taxes workers compensation insurance for strawberry crops (code 0079) and a percentage for other possible benefits Workersrsquo compensation costs will vary among growers but for this study the cost is based upon the average industry final rate as of March 2014 (California Department of Insurance) Labor for operations involving machinery are 20 higher than the operation time given in Table 1 to account for the extra labor involved in equipment set up moving maintenance work breaks and field repair
Equipment Operating Costs Repair costs are based on purchase price annual hours of use total hours of life and repair coefficients formulated by American Society of Agricultural and Biological Engineers (ASABE) Fuel and lubrication costs are also determined by ASABE equations based on maximum power takeoff (PTO) horsepower and fuel type Prices for on-farm delivery of diesel and gasoline are $356 and $393 per gallon respectively The cost includes the local sales tax on diesel fuel and gasoline Gasoline also includes federal and state excise tax which are refundable for on-farm use when filing income taxes The fuel lube and repair cost per acre for each operation in Table 1 is determined by multiplying the total hourly operating cost in Table
2014 Strawberries Organic Costs and Returns Study Central Coast UC Cooperative Extension 6
6 for each piece of equipment used for the selected operation by the hours per acre Tractor time is 10 higher than implement time for a given operation to account for setup travel and down time
Interest on Operating Capital Interest on operating capital is based on cash operating costs and is calculated monthly until harvest at a nominal rate of 575 per year A nominal interest rate is the typical market cost of borrowed funds The interest cost of post-harvest operations is discounted back to the last harvest month using a negative interest charge The rate will vary depending upon various factors but the rate in this study is considered a typical lending rate by a farm lending agency as of January 2014
Risk The risks associated with producing and marketing organic strawberries are high While this study makes every effort to model a production system based on typical real world practices it cannot fully represent financial production market legal and human resource risks that ultimately affect the profitability and economic viability of organic strawberries In this area invasive pests pose particular high regulatory and management challenges and increase production and marketing risks for growers In addition labor availability scheduling and cost is a noteworthy human resource risk In recent years labor constraints have meant challenges in securing and retaining a sufficient number of workers to ensure timely and effective farm operations Some growers report paying higher wages to attract and retain workers others may pay overtime because of labor constraints Overall profitability of the crop is negatively impacted in either case
Cash Overhead
Cash overhead consists of various cash expenses paid out during the year that are assigned to the whole farm and not to a particular operation These costs include property taxes interest on investments office expenses liability and property insurance sanitation services and equipment repairs Employee benefits insurance and payroll taxes are included in labor costs and not in overhead costs (see Labor)
Property Taxes Counties charge a base property tax rate of 1 on the assessed value of the property In some counties special assessment districts exist and charge additional taxes on property including equipment buildings and improvements For this study county taxes are calculated as 1 of the average value of the property Average value equals new cost plus salvage value divided by two on a per acre basis
Insurance Insurance for farm investments varies depending on the assets included and the amount of coverage Property insurance provides coverage for property loss and is charged at 0829 of the average value of the assets over their useful life Liability insurance covers accidents on the farm and costs $627 for the entire farm
Office Expenses Office and business expenses are estimated at $750 per acre These expenses include office supplies telephones bookkeeping accounting legal fees road maintenance utilities and miscellaneous expenses
Organic Certification and Registration Fees Organic strawberry certification and registration fees are estimated at $176 per acre This includes fees associated with field inspection certification and inspection by a USDA accredited certification agent and the California Department of Food and Agricultures Organic Program registration fee Depending on income and variability in inspection time fees will vary from year to year
Food Safety Program Growers of fresh market commodities such as strawberries incorporate and participate in food safety programs for their operations Part of a food safety program is participation in third party (independent) audits that are done to ensure the safety of fresh products accommodate buyer requests and to
2014 Strawberries Organic Costs and Returns Study Central Coast UC Cooperative Extension 7
enhance marketability of the crop Costs will vary depending upon farm or inspection circumstances For this study costs for the farm are estimated at approximately $30 per acre for a total of $810 per year
Regulatory Programs Costs associated with regulatory programs such as water and air quality are estimated at $50 per acre per year for monitoring and reporting
Sanitation Services Sanitation services provide two sets of triple-portable toilets with hand washing equipment and cost the farm $6340 annually Sanitation facilities required vary by state regulations and crew size
Land Rent The grower pays $2700 per acre per year for the 30-acres land rent for the 27 producing acres is therefore estimated at $3000 per acre per year The land includes a small shop and storage area
Farm Supervisor The grower hires a farm supervisor to oversee some of the cultural and harvest operations as well as fill in on some of the operations where temporary assistance is needed The estimated cost for the supervisor is $1000 per acre
Non-Cash Overhead
Non-cash overhead costs shown on an annual per acre basis are calculated as the capital recovery cost for equipment and other farm investments
Capital Recovery Costs Capital recovery cost is the annual depreciation and interest costs for a capital investment It is the amount of money required each year to recover the difference between the purchase price and salvage value (unrecovered capital) It is equivalent to the annual payment on a loan for the investment with the down payment equal to the discounted salvage value This is a more complex method of calculating ownership costs than straight-line depreciation and opportunity costs but more accurately represents the annual costs of ownership because it takes the time value of money into account (Boehlje and Eidman) The formula for the calculation of the annual capital recovery costs is ((Purchase Price ndash Salvage Value) x (Capital Recovery Factor)) + (Salvage Value x Interest Rate)
Salvage Value Salvage value is an estimate of the remaining value of an investment at the end of its useful life For farm machinery (tractors and implements) the remaining value is a percentage of the new cost of the investment (Boehlje and Eidman) The percent remaining value is calculated from equations developed by the American Society of Agricultural and Biological Engineers (ASABE) based on equipment type and years of life The life in years is estimated by dividing the wear out life as given by ASABE by the annual hours of use in this operation For other investments including irrigation systems buildings and miscellaneous equipment the value at the end of its useful life is zero The salvage value for land is the purchase price because land does not depreciate The purchase price and salvage value for equipment and investments are shown in Table 5
Capital Recovery Factor Capital recovery factor is the amortization factor or annual payment whose present value at compound interest is 1 The amortization factor is a table value that corresponds to the interest rate used and the life of the machine
Interest Rate The interest rate of 475 is used to calculate capital recovery The rate will vary depending upon size of loan and other lending agency conditions but is a suggested rate by a farm lending agency in January 2014
Buildings The grower maintains a 1200 square foot metal building on a cement slab
2014 Strawberries Organic Costs and Returns Study Central Coast UC Cooperative Extension 8
Fuel Tanks Two 300-gallon fuel tanks set in containment are installed for equipment fuel
ShopHand Tools Shop hand and various small field tools are included in these costs Tools vary considerably from farm to farm and cost does not represent any specific inventory
Irrigation System The irrigation systems include the filtration system and laterals that connect to drip lines Water is pumped through the filtration system into the main lines Reusable telescoping lateral lines are buried each year at the edge of the strawberry field and are connected to the main and drip lines The drip lines are included in irrigation system costs The grower owns enough sprinkler pipes to cover 27 acres per setting
Irrigation Pump amp Well This study assumes that the grower refurbished a 75 HP electric pump and well that services the farm In general growers in the region are responsible for the portion above ground such as the pump and the landowner is responsible for what is below ground such as the well running dry
Equipment Farm equipment is purchased new or used but the study shows the current purchase price for new equipment The new purchase price is adjusted to 60 to indicate a mix of new and used equipment Annual ownership costs for equipment and other investments are shown in Table 5 Equipment costs are composed of three parts non-cash overhead cash overhead and operating costs Both of the overhead factors have been discussed in previous sections The operating costs consist of repairs fuel and lubrication and are discussed under operating costs
Table Values Due to rounding the totals may be slightly different from the sum of the components
2014 Strawberries Organic Costs and Returns Study Central Coast UC Cooperative Extension 9
REFERENCES
American Society of Agricultural and Biological Engineers (ASABE) March 2011 American Society of Agricultural Engineers Standards Agricultural Machinery Management Data ASAE D4977 St Joseph Michigan httpelibraryasabeorg Internet accessed February 2013
Boehlje Michael D and Vernon R Eidman 1984 Farm management John Wiley amp Sons New York NY
Bolda Mark P Laura Tourte Karen M Klonsky Richard L De Moura 2006 Sample Costs to Produce Organic Strawberries Central Coast University of California Cooperative Extension Davis CA
Bolda Mark Laura Tourte Karen M Klonsky Richard L De Moura 2010 Sample Costs to Produce Strawberries Central Coast University of California Cooperative Extension Davis CA
Bolda Mark Laura Tourte Karen M Klonsky Richard L De Moura 2011 Sample Costs to Produce Second Year Strawberries Central Coast University of California Cooperative Extension Davis CA
California Department of Insurance 2014 California Workersrsquo Compensation Rating Data for Selected Agricultural Classifications as of March 2014 California Department of Insurance Rate Regulation Branch
California State Board of Equalization Fuel Tax Division Tax Rates Internet accessed January 2014 httpwwwboecagovsptaxprogspftdrateshtm
California Strawberry Commission 2014 Acreage Survey - Update Internet accessed January 2015 httpwwwcalstrawberrycomfileDatadocs2014AcreageSurvey_Updatepdf
Energy Information Administration 2014 Gasoline and Diesel Fuel Update Internet accessed January 2014 httptontoeiadoegovooginfogdugasdieselasp
Santa Cruz County Agricultural Commissioner 2013 Santa Cruz County 2012 Crop Report Fruit Crops Santa Cruz County Watsonville CA httpagdeptcomUniversity of California Statewide IPM Project 2013 UC Pest Management Guidelines Strawberries University of California Davis CA httpwwwipmucdavisedu
United States Department of Agriculture Agricultural Marketing Service httpwwwamsusdagov
2014 Strawberries Organic Costs and Returns Study Central Coast UC Cooperative Extension 10
UC COOPERATIVE EXTENSION CENTRAL COAST - 2014
Table 1 COSTS PER ACRE TO PRODUCE ORGANIC STRAWBERRIES
Equipment Operation Cash and Labor Costs per Acre
Time Labor Fuel Lube amp Material Custom Total Your Operation (HrsA) Cost Repairs Cost Rent Cost Cost
Cultural Soil Samples (2 per 27 Acre Farm) 000 0 0 0 0 6 6 Disk 2X (Cover Crop) 050 11 9 3 0 0 23 Compost + Spread 000 0 0 0 275 12 287 Sprinklers Setup and Removal 300 106 32 10 0 0 147 Irrigate Sprinkler 000 46 0 0 56 0 103 Subsoil 5X 180 41 31 13 0 0 85 Level (Triplane) 100 23 17 7 0 0 47 Disk 4X 100 23 17 6 0 0 47 Chisel 2X 054 12 8 3 0 0 24 Blood Meal + Gypsum Spread 000 0 0 0 880 12 892 Beds ListShape 100 23 17 5 0 0 45 Beds Re-ListRe-Shape (Post irrigation) 100 23 17 5 0 0 45 Install Drip System Tape amp Laterals 300 82 32 12 240 0 365 Plant Lay Mulch 150 34 16 5 363 0 419 Plant Punch Planting Holes 075 17 8 3 0 0 28 Plant Strawberries (Includes 5 Replant) 000 649 0 0 2744 0 3394 Weed Hand 000 2474 0 0 0 0 2474 Insect Mites (Predatory) 000 49 0 0 880 0 929 Weed Cultivate 075 17 11 4 0 0 32 Fertilize Foliar (Biomin) 078 18 11 4 144 0 177 Fertilize Foliar (Maxi Crop) 078 18 11 4 226 0 260 Vertebrate Trapping 000 25 0 0 0 0 25 Pest Control Adviser (PCA) 000 0 0 0 0 125 125 Irrigate Drip 000 148 0 0 540 0 688 Fertilize Soil (Agrothrive) 000 37 0 0 250 0 287 Insect Vacuum Lygus 8Xmonth 2373 544 251 307 0 0 1101 Disease Powdery Mildew (Kumulus) 098 22 14 5 75 0 117 Insect LBAM (Entrust) 029 7 4 2 332 0 344 Worms (Dipel) 020 4 3 1 74 0 82 Post Harvest Cleanup 300 372 20 14 18 0 423 Pickup Business Use 171 39 17 6 0 0 62 ATV 059 14 2 1 0 0 16
TOTAL Cultural COSTS 4789 4881 548 419 7097 155 13099 Harvest Harvest Regular and Peak Production 000 11732 0 0 6885 0 18617 Harvest Load amp Haul 5000 1351 246 214 0 0 1812 Harvest Cooler 000 0 0 0 0 2975 2975 CSC Assessment 000 0 0 0 170 0 170 SalesMarketing 000 0 0 0 5100 0 5100
TOTAL Harvest COSTS 5000 13083 246 214 12155 2975 28673
Interest on Operating Capital 575 710 TOTAL OPERATING COSTSACRE 9789 17964 793 634 19252 3130 42482
2014 Strawberries Organic Costs and Returns Study Central Coast UC Cooperative Extension 11
UC COOPERATIVE EXTENSION
CENTRAL COAST - 2014
Table 1 CONTINUED
Equipment Operation Cash and Labor Costs per Acre
Time Labor Fuel Lube amp Material Custom Total Your
Operation (HrsA) Cost Repairs Cost Rent Cost Cost
CASH OVERHEAD
Office Expense 833
Food Safety 30
Land Rent 2700
Liability Insurance 21
Sanitation Fee 235
Regulatory Programs 50
Organic CertificationRegistration 176
Ranch Supervisor 1000
Property Taxes 60
Property Insurance 50
Investment Repairs 102
TOTAL CASH OVERHEAD COSTSACRE 5257
TOTAL CASH COSTSACRE 47739
NON-CASH OVERHEAD Per producing Annual Cost
Acre Capital Recovery
Buildings 1200 sqft 1556 98 98
Fuel Tanks 2-300 gal 130 9 9
Harvest Carts (70) 52 12 12
75HP Pump 556 44 44
Sprinkler Pipe 2222 210 210
Lateral Lines 444 102 102
Shop Tools 556 50 50
Equipment 5236 779 779
TOTAL NON-CASH OVERHEAD COSTS 10751 1305 1305
TOTAL COSTSACRE 49044
Note Growing CostsAcre = Total Cash CostsAcre ndash Harvest CostsAcre ($47739 - $28673 = $19066)
2014 Strawberries Organic Costs and Returns Study Central Coast UC Cooperative Extension 12
UC COOPERATIVE EXTENSION CENTRAL COAST - 2014
Table 2 COSTS AND RETURNS PER ACRE TO PRODUCE ORGANIC STRAWBERRIES
Quantity Price or Value or Your Acre Unit CostUnit CostAcre Cost
GROSS RETURNS Organic 425000 tray 1500 63750
TOTAL GROSS RETURNS 425000 tray 63750 OPERATING COSTS Insecticide 1285 Persimilis (Predatory Mites) 8000 thou 1100 880 Entrust 750 oz 4421 332 Dipel DF (Bt) 400 lb 1838 74
Fungicide 75 Kumulus DF 4500 lb 167 75
Fertilizer 1775 Compost 500 ton 5500 275 Blood Meal 50000 lb 160 800 Gypsum 200 ton 4000 80 Biomin Calcium 800 gal 1802 144 Maxi-Crop 2000 lb 1132 226 Agrothrive LF 7000 gal 357 250
Custom 6 Soil Analysis (2 per 27 acres) 004 farm 15000 6
Materials 7506 T-Tape 2178000 feet 001 240 Black Plastic Mulch 275 rolls 13200 363 8 Clamshell +Tray 425000 each 162 6885 Disposal Site Fees 60000 lb 003 18
Water 596 Water - Pumped 2650 acin 2250 596
Plants 2744 Strawberry Plants 2286900 each 012 2744
Contract 3124 Spread CompostBlood Meal 200 acre 1200 24 Pest Control Adviser (PCA) 100 acre 12500 125 Cooler 425000 tray 070 2975
AssessmentsSales Commission 5270 CSC Assessment 425000 tray 004 170 Sales Commission 8 425000 tray 120 5100
Labor 17964 Equipment Operator Labor 11746 hrs 1910 2244 Non-Machine Labor 31999 hrs 1237 3958 Irrigation Labor 245 hrs 1237 30 Harvest Labor (Regular amp Peak) 94841 hrs 1237 11732
Machinery 1427 Fuel-Gas 7014 gal 393 276 Fuel-Diesel 14540 gal 356 518 Lube 119 Machinery Repair 515
Interest on Operating Capital (575) 710 TOTAL OPERATING COSTSACRE 42482 NET RETURNS ABOVE OPERATING COSTS 21268
Peak Harvest Labor HoursAcre are the equivalent of hourly wage plus piece rate
2014 Strawberries Organic Costs and Returns Study Central Coast UC Cooperative Extension 13
13
UC COOPERATIVE EXTENSION
CENTRAL COAST - 2014
Table 2 CONTINUED
Quantity Price or Value or Your
Acre Unit CostUnit CostAcre Cost
CASH OVERHEAD COSTS
Office Expense 833
Food Safety 30
Land Rent 2700
Liability Insurance 21
Sanitation Fee 235
Regulatory Programs 50
Organic CertificationRegistration 176
Ranch Supervisor 1000
Property Taxes 60
Property Insurance 50
Investment Repairs 102
TOTAL CASH OVERHEAD COSTSACRE 5257
TOTAL CASH COSTSACRE 47739
NET RETURNS ABOVE CASH COSTS 16011
NON-CASH OVERHEAD COSTS (Capital Recovery)
Buildings 1200 sqft 98
Fuel Tanks 2-300 gal 9
Harvest Carts 12
75HP Pump 44
Sprinkler Pipe 210
Lateral Lines 102
Shop Tools 50
Equipment 779
TOTAL NON-CASH OVERHEAD COSTSACRE 1305
TOTAL COSTACRE 49044
TOTAL COST TRAY 1154
NET RETURNS ABOVE TOTAL COST 14706
2014 Strawberries Organic Costs and Returns Study Central Coast UC Cooperative Extension 14
UC COOPERATIVE EXTENSION CENTRAL COAST - 2014
Table 3 MONTHLY CASH COSTS PER ACRE TO PRODUCE ORGANIC STRAWBERRIES
Beginning 09-13 Ending 10-14
SEP 13
OCT 13
NOV 13
DEC 13
JAN 14
FEB 14
MAR 14
APR 14
MAY 14
JUN 14
JUL 14
AUG 14
SEP 14
OCT 14
TOTAL
Cultural Soil Samples (2 per 27 Acre Farm) Disk 2X (Cover Crop) Compost + Spread Sprinklers Setup and Removal Irrigate Sprinkler Subsoil 5X
6 23
287 74 39 85
74 64
6 23
287 147 103
85 Level (Triplane) Disk 4X
47 47
47 47
Chisel 2X 24 24 Blood Meal + Gypsum Spread Beds ListShape Beds Re-ListRe-Shape (Post irrigation) Install Drip System Tape amp Laterals Plant Lay Mulch Plant Punch Planting Holes Plant Strawberries (Includes 5 Replant) Weed Hand Insect Mites (Predatory) Weed Cultivate
892 45 45
365 419
28 3394
247 247 247 465
11
247 465
11
247
11
247 247 247 247 247
892 45 45
365 419
28 3394 2474
929 32
Fertilize Foliar (Biomin) Fertilize Foliar (Maxi Crop) Vertebrate Trapping Pest Control Adviser (PCA) Irrigate Drip Fertilize Soil (Agrothrive) Insect Vacuum Lygus 8Xmonth Disease Powdery Mildew (Kumulus) Insect LBAM (Entrust) Worms (Dipel) Post Harvest Cleanup Pickup Business Use ATV
125
22 32
5
22 32
5
98 41
17
22 32
5
98 41
157 17
22 32
5
98 41
157 13
115 41
22 32
5
98 41
157 21
115 41
22 32
98 41
157 13
22 32
98 41
157 13
22 32
98 41
157 13
115
157 13
423 62 16
177 260
25 125 688 287
1101 117 344
82 423
62 16
TOTAL Cultural COSTS 631 5450 247 247 782 938 631 772 780 611 611 726 671 13099
2014 Strawberries Organic Costs and Returns Study Central Coast UC Cooperative Extension 15
UC COOPERATIVE EXTENSION
CENTRAL COAST - 2014
Table 3 CONTINUED
Beginning 09-13 SEP OCT NOV DEC JAN FEB MAR APR MAY JUN JUL AUG SEP OCT TOTAL
Ending 10-14 13 13 13 13 14 14 14 14 14 14 14 14 14 14
Harvest
Harvest Regular and Peak Production 1279 2283 4414 4414 3178 2283 767 18617
Harvest Load amp Haul 105 211 455 455 327 210 48 1812
Harvest Cooler 149 357 744 744 536 357 89 2975
CSC Assessment 9 20 43 43 31 20 5 170
SalesMarketing 255 612 1275 1275 918 612 153 5100
TOTAL Harvest COSTS 0 0 0 0 0 0 1796 3483 6930 6930 4989 3482 1062 28673
Interest on Operating Capital (575) 3 29 29 30 32 35 40 51 72 109 145 172 -28 -8 710
TOTAL OPERATING COSTSACRE 634 5479 29 278 279 818 978 2479 4327 7819 7686 5772 4179 1725 42482
CASH OVERHEAD
Office Expense 60 60 60 60 60 60 60 60 60 60 60 60 60 60 833
Food Safety 30 30
Land Rent 2700 2700
Liability Insurance 21 21
Sanitation Fee 235 235
Regulatory Programs 50 50
Organic CertificationRegistration 176 176
Ranch Supervisor 71 71 71 71 71 71 71 71 71 71 71 71 71 71 1000
Property Taxes 30 30 60
Property Insurance 25 25 50
Investment Repairs 7 7 7 7 7 7 7 7 7 7 7 7 7 7 102
TOTAL CASH OVERHEAD COSTS 138 138 138 168 3119 188 138 198 138 163 138 138 138 314 5257
TOTAL CASH COSTSACRE 772 5618 167 446 3398 1006 1116 2677 4465 7982 7824 5911 4318 2039 47739
2014 Strawberries Organic Costs and Returns Study Central Coast UC Cooperative Extension 16
UC COOPERATIVE EXTENSION CENTRAL COAST - 2014
Table 4 RANGING ANALYSIS
COST PER ACRE AT VARYING YIELDS TO PRODUCE ORGANIC STRAWBERRIES
YIELD (traysacre) 3500 3750 4000 4250 4500 4750 5000
OPERATING COSTS Cultural 13099 13099 13099 13099 13099 13099 13099 Harvest 24863 26133 27403 28673 29944 31214 32484
Interest on operating capital 575 674 686 698 710 722 734 746 TOTAL OPERATING COSTSACRE 38636 39918 41200 42482 43764 45047 46329
Total Operating Coststray 1104 1064 1030 1000 973 948 927 CASH OVERHEAD COSTSACRE 5257 5257 5257 5257 5257 5257 5257 TOTAL CASH COSTSACRE 43892 45174 46457 47739 49021 50303 51585 Total Cash Coststray 1254 1205 1161 1123 1089 1059 1032 NON-CASH OVERHEAD COSTSACRE 1305 1305 1305 1305 1305 1305 1305 TOTAL COSTSACRE 45197 46479 47762 49044 50326 51608 52890 Total Coststray 1291 1239 1194 1154 1118 1086 1058
NET RETURNS PER ACRE ABOVE OPERATING COSTS
YIELD (trayacre) PRICE($tray) 3500 3750 4000 4250 4500 4750 5000
1050 -1886 -543 800 2143 3486 4828 6171 1200 3364 5082 6800 8518 10236 11953 13671 1350 8614 10707 12800 14893 16986 19078 21171 1500 13864 16332 18800 21268 23736 26203 28671 1650 19114 21957 24800 27643 30486 33328 36171 1800 24364 27582 30800 34018 37236 40453 43671 1950 29614 33207 36800 40393 43986 47578 51171
NET RETURNS PER ACRE ABOVE CASH COSTS
YIELD (trayacre) PRICE($tray) 3500 3750 4000 4250 4500 4750 5000
1050 -7142 -5799 -4457 -3114 -1771 -428 915 1200 -1892 -174 1543 3261 4979 6697 8415 1350 3358 5451 7543 9636 11729 13822 15915 1500 8608 11076 13543 16011 18479 20947 23415 1650 13858 16701 19543 22386 25229 28072 30915 1800 19108 22326 25543 28761 31979 35197 38415 1950 24358 27951 31543 35136 38729 42322 45915
NET RETURNS PER ACRE ABOVE TOTAL COSTS
YIELD (trayacre) PRICE($tray) 3500 3750 4000 4250 4500 4750 5000
1050 -8447 -7104 -5762 -4419 -3076 -1733 -390 1200 -3197 -1479 238 1956 3674 5392 7110 1350 2053 4146 6238 8331 10424 12517 14610 1500 7303 9771 12238 14706 17174 19642 22110 1650 12553 15396 18238 21081 23924 26767 29610 1800 17803 21021 24238 27456 30674 33892 37110 1950 23053 26646 30238 33831 37424 41017 44610
2014 Strawberries Organic Costs and Returns Study Central Coast UC Cooperative Extension 17
UC COOPERATIVE EXTENSION CENTRAL COAST - 2014
Table 5 WHOLE FARM ANNUAL EQUIPMENT INVESTMENT AND BUSINESS OVERHEAD COSTS
ANNUAL EQUIPMENT COSTS
Cash Overhead Yrs Salvage Capital Insur-
Yr Description Price Life Value Recovery ance Taxes Total 14 55HP 2WD Tractor 32269 10 9532 3362 173 209 3744 14 75HP 4WD Tractor 45000 20 5774 3355 210 254 3820 14 90HP 4WD Tractor 47000 20 6031 3505 220 265 3990 14 ATV 4WD 7430 7 2818 924 42 51 1017 14 Blade Rear 3 pt 8 1560 20 81 120 7 8 135 14 Cultivator 3R 12 5000 20 261 385 22 26 433 14 Disc-Offset 14 16000 20 834 1231 70 84 1385 14 Drip Machine 1-48R 3500 15 336 316 16 19 351 14 ListerShaper 3-48R 5000 15 480 451 23 27 501 14 Mulch Machine 1-48R 3000 20 156 231 13 16 260 14 Pickup Truck 12 T 28000 5 12549 4140 168 203 4511 14 Punch Machine 1-48R 5000 20 261 385 22 26 433 14 Ripper-5 Shank 18 10800 20 563 831 47 57 935 14 Sprayer w20Boom 3700 5 1205 630 20 25 674 14 Trailer-Pipe 1950 20 102 150 9 10 169 14 Triplane 15 22200 20 1157 1708 97 117 1921 14 Truck 1 Ton 1 36000 5 16134 5323 216 261 5800 14 Mower 4 3500 20 182 269 15 18 303 14 Bug Vacuum 35000 2 16448 10723 213 257 11194 14 Chisel 12 12000 20 625 923 52 63 1039 14 Truck 1 Ton 2 36000 5 16134 5323 216 261 5800 TOTAL 359909 91664 44284 1872 2258 48414
60 of new cost 215945 54998 26570 1123 1355 29048 Used to reflect a mix of new and used equipment
ANNUAL INVESTMENT COSTS
Cash Overhead
Description Price Yrs Life
Salvage Value
Capital Recovery
Insur-ance Taxes Repairs Total
INVESTMENT Buildings 1200 sqft Fuel Tanks 2-300 gal Harvest Carts (70) 75HP Pump Filter Sprinkler Pipe Lateral Lines Shop Tools
42000 3500 1400
15000 60000 12000 15000
30 20
5 20 15
5 15
0 650
0 0 0 0
1500
2655 255 321
1178 5683 2753 1350
174 17
6 62
249 50 68
210 21
7 75
300 60 83
840 70 22
100 1200
220 300
3879 363 356
1415 7432 3082 1801
TOTAL INVESTMENT 148900 2150 14195 626 755 2752 18328
ANNUAL BUSINESS OVERHEAD COSTS
Units Price Total Description Farm Unit Unit Cost
Office Expense 30 acre 75000 22250 Food Safety 27 acre 3000 810 Land Rent 30 acre 270000 81000 Liability Insurance 30 acre 2090 627 Sanitation Fee 27 acre 23481 6340 Regulatory Programs 27 acre 5000 1350 Organic CertRegistration 27 acre 17600 4752 Ranch Supervisor 30 acre 100000 30000
2014 Strawberries Organic Costs and Returns Study Central Coast UC Cooperative Extension 18
UC COOPERATIVE EXTENSION
CENTRAL COAST - 2014
Table 6 HOURLY EQUIPMENT COSTS
COSTS PER HOUR
Strawberry Total Cash Overhead Operating
Hours Hours Capital Insur- Lube amp Fuel Total Total Yr Description Used Used Recovery ance Taxes Repairs Oper CostsHr
14 55HP 2WD Tractor 961 1200 168 009 010 294 962 1256 1443
14 75HP 4WD Tractor 128 600 336 021 025 389 1311 1700 2082
14 90HP 4WD Tractor 194 800 263 016 020 351 1573 1924 2223
14 ATV 4WD 16 285 194 009 011 094 262 356 570
14 Blade Rear 3 pt 8 28 100 072 004 005 000 000 000 081
14 Cultivator 3R 12 20 100 231 013 016 099 000 099 358
14 Disc-Offset 14 47 100 739 042 051 247 000 247 1078
14 Drip Machine 1-48R 55 100 189 010 012 092 000 092 303
14 ListerShaper 3-48R 54 133 203 010 012 101 000 101 327
14 Mulch Machine 1-48R 41 100 138 008 009 033 000 033 189
14 Pickup Truck 12 T 46 400 621 025 030 356 983 1339 2015
14 Punch Machine 1-48R 20 100 231 013 016 055 000 055 315
14 Ripper-5 Shank 18 49 125 399 023 027 340 000 340 788
14 Sprayer w20Boom 82 300 126 004 005 101 000 101 236
14 Trailer-Pipe 89 200 045 003 003 000 000 000 051
14 Triplane 15 27 150 683 039 047 330 000 330 1099
14 Truck 1 Ton 1 760 760 420 017 021 261 491 752 1210
14 Mower 4 10 100 162 009 011 157 000 157 338
14 Bug Vacuum 641 750 858 017 021 968 000 968 1864
14 Chisel 12 15 75 739 042 051 219 000 219 1049
14 Truck 1 Ton 2 654 654 488 020 024 291 491 782 1314
2014 Strawberries Organic Costs and Returns Study Central Coast UC Cooperative Extension 19
UC COOPERATIVE EXTENSION
CENTRAL COAST - 2014
Table 7 OPERATIONS WITH EQUIPMENT AND MATERIALS
Operation Labor Type Rate
Operation Month Tractor Implement Material acre Unit
Soil Samples (2 per 27 acres) Sept Soil Analysis 004 farm
Disk 2X (Cover Crop) Sept 90HP 4WD Tractor Disc-Offset 14 Equipment Operator Labor 06 hour
Compost + Spread Sept Compost 5 ton
Spread CompostMeal 1 acre
Sprinklers Setup amp Removal Sept 55HP 2WD Tractor Trailer-Pipe Non-Machine Labor 15 hours
Oct 55HP 2WD Tractor Trailer-Pipe Non-Machine Labor 15 hours
Irrigate OH Sprinkle Sept Irrigation Labor 13 hours
Water Pumped 1 acin
Oct Irrigation Labor 115 hours
Water Pumped 05 acin
Oct Non-Machine Labor 13 hours
Water Pumped 1 acin
Subsoil 5X Sept 90HP 4WD Tractor Ripper-5 Shank 18 Equipment Operator Labor 216 hours
Level (Triplane) Sept 90HP 4WD Tractor Triplane 15 Equipment Operator Labor 12 hours
Disk 4X Sept 90HP 4WD Tractor Disc-Offset 14 Equipment Operator Labor 12 hours
Chisel 2X Sept 75HP 4WD Tractor Chisel 12 Equipment Operator Labor 065 hour
Bloodmeal amp Gypsum + Spread Oct Bloodmeal 500 lb
Spread CompostMeal 1 acre
Gypsum 2 ton
Beds ListShape Oct 90HP 4WD Tractor LstrShpr 3-48R Equipment Operator Labor 12 hours
Beds Re-ListedRe-Shaped Oct 90HP 4WD Tractor LstrShpr 3-48R Equipment Operator Labor 12 hours
Install Drip System Tape Later Oct 55HP 2WD Tractor Drip Mchne 1-48R Non-Machine Labor 1 hour
T-Tape 2178000 foot
Oct 55HP 2WD Tractor Blade Rear 3 pt 8 Non-Machine Labor 01 hour
Plant Lay Mulch Oct 55HP 2WD Tractor Mulch Mchne 1-48R Equipment Operator Labor 18 hours
BlackPlasticMulch 275 roll
Plant Punch Planting Holes Oct 55HP 2WD Tractor Punch Mchn 1-48R Equipment Operator Labor 09 hour
Plant Strawberries (5 replant) Oct Non-Machine Labor 525 hours
Strawberry Plants 2286900 each
Weed Hand Dec Non-Machine Labor 20 hours
Jan Non-Machine Labor 20 hours
Feb Non-Machine Labor 20 hours
Mar Non-Machine Labor 20 hours
Apr Non-Machine Labor 20 hours
May Non-Machine Labor 20 hours
June Non-Machine Labor 20 hours
July Non-Machine Labor 20 hours
Aug Non-Machine Labor 20 hours
Sept Non-Machine Labor 20 hours
2014 Strawberries Organic Costs and Returns Study Central Coast UC Cooperative Extension 20
UC COOPERATIVE EXTENSION
CENTRAL COAST - 2014
Table 7 CONTINUED
Operation Labor Type Rate
Operation Month Tractor Implement Material acre Unit
Insect Mites (predatory) Feb Non-Machine Labor 2 hours
Persimilis (Mite) 40 thou
Mar Non-Machine Labor 2 hours
Persimilis (Mite) 40 thou
Weed Cultivate Feb 75HP 4WD Tractor Cultivator 3R 12 Equipment Operator Labor 03 hour
Mar 75HP 4WD Tractor Cultivator 3R 12 Equipment Operator Labor 03 hour
Apr 75HP 4WD Tractor Cultivator 3R 12 Equipment Operator Labor 03 hour
Fertilize Foliar (Biomin) Feb 75HP 4WD Tractor Sprayer w20Boom Equipment Operator Labor 012 hour
Biomin Calcium 1 gal
Mar 75HP 4WD Tractor Sprayer w20Boom Equipment Operator Labor 012 hour
Biomin Calcium 1 gal
Apr 75HP 4WD Tractor Sprayer w20Boom Equipment Operator Labor 012 hour
Biomin Calcium 1 gal
May 75HP 4WD Tractor Sprayer w20Boom Equipment Operator Labor 012 hour
Biomin Calcium 1 gal
June 75HP 4WD Tractor Sprayer w20Boom Equipment Operator Labor 012 hour
Biomin Calcium 1 gal
July 75HP 4WD Tractor Sprayer w20Boom Equipment Operator Labor 012 hour
Biomin Calcium 1 gal
Aug 75HP 4WD Tractor Sprayer w20Boom Equipment Operator Labor 012 hour
Biomin Calcium 1 gal
Sept 75HP 4WD Tractor Sprayer w20Boom Equipment Operator Labor 012 hour
Biomin Calcium 1 gal
Fertilize Foliar (Maxi) Feb 75HP 4WD Tractor Sprayer w20Boom Equipment Operator Labor 012 hour
Maxi-Crop 25 lb
Mar 75HP 4WD Tractor Sprayer w20Boom Equipment Operator Labor 012 hour
Maxi-Crop 25 lb
Apr 75HP 4WD Tractor Sprayer w20Boom Equipment Operator Labor 012 hour
Maxi-Crop 25 lb
May 75HP 4WD Tractor Sprayer w20Boom Equipment Operator Labor 012 hour
Maxi-Crop 25 lb
June 75HP 4WD Tractor Sprayer w20Boom Equipment Operator Labor 012 hour
Maxi-Crop 25 lb
July 75HP 4WD Tractor Sprayer w20Boom Equipment Operator Labor 012 hour
Maxi-Crop 25 lb
Aug 75HP 4WD Tractor Sprayer w20Boom Equipment Operator Labor 012 hour
Maxi-Crop 25 lb
Sept 75HP 4WD Tractor Sprayer w20Boom Equipment Operator Labor 012 hour
Maxi-Crop 25 lb
2014 Strawberries Organic Costs and Returns Study Central Coast UC Cooperative Extension 21
UC COOPERATIVE EXTENSION
CENTRAL COAST - 2014
Table 7 CONTINUED
Operation Labor Type Rate
Operation Month Tractor Implement Material acre Unit
Vertebrate Trapping Feb Non-Machine Labor 04 hour
Mar Non-Machine Labor 04 hour
Apr Non-Machine Labor 04 hour
May Non-Machine Labor 04 hour
June Non-Machine Labor 04 hour
Pest Control Adviser (PCA) Mar PCA fee 1 acre
Irrigate Drip Mar Non-Machine Labor 171 hours
Water Pumped 343 acin
Apr Non-Machine Labor 171 hours
Water Pumped 343 acin
May Non-Machine Labor 171 hours
Water Pumped 343 acin
June Non-Machine Labor 171 hours
Water Pumped 343 acin
July Non-Machine Labor 171 hours
Water Pumped 343 acin
Aug Non-Machine Labor 171 hours
Water Pumped 343 acin
Sept Non-Machine Labor 171 hours
Water Pumped 342 acin
Fertilize Through Drip (Agro) Mar Non-Machine Labor 043 hour
Agrothrive LF 10 gal
Apr Non-Machine Labor 043 hour
Agrothrive LF 10 gal
May Non-Machine Labor 043 hour
Agrothrive LF 10 gal
June Non-Machine Labor 043 hour
Agrothrive LF 10 gal
July Non-Machine Labor 043 hour
Agrothrive LF 10 gal
Aug Non-Machine Labor 043 hour
Agrothrive LF 10 gal
Sept Non-Machine Labor 042 hour
Agrothrive LF 10 gal
Insect Vacuum Lygus 8Xmonth Apr 55HP 2WD Tractor Bug Vacuum Equipment Operator Labor 407 hours
May 55HP 2WD Tractor Bug Vacuum Equipment Operator Labor 407 hours
June 55HP 2WD Tractor Bug Vacuum Equipment Operator Labor 407 hours
July 55HP 2WD Tractor Bug Vacuum Equipment Operator Labor 407 hours
Aug 55HP 2WD Tractor Bug Vacuum Equipment Operator Labor 407 hours
Sept 55HP 2WD Tractor Bug Vacuum Equipment Operator Labor 407 hours
Oct 55HP 2WD Tractor Bug Vacuum Equipment Operator Labor 407 hours
2014 Strawberries Organic Costs and Returns Study Central Coast UC Cooperative Extension 22
UC COOPERATIVE EXTENSION
CENTRAL COAST - 2014
Table 7 CONTINUED
Operation Labor Type Rate
Operation Month Tractor Implement Material acre Unit
Disease Powdery Mildew (Sulfur) Mar 75HP 4WD Tractor Sprayer w20Boom Equipment Operator Labor 024 hour
Kumulus DF 5 lb
Apr 75HP 4WD Tractor Sprayer w20Boom Equipment Operator Labor 024 hour
Kumulus DF 5 lb
May 75HP 4WD Tractor Sprayer w20Boom Equipment Operator Labor 012 hour
Kumulus DF 5 lb
June 75HP 4WD Tractor Sprayer w20Boom Equipment Operator Labor 012 hour
Kumulus DF 10 lb
July 75HP 4WD Tractor Sprayer w20Boom Equipment Operator Labor 012 hour
Kumulus DF 5 lb
Aug 75HP 4WD Tractor Sprayer w20Boom Equipment Operator Labor 012 hour
Kumulus DF 5 lb
Sept 75HP 4WD Tractor Sprayer w20Boom Equipment Operator Labor 012 hour
Kumulus DF 5 lb
Oct 75HP 4WD Tractor Sprayer w20Boom Equipment Operator Labor 012 hour
Kumulus DF 5 lb
Insect LBAM (Entrust) May 75HP 4WD Tractor Sprayer w20Boom Equipment Operator Labor 012 hour
Entrust 25 oz
June 75HP 4WD Tractor Sprayer w20Boom Equipment Operator Labor 012 hour
Entrust 25 oz
Sept 75HP 4WD Tractor Sprayer w20Boom Equipment Operator Labor 012 hour
Entrust 25 oz
Worms (Dipel) May 75HP 4WD Tractor Sprayer w20Boom Equipment Operator Labor 012 hour
Dipel DF (Bt) 2 lb
June 75HP 4WD Tractor Sprayer w20Boom Equipment Operator Labor 012 hour
Dipel DF (Bt) 2 lb
Post Harvest Cleanup Oct 55HP 2WD Tractor Mower 4 Non-Machine Labor 95 hours
Oct Truck 1 Ton 1 Non-Machine Labor 6 hours
DumpFee Monterey 600 lb
Oct 90HP 4WD Tractor Disc-Offset 14 Non-Machine Labor 9 hours
Pickup Business Use Oct Pickup Truck 12 T Equipment Operator Labor 205 hours
ATV Oct ATV 4WD Equipment Operator Labor 071 hour
Harvest Regular amp Peak Apr Harvest Labor 7589 hours
8 Clamshell +Tray 2125 each
May Harvest Labor 11775 hours
8 Clamshell +Tray 510 each
June Harvest Labor 21766 hours
8 Clamshell +Tray 106250 each
2014 Strawberries Organic Costs and Returns Study Central Coast UC Cooperative Extension 23
UC COOPERATIVE EXTENSION CENTRAL COAST - 2014 Table 7 CONTINUED
Operation Labor Type Rate Operation Month Tractor Implement Material acre Unit
Harvest Regular amp Peak July Harvest Labor 21766 hours 8 Clamshell +Tray 106250 each
Aug Harvest Labor 15671 hours 8 Clamshell +Tray 765 each
Sept Harvest Labor 11775 hours 8 Clamshell +Tray 510 each
Oct Truck 1 Ton 1 Harvest Labor 4551 hours 8 Clamshell +Tray 1275 each
Harvest Load amp Haul Apr Truck 1 Ton 1 Non-Machine Labor 157 hours May Truck 1 Ton 2 Non-Machine Labor 227 hours June Truck 1 Ton 1 Non-Machine Labor 337 hours July Truck 1 Ton 2 Non-Machine Labor 337 hours Aug Truck 1 Ton 1 Non-Machine Labor 283 hours Sept Truck 1 Ton 2 Non-Machine Labor 227 hours Oct Truck 1 Ton 1 Non-Machine Labor 094 hour
Harvest Cooler Apr Cooler 2125 tray May Cooler 510 tray June Equipment Operator Labor 532 hours
Cooler 106250 tray July Cooler 106250 tray Aug Cooler 765 tray Sept Cooler 510 tray Oct Cooler 1275 tray
Assessment Apr Strawberry Commiss 2125 tray May Strawberry Commiss 510 tray June Strawberry Commiss 106250 tray July Strawberry Commiss 106250 tray Aug Strawberry Commiss 765 tray Sept Strawberry Commiss 510 tray Oct Strawberry Commiss 1275 tray
Sales Apr Sales Commission 8 2125 tray May Sales Commission 8 510 tray June Sales Commission 8 106250 tray July Sales Commission 8 106250 tray Aug Sales Commission 8 765 tray Sept Sales Commission 8 510 tray Oct Sales Commission 8 1275 tray
2014 Strawberries Organic Costs and Returns Study Central Coast UC Cooperative Extension 24
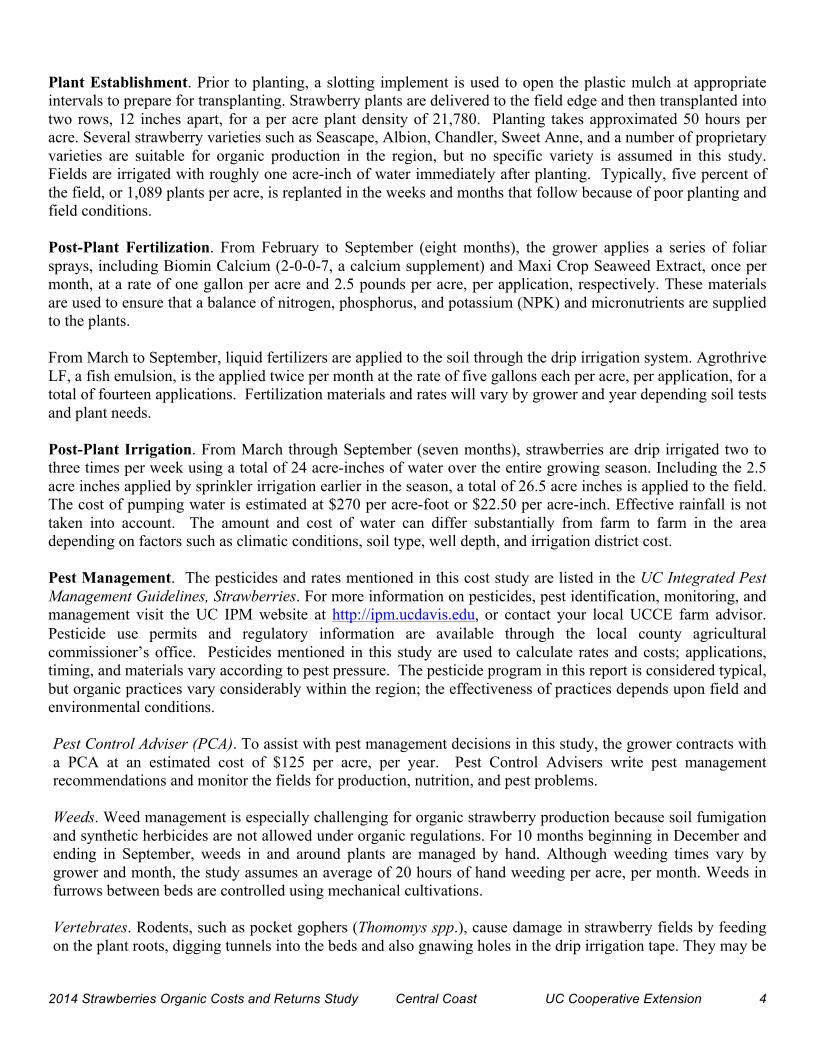
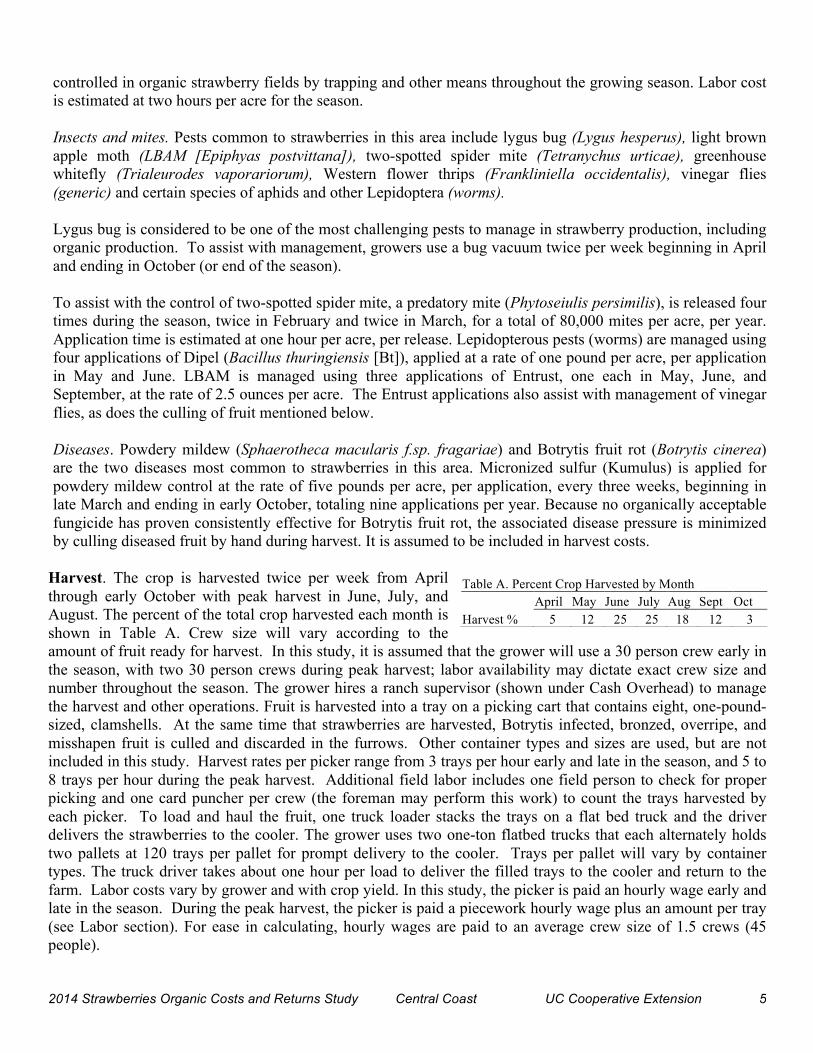

UC COOPERATIVE EXTENSION CENTRAL COAST - 2014
Table 1 COSTS PER ACRE TO PRODUCE ORGANIC STRAWBERRIES
Equipment Operation Cash and Labor Costs per Acre
Time Labor Fuel Lube amp Material Custom Total Your Operation (HrsA) Cost Repairs Cost Rent Cost Cost
Cultural Soil Samples (2 per 27 Acre Farm) 000 0 0 0 0 6 6 Disk 2X (Cover Crop) 050 11 9 3 0 0 23 Compost + Spread 000 0 0 0 275 12 287 Sprinklers Setup and Removal 300 106 32 10 0 0 147 Irrigate Sprinkler 000 46 0 0 56 0 103 Subsoil 5X 180 41 31 13 0 0 85 Level (Triplane) 100 23 17 7 0 0 47 Disk 4X 100 23 17 6 0 0 47 Chisel 2X 054 12 8 3 0 0 24 Blood Meal + Gypsum Spread 000 0 0 0 880 12 892 Beds ListShape 100 23 17 5 0 0 45 Beds Re-ListRe-Shape (Post irrigation) 100 23 17 5 0 0 45 Install Drip System Tape amp Laterals 300 82 32 12 240 0 365 Plant Lay Mulch 150 34 16 5 363 0 419 Plant Punch Planting Holes 075 17 8 3 0 0 28 Plant Strawberries (Includes 5 Replant) 000 649 0 0 2744 0 3394 Weed Hand 000 2474 0 0 0 0 2474 Insect Mites (Predatory) 000 49 0 0 880 0 929 Weed Cultivate 075 17 11 4 0 0 32 Fertilize Foliar (Biomin) 078 18 11 4 144 0 177 Fertilize Foliar (Maxi Crop) 078 18 11 4 226 0 260 Vertebrate Trapping 000 25 0 0 0 0 25 Pest Control Adviser (PCA) 000 0 0 0 0 125 125 Irrigate Drip 000 148 0 0 540 0 688 Fertilize Soil (Agrothrive) 000 37 0 0 250 0 287 Insect Vacuum Lygus 8Xmonth 2373 544 251 307 0 0 1101 Disease Powdery Mildew (Kumulus) 098 22 14 5 75 0 117 Insect LBAM (Entrust) 029 7 4 2 332 0 344 Worms (Dipel) 020 4 3 1 74 0 82 Post Harvest Cleanup 300 372 20 14 18 0 423 Pickup Business Use 171 39 17 6 0 0 62 ATV 059 14 2 1 0 0 16
TOTAL Cultural COSTS 4789 4881 548 419 7097 155 13099 Harvest Harvest Regular and Peak Production 000 11732 0 0 6885 0 18617 Harvest Load amp Haul 5000 1351 246 214 0 0 1812 Harvest Cooler 000 0 0 0 0 2975 2975 CSC Assessment 000 0 0 0 170 0 170 SalesMarketing 000 0 0 0 5100 0 5100
TOTAL Harvest COSTS 5000 13083 246 214 12155 2975 28673
Interest on Operating Capital 575 710 TOTAL OPERATING COSTSACRE 9789 17964 793 634 19252 3130 42482
2014 Strawberries Organic Costs and Returns Study Central Coast UC Cooperative Extension 11
UC COOPERATIVE EXTENSION
CENTRAL COAST - 2014
Table 1 CONTINUED
Equipment Operation Cash and Labor Costs per Acre
Time Labor Fuel Lube amp Material Custom Total Your
Operation (HrsA) Cost Repairs Cost Rent Cost Cost
CASH OVERHEAD
Office Expense 833
Food Safety 30
Land Rent 2700
Liability Insurance 21
Sanitation Fee 235
Regulatory Programs 50
Organic CertificationRegistration 176
Ranch Supervisor 1000
Property Taxes 60
Property Insurance 50
Investment Repairs 102
TOTAL CASH OVERHEAD COSTSACRE 5257
TOTAL CASH COSTSACRE 47739
NON-CASH OVERHEAD Per producing Annual Cost
Acre Capital Recovery
Buildings 1200 sqft 1556 98 98
Fuel Tanks 2-300 gal 130 9 9
Harvest Carts (70) 52 12 12
75HP Pump 556 44 44
Sprinkler Pipe 2222 210 210
Lateral Lines 444 102 102
Shop Tools 556 50 50
Equipment 5236 779 779
TOTAL NON-CASH OVERHEAD COSTS 10751 1305 1305
TOTAL COSTSACRE 49044
Note Growing CostsAcre = Total Cash CostsAcre ndash Harvest CostsAcre ($47739 - $28673 = $19066)
2014 Strawberries Organic Costs and Returns Study Central Coast UC Cooperative Extension 12
UC COOPERATIVE EXTENSION CENTRAL COAST - 2014
Table 2 COSTS AND RETURNS PER ACRE TO PRODUCE ORGANIC STRAWBERRIES
Quantity Price or Value or Your Acre Unit CostUnit CostAcre Cost
GROSS RETURNS Organic 425000 tray 1500 63750
TOTAL GROSS RETURNS 425000 tray 63750 OPERATING COSTS Insecticide 1285 Persimilis (Predatory Mites) 8000 thou 1100 880 Entrust 750 oz 4421 332 Dipel DF (Bt) 400 lb 1838 74
Fungicide 75 Kumulus DF 4500 lb 167 75
Fertilizer 1775 Compost 500 ton 5500 275 Blood Meal 50000 lb 160 800 Gypsum 200 ton 4000 80 Biomin Calcium 800 gal 1802 144 Maxi-Crop 2000 lb 1132 226 Agrothrive LF 7000 gal 357 250
Custom 6 Soil Analysis (2 per 27 acres) 004 farm 15000 6
Materials 7506 T-Tape 2178000 feet 001 240 Black Plastic Mulch 275 rolls 13200 363 8 Clamshell +Tray 425000 each 162 6885 Disposal Site Fees 60000 lb 003 18
Water 596 Water - Pumped 2650 acin 2250 596
Plants 2744 Strawberry Plants 2286900 each 012 2744
Contract 3124 Spread CompostBlood Meal 200 acre 1200 24 Pest Control Adviser (PCA) 100 acre 12500 125 Cooler 425000 tray 070 2975
AssessmentsSales Commission 5270 CSC Assessment 425000 tray 004 170 Sales Commission 8 425000 tray 120 5100
Labor 17964 Equipment Operator Labor 11746 hrs 1910 2244 Non-Machine Labor 31999 hrs 1237 3958 Irrigation Labor 245 hrs 1237 30 Harvest Labor (Regular amp Peak) 94841 hrs 1237 11732
Machinery 1427 Fuel-Gas 7014 gal 393 276 Fuel-Diesel 14540 gal 356 518 Lube 119 Machinery Repair 515
Interest on Operating Capital (575) 710 TOTAL OPERATING COSTSACRE 42482 NET RETURNS ABOVE OPERATING COSTS 21268
Peak Harvest Labor HoursAcre are the equivalent of hourly wage plus piece rate
2014 Strawberries Organic Costs and Returns Study Central Coast UC Cooperative Extension 13
13
UC COOPERATIVE EXTENSION
CENTRAL COAST - 2014
Table 2 CONTINUED
Quantity Price or Value or Your
Acre Unit CostUnit CostAcre Cost
CASH OVERHEAD COSTS
Office Expense 833
Food Safety 30
Land Rent 2700
Liability Insurance 21
Sanitation Fee 235
Regulatory Programs 50
Organic CertificationRegistration 176
Ranch Supervisor 1000
Property Taxes 60
Property Insurance 50
Investment Repairs 102
TOTAL CASH OVERHEAD COSTSACRE 5257
TOTAL CASH COSTSACRE 47739
NET RETURNS ABOVE CASH COSTS 16011
NON-CASH OVERHEAD COSTS (Capital Recovery)
Buildings 1200 sqft 98
Fuel Tanks 2-300 gal 9
Harvest Carts 12
75HP Pump 44
Sprinkler Pipe 210
Lateral Lines 102
Shop Tools 50
Equipment 779
TOTAL NON-CASH OVERHEAD COSTSACRE 1305
TOTAL COSTACRE 49044
TOTAL COST TRAY 1154
NET RETURNS ABOVE TOTAL COST 14706
2014 Strawberries Organic Costs and Returns Study Central Coast UC Cooperative Extension 14
UC COOPERATIVE EXTENSION CENTRAL COAST - 2014
Table 3 MONTHLY CASH COSTS PER ACRE TO PRODUCE ORGANIC STRAWBERRIES
Beginning 09-13 Ending 10-14
SEP 13
OCT 13
NOV 13
DEC 13
JAN 14
FEB 14
MAR 14
APR 14
MAY 14
JUN 14
JUL 14
AUG 14
SEP 14
OCT 14
TOTAL
Cultural Soil Samples (2 per 27 Acre Farm) Disk 2X (Cover Crop) Compost + Spread Sprinklers Setup and Removal Irrigate Sprinkler Subsoil 5X
6 23
287 74 39 85
74 64
6 23
287 147 103
85 Level (Triplane) Disk 4X
47 47
47 47
Chisel 2X 24 24 Blood Meal + Gypsum Spread Beds ListShape Beds Re-ListRe-Shape (Post irrigation) Install Drip System Tape amp Laterals Plant Lay Mulch Plant Punch Planting Holes Plant Strawberries (Includes 5 Replant) Weed Hand Insect Mites (Predatory) Weed Cultivate
892 45 45
365 419
28 3394
247 247 247 465
11
247 465
11
247
11
247 247 247 247 247
892 45 45
365 419
28 3394 2474
929 32
Fertilize Foliar (Biomin) Fertilize Foliar (Maxi Crop) Vertebrate Trapping Pest Control Adviser (PCA) Irrigate Drip Fertilize Soil (Agrothrive) Insect Vacuum Lygus 8Xmonth Disease Powdery Mildew (Kumulus) Insect LBAM (Entrust) Worms (Dipel) Post Harvest Cleanup Pickup Business Use ATV
125
22 32
5
22 32
5
98 41
17
22 32
5
98 41
157 17
22 32
5
98 41
157 13
115 41
22 32
5
98 41
157 21
115 41
22 32
98 41
157 13
22 32
98 41
157 13
22 32
98 41
157 13
115
157 13
423 62 16
177 260
25 125 688 287
1101 117 344
82 423
62 16
TOTAL Cultural COSTS 631 5450 247 247 782 938 631 772 780 611 611 726 671 13099
2014 Strawberries Organic Costs and Returns Study Central Coast UC Cooperative Extension 15
UC COOPERATIVE EXTENSION
CENTRAL COAST - 2014
Table 3 CONTINUED
Beginning 09-13 SEP OCT NOV DEC JAN FEB MAR APR MAY JUN JUL AUG SEP OCT TOTAL
Ending 10-14 13 13 13 13 14 14 14 14 14 14 14 14 14 14
Harvest
Harvest Regular and Peak Production 1279 2283 4414 4414 3178 2283 767 18617
Harvest Load amp Haul 105 211 455 455 327 210 48 1812
Harvest Cooler 149 357 744 744 536 357 89 2975
CSC Assessment 9 20 43 43 31 20 5 170
SalesMarketing 255 612 1275 1275 918 612 153 5100
TOTAL Harvest COSTS 0 0 0 0 0 0 1796 3483 6930 6930 4989 3482 1062 28673
Interest on Operating Capital (575) 3 29 29 30 32 35 40 51 72 109 145 172 -28 -8 710
TOTAL OPERATING COSTSACRE 634 5479 29 278 279 818 978 2479 4327 7819 7686 5772 4179 1725 42482
CASH OVERHEAD
Office Expense 60 60 60 60 60 60 60 60 60 60 60 60 60 60 833
Food Safety 30 30
Land Rent 2700 2700
Liability Insurance 21 21
Sanitation Fee 235 235
Regulatory Programs 50 50
Organic CertificationRegistration 176 176
Ranch Supervisor 71 71 71 71 71 71 71 71 71 71 71 71 71 71 1000
Property Taxes 30 30 60
Property Insurance 25 25 50
Investment Repairs 7 7 7 7 7 7 7 7 7 7 7 7 7 7 102
TOTAL CASH OVERHEAD COSTS 138 138 138 168 3119 188 138 198 138 163 138 138 138 314 5257
TOTAL CASH COSTSACRE 772 5618 167 446 3398 1006 1116 2677 4465 7982 7824 5911 4318 2039 47739
2014 Strawberries Organic Costs and Returns Study Central Coast UC Cooperative Extension 16
UC COOPERATIVE EXTENSION CENTRAL COAST - 2014
Table 4 RANGING ANALYSIS
COST PER ACRE AT VARYING YIELDS TO PRODUCE ORGANIC STRAWBERRIES
YIELD (traysacre) 3500 3750 4000 4250 4500 4750 5000
OPERATING COSTS Cultural 13099 13099 13099 13099 13099 13099 13099 Harvest 24863 26133 27403 28673 29944 31214 32484
Interest on operating capital 575 674 686 698 710 722 734 746 TOTAL OPERATING COSTSACRE 38636 39918 41200 42482 43764 45047 46329
Total Operating Coststray 1104 1064 1030 1000 973 948 927 CASH OVERHEAD COSTSACRE 5257 5257 5257 5257 5257 5257 5257 TOTAL CASH COSTSACRE 43892 45174 46457 47739 49021 50303 51585 Total Cash Coststray 1254 1205 1161 1123 1089 1059 1032 NON-CASH OVERHEAD COSTSACRE 1305 1305 1305 1305 1305 1305 1305 TOTAL COSTSACRE 45197 46479 47762 49044 50326 51608 52890 Total Coststray 1291 1239 1194 1154 1118 1086 1058
NET RETURNS PER ACRE ABOVE OPERATING COSTS
YIELD (trayacre) PRICE($tray) 3500 3750 4000 4250 4500 4750 5000
1050 -1886 -543 800 2143 3486 4828 6171 1200 3364 5082 6800 8518 10236 11953 13671 1350 8614 10707 12800 14893 16986 19078 21171 1500 13864 16332 18800 21268 23736 26203 28671 1650 19114 21957 24800 27643 30486 33328 36171 1800 24364 27582 30800 34018 37236 40453 43671 1950 29614 33207 36800 40393 43986 47578 51171
NET RETURNS PER ACRE ABOVE CASH COSTS
YIELD (trayacre) PRICE($tray) 3500 3750 4000 4250 4500 4750 5000
1050 -7142 -5799 -4457 -3114 -1771 -428 915 1200 -1892 -174 1543 3261 4979 6697 8415 1350 3358 5451 7543 9636 11729 13822 15915 1500 8608 11076 13543 16011 18479 20947 23415 1650 13858 16701 19543 22386 25229 28072 30915 1800 19108 22326 25543 28761 31979 35197 38415 1950 24358 27951 31543 35136 38729 42322 45915
NET RETURNS PER ACRE ABOVE TOTAL COSTS
YIELD (trayacre) PRICE($tray) 3500 3750 4000 4250 4500 4750 5000
1050 -8447 -7104 -5762 -4419 -3076 -1733 -390 1200 -3197 -1479 238 1956 3674 5392 7110 1350 2053 4146 6238 8331 10424 12517 14610 1500 7303 9771 12238 14706 17174 19642 22110 1650 12553 15396 18238 21081 23924 26767 29610 1800 17803 21021 24238 27456 30674 33892 37110 1950 23053 26646 30238 33831 37424 41017 44610
2014 Strawberries Organic Costs and Returns Study Central Coast UC Cooperative Extension 17
UC COOPERATIVE EXTENSION CENTRAL COAST - 2014
Table 5 WHOLE FARM ANNUAL EQUIPMENT INVESTMENT AND BUSINESS OVERHEAD COSTS
ANNUAL EQUIPMENT COSTS
Cash Overhead Yrs Salvage Capital Insur-
Yr Description Price Life Value Recovery ance Taxes Total 14 55HP 2WD Tractor 32269 10 9532 3362 173 209 3744 14 75HP 4WD Tractor 45000 20 5774 3355 210 254 3820 14 90HP 4WD Tractor 47000 20 6031 3505 220 265 3990 14 ATV 4WD 7430 7 2818 924 42 51 1017 14 Blade Rear 3 pt 8 1560 20 81 120 7 8 135 14 Cultivator 3R 12 5000 20 261 385 22 26 433 14 Disc-Offset 14 16000 20 834 1231 70 84 1385 14 Drip Machine 1-48R 3500 15 336 316 16 19 351 14 ListerShaper 3-48R 5000 15 480 451 23 27 501 14 Mulch Machine 1-48R 3000 20 156 231 13 16 260 14 Pickup Truck 12 T 28000 5 12549 4140 168 203 4511 14 Punch Machine 1-48R 5000 20 261 385 22 26 433 14 Ripper-5 Shank 18 10800 20 563 831 47 57 935 14 Sprayer w20Boom 3700 5 1205 630 20 25 674 14 Trailer-Pipe 1950 20 102 150 9 10 169 14 Triplane 15 22200 20 1157 1708 97 117 1921 14 Truck 1 Ton 1 36000 5 16134 5323 216 261 5800 14 Mower 4 3500 20 182 269 15 18 303 14 Bug Vacuum 35000 2 16448 10723 213 257 11194 14 Chisel 12 12000 20 625 923 52 63 1039 14 Truck 1 Ton 2 36000 5 16134 5323 216 261 5800 TOTAL 359909 91664 44284 1872 2258 48414
60 of new cost 215945 54998 26570 1123 1355 29048 Used to reflect a mix of new and used equipment
ANNUAL INVESTMENT COSTS
Cash Overhead
Description Price Yrs Life
Salvage Value
Capital Recovery
Insur-ance Taxes Repairs Total
INVESTMENT Buildings 1200 sqft Fuel Tanks 2-300 gal Harvest Carts (70) 75HP Pump Filter Sprinkler Pipe Lateral Lines Shop Tools
42000 3500 1400
15000 60000 12000 15000
30 20
5 20 15
5 15
0 650
0 0 0 0
1500
2655 255 321
1178 5683 2753 1350
174 17
6 62
249 50 68
210 21
7 75
300 60 83
840 70 22
100 1200
220 300
3879 363 356
1415 7432 3082 1801
TOTAL INVESTMENT 148900 2150 14195 626 755 2752 18328
ANNUAL BUSINESS OVERHEAD COSTS
Units Price Total Description Farm Unit Unit Cost
Office Expense 30 acre 75000 22250 Food Safety 27 acre 3000 810 Land Rent 30 acre 270000 81000 Liability Insurance 30 acre 2090 627 Sanitation Fee 27 acre 23481 6340 Regulatory Programs 27 acre 5000 1350 Organic CertRegistration 27 acre 17600 4752 Ranch Supervisor 30 acre 100000 30000
2014 Strawberries Organic Costs and Returns Study Central Coast UC Cooperative Extension 18
UC COOPERATIVE EXTENSION
CENTRAL COAST - 2014
Table 6 HOURLY EQUIPMENT COSTS
COSTS PER HOUR
Strawberry Total Cash Overhead Operating
Hours Hours Capital Insur- Lube amp Fuel Total Total Yr Description Used Used Recovery ance Taxes Repairs Oper CostsHr
14 55HP 2WD Tractor 961 1200 168 009 010 294 962 1256 1443
14 75HP 4WD Tractor 128 600 336 021 025 389 1311 1700 2082
14 90HP 4WD Tractor 194 800 263 016 020 351 1573 1924 2223
14 ATV 4WD 16 285 194 009 011 094 262 356 570
14 Blade Rear 3 pt 8 28 100 072 004 005 000 000 000 081
14 Cultivator 3R 12 20 100 231 013 016 099 000 099 358
14 Disc-Offset 14 47 100 739 042 051 247 000 247 1078
14 Drip Machine 1-48R 55 100 189 010 012 092 000 092 303
14 ListerShaper 3-48R 54 133 203 010 012 101 000 101 327
14 Mulch Machine 1-48R 41 100 138 008 009 033 000 033 189
14 Pickup Truck 12 T 46 400 621 025 030 356 983 1339 2015
14 Punch Machine 1-48R 20 100 231 013 016 055 000 055 315
14 Ripper-5 Shank 18 49 125 399 023 027 340 000 340 788
14 Sprayer w20Boom 82 300 126 004 005 101 000 101 236
14 Trailer-Pipe 89 200 045 003 003 000 000 000 051
14 Triplane 15 27 150 683 039 047 330 000 330 1099
14 Truck 1 Ton 1 760 760 420 017 021 261 491 752 1210
14 Mower 4 10 100 162 009 011 157 000 157 338
14 Bug Vacuum 641 750 858 017 021 968 000 968 1864
14 Chisel 12 15 75 739 042 051 219 000 219 1049
14 Truck 1 Ton 2 654 654 488 020 024 291 491 782 1314
2014 Strawberries Organic Costs and Returns Study Central Coast UC Cooperative Extension 19
UC COOPERATIVE EXTENSION
CENTRAL COAST - 2014
Table 7 OPERATIONS WITH EQUIPMENT AND MATERIALS
Operation Labor Type Rate
Operation Month Tractor Implement Material acre Unit
Soil Samples (2 per 27 acres) Sept Soil Analysis 004 farm
Disk 2X (Cover Crop) Sept 90HP 4WD Tractor Disc-Offset 14 Equipment Operator Labor 06 hour
Compost + Spread Sept Compost 5 ton
Spread CompostMeal 1 acre
Sprinklers Setup amp Removal Sept 55HP 2WD Tractor Trailer-Pipe Non-Machine Labor 15 hours
Oct 55HP 2WD Tractor Trailer-Pipe Non-Machine Labor 15 hours
Irrigate OH Sprinkle Sept Irrigation Labor 13 hours
Water Pumped 1 acin
Oct Irrigation Labor 115 hours
Water Pumped 05 acin
Oct Non-Machine Labor 13 hours
Water Pumped 1 acin
Subsoil 5X Sept 90HP 4WD Tractor Ripper-5 Shank 18 Equipment Operator Labor 216 hours
Level (Triplane) Sept 90HP 4WD Tractor Triplane 15 Equipment Operator Labor 12 hours
Disk 4X Sept 90HP 4WD Tractor Disc-Offset 14 Equipment Operator Labor 12 hours
Chisel 2X Sept 75HP 4WD Tractor Chisel 12 Equipment Operator Labor 065 hour
Bloodmeal amp Gypsum + Spread Oct Bloodmeal 500 lb
Spread CompostMeal 1 acre
Gypsum 2 ton
Beds ListShape Oct 90HP 4WD Tractor LstrShpr 3-48R Equipment Operator Labor 12 hours
Beds Re-ListedRe-Shaped Oct 90HP 4WD Tractor LstrShpr 3-48R Equipment Operator Labor 12 hours
Install Drip System Tape Later Oct 55HP 2WD Tractor Drip Mchne 1-48R Non-Machine Labor 1 hour
T-Tape 2178000 foot
Oct 55HP 2WD Tractor Blade Rear 3 pt 8 Non-Machine Labor 01 hour
Plant Lay Mulch Oct 55HP 2WD Tractor Mulch Mchne 1-48R Equipment Operator Labor 18 hours
BlackPlasticMulch 275 roll
Plant Punch Planting Holes Oct 55HP 2WD Tractor Punch Mchn 1-48R Equipment Operator Labor 09 hour
Plant Strawberries (5 replant) Oct Non-Machine Labor 525 hours
Strawberry Plants 2286900 each
Weed Hand Dec Non-Machine Labor 20 hours
Jan Non-Machine Labor 20 hours
Feb Non-Machine Labor 20 hours
Mar Non-Machine Labor 20 hours
Apr Non-Machine Labor 20 hours
May Non-Machine Labor 20 hours
June Non-Machine Labor 20 hours
July Non-Machine Labor 20 hours
Aug Non-Machine Labor 20 hours
Sept Non-Machine Labor 20 hours
2014 Strawberries Organic Costs and Returns Study Central Coast UC Cooperative Extension 20
UC COOPERATIVE EXTENSION
CENTRAL COAST - 2014
Table 7 CONTINUED
Operation Labor Type Rate
Operation Month Tractor Implement Material acre Unit
Insect Mites (predatory) Feb Non-Machine Labor 2 hours
Persimilis (Mite) 40 thou
Mar Non-Machine Labor 2 hours
Persimilis (Mite) 40 thou
Weed Cultivate Feb 75HP 4WD Tractor Cultivator 3R 12 Equipment Operator Labor 03 hour
Mar 75HP 4WD Tractor Cultivator 3R 12 Equipment Operator Labor 03 hour
Apr 75HP 4WD Tractor Cultivator 3R 12 Equipment Operator Labor 03 hour
Fertilize Foliar (Biomin) Feb 75HP 4WD Tractor Sprayer w20Boom Equipment Operator Labor 012 hour
Biomin Calcium 1 gal
Mar 75HP 4WD Tractor Sprayer w20Boom Equipment Operator Labor 012 hour
Biomin Calcium 1 gal
Apr 75HP 4WD Tractor Sprayer w20Boom Equipment Operator Labor 012 hour
Biomin Calcium 1 gal
May 75HP 4WD Tractor Sprayer w20Boom Equipment Operator Labor 012 hour
Biomin Calcium 1 gal
June 75HP 4WD Tractor Sprayer w20Boom Equipment Operator Labor 012 hour
Biomin Calcium 1 gal
July 75HP 4WD Tractor Sprayer w20Boom Equipment Operator Labor 012 hour
Biomin Calcium 1 gal
Aug 75HP 4WD Tractor Sprayer w20Boom Equipment Operator Labor 012 hour
Biomin Calcium 1 gal
Sept 75HP 4WD Tractor Sprayer w20Boom Equipment Operator Labor 012 hour
Biomin Calcium 1 gal
Fertilize Foliar (Maxi) Feb 75HP 4WD Tractor Sprayer w20Boom Equipment Operator Labor 012 hour
Maxi-Crop 25 lb
Mar 75HP 4WD Tractor Sprayer w20Boom Equipment Operator Labor 012 hour
Maxi-Crop 25 lb
Apr 75HP 4WD Tractor Sprayer w20Boom Equipment Operator Labor 012 hour
Maxi-Crop 25 lb
May 75HP 4WD Tractor Sprayer w20Boom Equipment Operator Labor 012 hour
Maxi-Crop 25 lb
June 75HP 4WD Tractor Sprayer w20Boom Equipment Operator Labor 012 hour
Maxi-Crop 25 lb
July 75HP 4WD Tractor Sprayer w20Boom Equipment Operator Labor 012 hour
Maxi-Crop 25 lb
Aug 75HP 4WD Tractor Sprayer w20Boom Equipment Operator Labor 012 hour
Maxi-Crop 25 lb
Sept 75HP 4WD Tractor Sprayer w20Boom Equipment Operator Labor 012 hour
Maxi-Crop 25 lb
2014 Strawberries Organic Costs and Returns Study Central Coast UC Cooperative Extension 21
UC COOPERATIVE EXTENSION
CENTRAL COAST - 2014
Table 7 CONTINUED
Operation Labor Type Rate
Operation Month Tractor Implement Material acre Unit
Vertebrate Trapping Feb Non-Machine Labor 04 hour
Mar Non-Machine Labor 04 hour
Apr Non-Machine Labor 04 hour
May Non-Machine Labor 04 hour
June Non-Machine Labor 04 hour
Pest Control Adviser (PCA) Mar PCA fee 1 acre
Irrigate Drip Mar Non-Machine Labor 171 hours
Water Pumped 343 acin
Apr Non-Machine Labor 171 hours
Water Pumped 343 acin
May Non-Machine Labor 171 hours
Water Pumped 343 acin
June Non-Machine Labor 171 hours
Water Pumped 343 acin
July Non-Machine Labor 171 hours
Water Pumped 343 acin
Aug Non-Machine Labor 171 hours
Water Pumped 343 acin
Sept Non-Machine Labor 171 hours
Water Pumped 342 acin
Fertilize Through Drip (Agro) Mar Non-Machine Labor 043 hour
Agrothrive LF 10 gal
Apr Non-Machine Labor 043 hour
Agrothrive LF 10 gal
May Non-Machine Labor 043 hour
Agrothrive LF 10 gal
June Non-Machine Labor 043 hour
Agrothrive LF 10 gal
July Non-Machine Labor 043 hour
Agrothrive LF 10 gal
Aug Non-Machine Labor 043 hour
Agrothrive LF 10 gal
Sept Non-Machine Labor 042 hour
Agrothrive LF 10 gal
Insect Vacuum Lygus 8Xmonth Apr 55HP 2WD Tractor Bug Vacuum Equipment Operator Labor 407 hours
May 55HP 2WD Tractor Bug Vacuum Equipment Operator Labor 407 hours
June 55HP 2WD Tractor Bug Vacuum Equipment Operator Labor 407 hours
July 55HP 2WD Tractor Bug Vacuum Equipment Operator Labor 407 hours
Aug 55HP 2WD Tractor Bug Vacuum Equipment Operator Labor 407 hours
Sept 55HP 2WD Tractor Bug Vacuum Equipment Operator Labor 407 hours
Oct 55HP 2WD Tractor Bug Vacuum Equipment Operator Labor 407 hours
2014 Strawberries Organic Costs and Returns Study Central Coast UC Cooperative Extension 22
UC COOPERATIVE EXTENSION
CENTRAL COAST - 2014
Table 7 CONTINUED
Operation Labor Type Rate
Operation Month Tractor Implement Material acre Unit
Disease Powdery Mildew (Sulfur) Mar 75HP 4WD Tractor Sprayer w20Boom Equipment Operator Labor 024 hour
Kumulus DF 5 lb
Apr 75HP 4WD Tractor Sprayer w20Boom Equipment Operator Labor 024 hour
Kumulus DF 5 lb
May 75HP 4WD Tractor Sprayer w20Boom Equipment Operator Labor 012 hour
Kumulus DF 5 lb
June 75HP 4WD Tractor Sprayer w20Boom Equipment Operator Labor 012 hour
Kumulus DF 10 lb
July 75HP 4WD Tractor Sprayer w20Boom Equipment Operator Labor 012 hour
Kumulus DF 5 lb
Aug 75HP 4WD Tractor Sprayer w20Boom Equipment Operator Labor 012 hour
Kumulus DF 5 lb
Sept 75HP 4WD Tractor Sprayer w20Boom Equipment Operator Labor 012 hour
Kumulus DF 5 lb
Oct 75HP 4WD Tractor Sprayer w20Boom Equipment Operator Labor 012 hour
Kumulus DF 5 lb
Insect LBAM (Entrust) May 75HP 4WD Tractor Sprayer w20Boom Equipment Operator Labor 012 hour
Entrust 25 oz
June 75HP 4WD Tractor Sprayer w20Boom Equipment Operator Labor 012 hour
Entrust 25 oz
Sept 75HP 4WD Tractor Sprayer w20Boom Equipment Operator Labor 012 hour
Entrust 25 oz
Worms (Dipel) May 75HP 4WD Tractor Sprayer w20Boom Equipment Operator Labor 012 hour
Dipel DF (Bt) 2 lb
June 75HP 4WD Tractor Sprayer w20Boom Equipment Operator Labor 012 hour
Dipel DF (Bt) 2 lb
Post Harvest Cleanup Oct 55HP 2WD Tractor Mower 4 Non-Machine Labor 95 hours
Oct Truck 1 Ton 1 Non-Machine Labor 6 hours
DumpFee Monterey 600 lb
Oct 90HP 4WD Tractor Disc-Offset 14 Non-Machine Labor 9 hours
Pickup Business Use Oct Pickup Truck 12 T Equipment Operator Labor 205 hours
ATV Oct ATV 4WD Equipment Operator Labor 071 hour
Harvest Regular amp Peak Apr Harvest Labor 7589 hours
8 Clamshell +Tray 2125 each
May Harvest Labor 11775 hours
8 Clamshell +Tray 510 each
June Harvest Labor 21766 hours
8 Clamshell +Tray 106250 each
2014 Strawberries Organic Costs and Returns Study Central Coast UC Cooperative Extension 23
UC COOPERATIVE EXTENSION CENTRAL COAST - 2014 Table 7 CONTINUED
Operation Labor Type Rate Operation Month Tractor Implement Material acre Unit
Harvest Regular amp Peak July Harvest Labor 21766 hours 8 Clamshell +Tray 106250 each
Aug Harvest Labor 15671 hours 8 Clamshell +Tray 765 each
Sept Harvest Labor 11775 hours 8 Clamshell +Tray 510 each
Oct Truck 1 Ton 1 Harvest Labor 4551 hours 8 Clamshell +Tray 1275 each
Harvest Load amp Haul Apr Truck 1 Ton 1 Non-Machine Labor 157 hours May Truck 1 Ton 2 Non-Machine Labor 227 hours June Truck 1 Ton 1 Non-Machine Labor 337 hours July Truck 1 Ton 2 Non-Machine Labor 337 hours Aug Truck 1 Ton 1 Non-Machine Labor 283 hours Sept Truck 1 Ton 2 Non-Machine Labor 227 hours Oct Truck 1 Ton 1 Non-Machine Labor 094 hour
Harvest Cooler Apr Cooler 2125 tray May Cooler 510 tray June Equipment Operator Labor 532 hours
Cooler 106250 tray July Cooler 106250 tray Aug Cooler 765 tray Sept Cooler 510 tray Oct Cooler 1275 tray
Assessment Apr Strawberry Commiss 2125 tray May Strawberry Commiss 510 tray June Strawberry Commiss 106250 tray July Strawberry Commiss 106250 tray Aug Strawberry Commiss 765 tray Sept Strawberry Commiss 510 tray Oct Strawberry Commiss 1275 tray
Sales Apr Sales Commission 8 2125 tray May Sales Commission 8 510 tray June Sales Commission 8 106250 tray July Sales Commission 8 106250 tray Aug Sales Commission 8 765 tray Sept Sales Commission 8 510 tray Oct Sales Commission 8 1275 tray
2014 Strawberries Organic Costs and Returns Study Central Coast UC Cooperative Extension 24
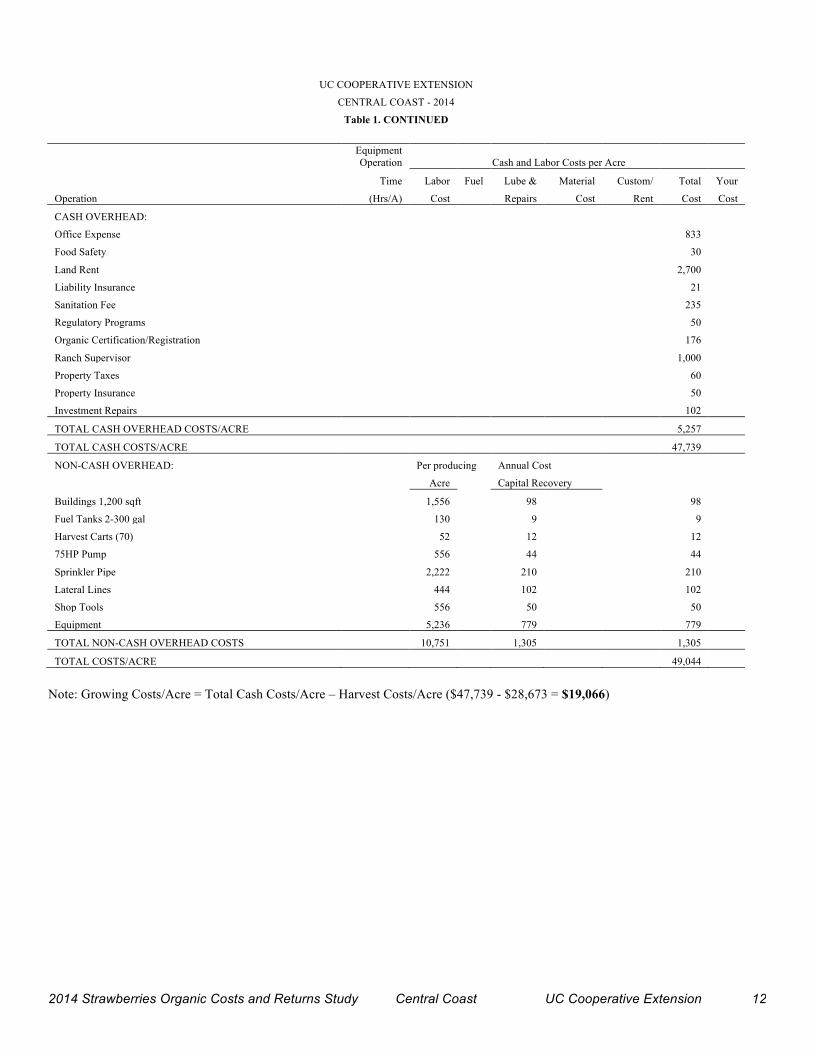
UC COOPERATIVE EXTENSION
CENTRAL COAST - 2014
Table 1 CONTINUED
Equipment Operation Cash and Labor Costs per Acre
Time Labor Fuel Lube amp Material Custom Total Your
Operation (HrsA) Cost Repairs Cost Rent Cost Cost
CASH OVERHEAD
Office Expense 833
Food Safety 30
Land Rent 2700
Liability Insurance 21
Sanitation Fee 235
Regulatory Programs 50
Organic CertificationRegistration 176
Ranch Supervisor 1000
Property Taxes 60
Property Insurance 50
Investment Repairs 102
TOTAL CASH OVERHEAD COSTSACRE 5257
TOTAL CASH COSTSACRE 47739
NON-CASH OVERHEAD Per producing Annual Cost
Acre Capital Recovery
Buildings 1200 sqft 1556 98 98
Fuel Tanks 2-300 gal 130 9 9
Harvest Carts (70) 52 12 12
75HP Pump 556 44 44
Sprinkler Pipe 2222 210 210
Lateral Lines 444 102 102
Shop Tools 556 50 50
Equipment 5236 779 779
TOTAL NON-CASH OVERHEAD COSTS 10751 1305 1305
TOTAL COSTSACRE 49044
Note Growing CostsAcre = Total Cash CostsAcre ndash Harvest CostsAcre ($47739 - $28673 = $19066)
2014 Strawberries Organic Costs and Returns Study Central Coast UC Cooperative Extension 12
UC COOPERATIVE EXTENSION CENTRAL COAST - 2014
Table 2 COSTS AND RETURNS PER ACRE TO PRODUCE ORGANIC STRAWBERRIES
Quantity Price or Value or Your Acre Unit CostUnit CostAcre Cost
GROSS RETURNS Organic 425000 tray 1500 63750
TOTAL GROSS RETURNS 425000 tray 63750 OPERATING COSTS Insecticide 1285 Persimilis (Predatory Mites) 8000 thou 1100 880 Entrust 750 oz 4421 332 Dipel DF (Bt) 400 lb 1838 74
Fungicide 75 Kumulus DF 4500 lb 167 75
Fertilizer 1775 Compost 500 ton 5500 275 Blood Meal 50000 lb 160 800 Gypsum 200 ton 4000 80 Biomin Calcium 800 gal 1802 144 Maxi-Crop 2000 lb 1132 226 Agrothrive LF 7000 gal 357 250
Custom 6 Soil Analysis (2 per 27 acres) 004 farm 15000 6
Materials 7506 T-Tape 2178000 feet 001 240 Black Plastic Mulch 275 rolls 13200 363 8 Clamshell +Tray 425000 each 162 6885 Disposal Site Fees 60000 lb 003 18
Water 596 Water - Pumped 2650 acin 2250 596
Plants 2744 Strawberry Plants 2286900 each 012 2744
Contract 3124 Spread CompostBlood Meal 200 acre 1200 24 Pest Control Adviser (PCA) 100 acre 12500 125 Cooler 425000 tray 070 2975
AssessmentsSales Commission 5270 CSC Assessment 425000 tray 004 170 Sales Commission 8 425000 tray 120 5100
Labor 17964 Equipment Operator Labor 11746 hrs 1910 2244 Non-Machine Labor 31999 hrs 1237 3958 Irrigation Labor 245 hrs 1237 30 Harvest Labor (Regular amp Peak) 94841 hrs 1237 11732
Machinery 1427 Fuel-Gas 7014 gal 393 276 Fuel-Diesel 14540 gal 356 518 Lube 119 Machinery Repair 515
Interest on Operating Capital (575) 710 TOTAL OPERATING COSTSACRE 42482 NET RETURNS ABOVE OPERATING COSTS 21268
Peak Harvest Labor HoursAcre are the equivalent of hourly wage plus piece rate
2014 Strawberries Organic Costs and Returns Study Central Coast UC Cooperative Extension 13
13
UC COOPERATIVE EXTENSION
CENTRAL COAST - 2014
Table 2 CONTINUED
Quantity Price or Value or Your
Acre Unit CostUnit CostAcre Cost
CASH OVERHEAD COSTS
Office Expense 833
Food Safety 30
Land Rent 2700
Liability Insurance 21
Sanitation Fee 235
Regulatory Programs 50
Organic CertificationRegistration 176
Ranch Supervisor 1000
Property Taxes 60
Property Insurance 50
Investment Repairs 102
TOTAL CASH OVERHEAD COSTSACRE 5257
TOTAL CASH COSTSACRE 47739
NET RETURNS ABOVE CASH COSTS 16011
NON-CASH OVERHEAD COSTS (Capital Recovery)
Buildings 1200 sqft 98
Fuel Tanks 2-300 gal 9
Harvest Carts 12
75HP Pump 44
Sprinkler Pipe 210
Lateral Lines 102
Shop Tools 50
Equipment 779
TOTAL NON-CASH OVERHEAD COSTSACRE 1305
TOTAL COSTACRE 49044
TOTAL COST TRAY 1154
NET RETURNS ABOVE TOTAL COST 14706
2014 Strawberries Organic Costs and Returns Study Central Coast UC Cooperative Extension 14
UC COOPERATIVE EXTENSION CENTRAL COAST - 2014
Table 3 MONTHLY CASH COSTS PER ACRE TO PRODUCE ORGANIC STRAWBERRIES
Beginning 09-13 Ending 10-14
SEP 13
OCT 13
NOV 13
DEC 13
JAN 14
FEB 14
MAR 14
APR 14
MAY 14
JUN 14
JUL 14
AUG 14
SEP 14
OCT 14
TOTAL
Cultural Soil Samples (2 per 27 Acre Farm) Disk 2X (Cover Crop) Compost + Spread Sprinklers Setup and Removal Irrigate Sprinkler Subsoil 5X
6 23
287 74 39 85
74 64
6 23
287 147 103
85 Level (Triplane) Disk 4X
47 47
47 47
Chisel 2X 24 24 Blood Meal + Gypsum Spread Beds ListShape Beds Re-ListRe-Shape (Post irrigation) Install Drip System Tape amp Laterals Plant Lay Mulch Plant Punch Planting Holes Plant Strawberries (Includes 5 Replant) Weed Hand Insect Mites (Predatory) Weed Cultivate
892 45 45
365 419
28 3394
247 247 247 465
11
247 465
11
247
11
247 247 247 247 247
892 45 45
365 419
28 3394 2474
929 32
Fertilize Foliar (Biomin) Fertilize Foliar (Maxi Crop) Vertebrate Trapping Pest Control Adviser (PCA) Irrigate Drip Fertilize Soil (Agrothrive) Insect Vacuum Lygus 8Xmonth Disease Powdery Mildew (Kumulus) Insect LBAM (Entrust) Worms (Dipel) Post Harvest Cleanup Pickup Business Use ATV
125
22 32
5
22 32
5
98 41
17
22 32
5
98 41
157 17
22 32
5
98 41
157 13
115 41
22 32
5
98 41
157 21
115 41
22 32
98 41
157 13
22 32
98 41
157 13
22 32
98 41
157 13
115
157 13
423 62 16
177 260
25 125 688 287
1101 117 344
82 423
62 16
TOTAL Cultural COSTS 631 5450 247 247 782 938 631 772 780 611 611 726 671 13099
2014 Strawberries Organic Costs and Returns Study Central Coast UC Cooperative Extension 15
UC COOPERATIVE EXTENSION
CENTRAL COAST - 2014
Table 3 CONTINUED
Beginning 09-13 SEP OCT NOV DEC JAN FEB MAR APR MAY JUN JUL AUG SEP OCT TOTAL
Ending 10-14 13 13 13 13 14 14 14 14 14 14 14 14 14 14
Harvest
Harvest Regular and Peak Production 1279 2283 4414 4414 3178 2283 767 18617
Harvest Load amp Haul 105 211 455 455 327 210 48 1812
Harvest Cooler 149 357 744 744 536 357 89 2975
CSC Assessment 9 20 43 43 31 20 5 170
SalesMarketing 255 612 1275 1275 918 612 153 5100
TOTAL Harvest COSTS 0 0 0 0 0 0 1796 3483 6930 6930 4989 3482 1062 28673
Interest on Operating Capital (575) 3 29 29 30 32 35 40 51 72 109 145 172 -28 -8 710
TOTAL OPERATING COSTSACRE 634 5479 29 278 279 818 978 2479 4327 7819 7686 5772 4179 1725 42482
CASH OVERHEAD
Office Expense 60 60 60 60 60 60 60 60 60 60 60 60 60 60 833
Food Safety 30 30
Land Rent 2700 2700
Liability Insurance 21 21
Sanitation Fee 235 235
Regulatory Programs 50 50
Organic CertificationRegistration 176 176
Ranch Supervisor 71 71 71 71 71 71 71 71 71 71 71 71 71 71 1000
Property Taxes 30 30 60
Property Insurance 25 25 50
Investment Repairs 7 7 7 7 7 7 7 7 7 7 7 7 7 7 102
TOTAL CASH OVERHEAD COSTS 138 138 138 168 3119 188 138 198 138 163 138 138 138 314 5257
TOTAL CASH COSTSACRE 772 5618 167 446 3398 1006 1116 2677 4465 7982 7824 5911 4318 2039 47739
2014 Strawberries Organic Costs and Returns Study Central Coast UC Cooperative Extension 16
UC COOPERATIVE EXTENSION CENTRAL COAST - 2014
Table 4 RANGING ANALYSIS
COST PER ACRE AT VARYING YIELDS TO PRODUCE ORGANIC STRAWBERRIES
YIELD (traysacre) 3500 3750 4000 4250 4500 4750 5000
OPERATING COSTS Cultural 13099 13099 13099 13099 13099 13099 13099 Harvest 24863 26133 27403 28673 29944 31214 32484
Interest on operating capital 575 674 686 698 710 722 734 746 TOTAL OPERATING COSTSACRE 38636 39918 41200 42482 43764 45047 46329
Total Operating Coststray 1104 1064 1030 1000 973 948 927 CASH OVERHEAD COSTSACRE 5257 5257 5257 5257 5257 5257 5257 TOTAL CASH COSTSACRE 43892 45174 46457 47739 49021 50303 51585 Total Cash Coststray 1254 1205 1161 1123 1089 1059 1032 NON-CASH OVERHEAD COSTSACRE 1305 1305 1305 1305 1305 1305 1305 TOTAL COSTSACRE 45197 46479 47762 49044 50326 51608 52890 Total Coststray 1291 1239 1194 1154 1118 1086 1058
NET RETURNS PER ACRE ABOVE OPERATING COSTS
YIELD (trayacre) PRICE($tray) 3500 3750 4000 4250 4500 4750 5000
1050 -1886 -543 800 2143 3486 4828 6171 1200 3364 5082 6800 8518 10236 11953 13671 1350 8614 10707 12800 14893 16986 19078 21171 1500 13864 16332 18800 21268 23736 26203 28671 1650 19114 21957 24800 27643 30486 33328 36171 1800 24364 27582 30800 34018 37236 40453 43671 1950 29614 33207 36800 40393 43986 47578 51171
NET RETURNS PER ACRE ABOVE CASH COSTS
YIELD (trayacre) PRICE($tray) 3500 3750 4000 4250 4500 4750 5000
1050 -7142 -5799 -4457 -3114 -1771 -428 915 1200 -1892 -174 1543 3261 4979 6697 8415 1350 3358 5451 7543 9636 11729 13822 15915 1500 8608 11076 13543 16011 18479 20947 23415 1650 13858 16701 19543 22386 25229 28072 30915 1800 19108 22326 25543 28761 31979 35197 38415 1950 24358 27951 31543 35136 38729 42322 45915
NET RETURNS PER ACRE ABOVE TOTAL COSTS
YIELD (trayacre) PRICE($tray) 3500 3750 4000 4250 4500 4750 5000
1050 -8447 -7104 -5762 -4419 -3076 -1733 -390 1200 -3197 -1479 238 1956 3674 5392 7110 1350 2053 4146 6238 8331 10424 12517 14610 1500 7303 9771 12238 14706 17174 19642 22110 1650 12553 15396 18238 21081 23924 26767 29610 1800 17803 21021 24238 27456 30674 33892 37110 1950 23053 26646 30238 33831 37424 41017 44610
2014 Strawberries Organic Costs and Returns Study Central Coast UC Cooperative Extension 17
UC COOPERATIVE EXTENSION CENTRAL COAST - 2014
Table 5 WHOLE FARM ANNUAL EQUIPMENT INVESTMENT AND BUSINESS OVERHEAD COSTS
ANNUAL EQUIPMENT COSTS
Cash Overhead Yrs Salvage Capital Insur-
Yr Description Price Life Value Recovery ance Taxes Total 14 55HP 2WD Tractor 32269 10 9532 3362 173 209 3744 14 75HP 4WD Tractor 45000 20 5774 3355 210 254 3820 14 90HP 4WD Tractor 47000 20 6031 3505 220 265 3990 14 ATV 4WD 7430 7 2818 924 42 51 1017 14 Blade Rear 3 pt 8 1560 20 81 120 7 8 135 14 Cultivator 3R 12 5000 20 261 385 22 26 433 14 Disc-Offset 14 16000 20 834 1231 70 84 1385 14 Drip Machine 1-48R 3500 15 336 316 16 19 351 14 ListerShaper 3-48R 5000 15 480 451 23 27 501 14 Mulch Machine 1-48R 3000 20 156 231 13 16 260 14 Pickup Truck 12 T 28000 5 12549 4140 168 203 4511 14 Punch Machine 1-48R 5000 20 261 385 22 26 433 14 Ripper-5 Shank 18 10800 20 563 831 47 57 935 14 Sprayer w20Boom 3700 5 1205 630 20 25 674 14 Trailer-Pipe 1950 20 102 150 9 10 169 14 Triplane 15 22200 20 1157 1708 97 117 1921 14 Truck 1 Ton 1 36000 5 16134 5323 216 261 5800 14 Mower 4 3500 20 182 269 15 18 303 14 Bug Vacuum 35000 2 16448 10723 213 257 11194 14 Chisel 12 12000 20 625 923 52 63 1039 14 Truck 1 Ton 2 36000 5 16134 5323 216 261 5800 TOTAL 359909 91664 44284 1872 2258 48414
60 of new cost 215945 54998 26570 1123 1355 29048 Used to reflect a mix of new and used equipment
ANNUAL INVESTMENT COSTS
Cash Overhead
Description Price Yrs Life
Salvage Value
Capital Recovery
Insur-ance Taxes Repairs Total
INVESTMENT Buildings 1200 sqft Fuel Tanks 2-300 gal Harvest Carts (70) 75HP Pump Filter Sprinkler Pipe Lateral Lines Shop Tools
42000 3500 1400
15000 60000 12000 15000
30 20
5 20 15
5 15
0 650
0 0 0 0
1500
2655 255 321
1178 5683 2753 1350
174 17
6 62
249 50 68
210 21
7 75
300 60 83
840 70 22
100 1200
220 300
3879 363 356
1415 7432 3082 1801
TOTAL INVESTMENT 148900 2150 14195 626 755 2752 18328
ANNUAL BUSINESS OVERHEAD COSTS
Units Price Total Description Farm Unit Unit Cost
Office Expense 30 acre 75000 22250 Food Safety 27 acre 3000 810 Land Rent 30 acre 270000 81000 Liability Insurance 30 acre 2090 627 Sanitation Fee 27 acre 23481 6340 Regulatory Programs 27 acre 5000 1350 Organic CertRegistration 27 acre 17600 4752 Ranch Supervisor 30 acre 100000 30000
2014 Strawberries Organic Costs and Returns Study Central Coast UC Cooperative Extension 18
UC COOPERATIVE EXTENSION
CENTRAL COAST - 2014
Table 6 HOURLY EQUIPMENT COSTS
COSTS PER HOUR
Strawberry Total Cash Overhead Operating
Hours Hours Capital Insur- Lube amp Fuel Total Total Yr Description Used Used Recovery ance Taxes Repairs Oper CostsHr
14 55HP 2WD Tractor 961 1200 168 009 010 294 962 1256 1443
14 75HP 4WD Tractor 128 600 336 021 025 389 1311 1700 2082
14 90HP 4WD Tractor 194 800 263 016 020 351 1573 1924 2223
14 ATV 4WD 16 285 194 009 011 094 262 356 570
14 Blade Rear 3 pt 8 28 100 072 004 005 000 000 000 081
14 Cultivator 3R 12 20 100 231 013 016 099 000 099 358
14 Disc-Offset 14 47 100 739 042 051 247 000 247 1078
14 Drip Machine 1-48R 55 100 189 010 012 092 000 092 303
14 ListerShaper 3-48R 54 133 203 010 012 101 000 101 327
14 Mulch Machine 1-48R 41 100 138 008 009 033 000 033 189
14 Pickup Truck 12 T 46 400 621 025 030 356 983 1339 2015
14 Punch Machine 1-48R 20 100 231 013 016 055 000 055 315
14 Ripper-5 Shank 18 49 125 399 023 027 340 000 340 788
14 Sprayer w20Boom 82 300 126 004 005 101 000 101 236
14 Trailer-Pipe 89 200 045 003 003 000 000 000 051
14 Triplane 15 27 150 683 039 047 330 000 330 1099
14 Truck 1 Ton 1 760 760 420 017 021 261 491 752 1210
14 Mower 4 10 100 162 009 011 157 000 157 338
14 Bug Vacuum 641 750 858 017 021 968 000 968 1864
14 Chisel 12 15 75 739 042 051 219 000 219 1049
14 Truck 1 Ton 2 654 654 488 020 024 291 491 782 1314
2014 Strawberries Organic Costs and Returns Study Central Coast UC Cooperative Extension 19
UC COOPERATIVE EXTENSION
CENTRAL COAST - 2014
Table 7 OPERATIONS WITH EQUIPMENT AND MATERIALS
Operation Labor Type Rate
Operation Month Tractor Implement Material acre Unit
Soil Samples (2 per 27 acres) Sept Soil Analysis 004 farm
Disk 2X (Cover Crop) Sept 90HP 4WD Tractor Disc-Offset 14 Equipment Operator Labor 06 hour
Compost + Spread Sept Compost 5 ton
Spread CompostMeal 1 acre
Sprinklers Setup amp Removal Sept 55HP 2WD Tractor Trailer-Pipe Non-Machine Labor 15 hours
Oct 55HP 2WD Tractor Trailer-Pipe Non-Machine Labor 15 hours
Irrigate OH Sprinkle Sept Irrigation Labor 13 hours
Water Pumped 1 acin
Oct Irrigation Labor 115 hours
Water Pumped 05 acin
Oct Non-Machine Labor 13 hours
Water Pumped 1 acin
Subsoil 5X Sept 90HP 4WD Tractor Ripper-5 Shank 18 Equipment Operator Labor 216 hours
Level (Triplane) Sept 90HP 4WD Tractor Triplane 15 Equipment Operator Labor 12 hours
Disk 4X Sept 90HP 4WD Tractor Disc-Offset 14 Equipment Operator Labor 12 hours
Chisel 2X Sept 75HP 4WD Tractor Chisel 12 Equipment Operator Labor 065 hour
Bloodmeal amp Gypsum + Spread Oct Bloodmeal 500 lb
Spread CompostMeal 1 acre
Gypsum 2 ton
Beds ListShape Oct 90HP 4WD Tractor LstrShpr 3-48R Equipment Operator Labor 12 hours
Beds Re-ListedRe-Shaped Oct 90HP 4WD Tractor LstrShpr 3-48R Equipment Operator Labor 12 hours
Install Drip System Tape Later Oct 55HP 2WD Tractor Drip Mchne 1-48R Non-Machine Labor 1 hour
T-Tape 2178000 foot
Oct 55HP 2WD Tractor Blade Rear 3 pt 8 Non-Machine Labor 01 hour
Plant Lay Mulch Oct 55HP 2WD Tractor Mulch Mchne 1-48R Equipment Operator Labor 18 hours
BlackPlasticMulch 275 roll
Plant Punch Planting Holes Oct 55HP 2WD Tractor Punch Mchn 1-48R Equipment Operator Labor 09 hour
Plant Strawberries (5 replant) Oct Non-Machine Labor 525 hours
Strawberry Plants 2286900 each
Weed Hand Dec Non-Machine Labor 20 hours
Jan Non-Machine Labor 20 hours
Feb Non-Machine Labor 20 hours
Mar Non-Machine Labor 20 hours
Apr Non-Machine Labor 20 hours
May Non-Machine Labor 20 hours
June Non-Machine Labor 20 hours
July Non-Machine Labor 20 hours
Aug Non-Machine Labor 20 hours
Sept Non-Machine Labor 20 hours
2014 Strawberries Organic Costs and Returns Study Central Coast UC Cooperative Extension 20
UC COOPERATIVE EXTENSION
CENTRAL COAST - 2014
Table 7 CONTINUED
Operation Labor Type Rate
Operation Month Tractor Implement Material acre Unit
Insect Mites (predatory) Feb Non-Machine Labor 2 hours
Persimilis (Mite) 40 thou
Mar Non-Machine Labor 2 hours
Persimilis (Mite) 40 thou
Weed Cultivate Feb 75HP 4WD Tractor Cultivator 3R 12 Equipment Operator Labor 03 hour
Mar 75HP 4WD Tractor Cultivator 3R 12 Equipment Operator Labor 03 hour
Apr 75HP 4WD Tractor Cultivator 3R 12 Equipment Operator Labor 03 hour
Fertilize Foliar (Biomin) Feb 75HP 4WD Tractor Sprayer w20Boom Equipment Operator Labor 012 hour
Biomin Calcium 1 gal
Mar 75HP 4WD Tractor Sprayer w20Boom Equipment Operator Labor 012 hour
Biomin Calcium 1 gal
Apr 75HP 4WD Tractor Sprayer w20Boom Equipment Operator Labor 012 hour
Biomin Calcium 1 gal
May 75HP 4WD Tractor Sprayer w20Boom Equipment Operator Labor 012 hour
Biomin Calcium 1 gal
June 75HP 4WD Tractor Sprayer w20Boom Equipment Operator Labor 012 hour
Biomin Calcium 1 gal
July 75HP 4WD Tractor Sprayer w20Boom Equipment Operator Labor 012 hour
Biomin Calcium 1 gal
Aug 75HP 4WD Tractor Sprayer w20Boom Equipment Operator Labor 012 hour
Biomin Calcium 1 gal
Sept 75HP 4WD Tractor Sprayer w20Boom Equipment Operator Labor 012 hour
Biomin Calcium 1 gal
Fertilize Foliar (Maxi) Feb 75HP 4WD Tractor Sprayer w20Boom Equipment Operator Labor 012 hour
Maxi-Crop 25 lb
Mar 75HP 4WD Tractor Sprayer w20Boom Equipment Operator Labor 012 hour
Maxi-Crop 25 lb
Apr 75HP 4WD Tractor Sprayer w20Boom Equipment Operator Labor 012 hour
Maxi-Crop 25 lb
May 75HP 4WD Tractor Sprayer w20Boom Equipment Operator Labor 012 hour
Maxi-Crop 25 lb
June 75HP 4WD Tractor Sprayer w20Boom Equipment Operator Labor 012 hour
Maxi-Crop 25 lb
July 75HP 4WD Tractor Sprayer w20Boom Equipment Operator Labor 012 hour
Maxi-Crop 25 lb
Aug 75HP 4WD Tractor Sprayer w20Boom Equipment Operator Labor 012 hour
Maxi-Crop 25 lb
Sept 75HP 4WD Tractor Sprayer w20Boom Equipment Operator Labor 012 hour
Maxi-Crop 25 lb
2014 Strawberries Organic Costs and Returns Study Central Coast UC Cooperative Extension 21
UC COOPERATIVE EXTENSION
CENTRAL COAST - 2014
Table 7 CONTINUED
Operation Labor Type Rate
Operation Month Tractor Implement Material acre Unit
Vertebrate Trapping Feb Non-Machine Labor 04 hour
Mar Non-Machine Labor 04 hour
Apr Non-Machine Labor 04 hour
May Non-Machine Labor 04 hour
June Non-Machine Labor 04 hour
Pest Control Adviser (PCA) Mar PCA fee 1 acre
Irrigate Drip Mar Non-Machine Labor 171 hours
Water Pumped 343 acin
Apr Non-Machine Labor 171 hours
Water Pumped 343 acin
May Non-Machine Labor 171 hours
Water Pumped 343 acin
June Non-Machine Labor 171 hours
Water Pumped 343 acin
July Non-Machine Labor 171 hours
Water Pumped 343 acin
Aug Non-Machine Labor 171 hours
Water Pumped 343 acin
Sept Non-Machine Labor 171 hours
Water Pumped 342 acin
Fertilize Through Drip (Agro) Mar Non-Machine Labor 043 hour
Agrothrive LF 10 gal
Apr Non-Machine Labor 043 hour
Agrothrive LF 10 gal
May Non-Machine Labor 043 hour
Agrothrive LF 10 gal
June Non-Machine Labor 043 hour
Agrothrive LF 10 gal
July Non-Machine Labor 043 hour
Agrothrive LF 10 gal
Aug Non-Machine Labor 043 hour
Agrothrive LF 10 gal
Sept Non-Machine Labor 042 hour
Agrothrive LF 10 gal
Insect Vacuum Lygus 8Xmonth Apr 55HP 2WD Tractor Bug Vacuum Equipment Operator Labor 407 hours
May 55HP 2WD Tractor Bug Vacuum Equipment Operator Labor 407 hours
June 55HP 2WD Tractor Bug Vacuum Equipment Operator Labor 407 hours
July 55HP 2WD Tractor Bug Vacuum Equipment Operator Labor 407 hours
Aug 55HP 2WD Tractor Bug Vacuum Equipment Operator Labor 407 hours
Sept 55HP 2WD Tractor Bug Vacuum Equipment Operator Labor 407 hours
Oct 55HP 2WD Tractor Bug Vacuum Equipment Operator Labor 407 hours
2014 Strawberries Organic Costs and Returns Study Central Coast UC Cooperative Extension 22
UC COOPERATIVE EXTENSION
CENTRAL COAST - 2014
Table 7 CONTINUED
Operation Labor Type Rate
Operation Month Tractor Implement Material acre Unit
Disease Powdery Mildew (Sulfur) Mar 75HP 4WD Tractor Sprayer w20Boom Equipment Operator Labor 024 hour
Kumulus DF 5 lb
Apr 75HP 4WD Tractor Sprayer w20Boom Equipment Operator Labor 024 hour
Kumulus DF 5 lb
May 75HP 4WD Tractor Sprayer w20Boom Equipment Operator Labor 012 hour
Kumulus DF 5 lb
June 75HP 4WD Tractor Sprayer w20Boom Equipment Operator Labor 012 hour
Kumulus DF 10 lb
July 75HP 4WD Tractor Sprayer w20Boom Equipment Operator Labor 012 hour
Kumulus DF 5 lb
Aug 75HP 4WD Tractor Sprayer w20Boom Equipment Operator Labor 012 hour
Kumulus DF 5 lb
Sept 75HP 4WD Tractor Sprayer w20Boom Equipment Operator Labor 012 hour
Kumulus DF 5 lb
Oct 75HP 4WD Tractor Sprayer w20Boom Equipment Operator Labor 012 hour
Kumulus DF 5 lb
Insect LBAM (Entrust) May 75HP 4WD Tractor Sprayer w20Boom Equipment Operator Labor 012 hour
Entrust 25 oz
June 75HP 4WD Tractor Sprayer w20Boom Equipment Operator Labor 012 hour
Entrust 25 oz
Sept 75HP 4WD Tractor Sprayer w20Boom Equipment Operator Labor 012 hour
Entrust 25 oz
Worms (Dipel) May 75HP 4WD Tractor Sprayer w20Boom Equipment Operator Labor 012 hour
Dipel DF (Bt) 2 lb
June 75HP 4WD Tractor Sprayer w20Boom Equipment Operator Labor 012 hour
Dipel DF (Bt) 2 lb
Post Harvest Cleanup Oct 55HP 2WD Tractor Mower 4 Non-Machine Labor 95 hours
Oct Truck 1 Ton 1 Non-Machine Labor 6 hours
DumpFee Monterey 600 lb
Oct 90HP 4WD Tractor Disc-Offset 14 Non-Machine Labor 9 hours
Pickup Business Use Oct Pickup Truck 12 T Equipment Operator Labor 205 hours
ATV Oct ATV 4WD Equipment Operator Labor 071 hour
Harvest Regular amp Peak Apr Harvest Labor 7589 hours
8 Clamshell +Tray 2125 each
May Harvest Labor 11775 hours
8 Clamshell +Tray 510 each
June Harvest Labor 21766 hours
8 Clamshell +Tray 106250 each
2014 Strawberries Organic Costs and Returns Study Central Coast UC Cooperative Extension 23
UC COOPERATIVE EXTENSION CENTRAL COAST - 2014 Table 7 CONTINUED
Operation Labor Type Rate Operation Month Tractor Implement Material acre Unit
Harvest Regular amp Peak July Harvest Labor 21766 hours 8 Clamshell +Tray 106250 each
Aug Harvest Labor 15671 hours 8 Clamshell +Tray 765 each
Sept Harvest Labor 11775 hours 8 Clamshell +Tray 510 each
Oct Truck 1 Ton 1 Harvest Labor 4551 hours 8 Clamshell +Tray 1275 each
Harvest Load amp Haul Apr Truck 1 Ton 1 Non-Machine Labor 157 hours May Truck 1 Ton 2 Non-Machine Labor 227 hours June Truck 1 Ton 1 Non-Machine Labor 337 hours July Truck 1 Ton 2 Non-Machine Labor 337 hours Aug Truck 1 Ton 1 Non-Machine Labor 283 hours Sept Truck 1 Ton 2 Non-Machine Labor 227 hours Oct Truck 1 Ton 1 Non-Machine Labor 094 hour
Harvest Cooler Apr Cooler 2125 tray May Cooler 510 tray June Equipment Operator Labor 532 hours
Cooler 106250 tray July Cooler 106250 tray Aug Cooler 765 tray Sept Cooler 510 tray Oct Cooler 1275 tray
Assessment Apr Strawberry Commiss 2125 tray May Strawberry Commiss 510 tray June Strawberry Commiss 106250 tray July Strawberry Commiss 106250 tray Aug Strawberry Commiss 765 tray Sept Strawberry Commiss 510 tray Oct Strawberry Commiss 1275 tray
Sales Apr Sales Commission 8 2125 tray May Sales Commission 8 510 tray June Sales Commission 8 106250 tray July Sales Commission 8 106250 tray Aug Sales Commission 8 765 tray Sept Sales Commission 8 510 tray Oct Sales Commission 8 1275 tray
2014 Strawberries Organic Costs and Returns Study Central Coast UC Cooperative Extension 24
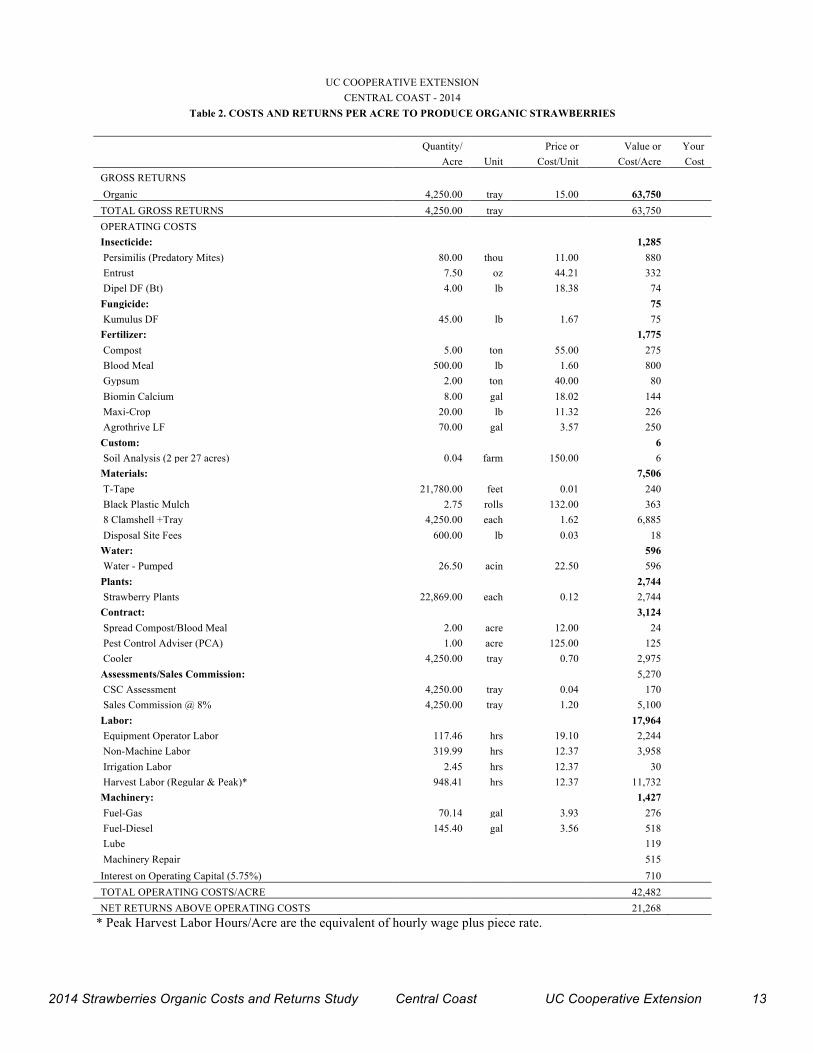
UC COOPERATIVE EXTENSION CENTRAL COAST - 2014
Table 2 COSTS AND RETURNS PER ACRE TO PRODUCE ORGANIC STRAWBERRIES
Quantity Price or Value or Your Acre Unit CostUnit CostAcre Cost
GROSS RETURNS Organic 425000 tray 1500 63750
TOTAL GROSS RETURNS 425000 tray 63750 OPERATING COSTS Insecticide 1285 Persimilis (Predatory Mites) 8000 thou 1100 880 Entrust 750 oz 4421 332 Dipel DF (Bt) 400 lb 1838 74
Fungicide 75 Kumulus DF 4500 lb 167 75
Fertilizer 1775 Compost 500 ton 5500 275 Blood Meal 50000 lb 160 800 Gypsum 200 ton 4000 80 Biomin Calcium 800 gal 1802 144 Maxi-Crop 2000 lb 1132 226 Agrothrive LF 7000 gal 357 250
Custom 6 Soil Analysis (2 per 27 acres) 004 farm 15000 6
Materials 7506 T-Tape 2178000 feet 001 240 Black Plastic Mulch 275 rolls 13200 363 8 Clamshell +Tray 425000 each 162 6885 Disposal Site Fees 60000 lb 003 18
Water 596 Water - Pumped 2650 acin 2250 596
Plants 2744 Strawberry Plants 2286900 each 012 2744
Contract 3124 Spread CompostBlood Meal 200 acre 1200 24 Pest Control Adviser (PCA) 100 acre 12500 125 Cooler 425000 tray 070 2975
AssessmentsSales Commission 5270 CSC Assessment 425000 tray 004 170 Sales Commission 8 425000 tray 120 5100
Labor 17964 Equipment Operator Labor 11746 hrs 1910 2244 Non-Machine Labor 31999 hrs 1237 3958 Irrigation Labor 245 hrs 1237 30 Harvest Labor (Regular amp Peak) 94841 hrs 1237 11732
Machinery 1427 Fuel-Gas 7014 gal 393 276 Fuel-Diesel 14540 gal 356 518 Lube 119 Machinery Repair 515
Interest on Operating Capital (575) 710 TOTAL OPERATING COSTSACRE 42482 NET RETURNS ABOVE OPERATING COSTS 21268
Peak Harvest Labor HoursAcre are the equivalent of hourly wage plus piece rate
2014 Strawberries Organic Costs and Returns Study Central Coast UC Cooperative Extension 13
13
UC COOPERATIVE EXTENSION
CENTRAL COAST - 2014
Table 2 CONTINUED
Quantity Price or Value or Your
Acre Unit CostUnit CostAcre Cost
CASH OVERHEAD COSTS
Office Expense 833
Food Safety 30
Land Rent 2700
Liability Insurance 21
Sanitation Fee 235
Regulatory Programs 50
Organic CertificationRegistration 176
Ranch Supervisor 1000
Property Taxes 60
Property Insurance 50
Investment Repairs 102
TOTAL CASH OVERHEAD COSTSACRE 5257
TOTAL CASH COSTSACRE 47739
NET RETURNS ABOVE CASH COSTS 16011
NON-CASH OVERHEAD COSTS (Capital Recovery)
Buildings 1200 sqft 98
Fuel Tanks 2-300 gal 9
Harvest Carts 12
75HP Pump 44
Sprinkler Pipe 210
Lateral Lines 102
Shop Tools 50
Equipment 779
TOTAL NON-CASH OVERHEAD COSTSACRE 1305
TOTAL COSTACRE 49044
TOTAL COST TRAY 1154
NET RETURNS ABOVE TOTAL COST 14706
2014 Strawberries Organic Costs and Returns Study Central Coast UC Cooperative Extension 14
UC COOPERATIVE EXTENSION CENTRAL COAST - 2014
Table 3 MONTHLY CASH COSTS PER ACRE TO PRODUCE ORGANIC STRAWBERRIES
Beginning 09-13 Ending 10-14
SEP 13
OCT 13
NOV 13
DEC 13
JAN 14
FEB 14
MAR 14
APR 14
MAY 14
JUN 14
JUL 14
AUG 14
SEP 14
OCT 14
TOTAL
Cultural Soil Samples (2 per 27 Acre Farm) Disk 2X (Cover Crop) Compost + Spread Sprinklers Setup and Removal Irrigate Sprinkler Subsoil 5X
6 23
287 74 39 85
74 64
6 23
287 147 103
85 Level (Triplane) Disk 4X
47 47
47 47
Chisel 2X 24 24 Blood Meal + Gypsum Spread Beds ListShape Beds Re-ListRe-Shape (Post irrigation) Install Drip System Tape amp Laterals Plant Lay Mulch Plant Punch Planting Holes Plant Strawberries (Includes 5 Replant) Weed Hand Insect Mites (Predatory) Weed Cultivate
892 45 45
365 419
28 3394
247 247 247 465
11
247 465
11
247
11
247 247 247 247 247
892 45 45
365 419
28 3394 2474
929 32
Fertilize Foliar (Biomin) Fertilize Foliar (Maxi Crop) Vertebrate Trapping Pest Control Adviser (PCA) Irrigate Drip Fertilize Soil (Agrothrive) Insect Vacuum Lygus 8Xmonth Disease Powdery Mildew (Kumulus) Insect LBAM (Entrust) Worms (Dipel) Post Harvest Cleanup Pickup Business Use ATV
125
22 32
5
22 32
5
98 41
17
22 32
5
98 41
157 17
22 32
5
98 41
157 13
115 41
22 32
5
98 41
157 21
115 41
22 32
98 41
157 13
22 32
98 41
157 13
22 32
98 41
157 13
115
157 13
423 62 16
177 260
25 125 688 287
1101 117 344
82 423
62 16
TOTAL Cultural COSTS 631 5450 247 247 782 938 631 772 780 611 611 726 671 13099
2014 Strawberries Organic Costs and Returns Study Central Coast UC Cooperative Extension 15
UC COOPERATIVE EXTENSION
CENTRAL COAST - 2014
Table 3 CONTINUED
Beginning 09-13 SEP OCT NOV DEC JAN FEB MAR APR MAY JUN JUL AUG SEP OCT TOTAL
Ending 10-14 13 13 13 13 14 14 14 14 14 14 14 14 14 14
Harvest
Harvest Regular and Peak Production 1279 2283 4414 4414 3178 2283 767 18617
Harvest Load amp Haul 105 211 455 455 327 210 48 1812
Harvest Cooler 149 357 744 744 536 357 89 2975
CSC Assessment 9 20 43 43 31 20 5 170
SalesMarketing 255 612 1275 1275 918 612 153 5100
TOTAL Harvest COSTS 0 0 0 0 0 0 1796 3483 6930 6930 4989 3482 1062 28673
Interest on Operating Capital (575) 3 29 29 30 32 35 40 51 72 109 145 172 -28 -8 710
TOTAL OPERATING COSTSACRE 634 5479 29 278 279 818 978 2479 4327 7819 7686 5772 4179 1725 42482
CASH OVERHEAD
Office Expense 60 60 60 60 60 60 60 60 60 60 60 60 60 60 833
Food Safety 30 30
Land Rent 2700 2700
Liability Insurance 21 21
Sanitation Fee 235 235
Regulatory Programs 50 50
Organic CertificationRegistration 176 176
Ranch Supervisor 71 71 71 71 71 71 71 71 71 71 71 71 71 71 1000
Property Taxes 30 30 60
Property Insurance 25 25 50
Investment Repairs 7 7 7 7 7 7 7 7 7 7 7 7 7 7 102
TOTAL CASH OVERHEAD COSTS 138 138 138 168 3119 188 138 198 138 163 138 138 138 314 5257
TOTAL CASH COSTSACRE 772 5618 167 446 3398 1006 1116 2677 4465 7982 7824 5911 4318 2039 47739
2014 Strawberries Organic Costs and Returns Study Central Coast UC Cooperative Extension 16
UC COOPERATIVE EXTENSION CENTRAL COAST - 2014
Table 4 RANGING ANALYSIS
COST PER ACRE AT VARYING YIELDS TO PRODUCE ORGANIC STRAWBERRIES
YIELD (traysacre) 3500 3750 4000 4250 4500 4750 5000
OPERATING COSTS Cultural 13099 13099 13099 13099 13099 13099 13099 Harvest 24863 26133 27403 28673 29944 31214 32484
Interest on operating capital 575 674 686 698 710 722 734 746 TOTAL OPERATING COSTSACRE 38636 39918 41200 42482 43764 45047 46329
Total Operating Coststray 1104 1064 1030 1000 973 948 927 CASH OVERHEAD COSTSACRE 5257 5257 5257 5257 5257 5257 5257 TOTAL CASH COSTSACRE 43892 45174 46457 47739 49021 50303 51585 Total Cash Coststray 1254 1205 1161 1123 1089 1059 1032 NON-CASH OVERHEAD COSTSACRE 1305 1305 1305 1305 1305 1305 1305 TOTAL COSTSACRE 45197 46479 47762 49044 50326 51608 52890 Total Coststray 1291 1239 1194 1154 1118 1086 1058
NET RETURNS PER ACRE ABOVE OPERATING COSTS
YIELD (trayacre) PRICE($tray) 3500 3750 4000 4250 4500 4750 5000
1050 -1886 -543 800 2143 3486 4828 6171 1200 3364 5082 6800 8518 10236 11953 13671 1350 8614 10707 12800 14893 16986 19078 21171 1500 13864 16332 18800 21268 23736 26203 28671 1650 19114 21957 24800 27643 30486 33328 36171 1800 24364 27582 30800 34018 37236 40453 43671 1950 29614 33207 36800 40393 43986 47578 51171
NET RETURNS PER ACRE ABOVE CASH COSTS
YIELD (trayacre) PRICE($tray) 3500 3750 4000 4250 4500 4750 5000
1050 -7142 -5799 -4457 -3114 -1771 -428 915 1200 -1892 -174 1543 3261 4979 6697 8415 1350 3358 5451 7543 9636 11729 13822 15915 1500 8608 11076 13543 16011 18479 20947 23415 1650 13858 16701 19543 22386 25229 28072 30915 1800 19108 22326 25543 28761 31979 35197 38415 1950 24358 27951 31543 35136 38729 42322 45915
NET RETURNS PER ACRE ABOVE TOTAL COSTS
YIELD (trayacre) PRICE($tray) 3500 3750 4000 4250 4500 4750 5000
1050 -8447 -7104 -5762 -4419 -3076 -1733 -390 1200 -3197 -1479 238 1956 3674 5392 7110 1350 2053 4146 6238 8331 10424 12517 14610 1500 7303 9771 12238 14706 17174 19642 22110 1650 12553 15396 18238 21081 23924 26767 29610 1800 17803 21021 24238 27456 30674 33892 37110 1950 23053 26646 30238 33831 37424 41017 44610
2014 Strawberries Organic Costs and Returns Study Central Coast UC Cooperative Extension 17
UC COOPERATIVE EXTENSION CENTRAL COAST - 2014
Table 5 WHOLE FARM ANNUAL EQUIPMENT INVESTMENT AND BUSINESS OVERHEAD COSTS
ANNUAL EQUIPMENT COSTS
Cash Overhead Yrs Salvage Capital Insur-
Yr Description Price Life Value Recovery ance Taxes Total 14 55HP 2WD Tractor 32269 10 9532 3362 173 209 3744 14 75HP 4WD Tractor 45000 20 5774 3355 210 254 3820 14 90HP 4WD Tractor 47000 20 6031 3505 220 265 3990 14 ATV 4WD 7430 7 2818 924 42 51 1017 14 Blade Rear 3 pt 8 1560 20 81 120 7 8 135 14 Cultivator 3R 12 5000 20 261 385 22 26 433 14 Disc-Offset 14 16000 20 834 1231 70 84 1385 14 Drip Machine 1-48R 3500 15 336 316 16 19 351 14 ListerShaper 3-48R 5000 15 480 451 23 27 501 14 Mulch Machine 1-48R 3000 20 156 231 13 16 260 14 Pickup Truck 12 T 28000 5 12549 4140 168 203 4511 14 Punch Machine 1-48R 5000 20 261 385 22 26 433 14 Ripper-5 Shank 18 10800 20 563 831 47 57 935 14 Sprayer w20Boom 3700 5 1205 630 20 25 674 14 Trailer-Pipe 1950 20 102 150 9 10 169 14 Triplane 15 22200 20 1157 1708 97 117 1921 14 Truck 1 Ton 1 36000 5 16134 5323 216 261 5800 14 Mower 4 3500 20 182 269 15 18 303 14 Bug Vacuum 35000 2 16448 10723 213 257 11194 14 Chisel 12 12000 20 625 923 52 63 1039 14 Truck 1 Ton 2 36000 5 16134 5323 216 261 5800 TOTAL 359909 91664 44284 1872 2258 48414
60 of new cost 215945 54998 26570 1123 1355 29048 Used to reflect a mix of new and used equipment
ANNUAL INVESTMENT COSTS
Cash Overhead
Description Price Yrs Life
Salvage Value
Capital Recovery
Insur-ance Taxes Repairs Total
INVESTMENT Buildings 1200 sqft Fuel Tanks 2-300 gal Harvest Carts (70) 75HP Pump Filter Sprinkler Pipe Lateral Lines Shop Tools
42000 3500 1400
15000 60000 12000 15000
30 20
5 20 15
5 15
0 650
0 0 0 0
1500
2655 255 321
1178 5683 2753 1350
174 17
6 62
249 50 68
210 21
7 75
300 60 83
840 70 22
100 1200
220 300
3879 363 356
1415 7432 3082 1801
TOTAL INVESTMENT 148900 2150 14195 626 755 2752 18328
ANNUAL BUSINESS OVERHEAD COSTS
Units Price Total Description Farm Unit Unit Cost
Office Expense 30 acre 75000 22250 Food Safety 27 acre 3000 810 Land Rent 30 acre 270000 81000 Liability Insurance 30 acre 2090 627 Sanitation Fee 27 acre 23481 6340 Regulatory Programs 27 acre 5000 1350 Organic CertRegistration 27 acre 17600 4752 Ranch Supervisor 30 acre 100000 30000
2014 Strawberries Organic Costs and Returns Study Central Coast UC Cooperative Extension 18
UC COOPERATIVE EXTENSION
CENTRAL COAST - 2014
Table 6 HOURLY EQUIPMENT COSTS
COSTS PER HOUR
Strawberry Total Cash Overhead Operating
Hours Hours Capital Insur- Lube amp Fuel Total Total Yr Description Used Used Recovery ance Taxes Repairs Oper CostsHr
14 55HP 2WD Tractor 961 1200 168 009 010 294 962 1256 1443
14 75HP 4WD Tractor 128 600 336 021 025 389 1311 1700 2082
14 90HP 4WD Tractor 194 800 263 016 020 351 1573 1924 2223
14 ATV 4WD 16 285 194 009 011 094 262 356 570
14 Blade Rear 3 pt 8 28 100 072 004 005 000 000 000 081
14 Cultivator 3R 12 20 100 231 013 016 099 000 099 358
14 Disc-Offset 14 47 100 739 042 051 247 000 247 1078
14 Drip Machine 1-48R 55 100 189 010 012 092 000 092 303
14 ListerShaper 3-48R 54 133 203 010 012 101 000 101 327
14 Mulch Machine 1-48R 41 100 138 008 009 033 000 033 189
14 Pickup Truck 12 T 46 400 621 025 030 356 983 1339 2015
14 Punch Machine 1-48R 20 100 231 013 016 055 000 055 315
14 Ripper-5 Shank 18 49 125 399 023 027 340 000 340 788
14 Sprayer w20Boom 82 300 126 004 005 101 000 101 236
14 Trailer-Pipe 89 200 045 003 003 000 000 000 051
14 Triplane 15 27 150 683 039 047 330 000 330 1099
14 Truck 1 Ton 1 760 760 420 017 021 261 491 752 1210
14 Mower 4 10 100 162 009 011 157 000 157 338
14 Bug Vacuum 641 750 858 017 021 968 000 968 1864
14 Chisel 12 15 75 739 042 051 219 000 219 1049
14 Truck 1 Ton 2 654 654 488 020 024 291 491 782 1314
2014 Strawberries Organic Costs and Returns Study Central Coast UC Cooperative Extension 19
UC COOPERATIVE EXTENSION
CENTRAL COAST - 2014
Table 7 OPERATIONS WITH EQUIPMENT AND MATERIALS
Operation Labor Type Rate
Operation Month Tractor Implement Material acre Unit
Soil Samples (2 per 27 acres) Sept Soil Analysis 004 farm
Disk 2X (Cover Crop) Sept 90HP 4WD Tractor Disc-Offset 14 Equipment Operator Labor 06 hour
Compost + Spread Sept Compost 5 ton
Spread CompostMeal 1 acre
Sprinklers Setup amp Removal Sept 55HP 2WD Tractor Trailer-Pipe Non-Machine Labor 15 hours
Oct 55HP 2WD Tractor Trailer-Pipe Non-Machine Labor 15 hours
Irrigate OH Sprinkle Sept Irrigation Labor 13 hours
Water Pumped 1 acin
Oct Irrigation Labor 115 hours
Water Pumped 05 acin
Oct Non-Machine Labor 13 hours
Water Pumped 1 acin
Subsoil 5X Sept 90HP 4WD Tractor Ripper-5 Shank 18 Equipment Operator Labor 216 hours
Level (Triplane) Sept 90HP 4WD Tractor Triplane 15 Equipment Operator Labor 12 hours
Disk 4X Sept 90HP 4WD Tractor Disc-Offset 14 Equipment Operator Labor 12 hours
Chisel 2X Sept 75HP 4WD Tractor Chisel 12 Equipment Operator Labor 065 hour
Bloodmeal amp Gypsum + Spread Oct Bloodmeal 500 lb
Spread CompostMeal 1 acre
Gypsum 2 ton
Beds ListShape Oct 90HP 4WD Tractor LstrShpr 3-48R Equipment Operator Labor 12 hours
Beds Re-ListedRe-Shaped Oct 90HP 4WD Tractor LstrShpr 3-48R Equipment Operator Labor 12 hours
Install Drip System Tape Later Oct 55HP 2WD Tractor Drip Mchne 1-48R Non-Machine Labor 1 hour
T-Tape 2178000 foot
Oct 55HP 2WD Tractor Blade Rear 3 pt 8 Non-Machine Labor 01 hour
Plant Lay Mulch Oct 55HP 2WD Tractor Mulch Mchne 1-48R Equipment Operator Labor 18 hours
BlackPlasticMulch 275 roll
Plant Punch Planting Holes Oct 55HP 2WD Tractor Punch Mchn 1-48R Equipment Operator Labor 09 hour
Plant Strawberries (5 replant) Oct Non-Machine Labor 525 hours
Strawberry Plants 2286900 each
Weed Hand Dec Non-Machine Labor 20 hours
Jan Non-Machine Labor 20 hours
Feb Non-Machine Labor 20 hours
Mar Non-Machine Labor 20 hours
Apr Non-Machine Labor 20 hours
May Non-Machine Labor 20 hours
June Non-Machine Labor 20 hours
July Non-Machine Labor 20 hours
Aug Non-Machine Labor 20 hours
Sept Non-Machine Labor 20 hours
2014 Strawberries Organic Costs and Returns Study Central Coast UC Cooperative Extension 20
UC COOPERATIVE EXTENSION
CENTRAL COAST - 2014
Table 7 CONTINUED
Operation Labor Type Rate
Operation Month Tractor Implement Material acre Unit
Insect Mites (predatory) Feb Non-Machine Labor 2 hours
Persimilis (Mite) 40 thou
Mar Non-Machine Labor 2 hours
Persimilis (Mite) 40 thou
Weed Cultivate Feb 75HP 4WD Tractor Cultivator 3R 12 Equipment Operator Labor 03 hour
Mar 75HP 4WD Tractor Cultivator 3R 12 Equipment Operator Labor 03 hour
Apr 75HP 4WD Tractor Cultivator 3R 12 Equipment Operator Labor 03 hour
Fertilize Foliar (Biomin) Feb 75HP 4WD Tractor Sprayer w20Boom Equipment Operator Labor 012 hour
Biomin Calcium 1 gal
Mar 75HP 4WD Tractor Sprayer w20Boom Equipment Operator Labor 012 hour
Biomin Calcium 1 gal
Apr 75HP 4WD Tractor Sprayer w20Boom Equipment Operator Labor 012 hour
Biomin Calcium 1 gal
May 75HP 4WD Tractor Sprayer w20Boom Equipment Operator Labor 012 hour
Biomin Calcium 1 gal
June 75HP 4WD Tractor Sprayer w20Boom Equipment Operator Labor 012 hour
Biomin Calcium 1 gal
July 75HP 4WD Tractor Sprayer w20Boom Equipment Operator Labor 012 hour
Biomin Calcium 1 gal
Aug 75HP 4WD Tractor Sprayer w20Boom Equipment Operator Labor 012 hour
Biomin Calcium 1 gal
Sept 75HP 4WD Tractor Sprayer w20Boom Equipment Operator Labor 012 hour
Biomin Calcium 1 gal
Fertilize Foliar (Maxi) Feb 75HP 4WD Tractor Sprayer w20Boom Equipment Operator Labor 012 hour
Maxi-Crop 25 lb
Mar 75HP 4WD Tractor Sprayer w20Boom Equipment Operator Labor 012 hour
Maxi-Crop 25 lb
Apr 75HP 4WD Tractor Sprayer w20Boom Equipment Operator Labor 012 hour
Maxi-Crop 25 lb
May 75HP 4WD Tractor Sprayer w20Boom Equipment Operator Labor 012 hour
Maxi-Crop 25 lb
June 75HP 4WD Tractor Sprayer w20Boom Equipment Operator Labor 012 hour
Maxi-Crop 25 lb
July 75HP 4WD Tractor Sprayer w20Boom Equipment Operator Labor 012 hour
Maxi-Crop 25 lb
Aug 75HP 4WD Tractor Sprayer w20Boom Equipment Operator Labor 012 hour
Maxi-Crop 25 lb
Sept 75HP 4WD Tractor Sprayer w20Boom Equipment Operator Labor 012 hour
Maxi-Crop 25 lb
2014 Strawberries Organic Costs and Returns Study Central Coast UC Cooperative Extension 21
UC COOPERATIVE EXTENSION
CENTRAL COAST - 2014
Table 7 CONTINUED
Operation Labor Type Rate
Operation Month Tractor Implement Material acre Unit
Vertebrate Trapping Feb Non-Machine Labor 04 hour
Mar Non-Machine Labor 04 hour
Apr Non-Machine Labor 04 hour
May Non-Machine Labor 04 hour
June Non-Machine Labor 04 hour
Pest Control Adviser (PCA) Mar PCA fee 1 acre
Irrigate Drip Mar Non-Machine Labor 171 hours
Water Pumped 343 acin
Apr Non-Machine Labor 171 hours
Water Pumped 343 acin
May Non-Machine Labor 171 hours
Water Pumped 343 acin
June Non-Machine Labor 171 hours
Water Pumped 343 acin
July Non-Machine Labor 171 hours
Water Pumped 343 acin
Aug Non-Machine Labor 171 hours
Water Pumped 343 acin
Sept Non-Machine Labor 171 hours
Water Pumped 342 acin
Fertilize Through Drip (Agro) Mar Non-Machine Labor 043 hour
Agrothrive LF 10 gal
Apr Non-Machine Labor 043 hour
Agrothrive LF 10 gal
May Non-Machine Labor 043 hour
Agrothrive LF 10 gal
June Non-Machine Labor 043 hour
Agrothrive LF 10 gal
July Non-Machine Labor 043 hour
Agrothrive LF 10 gal
Aug Non-Machine Labor 043 hour
Agrothrive LF 10 gal
Sept Non-Machine Labor 042 hour
Agrothrive LF 10 gal
Insect Vacuum Lygus 8Xmonth Apr 55HP 2WD Tractor Bug Vacuum Equipment Operator Labor 407 hours
May 55HP 2WD Tractor Bug Vacuum Equipment Operator Labor 407 hours
June 55HP 2WD Tractor Bug Vacuum Equipment Operator Labor 407 hours
July 55HP 2WD Tractor Bug Vacuum Equipment Operator Labor 407 hours
Aug 55HP 2WD Tractor Bug Vacuum Equipment Operator Labor 407 hours
Sept 55HP 2WD Tractor Bug Vacuum Equipment Operator Labor 407 hours
Oct 55HP 2WD Tractor Bug Vacuum Equipment Operator Labor 407 hours
2014 Strawberries Organic Costs and Returns Study Central Coast UC Cooperative Extension 22
UC COOPERATIVE EXTENSION
CENTRAL COAST - 2014
Table 7 CONTINUED
Operation Labor Type Rate
Operation Month Tractor Implement Material acre Unit
Disease Powdery Mildew (Sulfur) Mar 75HP 4WD Tractor Sprayer w20Boom Equipment Operator Labor 024 hour
Kumulus DF 5 lb
Apr 75HP 4WD Tractor Sprayer w20Boom Equipment Operator Labor 024 hour
Kumulus DF 5 lb
May 75HP 4WD Tractor Sprayer w20Boom Equipment Operator Labor 012 hour
Kumulus DF 5 lb
June 75HP 4WD Tractor Sprayer w20Boom Equipment Operator Labor 012 hour
Kumulus DF 10 lb
July 75HP 4WD Tractor Sprayer w20Boom Equipment Operator Labor 012 hour
Kumulus DF 5 lb
Aug 75HP 4WD Tractor Sprayer w20Boom Equipment Operator Labor 012 hour
Kumulus DF 5 lb
Sept 75HP 4WD Tractor Sprayer w20Boom Equipment Operator Labor 012 hour
Kumulus DF 5 lb
Oct 75HP 4WD Tractor Sprayer w20Boom Equipment Operator Labor 012 hour
Kumulus DF 5 lb
Insect LBAM (Entrust) May 75HP 4WD Tractor Sprayer w20Boom Equipment Operator Labor 012 hour
Entrust 25 oz
June 75HP 4WD Tractor Sprayer w20Boom Equipment Operator Labor 012 hour
Entrust 25 oz
Sept 75HP 4WD Tractor Sprayer w20Boom Equipment Operator Labor 012 hour
Entrust 25 oz
Worms (Dipel) May 75HP 4WD Tractor Sprayer w20Boom Equipment Operator Labor 012 hour
Dipel DF (Bt) 2 lb
June 75HP 4WD Tractor Sprayer w20Boom Equipment Operator Labor 012 hour
Dipel DF (Bt) 2 lb
Post Harvest Cleanup Oct 55HP 2WD Tractor Mower 4 Non-Machine Labor 95 hours
Oct Truck 1 Ton 1 Non-Machine Labor 6 hours
DumpFee Monterey 600 lb
Oct 90HP 4WD Tractor Disc-Offset 14 Non-Machine Labor 9 hours
Pickup Business Use Oct Pickup Truck 12 T Equipment Operator Labor 205 hours
ATV Oct ATV 4WD Equipment Operator Labor 071 hour
Harvest Regular amp Peak Apr Harvest Labor 7589 hours
8 Clamshell +Tray 2125 each
May Harvest Labor 11775 hours
8 Clamshell +Tray 510 each
June Harvest Labor 21766 hours
8 Clamshell +Tray 106250 each
2014 Strawberries Organic Costs and Returns Study Central Coast UC Cooperative Extension 23
UC COOPERATIVE EXTENSION CENTRAL COAST - 2014 Table 7 CONTINUED
Operation Labor Type Rate Operation Month Tractor Implement Material acre Unit
Harvest Regular amp Peak July Harvest Labor 21766 hours 8 Clamshell +Tray 106250 each
Aug Harvest Labor 15671 hours 8 Clamshell +Tray 765 each
Sept Harvest Labor 11775 hours 8 Clamshell +Tray 510 each
Oct Truck 1 Ton 1 Harvest Labor 4551 hours 8 Clamshell +Tray 1275 each
Harvest Load amp Haul Apr Truck 1 Ton 1 Non-Machine Labor 157 hours May Truck 1 Ton 2 Non-Machine Labor 227 hours June Truck 1 Ton 1 Non-Machine Labor 337 hours July Truck 1 Ton 2 Non-Machine Labor 337 hours Aug Truck 1 Ton 1 Non-Machine Labor 283 hours Sept Truck 1 Ton 2 Non-Machine Labor 227 hours Oct Truck 1 Ton 1 Non-Machine Labor 094 hour
Harvest Cooler Apr Cooler 2125 tray May Cooler 510 tray June Equipment Operator Labor 532 hours
Cooler 106250 tray July Cooler 106250 tray Aug Cooler 765 tray Sept Cooler 510 tray Oct Cooler 1275 tray
Assessment Apr Strawberry Commiss 2125 tray May Strawberry Commiss 510 tray June Strawberry Commiss 106250 tray July Strawberry Commiss 106250 tray Aug Strawberry Commiss 765 tray Sept Strawberry Commiss 510 tray Oct Strawberry Commiss 1275 tray
Sales Apr Sales Commission 8 2125 tray May Sales Commission 8 510 tray June Sales Commission 8 106250 tray July Sales Commission 8 106250 tray Aug Sales Commission 8 765 tray Sept Sales Commission 8 510 tray Oct Sales Commission 8 1275 tray
2014 Strawberries Organic Costs and Returns Study Central Coast UC Cooperative Extension 24

UC COOPERATIVE EXTENSION CENTRAL COAST - 2014
Table 3 MONTHLY CASH COSTS PER ACRE TO PRODUCE ORGANIC STRAWBERRIES
Beginning 09-13 Ending 10-14
SEP 13
OCT 13
NOV 13
DEC 13
JAN 14
FEB 14
MAR 14
APR 14
MAY 14
JUN 14
JUL 14
AUG 14
SEP 14
OCT 14
TOTAL
Cultural Soil Samples (2 per 27 Acre Farm) Disk 2X (Cover Crop) Compost + Spread Sprinklers Setup and Removal Irrigate Sprinkler Subsoil 5X
6 23
287 74 39 85
74 64
6 23
287 147 103
85 Level (Triplane) Disk 4X
47 47
47 47
Chisel 2X 24 24 Blood Meal + Gypsum Spread Beds ListShape Beds Re-ListRe-Shape (Post irrigation) Install Drip System Tape amp Laterals Plant Lay Mulch Plant Punch Planting Holes Plant Strawberries (Includes 5 Replant) Weed Hand Insect Mites (Predatory) Weed Cultivate
892 45 45
365 419
28 3394
247 247 247 465
11
247 465
11
247
11
247 247 247 247 247
892 45 45
365 419
28 3394 2474
929 32
Fertilize Foliar (Biomin) Fertilize Foliar (Maxi Crop) Vertebrate Trapping Pest Control Adviser (PCA) Irrigate Drip Fertilize Soil (Agrothrive) Insect Vacuum Lygus 8Xmonth Disease Powdery Mildew (Kumulus) Insect LBAM (Entrust) Worms (Dipel) Post Harvest Cleanup Pickup Business Use ATV
125
22 32
5
22 32
5
98 41
17
22 32
5
98 41
157 17
22 32
5
98 41
157 13
115 41
22 32
5
98 41
157 21
115 41
22 32
98 41
157 13
22 32
98 41
157 13
22 32
98 41
157 13
115
157 13
423 62 16
177 260
25 125 688 287
1101 117 344
82 423
62 16
TOTAL Cultural COSTS 631 5450 247 247 782 938 631 772 780 611 611 726 671 13099
2014 Strawberries Organic Costs and Returns Study Central Coast UC Cooperative Extension 15
UC COOPERATIVE EXTENSION
CENTRAL COAST - 2014
Table 3 CONTINUED
Beginning 09-13 SEP OCT NOV DEC JAN FEB MAR APR MAY JUN JUL AUG SEP OCT TOTAL
Ending 10-14 13 13 13 13 14 14 14 14 14 14 14 14 14 14
Harvest
Harvest Regular and Peak Production 1279 2283 4414 4414 3178 2283 767 18617
Harvest Load amp Haul 105 211 455 455 327 210 48 1812
Harvest Cooler 149 357 744 744 536 357 89 2975
CSC Assessment 9 20 43 43 31 20 5 170
SalesMarketing 255 612 1275 1275 918 612 153 5100
TOTAL Harvest COSTS 0 0 0 0 0 0 1796 3483 6930 6930 4989 3482 1062 28673
Interest on Operating Capital (575) 3 29 29 30 32 35 40 51 72 109 145 172 -28 -8 710
TOTAL OPERATING COSTSACRE 634 5479 29 278 279 818 978 2479 4327 7819 7686 5772 4179 1725 42482
CASH OVERHEAD
Office Expense 60 60 60 60 60 60 60 60 60 60 60 60 60 60 833
Food Safety 30 30
Land Rent 2700 2700
Liability Insurance 21 21
Sanitation Fee 235 235
Regulatory Programs 50 50
Organic CertificationRegistration 176 176
Ranch Supervisor 71 71 71 71 71 71 71 71 71 71 71 71 71 71 1000
Property Taxes 30 30 60
Property Insurance 25 25 50
Investment Repairs 7 7 7 7 7 7 7 7 7 7 7 7 7 7 102
TOTAL CASH OVERHEAD COSTS 138 138 138 168 3119 188 138 198 138 163 138 138 138 314 5257
TOTAL CASH COSTSACRE 772 5618 167 446 3398 1006 1116 2677 4465 7982 7824 5911 4318 2039 47739
2014 Strawberries Organic Costs and Returns Study Central Coast UC Cooperative Extension 16
UC COOPERATIVE EXTENSION CENTRAL COAST - 2014
Table 4 RANGING ANALYSIS
COST PER ACRE AT VARYING YIELDS TO PRODUCE ORGANIC STRAWBERRIES
YIELD (traysacre) 3500 3750 4000 4250 4500 4750 5000
OPERATING COSTS Cultural 13099 13099 13099 13099 13099 13099 13099 Harvest 24863 26133 27403 28673 29944 31214 32484
Interest on operating capital 575 674 686 698 710 722 734 746 TOTAL OPERATING COSTSACRE 38636 39918 41200 42482 43764 45047 46329
Total Operating Coststray 1104 1064 1030 1000 973 948 927 CASH OVERHEAD COSTSACRE 5257 5257 5257 5257 5257 5257 5257 TOTAL CASH COSTSACRE 43892 45174 46457 47739 49021 50303 51585 Total Cash Coststray 1254 1205 1161 1123 1089 1059 1032 NON-CASH OVERHEAD COSTSACRE 1305 1305 1305 1305 1305 1305 1305 TOTAL COSTSACRE 45197 46479 47762 49044 50326 51608 52890 Total Coststray 1291 1239 1194 1154 1118 1086 1058
NET RETURNS PER ACRE ABOVE OPERATING COSTS
YIELD (trayacre) PRICE($tray) 3500 3750 4000 4250 4500 4750 5000
1050 -1886 -543 800 2143 3486 4828 6171 1200 3364 5082 6800 8518 10236 11953 13671 1350 8614 10707 12800 14893 16986 19078 21171 1500 13864 16332 18800 21268 23736 26203 28671 1650 19114 21957 24800 27643 30486 33328 36171 1800 24364 27582 30800 34018 37236 40453 43671 1950 29614 33207 36800 40393 43986 47578 51171
NET RETURNS PER ACRE ABOVE CASH COSTS
YIELD (trayacre) PRICE($tray) 3500 3750 4000 4250 4500 4750 5000
1050 -7142 -5799 -4457 -3114 -1771 -428 915 1200 -1892 -174 1543 3261 4979 6697 8415 1350 3358 5451 7543 9636 11729 13822 15915 1500 8608 11076 13543 16011 18479 20947 23415 1650 13858 16701 19543 22386 25229 28072 30915 1800 19108 22326 25543 28761 31979 35197 38415 1950 24358 27951 31543 35136 38729 42322 45915
NET RETURNS PER ACRE ABOVE TOTAL COSTS
YIELD (trayacre) PRICE($tray) 3500 3750 4000 4250 4500 4750 5000
1050 -8447 -7104 -5762 -4419 -3076 -1733 -390 1200 -3197 -1479 238 1956 3674 5392 7110 1350 2053 4146 6238 8331 10424 12517 14610 1500 7303 9771 12238 14706 17174 19642 22110 1650 12553 15396 18238 21081 23924 26767 29610 1800 17803 21021 24238 27456 30674 33892 37110 1950 23053 26646 30238 33831 37424 41017 44610
2014 Strawberries Organic Costs and Returns Study Central Coast UC Cooperative Extension 17
UC COOPERATIVE EXTENSION CENTRAL COAST - 2014
Table 5 WHOLE FARM ANNUAL EQUIPMENT INVESTMENT AND BUSINESS OVERHEAD COSTS
ANNUAL EQUIPMENT COSTS
Cash Overhead Yrs Salvage Capital Insur-
Yr Description Price Life Value Recovery ance Taxes Total 14 55HP 2WD Tractor 32269 10 9532 3362 173 209 3744 14 75HP 4WD Tractor 45000 20 5774 3355 210 254 3820 14 90HP 4WD Tractor 47000 20 6031 3505 220 265 3990 14 ATV 4WD 7430 7 2818 924 42 51 1017 14 Blade Rear 3 pt 8 1560 20 81 120 7 8 135 14 Cultivator 3R 12 5000 20 261 385 22 26 433 14 Disc-Offset 14 16000 20 834 1231 70 84 1385 14 Drip Machine 1-48R 3500 15 336 316 16 19 351 14 ListerShaper 3-48R 5000 15 480 451 23 27 501 14 Mulch Machine 1-48R 3000 20 156 231 13 16 260 14 Pickup Truck 12 T 28000 5 12549 4140 168 203 4511 14 Punch Machine 1-48R 5000 20 261 385 22 26 433 14 Ripper-5 Shank 18 10800 20 563 831 47 57 935 14 Sprayer w20Boom 3700 5 1205 630 20 25 674 14 Trailer-Pipe 1950 20 102 150 9 10 169 14 Triplane 15 22200 20 1157 1708 97 117 1921 14 Truck 1 Ton 1 36000 5 16134 5323 216 261 5800 14 Mower 4 3500 20 182 269 15 18 303 14 Bug Vacuum 35000 2 16448 10723 213 257 11194 14 Chisel 12 12000 20 625 923 52 63 1039 14 Truck 1 Ton 2 36000 5 16134 5323 216 261 5800 TOTAL 359909 91664 44284 1872 2258 48414
60 of new cost 215945 54998 26570 1123 1355 29048 Used to reflect a mix of new and used equipment
ANNUAL INVESTMENT COSTS
Cash Overhead
Description Price Yrs Life
Salvage Value
Capital Recovery
Insur-ance Taxes Repairs Total
INVESTMENT Buildings 1200 sqft Fuel Tanks 2-300 gal Harvest Carts (70) 75HP Pump Filter Sprinkler Pipe Lateral Lines Shop Tools
42000 3500 1400
15000 60000 12000 15000
30 20
5 20 15
5 15
0 650
0 0 0 0
1500
2655 255 321
1178 5683 2753 1350
174 17
6 62
249 50 68
210 21
7 75
300 60 83
840 70 22
100 1200
220 300
3879 363 356
1415 7432 3082 1801
TOTAL INVESTMENT 148900 2150 14195 626 755 2752 18328
ANNUAL BUSINESS OVERHEAD COSTS
Units Price Total Description Farm Unit Unit Cost
Office Expense 30 acre 75000 22250 Food Safety 27 acre 3000 810 Land Rent 30 acre 270000 81000 Liability Insurance 30 acre 2090 627 Sanitation Fee 27 acre 23481 6340 Regulatory Programs 27 acre 5000 1350 Organic CertRegistration 27 acre 17600 4752 Ranch Supervisor 30 acre 100000 30000
2014 Strawberries Organic Costs and Returns Study Central Coast UC Cooperative Extension 18
UC COOPERATIVE EXTENSION
CENTRAL COAST - 2014
Table 6 HOURLY EQUIPMENT COSTS
COSTS PER HOUR
Strawberry Total Cash Overhead Operating
Hours Hours Capital Insur- Lube amp Fuel Total Total Yr Description Used Used Recovery ance Taxes Repairs Oper CostsHr
14 55HP 2WD Tractor 961 1200 168 009 010 294 962 1256 1443
14 75HP 4WD Tractor 128 600 336 021 025 389 1311 1700 2082
14 90HP 4WD Tractor 194 800 263 016 020 351 1573 1924 2223
14 ATV 4WD 16 285 194 009 011 094 262 356 570
14 Blade Rear 3 pt 8 28 100 072 004 005 000 000 000 081
14 Cultivator 3R 12 20 100 231 013 016 099 000 099 358
14 Disc-Offset 14 47 100 739 042 051 247 000 247 1078
14 Drip Machine 1-48R 55 100 189 010 012 092 000 092 303
14 ListerShaper 3-48R 54 133 203 010 012 101 000 101 327
14 Mulch Machine 1-48R 41 100 138 008 009 033 000 033 189
14 Pickup Truck 12 T 46 400 621 025 030 356 983 1339 2015
14 Punch Machine 1-48R 20 100 231 013 016 055 000 055 315
14 Ripper-5 Shank 18 49 125 399 023 027 340 000 340 788
14 Sprayer w20Boom 82 300 126 004 005 101 000 101 236
14 Trailer-Pipe 89 200 045 003 003 000 000 000 051
14 Triplane 15 27 150 683 039 047 330 000 330 1099
14 Truck 1 Ton 1 760 760 420 017 021 261 491 752 1210
14 Mower 4 10 100 162 009 011 157 000 157 338
14 Bug Vacuum 641 750 858 017 021 968 000 968 1864
14 Chisel 12 15 75 739 042 051 219 000 219 1049
14 Truck 1 Ton 2 654 654 488 020 024 291 491 782 1314
2014 Strawberries Organic Costs and Returns Study Central Coast UC Cooperative Extension 19
UC COOPERATIVE EXTENSION
CENTRAL COAST - 2014
Table 7 OPERATIONS WITH EQUIPMENT AND MATERIALS
Operation Labor Type Rate
Operation Month Tractor Implement Material acre Unit
Soil Samples (2 per 27 acres) Sept Soil Analysis 004 farm
Disk 2X (Cover Crop) Sept 90HP 4WD Tractor Disc-Offset 14 Equipment Operator Labor 06 hour
Compost + Spread Sept Compost 5 ton
Spread CompostMeal 1 acre
Sprinklers Setup amp Removal Sept 55HP 2WD Tractor Trailer-Pipe Non-Machine Labor 15 hours
Oct 55HP 2WD Tractor Trailer-Pipe Non-Machine Labor 15 hours
Irrigate OH Sprinkle Sept Irrigation Labor 13 hours
Water Pumped 1 acin
Oct Irrigation Labor 115 hours
Water Pumped 05 acin
Oct Non-Machine Labor 13 hours
Water Pumped 1 acin
Subsoil 5X Sept 90HP 4WD Tractor Ripper-5 Shank 18 Equipment Operator Labor 216 hours
Level (Triplane) Sept 90HP 4WD Tractor Triplane 15 Equipment Operator Labor 12 hours
Disk 4X Sept 90HP 4WD Tractor Disc-Offset 14 Equipment Operator Labor 12 hours
Chisel 2X Sept 75HP 4WD Tractor Chisel 12 Equipment Operator Labor 065 hour
Bloodmeal amp Gypsum + Spread Oct Bloodmeal 500 lb
Spread CompostMeal 1 acre
Gypsum 2 ton
Beds ListShape Oct 90HP 4WD Tractor LstrShpr 3-48R Equipment Operator Labor 12 hours
Beds Re-ListedRe-Shaped Oct 90HP 4WD Tractor LstrShpr 3-48R Equipment Operator Labor 12 hours
Install Drip System Tape Later Oct 55HP 2WD Tractor Drip Mchne 1-48R Non-Machine Labor 1 hour
T-Tape 2178000 foot
Oct 55HP 2WD Tractor Blade Rear 3 pt 8 Non-Machine Labor 01 hour
Plant Lay Mulch Oct 55HP 2WD Tractor Mulch Mchne 1-48R Equipment Operator Labor 18 hours
BlackPlasticMulch 275 roll
Plant Punch Planting Holes Oct 55HP 2WD Tractor Punch Mchn 1-48R Equipment Operator Labor 09 hour
Plant Strawberries (5 replant) Oct Non-Machine Labor 525 hours
Strawberry Plants 2286900 each
Weed Hand Dec Non-Machine Labor 20 hours
Jan Non-Machine Labor 20 hours
Feb Non-Machine Labor 20 hours
Mar Non-Machine Labor 20 hours
Apr Non-Machine Labor 20 hours
May Non-Machine Labor 20 hours
June Non-Machine Labor 20 hours
July Non-Machine Labor 20 hours
Aug Non-Machine Labor 20 hours
Sept Non-Machine Labor 20 hours
2014 Strawberries Organic Costs and Returns Study Central Coast UC Cooperative Extension 20
UC COOPERATIVE EXTENSION
CENTRAL COAST - 2014
Table 7 CONTINUED
Operation Labor Type Rate
Operation Month Tractor Implement Material acre Unit
Insect Mites (predatory) Feb Non-Machine Labor 2 hours
Persimilis (Mite) 40 thou
Mar Non-Machine Labor 2 hours
Persimilis (Mite) 40 thou
Weed Cultivate Feb 75HP 4WD Tractor Cultivator 3R 12 Equipment Operator Labor 03 hour
Mar 75HP 4WD Tractor Cultivator 3R 12 Equipment Operator Labor 03 hour
Apr 75HP 4WD Tractor Cultivator 3R 12 Equipment Operator Labor 03 hour
Fertilize Foliar (Biomin) Feb 75HP 4WD Tractor Sprayer w20Boom Equipment Operator Labor 012 hour
Biomin Calcium 1 gal
Mar 75HP 4WD Tractor Sprayer w20Boom Equipment Operator Labor 012 hour
Biomin Calcium 1 gal
Apr 75HP 4WD Tractor Sprayer w20Boom Equipment Operator Labor 012 hour
Biomin Calcium 1 gal
May 75HP 4WD Tractor Sprayer w20Boom Equipment Operator Labor 012 hour
Biomin Calcium 1 gal
June 75HP 4WD Tractor Sprayer w20Boom Equipment Operator Labor 012 hour
Biomin Calcium 1 gal
July 75HP 4WD Tractor Sprayer w20Boom Equipment Operator Labor 012 hour
Biomin Calcium 1 gal
Aug 75HP 4WD Tractor Sprayer w20Boom Equipment Operator Labor 012 hour
Biomin Calcium 1 gal
Sept 75HP 4WD Tractor Sprayer w20Boom Equipment Operator Labor 012 hour
Biomin Calcium 1 gal
Fertilize Foliar (Maxi) Feb 75HP 4WD Tractor Sprayer w20Boom Equipment Operator Labor 012 hour
Maxi-Crop 25 lb
Mar 75HP 4WD Tractor Sprayer w20Boom Equipment Operator Labor 012 hour
Maxi-Crop 25 lb
Apr 75HP 4WD Tractor Sprayer w20Boom Equipment Operator Labor 012 hour
Maxi-Crop 25 lb
May 75HP 4WD Tractor Sprayer w20Boom Equipment Operator Labor 012 hour
Maxi-Crop 25 lb
June 75HP 4WD Tractor Sprayer w20Boom Equipment Operator Labor 012 hour
Maxi-Crop 25 lb
July 75HP 4WD Tractor Sprayer w20Boom Equipment Operator Labor 012 hour
Maxi-Crop 25 lb
Aug 75HP 4WD Tractor Sprayer w20Boom Equipment Operator Labor 012 hour
Maxi-Crop 25 lb
Sept 75HP 4WD Tractor Sprayer w20Boom Equipment Operator Labor 012 hour
Maxi-Crop 25 lb
2014 Strawberries Organic Costs and Returns Study Central Coast UC Cooperative Extension 21
UC COOPERATIVE EXTENSION
CENTRAL COAST - 2014
Table 7 CONTINUED
Operation Labor Type Rate
Operation Month Tractor Implement Material acre Unit
Vertebrate Trapping Feb Non-Machine Labor 04 hour
Mar Non-Machine Labor 04 hour
Apr Non-Machine Labor 04 hour
May Non-Machine Labor 04 hour
June Non-Machine Labor 04 hour
Pest Control Adviser (PCA) Mar PCA fee 1 acre
Irrigate Drip Mar Non-Machine Labor 171 hours
Water Pumped 343 acin
Apr Non-Machine Labor 171 hours
Water Pumped 343 acin
May Non-Machine Labor 171 hours
Water Pumped 343 acin
June Non-Machine Labor 171 hours
Water Pumped 343 acin
July Non-Machine Labor 171 hours
Water Pumped 343 acin
Aug Non-Machine Labor 171 hours
Water Pumped 343 acin
Sept Non-Machine Labor 171 hours
Water Pumped 342 acin
Fertilize Through Drip (Agro) Mar Non-Machine Labor 043 hour
Agrothrive LF 10 gal
Apr Non-Machine Labor 043 hour
Agrothrive LF 10 gal
May Non-Machine Labor 043 hour
Agrothrive LF 10 gal
June Non-Machine Labor 043 hour
Agrothrive LF 10 gal
July Non-Machine Labor 043 hour
Agrothrive LF 10 gal
Aug Non-Machine Labor 043 hour
Agrothrive LF 10 gal
Sept Non-Machine Labor 042 hour
Agrothrive LF 10 gal
Insect Vacuum Lygus 8Xmonth Apr 55HP 2WD Tractor Bug Vacuum Equipment Operator Labor 407 hours
May 55HP 2WD Tractor Bug Vacuum Equipment Operator Labor 407 hours
June 55HP 2WD Tractor Bug Vacuum Equipment Operator Labor 407 hours
July 55HP 2WD Tractor Bug Vacuum Equipment Operator Labor 407 hours
Aug 55HP 2WD Tractor Bug Vacuum Equipment Operator Labor 407 hours
Sept 55HP 2WD Tractor Bug Vacuum Equipment Operator Labor 407 hours
Oct 55HP 2WD Tractor Bug Vacuum Equipment Operator Labor 407 hours
2014 Strawberries Organic Costs and Returns Study Central Coast UC Cooperative Extension 22
UC COOPERATIVE EXTENSION
CENTRAL COAST - 2014
Table 7 CONTINUED
Operation Labor Type Rate
Operation Month Tractor Implement Material acre Unit
Disease Powdery Mildew (Sulfur) Mar 75HP 4WD Tractor Sprayer w20Boom Equipment Operator Labor 024 hour
Kumulus DF 5 lb
Apr 75HP 4WD Tractor Sprayer w20Boom Equipment Operator Labor 024 hour
Kumulus DF 5 lb
May 75HP 4WD Tractor Sprayer w20Boom Equipment Operator Labor 012 hour
Kumulus DF 5 lb
June 75HP 4WD Tractor Sprayer w20Boom Equipment Operator Labor 012 hour
Kumulus DF 10 lb
July 75HP 4WD Tractor Sprayer w20Boom Equipment Operator Labor 012 hour
Kumulus DF 5 lb
Aug 75HP 4WD Tractor Sprayer w20Boom Equipment Operator Labor 012 hour
Kumulus DF 5 lb
Sept 75HP 4WD Tractor Sprayer w20Boom Equipment Operator Labor 012 hour
Kumulus DF 5 lb
Oct 75HP 4WD Tractor Sprayer w20Boom Equipment Operator Labor 012 hour
Kumulus DF 5 lb
Insect LBAM (Entrust) May 75HP 4WD Tractor Sprayer w20Boom Equipment Operator Labor 012 hour
Entrust 25 oz
June 75HP 4WD Tractor Sprayer w20Boom Equipment Operator Labor 012 hour
Entrust 25 oz
Sept 75HP 4WD Tractor Sprayer w20Boom Equipment Operator Labor 012 hour
Entrust 25 oz
Worms (Dipel) May 75HP 4WD Tractor Sprayer w20Boom Equipment Operator Labor 012 hour
Dipel DF (Bt) 2 lb
June 75HP 4WD Tractor Sprayer w20Boom Equipment Operator Labor 012 hour
Dipel DF (Bt) 2 lb
Post Harvest Cleanup Oct 55HP 2WD Tractor Mower 4 Non-Machine Labor 95 hours
Oct Truck 1 Ton 1 Non-Machine Labor 6 hours
DumpFee Monterey 600 lb
Oct 90HP 4WD Tractor Disc-Offset 14 Non-Machine Labor 9 hours
Pickup Business Use Oct Pickup Truck 12 T Equipment Operator Labor 205 hours
ATV Oct ATV 4WD Equipment Operator Labor 071 hour
Harvest Regular amp Peak Apr Harvest Labor 7589 hours
8 Clamshell +Tray 2125 each
May Harvest Labor 11775 hours
8 Clamshell +Tray 510 each
June Harvest Labor 21766 hours
8 Clamshell +Tray 106250 each
2014 Strawberries Organic Costs and Returns Study Central Coast UC Cooperative Extension 23
UC COOPERATIVE EXTENSION CENTRAL COAST - 2014 Table 7 CONTINUED
Operation Labor Type Rate Operation Month Tractor Implement Material acre Unit
Harvest Regular amp Peak July Harvest Labor 21766 hours 8 Clamshell +Tray 106250 each
Aug Harvest Labor 15671 hours 8 Clamshell +Tray 765 each
Sept Harvest Labor 11775 hours 8 Clamshell +Tray 510 each
Oct Truck 1 Ton 1 Harvest Labor 4551 hours 8 Clamshell +Tray 1275 each
Harvest Load amp Haul Apr Truck 1 Ton 1 Non-Machine Labor 157 hours May Truck 1 Ton 2 Non-Machine Labor 227 hours June Truck 1 Ton 1 Non-Machine Labor 337 hours July Truck 1 Ton 2 Non-Machine Labor 337 hours Aug Truck 1 Ton 1 Non-Machine Labor 283 hours Sept Truck 1 Ton 2 Non-Machine Labor 227 hours Oct Truck 1 Ton 1 Non-Machine Labor 094 hour
Harvest Cooler Apr Cooler 2125 tray May Cooler 510 tray June Equipment Operator Labor 532 hours
Cooler 106250 tray July Cooler 106250 tray Aug Cooler 765 tray Sept Cooler 510 tray Oct Cooler 1275 tray
Assessment Apr Strawberry Commiss 2125 tray May Strawberry Commiss 510 tray June Strawberry Commiss 106250 tray July Strawberry Commiss 106250 tray Aug Strawberry Commiss 765 tray Sept Strawberry Commiss 510 tray Oct Strawberry Commiss 1275 tray
Sales Apr Sales Commission 8 2125 tray May Sales Commission 8 510 tray June Sales Commission 8 106250 tray July Sales Commission 8 106250 tray Aug Sales Commission 8 765 tray Sept Sales Commission 8 510 tray Oct Sales Commission 8 1275 tray
2014 Strawberries Organic Costs and Returns Study Central Coast UC Cooperative Extension 24

UC COOPERATIVE EXTENSION
CENTRAL COAST - 2014
Table 3 CONTINUED
Beginning 09-13 SEP OCT NOV DEC JAN FEB MAR APR MAY JUN JUL AUG SEP OCT TOTAL
Ending 10-14 13 13 13 13 14 14 14 14 14 14 14 14 14 14
Harvest
Harvest Regular and Peak Production 1279 2283 4414 4414 3178 2283 767 18617
Harvest Load amp Haul 105 211 455 455 327 210 48 1812
Harvest Cooler 149 357 744 744 536 357 89 2975
CSC Assessment 9 20 43 43 31 20 5 170
SalesMarketing 255 612 1275 1275 918 612 153 5100
TOTAL Harvest COSTS 0 0 0 0 0 0 1796 3483 6930 6930 4989 3482 1062 28673
Interest on Operating Capital (575) 3 29 29 30 32 35 40 51 72 109 145 172 -28 -8 710
TOTAL OPERATING COSTSACRE 634 5479 29 278 279 818 978 2479 4327 7819 7686 5772 4179 1725 42482
CASH OVERHEAD
Office Expense 60 60 60 60 60 60 60 60 60 60 60 60 60 60 833
Food Safety 30 30
Land Rent 2700 2700
Liability Insurance 21 21
Sanitation Fee 235 235
Regulatory Programs 50 50
Organic CertificationRegistration 176 176
Ranch Supervisor 71 71 71 71 71 71 71 71 71 71 71 71 71 71 1000
Property Taxes 30 30 60
Property Insurance 25 25 50
Investment Repairs 7 7 7 7 7 7 7 7 7 7 7 7 7 7 102
TOTAL CASH OVERHEAD COSTS 138 138 138 168 3119 188 138 198 138 163 138 138 138 314 5257
TOTAL CASH COSTSACRE 772 5618 167 446 3398 1006 1116 2677 4465 7982 7824 5911 4318 2039 47739
2014 Strawberries Organic Costs and Returns Study Central Coast UC Cooperative Extension 16
UC COOPERATIVE EXTENSION CENTRAL COAST - 2014
Table 4 RANGING ANALYSIS
COST PER ACRE AT VARYING YIELDS TO PRODUCE ORGANIC STRAWBERRIES
YIELD (traysacre) 3500 3750 4000 4250 4500 4750 5000
OPERATING COSTS Cultural 13099 13099 13099 13099 13099 13099 13099 Harvest 24863 26133 27403 28673 29944 31214 32484
Interest on operating capital 575 674 686 698 710 722 734 746 TOTAL OPERATING COSTSACRE 38636 39918 41200 42482 43764 45047 46329
Total Operating Coststray 1104 1064 1030 1000 973 948 927 CASH OVERHEAD COSTSACRE 5257 5257 5257 5257 5257 5257 5257 TOTAL CASH COSTSACRE 43892 45174 46457 47739 49021 50303 51585 Total Cash Coststray 1254 1205 1161 1123 1089 1059 1032 NON-CASH OVERHEAD COSTSACRE 1305 1305 1305 1305 1305 1305 1305 TOTAL COSTSACRE 45197 46479 47762 49044 50326 51608 52890 Total Coststray 1291 1239 1194 1154 1118 1086 1058
NET RETURNS PER ACRE ABOVE OPERATING COSTS
YIELD (trayacre) PRICE($tray) 3500 3750 4000 4250 4500 4750 5000
1050 -1886 -543 800 2143 3486 4828 6171 1200 3364 5082 6800 8518 10236 11953 13671 1350 8614 10707 12800 14893 16986 19078 21171 1500 13864 16332 18800 21268 23736 26203 28671 1650 19114 21957 24800 27643 30486 33328 36171 1800 24364 27582 30800 34018 37236 40453 43671 1950 29614 33207 36800 40393 43986 47578 51171
NET RETURNS PER ACRE ABOVE CASH COSTS
YIELD (trayacre) PRICE($tray) 3500 3750 4000 4250 4500 4750 5000
1050 -7142 -5799 -4457 -3114 -1771 -428 915 1200 -1892 -174 1543 3261 4979 6697 8415 1350 3358 5451 7543 9636 11729 13822 15915 1500 8608 11076 13543 16011 18479 20947 23415 1650 13858 16701 19543 22386 25229 28072 30915 1800 19108 22326 25543 28761 31979 35197 38415 1950 24358 27951 31543 35136 38729 42322 45915
NET RETURNS PER ACRE ABOVE TOTAL COSTS
YIELD (trayacre) PRICE($tray) 3500 3750 4000 4250 4500 4750 5000
1050 -8447 -7104 -5762 -4419 -3076 -1733 -390 1200 -3197 -1479 238 1956 3674 5392 7110 1350 2053 4146 6238 8331 10424 12517 14610 1500 7303 9771 12238 14706 17174 19642 22110 1650 12553 15396 18238 21081 23924 26767 29610 1800 17803 21021 24238 27456 30674 33892 37110 1950 23053 26646 30238 33831 37424 41017 44610
2014 Strawberries Organic Costs and Returns Study Central Coast UC Cooperative Extension 17
UC COOPERATIVE EXTENSION CENTRAL COAST - 2014
Table 5 WHOLE FARM ANNUAL EQUIPMENT INVESTMENT AND BUSINESS OVERHEAD COSTS
ANNUAL EQUIPMENT COSTS
Cash Overhead Yrs Salvage Capital Insur-
Yr Description Price Life Value Recovery ance Taxes Total 14 55HP 2WD Tractor 32269 10 9532 3362 173 209 3744 14 75HP 4WD Tractor 45000 20 5774 3355 210 254 3820 14 90HP 4WD Tractor 47000 20 6031 3505 220 265 3990 14 ATV 4WD 7430 7 2818 924 42 51 1017 14 Blade Rear 3 pt 8 1560 20 81 120 7 8 135 14 Cultivator 3R 12 5000 20 261 385 22 26 433 14 Disc-Offset 14 16000 20 834 1231 70 84 1385 14 Drip Machine 1-48R 3500 15 336 316 16 19 351 14 ListerShaper 3-48R 5000 15 480 451 23 27 501 14 Mulch Machine 1-48R 3000 20 156 231 13 16 260 14 Pickup Truck 12 T 28000 5 12549 4140 168 203 4511 14 Punch Machine 1-48R 5000 20 261 385 22 26 433 14 Ripper-5 Shank 18 10800 20 563 831 47 57 935 14 Sprayer w20Boom 3700 5 1205 630 20 25 674 14 Trailer-Pipe 1950 20 102 150 9 10 169 14 Triplane 15 22200 20 1157 1708 97 117 1921 14 Truck 1 Ton 1 36000 5 16134 5323 216 261 5800 14 Mower 4 3500 20 182 269 15 18 303 14 Bug Vacuum 35000 2 16448 10723 213 257 11194 14 Chisel 12 12000 20 625 923 52 63 1039 14 Truck 1 Ton 2 36000 5 16134 5323 216 261 5800 TOTAL 359909 91664 44284 1872 2258 48414
60 of new cost 215945 54998 26570 1123 1355 29048 Used to reflect a mix of new and used equipment
ANNUAL INVESTMENT COSTS
Cash Overhead
Description Price Yrs Life
Salvage Value
Capital Recovery
Insur-ance Taxes Repairs Total
INVESTMENT Buildings 1200 sqft Fuel Tanks 2-300 gal Harvest Carts (70) 75HP Pump Filter Sprinkler Pipe Lateral Lines Shop Tools
42000 3500 1400
15000 60000 12000 15000
30 20
5 20 15
5 15
0 650
0 0 0 0
1500
2655 255 321
1178 5683 2753 1350
174 17
6 62
249 50 68
210 21
7 75
300 60 83
840 70 22
100 1200
220 300
3879 363 356
1415 7432 3082 1801
TOTAL INVESTMENT 148900 2150 14195 626 755 2752 18328
ANNUAL BUSINESS OVERHEAD COSTS
Units Price Total Description Farm Unit Unit Cost
Office Expense 30 acre 75000 22250 Food Safety 27 acre 3000 810 Land Rent 30 acre 270000 81000 Liability Insurance 30 acre 2090 627 Sanitation Fee 27 acre 23481 6340 Regulatory Programs 27 acre 5000 1350 Organic CertRegistration 27 acre 17600 4752 Ranch Supervisor 30 acre 100000 30000
2014 Strawberries Organic Costs and Returns Study Central Coast UC Cooperative Extension 18
UC COOPERATIVE EXTENSION
CENTRAL COAST - 2014
Table 6 HOURLY EQUIPMENT COSTS
COSTS PER HOUR
Strawberry Total Cash Overhead Operating
Hours Hours Capital Insur- Lube amp Fuel Total Total Yr Description Used Used Recovery ance Taxes Repairs Oper CostsHr
14 55HP 2WD Tractor 961 1200 168 009 010 294 962 1256 1443
14 75HP 4WD Tractor 128 600 336 021 025 389 1311 1700 2082
14 90HP 4WD Tractor 194 800 263 016 020 351 1573 1924 2223
14 ATV 4WD 16 285 194 009 011 094 262 356 570
14 Blade Rear 3 pt 8 28 100 072 004 005 000 000 000 081
14 Cultivator 3R 12 20 100 231 013 016 099 000 099 358
14 Disc-Offset 14 47 100 739 042 051 247 000 247 1078
14 Drip Machine 1-48R 55 100 189 010 012 092 000 092 303
14 ListerShaper 3-48R 54 133 203 010 012 101 000 101 327
14 Mulch Machine 1-48R 41 100 138 008 009 033 000 033 189
14 Pickup Truck 12 T 46 400 621 025 030 356 983 1339 2015
14 Punch Machine 1-48R 20 100 231 013 016 055 000 055 315
14 Ripper-5 Shank 18 49 125 399 023 027 340 000 340 788
14 Sprayer w20Boom 82 300 126 004 005 101 000 101 236
14 Trailer-Pipe 89 200 045 003 003 000 000 000 051
14 Triplane 15 27 150 683 039 047 330 000 330 1099
14 Truck 1 Ton 1 760 760 420 017 021 261 491 752 1210
14 Mower 4 10 100 162 009 011 157 000 157 338
14 Bug Vacuum 641 750 858 017 021 968 000 968 1864
14 Chisel 12 15 75 739 042 051 219 000 219 1049
14 Truck 1 Ton 2 654 654 488 020 024 291 491 782 1314
2014 Strawberries Organic Costs and Returns Study Central Coast UC Cooperative Extension 19
UC COOPERATIVE EXTENSION
CENTRAL COAST - 2014
Table 7 OPERATIONS WITH EQUIPMENT AND MATERIALS
Operation Labor Type Rate
Operation Month Tractor Implement Material acre Unit
Soil Samples (2 per 27 acres) Sept Soil Analysis 004 farm
Disk 2X (Cover Crop) Sept 90HP 4WD Tractor Disc-Offset 14 Equipment Operator Labor 06 hour
Compost + Spread Sept Compost 5 ton
Spread CompostMeal 1 acre
Sprinklers Setup amp Removal Sept 55HP 2WD Tractor Trailer-Pipe Non-Machine Labor 15 hours
Oct 55HP 2WD Tractor Trailer-Pipe Non-Machine Labor 15 hours
Irrigate OH Sprinkle Sept Irrigation Labor 13 hours
Water Pumped 1 acin
Oct Irrigation Labor 115 hours
Water Pumped 05 acin
Oct Non-Machine Labor 13 hours
Water Pumped 1 acin
Subsoil 5X Sept 90HP 4WD Tractor Ripper-5 Shank 18 Equipment Operator Labor 216 hours
Level (Triplane) Sept 90HP 4WD Tractor Triplane 15 Equipment Operator Labor 12 hours
Disk 4X Sept 90HP 4WD Tractor Disc-Offset 14 Equipment Operator Labor 12 hours
Chisel 2X Sept 75HP 4WD Tractor Chisel 12 Equipment Operator Labor 065 hour
Bloodmeal amp Gypsum + Spread Oct Bloodmeal 500 lb
Spread CompostMeal 1 acre
Gypsum 2 ton
Beds ListShape Oct 90HP 4WD Tractor LstrShpr 3-48R Equipment Operator Labor 12 hours
Beds Re-ListedRe-Shaped Oct 90HP 4WD Tractor LstrShpr 3-48R Equipment Operator Labor 12 hours
Install Drip System Tape Later Oct 55HP 2WD Tractor Drip Mchne 1-48R Non-Machine Labor 1 hour
T-Tape 2178000 foot
Oct 55HP 2WD Tractor Blade Rear 3 pt 8 Non-Machine Labor 01 hour
Plant Lay Mulch Oct 55HP 2WD Tractor Mulch Mchne 1-48R Equipment Operator Labor 18 hours
BlackPlasticMulch 275 roll
Plant Punch Planting Holes Oct 55HP 2WD Tractor Punch Mchn 1-48R Equipment Operator Labor 09 hour
Plant Strawberries (5 replant) Oct Non-Machine Labor 525 hours
Strawberry Plants 2286900 each
Weed Hand Dec Non-Machine Labor 20 hours
Jan Non-Machine Labor 20 hours
Feb Non-Machine Labor 20 hours
Mar Non-Machine Labor 20 hours
Apr Non-Machine Labor 20 hours
May Non-Machine Labor 20 hours
June Non-Machine Labor 20 hours
July Non-Machine Labor 20 hours
Aug Non-Machine Labor 20 hours
Sept Non-Machine Labor 20 hours
2014 Strawberries Organic Costs and Returns Study Central Coast UC Cooperative Extension 20
UC COOPERATIVE EXTENSION
CENTRAL COAST - 2014
Table 7 CONTINUED
Operation Labor Type Rate
Operation Month Tractor Implement Material acre Unit
Insect Mites (predatory) Feb Non-Machine Labor 2 hours
Persimilis (Mite) 40 thou
Mar Non-Machine Labor 2 hours
Persimilis (Mite) 40 thou
Weed Cultivate Feb 75HP 4WD Tractor Cultivator 3R 12 Equipment Operator Labor 03 hour
Mar 75HP 4WD Tractor Cultivator 3R 12 Equipment Operator Labor 03 hour
Apr 75HP 4WD Tractor Cultivator 3R 12 Equipment Operator Labor 03 hour
Fertilize Foliar (Biomin) Feb 75HP 4WD Tractor Sprayer w20Boom Equipment Operator Labor 012 hour
Biomin Calcium 1 gal
Mar 75HP 4WD Tractor Sprayer w20Boom Equipment Operator Labor 012 hour
Biomin Calcium 1 gal
Apr 75HP 4WD Tractor Sprayer w20Boom Equipment Operator Labor 012 hour
Biomin Calcium 1 gal
May 75HP 4WD Tractor Sprayer w20Boom Equipment Operator Labor 012 hour
Biomin Calcium 1 gal
June 75HP 4WD Tractor Sprayer w20Boom Equipment Operator Labor 012 hour
Biomin Calcium 1 gal
July 75HP 4WD Tractor Sprayer w20Boom Equipment Operator Labor 012 hour
Biomin Calcium 1 gal
Aug 75HP 4WD Tractor Sprayer w20Boom Equipment Operator Labor 012 hour
Biomin Calcium 1 gal
Sept 75HP 4WD Tractor Sprayer w20Boom Equipment Operator Labor 012 hour
Biomin Calcium 1 gal
Fertilize Foliar (Maxi) Feb 75HP 4WD Tractor Sprayer w20Boom Equipment Operator Labor 012 hour
Maxi-Crop 25 lb
Mar 75HP 4WD Tractor Sprayer w20Boom Equipment Operator Labor 012 hour
Maxi-Crop 25 lb
Apr 75HP 4WD Tractor Sprayer w20Boom Equipment Operator Labor 012 hour
Maxi-Crop 25 lb
May 75HP 4WD Tractor Sprayer w20Boom Equipment Operator Labor 012 hour
Maxi-Crop 25 lb
June 75HP 4WD Tractor Sprayer w20Boom Equipment Operator Labor 012 hour
Maxi-Crop 25 lb
July 75HP 4WD Tractor Sprayer w20Boom Equipment Operator Labor 012 hour
Maxi-Crop 25 lb
Aug 75HP 4WD Tractor Sprayer w20Boom Equipment Operator Labor 012 hour
Maxi-Crop 25 lb
Sept 75HP 4WD Tractor Sprayer w20Boom Equipment Operator Labor 012 hour
Maxi-Crop 25 lb
2014 Strawberries Organic Costs and Returns Study Central Coast UC Cooperative Extension 21
UC COOPERATIVE EXTENSION
CENTRAL COAST - 2014
Table 7 CONTINUED
Operation Labor Type Rate
Operation Month Tractor Implement Material acre Unit
Vertebrate Trapping Feb Non-Machine Labor 04 hour
Mar Non-Machine Labor 04 hour
Apr Non-Machine Labor 04 hour
May Non-Machine Labor 04 hour
June Non-Machine Labor 04 hour
Pest Control Adviser (PCA) Mar PCA fee 1 acre
Irrigate Drip Mar Non-Machine Labor 171 hours
Water Pumped 343 acin
Apr Non-Machine Labor 171 hours
Water Pumped 343 acin
May Non-Machine Labor 171 hours
Water Pumped 343 acin
June Non-Machine Labor 171 hours
Water Pumped 343 acin
July Non-Machine Labor 171 hours
Water Pumped 343 acin
Aug Non-Machine Labor 171 hours
Water Pumped 343 acin
Sept Non-Machine Labor 171 hours
Water Pumped 342 acin
Fertilize Through Drip (Agro) Mar Non-Machine Labor 043 hour
Agrothrive LF 10 gal
Apr Non-Machine Labor 043 hour
Agrothrive LF 10 gal
May Non-Machine Labor 043 hour
Agrothrive LF 10 gal
June Non-Machine Labor 043 hour
Agrothrive LF 10 gal
July Non-Machine Labor 043 hour
Agrothrive LF 10 gal
Aug Non-Machine Labor 043 hour
Agrothrive LF 10 gal
Sept Non-Machine Labor 042 hour
Agrothrive LF 10 gal
Insect Vacuum Lygus 8Xmonth Apr 55HP 2WD Tractor Bug Vacuum Equipment Operator Labor 407 hours
May 55HP 2WD Tractor Bug Vacuum Equipment Operator Labor 407 hours
June 55HP 2WD Tractor Bug Vacuum Equipment Operator Labor 407 hours
July 55HP 2WD Tractor Bug Vacuum Equipment Operator Labor 407 hours
Aug 55HP 2WD Tractor Bug Vacuum Equipment Operator Labor 407 hours
Sept 55HP 2WD Tractor Bug Vacuum Equipment Operator Labor 407 hours
Oct 55HP 2WD Tractor Bug Vacuum Equipment Operator Labor 407 hours
2014 Strawberries Organic Costs and Returns Study Central Coast UC Cooperative Extension 22
UC COOPERATIVE EXTENSION
CENTRAL COAST - 2014
Table 7 CONTINUED
Operation Labor Type Rate
Operation Month Tractor Implement Material acre Unit
Disease Powdery Mildew (Sulfur) Mar 75HP 4WD Tractor Sprayer w20Boom Equipment Operator Labor 024 hour
Kumulus DF 5 lb
Apr 75HP 4WD Tractor Sprayer w20Boom Equipment Operator Labor 024 hour
Kumulus DF 5 lb
May 75HP 4WD Tractor Sprayer w20Boom Equipment Operator Labor 012 hour
Kumulus DF 5 lb
June 75HP 4WD Tractor Sprayer w20Boom Equipment Operator Labor 012 hour
Kumulus DF 10 lb
July 75HP 4WD Tractor Sprayer w20Boom Equipment Operator Labor 012 hour
Kumulus DF 5 lb
Aug 75HP 4WD Tractor Sprayer w20Boom Equipment Operator Labor 012 hour
Kumulus DF 5 lb
Sept 75HP 4WD Tractor Sprayer w20Boom Equipment Operator Labor 012 hour
Kumulus DF 5 lb
Oct 75HP 4WD Tractor Sprayer w20Boom Equipment Operator Labor 012 hour
Kumulus DF 5 lb
Insect LBAM (Entrust) May 75HP 4WD Tractor Sprayer w20Boom Equipment Operator Labor 012 hour
Entrust 25 oz
June 75HP 4WD Tractor Sprayer w20Boom Equipment Operator Labor 012 hour
Entrust 25 oz
Sept 75HP 4WD Tractor Sprayer w20Boom Equipment Operator Labor 012 hour
Entrust 25 oz
Worms (Dipel) May 75HP 4WD Tractor Sprayer w20Boom Equipment Operator Labor 012 hour
Dipel DF (Bt) 2 lb
June 75HP 4WD Tractor Sprayer w20Boom Equipment Operator Labor 012 hour
Dipel DF (Bt) 2 lb
Post Harvest Cleanup Oct 55HP 2WD Tractor Mower 4 Non-Machine Labor 95 hours
Oct Truck 1 Ton 1 Non-Machine Labor 6 hours
DumpFee Monterey 600 lb
Oct 90HP 4WD Tractor Disc-Offset 14 Non-Machine Labor 9 hours
Pickup Business Use Oct Pickup Truck 12 T Equipment Operator Labor 205 hours
ATV Oct ATV 4WD Equipment Operator Labor 071 hour
Harvest Regular amp Peak Apr Harvest Labor 7589 hours
8 Clamshell +Tray 2125 each
May Harvest Labor 11775 hours
8 Clamshell +Tray 510 each
June Harvest Labor 21766 hours
8 Clamshell +Tray 106250 each
2014 Strawberries Organic Costs and Returns Study Central Coast UC Cooperative Extension 23
UC COOPERATIVE EXTENSION CENTRAL COAST - 2014 Table 7 CONTINUED
Operation Labor Type Rate Operation Month Tractor Implement Material acre Unit
Harvest Regular amp Peak July Harvest Labor 21766 hours 8 Clamshell +Tray 106250 each
Aug Harvest Labor 15671 hours 8 Clamshell +Tray 765 each
Sept Harvest Labor 11775 hours 8 Clamshell +Tray 510 each
Oct Truck 1 Ton 1 Harvest Labor 4551 hours 8 Clamshell +Tray 1275 each
Harvest Load amp Haul Apr Truck 1 Ton 1 Non-Machine Labor 157 hours May Truck 1 Ton 2 Non-Machine Labor 227 hours June Truck 1 Ton 1 Non-Machine Labor 337 hours July Truck 1 Ton 2 Non-Machine Labor 337 hours Aug Truck 1 Ton 1 Non-Machine Labor 283 hours Sept Truck 1 Ton 2 Non-Machine Labor 227 hours Oct Truck 1 Ton 1 Non-Machine Labor 094 hour
Harvest Cooler Apr Cooler 2125 tray May Cooler 510 tray June Equipment Operator Labor 532 hours
Cooler 106250 tray July Cooler 106250 tray Aug Cooler 765 tray Sept Cooler 510 tray Oct Cooler 1275 tray
Assessment Apr Strawberry Commiss 2125 tray May Strawberry Commiss 510 tray June Strawberry Commiss 106250 tray July Strawberry Commiss 106250 tray Aug Strawberry Commiss 765 tray Sept Strawberry Commiss 510 tray Oct Strawberry Commiss 1275 tray
Sales Apr Sales Commission 8 2125 tray May Sales Commission 8 510 tray June Sales Commission 8 106250 tray July Sales Commission 8 106250 tray Aug Sales Commission 8 765 tray Sept Sales Commission 8 510 tray Oct Sales Commission 8 1275 tray
2014 Strawberries Organic Costs and Returns Study Central Coast UC Cooperative Extension 24

UC COOPERATIVE EXTENSION CENTRAL COAST - 2014
Table 5 WHOLE FARM ANNUAL EQUIPMENT INVESTMENT AND BUSINESS OVERHEAD COSTS
ANNUAL EQUIPMENT COSTS
Cash Overhead Yrs Salvage Capital Insur-
Yr Description Price Life Value Recovery ance Taxes Total 14 55HP 2WD Tractor 32269 10 9532 3362 173 209 3744 14 75HP 4WD Tractor 45000 20 5774 3355 210 254 3820 14 90HP 4WD Tractor 47000 20 6031 3505 220 265 3990 14 ATV 4WD 7430 7 2818 924 42 51 1017 14 Blade Rear 3 pt 8 1560 20 81 120 7 8 135 14 Cultivator 3R 12 5000 20 261 385 22 26 433 14 Disc-Offset 14 16000 20 834 1231 70 84 1385 14 Drip Machine 1-48R 3500 15 336 316 16 19 351 14 ListerShaper 3-48R 5000 15 480 451 23 27 501 14 Mulch Machine 1-48R 3000 20 156 231 13 16 260 14 Pickup Truck 12 T 28000 5 12549 4140 168 203 4511 14 Punch Machine 1-48R 5000 20 261 385 22 26 433 14 Ripper-5 Shank 18 10800 20 563 831 47 57 935 14 Sprayer w20Boom 3700 5 1205 630 20 25 674 14 Trailer-Pipe 1950 20 102 150 9 10 169 14 Triplane 15 22200 20 1157 1708 97 117 1921 14 Truck 1 Ton 1 36000 5 16134 5323 216 261 5800 14 Mower 4 3500 20 182 269 15 18 303 14 Bug Vacuum 35000 2 16448 10723 213 257 11194 14 Chisel 12 12000 20 625 923 52 63 1039 14 Truck 1 Ton 2 36000 5 16134 5323 216 261 5800 TOTAL 359909 91664 44284 1872 2258 48414
60 of new cost 215945 54998 26570 1123 1355 29048 Used to reflect a mix of new and used equipment
ANNUAL INVESTMENT COSTS
Cash Overhead
Description Price Yrs Life
Salvage Value
Capital Recovery
Insur-ance Taxes Repairs Total
INVESTMENT Buildings 1200 sqft Fuel Tanks 2-300 gal Harvest Carts (70) 75HP Pump Filter Sprinkler Pipe Lateral Lines Shop Tools
42000 3500 1400
15000 60000 12000 15000
30 20
5 20 15
5 15
0 650
0 0 0 0
1500
2655 255 321
1178 5683 2753 1350
174 17
6 62
249 50 68
210 21
7 75
300 60 83
840 70 22
100 1200
220 300
3879 363 356
1415 7432 3082 1801
TOTAL INVESTMENT 148900 2150 14195 626 755 2752 18328
ANNUAL BUSINESS OVERHEAD COSTS
Units Price Total Description Farm Unit Unit Cost
Office Expense 30 acre 75000 22250 Food Safety 27 acre 3000 810 Land Rent 30 acre 270000 81000 Liability Insurance 30 acre 2090 627 Sanitation Fee 27 acre 23481 6340 Regulatory Programs 27 acre 5000 1350 Organic CertRegistration 27 acre 17600 4752 Ranch Supervisor 30 acre 100000 30000
2014 Strawberries Organic Costs and Returns Study Central Coast UC Cooperative Extension 18
UC COOPERATIVE EXTENSION
CENTRAL COAST - 2014
Table 6 HOURLY EQUIPMENT COSTS
COSTS PER HOUR
Strawberry Total Cash Overhead Operating
Hours Hours Capital Insur- Lube amp Fuel Total Total Yr Description Used Used Recovery ance Taxes Repairs Oper CostsHr
14 55HP 2WD Tractor 961 1200 168 009 010 294 962 1256 1443
14 75HP 4WD Tractor 128 600 336 021 025 389 1311 1700 2082
14 90HP 4WD Tractor 194 800 263 016 020 351 1573 1924 2223
14 ATV 4WD 16 285 194 009 011 094 262 356 570
14 Blade Rear 3 pt 8 28 100 072 004 005 000 000 000 081
14 Cultivator 3R 12 20 100 231 013 016 099 000 099 358
14 Disc-Offset 14 47 100 739 042 051 247 000 247 1078
14 Drip Machine 1-48R 55 100 189 010 012 092 000 092 303
14 ListerShaper 3-48R 54 133 203 010 012 101 000 101 327
14 Mulch Machine 1-48R 41 100 138 008 009 033 000 033 189
14 Pickup Truck 12 T 46 400 621 025 030 356 983 1339 2015
14 Punch Machine 1-48R 20 100 231 013 016 055 000 055 315
14 Ripper-5 Shank 18 49 125 399 023 027 340 000 340 788
14 Sprayer w20Boom 82 300 126 004 005 101 000 101 236
14 Trailer-Pipe 89 200 045 003 003 000 000 000 051
14 Triplane 15 27 150 683 039 047 330 000 330 1099
14 Truck 1 Ton 1 760 760 420 017 021 261 491 752 1210
14 Mower 4 10 100 162 009 011 157 000 157 338
14 Bug Vacuum 641 750 858 017 021 968 000 968 1864
14 Chisel 12 15 75 739 042 051 219 000 219 1049
14 Truck 1 Ton 2 654 654 488 020 024 291 491 782 1314
2014 Strawberries Organic Costs and Returns Study Central Coast UC Cooperative Extension 19
UC COOPERATIVE EXTENSION
CENTRAL COAST - 2014
Table 7 OPERATIONS WITH EQUIPMENT AND MATERIALS
Operation Labor Type Rate
Operation Month Tractor Implement Material acre Unit
Soil Samples (2 per 27 acres) Sept Soil Analysis 004 farm
Disk 2X (Cover Crop) Sept 90HP 4WD Tractor Disc-Offset 14 Equipment Operator Labor 06 hour
Compost + Spread Sept Compost 5 ton
Spread CompostMeal 1 acre
Sprinklers Setup amp Removal Sept 55HP 2WD Tractor Trailer-Pipe Non-Machine Labor 15 hours
Oct 55HP 2WD Tractor Trailer-Pipe Non-Machine Labor 15 hours
Irrigate OH Sprinkle Sept Irrigation Labor 13 hours
Water Pumped 1 acin
Oct Irrigation Labor 115 hours
Water Pumped 05 acin
Oct Non-Machine Labor 13 hours
Water Pumped 1 acin
Subsoil 5X Sept 90HP 4WD Tractor Ripper-5 Shank 18 Equipment Operator Labor 216 hours
Level (Triplane) Sept 90HP 4WD Tractor Triplane 15 Equipment Operator Labor 12 hours
Disk 4X Sept 90HP 4WD Tractor Disc-Offset 14 Equipment Operator Labor 12 hours
Chisel 2X Sept 75HP 4WD Tractor Chisel 12 Equipment Operator Labor 065 hour
Bloodmeal amp Gypsum + Spread Oct Bloodmeal 500 lb
Spread CompostMeal 1 acre
Gypsum 2 ton
Beds ListShape Oct 90HP 4WD Tractor LstrShpr 3-48R Equipment Operator Labor 12 hours
Beds Re-ListedRe-Shaped Oct 90HP 4WD Tractor LstrShpr 3-48R Equipment Operator Labor 12 hours
Install Drip System Tape Later Oct 55HP 2WD Tractor Drip Mchne 1-48R Non-Machine Labor 1 hour
T-Tape 2178000 foot
Oct 55HP 2WD Tractor Blade Rear 3 pt 8 Non-Machine Labor 01 hour
Plant Lay Mulch Oct 55HP 2WD Tractor Mulch Mchne 1-48R Equipment Operator Labor 18 hours
BlackPlasticMulch 275 roll
Plant Punch Planting Holes Oct 55HP 2WD Tractor Punch Mchn 1-48R Equipment Operator Labor 09 hour
Plant Strawberries (5 replant) Oct Non-Machine Labor 525 hours
Strawberry Plants 2286900 each
Weed Hand Dec Non-Machine Labor 20 hours
Jan Non-Machine Labor 20 hours
Feb Non-Machine Labor 20 hours
Mar Non-Machine Labor 20 hours
Apr Non-Machine Labor 20 hours
May Non-Machine Labor 20 hours
June Non-Machine Labor 20 hours
July Non-Machine Labor 20 hours
Aug Non-Machine Labor 20 hours
Sept Non-Machine Labor 20 hours
2014 Strawberries Organic Costs and Returns Study Central Coast UC Cooperative Extension 20
UC COOPERATIVE EXTENSION
CENTRAL COAST - 2014
Table 7 CONTINUED
Operation Labor Type Rate
Operation Month Tractor Implement Material acre Unit
Insect Mites (predatory) Feb Non-Machine Labor 2 hours
Persimilis (Mite) 40 thou
Mar Non-Machine Labor 2 hours
Persimilis (Mite) 40 thou
Weed Cultivate Feb 75HP 4WD Tractor Cultivator 3R 12 Equipment Operator Labor 03 hour
Mar 75HP 4WD Tractor Cultivator 3R 12 Equipment Operator Labor 03 hour
Apr 75HP 4WD Tractor Cultivator 3R 12 Equipment Operator Labor 03 hour
Fertilize Foliar (Biomin) Feb 75HP 4WD Tractor Sprayer w20Boom Equipment Operator Labor 012 hour
Biomin Calcium 1 gal
Mar 75HP 4WD Tractor Sprayer w20Boom Equipment Operator Labor 012 hour
Biomin Calcium 1 gal
Apr 75HP 4WD Tractor Sprayer w20Boom Equipment Operator Labor 012 hour
Biomin Calcium 1 gal
May 75HP 4WD Tractor Sprayer w20Boom Equipment Operator Labor 012 hour
Biomin Calcium 1 gal
June 75HP 4WD Tractor Sprayer w20Boom Equipment Operator Labor 012 hour
Biomin Calcium 1 gal
July 75HP 4WD Tractor Sprayer w20Boom Equipment Operator Labor 012 hour
Biomin Calcium 1 gal
Aug 75HP 4WD Tractor Sprayer w20Boom Equipment Operator Labor 012 hour
Biomin Calcium 1 gal
Sept 75HP 4WD Tractor Sprayer w20Boom Equipment Operator Labor 012 hour
Biomin Calcium 1 gal
Fertilize Foliar (Maxi) Feb 75HP 4WD Tractor Sprayer w20Boom Equipment Operator Labor 012 hour
Maxi-Crop 25 lb
Mar 75HP 4WD Tractor Sprayer w20Boom Equipment Operator Labor 012 hour
Maxi-Crop 25 lb
Apr 75HP 4WD Tractor Sprayer w20Boom Equipment Operator Labor 012 hour
Maxi-Crop 25 lb
May 75HP 4WD Tractor Sprayer w20Boom Equipment Operator Labor 012 hour
Maxi-Crop 25 lb
June 75HP 4WD Tractor Sprayer w20Boom Equipment Operator Labor 012 hour
Maxi-Crop 25 lb
July 75HP 4WD Tractor Sprayer w20Boom Equipment Operator Labor 012 hour
Maxi-Crop 25 lb
Aug 75HP 4WD Tractor Sprayer w20Boom Equipment Operator Labor 012 hour
Maxi-Crop 25 lb
Sept 75HP 4WD Tractor Sprayer w20Boom Equipment Operator Labor 012 hour
Maxi-Crop 25 lb
2014 Strawberries Organic Costs and Returns Study Central Coast UC Cooperative Extension 21
UC COOPERATIVE EXTENSION
CENTRAL COAST - 2014
Table 7 CONTINUED
Operation Labor Type Rate
Operation Month Tractor Implement Material acre Unit
Vertebrate Trapping Feb Non-Machine Labor 04 hour
Mar Non-Machine Labor 04 hour
Apr Non-Machine Labor 04 hour
May Non-Machine Labor 04 hour
June Non-Machine Labor 04 hour
Pest Control Adviser (PCA) Mar PCA fee 1 acre
Irrigate Drip Mar Non-Machine Labor 171 hours
Water Pumped 343 acin
Apr Non-Machine Labor 171 hours
Water Pumped 343 acin
May Non-Machine Labor 171 hours
Water Pumped 343 acin
June Non-Machine Labor 171 hours
Water Pumped 343 acin
July Non-Machine Labor 171 hours
Water Pumped 343 acin
Aug Non-Machine Labor 171 hours
Water Pumped 343 acin
Sept Non-Machine Labor 171 hours
Water Pumped 342 acin
Fertilize Through Drip (Agro) Mar Non-Machine Labor 043 hour
Agrothrive LF 10 gal
Apr Non-Machine Labor 043 hour
Agrothrive LF 10 gal
May Non-Machine Labor 043 hour
Agrothrive LF 10 gal
June Non-Machine Labor 043 hour
Agrothrive LF 10 gal
July Non-Machine Labor 043 hour
Agrothrive LF 10 gal
Aug Non-Machine Labor 043 hour
Agrothrive LF 10 gal
Sept Non-Machine Labor 042 hour
Agrothrive LF 10 gal
Insect Vacuum Lygus 8Xmonth Apr 55HP 2WD Tractor Bug Vacuum Equipment Operator Labor 407 hours
May 55HP 2WD Tractor Bug Vacuum Equipment Operator Labor 407 hours
June 55HP 2WD Tractor Bug Vacuum Equipment Operator Labor 407 hours
July 55HP 2WD Tractor Bug Vacuum Equipment Operator Labor 407 hours
Aug 55HP 2WD Tractor Bug Vacuum Equipment Operator Labor 407 hours
Sept 55HP 2WD Tractor Bug Vacuum Equipment Operator Labor 407 hours
Oct 55HP 2WD Tractor Bug Vacuum Equipment Operator Labor 407 hours
2014 Strawberries Organic Costs and Returns Study Central Coast UC Cooperative Extension 22
UC COOPERATIVE EXTENSION
CENTRAL COAST - 2014
Table 7 CONTINUED
Operation Labor Type Rate
Operation Month Tractor Implement Material acre Unit
Disease Powdery Mildew (Sulfur) Mar 75HP 4WD Tractor Sprayer w20Boom Equipment Operator Labor 024 hour
Kumulus DF 5 lb
Apr 75HP 4WD Tractor Sprayer w20Boom Equipment Operator Labor 024 hour
Kumulus DF 5 lb
May 75HP 4WD Tractor Sprayer w20Boom Equipment Operator Labor 012 hour
Kumulus DF 5 lb
June 75HP 4WD Tractor Sprayer w20Boom Equipment Operator Labor 012 hour
Kumulus DF 10 lb
July 75HP 4WD Tractor Sprayer w20Boom Equipment Operator Labor 012 hour
Kumulus DF 5 lb
Aug 75HP 4WD Tractor Sprayer w20Boom Equipment Operator Labor 012 hour
Kumulus DF 5 lb
Sept 75HP 4WD Tractor Sprayer w20Boom Equipment Operator Labor 012 hour
Kumulus DF 5 lb
Oct 75HP 4WD Tractor Sprayer w20Boom Equipment Operator Labor 012 hour
Kumulus DF 5 lb
Insect LBAM (Entrust) May 75HP 4WD Tractor Sprayer w20Boom Equipment Operator Labor 012 hour
Entrust 25 oz
June 75HP 4WD Tractor Sprayer w20Boom Equipment Operator Labor 012 hour
Entrust 25 oz
Sept 75HP 4WD Tractor Sprayer w20Boom Equipment Operator Labor 012 hour
Entrust 25 oz
Worms (Dipel) May 75HP 4WD Tractor Sprayer w20Boom Equipment Operator Labor 012 hour
Dipel DF (Bt) 2 lb
June 75HP 4WD Tractor Sprayer w20Boom Equipment Operator Labor 012 hour
Dipel DF (Bt) 2 lb
Post Harvest Cleanup Oct 55HP 2WD Tractor Mower 4 Non-Machine Labor 95 hours
Oct Truck 1 Ton 1 Non-Machine Labor 6 hours
DumpFee Monterey 600 lb
Oct 90HP 4WD Tractor Disc-Offset 14 Non-Machine Labor 9 hours
Pickup Business Use Oct Pickup Truck 12 T Equipment Operator Labor 205 hours
ATV Oct ATV 4WD Equipment Operator Labor 071 hour
Harvest Regular amp Peak Apr Harvest Labor 7589 hours
8 Clamshell +Tray 2125 each
May Harvest Labor 11775 hours
8 Clamshell +Tray 510 each
June Harvest Labor 21766 hours
8 Clamshell +Tray 106250 each
2014 Strawberries Organic Costs and Returns Study Central Coast UC Cooperative Extension 23
UC COOPERATIVE EXTENSION CENTRAL COAST - 2014 Table 7 CONTINUED
Operation Labor Type Rate Operation Month Tractor Implement Material acre Unit
Harvest Regular amp Peak July Harvest Labor 21766 hours 8 Clamshell +Tray 106250 each
Aug Harvest Labor 15671 hours 8 Clamshell +Tray 765 each
Sept Harvest Labor 11775 hours 8 Clamshell +Tray 510 each
Oct Truck 1 Ton 1 Harvest Labor 4551 hours 8 Clamshell +Tray 1275 each
Harvest Load amp Haul Apr Truck 1 Ton 1 Non-Machine Labor 157 hours May Truck 1 Ton 2 Non-Machine Labor 227 hours June Truck 1 Ton 1 Non-Machine Labor 337 hours July Truck 1 Ton 2 Non-Machine Labor 337 hours Aug Truck 1 Ton 1 Non-Machine Labor 283 hours Sept Truck 1 Ton 2 Non-Machine Labor 227 hours Oct Truck 1 Ton 1 Non-Machine Labor 094 hour
Harvest Cooler Apr Cooler 2125 tray May Cooler 510 tray June Equipment Operator Labor 532 hours
Cooler 106250 tray July Cooler 106250 tray Aug Cooler 765 tray Sept Cooler 510 tray Oct Cooler 1275 tray
Assessment Apr Strawberry Commiss 2125 tray May Strawberry Commiss 510 tray June Strawberry Commiss 106250 tray July Strawberry Commiss 106250 tray Aug Strawberry Commiss 765 tray Sept Strawberry Commiss 510 tray Oct Strawberry Commiss 1275 tray
Sales Apr Sales Commission 8 2125 tray May Sales Commission 8 510 tray June Sales Commission 8 106250 tray July Sales Commission 8 106250 tray Aug Sales Commission 8 765 tray Sept Sales Commission 8 510 tray Oct Sales Commission 8 1275 tray
2014 Strawberries Organic Costs and Returns Study Central Coast UC Cooperative Extension 24
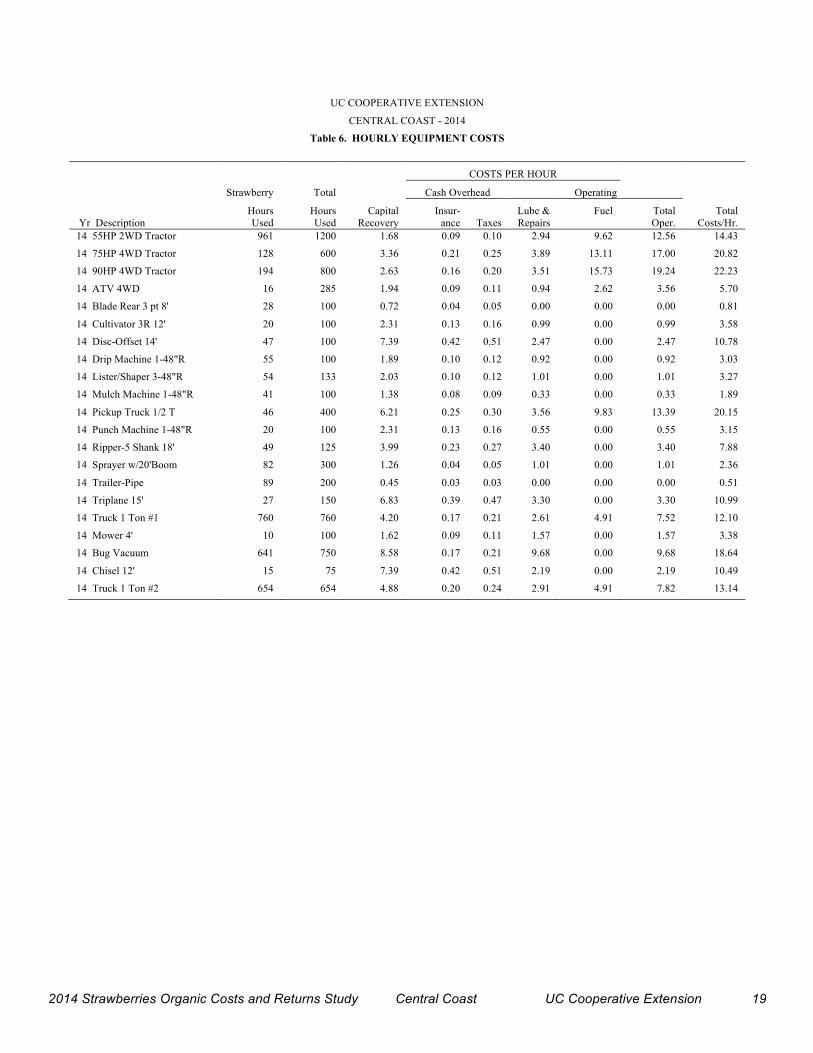
UC COOPERATIVE EXTENSION
CENTRAL COAST - 2014
Table 7 CONTINUED
Operation Labor Type Rate
Operation Month Tractor Implement Material acre Unit
Insect Mites (predatory) Feb Non-Machine Labor 2 hours
Persimilis (Mite) 40 thou
Mar Non-Machine Labor 2 hours
Persimilis (Mite) 40 thou
Weed Cultivate Feb 75HP 4WD Tractor Cultivator 3R 12 Equipment Operator Labor 03 hour
Mar 75HP 4WD Tractor Cultivator 3R 12 Equipment Operator Labor 03 hour
Apr 75HP 4WD Tractor Cultivator 3R 12 Equipment Operator Labor 03 hour
Fertilize Foliar (Biomin) Feb 75HP 4WD Tractor Sprayer w20Boom Equipment Operator Labor 012 hour
Biomin Calcium 1 gal
Mar 75HP 4WD Tractor Sprayer w20Boom Equipment Operator Labor 012 hour
Biomin Calcium 1 gal
Apr 75HP 4WD Tractor Sprayer w20Boom Equipment Operator Labor 012 hour
Biomin Calcium 1 gal
May 75HP 4WD Tractor Sprayer w20Boom Equipment Operator Labor 012 hour
Biomin Calcium 1 gal
June 75HP 4WD Tractor Sprayer w20Boom Equipment Operator Labor 012 hour
Biomin Calcium 1 gal
July 75HP 4WD Tractor Sprayer w20Boom Equipment Operator Labor 012 hour
Biomin Calcium 1 gal
Aug 75HP 4WD Tractor Sprayer w20Boom Equipment Operator Labor 012 hour
Biomin Calcium 1 gal
Sept 75HP 4WD Tractor Sprayer w20Boom Equipment Operator Labor 012 hour
Biomin Calcium 1 gal
Fertilize Foliar (Maxi) Feb 75HP 4WD Tractor Sprayer w20Boom Equipment Operator Labor 012 hour
Maxi-Crop 25 lb
Mar 75HP 4WD Tractor Sprayer w20Boom Equipment Operator Labor 012 hour
Maxi-Crop 25 lb
Apr 75HP 4WD Tractor Sprayer w20Boom Equipment Operator Labor 012 hour
Maxi-Crop 25 lb
May 75HP 4WD Tractor Sprayer w20Boom Equipment Operator Labor 012 hour
Maxi-Crop 25 lb
June 75HP 4WD Tractor Sprayer w20Boom Equipment Operator Labor 012 hour
Maxi-Crop 25 lb
July 75HP 4WD Tractor Sprayer w20Boom Equipment Operator Labor 012 hour
Maxi-Crop 25 lb
Aug 75HP 4WD Tractor Sprayer w20Boom Equipment Operator Labor 012 hour
Maxi-Crop 25 lb
Sept 75HP 4WD Tractor Sprayer w20Boom Equipment Operator Labor 012 hour
Maxi-Crop 25 lb
2014 Strawberries Organic Costs and Returns Study Central Coast UC Cooperative Extension 21
UC COOPERATIVE EXTENSION
CENTRAL COAST - 2014
Table 7 CONTINUED
Operation Labor Type Rate
Operation Month Tractor Implement Material acre Unit
Vertebrate Trapping Feb Non-Machine Labor 04 hour
Mar Non-Machine Labor 04 hour
Apr Non-Machine Labor 04 hour
May Non-Machine Labor 04 hour
June Non-Machine Labor 04 hour
Pest Control Adviser (PCA) Mar PCA fee 1 acre
Irrigate Drip Mar Non-Machine Labor 171 hours
Water Pumped 343 acin
Apr Non-Machine Labor 171 hours
Water Pumped 343 acin
May Non-Machine Labor 171 hours
Water Pumped 343 acin
June Non-Machine Labor 171 hours
Water Pumped 343 acin
July Non-Machine Labor 171 hours
Water Pumped 343 acin
Aug Non-Machine Labor 171 hours
Water Pumped 343 acin
Sept Non-Machine Labor 171 hours
Water Pumped 342 acin
Fertilize Through Drip (Agro) Mar Non-Machine Labor 043 hour
Agrothrive LF 10 gal
Apr Non-Machine Labor 043 hour
Agrothrive LF 10 gal
May Non-Machine Labor 043 hour
Agrothrive LF 10 gal
June Non-Machine Labor 043 hour
Agrothrive LF 10 gal
July Non-Machine Labor 043 hour
Agrothrive LF 10 gal
Aug Non-Machine Labor 043 hour
Agrothrive LF 10 gal
Sept Non-Machine Labor 042 hour
Agrothrive LF 10 gal
Insect Vacuum Lygus 8Xmonth Apr 55HP 2WD Tractor Bug Vacuum Equipment Operator Labor 407 hours
May 55HP 2WD Tractor Bug Vacuum Equipment Operator Labor 407 hours
June 55HP 2WD Tractor Bug Vacuum Equipment Operator Labor 407 hours
July 55HP 2WD Tractor Bug Vacuum Equipment Operator Labor 407 hours
Aug 55HP 2WD Tractor Bug Vacuum Equipment Operator Labor 407 hours
Sept 55HP 2WD Tractor Bug Vacuum Equipment Operator Labor 407 hours
Oct 55HP 2WD Tractor Bug Vacuum Equipment Operator Labor 407 hours
2014 Strawberries Organic Costs and Returns Study Central Coast UC Cooperative Extension 22
UC COOPERATIVE EXTENSION
CENTRAL COAST - 2014
Table 7 CONTINUED
Operation Labor Type Rate
Operation Month Tractor Implement Material acre Unit
Disease Powdery Mildew (Sulfur) Mar 75HP 4WD Tractor Sprayer w20Boom Equipment Operator Labor 024 hour
Kumulus DF 5 lb
Apr 75HP 4WD Tractor Sprayer w20Boom Equipment Operator Labor 024 hour
Kumulus DF 5 lb
May 75HP 4WD Tractor Sprayer w20Boom Equipment Operator Labor 012 hour
Kumulus DF 5 lb
June 75HP 4WD Tractor Sprayer w20Boom Equipment Operator Labor 012 hour
Kumulus DF 10 lb
July 75HP 4WD Tractor Sprayer w20Boom Equipment Operator Labor 012 hour
Kumulus DF 5 lb
Aug 75HP 4WD Tractor Sprayer w20Boom Equipment Operator Labor 012 hour
Kumulus DF 5 lb
Sept 75HP 4WD Tractor Sprayer w20Boom Equipment Operator Labor 012 hour
Kumulus DF 5 lb
Oct 75HP 4WD Tractor Sprayer w20Boom Equipment Operator Labor 012 hour
Kumulus DF 5 lb
Insect LBAM (Entrust) May 75HP 4WD Tractor Sprayer w20Boom Equipment Operator Labor 012 hour
Entrust 25 oz
June 75HP 4WD Tractor Sprayer w20Boom Equipment Operator Labor 012 hour
Entrust 25 oz
Sept 75HP 4WD Tractor Sprayer w20Boom Equipment Operator Labor 012 hour
Entrust 25 oz
Worms (Dipel) May 75HP 4WD Tractor Sprayer w20Boom Equipment Operator Labor 012 hour
Dipel DF (Bt) 2 lb
June 75HP 4WD Tractor Sprayer w20Boom Equipment Operator Labor 012 hour
Dipel DF (Bt) 2 lb
Post Harvest Cleanup Oct 55HP 2WD Tractor Mower 4 Non-Machine Labor 95 hours
Oct Truck 1 Ton 1 Non-Machine Labor 6 hours
DumpFee Monterey 600 lb
Oct 90HP 4WD Tractor Disc-Offset 14 Non-Machine Labor 9 hours
Pickup Business Use Oct Pickup Truck 12 T Equipment Operator Labor 205 hours
ATV Oct ATV 4WD Equipment Operator Labor 071 hour
Harvest Regular amp Peak Apr Harvest Labor 7589 hours
8 Clamshell +Tray 2125 each
May Harvest Labor 11775 hours
8 Clamshell +Tray 510 each
June Harvest Labor 21766 hours
8 Clamshell +Tray 106250 each
2014 Strawberries Organic Costs and Returns Study Central Coast UC Cooperative Extension 23
UC COOPERATIVE EXTENSION CENTRAL COAST - 2014 Table 7 CONTINUED
Operation Labor Type Rate Operation Month Tractor Implement Material acre Unit
Harvest Regular amp Peak July Harvest Labor 21766 hours 8 Clamshell +Tray 106250 each
Aug Harvest Labor 15671 hours 8 Clamshell +Tray 765 each
Sept Harvest Labor 11775 hours 8 Clamshell +Tray 510 each
Oct Truck 1 Ton 1 Harvest Labor 4551 hours 8 Clamshell +Tray 1275 each
Harvest Load amp Haul Apr Truck 1 Ton 1 Non-Machine Labor 157 hours May Truck 1 Ton 2 Non-Machine Labor 227 hours June Truck 1 Ton 1 Non-Machine Labor 337 hours July Truck 1 Ton 2 Non-Machine Labor 337 hours Aug Truck 1 Ton 1 Non-Machine Labor 283 hours Sept Truck 1 Ton 2 Non-Machine Labor 227 hours Oct Truck 1 Ton 1 Non-Machine Labor 094 hour
Harvest Cooler Apr Cooler 2125 tray May Cooler 510 tray June Equipment Operator Labor 532 hours
Cooler 106250 tray July Cooler 106250 tray Aug Cooler 765 tray Sept Cooler 510 tray Oct Cooler 1275 tray
Assessment Apr Strawberry Commiss 2125 tray May Strawberry Commiss 510 tray June Strawberry Commiss 106250 tray July Strawberry Commiss 106250 tray Aug Strawberry Commiss 765 tray Sept Strawberry Commiss 510 tray Oct Strawberry Commiss 1275 tray
Sales Apr Sales Commission 8 2125 tray May Sales Commission 8 510 tray June Sales Commission 8 106250 tray July Sales Commission 8 106250 tray Aug Sales Commission 8 765 tray Sept Sales Commission 8 510 tray Oct Sales Commission 8 1275 tray
2014 Strawberries Organic Costs and Returns Study Central Coast UC Cooperative Extension 24
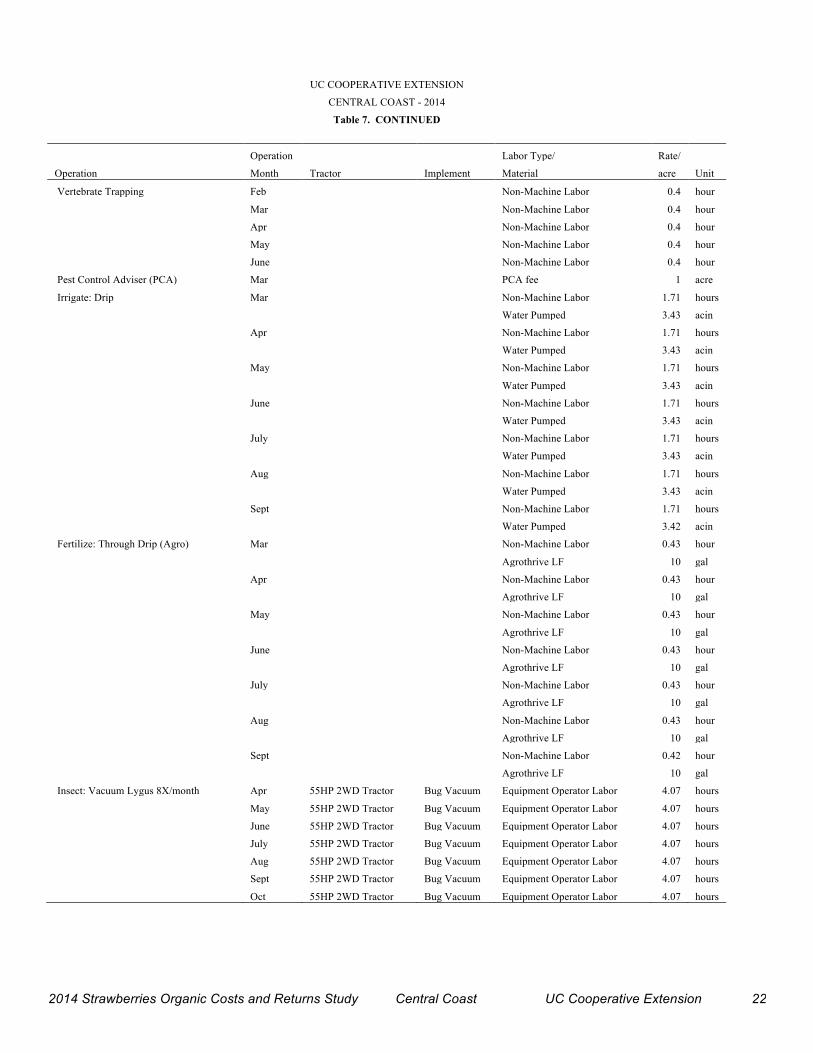
UC COOPERATIVE EXTENSION
CENTRAL COAST - 2014
Table 7 CONTINUED
Operation Labor Type Rate
Operation Month Tractor Implement Material acre Unit
Disease Powdery Mildew (Sulfur) Mar 75HP 4WD Tractor Sprayer w20Boom Equipment Operator Labor 024 hour
Kumulus DF 5 lb
Apr 75HP 4WD Tractor Sprayer w20Boom Equipment Operator Labor 024 hour
Kumulus DF 5 lb
May 75HP 4WD Tractor Sprayer w20Boom Equipment Operator Labor 012 hour
Kumulus DF 5 lb
June 75HP 4WD Tractor Sprayer w20Boom Equipment Operator Labor 012 hour
Kumulus DF 10 lb
July 75HP 4WD Tractor Sprayer w20Boom Equipment Operator Labor 012 hour
Kumulus DF 5 lb
Aug 75HP 4WD Tractor Sprayer w20Boom Equipment Operator Labor 012 hour
Kumulus DF 5 lb
Sept 75HP 4WD Tractor Sprayer w20Boom Equipment Operator Labor 012 hour
Kumulus DF 5 lb
Oct 75HP 4WD Tractor Sprayer w20Boom Equipment Operator Labor 012 hour
Kumulus DF 5 lb
Insect LBAM (Entrust) May 75HP 4WD Tractor Sprayer w20Boom Equipment Operator Labor 012 hour
Entrust 25 oz
June 75HP 4WD Tractor Sprayer w20Boom Equipment Operator Labor 012 hour
Entrust 25 oz
Sept 75HP 4WD Tractor Sprayer w20Boom Equipment Operator Labor 012 hour
Entrust 25 oz
Worms (Dipel) May 75HP 4WD Tractor Sprayer w20Boom Equipment Operator Labor 012 hour
Dipel DF (Bt) 2 lb
June 75HP 4WD Tractor Sprayer w20Boom Equipment Operator Labor 012 hour
Dipel DF (Bt) 2 lb
Post Harvest Cleanup Oct 55HP 2WD Tractor Mower 4 Non-Machine Labor 95 hours
Oct Truck 1 Ton 1 Non-Machine Labor 6 hours
DumpFee Monterey 600 lb
Oct 90HP 4WD Tractor Disc-Offset 14 Non-Machine Labor 9 hours
Pickup Business Use Oct Pickup Truck 12 T Equipment Operator Labor 205 hours
ATV Oct ATV 4WD Equipment Operator Labor 071 hour
Harvest Regular amp Peak Apr Harvest Labor 7589 hours
8 Clamshell +Tray 2125 each
May Harvest Labor 11775 hours
8 Clamshell +Tray 510 each
June Harvest Labor 21766 hours
8 Clamshell +Tray 106250 each
2014 Strawberries Organic Costs and Returns Study Central Coast UC Cooperative Extension 23
UC COOPERATIVE EXTENSION CENTRAL COAST - 2014 Table 7 CONTINUED
Operation Labor Type Rate Operation Month Tractor Implement Material acre Unit
Harvest Regular amp Peak July Harvest Labor 21766 hours 8 Clamshell +Tray 106250 each
Aug Harvest Labor 15671 hours 8 Clamshell +Tray 765 each
Sept Harvest Labor 11775 hours 8 Clamshell +Tray 510 each
Oct Truck 1 Ton 1 Harvest Labor 4551 hours 8 Clamshell +Tray 1275 each
Harvest Load amp Haul Apr Truck 1 Ton 1 Non-Machine Labor 157 hours May Truck 1 Ton 2 Non-Machine Labor 227 hours June Truck 1 Ton 1 Non-Machine Labor 337 hours July Truck 1 Ton 2 Non-Machine Labor 337 hours Aug Truck 1 Ton 1 Non-Machine Labor 283 hours Sept Truck 1 Ton 2 Non-Machine Labor 227 hours Oct Truck 1 Ton 1 Non-Machine Labor 094 hour
Harvest Cooler Apr Cooler 2125 tray May Cooler 510 tray June Equipment Operator Labor 532 hours
Cooler 106250 tray July Cooler 106250 tray Aug Cooler 765 tray Sept Cooler 510 tray Oct Cooler 1275 tray
Assessment Apr Strawberry Commiss 2125 tray May Strawberry Commiss 510 tray June Strawberry Commiss 106250 tray July Strawberry Commiss 106250 tray Aug Strawberry Commiss 765 tray Sept Strawberry Commiss 510 tray Oct Strawberry Commiss 1275 tray
Sales Apr Sales Commission 8 2125 tray May Sales Commission 8 510 tray June Sales Commission 8 106250 tray July Sales Commission 8 106250 tray Aug Sales Commission 8 765 tray Sept Sales Commission 8 510 tray Oct Sales Commission 8 1275 tray
2014 Strawberries Organic Costs and Returns Study Central Coast UC Cooperative Extension 24