sample - construction cost estimating data · ries, reference books, internet data and various cost...
TRANSCRIPT
SAMPLE

Compass International Consultants Inc.Morrisville, Pennsylvania, USA
2019 Front-End / Conceptual Estimating Yearbook18TH ANNUAL EDITION
•Front End / Conceptual CAPEX Estimating Issues •Capital Cost Estimating Fundamentals •Capital Cost Estimating Methods •Benchmarking Data •Exponent / Cost - Capacity Equations •Ratio / Percentage Factors and M.E. Multipliers •Square Foot / M2 Unit Prices (60 + Building - Facility Types) •Unit Prices (Labor & Materials) 1,000 + cost line items •Location Factors, Engineering / CM Fee’s, Labor Rates •Process Equipment Prices (8 5+ pages) •Front End / Semi-Detailed Estimating Systems
SAMPLE

SAMPLE
II. | CONTENTS
Copyright © 2019 Compass International, Inc.
3SECTION 3: SQUARE FOOT / SQUARE METER COST DATANew Industrial / Commercial Sq. Ft. – M2 Building Costs (100 + facility examples)Major Revamp / Rehabilitation IssuesModerate Revamp / Rehabilitation IssuesMinor Revamp / Superficial Facelift Issues25 floors - 200 apartments Major N.E. USA City
4SECTION 4: SEMI-DETAILED COST-ESTIMATING DATAGeneral Conditions / Demolition workSite Construction workCivil, Foundations / U.G. Utility workStructural Steel Framing / PlatformsExternal Wall SystemsRoofing, Siding & Miscellaneous itemsInternal walls / Doors / Ceilings / Flooring / GlassMaterial Handling Equipment and Specialized EquipmentMechanical Equipment / Plumbing / HVAC & Fire protectionElectrical / Instrumentation systemsClean room construction itemsHome Office Engineering, Procurement and Construction (EPC) Staff RatesTypical Engineering Production HoursProcess Piping SystemsPiping Material adjustmentsMajor Equipment Insulation“All In” Unit Material Price ChecklistBudget Pricing Stainless Steel Tubing / PipingAverage Number of Fittings / ValvesMajor Equipment and Piping InsulationInstrumentation CostsWelding metricsPipeline(s) MetricsRail Road Cost BenchmarksRobotic systemsIn-direct Labor Open Shop Benchmarks and AssumptionsWarehouse Miscellaneous Equipment
159
169
SAMPLE
CONTENTS | III.
Copyright © 2019 Compass International, Inc.
5SECTION 5: ESTIMATING MISCELLANEOUS SUPPORTING DATACheck-list of Front End Estimating / Site Management IssuesExcavation Equipment Production RatesReinforced Concrete 3,500 PSI / 25 MPA Budget PricingValue Engineering / Cost Optimization Methods (COM)USA & International Location FactorsEngineering Productivity V’S USA StandardsDetailed Design / Engineering / Architectural & CM FeesOpen Shop / Non - Union Labor CostsMaterial Adjustment Values (Piping)Sales Tax (50 US states and 10 Canadian Provinces)Production / Utility Equipment Benchmarks (90 + Cost models)Inflation / Compass Cost Index
6SECTION 6: EPC HISTORICAL COST MODELS & BENCHMARKSGeneral Production Benchmarks (80 +)Estimate Assessment Sheet / Ratio AnalysisMajor Equipment delivery times / USA Construction Productivity
265
433
SAMPLE

ABOUT THE FIRM
Compass International Consultants Inc. (C.I.C.I) was founded in 1992 and is a provider of Estimating Ser-vices, International Construction Cost Data, Location Factors, Estimating Training Seminars, Value Engi-neering, Production and Review of Claims, Estimating Support and a provider of Global Conceptual Con-struction Economic Cost Data. Compass International is backed by an excellent team of experienced Cost Engineers, Cost Estimators, Planners, Civil / Mechanical / Chemical Engineers and Economists.
Web site: http://www.compassinternational.net
Mailing Address: Compass International P.O. Box 1295Morrisville, PA. 19067 USA
Telephone(215) 504-9777(609) 577 4505
E Mail:[email protected]
Copyright © 2019 Compass International, Inc.
SAMPLE

Copyright © 2019 Compass International, Inc.
This data source is the result of more than 20+ year’s research and data collection. The information con-tained in this data source was collected from more than 100 + completed CAPEX projects (Refinery, Chemi-cal and Manufacturing facilities) located in North America, the UK, Mainland Europe, Asia, Africa and South America valued between $0.30 million to over $3 billion. The data is for the most part based on Com-pass International’s cost library, augmented with latest cost and labor data from International Development Banks and Agencies, EU Commission Reports, various Country National Libraries and Bibliotheques from around the world, various Government Information Agencies, Global Quasi-Governance Organizations, an assortment of Government Trade Promotion Departments / Labor Departments, numerous trade magazines, hourly and annual salary rates from US / Overseas labor organizations and newspaper articles, professional society articles, an assortment of technical magazine articles, various international almanacs and directo-ries, reference books, internet data and various cost – construction proposals and bids from contractors and engineering firms together with related journals, the cost models and tables have also been augmented by a number of personal estimating libraries (that in some cases are very recent), this information has been au-dited, expanded upon, modified and calibrated and refined to today’s construction methods and installation applications. We would like to express our sincere thanks to the many engineers, contractors, vendors and other individuals (friends and colleagues) too many to mention who have given freely of their advice, input, time and knowledge so that this data source could be produced for the benefit of engineering and construc-tion professionals that have an interest in this subject matter. We welcome any comments or data that could be used in future updates to make this database more complete and accurate.
Copyright © 2003 – 2019: By Compass International. All rights reserved. This information may not be reproduced or transmitted in any, electronic or mechanical means, including photocopying, faxing, scan-ning, uploading, copying and pasting, recording, or by any information storage or retrieval system without permission of the publisher; it is illegal and punishable by law. Compass International makes no warranty or guarantee as to the accuracy and completeness of the estimating data contained in this publication and assumes no liability for damages that are incurred by utilizing the data contained within this publication. The data is conceptual and should be considered +/- 15% accurate, the cost and man-hour data contained in this database should only be used as an early front end budgeting tool or as a check and audit against received bids or proposals. The publisher recommends obtaining a number of lump sum quotes and bids that are supported by a scope of work statement and a timeline of when the work would be completed, reliance on the data contained in this document could result in losing bids or worse still losing money. Compass International has no control over the cost of materials, labor and construction equipment, or over the com-petitive bidding or current market conditions, the data contained in this reference source is made from our experience and judgement and is presented as a general guide. Compass International assumes no liability for any damages that are incurred by utilizing and relying on any of the cost and man-hour data contained within this publication.
ACKNOWLEDGEMENTS
Compass International Consultants Inc.Morrisville, Pennsylvania, USA
SAMPLE

Copyright © 2019 Compass International, Inc.
he completion of a front-end estimate / conceptual estimate is usually the first step in the CAPEX Budgeting / Estimating process. This publication has been com-
piled to assist all construction professionals with an annual reference guide that will help them with “quick” reason-ably accurate construction prices for work associated with chemical plants, refineries, manufacturing facilities and other related indus-trial plants. A vast number of challenges and hurdles remain in place for “Process / Manufactur-ing / Chemical” companies (and their decisions to build new / revamped facilities): as we look into the future as of late 2018, the issues to be faced in 2019 and beyond include numerous issues (that have financial, construction and operat-ing cost consequences) that will need to be gauged and planned for, if the decision is made to proceed with the EPC effort. The Process / Manufacturing / Chemical industry as the engineering / construction professionals knew it in the early years of the last decade will have changed dramatically in the next two or three decades. Emerging economies such as China, India, Brazil and South Korea to name but a few will continue to forge ahead in developing their
T
General Information:Introduction to CAPEX Estimating
SECTION 1
Introduction to Front End / Conceptual Estimating: “A Front End / Conceptual estimate is an esti-mation of the cost of a proposed CAPEX project based on initial conceptual engineering and design data, even though the specific details are not clearly revealed or specified at this early stage of the proposed CAPEX project. An all-inclusive value is required to determine the viability of the pro-posed undertaking.”
R & D and manufacturing bases, there is an increas-ing anxiety in some of the more developed nations as to how this will all play out and what impact this manufacturing / economic “sea change” will have on the future employment opportunities, facility
costs and engineering / construc-tion activities in Western Europe, North America and around the world. Hopefully, this publica-tion and its’ future updates will assist the reader in navigating and understanding the dynamics of this situation, and the associated engineering / construction related costs specific to Process / Manu-
facturing / Chemical facilities.down all other legisla-tion topics.
THE GENERAL FORECAST FOR 2019 AND BEYOND(Specific to the Process / Manufacturing / Chemical Industry and to the construction of these facilities).
• The US construction industry will continue to struggle in 2019 with a shortage of skilled craft workers.
• The Global Enginnering, Procurement and Construction (EPC) market has had a ten year roller coaster ride. Asia, Africa and South America have
The US construction industry will continue to struggle in 2019 with a shortage of skilled craft workers.
SAMPLE

62. | SECTION 1
Copyright © 2019 Compass International, Inc.
are designed in a safe and cost effective manner. Successful capital EPC projects are deemed success-ful if they meet the legged stool metric previously referred to. It must be remembered that the end use of a capital project is to increase product sales, beat competitors to the market place, to operate the facility at lower unit operating costs and to be flex-ible and sustainable for the future growth goals of the owners operating unit (future expansion added operating units or addition production trains need to be considered- going forward). A capital cost esti-mate, to be effective management tool (and a project control tool) for implementation and future cost management and planning (consider a capital cost estimate as a road map – you start out in A and you need to get to Z). This document and an execution plan are key tools needed to get the project completed, the capital cost estimate should have line by line items (by Company code of accounts (COA) – or work break-down structure (WBS) where pos-sible) showing major equipment, freight costs, bulk and engineered materials together with construc-tion labor (man hours) by discipline i.e. civil, mechanical, piping, E/I, etc including indirect build up such as engineering costs and man hours, construction management, general conditions and contingency etc.. This data is needed to pragmatically establish, possible long lead major equipment items, extent of bulk materials, field labor requirements. Do we need to establish a concrete batching plant, design staffing needs, construction management needs, spare part requirements and period / timing / duration require-ments? The EPC project team requires “estimating details” as early as possible in the execution phase to plan the purchasing effort (buy out) and execute the project, perhaps by various work packages. Capital Cost Estimates can be (1) early front end concep-tual, (2) preliminary a decent amount of engineer-ing has been completed, or (3) definitive / lump
sum at least 50% of the required engineering effort has been compiled. These estimating types are of course reliant on the quality of information provided and the estimating effort required to produce them. Cost estimating procedures vary from down and dirty relatively quick (and not very accurate) ratio / percentage factoring to highly developed “details oriented” computerized capitalized cost estimating / scheduling systems that can produce substantial amounts of capital cost estimating and in some situa-tions engineering data. If the above described meth-ods are correctly utilized, they can generate very precise and detailed capital cost estimates that have a high degree of creditability and more importantly can forecast the final cost of the CAPEX project.
To drive home a basic point again, it should be kept in mind that there are three basic types of estimates, (A) Front End Estimate (OOM, preliminary, conceptual etc) perhaps a good amount of basic process design has been compiled - PFD’s, plot plans, we know the number of major equipment items, we know we need offsite storage, we know we need load-ing areas, we know we need a warehouse, however the detailed
design has not been completed or it may only be less than 20%. (B) AFE Funding / Preliminary (perhaps a hybrid of A and C, and (C) Detailed Estimates (Lump sum bids, GMP’s, Design / Build etc) are based on a lot more definition, the design deliver-ables may be 30% - 60% complete, we have a priced out major equipment list, we have detailed quantity take-off’s, we have plot plans, general arrangement drawings and the P&ID’s could be well advanced. Precise (bearing in mind the level of design work that has been compiled) and timely capital cost estimating preparation is a very important aspect to successful project execution and profitable projects. Typically the decision to execute the EPC project cannot proceed without management approval of
A capital cost estimate is not over and done with when a project manage-ment / engineering review has approved the CAPEX capital cost estimate.
SAMPLE

74. | SECTION 2
Copyright © 2019 Compass International, Inc.
\
MATERIAL % LABOR % TOTAL
(D) OFF SITES OSBL (CONTINUED) Piping Systems 88,745 10.05% 93,664 10.61% 182,409 Electrical Systems 40,453 4.58% 36,553 4.14% 77,006 Instrument / Controls 58,894 6.67% 14,640 1.66% 73,534 Paint / Insulation 18,547 2.10% 19,336 2.19% 37,883 Fire Protection / Safety 15,453 1.75% 16,677 1.89% 32,130 Loading Facilities 362,447 41.06% 79,774 9.04% 442,221 (D) TOTAL DIRECT MAT & LABOR 1,627,482 84.38% 491396 55.67% 2,118,878 (E) INDIRECT WORK Trade Supervision / Foreman / Gangers etc. 16,594 1.88% 66,641 7.55% 83,235 Consumable supplies 29,392 3.33% 2,383 0.27% 31,776 Small Tools (items less than $200 per item) 26,921 3.05% 2,207 0.25% 29,128 Site Establishment / Trailers / Temp Offices. 48,899 5.54% 25,156 2.85% 74,055 Safety / Training 3,089 0.35% 7,503 0.85% 10,592 Constr. Equipment costs. Rental / Owned. 12,092 1.37% 65,758 7.45% 77,850 Constr. Equipment Repairs etc. / Fueling. 4,855 0.55% 9,268 1.05% 14,123 Material Mgmt / Logistics / Field Support 19,860 2.25% 10,592 1.20% 30,452 Testing Activities 1,854 0.21% 1,324 0.15% 3,178 Site Clean Up 3,707 0.42% 8,827 1.00% 12,534 Expense items (Demo / relocations) 11,739 1.33% 14,387 1.63% 26,127 Sales Tax 48,723 5.52% 0 0.00% 48,723(optional cost item could be excluded) TOTAL INDIRECT WORK 227,726 214,044 441,770 TOTAL D & I (D+E) OSBL 1,855,208 705,440 1 2,560,648 (F) DETAILED DESIGN D.D.& S. FOR OSBL EPC Detailed Design 136739 5.34% Of D&IConstruction Mgmt 82,197 3.21% Of D&IHome Office support / field coordination 10,243 0.40% Of D&ITravel Costs 19,205 0.75% Of D&IOwner Project Eng / CM 11,523 0.45% Of D&IPlant C.M. / Eng Support 16,644 0.65% Of D&IPlant Gen Conditions 8,450 0.33% Of D&IConsultants / Miscellaneous Costs 12,291 0.48% Of D&ITOTAL (D.D.& S) ISBL 297,291 TOTAL OSBL (D+E+F) 2,857,939 Total w/o contingency 24,687,401 Contingency 10% (range 5% - 20%) 2,468,740 10.00% Of TotalTOTAL (INCLUDES ISBL & OSBL) $27,156,142
All % are related to M.E. values.Note 1. Vendor assistance, start up, I/C programming and initial chemicals
SAMPLE

126. | SECTION 2
Copyright © 2019 Compass International, Inc.
Table 31UREA-NITROGEN-NITRICACID-FERTILIZERFACILITY-425TONS/DAYPRODUCTION LOCATIONMIDWESTUSA-2015COSTBASISUNION LABOR (26 MONTH CONSTRUCTION EFFORT)80 ACRE SITE WITH MINIMAL SITE CLEARING
# CATEGORY M-H’S $TICCOST $COST/HOUR REMARKS
1 Engineering / Detailed Design 68,562 10,205,995 $148.86 includes profit on bill out rate2 OH / GA Profit - Fee / CAD / Repro / 3,977,532 39% of # 1 Admin HO Support Staff 3 Procurement of Major Equipment, 74,865,775 259 Tagged M.E. items including 5 # Field Erected Tanks & (excludes instruments) pre-fab piping approx shipping weight = 19,750 tons 4 Construction Direct Labor (all trades) 598,774 23,196,505 $38.74 Rate ranges from $32.50 for lower skills to $41.85 for electricians & pipefitters5 Indirects (general conditions, 598,774 17,094,998 $28.55 Combined rate = $67.29 site establishment, construction equipment, small tools, consumables, heavy lift cranes) 6 Construction Bulks 37,887,346 Concrete, rebar, forwork, struc steel, electrical & insulation7 Construction tagged items 7,648,862 Purchased by Engineering (instruments / CV’s) firm (1,397 #)8 Construction In-Direct Support Labor 202,334 7,277,665 $35.97 9 Construction Management 72,446 8,867,435 $122.40 Locals & OoTown Consultants (approx 14 individuals)10 C M Travel / Per Diem / Site Trucks / 3,776,347 Other field costs 11 Miscl items Demo / Removals (rail spur / transmission lines) 2,788,734 12 Barge Loading Area / Conveyors / Diverters 5,966,745 incl truck scales13 Miscl items, Fencing, guard service, rail spur, temp roads, temp utilities & 3rd party testing 2,433,763 12 Field created P.O.’s14 Construction contractors fee on construction 4,927,665 Construction work final a/c = pass thru $104,667,000 (4.7%)15 Total EPCM Cost $210,915,366 (425 Tons / Per Day - 150,000 TPY) COST PER TON (MILLIONS $) $496,270 Typical CAPEX Cost Range per Ton / Day High $596,000 Typical CAPEX Cost Range per Ton / Day Low $397,000 Excludes Owner In-House Engineering & Owner general conditions & consultants Excludes Front End Studies / Permitting studies Excludes Initial fill & chemicals & spare parts Excludes Jetty / River Intake Structure - $3.7 million
SAMPLE

SECTION B2 | 127.
Copyright © 2019 Compass International, Inc.
Table 32ENGINEERING, PROCUREMENT AND CONSTRUCTION COSTS FOR TYPICAL $20 MILLION TO $80 MILLION SHALE – SYNGAS –CO2-LNG– INDUSTRIAL GAS FACILITY; 2015 COST BASIS:
Costs of course vary on each and every facility; however the typical ranges / percentage splits are as follows:
CATEGORY LOW % RANGE HIGH % RANGE
Engineering / Detailed Design 10% to 12% 12% to 16%Procurement including Major Equipment 30% to 40% 35% to 50%Construction including some bulks such as civil, site works, 30% to 40% 35% to 45% concrete & structural steel Construction Management 5% to 8% 7% to 10%Commissioning / Start Up 2% to 4% 3% to 5%EPC Fee 3% to 4.5% 4.5% to 7.5%
Table 331 MILLION TONS PER YEAR ETHYLENE / LNG FACILITY COST MODEL2016 US GULF COAST COST BASIS: ISBL = 81% OSBL = 19%
CATEGORY APPROX., OPEN SHOP OPEN SHOP OPEN SHOP UNION TOTAL UNION TOTAL UNION % SPLIT TOTAL EPC TOTAL EPC TOTAL EPC EPC COST EPC COST TOTAL EPC COST PER COST PER TON COST PER PER TON PER TON COST PER TON LOW AVERAGE TON HIGH LOW AVERAGE TON HIGH
Major Equipment 26% $416 $459(Tagged Items) Bulk Materials 16% $257 $284 Direct Field Labor 14% $227 $250 Field Labor 11% $176 $194In directs Engineering 10% $165 $182 Detailed Design Project 2% $29 $32 Management / Project Control / Procurement Fees 3% $53 $59 Miscellaneous 5% $81 $90 Contingency 6% $97 $107 Construction 5% $80 $89 Management TOTAL 100% $1,187 $1,582 $1,978 $1,310 $1,746 $2,183BENCHMARKS# of Major Equipment 250 to 300# of Instruments 3,500 to 4,000CY of Concrete 50,000 to 60,000Tons of Structural Steel 6,000 to 7,000LF of above ground pipe 450,000 to 550,000Direct Construction Man-Hours 4,000,000 to 5,000,000Detailed Design Hours 700,000 to 825,000
SAMPLE

Copyright © 2019 Compass International, Inc.
he following listing of unit prices are focused on process / manufacturing CA-PEX projects ranging in cost from $0.50 to $100 + million. These unit costs are for
new construction, it should be noted that alteration / revamp / major renovation construction work could cost between 10% and 50% more than the values indicated in the nine listings. These unit prices are 2019 values (calibrated to mid point of year) they are based on historical data of projects completed in North America and have been adjusted to reflect pricing within the Washington DC beltway (25 - 40 mile radius). A hybrid of Union / Non-union pay scales have been used in determining labor / instal-lation values: (The labor cost value includes a value for construction / rental equipment, i.e., 6.50%, this is for cranes, welding machines and similar types of equipment required to complete each individual task). The units include supervision, plus a profit margin of 10%. (A percentage of between 7 % – 11% - suggest 8.5% should be added to the values indicated to capture site establishment (Division 1 / Preliminaries) costs for such items as scaffolding, trailers, testing, temporary warehousing and testing etc:
T
Semi-Detailed Cost Estimating Data
SECTION 4
GENERALCONVERSIONVALUES-IMPERIAL TO METRIC UNITS
• 1 Acre = 4,047 M2• 1 Foot = 30.48 Centimeters• 1 Foot = 0.3048 Meters• 1 Meter = 39.37 inches• 1 Meter = 1.094 Yards• 1 Cubic Yard = 0.765 M3:• 1 M3 = 1.31 Cubic Yards:• 1 M = 3.28 Lineal Feet:• 1 M2 = 10.76 Square Feet:• 1 Hectare = 2.471 Acres• 1 Kilogram = 2.205 Pounds• 1 Gallon = 3,785 Cubic Centimeters• 1 Imperial Gallon = 1.20095 US Gallons• 1 Liter = 0.264 Gallons• 1 Square Foot = 0.0929 M2• 1 Mile = 1.609 Kilometers• 1 Square Kilometer = 247 Acres• 1 Square Yard = 0.836 M2• 1 Yard = 0.9144 M
SAMPLE
176. | SECTION 4
Copyright © 2019 Compass International, Inc.
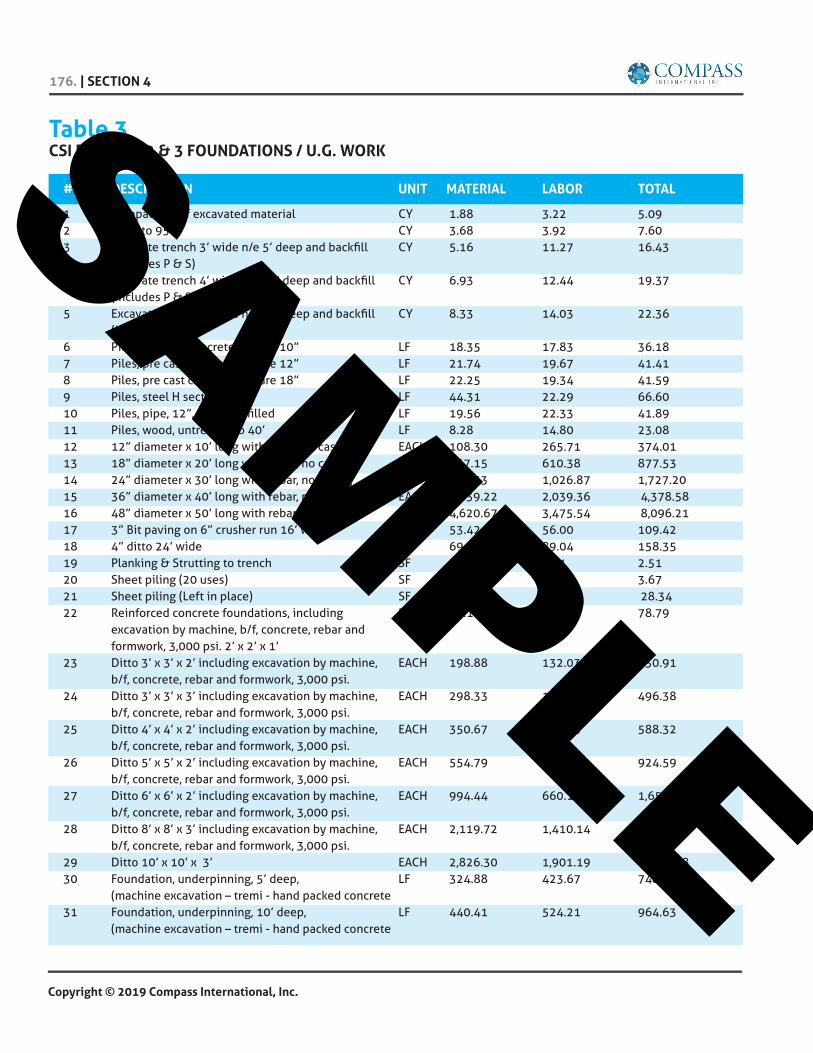
Table 3CSI DIVISION 2 & 3 FOUNDATIONS / U.G. WORK
# DESCRIPTION UNIT MATERIAL LABOR TOTAL
1 Compaction of excavated material CY 1.88 3.22 5.09 2 Ditto to 95% CY 3.68 3.92 7.60 3 Excavate trench 3’ wide n/e 5’ deep and backfill CY 5.16 11.27 16.43 (includes P & S) 4 Excavate trench 4’ wide n/e 10’ deep and backfill CY 6.93 12.44 19.37 (includes P & S) 5 Excavate trench 5’ wide n/e 15’ deep and backfill CY 8.33 14.03 22.36 (includes P & S) 6 Piles, pre cast concrete, square 10” LF 18.35 17.83 36.18 7 Piles, pre cast concrete, square 12” LF 21.74 19.67 41.41 8 Piles, pre cast concrete, square 18” LF 22.25 19.34 41.59 9 Piles, steel H section, 10” LF 44.31 22.29 66.60 10 Piles, pipe, 12”, concrete filled LF 19.56 22.33 41.89 11 Piles, wood, untreated to 40’ LF 8.28 14.80 23.08 12 12” diameter x 10’ long with rebar, no casing EACH 108.30 265.71 374.01 13 18” diameter x 20’ long with rebar, no casing EACH 267.15 610.38 877.53 14 24” diameter x 30’ long with rebar, no casing EACH 700.33 1,026.87 1,727.20 15 36” diameter x 40’ long with rebar, no casing EACH 2,339.22 2,039.36 4,378.58 16 48” diameter x 50’ long with rebar, no casing EACH 4,620.67 3,475.54 8,096.21 17 3” Bit paving on 6” crusher run 16’ wide LF 53.42 56.00 109.42 18 4” ditto 24’ wide LF 69.31 89.04 158.35 19 Planking & Strutting to trench SF 0.79 1.71 2.51 20 Sheet piling (20 uses) SF 1.16 2.51 3.67 21 Sheet piling (Left in place) SF 20.79 7.54 28.34 22 Reinforced concrete foundations, including EACH 47.11 31.68 78.79 excavation by machine, b/f, concrete, rebar and formwork, 3,000 psi. 2’ x 2’ x 1’ 23 Ditto 3’ x 3’ x 2’ including excavation by machine, EACH 198.88 132.03 330.91 b/f, concrete, rebar and formwork, 3,000 psi. 24 Ditto 3’ x 3’ x 3’ including excavation by machine, EACH 298.33 198.04 496.38 b/f, concrete, rebar and formwork, 3,000 psi. 25 Ditto 4’ x 4’ x 2’ including excavation by machine, EACH 350.67 237.65 588.32 b/f, concrete, rebar and formwork, 3,000 psi. 26 Ditto 5’ x 5’ x 2’ including excavation by machine, EACH 554.79 369.80 924.59 b/f, concrete, rebar and formwork, 3,000 psi. 27 Ditto 6’ x 6’ x 2’ including excavation by machine, EACH 994.44 660.13 1,654.57 b/f, concrete, rebar and formwork, 3,000 psi. 28 Ditto 8’ x 8’ x 3’ including excavation by machine, EACH 2,119.72 1,410.14 3,529.86 b/f, concrete, rebar and formwork, 3,000 psi. 29 Ditto 10’ x 10’ x 3’ EACH 2,826.30 1,901.19 4,727.48 30 Foundation, underpinning, 5’ deep, LF 324.88 423.67 748.56 (machine excavation – tremi - hand packed concrete 31 Foundation, underpinning, 10’ deep, LF 440.41 524.21 964.63 (machine excavation – tremi - hand packed concrete
SAMPLE

236. | SECTION 4
Copyright © 2019 Compass International, Inc.
Tubing Stainless Steel 316 PHARMACEUTICAL GRADE PIPING COST / LF OF INSTALLED PIPE (INCLUDES PIPE & FITTINGS, EXCLUDES VALVES):
DIA. MATERIAL / LABOR MATERIAL / LABOR COST PER LF COST PER M1” $90 $294 1.50” $100 $329 2” $145 $474 3” $162 $530
Automatic Sprinkler System
DRY SYSTEM WET SYSTEM$2.65 – $4.25 / SF $2.35 – $3.85 / SF
Valves - Installation Man Hours THEFOLLOWINGMAN-HOURSAPPLYFORALLMATERIAL TYPES
DIAMETER MAN HOURS2” 2.503” 34” 46” 58” 710” 1012” 12/16
Demolition & Removal of C.S. / S.S. Piping INCLUDE HANGARS, FITTINGS & VALVES
DIAMETER $ COST / 100 LF1” 17.522” 32.513” 43.654” 58.356” 72.798” 93.2610” 111.9612” 138.14
Multiply values by 1.20 if pipe is insulated Multiply by 1.12 if pipe is steam or heat tracedNote: credit the estimated cost if pipe is sold for scrap.
Valves - Approximate Cost: use multipliers / calibration factors shown earlier for different mate-rial types, note these indicated material costs can sometimes be discounted by as much as 35% - 65% for orders greater than 10 /12 valves.
Carbon Steel150 # RATING:
DIAMETER BALL BUTTERFLY CHECK GATE GLOBE 2” $539 $1,216 $768 $900 $1,052 3” $629 $1,238 $1,001 $1,232 $1,379 4” $798 $1,539 $1,518 $1,640 $2,101 6” $1,596 $2,463 $2,128 $2,395 $3,373 8” $3,069 $5,310 $3,814 $5,209 $6,203 10” $5,974 $6,219 $5,633 $6,232 $12,854 12” $7,997 $7,975 $7,145 $7,764 $17,218
SAMPLE

SECTION 4 | 241.
Copyright © 2019 Compass International, Inc.
/ Microchip facilities in piping / tubing applications such as clean in place (CIP), Steam in Place (SIP), Water for Injection (WFI) and other critical finished product lines. It is used to mitigate contamination (bacterial build up), Stainless Steel 316 L is used ex-tensively. The welding approach utilized is where all the completed welds and the internal surface of the pipe / tube is required to be joint free / entrapment-free internally to prevent any bacterial contamina-tion to the finished product. Full penetration (100%) welds should be aimed for. It is important to understand that any gaps, fissures, fractures includ-ing any imperfect weld joints can entrap the product / fluid flowing through the pipe / tubing. If any gaps, fissures, fractures are pres-ent they can develop into a haven for future problems and possible product contamination. Automated welding is many times utilized to lower welding production costs i.e. the main element being the cost of employing a workforce (labor costs), however the cost of purchasing the welding equipment together with its subsequent maintenance costs can be substantial, neverthe less automated welding is usually the best avenue to proceed on, on major welding projects. The best example of this is in ship building, just about all the welding is done using an automated process. Orbital welding is used in Pharmaceutical, Aerospace, Microchip and other Hi-Tech industries. Orbital welding uses the Gas Tungsten Arc Welding (GTAW) methodology; it is used primarily on small-bore piping and tubing 2” diameter and below. Stainless Steel 316 L and some other alloys that work well in extreme / harsh operat-ing conditions are usually the specified materials that are utilized. Other industry sectors that are embark-ing on orbital welding in their construction process include:
• Food Production• Dairy (Milk, Butter and Cheese production)
• Brewery / Beverage• Nuclear / Conventional (Power Facilities)• The Petro – Chemical and the Offshore Oil and
Gas sector These industry sectors look at this approach as a
practical and cost effective opportunity for welding small bore stainless steel piping and tubing. Orbital welding makes available a process to make sure construction productivity is optimized while also ensuring that the quality of the finished weld is of a
high quality. Fillet welding using SMAW
is the welding process for con-necting various carbon steel plates, vessels, sections, channels and angles together: Labor cost includes transport of welded met-als to the welding area, prepara-tion work, measuring, initial tack welding, final welding and any necessary grinding. See chart next page.
• Split of (L&M) Labor = 55% Material = 45% (Construc-
tion Equipment of 5% – 10% is included in Labor value)
• Using $59 / per hour for a welder • For applications with a good amount of repeat
work, where good productivity can be achieved mul-tiply above values by 0.75
• For applications with small / difficult / intricate welding work multiply above values by 1.25
• Add 8% - 12% to above for vertical / horizontal applications
• Add 18% - 24% to above for overhead applica-tions
ORDER OF MAGNITUDE PRICES:• Cost per pound of deposited welding material
= $16.95 – $26.05 (Labor and material) to use this method determine cubic content of weld.
• Weight of metal deposited in 0.25” fillet weld = 0.15 pounds per LF
It is important to under-stand that any gaps, fis-sures, fractures including any imperfect weld joints can entrap the product / fluid flowing through the pipe / tubing.
SAMPLE

290. | SECTION 5
Copyright © 2019 Compass International, Inc.
Fuel Storage Tank Fiberglass2,500 Gallon $2,970 4 / 65,000 Gallon $4,480 610,000 Gallon $11,360 16
MIXER / EXTRUDER
Furnace Gas / Oil Fired 250 PSIG CS / AlloyDATA TABLE
MMBTU’S PER $ COST PER UNIT TO PURCHASE $ COST PER UNIT WITH BULKS $ COST PER UNIT WITHHOUR DUTY DELIVERED IN SECTIONS TO SITE & FIELD ERECTION LABOR DESIGN / CM & INSPECTION 25 506,663 835,831 1,071,964
50 977,826 1,244,226 1,595,736
100 1,855,610 2,223,504 2,851,672
250 4,409,895 5,326,405 6,831,182
500 8,601,675 9,303,863 11,932,321
MA
N H
OU
RS
HP
0 10 20 30 40 50 60
0 10
0 20
0 30
0 40
0 50
0 60
0
SAMPLE
298. | SECTION 5
Copyright © 2019 Compass International, Inc.
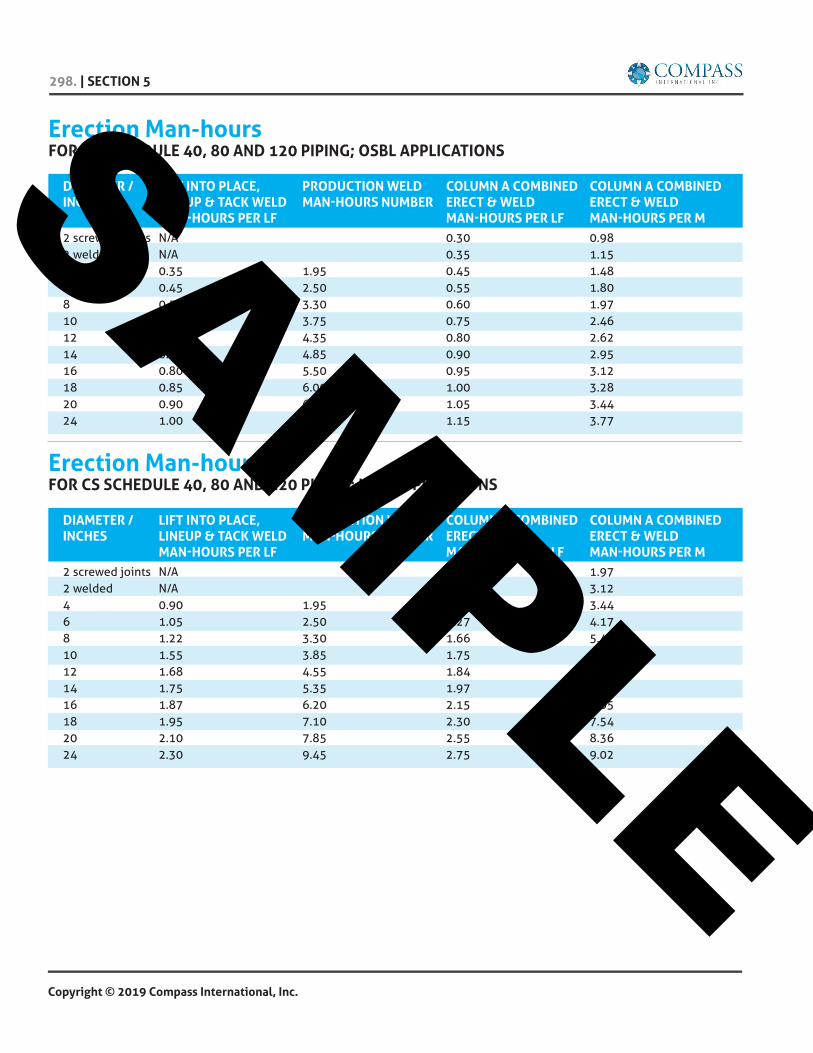
Erection Man-hours FOR CS SCHEDULE 40, 80 AND 120 PIPING; OSBL APPLICATIONS
DIAMETER / LIFT INTO PLACE, PRODUCTION WELD COLUMN A COMBINED COLUMN A COMBINED INCHES LINEUP&TACKWELD MAN-HOURSNUMBER ERECT&WELD ERECT&WELD MAN-HOURSPERLF MAN-HOURSPERLF MAN-HOURSPERM2 screwed joints N/A 0.30 0.982 welded N/A 0.35 1.154 0.35 1.95 0.45 1.486 0.45 2.50 0.55 1.808 0.50 3.30 0.60 1.9710 0.60 3.75 0.75 2.4612 0.65 4.35 0.80 2.6214 0.75 4.85 0.90 2.9516 0.80 5.50 0.95 3.1218 0.85 6.00 1.00 3.2820 0.90 6.75 1.05 3.4424 1.00 7.75 1.15 3.77
Erection Man-hours FOR CS SCHEDULE 40, 80 AND 120 PIPING; ISBL APPLICATIONS
DIAMETER / LIFT INTO PLACE, PRODUCTION WELD COLUMN A COMBINED COLUMN A COMBINED INCHES LINEUP&TACKWELD MAN-HOURSNUMBER ERECT&WELD ERECT&WELD MAN-HOURSPERLF MAN-HOURSPERLF MAN-HOURSPERM2 screwed joints N/A 0.60 1.972 welded N/A 0.95 3.124 0.90 1.95 1.05 3.446 1.05 2.50 1.27 4.178 1.22 3.30 1.66 5.4410 1.55 3.85 1.75 5.7412 1.68 4.55 1.84 6.0414 1.75 5.35 1.97 6.4616 1.87 6.20 2.15 7.0518 1.95 7.10 2.30 7.5420 2.10 7.85 2.55 8.3624 2.30 9.45 2.75 9.02
SAMPLE

392. | SECTION 5
Copyright © 2019 Compass International, Inc.
(B) Centrifugal Air Compressors- with motor: Add 3% for transport to site for US and overseas applications (ocean freight would increase freight cost).
(C) Centrifugal Pump, C S API 100 Deg F, 1,800 Motor
• Add 3% for transport to site for US and over-seas applications (ocean freight would increase freight cost).
• If pumps and motor are skid mounted multiply above units by 0.85.
• Cost range is $26.18 - $63.67 per GPM
(D) Centrifugal Compressor C.S. – 100 PSI• Cost range is $311 - $2,558 per HP.• Add installation man-hours.• Add 3% for transport to site for US and over-
seas applications (ocean freight would increase freight cost).
(16) CHILLER:(A) ABSORPTION WATER CHILLERS:
Installation man-hours includes unloading, unpack-ing, transport from temporary site warehouse to final location n/e 0.50 miles – 0.80 km, installation on base, adjusting drive alignment, calibrating and sys-tem check out. Man-hours exclude cranes, founda-tions, setting holding down bolts, grouting, brackets, supports, piping, cable, conduit and electrical hook-up, refer to productivity adjustments on earlier page to calibrate installation man-hours. The man-hour installation units exclude initial chemical charging, cooling liquids, refrigerant / anti freeze chemicals, M.E. passivation and cleaning (pickling) and M.E. identification / stenciling & subsequent tagging.
(B) CHILLERS, PACKAGED WATER HOT-WATER OR STEAM TYPE: Includes installation of motor and drives, controls: Excludes crane rental, foundations, setting holding down bolts, grouting, brackets, supports, piping, cable, conduit and elec-trical hook-up, refer to productivity adjustments on
Table 15BCFM $EQUIP.COST INSTALLATIONMAN-HOURS5,000 $416,317 42010,000 $689,317 71025,000 $1,250,395 1,334
Table 15CGPM $EQUIP.COST INSTALLATIONMAN-HOURS100 $6,367 4203,000 $78,544 710
Table 15DH.P. $ EQUIPMENT $ COST INSTALLATION COST PERH.P.MAN-HOURS
25 $64,696 $2,588 3850 $69,742 $1,395 44100 $77,360 $774 54250 $114,399 $458 74500 $178,107 $356 1061,000 $311,342 $311 184
Table 16ARATINGS TON $ EQUIPMENT INSTALLATION COST MAN-HOURS
25 $22,005 3050 $42,015 38100 $49,683 46250 $116,435 108
Table 16BTONS $COST/EQUIPT. MAN-HOURSPERTON
100 141,618 3.2150 184,629 2.6200 208,067 2.33250 225,967 2.14500 332,324 1.451,000 526,216 0.952,500 721,450 0.55
SAMPLE

SECTION 5 | 411.
Copyright © 2019 Compass International, Inc.
Table 51AH.P. APPROX WEIGHT # OF PIECES M.H.’ S M.H.’ S PER HP25 2,400 3 / 5 23 0.9250 3,700 3 / 5 27 0.5475 5,400 3 / 5 34 0.45
Table 51BCOST PER UNIT $ COST LOW $ COST HIGHCost per pound $8.55 $11.37 Cost per Kg $18.81 $25.01 Cost per HP $397 $525
12H-250A GLYCOL UNITS
MA
N H
OU
RS
PER
TO
N
TONS
0 1-5 5-10 10-20 20-50
0
1
2
3
4
5
SAMPLE
446. | SECTION 6
Copyright © 2019 Compass International, Inc.
OSHA safety measures, factory witness testing and any acceptance testing and operational tests, initial chemical charging, cooling liquids, “grogg” type chemicals and any scaffolding and hoisting needs. Remember there could be a need for a full time hoist operator on union projects.
Major Equipment (M.E.) / Chemical / Manu-facturing facility major equipment is fundamentally all the components that are utilized in the above mentioned industries / business sectors, the (M.E.) major equipment includes items such as the follow-ing together with the “judgment” percentage to set the particular piece of major equipment described below. A description of (A), (B) and (C) is described below:
• Activators (B) / Agitators (A) / Air Dryers (B) / Air Handlers (B)
• Bag house (B) / Blenders (B) / Bins (B) / Boil-ers (C)
• Centrifuges (B) / Chlorine Evaporators (B) / Columns (B)
• Compressors (B) / Condensers (B) / Conveyors (C) / Crushers (B) / Crystallizers (B)
• Dearators (B) / Drums (A) / Dryers (B)• Emulsifiers (B) / Electrical Switch Gear (B) /
Evaporators (B) / Extruders (B)• Filters (B) / Presses (B) / Furnaces (C)• Hammer Mills (B) / Heaters (C) / Heat Ex-
changers (C)• Instrument and process control equipment (B)• Reactors (C) / Pressure vessels (B) / Pumps &
Motors (B)• Size reduction and separation equipment (B) /
Scrubbers (B) / Steam Turbines (C) • Tanks (A) / Towers (B) / Valves (motor con-
trolled) (B) / Vessels (B)(A) = Large / static pieces of M.E. needing rela-
tively minimal setting hours (and minimal internal setting and aligning) 3% -7% of M.E. cost divided by $65 / hour will provide a man hour budget for setting the M.E.
(B) = Mid sized pieces of M.E. needing addition-al setting and requiring internal work and aligning
work hours 5% -10% of M.E. cost.(C) = Complex pieces of M.E. requiring a fair
amount of assembly and setting / internal aligning hours 7% -14% of M.E. cost will provide a man hour budget for setting the M.E.
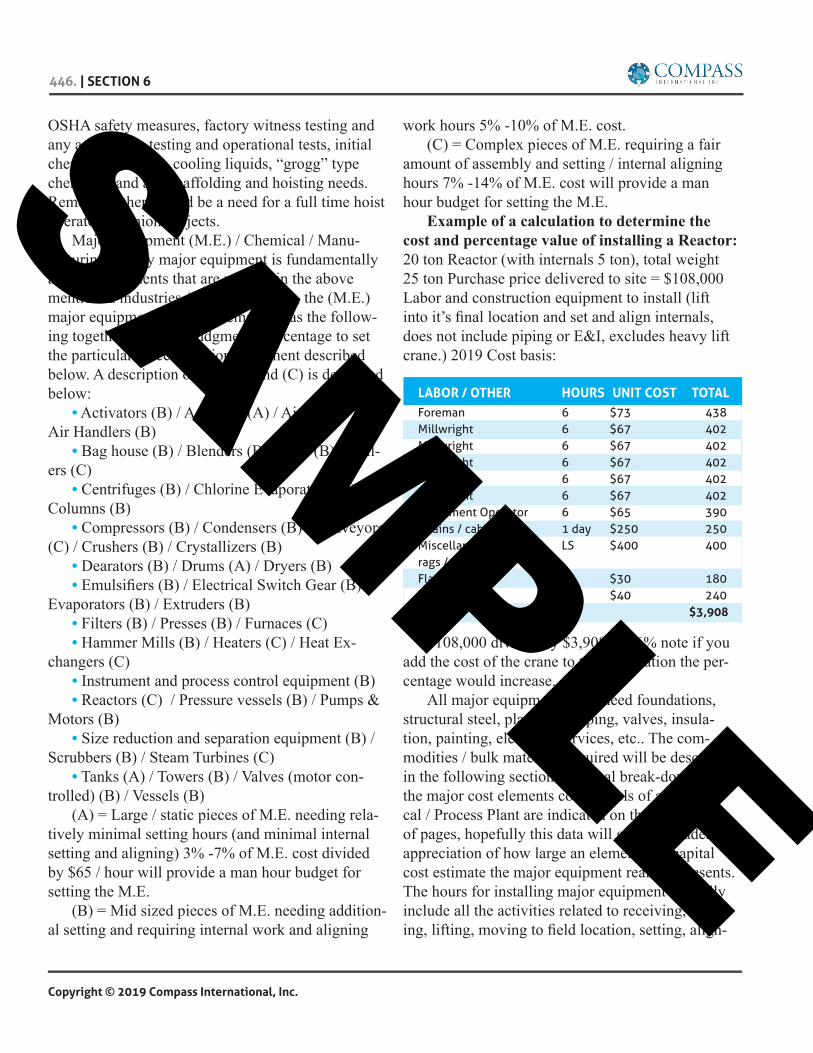
Example of a calculation to determine the cost and percentage value of installing a Reactor: 20 ton Reactor (with internals 5 ton), total weight 25 ton Purchase price delivered to site = $108,000 Labor and construction equipment to install (lift into it’s final location and set and align internals, does not include piping or E&I, excludes heavy lift crane.) 2019 Cost basis:
$108,000 divided by $3,908 = 3.6% note if you add the cost of the crane to this calculation the per-centage would increase.
All major equipment items need foundations, structural steel, platforms, piping, valves, insula-tion, painting, electrical services, etc.. The com-modities / bulk materials required will be described in the following sections. Typical break-downs of the major cost elements cost models of a Chemi-cal / Process Plant are indicated on the next couple of pages, hopefully this data will give the reader an appreciation of how large an element of a capital cost estimate the major equipment really represents. The hours for installing major equipment typically include all the activities related to receiving, stor-ing, lifting, moving to field location, setting, align-
LABOR / OTHER HOURS UNIT COST TOTALForeman 6 $73 438Millwright 6 $67 402Millwright 6 $67 402Millwright 6 $67 402Millwright 6 $67 402Millwright 6 $67 402Equipment Operator 6 $65 390Chains / cables 1 day $250 250Miscellaneous l shims / LS $400 400rags / greaseFlatbed trailer 6 $30 180Tractor 6 $40 240TOTAL $3,908
SAMPLE

SECTION 6 | 451.
Copyright © 2019 Compass International, Inc.
ENGINEERING / HOME OFFICE COSTS / DATA: See chart at right. For additional data specific to installation man-hour units refer to later sections.
ESTIMATE ASSESSMENT SHEET / RATIO ANALYSISThe capital cost estimate review sheet (see chart above and on the previous page) sets the ranges min-imum and maximum for various activities, this data can be used as a data source to calibrate / compare specific key elements of a process related project, this data applies to new / green field construction applications.
• (I.S.B.L.) inside battery limits (M.E.) major equipment (T.I.C.) total installed cost
• (D.L.) direct laborThe following data / tables are a variety of man
hour production units for various construction trades that can assist an estimator / cost engineer in compil-ing both conceptual and detailed cost estimates, for more detailed estimating units refer to Section 4.
FUNCTION/GENERALDATA COST/MAN-HOUR UNITSProject Manager $80 - $150 / hourArchitect $85 – $150 / hourCivil Engineer $75 - $135 / hourHome office engineer $75 - $135 / hourEstimator $70 - $130 / hourDesigner $55 - $90 / hourMan-hours per item of 600 –1200 (aver 700)major equipmentMan hours per PFD 40 - 100Man-hours per P. & I.D: 250 -500Man-hours per plot plan / G. A. 100 –200Man hours per ISO. 4 / 6CAD machine bill out rate $25 - $60 / hour
PROCUREMENT / CONTRACT / PROJECT CONTROL Procurement / Contracts Engineer $60 - $100 / hourProject Control Engineer $70 - $110 / hourMan-hours per material inquiry / 4 - 12requisitionMan-hours per purchase order 30 - 50Man-hours per contract 60 –100Inspection of M.E. item 4 – 8 / hours
Estimate Assessment Sheet / Ratio AnalysisDATA APPLIES TO NEW / GREEN FIELD CONSTRUCTION APPLICATIONS
N0. RATIOS & PERCENTAGES NORMAL RANGE
1 Site Works as a percentage of M.E. (I.S.B.L) 2 – 5%2 Buildings / Structures as a percentage of M.E. (I.S.B.L) 5 – 12%3 Piping material as percent M.E. (I.S.B.L) 20-50%4 Labor as percent of T.I.C. 20-30%5 Piping labor as percent of pipe material 40-125%6 Indirect cost as percent D.L. 70-125%7 Piping labor as percent D.L. 10-55%8 Typical M.E. Multiplier to T.I.C. 3.0 – 5.50 (Typical average 4.00) Refer to Benchmark Data.9 Instrument material as percent M.E. (I.S.B.L.) 15-20%10 Electrical work as a percentage of M.E. (I.S.B.L) 7 – 12%11 Electrical labor as a percentage of M.E. (I.S.B.L) 10 – 20%12 Insulation work as a percentage of M.E. (I.S.B.L) 3 – 5%13 Field Establishment as a percentage of field in-directs 4 – 9%14 Small tools / consumables as percent of D.L. 0.15 – 2.25%15 Scaffolding as percent of D.L. 0.5 – 2%16 Spare Parts 5% to 7.5% of major equipment on complex process facilities
SAMPLE