salt reduction in bread: is it enough? · bread is the major contributor for salt intake in...
TRANSCRIPT

Salt reduction in bread: Is it enough? PRELIMINARY RESULTS OF A HIA IN PORTUGAL

INTRODUCTION
Fig. 1. Adapted from WHO (2019)
Health Impact Assessments (HIA) are a combination of procedures, methods and tools by which a policy, program or project may be judged as to its potential effects on the health of a population and the distribution of those effects. A pilot HIA is in progress to train health professionals in this methodology in Portugal with the support of the World Health Organization (WHO).

Bread is the major contributor for salt intake in Portugal (7.3 g total average; 1 from bread). (1)
Salt is responsible for high blood pressure (BP) and Cardiovascular Diseases (CVD). (2)
A maximum of total salt intake of 5g daily is recommended. (2)
A voluntary agreement between the industry and authorities was signed to assure salt in bread achieves a max of 1 gr salt/ 100 gr in bread. (currently is 1.4gr)
Screening asks… Is the HIA necessary?
The team checks with the Irish framework and concludes Yes! Potential impacts are likely on different areas.
Scoping
Risk Appraisal
Recommendations

Creation of a Steering Group composed by representatives from: (i) Northern Bakery, Patisserie and Similar Industry Association (AIPAN) (ii) National Institute of Health Doutor Ricardo Jorge, IP (INSA) (iii) Portuguese Association for Consumer Protection (DECO) (iv) National Healthy Cities Network (v) Portuguese Distribution Business Association (APED) (vi) Portuguese National Programme for the Promotion of Healthy Federation of the Portuguese Agri-Food Industry (FIPA) (vii) National Programme for Cardiovascular Diseases (viii) Directorate-General for Education (DGE).
Set the scope (workplan, timeline, resources, depth of HIA)
Establish the TOR: Research strategy, key concerns, pathway diagram.
Scoping
Risk Appraisal
Recommendations

Screening
Risk Appraisal
Recommendations
Fig.2 Pathway diagram regarding potential impacts in health and in the economic sector, due to a reduction of salt in bread.
[Not only but these were defined as the ones we were going to priorize]
OBJECTIVE To estimate the impact in BP and CVD of a nation-wide policy that intends to achieve a maximum of 1 g of salt/100 gr in bread by 2021.

Screening
Scoping
Recommendations
METHODS (1) Secondary data from two population based, representative surveys. INSEF provides information about BP and IANAF about daily salt intake.
We used IANAF to estimate what is the salt intake expected after a 29% reduction for each individual. Then, we linked both databases by, sex, age group, region and education to find current average levels of blood pressure in each one of these categories.
Stratified by individuals with BP < 140 mmHg and BP > = 140 mmHg and applied values of a meta analysis (3) to estimate the expected reduction in BP. Values of a meta analysis (4) were also used to estimate reduction in the risk of CVD from these values.
(3) normotensives, the mean effect was -2.42 mmHg and hypertensive the mean effect was -5.39 mmHg (4) Every 10 mmHg systolic blood pressure reduction decreases the risk for CVD.

Screening
Scoping
Recommendations
RESULTS (1) DESCRIPTIVE ANALYSIS Salt Intake from bread (n=3.247, 25-74y)
Fig 3. Distribution of salt intake from bread according to sex, age group, region and education. IANAF, 2015

Screening
Scoping
Recommendations
RESULTS (2) DESCRIPTIVE ANALYSIS Current blood pressure (n=4.911, 25-74y)
Fig 3. Distribution of BP according to sex, age group, region and education. INSEF, 2015

Screening
Scoping
Recommendations
RESULTS (3)
Women 1.113 6.260 0.323 5.937 152.93 152.54
-0.396 0.028
Men 1.752 8.880 0.508 8.372 151.93 151.30 -0.624 0.051
SEX Salt intake from bread
Current total intake of salt Salt reduction
Total salt intake
reduction expected
Current BP values
Expected BP values
Expected-Observed
Size effect
Women 1.113 6.259 0.323 5.937
117.08 116.80 -0.29 0.013
Men 1.752 8.880 0.508 8.372
124.37 123.90 -0.42 0.023
Legend: Values are averages. Grams is the unit of measure for salt and mmGh for BP. Effect size = E-O/sd
Normotensive
Hypertensive

Screening
Scoping
Recommendations
RESULTS (5)
REGION
Salt intake from bread
Current total
intake of salt
Salt reduction
Total salt intake
reduction expected
Current BP values
Expected BP values
Expected-Observed
Size effect
North 1.352 7.836 0.392 7.443 120.669 120.455
-0.214 -0.020
Center 1.408 7.783 0.408 7.374 121.194 120.971
-0.223 -0.021
LVT 1.265 7.774 0.367 7.408 119.388 119.188
-0.200 -0.016
Alentejo 2.066 8.550 0.599 7.951 120.144 119.817
-0.327 -0.030
Algarve 1.514 7.583 0.439 7.143 119.466 119.227
-0.240 -0.021
Madeira 1.038 5.582 0.301 5.281 119.792 119.627
-0.164 -0.015
Azores 1.331 7.253 0.386 6.868 120.539 120.328
-0.210 -0.019
Normotensive

Screening
Scoping
Recommendations
RESULTS (4) Hypertensive
REGION Salt intake from bread
Current total intake
of salt
Salt reduction
Total salt intake
reduction expected
Current BP
values
Expected BP values
Expected-Observed
Size effect
North 1.352 7.836 0.392 7.444 149.908 149.427 -0.481 -0.0472
Center 1.408 7.783 0.408 7.374 151.745 151.243 -0.501 -0.0410
LVT 1.265 7.774 0.367 7.408 152.781 152.331 -0.450 -0.0367
Alentejo 2.066 8.550 0.599 7.951 154.775 154.040 -0.735 -0.0481
Algarve 1.515 7.582 0.439 7.143 149.771 149.232 -0.539 -0.0555
Madeira 1.038 5.582 0.301 5.281 152.938 152.568 -0.369 -0.0270
Azores 1.330 7.254 0.386 6.868 154.197 153.723 -0.4737 -0.032

Screening
Scoping
Recommendations
AGE GROUP Salt intake from bread
Current total intake
of salt
Salt reduction
Total salt intake
reduction expected
Current BP
values
Expected BP
values
Expected
-Observed
Size effect
25-34 1.210 7.771 0.351 7.420
116.765
116.573 -0.191 0.017
35-44 1.345 7.842 0.390 7.452
118.334
118.121 -0.213 0.019
45-54 1.417 7.468 0.411 7.057
120.591
120.367 -0.224 0.021
55-64 1.600 7.439 0.464 6.975
122.625
122.372 -0.253 0.024
65-75 1.506 6.753 0.437 6.316
123.721
123.482 -0.238 0.023
25-34 1.210 7.771 0.351 7.420
147.250
146.819 -0.431 0.061
35-44 1.345 7.842 0.389 7.452
148.146
147.668 -0.479 0.052
45-54 1.416 7.468 0.410 7.057
153.056
152.551 -0.504 0.039
55-64 1.600 7.439 0.464 6.975
152.787
152.217 -0.570 0.042
65-75 1.506 6.753 0.437 6.316
153.485
152.949 -0.536 0.040
Hypertensive
Normotensive

Screening
Scoping
Recommendations
RESULTS (7)
EDUCATION
Salt intake from bread
Current total intake
of salt
Salt reduction
Total salt intake
reduction expected
Current BP
values
Expected BP values
Expected
-Observed
Size effect
Primary school 1.50 7.06 0.437 6.622 122.499 122.260 -0.238 -0.022
Secondary school 1.43 7.83 0.414 7.415 119.698 119.472 -0.226 -0.020
Higher Education 1.25 7.56 0.362 7.201 116.402 116.205 -0.197 -0.018
Primary school 1.507 7.059 0.437 6.622 153.652 153.116 -0.536 -0.039
Secondary school 1.428 7.829 0.414 7.415 150.038 149.529 -0.508 -0.047
Higher Education 1.249 7.561 0.362 7.199 149.066 148.621 -0.444 -0.042
Hypertensive
Normotensive

Screening
Scoping
Recommendations
RESULTS (8)
WHAT ABOUT CVD? We need 10 mmHg in blood pressure lowering to achieve a
reduction of in risk of CVD no effect in CVD.
CONCLUDING... Men 55-64 Alentejo Primary education
Men 25-34 Algarve Secondary education
Normotensive Hypertensive
Screening
Scoping
Risk Appraisal
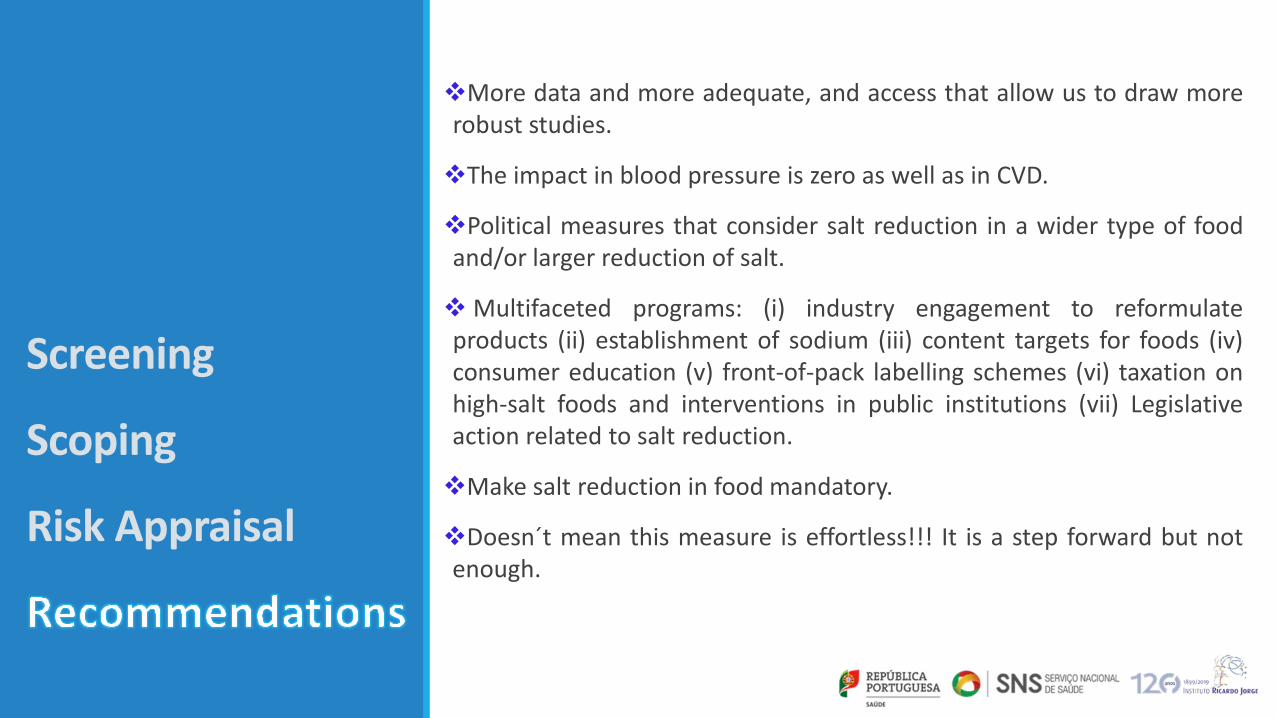
More data and more adequate, and access that allow us to draw more robust studies.
The impact in blood pressure is zero as well as in CVD.
Political measures that consider salt reduction in a wider type of food and/or larger reduction of salt.
Multifaceted programs: (i) industry engagement to reformulate products (ii) establishment of sodium (iii) content targets for foods (iv) consumer education (v) front-of-pack labelling schemes (vi) taxation on high-salt foods and interventions in public institutions (vii) Legislative action related to salt reduction.
Make salt reduction in food mandatory.
Doesn´t mean this measure is effortless!!! It is a step forward but not enough.
REFERENCES (1) IANAF (2016). Inquerito Alimentar nacional e Atividade Fisica.
(2) WHO (2019). Reducing sodium intake to reduce blood pressure and risk of cardiovascular diseases in
adults.
(3) H, Feng J., et al. (2013). “Effect of Longer-Term Modest Salt Reduction on Blood Pressure.”
Cochrane Database of Systematic Reviews.
(4) Ettehad D, et al. (2016) Blood pressure lowering for prevention of cardiovascular disease and
death: a systematic review and meta-analysis. Lancet. Mar 5;387(10022):957-967.

THANK YOU!