sales of fossil fuels produced from federal and indian ... · sales of fossil fuels produced from...
TRANSCRIPT
Sales of Fossil Fuels Produced from Federal and Indian Lands, FY 2003 through FY 2014
July 2015
Independent Statistics & Analysis
www.eia.gov
U.S. Department of Energy
Washington, DC 20585

U.S. Energy Information Administration | Sales of Fossil Fuels Produced on Federal and Indian Lands, FY 2003 through FY 2014 i
This report was prepared by the U.S. Energy Information Administration (EIA), the statistical and analytical agency within the U.S. Department of Energy. By law, EIA’s data, analyses, and forecasts are independent of approval by any other officer or employee of the United States Government. The views in this report therefore should not be construed as representing those of the Department of Energy or other federal agencies.

July 2015
U.S. Energy Information Administration | Sales of Fossil Fuels Produced on Federal and Indian Lands, FY 2003 through FY 2014 ii
Contents Sales of Fossil Fuels Produced from Federal and Indian Lands, FY 2003 through FY 2014 ......................... 1
Summary .................................................................................................................................................. 1
Sales from production on federal and Indian lands ................................................................................ 4
Trends in federal and Indian lands production from FY 2003 through FY 2014 ...................................... 5
State/offshore trends .............................................................................................................................. 7
Data sources .......................................................................................................................................... 10
Appendix ..................................................................................................................................................... 23
State/area maps .................................................................................................................................... 23

July 2015
U.S. Energy Information Administration | Sales of Fossil Fuels Produced on Federal and Indian Lands, FY 2003 through FY 2014 iii
Tables Table 1. Fossil fuel sales of production from federal lands, FY 2003-14 ...................................................... 2 Table 2. Fossil fuel sales of production from Indian lands, FY 2003-14 ........................................................ 3 Table 3. Sales of crude oil and lease condensate production from federal and Indian lands, FY 2003-14 16 Table 4. Sales of natural gas production from federal and Indian lands, FY 2003-14 ................................ 16 Table 5. Sales of natural gas plant liquids production from federal and Indian lands, FY 2003-14........... 17 Table 6. Sales of coal from federal and Indian lands, FY 2003-14 ............................................................. 17 Table 7. Sales of fossil fuel production from federal and Indian lands by state/area, FY 2003-14 ............ 18 Table 8. Sales of crude oil and lease condensate production from federal and Indian lands by state/area, FY 2003-14 .................................................................................................................................................. 19 Table 9. Sales of natural gas production from federal and Indian lands by state/area, FY 2003-14 .......... 20 Table 10. Sales of natural gas plant liquids production from federal and Indian lands by state/area, FY 2003-14 ....................................................................................................................................................... 21 Table 11. Sales of coal production from federal and Indian lands by state/area, FY 2003-14 ................... 22
Figures Figure 1. Fossil fuel production on federal lands, FY 2003-14 ...................................................................... 6 Figure 2. Fossil fuel production on Indian lands, FY 2003-14 ....................................................................... 7 Figure 3. Onshore federal and Indian lands .................................................................................................. 8 Figure 4. Fossil fuel production on federal and Indian lands, FY 2003-14 .................................................. 10 Figure 5. Crude oil production on federal and Indian lands, FY 2003-14 ................................................... 12 Figure 6. Natural gas production on federal and Indian lands, FY 2003-14 ............................................... 13 Figure 7. Natural gas liquids production on federal and Indian lands, FY 2003-14 .................................... 14 Figure 8. Coal production on federal and Indian lands, FY 2003-14 ........................................................... 15
Figure A1. Fossil fuel production on federal and Indian lands, FY 2014 ..................................................... 23 Figure A2. Changes in fossil fuels production (trillion Btu) on federal and Indian lands, FY 2013-14 ........ 24 Figure A3. Crude oil production on federal and Indian lands, FY 2014 ...................................................... 25 Figure A4. Changes in crude oil production on federal and Indian lands, FY 2013-14 ............................... 26 Figure A5. Natural gas production on federal and Indian lands, FY 2014 .................................................. 27 Figure A6. Changes in natural gas production on federal and Indian lands, FY 2013-14 ........................... 28 Figure A7. Natural gas liquids production on federal and Indian lands, FY 2014 ....................................... 29 Figure A8. Changes in natural gas liquids production on federal and Indian lands, FY 2013-14 ................ 30 Figure A9. Coal production on federal and Indian lands, FY 2014 ............................................................. 31 Figure A10. Changes in coal production on federal and Indian lands by state, FY 2013-14 ....................... 32
July 2015
U.S. Energy Information Administration | Sales of Fossil Fuels Produced on Federal and Indian Lands, FY 2003 through FY 2014 1
Sales of Fossil Fuels Produced from Federal and Indian Lands, FY 2003 through FY 2014
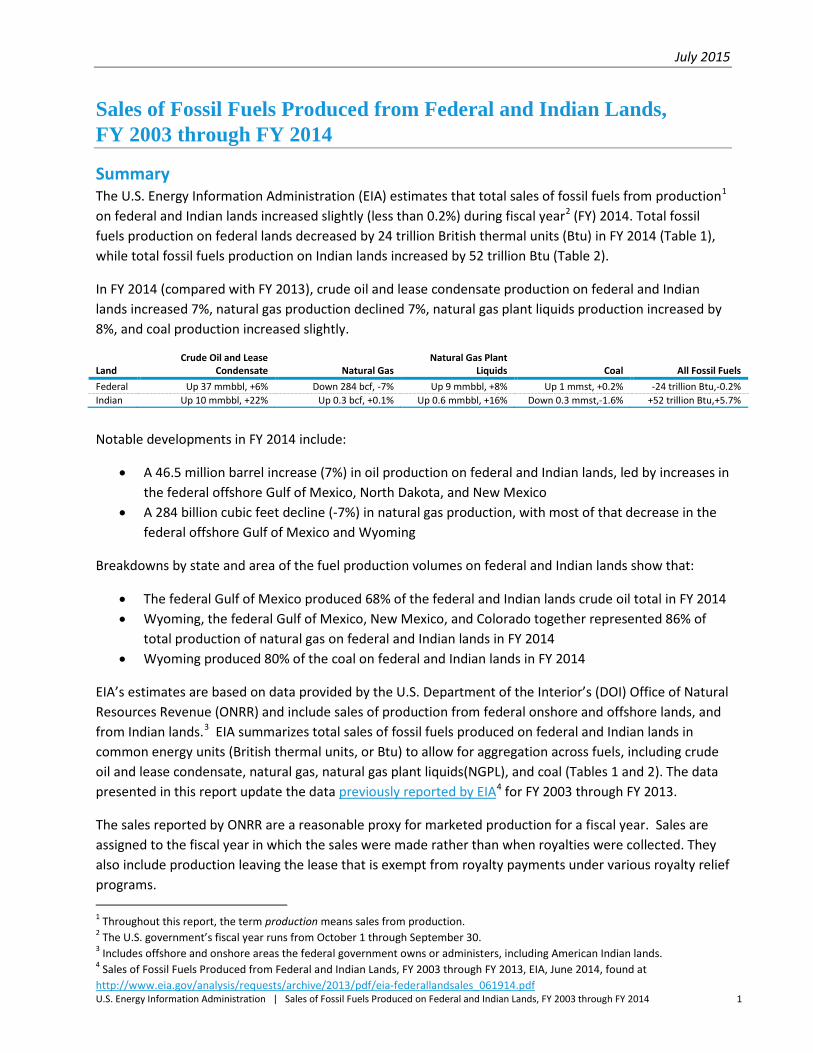
Summary The U.S. Energy Information Administration (EIA) estimates that total sales of fossil fuels from production1 on federal and Indian lands increased slightly (less than 0.2%) during fiscal year2 (FY) 2014. Total fossil fuels production on federal lands decreased by 24 trillion British thermal units (Btu) in FY 2014 (Table 1), while total fossil fuels production on Indian lands increased by 52 trillion Btu (Table 2).
In FY 2014 (compared with FY 2013), crude oil and lease condensate production on federal and Indian lands increased 7%, natural gas production declined 7%, natural gas plant liquids production increased by 8%, and coal production increased slightly.
Land Crude Oil and Lease
Condensate Natural Gas Natural Gas Plant
Liquids Coal All Fossil Fuels Federal Up 37 mmbbl, +6% Down 284 bcf, -7% Up 9 mmbbl, +8% Up 1 mmst, +0.2% -24 trillion Btu,-0.2% Indian Up 10 mmbbl, +22% Up 0.3 bcf, +0.1% Up 0.6 mmbbl, +16% Down 0.3 mmst,-1.6% +52 trillion Btu,+5.7%
Notable developments in FY 2014 include:
• A 46.5 million barrel increase (7%) in oil production on federal and Indian lands, led by increases in the federal offshore Gulf of Mexico, North Dakota, and New Mexico
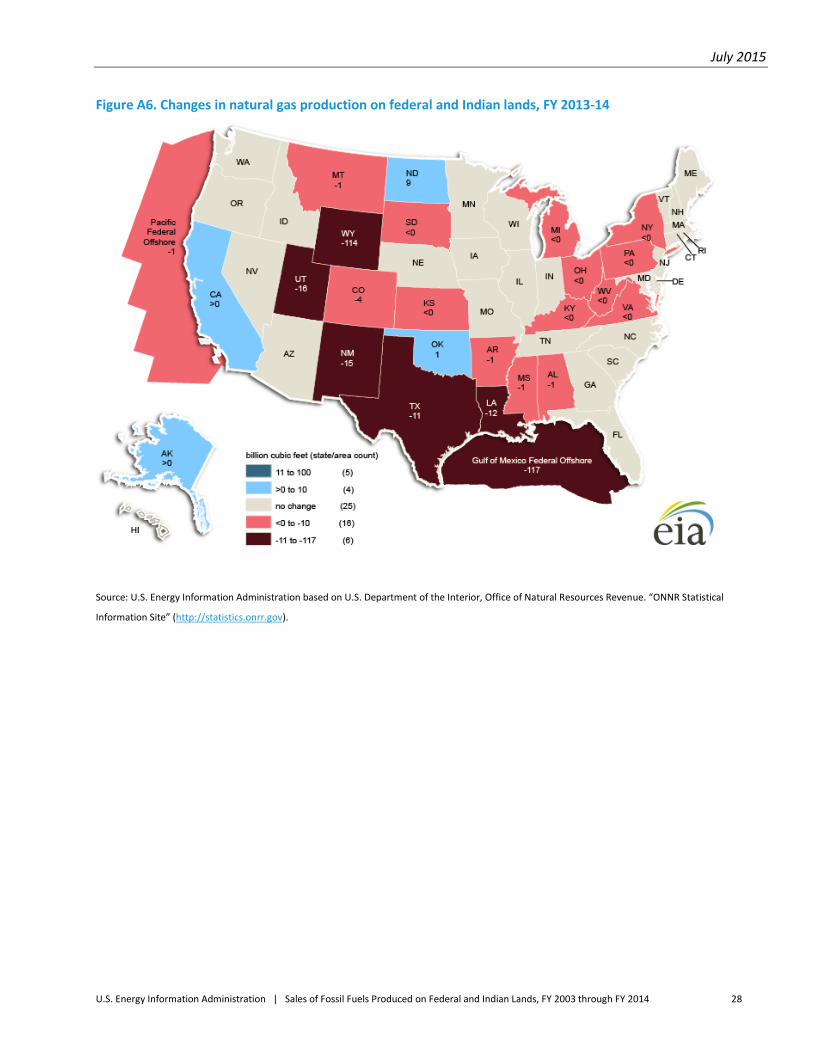
• A 284 billion cubic feet decline (-7%) in natural gas production, with most of that decrease in the federal offshore Gulf of Mexico and Wyoming
Breakdowns by state and area of the fuel production volumes on federal and Indian lands show that:
• The federal Gulf of Mexico produced 68% of the federal and Indian lands crude oil total in FY 2014 • Wyoming, the federal Gulf of Mexico, New Mexico, and Colorado together represented 86% of
total production of natural gas on federal and Indian lands in FY 2014 • Wyoming produced 80% of the coal on federal and Indian lands in FY 2014
EIA’s estimates are based on data provided by the U.S. Department of the Interior’s (DOI) Office of Natural Resources Revenue (ONRR) and include sales of production from federal onshore and offshore lands, and from Indian lands.3 EIA summarizes total sales of fossil fuels produced on federal and Indian lands in common energy units (British thermal units, or Btu) to allow for aggregation across fuels, including crude oil and lease condensate, natural gas, natural gas plant liquids(NGPL), and coal (Tables 1 and 2). The data presented in this report update the data previously reported by EIA4 for FY 2003 through FY 2013.
The sales reported by ONRR are a reasonable proxy for marketed production for a fiscal year. Sales are assigned to the fiscal year in which the sales were made rather than when royalties were collected. They also include production leaving the lease that is exempt from royalty payments under various royalty relief programs. 1 Throughout this report, the term production means sales from production. 2 The U.S. government’s fiscal year runs from October 1 through September 30. 3 Includes offshore and onshore areas the federal government owns or administers, including American Indian lands. 4 Sales of Fossil Fuels Produced from Federal and Indian Lands, FY 2003 through FY 2013, EIA, June 2014, found at http://www.eia.gov/analysis/requests/archive/2013/pdf/eia-federallandsales_061914.pdf
July 2015
U.S. Energy Information Administration | Sales of Fossil Fuels Produced on Federal and Indian Lands, FY 2003 through FY 2014 2
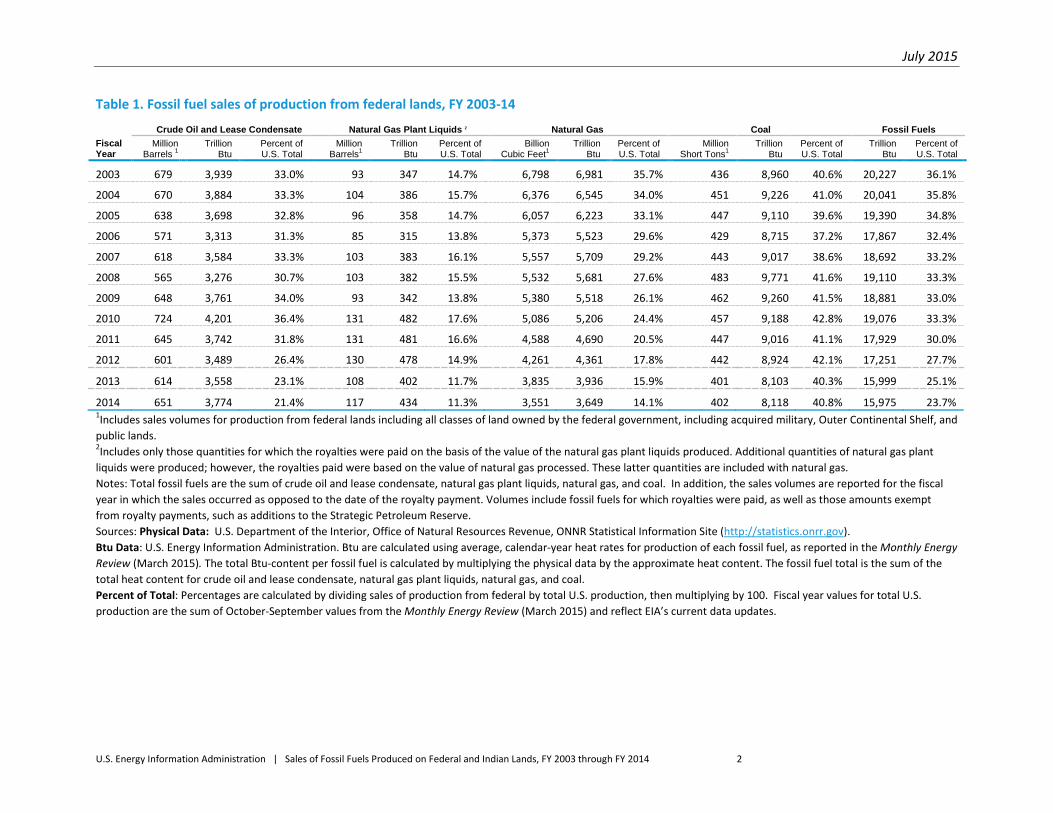
Table 1. Fossil fuel sales of production from federal lands, FY 2003-14
Fiscal Year
Crude Oil and Lease Condensate Natural Gas Plant Liquids 2 Natural Gas Coal Fossil Fuels Million
Barrels 1 Trillion
Btu Percent of U.S. Total
Million Barrels1
Trillion Btu
Percent of U.S. Total
Billion Cubic Feet1
Trillion Btu
Percent of U.S. Total
Million Short Tons1
Trillion Btu
Percent of U.S. Total
Trillion Btu
Percent of U.S. Total
2003 679 3,939 33.0% 93 347 14.7% 6,798 6,981 35.7% 436 8,960 40.6% 20,227 36.1%
2004 670 3,884 33.3% 104 386 15.7% 6,376 6,545 34.0% 451 9,226 41.0% 20,041 35.8%
2005 638 3,698 32.8% 96 358 14.7% 6,057 6,223 33.1% 447 9,110 39.6% 19,390 34.8%
2006 571 3,313 31.3% 85 315 13.8% 5,373 5,523 29.6% 429 8,715 37.2% 17,867 32.4%
2007 618 3,584 33.3% 103 383 16.1% 5,557 5,709 29.2% 443 9,017 38.6% 18,692 33.2%
2008 565 3,276 30.7% 103 382 15.5% 5,532 5,681 27.6% 483 9,771 41.6% 19,110 33.3%
2009 648 3,761 34.0% 93 342 13.8% 5,380 5,518 26.1% 462 9,260 41.5% 18,881 33.0%
2010 724 4,201 36.4% 131 482 17.6% 5,086 5,206 24.4% 457 9,188 42.8% 19,076 33.3%
2011 645 3,742 31.8% 131 481 16.6% 4,588 4,690 20.5% 447 9,016 41.1% 17,929 30.0%
2012 601 3,489 26.4% 130 478 14.9% 4,261 4,361 17.8% 442 8,924 42.1% 17,251 27.7%
2013 614 3,558 23.1% 108 402 11.7% 3,835 3,936 15.9% 401 8,103 40.3% 15,999 25.1%
2014 651 3,774 21.4% 117 434 11.3% 3,551 3,649 14.1% 402 8,118 40.8% 15,975 23.7% 1Includes sales volumes for production from federal lands including all classes of land owned by the federal government, including acquired military, Outer Continental Shelf, and public lands. 2Includes only those quantities for which the royalties were paid on the basis of the value of the natural gas plant liquids produced. Additional quantities of natural gas plant liquids were produced; however, the royalties paid were based on the value of natural gas processed. These latter quantities are included with natural gas. Notes: Total fossil fuels are the sum of crude oil and lease condensate, natural gas plant liquids, natural gas, and coal. In addition, the sales volumes are reported for the fiscal year in which the sales occurred as opposed to the date of the royalty payment. Volumes include fossil fuels for which royalties were paid, as well as those amounts exempt from royalty payments, such as additions to the Strategic Petroleum Reserve. Sources: Physical Data: U.S. Department of the Interior, Office of Natural Resources Revenue, ONNR Statistical Information Site (http://statistics.onrr.gov). Btu Data: U.S. Energy Information Administration. Btu are calculated using average, calendar-year heat rates for production of each fossil fuel, as reported in the Monthly Energy Review (March 2015). The total Btu-content per fossil fuel is calculated by multiplying the physical data by the approximate heat content. The fossil fuel total is the sum of the total heat content for crude oil and lease condensate, natural gas plant liquids, natural gas, and coal. Percent of Total: Percentages are calculated by dividing sales of production from federal by total U.S. production, then multiplying by 100. Fiscal year values for total U.S. production are the sum of October-September values from the Monthly Energy Review (March 2015) and reflect EIA’s current data updates.

July 2015
U.S. Energy Information Administration | Sales of Fossil Fuels Produced on Federal and Indian Lands, FY 2003 through FY 2014 3
Table 2. Fossil fuel sales of production from Indian lands, FY 2003-14
Fiscal Year
Crude Oil and Lease Condensate Natural Gas Plant Liquids 2 Natural Gas Coal Fossil Fuels Million
Barrels 1 Trillion
Btu Percent of U.S. Total
Million Barrels1
Trillion Btu
Percent of U.S. Total
Billion Cubic Feet1
Trillion Btu
Percent of U.S. Total
Million Short Tons1
Trillion Btu
Percent of U.S. Total
Trillion Btu
Percent of U.S. Total
2003 10 59 0.5% 2 6 0.3% 283 291 1.5% 30 616 2.8% 972 1.7%
2004 10 58 0.5% 2 7 0.3% 312 320 1.7% 33 667 3.0% 1,052 1.9%
2005 10 59 0.5% 2 7 0.3% 327 336 1.8% 34 698 3.0% 1,100 2.0%
2006 10 56 0.5% 2 8 0.3% 308 317 1.7% 29 593 2.5% 974 1.8%
2007 10 56 0.5% 3 10 0.4% 284 292 1.5% 27 558 2.4% 916 1.6%
2008 10 57 0.5% 3 11 0.4% 272 279 1.4% 26 527 2.2% 874 1.5%
2009 10 61 0.5% 3 10 0.4% 266 273 1.3% 26 521 2.3% 864 1.5%
2010 13 77 0.7% 3 11 0.4% 251 257 1.2% 22 435 2.0% 781 1.4%
2011 20 115 1.0% 3 12 0.4% 254 260 1.1% 22 444 2.0% 831 1.4%
2012 31 182 1.4% 4 13 0.4% 253 259 1.1% 19 383 1.8% 837 1.3%
2013 46 269 1.8% 4 14 0.4% 241 247 1.0% 19 387 1.9% 916 1.4%
2014 56 324 1.8% 4 16 0.4% 241 247 1.0% 19 380 1.9% 968 1.4% 1Includes sales volumes for production from Indian lands. 2Includes only those quantities for which the royalties were paid on the basis of the value of the natural gas plant liquids produced. Additional quantities of natural gas plant liquids were produced; however, the royalties paid were based on the value of natural gas processed. These latter quantities are included with natural gas. Notes: Total fossil fuels equals the sum of crude oil and lease condensate, natural gas plant liquids, natural gas, and coal. In addition, the sales volumes are reported for the fiscal year in which the sales occurred as opposed to the date of the royalty payment. Volumes include fossil fuels for which royalties were paid, as well as those amounts exempt from royalty payments, such as additions to the Strategic Petroleum Reserve. Sources: Physical Data: U.S. Department of the Interior, Office of Natural Resources Revenue, ONNR Statistical Information Site (http://statistics.onrr.gov). Btu Data: U.S. Energy Information Administration. Btu are calculated using average, calendar-year heat rates for production of each fossil fuel, as reported in the Monthly Energy Review (March 2015). The total Btu-content per fossil fuel is calculated by multiplying the physical data by the approximate heat content. The fossil fuel total is the sum of the total heat content for crude oil and lease condensate, natural gas plant liquids, natural gas, and coal. Percent of Total: Percentages are calculated by dividing sales of production from Indian lands by total U.S. production, then multiplying by 100. Fiscal year values for total U.S. production are the sum of October-September values from the Monthly Energy Review (March 2015) and reflect EIA’s current data updates.

July 2015
U.S. Energy Information Administration | Sales of Fossil Fuels Produced on Federal and Indian Lands, FY 2003 through FY 2014 4
Sales from production on federal and Indian lands
Federal lands Coal represented 51% of fossil fuel sales from production on federal lands in FY 2014, measured in common Btu units, followed by crude oil and lease condensate (24%), natural gas (23%), and natural gas plant liquids (NGPL) (3%). Total fossil fuels sales from production on federal lands decreased slightly from 15,999 trillion Btu in FY 2013 to 15,975 trillion Btu in FY 2014 (Table 1). On federal lands (only) in FY 2014:
• Sales of crude oil5 from federal lands increased 6%, from 614 million barrels in FY 2013 to 651 million barrels in FY 2014. Federal offshore and onshore oil production increased by 5% and 9%, respectively (Table 3). Despite this increase, crude oil production from federal lands as a share of total U.S. crude oil production decreased from 23% in FY 2013 to 21% in FY 2014. This decrease in the federal lands share of total production was the result of the 16% increase in total U.S. crude oil production.6
• Sales of natural gas from federal lands decreased 7%, from 3,835 billion cubic feet in FY 2013 to 3,551 billion cubic feet in FY 2014. Both offshore (11%) and onshore volumes (6%) declined (Table 4). Natural gas production on federal lands dropped to 14% of the U.S. total in FY 2014 from 16% in FY 2013. The largest portion of the drop in natural gas production on federal lands was from declines in the Gulf of Mexico and Wyoming.
• Sales of natural gas plant liquids (NGPL) produced on federal lands increased 8%, from 108 million barrels in FY 2013 to 117 million barrels in FY 2014. Both onshore (9%) and offshore volumes (7%) increased (Table 5). NGPL production from federal lands decreased from 12% to 11% of the U.S. total in FY 2014.
• Coal sales from production on federal lands increased slightly (0.2%) from 401 million short tons in FY 2013 to 402 million short tons in FY 2014 (Table 6). Coal produced on federal lands accounted for 41% of the U.S. total in FY 2014, up from 40% in FY 2013.
Indian Lands Coal represented 39% of fossil fuel sales from production on Indian lands in FY 2014, measured in common Btu units, followed by crude oil (33%), natural gas (26%), and NGPL (2%). Total fossil fuels sales from production on Indian lands increased 6% from 916 trillion Btu in FY 2013 to 968 trillion Btu in FY 2014 (Table 2), as oil and NGPL production increased, natural gas production remained level, and coal production declined. On Indian lands (only) in FY 2014:
• Sales of crude oil produced on Indian lands increased 22%, increasing from 46 million barrels in FY 2013 to 56 million barrels in FY 2014 (Table 3). The increase in Indian lands oil production was attributable mostly to gains on tribal lands in North Dakota (Bakken formation) and, to a lesser extent, gains on tribal lands in New Mexico and Utah.
• Sales of natural gas from Indian lands remained at 241 billion cubic feet in FY 2014 (Table 4).
5 Throughout this report, the term crude oil includes lease condensate. 6 http://www.eia.gov/dnav/pet/pet_crd_crpdn_adc_mbblpd_a.htm.

July 2015
U.S. Energy Information Administration | Sales of Fossil Fuels Produced on Federal and Indian Lands, FY 2003 through FY 2014 5
• Sales of NGPL increased slightly and coal production decreased slightly on Indian lands in FY 2014, but these changes were negligible in the context of reported units (million short tons) in the tables of this report. Therefore, the production of NGPL and coal from Indian lands in FY 2014 matches that of FY 2013, 4 million barrels and 19 million short tons, respectively (Tables 5 and 6).
Trends in federal and Indian lands production from FY 2003 through FY 2014 Overall fossil fuel production from federal lands generally declined between FY 2003 and FY 2014, down 21% in FY 2014 compared with FY 2003 (Table 1). This trend is primarily the result of a steady decline in federal offshore natural gas production between FY 2003 and FY 2014 and the 9% drop in coal production from federal lands from FY 2012 to FY 2013.
Conversely, overall fossil fuel production from Indian lands has risen since 2009 because of increasing crude oil and NGPL production. Total fossil fuels production on Indian lands in FY 2014 fell just short of surpassing the amount produced in FY 2003 (less than a 1% difference).
• Crude oil production from federal lands decreased 4% between FY 2003 and FY 2014 (Figure 1, Table 3). Production in the federal offshore declined 13% over that period, which outweighs the 49% increase in the federal onshore volumes over the same period. In FY 2014, the federal offshore still had the majority (77%) of total federal crude oil production, but its share declined compared with FY 2003 when it comprised 85% of all federal crude oil production.
• For the past six consecutive fiscal years, 2009-2014, oil production on Indian lands has increased (Figure 2). Between FY 2003 and FY 2014, oil production on Indian lands increased 460%.
• Natural gas production from federal lands has declined steadily, down 48% in FY 2014 from 2003(Figure 1, Table 4). The once-larger federal offshore volumes declined every year through FY 2014, down 76% from FY 2003. That decrease was partially offset by the now-larger onshore volumes, which increased 9% over the same time period. This declining natural gas production from federal lands, coupled with increasing total U.S. natural gas production7, steadily reduced the federal lands share of total U.S. natural gas production.
• NGPL production from federal lands increased 26% between FY 2003 and FY 2014 (Figure 1, Table 5). Following the natural gas trend, the once-larger federal offshore NGPL volumes declined 6%, while the now-larger onshore NGPL volumes increased 64% over the same period. NGPL production on Indian lands in FY 2014 was 4 million barrels, and while this level is twice the amount produced from Indian lands in FY 2003, it is a small volume compared with what was produced on federal lands (117 million barrels) in FY 2014.
• Federal land coal production declined 8% between FY 2003 and FY 2014 (Figure 1, Table 6). Coal production on Indian lands declined 37% over the same period. U.S. total coal production was an estimated 1,072 million short tons in 2003 and declined to 997 million short tons in 2014 (a 7% decline). Coal production from federal and Indian lands totaled 421 million short tons (42% of the U.S. total) in FY 2014.
7 http://www.eia.gov/dnav/ng/ng_prod_sum_dcu_NUS_a.htm.

July 2015
U.S. Energy Information Administration | Sales of Fossil Fuels Produced on Federal and Indian Lands, FY 2003 through FY 2014 6
Figure 1. Fossil fuel production on federal lands, FY 2003-14
Source: U.S. Energy Information Administration based on U.S. Department of the Interior, Office of Natural Resources Revenue. ONNR
Statistical Information Site (http://statistics.onrr.gov).
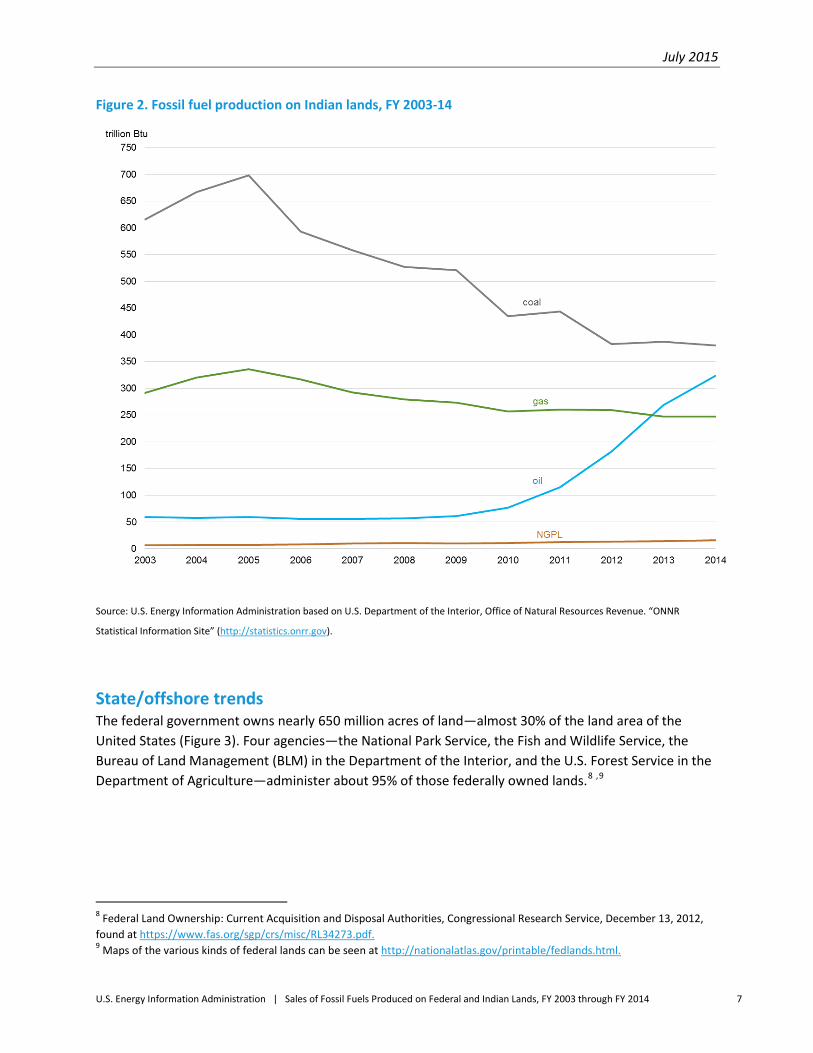
Total fossil fuel production from Indian lands increased each year since FY 2010. Increases in oil production have almost completely offset the decreases in coal production and natural gas production between FY 2003 and FY 2014 (Table 2). The annual totals are less than 1% different, but the FY 2003 level was slightly higher.
• Crude oil production from Indian lands increased 460% from 10 million barrels in FY 2003 to 56 million barrels in FY 2014. Almost all of this increase took place since FY 2010 (Figure 2, Table 3), and mostly in North Dakota (primarily the Fort Berthold Indian Reservation in the western part of the state, part of the Bakken/Three Forks tight oil play).
• Natural gas production and coal production from Indian lands declined between FY 2003 and FY 2014 by 15% and 37%, respectively. Except for a small deviation in FY 2011, natural gas and coal production have steadily declined since FY 2005 (Figure 2).
July 2015
U.S. Energy Information Administration | Sales of Fossil Fuels Produced on Federal and Indian Lands, FY 2003 through FY 2014 7
Figure 2. Fossil fuel production on Indian lands, FY 2003-14
Source: U.S. Energy Information Administration based on U.S. Department of the Interior, Office of Natural Resources Revenue. “ONNR
Statistical Information Site” (http://statistics.onrr.gov).
State/offshore trends The federal government owns nearly 650 million acres of land—almost 30% of the land area of the United States (Figure 3). Four agencies—the National Park Service, the Fish and Wildlife Service, the Bureau of Land Management (BLM) in the Department of the Interior, and the U.S. Forest Service in the Department of Agriculture—administer about 95% of those federally owned lands.8 ,9
8 Federal Land Ownership: Current Acquisition and Disposal Authorities, Congressional Research Service, December 13, 2012, found at https://www.fas.org/sgp/crs/misc/RL34273.pdf. 9 Maps of the various kinds of federal lands can be seen at http://nationalatlas.gov/printable/fedlands.html.
July 2015
U.S. Energy Information Administration | Sales of Fossil Fuels Produced on Federal and Indian Lands, FY 2003 through FY 2014 8
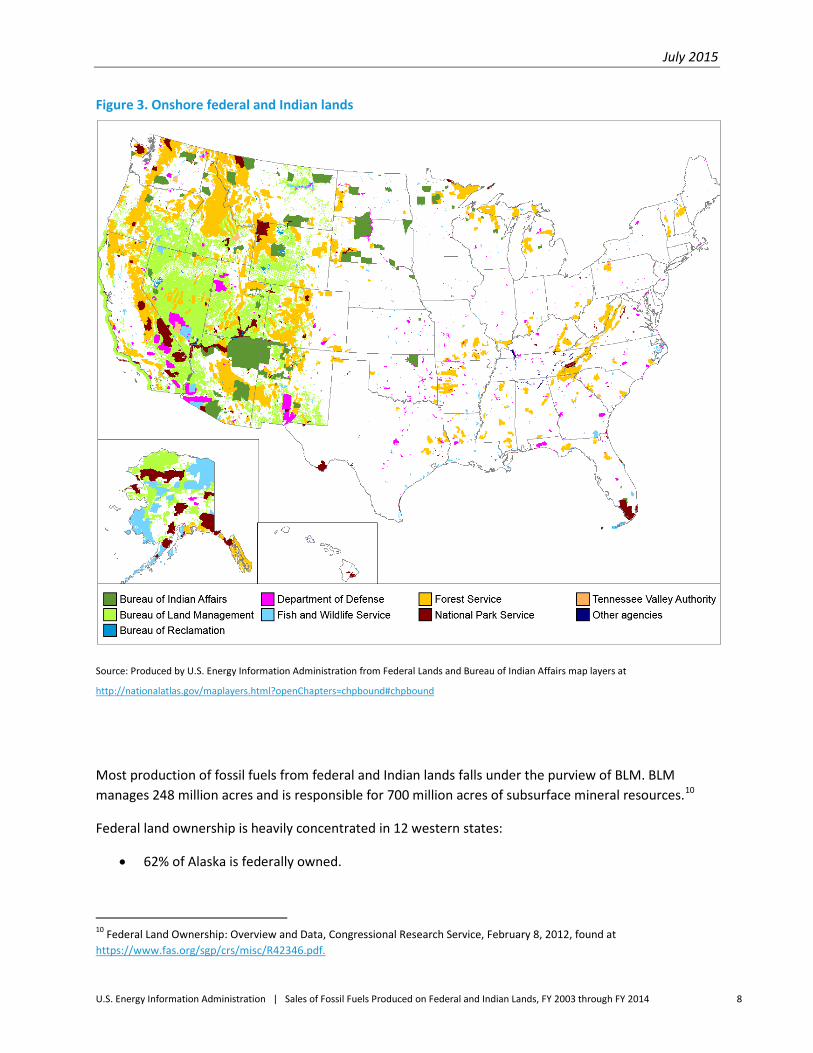
Figure 3. Onshore federal and Indian lands
Source: Produced by U.S. Energy Information Administration from Federal Lands and Bureau of Indian Affairs map layers at
http://nationalatlas.gov/maplayers.html?openChapters=chpbound#chpbound
Most production of fossil fuels from federal and Indian lands falls under the purview of BLM. BLM manages 248 million acres and is responsible for 700 million acres of subsurface mineral resources.10
Federal land ownership is heavily concentrated in 12 western states:
• 62% of Alaska is federally owned.
10 Federal Land Ownership: Overview and Data, Congressional Research Service, February 8, 2012, found at https://www.fas.org/sgp/crs/misc/R42346.pdf.

July 2015
U.S. Energy Information Administration | Sales of Fossil Fuels Produced on Federal and Indian Lands, FY 2003 through FY 2014 9
• 47% of the 11 western states11 in the Lower 48 states is federally owned. In calendar year 2013, those 11 western states represented approximately 20% of total U.S. reserves of crude oil and lease condensate and 23% of total U.S. reserves of wet natural gas.12 Wyoming, Montana, Colorado, Utah, and New Mexico are the leading states producing fossil fuels from federal and Indian lands.
• Only 4% of the total area of all the other states combined is federally owned.
Indian lands are primarily in the western United States, with concentrations in the four corners region of Arizona, New Mexico, Colorado, and Utah; North and South Dakota; and a few other states (Figure 3).
Figures 4 through 8 provide summary information for production from federal and Indian lands for leading states and offshore areas. Complete state-level data on production from federal and Indian lands are provided in Tables 7 through11.13 The relative and absolute contribution of each state and offshore region in federal and Indian lands production varies significantly across fuels. Some notable observations include:
• Wyoming and the federal Gulf of Mexico together produced 72% of the federal and Indian lands fossil fuels total in FY 2014 (Table 7, Figure 4). New Mexico, Colorado, and Utah were the next largest production states.
• The federal Gulf of Mexico produced 67% of the federal and Indian lands crude oil total in FY 2014 (Figure 5, Table 8). New Mexico, North Dakota, and Wyoming were the next largest crude oil producers on federal and Indian lands.
• Wyoming, the federal Gulf of Mexico, New Mexico, and Colorado together represented 86% of total production of natural gas on federal and Indian lands in FY 2014 (Figure 6, Table 9).
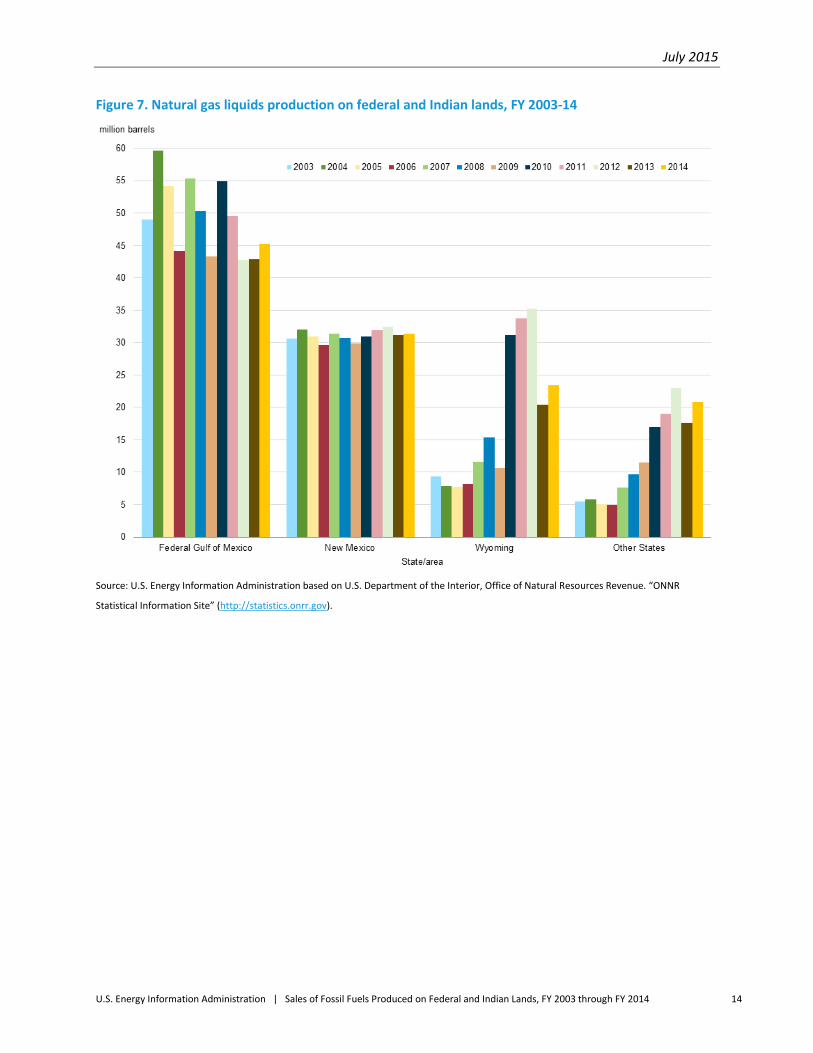
• The federal Gulf of Mexico, New Mexico, and Wyoming together produced 82% of NGPL from federal and Indian lands NGPL in FY 2014 (Figure 7, Table 10).
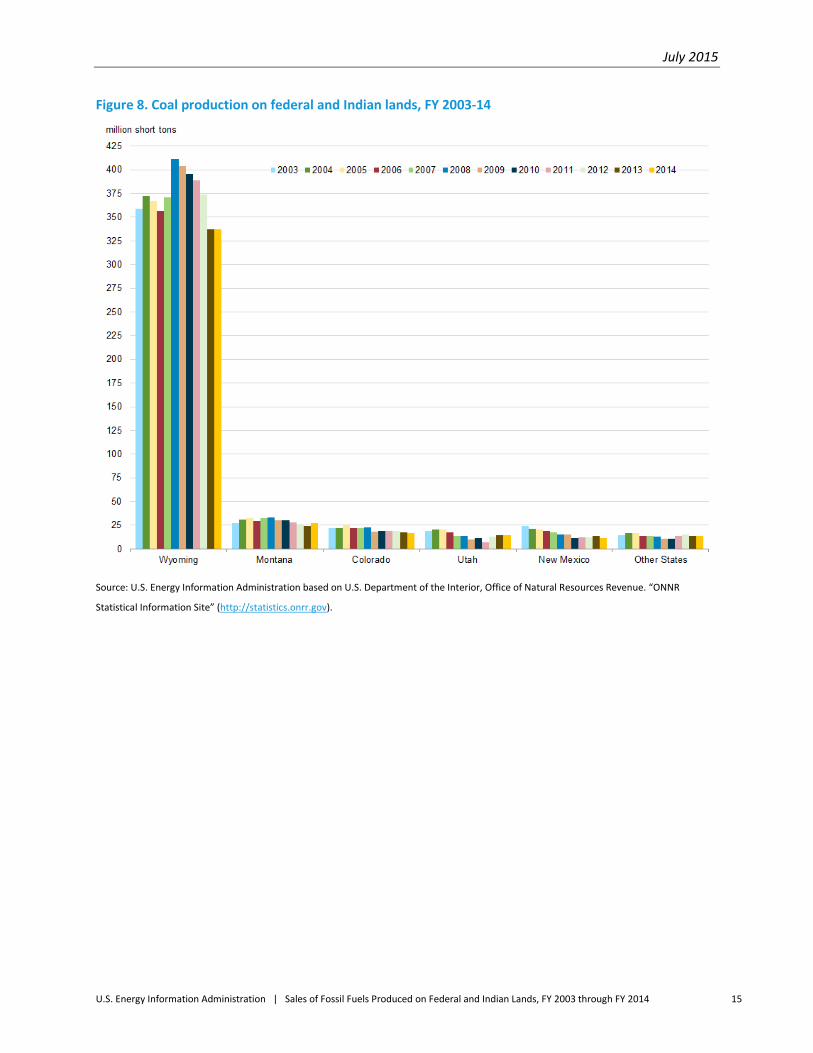
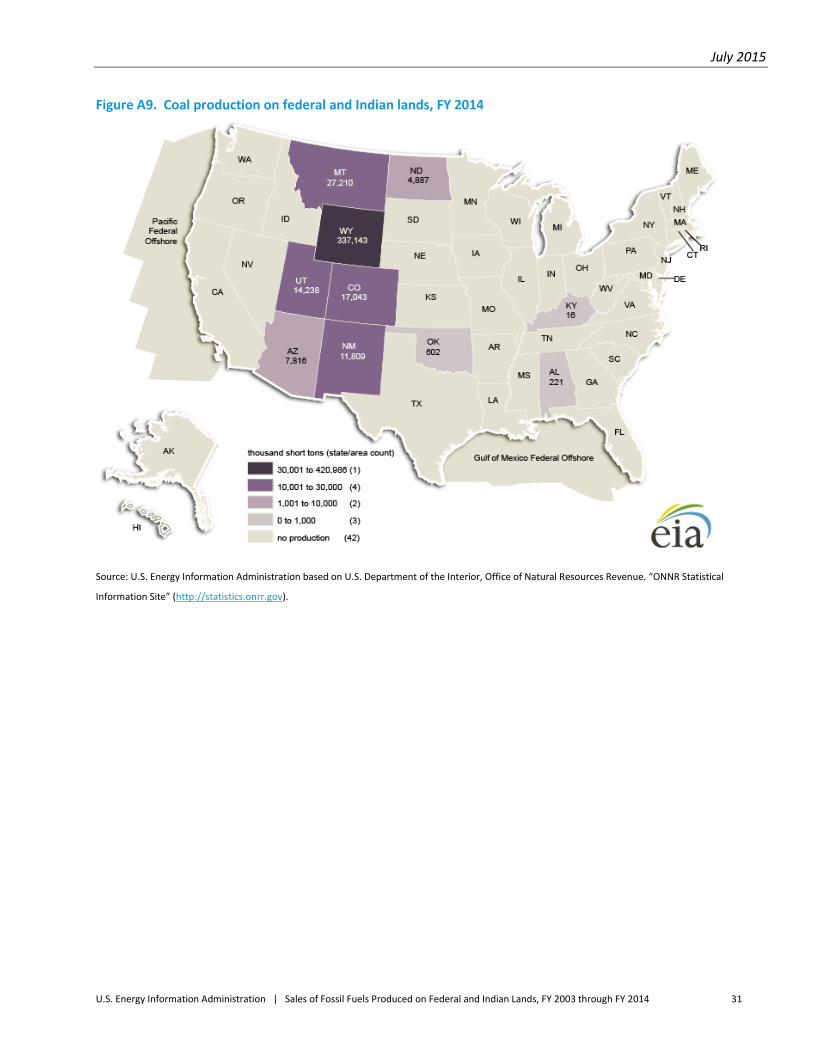
• Production of coal on federal and Indian lands is dominated by Wyoming, which accounted for 80% of the total in FY 2014 (Figure 8, Table11). Montana, Colorado, Utah, and New Mexico were the next biggest coal producers on federal and Indian lands. In FY 2014, coal production in Montana increased by 3 million short tons, and New Mexico production decreased by 2 million short tons.
11 Montana, Wyoming, Colorado, New Mexico, Idaho, Utah, Arizona, Washington, Oregon, Nevada, and California. 12 U.S. Crude Oil and Natural Gas Proved Reserves, 2013, Tables 6 and 10, EIA, December 2014, found at http://www.eia.gov/naturalgas/crudeoilreserves/. 13 The Appendix presents information from these tables in the form of maps of the latest state-level production levels and changes.

July 2015
U.S. Energy Information Administration | Sales of Fossil Fuels Produced on Federal and Indian Lands, FY 2003 through FY 2014 10
Figure 4. Fossil fuel production on federal and Indian lands, FY 2003-14
Source: U.S. Energy Information Administration based on U.S. Department of the Interior, Office of Natural Resources Revenue. “ONNR Statistical Information Site” (http://statistics.onrr.gov).
Data sources U.S. Department of Interior program offices continually collect sales and royalty payment data on fossil fuel sales of production from federal and Indian lands. Near the end of the first quarter of each calendar year, ONRR issues the sales data it collected for the previous sales year. Sales are assigned to the fiscal year in which they occur, not necessarily the same year royalties were collected. Audits conducted by ONNR result in revisions to data previously reported.
This report is based on information reported to and processed by ONRR as of March 31, 2015. ONRR updates the data values it reports for prior years. The recently updated data provided by ONRR for FY 2003 through FY 2014 generally fall within 2% of the volumes EIA reported previously, although updates for some NGPL volumes slightly exceeded that threshold (e.g., FY 2013 NGPL production volume was revised upward 3.3% in May 2013).
Additional data, background information, and discussions of methodology and key drivers contributing to trends in sales from production on federal lands during the FY 2003 through FY 2013 period are available in Sales of Fossil Fuels Produced on Federal and Indian Lands, FY 2003 through 2013 and on the ONRR website.
July 2015
U.S. Energy Information Administration | Sales of Fossil Fuels Produced on Federal and Indian Lands, FY 2003 through FY 2014 11
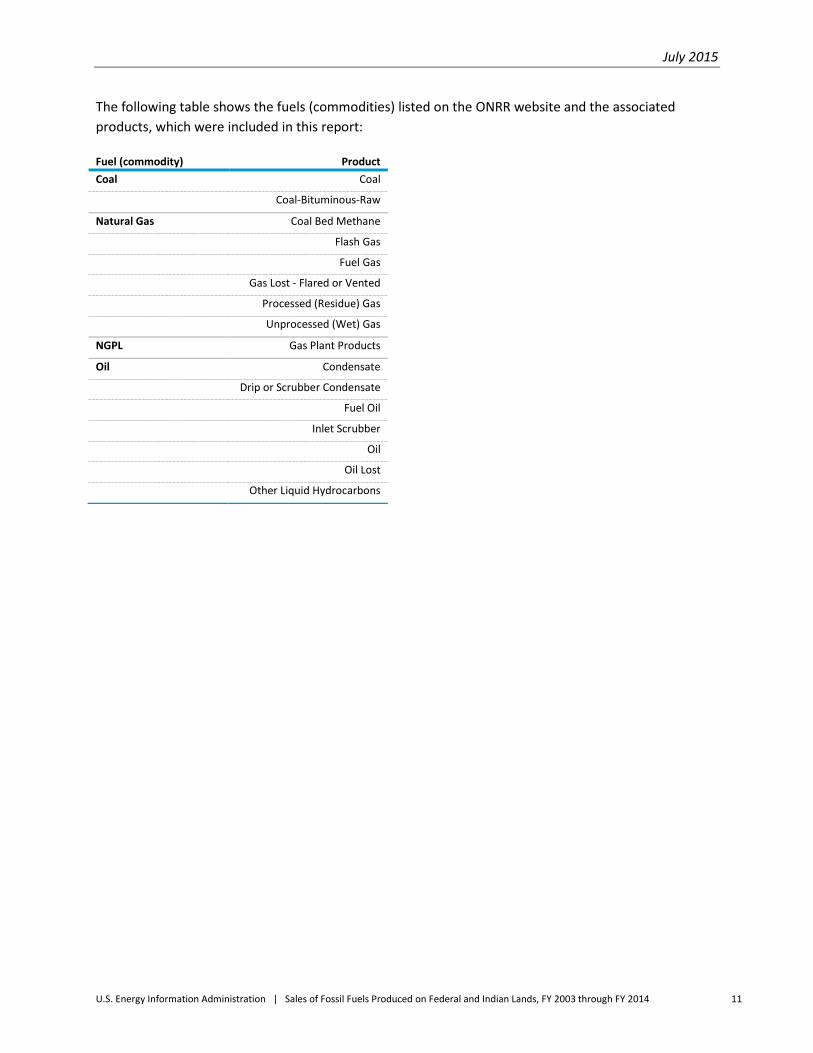
The following table shows the fuels (commodities) listed on the ONRR website and the associated products, which were included in this report:
Fuel (commodity) Product Coal Coal
Coal-Bituminous-Raw
Natural Gas Coal Bed Methane
Flash Gas
Fuel Gas
Gas Lost - Flared or Vented
Processed (Residue) Gas
Unprocessed (Wet) Gas
NGPL Gas Plant Products
Oil Condensate
Drip or Scrubber Condensate
Fuel Oil
Inlet Scrubber
Oil
Oil Lost
Other Liquid Hydrocarbons

July 2015
U.S. Energy Information Administration | Sales of Fossil Fuels Produced on Federal and Indian Lands, FY 2003 through FY 2014 12
Figure 5. Crude oil production on federal and Indian lands, FY 2003-14
Source: U.S. Energy Information Administration based on U.S. Department of the Interior, Office of Natural Resources Revenue. “ONNR Statistical Information Site” (http://statistics.onrr.gov).

July 2015
U.S. Energy Information Administration | Sales of Fossil Fuels Produced on Federal and Indian Lands, FY 2003 through FY 2014 13
Figure 6. Natural gas production on federal and Indian lands, FY 2003-14
Source: U.S. Energy Information Administration based on U.S. Department of the Interior, Office of Natural Resources Revenue. “ONNR
Statistical Information Site” (http://statistics.onrr.gov).
July 2015
U.S. Energy Information Administration | Sales of Fossil Fuels Produced on Federal and Indian Lands, FY 2003 through FY 2014 14
Figure 7. Natural gas liquids production on federal and Indian lands, FY 2003-14
Source: U.S. Energy Information Administration based on U.S. Department of the Interior, Office of Natural Resources Revenue. “ONNR
Statistical Information Site” (http://statistics.onrr.gov).
July 2015
U.S. Energy Information Administration | Sales of Fossil Fuels Produced on Federal and Indian Lands, FY 2003 through FY 2014 15
Figure 8. Coal production on federal and Indian lands, FY 2003-14
Source: U.S. Energy Information Administration based on U.S. Department of the Interior, Office of Natural Resources Revenue. “ONNR
Statistical Information Site” (http://statistics.onrr.gov).

July 2015
U.S. Energy Information Administration | Sales of Fossil Fuels Produced on Federal and Indian Lands, FY 2003 through FY 2014 16
Table 3. Sales of crude oil and lease condensate production from federal and Indian lands, FY 2003-14 million barrels
Notes: Totals may not equal sum of components because of independent rounding. Onshore federal excludes volumes on Indian lands. Offshore federal only includes areas in federal waters. Source: U.S. Energy Information Administration based on U.S. Department of the Interior, Office of Natural Resources Revenue. “ONNR Statistical Information Site” (http://statistics.onrr.gov).
Table 4. Sales of natural gas production from federal and Indian lands, FY 2003-14 billion cubic feet Fiscal Year Offshore Federal Onshore Federal Total Federal Indian Lands
2003 4,522 2,276 6,798 283
2004 4,025 2,351 6,376 312
2005 3,523 2,534 6,057 327
2006 2,754 2,619 5,373 308
2007 2,700 2,857 5,557 284
2008 2,483 3,049 5,532 272
2009 2,213 3,167 5,380 266
2010 2,080 3,006 5,086 251
2011 1,692 2,896 4,588 254
2012 1,374 2,887 4,261 253
2013 1,198 2,637 3,835 241
2014 1,069 2,482 3,551 241 Notes: Totals may not equal sum of components because of independent rounding. Onshore federal excludes volumes on Indian lands. Offshore federal only includes areas in federal waters. Source: U.S. Energy Information Administration based on U.S. Department of the Interior, Office of Natural Resources Revenue. “ONNR Statistical Information Site” (http://statistics.onrr.gov).
Fiscal Year Offshore Federal Onshore Federal Total Federal Indian Lands
2003 579 100 679 10
2004 572 97 670 10
2005 541 96 638 10
2006 471 100 571 10
2007 514 104 618 10
2008 462 103 565 10
2009 544 105 649 10
2010 616 108 724 13
2011 532 113 645 20
2012 476 125 601 31
2013 476 137 614 46
2014 502 149 651 56

July 2015
U.S. Energy Information Administration | Sales of Fossil Fuels Produced on Federal and Indian Lands, FY 2003 through FY 2014 17
Table 5. Sales of natural gas plant liquids production from federal and Indian lands, FY 2003-14 million barrels
Fiscal Year Offshore Federal Onshore Federal Total Federal Indian Lands
2003 51 42 93 2
2004 62 41 104 2
2005 56 40 96 2
2006 46 39 85 2
2007 59 44 103 3
2008 53 50 103 3
2009 45 47 93 3
2010 58 73 131 3
2011 52 79 131 3
2012 45 85 130 4
2013 45 63 108 4
2014 48 69 117 4 Notes: Totals may not equal sum of components because of independent rounding. Onshore federal excludes volumes on Indian lands. Offshore federal only includes areas in federal waters. Source: U.S. Energy Information Administration based on U.S. Department of the Interior, Office of Natural Resources Revenue. “ONNR Statistical Information Site” (http://statistics.onrr.gov).
Table 6. Sales of coal from federal and Indian lands, FY 2003-14 million short tons
Fiscal Year Federal Indian Lands
2003 436 30
2004 451 33
2005 447 34
2006 429 29
2007 443 27
2008 483 26
2009 462 26
2010 457 22
2011 447 22
2012 442 19
2013 401 19
2014 402 19 Source: U.S. Energy Information Administration based on U.S. Department of the Interior, Office of Natural Resources Revenue. “ONNR Statistical Information Site” (http://statistics.onrr.gov).

July 2015
U.S. Energy Information Administration | Sales of Fossil Fuels Produced on Federal and Indian Lands, FY 2003 through FY 2014 18
Table 7. Sales of fossil fuel production from federal and Indian lands by state/area, FY 2003-14 trillion Btu
State 2003 2004 2005 2006 2007 2008 2009 2010 2011 2012 2013 2014 Alabama 75 57 51 47 40 42 60 88 86 71 46 29 Alaska 61 66 68 52 32 28 27 23 21 19 18 21 Arizona 258 273 280 193 180 162 157 154 164 163 167 158 Arkansas 7 8 10 10 10 11 15 18 14 13 11 11 California 141 125 124 139 146 129 116 115 121 125 121 119 Colorado 785 842 960 906 905 931 846 868 917 952 875 877 Florida 0 - - - - - - - - - - - Illinois 0 - - - - - - - - - - - Indiana 0 - - - - - - - - - - - Kansas 12 11 11 12 10 10 10 9 8 7 7 6 Kentucky 0 - - 6 18 8 4 1 3 5 6 - Louisiana 225 245 188 164 167 162 146 127 116 111 106 88 Michigan 4 4 4 4 4 4 3 3 2 2 2 1 Mississippi 19 19 18 16 16 17 14 13 13 12 12 10 Montana 612 684 722 661 723 727 662 659 612 576 515 580 Nebraska 0 - 1 2 1 - - - - - - - Nevada 3 3 3 2 2 2 3 3 2 2 2 2 New Mexico 1,823 1,750 1,696 1,627 1,570 1,474 1,447 1,333 1,339 1,365 1,408 1,403 New York 0 - - - - - - - - - - - North Dakota 70 92 88 111 121 126 77 83 165 291 387 469 Offshore Gulf 7,570 7,086 6,484 5,289 5,553 5,046 5,235 5,587 4,713 4,078 3,907 3,949 Offshore Pacific 170 156 145 144 138 131 129 123 107 92 98 97 Ohio 1 1 1 1 1 1 1 1 1 1 1 - Oklahoma 56 57 56 57 59 57 60 60 63 63 62 63 Pennsylvania 0 - - - - - - - - - - - South Dakota 1 1 1 1 1 1 1 1 1 2 1 1 Texas 119 113 90 87 87 67 64 49 54 76 62 50 Utah 586 637 677 654 621 647 622 632 570 734 733 738 Virginia 0 - 1 1 - - - - - - - - Washington 4 - - - - - - - - - - - West Virginia 1 1 1 2 1 1 1 1 1 - - - Wyoming 8,596 8,863 8,813 8,653 9,197 10,198 10,048 9,908 9,665 9,331 8,369 8,270
Total 21,200 21,096 20,493 18,841 19,607 19,984 19,748 19,859 18,760 18,091 16,915 16,944 Note: Totals may not equal sum of components because of independent rounding. Source: U.S. Energy Information Administration based on U.S. Department of the Interior, Office of Natural Resources Revenue. “ONNR Statistical Information Site” (http://statistics.onrr.gov)
July 2015
U.S. Energy Information Administration | Sales of Fossil Fuels Produced on Federal and Indian Lands, FY 2003 through FY 2014 19
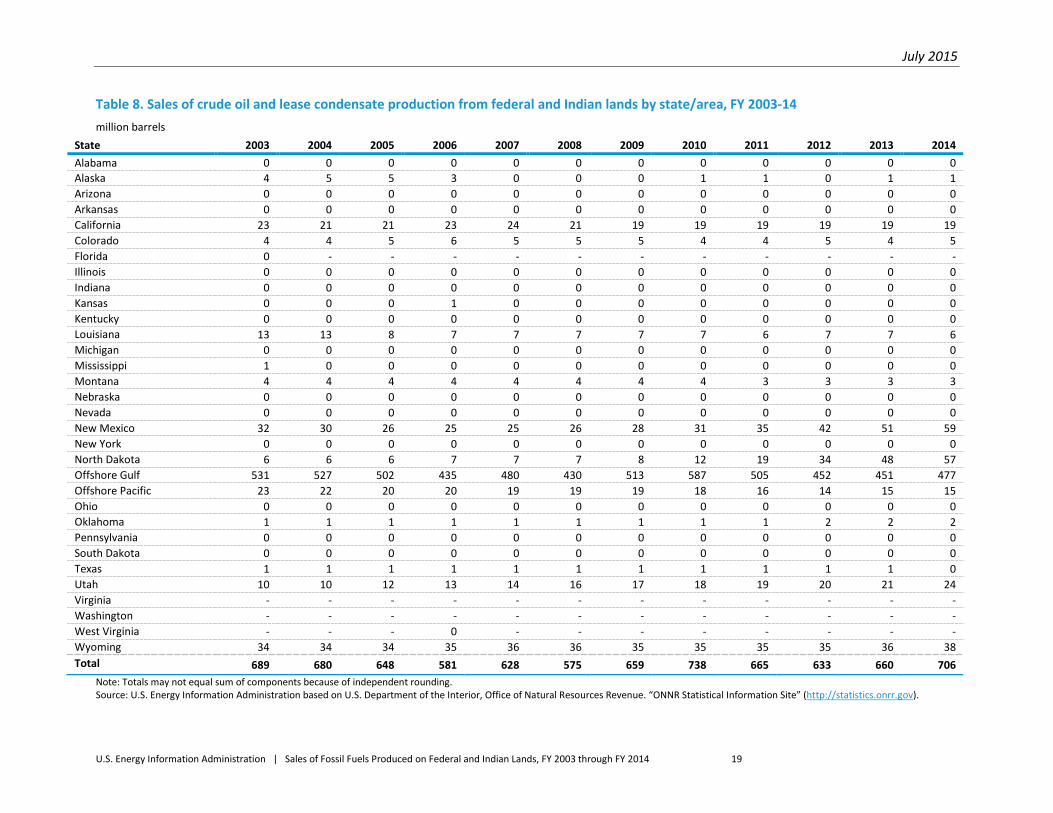
Table 8. Sales of crude oil and lease condensate production from federal and Indian lands by state/area, FY 2003-14 million barrels
State 2003 2004 2005 2006 2007 2008 2009 2010 2011 2012 2013 2014 Alabama 0 0 0 0 0 0 0 0 0 0 0 0 Alaska 4 5 5 3 0 0 0 1 1 0 1 1 Arizona 0 0 0 0 0 0 0 0 0 0 0 0 Arkansas 0 0 0 0 0 0 0 0 0 0 0 0 California 23 21 21 23 24 21 19 19 19 19 19 19 Colorado 4 4 5 6 5 5 5 4 4 5 4 5 Florida 0 - - - - - - - - - - - Illinois 0 0 0 0 0 0 0 0 0 0 0 0 Indiana 0 0 0 0 0 0 0 0 0 0 0 0 Kansas 0 0 0 1 0 0 0 0 0 0 0 0 Kentucky 0 0 0 0 0 0 0 0 0 0 0 0 Louisiana 13 13 8 7 7 7 7 7 6 7 7 6 Michigan 0 0 0 0 0 0 0 0 0 0 0 0 Mississippi 1 0 0 0 0 0 0 0 0 0 0 0 Montana 4 4 4 4 4 4 4 4 3 3 3 3 Nebraska 0 0 0 0 0 0 0 0 0 0 0 0 Nevada 0 0 0 0 0 0 0 0 0 0 0 0 New Mexico 32 30 26 25 25 26 28 31 35 42 51 59 New York 0 0 0 0 0 0 0 0 0 0 0 0 North Dakota 6 6 6 7 7 7 8 12 19 34 48 57 Offshore Gulf 531 527 502 435 480 430 513 587 505 452 451 477 Offshore Pacific 23 22 20 20 19 19 19 18 16 14 15 15 Ohio 0 0 0 0 0 0 0 0 0 0 0 0 Oklahoma 1 1 1 1 1 1 1 1 1 2 2 2 Pennsylvania 0 0 0 0 0 0 0 0 0 0 0 0 South Dakota 0 0 0 0 0 0 0 0 0 0 0 0 Texas 1 1 1 1 1 1 1 1 1 1 1 0 Utah 10 10 12 13 14 16 17 18 19 20 21 24 Virginia - - - - - - - - - - - - Washington - - - - - - - - - - - - West Virginia - - - 0 - - - - - - - - Wyoming 34 34 34 35 36 36 35 35 35 35 36 38 Total 689 680 648 581 628 575 659 738 665 633 660 706
Note: Totals may not equal sum of components because of independent rounding. Source: U.S. Energy Information Administration based on U.S. Department of the Interior, Office of Natural Resources Revenue. “ONNR Statistical Information Site” (http://statistics.onrr.gov).
July 2015
U.S. Energy Information Administration | Sales of Fossil Fuels Produced on Federal and Indian Lands, FY 2003 through FY 2014 20
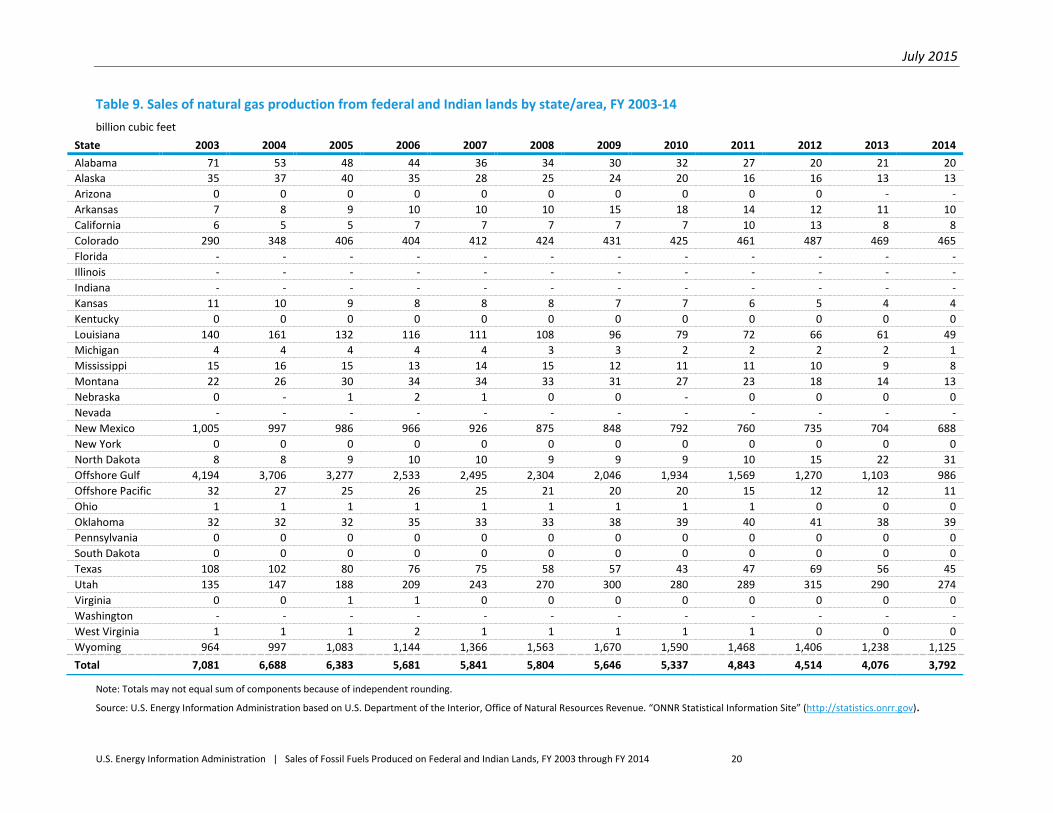
Table 9. Sales of natural gas production from federal and Indian lands by state/area, FY 2003-14 billion cubic feet
State 2003 2004 2005 2006 2007 2008 2009 2010 2011 2012 2013 2014 Alabama 71 53 48 44 36 34 30 32 27 20 21 20 Alaska 35 37 40 35 28 25 24 20 16 16 13 13 Arizona 0 0 0 0 0 0 0 0 0 0 - - Arkansas 7 8 9 10 10 10 15 18 14 12 11 10 California 6 5 5 7 7 7 7 7 10 13 8 8 Colorado 290 348 406 404 412 424 431 425 461 487 469 465 Florida - - - - - - - - - - - - Illinois - - - - - - - - - - - - Indiana - - - - - - - - - - - - Kansas 11 10 9 8 8 8 7 7 6 5 4 4 Kentucky 0 0 0 0 0 0 0 0 0 0 0 0 Louisiana 140 161 132 116 111 108 96 79 72 66 61 49 Michigan 4 4 4 4 4 3 3 2 2 2 2 1 Mississippi 15 16 15 13 14 15 12 11 11 10 9 8 Montana 22 26 30 34 34 33 31 27 23 18 14 13 Nebraska 0 - 1 2 1 0 0 - 0 0 0 0 Nevada - - - - - - - - - - - - New Mexico 1,005 997 986 966 926 875 848 792 760 735 704 688 New York 0 0 0 0 0 0 0 0 0 0 0 0 North Dakota 8 8 9 10 10 9 9 9 10 15 22 31 Offshore Gulf 4,194 3,706 3,277 2,533 2,495 2,304 2,046 1,934 1,569 1,270 1,103 986 Offshore Pacific 32 27 25 26 25 21 20 20 15 12 12 11 Ohio 1 1 1 1 1 1 1 1 1 0 0 0 Oklahoma 32 32 32 35 33 33 38 39 40 41 38 39 Pennsylvania 0 0 0 0 0 0 0 0 0 0 0 0 South Dakota 0 0 0 0 0 0 0 0 0 0 0 0 Texas 108 102 80 76 75 58 57 43 47 69 56 45 Utah 135 147 188 209 243 270 300 280 289 315 290 274 Virginia 0 0 1 1 0 0 0 0 0 0 0 0 Washington - - - - - - - - - - - - West Virginia 1 1 1 2 1 1 1 1 1 0 0 0 Wyoming 964 997 1,083 1,144 1,366 1,563 1,670 1,590 1,468 1,406 1,238 1,125 Total 7,081 6,688 6,383 5,681 5,841 5,804 5,646 5,337 4,843 4,514 4,076 3,792
Note: Totals may not equal sum of components because of independent rounding.
Source: U.S. Energy Information Administration based on U.S. Department of the Interior, Office of Natural Resources Revenue. “ONNR Statistical Information Site” (http://statistics.onrr.gov).

July 2015
U.S. Energy Information Administration | Sales of Fossil Fuels Produced on Federal and Indian Lands, FY 2003 through FY 2014 21
Table 10. Sales of natural gas plant liquids production from federal and Indian lands by state/area, FY 2003-14 million barrels
State 2003 2004 2005 2006 2007 2008 2009 2010 2011 2012 2013 2014 Alabama 0 0 0 0 1 1 1 1 1 1 1 1 Alaska 0 0 0 0 0 0 0 0 - - - 0 Arizona - - - - - - 0 0 0 0 - - Arkansas - - - - - - - - - - - - California 0 0 0 0 0 0 0 0 0 0 0 0 Colorado 1 1 1 1 1 3 5 8 9 11 6 7 Florida - - - - - - - - - - - - Illinois - - - - - - - - - - - - Indiana - - - - - - - - - - - - Kansas 0 0 0 0 0 0 0 0 0 0 0 0 Kentucky - - - - - - 0 0 0 - - - Louisiana 1 2 2 1 3 3 2 2 1 1 1 1 Michigan 0 0 0 0 0 0 0 0 0 0 0 0 Mississippi 0 0 - - - - - - - 0 0 - Montana 0 0 0 0 0 0 0 0 0 0 0 0 Nebraska - - - - - 0 - - - - - - Nevada - - - - - - - - - - - - New Mexico 31 32 31 30 31 31 30 31 32 32 31 31 New York - - - - - - - - - - - - North Dakota 0 0 0 0 0 0 0 0 0 1 1 2 Offshore Gulf 49 60 54 44 55 50 43 55 50 43 43 45 Offshore Pacific 0 0 0 0 0 0 0 0 0 0 0 0 Ohio - - - - - - - - - 0 0 - Oklahoma 0 0 0 0 0 0 0 0 0 1 1 0 Pennsylvania - - - - - - - - - 0 0 0 South Dakota - - - - - - - - - - - - Texas 0 0 0 0 0 0 0 0 0 0 0 0 Utah 1 1 1 1 1 2 4 5 6 8 7 8 Virginia - - - - - - - - - - - - Washington - - - - - - - - - - - - West Virginia - - - - - - - - - - - - Wyoming 9 8 8 8 12 15 11 31 34 35 20 23 Total 94 105 98 87 106 106 95 134 134 133 112 121
Note: Totals may not equal sum of components because of independent rounding. Source: U.S. Energy Information Administration based on U.S. Department of the Interior, Office of Natural Resources Revenue. “ONNR Statistical Information Site” (http://statistics.onrr.gov).

July 2015
U.S. Energy Information Administration | Sales of Fossil Fuels Produced on Federal and Indian Lands, FY 2003 through FY 2014 22
Table 11. Sales of coal production from federal and Indian lands by state/area, FY 2003-14 million short tons
State 2003 2004 2005 2006 2007 2008 2009 2010 2011 2012 2013 2014 Alabama 0 0 0 0 0 0 1 3 3 2 1 0 Alaska 0 0 0 0 0 0 0 0 0 0 0 0 Arizona 13 13 14 9 9 8 8 8 8 8 8 8 Arkansas 0 0 0 0 0 0 0 0 0 0 0 0 California 0 0 0 0 0 0 0 0 0 0 0 0 Colorado 22 22 25 22 22 23 18 19 19 19 17 17 Florida 0 0 0 0 0 0 0 0 0 0 0 0 Illinois 0 0 0 0 0 0 0 0 0 0 0 0 Indiana 0 0 0 0 0 0 0 0 0 0 0 0 Kansas 0 0 0 0 0 0 0 0 0 0 0 0 Kentucky 0 0 0 0 1 0 0 0 0 0 0 0 Louisiana 0 0 0 0 0 0 0 0 0 0 0 0 Michigan 0 0 0 0 0 0 0 0 0 0 0 0 Mississippi 0 0 0 0 0 0 0 0 0 0 0 0 Montana 28 31 33 30 33 33 30 30 28 27 24 27 Nebraska 0 0 0 0 0 0 0 0 0 0 0 0 Nevada 0 0 0 0 0 0 0 0 0 0 0 0 New Mexico 24 21 20 19 17 15 15 11 12 12 14 12 New York 0 0 0 0 0 0 0 0 0 0 0 0 North Dakota 1 2 2 3 3 4 1 0 2 4 4 5 Offshore Gulf 0 0 0 0 0 0 0 0 0 0 0 0 Offshore Pacific 0 0 0 0 0 0 0 0 0 0 0 0 Ohio 0 0 0 0 0 0 0 0 0 0 0 0 Oklahoma 1 1 1 1 1 1 1 1 1 0 1 1 Pennsylvania 0 0 0 0 0 0 0 0 0 0 0 0 South Dakota 0 0 0 0 0 0 0 0 0 0 0 0 Texas 0 0 0 0 0 0 0 0 0 0 0 0 Utah 19 21 20 18 14 14 10 11 7 13 14 14 Virginia 0 0 0 0 0 0 0 0 0 0 0 0 Washington 0 0 0 0 0 0 0 0 0 0 0 0 West Virginia 0 0 0 0 0 0 0 0 0 0 0 0 Wyoming 359 372 367 356 371 411 404 396 389 374 337 337 Total 466 484 482 458 471 509 488 478 470 461 420 421
Note: Totals may not equal sum of components because of independent rounding. Source: U.S. Energy Information Administration based on U.S. Department of the Interior, Office of Natural Resources Revenue. “ONNR Statistical Information Site” (http://statistics.onrr.gov).

July 2015
U.S. Energy Information Administration | Sales of Fossil Fuels Produced on Federal and Indian Lands, FY 2003 through FY 2014 23
Map Appendix
State/area maps Figure A1. Fossil fuel production on federal and Indian lands, FY 2014
Source: U.S. Energy Information Administration based on U.S. Department of the Interior, Office of Natural Resources Revenue. “ONNR Statistical
Information Site” (http://statistics.onrr.gov).

July 2015
U.S. Energy Information Administration | Sales of Fossil Fuels Produced on Federal and Indian Lands, FY 2003 through FY 2014 24
Figure A2. Changes in fossil fuels production (trillion Btu) on federal and Indian lands, FY 2013-14
Source: U.S. Energy Information Administration based on U.S. Department of the Interior, Office of Natural Resources Revenue. “ONNR Statistical
Information Site” (http://statistics.onrr.gov).

July 2015
U.S. Energy Information Administration | Sales of Fossil Fuels Produced on Federal and Indian Lands, FY 2003 through FY 2014 25
Figure A3. Crude oil production on federal and Indian lands, FY 2014
Source: U.S. Energy Information Administration based on U.S. Department of the Interior, Office of Natural Resources Revenue. “ONNR Statistical
Information Site” (http://statistics.onrr.gov).

July 2015
U.S. Energy Information Administration | Sales of Fossil Fuels Produced on Federal and Indian Lands, FY 2003 through FY 2014 26
Figure A4. Changes in crude oil production on federal and Indian lands, FY 2013-14
Source: U.S. Energy Information Administration based on U.S. Department of the Interior, Office of Natural Resources Revenue. “ONNR Statistical
Information Site” (http://statistics.onrr.gov).

July 2015
U.S. Energy Information Administration | Sales of Fossil Fuels Produced on Federal and Indian Lands, FY 2003 through FY 2014 27
Figure A5. Natural gas production on federal and Indian lands, FY 2014
Source: U.S. Energy Information Administration based on U.S. Department of the Interior, Office of Natural Resources Revenue. “ONNR Statistical
Information Site” (http://statistics.onrr.gov).
July 2015
U.S. Energy Information Administration | Sales of Fossil Fuels Produced on Federal and Indian Lands, FY 2003 through FY 2014 28
Figure A6. Changes in natural gas production on federal and Indian lands, FY 2013-14
Source: U.S. Energy Information Administration based on U.S. Department of the Interior, Office of Natural Resources Revenue. “ONNR Statistical
Information Site” (http://statistics.onrr.gov).

July 2015
U.S. Energy Information Administration | Sales of Fossil Fuels Produced on Federal and Indian Lands, FY 2003 through FY 2014 29
Figure A7. Natural gas liquids production on federal and Indian lands, FY 2014
Source: U.S. Energy Information Administration based on U.S. Department of the Interior, Office of Natural Resources Revenue. “ONNR Statistical
Information Site” (http://statistics.onrr.gov).

July 2015
U.S. Energy Information Administration | Sales of Fossil Fuels Produced on Federal and Indian Lands, FY 2003 through FY 2014 30
Figure A8. Changes in natural gas liquids production on federal and Indian lands, FY 2013-14
Source: U.S. Energy Information Administration based on U.S. Department of the Interior, Office of Natural Resources Revenue. “ONNR Statistical
Information Site” (http://statistics.onrr.gov).
July 2015
U.S. Energy Information Administration | Sales of Fossil Fuels Produced on Federal and Indian Lands, FY 2003 through FY 2014 31
Figure A9. Coal production on federal and Indian lands, FY 2014
Source: U.S. Energy Information Administration based on U.S. Department of the Interior, Office of Natural Resources Revenue. “ONNR Statistical
Information Site” (http://statistics.onrr.gov).

July 2015
U.S. Energy Information Administration | Sales of Fossil Fuels Produced on Federal and Indian Lands, FY 2003 through FY 2014 32
Figure A10. Changes in coal production on federal and Indian lands by state, FY 2013-14
Source: U.S. Energy Information Administration based on U.S. Department of the Interior, Office of Natural Resources Revenue. “ONNR Statistical
Information Site” (http://statistics.onrr.gov).