salasar techno engineering ltd - hdfc securities techno eng - pick... · salasar techno engineering...
TRANSCRIPT


1 | P a g e
PICK OF THE WEEK Jan 01, 2018
SALASAR TECHNO ENGINEERING LTD
Recommendation
Buy at CMP and add on declines
Add on dips to
Rs. 264-270
Sequential Targets
Rs. 351-401
Time Horizon
3-4 Quarters
Industry
Construction/Eng-
CMP
Rs. 302
FUNDAMENTAL ANALYST Abdul Karim [email protected]
HDFC Scrip Code SALTECEQNR BSE Code 540642 NSE Code SALASAR
TALWALKARS Bloomberg SALASAR IN CMP Dec 29 2017 Rs. 302 Equity Capital (Rscr)
13.3 Face Value (Rs) 10 Eq- Share O/S(crs) 1.33 Market Cap (Rscrs) 401 Book Value (Rs) 72.7 Avg.52 Wk Volume 180502 52 Week High 333.0 52 Week Low 198.1
Shareholding Pattern % (Sept 30, 17) Promoters 74.9 Institutions 0.4 Non Institutions 24.7 Total 100.0
Salasar Techno Engineering Ltd (STEL) was established in year 2001 to provide technologically advanced tower solutions to customers. STEL is engaged in manufacturing of customized steel fabrication and infrastructure solutions in India for Telecommunication Towers, Transmission Towers & Substation Structures and Solar Module Mounting Structures. Company provides all solutions by carrying out engineering, designing, fabrication, galvanization and deployment. STEL also manufactures utility poles, high mast poles, stadium lighting poles, flat poles and smart city poles. Investment Rationale: Diversified product portfolio across segments brings more opportunity to boost revenues; Established relationship with clients could help generate more revenue going forward; Technology partnership with Ramboll provides an edge to STEL in Telecom Towers; Robust order book and excellent pre-qualification credentials; Expected to receive more orders led by rising capex in energy, Infra, and railway projects going forward; Capacity expansion at its subsidiary could bring revenue growth visibility going forward; Strong financials led by consistent growth, strong credit profile, and healthy order book.
Concerns: Susceptibility of margins to volatility in prices of raw material; Transmission business depends on government projects/capex; Exit of any top client could impact its revenue going forward; Power T&D sector is highly competitive in nature due to tender-based nature of business; Its business is working capital intensive in nature.
View and Valuation: STEL has successfully diversified its product portfolio over the years into Transmission, Rural electrification, Solar and Railways apart from Telecom Towers to ensure diversification and support growth. It has expanded its capacity from 50000MTPA to 100000MTPA. Taking into the consideration of government’s focus on infrastructure, electrification, and smart city projects and telecom sector’s move towards 5G, STEL could see more opportunity to get orders. Going forward, we expect rising sales and profits, higher utilization and healthy diversified order book resulting in higher return ratios. We feel investors could buy the stock at the CMP and add on dips to Rs. 264-270 band (8.0x FY20E EPS) for sequential targets of Rs 351 (10.5x FY20E EPS) and Rs 401 (12.0x FY20E EPS). At the CMP of Rs 302 the stock trades at 9.0x FY20E EPS.

2 | P a g e
PICK OF THE WEEK Jan 01, 2018
SALASAR TECHNO ENGINEERING LTD
Financial Summary (Consolidated): Particulars (Rscr) Q2FY18 Q2FY17 YoY-% Q1FY18 QoQ-% FY17 FY18E FY19E FY20E Net Sales 99.6 77.9 27.8% 117.1 -15.0% 384.3 548.1 692.8 793.0 EBITDA 11.0 8.4 32.0% 12.0 -8.5% 38.6 57.3 71.4 81.3 APAT 5.5 3.3 67.1% 6.2 -11.0% 18.3 30.6 38.9 44.4 Diluted EPS (Rs) 4.6 3.6 26.9% 6.1 -25.6% 13.8 23.0 29.3 33.4 P/E (x) 21.9 13.1 10.3 9.0 RoE (%) 18.9% 19.0% 23.5% 21.5%
(Source: Company, HDFC sec) Company Profile: Salasar Techno Engineering Ltd (STEL) was established in year 2001 to provide technologically advanced tower solutions to customers. STEL is engaged in manufacturing of customized steel fabrication and infrastructure solutions in India for Telecommunication Towers, Transmission Towers & Substation Structures and Solar Module Mounting Structures. Company provides all solutions by carrying out engineering, designing, fabrication, galvanization and deployment. STEL also manufactures utility poles, high mast poles, stadium lighting poles, flat poles and smart city poles.
Salasar group is owned and promoted by the members of the Agrawal family of Delhi with extensive industry experience. The group has a long track record of operations for more than 16 years, which coupled with extensive experience of the promoters helps in better understanding of business cycle and develop established relationships with the customers and suppliers.
Company has technical collaboration with M/S Ramboll Telecom, Denmark for manufacturing of tubular towers as per their designs. Ramboll telecom is one of the world's foremost organizations in designing of telecom towers. At present, Salasar Techno is providing service to some of the largest corporates in India, such as Bharti Airtel, Reliance communication, Reliance Infra, Idea cellular, GTL India, Essar Telecom, Areva T&D, Enercon India, Triveni Engineering to name a few. Apart from serving such prestigious domestic clientele, STEL also exports its products to various countries in Africa and Asia. Company has ISO 9001: 2015, 14001: 2015 OHSAS 18001: 2007 certified standard ratings.
STEL has two manufacturing units at Jindal Nagar, Hapur District (UP) and Khera Dehat, Hapur District (UP) with an installed capacity of 100,000 MTPA (including 50000 MTPA in its subsidiary).
The group had an order book of Rs.380.67 crore as on November 30, 2017 (0.98x of FY17 total operating income) to be executed over the next 6-12 months
Subsidiary and Joint Venture Company: The Company has a wholly owned subsidiary based at NCR (National Capital Region)namely- Salasar Stainless Ltd(SSL) with an investment of Rs ~17.95 cr for 4999000 shares as on 31st March 2017. SSL’s sales stood at Rs12.45cr and Rs 1.93 cr in FY17. SSL was previously engaged in the manufacturing of stainless steel pipes and tubes. However, currently it majorly undertakes job-work for manufacturing of galvanized and non-galvanised mild steel (M.S.) structures for its holding company.
KEY HIGHLIGHTS
Salasar Techno Engineering Ltd (STEL) was established in year 2001 to provide technologically advanced tower solutions to customers. STEL is engaged in manufacturing of customized steel fabrication and infrastructure solutions in India for Telecommunication Towers, Transmission Towers & Substation Structures and Solar Module Mounting Structures.
STEL has diversified its product portfolio into Transmission, Rural electrification, Solar and Railways apart from Telecom towers to ensure diversification and support growth and expanded its capacity from 50000MTPA to 100000MTPA.
Taking into the consideration of government’s focus on infrastructure, electrification, and smart city projects and telecom sector’s move towards 5G, company could see more opportunity to get orders. Going forward, we expect rising sales and profits, higher utilization and healthy diversified order book resulting in higher return ratios.
3 | P a g e
PICK OF THE WEEK Jan 01, 2018
SALASAR TECHNO ENGINEERING LTD
STEL has entered into Joint Venture with Sikka Engineering Company named as Sikka- Salasar JV dated 30th March, 2017. for the purpose of participation in the Tender submitted with the Central Organisation for Railway Electrification for the work of "Design, Supply, Erection, Testing & Commissioning of 25Kv, 50H2, Single Phase, AC, electrification works. Sikka had qualifications for bidding for 185 km railway line and hence the JV. Sikka will be entitled to a royalty on sales from the project. This JV will execute Rs.49 cr project for railway electrification which will get completed by end FY19.
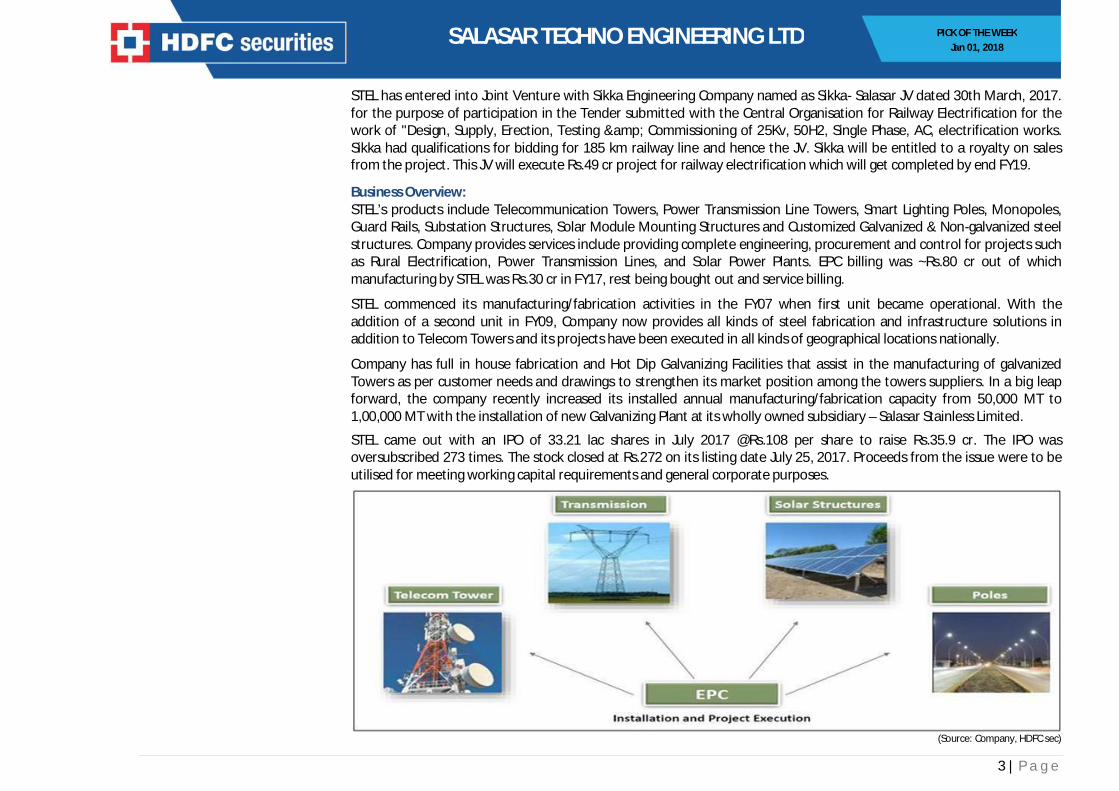
Business Overview: STEL’s products include Telecommunication Towers, Power Transmission Line Towers, Smart Lighting Poles, Monopoles, Guard Rails, Substation Structures, Solar Module Mounting Structures and Customized Galvanized & Non-galvanized steel structures. Company provides services include providing complete engineering, procurement and control for projects such as Rural Electrification, Power Transmission Lines, and Solar Power Plants. EPC billing was ~Rs.80 cr out of which manufacturing by STEL was Rs.30 cr in FY17, rest being bought out and service billing.
STEL commenced its manufacturing/fabrication activities in the FY07 when first unit became operational. With the addition of a second unit in FY09, Company now provides all kinds of steel fabrication and infrastructure solutions in addition to Telecom Towers and its projects have been executed in all kinds of geographical locations nationally.
Company has full in house fabrication and Hot Dip Galvanizing Facilities that assist in the manufacturing of galvanized Towers as per customer needs and drawings to strengthen its market position among the towers suppliers. In a big leap forward, the company recently increased its installed annual manufacturing/fabrication capacity from 50,000 MT to 1,00,000 MT with the installation of new Galvanizing Plant at its wholly owned subsidiary – Salasar Stainless Limited.
STEL came out with an IPO of 33.21 lac shares in July 2017 @Rs.108 per share to raise Rs.35.9 cr. The IPO was oversubscribed 273 times. The stock closed at Rs.272 on its listing date July 25, 2017. Proceeds from the issue were to be utilised for meeting working capital requirements and general corporate purposes.
(Source: Company, HDFC sec)
4 | P a g e
PICK OF THE WEEK Jan 01, 2018
SALASAR TECHNO ENGINEERING LTD
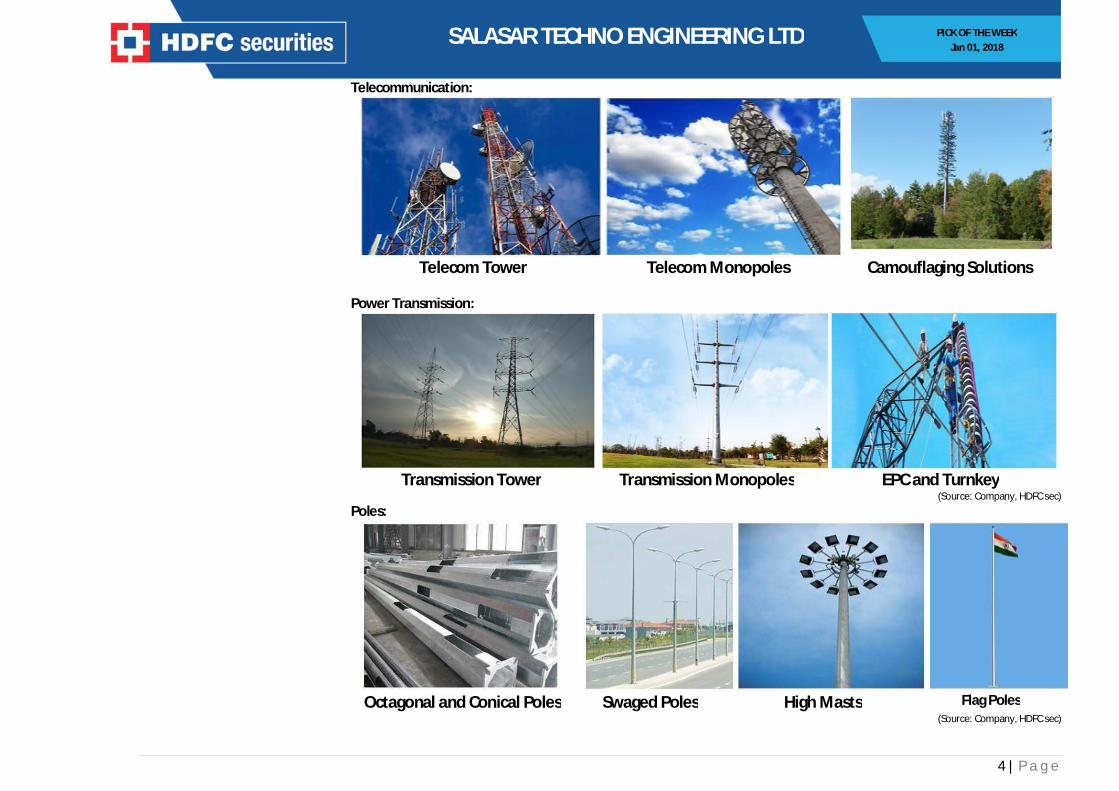
Telecommunication:
Telecom Tower Telecom Monopoles Camouflaging Solutions Power Transmission:
Transmission Tower Transmission Monopoles EPC and Turnkey
(Source: Company, HDFC sec) Poles:
Octagonal and Conical Poles Swaged Poles High Masts Flag Poles
(Source: Company, HDFC sec)
5 | P a g e
PICK OF THE WEEK Jan 01, 2018
SALASAR TECHNO ENGINEERING LTD
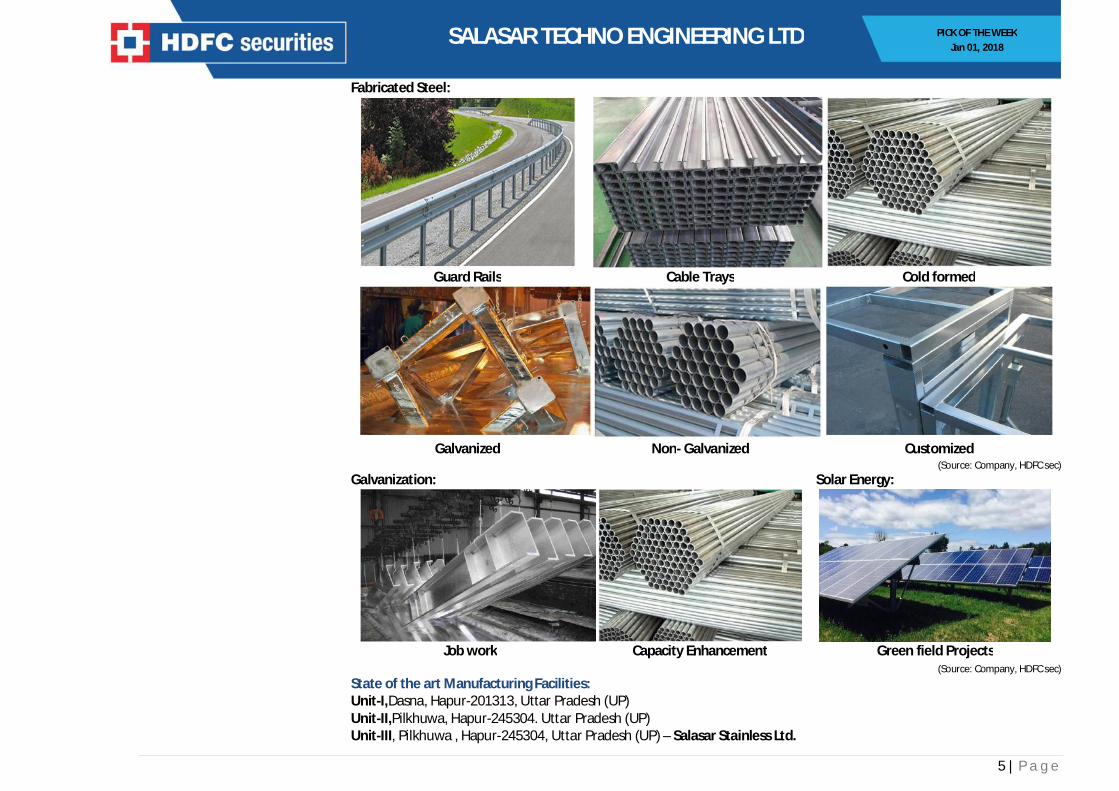
Fabricated Steel:
Guard Rails Cable Trays Cold formed
Galvanized Non- Galvanized Customized
(Source: Company, HDFC sec) Galvanization: Solar Energy:
Job work Capacity Enhancement Green field Projects
(Source: Company, HDFC sec) State of the art Manufacturing Facilities: Unit-I,Dasna, Hapur-201313, Uttar Pradesh (UP) Unit-II,Pilkhuwa, Hapur-245304. Uttar Pradesh (UP) Unit-III, Pilkhuwa , Hapur-245304, Uttar Pradesh (UP) – Salasar Stainless Ltd.
6 | P a g e
PICK OF THE WEEK Jan 01, 2018
SALASAR TECHNO ENGINEERING LTD
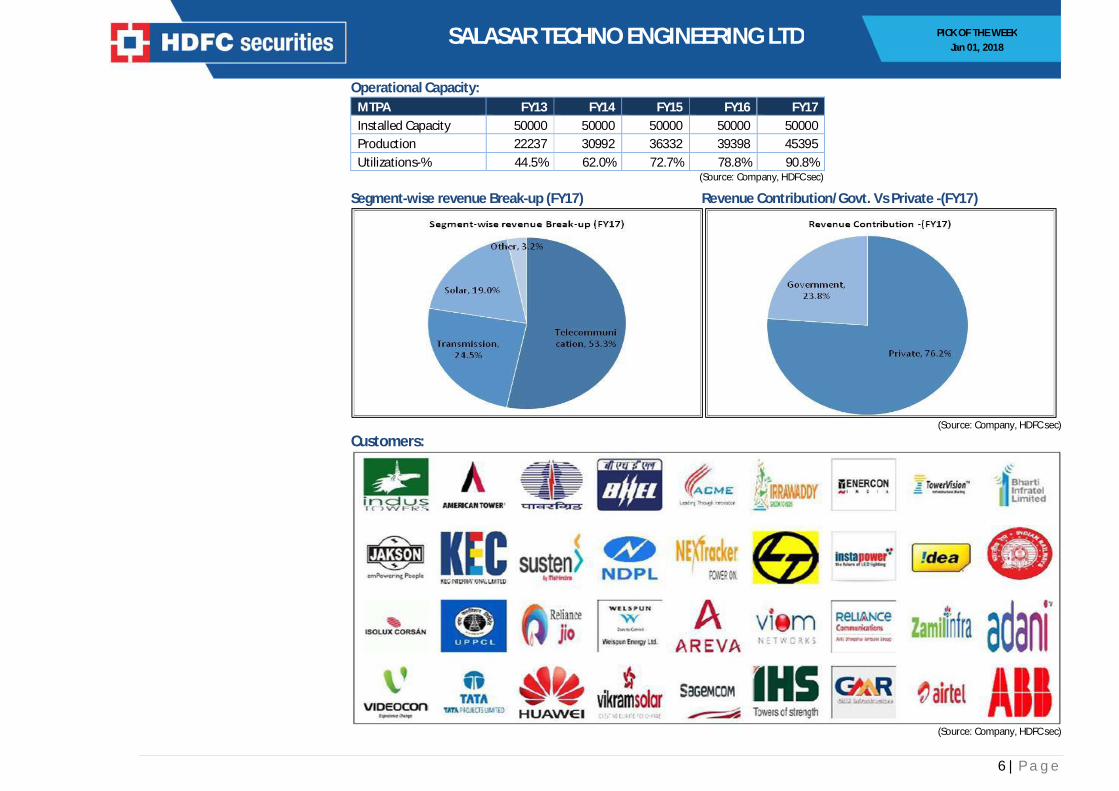
Operational Capacity: MTPA FY13 FY14 FY15 FY16 FY17 Installed Capacity 50000 50000 50000 50000 50000 Production 22237 30992 36332 39398 45395 Utilizations-% 44.5% 62.0% 72.7% 78.8% 90.8%
(Source: Company, HDFC sec)
Segment-wise revenue Break-up (FY17) Revenue Contribution/Govt. Vs Private -(FY17)
(Source: Company, HDFC sec)
Customers:
(Source: Company, HDFC sec)
7 | P a g e
PICK OF THE WEEK Jan 01, 2018
SALASAR TECHNO ENGINEERING LTD
Industry Overview: Infrastructure sector Development and growth of Infrastructure sector is critical for rapid growth of domestic steel industry in the country.
Steel industry is a major user of infrastructural facilities especially of Railways, roads, power, and ports. As per the working group projections, the steel production in the country could nearly double within the next five years. This requires rapid growth of railways, roads, ports and power facilities.
Growth in the infrastructure and construction segment is expected to be driven by power, roads, irrigation and urban infrastructure. To support infrastructure in the country, the Government has identified infrastructure as a priority sector to bolster the GDP growth rate.
Telecom Tower: With a total of 11 operators serving an active wireless subscriber base of 842.39 million (88.45% of total registered
wireless subscriber base), the Indian telecom market is now amongst the most competitive markets in the world. Telecommunications in India has grown from a fledgling to a large industry over the last decade, As per industry sources,
telecom tower companies in India could post a revenue growth of about 10 percent over the next two years, as mobile operators are expanding their 3G and 4G footprint and will seek to lease more tower space.
Considering India is at the cusp of a rolling out 4G and other high end services, industry estimates significant growth and bright future of the Indian Tower Industry.
The growth in telecom sector has helped India emerge as a trendsetter in the tower infrastructure segment. Around 70 per cent of India’s 4,00,000 towers are owned and operated by tower companies. The advent of new technologies, such as 4G by Telecom Service Providers (TSPs), along with expansion in the rural areas, is expected to be key drivers for the telecom infrastructure industry over the next five years.
Transmission Towers: India’s Power Transmission networks constitute the vital part of the entire power value chain. The growth of power
sector is contingent to development of a robust and a reliable transmission network. As per the 12th Five Year Plan, the future expansion in power generation capacity in India is planned around 88GW. In
order to meet this capacity, investment in the transmission sector needs to be increased. Overall, an addition of 90,000 ckm of 765-220 kV lines, 154,000 MVA of substation capacity and 27,350 MW of national grid capacity is required in order to meet the 12th Five Year Plan.
FY 16 saw an addition of around 28,114 ckm(Circuit Kilometer) of transmission lines (220kV and above) and in FY17 another 23,384 ckm of transmission lines (220kV and above) is expected to be further added.
An investment of USD 35 billion has planned in the power transmission sector. Of this, about USD 19 billion has planned to 10 come from Power Grid Corporation of India Ltd. The remaining USD 16 billion, ~46% of the total investments, needs to be secured from private players.

8 | P a g e
PICK OF THE WEEK Jan 01, 2018
SALASAR TECHNO ENGINEERING LTD
Sub-Station Structure: India is undertaking a sustained heavy capital-expenditure program that is running at US$4- 5bn annually to cover grid-
transmission line and substation expansions and upgrades while expanding interregional capacity. The Indian grid has an installed generation capacity of ~250GW. In next 5 years, that figure is expected to approach 500GW, requiring an investment of more than US$20bn.
Solar Energy Sector: Renewable energy contributes 14.7% of the total installed capacity in the country (as on 31.07.2016). India has
ambitious target of 175 GW of renewable power by 2022 which includes 100 GW of Solar power, 60 GW from wind power, 10 GW from biomass power and 5 GW from small hydro power.
Investment Rationale: Diversified product portfolio across segments brings more opportunity to boost revenues: STEL has a strong product portfolio across various segments, which enables to cater to its various marquee customers present across diverse industries such as telecom, engineering, infrastructure, etc. STEL, through its production prowess designs, engineers and installs structures as per the customer’s requirements.
Telecommunication Towers have several applications in different sectors, such as mobile, internet, television, navigation and radio signal transmissions. These are structures which house the dishes and receivers required for wireless communication and data transfers. Company has manufactured and erected more than 10,000 towers of various designs- Angular, Tubular, Hybrid Ground Based Towers (GBT) and Roof Top Towers- for various leading telecom companies in India. Solar Module Mounting structures are used to fix solar panels on surfaces like roofs, building facades and on the ground. These mounting systems generally enable retrofitting of solar panels on roofs or as part of the structure of the building. STEL carries out rural electrification projects under the government through route mapping, feeder segregation and installation of transmission lines and substations. Apart from this, STEL has executed projects for various clients, including Rajasthan Rajya Vidyut Prasaran Nigam Limited and NTPC Ltd, among others. Its diversified product portfolio could help to bring more opportunity for adding revenues going forward and insulate itself from downturn in anyone segment. Established relationship with clients could help to generate more revenue going forward: STEL has established relationship with suppliers and customers and caters to the leading names in India. It has in the past done Transmission and Substation for U.P. Power Transmission Corporation Ltd, Tata Power Delhi Distribution Ltd., Unitech Power Transmission Ltd., executing orders of Telecom Towers including erection of towers for ATC India Tower Corporation Pvt Ltd, Indus Towers Ltd, ATC Telecom Infrastructure Pvt Ltd, Bharti Infratel Ltd, Reliance Jio Infocomm Ltd, Tower Vision India Pvt Ltd, Viom Networks Ltd, and supplying Solar Mounting Module Structures for Jakson Engineers Ltd, Prayatna Developers Pvt Ltd, Welspun Renewables Energy Pvt Ltd., Insta Power Energy Efficiency Pvt Ltd etc.
9 | P a g e
PICK OF THE WEEK Jan 01, 2018
SALASAR TECHNO ENGINEERING LTD
Manufacturing partnership with Ramboll brings technical expertise in Tabular Telecom Towers: Ramboll Telecom is Denmark based company, engaged in engineering, design and consulting activities in Telecom Towers. Company is the market leader in innovative designs and supply of tower solutions with a history in analysis, design and construction of towers and masts since 1945, and nearly 30,000 masts and towers bear its stamp worldwide.
STEL has a technical collaboration with Ramboll which has enabled it to become one of the India’s key players in the manufacturing and fabrication of telecom towers. Robust order book and excellent pre-qualification credentials: Company has executed various projects over the past among few major projects were for Rajasthan Rajya Vidyut Prasaran Nigam Ltd, NTPC Ltd (Raj), Today Green Energy Pvt Ltd, Bharti Infratel Ltd, Reliance Jio Infocomm Ltd, Zamil Infra Pvt Ltd, Indus Towers Ltd, Welspun Energy Pvt Ltd and ATC Telecom Infrastructure Pvt Ltd.
Execution of projects of U. P. Power Transmission Corporation Ltd, Acme Cleantech Solution Pvt Ltd, Bharti Hexacom Ltd, Renew Solar Energy Pvt Ltd, Mahindra Susten Pvt. Ltd, Reliance Jio Infocomm Ltd, Prayatna Developers Pvt Ltd, Paschimanchal Vidyut Vitran Nigam Ltd, PES Solar Pvt Ltd and many more are under process.
Expected to receive government’s order led by rising capex in energy, Infra, and railway projects going forward: In India, Power Grid Corporation India Ltd is one of the leading players in T&D (Transmission and distribution) and it participates in most of government’s bid. Apart from PGCIL’s sustained and steady capex, state government’s spend on transmission infrastructure is also expected to improve to meet their UDAY related milestones. STEL is expected to be a key beneficiary of this strong growth prospect in India. STEL has already got one order from Railways for rail electrification in its JV and is expected to get more such orders in future given Rail Minister’s vision to electrify its entire network in the next four years at a cost of Rs.35000 cr.
Government’s thrust on improving rail and energy infrastructure is also expected to result in rising capex for the sectors. STEL is seeing a lot of traction on orders both in T&D and railways and has strong order book in both the businesses. STEL has been building robust team there on execution. Currently, these businesses contribute around 70% of the order book and are expected to grow significantly. Ordering from Telecom Towers segment could be robust: China has over1m sites (compared to a little more than 0.4mn in India) hence showing the scope for addition of towers in future. Further move towards 5G technology could result in smaller but closer towers (Inter-site distance of500m for 5G). This could result in extensive small cell deployments in future. Capacity expansion by its subsidiary could bring revenue visibility going forward: Recently, STEL’s wholly owned subsidiary Salasar Stainless Ltd (SSL) has installed Galvanizing Plant of 50,000 MT which has increased its installed galvanizing capacity to 1,00,000 MT. Now STEL group can manufacture & execute projects twice the earlier size. Apart from this, company continues to expand its product portfolio by upgrading existing products and introducing new ones to maintain market share and engage new customers. Focusing on new segment like Railways and Power could also help utilise the new capacity better.
10 | P a g e
PICK OF THE WEEK Jan 01, 2018
SALASAR TECHNO ENGINEERING LTD
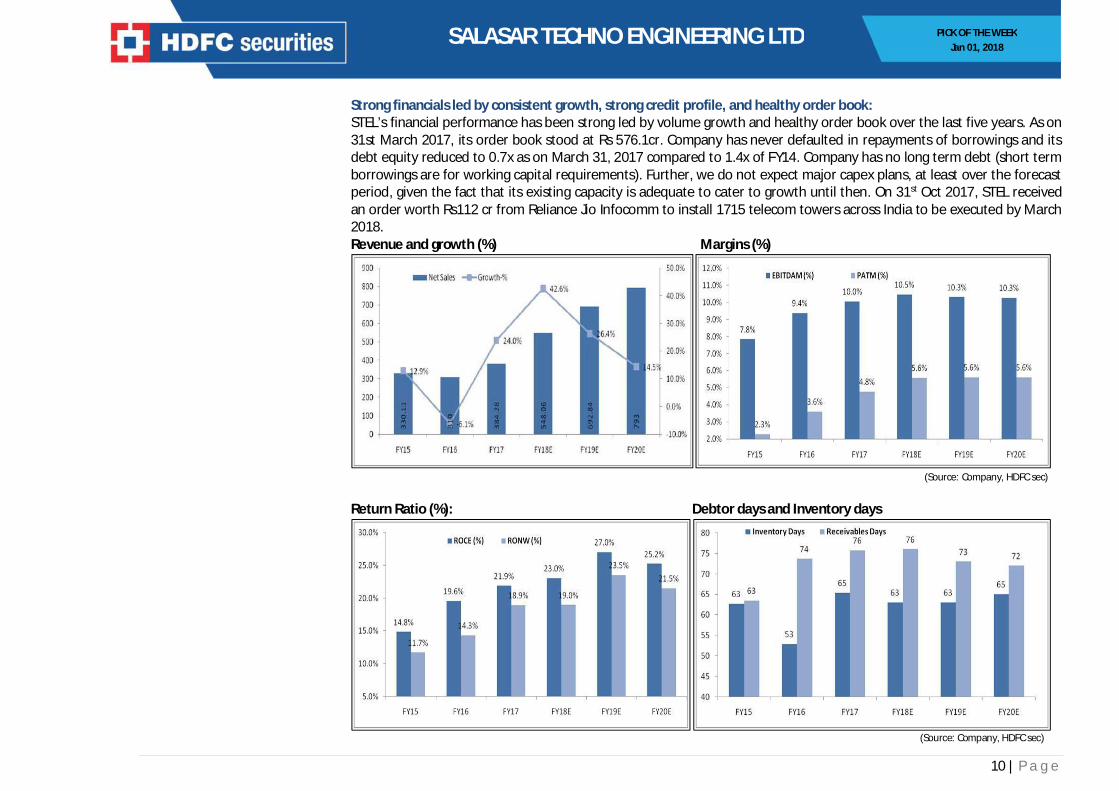
Strong financials led by consistent growth, strong credit profile, and healthy order book: STEL’s financial performance has been strong led by volume growth and healthy order book over the last five years. As on 31st March 2017, its order book stood at Rs 576.1cr. Company has never defaulted in repayments of borrowings and its debt equity reduced to 0.7x as on March 31, 2017 compared to 1.4x of FY14. Company has no long term debt (short term borrowings are for working capital requirements). Further, we do not expect major capex plans, at least over the forecast period, given the fact that its existing capacity is adequate to cater to growth until then. On 31st Oct 2017, STEL received an order worth Rs112 cr from Reliance Jio Infocomm to install 1715 telecom towers across India to be executed by March 2018. Revenue and growth (%) Margins (%)
(Source: Company, HDFC sec)
Return Ratio (%): Debtor days and Inventory days
(Source: Company, HDFC sec)

11 | P a g e
PICK OF THE WEEK Jan 01, 2018
SALASAR TECHNO ENGINEERING LTD
Risk and Concerns: Susceptibility of margins to volatility in prices of raw material: The operations of the group are raw material intensive in nature as reflected by raw material cost constituting around 72% of total cost of sales in FY17. The key raw material required include steel, copper, zinc etc. prices of which are highly volatile in nature, and the group is thus exposed to the risk of price volatility. However, Salasar group has lower risk of volatile raw material prices due to the price variation clause in its agreements with clients. Default or delay in payment from customers could impact its profitability going forward: Company’s operations involve extending credit, ranging typically from 60 to 90 days, to customers in respect of products. For the FY17, FY16 & FY15, its trade receivables stood at Rs. 77.7 cr, Rs. 56.9 cr and Rs. 38.9 cr, respectively, which constituted 20.8%, 20.6% and 14.1% respectively of total revenues. Foreign Currency fluctuations: Company exports its products to other countries that are generally priced in foreign currency, exports revenue contributes ~3% on sales on consolidated basis as on 31st March 2017. Accordingly any rise in the value of the Rupee against the foreign currency would decrease the Rupee cost of such products. However, company has been reducing its export contribution over the period efficiently; it was 12.3% of sales in FY14. Transmission business highly depends on government projects: Transmission business increasingly relies on projects awarded or funded by the Government or State Governments. STEL has various government clients and top clients in transmission business are UP Power Transmission Corporation Ltd and Paschimanchal Vidyut Vitaran Nigam Ltd. Any slowdown in spending by the Govts could result in lower growth for STEL. Exit of any top client could impact its revenue going forward: Company’s top five clients contribute 55.1% of revenues as on 31st March 31, 2017 and this ratio was 64.5% and 63.1% as on 31st March 2016 and 31st March 2015 respectively. Any decline in quality standards, growing competition and any change in the demand for products by customers may result in exit by any one or more of these big clients resulting in impact on top and bottomline. Business is working capital intensive in nature The business of STEL is working capital intensive as reflected by operating cycle of 104 days on March 31, 2017 driven by average inventory and debtors of 60 days and 69 days respectively. Inventory holding is high due to its relatively long lead manufacturing time of about 3 to 4 weeks and sizeable amount of inventory required for the fabrication work. Collection days remain high due to credit period offered to established clientele in telecom sector and longer payment cycle in orders from power utilities.
12 | P a g e
PICK OF THE WEEK Jan 01, 2018
SALASAR TECHNO ENGINEERING LTD
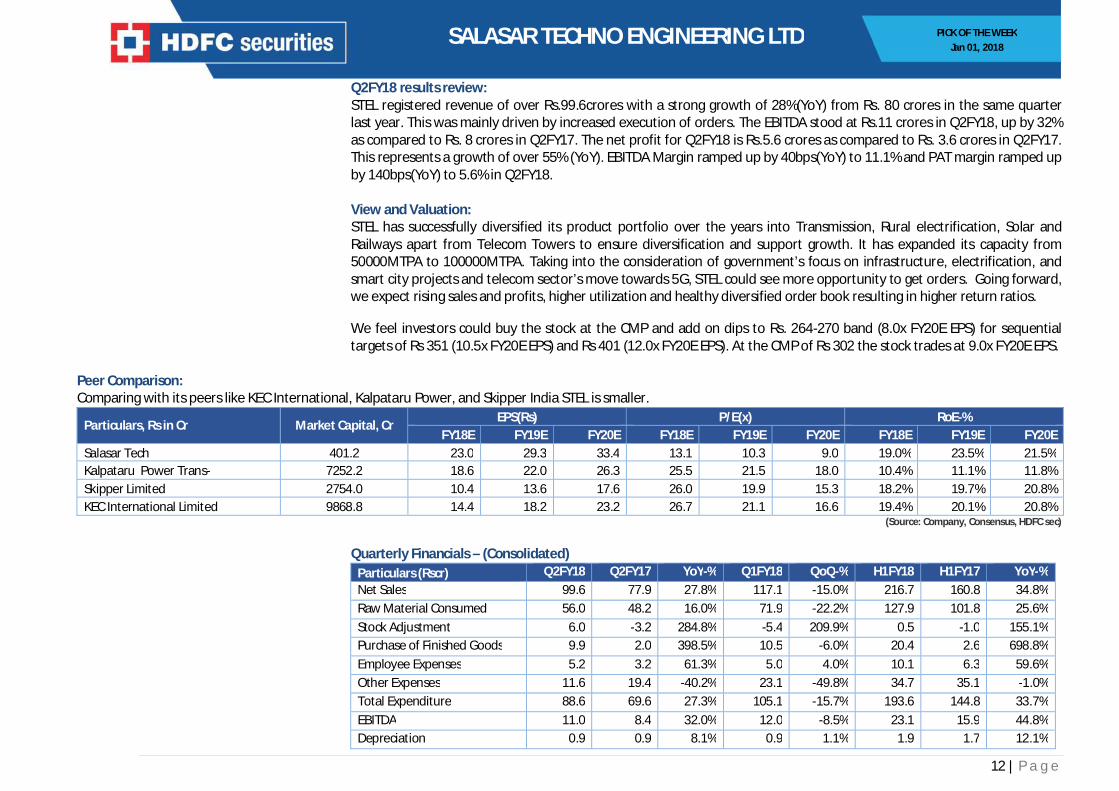
Q2FY18 results review: STEL registered revenue of over Rs.99.6crores with a strong growth of 28%(YoY) from Rs. 80 crores in the same quarter last year. This was mainly driven by increased execution of orders. The EBITDA stood at Rs.11 crores in Q2FY18, up by 32% as compared to Rs. 8 crores in Q2FY17. The net profit for Q2FY18 is Rs.5.6 crores as compared to Rs. 3.6 crores in Q2FY17. This represents a growth of over 55% (YoY). EBITDA Margin ramped up by 40bps(YoY) to 11.1% and PAT margin ramped up by 140bps(YoY) to 5.6% in Q2FY18. View and Valuation: STEL has successfully diversified its product portfolio over the years into Transmission, Rural electrification, Solar and Railways apart from Telecom Towers to ensure diversification and support growth. It has expanded its capacity from 50000MTPA to 100000MTPA. Taking into the consideration of government’s focus on infrastructure, electrification, and smart city projects and telecom sector’s move towards 5G, STEL could see more opportunity to get orders. Going forward, we expect rising sales and profits, higher utilization and healthy diversified order book resulting in higher return ratios. We feel investors could buy the stock at the CMP and add on dips to Rs. 264-270 band (8.0x FY20E EPS) for sequential targets of Rs 351 (10.5x FY20E EPS) and Rs 401 (12.0x FY20E EPS). At the CMP of Rs 302 the stock trades at 9.0x FY20E EPS.
Peer Comparison: Comparing with its peers like KEC International, Kalpataru Power, and Skipper India STEL is smaller.
Particulars, Rs in Cr Market Capital, Cr EPS(Rs) P/E(x) RoE-%
FY18E FY19E FY20E FY18E FY19E FY20E FY18E FY19E FY20E Salasar Tech 401.2 23.0 29.3 33.4 13.1 10.3 9.0 19.0% 23.5% 21.5% Kalpataru Power Trans- 7252.2 18.6 22.0 26.3 25.5 21.5 18.0 10.4% 11.1% 11.8% Skipper Limited 2754.0 10.4 13.6 17.6 26.0 19.9 15.3 18.2% 19.7% 20.8% KEC International Limited 9868.8 14.4 18.2 23.2 26.7 21.1 16.6 19.4% 20.1% 20.8%
(Source: Company, Consensus, HDFC sec) Quarterly Financials – (Consolidated)
Particulars (Rscr) Q2FY18 Q2FY17 YoY-% Q1FY18 QoQ-% H1FY18 H1FY17 YoY-% Net Sales 99.6 77.9 27.8% 117.1 -15.0% 216.7 160.8 34.8% Raw Material Consumed 56.0 48.2 16.0% 71.9 -22.2% 127.9 101.8 25.6% Stock Adjustment 6.0 -3.2 284.8% -5.4 209.9% 0.5 -1.0 155.1% Purchase of Finished Goods 9.9 2.0 398.5% 10.5 -6.0% 20.4 2.6 698.8% Employee Expenses 5.2 3.2 61.3% 5.0 4.0% 10.1 6.3 59.6% Other Expenses 11.6 19.4 -40.2% 23.1 -49.8% 34.7 35.1 -1.0% Total Expenditure 88.6 69.6 27.3% 105.1 -15.7% 193.6 144.8 33.7% EBITDA 11.0 8.4 32.0% 12.0 -8.5% 23.1 15.9 44.8% Depreciation 0.9 0.9 8.1% 0.9 1.1% 1.9 1.7 12.1%

13 | P a g e
PICK OF THE WEEK Jan 01, 2018
SALASAR TECHNO ENGINEERING LTD
EBIT 10.1 7.5 34.7% 11.1 -9.3% 21.2 14.3 48.5% Other Income 0.2 0.5 -63.5% 0.1 216.7% 0.3 0.6 -56.9% Interest 1.9 2.2 -11.5% 2.3 -16.5% 4.2 3.5 19.2% EBT 8.4 5.8 43.2% 8.9 -5.9% 17.2 11.3 52.3% Tax Paid 2.8 2.3 23.1% 2.8 -0.4% 5.6 4.3 30.0% Reported PAT 5.6 3.6 55.7% 6.1 -8.4% 11.7 7.1 65.8% Extra-ordinary Items 0.1 0.3 -78.6% -0.1 154.5% -0.1 0.3 -117.9% Adjusted PAT 5.5 3.3 67.1% 6.2 -11.0% 11.7 6.8 73.4% EPS (Adj) (Unit Curr.) 4.6 3.6 26.9% 6.1 -25.6% 10.7 7.1 51.9%
(Source: Company, HDFC sec)
Financials (Consolidated):
Income Statement Cash Flow Particulars, Rs in Cr FY16 FY17 FY18E FY19E FY20E Particulars, Rs in Cr FY16 FY17 FY18E FY19E FY20E
Net Sales 310.0 384.3 548.1 692.8 793.0 EBT 12.3 28.9 45.6 57.9 66.0 Raw Material Consumed 196.9 254.3 355.4 450.3 511.5 Depreciation and Amort- 3.1 3.3 4.0 5.1 5.5 Stock Adjustment 12.8 -25.0 -23.0 -26.7 -23.0 Interest /Dividend paid 8.8 7.3 8.4 9.4 10.7 Purchase of Finished Goods 1.4 9.7 46.6 61.3 71.8 Other Adjustment 2.6 -0.8 -0.2 -12.2 5.9 Employee Expenses 11.1 14.3 21.4 25.6 28.5 (Inc)/Dec in working Capital 8.0 -16.6 -42.7 -17.3 -38.4 Other Expenses 58.8 92.4 90.4 110.9 122.9 Tax Paid -4.9 -10.1 -14.8 -18.8 -21.5 Total Expenditure 280.9 345.7 490.8 621.5 711.7 CF from Operating Activities 29.9 11.9 0.2 24.2 28.3 EBITDA 29.1 38.6 57.3 71.4 81.3 Capital expenditure -4.3 -9.8 -7.5 -21.8 -13.0 Depreciation 3.1 3.3 4.0 5.1 5.5 (Purchase)/Sale of Invest- -1.6 -4.0 -0.3 -0.2 -0.2 EBIT 26.0 35.3 53.3 66.2 75.8 Others 0.2 0.4 -2.6 -7.6 5.9 Other Income 0.2 0.9 0.7 1.0 1.0 CF from Investing Activities -5.8 -13.5 -10.4 -29.6 -7.3 Interest 8.8 7.5 8.4 9.4 10.7 Inc/(Dec) in Share capital 0.0 0.0 35.9 0.0 0.0 EBT 17.4 28.7 45.6 57.9 66.0 Inc/(Dec) in Debt -15.5 12.7 -8.7 7.0 3.0 Tax Paid 6.2 10.1 14.8 18.8 21.5 Dividend and Interest Paid -8.8 -7.3 -9.9 -11.8 -13.9 Reported PAT 11.2 18.6 30.8 39.1 44.6 CF from Financing Activities -24.3 5.5 17.2 -4.8 -10.9 Extra-ordinary Items 0.0 0.3 0.2 0.2 0.2 Net Cash Flow -0.2 3.8 7.0 -10.2 10.1 Adjusted PAT 11.2 18.3 30.6 38.9 44.4 Opening Balance 3.2 3.0 6.8 13.8 3.6 EPS (Adj) (Unit Curr.) 11.1 18.7 23.0 29.3 33.4 Closing Balance 3.0 6.8 13.8 3.6 13.7
(Source: Company, HDFC sec)
14 | P a g e
PICK OF THE WEEK Jan 01, 2018
SALASAR TECHNO ENGINEERING LTD
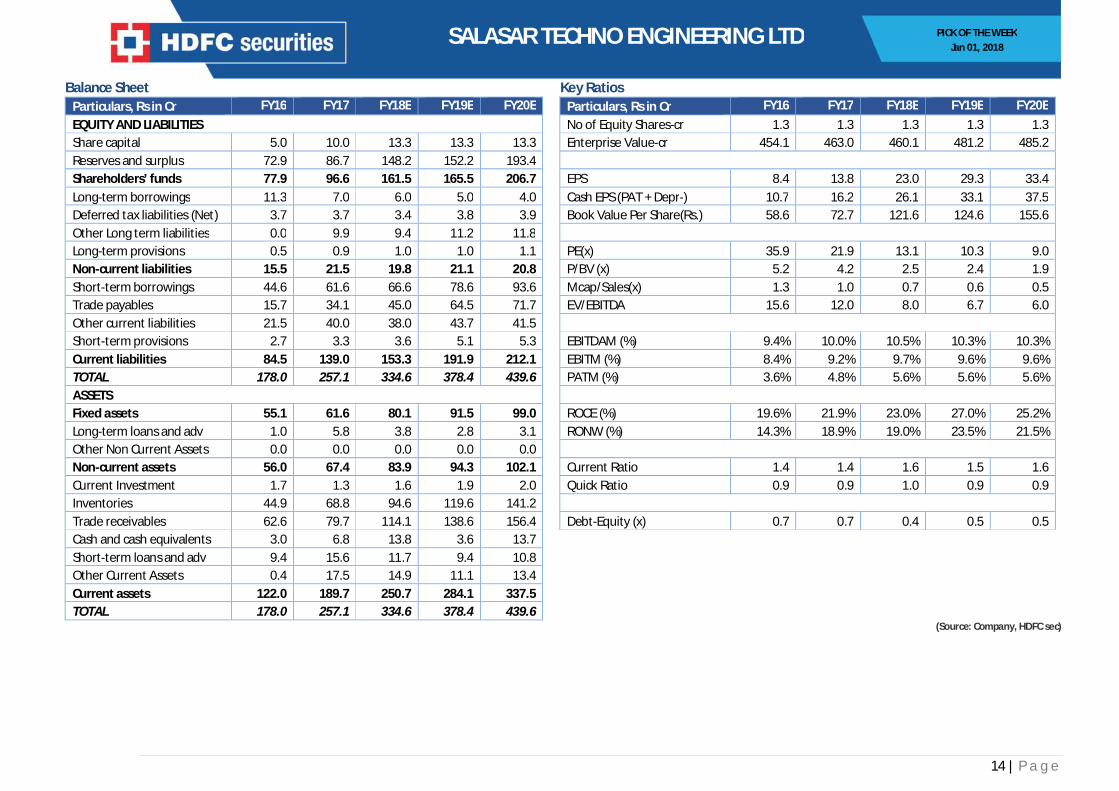
Balance Sheet Key Ratios Particulars, Rs in Cr FY16 FY17 FY18E FY19E FY20E Particulars, Rs in Cr FY16 FY17 FY18E FY19E FY20E EQUITY AND LIABILITIES No of Equity Shares-cr 1.3 1.3 1.3 1.3 1.3 Share capital 5.0 10.0 13.3 13.3 13.3 Enterprise Value-cr 454.1 463.0 460.1 481.2 485.2 Reserves and surplus 72.9 86.7 148.2 152.2 193.4 Shareholders’ funds 77.9 96.6 161.5 165.5 206.7 EPS 8.4 13.8 23.0 29.3 33.4 Long-term borrowings 11.3 7.0 6.0 5.0 4.0 Cash EPS (PAT + Depr-) 10.7 16.2 26.1 33.1 37.5 Deferred tax liabilities (Net) 3.7 3.7 3.4 3.8 3.9 Book Value Per Share(Rs.) 58.6 72.7 121.6 124.6 155.6 Other Long term liabilities 0.0 9.9 9.4 11.2 11.8 Long-term provisions 0.5 0.9 1.0 1.0 1.1 PE(x) 35.9 21.9 13.1 10.3 9.0 Non-current liabilities 15.5 21.5 19.8 21.1 20.8 P/BV (x) 5.2 4.2 2.5 2.4 1.9 Short-term borrowings 44.6 61.6 66.6 78.6 93.6 Mcap/Sales(x) 1.3 1.0 0.7 0.6 0.5 Trade payables 15.7 34.1 45.0 64.5 71.7 EV/EBITDA 15.6 12.0 8.0 6.7 6.0 Other current liabilities 21.5 40.0 38.0 43.7 41.5 Short-term provisions 2.7 3.3 3.6 5.1 5.3 EBITDAM (%) 9.4% 10.0% 10.5% 10.3% 10.3% Current liabilities 84.5 139.0 153.3 191.9 212.1 EBITM (%) 8.4% 9.2% 9.7% 9.6% 9.6% TOTAL 178.0 257.1 334.6 378.4 439.6 PATM (%) 3.6% 4.8% 5.6% 5.6% 5.6% ASSETS Fixed assets 55.1 61.6 80.1 91.5 99.0 ROCE (%) 19.6% 21.9% 23.0% 27.0% 25.2% Long-term loans and adv 1.0 5.8 3.8 2.8 3.1 RONW (%) 14.3% 18.9% 19.0% 23.5% 21.5% Other Non Current Assets 0.0 0.0 0.0 0.0 0.0 Non-current assets 56.0 67.4 83.9 94.3 102.1 Current Ratio 1.4 1.4 1.6 1.5 1.6 Current Investment 1.7 1.3 1.6 1.9 2.0 Quick Ratio 0.9 0.9 1.0 0.9 0.9 Inventories 44.9 68.8 94.6 119.6 141.2 Trade receivables 62.6 79.7 114.1 138.6 156.4 Debt-Equity (x) 0.7 0.7 0.4 0.5 0.5 Cash and cash equivalents 3.0 6.8 13.8 3.6 13.7 Short-term loans and adv 9.4 15.6 11.7 9.4 10.8 Other Current Assets 0.4 17.5 14.9 11.1 13.4 Current assets 122.0 189.7 250.7 284.1 337.5 TOTAL 178.0 257.1 334.6 378.4 439.6
(Source: Company, HDFC sec)

15 | P a g e
PICK OF THE WEEK Jan 01, 2018
SALASAR TECHNO ENGINEERING LTD
Daily Closing Price Chart
(Source: Company, HDFC sec)
16 | P a g e
PICK OF THE WEEK Jan 01, 2018
SALASAR TECHNO ENGINEERING LTD
Fundamental Research Analyst: Abdul Karim ([email protected]) HDFC securities Limited, I Think Techno Campus, Building - B, "Alpha", Office Floor 8, Near Kanjurmarg Station, Opp. Crompton Greaves, Kanjurmarg (East), Mumbai 400 042 Phone: (022) 3075 3400 Fax: (022) 2496 5066 Website: www.hdfcsec.com Email: [email protected]. Compliance Officer: Binkle R. Oza Email: [email protected] Phone: (022) 3045 3600 __________________________________________________________________________________________________________________________________________________________________________________________ Disclosure: I, (Abdul Karim, MBA), authors and the names subscribed to this report, hereby certify that all of the views expressed in this research report accurately reflect our views about the subject issuer(s) or securities. HSL has no material adverse disciplinary history as on the date of publication of this report. We also certify that no part of our compensation was, is, or will be directly or indirectly related to the specific recommendation(s) or view(s) in this report. Research Analyst or his/her relative or HDFC Securities Ltd. does not have any financial interest in the subject company. Also Research Analyst or his relative or HDFC Securities Ltd. or its Associate does not have beneficial ownership of 1% or more in the subject company at the end of the month immediately preceding the date of publication of the Research Report. Further Research Analyst or his relative or HDFC Securities Ltd. or its associate does not have any material conflict of interest. Any holding in stock – No HDFC Securities Limited (HSL) is a SEBI Registered Research Analyst having registration no. INH000002475. Disclaimer: This report has been prepared by HDFC Securities Ltd and is meant for sole use by the recipient and not for circulation. The information and opinions contained herein have been compiled or arrived at, based upon information obtained in good faith from sources believed to be reliable. Such information has not been independently verified and no guaranty, representation of warranty, express or implied, is made as to its accuracy, completeness or correctness. All such information and opinions are subject to change without notice. This document is for information purposes only. Descriptions of any company or companies or their securities mentioned herein are not intended to be complete and this document is not, and should not be construed as an offer or solicitation of an offer, to buy or sell any securities or other financial instruments. This report is not directed to, or intended for display, downloading, printing, reproducing or for distribution to or use by, any person or entity who is a citizen or resident or located in any locality, state, country or other jurisdiction where such distribution, publication, reproduction, availability or use would be contrary to law or regulation or what would subject HSL or its affiliates to any registration or licensing requirement within such jurisdiction. If this report is inadvertently send or has reached any individual in such country, especially, USA, the same may be ignored and brought to the attention of the sender. This document may not be reproduced, distributed or published for any purposes without prior written approval of HSL. Foreign currencies denominated securities, wherever mentioned, are subject to exchange rate fluctuations, which could have an adverse effect on their value or price, or the income derived from them. In addition, investors in securities such as ADRs, the values of which are influenced by foreign currencies effectively assume currency risk. It should not be considered to be taken as an offer to sell or a solicitation to buy any security. HSL may from time to time solicit from, or perform broking, or other services for, any company mentioned in this mail and/or its attachments. HSL and its affiliated company(ies), their directors and employees may; (a) from time to time, have a long or short position in, and buy or sell the securities of the company(ies) mentioned herein or (b) be engaged in any other transaction involving such securities and earn brokerage or other compensation or act as a market maker in the financial instruments of the company(ies) discussed herein or act as an advisor or lender/borrower to such company(ies) or may have any other potential conflict of interests with respect to any recommendation and other related information and opinions. HSL, its directors, analysts or employees do not take any responsibility, financial or otherwise, of the losses or the damages sustained due to the investments made or any action taken on basis of this report, including but not restricted to, fluctuation in the prices of shares and bonds, changes in the currency rates, diminution in the NAVs, reduction in the dividend or income, etc. HSL and other group companies, its directors, associates, employees may have various positions in any of the stocks, securities and financial instruments dealt in the report, or may make sell or purchase or other deals in these securities from time to time or may deal in other securities of the companies / organizations described in this report.
HSL or its associates might have managed or co-managed public offering of securities for the subject company or might have been mandated by the subject company for any other assignment in the past twelve months. HSL or its associates might have received any compensation from the companies mentioned in the report during the period preceding twelve months from t date of this report for services in respect of managing or co-managing public offerings, corporate finance, investment banking or merchant banking, brokerage services or other advisory service in a merger or specific transaction in the normal course of business. HSL or its analysts did not receive any compensation or other benefits from the companies mentioned in the report or third party in connection with preparation of the research report. Accordingly, neither HSL nor Research Analysts have any material conflict of interest at the time of publication of this report. Compensation of our Research Analysts is not based on any specific merchant banking, investment banking or brokerage service transactions. HSL may have issued other reports that are inconsistent with and reach different conclusion from the information presented in this report. Research entity has not been engaged in market making activity for the subject company. Research analyst has not served as an officer, director or employee of the subject company. We have not received any compensation/benefits from the subject company or third party in connection with the Research Report.
This report is intended for non-Institutional Clients only. The views and opinions expressed in this report may at times be contrary to or not in consonance with those of Institutional Research or PCG Research teams of HDFC Securities Ltd. and/or may have different time horizons
HDFC Securities Limited, SEBI Reg. No.: NSE-INB/F/E 231109431, BSE-INB/F 011109437, AMFI Reg. No. ARN: 13549, PFRDA Reg. No. POP: 04102015, IRDA Corporate Agent License No.: HDF 2806925/HDF C000222657, SEBI Research Analyst Reg. No.: INH000002475, CIN - U67120MH2000PLC152193