salary comparison 2010 final
TRANSCRIPT

8/4/2019 Salary Comparison 2010 Final
http://slidepdf.com/reader/full/salary-comparison-2010-final 1/36
Comparison of salaries
in the main EADS countries
Update 2010
Status: June 2010

8/4/2019 Salary Comparison 2010 Final
http://slidepdf.com/reader/full/salary-comparison-2010-final 2/36
Group HR Operations
June 2010Page 2
Contents
Cost of Living
General Information
Tax Explanation
Social Security
Salary Comparison: Examples
1
2
3
4
5

8/4/2019 Salary Comparison 2010 Final
http://slidepdf.com/reader/full/salary-comparison-2010-final 3/36
Group HR Operations
June 2010Page 3
Cost of Living
• Inflation Rate
• VAT
General Information
Tax Explanation
Social Security
Salary Comparison: Examples
→
2
3
4
5
1
8/4/2019 Salary Comparison 2010 Final
http://slidepdf.com/reader/full/salary-comparison-2010-final 4/36
Group HR Operations
June 2010Page 4
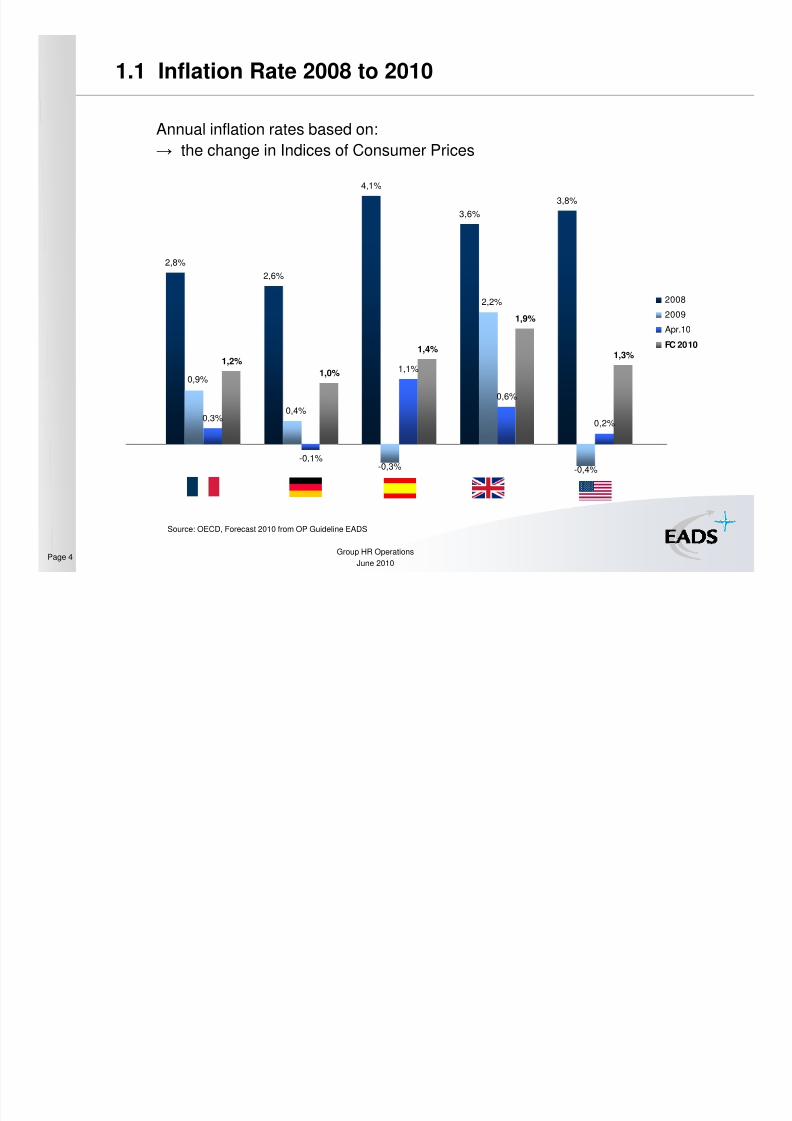
1.1 Inflation Rate 2008 to 2010
Annual inflation rates based on:
→ the change in Indices of Consumer Prices
Source: OECD, Forecast 2010 from OP Guideline EADS
2,8%
2,6%
4,1%
3,6%
3,8%
0,3%
-0,1%
1,1%
0,6%
0,2%
1,2%
1,0%
1,4%
1,9%
1,3%
0,9%
0,4%
2,2%
-0,4%-0,3%
2008
2009
Apr.10
FC 2010

8/4/2019 Salary Comparison 2010 Final
http://slidepdf.com/reader/full/salary-comparison-2010-final 5/36
Group HR Operations
June 2010Page 5
1.2 VAT
Source: International VAT and IPT Services 2010 / OECD
Rate for Spain is valid from July 2010
America is one of the few nations without a value-added tax (VAT).The "equivalent" of the European VAT is the much lower sales tax (range 0-13%) being collected at the cash register.
VAT 2010 Standard Rate, Reduced Rate and Super Reduced Rate
3,55,5 7,0 7,0 5,0
7,0 4,0
19,6%19,0% 18,8%
17,5%
5,0%5,5%
7,0%8,0%
4,0%
2,1%
Standard Rate
Reduced Rate
Super Reduced Rate

8/4/2019 Salary Comparison 2010 Final
http://slidepdf.com/reader/full/salary-comparison-2010-final 6/36
Group HR Operations
June 2010Page 6
Cost of Living
General Information• Working Hours
• Leave Days / Public Holidays
• Unemployment Levels
Tax ExplanationSocial Security
Salary Comparison:
Examples
→2
3
4
1
5

8/4/2019 Salary Comparison 2010 Final
http://slidepdf.com/reader/full/salary-comparison-2010-final 7/36
Group HR Operations
June 2010Page 7
1.799
1.660
1.603
1.354
1.468
1.797
1.638
1.613
1.353
1.475
1.776
1.638
1.615
1.309
1.469
USA
UK
Spain
Germany
France
2007 2008 2009
2.1 Hours Worked Per Year
West
East
Average annual hours actually worked per person in 2007, 2008 and 2009
hours/year
Source: Valid for labour force in dependent employmenthttp://stats.oecd.org

8/4/2019 Salary Comparison 2010 Final
http://slidepdf.com/reader/full/salary-comparison-2010-final 8/36
Group HR Operations
June 2010Page 8
2.2 Leave Days
Number of leave days in 2009
Source: www.mercerhr.com
Notes:• France: According to law employees employees get 5 weeks off, i.e. 30 calendar days + sundays• Germany: Legal regulation basis: 20 days, additional 10 leave days for employees in the Metal, engineering and
technology based industries. Public holidays are regulated differently in the single federal states (9 to 13 days)• Spain: 22 working days or 30 calendar days• UK: Since April 1st, 2009 employees have the right to take 28 days off per year (formerly 24 days)• USA: no holiday entitlement by law, but normally companies grant their employees up to 3 weeks after a seniority of
5 to 10 years
Leave days/Year
15
28
22
30
30
10
8
14
10
10
holiday entitlement public holidays

8/4/2019 Salary Comparison 2010 Final
http://slidepdf.com/reader/full/salary-comparison-2010-final 9/36
Group HR Operations
June 2010Page 9
8,0% 8,6%
5,1% 4,8%
7,9%
13,9%
5,3%6,0%
7,7%
19,7%
7,9%7,2%
9,9%
7,4%
19,0%
10,0%10,1%
7,1%7,9%
9,9%
2007
2008
2009
Apr.10
2.3 Unemployment Levels 2007 to 2010
Source: OECD Standardised Unemployment Rates, May 2010

8/4/2019 Salary Comparison 2010 Final
http://slidepdf.com/reader/full/salary-comparison-2010-final 10/36
Group HR Operations
June 2010Page 10
Cost of Living
General Information
Tax Explanation
• Taxes on Salary
• Income Tax – Progressive Systems
• Consideration of Family Status / Children
Social Security
Salary Comparison: Examples
→
2
3
4
1
5

8/4/2019 Salary Comparison 2010 Final
http://slidepdf.com/reader/full/salary-comparison-2010-final 11/36
Group HR Operations
June 2010Page 11
3.1 Taxes on Salary
—
—
Voluntary:0.7% oftotal income.Choice betweenSocial Fund andChurch
—
8%-9% variationof income taxdepending onchurchmembershipand federal states
5.5% of incometax
— —Church Tax
— —
Solidarity Tax
Income Tax
Source: Internal

8/4/2019 Salary Comparison 2010 Final
http://slidepdf.com/reader/full/salary-comparison-2010-final 12/36
Group HR Operations
June 2010Page 12
Progressive Systems in all countries (not comparable)
3.2 Income Tax
Source: Internal
*Personal deductions
£6,039
£ 37,401 - £150,000 →40%
>£150,001 → 50%
< £ 37,400 → 20%
Personal deductions£ 6,039
> € 53,407.20 →43%
≤ € 17,707.19→24% tax retention
Deductions(for everyone):€ 5,151 (below65 years old)
EmployeeEarnedDeductions(for some):max. € 2,652
> € 52,882→ 42%
Income above € 250,000(€ 500,000 for marriedcouples filing jointly) issubject to an additional
income tax of 3%.
≤ € 8,004 / 16,008→ taxfree for singles / married
couple
> € 8,005 → 14%
Pension fund 19.9%
Unemploymentinsurance 2.8%
Health insurance15.5%
Nursing Careinsurance 1.95%
/without a child 2.2%
Single:> $ 349,700 = $ 101,469.25+ 35% over $ 349,700
Married:> $ 349,700 = $ 94,601.00
+ 35% over $ 349,700
> € 69,783→ 40.0%MaximumTax RateAmount
Deductions to be made frompersonal annual adjustedgross income
The total income of ahousehold is dividedequally by the numberof members beforeapplying the aboverates. Total tax isresulting by multiplyingthe number of parts with
the resulting figure.
Comments
Single:≤ $ 7,825 → 10%
Married:≤ $ 15,650 → 10%
≤ € 5,875 → no taxretention
€ 5,875 - € 11,720→5.5%
Basic
IncomeTax Rate
Standard Deduction for
Singles $5,700 and
married couples $11,400
Social charges(CSG) 8%
Deductions

8/4/2019 Salary Comparison 2010 Final
http://slidepdf.com/reader/full/salary-comparison-2010-final 13/36
Group HR Operations
June 2010Page 13
3.3 Consideration of Family Status –Children for Tax Calculation
—
• < £ 50,000income:
→ tax credit £ 545and £1,090 for ababy under 1 year
→ additional £ 2,300
for each child peryear applicable
Qualify
Child under 16 Child over 16 but in full time education that qualifies
Per Year
• 1st Child £1,055.60 • 2 nd Child £696.80
—
• one time creditfor babies € 2,500
• maternity allowanceof € 2,244 for eachchild under the ageof 3
Per year
• 1st child: € 1,836• 2nd child: € 2,040• 3rd child: € 3,672• 4th child+: € 4,182
The deductions aredivided by 2 in case the
children are under theresponsibility of bothfather and mother
—
—
• potential deductionfor children in general€ 4,368
• potential deduction forchild care andeducational matters
€2,640
Per year
• 1st child: € 2,208
• 2nd child: € 2,208
• 3rd child: € 2,280
• 4th child: € 2,580
Special tax classeswhich affect tax burden
$ 1,000 credit perqualifying child
—Child Tax Credit
—
• 1st child: +0.5
• 2nd child: +0.5
• 3rd child: +1.0
Child Coefficientfor calculation ofIncome Tax Rate
Maximum credit of $ 600per child, capped at $1,200 per family
—Child Benefit
Tax relief of marriedcouples is depending onassessing jointly orseparately the taxation.Also number of
dependents affect taxrelief.
If married:Coefficient + 1 cutstaxable income inhalf
Family Status
Source: Internalwww.franceaccountants.comwww. bundesfinanzministerium.dewww.spainexpat.com
8/4/2019 Salary Comparison 2010 Final
http://slidepdf.com/reader/full/salary-comparison-2010-final 14/36
Group HR Operations
June 2010Page 14
Cost of Living
General Information
Tax Explanation
Social Security
• Ceilings for monthly salary• Split of Contribution Employer/Employee
• Total Contribution
• Employer Contribution
• Employee Contribution
Salary Comparison: Examples
→
2
3
4
1
5

8/4/2019 Salary Comparison 2010 Final
http://slidepdf.com/reader/full/salary-comparison-2010-final 15/36
Group HR Operations
June 2010Page 15
6.256
7.838
3.198
5.500
11.540
513
3.198
5.500
11.540
3.198
3.750
11.540
3.750
0 2.000 4.000 6.000 8.000 10.000 12.000 14.000
USA
UK
Spain
Germany
France
Nursing Insurance
Health Insurance
National Unemployment Insurance
National Pension Insurance
4.1 Social Security: Ceilings for monthly salary
Source: Internal
***
* Tranche A: up to € 2.885,00 / Tranche B: from above € 2.885,00 to € 11.540,00

8/4/2019 Salary Comparison 2010 Final
http://slidepdf.com/reader/full/salary-comparison-2010-final 16/36
Group HR Operations
June 2010Page 16
4.2 Social Security: Split Employee/Employer Contribution
Source: Internal
www.aok.business.de
France
Employee
33%
Employer
67%
Spain
Employer
83%
Employee
17%
UK
Employee
46%
Employer
54%
Germany
Employee
50%
Employer
50%
USA
Employer64%
Employee
36%

8/4/2019 Salary Comparison 2010 Final
http://slidepdf.com/reader/full/salary-comparison-2010-final 17/36
Group HR Operations
June 2010Page 17
40,50%
Source: Internal
GermanyFrance
UK
Note: simplified presentation!
4.3 Social Security: Total Contribution (in % of gross salary)
*Health insurance includes pension
* National insurance incl. pension, health,unemployment insurance
***
69,41%
* Complementary company pension not included** Share of Nursing insurance for employees without
children. Share decreases to 1,95% for families withchildren.
USA 21,50%
* Federal unemployment contributions at 6.2%of first 7.000 USD, annual wages
Spain 36,80%
*
23,80%
Employee
33%
Employer
67%
Employee
33%
Employer
67%
Employee
50%
Employer
50%
Employee
50%
Employer
50%Employer
83%
Employee
17%
Employer
83%
Employee
17%
Employee
46%
Employer
54%Employee
46%
Employer
54%
**
Employer
64%
Employee
36%Employer
64%
Employee
36%
12,40%
6,20%
2,90%
Employer
83%
Employee
17%
Employer
83%
Employee
17%
Employer/Employee Split
65,23%
Tranche A Tranche B
0,10%
2,80%
2,20%
15,50%
19,90%
29,33%
27,00%
4,53%
8,55%
29,74%
22,25%
4,43%
8,81%
23,80%
Pension
Health
Nursing
Unemployment
Others
28,30%
1,25%
7,25%

8/4/2019 Salary Comparison 2010 Final
http://slidepdf.com/reader/full/salary-comparison-2010-final 18/36
Group HR Operations
June 2010Page 18
6,20%
1,45%
6,20%
0,10%1,65%
0,85%
7,30%
9,95%
19,85%Germany
4.4 Social Security: Employer Contribution (in % of gross salary)
Note: simplified presentation!
*Health insurance includes pension
Source: Internal
Spain 30,25%
USA 13,85%UK
*
* Federal unemployment contributions at 6.2%of first 7.000 USD, annual wages
*
12,80%
N o d e f i n i t i v
e p e r c
e n t a g
e s p l i t
a v a i l a
b l e
5,35%
20,21%
16,12%
4,53%
*
14,42%
19,67%
5,49%
4,43%
France
46,21% 44,01%
Tranche A Tranche B
Pension
Health
Nursing
Unemployment
Others
23,60%
1,15%
5,50%

8/4/2019 Salary Comparison 2010 Final
http://slidepdf.com/reader/full/salary-comparison-2010-final 19/36
Group HR Operations
June 2010Page 19
GermanyFrance Spain
UK
4.5 Social Security: Employee Contribution (in % of gross salary)
20,65% 6,55%
Note: simplified presentation!
* Health insurance includes pension
USA 7,65%
Source: Internal
* Unemployment contribution not applicable (employer only)
11,00%
6,20%
1,45%
*
23,20% 21,23%
Tranche A Tranche B
9,95%8,20%
1,35%
1,15%
9,12%
10,88%
3,20% 3,32%
10,08%
7,83%
Pension
Health
Nursing
Unemployment
Others
4,70%
0,10%
1,75%
N o d e f i n
i t i v e p
e r c e n t
a g e s
p l i t
a v a i l a
b l e

8/4/2019 Salary Comparison 2010 Final
http://slidepdf.com/reader/full/salary-comparison-2010-final 20/36
Group HR Operations
June 2010Page 20
Cost of Living
General Information
Tax Explanation
Social Security
Salary comparison examples
based on gross income 1. € 40,000; 2. € 65,000; 3. € 90,000
Single, no children
Married, no childrenMarried, 2 children
Employer costs
→
2
3
4
5
1
8/4/2019 Salary Comparison 2010 Final
http://slidepdf.com/reader/full/salary-comparison-2010-final 21/36
Group HR Operations
June 2010Page 21
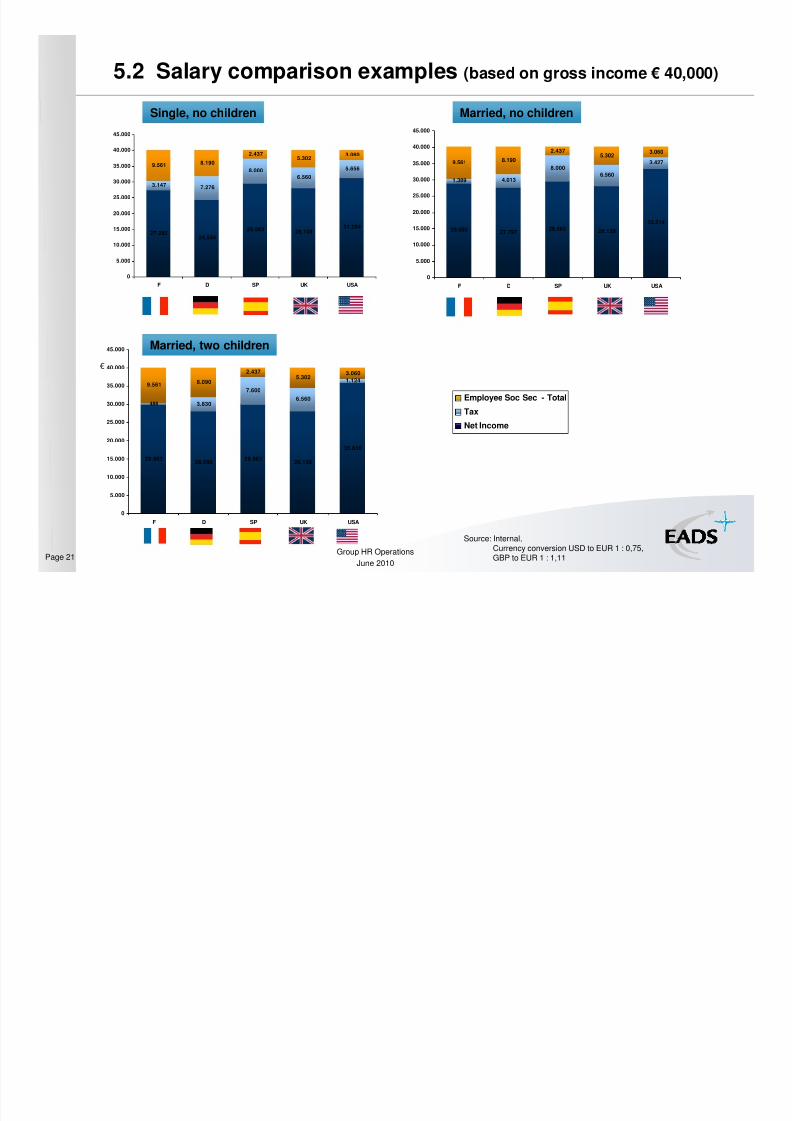
5.2 Salary comparison examples (based on gross income € 40,000)
Source: Internal,Currency conversion USD to EUR 1 : 0,75,GBP to EUR 1 : 1,11
Single, no children Married, no children
Married, two children
€
Employee Soc Sec - Total
Tax
Net Income
27.29224.534
29.563 28.13831.284
3.147 7.276
8.000
6.560
5.656
3.0605.302
2.437
8.1909.561
0
5.000
10.000
15.000
20.000
25.000
30.000
35.000
40.000
45.000
F D SP UK USA
29.050 27.79729.563 28.138
33.514
1.389 4.013
8.000
6.560
3.4278.190
2.4375.302
3.060
9.561
0
5.000
10.000
15.000
20.000
25.000
30.000
35.000
40.000
45.000
F D SP UK USA
29.95328.080
29.96328.138
35.816
3.830
7.600
6.560
1.1248.090
2.4375.302
3.060
486
9.561
0
5.000
10.000
15.000
20.000
25.000
30.000
35.000
40.000
45.000
F D SP UK USA

8/4/2019 Salary Comparison 2010 Final
http://slidepdf.com/reader/full/salary-comparison-2010-final 22/36
Group HR Operations
June 2010Page 22
5.1 Employer costs (based on gross income € 40,000)
Source: Internal
€
TOTAL: € 49,308€ 51,650€ 61,843 € 48,094 € 50,040
40.000 40.000 40.000 40.000 40.000
6.334
8.167
2.161
1.560
3.980
2.920340
40
8.967*
2.166
403
5.120**2.480
334
7.226***660
Others
Unemployment
Nursing
Health
Pension
Gross
40.000 40.000 40.000 40.000
3.343 3.980 5.0002.480
13.648
2.800 9.0574.308 7.226
1.760
5602.110
3.092
40.000
334483
0
10.000
20.000
30.000
40.000
50.000
60.000
70.000
F D SP UK USA
*
* = Nursing Insurance: 490 €, Others: 264 €
Currency conversion USD to EUR = 1 : 0,75, GBP to EUR 1 : 1,11

8/4/2019 Salary Comparison 2010 Final
http://slidepdf.com/reader/full/salary-comparison-2010-final 23/36
Group HR Operations
June 2010Page 23
41.33136.667
54.563
43.76448.136
9.016 16.849
8.000
14.80911.892
4.9736.4262.437
11.48414.653
0
10.000
20.000
30.000
40.000
50.000
60.000
70.000
F D SP UK USA
5.1 Salary comparison examples (based on gross income € 65,000)
Source: Internal,Currency conversion USD to EUR 1:0,75,GBP to EUR 1,1 : 1
Single, no children Married, no children
€
Employee Soc Sec - Total
Tax
Net Income
€
46.21942.477
54.563
43.764
52.441
4.128 11.040
8.000
14.809
7.58711.484
2.4376.426 4.973
14.653
0
10.000
20.000
30.000
40.000
50.000
60.000
70.000
F D SP UK USA
Married, two children
47.53842.778
54.963
43.764
55.178
2.809 10.851
7.600
14.809
4.84911.371
2.4376.426 4.973
14.653
0
10.000
20.000
30.000
40.000
50.000
60.000
70.000
F D SP UK USA
€

8/4/2019 Salary Comparison 2010 Final
http://slidepdf.com/reader/full/salary-comparison-2010-final 24/36
Group HR Operations
June 2010Page 24
5.2 Employer costs (based on gross income € 65,000)
Source: Internal
€
TOTAL: € 81,633€ 76,650€ 94,403 € 76,507 € 76,590
65.000 65.000 65.000 65.000 65.000
9.939 6.468 4.030
13.159
8.967*
4.745
943***1.073
3.532
2.166
8.320**
2.535
65403553
7.226
Others
Unemployment
Nursing
Health
Pension
Gross
65.000 65.000 65.000 65.000
6.882 6.467 9.125 4.030
19.096
3.150
9.057
7.508
7.226
2.856
910 2.110
4.569
65.000
334483
0
20.000
40.000
60.000
80.000
100.000
120.000
F D SP UK USA
* = Nursing Insurance: 551 €, Others: 429 €
Currency conversion USD to EUR = 1 : 0,75, GBP to EUR 1 : 1,11
8/4/2019 Salary Comparison 2010 Final
http://slidepdf.com/reader/full/salary-comparison-2010-final 25/36
Group HR Operations
June 2010Page 25
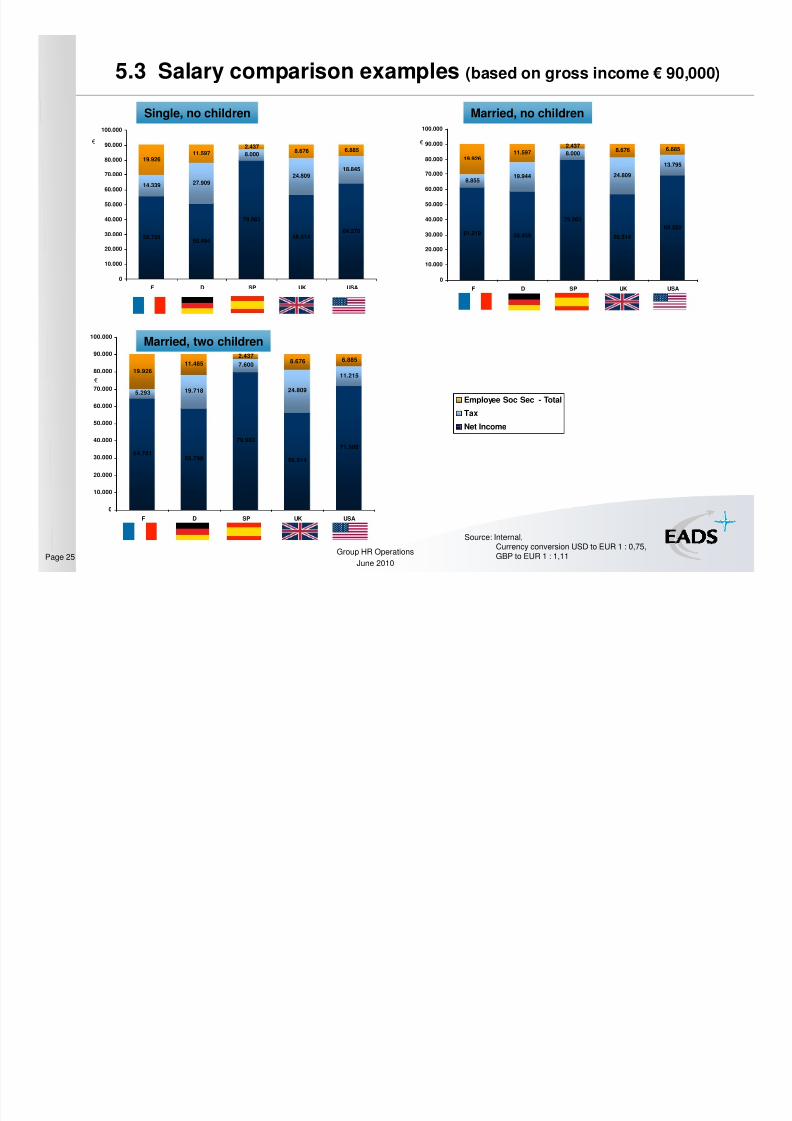
5.3 Salary comparison examples (based on gross income € 90,000)
Source: Internal,Currency conversion USD to EUR 1 : 0,75,GBP to EUR 1 : 1,11
Single, no children Married, no children
Married, two children
€
€
€
Employee Soc Sec - Total
Tax
Net Income
55.73550.494
79.563
56.51464.270
14.339 27.909
8.000
24.80918.845
6.8858.6762.437
11.59719.926
0
10.000
20.000
30.000
40.000
50.000
60.000
70.000
80.000
90.000
100.000
F D SP UK USA
61.219 58.459
79.563
56.514
69.320
8.85519.944
8.000
24.809
13.795
11.5972.437
8.676 6.885
19.926
0
10.000
20.000
30.000
40.000
50.000
60.000
70.000
80.000
90.000
100.000
F D SP UK USA
64.78158.798
79.963
56.514
71.900
5.293 19.718
7.600
24.809
11.215
11.485
2.4378.676 6.885
19.926
0
10.000
20.000
30.000
40.000
50.000
60.000
70.000
80.000
90.000
100.000
F D SP UK USA

8/4/2019 Salary Comparison 2010 Final
http://slidepdf.com/reader/full/salary-comparison-2010-final 26/36
Group HR Operations
June 2010Page 26
5.3 Employer costs (based on gross income € 90,000)
Source: Internal
€
TOTAL: € 111,957€ 101,650€ 137,486 € 101,628 € 103,140
90.000 90.000 90.000 90.000 90.000 ***
13.544
18.150
4.905
3.510
8.955
6.570
76590
1.485
8.967 *
4032.166
11.520** 5.580
334
* = Nursing Insurance: 551 €, Unemployment insurance: 924 €, Others: 436 €
Currency conversion USD to EUR = 1 : 0,75, GBP to EUR 1 : 1,11
7.226
Others
Unemployment
Nursing
Health
Pension
Gross
90.000 90.000 90.000 90.000
10.421 6.56711.249
5.580
26.553
3.1509.057
10.708
7.226
3.960
2.110
6.552
90.000
334483
0
10.000
20.000
30.000
40.000
50.000
60.000
70.000
80.000
90.000
100.000
110.000
120.000
130.000
140.000
150.000
F D SP UK USA
*

8/4/2019 Salary Comparison 2010 Final
http://slidepdf.com/reader/full/salary-comparison-2010-final 27/36
BackupBackup

8/4/2019 Salary Comparison 2010 Final
http://slidepdf.com/reader/full/salary-comparison-2010-final 28/36
Group HR Operations
June 2010Page 28
0%
10%
20%
30%
40%
50%
0 10 20 30 40 50 60 70 80 90 100 110 120
Thousand €
Progression rates of tax systems (1/2)
Source: Internal
Marginal Tax Rates (■) and Average Tax Rates (♦) in the five main EADS countries(applicable for a single employee without children)
Note!: Taxable income varies substantially across countries!
E.g. France: Taxable inc.=gross salary -social deduct. -10% -20%!
GermanyFrance
0%
10%
20%
30%
40%
50%
0 10 20 30 40 50 60 70 80 90 100 110 120
Thousand €

8/4/2019 Salary Comparison 2010 Final
http://slidepdf.com/reader/full/salary-comparison-2010-final 29/36
Group HR Operations
June 2010Page 29
0%
10%
20%
30%
40%
50%
0 10 20 30 40 50 60 70 80 90 100 110 120
Thousand €
0%
10%
20%
30%
40%
50%
0 10 20 30 40 50 60 70 80 90 100 110 120
Thousand €
0%
10%
20%
30%
40%
50%
0 10 20 30 40 50 60 70 80 90 100 110 120
Thousand €
Spain
UK
USA
Progression rates of tax systems (2/2)
Marginal Tax Rates (■) and Average Tax Rates (♦) in the five main EADS countries(applicable for a single employee without children)
Note: Taxable income varies substantially across countries!
Source: Internal

8/4/2019 Salary Comparison 2010 Final
http://slidepdf.com/reader/full/salary-comparison-2010-final 30/36
Group HR Operations
June 2010Page 30
No wage ceiling onMedicare
Included in theNational PensionInsurance.
Same as above€ 3,675/ month =€ 44,100/ year
Highest calculationbase for contribution.
Above ceiling: Maychoose voluntaryprivate insurance(instead of thecompulsory one)
Same as aboveHealthInsurance
Included in theNational PensionInsurance.
Included in theNational PensionInsurance.
Lower limit £ 5,044 -£5,715/ yr to startconts.
Earning Threshold
₤ 5,715 - £40,040
Upper Accrual Point(UAP) £40,040 -£43,875
Upper Earnings Limit
£43,375
Thereafter, the rateis 1%.
Not applicableNo equivalentinsurance
Same as aboveNo equivalentinsurance
NursingInsurance
Same as above
€ 2,996/ month= € 35,952/ year
Highest calculationbase for contribution.
Same as above
€ 5,500/ month= € 66,000/ year
Highest calculationbase for contribution.
6.2% of first $ 7,000annual wages
Same as aboveNationalUnemploymentInsurance
€ 6,256 ($ 8,125)/ month
€ 75,075 ($97,500)/ year
TA = € 2,885/ month= € 34,620/ year
TB = from € 34,620to € 138,480/ year
TC = from € 138,480to € 276960year
NationalPensionInsurance
CEILINGS
Source: Internal
Social Security: Ceilings for monthly salary

8/4/2019 Salary Comparison 2010 Final
http://slidepdf.com/reader/full/salary-comparison-2010-final 31/36
Group HR Operations
June 2010Page 31
Social Security: Contribution Rates (in % of gross salary)
Source: Internal
Included in the above
Included in the above
23.8%, thereof:
Er: 12.8%Ee: 11.0%
Further 1.0% on Ers, asprevious
1.7%, thereof:
Er: 0.85%,Ee: 0.85%
Nursing Insurance
Medicare
Er: 1.45%Ee: 1.45%
28.30%, thereof:
Er: 23.60%Ee: 4.70%
~15.5% (dep. oninsur. company),thereof:
Er: 7.30%
Ee:8.20%
21.15%, thereof:
Er: 12.80%+ 0,30% (solidarity day)+ 5.40% for family
allowance(fully borne by employer)
+ complementary contrib.“prevoyance” dep. on joblevel: ~2.5%, thereof60.0% paid by employer
+ 1.30% (fully by employer)
Ee: 0.75%
Health Insurance
7.30%, thereof:
Er: 5.75%Ee: 1.55%
included in the HealthInsurance contribution
2.80%, thereof:
Er: 1.65%Ee: 1.15%
19.90%, thereof:
Er: 9.95%
Ee: 9.95%
6.20% of first $7,000 annualwages
8.40% TA+8.60% TB*, thereof:
Er: 5.20% TA+5.30% TBEe: 3.20% TA+3.30% TB
National
UnemploymentInsurance
Er: 6.20%
Ee: 6.20%
1.60% of total salary(fully borne by Er)
0.10% of total salary(fully borne by Ee)
+ Er: 8.30% of TA*+ Ee: 6.65% of TA
National Pension
Insurance
CONTRIBUTIONRATES
* TA=1 ceiling of “Sécurité sociale” =€ 2,682/ month; TB=from € 2,682 to € 10,728 (included) /month;TC=from € 10,728 to € 21,456 (included)/ month

8/4/2019 Salary Comparison 2010 Final
http://slidepdf.com/reader/full/salary-comparison-2010-final 32/36
Group HR Operations
June 2010Page 32
0.60%, thereof:
Employer: 0.60%Employee: 0.10%
Professionaltraining
0.20% by employer0.15% of TA/TB (borneby employer)
Salary guarant.
fund
5.00% Works Council;0.45% Logement; 0.68%Apprentice; 1.60%Training
7.50% “Contributionsociale généralisée” =CSG (borne byemployee, thereof 5.10%tax deductible)
0.50% “Contribution auremboursement de ladette sociale” = CRDS(borne by employee)
Others
Accident InsuranceUSA – StatutoryAccident Insurance(worker’scompensation) – borne by employer:
average rate 0.25%of annual wages
0.35% for incapacity,death and survival(self-insurance)
Statutory accidentinsurance (borne byemployer)
Depends on degreeof risk (in 2008: on
average 0.92 % ofsalaries)
Accident Insurance(professional acc.)
Social Security: Further social contributions
Source: Internal

8/4/2019 Salary Comparison 2010 Final
http://slidepdf.com/reader/full/salary-comparison-2010-final 33/36
Group HR Operations
June 2010Page 33
Social Security: National Pension Insurance
Normal: men 65years, woman
between 60 and 65
(depending on date ofbirth)
Approximately ₤ 5,078per yearsingle = ₤ 423 permonth dependant onindividualcircumstances.
All employees
Normal: 65 – 67years, depending ondate of birth
Earliest age: 62 years
Normal: 65 years
Earliest age: 60 years
Normal: 65 years
Earlier retirementpossible (but:reductions)
Starting from 2012 theretirement age will beincreased graduallyfrom 65 to 67 years
Legal: 65 years
Persons with a total of42-year-total insuranceperiod may retirebefore 60
Age of
Retirement
Full rate can only bereceived after havingpaid in for 35 years
and retiring at age 65.
Maximum pension:€ 2,290,59/per month+ 2 Bonus pays= € 32,068 /per year(after 35 years, at age
65)
All employees
PEP*RAF*AR=act.Monthly rent (gross)
PEP=salary wagemarksRAF=sort of pensionfactorAR=act. value of rent
Maximum pension:~€ 1,600 - € 1,700 per
month (after 40 years)
All employees
Maximum Benefit of$ 2,116 / month
50% of 25 last bestannual salaries, capedto 50% of Slice A.
Full rate after havingpaid contributions for42 years, otherwisereduced rates.
Function of number ofyears of contribution.
Pension Level
All employeesAll employeesObligatory for
PENSIONINSURANCE
Source: Internal

8/4/2019 Salary Comparison 2010 Final
http://slidepdf.com/reader/full/salary-comparison-2010-final 34/36

8/4/2019 Salary Comparison 2010 Final
http://slidepdf.com/reader/full/salary-comparison-2010-final 35/36
Group HR Operations
June 2010Page 35
Social Security: National Unemployment Insurance
Job SeekersAllowance:₤ 3,403.40 p.a.=₤ 61.80 per month
All employeesincluded in the
National Insurance
Unemploymentbenefit depends on
the contribution tothe Social SecuritySystem during the last180 days (there aremaximum andminimum receipt
limits) and the maritalstatus.
The benefitapplication perioddepends on thecontribution period(max. 720 days).
Unemploymentbenefit:
80% (without children)and 107% (withchildren) of minimumsalary in Spain (SMI =€ 540,9 in 2006,€ 570,60 in 2007,€ 527,24 in 2008)
All employees
Unemployment benefitis staggered accordingto marital status andincome:
60% (no children) resp.67% (with children)of last income (max.ceiling).
Depending on age andinsurance period, theunemployment benefitis paid 12 months.
All employees
Range from € 162($210) per week to €430 ($558) per weekdepending on state
57.4% of last annualsalary.
Minimum € 14.00/day+ € 6.10 if age≥55
During7 months if 6 monthsof contribution in the
last 22 months23 months if 14months of contributionin the last 24 months
36 months if 27months of contributionin the last 36 monthsand age≥50
42 months if 27
months of contributionin the last 36 monthsand age≥57
Maximum payment: 4times TA=TB
Benefits
All EmployeesAll employeesObligatory for
UNEMPLOYM.
INSURANCE
Source: Internal

8/4/2019 Salary Comparison 2010 Final
http://slidepdf.com/reader/full/salary-comparison-2010-final 36/36
Group HR Operations
June 2010Page 36
Source: Internal
Continued pay byemployer for 48 weeks
After 48 weeks:
Sickness benefit paidby national insurance:€ 5,464 (₤ 3,642) p.a.=€ 455 (₤ 303) per
monthNo tax
Basic medicalservices but there arewaiting lists (esp. forhospital; emergenciesare treated withoutdelay.)
All employees
Illness: 3 first days100% salary byemployer. 5 followingdays 60% ofregulatory basis
(R.B.) by employer. 12following days 60% ofR.B. by Social Security
(S.S.) From the 21st
day 75% of R.B. byS.S.
• Pharmaceuticalbenefits
Temporaryincapacity• Maternity• Disability• Perm. Injuries (not
disability)• Recuperation benefit• Family benefit forchildon charge
All employees
100% salary byemployer for the first6 weeks.
After 6 weeks:Sickness Benefit(~80%)
No tax
• Doctorsappointments• Dentistsappointments• Hospital• Pharmaceuticalbenefits (co-
payment)• Maternity(pregnancy-
related costs andcashbenefits)
All employees
Generally no cashbenefits, exceptprivate insurances(different programs),basic services forseveral groups ofpeople are provided by
-“Medicaid” (low-
income individuals
- “Medicare” (> 65years)
- “State Children’sHealth InsuranceProgram” (<19 years):special program forbabies and children
Sickness Benefit100% Salary paid byemployer for 3 days.
Then:
Health Insurance pays 50%of last salary (limited to TA).
Depending on seniority &
level there may be additionalpayments
• Doctors appointments• Dentists appointments• Hospital (coverage 80%)• Pharmaceutical benefits(co-payment)
• Maternity (pregnancy-
related costs and cashbenefits)
National + complementarycontributions (prévoyance):~90% of cost for employee.10% of the cost to becovered by the employee.
Benefits
All employeesAll employees (nationallevel)
All employees depending onlevel (complementary
contributions)
Obligatory for
HEALTHINSURANCE
Social Security: Health Insurance