saimm 201506 jun
DESCRIPTION
Journal of the SAIMM June 2015TRANSCRIPT

VOLUME 115 NO. 6 JUNE 2015


Realising possibilities...
...from mine to market.
WorleyParsons adds value through our full scope of services from pit to port including studies, mine planning, impact assessments, permitting and approvals, project management, construction management and global procurement.
www.worleyparsons.com
37,50043 166 peoplecountries offices
Environment & Approvals
Non-Process Infrastructure
Mine Planning
Mining & Mine Development
MaterialsHandling
Resource Evaluation
Mineral Processing
Tailings & Waste Management
Smelting & Refining
Transport to Market
ts, permitting and aassessmentudo port including som pit tfr
oalue thrarsons adds vyPorleW
niotaualvEceruosRe
olevDegininM
nginnalPeinM
eR&& emS
tenemganaMetsas & WgniliaT
gnissceorPalreinM
t,oject managemenals, prvoappries, mine planning, impact
f servicesope oough our full sc
eturucstrarfnIsescorPn-oN
lsaovrppA&ntemnroivnE
ginldnHalsiaretaM
tneopmeinM&
tekrao MttporsnarT
nginfieginlte
ffiotriesounc 61643
omyparsons.corlewww.w
t andtruction managemenonscp g
ffices people,500377,t.emenocurd global pr
j gppp

▲
ii JUNE 2015 The Journal of The Southern African Institute of Mining and Metallurgy
OFFICE BEARERS AND COUNCIL FOR THE2014/2015 SESSION
Honorary PresidentMike TekePresident, Chamber of Mines of South Africa
Honorary Vice-PresidentsNgoako RamatlhodiMinister of Mineral Resources, South AfricaRob DaviesMinister of Trade and Industry, South AfricaNaledi PandoMinister of Science and Technology, South Africa
PresidentJ.L. Porter
President ElectR.T. Jones
Vice-PresidentsC. MusingwiniS. Ndlovu
Immediate Past PresidentM. Dworzanowski
Honorary TreasurerC. Musingwini
Ordinary Members on Council
V.G. Duke T. PegramM.F. Handley S. RupprechtA.S. Macfarlane N. SearleM. Motuku A.G. SmithM. Mthenjane M.H. SolomonD.D. Munro D. TudorG. Njowa D.J. van Niekerk
Past Presidents Serving on CouncilN.A. Barcza J.C. Ngoma R.D. Beck S.J. Ramokgopa J.A. Cruise M.H. Rogers J.R. Dixon G.L. Smith F.M.G. Egerton J.N. van der Merwe G.V.R. Landman W.H. van NiekerkR.P. Mohring
Branch ChairmenBotswana L.E. DimbunguDRC S. MalebaJohannesburg I. AshmoleNamibia N.M. NamateNorthern Cape C.A. van WykPretoria N. NaudeWestern Cape C. DorflingZambia D. MumaZimbabwe S. NdiyambaZululand C.W. Mienie
Corresponding Members of CouncilAustralia: I.J. Corrans, R.J. Dippenaar, A. Croll,
C. Workman-DaviesAustria: H. WagnerBotswana: S.D. WilliamsUnited Kingdom: J.J.L. Cilliers, N.A. BarczaUSA: J-M.M. Rendu, P.C. Pistorius
The Southern African Institute of Mining and Metallurgy
PAST PRESIDENTS
*Deceased
* W. Bettel (1894–1895)* A.F. Crosse (1895–1896)* W.R. Feldtmann (1896–1897)* C. Butters (1897–1898)* J. Loevy (1898–1899)* J.R. Williams (1899–1903)* S.H. Pearce (1903–1904)* W.A. Caldecott (1904–1905)* W. Cullen (1905–1906)* E.H. Johnson (1906–1907)* J. Yates (1907–1908)* R.G. Bevington (1908–1909)* A. McA. Johnston (1909–1910)* J. Moir (1910–1911)* C.B. Saner (1911–1912)* W.R. Dowling (1912–1913)* A. Richardson (1913–1914)* G.H. Stanley (1914–1915)* J.E. Thomas (1915–1916)* J.A. Wilkinson (1916–1917)* G. Hildick-Smith (1917–1918)* H.S. Meyer (1918–1919)* J. Gray (1919–1920)* J. Chilton (1920–1921)* F. Wartenweiler (1921–1922)* G.A. Watermeyer (1922–1923)* F.W. Watson (1923–1924)* C.J. Gray (1924–1925)* H.A. White (1925–1926)* H.R. Adam (1926–1927)* Sir Robert Kotze (1927–1928)* J.A. Woodburn (1928–1929)* H. Pirow (1929–1930)* J. Henderson (1930–1931)* A. King (1931–1932)* V. Nimmo-Dewar (1932–1933)* P.N. Lategan (1933–1934)* E.C. Ranson (1934–1935)* R.A. Flugge-De-Smidt
(1935–1936)* T.K. Prentice (1936–1937)* R.S.G. Stokes (1937–1938)* P.E. Hall (1938–1939)* E.H.A. Joseph (1939–1940)* J.H. Dobson (1940–1941)* Theo Meyer (1941–1942)* John V. Muller (1942–1943)* C. Biccard Jeppe (1943–1944)* P.J. Louis Bok (1944–1945)* J.T. McIntyre (1945–1946)* M. Falcon (1946–1947)* A. Clemens (1947–1948)* F.G. Hill (1948–1949)* O.A.E. Jackson (1949–1950)* W.E. Gooday (1950–1951)* C.J. Irving (1951–1952)* D.D. Stitt (1952–1953)* M.C.G. Meyer (1953–1954)* L.A. Bushell (1954–1955)
* H. Britten (1955–1956)* Wm. Bleloch (1956–1957)* H. Simon (1957–1958)* M. Barcza (1958–1959)* R.J. Adamson (1959–1960)* W.S. Findlay (1960–1961)
D.G. Maxwell (1961–1962)* J. de V. Lambrechts (1962–1963)* J.F. Reid (1963–1964)* D.M. Jamieson (1964–1965)* H.E. Cross (1965–1966)* D. Gordon Jones (1966–1967)* P. Lambooy (1967–1968)* R.C.J. Goode (1968–1969)* J.K.E. Douglas (1969–1970)* V.C. Robinson (1970–1971)* D.D. Howat (1971–1972)
J.P. Hugo (1972–1973)* P.W.J. van Rensburg (1973–1974)* R.P. Plewman (1974–1975)
R.E. Robinson (1975–1976)* M.D.G. Salamon (1976–1977)* P.A. Von Wielligh (1977–1978)* M.G. Atmore (1978–1979)* D.A. Viljoen (1979–1980)* P.R. Jochens (1980–1981)
G.Y. Nisbet (1981–1982)A.N. Brown (1982–1983)
* R.P. King (1983–1984)J.D. Austin (1984–1985)H.E. James (1985–1986)H. Wagner (1986–1987)
* B.C. Alberts (1987–1988)C.E. Fivaz (1988–1989)O.K.H. Steffen (1989–1990)
* H.G. Mosenthal (1990–1991)R.D. Beck (1991–1992)J.P. Hoffman (1992–1993)
* H. Scott-Russell (1993–1994)J.A. Cruise (1994–1995)D.A.J. Ross-Watt (1995–1996)N.A. Barcza (1996–1997)R.P. Mohring (1997–1998)J.R. Dixon (1998–1999)M.H. Rogers (1999–2000)L.A. Cramer (2000–2001)
* A.A.B. Douglas (2001–2002)S.J. Ramokgopa (2002-2003)T.R. Stacey (2003–2004)F.M.G. Egerton (2004–2005)W.H. van Niekerk (2005–2006)R.P.H. Willis (2006–2007)R.G.B. Pickering (2007–2008)A.M. Garbers-Craig (2008–2009)J.C. Ngoma (2009–2010)G.V.R. Landman (2010–2011)J.N. van der Merwe (2011–2012)G.L. Smith (2012–2013)M. Dworzanowski (2013–2014)
Honorary Legal AdvisersVan Hulsteyns Attorneys
AuditorsMessrs R.H. Kitching
Secretaries
The Southern African Institute of Mining and MetallurgyFifth Floor, Chamber of Mines Building5 Hollard Street, Johannesburg 2001P.O. Box 61127, Marshalltown 2107Telephone (011) 834-1273/7Fax (011) 838-5923 or (011) 833-8156E-mail: [email protected]

The Journal of The Southern African Institute of Mining and Metallurgy JUNE 2015 ▲iii
ContentsJournal Commentby G.L. Smith . . . . . . . . . . . . . . . . . . . . . . . . . . . . . . . . . . . . . . . . . . . . . . . . . . . . . . . . . . . . . ivPresident’s Corner by J.L. Porter . . . . . . . . . . . . . . . . . . . . . . . . . . . . . . . . . . . . . . . . . . . . . . . . . . . . . . . . . . . . . . vii
Spotlight: SANCOT Newsby R. Tluczek . . . . . . . . . . . . . . . . . . . . . . . . . . . . . . . . . . . . . . . . . . . . . . . . . . . . . . . . . . . . . . viThe SAIMM Young Professionals’ Council (SAIMM-YPC)by T. Mmola . . . . . . . . . . . . . . . . . . . . . . . . . . . . . . . . . . . . . . . . . . . . . . . . . . . . . . . . . . . . . . . v
Predicting the probability of Iron-Rich Ultramafic Pegmatite (IRUP) in the Merensky Reef at Lonmin’s Karee Mineby D. Hoffmann and S. Plumb. . . . . . . . . . . . . . . . . . . . . . . . . . . . . . . . . . . . . . . . . . . . . . . . . . 465Tough choices facing the South African mining industry by A. Lane, J. Guzek, and W. van Antwerpen . . . . . . . . . . . . . . . . . . . . . . . . . . . . . . . . . . . . . . 471Crush pillar support – designing for controlled pillar failure by M. du Plessis and D.F. Malan . . . . . . . . . . . . . . . . . . . . . . . . . . . . . . . . . . . . . . . . . . . . . . . . 481The application of pumpable emulsions in narrow-reef stopingby S.P. Pearton . . . . . . . . . . . . . . . . . . . . . . . . . . . . . . . . . . . . . . . . . . . . . . . . . . . . . . . . . . . . . 489Corrosion resistance of laser-cladded 304L stainless steel enriched with ruthenium additions exposed to sulphuric acid and sodium chloride media by J. van der Merwe and D. Tharandt . . . . . . . . . . . . . . . . . . . . . . . . . . . . . . . . . . . . . . . . . . . . 499Fire and brimstone: The roasting of a Merensky PGM concentrateby R.I. Rambiyana, P. den Hoed, and A.M. Garbers-Craig. . . . . . . . . . . . . . . . . . . . . . . . . . . . . 507Strategic and tactical requirements of a mining long-term planby B.J. Kloppers, C.J. Horn, and J.V.Z. Visser . . . . . . . . . . . . . . . . . . . . . . . . . . . . . . . . . . . . . . . 515
Integration of imprecise and biased data into mineral resource estimatesby A. Cornah and E Machaka . . . . . . . . . . . . . . . . . . . . . . . . . . . . . . . . . . . . . . . . . . . . . . . . . . 523Stochastic simulation for budget prediction for large surface mines in the South African mining industryby J. Hager, V.S.S. Yadavalli, and R. Webber-Youngman . . . . . . . . . . . . . . . . . . . . . . . . . . . . . 531Q-coda estimation in the Kaapvaal Cratonby D.J. Birch, A. Cichowicz, and D. Grobbelaar . . . . . . . . . . . . . . . . . . . . . . . . . . . . . . . . . . . . . 541Geometallurgical model of a copper sulphide mine for long-term planningby G. Compan, E. Pizarro, and A. Videla . . . . . . . . . . . . . . . . . . . . . . . . . . . . . . . . . . . . . . . . . . 549Introduction to the production of clean steelby J.D. Steenkamp and L. du Preez . . . . . . . . . . . . . . . . . . . . . . . . . . . . . . . . . . . . . . . . . . . . . . 557
International Advisory Board
R. Dimitrakopoulos, McGill University, CanadaD. Dreisinger, University of British Columbia, CanadaE. Esterhuizen, NIOSH Research Organization, USAH. Mitri, McGill University, CanadaM.J. Nicol, Murdoch University, AustraliaE. Topal, Curtin University, Australia
VOLUME 115 NO. 6 JUNE 2015
Editorial BoardR.D. BeckJ. Beukes
P. den HoedM. Dworzanowski
M.F. HandleyR.T. Jones
W.C. JoughinJ.A. LuckmannC. MusingwiniR.E. Robinson
T.R. StaceyR.J. Stewart
Editorial ConsultantD. Tudor
Typeset and Published byThe Southern African Instituteof Mining and MetallurgyP.O. Box 61127Marshalltown 2107Telephone (011) 834-1273/7Fax (011) 838-5923E-mail: [email protected]
Printed by Camera Press, Johannesburg
AdvertisingRepresentativeBarbara SpenceAvenue AdvertisingTelephone (011) 463-7940E-mail: [email protected] SecretariatThe Southern AfricanInstitute of Mining andMetallurgyISSN 2225-6253 (print)ISSN 2411-9717 (online)
THE INSTITUTE, AS A BODY, ISNOT RESPONSIBLE FOR THESTATEMENTS AND OPINIONSADVANCED IN ANY OF ITSPUBLICATIONS.Copyright© 1978 by The Southern AfricanInstitute of Mining and Metallurgy. Allrights reserved. Multiple copying of thecontents of this publication or partsthereof without permission is in breach ofcopyright, but permission is hereby givenfor the copying of titles and abstracts ofpapers and names of authors. Permissionto copy illustrations and short extractsfrom the text of individual contributions isusually given upon written application tothe Institute, provided that the source (andwhere appropriate, the copyright) isacknowledged. Apart from any fair dealingfor the purposes of review or criticismunder The Copyright Act no. 98, 1978,Section 12, of the Republic of SouthAfrica, a single copy of an article may besupplied by a library for the purposes ofresearch or private study. No part of thispublication may be reproduced, stored ina retrieval system, or transmitted in anyform or by any means without the priorpermission of the publishers. Multiplecopying of the contents of the publicationwithout permission is always illegal.
U.S. Copyright Law applicable to users Inthe U.S.A.The appearance of the statement ofcopyright at the bottom of the first page ofan article appearing in this journalindicates that the copyright holderconsents to the making of copies of thearticle for personal or internal use. Thisconsent is given on condition that thecopier pays the stated fee for each copy ofa paper beyond that permitted by Section107 or 108 of the U.S. Copyright Law. Thefee is to be paid through the CopyrightClearance Center, Inc., Operations Center,P.O. Box 765, Schenectady, New York12301, U.S.A. This consent does notextend to other kinds of copying, such ascopying for general distribution, foradvertising or promotional purposes, forcreating new collective works, or forresale.
GENERAL PAPERS
PLATINUM CONFERENCE PAPERS
VOLUME 115 NO. 6 JUNE 2015

▲
iv JUNE 2015 The Journal of The Southern African Institute of Mining and Metallurgy
T he SAIMM biannual platinum conference was firstconvened in 2004 and has run regularly through to2014. During this period the industry has moved
through a number of challenges – from the global financialcrisis to metal pricing spikes and troughs, labour unrest in theform of a crippling five-month strike in South Africa in thefirst half of 2014, and now sustained oversupply in the face ofreduced demand associated with the slow recovery of theEuropean markets and the cooling of the Chinese economy.
Despite this eleven-year rollercoaster journey it is stillclear that platinum group metals (PGMs) are definitely themetals for the future. Aside from the obvious investmentvalue of platinum and the other PGMs they are an essentialpart of modern life and can be found in a multitude ofapplications from autocatalysts to cardiac pacemakers,fertilizer production to food preservation, and fuels cells tojewellery. In fact, it is hard to find areas in which the PGMshave not improved the quality of life as we have come toaccept it.
The PGMs are crucial to the energy and transportationsectors in establishing environmentally friendly technology,and the long-term outlook for PGM demand is positive.Evolving energy-efficient transport solutions, tightening
emission regulations, fundamental industrial applications,and sustained demand from the jewellery and investmentsectors all indicate continued demand for these metals. Evenat the current reduced global economic growth rates, rapidlyurbanizing populations will inevitable require even greaterquantities of PGMs. Increased recycling efficiency (the ‘urbanmine’) will meet a portion of this demand, but demand forfreshly mined PGMs will continue to grow, albeit at a slowerrate than in previous decades.
Within this milieu of opportunity and challenge, the 6thInternational Platinum Conference: ‘Platinum – Metal for theFuture’ held in October 2014 highlighted the market,technical, and social challenges faced by the industry whileshowcasing the depth of talent in the sector and evolvingsolutions to the many challenges .
For this edition of the Journal, seven papers on topicsranging from geosciences to strategy and mining technologyto pyrometallurgy have been selected to tempt you intoaccessing the full conference proceedings on the SAIMMwebsite and gain a better understanding of the industry thatproduces the ’metal for the future’
G.L. Smith
Journal Comment

The Journal of The Southern African Institute of Mining and Metallurgy JUNE 2015 ▲v
T he SAIMM recognizes the value that young professionals can contribute towards the Institute. On 12September 2014, the Career Guidance and Education (CGE) committee held a workshop with the primaryobjective of convening an interim council of young professionals to:
➣ Establish and entrench a Youth Council to represent the interests of SAIMM members 35 years of age and younger➣ Set up the rules for the functioning of the Youth Council (similar to the SAIMM Council, but subordinate) ➣ Draft suitable terms of reference for the Youth Council for approval ➣ Prepare an election process for members to serve on the Youth Council.
In this regard, the interim council and the CGE committee have been exceedingly successful. The establishment ofthe Southern African Institute of Mining and Metallurgy Young Professionals’ Council (SAIMM-YPC) and the rules forthe functioning of the SAIMM-YPC, ‘By-law I – Young Professionals’ Council’, have been approved by Council (16January 2015). The election process for the 2015/2016 Young Professionals’ Council commenced in March and willconclude in July prior to ratification at the Annual General Meeting (AGM) in August.
The SAIMM-YPC has been involved in activities that were previously organized by the CGE committee. The SAIMM-YPC participated in the ‘Engineering Focus Week’ at Sci-Bono from 4 to 8 May, holding informative and inspirationaltalks to students from several high schools interested in engineering as a career. The SAIMM-YPC has also joined theorganizing committee of the Young Professionals’ Conference to be held from 21 to 22 October. A Career Day, to equipfinal-year students about to start their professional careers with information on what to expect in the first five years ofemployment, is also being organized. Participation in these activities has been an important process in the transfer ofknow-how from the CGE committee to the SAIMM-YPC.
Going forward the SAIMM-YPC has identified three focus areas to be involved in – Education, Career Guidance andEnterprise (see table). These focus areas have been designated due to the challenges faced by young professionals suchas:➣ Shortage of funding for education➣ Limited opportunities for practical training and vacation work ➣ Unemployment and depressing career prospects➣ Obstacles to entry and participation in entrepreneurial activities in the minerals sector
The SAIMM–YPC focus will be to engage with the mining industry to assist in finding support for youngprofessionals in mining and metallurgy.
Overcoming challenges such as getting time off work and travelling long distances to attend meetings, the membersof the interim council have shown remarkable commitment, energy, and eagerness to provide active leadership andbring about a positive influence in the mining industry. Their efforts and that of the CGE committee in ensuringsustained long-term success of the younger members of the Institute and ensuring that the SAIMM–YPC becomes anintegral part of the Institute is acknowledged.
T. MmolaChairman: Young Professionals’ Council (SAIMM)
The SAIMM Young Professionals’Council (SAIMM-YPC)
SAIMM-YPC focus areas
Focus Area Mission
Education Represent the interests of pre-graduates in basic and higher education on matters of career guidance, academicdevelopment and life skills
Career Guidance Represent the interests of primarily post-graduates in mining and metallurgy on matters of training, professionaldevelopment and life skills
Enterprise Undertake industrious initiatives of some scope, complication and risk to serve the interests of youngprofessionals

▲
vi JUNE 2015 The Journal of The Southern African Institute of Mining and Metallurgy
SpotlightReport back on the ITA 2015 general assemblyForty-first annual meeting held in Dubrovnik, Croatia
The International Tunnelling and Underground SpaceAssociation (ITA) held its forty-first annual meeting in
Dubrovnik, Croatia from 22 to 28 May 2015, in conjunctionwith the World Tunnel Congress 2015 ‘PromotingTunnelling in South East European Region’ organized by theITA and the Croatian Association for Tunnelling andUnderground Space. More than 1550 persons participated inthe conference. The Association registered two new membernations, Guatemala and Qatar, and 21 new AffiliateMembers in the preceding year, which resulted in a total of73 Member Nations and 282 Affiliate members (taking intoaccount some resignations). 57 of the 73 Member Nationswere represented in the General Assembly. Ron Tluczek,chairman of SANCOT, represented South Africa on behalf ofthe SANCOT Committee.
The Open Session, which took place on 26 May, wasdedicated to ‘Underground Space and Natural Resources’ with aspecial focus on hydro. A panel of seven experts madepresentations and a floor discussion was held on three mainthemes, namely sustainability, constructability, finance, andinsurance. At the end of the session it was very clear that hydropower tunnels have proven to be a very sustainable solution,especially when due attention is given to constructability by utilizing advanced technology and contractual practices. Financialmodels should be based on long-term revenues. With the current market development of renewable energy, hydro tunnels andrelated structures have proven to provide the most reliable, and most economical long-term solutions for the supply of energy forour planet. Underground space can make hydro power schemes more sustainable with respect to environmental, social, andeconomic aspects, when used in suitable settings and with a clear understanding of all risks, particularly geotechnical risk. Otherrisks to be aware of include; financial challenges, construction risk, hydrological risk, off-taker risk, regulatory risk, life-cycle risk,and changes in climate and technology.
The ITA has produced a video of the Open Session, which can be seen on the ITA Youtube Channel[https://youtu.be/47fcycz9pyg].
The ITA Young Member Group has been very active during the year, strengthening the international network between youngmembers and participating in two major events in Greece and the UAE. The ITA YM group has also created a new magazine,‘Breakthrough’.
South African representatives participated in four Working Groups. Ron Tluczek participated in WG 2 (Research), TonyBoniface in WG 5 (Health and Safety in Works), Chris Viljoen in WG 12 (Sprayed Concrete Use), and Monica Walnstein participatedin WG 21 (Life Cycle Asset Management). Chris Viljoen made a presentation to Working Group 12 on the status of a guideline forsprayed concrete.
Eight reports were published in the previous year: three from ITA Working Groups, four from ITAtech Activity Groups, and onefrom the ITA COSUF Committee, namely:� ‘Strategy for Site Investigation on Tunnelling Projects’� ‘Guidelines for Good Working Practice in High Pressure Compressed Air (HPCA)’ � ‘An Owners Guide to Immersed Tunnels’� ‘Rebuilt Equipment – Guidelines on Rebuilds of Machinery for Mechanised Tunnel Excavation’� ‘Guideline for Good Practice of Fibre Reinforced Concrete Precast Segments’� ‘Guidelines on Measurement Frequencies’� ‘Remote Measurement’� ‘Survey of Existing Regulations and Recognised Recommendations (on Operation and Safety of Road Tunnels)’.
All these documents are available free of charge on the ITA website and available for comments.The next annual meetings of the ITA General Assembly will be held at the following venues:
� San Francisco, USA, from 22 to 28 April 2016, during the ITA-AITES WTC 2016 ‘Uniting our Industry’.� Bergen, Norway, from 9 to 16 June 2017, during the ITA-AITES WTC 2017 ‘Surface Problems – Underground Solutions’.� Dubai, UAE, from 20 to 26 April 2018, during the ITA-AITES WTC 2018 ‘Smart Cities: Managing the Use of Underground Space
to Enhance Quality of Life’.
R. Tluczek
From left to right: Moroke Nteene (Lesotho Tunnelling Association),Tony Boniface, Monique Walnstein, Veronica Boniface, Lucky Nene(Chairman, SANCOT Young Professional Group), Soren Eskesen (ITAPresident), Janie Viljoen, Chris Viljoen (SANCOT Vice Chairman),Merryn Scott-Tluczek, Ron Tluczek (SANCOT Chairman), Jim McKelvey(past SANCOT Chairman).

The Journal of The Southern African Institute of Mining and Metallurgy JUNE 2015 ▲vii
Anumber of papers in this month’s Journal deal with matters relating to longer-termplanning considerations in our hard-rock, deep-level mines (for example, ‘Strategic and tactical requirements of a mining long-term plan’ by B.J. Kloppers, C.J. Horn, and
J.V.Z. Visser). It is also really good to see some mining engineering-related topics in thisissue, as they have been in short supply for some time now. This may have led to aperception that the mining engineering fraternity were starting to fall behind in thepublication of leading work being undertaken in the South African mining industry. Taken
in conjunction with the current range of challenges facing the industry, this could also be interpretedas little being done to develop new solutions.
It is the SAIMM’s fervent hope that this is not the case. However, it would be remiss of me not to also highlight the fact thatlocal support of SAIMM conferences in 2015 is at the lowest level we have experienced in many years. So there are clearlyshort-term challenges. A joint meeting of the Technical Programme Committees (TPCs) was held during May with the objectiveof challenging the historical way that the SAIMM TPCs have functioned and to investigate new, modern options to satisfy aprime objective of the TPCs, as required by our constitution: to ‘Disseminate scientific and technical knowledge to the benefit ofthe mining and metallurgical industries’. The message here is that the SAIMM needs to be as adaptable and responsive as anyother business to the current circumstances.
I would not be the first to comment that under difficult circumstances one needs to have strong leadership come to the fore.This is not to say that good quality leadership is not always important, but it is usually adversity that brings out the best inpeople. In their paper ‘Tough choices facing the South African mining industry’, A. Lane, J. Guzek, and Dr W. van Antwerpenput matters very succinctly in their synopsis: the mining industry in South Africa finds itself in a difficult situation. Operatingconditions are tough, the socio-political environment is complex, and financial performance is under pressure. The choices madeby all the stakeholders in this industry in the short term will shape the future of the industry.’ The level of energy andinvestment that is being expended to ‘re-tool’ the platinum sector, for example, is considerable. It is my hope that more paperswill be forthcoming in the medium term that tell more of the stories behind the herculean effort to re-position the platinummining industry. An early indicator is the paper on the implementation of ultra-low profile mechanized equipment at AngloAmerican platinum mines, by F. Fourie, Dr P. Valicek, G. Krafft, and J. Sevenoaks (to be published at a later date).
It is reflecting on these papers and the conditions in the mining industry that brings me back to the matter of leadership.There are many elements to leadership, but the one I want to comment on herein relates to personal discipline and self-control.Let me be clear, I am not referring to the militaristic styles of leadership of the last century and characterized by Robert Malott,CEO of a chemical company in the 1970s and ‘80s, who said ‘Leadership is demonstrated when the ability to inflict pain isconfirmed’. I can vouch that I worked for a couple of these guys in my early career! What I AM referring to is the style ofleadership that embraces the principal that once a rule or standard is set and agreed upon, then it must be complied with by all.There is not one set of standards of compliance or behaviour for ‘workers’ and another for ‘managers’. At a very fundamentallevel, most people want to be led and given clear direction, but in today’s technological environment where speed andcommunication tools are cheap and pervasive, a different level of self-control is required.
According to recent research, it turns out that self-control (or willpower) can be depleted. Several hundred studies (GoogleProfessor Roy F. Baumeister) indicate that maintaining the self-control to lead by example, make the hard decisions, to be trueto your word, etc. requires a concentration of effort that runs down over time. The good news is that by conscious effort, like amuscle, self-control can be strengthened. I think that many of us can empathize with this scenario? We have all had hard daysat the office or with the children, which leave one feeling drained and depleted. It takes real work effort and conscious though tolead in the context that I am using in these personal observations. According to a 2013 study by Wilhelm Hoffman, people witha high degree of self-control are happier than those without. So, for everyone out there under work or domestic pressures, thereare five tips that I have picked up that may assist:1. Remove temptation: Remove from your environment issues that distract you from your goals. If people are not workingaccording to the accepted standards and norms, do not let it go by without challenge2. Eat and properly sleep: Probably one of the trickier ones to comply with, but how can you strengthen self-control if you aretired and hungry?3. Consciously break habits: Of the five, probably one of the hardest with which to comply. There are times when intuitively youknow that you are taking the ‘easy option’. That is when your gut feel has to say NO, I am going to do things differently4. Reward yourself and have fun: Self-discipline does not imply a harsh life – not at all! When you have had a good day orweek, when you know that you have made progress, have a glass of wine. Buy the team a cup of decent coffee. Take the familyout for a meal. Whatever!5. Don’t dwell on setbacks: There are always going to be setbacks and things that do not go according to plan. To dwell onfailure is unhealthy, to understand the lessons learnt is educational, to start today on the fix is inspirational.
My last comment about leadership in difficult times is that no one is alone. I really like this quote from Steve Jobs: ‘Itdoesn’t make sense to hire smart people and then tell them what to do; we hire smart people so they can tell us what to do.’
J.L. PorterPresident, SAIMM
President’s
Corner

Cora
lynne
& A
ssoc
iates
+27
(011
) 849
3142
World Class Mining Contractors
MAKE IT YOURS!
MURRAY & ROBERTS CEMENTATIONIS OUR 1 CHOICEST
www.cementation.murrob.com

PAPERS IN THIS EDITIONThese papers have been refereed and edited according to internationally accepted standards and
are accredited for rating purposes by the South African Department of Higher Education andTraining
These papers will be available on the SAIMM websitehttp://www.saimm.co.za
Platinum Conference PapersPredicting the probability of Iron-Rich Ultramafic Pegmatite (IRUP) in the Merensky Reef at Lonmin’s Karee Mineby D. Hoffmann and S. Plumb . . . . . . . . . . . . . . . . . . . . . . . . . . . . . . . . . . . . . . . . . . . . . . . . . . . . . . . . . . . . . . . . . . . 465This study focuses on the estimation of the probability of iron-rich ultramafic pegmatite (IRUP) occurrence in the Merensky Reef at Lonmin’s Marikana Karee Mine, using block model kriged estimates of IRUP probability derived from mapping and surface borehole data.
Tough choices facing the South African mining industry by A. Lane, J. Guzek, and W. van Antwerpen. . . . . . . . . . . . . . . . . . . . . . . . . . . . . . . . . . . . . . . . . . . . . . . . . . . . . . . . 471This paper characterizes some of the difficult choices that the South African mining industry must face to ensure long-term sustainability, and discusses how these decisions could be approached in a fact-based and robust way.
Crush pillar support – designing for controlled pillar failure by M. du Plessis and D.F. Malan. . . . . . . . . . . . . . . . . . . . . . . . . . . . . . . . . . . . . . . . . . . . . . . . . . . . . . . . . . . . . . . . . . 481An overview of in-stope crush pillars is provided, including the application, behaviour, function, mechanism, impact, and design of a crush pillar system. An idealized crush pillar layout was simulated using a limit equilibrium model to predict the potential residual state of crush pillars. The results indicate that there are many factors affecting the initial stress state of the pillar, which determines whether failure will occur in a stable manner.
The application of pumpable emulsions in narrow-reef stopingby S.P. Pearton . . . . . . . . . . . . . . . . . . . . . . . . . . . . . . . . . . . . . . . . . . . . . . . . . . . . . . . . . . . . . . . . . . . . . . . . . . . . . . . 489The viability of using pumpable emulsion explosives in South African narrow-reef mining operations is evaluated from multiple perspectives. The study concludes that pumpable emulsions are able to provide narrow-reef operations with increased levels of flexibility, efficiency, and control that are unavailable or limited through the use of alternative commercially available explosives.
Corrosion resistance of laser-cladded 304L stainless steel enriched with ruthenium additions exposed to sulphuric acid and sodium chloride media by J. van der Merwe and D. Tharandt . . . . . . . . . . . . . . . . . . . . . . . . . . . . . . . . . . . . . . . . . . . . . . . . . . . . . . . . . . . . . . 499The corrosion behaviour of 304L stainless steel samples laser-cladded with various amounts of ruthenium was evaluated by open circuit potential and cyclic potentiodynamic polarization tests. The results show that for each environment there is an optimal ruthenium concentration for the best corrosion protection, beyond which further ruthenium additions do not confer increased protection.
Fire and brimstone: The roasting of a Merensky PGM concentrateby R.I. Rambiyana, P. den Hoed, and A.M. Garbers-Craig . . . . . . . . . . . . . . . . . . . . . . . . . . . . . . . . . . . . . . . . . . . . . . 507This paper discusses the roasting of Merensky concentrate in air before smelting, with the purpose of reducing the matte load to the converter. A brief description is given of the mechanisms by which pyrrhotite, chalcopyrite, and pentlandite are oxidized during roasting, and these mechanisms are explored in relation to chemical thermodynamics and microstructures.
Strategic and tactical requirements of a mining long-term planby B.J. Kloppers, C.J. Horn, and J.V.Z. Visser . . . . . . . . . . . . . . . . . . . . . . . . . . . . . . . . . . . . . . . . . . . . . . . . . . . . . . . . 515The Lonmin process of linking company strategy with long-term planning, tactical planning, and the execution of the plan through an annual planning cycle to maximize organizational flexibility is described. This flexibility enables a mining company to respond to the many internal and external forces that impact on both strategy formulation and delivery of results.

PAPERS IN THIS EDITIONThese papers have been refereed and edited according to internationally accepted standards and
are accredited for rating purposes by the South African Department of Higher Education andTraining
These papers will be available on the SAIMM websitehttp://www.saimm.co.za
General PapersIntegration of imprecise and biased data into mineral resource estimatesby A. Cornah and E Machaka . . . . . . . . . . . . . . . . . . . . . . . . . . . . . . . . . . . . . . . . . . . . . . . . . . . . . . . . . . . . . . . . . . . . 523The exclusion of imprecise or biased data from mineral resource estimations is often wasteful. This paper evaluates a number of specialized geostatistical tools that are available to extract maximum value from such ‘secondary data’.
Stochastic simulation for budget prediction for large surface mines in the South African mining industryby J. Hager, V.S.S. Yadavalli, and R. Webber-Youngman . . . . . . . . . . . . . . . . . . . . . . . . . . . . . . . . . . . . . . . . . . . . . . . 531This paper investigates the complex problem of a large mining operation’s budgeting process. The use of stochastic simulation is examined and a model enabling its application to the budgeting process is proposed..
Q-coda estimation in the Kaapvaal Cratonby D.J. Birch, A. Cichowicz, and D. Grobbelaar . . . . . . . . . . . . . . . . . . . . . . . . . . . . . . . . . . . . . . . . . . . . . . . . . . . . . . . 541The Q-coda method was used to characterize seismic wave attenuation in a region of the Kaapvaal Craton that includes the mining areas of the Bushveld Complex and Witwatersrand Basin. An accurate understanding of the attenuation is important since it affects not only the results of day-to-day monitoring such as magnitude calculations, but also advanced seismological studies such as determining the characteristics of the seismic source.
Geometallurgical model of a copper sulphide mine for long-term planningby G. Compan, E. Pizarro, and A. Videla. . . . . . . . . . . . . . . . . . . . . . . . . . . . . . . . . . . . . . . . . . . . . . . . . . . . . . . . . . . . 549A multivariate regression model is used to predict metallurgical recovery in a copper sulphide milling-flotation plant as a function of geo-mining-metallurgical data and ore characteristics, including feed grades, ore hardness, particle size, mineralogy, pH, and flotation reagents. The model is able to predict, with acceptable accuracy, the actual copper recovery, and allows for an improvement in the investment decision process by forecasting performance and risk.
Introduction to the production of clean steelby J.D. Steenkamp and L. du Preez . . . . . . . . . . . . . . . . . . . . . . . . . . . . . . . . . . . . . . . . . . . . . . . . . . . . . . . . . . . . . . . . 557This paper describes clean steel production from a pyrometallurgist’s perspective with the aim of introducing these concepts to the broader metallurgical community

IntroductionIRUP is an iron-rich ultramafic pegmatite rockthat occurs as discordant pipe-, vein-, orsheet-like bodies that formed subsequent tocumulate crystallization within the BushveldComplex (Viljoen and Scoon, 1985). Theoccurrence of large IRUP zones in platinummining operations result in changing reefconditions that adversely affect mining layoutsand efficiency due to (i) variable strike of thereef associated with slumping of the strata,thus influencing haulage positioning, (ii) poorstope extraction where iron replacement on thereef horizon has obliterated the economic zoneand redistributed part of the platinum groupmetal mineralization, and (iii) more complexprocessing conditions related to harder millfeed and poorer concentrator recoveries arisingfrom the increased petrological variability ofIRUP ore. At the Marikana Karee Mine, thecurrent mine planning practice assigns a 100%geological loss to IRUP-affected Merensky Reef
where there is no on-reef development, whicheffectively discounts approximately 1.4 millioncentares of mineral resources. A quantitativepredictive model for the occurrence of IRUPahead of mining would be useful since thegeological loss discount value could befactored more proportionally to the riskassociated with the estimated probability ofIRUP occurrence.
A conceptual study is presented in whichgeological information from three sources(aeromagnetic survey, surface borehole corelogging, and underground mapping) isexamined and used to predict the probability ofIRUP occurrence ahead of mining at Karee(Figure 1). The approach was to establish ageostatistical estimate of the IRUP probabilityusing ordinary kriging. The borehole andmapping source data, converted to categoricalindicators, was interpolated into block modelsand compared to outcomes from multiple setsof declustered data. The objective being toreconcile models derived from widely-spaceddata with a reference model based on all thedata, and to comment on the change in theprobability of IRUP occurrence in selectedmining study blocks. A sequential indicatorsimulation model using only the surfaceborehole intersection data was alsoinvestigated to examine its suitability forpredicting the probability of IRUP occurrence.
Geological settingAt Marikana, the IRUP-rich alteration zones onthe reef horizons have diameters ranging fromtens to hundreds of metres, and are oftenobserved as conformable sheets below the UG2Reef footwall contact, where replacement ofthe plagioclase-rich pegmatoidal pyroxeniteunit occurs, or as a discordant replacement of
Predicting the probability of Iron-RichUltramafic Pegmatite (IRUP) in theMerensky Reef at Lonmin’s Karee Mineby D. Hoffmann* and S. Plumb*
SynopsisIRUP is an iron-rich ultramafic pegmatite rock that formed due to hot iron-rich fluids and gases replacing local stratigraphic zones of the BushveldComplex. This study focuses on the estimation of the probability of IRUPoccurrence on the Merensky Reef at the Marikana Karee Mine. A 2.15million centare IRUP-rich domain at the Karee Mine was initially definedfrom the interpretation of a surface aeromagnetic anomaly, and exposuresin the mine workings. Surface boreholes (spaced 250–500 m apart) withinthis IRUP domain contain approximately equal numbers of IRUP-replacedand IRUP-free intersections. Owing to the uncertainty in the continuity ofthe IRUP alteration (a result of the wide borehole spacing), the riskassociated with the development of mining infrastructure within thisdomain is unquantifiable. Semi-quantitative data comprising visualestimates of IRUP replacement from reef development mapping data andsurface borehole reef intersections was interpolated into blocks usingindicator kriging estimation. Comparative analyses of the estimate of IRUPoccurrences were made by changing the block size and declustering thedata systematically. Reconciliations of the probability of IRUP predictedfrom the block models derived from the different data-sets and sequentialindicator simulation models were analysed for four mining study blocks. Aquantitative approach to modelling the occurrence of IRUP can be anadditional tool for refining the estimate of the geological losses that informthe mine plan in such high-risk zones.
Keywordsgeological losses, Merensky Reef, IRUP replacement, indication kriging.
* Lonmin Geology, South Africa.© The Southern African Institute of Mining and
Metallurgy, 2015. ISSN 2225-6253. This paperwas first presented at the, Platinum Conference2014, 20–24 October 2014, Sun City South Africa.
465The Journal of The Southern African Institute of Mining and Metallurgy VOLUME 115 JUNE 2015 ▲
ISSN:2411-9717/2015/v115/n6/a1http://dx.doi.org/10.17159/2411-9717/2015/v115n6a1

Predicting the probability of Iron-Rich Ultramafic Pegmatite (IRUP)
the Merensky Reef pyroxenite unit. Due to the irregularnature of the IRUP, exposures seen in the footwallexcavations do not always continue directly to the overlyingreef, typically 20 m above. In the study area at the westernpart of the Karee Mine (Figure 1), the IRUP domain has anarea of 2.15 million centares and occurs as an irregularnorth-south elongate zone that forms part of the BrakspruitPipe described by Viljoen and Scoon (1985). Within theLonmin mining right, the zone has dimensions of 2.7 kmnorth-south and 1.7 km east-west based on the interpretationof an aeromagnetic anomaly. Along the north andnortheastern margin of the aeromagnetic anomaly in the K3Shaft block the occurrence of IRUP is closely correlated withthe mining limit (Figure 1). Towards the east and southeastof the anomaly, mining has not advanced into the IRUPdomain, and the distribution of IRUP will be tested as miningprogresses within the 4 Belt Shaft block.
Surface borehole geological logging has revealed that
within the aeromagnetic anomaly, five of the 16 boreholes onthe reef horizon define a large core of IRUP towards thenortheast. Detailed mining exposure in this area, however,reveals that this core is fragmented and consists of erraticlenses of iron-replaced pyroxenite (Figure 2) with largerareas of replacement towards the central zone. The areasalong the remaining periphery of the aeromagnetic anomalytowards the north, west, and southwest were found to bemostly IRUP-free on the Merensky Reef horizon, based onintersections from ten boreholes. It is within this zone of theaeromagnetic anomaly that the conundrum arises. Since inthe exposures towards the east there is a good correlation ofIRUP with the aeromagnetic anomaly, a similar highprobability of IRUP occurrence would be expected towards thewest; however, the surface borehole intersection dataindicates a low probability of IRUP occurrence in theseunmined areas.
Data preparationIn the underground developments, the location and continuityof the IRUP occurrence is well defined from mappinginformation. For the on-reef development, mapped IRUPalteration, where visible in significant proportions, has beenused to define categorical indicators of IRUP occurrence. Apseudo-borehole data-set was compiled using the mappingdata. The on-reef development mapping was divided into 10 m intervals and used to compile a database for theoccurrence of IRUP (Figure 2). The actual percentage of IRUPexposed in the development was not determined, but a visualestimate was defined consisting of three categories, viz.: (1)no replacement with no visible IRUP, (2) partial replacement,<50% IRUP, and (3) strong replacement, 51–100% IRUP. Thesame categories were assigned to the surface boreholes forthe mother hole only. These were then assigned values of 0,50, and 100 respectively. In the variography data analysesand estimation block models, the 50 and 100 values werecombined into a single category to reflect ‘some’ or ‘full’occurrence of IRUP and assigned a value of one. Theresulting categorical data-set represents two rock types, one
▲
466 JUNE 2015 VOLUME 115 The Journal of The Southern African Institute of Mining and Metallurgy
Figure 1 – Plan showing the location of the study area at the MarikanaKaree Mine in relation to the shaft blocks (right) and the surfacemagnetic low anomaly on the aeromagnetic image (left). The MarikanaKaree Mine is comprised of three shafts: namely 4 Belt Shaft, K3 Shaft,and K4 Shaft. Scale defined from coordinates in metres
Figure 2 – Location of mapping and surface borehole data relative to the surface magnetic anomaly and mined out area (left), and plan and cross-sectionof raise mapping within the mine’s mapping system (top right). Mapping data was used to define hypothetical boreholes points to reflect IRUP occurrenceintersections at 10 m intervals. Plan showing erratic IRUP occurrences in underground development as magenta polygons (bottom right). Scale definedfrom coordinates in metres

with no observed IRUP and the other where IRUP may bepresent in varying proportions. A total of 3617 measuredmapping points and 60 surface borehole points were used inthe analysis.
Block model processBlock models reflecting an estimate of the probability of IRUPoccurrence were constructed by interpolating the binary dataof categorical values of 0 (no IRUP) and 1 (some IRUP) usingordinary kriging estimation. Deutsch (2006) suggests thatthe ordinary kriging method for indicators is a reasonableapproach where local data is plentiful, and there is ‘someevidence of non-stationarity areas’. Generally, stationaritywas assumed within each categorical variable. The spatialanalysis revealed non-anisotropy for the IRUP categoricaldata, and a spherical model was applied to the semivar-iogram, which had a range of 480 m at the normalized sill.The first search distance of 500 m for data selection was
derived from the semivariogram range, and a second searchdistance of 1000 m was permitted to complete filling of themodel. The sample numbers were set to a minimum of 5 anda maximum of 20. Block models using the total data-set wereconstructed for 50, 100, 250, and 500 m block sizes in the Xand Y directions. The estimate of IRUP for the study domainswas stable for block sizes ≤250 m; however, an increaseddivergence in the probability of IRUP occurrence was foundfor the 500 m blocks. A block size of 100 m was selected asthe preferred size because of the closeness to the dimensionsof the planned selective mining unit. Additional block modelswith 100 m block sizes were derived for the declustered data-sets with centres at intervals of 50, 100, 250, and 500 m. Thedata points in the declustering process were selected closestto the centre of the cell. Similarly, additional block modelswere constructed using only the surface boreholeintersections. All the above block modelling was conductedusing the Datamine software (Figure 3). Finally, a sequential
Predicting the probability of Iron-Rich Ultramafic Pegmatite (IRUP)
467The Journal of The Southern African Institute of Mining and Metallurgy VOLUME 115 JUNE 2015 ▲
Figure 3 – Block models showing the estimated percentage probability of IRUP as interpolated into 100 m blocks for (A) Reference Model (all data), (B) 100m declustered data model, (C) 250 m declustered data model, and (D) surface borehole data model. Compare with Figure 2 for scale, individual blocks are100 m

Predicting the probability of Iron-Rich Ultramafic Pegmatite (IRUP)
indicator simulation block model using the ‘BLOCKSIS’module in the GSLIB software suite (Deutsch, 2006) wasused by applying the same estimation parameters for thesurface borehole data. Here, 100 realizations werecomposited into a single model (Figure 4).
IRUP block modelsThe IRUP block model using the combined mapping andsurface borehole data (called the Reference Model) honoursthe IRUP aeromagnetic outline within the K3 Shaft block forestimated IRUP probability values >25%. It conflicts,however, with a portion of the aeromagnetic anomalytowards the south within the 4 Belt Shaft block (Figure 3A).Here, the higher IRUP probability was influenced by sparseborehole spacing within the 4 Belt Shaft block, particularlybetween boreholes spaced 1000 m apart. The block modelalso reveals a core of higher IRUP probability for the K3 Shaftblock, which lies within a NE-SW trending ellipsoid of lowerIRUP probability. Where the IRUP probability is estimated at>62%, the block boundary coincides with the termination ofmining where panel faces have been stopped due to excessiveIRUP. By declustering the data to 100 m and 250 m centres,the NE-SW trend of the IRUP block model is maintained(Figure 3B and 3C). The higher IRUP probability core for 100 m declustered data continues to honour the aeromagneticfootprint. The declustered data block models have increasedsmoothing, which results in a more diffuse distribution ofIRUP probability. In particular, the 250 m declustered datablock model no longer exhibits the higher IRUP probabilitycore.
An interesting pattern emerges for the surface boreholedata block model, which reveals a well-developed concentriccore of high IRUP probability with decreasing IRUPprobability trending outwards (Figure 3D). Furthermore, theNE-SW trend is no longer developed. Where the estimatedIRUP probability is >75% in the core, a close correlation withthe aeromagnetic anomaly exists; however, it extendspartially into the mined-out area. Comparison of this modelwith the simulated IRUP block model (Figure 4) reveals anexpansion of the core and erroneous extension well beyondthe mined-out contact towards the east beyond theaeromagnetic limit, thus overestimating the IRUPprobability.
A distinctive low IRUP probability trend (NW-SEdirection) evident in the Reference Model and 100 mdeclustered data block model (Figure 3A and 3B) has theeffect of enclosing the IRUP core zone towards the west. Thisis due to the effect of four boreholes in this area exhibitingIRUP-free intersections and the absence of IRUP intersectionson the reef horizon. This low-probability IRUP area becomesincreasingly prominent in the block models based on surfaceborehole data only (Figure 3D and Figure 4), and predictsthat the remaining part of the K3 Shaft block towards themining right boundary will have a low probability of IRUPoccurrence.
ReconciliationThe success of the IRUP prediction model rests on thecloseness of the probability estimates using the surfaceborehole and declustered data models compared with theReference Model (total data model). This was examined for
four study blocks with dimensions 500 × 500 m along thewestern mining levels of the K3 Shaft block (Figure 5). Thesemining study blocks were selected such that there wasoverlap into the areas of extensive on-reef developmentwhere there would be greatest confidence in the model. Eachstudy block had varying proportions of stope extraction
▲
468 JUNE 2015 VOLUME 115 The Journal of The Southern African Institute of Mining and Metallurgy
Figure 4 – Block model showing the estimated percentage probabilityof IRUP as simulated using surface borehole data only. Compare withFigure 2 for scale, individual blocks are 100 m
Figure 5 – Plan showing the four study blocks (SB1 to SB4) withdimensions 500 × 500 m along the western mining levels of K3 Shaft.*Study blocks shifted 500 m towards the west. Hypothetical boreholes(red open circles) are assumed to have intersected IRUP replacementon the Merensky Reef. Scale defined from coordinates in metres

(Table I). Study blocks 1 and 4 (SB1, SB4) have low IRUPoccurrence and a high stope extraction, whereas study block2 (SB2) is divided into zones of high and low stopeextraction due to the IRUP distribution, and study block 3(SB3) has high IRUP occurrence and very low stopeextraction.
There is a close correspondence between the IRUPprobabilities of the Reference Model and the models derivedusing 50 and 100 m declustered data (Table I). In contrast,the IRUP probability for the 250 m declustered data modelhas close estimates for SB2 and SB4, but grossly underes-timates SB3 where there is a high probability of IRUPoccurrence and concomitant poor stope extraction. Similarly,the 500 m declustered data significantly overestimates the
IRUP probability in SB1 and SB2, where IRUP occurrence islow and medium, respectively, in the Reference Model. Thesurface borehole model consistently overestimates theprobability of IRUP in SB1, SB2, and SB4 compared to theReference Model, where the IRUP probability is low tomedium. In contrast, it has a very close comparison for SB3,where IRUP probability is high. The surface boreholesimulation model generally reported higher IRUP probabilitiescompared to the Reference Model, in particular for SB2, buthas reasonable comparisons for SB1, SB3, and SB4.
These 500 m study blocks reveal a reasonable reconcil-iation for data spaced 100 m apart, and thus longer termmine planning could reasonably apply the IRUP probability asa discount factor. However, caution should be exercised whenconsidering the IRUP probabilities for 250 m and 500 mspaced data, due to the variable and erratic nature of thealteration.
It is of interest to see if the 100 m declustered data IRUPblock model can be used to predict a reliable local estimate ofthe IRUP occurrence. SB2 was selected for this exercise as thenortheast part of the block has low IRUP occurrence and ahigh stope extraction, whereas the southwest part has highIRUP occurrence and the prospect of stope extraction is poor(Figure 6). SB2 was divided into 100 m block sizes, becausethis size coincides with the mining crosscut layout, where adecision could be made to suspend development pending theoutcome of further drilling information. A good correlationfor the estimated IRUP probability in the Reference Modeland the 100 m declustered data model (Figure 6) is obtainedfor the subdivided 100 m blocks in SB2.
Predicting the probability of Iron-Rich Ultramafic Pegmatite (IRUP)
The Journal of The Southern African Institute of Mining and Metallurgy VOLUME 115 JUNE 2015 469 ▲
Table I
Probability of IRUP occurrence estimated for the500 m study blocks
SB 1 SB 2 SB 3 SB 4
Reference Model (all data) 0.80 29.10 54.08 6.49100 m (50 m declust.) 2.34 25.83 49.52 6.53100 m (100 m declust.) 5.43 32.51 53.81 11.18100 m (250 m declust.) 13.31 31.31 31.48 9.92100 m (500 m declust.) 20.26 54.76 41.11 13.17100 m (SBH) 19.44 67.01 54.50 25.63100 m (SBH simulation) 9.46 73.74 58.18 9.18Approx. % stope depletion >90 50 <10 >60
Figure 6 – Plan showing stoping extraction within mining study block 2 (SB2) with 100 m subdivisions (top). Grids of estimated IRUP probability percentagefor Reference and 100 m declustered data models in SB2. Scale defined from coordinates in metres

Predicting the probability of Iron-Rich Ultramafic Pegmatite (IRUP)
DiscussionThe practice of assigning a 100% discount to the mineralresource for blocks outside the on-reef development inMerensky Reef IRUP domains requires discussion. Thiscautious approach is founded on the close correlation of IRUPoccurrence with the aeromagnetic anomaly, and is furthersupported by the high rate of stope termination along itsperimeter. However, the significant number of surfaceboreholes that are free of IRUP within the aeromagneticanomaly suggests that there may be large continuous areasthat are minimally affected by IRUP. Thus blocks for whichthe IRUP probability is estimated to be below a certainthreshold may have reasonable prospects for extraction. Inconsideration of the mining study blocks, it would be anoption to differentiate blocks that have an estimatedprobability of <50% IRUP from those with >50%. Blocks inthe aeromagnetic anomaly with an estimated probability of<50%, such as SB2, were found to have a high stopeextraction. Similar blocks could be considered to have arealistic prospect of extraction, albeit with an additionalnominal geological loss, for example +5% or +10%. Blocksthat have >50% probability of IRUP occurrence wouldcontinue to be fully discounted from the mineral resource asthe prospects of stoping extraction remain poor. Thisapproach is reasonable for model estimates based on closelyspaced data, typically ≤100 m. In contrast, the results forwidely spaced data reveal a different outcome. A similarexamination of the surface boreholes with data spaced250–500 m apart reveals that the models are unsuitable forlocal estimation of blocks 100 m in size.
Testing the areas ahead of the mining study blocks(SB1–SB4) by querying the model 500 m further west of eachblock generally revealed a lower probability of IRUPoccurrence. The study blocks SB2* and SB3* have signifi-cantly lower IRUP probability (Table II) due to their closerproximity to IRUP-free boreholes ahead of mining, whereasSB4* has a significantly higher IRUP probability due to asimilar effect of a single IRUP-bearing borehole. To test therobustness of the model, five additional hypothetical surfaceboreholes were assumed to have intersected IRUP within theaeromagnetic anomaly. These boreholes were placed 100 meast of the IRUP-free borehole intersections and thenremodelled. The new model reveals that the IRUP probabilityincreases materially for the shifted study blocks in SB2*,SB3*, and SB4* (Table II). In particular, SB3* has a
probability value of 43% and would likely be considered atarget for further drilling, the outcome of which wouldconfirm the decision to exclude it from future stoping. Thisdemonstrates that the predicative model is sensitive to datavolumes.
Limited attention was dedicated to the borehole blocksimulation model due to the poor correlation with thereference model. An approach to improve on the blocksimulation would be to use the aeromagnetic outline as aspatial reference. This would constrain the simulation to aknown domain, thus assessing the IRUP probability withinthe aeromagnetic area.
Conclusions➤ The aeromagnetic low anomaly associated with the
occurrence of IRUP has been shown to be a useful toolto delineate the macro IRUP domain, which isassociated with low stope extraction rates in the K3Shaft block.
➤ The application of categorical indicators to estimate theoccurrence of IRUP has revealed useful trends in thedistribution of the IRUP probability. Block model krigedestimates of IRUP probability derived from mappingand surface borehole data at 50 m and 100 m intervalscorrelate well with the actual IRUP occurrence, which inturn can be correlated to the stoping extraction. Incontrast, the IRUP probability for 250 m and 500 mspaced data may prove to be less reliable, due to thevariable and erratic nature of the alteration.
➤ Estimated blocks in the aeromagnetic anomaly with aprobability <50% of IRUP occurrence could beconsidered to have a realistic prospect of extraction.This threshold should be further tested. These blockswould likely carry an additional nominal geological lossfor contingency. Blocks that have >50% probability ofIRUP would continue to be fully discounted from themineral resource, as the prospects of stoping extractionremain poor.
➤ A quantitative approach to modelling the occurrence ofIRUP can provide an additional tool to refine theestimate of the geological losses that inform the long-term mine plan in such high-risk zones. This is work inprogress and will be considered in the next planningcycle. Further testing of the simulation model byconstraining the estimate to the aeromagnetic domainis a potential enhancement that could prove to be amore reliable predictor of IRUP occurrence.
AcknowledgementsThe management of Lonmin Platinum is thanked for theopportunity and permission to publish this paper.
ReferencesDEUTSCH, C.V. 2006. A sequential indicator simulation program for categorical
variables with point and block data: BlockSIS. Computers and Geosciences,vol. 32. pp. 1669–1681.
VILJOEN, M.J. and SCOON, R. 1985. The distribution and main geologic features ofdiscordant bodies of iron-rich ultramafic pegmatite in the BushveldComplex. Economic Geology, vol. 80. pp. 1109–1128. ◆
▲
470 JUNE 2015 VOLUME 115 The Journal of The Southern African Institute of Mining and Metallurgy
Table II
Probability of IRUP occurrence estimated for the500 m study blocks. * Study blocks shifted 500 mwest
SB 1* SB 2* SB 3* SB 4*
Reference Model (original 0.80 29.10 54.08 6.49study block positions)Reference Model tested 0.00 18.11 32.50 31.41500 m further westReference Model tested 0.00 30.60 42.72 36.30500 m further west with 5 hypothetical surface boreholes

IntroductionMining companies in South Africa facesignificant challenges, putting the industry at acrossroads. Local mining companies manageunique South African operational complexitieswhile still operating in the context of globalpressures. Monitor Deloitte has identified fivetough choices that mining executives mustface to ensure long-term sustainability. Theanswers to these questions are not obvious,and require an analytical approach. This paperproposes five tools that can assist miningexecutives in understanding the issuesunderlying these questions, and how miningcompanies can develop integrative strategies todrive sustainable growth.
The current mining situationGlobally, mining companies are facing a series
of economic, financial, and operationalchallenges. South African mining companies1
must also account for uniquely local issueswith profound operational implications. Someof the pressing issues are shown in Figure 1.
The global situationMining companies are inevitably influenced byglobal developments, with macro-economicgrowth and international markets stronglyinfluencing both the demand for resources andprofitability.
Historically, there has been a strongcorrelation between the performance ofcommodity markets and mining stocks;however, this relationship appears to havebroken down. Mining stocks (including thoseof global diversified mining players such asBHP Billiton and Rio Tinto) continue tounderperform broad commodity pricebenchmarks. This gap between stockperformance and commodity indices may bedue to investors attaching a higher riskpremium to mining stocks owing to a poortrack record of project delivery and a lack ofnew discoveries, resulting in sub-optimalshareholder returns.
Globally important economies such as theUSA, Europe, and China are slowly recoveringfrom the recession; however, there are mixedsignals for future growth. While the USA, theworld’s largest economy, has been recoveringslowly, Europe continues to face a sovereigndebt crisis. In response to this, the EuropeanUnion has undertaken deep structural reforms,including various financial supportmechanisms (such as bailouts and austerityprogrammes) for countries with troubledeconomies. While this may have temporarily
Tough choices facing the South Africanmining industry by A. Lane*, J. Guzek† and W. van Antwerpen†
SynopsisStrategy is about making choices. Mining companies choose to do certainthings and not to do other things. Mining is a long-term business, and thechoices made typically have large investments attached to them, longpayback periods, and significant socio-economic consequences. In today’suncertain world, it is important to make the right choices. The miningindustry in South Africa finds itself in a difficult situation. Operatingconditions are tough, the socio-political environment is complex, andfinancial performance is under pressure. The choices made by all thestakeholders in this industry in the short term will shape the future of theindustry. This paper characterizes some of the big, difficult decisions facedby the mining industry in the South African context, and discusses howthese decisions could be approached in a fact-based and robust way.
KeywordsStrategy, choices, community, social impact, scenarios, portfoliooptimization, adaptive cost management, stakeholders, innovation.
* Monitor Deloitte.† Deloitte Consulting.© The Southern African Institute of Mining and
Metallurgy, 2015. ISSN 2225-6253. This paperwas first presented at the, Platinum Conference2014, 20–24 October 2014, Sun City South Africa.
471The Journal of The Southern African Institute of Mining and Metallurgy VOLUME 115 JUNE 2015 ▲
1 Throughout this paper, the term ‘South Africanmining companies’ is used interchangeably to referto international mining companies with SouthAfrican mining operations, as well as miningcompanies registered in (and with primaryoperations in) South Africa.
ISSN:2411-9717/2015/v115/n6/a2http://dx.doi.org/10.17159/2411-9717/2015/v115n6a2

Tough choices facing the South African mining industry
appeased markets, the memory of the Eurozone crisis islikely to remain fresh in investors’ minds in years to come.With limited post-recession growth prospects in the USA andEurope, companies have looked to Asia to drive globaldemand. China’s expected growth rate of 8.4% in 2013(Deloitte Market Intelligence, 2013) falls short of its pre-recession growth rate, which averaged 10.3% between 1999and 2009 (McNitt, 2013); however, the year-on-year increasefrom 7.5% in 2012 is positive news for mining companies
that rely on China’s continued appetite for resources. Whilethe global economic outlook for these key economies remainsconstrained, the ongoing trend towards industrialization andurbanization is likely to sustain long-term demand forresources.
In addition to the current decline in demand, miningcompanies face further challenges to profitability in the formof unfavourable commodity prices and tougher miningconditions. While commodity prices have improved since their2008 lows, prices remain stagnant or falling, limiting revenuepotential. Declining ore grades at current depths also meanthat mining companies have to mine deeper to reach newdeposits, significantly increasing the cost of extraction. Sincethe start of 2000, over 75% of new base metal discoverieshave been at depths greater than 300 m (Deloitte MarketIntelligence, 2013). Mining at these depths also introducesadditional safety issues due to the high risk of rockfalls,flooding, gas discharges, seismic events, and ventilationproblems.
Compounding these economic and operational factors,mining companies also face regulatory uncertainty followinga global trend of resource nationalism. Governmentsthroughout the world are looking to increase their share ofmining profits as a means to bolster slow economies anddrive socio-economic development. State interventions in themining industry vary from the introduction of new resource-based taxes to transferring of mining rights to state-ownedcompanies, as shown in Figure 2. This regulatory uncertaintyposes a significant challenge to mining companies’ long-termstrategic planning.
Despite the particularly uncertain regulatory environmentin Africa, global mining companies cannot ignore the
▲
472 JUNE 2015 VOLUME 115 The Journal of The Southern African Institute of Mining and Metallurgy
Figure 1 – Global and local influences on mining companies with SouthAfrican operations
Figure 2 – Resource nationalism across the world

substantial growth prospects that the continent offers. Africahas vast mineral riches, with significant reserves of morethan 60 metals and mineral products, estimated at 30% of theworld’s entire mineral reserves (Deloitte Mining Intelligence,2013). Despite this resource base, Africa’s productionrepresents only 8% of global mineral production, and ismostly exported in raw form. The relatively low explorationspend (at US$5 per square kilometre across Africa comparedwith US$65 per square kilometre in Canada, Australia, andLatin America) (McNitt, 2013) further highlights theopportunity for mining companies to take advantage of thisnew frontier for expansion, especially for those companieslooking to expand into emerging markets.
Mining companies looking to operate on the Africancontinent face unique challenges. While most companiesbenefit from long-term certainty and predictability, thesemarket characteristics are even more important to long-termbusinesses like mining. Mining companies require a degree ofpolitical stability, investment-friendliness, appropriatetransportation infrastructure, and balanced fiscal regimes tooperate successfully. There are several issues prevalentacross the African continent that run counter to theserequirements, and which contribute to the perception ofAfrica as a risky destination for business. Poor governance,the prevalence or perception of corruption, tenuous legislativeframeworks, fragile security of tenure, and unclear royaltyand tax regimes make strategic decisions difficult.Furthermore, long-standing issues such as civil unrest,insurgency, and a history of ethnic conflict pose additionaloperational risks in certain countries.
Besides socio-economic and political complexities, thelack of appropriate infrastructure across Africa is a furtherbarrier for mining companies. The required infrastructurecapital is far more than the current infrastructure spend,leaving a substantial spending shortfall. This developmentconstraint leaves investors with little confidence that public-sector infrastructure development will improve sufficiently tofacilitate operations. African governments are turning tomining companies themselves to accelerate infrastructuredevelopment, linking mining licence issuance to hugeinfrastructure projects (McNitt, 2013). These multi-billiondollar foreign investments are likely to have a far greaterimpact on African infrastructure development than public-sector spending.
The relationship between mining companies and hostcountries’ governments is challenging. Of the 54 countries inAfrica, 24 rely on relatively few mineral products to generatemore than 75% of their export earnings (Monitor Deloitteanalysis). Despite this economic dependence on a prosperousmining industry, host governments habitually treat miningcompanies with suspicion. Mining operations are viewed asoperations in isolation without the necessary linkages andbenefits to other sectors of the economy or alignment withlocal aspirations. Furthermore, the history of colonialismacross Africa has often resulted in foreign-owned miningcompanies being viewed by communities as entities with nolong-term commitment to the country. Communities oftenperceive companies as generating wealth and repatriatingdividends, leaving behind a damaged environment with littlelasting benefit for the community.
The South African situationIn addition to the complex factors affecting mining companiesat a global level, companies with South African operationsface further complexities. Mining has historically been a veryimportant sector to the South African economy. Like manyother African countries, South Africa has vast mineral wealthwith immense value generation potential. With more than 52commodities under its surface, South Africa has the world’slargest reserves of platinum, manganese, chrome, vanadium,and gold, as well as major reserves of coal, iron ore,zirconium, and titanium minerals (Monitor Deloitte analysis).The combined value of these resources is estimated at US$2.5trillion. The industry’s substantial wealth has supported thecountry’s growth with strong resource exports and jobcreation. However, the mining industry’s relative contributionto the economy has declined due to growth in the financialand real estate sectors.
To an even greater extent than their global counterparts,South African mining companies’ margins are underpressure. The combination of stagnant or falling globalcommodity prices and rising input costs is forcing miningcompanies to make difficult decisions in an attempt tosustain short-term operations, while still aligning thesedecisions with long-term objectives. In particular, increases inlabour and energy costs have exceeded inflation. The annual‘strike season’ is characterized by ever-increasing demandsby unions and mineworkers who may not have a fullappreciation of the challenging operating environment thatmining companies face.
In addition to the requirements by workers, there arerising demands by government as to the role mines shouldplay in society. The government increasingly expects miningcompanies to fulfil social needs typically addressed bygovernment in developed countries, such as the provision ofbasic services, education, and health care. These expectationsare often not clearly defined, and are compounded by localcommunities’ demands for employment opportunities, skillsdevelopment opportunities, education, and modern health-care facilities.
‘Gone are the days when mining contribution is measuredonly its contribution to the gross domestic product, orroyalties that it pays to the fiscus. Communities expectmining companies to become engines of socio-economicdevelopment of their areas’ - Susan Shabangu, Minister ofMinerals
The perception of a lack of (or inadequate) progress inthese key areas is often met with vocal opposition, strikes,and unrest. This can have a significant impact on projectdevelopment through costly operational delays and reputa-tional damage to mining companies. This puts miningcompanies in a tenuous position, with corporate socialresponsibility (CSR) today extending well beyond theminimum legal requirements. South African miningcompanies require a deep understanding of shiftingcommunity and government expectations and a commitmentto a high level of transparency and operational sustainabilityto address the demands of relevant stakeholder groups.
Government’s requirements are further obscured by alocal environment loaded with rhetoric. Some governmentofficials have criticized the country’s inability to translate itsmineral wealth into sustainable economic development at
Tough choices facing the South African mining industry
473The Journal of The Southern African Institute of Mining and Metallurgy VOLUME 115 JUNE 2015 ▲

Tough choices facing the South African mining industry
grassroots levels. The government has been criticized forbeing seemingly slow to address what the previous MineralResources Minister, Susan Shabangu, called South Africa’s‘evil triplets’ of poverty, inequality, and unemployment(Sowetan, 2011).
In this highly political context, proponents of radical stateintervention in the South African mining industry haveasserted that the mineral wealth of the country ends up in thepockets of ’monopoly capital’ rather than benefiting thebroader population (Monitor Deloitte analysis). While thegovernment has ultimately declared that it has no short-termagenda to pursue resource nationalization, the widelyreported rhetoric has cost the country a sharp decrease in itsattractiveness as a mining destination, resulting in billions ofdollars in deferred or abandoned investments (The National,2013). This negative local sentiment is likely to have gainedadditional momentum due to the global trend towardsresource nationalism and community activism, especiallyacross the developing world.
The overarching challenge in Africa (and particularly inSouth Africa) is to strike an equitable balance of interests,ensuring that mining is productive and profitable, as well asbeing fair to foreign investors, host states, and affected localcommunities alike. These challenges, at both a local andglobal level, make strategy critically important for miningcompanies.
The strategy of decision-makingStrategy is about making choices. Companies choose to docertain things and not to do other things (as opposed totactics, which are about how to execute on the choices made).The complex operating environment in which miningcompanies function results in difficult choices. Thisnecessitates a deep understanding of the factors that
influence mine profitability, as well as those affecting thecompany’s reputation and relationship with stakeholders.Adopting a structured approach to making choices at acorporate and business unit level is essential. Strategy is anintegrated set of choices that includes both strategicpositioning choices and strategic activation choices.
Monitor Deloitte assists mining companies to makedifficult decisions based on a series of cascading choices, asshown in Figure 3. Mining companies should be able toanswer each question successively, working down thecascade. Where a question leads executives to re-evaluatetheir initial propositions, they can trace back up the cascadeto redefine aspects until the strategy is cohesive. Thesequestions allow mining companies to successively focus onkey aspects of their high-level and operational strategies,which collectively form the basis for long-term strategicplanning and short-term prioritization. The questions shownin Figure 3 can be adapted to the mining context as follows.
What are our aspirations? Mining companies should be able to clearly define both thefinancial (such as achieving year-on-year increases inaverage IRR) and non-financial objectives (such as consis-tently achieving zero harm, or making a positive socialimpact in host countries). These objectives should be alignedwith the company’s overall vision, as they will guideinvestment decisions.
Where will we play?Mining companies must choose the resource portfolio thatthey wish to develop and the countries in which they willoperate. They must also decide which parts of the valuestream they will target, and where in the project life cyclethey should enter or exit.
▲
474 JUNE 2015 VOLUME 115 The Journal of The Southern African Institute of Mining and Metallurgy
Figure 3 – Cascading choices

How will we win in chosen markets?Mining companies should identify sources of sustainableadvantage, and use these as the basis for business modeldevelopment. These choices typically include the miningmethod, mine design, technology, and sustainability choices.These choices are necessary to achieve the goals andaspirations within the confines of where the company haschosen to play.
How will we configure?Mining companies should ensure that they have thecapabilities and skills in place and that they are configuredappropriately to successfully implement these strategies.
What are the priority initiatives?In a complex global market, mining companies must prioritizekey initiatives and investments in order to execute on thechoices made.
Using this decision framework, Monitor Deloitte hasidentified five generic ’tough choices’ that face South Africanmining executives.
Tough choices facing mining companiesManagement teams at mining companies with South Africanoperations face a series of tough choices and trade-offs.These are difficult decisions with a broad impact, butultimately they are critical for long-term survival. MonitorDeloitte has identified five generic questions of particularsignificance to South African mining companies in light ofthe global operating context:➤ How to achieve a step change in profitability and safety
performance?➤ How to attract and retain critical skills?➤ How to raise the capital needed for South African
operations?➤ What is the best and most sustainable use of capital?➤ How to balance the conflicting needs of stakeholders?
These questions are explored below.
How can mining companies achieve a step change inprofitability and safety performance?
South African mining companies must simultaneously defendand grow profits, while also ensuring that safety recordsimprove. While South Africa’s mining safety records aresteadily improving, mine injury and fatality levels are stillabove those achieved elsewhere in the world (Business Day,2013a). With mines becoming progressively deeper and oregrades declining, the unit cost of mine production in SouthAfrica is under significant pressure. The situation isexacerbated by rapidly rising input costs, particularly those ofenergy and labour.
All of the major South African mining companies havebeen through successive waves of cost reduction and safetyimprovement initiatives. While these have often beensuccessful, the rate of incremental improvement has not keptpace with the pressures that are inexorably driving up unitcosts. Most mines operating in South Africa are in need of astep change in performance.
How can mining companies attract and retain criticalskills?Mines continue to face severe frontline and professional skillsshortages that affect critical day-to-day operations. Althoughtraining programmes have improved, there is still a lack ofexperienced skills in frontline positions, such as artisans andsupervisors, as experienced personnel retire or leave thecompany. Although current learnerships do produce highvolumes of graduates, these graduates often lack necessaryhands-on experience. This directly affects output, quality,and safety, while increasing overhead costs.
Professional skills are also difficult to attract and retain inmining. The mining industry competes with many otherindustries for professional talent, and mines are at adisadvantage due to the harsh conditions and remotelocations in which they operate. At a global level, SouthAfrica is losing professional skills to other countries asexperienced professionals emigrate.
Executives are challenged to develop an understanding ofthe human resource capabilities required, and look toimplement structures that attract, develop, and retain theseskills. However, the dynamic nature of the industry (and theindustries that drive resource demand) means that it willbecome increasingly challenging to balance the skills requiredtoday with the skills needed by mines in future.
How can mining companies raise the capital theyneed for their South African operations?Investors are starting to attach a risk premium to SouthAfrican mining investments. This has the effect of increasingthe cost of capital to South African mining companies.Several companies have moved to separate their SouthAfrican assets from their global assets, to help them raisecapital for international investments. This leaves their SouthAfrican assets cash-constrained and struggling to fundexpansion projects.
Furthermore, many black economic empowerment (BEE)transactions are vendor-financed in a way that leaves thenew company cash-constrained and unable to fundexpansion projects. In an environment of rising costs andlacklustre commodity prices, South African executives havetheir work cut out to fund expansion out of operating cashflows.
How can mining companies determine the best andmost sustainable use of capital?Capital decisions are complicated by the global and SouthAfrican factors influencing the current and future operatingenvironment. The increasing regulatory uncertainty andvolatile labour conditions in South Africa have substantiallyincreased the country’s inherent operating risk. Thesefactors, coupled with increasing pressures from rising costs,have resulted in mining companies sometimes finding thatproducing more is not always more profitable. Miningcompanies have subsequently increased their thresholds forproject profitability, abandoning projects that do not promisehigh enough returns.
In addition to local projects, mining companies have amyriad of options to consider elsewhere. The trend towardsAfrican exploration promises growth for mining companieswilling to absorb the higher operational risks. Beyond the
Tough choices facing the South African mining industry
The Journal of The Southern African Institute of Mining and Metallurgy VOLUME 115 JUNE 2015 475 ▲

Tough choices facing the South African mining industry
choice of geographic focus, mining companies must alsoassess which commodities are the most profitable and viableunder the current conditions, and which commodities are ofstrategic importance for future growth. Finally, miningcompanies have the choice of investing in mature mines ordeveloping early-stage operations.
How can mining companies balance the conflictingneeds of stakeholders?Mining companies have the unenviable task of balancing theneeds of multiple stakeholders. Each stakeholder group hasits own unique objectives, often conflicting with those ofother stakeholders, as shown in Figure 4.
Government looks to maximize revenue to the state whileensuring that mining companies contribute to socio-economicand infrastructure development. Where the government hashistorically struggled to provide adequate services, miningcompanies are often used as a vehicle to accelerate change.The role of mining companies is further obscured by the factthat multiple arms of government are often not aligned, withinconsistent policy and populist rhetoric. Calls for distributionof the country’s mineral wealth through resource national-ization have become increasingly popular with politicianslooking to garner favour with the country’s impoverishedmajority. While current government policy is against short-term resource nationalization, this policy stance may changein future depending on the success of other African countriesthat have implemented resource-based interventions to drivesocio-economic progress.
Mining executives should also bear in mind that policy mayshift without being considered a ‘radical intervention’ (forexample, by increasing royalties or taxes on miningcompanies). These interventions can nevertheless have asignificant impact on profitability and operational sustainability.
Similarly, labour, organized labour, and communities also
expect mines to play an active role in socio-economicdevelopment. Mines frequently operate in areas with histor-ically poor levels of service provision, and are often on thereceiving end of decades of frustration due to a lack oftangible economic development, resulting in social unrest.The perception that international mining companies hoardwealth and do not share it with the communities in whichthey operate (despite the CSR investments that miningcompanies make) further threatens the fragile relationshipbetween mining companies and communities.
While many shareholders appreciate the value of CSRinitiatives, the increasing requirements for mining companiesto invest in broad service provision activities makes itdifficult for them to balance their responsibility to theshareholders and their responsibility to the community.Mining companies, as is to be expected, look to maximizeprofit while retaining a social licence to operate. The fluid andincreasing government and community expectations meanthat mining companies are not always willing or able todeliver social projects to the levels expected. Even whencompanies are willing to drive social change in their areas ofoperation, they often do not understand the communities’needs, and find that fulfilling needs identified by localmunicipalities sometimes also falls short of meetingcommunity requirements.
Tools to assist decision-makingThe tough questions facing mining executives requireanalytical tools as the basis for data-driven decision-making.Monitor Deloitte has identified five tools that can help miningexecutives understand the key issues underlying thesechallenging questions, as well as the strategies necessary tomitigate risk and take advantage of opportunities to createsustainable value.
▲
476 JUNE 2015 VOLUME 115 The Journal of The Southern African Institute of Mining and Metallurgy
Figure 4 – Overview of the stakeholder landscape

Tool 1: take a long viewMining companies can benefit from thinking about the long-term future by using tools such as scenario planning.Scenario planning allows mining companies to organizecritical uncertainties about the future, along withpredetermined elements, into a manageable set of scenariosthat vividly describe potential future states of the world inwhich stakeholders live. Scenario planning was developed atRoyal Dutch Shell in the 1970s as a tool to aid executives inmaking high-stakes decisions involving large investmentsand volatile situations, and it is clearly applicable to themining industry.
The foundational proposition of scenario planning is thatno-one can predict the future. However, mining companiescan choose to adopt a disciplined and imaginative point ofview about possible futures by focusing on key interactionsamong critical uncertainties and how these interactions couldreasonably play out. Furthermore, scenario planning alsogenerates early indications that can act as warning signs ofdanger, or even more valuable early indicators of high-valueopportunities, some of which are barely visible or unlikely atthe point at which an investment decision is made.
Case study: take a long viewA decade ago, miners had great hopes for the investmentpotential of Zimbabwe. Despite ongoing political turmoil,Harare was signalling a new openness to foreign investors.However, in 2011, the Zimbabwean indigenization ministermoved to enforce a previously unenforced law limitingforeign ownership in the mining sector. This left miningcompanies with three choices: (1) comply with the law,ceding 51% of their stake, (2) refuse to comply and fight fortheir stake, or (3) walk away from their investment. Thispresents a tough choice. Scenario planning a decade ago mayhave thrown up a potential indigenization scenario, andwould have helped executives develop a strategy that couldsurvive in this scenario, as well as provide the tools toidentify the scenario as it developed.
Tool 2: optimize portfolioThe new reality of volatile prices and rising costs means thatcompanies have to optimize their portfolios by acquiring andmining high-quality assets with better grades and strongmargins, while ceding low-margin assets to junior miners.
Mining company board members and executives facedifficult trade-offs between competing strategic objectives,especially when it comes to projects with significant capitalrequirements. While in-depth financial modelling is critical,decision-makers need to move beyond simply prioritizingprojects by value metrics such as NPV or IRR. Companiesmust assess the tangible and intangible benefits of projectsunder consideration. While evaluating intangible benefits isoften subjective, mining companies can assign quantitativemeasures to these benefits, allowing projects to be comparedon a value basis.
Capital allocation models in mining can be furtherimproved by adopting principles from modern portfoliotheory. Widely used to assess the value of stocks and otherinvestment instruments, portfolio theory allows miningcompanies to prioritize projects using a risk-adjusted capitalallocation model. Methods that account for risk are especially
crucial for mining companies strongly influenced by globaluncertainties such as exchange rates, commodity prices, andpolitical risks, over and above the project-specific risks.
Executives are also faced with the decision to allocatecapital to growth projects, or sustaining capital to existingprojects. As the market expects healthy project pipelines,companies are under pressure to ensure that they are well-positioned to analyse, select, and implement key projects.Allocating sustaining capital is often more difficult, as thestrategic objectives between projects vary greatly, making itdifficult to directly compare the return on capital allocations.
Case study: optimize portfolioIn June 2013, Sentula Mining announced that it would sell offits coal assets (including its contract mining and explorationoperations in Mozambique), as part of a strategy to disposeof non-core assets to focus on its core businesses (BusinessDay, 2013b) in line with similar disposals by global miningcompanies such as Rio Tinto and BHP Billiton (Bloomberg,2013). By focusing its activities on key geographies andcommodities in clearly defined parts of the value chain,Sentula Mining made the complex choices of where to play’and ‘how to win in chosen markets’. This strategic decisionwill streamline Sentula Mining’s capital allocation process.
Tool 3: innovate aggressivelyDuring challenging times such as these, mining companiescan choose to pursue a ‘survival strategy’ or a ‘leadershipstrategy’. Those pursuing a survival strategy will cut costs tothe bone while adopting a risk-averse posture and focus ondefending their core business. Other companies adopt aleadership strategy, looking to identify unusual opportunitiesthat will enable them to gain ground during the downturnand to make step changes in performance.
Mining executives often associate innovation withtechnology. While this is often the case, there are manydifferent ways in which a company can innovate, as shownin Figure 5.
There is no lack of innovative ideas in any business. Thechallenge is turning these ideas into a step change in results.Good ideas often fall foul of resistance to change, and afailure to understand the whole system of innovationsrequired to make the idea successful. For example, a newmining technology for the mine of the future will inevitablyrequire innovative thinking in skills provision, mineplanning, and performance measures. Mining companiesshould focus their innovation efforts on the few criticalprojects that will achieve a step change in performance andthen move quickly. It is also not necessary to ‘reinvent thewheel’. Many of the most successful innovations started withan idea from outside the company.
Tool 4: engage proactively with stakeholdersMining companies operate in a complex stakeholderenvironment. As stakeholder understanding is oftenunstructured, mining companies can adopt a far more analyt-ically rigorous approach to defining and understanding thestakeholder mind-set. Mining companies often take a toonarrow view of their stakeholder landscape, missing interde-pendencies and ‘new’ groups whose interests will bemobilized over the course of the project’s lifespan.
Mining companies should develop a sophisticated
Tough choices facing the South African mining industry
The Journal of The Southern African Institute of Mining and Metallurgy VOLUME 115 JUNE 2015 477 ▲
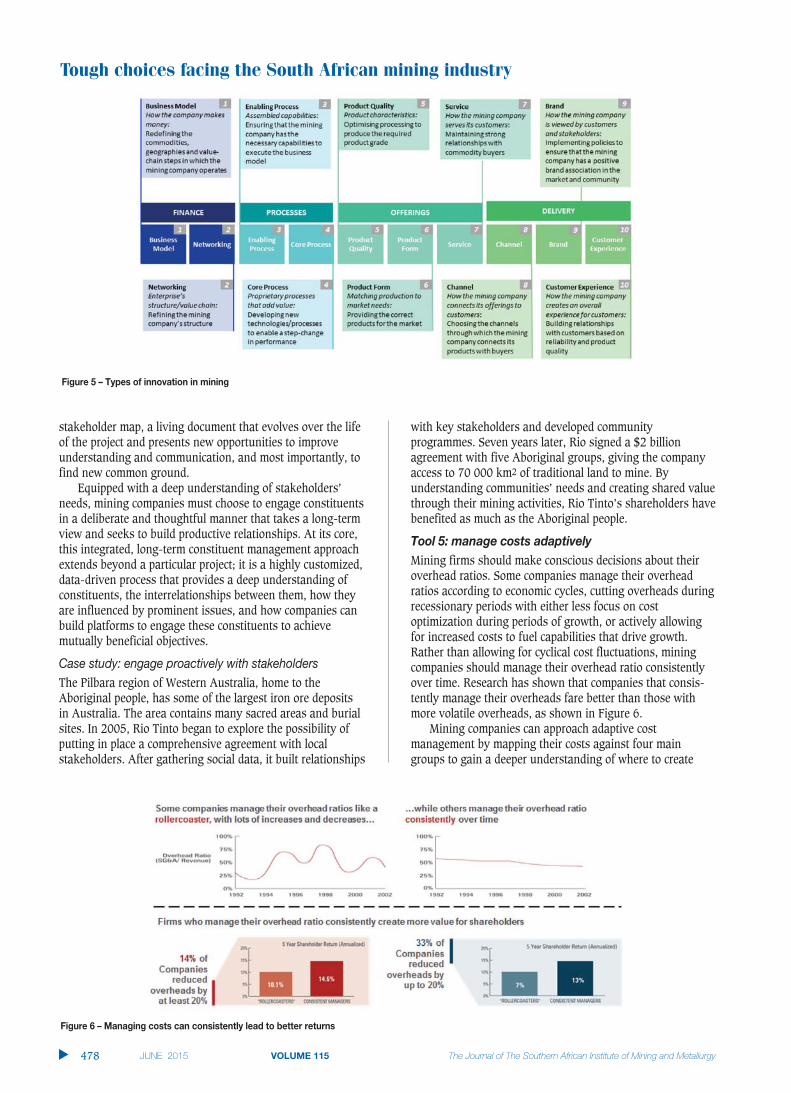
Tough choices facing the South African mining industry
stakeholder map, a living document that evolves over the lifeof the project and presents new opportunities to improveunderstanding and communication, and most importantly, tofind new common ground.
Equipped with a deep understanding of stakeholders’needs, mining companies must choose to engage constituentsin a deliberate and thoughtful manner that takes a long-termview and seeks to build productive relationships. At its core,this integrated, long-term constituent management approachextends beyond a particular project; it is a highly customized,data-driven process that provides a deep understanding ofconstituents, the interrelationships between them, how theyare influenced by prominent issues, and how companies canbuild platforms to engage these constituents to achievemutually beneficial objectives.
Case study: engage proactively with stakeholdersThe Pilbara region of Western Australia, home to theAboriginal people, has some of the largest iron ore depositsin Australia. The area contains many sacred areas and burialsites. In 2005, Rio Tinto began to explore the possibility ofputting in place a comprehensive agreement with localstakeholders. After gathering social data, it built relationships
with key stakeholders and developed communityprogrammes. Seven years later, Rio signed a $2 billionagreement with five Aboriginal groups, giving the companyaccess to 70 000 km2 of traditional land to mine. Byunderstanding communities’ needs and creating shared valuethrough their mining activities, Rio Tinto’s shareholders havebenefited as much as the Aboriginal people.
Tool 5: manage costs adaptivelyMining firms should make conscious decisions about theiroverhead ratios. Some companies manage their overheadratios according to economic cycles, cutting overheads duringrecessionary periods with either less focus on costoptimization during periods of growth, or actively allowingfor increased costs to fuel capabilities that drive growth.Rather than allowing for cyclical cost fluctuations, miningcompanies should manage their overhead ratio consistentlyover time. Research has shown that companies that consis-tently manage their overheads fare better than those withmore volatile overheads, as shown in Figure 6.
Mining companies can approach adaptive costmanagement by mapping their costs against four maingroups to gain a deeper understanding of where to create
▲
478 JUNE 2015 VOLUME 115 The Journal of The Southern African Institute of Mining and Metallurgy
Figure 5 – Types of innovation in mining
Figure 6 – Managing costs can consistently lead to better returns

value. The return on each overhead class can then becalculated, allowing firms to prioritize and optimize costs,focusing on value-creating activities throughout the cycle, asshown in Figure 7.
ConclusionMines currently face tough choices around their profitability,attracting and developing key skills, capital raising, capitalallocation, and stakeholder engagement. Mining executivesneed to think strategically about these issues and integratethem into a sustainable long-term strategy.
The rising pressure on mining companies to grow profitsdespite a sub-optimal macro-economic environment andrising costs requires in-depth analysis. Mining executives canuse scenario planning to understand possible futures as thebasis for informed decision-making in an uncertainenvironment, and then optimize their portfolio accordingly.Seizing opportunities to innovate, from technologicalbreakthroughs to internal process changes, offers mines afurther opportunity to control their future. With limitedrevenue potential due to unfavourable commodity prices,mining companies may seek to defend their profits bymanaging costs and streamlining their overhead portfolio tofocus on cost categories that drive growth.
Mining companies should also welcome innovation toaddress the critical skills shortages affecting the industry.Scenario planning may also be useful to structure thinkingaround the kinds of skills that will be required for mining inthe future. This will provide the basis for developingstrategies to attract, develop, and retain these skills to securefuture capabilities.
Furthermore, mining executives face difficult capitalallocation decisions. By integrating lessons learned from
scenario planning to create an understanding of whichprojects will develop the mining company’s sustainableadvantage in future, mining executives can adopt aspects ofmodern portfolio theory to analyse and select appropriateprojects to deliver shareholder value.
Finally, mining companies must take cognisance of theiroperational context, especially in South Africa. The miningindustry must understand and anticipate the needs of variousstakeholders. Mining executives can use an analyticalapproach to understand the stakeholder landscape, ensuringthat an effective stakeholder engagement strategy is in place.This strategy should seek to create shared value forstakeholders, resulting in mutually beneficial and productiverelationships between the mining company, government,labour, and the community.
Even in tough times, mining companies can use strategicthinking and analytical tools to face their tough choices.
ReferencesBLOOMBERG. 2 May 2013. European power prices slide to record as coal slumps
on surplus. Bloomberg. www.bloomberg.co.za [Accessed 2 July 2013].
BUSINESS DAY LIVE. 5 May 2013. Mine deaths fall, but safety targets missed. BDLive. www.bdlive.co.za [Accessed 26 June 2013].
BUSINESS DAY LIVE. 28 June 2013. Sentula to sell coal assets as losses widen. BDLive. www.bdlive.co.za [Accessed 2 July 2013].
DELOITTE MARKET INTELLIGENCE, May 2013. Global Mining Update – May 2013:Taking the temperature of the market.
MCNITT, L. 25 June 2013. A new type of colonialism? AgWeb. www.agweb.com[Accessed 26 June 2013].
SOWETAN LIVE. 3 August 2011. Nationalisation the wrong debate – Shabangu.Sowetan Live. www.sowetanlive.co.za [Accessed 26 June 2013].
THE NATIONAL. 21 June 2013. Glitter comes off South Africa’s gold. TheNational. www.thenational.ae [Accessed 26 June 2013]. ◆
Tough choices facing the South African mining industry
The Journal of The Southern African Institute of Mining and Metallurgy VOLUME 115 JUNE 2015 479 ▲
Figure 7 – Analysing return on overheads

amecfw.com/mining
JohannesburgT +27 11 840 7300
Excellence in project delivery
Amec Foster Wheeler is a leader in mining project development and delivery. With over 150 years of history, we are committed to delivering excellence across a full range of mining services around the globe.
part of the African continent, we are proud of our track record in delivering projects safely, reliably
connected excellence in all we do
Oil & GasClean Energy
Environment & Infrastructure
Mining
IntroductionSafe mining practices are aimed at maximizingthe extraction of a particular orebody. Minestability is a key consideration and the type oflayout (i.e. pillar type and spans) must besuitable for the prevailing rock mass conditions.Crush pillar mining appears to be a methodunique to South African hard rock mines, withthe pillar system being applied to shallow andintermediate-depth gold and platinumorebodies. It allows for a higher extraction thanwhat can typically be achieved with a conven-tional rigid/elastic non-yielding pillar system.The crush pillar system must, however, be usedin conjunction with a barrier pillar system. Thecrush pillar dimensions are generally selected togive a width to height ratio (w:h) of approxi-mately 2 (Ryder and Jager, 2002). This w:hratio is selected to ensure that the pillars fail asthey are being cut at the mining face. Once thepillar has failed in a stable manner, the residualstrength of the pillar contributes to the requiredpanel support by carrying the deadweight loadto the height of the uppermost parting on whichseparation is expected to occur. Closely spacedsupport elements are typically used betweenadjacent rows of pillars to provide additional in-panel support.
Ozbay and Roberts (1988) suggested thatcrush pillars should be implemented at depthsgreater than 400 m below surface. This is basedon the assumption that the average face stress
at this depth is large enough to enable crushingof the pillars.
In contrast to stable pillar layouts, failure ofcrush pillars is in fact desired as long as itoccurs in a controlled manner. Pillar failure andthe resulting load-shedding should ideally becontinuous to prevent accumulation of elasticstrain energy.
Figure 1 is an illustration of the stress-strain relationship of a typical pillar. The initialstraight line portion of the curve up to the yieldpoint reflects the elastic response of the pillar.The yield point indicates the onset of inelasticbehaviour, whereafter the pillar exhibits strainhardening until it reaches its peak strength.Load shedding then follows until the pillarreaches its residual strength. Crush pillars aredesigned to function in this residual part of thepillar stress-strain curve.
Historic use and design of Merenskycrush pillarsRPM (Rustenburg Section) was the firstplatinum mine reported to have used crushpillars (Ozbay et al., 1995). Crush pillars wereimplemented as early as 1974 on Frank Shaft(now Khomanani Mine) and RPM (UnionSection) in 1977 (Korf, 1978). The pillar systemwas introduced to prevent back breaks as aresult of large spans created when the supportmethod was changed from stonewalls (1927) tostonepacks to crush pillars (1974) as miningprogressed deeper. Interestingly enough, noneof the platinum mine crush pillar sitesinvestigated by Ozbay (1995) made use ofbarrier pillars in conjunction with the crushpillars.
Crush pillar support – designing forcontrolled pillar failure by M. du Plessis* and D.F. Malan†
SynopsisThe aim of any mine design is to ensure that the excavations remain stablefor the period they will be in use. Various pillar systems are used to ensurethat underground stopes remain stable and that mining activities do notaffect the surface infrastructure through either surface subsidence orseismicity.
Intermediate-depth platinum mines make use of in-stope pillarsdesigned to fail while the pillars are being cut at the mining face. The pillarstress exceeds the loading capacity and the pillars crush as a result.
The aim of the paper is to provide an overview of in-stope crushpillars. This will include the application, behaviour, function, mechanism,impact, and design of a crush pillar system.
Keywordscrush pillars, controlled failure, limit equilibrium model, pillar layout.
* Lonmin Platinum, Marikana, North-Westprovince, South Africa.
† Department of Mining Engineering, University ofPretoria, South Africa.
© The Southern African Institute of Mining andMetallurgy, 2015. ISSN 2225-6253. This paperwas first presented at the, Platinum Conference2014, 20–24 October 2014, Sun City South Africa.
481The Journal of The Southern African Institute of Mining and Metallurgy VOLUME 115 JUNE 2015 ▲
ISSN:2411-9717/2015/v115/n6/a3http://dx.doi.org/10.17159/2411-9717/2015/v115n6a3

Crush pillar support – designing for controlled pillar failure
Crush pillar layouts were initially designed using pillardimensions that were successful in other areas. The pillardimensions and spacings were then adjusted until the pillarsexhibited the required behaviour (Ozbay et al., 1995). Thetypical range of w:h ratios of the crush pillars varied between1.5 and 2.5. This accommodated the varying stoping widths(0.9 m to 2 m), the weak footwall rock in some areas, andstructural weaknesses in the rock. An alternative designapproach was to cut the pillar at a w:h ratio of 2 and thenincrease or decrease the pillar width until crushing wasachieved.
Ozbay et al. (1995) stated that the main purpose of thecrush pillars was to provide enough resistance to support therock up to the highest known parting plane (i.e. the MerenskyBastard reef contact at a height of 5–45 m), and not to supportthe full overburden rock mass to surface. The load requirementof a crush pillar to function as local support can be establishedby determining the support resistance required, which isdictated by the height of the prominent parting. Supportresistance in the order of 1 MPa is quoted (Roberts et al.,2005a), based on the back-analysis of back breaks thatoccurred at Randfontein Estates and Northam Platinum, wherethe failures took place at 40 m and 30 m into the hangingwallrespectively. Parting heights of 10 m and 20 m would result ina support resistance requirement of approximately 0.3 MPaand 0.6 MPa respectively.
Typical crush pillar layoutsA typical mining configuration for a crush pillar layout consistsof pillars being positioned either adjacent to raises/winzes (dipmining) or strike gullies (breast mining). The pillars areseparated in the direction of mining by a holing to allow foreither ventilation (vent holing) or to increase extraction (pillarholing). Crush pillar layouts typically consist of approximately30–33 m wide panel spans (inter-pillar) with slender pillars 2 m, 2.5 m, 3 m, or 4 m wide and 3 m, 4 m, or 6 m in length.The pillars are separated by 0.5 m to 3 m wide holings. Insome instances a siding is mined adjacent to the raise or gullyto ensure that the failed pillar material does not fall into thetravelling way. These sidings are approximately 2–2.5 m deepand are carried a maximum of either 3 m or 6 m behind thepanel face (depending on the standard applied by the miningcompany). Figure 3 is an example of a typical up-dip crushpillar layout. An off-reef haulage links to the reef horizon via acrosscut and a travelling way.
Uncertainty regarding pillar behaviour and design The measured and observed behaviour of a 2:1 Merenskycrush pillar is summarized in Figure 4 and Table I. Based onstress measurements, Roberts et al. (2005b) determined that acrush pillar reaches its peak strength at between 3 and 10millistrains, then fails following a further compression ofapproximately 5 millistrains along an estimated negative post-peak stiffness slope of 12 GN/m. Following furthercompression to the extent of 50–90 millistrains, it is assumedthat footwall heave occurs as a result of the lateral confinement
▲
482 JUNE 2015 VOLUME 115 The Journal of The Southern African Institute of Mining and Metallurgy
Figure 1 – Diagram illustrating the complete stress-strain behaviour of apillar (after Ryder and Jager, 2002)
Figure 2 – Photograph of a crush pillar in an underground trial sectionat Lonmin
Figure 3 – Typical layout (up-dip mining) for a narrow tabular reef mineusing crush pillars (plan view)
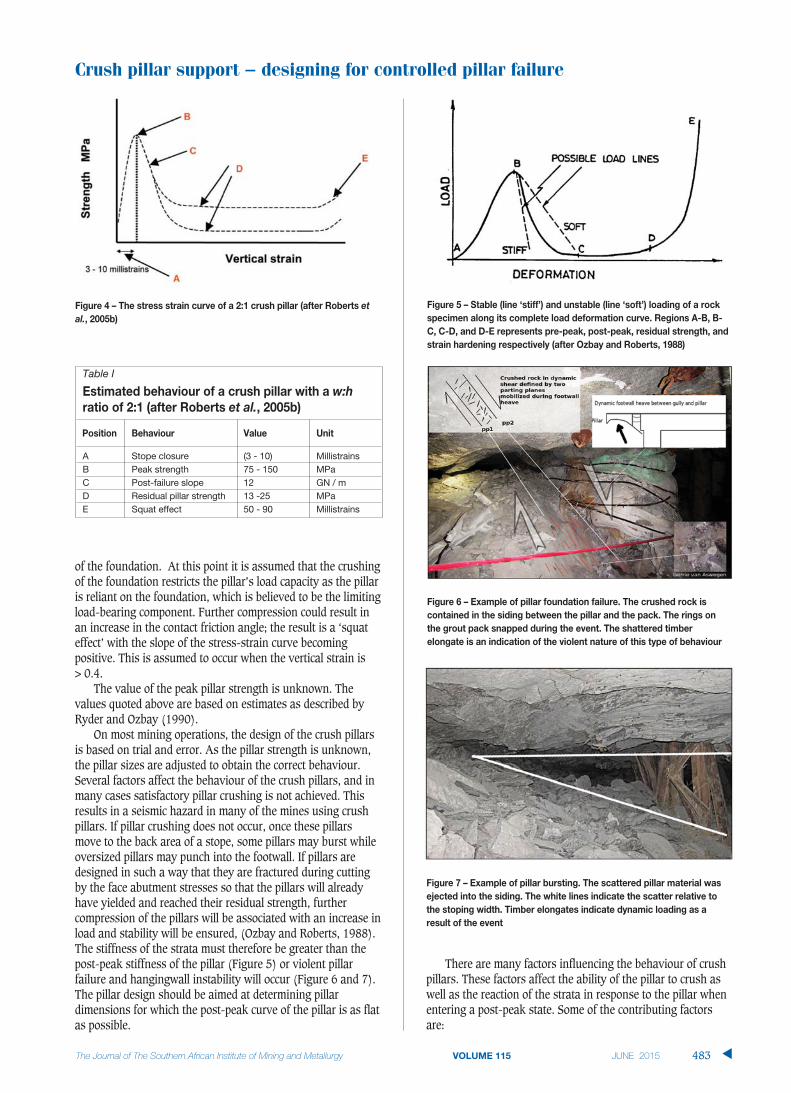
of the foundation. At this point it is assumed that the crushingof the foundation restricts the pillar’s load capacity as the pillaris reliant on the foundation, which is believed to be the limitingload-bearing component. Further compression could result inan increase in the contact friction angle; the result is a ‘squateffect’ with the slope of the stress-strain curve becomingpositive. This is assumed to occur when the vertical strain is > 0.4.
The value of the peak pillar strength is unknown. Thevalues quoted above are based on estimates as described byRyder and Ozbay (1990).
On most mining operations, the design of the crush pillarsis based on trial and error. As the pillar strength is unknown,the pillar sizes are adjusted to obtain the correct behaviour.Several factors affect the behaviour of the crush pillars, and inmany cases satisfactory pillar crushing is not achieved. Thisresults in a seismic hazard in many of the mines using crushpillars. If pillar crushing does not occur, once these pillarsmove to the back area of a stope, some pillars may burst whileoversized pillars may punch into the footwall. If pillars aredesigned in such a way that they are fractured during cuttingby the face abutment stresses so that the pillars will alreadyhave yielded and reached their residual strength, furthercompression of the pillars will be associated with an increase inload and stability will be ensured, (Ozbay and Roberts, 1988).The stiffness of the strata must therefore be greater than thepost-peak stiffness of the pillar (Figure 5) or violent pillarfailure and hangingwall instability will occur (Figure 6 and 7).The pillar design should be aimed at determining pillardimensions for which the post-peak curve of the pillar is as flatas possible.
There are many factors influencing the behaviour of crushpillars. These factors affect the ability of the pillar to crush aswell as the reaction of the strata in response to the pillar whenentering a post-peak state. Some of the contributing factorsare:
Crush pillar support – designing for controlled pillar failure
483The Journal of The Southern African Institute of Mining and Metallurgy VOLUME 115 JUNE 2015 ▲
Figure 4 – The stress strain curve of a 2:1 crush pillar (after Roberts etal., 2005b)
Figure 5 – Stable (line ‘stiff’) and unstable (line ‘soft’) loading of a rockspecimen along its complete load deformation curve. Regions A-B, B-C, C-D, and D-E represents pre-peak, post-peak, residual strength, andstrain hardening respectively (after Ozbay and Roberts, 1988)
Figure 6 – Example of pillar foundation failure. The crushed rock iscontained in the siding between the pillar and the pack. The rings onthe grout pack snapped during the event. The shattered timberelongate is an indication of the violent nature of this type of behaviour
Figure 7 – Example of pillar bursting. The scattered pillar material wasejected into the siding. The white lines indicate the scatter relative tothe stoping width. Timber elongates indicate dynamic loading as aresult of the event
Table I
Estimated behaviour of a crush pillar with a w:hratio of 2:1 (after Roberts et al., 2005b)
Position Behaviour Value Unit
A Stope closure (3 - 10) MillistrainsB Peak strength 75 - 150 MPaC Post-failure slope 12 GN / mD Residual pillar strength 13 -25 MPa E Squat effect 50 - 90 Millistrains

Crush pillar support – designing for controlled pillar failure
➤ Mining depth (stress)➤ The mining height and pillar size (w:h ratio)➤ Stope layouts, including the position of the pillars and
presence of a siding ➤ Strata stiffness and the influence of mining losses (i.e.
potholes or unmined ground) or regional pillars ➤ Strength of the pillar foundation relative to the pillar
strength and load applied➤ Peak and residual pillar strength➤ Mining discipline resulting in over- or undersized pillars.
Evaluation of parameters that govern crush pillarbehaviourDuring the past four decades, several parameters have beenstudied in an attempt to better understand and predict thebehaviour of crush pillars. Crush pillar layouts have, however,remained essentially unchanged over this period. To assesssome of the key parameters as outlined in the previous section,a simplified model has been derived to investigate some of theparameters governing crush pillar behaviour. The approachapplied and results achieved are expanded on in thesubsequent sections of the paper. The aim is to understand theimpact of these parameters on crush pillar behaviour. All of theresults are preliminary and must be substantiated byunderground observations and measurement. A trial is beingconducted at Lonmin Platinum to calibrate the model andvalidate the preliminary findings.
Formulation of the limit equilibrium modelMalan and Napier (2006) represented the force equilibrium ofa material ‘slice’ of a fractured pillar as shown in Figure 8. Theslice of fractured material has a mining height H at a distance xfrom the stope face. The slice is confined by reef-parallel andreef-normal stress components σs and σn respectively, as wellas by shear tractions, τ. It is assumed that the edge of the pillaris at x = 0 and that the seam-parallel stress component σs isuniform over the height of the pillar and increases as xincreases. From Figure 8 it can be inferred that the equilibriumforce balance acting on the slice of height H and unit out ofplane width requires that:
Hσs(x + Δx) = Hσs(x) + 2τΔx [1]
Following integration and the application of assumptionsand substitutions for σs and τ, the following expressions werederived by Malan and Napier (2006) to express the averagehorizontal and vertical stress values for a failed pillar.
σs = S(eαx – 1)/m [2]
σn = Seαx [3]
with α=2μm/H, μ=tanϕ the frictional coefficient, S thecohesion, and m a strengthening parameter. No allowance ismade for roof or floor foundation failure and the stresscomponents increase exponentially from the pillar edge. Aspointed out by Salamon et al. (2003), a Mohr-Coulombplasticity model without strain-softening behaviour isinadequate for simulating actual pillar behaviour where rapidload-shedding or ‘bursting’ may occur. To address thisshortcoming, it is assumed that initial failure in the seam orreef is controlled by the additional relationship:
σn ≤ S0 + m0σs [4]
where S0 and m0 represent the intact strength of the pillarmaterial. Equation [4] can be used to implicitly determine theboundaries between the intact pillar core and the failed edgeregions. Equation [3] predicts an exponential increase in thepillar stress away from the edge towards the centre of thepillar. If the pillar width is w and if the pillar is completelyfailed, assuming that the stress profile is symmetric about thecentre of the pillar, the average stress in the pillar (APS,average pillar stress) is given by:
[5]
Substituting Equation [3] into [5] and following theintegration of Equation [5], the average pillar stress isexpressed by the following relationship (Du Plessis et al.,2011):
[6]
Simulation of crush pillar behaviourThe evaluation of an analytical limit equilibrium model tosimulate crush pillar behaviour was described by Du Plessis etal. (2011). The values predicted by this model were comparedto the numerical values obtained from the TEXAN (TabularEXcavation ANalyzer) simulations. Good correlation wasobtained and this serves as a useful validation of the modelimplemented in the numerical code. In general, the limitequilibrium model appears to be very attractive for simulatingpillar failure as the gradual crushing of the outside of the pillarand the transfer of stress to the intact core can be replicated.
Du Plessis and Malan (2012) indicated that the analyticalsolution derived by the author provided a reasonable fit to theunderground crush pillar stress measurements conducted byWatson (2010).
The impact of pillar width on crush pillar behaviour wasinvestigated by simulating an idealized crush pillar layout(Figure 9) in the TEXAN code. The layout consists of a 30 m ×70 m stope panel with a second panel being mined in asequential fashion adjacent to this first panel. The layout wassimulated as eight mining steps with seven crush pillars beingformed in this process. For the second panel, the size of each
▲
484 JUNE 2015 VOLUME 115 The Journal of The Southern African Institute of Mining and Metallurgy
Figure 8 – Force equilibrium of a material slice in the pillar (after Malanand Napier, 2006)

mining step was 10 m and the sizes of the crush pillars werevaried to obtain the required w:h ratio. Furthermore, miningheights of both 1 m and 2 m were used to compare the impactof pillar width for a constant w:h ratio on pillar crushing. Theelement sizes used were 0.5 m.
The parameters used for the simulations are shown inTable II. Note that these values were chosen arbitrarily and abetter calibration of this model based on undergroundmeasurements will be required in the future. For pillarssimulated with a w:h = 2:1 it appears as if these originalparameters used to test the simulation of pillar crushing with alimit equilibrium model (Table II) are very conservative and atthe upper limit ensuring that pillar crushing is achieved for thesimulations carried out (Du Plessis and Malan, 2012).
Results from numerical simulationsFigure 10 indicates the TEXAN modelling results for thevarious layouts simulating the effect and behaviour of differentpillar widths (w:h ratios). All of the results are for pillar Dformed in mining step 5. The residual (for smaller w:h rangepillars) and peak stress (for larger w:h range pillars) ashighlighted in Figure 10 are re-plotted in Figure 11. Thiscompares the results of the numerical analysis and theanalytical solution for the same set of input parameters. Notethat the larger w:h range pillars did not reach a residual stateand therefore the peak stresses of these pillars were used, ashighlighted.
The preliminary numerical analyses indicated that thepillars with a w:h >2.0 were not yet in a crushed state (at 600mbs). The 4 m wide pillar (w:h = 2:1) did experience latecrushing. Comparative simulations indicated that crush pillarswith a w:h ratio of 2 implemented at depths shallower than600 m will most likely not crush (Du Plessis and Malan, 2012).The simulated pillar behaviour indicated that once the peakstrength of a pillar is reached, the stress increase causescomplete failure of the core of the pillar and the pillar thenmoves to a residual state (also shown in Figure 15). Oversizedpillars that are typically encountered underground either do not
crush or fail violently in the back area. The study highlighted akey attribute of the limit equilibrium models: the pillar stressincreases in an exponential fashion towards the centre of thepillar. This may lead to to the formation of unduly highstresses in the core of wide pillars. The simulated resultsindicated that the cores of these oversized pillars were stillintact. As the oversized pillars did not crush at the face whenbeing cut, these pillars move into the back area as the miningface advances. In the back area, the pillar is at a higher stress.The change in stress caused by a mining increment is lowerthan when the pillar is formed at the face. The pillar maytherefore either not crush (particularly when oversized) or failviolently, as the stresses on these pillars are much higher andthe loading environment has become much softer as the pillaris no longer close to the face abutment. The slope of the post-peak load deformation relationship becomes flatter withincreasing w:h ratios (Salamon and Oravecz, 1976). Salamonpredicted that the softest loading system (strata stiffness) willpresent the greatest danger of uncontrolled failure
The analytical solution of a completely crushed pillar, asindicated in Figure 11, provides a two-dimensional solution(infinitely long pillars) to a three-dimensional problem. If verylong pillars are simulated in TEXAN, the residual pillar stressof the failed pillars moves closer to the analytical solution(pillars with w:h ≤ 2:1). The residual pillar stress of thesefailed pillars touches or lies just below the analytical solutioncurve.
Assessing pillar behaviourFigure 10 and 11 indicate that pillars of different dimensions(w:h ratio) behave differently. There are limiting factorsaffecting pillar crushing which include pilllar width, miningdepth, regional stability (presence of geological structures),pillar length, etc. It is important to understand whichunderlying factors play a role and how they affect thebehaviour of crush pillars. In this paper some of these charac-teristics will be highlighted by determining the governingtrends.
Figure 12 combines the results of the numericalsimulations and the analytical solution. Note that thenumerical simulation considered that the pillar is initially partof the solid rock mass, and is then formed by the approachingmining face, in order to establish how the pillar behaves pre-
Crush pillar support – designing for controlled pillar failure
The Journal of The Southern African Institute of Mining and Metallurgy VOLUME 115 JUNE 2015 485 ▲
Figure 9 – Idealized crush pillar layout simulated in the TEXAN code(plan view)
Table II
Parameters used in crush pillar simulations
General parameters Value
Young's modulus 70 GPaPoisson's ratio 0.25Stress gradient 0.03 MPa/mDepth 600 mReef dip 0°
Crush model parameters Value
Intact cohesion C0 5 MPaResidual cohesion 5 MPaIntact slope m0 5Residual slope m 3Bounding friction angle 35°Seam height 1 m and 2 mSeam stiffness modulus 106 MPa/m

Crush pillar support – designing for controlled pillar failure
cutting whilst being formed at the face and post-cutting as itmoves into the back area as the mining face continus toadvance. Figure 12 was compiled to establish how the state ofstress of each cut pillar changes and compares in relation to theanalytical solution during this pillar-forming stage. Thebehaviour of each pillar is indicated by the arrows representingthe stress relation as a result of mining. The range includes theinitial state of stress (after mining step 1), the increase instress as the pillar is formed (towards the maximum), andwhere applicable the reduction in pillar stress to the residualstate (pillar crushing). From Figure 12 it is apparent that thestress range of the larger pillars (w:h > 2:1) is situated farbelow the analytical solution.
Line A represents the initial pillar stress (all pillars) andline B the peak pillar stress (for the failed pillars only). Fromthe figure it is clear that the pillars with a larger width-to-height ratio (i.e. w:h > 2:1) are at a much lower initial stress.The pillars are therefore able to absorb the change in stress as
they are formed and mining progresses. The state of peak pillarstress is therefore not reached and pillar crushing is notachieved. For these pillars a much higher level of initial stressis required.
As mentioned earlier, various factors affect the initial stressstate of the rock mass and pillar. These include pillar width,mining height, mining depth, pillar length (width-to-lengthratio >5), and the presence of geological structures (regionalstability).
Figure 13 compares the stress profile from the edge of pillarD, over the pillar holing and ahead of the mining face, for botha 1 m and 2 m mining height (for mining step 5). For a lowermining height, a narrower pillar is required to maintain thesame w:h ratio. As mentioned, late pillar crushing wasachieved for the the 4 m wide pillar (2 m stoping height; SW = 2). The 2 m wide pillar (1 m stoping height; SW = 1) didexperience pillar crushing while the pillar was being formed atthe mining face (also refer to Figure 14, which compares thestress change per mining step). In both cases, significantlylarge face stresses were achieved in the region approximately 2 m ahead of the mining face. These were sufficiently large to
▲
486 JUNE 2015 VOLUME 115 The Journal of The Southern African Institute of Mining and Metallurgy
Figure 10 – TEXAN simulation – effect of pillar width on pillarperformance (600 mbs; 2 m pillar height)
Figure 11 – Results from the analytical solution of a completely crushedpillar (Equation [6]) and numerical simulation for pillars with various w:hratios (600 mbs)
Figure 13 – Simulated vertical stress along portion of section b´- b´ inFigure 9. Note that the same w:h ratio is maintained in the simulationsfor both stoping widths
Figure 12 – Pillar stress trends for different pillar widths (simulatedpillars at 600 mbs)

initiate early pillar crushing while the pillar was being formedat the face. This is, however, not the case for larger pillars withw:h > 2:1. Lower pillar edge stress is achieved for the pillarswith larger w:h ratios (110 MPa for a pillar with w:h = 3:1compared to 189 MPa for pillar with w:h = 2:1). This effect ishighlighted in Figure 12 and Figure 15.
Figure 15 indicates the exponential stress increase towardsthe centre of the pillar. This could, however, lead to excessivelyhigh stresses in the cores of wide pillars where a crushed stateis not reached. Note that the stress profile for the w:h = 2:1pillar is for mining step 5 and just before the pillar completelycrushes and moves to a residual state in mining step 6 (refer toFigure 14, which indicates the stress sequence as a result ofmining). At this point the pillar has completely crushed fromthe outside towards the centre of the pillar. The pillar core alsoreaches a maximum stress limit, after which complete failure ofthe pillar is reached and the pillar moves to a residual state (ascan be seen for a w:h = 1.5 pillar). As mentioned, the core ofan over-sized pillar does not reach this maximum stress limitand remains intact.
Considering the aforementioned factors influencing thestress state of a pillar, a zone defining possible pillar crushingcan be identified. Figure 16 distinguishes between zone 1(pillar crushing) and zone 2 (no pillar crushing). The windowfor achieving pillar crushing therefore becomes smaller as thepillar width increases (as indicated by zone 1 pinching out at aw:h of approximately 2.5). Line C defines a possible linearextrapolation of the anticipated residual pillar stress. In theory,the residual state of the pillar should coincide with the curverepresenting the analytical solution. The amount of stresschange required per increment of mining for these large pillarsdoes, however, become substantial. As indicated by the resultsof the numerical modelling, pillar crushing is typically notachieved by these larger pillars. Although the pillars are at ahigher stress, the incremental stress increase reduces as thepillars move towards the back area (refer to Figure 10). Acritical stress level is therefore not reached whereby the pillarscrush completely (the pillar core remains intact).
This highlights the importance of crush pillars requiring asufficiently high initial stress level to ensure that the pillar canfail throughout and move to a residual state. The peak strengthof the pillar must be exceeded while the pillar is close to themining face to cause complete failure of the core. It is for this
reason that the analytical solution may be of practical use onlyfor pillars with low width-to-height ratios (w:h approx. 2:1).Numerical simulations conducted for pillars with w:h ≥ 2.5indicated that the pillars did not crush even at 1000 m belowsurface. The wider pillars are therefore able to absorb thechange in stress as the pillar is formed and mining progresses.In the back area the change in stress per mining incrementdecreases and the pillar core remains solid.
From the preliminary results obtained, it is hypothesizedthat the zone of pillar crushing can essentially be extended asindicated in Figure 17. The cut-off zone extends just beyond apillar w:h ratio of 2 and stretches towards the analyticalsolution curve. This is based on numerical simulation forvarious scenarios including mining depth, pillar width, pillarheight, and the impact of infinitely long pillars.
ConclusionThis paper provides a general overview of crush pillars.Although the function of crush pillars is well understood (theresidual state of the pillar must support the deadweight to theuppermost unstable parting), the behaviour of pillars in
Crush pillar support – designing for controlled pillar failure
The Journal of The Southern African Institute of Mining and Metallurgy VOLUME 115 JUNE 2015 487 ▲
Figure 14 – Effect of pillar width on pillar behaviour (comparison of a 1m and 2 m mining height on w:h = 2:1 pillar)
Figure 15 – Simulated vertical stress along section a´ – a´ in Figure 9 forpillars with different w:h ratios (600 mbs)
Figure 16 – Zone of pillar crushing for various pillar widths (600 mbs)

Crush pillar support – designing for controlled pillar failure
underground mines is, in some instances, unpredictable,resulting in pillar seismicity. Although the concept that thepillar design should be aimed at determining pillar dimensionsfor which the post-peak curve of the pillar is as flat as possibleis widely accepted, several factors influence the ability of apillar to enter a residual state while the pillar is being formed atthe mining face. If the pillar does not crush while in closeproximity to the stiff face abutment, the transition to a softloading environment as the pillar moves into the back areacould cause the pillar to fail violently.
A derived limit equilibrium model and its implementationin a numerical boundary element code were used to predict thepotential residual state of crush pillars. This includedsimulating an idealized crush pillar layout to determine thestress of a crush pillar prior to formation (while still part of themining face), when cut at the face, and when the pillar is in theback area of a stope as the mining face advances.
The results indicate that there are many factors affectingpillar crushing, including pillar width, mining depth, miningheight, regional stability, and pillar length. These factors havean impact on the initial stress state of the pillar. Thecomparative simulations indicated that a pillar with a w:h > 2:1may not crush completely and could pose a seismic risk in theback area of a stope. Furthermore, the initial stress required toensure the crushing of a 2:1 pillar core is achieved only atmining depths greater than 600 m below surface. The peakstrength of the pillar must be exceeded while the pillar is closeto the mining face to cause complete failure of the pillar core. Itis for this reason that it is envisaged that the analyticalsolution might be of practical use only for pillars with lowwidth-to-height ratios. A zone of pillar crushing exists aroundthe analytical solution curve. The window for pillar crushing,however, decreases as the pillar width increases and isinfluenced by the initial stress state of the pillar. Mining lossessuch as potholes also affect the initial stress state of crushpillars in close proximity to these geological structures. Theinfluence of potholes was also simulated in order to tounderstand the impact on crush pillar behaviour, but theresults are not presented in this paper.
It should be emphasized that all of these results andconclusions are based on the parameters assumed for the limitequilibrium model. Regarding further work, rock testing isrequired to determine the post-peak properties and behaviourof the Merensky Reef. This will improve the confidence in thederived analytical solution as a tool for estimating the residualstrength of crush pillars. Furthermore, undergroundmeasurements are required to back-analyse the crush pillarbehaviour and calibrate the model. A trial mining site usingcrush pillars has been established at Lonmin Platinum.
AcknowledgementThe work described in this paper forms part of the PhD studyof Michael du Plessis at the University of Pretoria. The contri-bution of Dr John Napier with regards to the development ofthe limit equilibrium model as well as the TEXAN code isgreatly appreciated.
ReferencesDU PLESSIS, M. MALAN, D.F. and NAPIER, J.A.L. 2011. Evaluation of a limit
equilibrium model to simulate crush pillar behaviour. Journal of theSouthern African Institute of Mining and Metallurgy, vol. 111, no. 12. pp.875–885.
DU PLESSIS, M. and MALAN, D.F. 2012. The simulation of crush pillar behaviour inthe tabular layouts of the Bushveld Complex. Proceedings of Eurock 2012,Stockholm, Sweden, 28–30 May 2012. International Society for RockMechanics.
KORF, C.W. 1978. Stick and pillar support on Union Section, Rustenburg PlatinumMines, Association of Mine Managers of South Africa. pp. 71–82.
MALAN, D.F. and NAPIER, J.A.L. 2006. Practical application of the TEXAN code tosolve pillar design problems in tabular excavations. SANIRE 2006Symposium - Facing the Challenges, Rustenburg, South Africa. SouthAfrican National Institute for Rock Engineering. pp. 55–74.
OZBAY, M.U., and ROBERTS, M.K.C 1988. Yield pillars in stope support. Proceedingsof the SANGORM Symposium in Africa, Swaziland. South African NationalGroup on Rock Mechanics, Johannesburg. pp. 317–326.
OZBAY, M.U., RYDER, J.A., and JAGER, A.J. 1995. The design of pillar systems aspracticed in shallow hard-rock tabular mines in South Africa. Journal of theSouth African Institute of Mining and Metallurgy, vol 95, no. 1. pp. 7–18.
ROBERTS, D.P., ROBERTS, M.K.C., and JAGER, A.J. 2005a. Alternative supportsystems for mechanised stopes, PlatMine project report 2004-0189.Miningtek Division, CSIR, Johannesburg.
ROBERTS, D.P., ROBERTS, M.K.C., JAGER, A.J., and COETZER, S. 2005b. The determi-nation of the residual strength of hard rock crush pillars with a width toheight ratio of 2:1. Journal of the South African Institute of Mining andMetallurgy. vol. 105. pp. 401–408.
RYDER, J.A. and JAGER, A.J. 2002. A Textbook on Rock Mechanics for TabularHard Rock Mines. Safety in Mines Research Advisory Committee (SIMRAC),Johannesburg. pp 287, 298–299.
RYDER, J.A. and OZBAY, M.U. 1990. A methodology for designing pillar layouts forshallow mining. International Symposium on Static and DynamicConsiderations in Rock Engineering, Swaziland, 10-12 September 1990.International Society for Rock Mechanics.
SALAMON, M.D.G. and ORAVECZ, K.I. 1976. Rock Mechanics in Coal Mining. CoalMining Research Controlling Council. Chamber of Mines, Johannesburg.
SALAMON, M.D.G., BADR, S., MENDOZA, R., and OZBAY, M.U. 2003. Pillar failure indeep coal seams: numerical simulation. Proceedings of the 10th Congress ofthe International Society for Rock Mechanics. South African Institute ofMining and Metallurgy, Johannesburg. pp. 1011–1018.
WATSON, B.P. 2010. Rock Behaviour of the Bushveld Merensky Reef and theDesign of Crush Pillars. PhD thesis, School of Mining Engineering,University of the Witwatersrand, Johannesburg, South Africa. ◆
▲
488 JUNE 2015 VOLUME 115 The Journal of The Southern African Institute of Mining and Metallurgy
Figure 17 – Proposed extrapolated zone of pillar crushing based onpreliminary modelling results
IntroductionBulk emulsion explosives have been used inlarge-scale mining operations across the globefor decades. The reason for their extensive uselies primarily in the advantages of bulkemulsion explosives over alternative explosivetechnologies, both in terms of safety and blastperformance. Despite these benefits havingbeen attainable for some time, the scale andcost of equipment required for the implemen-tation of such technologies has resulted intheir use being limited to large-scale miningoperations. This limitation continues to exist,despite the ever-growing demand for increasedlevels of safety and security in the narrow-reefenvironment.
As pumpable emulsions are insensitive toinitiation prior to sensitization they areclassified as UN Class 5.1, and as such are free
from many of the regulations imposed on Class1 explosives. The increase in safety andsecurity obtainable through this classification,together with the physical properties ofpumpable emulsions, allows for significantadvantages over alternative explosivestechnologies available for use in the narrow-reef environment. In addition to the improvedsafety during transportation, storage, andhandling, pumpable emulsions can be pumpedbetween transport vessels, through shaftpipelines, and into the blast-hole, therebyreducing labour requirements.
Given the possible benefits availablethrough the implementation of pumpableemulsions within narrow-reef operations, astudy was undertaken in order to gain anunderstanding of the factors essential to theirsuccessful implementation. Through thisunderstanding, a project was formulated thatwould allow for the development of a suite ofunderground emulsion technologies and UNclass 5.1 pumpable emulsion formulationssuitable for application in the South Africannarrow-reef environment.
Explosives selection for narrow-reefblasting applicationsIn order to understand the benefits availablethrough the implementation of pumpableemulsion systems, a discussion of availableexplosives is important for comparativepurposes.
Toward the end of the 20th century the useof dynamite explosives was phased out ofnarrow-reef mining operations in favour ofvarious forms of ammonium nitrate (AN)-based explosives. Despite the commonality ofAN in the various explosives, considerable
The application of pumpable emulsionsin narrow-reef stopingby S.P. Pearton*
SynopsisPumpable emulsion explosives have been available to surface andunderground massive mining operations for decades, and their uniqueproperties offer significant advantages in terms of improved safety,reliability, and performance. However, the benefits of pumpable emulsionshave been unavailable to narrow-reef mining operations due to the lack oftechnology necessary for their successful implementation in thischallenging environment. Despite efforts to promote and enhance thesafety and performance of bulk emulsions for narrow-reef stoping, littleresearch has been undertaken to advance the pump technologies requiredfor their implementation. This has resulted in a gap in knowledge andtechnology, and as a consequence the successful implementation of apumpable emulsion system has consistently eluded the narrow-reefenvironment.
The purpose of the following investigation was to evaluate theviability of pumpable emulsion explosives for use in South Africannarrow-reef mining operations. By approaching the problem from multipleperspectives, this research aimed firstly to propose a theoreticalframework and suite of equipment suitable for the implementation ofpumpable emulsions within the narrow-reef environment. Through thedevelopment of this suite of pumpable emulsion technology, tests could beundertaken on the proposed narrow-reef emulsion formulation andpumpable emulsion technology to obtain the necessary understanding ofthe performance of the system under controlled operating conditions priorto its implementation in the broader mining industry.
Keywordsblasting technology, explosives, pumpable emulsions.
* BME, a division of the Omnia Group© The Southern African Institute of Mining and
Metallurgy, 2015. ISSN 2225-6253. This paperwas first presented at the, Platinum Conference2014, 20–24 October 2014, Sun City South Africa.
489The Journal of The Southern African Institute of Mining and Metallurgy VOLUME 115 JUNE 2015 ▲
ISSN:2411-9717/2015/v115/n6/a4http://dx.doi.org/10.17159/2411-9717/2015/v115n6a4

The application of pumpable emulsions in narrow-reef stoping
differences in physical properties and performance character-istics still exist between the various types of AN-basedexplosives. As the results obtained in blasting operations are,in part, dependent on the physical properties andperformance characteristics of the selected explosive, theoptimal choice of explosive will differ depending on the blastdesign, the desired outcome of the blast, and the geologicaland environmental conditions in which the blast takes place.
ANFOANFO was first introduced into South African undergroundtabular mining operations in 1963, and by 1975 accountedfor approximately 60% of the commercial explosivesconsumption within the sector. Not only did ANFO increasethe level of safety of commercial explosives, but it was lessexpensive than dynamites, ‘less arduous’ to handle, and as aresult of its bulk form it allowed for 100% coupling withinthe blast-hole, improving the efficiency of energy transferfrom the blast-hole into the surrounding rock mass. Althoughthe bulk nature of ANFO initially appeared to be beneficial tomining operations, it allowed for the unprecedentedovercharging of blast-holes. This high mass of fully-coupledlow velocity of detonation (VOD) explosive increased theextent of damage to the hangingwall and increased levels ofoverbreak (Mosenthal, 1990). Due to the hygroscopic natureof ANFO it is also less sensitive to detonation when exposedto humid conditions and its use will result in poor andinconsistent blast results in wet mines. The combination ofthese factors reduces the efficiency of blasting operations andincreases the overall cost of mining due to undesirable blastresults and high levels of explosives waste.
Although ANFO is manufactured at an approximate bulkdensity of 0.8 g/cm3, the blow loading of ANFO inunderground operations increases the density of theexplosive, thereby increasing the relative bulk strength (RBS)of the explosive. As the air pressure available at the time ofloading determines the force at which the ANFO granules arepropelled through the charging lance and into the hole, thecrushed particle size and compaction of the prill within theblast-hole will vary depending on the available air pressure,the strength of the prill, and the loading technique used.Loaded densities achieved through the use of pneumaticloaders commonly range from 0.94 to 1.1 g/cm3 dependingon the abovementioned variables (Brinkmann, 1994). Thishigh blow-loaded density further exacerbates the problem ofthe overcharging of blast-holes due to the increased energywithin the blast-hole. As ammonium nitrate crystals undergoa phase change at 32°C, the control of product shelf life isimportant in order to limit the degradation of ANFO throughtemperature cycling (Mulke, 1966). Repeated cycling ofANFO across 32°C results in the degradation of the originalprill and significantly increases the density achieved throughpneumatic loading, as well as the quantity of ANFO blowninto the air during loading operations.
As these factors affect the density of blow-loaded ANFOand this in turn affects the VOD, a broad and inconsistentrange of VOD results will be experienced when using ANFO.In an attempt to reduce the extent of damage caused by theovercharging of blast-holes with ANFO, explosives manufac-turers have reduced the relative bulk strength of ANFO.Despite these efforts, limited success is evident and ANFO
has been largely excluded from consideration in mines withpoor ground conditions (Kruger, 2010). In addition to theundesirable performance profile, the UN Class 1 classificationof ANFO increases the burden on the transportation andstorage of ANFO as required in accordance with SouthAfrican law.
Cartridged explosivesThe way in which an explosive is packaged has both practicaland financial implications for mining operations. Two typesof packaged AN-based cartridges exist for use inunderground blasting applications, namely watergel (slurry)and emulsion cartridges. As packaged explosives such ascartridges are pre-sensitized at a manufacturing facility,better equipment and a higher level of control can beexercised in achieving consistent quality product. In addition,as cartridges are manufactured ready to load into the blast-hole, they are also easy to handle in confined and difficultunderground conditions.
Despite these benefits, the use of packaged explosivesentails numerous disadvantages. Owing to their pre-sensitized nature, most packaged explosives are classified asClass 1 explosives and as such are subject to the regulationsof the Department of Mineral Resources (DMR), ChiefInspectorate of Explosives (CIE), and the Department ofLabour (DOL) throughout manufacture, delivery to, andstorage on mining operations. This is a significantdisadvantage in the current South African environment giventhe stringent legislation regulating the transportation andcontrol of Class 1 explosives. In addition to increasedregulation, the manufacture of pre-packaged explosivesnecessitates increased investment and operating expenses onthe side of the manufacturer, in turn resulting in higherprices than for packaged explosives than for bulk products.As packaged products also require additional labour foroffloading and handling on the shaft, transportation
▲
490 JUNE 2015 VOLUME 115 The Journal of The Southern African Institute of Mining and Metallurgy
Figure 1 – Effect of coupling ratio on radial compressive strain and falltime (Saffy, 1961)

throughout the operations, and during loading of the blast-face, considerable additional labour expenses are incurred.
One consideration of great significance in the use ofpackaged explosives is the reduction in coupling experiencedduring the loading of the explosive. The degree of decouplingis dependent on a number of variables in the manufacturingand loading of the explosive. These factors include themanufactured stiffness of the cartridge, the thickness andstrength of the wrapping or sleeving material, the elevation ofthe operation where it is used, the temperature at time of use,the ratio of the manufactured cartridge size to hole size, andspecific operator practices such as the force applied to tampthe cartridge and the number of cartridges inserted in a holeprior to tamping (ISEE, 1998; Saffy, 1961). As a decrease incoupling ratio is directly proportional to the loss in shockenergy or the strain wave delivered to the rock mass, asignificant reduction in explosive efficiency results from theuse of decoupled cartridged explosives (Figure 1). In order tocompensate for the poor efficiency of shock transmission tothe rock mass, a greater mass of explosive is necessary perblast-hole to break a fixed mass of rock, furthercompounding the additional time and labour required to loadthe blast-face.
Cartridged watergel explosivesWatergel or slurry explosives as they are also known werefirst implemented in South African opencast mines in 1968.Watergel explosives constitute ‘a colloidal suspension of solidAN particles suspended in a liquid AN solution and gelledusing cross linking agents’ (Aimone, 1992). Gelling agentssuch as guar gum are used to thicken the explosive matrixwhile fuel oils are added to the matrix to enable detonation totake place. In order to increase the sensitivity of watergelexplosives, sensitizing agents such as TNT, nitrostarch,Composition B, ethyl alcohol, and glass micro-bubbles areadded to the formulation, while aluminium is added toincrease the energy released during detonation.
Due to the comparatively poor intimacy of the fuel andoxidizer phases of watergel explosives, they have a lowerVOD and as such a lower detonation pressure than emulsionexplosives (Spiteri, 1998). Owing to the lower detonationpressure, the strain wave induced through the detonation ofthe charge will be lower than that of high-VOD emulsionexplosives, while the period of time in which high-pressuregases act on the rock mass will be greater. Typical VODvalues for smaller diameter watergel charges fall within therange of 3200 m/s to 3700 m/s (Brinkmann, 1990), whileexplosive densities may be as high as 1.35 g/cm3, allowingfor a high energy concentration during loading (Spiteri,1998). Due to the presence of water in the watergelformulation, the resistance of watergel explosives toaccidental initiation is good.
Cartridged emulsion explosivesEmulsion explosives first entered South African undergroundtabular mining operations in cartridged form in the early1980s. Emulsion explosives are composed of two immiscibleliquids with an aqueous oxidizer phase and a fuel oil phasemaking up the explosive. During the manufacturing process,the aqueous ammonium nitrate phase of the emulsion isdivided repeatedly through a blending process, formingmicroscopic droplets of oxidizer suspended within the oil
matrix. As a result of the microscopic size and even distri-bution of oxidizer droplets within the matrix, the intimacy ofthe oxidizer and fuel within emulsion explosives is betterthan in ANFO and slurry explosives.
During detonation, the high degree of intimacy betweenthe two phases of the emulsion explosive allows for a fasterreaction between the fuel and oxidizer, thereby resulting in ahigher VOD. As this intimacy allows for a more efficientreaction, smaller volumes of noxious gases are releasedduring detonation (Svard and Johansson, 1999). Anotherbenefit of the high intimacy between the fuel and oxidizerphase of an emulsion is that the addition of mechanically orchemically induced nitrogen gas bubbles is sufficient tosensitize the base emulsion to allow for detonation. For thisreason no other sensitizing chemicals need be added to anemulsion, and as a result, the resistance of emulsions toaccidental initiation is substantially less than even that ofwatergel explosives. Typical VOD values for emulsions insmall-diameter blast-holes range from 4500 m/s to 5100 m/s(Brinkmann, 1990), with average density values in theregion of 1.15 g/cm3 to upper limits as high 1.35 g/cm3
(Spiteri, 1998). As emulsions are insoluble in water, they areideal for use in wet mining operations where they are able todisplace water within wet blast-holes due to their high initialdensity.
Pumpable emulsion explosivesPumpable emulsions represent the forefront in explosivessafety and efficiency in underground mining operations dueto their Class 5.1 classification and bulk form. In order toreduce the sensitivity to allow for the UN Class 5.1 classifi-cation, pumpable emulsions are manufactured with a higherwater content than Class 1 cartridged emulsions. This,together with the larger bubble size introduced through on-site chemical sensitization, results a marginally lower VODspecific to the water content and overall sensitivity toinitiation of the emulsion formulation. While pumpableemulsions share many of the performance characteristics ofcartridged emulsion explosives, the physical properties ofpumpable emulsions allow for greatly improved operationalefficiency. Advantages of pumpable emulsions include areduction in labour for the transportation and loading ofexplosives, a reduction in charging time due to the highloading rate of charging equipment, and a 100% couplingratio between the explosive charge and the blast-hole wall.As full coupling increases the efficiency with which thedetonation pressure and brisance produced in the detonationfront are transmitted into the rock mass, the overall efficiencyof the blast is improved (Saffy, 1961).
As cartridged explosives possess a coupling ratio of only80% to 90%, they are unable to achieve the same blastingefficiency as bulk explosives. This is evident in Figure 2,where the shock energy delivered to the rock through theprimary reaction zone (PRZ) is calculated and compared for ahigh-energy cartridged emulsion (RBS 153, VOD 4500 m/s)and average energy pumpable emulsion (RBS 132, VOD 3600m/s) (Brinkmann, 1990). From the figure it is evident thatthe efficiency of decoupled explosive charges is impactedinitially by a decrease in loaded mass per metre as a result ofdecoupling, and secondly by a loss in shock energy deliveredto the rock mass as a result of the decreased efficiency in thetransmission of the strain wave through the air cushion
The application of pumpable emulsions in narrow-reef stoping
491The Journal of The Southern African Institute of Mining and Metallurgy VOLUME 115 JUNE 2015 ▲
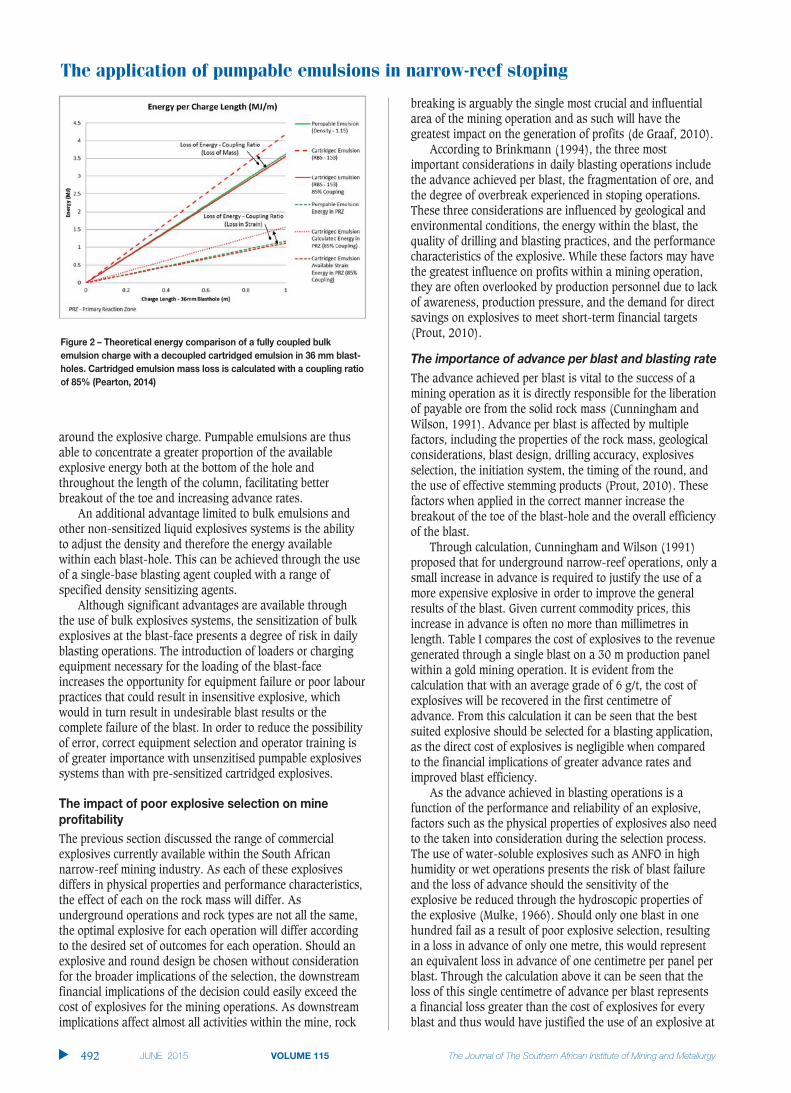
The application of pumpable emulsions in narrow-reef stoping
around the explosive charge. Pumpable emulsions are thusable to concentrate a greater proportion of the availableexplosive energy both at the bottom of the hole andthroughout the length of the column, facilitating betterbreakout of the toe and increasing advance rates.
An additional advantage limited to bulk emulsions andother non-sensitized liquid explosives systems is the abilityto adjust the density and therefore the energy availablewithin each blast-hole. This can be achieved through the useof a single-base blasting agent coupled with a range ofspecified density sensitizing agents.
Although significant advantages are available throughthe use of bulk explosives systems, the sensitization of bulkexplosives at the blast-face presents a degree of risk in dailyblasting operations. The introduction of loaders or chargingequipment necessary for the loading of the blast-faceincreases the opportunity for equipment failure or poor labourpractices that could result in insensitive explosive, whichwould in turn result in undesirable blast results or thecomplete failure of the blast. In order to reduce the possibilityof error, correct equipment selection and operator training isof greater importance with unsenzitised pumpable explosivessystems than with pre-sensitized cartridged explosives.
The impact of poor explosive selection on mineprofitabilityThe previous section discussed the range of commercialexplosives currently available within the South Africannarrow-reef mining industry. As each of these explosivesdiffers in physical properties and performance characteristics,the effect of each on the rock mass will differ. Asunderground operations and rock types are not all the same,the optimal explosive for each operation will differ accordingto the desired set of outcomes for each operation. Should anexplosive and round design be chosen without considerationfor the broader implications of the selection, the downstreamfinancial implications of the decision could easily exceed thecost of explosives for the mining operations. As downstreamimplications affect almost all activities within the mine, rock
breaking is arguably the single most crucial and influentialarea of the mining operation and as such will have thegreatest impact on the generation of profits (de Graaf, 2010).
According to Brinkmann (1994), the three mostimportant considerations in daily blasting operations includethe advance achieved per blast, the fragmentation of ore, andthe degree of overbreak experienced in stoping operations.These three considerations are influenced by geological andenvironmental conditions, the energy within the blast, thequality of drilling and blasting practices, and the performancecharacteristics of the explosive. While these factors may havethe greatest influence on profits within a mining operation,they are often overlooked by production personnel due to lackof awareness, production pressure, and the demand for directsavings on explosives to meet short-term financial targets(Prout, 2010).
The importance of advance per blast and blasting rateThe advance achieved per blast is vital to the success of amining operation as it is directly responsible for the liberationof payable ore from the solid rock mass (Cunningham andWilson, 1991). Advance per blast is affected by multiplefactors, including the properties of the rock mass, geologicalconsiderations, blast design, drilling accuracy, explosivesselection, the initiation system, the timing of the round, andthe use of effective stemming products (Prout, 2010). Thesefactors when applied in the correct manner increase thebreakout of the toe of the blast-hole and the overall efficiencyof the blast.
Through calculation, Cunningham and Wilson (1991)proposed that for underground narrow-reef operations, only asmall increase in advance is required to justify the use of amore expensive explosive in order to improve the generalresults of the blast. Given current commodity prices, thisincrease in advance is often no more than millimetres inlength. Table I compares the cost of explosives to the revenuegenerated through a single blast on a 30 m production panelwithin a gold mining operation. It is evident from thecalculation that with an average grade of 6 g/t, the cost ofexplosives will be recovered in the first centimetre ofadvance. From this calculation it can be seen that the bestsuited explosive should be selected for a blasting application,as the direct cost of explosives is negligible when comparedto the financial implications of greater advance rates andimproved blast efficiency.
As the advance achieved in blasting operations is afunction of the performance and reliability of an explosive,factors such as the physical properties of explosives also needto the taken into consideration during the selection process.The use of water-soluble explosives such as ANFO in highhumidity or wet operations presents the risk of blast failureand the loss of advance should the sensitivity of theexplosive be reduced through the hydroscopic properties ofthe explosive (Mulke, 1966). Should only one blast in onehundred fail as a result of poor explosive selection, resultingin a loss in advance of only one metre, this would representan equivalent loss in advance of one centimetre per panel perblast. Through the calculation above it can be seen that theloss of this single centimetre of advance per blast representsa financial loss greater than the cost of explosives for everyblast and thus would have justified the use of an explosive at
▲
492 JUNE 2015 VOLUME 115 The Journal of The Southern African Institute of Mining and Metallurgy
Figure 2 – Theoretical energy comparison of a fully coupled bulkemulsion charge with a decoupled cartridged emulsion in 36 mm blast-holes. Cartridged emulsion mass loss is calculated with a coupling ratioof 85% (Pearton, 2014)

double the expense in order to prevent the failure of a singleblast. From this, it is evident that the direct cost of explosivesis negligible when compared to the financial implications ofdaily blasting operations. Any loss in advance experiencedwithin a mining operation represents a piece of ground thatneeds to be drilled and blasted a second time (Brinkmann,1994).
Fragmentation and mine call factorAs previously discussed regarding the advance per blast,multiple factors are responsible for the degree of fragmen-tation achieved in blast results. The most important factors indetermining the fragmentation within a specific round designinclude the specific energy of the explosive, the powder factorwithin the round, the timing of the round, the quality ofdrilling and blasting practices, and the VOD of the selectedexplosive (Prout, 2010; Lindsay, 1991). While the mass andVOD of the explosive determine the extent of fracturingsurrounding the blast-hole, Brinkmann (1994) found byexperimentation that the specific energy within the round hadby a significant margin the greatest effect on the size offragmentation achieved in the blast. This is illustrated inFigure 3, where the specific energy per cubic metre is plottedagainst fragment size for 10%, 50%, and 90% screen passrates (Brinkmann 1994). Due to the increase in pressurewithin the blast, rock particles will be accelerated to highervelocities and the size of rock fragments will be furtherreduced on collision with the excavation walls (Brinkmann,1994).
From his experiments Brinkmann (1994) noted apractical limit to the specific energy that could be applied inan attempt to reduce the maximum fragment size achieved inthe blast. As indicated in Figure 3, only a small reduction inlarge particle size is experienced for increasing specificenergy beyond approximately 8 MJ/m3.
In determining the required fragment size for a specificmining operation, logistical considerations, the geologicalproperties of the rock mass, and the distribution of mineral-ization in the ore need to be taken into consideration(Brinkmann, 1994). Fragment size is of particular importancefor carbonaceous gold reefs on the Witwatersrand due to thedetrimental effect of excessive fragmentation on mine callfactor. Several case studies have highlighted the severefinancial implications that can result from the excessive useof high-energy explosives in such operations (Kruger, 2010;
Brinkmann, 1994). Another repercussion of excessively finefragmentation is increased operating expenses forautogenous mills due to the requirement for additional steelballs (Brinkmann, 1994).
Excessively large fragmentation will similarly have animpact on the operating costs of the mining operation. As thepowder factor of the blast increases, within acceptable limits,the average fragment size produced by the blast willdecrease, increasing the efficiency of handling and sizereduction activities downstream.
Areas of low efficiency and increased expenditure as aresult of oversize ore in the muck pile include (Prout, 2010;Cunningham and Wilson, 1991; Brinkmann, 1994):➤ Damage to support and blasting barricades➤ Secondary blasting activities➤ Cleaning cycle times➤ Efficiency and wear on scrapers➤ Grizzly maintenance costs➤ Orepass blockages➤ Maintenance of loading boxes➤ Equipment running costs➤ Crusher throughput and maintenance.
From the above discussion it is clear that a fundamentalunderstanding is required of the effect of fragmentation sizeon the profitability of a specific mining operation in order for
The application of pumpable emulsions in narrow-reef stoping
The Journal of The Southern African Institute of Mining and Metallurgy VOLUME 115 JUNE 2015 493 ▲
Table I
Comparison of revenue and the direct cost of explosives for a panel (gold mining)
Panel length (m) 30 Burden (m) 0.5Panel height (m) 1.2 Lines 2Advance (m) 1.0 (83%) Blast-holes per face 120Rock density (kg/m3) 2.7 Mass per hole (kg) 0.8Tons per blast (t) 97 Mass per face (kg) 96.0Average grade (g/t) 6.0 Powder factor (kg/m3) 2.1Gold produced per blast (kg) 0.6 Cost per kg explosive R 10.00Gold price ($ per oz) $ 1260 Cost per fuse R 10.00Exchange rate (R/$) R 10.20 Cost of explosives R 960Rand gold price R 413 248 Cost of accessories R 1200Revenue per blast R 241 006 Total cost of explosives R 2160Explosives cost as % of revenue 0.9% Cost per ton broken R 22.22
Figure 3 – Influence of specific energy on fragment size in blast results(Brinkmann, 1994)

The application of pumpable emulsions in narrow-reef stoping
the correct explosive and round design to be selected for theapplication. Given the financial implications of fragmentationon the profitability of an operation, it is essential tounderstand the effect of both excessive fines and oversizematerial on the profitability of the mine (Brinkmann, 1994).
Overbreak and dilutionOne of the greatest areas of concern in narrow-stope miningoperations is the degree of overbreak. Overbreak results fromthe penetration of high-pressure gases into the rock masssurrounding the excavation, resulting in the breakout ofexcess rock from the hangingwall (Brinkmann, 1994). Aswith advance and fragmentation, the primary factorsresponsible for the degree of overbreak include the energy ofthe explosive, the energy within the round design, the qualityof drilling and blasting practices, sequential firing of blast-holes, and the VOD of the selected explosive. As the powderfactor within a round design increases, the magnitude of theshock wave and the volume of high-pressure gases producedwithin the blast-hole increase. On detonation, these high-pressure gases penetrate the hangingwall resulting in thebreakout of the hanging. As rock type and geology play asignificant role in the extent of overbreak, these factors needto be taken into consideration during the selection ofexplosives and blast designs.
A study undertaken by Cunningham and Wilson (1991)on the comparative overbreak experienced through the use ofDynagel and ANFO explosives on a gold mining operationrevealed an average overbreak of approximately 18% forDynagel in comparison to approximately 33% for ANFO.Despite the similar VODs of Dynagel and ANFO explosives, agreater level of overbreak was experienced through the use ofANFO as a result of the overcharging of blast-holes(Cunningham and Wilson, 1991). This comparison illustratesthe importance in controlling the energy within the blast inorder to prevent overbreak. As higher VOD explosivesproduce a greater strain wave with a shorter period within theblast-hole, limited time is available for the penetration ofhigh-pressure gases into rock strata surrounding theexcavation. Higher VOD explosives can thus be appliedtogether with lower overall energy and reduced burden sizesin order to control the extent of damage to the hangingwall instoping operations (Lindsay, 1991).
Given their large width-to-height ratio, narrow-reefoperations are particularly sensitive to overbreak due to theadditional volume of rock that will be broken out as a resultof only minor levels of overbreak in the hanging (Brinkmann,1994). As overbreak is largely responsible for the liberationof waste, payable ore is diluted, decreasing the head gradeand increasing all expenses associated with the downstreamhandling and processing of ore (Prout, 2010; Swart, Human,and Harvey, 2004; Brinkmann, 1994). Through overbreak,mine infrastructure is indirectly allocated to the handling andprocessing of waste rock and the production of gold istherefore restricted. This increases expenses incurred throughactivities such as tramming, shaft expenses and timelimitations, mucking, and additional support requirements, allin proportion to the level of overbreak, thereby limitingpotential revenue through reduced gold production (Prout,2010; Cunningham and Wilson, 1991).
Due to ore processing inefficiencies, an increase in thevolume of rock processed to recover a specific quantity of
gold will in addition result in an increase in the total goldlosses incurred (Pickering, 2005). This is a result of goldbeing trapped within the larger volume of rock andconcentrate during the beneficiation process. As expensesrelated to the handling and processing of ore increase and theactual mass of gold extracted in the plant decreases, the effectof overbreak on the bottom line of a mining operation issignificant. ‘If mining width is not controlled the profitabilityof the mining operation will suffer’ (Pickering, 2005).
Theft of explosivesOne of the greatest factors driving the implementation ofClass 5.1 blasting agents within South African miningoperations is the theft of commercial explosives for use inillicit activities. As cartridged explosives are pre-sensitizedand easy to handle, they have become the preferred explosivefor use in activities such as ATM bombings and illegalmining. In an attempt to reduce the extent of crimescommitted with commercial explosives, the Inspector ofMines, under the auspices of the Department of MineralResources (DMR), has targeted the control of explosivesthroughout commercial blasting applications in an attempt toprevent the flow of Class 1.1 cartridged explosives frommines into the community. Despite the continued focus of thepolice on the theft of explosives and the increase in arrestsseen in recent years, levels of ATM bombings are still high,presenting an unacceptable risk to the community. Thistrend, as evident in Table II, has become one of the greatestmotivations behind the increase in Section 54 mine stoppagesexperienced in recent years.
Should the improper control of a Class 1 explosive on theoperation result in a Section 54 notice being issued to themine a significant loss in revenue will be incurred. As theaverage downtime experienced through a Section 54 notice is3.9 days and over this period three blasts are potentially lostper panel, the loss in revenue per notice totals 1.6% perannum. This equates to a loss in revenue of R815 298 perSection 54 per panel, thereby exceeding the total cost ofexplosives for the panel for the year.
As Class 5.1 blasting agents are not explosives untilsensitized at the face it is not possible for them to be used incriminal activities without the correct components andequipment required for their sensitization. As the use of thisequipment in such applications is highly implausible,criminals will continue to use pre-sensitized cartridgedexplosives until it is no longer possible to do so. The viscousnature of pumpable emulsions both before and after thesensitization process also prevents the relocation of
▲
494 JUNE 2015 VOLUME 115 The Journal of The Southern African Institute of Mining and Metallurgy
Table II
Number of ATM bombings per year in South Africa
Fiscal year Number of ATM bombings
2007/2008 4312008/2009 3872009/2010 2472010/2011 3992011/2012 251
(South Africa.info, 2012 and ISS, 2011)

sensitized emulsion without disturbing the chemicallyinduced nitrogen gas bubbles within the sensitized emulsion.As the disturbance of these gas bubbles would return theemulsion to its non-explosive state, it would again becomeundetonable and impossible to use in illicit activities.
Given the implications of explosives selection and theimportance of the leveraging effects of explosives asdiscussed above, the correct application of explosives throughcorrect drilling and blasting practices is fundamental to thesuccess of any blasting operation. As production personnelare often unaware of the broader implications of theirdecisions, significant financial implications often originate indaily blasting activities. The state of health of a miningoperation is determined by the effectiveness of daily drillingand blasting activities on the operation (Cunningham andWilson, 1991).
The development of new pump technology for tabularmining operationsPossibly the greatest challenge faced in the introduction ofpumpable emulsion systems to narrow-reef operations is themanagement of pump technology required for theirimplementation. As pumpable emulsions are transportedunderground as a Class 5.1 oxidizer, the ability to‘manufacture’ explosives in the underground environment isdetermined almost entirely by the reliability and consistencyof the equipment used in charging operations. While it iscomparatively simple to guarantee the quality of explosivesmanufactured at a central production facility, the ability toidentify ‘out of spec’ sensitized emulsion in undergroundoperations depends on the ability and training of the pumpoperator. Traditional emulsion charging units previouslyutilized for the implementation of pumpable emulsions onmechanized underground operations are complex machines,and as such necessitate the allocation and training of a
skilled technician with each unit in order to ensure the correctperformance of the charging unit.
Given the inflexibility of narrow-reef operations, a largenumber of pumps are necessary for the implementation ofpumpable emulsions on such operations. As a result it is nolonger possible for every portable charging unit (PCU) to beaccompanied by a trained technician to ensure the quality ofexplosive manufactured at the blast-face. With this in mind,the reliability of the PCU and its ability to deliver consistentsensitized emulsion without continual calibration weredeemed essential to the success of the project. Given the levelof skills and training within the workforce, safe operation ofthe pump technology was paramount throughout alloperating conditions and all possible failure modes. Allpossible risks were to be identified, and multiple fail-safemodes incorporated into the charging equipment design so asto eliminate the possibility of dangerous pumping conditions.
As technicians were no longer available during dailycharging operations, it would no longer be possible for skilledpersonnel to check the quality of explosive delivered to eachblast-hole during charging operations. For this reason adecision was made to remove the ability of individuals toadjust the manufacturing parameters of sensitized emulsionin the underground environment. In order to allow this totake place, it was essential that the charging equipmentdelivers consistent and repeatable results such that uniformsettings applied to all charging equipment would produceconsistent sensitized emulsion on all pumps in usethroughout the operation. This outcome needed to beachieved despite variable operating conditions that includedtemperature fluctuations and changing air or hydropowerpressure throughout the operation based on both workplaceand time of day.
Operation of the narrow-reef emulsion systemAs shown in Figure 4, the narrow-reef emulsion system hasbeen specifically designed for use in confined stopingoperations. The system utilizes re-useable bags to supply
The application of pumpable emulsions in narrow-reef stoping
The Journal of The Southern African Institute of Mining and Metallurgy VOLUME 115 JUNE 2015 495 ▲
Table III
Impact of Section 54 notices on gold mine revenue
Value per panel
Panel length (m) 30Panel height (m) 1.2Drilled length (m) 1.13Volume per blast (m3) 40.6Rock density (t/m3) 2.7Tons per blast 110Recovered grade (g/t) 6Gold recovered per blast (kg) 0.658Gold price ($ per oz) 1260Exchange rate R/$ 10.2Value per blast (R) 271 766
Loss of revenue – Section 54
Blasts per year (per panel) 192Revenue per year (per panel) (mill) 52.2Lost blasts per section 54 (per panel) 3Loss in annual revenue per Section 54 (per panel) R 815 298 1.6%
Loss of revenue – blast performance
1% failure of blasts as % of explosives costs R 2718 106%1 cm loss in advance as % of explosives costs R 2265 88%
Figure 4 – Portable pump as implemented in the Rand Uranium narrow-reef trial

The application of pumpable emulsions in narrow-reef stoping
emulsion and sensitizer to the pump, allowing the emulsionsystem to be used in previously inaccessible areas withinmining operations. The PCU has a weight of only 14 kg,allowing the pump to be carried by a single operator, and isable to deliver a fixed mass of explosive per blast-holethrough the activation gun on the charging lance. As the PCUutilizes sealed emulsion bags that do not require continuousre-filling by a charging assistant (such as in the case of opentanks), only a single operator is required for the operation ofthe PCU.
Distribution of emulsionBME’s Megapump emulsion is delivered to site in 30 ttankers and either stored in a silo on surface or pumpedthrough a vertical pipeline to an underground storage facility.When applicable, the emulsion is pumped into emulsiontransfer cassettes for transportation through the shaft beforebeing transferred into refilling stations at the entrance to theworking places. When required, emulsion bags can be refilledfrom the refilling stations and transported into the panel to beconnected to the PCU for loading the stope face. One on thegreatest advantages available through the use of the BMEPCU is the Closed Emulsion SystemTM used to deliveremulsion to the pump. By eliminating the use of polyethylenebags and open containers for the transportation of emulsionto the pump, the Closed Emulsion SystemTM is able toeliminate waste during the refilling of emulsion containersand while transferring emulsion into the PCU. In addition tothe considerable saving through the elimination of waste,BME’s Closed Emulsion SystemTM also acts to prevent rockand foreign objects from contaminating the emulsion,reducing the risk of damage to the PCU.
Key to the success of the Closed Emulsion SystemTM isthe high stability and long shelf life of BME’s Megapumpemulsion formulations. As Megapump can be pumped
multiple times without damaging the integrity of theemulsion, it is possible for it to be pumped through multipletransfer tanks before being pumped into emulsion bags fortransport to the blast-face. In addition, the high stability ofMegapump emulsion allows for it to be pumped through theshaft, reducing the shaft time necessary for thetransportation of explosives and increasing shaft availability.
The influence of equipment on the feasibility of thepumpable emulsion systemWhen considering the overall cost of an explosives system,three broad areas of costs need to be borne in mind. Thesethree areas include the direct costs of explosives; thelogistical, capital, and operating expenses for the system; andthe downstream implications of the explosive system on dailymining activities and revenue generation. While bulkpumpable explosives systems are able to offer a reduction inthe direct cost of explosives, logistics, and storagerequirements, and allow for increased levels of efficiencythroughout the mining cycle, initial capital is required for theprocurement of charging equipment and storage facilities. Inorder to justify the increase in capital expenditure requiredfor the implementation of the pumpable emulsion system, anadequate level of equipment utilization needs to be achievedin order to offset the costs incurred through the implemen-tation of the system. The importance of utilization in theoverall cost of the explosives system is illustrated in Figure 5.As the capital and maintenance expenses required for theimplementation of a charging unit increase, the utilization ofcharging unit also needs to increase in order to offset theincrease in fixed and operating expenditure. Although costswill vary for different mining operations, Figure 5 illustratesthe importance of maximizing the utilization of chargingequipment. Manufacturing and maintenance data used in thecalculation of the cost curves was obtained from original
▲
496 JUNE 2015 VOLUME 115 The Journal of The Southern African Institute of Mining and Metallurgy
Figure 5 – Effect of equipment utilization on the overall cost of explosives (calculation excludes explosives waste, initiation systems, and magazinefacilities)

equipment manufacturers (OEMs), and comparative labourand logistics costs include the cost of unit operators andtechnicians for mechanized equipment as well as theequipment necessary for the transport of explosivesthroughout the operation.
As charging equipment cannot easily be moved withinthe narrow-reef environment and blasts are limited in sizeand undertaken only once per day, the utilization ofequipment in the narrow-reef environment will be inherentlypoor. Under such conditions, the quantity of explosive thatcan be pumped through a charging unit will be limited to arange of 1 to 5 t per month, depending on the requirementsof the panel. In order to allow for the feasible implementationof the narrow-reef emulsion system, the system not onlyneeded to achieve the technical requirements discussedpreviously, but also needed to cost considerably less thantraditional charging equipment. For this reason design of thePCU was optimized on an ongoing basis such that manufac-turing and maintenance expenses could be reduced toacceptable levels.
ConclusionThrough the comparison of commercial explosives availablefor use in narrow-reef mining operations, a number ofimprovements in safety and operational efficiency have beenproposed through the implementation of pumpableemulsions. Arguably the greatest advantage of pumpableemulsions lies in their UN Class 5.1 classification. This classi-fication has less stringent requirements for legislation andcontrol than those applicable to Class 1 explosives, allowingfor considerable advantages throughout the transportationand storage of blasting intermediates. Additional advantagesof the non-explosive classification of the system are evidentin the prevention of the theft of explosives and thedownstream use of commercial explosives in criminalactivities. Class 5.1 blasting intermediates can be transportedwith other materials, saving tramming and shaft time as wellas allowing for longer storage periods underground.
The bulk nature of pumpable emulsions gives them anumber of advantages over pre-packaged explosives systems.Of greatest significance in the use of bulk explosives is thefull coupling of the explosive within the blast-hole. Throughfull coupling, pumpable emulsions are able to increase theenergy available at the toe of the blast-hole, as well as theefficiency with which shock energy is transmitted from theexplosive into the surrounding rock mass. From this study itis evident that pumpable emulsions are able to providenarrow-reef operations with increased levels of flexibility,efficiency, and control that are unavailable or limited throughthe use of alternative commercially available explosives. Thisincrease in performance and efficiency throughout the miningoperation renders pumpable emulsions a financially desirablealternative to existing explosives systems within the narrow-reef environment.
ReferencesBRINKMANN, J.R. 1990. An experimental study of the effects of shock and gas
penetration in blasting. Third International Symposium on RockFragmentation by Blasting, Brisbane Australia, 26-31 August 1990.
BRINKMANN, J.R. 1994. Controlled blasting and its impact on profits. School:Drilling and Blasting in the Narrow Reefs and their Effect on theProfitability of Gold Mines, Welkom, South Africa. South African Instituteof Mining and Metallurgy, Johannesburg.
CANADIAN INDUSTRIES LIMITED (CIL). 1968. Blasters Handbook. 6th edn. CILExplosives Division, Montreal.
CUNNINGHAM, C. and WILSON, J. 1991. Blast surveys: getting to grips withrealities at the rockface. Rescue ‘91: Survival Initiatives for the MiningIndustry, Welkom, South Africa, 16 June 1991. South African Institute ofMining and Metallurgy, Johannesburg.
DE GRAAF, W. 2010. Explosives. Drilling and Blasting 2010, Muldersdrift,South Africa, 8 June 2010. Southern African Institute of Mining andMetallurgy, Johannesburg.
DYNO NOBEL. 2006. Trench blasting with dynamite. Trench Blasting Guide.Dyno Nobel Inc. www.dynonobel.com
HUSTRULID, W.A. 1999. Blasting Principles for Open Pit Mining, General DesignConcept. AA Balkema, Rotterdam, Netherlands.
ISEE. 1998, Blasters Handbook. 17th edn. International Society of ExplosivesEngineers, Cleveland, Ohio.
ISEE. 2011. Blasters Handbook. 18th edn. International Society of ExplosivesEngineers, Cleveland, Ohio.
KRUGER, D. 2010. Blasting explosives for narrow reef stoping of gold. Drillingand Blasting 2010, Muldersdrift, South Africa, 8 June 2010. SouthernAfrican Institute of Mining and Metallurgy, Johannesburg.
LINDSAY, R.A. 1991. Improved explosives technology, has it been worth theeffort? Rescue ‘91. Survival Initiatives for the Mining Industry. SouthAfrican Institute of Mining and Metallurgy, Johannesburg.
MULKE, H.C. 1966. The measurement and analysis of the velocity of detonationof ANBA in small diameter drill holes. Thesis, University of theWitwatersrand.
PICKERING, R.B.G. 1996. Colloquium:.Deep Level Mining - the Challenges. SouthAfrican Institute of Mining and Metallurgy, Johannesburg.
PICKERING, R.G.B. 2004. .The optimization of mining method and equipment.International Platinum Conference: ‘Platinum Adding Value’, Sun City,South Africa, 3-7 October 2004. Symposium Series S38. South AfricanInstitute of Mining and Metallurgy, Johannesburg. pp. 111–116.
PEARTON, S. 2014. Evaluating the viability of pumpable emulsion explosives foruse in narrow reef mining operations. MSc Research Report. Departmentof Mining Engineering, University of the Witwatersrand.
PROUT, B. 2010. Choosing explosives and initiating systems for undergroundmetalliferous mines. Drilling and Blasting 2010, Muldersdrift, SouthAfrica, 8 June 2010. Southern African Institute of Mining and Metallurgy,Johannesburg
SAFFY, A.A. 1961. An experimental Investigation of the factors influencing theefficient use of explosives in short drill holes. Thesis, University of theWitwatersrand.
SPITERI, 1998. A new gereration Watergel explosive. Colloquium, Explosives –What’s New, University of the Witwatersrand, 29 July 1998. University ofthe Witwatersrand and South African Institute of Mining and Metallurgy.
SVARD, J. and JOHANSSON, C. 1999. How environmental and transport regulationswill effect blasting - explosives of the future. Fragblast 1999. SixthInternational Symposium for Rock Fragmentation by Blasting, 8-12August 1999. South African Institute of Mining and Metallurgy,Johannesburg. ◆
The application of pumpable emulsions in narrow-reef stoping
The Journal of The Southern African Institute of Mining and Metallurgy VOLUME 115 JUNE 2015 497 ▲

]® ®
® ®
®
®
Weir Minerals. Expertise where it counts.
®]® ®

IntroductionCorrosion is responsible for significanteconomic loss in all types of industries due toequipment failures and additional maintenancerequirements. It can be prevented or reducedby applying surface coatings to the metal. Theevaluation of a more corrosion-resistantsurface coating on 304L stainless steel is thesubject of this investigation.
It is well known that the corrosionresistance (electrochemical and pittingcorrosion) of all types of stainless steels issignificantly increased by alloying it with smallamounts of platinum group metals (PGMs)(Sherif et al., 2009). Ru is by far the leastexpensive metal of the PGM family andtherefore is most applicable in industry for thepassivation of stainless steels. It has beenobserved that the addition of small amounts ofRu improves the corrosion resistance ofstainless steel (Potgieter, Ellis, and vanBennekom, 1995). Bulk alloying is still con-sidered expensive, and since corrosion is asurface phenomenon, recent research (Lekala,van der Merwe, and Pityana, 2012) indicates atendency to add the alloy only to the surface,where corrosion protection is most required.
It is now generally known (Potgieter, Ellis,and van Bennekom, 1995) that during activecorrosion, ruthenium additions increase theresistance of stainless steel to anodicdissolution and lower the hydrogen over-potential. This implies that ruthenium inhibitsthe corrosion of the alloy by a combination ofthese two mechanisms. During activedissolution, ruthenium increases the corrosionpotential and lowers the critical as well as thepassivation current density. Potgieter, Ellis,and van Bennekom (1995) showed thatstainless steel alloyed with minor rutheniumadditions passivates spontaneously due to theformation of a stable passive surface layerwith a significantly increased corrosionresistance. This shifts the corrosion potentialof these alloys towards more noble (morepositive) values. The mechanism of corrosionalso depends on the medium of exposure.
Experimental procedure
Test materialsStainless steel 304L base-plate 5 mm inthickness was used as the substrate for all thetest samples. A mixture of 304L stainless steelpowder and ruthenium powder was used toclad the base-plate using a laser surface-cladding technique. The ruthenium powderwas added to the stainless steel powder invarying ratios to obtain target Ru contents inthe coating of 1 wt%, 2 wt%, 3 wt%, 4 wt%,and 5 wt%.
Corrosion resistance of laser-cladded 304Lstainless steel enriched with rutheniumadditions exposed to sulphuric acid andsodium chloride media by J. van der Merwe*† and D. Tharandt*†‡
SynopsisThe corrosion behaviour of 304L stainless steel laser-cladded with variousamounts of ruthenium (Ru) was evaluated in solutions of sulphuric acidand sulphuric acid plus sodium chloride at 25°C and 45°C by open-circuitpotential and cyclic potentiodynamic polarization tests. In general, theaddition of Ru to the stainless steel increased its corrosion resistance in 1 M H2SO4, as well as in 1 M H2SO4 plus 1 wt% NaCl. This was observedfor a number of parameters such as corrosion rate, corrosion potential,open-circuit potential, and current density. However, increasing theamount of Ru added beyond a certain level did not result in furtherimprovement in corrosion protection. For each environment there is anoptimal Ru concentration for the best corrosion protection. For example, in1 M H2SO4 at 25°C, 2.44 wt% Ru shows the least active surface in terms ofcorrosion. Further research into ruthenium coatings on stainless steels isrecommended.
Keywordscorrosion protection, ruthenium, laser cladding, 304 stainless steel.
* School of Chemical and Metallurgical Engineering,University of the Witwatersrand, Johannesburg,South Africa.
† DST/NRF Centre of Excellence for Strong Materials,University of the Witwatersrand, Johannesburg,South Africa.
‡ Worley Parsons, Johannesburg.© The Southern African Institute of Mining and
Metallurgy, 2015. ISSN 2225-6253. This paperwas first presented at the, Platinum Conference2014, 20–24 October 2014, Sun City South Africa.
499The Journal of The Southern African Institute of Mining and Metallurgy VOLUME 115 JUNE 2015 ▲
ISSN:2411-9717/2015/v115/n6/a5http://dx.doi.org/10.17159/2411-9717/2015/v115n6a5

Corrosion resistance of laser-cladded 304L stainless steel enriched with ruthenium additions
The plates were plasma-cut into approximately 40 x 60mm sections and cleaned with acetone before cladding. Thecladded portion was 20 x 30 mm, providing approximately600 mm2 of cladding. Figure 1A shows the stainless steelafter laser cladding, from which the samples were cut.
Laser surface alloying techniqueThe laser cladding was performed using a 4.4 kW Rofin
Sinar diode-pumped Nd:Y AG laser. The 1.064 μm radiationwas delivered via a 400 μm core diameter step index opticalfibre to a 200 mm focal length collimator. The collimatedbeam was focused with a 300 mm focal length lens. Theoptical assembly was mounted on a KIKA KR60L30HA six-axis articulated arm robot to control the welding process. Thelaser spot size was 2 mm in diameter. The stepover for all thesamples, i.e. the centre-to-centre distance of successive weldbeads, was 0.8 mm. The laser power used was 1200 W andthe scan speed was 2 m/min bi-directional. The carrier shieldgas was argon at a flow rate of 3 standard L/min.
The cladded plate was cut into a number of approximately5 x 5 mm samples for assessment of the alloyed surface andthe cross-sectional microstructure, as well as electrochemicaltests.
Scanning electron microscopy (SEM)The samples for SEM tests were mounted separately inBakelite® powder using a mounting press. Two samples foreach composition were mounted – one such that the alloyedsurface could be examined, and the second sample such thatthe cross-section of the weld could be examined. Thesamples were ground in stages to 1200 grit size using siliconcarbide paper, as were the samples for electrochemicaltesting. The samples were then polished using 3 μm diamondpowder on an automated polishing machine. The sampleswere cleaned with ethanol and dried with compressed air.The clean and dry samples were then electrolytically etchedin 10 wt% oxalic acid solution for 30 seconds. Themicrostructures were evaluated using a Zeiss Axiotech 25HD microscope. Figure 1B shows a mounted sample used formicroscopic evaluation.
SEM is a semi-quantitative method of chemical analysisthat provides only an indication of composition. The chemicalcomposition of the alloyed surface was measured by scanningits surface area as well as the cross-sectional area of thesample using the energy dispersive spectroscopy (EDS)capability of the Zeiss Sigma field emission SEM. EDS wasconducted at a working distance of approximately 8.5 mmand an acceleration voltage of 20.0 kV. The overallcomposition was determined by averaging the measuredcompositions.
Electrochemical testsThe samples prepared for electrochemical tests were cold-mounted in epoxy resin such that the alloyed surface wouldbe exposed to the corrosive environment. An example of a1200 grit ground sample, ready for testing, is shown inFigure 1C.
The electrochemical tests were conducted in an electro-chemical cell consisting of the working electrode (the cold-
mounted sample), a platinum counter-electrode, and asilver/silver chloride reference electrode. The electrochemicalpolarization measurements were carried out by an autolabpotentiostat. Nova software was used to simulate the testprocedures as well as to analyse the resultant potentio-dynamic polarization curves.
The potentiodynamic polarization procedure consisted ofthe following consecutive steps:➤ Open-circuit potential (E vs time) for 12 hours➤ Anodic scan from -500 mV to +1100 mV at a scan rate
of 1 mV/s➤ Polarization at -500 mV for 5 minutes➤ Anodic scan from -500 mV to +1100 mV at a scan rate
of 1 mV/s.The tests were conducted according to the ASTM G5
standard. The corrosive environment for each sample wasaltered by varying the medium and the temperature. The twosolutions used were 1 M sulphuric acid and 1 M sulphuricacid with 1 wt% sodium chloride. The samples were exposedat temperatures of 25°C and 45°C; the temperatures were keptconstant by a thermostat-controlled water bath.
Results and analysis
Energy dispersive spectroscopyThe compositions of the laser cladded surfaces, as obtainedby EDS, are shown in Table I.
▲
500 JUNE 2015 VOLUME 115 The Journal of The Southern African Institute of Mining and Metallurgy
Figure 1 – Samples used for the experimentation. A: laser-claddedbase-plate. B: mounted sample for microscopic evaluation. C: groundsample for electrochemical testing
Table I
Compositions of the laser-alloyed surfacemeasured by EDS
Ru (wt%)
Expected Sample Sample Sample Average area 1 area 2 area 3
1 0.72 0.16 - 0.442 0.84 0.79 - 0.823 2.90 3.22 2.65 2.924 1.81 1.80 3.70 2.445 5.24 4.19 4.57 4.67

The stainless steel base-plate was also analysed. Thecomposition is shown in Table II.
The EDS results show that the expected Ru compositionswere not attained on all samples, and the composition variedsignificantly between different areas on the same sample.This is a result of the actual cladding procedure, since thevariation of the base-plate composition was negligible. Onsome samples, ruthenium-rich stringers were observed wherethe ruthenium was well mixed with the stainless steel
powder; in those areas the Ru concentration was very close tothat expected. In other areas Ru islands were observed wherethe Ru concentration was up to 100 wt%. A consistentcoating thickness was obtained, but the coating was nothomogeneous at higher Ru concentrations and could thus notproduce a consistent protective layer. Figures 2 and 3 showexamples of the images obtained and analysed; the whitespots represent pure Ru. The average compositions of thesecladded samples are given in Table III.
Electrochemical testingA number of parameters were used to indicate corrosionresistance. These included the corrosion rate (mm/a); theobserved corrosion potential, Ecorr (V); the passivationexchange current density, ipass (A/cm2); the open-circuitpotential, OCP (V); and the critical exchange current, icrit (A).
1 M H2SO4 solution at 25°C
Increasing the Ru concentration within the cladded layer wasexpected to improve corrosion resistance. From the log i vs Ecurve (Figure 4) it is evident that small additions of Ru to thestainless steel surface protect in 1 M H2SO4 solution. Thepassivation current density for the samples containing Ru isorders of magnitude smaller than when no Ru is added.However, passivation does not occur over a large potentialrange at a specific current density normally associated with astable protective film on the surface. For samples with Rucladding, the current density increases in this passivationregion as the potential increases until the transpassivepotential is reached. The expected step increases withincreasing Ru concentration are not evident. Averaging allthe results and looking at a combination of all the above-mentioned parameters for corrosion protection, a very clearranking order is observed. The order of decreasing corrosionresistance in 1 M H2SO4 solution at ambient temperatures is2.44 wt%, 0.82 wt%, 2.92 wt%, 4.67 wt%, 0.44 wt%,stainless steel blank, and 0 wt% Ru.
The stainless steel blank sample (no cladding) shows atypical curve with distinct active, passive, and transpassiveregions. The cladded sample with no Ru added indicates verylow corrosion resistance in this environment, with a moreactive corrosion potential indicating that a welded regionwould be more susceptible to corrosion, as expected. At 0.44wt% Ru, the benefit of corrosion protection can be seen, andat higher Ru concentrations more noble corrosion potentialsare seen, indicating the formation of a more stable passivelayer.
Samples that exhibited high corrosion potentials had alesser tendency to corrode since a high potential energy isrequired to break down or corrode the alloy. High positive
Corrosion resistance of laser-cladded 304L stainless steel enriched with ruthenium additions
501The Journal of The Southern African Institute of Mining and Metallurgy VOLUME 115 JUNE 2015 ▲
Table II
Composition of the 304L stainless steel base-plate, wt%Fe 71.0Ni 8.0Cr 19.1Mn 1.4
Table III
Compositions of the cladded samples in Figures 2 and 3, wt%
Sample Fe Ni Cr Si Mn Ru
3 wt% Ru surface 66.26 9.81 18.91 0.79 1.58 2.665 wt% Ru cross-section 64.41 9.53 18.39 0.83 1.60 5.24
Figure 3 – Cross-section of the laser-cladded 5 wt% Ru sample
Figure 2 –Surface of the laser-cladded 3 wt% Ru sample

Corrosion resistance of laser-cladded 304L stainless steel enriched with ruthenium additions
potentials are an indication of spontaneous passivation of thesurface of the sample (Papavinasam, 2013). From the trendshown in Table IV, it is clear that the maximum corrosionprotection is attained at 2.44 wt% Ru, closely followed by0.82 wt% Ru (both of which indicated spontaneous
passivation), then 4.67 wt% Ru, 2.92 wt% Ru, 0.44 wt% Ru,no Ru, and finally the stainless steel blank.
Figure 5 shows that a stable potential was achieved overa short period of time; most notably for the 2.44 wt% Rusample. The attained potentials with Ru addition were in the
▲
502 JUNE 2015 VOLUME 115 The Journal of The Southern African Institute of Mining and Metallurgy
Figure 5 – OCP graphs after exposure to 1 M H2SO4 at 25°C
Figure 4 – Log i vs E example curves for different Ru compositions in 1 M H2SO4 at 25°C
Table IV
Indicators of corrosion rates using average sample measurements
Sample Ecorr obs (mV) jcorr (nA/cm2) Polarization resistance Corrosion rate (mm/a) OCP (mV)
(kΩ)
SS blank -257 47393 11.4 0.551 -120 wt% Ru -243 287344 3.3 3.841 -2420.44 wt% Ru -222 14254 23.3 0.166 1340.82 wt% Ru 77 776 322.1 0.009 3052.44 wt% Ru 134 587 826.8 0.007 2042.92 wt% Ru 121 1409 290.4 0.016 3364.67 wt% Ru 15 57109 309.3 0.081 234

noble po-tential region. Higher, positive OCPs were obtainedwith increasing Ru, peaking at 2.92 wt% Ru, followed by0.82 wt%, 4.67 wt%, 0.44 wt%, and 2.44 wt% Ru.
1 M H2SO4 + 1 wt% NaCl solution at 25°C
Addition of sodium chloride to the sulphuric acid solutionincreased the corrosivity of the environment due to thechloride ions attacking the passive layer formed on thesurface of the cladded material. A clearer relationshipbetween increasing Ru concentration and improved corrosionprotection became evident. Figure 6 shows that the corrosionpotential increased with increasing Ru content. The presenceof chloride ions in the solution accelerated the damage to thepassive layer.
The effects of variations in Ru concentrations in thesamples were also observed in the tests with the acid and saltsolution. Table V shows a slightly different trend with regardto specific corrosion protection values, but clearly indicatesthat cladding with stainless steel alone, without any Ru,decreases corrosion resistance, while increasing the amountof Ru added improves the corrosion protection significantly in1 M H2SO4 with 1 wt% NaCl. Samples with 0.44 and 2.44wt% Ru addition were damaged during the experimentalstage and no further results could be obtained from these.
The attained open-circuit potentials were negative only
for the cladding without Ru and the stainless steel blanksamples, while the addition of Ru brought them into thenoble region The clear trend is, in order of increasingcorrosion protection: 0 wt% Ru, stainless steel blank, 0.82wt% Ru, 2.92 wt% Ru, and 4.67 wt% Ru.
1 M H2SO4 + 1 wt% NaCl solution at 45°C
At higher temperature (45°C) in an acid environment withthe presence of chloride ions there was no significantimprovement in corrosion resistance with increasing Rucontent. The stainless steel blank as well as the 0 wt% Rusample behaved similarly, and all samples containing Rubehaved very similarly, as can be seen from Figures 7 and 8.A notable improvement in corrosion protection is observedwith the addition of 0.82% Ru, but no additional benefit wasobserved at higher Ru contents.
DiscussionThe laser cladding method appears to have resulted in lowerRu compositions in the cladding than in the powder used.Although a uniform coating depth of almost 1 mm wasobtained, Ru distribution was not uniform. The highvariability of the Ru content of the cladding is the most likelycause of the variability of the electrochemical results, sinceeach fresh surface exposed had a slightly different
Corrosion resistance of laser-cladded 304L stainless steel enriched with ruthenium additions
The Journal of The Southern African Institute of Mining and Metallurgy VOLUME 115 JUNE 2015 503 ▲
Table V
Indicators of corrosion rates using average sample measurements
Sample Ecorr obs. (mV] jcorr (nA/cm2] Polarization resistance Corrosion rate (mm/a) OCP (mV0
(kΩ)
SS blank -336 256383 0.34 2.98 -3570 wt% Ru -352 461480 0.20 5.36 -3650.82 wt% Ru -269 551340 4.74 6.41 542.92 wt% Ru -239 48370 4.06 0.56 1144.67 wt% Ru -193 13089 20.78 0.15 192
Figure 6 – Log i vs E example curves for different Ru compositions in 1 M H2SO4 plus 1 wt% NaCl at 25°C

composition and structure. Repeatable results were obtainedwith the stainless steel blank sample, but the claddingintroduced significant variability. As can be seen fromFigures 2 and 3 as well as Table I, the Ru concentration ishighly variable between specific small areas within the plate.It should be noted that the EDS results are only for comparingthe various samples – EDS is by no means the most accuratemethod for determining chemical composition.
The polarization curves clearly indicate an improvedcorrosion resistance with the addition of Ru in 1 M H2SO4
and 1 M H2SO4 plus 1 wt% NaCl, especially at higher temper-atures. The reason for this is as follows. Since the over-
potential of the standard hydrogen reduction reaction is low,the addition of Ru shifts the equilibrium reaction to moreactive potentials, and this shift is sufficient in a reducingmedium to move the system into the passive region and thusreduce the actual corrosion rate of the sample. McGill (1990)also observed this initial rapid corrosion of stainless steelfollowed by passivation in non-oxidizing acid media such assulphuric acid (H2SO4). The solution concentration is critical,as too high a concentration results in no passivation since thedissolution rate is too fast (McGill, 1990). Potgieter andBrookes (1995) observed that adding too small an amount ofRu can increase corrosion rates as it increases the efficiency
Corrosion resistance of laser-cladded 304L stainless steel enriched with ruthenium additions
▲
504 JUNE 2015 VOLUME 115 The Journal of The Southern African Institute of Mining and Metallurgy
Figure 8 – OCP graphs after exposure to 1 M H2SO4 plus 1 wt% NaCl at 45°C
Figure 7 – Log i vs E example curves for different Ru compositions in 1 M H2SO4 plus 1 wt% NaCl at 45°C

of the cathodic hydrogen reaction. Therefore, passivation isinduced only if the passivation potential of the PGM-metalalloy is less than the overpotential of the hydrogen evolutionreaction on the alloying PGM. Potgieter and Brookes (1995)conclude that there is a maximum amount of ruthenium thatcan be added to stainless steel to increase corrosionresistance, beyond which no further improvement is gained.The actual amount depends on the exposure medium andtemperature. This is corroborated by the results of the currentinvestigation.
The OCP was expected to increase with time as theformation of a passive region occurs by the dissolution ofoxides that accumulate into a protective layer. Ruthenium isexpected to become concentrated on the surface as the othercomponents oxidize, thereby stabilizing the protective layerby preventing it breaking down. It was thus expected thatincreasing the Ru content would increase that stabilizingeffect, consequently increasing the resistance of the materialto corrosion. OCP values of the claddings containing Ru werein the positive region, but did not simply increase withincreasing Ru content. There is a definite optimal Ru concen-tration for a particular environment.
It is important in the development of any new product oralloy to ensure that it is cost-effective, or there will be onlyvery limited scope for application. In this case, the variouscompositions of ruthenium in the stainless steel need to beevaluated for cost-effectiveness and compared to otherexisting materials offering similar levels of corrosionprotection. The cost of only the ruthenium metal was takeninto account for this evaluation. A 5 wt% Ru coating isrequired, and it could only be 100–200 μm thick if it were toreplace a 316 stainless steel or SAF2205. Such thickness isdifficult to achieve at this stage with the laser claddingprocess. If a 3 wt% Ru coating was sufficient, it could be upto 500 μm thick to compete with SAF2205 on the materialcosts only. This thickness can be achieved more easily withthe laser cladding. A different cladding technique needs to beinvestigated in order to reduce the thickness of the appliedruthenium alloy. Hastelloy C276, on the other hand, is soexpensive that almost any quantity of ruthenium alloyed with304L stainless steel would be cost-effective providing that itcan demonstrate equivalent corrosion protection. Therefore,especially for smaller components, this technology could bevery beneficial and improve the lifespan considerably.
Conclusions
➤ The laser surface cladding method was successfullyused to add small amounts of ruthenium to a stainlesssteel cladding in a non-porous and well-adhered layerof uniform thickness. The variability in terms ofchemical composition and ruthenium distribution in thecladding need to be improved in future studies.
➤ The addition of Ru to the stainless steel increased itscorrosion resistance in 1 M H2SO4, as well as in 1 MH2SO4 plus 1 wt% NaCl. This was observed for anumber of variables such as corrosion rate, corrosion
potential, OCP, and current density.➤ Corrosion protection did not improve with increasing
additional of Ru beyond a certain level. There is anoptimal Ru concentration to be added for a specificenvironment. By averaging the results a clear rankingorder is obtained: for the 1 M H2SO4 solution at 25°Cthe order of increasing corrosion protection is 0 wt%,0.44 wt%, 2.92 wt%, 4.67 wt%, 0.82 wt% and best at2.44 wt%. The addition of 1 wt%NaCl changes that to 0 wt%, 0.82 wt%, 2.92 wt% and 4.67 wt%Ru.
➤ Chloride ions attack the passive layer formed onstainless steel, increasing the corrosion rate. This isalso applicable to the Ru-cladded samples, even thoughcorrosion protection is substantially improved.
➤ Increasing the temperature of the 1 M H2SO4 plus1 wt% NaCl environment to which the samples wereexposed increased the corrosivity. Test results showedthat the passive layers formed were stable as thetemperature increased. A notable improvement in cor-rosion protection is observed with the addition of Ruunder these conditions, but adding Ru above a certainlevel does not result in any additional benefit for theRu range observed.
➤ Ruthenium-cladded samples behaved differently indifferent environments, and hence their applicationshould be carefully selected and evaluated againstavailable types of stainless steel.
References
LEKALA, M.B., VAN DER MERWE, J.W., and PITYANA, S.L. 2012. Laser surface
alloying of 316L stainless steel with Ru and Ni mixtures. International
Journal of Corrosion, vol. 2012. pp. 1–4.
MCGILL, I.R. 1990. Platinum metals in stainless steels – a review of corrosion
and mechanical properties. Platinum Metals Review, vol. 34. pp. 85–97.
PAPAVINASAM, S. 2013. Corrosion Control in the Oil and Gas Industry. Elsevier,
Amsterdam. Chapter 2. pp. 49.
POTGIETER, J.H. and BROOKES, H.C. 1995. Corrosion behavior of a high-chromium
duplex stainless steel with minor additions of ruthenium in sulfuric acid.
Corrosion Engineering, vol. 51, no.4. pp. 312–320.
POTGIETER, J.H., ELLIS, P., and VAN BENNEKOM, A. 1995. Investigation of the active
dissolution behaviour of a 22wt% chromium duplex stainless steel with
small ruthenium additions in sulphuric acid. ISIJ International, vol. 35. pp.
197–202.
SHERIF, EL-SAYED M., POTGIETER, J.H., COMINS, J.D., CORNISH L.A., OLUBAMBI P.A.,
and MACHIO C.N. 2009.Effects of minor additions of ruthenium on the
passivation of duplex stain-less-steel corrosion in concentrated
hydrochloric acid solutions. Journal of Applied Electrochemistry, vol. 39.
pp. 1385–1392. ◆
Corrosion resistance of laser-cladded 304L stainless steel enriched with ruthenium additions
The Journal of The Southern African Institute of Mining and Metallurgy VOLUME 115 JUNE 2015 505 ▲

Outotec provides leading technologies and services for the sustainable use of Earth’s natural resources. As the global leader in minerals and metals processing technology, we have developed many breakthrough technologies over the decades for our customers in metals and mining industry. We also provide innovative solutions for industrial water treatment, the utilization of alternative energy sources and the chemical industry. www.outotec.com
For the whole story, please visit our YouTube channel.
IntroductionProducers of nickel and copper have beenpartially roasting concentrates to reduce levelsof sulphur and volatile impurities such asarsenic, antimony, and lead for many years(US Environmental Protection Agency, 1995).At Sudbury (Glencore) and Thompson (ValeInco), concentrate is roasted in fluidized beds(two at each plant) before smelting. The gratediameters of the roasters at Sudbury are 5.6
m, and the freeboard 8 m, while the gratediameters at Thompson are 5.5 m, and thefreeboard 6.4 m. The expanded freeboardbegins 6.5 m above the grate (Warner et al.,2007). The roasters at Thompson processapproximately 50 dry t/h of concentrate. Thebed temperatures of the roasters at Thompsonand Sudbury are respectively 600°C and760°C. Both roasters operate under oxidizingatmospheres of air or oxygen-enriched air.Approximately 40% of the sulphur is removedfrom the concentrate at Thompson, and 70%at Sudbury (Pandher and Utigard, 2010).
Roasting can in principle be applied toPGM concentrates, which besides gangueminerals (mostly minerals in the pyroxenegroup) comprise pyrite (FeS2), pyrrhotite(Fe1–xS), chalcopyrite (CuFeS2), andpentlandite ([Ni,Fe]9S8). The base metalsulphides are the very same minerals roastedin the copper and nickel industries. In theConRoast process developed at Mintek, PGMconcentrates are dead-roasted to remove all ofthe sulphur (Jones, 1999). Subsequentsmelting under reducing conditions producesa Cu-Ni-bearing alloy, which collects thePGMs. Many of the aims of roasting could bemet by partially oxidizing the base metalsulphides. Partial roasting would desulphurizethe concentrate, oxidize some or most of theiron, and the roasted concentrate would stillproduce a matte.
Fire and brimstone: The roasting of aMerensky PGM concentrateby R.I. Rambiyana*, P. den Hoed†, and A.M. Garbers-Craig‡
SynopsisFour sulphide minerals – pyrite (FeS2), pyrrhotite (Fe1–xS), pentlandite([Ni,Fe]9S8), and chalcopyrite (CuFeS2) – contain the base metals andmost of the iron in concentrates of platinum group metals (PGMs). In thepyrometallurgical processing of PGM concentrates these sulphides form amatte during smelting, and iron and sulphur are removed from the matteduring the converting process. This paper discusses the roasting ofMerensky concentrate in air before smelting, with the purpose of reducingthe matte load to the converter.
Roasting tests were conducted in a bench-scale rotary kiln at temper-atures from 350°C to 700°C. The concentrate tested contained 17.4%sulphur and consisted of 23% pyrrhotite, 16% pentlandite, 11%chalcopyrite, and 2% pyrite. The particles were fine (d50 = 22 μm), and allthe sulphide particles were liberated. Roasting in air at 550°C and 650°C for20 minutes removed respectively 60% and 70% of the sulphur. The iron inthe sulphides was oxidized to Fe3O4 (magnetite) at temperatures below500⁰C and to Fe2O3 (haematite) at temperatures above 550⁰C. At 700⁰C thebed sintered and copper oxides formed. At temperatures below 450°Coxidation was incomplete: pyrrhotite remained and only 30% of thesulphur was removed. Smelting tests were conducted to assess matte falland the deportment of copper and nickel to matte. It was evident thatroasting resulted in lower matte falls (a drop of approximately 60%)compared with matte falls from unroasted concentrate. The iron andsulphur levels in the matte were reduced to below 3.5% and 22% respec-tively.
This paper also briefly describes the mechanisms by which pyrrhotite,chalcopyrite, and pentlandite are oxidized during roasting. Forchalcopyrite, the mechanism proceeds through an intermediate solidsolution phase, which extends from Cu1.02Fe1.04S2 to Cu2.04Fe0.72S2 to acopper-rich solid solution of bornite (Cu4Fe1.4S4–Cu2S). The oxidation ofpentlandite proceeds through a monosulphide solid solution(Ni0.39Fe0.53S–Ni0.74Fe0.15S) to a solid solution of heazlewoodite([Ni,Fe]3±xS2). These mechanisms are explored in relation to chemicalthermodynamics and microstructures.
Keywordsroasting, PGM, concentrate, pyrrhotite, pentlandite, chalcopyrite, smelting,matte, base metal.
* Centre for Pyrometallurgy, Department ofMaterials Science and Metallurgical Engineering,University of Pretoria, now working for AngloAmerican Platinum.
† Anglo American Technical Solutions.‡ Centre for Pyrometallurgy, Department of
Materials Science and Metallurgical Engineering,University of Pretoria.
© The Southern African Institute of Mining andMetallurgy, 2015. ISSN 2225-6253. This paperwas first presented at the, Platinum Conference2014, 20–24 October 2014, Sun City South Africa.
507The Journal of The Southern African Institute of Mining and Metallurgy VOLUME 115 JUNE 2015 ▲
ISSN:2411-9717/2015/v115/n6/a6http://dx.doi.org/10.17159/2411-9717/2015/v115n6a6

Fire and brimstone: The roasting of a Merensky PGM concentrate
This study focused on partial roasting of a Merenskyconcentrate. It examined how the conditions of roastingaffect the degree of desulphurization, which phases form,how these phases affect matte fall, and the deportment ofbase metals to the matte. Mechanisms for the oxidation ofpyrrhotite, pentlandite, and chalcopyrite were alsodetermined.
Experimental
Sample
The concentrate sample — a product of flotation —originated from the Merensky Reef in Limpopo Province,South Africa. The bulk modal analysis of the concentrate, asdetermined with a Mineral Liberation Analyser (MLA), isgiven in Table I. The main sulphide minerals present in theconcentrate were pyrrhotite (Fe1–xS), pentlandite([Ni,Fe]9S8), and chalcopyrite (CuFeS2); together accountingfor 50.1% of the mass of the concentrate. The metalsulphides in sub-samples showed a degree of variation withrespect to phase compositions (Rambiyana, 2015). Attachinga fixed set of conditons to a degree of oxidation is thereforeproblematic.
Procedure
Roasting tests were conducted in a rotating-tube furnace(Figure 1). This reactor provided good gas-solid mixing andcontact for the duration of a test and readily dissipated heatfrom the exothermic reactions. The furnace was fitted with aquartz work tube, 100 mm in internal diameter and 1150mm long. The work tube was externally heated, whichresulted in a hot zone of 550 mm. The tube was fitted withlifters to ensure good gas-solid mixing and contact. Theroasting tests were conducted under isothermal conditions attemperatures ranging from 400°C to 650°C and a residencetime of 20 minutes. The work tube was purged with air at aflow rate of 42 NL/min. Roasting was conducted with thereactor run in continuous mode.
The sulphation reactions were tested in an angularreciprocating capsule that was heated in a horizontal split-shell furnace. This capsule rotated about its longitudinalaxis, but alternated between clockwise and anticlockwise(Figure 2). The capsule had an internal diameter of 44 mm,a working zone of 120 mm, and a volume of 954 cm3. It wasalso fitted with lifters. The temperature of the bed wasmeasured with a K-type thermocouple. Tests were carriedout on 50 g samples held at 500°C under controlledatmospheres (air at 1 and 2 bar) for one hour. The pressurein the capsule was recorded for the duration of the tests. Thecapsule provided 0.0148 moles of oxygen for every 1 bar ofpressure. Smelting tests were conducted in a vertical-tubefurnace. The mullite work tube had an internal diameter of80 mm and a hot zone of 150 mm. Unroasted concentrate,concentrate roasted at 550°C, and concentrate roasted at650°C were smelted in alumina crucibles. A flux consisting
▲
508 JUNE 2015 VOLUME 115 The Journal of The Southern African Institute of Mining and Metallurgy
Table I
Mineral composition of the Merensky concentrate(bulk modal analysis)
Mineral Mass %
Base metal sulphidesPyrrhotite (Fe1–xS) 22.9Pentlandite ([Ni,Fe]9S8) 16.0Chalcopyrite (CuFeS2) 11.2Pyrite (FeS2) 2.0Bornite (Cu5FeS4) 0.1Other sulphides 0.2
GangueEnstatite (Mg2Si2O6) 30.6Other 16.9
Figure 1 – View of the rotating-tube furnace (RTF)
Figure 2 – View of the angular reciprocating capsule (ARC)

of 10 g Al2O3 and 10 g CaO for every 100 g of concentratewas added to the charge. The charge was mixed well andsmelted at 1500°C for 30 minutes. The sample was furnace-cooled.
Analytical techniques
The products of roasting and smelting were examined andanalysed by an array of techniques. These included X-raydiffraction analysis (XRD); scanning electron microscopy(SEM), using energy dispersive spectrometry (EDS); quanti-tative evaluation of minerals by scanning electronmicroscopy (QEMSCAN); and quantification of the amount offerromagnetic material. XRD analysis was performed with aPANalytical X’Pert Pro powder diffractometer in θ–θ configu-ration with an X’Celerator detector and variable divergenceand receiving slits. The radiation was Fe-filtered Co-Kα(λ=1.789 Å). Phases were identified by means of X’PertHighscore Plus software. SEM-EDS was performed with aMineral Liberation Analyser to identify phases and analysetheir compositions. QEMSCAN-EDS was used to createmineral maps of the samples. The percentage ferromagneticmaterial was determined with a Satmagan 135 (RapiscanSystems). This instrument measures the ferromagneticsignal from a sample and correlates it with magnetitecontent.
Results
Roasting mechanisms
Roasting tests focused on two temperatures, 450°C and650°C. These temperatures were chosen based on datapublished in the literature for the pertinent systems Fe-Ni-Sand Fe-Cu-S. Rates of oxidation are too slow at temperaturesbelow 400°C, while particles sinter and stick to the wall ofthe work tube at temperatures above 700°C. Tests were runin air at temperature for residence times ranging fromseveral minutes to 25 minutes. Most tests were run with thesample passing through the kiln in 20 minutes. The phasechemistry of the roasted samples was analysed using SEM-EDS and XRD. By combining the conditions of roasting andphase chemical results with phase diagrams and thermo-chemical data, the mechanisms for the oxidation of the threeprimary sulphide minerals in the PGM concentrate werepostulated.
Pyrrhotite (Fe1–xS)
Pyrrhotite reacted with oxygen to form iron oxide. Thisreaction was rapid compared with the oxidation of the basemetal sulphides. In the 400—650⁰C temperature rangepyrrhotite disappeared within 20 minutes. Chemical thermo-dynamics predicts that oxidation should result in theformation of Fe2O3 (haematite) (Muan and Osborn, 1965:Figure 12). However, Fe3O4 (magnetite) formed as anintermediate phase. These observations are consistent withthe assumption that in the temperature range 400–650⁰C,
the oxidation of Fe3O4 to Fe2O3 is relatively slow and thatthe oxidation rate increases with temperature. At temper-atures below 500°C oxidation did not proceed much beyondFe3O4. As temperatures increased from 500°C to 650°C,increasing amounts of Fe2O3 formed and less Fe3O4. Thereaction occurred at the interface between pyrrhotite (Fe1–xS)and the iron oxide. The reaction might proceed by means ofa shrinking core but, given that the pyrrhotite is porous, itmight occur at several loci within each particle.
As the conversion of Fe3O4 to Fe2O3 also occurred duringthe oxidation of the base metal sulphides, it is discussed inmore detail in a subsequent section of this paper. This‘duplex layer’ has been observed in other studies on theroasting of base metal sulphides (Xia, Pring, and Brugger,2012).
Chalcopyrite (CuFeS2)
Chalcopyrite particles in the initial stages of oxidation had
Fire and brimstone: The roasting of a Merensky PGM concentrate
509The Journal of The Southern African Institute of Mining and Metallurgy VOLUME 115 JUNE 2015 ▲
Figure 4 – Backscattered electron (BSE) image of bornite(ss) occupyinga core that was formerly chalcopyrite. 1 - Cu5.77Fe0.24S4
Figure 3 – Backscattered electron (BSE) image of bornite(ss) around acore of chalcopyrite. 1 - Cu0.9Fe0.98S2; 2 - Cu4.73Fe0.94S4

Fire and brimstone: The roasting of a Merensky PGM concentrate
compositions at the iron-rich end of the bornite solid-solution series. Chalcopyrite occupied a core that shrunk asbornite(ss) developed around it (Figure 3). Iron oxide (Fe2O3
or Fe3O4) formed on the surface of the bornite(ss). Thedisappearance of chalcopyrite was rapid. Further oxidationproceeded by the reaction of oxygen with iron and sulphur inbornite(ss), which retained its structure but becameincreasingly depleted in iron and (somewhat less) in sulphur(Figure 4). It was difficult to accurately determine thechange in bornite(ss) phase compositions radially with SEM-EDS, as the particles were too fine. It is therefore not clearwhether the chalcopyrite disappeared before bornite(ss)started to oxidize. Cu-rich end-members of the bornite(ss)were not detected with chalcopyrite cores in a particle.Reactions were faster at higher temperatures. Chalcopyritedisappeared after roasting for 20 minutes at 450°C and650°C. However, the bornite(ss) was richer in copper athigher temperatures and richer in iron at lower temperaturesafter 20 minutes. This empirical evidence is in disagreementwith the phase relations in the system Fe-Cu-S (Rambiyana,2015). An intermediate solid solution (iss) was found to bestable at temperatures above 400°C, occupying a region ofthe phase diagram between CuFeS2 (chalcopyrite) and thebornite(ss). The presence of iss could not be confirmed inthis study.
Pentlandite ([Ni,Fe]9S8)
An initial rapid reaction resulted in pentlandite losing ironthrough oxidation to Fe3O4 and transforming into the mss(monosulphide solid solution) phase, which became progres-sively depleted in iron through further oxidation. Anindividual particle could exhibit variable compositions of themss phase (Figure 5). More Fe3O4 (magnetite) formed andwas oxidized to Fe2O3. The Ni-rich mss finally becameunstable and underwent a structural change to heazle-woodite (ss). This agrees with the work of Zamalloa and
Utigard (1996), who identified (Ni,Fe)3±xS2 (heazlewoodite)in particles roasted at 747⁰C. This reaction sequence wasobserved at all temperatures above 400⁰C. Pentlanditedisappeared after 10 minutes at all temperatures above400⁰C. Heazlewoodite (ss) appeared after 20 minutes attemperatures above 650⁰C.
The absence of sulphates
The formation of sulphates during roasting is undesirable assulphates retain sulphur. Sulphate formation can, however,be avoided by considering the thermodynamic relationsdepicted in the predominance diagrams of Fe-Ni-S-O and Fe-Cu-S-O. High partial pressures of SO2 and O2 tend tostabilize the metal sulphates FeSO4 and Fe2(SO4)3. To avoidthe formation of sulphates during roasting of base metalsulphides, pSO2 should therefore be kept low (<1%).However, higher partial pressures of SO2 may be establishedinadvertently – fixed beds of fine particles promote high SO2
partial pressures within the bed, as SO2 is unable to diffuserapidly to the free surface of the bed. Examples includeparticulate beds contained in crucibles or boats used inthermogravimetry and in work utilizing muffle furnaces.Disturbing the bed frees the ‘trapped’ SO2. This was
▲
510 JUNE 2015 VOLUME 115 The Journal of The Southern African Institute of Mining and Metallurgy
Figure 5 – Backscattered electron (BSE) image of a particle of mss andiron oxide after oxidation (formerly pentlandite). 1 - Ni0.69Fe0.18S; 2 -Ni0.78Fe0.12S; 3 – Fe oxide rim
Figure 6 – TG-DTA curves of Merensky concentrate roasted in air andargon (heating rate 5°C/min)
Figure 7 – Change in pressure and temperature in the angular recipro-cating capsule during the roasting of Merensky concentrate

accomplished in the rotating-tube furnace by the action ofthe lifters in the work tube. Compressed air was also forcedin at the feed end of the work tube and extracted by meansof an extraction duct inserted at the discharge end. A highpO2 and a low pSO2 were therefore maintained in the tube.No sulphates were detected in any of the products from testsconducted in the rotating-tube furnace. Roasting ofconcentrate in a thermobalance and the angular recipro-cating capsule, however, produced metal sulphates, asindicated by a gain in mass shown by the thermobalance(Figure 6). The sample started to gain mass from approxi-mately 350°C, and the gain became significant between400°C and 620°C (Figure 6). It is at these temperatures,under high SO2 partial pressures, that metal sulphates canbe expected to form. At temperatures greater than 620°C thesample lost mass. This loss is associated with the decompo-sition of sulphates, which are thermodynamically unstable athigh temperatures. The temperatures for the thermaldecomposition of ferrous sulphate, copper sulphate, andnickel sulphate are reported in the literature (Kolta andAskar, 1975). The two peaks in the TG curve — one at725°C, the other at 830°C — indicate the decomposition ofdifferent sulphates at their respective thermal stability limits.
Sulphates were also formed in the angular reciprocatingcapsule, as high SO2 partial pressures were established bymaintaining a closed system. The pressure in the capsuleincreased while the capsule was being heated to temperature(Figure 7). The initial increase in pressure can be attributedprincipally to the thermal expansion of gas (air) in thefreeboard. The pressure dropped when the temperatureexceeded approximately 200°C, and the final recordedpressure was lower than the pressure in the system at thebeginning of the test. From these measurements, and froman understanding of the conditions that promote sulphate
formation, it can be concluded that oxygen was withdrawnfrom the gas phase and reacted with the sulphides to formsulphates.
Sulphur removal and the formation of iron oxides
The primary objective of roasting is to lower the levels ofsulphur in a concentrate. A second objective is the prefer-ential oxidation of iron in the base metal sulphides so thatthe iron can be removed in the slag phase during smelting.Iron is oxidized to either Fe2O3 or Fe3O4. Where possible,magnetite formation should be avoided as iron-bearingspinels form a viscous intermediate layer between the matteand slag layers during smelting. This viscous layer results inincreased levels of matte entrainment in, and PGM losses to,the slag. The build-up of Fe3O4 or other spinels duringsmelting also reduces furnace capacity (Jones, 1999).
The amount of either Fe3O4 or Fe2O3 in the product isalso linked to temperature (Muan and Osborn, 1965). Theunroasted concentrate contained 17.4% sulphur. The degree
Fire and brimstone: The roasting of a Merensky PGM concentrate
The Journal of The Southern African Institute of Mining and Metallurgy VOLUME 115 JUNE 2015 511 ▲
Figure 8 – Sulphur and magnetite contents in the concentrate as afunction of roasting temperature (roasting in air for 20 minutes)
Table II
Compositions of phases shown in Figure 9 (wt%)
A† B‡ C (insert in B) D
1 2 3 1 2* 1 2 Matrix Digenite* Silicate Spinel#
S 37.6 34.5 31.6 26.7 21.3 — — 28.23 21.3 — —Fe 58.6 40.0 35.8 — — 2.0 2.4 — — 15.0 60.2Ni 3.8 20.8 16.4 73.4 — 62.0 70.7 71.77 — 1.4 8.7Cu — 4.7 16.3 — 78.7 26.0 26.2 — 78.7 — —Pt — — — — — 10.0 — — — — —Pd — — — — — — 0.8 — — — —Mg — — — — — — — — — 4.2Al — — — — — — — — — 6.0 9.9Si — — — — — — — — — 19.1 —Ca — — — — — — — — — 21.5 —O — — — — — — — — — 32.8 21.2* These phases are digenite(ss) with Cu9.3S5† A phase assemblage of (1) Fe0.9Ni0.5S (pyrrhotite[ss]), (2) (Fe0.6Ni0.3Cu0.06)9S8(pentlandite[ss]), and (3) Cu9S5 (digenite) in a matrix of pentlandite(ss) ispostulated‡ The phase assemblage comprises (1) heazlewoodite(ss) and (2) digenite(ss), which is intergrown with heazlewoodite(ss) in a macro- and micro-texture# The spinel composition matches the following stoichiometry (Fe0.7Ni0.3)(Al0.7Fe1.3)O4

Fire and brimstone: The roasting of a Merensky PGM concentrate
▲
512 JUNE 2015 VOLUME 115 The Journal of The Southern African Institute of Mining and Metallurgy
Table III
Compositions of phases shown in Figure 10B (wt%)
1 2 3 4 5* 6# 7 8
Fe 1.46 1.76 2.22 15.94 62.95 38.56 1.65 2.31
Ni 3.19 5.36 1.73 7.97 15.01 15.15 3.98
Cu 95.35 88.96 94.58 93.72
Mg 4.56 2.21 6.30 5.47
Al 5.98 9.96 21.09 6.25
Si 20.97 20.67
Ca 23.40 23.81
Cr 2.44
O 3.88 3.20 27.42 16.91 16.60 27.99
* A spinel, (Mg0.16Ni0.24Fe2+0.61)(Al0.64Fe3+1.36)O4
# A spinel, (Mg0.38Ni0.38Fe2+0.24)(Al1.15Cr0.07Fe3+0.78)O4
Figure 9 – Backscattered electron (BSE) images of phases observed in the smelted samples. (A) matte from unroasted concentrate; (B) matte fromconcentrate roasted at 550°C; (C) insert appearing in (B); (D) matte and slag from concentrate roasted at 550°C. (Phase compositions are given in Table II)

of desulphurization increases with increasing temperature,as reactions are faster at higher temperatures and, for thesame duration of oxidation (20 minutes), the extent ofdesulphurization is higher. Since the concentrate sampleconsisted of different proportions of pyrrhotite, pentlandite,and chalcopyrite, the overall degree of desulphurizationreflects the joint extents of oxidation of these differentsulphide phases. At 550°C the sulphur content in the roastedconcentrate dropped to 6.5% (a decrease in sulphur contentof approximately 60%), while at 650°C it dropped to justover 5% (a decrease of 70%).
The magnetite content also decreased with temperature(Figure 8). Oxidation produced both Fe2O3 and Fe3O4. Atapproximately 400°C, after 20 minute of roasting, themagnetite content was at its highest and decreased steadilywith increasing temperature. Thermodynamics predicts thathaematite is the stable form of iron oxide in air, in thetemperature range used in this study (Muan and Osborn,1965. The presence of magnetite therefore reflects non-equilibrium conditions.
Smelting
When concentrate is smelted, PGMs are collected in thematte phase. The principal aim of partially roasting theconcentrate before smelting is to decrease the matte fall,thereby resulting in a higher PGM concentration in the mattephase. It is thus important to know how a roastedconcentrate will behave on smelting. Bench-scale smeltingtests were therefore conducted on the roasted concentrate,using alumina crucibles. The smelting tests were evaluatedaccording to the matte fall (as a percentage of materialcharged to the crucible), the deportment of Ni and Cu to thematte, the collection of PGMs in the matte (if this could bemeasured accurately on a small scale), as well as thecomposition of the matte.
Since roasting lowered the sulphur concentrations in theconcentrate by approximately 60%, from 17.4 % to 6.5 % at550°C, while the concentration of magnetite formeddecreased from approximately 4.8% to 3.1% as thetemperature increased from 450°C to 550°C, it was decidedto do the smelting tests only on the roasted concentratesamples of lower magnetite content, i.e. the samples thatwere roasted at 550°C and 650°C. Matte was collected fromthe smelting of fresh concentrate, while matte associatedwith an alloy phase was collected from smelting ofconcentrate roasted at 550°C (Figure 9). Smelting of theconcentrate roasted at 650°C produced only an alloy. In allthree tests the matte or alloy collected in fine beads andprills, which did not fall under gravity to the bottom of thecrucible. The viscosity of the slag was therefore too high tofacilitate the coalescence of matte or alloy into a buttonwithin 30 minutes. Dispersed matte hindered the directmeasurement of matte fall. Matte fall was subsequentlyestimated at 45% for the unroasted concentrate and 15% forthe concentrate roasted at 550°C, using a least-squaresregression of concentrate and matte compositions within theframework of a mass balance. These values are lower thanthe matte falls calculated from all sulphides that can possiblyreport to the matte: 52% for the unroasted concentrate, 21%for the concentrate roasted at 550°C, and 17.6% for theconcentrate roasted at 650°C.
Although matte (from the unroasted and 550°C roastedconcentrates) and alloy (from the 650°C roasted concentrate)did not coalesce, the compositions of matte and alloy beadsand prills as well as the slags could be determined. Thematte from the concentrate roasted at 550°C comprised Ni3S2
(heazlewoodite), Cu9S5 (digenite), Cu1.97S (djurleite), andCu2S (chalcocite) (Table II). The PGM-containing alloy wasassociated only with nickel-copper-iron alloys (Figure 9C).Some nickel was lost to the slag (estimated in a mass
Fire and brimstone: The roasting of a Merensky PGM concentrate
The Journal of The Southern African Institute of Mining and Metallurgy VOLUME 115 JUNE 2015 513 ▲
Figure 10 – Backscattered electron (BSE) images of the smelted concentrate roasted at 650°C. (A) Typical microstructure, (B) Typical phase assemblage athigher magnification (phase compositions are given in Table III)

Fire and brimstone: The roasting of a Merensky PGM concentrate
balance calculation to be less than 10% in silicates andspinel). Copper was not detected in any of the phases in theslag.
The formation of a Cu-rich alloy in the smelted productof the concentrate roasted at 650°C was unexpected (Figure10). With 5% residual sulphur in this roasted product, up to10% matte was expected to form. The alloy was entrained inan iron-rich spinel in a silicate matrix of variablecomposition (Table III).
Conclusions
➤ It is possible to selectively oxidize the iron insulphides that are present in a Merensky concentrate,leave the nickel and copper in sulphide phases, andproduce a matte on smelting. This was achieved byroasting the concentrate at 550°C for 20 minutes
➤ The oxidation of the iron-containing sulphide phasesat temperatures between 500°C and 650°C proceededas follows:• Pyrrhotite oxidized to magnetite, which in turn
oxidized to haematite. The extent of haematiteformation increased with roasting temperature
• Chalcopyrite oxidized to form a bornite(ss) phase,with compositions close to the Fe-rich end memberat 550°C and a Cu-rich end member at 650°C
• Pentlandite oxidized to monosulphide solid solution(mss). The mss composition tended towards the NiS(millerite) end-member of the solution withoxidation at higher temperatures.
➤ Roasting at 550°C lowered the sulphur levels by atleast 60%, from 17.4% to 6.5% total sulphur, and at650°C, sulphur was lowered by 70%, from 17.4% to4.9% total sulphur
➤ The magnetite content of the calcine roasted at 550°Cwas double that of unroasted concentrate
➤ As long as the oxygen partial pressure in the rotaryfurnace remained high (close to that of air), metalsulphates did not form
➤ Smelting tests revealed that concentrates roasted at550°C for 20 minutes produced matte and a greatlyreduced matte fall. The iron levels in the matte werebelow 3.5%. The sulphur content of this matte wasjust above 20%, compared to a sulphur content ofmore than 30% for matte from unroasted concentrate
➤ The matte produced from roasted concentrateresembled the converter matte in composition.
Acknowledgments
The authors would like to thank Lonmin for supplying theconcentrate, and gratefully acknowledge the technicalsupport of Dr Lloyd Nelson and Rodney Hundermark fromAnglo American Platinum, as well as Rian Bezuidenhout andBurger van Beek from Lonmin. A special word of thanksgoes to our colleagues in the Department of Material Science
and Metallurgical Engineering at the University of Pretoria.At Anglo American our thanks go to Dr L.J. Bryson (Head ofHydrometallurgy) and Dr R.P. Schouwstra (Head of Mineraland Process Research) for the use of the facilities atTechnical Solutions as well as their technical support.
This work is based on the research supported in part bythe National Research Foundation of South Africa (Grantnumber TP1208219517).
References
GELDART, D. 1973. Types of gas fluidization. Powder Technology, vol. 7. pp.
185–195.
JONES, R.T. 1999. Platinum smelting in South Africa. South African Journal of
Science. vol. 95, no. 11–12. pp. 525–534.
KNOWLTON, T.M. 2002. A review of catalytic fluidized-bed reactors in the
chemical and petrochemical industries. IFSA 2002, Industrial
Fluidization South Africa. Luckos, A. and Den Hoed, P. (eds). Southern
African Institute of Mining and Metallurgy, Johannesburg. pp. 3–31.
KOLTA, G.A. and ASKAR, M.H. 1975. Thermal decomposition of some metal
sulphates. Thermochimica Acta, vol. 11, no. 1. pp. 65–72.
MUAN, A. and OSBORN, E.F. 1965. Phase Equilibria among Oxides in
Steelmaking. Addison-Wesley, Reading, MA.
PANDHER, R. and UTIGARD, T. 2010. Roasting of nickel concentrates.
Metallurgical and Matererials Transaction B, vol. 41, no. 4. pp. 780–789.
RAMBIYANA, R.I. 2015. Partial roasting of a PGM concentrate. MEng disser-
tation, University of Pretoria, South Africa.
US ENVIRONMENTAL PROTECTION AGENCY. 1995. Compilation of Air Pollutant
Emission Factors. Volume 1: Stationary Point and Area Sources. Chapter
12. Office of Air Quality Planning and Standards (OAQPS) and Office of
Air and Radiation (OAR) Research Triangle Park, NC.
WARNER, A.E.M., DIAZ, C.M., DALVI, A.D., MACKEY, P.J., TARASOV, A.V., and
JONES, R.T. 2007. JOM World Nonferrous Smelter Survey. Part IV: Nickel
Sulphide. JOM, vol. 59, no. 4. pp. 58–72.
XIA, F., PRING, A., and BRUGGER, J. 2012. Understanding the mechanism and
kinetics of pentlandite oxidation in extractive pyrometallurgy of nickel.
Minerals Engineering, vol. 27-28. pp. 11–19.
ZAMALLOA, M. and UTIGARD, T.A. 1996. The behaviour of Ni-Cu concentrate in
an industrial fluid bed roaster. Canadian Metallurgical Quarterly, vol. 35,
no. 5. pp. 435–449. ◆
▲
514 JUNE 2015 VOLUME 115 The Journal of The Southern African Institute of Mining and Metallurgy

IntroductionThe strategic long-term plan (LTP) of amineral resources company can be describedas the scheduled mining plan for the availablemineral resource area based on currentknowledge of the orebody and its mineralresource classification. The long-termrobustness of the strategic plan is typicallyimpacted by a combination of changingeconomic, market, and technical environments.Therefore the LTP has to be updated andreviewed on an annual basis, resulting in anear-term tactical as well as long-termstrategic plan in response to changes (Smith,2011).
The annual update of the LTP ensuresfulfilment of legislative and statutoryrequirements of the Mine Works Programme interms of the Mineral and Petroleum ResourcesDevelopment Act (DMR, 2002) as well as theresource classification in the mineral resourcesand reserves statement in terms of the SouthAfrican Code for the Reporting of ExplorationResults, Mineral Resources, and MineralReserves (SAMREC, 2007).
An integrated mining company mustinclude in the strategic LTP all the activities ofmining, including those related to mineralprocessing and beneficiation as well ascommercial marketing and sales. The LTPtherefore has to be more than a mere technicalmining document of what is planned to bemined where and how in the future – the LTPbecomes a strategic tool to guide the entireorganization into the future.
The strategic LTP needs to be an alignedview of the organization’s future outlook: along-term plan delivering on the company’sstrategic intent, balanced by a short-termtactical plan.
Different planning horizonsLong-term planning focuses on strategy,determining the ‘where’ or destination infuture, while short-term planning focuses onthe execution process representing the ‘how’ toget there in the short term. Long-term strategicplanning is supported by shorter termoperational planning, also referred to astactical planning.
Kear (2006) states that tactical andstrategic planning are done in two verydifferent planning environments, with differentlevels of an organization with different skillsets working in these distinct environments.These environments are also referred to as the‘realms of planning’ by Lane et al. (2010),where three worlds within planning arepresented as strategic planning, capitalplanning, and operation planning.
Strategic planningKear (2006) states that strategy is the broadplan to attain some objectives in the future and
Strategic and tactical requirements of amining long-term planby B.J. Kloppers*, C.J. Horn*, and J.V.Z. Visser*
SynopsisThe long-term plan (LTP) in a mineral resource company is defined by thequality of the mineral resource and represents the result of a series oftrade-offs to fulfil internal organizational as well as external business andlegislative requirements, ensuring ultimate delivery on the defined organi-zational strategy.
The LTP should as a whole align to a coherent and well-definedorganizational strategy, working towards a clearly defined objective whilestill allowing a tactical response to short-term requirements of the organi-zation. The ability to respond tactically to changes in environment, like theunprecedented five-month strike in 2014 on the platinum belt followingthe 2012 Marikana incident, is a measure of the flexibility of the plangiven the agreed strategy.
This paper describes the Lonmin process of linking company strategywith long-term planning, tactical planning, and the execution of the planthrough an annual planning cycle to maximize organizational flexibility.This flexibility enables mining companies to respond to the many internaland external forces that impact on both strategy formulation and deliveryof results that meet shareholder expectations.
Keywordsplanning cycle, long-term plan, organizational strategy.
* Lonmin Platinum, South Africa.© The Southern African Institute of Mining and
Metallurgy, 2015. ISSN 2225-6253. This paperwas first presented at the Platinum Conference2014, 20–24 October 2014, Sun City SouthAfrica.
515The Journal of The Southern African Institute of Mining and Metallurgy VOLUME 115 JUNE 2015 ▲
ISSN:2411-9717/2015/v115/n6/a7http://dx.doi.org/10.17159/2411-9717/2015/v115n6a7

Strategic and tactical requirements of a mining long-term plan
that strategic planning focuses on identifying those objectiveswith a view of more than 10 years ahead. Smith et al. (2008)describe strategic planning as dealing with components of thebusiness and decisions that deal with long-term valuegeneration. Strategic planning can also be described as aprocess of selecting options or making choices of what thelong-term goal should be. In the analogy where strategydetermines the destination, strategic planning will involvecertain trade-offs of alternative destinations identifying themost desirable long-term destination.
To be successful, the long-term strategy needs to beconstantly assessed in the light of short-term progress madetowards the intended destination, which in turn is determinedby the tactical plan within an ever-changing businessenvironment.
Tactical planningThe tactical plan can be described as the short-term oroperational plan aimed at solving the ‘how’ of getting to thestrategic destination. Smith et al. (2008) describe tacticalplanning as a process that is interlinked with strategicplanning and revolves around the routine operationalplanning requirements, ensuring delivery on the long-termstrategy. This requires that operational performance betracked and measured with regard to its alignment withstrategy, and corrective action taken when required. It isduring the execution phase of the tactical plan that executivesare faced with the challenges of enabling the overall strategy.
Executive’s dilemmaIdentification of the appropriate long-term strategy involvestrade-offs between a desired future state and the cost ofopportunities lost as a result of choosing the specific futurestate. These trade-offs have been described as the‘executive’s dilemma’ by Lane et al. (2010) with the question‘what should the strategic objective be?’ A modification oftheir model of the executive’s dilemma is depicted in Figure 1.
This model deals exclusively with issues in the economicrealm with reference to production levels, capital efficiency,value, and profit. The dilemma lies not in the fact that trade-offs exist between the economic drivers, but rather inunderstanding the opportunity cost of options given up dueto the selection of a strategy based on a specific economicdriver.
Table I outlines potential trade-offs that may exist whenfollowing a strategy to maximize value based on a singleeconomic driver. The strategic intent shown for each of thesedrivers viewed in isolation will enhance long-term value.
Clear trade-offs exist between the economic drivers whenthe strategic intent is to maximize value, since variouscombinations of these drivers or components of cash flow canbe used to maximize value. It should also be noted thattactical requirements sometimes have to be traded off againstlong-term strategic requirements. The need to preserve cashin a severe short-term downturn of the economy will trigger a‘cash conservation’ tactical plan, while the long-term strategymight still require capital investment in future growth basedon a bullish long-term view.
The true dilemma in identifying and selecting theappropriate long-term objectives is much broader than justthe economic realities. The trade-offs that require the highestlevel of analysis due to uncertainty and risk fall outside ofthe financial realm where the financial impact is driven bynon-financial factors. It is in these areas of decision-makingwhere economic modelling and scenario planning taking riskand uncertainty into account plays an important role –identifying and quantifying the potential economic impact ofnon-financial decisions in diverse scenarios.
The discipline of economic modelling makes trade-offdecisions in this realm less complex because of the ability toexpress the impact of various decisions in terms of a commonmonetary value using a process of scenario analysis andranking (Ballington et al., 2004).
Triple bottom line (3BL)The need to understand and measure the impact of businessis focused not only on the financial, but also the environ-mental and social spheres of influence as described bySpreckley (1981), who identified a need for ‘social enterprise
▲
516 JUNE 2015 VOLUME 115 The Journal of The Southern African Institute of Mining and Metallurgy
Figure 1 – Indication of economic trade-offs (adapted from Lane et al.,2010)
Table I
Trade-offs between economic drivers (adapted from Lane et al., 2010)
Economic driver Possible strategic intent Resultant strategic trade-offs(management levers)
Revenue Increase production / sales Potentially impacting costs and/or capital efficiency by introducing high unit cost expansion projects requiring additional capital
Costs Reduce unit costs Potentially impacting revenue by cutting high-cost production and/or capital efficiency by introducing expansion capital projects
Capex Increase capital efficiency Potentially impacting revenue and/or fixed cost dilution by stopping low-efficiency projects

audits’ in an attempt to highlight a more holistic impact ofexecution of a business strategy. Over time this need forbroader reporting and measurement gave rise to the phrase‘triple bottom line’, which was coined by Elkington in 1999and comprises profits, people, and environment (Elkington,1999). This concept has since gained tremendous momentumin management and business literature.
Measuring a strategy against the triple bottom line byincluding people and the environment is particularly apt inthe mining industry. One only has to consider the recentindustrial action in the platinum belt, which highlighted thesocio-economic impact of mines on their surroundingcommunities and how the general well-being of thecommunities affects labour productivity. These spheres havethe potential to disrupt the ultimate delivery of the strategy,thus proving some of the trade-offs made in selection of thestrategy obsolete if not considered at the onset.
Model of key strategic drivers Strategy formulation, building on the models of a triplebottom line and the notion of an executive’s dilemma(answering the question ‘what should the strategic objectivebe?’), should therefore be considered against an expandedset of drivers that includes economic drivers as well asinternal and external forces.
Expanding on the model of the executive’s dilemma, bybringing in the realities of the non-financial factors in the3BL model, ensures better informed evaluation of optionstraded off by capturing potential risks that would otherwisenot have been identified as opportunity costs when viewingeconomic drivers exclusively. The factors to be traded off indetermining strategy can collectively be referred to asstrategic drivers; internal forces are identified as a proxy forpeople and external forces are used as a proxy forenvironment from the 3BL model.
In the adapted model depicted in Figure 2, the economictrade-offs are still as important, being the trade-off to bestgenerate free cash flow and ultimately value. The emphasischanges by also considering the non-financial factors relatedback to 3BL.
This system of strategic drivers is in a perpetual state offlux. The strategic trade-off of how to best generate value byharmonizing the economic drivers is constantly influenced bychanging internal and external forces or drivers of strategy.
Strategic planning will result in a plan that best matchesthe economic drivers to deliver on a single long-term strategicview, with some flexibility to alter course based on changesin the environment. Tactical planning will, however, bebombarded by the turbulent environment due to short-termchanges in the internal as well as external strategic driverslike industrial action or exchange rate and commodity pricevolatility.
This change in external and internal forces in the shortterm requires that the strategic intent be re-assessed on acontinual basis to ensure alignment between where thestrategy aims to go and what the tactical implementationallows. In some instances, the changes in the short-termdrivers might require drastic changes in tactical executionhaving a material impact on delivery of the strategic LTP.This would require a total overhaul of the strategy, forexample, the impact of the five-month strike on the platinumbelt and changes in the industrial relations climate, whichcould trigger a strategic move towards mining methods withincreased reliance on mechanization and reduced labourdependence.
The unprecedented five-month Association ofMineworkers and Construction Union (AMCU) strike thattook place from January to June in 2014 is an example of anexternal force that has to be evaluated in strategic planning.The loss of production had significantly different results onthe share prices of the three companies concerned. Although
Strategic and tactical requirements of a mining long-term plan
517The Journal of The Southern African Institute of Mining and Metallurgy VOLUME 115 JUNE 2015 ▲
Figure 2 – Strategic drivers Figure 3 – Share price movements following the AMCU strike (source:Sharenet, 2014)
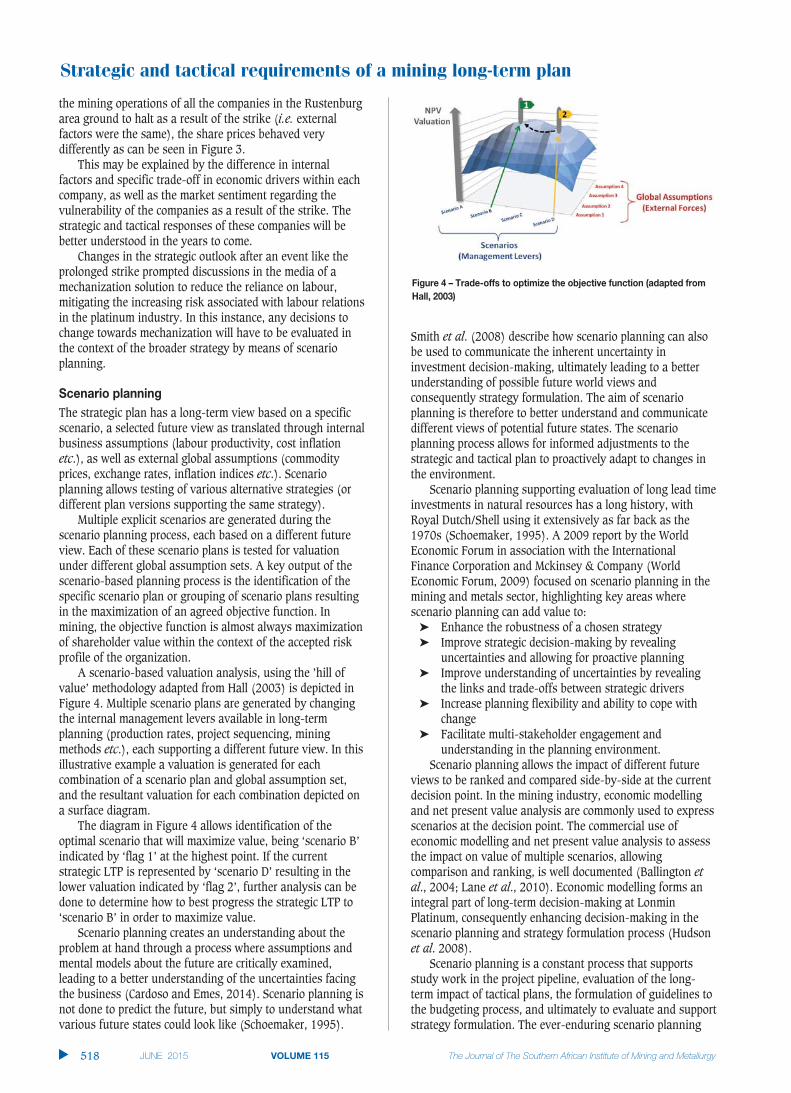
Strategic and tactical requirements of a mining long-term plan
the mining operations of all the companies in the Rustenburgarea ground to halt as a result of the strike (i.e. externalfactors were the same), the share prices behaved verydifferently as can be seen in Figure 3.
This may be explained by the difference in internalfactors and specific trade-off in economic drivers within eachcompany, as well as the market sentiment regarding thevulnerability of the companies as a result of the strike. Thestrategic and tactical responses of these companies will bebetter understood in the years to come.
Changes in the strategic outlook after an event like theprolonged strike prompted discussions in the media of amechanization solution to reduce the reliance on labour,mitigating the increasing risk associated with labour relationsin the platinum industry. In this instance, any decisions tochange towards mechanization will have to be evaluated inthe context of the broader strategy by means of scenarioplanning.
Scenario planning The strategic plan has a long-term view based on a specificscenario, a selected future view as translated through internalbusiness assumptions (labour productivity, cost inflationetc.), as well as external global assumptions (commodityprices, exchange rates, inflation indices etc.). Scenarioplanning allows testing of various alternative strategies (ordifferent plan versions supporting the same strategy).
Multiple explicit scenarios are generated during thescenario planning process, each based on a different futureview. Each of these scenario plans is tested for valuationunder different global assumption sets. A key output of thescenario-based planning process is the identification of thespecific scenario plan or grouping of scenario plans resultingin the maximization of an agreed objective function. Inmining, the objective function is almost always maximizationof shareholder value within the context of the accepted riskprofile of the organization.
A scenario-based valuation analysis, using the ’hill ofvalue’ methodology adapted from Hall (2003) is depicted inFigure 4. Multiple scenario plans are generated by changingthe internal management levers available in long-termplanning (production rates, project sequencing, miningmethods etc.), each supporting a different future view. In thisillustrative example a valuation is generated for eachcombination of a scenario plan and global assumption set,and the resultant valuation for each combination depicted ona surface diagram.
The diagram in Figure 4 allows identification of theoptimal scenario that will maximize value, being ‘scenario B’indicated by ‘flag 1’ at the highest point. If the currentstrategic LTP is represented by ‘scenario D’ resulting in thelower valuation indicated by ‘flag 2’, further analysis can bedone to determine how to best progress the strategic LTP to‘scenario B’ in order to maximize value.
Scenario planning creates an understanding about theproblem at hand through a process where assumptions andmental models about the future are critically examined,leading to a better understanding of the uncertainties facingthe business (Cardoso and Emes, 2014). Scenario planning isnot done to predict the future, but simply to understand whatvarious future states could look like (Schoemaker, 1995).
Smith et al. (2008) describe how scenario planning can alsobe used to communicate the inherent uncertainty ininvestment decision-making, ultimately leading to a betterunderstanding of possible future world views andconsequently strategy formulation. The aim of scenarioplanning is therefore to better understand and communicatedifferent views of potential future states. The scenarioplanning process allows for informed adjustments to thestrategic and tactical plan to proactively adapt to changes inthe environment.
Scenario planning supporting evaluation of long lead timeinvestments in natural resources has a long history, withRoyal Dutch/Shell using it extensively as far back as the1970s (Schoemaker, 1995). A 2009 report by the WorldEconomic Forum in association with the InternationalFinance Corporation and Mckinsey & Company (WorldEconomic Forum, 2009) focused on scenario planning in themining and metals sector, highlighting key areas wherescenario planning can add value to:➤ Enhance the robustness of a chosen strategy➤ Improve strategic decision-making by revealing
uncertainties and allowing for proactive planning➤ Improve understanding of uncertainties by revealing
the links and trade-offs between strategic drivers➤ Increase planning flexibility and ability to cope with
change➤ Facilitate multi-stakeholder engagement and
understanding in the planning environment.Scenario planning allows the impact of different future
views to be ranked and compared side-by-side at the currentdecision point. In the mining industry, economic modellingand net present value analysis are commonly used to expressscenarios at the decision point. The commercial use ofeconomic modelling and net present value analysis to assessthe impact on value of multiple scenarios, allowingcomparison and ranking, is well documented (Ballington etal., 2004; Lane et al., 2010). Economic modelling forms anintegral part of long-term decision-making at LonminPlatinum, consequently enhancing decision-making in thescenario planning and strategy formulation process (Hudsonet al. 2008).
Scenario planning is a constant process that supportsstudy work in the project pipeline, evaluation of the long-term impact of tactical plans, the formulation of guidelines tothe budgeting process, and ultimately to evaluate and supportstrategy formulation. The ever-enduring scenario planning
▲
518 JUNE 2015 VOLUME 115 The Journal of The Southern African Institute of Mining and Metallurgy
Figure 4 – Trade-offs to optimize the objective function (adapted fromHall, 2003)

process needs to be linked to a fixed business cycle toprovide specific feedback at specified points in the cycle.Scenario planning without these links and feedback loops caneasily evolve into ‘planning for the sake of planning’ thatover time becomes far removed from what is achievable in atactical plan.
Long-term planning cycle at LonminLonmin’s long-term plan has evolved over time and many ofthe leading practices described by Smith et al. (2006) andSmith (2011) have been introduced into the planning cycle.
The requirements of structured planning according to arepeatable cycle are not unique to South African mining. Thestrategic planning cycle is also identified as one of the mainfeatures of the planning process at major oil and gascompanies. Grant (2003) identified in his analysis ofstrategic planning within a turbulent environmentexperienced by the oil majors (similar to the currentenvironment of South African mining) that the cycle is to alarge part generic between organizations surveyed. The cycleidentified follows the path of strategic planning feedingplanning guidelines to budget and long-term planning endingwith reviews and a feedback loop back to strategic planning.This cycle can be compared to the planning cycle proposed inthe strategic framework for South African platinum miningby Smith (2011) in his doctoral thesis.
The planning cycle allows for multiple feedback loopsbetween each of the stages in the process. This allowsdevelopment of a tactical plan that keeps track of therequirements of the strategy on the one hand, but also feedsthe tactical and operational limitations back into the processof strategy formulation. The planning cycle should bedesigned in such a manner that it allows information to flowfreely between the tactical and strategic levels, with theability to adapt strategy if the environment dictates it, butalso to inform strategy when tactical execution needs todeviate from strategy.
Figure 5 illustrates how strategy is linked to the tacticalshort-term plan (or two-year budgeting cycle) at Lonmin.
The Lonmin strategy drives strategic planning through amine extraction and processing strategy that aims at theoptimal extraction of the available mineral resource. This isdone through the management of a project pipeline, whereprojects (mostly shafts and concentrator projects) are rankedas part of a portfolio optimization process establishing whichprojects are prioritized, considering the availability of capitaland value these projects generate.
The mining and processing extraction strategy providestop-down goals that form the guiding principles of the annualmining and processing long-term plans. The long-term plansin turn provide top-down goals to the two-year budgetingcycle. During the budgeting two-year period, short-termquarterly planning and control ensure that the tactical plansare executed according to the overall strategy.
The long-term planning cycle supports annual externalreporting of mineral resource and mineral reserves as well asthe mine works programme.
This cycle is unpacked in more detail in Figure 6, whichshows how the feedback loops operate along a two-yeartimeline.
Three cycles are illustrated in Figure 6, the StrategicPlanning Cycle illustrated horizontally across a two-yeartimeline, the Life of Business Plan Cycle illustrated in thecentre, and finally the Budget Cycle across the same timeline.
Commitment to the overall long-term strategy is key to anorganization’s success. Horn (2012), in the development of agoal-setting measurement tool for the South African miningindustry, found overwhelming evidence that goal-setting (inthis case following a defined strategy) correlates positivelywith organizational commitment.
Strategic planning at Lonmin occurs annually with thegathering of the company executives in March, where top-down goals (TDGs) that are derived from this session feedinto the scheduling of the mining LTP. The previous year’s
Strategic and tactical requirements of a mining long-term plan
The Journal of The Southern African Institute of Mining and Metallurgy VOLUME 115 JUNE 2015 519 ▲
Figure 5 – Linking strategy and tactical planning at Lonmin

Strategic and tactical requirements of a mining long-term plan
plan is used as a base and also provides input to the LTP.Lonmin makes use of a bottom-up planning process thatallows ownership and organizational commitment.
Figure 6 further illustrates a process of single- and multi-disciplinary reviews to ensure governance and compliancewith technical standards. This review and ownership processis unpacked in more detail in Figure 7.
Once the technical mining plan is complete with all thegovernance and quality assurance steps applied, a draft life-
of-business plan (LOBP) is prepared for the executivecommittee (Exco). This new plan is used to update the capitalranking model, which allows for further optimization toestablish the final LOBP. The final LOBP becomes the inputdocument for the strategic session taking place in thefollowing year, which leads to the cycle repeating itself. Theoutcomes of both the strategy session and the final LOBP arepresented to the board in March of each year.
Figure 6 further indicates how the life-of-business
▲
520 JUNE 2015 VOLUME 115 The Journal of The Southern African Institute of Mining and Metallurgy
Figure 6 – Long-term and short-term planning cycle
Figure 7 – Ownership and review of the LTP
planning cycle links to short-term planning. From Figure 6one can see that the draft LOBP provides input through TDGsinto the short-term budgeting cycle.
The draft LOBP through TDGs provides inputs in order toallocate available capital for the quarter 3 forecast plan,which is part of the two-year budgeting process. This planmakes use of the December mining face positions and amining schedule of 33 months is planned. This scheduleallows for two objectives to be achieved; firstly it provides fora 9-month short-term forecast of the current financial year inorder to enable market guidance. Secondly, it enables a 24-month budgeting process. The plan is signed off in March ofevery year.
Two other short-term plans are formulated during thebudgeting cycle, namely the quarter 2 and quarter 4 forecastplans. Both these plans enable refinement of the short-termplan and improve market guidance. These are tactical plansthat respond to the many internal and external factorsaffecting the plan.
In summary, the Lonmin planning cycle enables strategicscenarios to affect short-term execution as well as feedbackof how short-term internal and external forces may influence,and in some cases completely alter, the overall strategy of thecompany in a controlled, well-informed manner. The reviewand ownership of the plan is described in the next section.
Ownership and review of the LTPOrganizational commitment to the LTP at Lonmin is enabledthrough a bottom-up process where each shaft/operationgenerates its own LTP aligned with the previous LTP as wellas TDGs, as illustrated in Figure 7.
At operational level the various line managers, whichstarts at mine overseer level together with the technicalspecialists (geology, planning, rock engineering etc.), areresponsible for the shaft/operation LTP. The review,governance, and auditing of the LTP at shaft/operation leveltakes place through a series of single-disciplinary and multi-disciplinary reviews (SDRs and MDRs) by the Lonmin Groupmanagers together with the line managers.
This process ensures ownership as well as strategic andtactical alignment within organizational governance andquality standards.
ConclusionStrategic planning takes a long-term view and shouldconstantly be broken down into tactical plans that can beimplemented and monitored operationally. The process offormulating long-term strategy, testing the strategy in anoperational plan, and providing feedback that influencesfuture strategy should be embedded in planning and institu-tionalized in an annual planning cycle.
The Lonmin strategic long-term planning processdescribed in this paper follows leading practices that enableownership, tactical flexibility, and strategic alignment toensure all stakeholder expectations are met.
The challenge to the industry is the ability of organi-zations to balance the requirement to respond quickly tovolatile market conditions, like the prolonged platinum strikefollowing the Marikana event, with the often time-consumingformal process which ensures quality, governance, andcontrol of the strategic long-term plan.
References
BALLINGTON, I., BONDI, E., LANE, G., and SYMANOWITZ, J. 2004. A practicalapplication of an economic optimisation model in an underground miningenvironment. Proceedings of the Orebody Modelling and Strategic MinePlanning Conference, Perth, WA, 22–24 November 2004. pp. 215.
CARDOSO, J.F. and EMES, M.R. 2014. The use and value of scenario planning,Modern Management Science and Engineering, vol. 2, no. 1. pp. 19–42.
DEPARTMENT OF MINERAL RESOURCES (DMR). 2002. Mineral and PetroleumResources Development Act, Act 28. Government Gazette. 2002. Pretoria.
ELKINGTON, J. 1999. Cannibals with Forks: The Triple Bottom Line of 21stCentury Business. New Society Publishers, Stony Creek, CT.
GRANT, R.M. 2003. Strategic planning in a turbulent environment: evidencefrom the oil majors. Strategic Management Journal, vol. 24, no. 6. pp.491–517.
HALL, B.E. 2003. How mining companies improve share price by destroyingshareholder value. Proceedings of the CIM Mining Conference andExhibition, Montreal, Paper 1194.
HORN, C.J. 2012. Developing a measure for goal-setting in the mining industryin South Africa. Association of Mine Managers of South Africa.
HUDSON, J.H.K., MAYNARD, M., and KLOPPERS, B. 2008. The application ofeconomic modelling to enhance decision-making at Lonmin Platinum.Proceedings of the Third International Platinum Conference, Sun City,South Africa, 5–9 October 2008. Southern African Institute of Mining andMetallurgy. Johannesburg. pp. 343–348.
KEAR, R.M. 2006. Strategic and tactical mine planning components. Journal ofthe Southern African Institute of Mining and Metallurgy, vol. 106. pp.93–96.
LANE, G.R., MILOVANOVIC B., and BONDI E. 2010. Economic modelling and itsapplication in strategic planning. The 4th Colloquium on Diamonds -Source to Use, Gaborone, Botswana, 1-3 March 2010. Southern AfricanInstitute of Mining and Metallurgy, Johannesburg. pp. 161–172.
SCHOEMAKER, P.J.H. 1995. Scenario planning: a tool for strategic thinking. SloanManagement Review, vol. 36, no. 2. pp. 25–40.
SHARENET 2014. Sharenet Java Technical Analysis Charts.http://www.sharenet.co.za/charts/index.php?load=LON [Accessed 23 June2014].
SMITH, G.L. 2011. A conceptual framework for the strategic long term planningof platinum mining operations in the South African context. PhD thesis,University of the Witwatersrand, Johannesburg.
SMITH, G.L. PEARSON-TAYLOR J., and ANDERSEN D.C. 2006. The evolution ofstrategic long-term planning at Anglo Platinum. Proceedings of the SecondInternational Platinum Conference, Sun City, South Africa, 8–12 October2006. Southern African Institute of Mining and Metallurgy, Johannesburg.pp. 301–305.
SMITH, G.L., SURUJHLAL S.N., and MANYUCHI K.T. 2008. Strategic mine planning—communicating uncertainty with scenarios. Proceedings of the ThirdInternational Platinum Conference. Sun City, South Africa, 5–9 October2008. Southern African Institute of Mining and Metallurgy, Johannesburg.pp. 335–342.
SOUTH AFRICAN MINERAL RESOURCE COMMITTEE (SAMREC). South Africa 2007. TheSouth African Code for the Reporting of Exploration Results, MineralResources and Mineral Reserves (The SAMREC Code), 2007 Edition,amended July 2009.
SPRECKLEY, F. 1981. Social Audit - A Management Tool for Co-operativeWorking. Beechwood College.
WORLD ECONOMIC FORUM. 2009. Mining & Metals Scenarios to 2030. Geneva.http://www.weforum.org/reports/mining-metals-scenarios-2030[Accessed 19 May 2014]. ◆
Strategic and tactical requirements of a mining long-term plan
The Journal of The Southern African Institute of Mining and Metallurgy VOLUME 115 JUNE 2015 521 ▲

renault-trucks.co.za
STRONG ON ROBUSTNESS
IntroductionIn mining projects it is common that theresource estimate is informed by multipleoverlapping sources of ‘hard’ data. Sampleinformation for the attribute(s) of interest mayhave been acquired from various generationsand types of drilling campaigns (such asdiamond, sonic, reverse circulation, orpercussion). In addition, for brownfield sites,production data such as channel samples orblast-hole samples may also be available. Eachdata source is likely to be associated with adifferent level of precision and accuracy, asdemonstrated by quality control metadata ortwinned drill-holes. In addition, the variousdata sources often feature differences insample support.
At the outset of the resource estimationprocess, various key decisions are required;one of these is whether all of the availablehard data should be incorporated into theestimation, or whether some data should be
excluded on the basis of imprecision or bias orboth. Inclusion of additional data reduces theinformation effect (Journel and Huijbregts,1978), but by excluding one or more datasources the practitioner judges that the benefitof that data (in terms of minimizing estimationerror) is outweighed by its imprecision or biasor both. However, in practice this judgement israrely quantified and fails to consider thevarious geostatistical techniques available toaccount for imprecision and bias duringestimation.
Integration of imprecise or biased dataNumerous case studies concerning resourceestimation based upon multiple generations ofdrill-hole data are documented in the literature(for recent examples see Collier et al., 2011and Smith et al., 2011). Other authors havepreviously compared techniques for integratingdata of different types and reliability. Forexample, Emery et al. (2005) compared fivegeostatistical techniques for integrating twosubsets of error-free (assumed) and imprecisedata into a resource estimate, includingordinary kriging (OK) of the pooled data-set;separate OK of each data-set and subsequentcombination of the estimates by weightedaverage; cokriging (CK) of the two datasources; lognormal kriging with a filteringprocedure; and indicator kriging to determinee-type estimates of grade. Emery et al. (2005)contend that the kriging techniques tested arenot very sensitive to the level of sampling errorand that the quantity of data prevails over thequality; they conclude that imprecise andunbiased measurements should never bediscarded in the estimation paradigm despitetheir poor quality. However, Abzalov and
Integration of imprecise and biaseddata into mineral resource estimatesby A. Cornah* and E Machaka†
SynopsisMineral resources are typically informed by multiple data sources ofvarying reliability throughout a mining project life cycle. Abundant datawhich are imprecise or biased or both (‘secondary data’) are oftenexcluded from mineral resource estimations (the ‘base case’) under anintuitive, but usually untested, assumption that this data may reduce theestimation precision, bias the estimate, or both.
This paper demonstrates that the assumption is often wasteful andrealized only if the secondary data are naïvely integrated into theestimation. A number of specialized geostatistical tools are available toextract maximum value from secondary information which are impreciseor biased or both; this paper evaluates cokriging (CK), multicollocatedcokriging (MCCK), and ordinary kriging with variance of measurementerror (OKVME).
Where abundant imprecise but unbiased secondary data are available,integration using OKVME is recommended. This re-appropriates krigingweights from less precise to more precise data locations, improving theestimation precision compared to the base case and to Ordinary Kriging(OK) of a pooled data-set. If abundant secondary data are biased andimprecise, integration through CK is recommended as the biased data arezero-sum weighted. CK consequently provides an unbiased estimate withsome improvement in estimation precision compared to the base case.
KeywordsMineral resource estimation, data integration, cokriging, ordinary krigingwith variance of measurement error.
* Anglo American, formerly of QG Consulting.† Kumba Iron Ore.© The Southern African Institute of Mining and
Metallurgy, 2015. ISSN 2225-6253. Paper receivedMay 2014 and revised paper received Jan. 2015.
523The Journal of The Southern African Institute of Mining and Metallurgy VOLUME 115 JUNE 2015 ▲
ISSN:2411-9717/2015/v115/n6/a8http://dx.doi.org/10.17159/2411-9717/2015/v115n6a8

Integration of imprecise and biased data into mineral resource estimates
Pickers (2005) compared kriging with external drift (KED)and collocated cokriging (CCK) against OK for the integrationof two different generations of sample assays, finding thatKED and CCK significantly improved the accuracy of gradeestimation when compared with conventional OK.
This paper firstly re-examines the case where imprecisebut unbiased secondary data are available for incorporationinto the resource estimate; the imprecise and biased case isthen considered. Various techniques are trialled, includingintegration through CK, multicollocated cokriging (MCCK),and OK with variance of measurement error (OKVME).
CK is classically the estimation of one variable basedupon the measured values of that variable and secondaryvariable(s). Estimation uses not only the spatial correlation ofthe primary variable (modelled by the primary variogram) butalso the inter-variable spatial correlations (modelled by cross-variograms). By making use of data from a secondaryvariable(s) as well as the primary variable, CK aims to reduceestimation variance associated with the primary variable(Myers, 1982; Olea, 1999); it also seeks to enforcerelationships between variables as measured within the data.
CK coincides with independent OK if all variables aresampled at all locations (isotopic sampling) and the variablesof interest are also intrinsically correlated (see Wackernagel,2003); this is a condition known as autokrigeability (Journeland Huijbregts, 1978; Matheron, 1979; Wackernagel, 2003).However, in the isotopic sampling but non-intrinsic case, realand perceived difficulties are usually deemed to outweigh thebenefit of CK over OK (see Myers, 1991; Künsch et al., 1997;Goovaerts, 1997). Various authors including Journel andHuijbregts (1978) and Goovaerts (1997) suggest that CK isworthwhile only where correlations between attributes arestrong and the variable of interest is under-sampled withrespect to secondary variables (heterotopic sampling) (seeWackernagel, 2003).
Even in the heterotopic sampling case, secondary datathat are co-located or located near unknown primary datatend to screen the influence of distant secondary data; thehigh degree of data redundancy can produce large negativeweights and instability within CK systems (Xu et al., 1992).In addition, fitting a positive definite linear model ofcoregionalization (LMC) to multiple attributes is oftenconsidered problematic (Journel, 1999), although significantimprovements have been made in automated fitting routines(for example see Goulard and Voltz, 1992; Künsch et al.,1997; Pelletier et al., 2004; Oman and Vakulenko-Lagun.,2009; Emery, 2010). Furthermore, the inference of cross-variograms is problematic in the displaced heterotopicsampling case where the sample locations of the secondaryvariable do not coincide with the primary variable.
In this paper CK is used to integrate dislocated heterotopicprimary and secondary sample data representing the sameattribute in cases where the latter is imprecise or biased orboth, but spatially correlated to the former.
CCK was proposed by Xu et al. (1992) to avoid the matrixinstability associated with CK discussed above. It is usuallyapplied in cases where primary data is sparsely distributedbut secondary data is quasi-exhaustively measured (forexample seismic attributes in petroleum applications). Undera Markov-type screening hypothesis (Xu et al., 1992), theprimary data point screens the influence of any other data
point on the secondary collocated variable. This assumptionallows CK to be simplified to CCK in that only the secondarydata located at the estimation target is retained within the CKsystem; the neighbourhood of the auxiliary variable isreduced to only one point: the estimation location (Xu et al.,1992; Goovaerts, 1997). Under the Markov model the cross-covariance is available as a rescaled version of the primarycovariance (Xu et al., 1992).
MCCK makes use of the auxiliary variable at theestimation location and also at sample locations where thetarget variable is available, but not at other locations whereonly the auxiliary variable is available (Rivoirard, 2001).This study investigates the possibility of integrating thesecondary sample data, which represents the same attributeby MCCK.
Another alternative is to integrate data sources of varyingprecision using OKVME (Delhomme, 1976). The methodrequires that the precision of each sample incorporated intothe estimation is known. The approach also requires theassumption that measurement errors represent pure nuggeteffect; that is, the measurement errors are non-spatial noisewhich is independent of the data values (see Wackernagel,2003). The specific measurement error variance of each datapoint is added to the diagonal terms of the left-hand krigingmatrix. The response is re-appropriation of the krigingweights in favour of sample locations with low measurementerror variance and against samples with high measurementerror variance. In practice it is unlikely that the precision ofevery measurement is known: sampling errors may bebroadly assessed for each campaign based upon qualitycontrol metadata, allowing progressive penalization ofprogressively imprecise data. Details of procedures formeasuring and monitoring precision and accuracy ingeochemical data are given by Abzalov (2008, 2009).
ModellingExperimentation was carried out using a two-dimensionaliron ore data-set that comprises a set of exploration samplesfrom a single geological unit configured at approximately 75 m × 75 m spacing. These samples were derived fromdiamond drill core and for the purpose of this experiment areassumed to be error-free; herein they are referred to as the‘primary data’, Z1.
An exhaustive ‘punctual ground truth’ model of Fe gradeswithin the data-set area was generated at 1 m × 1 m spacednodes by conditional simulation (CS) of the primary data(Journel, 1974; Chilès and Delfiner, 1999). CS allows multipleimages of the deposit to be generated which are realisticallyvariable but are ‘conditional’ in the sense that they honourthe known but limited drill-hole sampling data from thedeposit. In this case, a single realization of Fe grade (whichadequately represented the statistical moments of the inputdata) was selected from a set of 25 that were generated usingthe turning bands algorithm (Journel, 1974). This ‘punctualground truth’ realization was averaged into 50 m × 50 mmining blocks as shown in Figure 1 to provide a ‘blockground truth’ (Z) against which estimations based upon theprimary and secondary data could be compared.
The top left-hand plot in Figure 1 portrays the primarydata locations (shown as solid black discs) and the CSrealization built from this data, the histogram of Fe grades
▲
524 JUNE 2015 VOLUME 115 The Journal of The Southern African Institute of Mining and Metallurgy

pertaining to this is shown below; the re-blocked realizationis shown in the top right graphic and the histogrampertaining to this below. The figure demonstrates the keyfeatures of up-scaling from punctual to block support underthe multigaussian model assumptions that underpin the CSrealization (see Journel and Alabert, 1989): the range andskewness of the distribution is reduced, but the mean ispreserved.
In order to provide a series of abundant secondary sampledata-sets (Z2), ‘virtual’ samples were extracted from thepunctual ground truth. Multi-generational data sources oftenoverlap, but are rarely exactly coincident unless theyrepresent re-assay of older pulps or rejects. The Z2 datalocations were therefore made irregular and dislocated fromZ1 in order to provide a realistic representation of a multi-generational drilling campaign (the displaced heterotopicsample arrangement; see Wackernagel, 2003). Regular 25 m× 25 m locations were adjusted by easting and northingvalues drawn from a uniform distribution over [−3,3] toprovide the Z2 extraction locations. This geometry results inZ2 to Z1 frequency of approximately 10:1.
Six unbiased normal error distributions were applied tothe extracted Z2 samples with absolute error standarddeviation (σα
Z2) ranging between 0.25 and 3 (see Figure 2),termed unbiased cases hereafter. Because the error distrib-utions are symmetric and unbounded, imprecision has noimplication with respect to bias. In addition, six positivelybiased error distributions centred upon absolute +1% wereapplied, and six negatively biased distributions centred uponabsolute -1% were applied, each with the same range in σα
Z2
(termed biased cases hereafter).An OK block estimate incorporating the primary data only
represents the base case (Z1OK) and is compared against the
block ground truth in the scatter plot shown in Figure 3.In bedded iron ore data-sets, the Fe distribution is
typically negatively skewed (see Figure 1), the data is charac-teristically heteroscedastic (i.e. subsets of the data showdifferences in variability), and the proportional effect usuallyexists (local variability is related to the local mean; seeJournel and Huijbregts, 1978). Figure 3 indicates that thevariance of estimation error is least where the local mean isgreatest but increases as the local mean declines. This implies
Integration of imprecise and biased data into mineral resource estimates
525The Journal of The Southern African Institute of Mining and Metallurgy VOLUME 115 JUNE 2015 ▲
Figure 1 – Conditional simulation of punctual ground truth (top left) with drill-hole locations shown as discs; punctual ground truth histogram (bottom left);ground truth up-scaled to 50 m x 50 m blocks (top right); and block ground truth histogram (bottom right)

Integration of imprecise and biased data into mineral resource estimates
that the proportional effect exists in this data-set with localvariability, and consequently estimation error, greatest inlower grade areas and least in high-grade areas. This iscommon in iron ore data-sets where the low-grade areas maypertain to deformed shale bands, discrete clay pods, diabasesills, or unaltered banded iron formation.
The Pearson correlation coefficient (shown as rho inFigure 3) measures the linear dependency between Z andZ1
OK and thus quantifies the precision of the estimate.However, following a review of the various precision metricsused in geochemical data-sets, Stanley and Lawie (2007) andAbzalov (2008) both recommend using the averagecoefficient of variation (CVAVR(%)) as the universal measureof relative precision error in mining geology applications:
Errors in geochemical determinations can be consideredanalogous to estimation errors in this case, and the CVAVR(%)metric is thus used as the basis for comparison betweenestimation precision in this paper. In the base case estimateshown in Figure 3, CVAVR(Z, Z1
OK)=0.88.
Analysis of imprecise but unbiased casesThe Z1 and unbiased but increasingly imprecise Z2 data-setswere integrated into estimation through OK (Z1,2
OK), CK (Z1,2CK),
MCCK (Z1,2MCCK), and OKVME (Z1,2
OKVME). Given the displacedheterotopic geometry of the data-sets, the Z2 locationsadjacent to Z1 were migrated into collocation to allow cross-variography in CK cases, and to allow implementation ofMCCK. The resulting loss of accuracy represents acompromise of these methods in the common displacedheterotopic sample geometry case and is discussed furtherbelow. The resulting estimates are quantitatively comparedagainst the base case CVAVR(Z, Z1
OK) and against each otherin Figure 4.
The figure firstly shows that CVAVR(Z, Z1OK) is
independent of σαZ2; secondly, that pooling the primary and
secondary data and estimating using OK (Z1,2OK) results in
CVAVR(Z,Z1,2OK)=0.56 where σα
Z2=0. Incorporating secondarysamples with zero measurement error through OK clearlyimproves estimation precision and is therefore preferable toexcluding them. However, as σα
Z2 increases, so CVAVR(Z,Z1,2OK)
also increases rapidly (indicating that estimation precisiondeclines). Figure 4 shows that, in this particular case, whereσα
Z2=1.5 there is no benefit to including Z2 samples in the OKestimate:
σαZ2=1.5 → CVAVR(Z,Z1,2
OK) ≈ CVAVR(Z, Z1OK).
▲
526 JUNE 2015 VOLUME 115 The Journal of The Southern African Institute of Mining and Metallurgy
Figure 2 – Secondary data locations shown as coloured discs with primary data locations shown as black discs (left); unbiased error distributions whichwere applied to the secondary data locations also shown (right)
Figure 3 – Comparison of base case estimation against the groundtruth; rho represents the Pearson correlation coefficient

Where measurement errors are large, the OK estimateusing the pooled data-set is less precise than the base case,which excludes the secondary data. In the discussed casestudy:
σαZ2>1.5 → CVAVR(Z,Z1,2
OK) > CVAVR(Z, Z1OK)
Figure 4 shows that where σαZ2=0, some improvement in
estimation precision is achieved by incorporating secondarysamples through CK (Z1,2
CK) compared to Z1OK. However, in this
circumstance the improvement in accuracy is not as great asthat gained through Z1,2
OK:
σαZ2=0 → CVAVR(Z,Z1,2
CK) > CVAVR(Z, Z1,2OK)
This is due to the vagaries of CK compared to OK, whichwere discussed above. However, as σα
Z2 increases, the benefitof Z1,2
OK declines relative to Z1,2CK. In this case, where σα
Z2≈1.4,CVAVR(Z, Z1,2
OK)≈CVAVR(Z,Z1,2CK), both of which are more
precise than the base case. Where the precision of thesecondary data is poorer than this, integrating it through CKis preferable to integrating it through OK. In this case:
σαZ2>1.4 → CVAVR(Z,Z1,2
CK) < CVAVR(Z, Z1,2OK)
Unlike OK, integrating the secondary data using CKprovides an improvement in estimation precision compared tothe base case in all of the cases tested:
CVAVR(Z,Z1,2CK) < CVAVR(Z, Z1
OK)
As discussed above, MCCK is an approximation of full CKand some loss of estimation precision is to be expected in thiscase by the migration of data locations required by non-colocation of primary and secondary data-sets. This isevident within the results shown in Figure 4: MCCK mirrors
fully the CK result, with some loss of estimation precisionwhere σα
Z2<2. However where σαZ2>2 the difference between
the two approaches is negligible, suggesting that at higherσα
Z2 levels the simplifications associated with MCCK representa worthwhile trade-off compared to CK. In addition,integration of secondary data through MCCK is preferable tothe base case in all σα
Z2 cases that were tested:
CVAVR(Z,Z1,2MCCK) < CVAVR(Z, Z1
OK)
Finally, Figure 4 shows the results of integratingsecondary data through OKVME estimation (Z,Z1,2
OKVME). In allσα
Z2 cases that were tested, this approach outperformed thebase case:
CVAVR(Z,Z1,2OKVME) < CVAVR(Z, Z1
OK)
The figure confirms that the Z1,2OKVME result converges on
Z1,2OK where zero error is associated with the secondary
variable:
σαZ2=0 → CVAVR(Z,Z1,2
OKVME) = CVAVR(Z, Z1OK)
However, as the precision of the secondary data declines,Z1,2
OKVME outperforms Z1,2OK by an increasing margin; it also
out-performs both Z1,2CK and Z1,2
MCCK. Therefore in all of the σαZ2
cases that were tested the following relationship holds:
σαZ2>0 → CVAVR(Z,Z1,2
OKVME) < CVAVR(Z, Z1,2CK)
< CVAVR(Z, Z1,2MCCK) < CVAVR(Z, Z1
OK)
To further elucidate the OKVME technique, thecumulative kriging weights allocated to each sample duringthe OK and OKVME estimations were recorded. The meanvalues for each σα
Z2 that was tested are shown in Figure 5.
Integration of imprecise and biased data into mineral resource estimates
The Journal of The Southern African Institute of Mining and Metallurgy VOLUME 115 JUNE 2015 527 ▲
Figure 4 – Average coefficient of variation for each of the estimation approaches, with increasing standard deviation of measurement error associatedwith the secondary samples in the unbiased cases

Integration of imprecise and biased data into mineral resource estimates
The figure firstly shows that in the Z1,2OK case the mean
cumulative OK weight that is applied to the secondarysamples exceeds that applied to the primary samples; this isbecause the secondary samples are typically in closerproximity to block centroids than the primary samples. As thesecondary samples are also more numerous than the primarysamples, they are clearly more influential in the OKestimation.
The figure confirms that the OK weight is independent ofσα
Z2; this results in the rapidly increasing CVAVR(Z, Z1,2OK) with
increasing σαZ2, as shown in Figure 4. Figure 5 also shows
that where no measurement error is associated with thesecondary samples, the OKVME weights converge on the OKweights. As σα
Z2 increases the OKVME weights are rebalancedin favour of the Z1 samples. In this case, where σα
Z2 is 0.5 orgreater the mean cumulative OKVME weight assigned to Z1samples exceeds that assigned to the Z2 samples.
Given that in the case study Z2 samples are significantlymore numerous than Z1, a small decrease in the meancumulative weight applied to the former must be balanced bya larger increase in the mean cumulative weight applied tothe latter, due to the requirement that the weights sum tounity.
Analysis of imprecise and biased casesThe imprecise and biased Z2 data-sets were also integratedinto estimation through OK, CK, MCCK, and OKVME. Meanestimated grades are compared against each other and theground truth mean in Figure 6.
The figure firstly shows that the base case Z1OK is
unbiased with respect to the ground truth. In the Z1,2OK,
estimate weights associated with the pooled Z1 and Z2samples sum to unity; consequently bias associated with Z2samples is directly transferred into the estimate in all σα
Z2
cases, as is shown in Figure 6. The Z1,2OKVME weights
associated with the pooled Z1 and Z2 samples also sum tounity. However, because increasing weight is re-appropriatedfrom Z2 to Z1 samples as σα
Z2 increases, less bias is retainedwithin the estimate in the higher σα
Z2 cases compared toZ1,2
OK; this is also evident in Figure 6.In the Z1,2
CK and Z1,2MCCK estimations, Z1 sample weights
sum to unity and Z2 samples are zero-sum weighted. Figure6 confirms that as a consequence the resulting estimationsare unbiased, regardless of the bias associated with Z2, andregardless of σα
Z2. Consequently, CK or MCCK represent theonly viable options to integrate Z2 data that are imprecise andbiased. The positive and negative bias cases are coincidentfor Z1,2
CK and for Z1,2MCCK .
ConclusionsIf precise, unbiased, and abundant secondary data areavailable, their basic integration through OK of a pooled data-set is pertinent (see Table I). The estimate is directlyimproved compared to the base case (exclusion of thesecondary data) by reduction of the information effect.
However, abundant secondary data that are imprecise orbiased or both are often excluded from resource estimationsby practitioners, typically under an intuitive but untested
▲
528 JUNE 2015 VOLUME 115 The Journal of The Southern African Institute of Mining and Metallurgy
Figure 5 – Mean cumulative kriging weights in OKVME at increasing standard deviation of measurement error associated with secondary samples

assumption that inclusion will result in loss of estimationprecision or that the estimation may be biased, or both.Experimentation outlined in this paper demonstrates that thismay be true if the secondary data are not handledappropriately in the estimation; also that such a decision isgenerally wasteful.
Where imprecise but unbiased secondary data areavailable, it is recommended to integrate them into theestimation using OKVME (see Table I). This provides animprovement in estimation precision compared to the basecase and compared to OK of a pooled data-set. CK and MCCKalso provide some improvement in estimation precisioncompared to the base case, but do not outperform OK of apooled data-set if abundant secondary data are relativelyprecise, and never out-performed OKVME in the unbiasedcases that were tested.
If secondary data are associated with bias in addition toimprecision, CK is recommended as the biased data are zero-sum weighted (see Table I). CK consequently provides anunbiased estimate but with some improvement in estimationprecision compared to the base case. MCCK suffers some lossof estimation precision compared to CK where the secondarydata are relatively precise, but is similar to CK where thesecondary data are less precise.
AcknowledgementsThe authors would like to sincerely thank Dr Michael Harleyof Anglo American, Scott Jackson of Anglo American, Dr JohnForkes (independent consultant), and John Vann of AngloAmerican; their excellent comments and constructive criticismof earlier versions of this paper significantly improved itsfinal content.
ReferencesABZALOV M.Z. and PICKERS, N. 2005. Integrating different generations of assays
using multivariate geostatistics: a case study. Transactions of the Instituteof Mining and Metallurgy, Section B: Applied Earth Science, vol. 114,no.1. pp. 23–32.
ABZALOV, M. 2008. Quality control of assay data: a review of procedures formeasuring and monitoring precision and accuracy. Exploration andMining Geology, vol. 17, no. 3–4. pp. 131–141.
ABZALOV, M. 2009. Use of twinned drillholes in mineral resource estimation.Exploration and Mining Geology, vol. 18, no. 1–4. pp. 13–23.
CHILÈS, J. and DELFINER, P. 1999. Geostatistics – Modelling Spatial Uncertainty.John Wiley and Sons, Hoboken, New Jersey.
COLLIER P., CLARK G., and SMITH R. 2011. Preparation of a JORC Code compliantresource statement based on an evaluation of historical data – a casestudy from the Panguna deposit, Bougainville, Papua New Guinea. EighthInternational Mining Geology Conference, Queenstown, New Zealand, 22-24 August 2011. Australasian Institute of Mining and Metallurgy. pp. 409–426.
Integration of imprecise and biased data into mineral resource estimates
The Journal of The Southern African Institute of Mining and Metallurgy VOLUME 115 JUNE 2015 529 ▲
Figure 6 – Estimated mean grades for each of the approaches, with increasing standard deviation of measurement error associated with the secondarysamples in the biased cases. CK estimates for negative and positive bias are coincident, as are the MCCK estimates
Table I
Summary of recommendations for integration of secondary data into resource estimates
Secondary data accuracy Secondary data precision Recommended integration approach
Good Good OKGood Poor OKVMEPoor Good CKPoor Poor CK

Integration of imprecise and biased data into mineral resource estimates
DELHOMME, J.P. 1976. Applications de la Theorie des variables RegionaliseesDans Les Sciences de L’Eau. Thése de Docteur – Ingénieur, UniversitiePierre et Marie Curie, Paris.
EMERY, X., BERTINI, J.P., and ORTIZ, J.M. 2005. Resource and reserve evaluationin the presence of imprecise data. CIM Bulletin, vol. 90, no. 1089. pp.366–377.
EMERY, X. 2010. Iterative algorithms for fitting a linear model of coregional-ization. Computers and Geosciences, vol. 36, no. 9. pp. 1150–1160.
GOOVAERTS, P. 1997. Geostatistics for Natural Resources Evaluation. OxfordUniversity Press.
GOULARD, M. and VOLTZ, M. 1992. Linear coregionalization model: tools forestimation and choice of cross-variogram matrix. Mathematical Geology,vol. 24, no. 3. pp. 269–286.
JOURNEL, A., 1974. Geostatistics for the conditional simulation of ore bodies,Economic Geology, vol. 69. pp. 673–688.
JOURNEL, A.G. and Huijbregts, C.J. 1978. Mining Geostatistics. Academic Press,London.
JOURNEL, A.G. and Alabert, F. 1989. Non-Gaussian data expansion in the earthsciences. Terra Nova vol. 1. pp. 123–134.
JOURNEL, A.G. 1999. Markov models for cross-covariances. MathematicalGeology, vol. 31, no. 8. pp. 955–964.
KÜNSCH H.R., PAPRITZ A., and BASSI F. 1997. Generalized cross-covariances andtheir estimation. Mathematical Geology, vol. 29, no.6. pp. 779–799.
MATHERON, G. 1979. Recherche de simplification dans un problem decokrigeage. Centre de Géostatistique, Fountainebleau, France.
MYERS, D.E. 1982. Matrix formulation of co-kriging. Mathematical Geology, vol.14. pp. 249–257.
MYERS, D.E. 1991. Pseudo-cross variograms, positive definiteness, cokriging.Mathematical Geology, vol. 23, no. 6. pp. 805–816.
OLEA, R. 1999. Geostatistics for Engineers and Earth Scientists. 1st edn. OxfordUniversity Press, Oxford.
OMAN, S.D. and VAKULENKO-LAGUN, B. 2009. Estimation of sill matrices in thelinear model of coregionalization. Mathematical Geosciences, vol. 41, no.1. pp. 15–27.
PELLETIER, B., DUTILLEUL, P., LAROCQUE, G., and FYLES, J.W. 2004. Fitting thelinear model of coregionalisation by generalized least squares.Mathematical Geology, vol. 36, no. 3. pp. 323–343.
RIVOIRARD, J. 2001. Which models for collocated cokriging? MathematicalGeology. vol. 33, no.2. pp. 117–131.
SMITH, D., LUTHERBORROW, C., ERROCK, C., and PRYOR, T. 2011. Chasing thelead/zinc/silver lining – establishing a resource model for the historicCML7, Broken Hill, New South Wales, Australia. Eighth InternationalMining Geology Conference, Queenstown, New Zealand, 22-24 August2011. Australasian Institute of Mining and Metallurgy. pp 181–189.
STANLEY, C.R. and LAWIE, D. 2007. Average relative error in geochemicaldeterminations: clarification, calculation, and a plea for consistency.Exploration and Mining Geology, vol. 16. pp. 265–274.
WACKERNAGEL, H. 2003. Multivariate Geostatistics. An Introduction withApplications. Springer-Verlag, Berlin.
XU, W., TRAN, T.T., SRIVASTAVA, R.M., and JOURNEL, A.G. 1992. Integratingseismic data in reservoir modeling: the collocated cokriging alternative.67th Annual Technical Conference of the Society of Petroleum Engineers,Washington DC. Proceedings paper SPE 24742. pp. 833–842. ◆
▲
530 JUNE 2015 VOLUME 115 The Journal of The Southern African Institute of Mining and Metallurgy

IntroductionOne of the biggest questions confronting seniormanagement of a mine, regardless of its size ormining methodology, is: ‘Why does the budgetof a mine become so far removed from realitythat it ends up being useless?’
The extraction of minerals is an expensiveendeavour, with budgets often amounting tobillions of rands, and unlike a manufacturingprocess, is based on a resource that is depletingwith each production year. There are alsofactors unique to mining that make theenvironment challenging, including the extremevolatility of commodity markets and surety ofthe mineral reserves. The usual approach todealing with these challenges is to use arigorous budgeting process.
The budget is the single most importantdocument that regulates the production of amine. All the strategies, tactics, and plans areultimately based on attaining the targets set inthe budget. Investors and executive managers
of resource companies judge performance andmake decisions primarily based on the budgetsof the mines. The budget, however, is expressedin exact amounts, which obscure (or ignore) thevariability of the mining environment.
Deviations from the budget are often waivedas uncontrollable elements or force majeuresuch as more rain than expected, unfavourableexchange rates, or strikes. Revisions to theunderlying inputs (physical standards) thatdrive the budget are sometimes considered, butthen such physical standards are also stated asexact values, ignoring their inherent variability.Random and seasonal fluctuations areaggregated into single values and treated asdeterministic. Interdependability andaccompanying (common-mode) risk isneglected. The result is that the budget does nothave a fair chance of accurately forecastingreality.
The budgeting process for a large mine isespecially complicated and arduous, needingdetailed inputs from every department over asix-month period before it is finally compiled.Although management does measure thebudget carefully, its action is only retrospective– i.e. the fact is known only after the budget hasfailed (either negative or positive) – and theautopsy then turns into finding a scapegoat.Decisions about the application of scarce capitalsometimes appear to be somewhat arbitrary.There is no decision-making methodologyestablished that dictates where funds applied(spent) will have the greatest impact on thebudget.
The importance of increasing the confidencein achieving the budget, while simultaneouslygiving the assurance that the budget is accurateand ‘strict’ enough, cannot be over-emphasized.This article proposes a methodology thataddresses the lack of budgeting accuracy byaddressing the inherent uncertainty in a miningoperation.
Stochastic simulation for budgetprediction for large surface mines inthe South African mining industryby J. Hager*, V.S.S. Yadavalli*, and R. Webber-Youngman*
SynopsisThis article investigates the complex problem of a budgeting process for alarge mining operation. Strict adherence to budget infers that financialresults align with goals. In reality, the budget is not a predetermined entitybut emerges as the sum of the enterprise’s operational plans. These arehighly interdependent, being influenced by unforeseeable events andoperational decision-making.
Limitations of stochastic simulations, normally applied in the projectenvironment but not in budgeting, are examined and a model enablingtheir application is proposed. A better understanding of budget failure inlarge mines emerges, showing that the budget should be viewed as aprobability distribution rather than a single deterministic value.
The strength of the model application lies with the combining ofstochastic simulation, probability theory, financial budgeting, andpractical scheduling to predict budget achievement, reflected as aprobability distribution. The principal finding is the interpretation of therisk associated with, and constraints pertaining to, the budget.
The model utilizes a four-dimensional (space and time) schedule,linking key drivers through activity-based costing to the budget. It offers ahighly expressive account of deduction regarding fund application forbudget achievement, emphasizing that ’it is better to be approximatelyright than precisely wrong’.
Keywordsprobabilistic logic, Monte Carlo, simulation, NPV, budget.
* University of Pretoria, South Africa© The Southern African Institute of Mining and
Metallurgy, 2015. ISSN 2225-6253. Paper receivedAug. 2014 and revised paper received Feb. 2015.
531The Journal of The Southern African Institute of Mining and Metallurgy VOLUME 115 JUNE 2015 ▲
ISSN:2411-9717/2015/v115/n6/a9http://dx.doi.org/10.17159/2411-9717/2015/v115n6a9

Stochastic simulation for budget prediction for large surface mines
MethodologyTo achieve the necessary budget accuracy, a detailedmodelling tool is required. The model should be able toreplicate the actual mining both in time and actual spatialtranslation – i.e. travelling distances and specific physicalattributes must be coupled to the mine layout and assetsutilized, taking cognisance of the particular equipment fleetand uniqueness of the beneficiation process, as well as thespecific geological factors that govern the resource. Themodel should be able to replicate the budget from firstprinciples to within 1% accuracy.
Once the detailed tool is in place and calibrated, the keyoperational performance drivers of the budget aredetermined. These are the drivers that have the mostinfluence on the budget, and also have the largest variance.The main concept is that if two or more key drivers (thathave a large impact) have large variances (as opposed totheir budget assumptions) and are interdependent of eachother, the probabilities of each can be multiplied to give anew probability. This new probability will have a larger’spread’ than either of the individual drivers. This leads toinstability in terms of budget achievement.
The problem with the above is that if too many driverswith too large a spread are chosen, the resultant probabilitywill be unrealistic and unusable, i.e. multiplication of a lot offractions quickly approaches zero (this is in all probability themain reason why stochastic simulation is unsuccessful in thebudget process and is therefore never applied). It is thereforeclear that the key drivers must be carefully selected. Thesedrivers should be compiled from different secondaryprobabilities that can be influenced (or manipulated) tooptimize the distribution of the primary probability.
This leads to the investigation of how these first-order(prime) probabilities can be influenced or manipulated toincrease confidence, so the budget can be achieved. Thelogical deduction is that it will be mostly through theapplication of money, i.e. to fix something, buy more, paysomeone to do it, etc. This culminates in the final objective,to provide a realistic budget, expressed as a probability distri-bution, and show where scarce capital should be applied toachieve the optimum return.
The basic assumption is that all parameters that caninfluence the budget will conform to some type of probabilitydistribution. The following distributions were considered:triangular, normal, and Weibull. These will be sufficient todescribe any deviation. Due to the ability of a three-parameter Weibull distribution to closely approximate anormal distribution, the normal distribution was ignored.
Probabilistic logic and ‘stochasticity’The basic aim of probabilistic logic is to make use ofprobability theory in combination with logic. Probabilitytheory is used to handle uncertainty, while deductive logic isused to exploit structure. One of the problems withprobabilistic logic is that it tends to multiply the computa-tional complexities of the probabilistic and logicalcomponents, resulting in an answer that is too vague to havepractical meaning. Jøsang (2009) remarks that probabilisticlogic by itself finds it impossible to express input argumentswith degrees of ignorance as, for examples, reflected by theexpression ‘I don’t know’. The generally accepted practice, to
provide values without supporting evidence, will generallylead to unreliable conclusions, often described as the‘garbage in - garbage out’ syndrome.
Risk and uncertaintyRisk (and the chance of loss), i.e. in the event that thesituation can lead to both favourable and unfavourableoutcomes, is the probability that the event outcome will beunfavourable, i.e. an unwanted event, while uncertainty is theindefiniteness associated with the event, i.e. the distribution ofall the possible outcomes. Uncertainty is an intangible value(Elkjaer, 2000).
The main problem with the budget is that it uses only pointestimates. Discrete estimates by themselves, are insufficient forgood decisions (US Air Force, 2007) or a good budget.
The underlying probability distributions inherent to theproduction process will influence the outcome, for example notwo trucks travel at exactly the same speed – and no two shiftsproduce exactly the same saleable product. It is thereforeobvious that the answer to achieving the budget lies in theuncertainty of these cornerstones of production, which must beunderstood so that the probability of success may be improved(or positively influenced).
It is clear that the single deterministic point value for abudget is a fallacy, since the chance of achieving it exactly in ahighly complex environment is zero. As SAP® is widely used inlarge mining environments, Table 600, which is a summary ofthe main cost buckets of the budget, was analysed as a firststep. This was further distilled by using a standard Paretoanalysis to determine the most important cost buckets. AMonte Carlo simulation was then used to give the distributionof outcomes. (This simulation failed, as is explained below).From the literature it is clear that Monte Carlo simulation isused mainly for capital budgeting of large projects (Clark,2010). Such simulations are concerned with the cost of theproject, while this model concentrates on the uncertaintyinherent in the production process and regards cost fluctu-ations as risk i.e. uncontrollable (but explainable), for example,price increases in diesel, electricity, etc.
The cost buckets were then combined to describe the costfunction, broken down into fixed and variable cost. Income(through product sales) was added to allow the results to beexpressed as a net profit (prior to tax and cost of capital). Theprobability distributions were assumed to be triangular with alowest, highest, and most probable value (US Air Force, 2007).This methodology did not work, since the multiplication ofuncertainty leads to a wider spread of probabilities – to theextent that it is clearly an irrational approach and mostprobably is the reason why Monte Carlo simulation is not usedin the standard budgeting process.
A different approach was indicated, and thedrum–buffer–rope (DBR) production planning methodologyfrom the theory of constraints (TOC), as originally proposed byEliyahu M. Goldratt in the 1980s, was considered.Schragenheim and Dettmer (2000) summarize the drum-buffer-rope as striving to achieve the following:➤ Very reliable due-date performance➤ Effective exploitation of the constraint➤ As short a response time as possible, within the
limitations imposed by the constraints.The problem with the DBR methodology is that although
▲
532 JUNE 2015 VOLUME 115 The Journal of The Southern African Institute of Mining and Metallurgy

the beneficiation plants (specifically the tipping bins of theseplants) are normally defined (through TOC) as the bottleneck,the analogy is not a true one as the mining process differs fromthe manufacturing production process. It should rather bedescribed as a trail run with a specific obstacle that all therunners have to cross. It is clear that if trucks are seen as abuffer, the logical response would be to over-truck theconstraint. However, in the analogy of trail running, this is theworst possible decision. More athletes trying to cross the sameobstacle at the same time results in more interference witheach other and a slower throughput.
Envision athletes on a trail run. Some run faster and someslower. Some stumble and block others. There is no rope(communication once the athletes are running), and this isexactly the problem with production haul trucks. Breakdowns,bad road conditions or secondary work on the road,intersections etc. cause unpredictable delays that can behandled only by stochastic methods.
The logical solution is to express the budget as aprobability distribution through examining the effect of theinputs in a logical way. By managing these distributions, thefinal shape and position of the budget distribution may beinfluenced.
The understanding of the difference between the risk anduncertainty clearly indicates that the focus must be on‘controllable factors’, as the assumption that these factors maybe influenced by money (i.e. either men, material, orequipment), holds true. This will also allow the model toindicate to management where to optimally apply funds tohave maximum impact on the achievement of the budget.
The examination of the system through the above leads todefining the ’heartbeat’ of the operation – ROM must move,and for a large surface (open pit) mine it should be on wheels –i.e. trucks. So by measuring and understanding the truck cycle,the inherent uncertainty can be quantified as a probabilitydistribution. These distributions can be manipulated throughthe application of money and will directly influence theproduction and therefore attain the budget.
Analysis of the problemThe budget needs to be expressed not as a single number, butas a range within a probability distribution. The position of thebudget point relative to the median is important, i.e. a budgetabove the median indicates a greater chance of failure, andbelow a greater chance of success. The shape of the distri-bution is also important, as a narrow spread implies a greaterchance of success, while a broader spread equates to a higherrisk environment with a greater chance of failure (Figure 1).
The variability (distribution) of most of the key drivers canbe changed through the application of funds – i.e. training ofpersonnel, appointing more personnel, buying and commis-sioning more production units, or better maintenance toimprove reliability. However, not all key drivers can beinfluenced through application of money, for example,geological variability. Furthermore, the interdependenceobscures the relationships between the drivers to the extentthat is impossible to define the value of changing an individualdriver without detailed modelling.
The detailed modelling tool must accurately simulate theschedule that will supply the activities to be priced for thebudget – activity-based costing – and the model must not
break down under probabilistic simulation, but keep theintegrity of the mine plan and three-dimensional geographicalexploitation intact. The main inputs to any mining budget arederived primarily from the past, namely: historical costs andperformance, strategy with regard to exploitation, stripping,equipment replacement, and marketing. Normally, the minewill have a life-of-mine pit shell that outlines the mineablearea. Within these limits, the mine will then develop aschedule.
The most important driver of the schedule and hence thebudget is the market forecast. It is of no, or very little, use toproduce product that cannot be sold. Constraints imposed byinfrastructure such as rail or harbour capacity are normallyviewed as part of the overall marketing plan. A great deal oftime is spent on price forecasts – for the very obvious reasonthat it is imperative to know what prices will be realized.
Next, the market plan is married to the productionconstraints or bottleneck, normally the plant capacity. Thebeneficiation plant is usually the largest capital investment,and has a fixed production ceiling that limits the totalthroughput.
The schedule is then broken down into base components.Firstly, the ROM tonnages from the different mining benchesare determined and allocated to different beneficiation plants,honouring the spatial constraints. Secondly, the specificmetallurgical characteristics of the material to be delivered tothe plants are calculated – namely yield, plant efficiency, andother modifying factors like misplaced material, etc.
The calculations are based on physical standards andnorms with the assumption that physical standards arechangeable and can be influenced by the amount of moneyavailable, whereas norms are a given. Utilization through shiftrosters and number of operators employed is then added to theequation. Broadly speaking, the budget may be divided intotwo distinct parts, namely CAPEX (sustainable and other) andOPEX (salaries, electricity etc.)
The correct way to cost a schedule is to link the tonnagesto the activities. This is commonly referred to as activity-basedcosting (ABC). This results in a budget that tries to reflectreality. However, the shortcoming is that it is based on fixedevents – i.e. events that are supposed to occur. No exceptions
Stochastic simulation for budget prediction for large surface mines
533The Journal of The Southern African Institute of Mining and Metallurgy VOLUME 115 JUNE 2015 ▲
Figure 1 –- Probability distribution – shape and size

Stochastic simulation for budget prediction for large surface mines
are allowed in the budget. In reality, nothing is absolutely fixedand this is nowhere more apparent than in the intricate andhighly complex environment of a big mining operation.
The only way to address this is by way of a differentapproach, and this leads to the introduction of risk anduncertainty, which logically implies the use of stochasticmodelling of the budget to reflect uncertainty within thepredicted cash flow.
To find the significant (i.e. key) drivers of the budget, aclassical Pareto analysis was done on the budget’s main costbuckets (Figure 2).
The following analysis demonstrates the complexity of theproblem. For example, the cost of diesel is influenced throughprice fluctuations, over which the mine has no control.However, if it is influenced by production, i.e. higherproduction will require more diesel, but if there are betterstandards (fewer litres per ton produced), the mine will requireless diesel than budgeted. It is therefore clear that a differentapproach is required to find the real drivers that will meet therequirements of a distribution that can be manipulated.
In re-examining the approach, the following alternativeview of the process is proposed. The process (in a miningenvironment) can now be summarized as follows:➤ The budget utilizes assets (production units) to mine
and to supply ROM to the plant➤ The plant beneficiates and delivers product to be sold.
To use any asset for continuous production, three thingsare required, namely capital, utilization, and maintenance. Inusing the assets, the main drivers that will influence thebudget can now be stated as:➤ Capital. Only three things can happen to capital
expenditure – it may be replaced, sustained, or increased➤ Use of assets. Assets are either being used or
maintained. If they are in use, they can be used produc-tively. The level of utilization will depend on the skillslevel of the people and the number of full-timeemployees (FTEs). Both may be changed by applyingmore money i.e. more people can be employed, or theycan be trained better. The same basic argument can beapplied to maintenance. More money can be spent onbetter maintenance (replace before failure etc.),employing more FTEs, and/or training them better.Figure 3 shows the detail.
Plant yield (which provides the link between the budgetand the geology) is one of the most important drivers in abudget, as the quantity and quality of the product drives thetotal income stream of a mine. In the geological environment,boreholes are drilled to set spatial parameters. As an example,for a coal mine, coal from the boreholes is analysed in alaboratory to determine a washability curve that gives thevarious qualities at specific densities. The information is thenspatially configured through a database coupled to a geologicalmodel. The model uses different types of growth algorithms,statistical methods etc. to predict the information in-betweenthe boreholes – normally given in a grid (or block) format.Since the predictions are not absolute but rather an approxi-mation of the truth, this imparts a ‘probability’ flavour to theprocess. It should be noted that the interpretation ofwashability gives a singular deterministic value for a specificblock of coal. However, as the analysis is done in a laboratory,there will be a difference in the results, as the operationalprocedure (i.e. production) occurs under dynamic conditions. Itis sufficient to note that the yields will rarely be better thanexpected. The next problem is caused by the operationalprocedure followed in product bed-building. Production bedsare normally required to conform to very strict quality specifi-cations. It is standard practice, to build a product bed with aslightly higher than required quality, as it is easier to add low-grade material rather than above-grade in the beneficiationenvironment. When the bed is of too high a grade, nobodyworries, and there may even be some bonuses. However, if thebed is out of specification on the ‘poor’ side, the company mayincur large penalties or even rejection of the product by thecustomer. Because of this principle, and coupled to the fact thatthe beneficiation curve is not linear, it is common knowledgethat one never gains on the upswing what is lost on thedownswing. The schedule determines the time when a specificmining block will be beneficiated.
The methodology proposed here, is to take cognisance ofthe ‘stochasticity’ and to introduce variability with a triangularstochastic distribution as suggested by Clark, Reed, andStephan (2010). With this triangular distribution, the Arena®
model will simulate operator error and variability, which willrepresent reality much closer than utilizing a single
▲
534 JUNE 2015 VOLUME 115 The Journal of The Southern African Institute of Mining and Metallurgy
Figure 2 – Pareto analysis of main cost buckets Figure 3 – Interaction of Table 600 with the production process
deterministic value. As expected, the yield will form a distri-bution around the budget figure.
Although the uncertainty assumed for the evaluation of theDereköy copper deposit (Erdem et al., 2012) demonstrates aprobability curve of NPV, it ignores the time component inrelation to the actual mining of the deposit. This is a seriousshortcoming, as a financial budget is by default a forecast ofmonetary flow over time. The mining operator can influencethis to a large extent – for example, high-grading early on willincrease the NPV, etc.
The geology and other mining conditions are given inputsto the budget. These are accessed through the miningschedule, which links time-based production outcomes to thebudget. This is done with scheduling software (XPAC®), wherethe yield and plant relationships that will exist sometime in thefuture are derived through a time-based production schedule.The resultant product mix will impact on logistics andmarketing constraints if more than one product is sold. Thissolution may then be used to calculate the revenue or income,culminating in the final budget figure, expressed as a netprofit.
The above description is a somewhat simplified version ofthe actual process, but based on logic and demonstrablyaccurate enough to deal with the myriad of confusing interrela-tionships that exist in such a complex environment.
Rigidity of the mine planThe development or mining of an open pit follows very strictrules, i.e. the pit may be described in terms of a series ofconsecutive pit shells, governed by the need to keep the slopesat stable angles and have roads and ramps in place for accessto specific mining blocks. Although some deviations arepossible, for a given budget period the interrelationshipbetween the different material types will have a fixedcorrelation, for example the pit slope has to be maintained, sothe percentage distribution between benches will stay thesame, but with increased production the slope will move faster,and with decreased production, it will move slower.
The haul truck – defining the heartbeatA truck carries a payload that is not a fixed tonnage but mayvary considerably. There are specific factors that cause this,e.g. the load-tray design, loader operator expertise, loose bulkdensity of the material (i.e. after blasting) and the type ofmaterial, which all vary considerably for any given pit.Overloading will lead to spillage, and exceeding the maximumcarrying capability will cause damage to the truck.
A truck moves material from a given point to a fixeddestination – normally from a series of mining benches to aplant or crushing facility, or in the case of overburden to awaste dump. A truck haul cycle consists of the followingcomponents: full hauling, queue at bin, tip, empty hauling,queue at loader, spot, load, and the cycle starts again.
It is clear that there is a rigidly defined or fixed number ofproduction hours per year, day, or month during which thetruck may be utilized. During this time the truck must operatenot only productively, but also be maintained. Waiting times(times not spent hauling) should be as short as possible.
Probabilistic methodologyThe logic component is clearly defined in the budget process.Combining this with a probabilistic approach aims to determine:
➤ What do the confidence levels look like for a givenbudget?
➤ Could the application of probabilistic logic influence theinherent risk of non-compliance with the budget?
➤ Will a stochastic approach allow the budget owner toestablish a target probability with a higher confidencelevel?
To answer these questions, the impact on the budget orthe achievement thereof must be simulated in a stochasticenvironment. The problem with this statement is that settingup the model and running it takes up to 40 minutes per run.A true stochastic simulation would therefore take approxi-mately 2 years to complete.
Probabilistic cash flow modelFrom the literature it is clear that stochastic simulation is notapplied to the prime financial budget, but is used to assesseither the risk or the cost associated with large projects.
A systematic approach to modelling of the budget isneeded that will allow simulation of results under a variety ofpossible scenarios. In other words, simulated net cash flowwith extreme movements within the controllable budgetinputs, such as fluctuations in the norms and standards thatunderpin the budget, is required. In summary, the modelpredicts the potential loss or profit in relation to the budgetover a defined period, reflecting a probability distribution forwhich a given confidence interval can be assumed for theachievement (or non-achievement) of the budget. (Budgetrisks such as higher inflation, higher diesel prices, underper-forming assets, and declining revenues cannot be ignored,since for a large mine the influence of these risks may besignificant enough to threaten the company’s ability to fundnew projects, pay dividends, and impair cash flow).
Model interaction – probabilistic methodology (Figure 4)A methodology that will keep the space-time interrelationshipintact, honour the integrity of the mine plan while takingcognisance of the budget complexity, and meet the simulationcriteria with regard to computing time constraints is needed.
As explained, the initial phase is a modelling tool thatwill link the mining schedule to the budget. The Xpac®
model, which drives the tonnage schedule on which thebudget is based, is used to obtain bench information for tons,hours, cycles, payload, and destination – i.e. from where(which blast block) to which plant or overburden dump.
Next, the translation model describes the budget in termsof tons. Simultaneously, the costing (ABC) model is used togive inputs to the exposure model for the different variables.The exposure model balances the bench ratios etc.
The fundamentals and statistics interact to derive a modelwith economic logic – in other words, a basic cash flow modelunderpinned by logic. The macroeconomic variables ordrivers that have a significant influence on the budgetperformance can now be entered and distributions for theidentified drivers applied. Risk is derived from random,unexpected deviations from the forecasts.
Finally, a stochastic process (an Arena® Dynamicsimulation model) is used to simulate values of the variablesby randomly picking observations from theirvariance/covariance matrix.
Stochastic simulation for budget prediction for large surface mines
The Journal of The Southern African Institute of Mining and Metallurgy VOLUME 115 JUNE 2015 535 ▲

Stochastic simulation for budget prediction for large surface mines
Deriving the budget description in a mathematicalexpression
The budget ƒ can be described from Xeras® in terms offixed (Fc) and variable costs (Vc). The variable costs are afunction of ROM tons, which are a function of operationalperformance (OP).
Budget (Pareto-based) cost function ƒ = Fc_Other + Fc_Salaries + (Vc_Salaries x tons)+ Fc_Energy + (Vc_Energy x tons)+ Fc_Diesel + (Vc_Diesel x tons)+ Fc_Plant Maintenance + (Vc_Plant Maintenance x tons)+ Fc_Maintenance + (Vc_Maintenance x tons)+ Fc_Explosives + (Vc_Explosives x tons)
Budget Income ƒ = (AvePrice x tons)ROM tons can be described by the operational performance
drivers. These drivers can be described by probability distrib-utions which can be measured and managed and influenced.The relationship between the operational performance driversand tons can be determined with a function. The mainoperational performance drivers are:➤ Maintenance (availability and utilization)➤ Operators (FTEs, skills, production rate)➤ Fleet units.
Stochastic simulationThe Arena® Dynamic simulation model was used to simulatethe cash flow model analysis. The objective of the model is tovary chosen business drivers in order to obtain a net cash flowdistribution for the budget.
The model uses Excel® driver inputs (per destination perbench) obtained from an Xpac® life-of-mine schedule. Typicaldriver inputs like cycle times, bench ratios, payloads, fleethours, and physical standards are read in by the model. Themodel then uses probability distributions to independently varythe drivers like cycle times, payloads, and fleet hours, alsomaking provision for force majeure events and operatorabsence.
The model adjusts the driver values and then ensures thatthe fleet size and bench ratio are kept constant in order tosimulate new bench tons and product tons. The model hasproduct prices per bench, per destination, and per product, andalso has the variable and fixed costs as derived from the Table600 Budget, in order to calculate a net cost and net income.
Ten thousand variable runs of each independent driver aresimulated and the values are recorded in order to apply astatistical analysis of the net profit spread using an Excel®input sheet with built-in formulae for evaluation. BecauseArena® does not use ’time’ in the sense that the schedulingmodel does, an extra iteration to limit the total productionhours available had to be implemented. This increased thecomplexity of the model without influencing the stability.
The final Monte Carlo model was also expanded to be ableto ‘randomize’ more than one parameter simultaneously so thatinfluence on the budget of any combination of parameters canbe tested . The interaction between the different environmentsand accompanying models is depicted in Figure 4.
Data usedThe data for the probability distributions is obtained from themine’s history through a sequel server database. Values aregenerated fitting Weibull distributions with an Excel®-linkedspreadsheet.
The curves fitted are three-parameter Weibull curves. Themaximum likelihood estimation (MLE) method is generallyconsidered to be the best method for estimating the curveparameters for a two-parameter Weibull curve (balancingresources and accuracy), but poor with three-parametermethods (Cousineau, 2009). Therefore the method forestimating the shape of the distribution is a modified MLE,which intelligently identifies the offset parameter beforeapplying the MLE. The accuracy of the resulting curve hasproven to be consistently adequate during testing on real data.Some results are shown below in graphical format asprobability distribution and cumulative probability distributioncurves.
The following are examples of curve-fitting to real data asobtained from the dispatch sequel server database: Thepayload distribution (depended on the material density) andtotal cycle times are shown. Not shown, but fitted, were: emptyhauling time, spot time, queuing, loading, full haul, dump, andreassign time. From a visual inspection it is clear that themethodology applied, i.e. using a three-parameter Weibullcurve-fitting technique, yields the desired results. Typicalresults obtained are shown in Figures 5 and 6.
ResultsThe following results are based on a real case study. Thebudget has been normalized so as not to release sensitiveinformation. The answers are given in profit units, called netprofit, and expressed as millions of rands.
In the analysis that follows, it must be borne in mind thatthe budget was completed at least 3 months prior to the start ofthe budget year. The cycle time and payload information thatwere used were the actual for 3 months into the budget, as wellas the preceding 3 months, i.e. 6 months of real-time data. Allexamples refer to a large open pit mine.
Cycle and payload In this particular example, the mine had a problem, prior tobudgeting, with the standards used cycle times. They eitherwere under pressure not to drop the physical standards toomuch, or did not fully understand the implication of the trendthat they were seeing, or a combination of both. It would
▲
536 JUNE 2015 VOLUME 115 The Journal of The Southern African Institute of Mining and Metallurgy
Figure 4 – Model interaction

appear that they thought that the longer cycle times could becountered by increasing the payloads that the trucks werecarrying. In other words, they ‘under-budgeted’ on payloads.
Figures 7 and 8 show the situation. The budget was set at1862 units (Table I). The effect of the poor cycle times at 50%results in a target of 1401 – below the budget. It is clear thatthe effect of the cycle time deterioration was not apparent whenthe budget was compiled. The strategy of countering the poorcycle time performance with loading (1933 units at 50%) isobviously not working as the increase in payload moves thetarget to only 1554 units compared with a budget of 1862,clearly indicating that the budget will be at risk.
Production hours (FMs)In the following example, the influence of lost productionhours is examined (see Table II). A triangular distribution isdeemed to be the best fit to describe this problem, as depictedin Figure 10. The mine has on average two trucks down, eitherthrough an accident or an unforeseen rebuild. Section 54(Mine Health and Safety Act) stoppages cause a loss of onaverage four production days. The rest of the loss is made upof ‘truck standing no operator’ (dispatch code). The fit for thedata is a triangular distribution with a mean of 21 340production hours, less 10% plus 5% (these events are seen asa force majeure, hence the terminology FM.) The mean drops to1519 against the budget of 1862, with a very narrow distri-bution as indicated (Figure 10).
Yield (influence)Because yield causes a distribution around the budget line(Figures 9 and 10) it gives a target of only 1802 against thebudget of 1862, as expected.
Murphy (if everything that can go wrong, goes wrong)It is clear that if all of the above events occur, then the results(called ‘Murphy’) are catastrophic, with a mean of only 1345units.
Example of capex optimizationThe following example demonstrates the power of the model todetermine where money should be spent. In striving to achievethe budget, the mine now has the option of:➤ Spending R10 million on upgrading the roads and
improving the rolling resistance. This gives a minimumadvantage of 2 minutes per cycle and a maximum of 4minutes per cycle
➤ Alternatively, buy two additional trucks for R75 million,which will add 2 x 5500 hours = 11 000 hours for theyear.
The results are compared in Table III and Figures 11 and 12.
The mean moves from 1401 to 1542 with two extra trucks,or 142 units. If the cycle is adjusted by 2 minutes, (throughbetter roads) it moves to 1570, generating 159 units. A savingof 4 minutes will give 248 units. It is clear that the betteroption will be to spend money on the roads instead of buyingmore trucks.
ConclusionMonte Carlo simulation is not widely used in the industry as abudgeting tool, although there are a few examples of it beingused mainly for capital budgeting and the prediction of thevariations within the budget. The main reason for it not beingused in the normal budget process is that the multiplicationeffect of the distributions of the key budget drivers leads to aspread in the budget distribution that gives an unreliableconclusion, or no conclusion at all.
The strength of the probabilistic logic model lies in thedetermination of the main drivers (first-order) that areindependent of each other and can be influenced through theapplication of money. Probability logic offers a highlyexpressive account of deduction of where funds should beapplied to optimally influence the achievement of the budget.
The probabilistic logic model circumvents the originalproblem of expressing the budget as a single deterministic
Stochastic simulation for budget prediction for large surface mines
The Journal of The Southern African Institute of Mining and Metallurgy VOLUME 115 JUNE 2015 537 ▲
Figure 5 – Payload data fit
Figure 6 – Cycle time data fit

Stochastic simulation for budget prediction for large surface mines
▲
538 JUNE 2015 VOLUME 115 The Journal of The Southern African Institute of Mining and Metallurgy
Figure 8 – Probability distribution – cycle time and payload
Table II
Yield and FMs added to cycle time and payload
Base case Cycle and payload HRS/FM Yield Murphy
Description R m net profit R m net profit R m net profit R m net profit R m net profit
Low (5%) 1 862 1 154 1 472 1 731 977Mean (50%) 1 862 1 554 1 519 1 802 1 354High (95%) 1 862 1 987 1 570 1 861 1 774Median 1 862 1 544 1 519 1 802 1 341Mode 1 862 1 580 1 524 1 803 1 357
Figure 9 – Cumulative probability distribution – yield and FMs added tocycle time and payload
Figure 10 – Probability distribution – yield and FMs added to cycle timeand payload
Table I
Cycle time and payload *
Base case Cycle Payload Cycle and payload 0
Description R m net profit R m net profit R m net profit R m net profit R m net profit
Low (5%) 1 862 1 064 1 730 1 155 -Mean (50%) 1 862 1 401 1 933 1 544 -High (95%) 1 862 1 756 2 142 1 986 -Median 1 862 1 395 1 931 1 544 -Mode 1 862 1 430 1 981 1 540 -• 0 indicates a control run
Figure 7 – Cumulative probability distribution – cycle time and payload

value by using the related activity-based costing, so that whenstandards change the influence is clearly reflected in the newprobability distribution of the budget.
The robustness of the model is guaranteed through theexploitation part of the model that directly links the deviationin standards to production. Correcting standards through theapplication of men, materials, or money is something thatmanagement has been trained to do and is good at. The impactand value of changing the standards are directly reflected inthe probability of achieving the budget.
The stochastic model uses real data wherever possible.Hubbard (2010) makes the point that the model should onlybe accurate enough, and states that uncertainty can beovercome by adding more complexity to the model. This isprecisely wrong in the stochastic modelling environment. The
robustness of the model proposed lies in the fact that it differ-entiates between the primary drivers and secondary driverswhich, while appearing to be important, generate so muchnoise that the answers become invaluable or worthless.
Testing of a real budget proved the ability of the model andthe value that may be unlocked through this novel approach.
AcknowledgementsThe authors wish to thank Professor Kris Adendorff for hisvaluable comments.
Acronyms➤ Arena® - Simulation software➤ force majeure – Act of God, i.e. unforeseen and
uncontrollable➤ Murphy – Refers to Murphy’s Law, an adage typically
stated as ‘Anything that can go wrong will go wrong’ ➤ SAP® - Enterprise software used in the industry➤ Table 600 – A generic budget summary used in SAP®➤ Xeras® - Software from the Rung suite for costing
schedules➤ XPAC® – Scheduling software from the Runge suite,
widely used in mine planning
ReferencesCLARK, V., REED, M., and STEPHAN, J. 2010. Using Monte Carlo Simulation for a
Capital Budgeting Project. Management Accounting Quarterly, vol. 12, no. 1.pp. 20–31.
COUSINEAU, D. 2009. Nearly unbiased estimators for the three-parameter Weibulldistribution with greater efficiency than the iterative likelihood method.British Journal of Mathematical and Statistical Psychology, vol. 62, part 1.pp.167–91. http://www.ncbi.nlm.nih.gov/pubmed/18177546 [Accessed 18September 2013].
ELKJAER, M. 2000. Stochastic budget simulation. International Journal of ProjectManagement, vol. 18, no. 2. pp.139–147.http://linkinghub.elsevier.com/retrieve/pii/S0263786398000787.
ERDEM, Ö., GÜYAGÜLER, T., and DEMIREL, N. 2012. Uncertainty assessment for theevaluation of net present value : a mining industry perspective. Journal ofthe Southern African Institute of Mining and Metallurgy, vol. 112, no. 5.pp.405–412.
HUBBARD, D.W. 2010. How to Measure Anything: Finding the Value of“Intangibles” in Business. 2nd edn. Wiley.
JØSANG, A. 2009. Subjective Logic. Representations, vol. 171 (January). pp. 1–8.http://persons.unik.no/josang/papers/subjective_logic.pdf.
US AIR FORCE. 2007. Cost Risk and Uncertainty Analysis Handbook. TecoloteResearch Inc., Golera, CA. pp. 153–178.
SCHRAGENHEIM, E. and DETTMER, H.W. 2000. . Simplified drum-buffer-rope. Awhole system approad to high velocity manufacturing. Goal SystemsInternational, Port Angeles, WA, USA. ◆
Stochastic simulation for budget prediction for large surface mines
The Journal of The Southern African Institute of Mining and Metallurgy VOLUME 115 JUNE 2015 539 ▲
Figure 11 – Cumulative probability distribution – capex optimization
Figure 12 – Probability distribution – capex optimization
Table III
Capex optimization
Base case Cycle Cycle 2 min saving Cycle 4 min saving 2 New trucks + cycle
Description R m net profit R m net profit R m net profit R m net profit R m net profit
Low (5%) 1 862 1 065 1 190 1 241 1 179Mean (50%) 1 862 1 401 1 570 1 649 1 542High (95%) 1 862 1 757 1 975 2 084 1 928Median 1 862 1 395 1 562 1 641 1 536Mode 1 862 1 397 1 545 1 643 1 545

e information visit our website on www.bme.co.zaFor more
KIMBERLEYTel: +27 53 832 3983Fax: +27 53 832 3984Cell: +27 82 566 0556
PROBE CAMSTel: +27 13 697 0660Fax: +27 86 570 1036Cell: +27 82 901 1206
WITBANKTel: +27 13 692 4161 Fax: +27 13 692 3337Cell: +27 82 925
JOHANNESBURG Tel: 0861 113 507Tel: +27 11 453 0924 Fax: +27 11 453 2141
RUSTENBURGTel: +27 14 596 6285Fax: +27 14 596 6574Cell: +27 83 378 9842
EmployeeLock KeyONE
SAFETY AND PRODUCTIVITY
POWERSTEP
®
SAFETY ACCESS SYSTEMSSimply a STEP in the right direction
INTEGRATED MINING TECHNOLOGIES
COLLISION AVOIDANCE SYSTEMS
PROBE MOZAMBIQUETel: +258 239 21948Cell: +258 82 501 0051
S FEA YYTSAFET
Y NDA PRY AND P
RODUCTODUCTR
TIVI YYTTIVIT
STEPPOWER
ETSASAAFFSAF TYY AACCS
CCETY ACCSimplyy a STEPSimply a i i
®
CECESESSSS SYYSYSTTETEEMSMSiCESS SYSTEMSn tthe rrigght didirirecttionin the right direction

IntroductionEarthquake activity in South Africa is signifi-cantly more prevalent in the mining regions,especially gold mining, than anywhere else inthe country (Saunders et al., 2008). This hasled to a concentration of seismograph stationsof the South African National SeismographNetwork (SANSN) around mining areas. Anaccurate understanding of the attenuation isimportant to seismograph networks. It affectsnot only the results of day-to-day monitoringsuch as magnitude calculations, but alsoadvanced seismological studies such asdetermining the characteristics of the seismicsource. With the increase in the number ofseismograph stations around the gold andplatinum mining areas, a study to determinethe attenuation of seismic waves is this regionis necessary.
The region under investigation stretchesfrom the gold mines at Klerksdorp in the southto the platinum mines at Rustenburg in thenorth (Figure 1). The study region lies at thecentre of the Kaapvaal Craton and includes theeconomic mineral rich formations of theWitwatersrand Supergroup and BushveldComplex. The Q-coda method for estimatingthe attenuation parameter, Q, was applied tothe gold and platinum mining districts ofSouth Africa. Data from stations of the SouthAfrican National Seismograph Network(SANSN) at local distances were used. The
data-set includes only mining-related eventsinitiated at shallow depths (< 5 km).
S-wave coda decay has been widely usedto characterize the local, lateral heterogeneityof the shallow crust. The method, developed byAki (1969) and Aki and Chouet (1975), is astatistical approach to the coda wave amplitudedecay characterized by a single backscatteringmodel. Aki (1969) described the origin of codawaves from local earthquakes as backscatteredwaves and regarded them as a superposition ofsecondary waves, sometimes being referred toas the S-coda or QS. Aki (1969) proved thatthey could be treated entirely statistically andthat they were caused by heterogeneities in theshallow crust because of their short periodnature. The strict interpretation of Q, referredto as the quality factor, according to Langston(1989) is that it is the attenuation effect due toscattering of the elastic waves by elasticheterogeneity.
The general approach to estimating theattenuation in a country with little tectonicseismicity and a short history of recordedseismicity (Saunders et al., 2008) is to usemodels that have been derived for similarstable continental regions. One such region isNorway, which is characterized by small tomoderate, crustal earthquakes (Bungum etal.,1991). Ottemöller and Havskov (2003) usea quality factor of QS/Lg(f) = 470 f 0.7 forNorway.
Q-coda methodThe extent to which backscattered S-waves aregenerated is dependent on the heterogeneity ofthe shallow crust and is quantified as theattenuation of the medium by the parameter Q.
Aki and Chouet (1975) proposed twoextreme models to account for theobservations on the coda of seismograms.
Q-coda estimation in the KaapvaalCratonby D.J. Birch*, A. Cichowicz*, and D. Grobbelaar*
SynopsisThe Q-coda method for estimating the quality factor Q(f)= Qo(f)n was usedto characterize seismic wave attenuation in a region of the KaapvaalCraton that includes the mining areas of the Bushveld Complex andWitwatersrand Basin. Seismic waveform data, collected by locally distantstations of the South African National Seismograph Network (SANSN),consisted of mining-related events with magnitudes ranging from ML 1.8to ML 4. Q was calculated for nine different source-receiver pairs spanningthe study region. A weighted average Q based on the number of availabledata gave an estimated attenuation relation for the study region of Q(f) =327 f 0.81.
Keywordsseismic wave attenuation, coda waves, Q-coda method.
* Council for Geoscience, South Africa.© The Southern African Institute of Mining and
Metallurgy, 2015. ISSN 2225-6253. Paper receivedJan. 2014 and revised paper received Jun. 2015.
541The Journal of The Southern African Institute of Mining and Metallurgy VOLUME 115 JUNE 2015 ▲
ISSN:2411-9717/2015/v115/n6/a10http://dx.doi.org/10.17159/2411-9717/2015/v115n6a10

Q-coda estimation in the Kaapvaal Craton
Both models led to similar formulae that allowed for theseparation of the effects of the earthquake source andattenuation on coda spectra. The single backscattering modelis most frequently used to determine Q (Scherbaum andKisslinger, 1985; Lee et al., 1986; Woodgold, 1990; Gupta etal., 1998; Yun et al., 2007; Parvez et al., 2008). Aki andChouet (1975) also noted several important properties ofcoda waves that were highlighted and explained by Sato(1977). One such property is that the coda wave powerspectra of local earthquakes of different magnitudes andlocations but from the same sampling volume have a charac-teristic time-dependent decay. This serves as proof that thecoda wave train is the result of scattered S-waves for localearthquakes.
The coda wave amplitude AC(f,T) we observe on aseismogram is a function of the seismic source S(f), the siteeffect Z(f), the instrument transfer function I(f), and themedium function C(f,T).
AC(f,T) = S(f).Z(f).I(f).C(f,T) [1]
The medium function describes the geometrical spreading
and attenuation, which are responsible for the coda amplitudedecay. The source-receiver distance is small (< 100 km) andconsidered negligible when compared with the travel path ofthe backscattered waves. Thus, the sampling volume forwhich Q is calculated is much larger than the source volumewhere the seismicity is generated. In the single backscatteringmodel, scattering is considered to be a weak process and theloss of seismic energy through scattering is neglected (Akiand Chouet, 1975). The single backscattering modelexpresses the medium function as follows:
[2]
where T = lapse time; γ = geometrical spreading factor; f =frequency; Q = coda quality factor.
The lapse time is the time that has elapsed since theearthquake origin time. The geometrical spreading factor isassumed to be equal to unity for body waves and 0.5 forsurface waves. This model allows us to separate the mediumfunction from the rest by taking the natural logarithm onboth sides.
[3]
For a particular central frequency, f, the least-squares fitfor a plot of ln(AC(f,T).T) vs. T allows us to solve for thequality factor, Q.
The frequency dependence of Q was modelled as a power-law relationship of the form:
Q(f) = Qofn [4]
where Q = Qo at 1 Hz and n characterizes the frequencydependence of the attenuation in the medium.
A procedure to determine Q was written in MATLAB,using the following steps:➤ The P- and S-arrivals of raw seismograms were re-
picked to ensure accuracy. The seismograms were thentrimmed for faster processing (Figure 2)
➤ The trimmed seismograms were filtered at central
▲
542 JUNE 2015 VOLUME 115 The Journal of The Southern African Institute of Mining and Metallurgy
Figure 1 – Locality of the study region
Figure 2 – Raw seismogram from KOSH recorded at station PRYS showing the P- and S-arrivals and the 20-second coda waves interval

frequencies of 3, 4, 5, 6, 7, 8, 10, 12, 14, 16, 20, and24 Hz, using an 8-pole Butterworth bandpass filter(Figure 3)
➤ The coda waves were extracted from 20-second timewindows starting at 2Ts (Ts is the arrival time of S-wave less the origin time of the event). For lapse times> 2Ts the general form of the coda is established(Rautian and Khalturin, 1978)
➤ The rms coda amplitudes were calculated for windowsof 0.5 seconds
➤ The slope of the coda wave amplitude decay wasextracted from least-squares fits of the data, whichallowed us to solve for Q at each frequency (Figure 4)
➤ A power-law relationship (Equation 4) was modelledusing a least-squares fit of the data (Figure 5).
Certain quality control measures were employed. Thesignal-to-noise ratio of the coda was calculated by taking therms amplitude of a 5-second window of noise before the P-arrival and comparing it with that of a 5-second window atthe end of the 20-second coda wave interval. Waveformswith a ratio of less than 2.0 were not used. Any codaamplitude decay with a positive slope was rejected. Least-squares fits of the coda amplitude decay with relativestandard errors of greater than 50% were rejected.
Data descriptionWaveform data were collected for seismic events located inthe vicinity of the platinum mines near Rustenburg, the goldmines of the Central and West Rand, which form part of theWitwatersrand Basin, and the gold mines near Klerksdorp.These recordings were written at locally distant stations ofthe SANSN (viz. BFSD, KSR, MOAB, PRYS, SLR and TLEK,see Figure 6). The data includes densely clustered, smallmagnitude (ML 1.8 to ML 4) events.
Three seismograph stations of the SANSN are located inthe Klerksdorp area, resulting in source-receiver distances for
these events of 0–30 km. In all the other cases, theseismograph stations were located 50–70 km from theseismicity.
Scherbaum and Kisslinger (1985) estimated the samplingvolume for the coda waves of lapse time T as an ellipsoid withaxes a=Δ and b=vs.T/2, where Δ is the hypocentral distanceand vs the S-wave velocity, and the source and stationpositioned at the foci. For shallow mining events located atdistances > 50 km and with depths less than 5 km (thedeepest mining), we can assume that hypocentral distance isapproximately equal to epicentral distance. The average shearwave velocity in the upper 3 km was assumed to be 3.5 km/s(Kgaswane et al., 2012) and the coda wave duration was T =20 seconds. The maximum sampling volume would thereforetake the shape of an ellipsoid with the major axis a = 70 kmand minor axis b = 35 km. Since events are spread across thedifferent mining areas, the total approximate sampling volumehas an approximate diameter of 140 km. In the Klerksdorparea, BFSD, MOAB, and TLEK, sample roughly the same areadefined by a diameter of 35 km.
Figure 6 shows the source-receiver pairs that were selectedto calculate a quality factor for this study. Some stations wereused twice with nearby seismic events from two differentareas. A total of nine different pairs were used. The geology ofthe various sampled volumes is also displayed in Figure 6.
The data mainly sampled rock formations of the TransvaalSupergroup, with sources located in the igneous rocks of theBushveld Complex and sedimentary formations of theWitwatersrand Supergroup.
Results and discussionThe results are listed in Table I. The quality factor wascalculated using the vertical components of the waveformsonly, since site effects cause amplification on the horizontalcomponents at specific frequencies, which would contaminatethe results.
Q-coda estimation in the Kaapvaal Craton
543The Journal of The Southern African Institute of Mining and Metallurgy VOLUME 115 JUNE 2015 ▲
Figure 3 – Results of bandpass filtering at central frequencies 6, 10, 12, and 24 Hz

Q-coda estimation in the Kaapvaal Craton
The attenuation parameter Qo varied between 597 and115. A low Qo corresponds to a high attenuation. Theparameter n, which describes the power-law relationshipbetween Q and frequency, varied between 1.23 and 0.62. Avalue greater than unity would suggest that higherfrequencies attenuate less than the lower frequencies. This isdifficult to explain, but it could be related to the fact thathigher frequencies are more susceptible to small-scale hetero-geneities, which give rise to S-wave scattering and,ultimately, the coda waves. In this case, a higher frequencywave would be scattered more often, becoming more
prevalent in the coda and appearing to be attenuated lessthan the lower frequency waves.
The number of available data in the different areas variedsignificantly, with the lowest average number of data perfrequency being only 9, while the highest was 496. It is,therefore, best to calculate a weighted average as opposed totreating the individual results equally. This was done basedon the average number of data per frequency. The averagewas also calculated for comparison. The weighted averageyielded a quality factor of 327 f 0.81.
The ellipses 1, 7, and 8 from Figure 6 deviated from the
▲
544 JUNE 2015 VOLUME 115 The Journal of The Southern African Institute of Mining and Metallurgy
Figure 4 – Coda amplitude decay for central bandpass frequencies 6, 10, 12, and 24 Hz with a least-squares fit
Figure 5 – Q-coda attenuation relationship calculated for KOSH events recorded at station PRYS. The standard deviations for Q0 and n are given inparentheses

relatively low attenuation observed in the remaining sampledvolumes, yielding values for Qo between 186 and 115 and forn between 1.23 and 0.99. The geology does not provide anexplanation for this, since the three stations BFSD, MOAB,and TLEK would have sampled very similar rock masses.These three areas also do not have the lowest numbers ofdata available, suggesting that a lack of data is most likelynot the cause.
The least-squares fits for the attenuation power-lawrelationships are plotted in Figure 7, Figure 8 shows therelationships plotted on a geological map of the region.
Figure 9 allows for an easier comparison of the results.Apart from three outliers, the curves show good agreement.The pairings of BFSD with data from the West Rand, SLRwith data from the Central Rand, and KSR with data fromRustenburg (areas 1, 3, and 5 from Figure 6) deviate fromthe rest with a much higher quality factor (lower attenuation)
in the upper end of the frequency range. This may beattributed to similarities in the geology of the areas, since theTraansvaal Supergroup is prominent in all three samplingvolumes. Another possibility is that the stations may beexperiencing site effects, which would amplify the groundmotion at certain frequencies.
ConclusionsA Q-coda estimation following the single backscatteringmodel of Aki and Chouet (1975) was carried out for ninedifferent source-receiver pairs using seismicity recorded bylocally distant stations of the SANSN. Magnitudes of theseismic events ranged from ML 1.8 to ML 4. Q was calculatedfor the vertical component of bandpass filtered seismogramsat central frequencies of 3, 4, 5, 6, 7, 8, 10, 12, 14, 16, 20,and 24 Hz.
The majority of the results from the individual areas
Q-coda estimation in the Kaapvaal Craton
The Journal of The Southern African Institute of Mining and Metallurgy VOLUME 115 JUNE 2015 545 ▲Figure 6 – The SANSN stations and locations of seismic events that were used to calculate Q for various sections of the study region. Dashed linesdelineate the approximate sampling volumes

Q-coda estimation in the Kaapvaal Craton
▲
546 JUNE 2015 VOLUME 115 The Journal of The Southern African Institute of Mining and Metallurgy
Figure 7 – Plots of the least-squares fits for the Q-coda attenuation power-law relationships for each of the nine source-receiver pairs. The standarddeviations for Q0 and n are given in parentheses

Q-coda estimation in the Kaapvaal Craton
The Journal of The Southern African Institute of Mining and Metallurgy VOLUME 115 JUNE 2015 547 ▲
Figure 8 – The Q-coda attenuation relationships plotted on a geological map of the region
Table I
Q-coda attenuation relationships derived from the vertical components of the waveforms
Ellipse Source area Station Av. number of Qo Qo std. dev. n n std. dev. Q = Qo f n
no. data per freq.
1 Rustenburg KSR 43 115 15 1.23 0.06 115 f 1.23
2 Rustenburg SLR 9 390 128 0.74 0.14 390 f 0.74
3 Cent. Rand SLR 24 597 106 0.72 0.07 597 f 0.72
4 West Rand PRYS 496 356 14 0.73 0.02 356 f 0.73
5 West Rand BFSD 37 421 70 0.84 0.07 421 f 0.84
6 Klerksdorp PRYS 105 367 29 0.74 0.03 367 f 0.74
7 Klerksdorp BFSD 116 131 11 1.06 0.04 131 f 1.06
8 Klerksdorp MOAB 56 186 27 0.99 0.06 186 f 0.99
9 Klerksdorp TLEK 53 529 67 0.62 0.05 529 f 0.62
Average 344 169 0.85 0.2 344 f 0.85
Weighted average 327 115 0.81 0.15 327 f 0.81

Q-coda estimation in the Kaapvaal Craton
showed good agreement with each other, while three of thenine areas showed a significantly higher Q in the upper endof the frequency range.
The results confirm that a low-attenuation model is suitedto this stable continental region, although Q(f) is slightlylower than what was proposed for Norway. A calculation ofthe weighted average, based on the number of available data,yielded a quality factor vs. frequency power-law relation ofQ(f) = 327 f 0.81 for the study region. We conclude that whilethe local attenuation may vary significantly, a suitableattenuation model for the region is given by the weightedaverage of the individual constituents.
References
AKI, K. 1969. Analysis of the seismic coda of local earthquakes as scatteredwaves. Journal of Geophysical Research, vol. 74, no. 2. pp. 615–631.
AKI, K. and CHOUET, B. 1975. Origin of coda waves: source, attenuation andscattering effects. Journal of Geophysical Research, vol. 80, no. 23. pp.3322–3342.
BUNGUM, H., ALSAKER, A., KVAMME, L.B., and HANSEN, R.A. 1991. Seismicity andseismotectonics of Norway and nearby continental shelf areas. Journal ofGeophysical Research, vol. 96. pp. 2249–2265.
GUPTA, S.C., TEOTIA, S.S., RAI, S.S., and GAUTAM, N. 1998. Coda Q estimates inthe Koyna Region, India. Pure and Applied Geophysics, vol. 153. pp.713–731
JOHNSON, M.R., ANHAEUSSER, C.R., and THOMAS, R.J. (eds). 2006. The Geology ofSouth Africa. Geological Society of South Africa and Council forGeoscience, Johannesburg/Pretoria. 691 pp.
KGASWANE, E.M., NYBLADE, A.A., DURRHEIM, R.J., JULIÀ, J., DIRKS, P.H.G.M., andWEBB, S.J. 2012. Shear wave velocity structure of the Bushveld Complex,South Africa. Tectonophysics, vol. 554–557. pp. 83–104.
LANGSTON, C.A. 1989. Scattering of long-period Raleigh waves in Western NorthAmerica and the interpretation of Coda Q measurements. Bulletin of theSeismological Society of America, vol. 79, no. 3. pp. 774–789.
LEE, W.H.K., AKI, K., CHOUET, B., JOHNSON, P., MARKS, S., NEWBERRY, J.T., RYALL,A.S., STEWART, S.W., and TOTTINGHAM, D.M. 1986. A preliminary study ofcoda Q in California and Nevada. Bulletin of the Seismological Society ofAmerica, vol. 76, no. 4. pp. 1143–1150.
OTTEMÖLLER, L. and HAVSKOV, J. 2003. Moment magnitude determination forlocal and regional earthquakes based on source spectra. Bulletin of theSeismological Society of America, vol. 93, no. 1. pp. 203–214.
PARVEZ, I.A., SUTAR, A.K., MRIDULA, M., MISHRA, S.K., and RAI, S.S. 2008. Coda Qestimates in the Andaman Islands using local earthquakes. Pure andApplied Geophysics, vol. 165. pp. 1861–1878.
RAUTIAN, T.G. and KHUALTURIN, V.I. 1978. The use of the coda for determinationof the earthquake source spectrum. Bulletin of the Seismological Society ofAmerica, vol. 68, no. 4. pp. 923–948.
SATO, H. 1977. Energy propagation including scattering effects single isotropicscattering approximation. Journal of Physics of the Earth, vol. 25. pp.27–41.
SAUNDERS, I., BRANDT, M., STEYN, J., ROBLIN, D., and KIJKO, A. 2008. The SouthAfrican National Seismograph Network. Seismological Research Letters,vol. 79, no. 2. pp. 203–210.
SCHERBAUM, F. and KISSLINGER, C. 1985. Coda Q in the Adak seismic zone.Bulletin of the Seismological Society of America, vol. 75, no. 2. pp.615–620.
WOODGOLD, C.R.D. 1990. Estimation of Q in Eastern Canada using coda waves.Bulletin of the Seismological Society of America, vol. 80, no. 2. pp.411–429.
YUN, S., LEE, W.S., LEE, K., and NOH, M.H. 2007. Spatial distribution of coda inSouth Korea. Bulletin of the Seismological Society of America, vol. 97, no.3. pp. 1012–1018. ◆
▲
548 JUNE 2015 VOLUME 115 The Journal of The Southern African Institute of Mining and Metallurgy
Figure 9 – Q-coda relationships with frequency plotted for comparison

IntroductionGood investment decisions are based onreliable decision-making tools. In the geomet-allurgical field, decision-making tools arecommonly models designed to predict ore oroperational characteristics such as dilution,particle size, throughput, recovery, etc. Theresults lead to better design, investment, andoperational decisions. Geometallurgical modelscan generate the information necessary tomake better design evaluations in order tosupport business plans. The Batu Hijauthroughput model (Wirfiyata and McCaffery,2011) is a good example of how geometal-lurgical models can be applied to optimize theproduction plan and to improve the plantcircuit. The changes made led to a throughputrisk reduction of approximately 5%.
Geometallurgical models can be developedusing physical kinetic methods or statisticalmodels. An example of a physical kineticmodel is the geometallurgical modelling of theCollahuasi flotation circuit (Suazo et al.,2010), in which the flotation rate constant wasmodelled by using the collision-attachment-
detachment approach. The variables were gasdispersion properties, flotation feed particlesize distribution, and operational andequipment parameters. Another example of theuse of physical kinetic models to predictrecoveries in flotation is the calculation ofinduction times, i.e., the time required forthinning and rupture of the water film betweenparticles and bubbles (Danoucaras et al.,2013). Adopting the microkinetics modellingapproach and using induction time, it waspossible to obtain similar results to the actualrecovery of galena in four different sizeclasses.
Physical kinetic models are difficult toimplement and update timeously, and in suchcases statistical models can be developedbased upon different kinds of operational data,such as mineralogy, hardness, particle size,hydrodynamic characteristics, and alteration.Here, it is important to note that input datamay come from two sources: laboratory data orplant operational data. In the first case, thereare more uncertainties related to the scale-upprocess (Ralston et al., 2007) than foroperational-related data.
In the current study, Chuquicamata plantoperational data on mill feed grades, orehardness, particle size, mineralogy, pH, andreagents, representing several months ofoperation, was collected to predict recovery atthe plant.
As stated by Coward et al. (2009) thevariables that have the most impact on theprocesses of mining and treatment must beidentified to determine those that need to bemeasured. Geometallurgical models need to bewell specified. In the current study, a recent
Geometallurgical model of a coppersulphide mine for long-term planningby G. Compan*, E. Pizarro†, and A. Videla*
SynopsisOne of the main problems related to mining investment decisions is the useof accurate prediction models. Metallurgical recovery is a major source ofvariability, and in this regard, the Chuquicamata processing plant recoverywas modelled as a function of geomining-metallurgical data and orecharacteristics obtained from a historical database. In particular, the data-set gathered contains information related to feed grades, ore hardness,particle size, mineralogy, pH, and flotation reagents. A systemic approachwas applied to fit a multivariate regression model representing the copperrecovery in the plant. The systemic approach consists of an initialprojection of the characteristic grinding product size (P80), based uponenergy consumption at the particle size reduction step, followed by aflotation recovery model. The model allows for an improvement in theinvestment decision process by predicting performance and risk. The finalgeometallurgical model uses eight operational variables and is asignificant improvement over conventional prediction models. A validationwas performed using a recent data-set, and this showed a high correlationcoefficient with a low mean absolute error, which reveals that the geomet-allurgical model is able to predict, with acceptable accuracy, the actualcopper recovery in the plant.
Keywordsgeometallurgical modelling, multivariate regression, recovery prediction.
* Mining Engineering Department, PontificiaUniversidad Católica de Chile, Chile.
† Applied Technology Director, ChuquicamataUnderground Mining Project, CODELCO.
© The Southern African Institute of Mining andMetallurgy, 2015. ISSN 2225-6253. Paper receivedDec. 2014 and revised paper received Feb. 2015.
549The Journal of The Southern African Institute of Mining and Metallurgy VOLUME 115 JUNE 2015 ▲
ISSN:2411-9717/2015/v115/n6/a11http://dx.doi.org/10.17159/2411-9717/2015/v115n6a11

Geometallurgical model of a copper sulphide mine for long-term planning
technique that allows selection of variables based on the F-test was used to select the best regression variables set. Theuse of a correct set of variables made it possible to formulatean accurate prediction using as little information as possible.As shown by Berry (2009), reliable geological data input andcorrect interpretation include two-thirds of all the problemsexperienced as a consequence of using geometallurgicalmodels.
Recovery is one of the most important variables for amining project, and defines the performance of the mineralconcentration process. In economic terms, the income of aconcentrator can be calculated in a simple form as follows:
E = P · g · T · R [1]
where P is the net price of the valuable metal, which isusually defined by the market; g is the ore feed grade, whichis defined as the result of the cut-off grade policy applied bythe mine plan; and T is the mill plant throughput, whichshould be fulfilled to achieve a fixed production capacity.Finally, the recovery is an intrinsic variable of the concen-tration process and it can be managed in long-term planningby operative decisions.
It is well known that accurate forecasting of recovery isimportant due to its significance for the economic viability ofa project and because it is a variable of major impact onprocessing plant results. A good recovery prediction modelmakes it possible to take mitigation and control actions toguarantee a minimum return on investment. Differentapproaches have been taken in modelling recovery. It iscommon to use variables related only to the flotation cell(Nakhaei et al., 2012; Danoucaras et al., 2013; Hatton andHatfield, 2012), although a systemic approach which islinked to grinding and flotation models could yield betterresults (Bulled and McInnes, 2005).
HypothesisThe aim of this study is to model ore recovery as a functionof operational data and ore characteristics obtained from anhistorical database at the Chuquicamata A2 plant with the
idea of contributing to long-term management decisions andplanning mitigation initiatives in the event of majordeviations in plant performance. The data-set gathered wasmodified using a multiplier factor for confidentialitypurposes.
In this study, a multivariate regression method wasapplied to develop a recovery model based on knownoperational variables.
A general form for a regression model is as follows:
[2]where yi is the variable to be modelled, βj is a set of constantparameters, and xij are the regressors or explanatoryvariables for j going from 0 to n. Each variable in the data-setwas normalized for easier interpretation of the constantparameters as shown in Equation [3]:
[3]
where xi represents the average of the variable along thehistorical set of data. Therefore, a higher constant value βjmeans higher significance of the variable xi in the regression.
Chuquicamata plant descriptionThe Chuquicamata copper mine is owned and operated byCODELCO, a Chilean state-owned company since 1976. It islocated in the northern part of Chile, near Calama, 215 kmnortheast of Antofagasta. Chuquicamata produces coppercathodes from concentrate obtained at three different plantfacilities named A0, A1, and A2, each with different processtechnologies, depending upon the time they were built. Asimplified process flow chart is shown in Figure 1
The A0 plant was built in 1952. It operates a conven-tional milling circuit designed to process 74 kt/d. It consistsof 13 grinding circuits in parallel, each having one rod mill(10×14 ft, 597 kW) and two ball mills (10×12 ft, 597 kW).The A1 mill was built in 1983. It is designed to process 38kt/d and operates three parallel grinding circuits, each having
▲
550 JUNE 2015 VOLUME 115 The Journal of The Southern African Institute of Mining and Metallurgy
Figure 1 – Chuquicamata plant flow sheet

one rod mill (13.5×18 ft, 1305 kW) and one ball mill(16.5×21 ft, 2610 kW). Finally, the A2 mill, built in 1989,operates two parallel SAG lines, each with one SAG mill(32×15 ft, 8203 kW) and two ball mills (18×26 ft, 3729 kW).Additionally, the A2 mill plant has another smaller grindingline with two ball mills (13×18 ft, 1305 kW).
Each grinding circuit is followed by a rougher frothflotation circuit. The rougher concentrate from the three millsgoes through a single cleaner, scavenger, re-cleaner, and re-scavenger circuit that produces a copper-molybdenumconcentrate. The concentrate is then transported to a selectivemolybdenum concentration plant, where separate copper andmolybdenum concentrates are ultimately obtained.
Plant operational data analysis The historical data-set contains information related to feedgrades, hardness, particle size, mineralogy, pH, and reagentdosages for froth flotation. The data-set consists of 29variables controlled daily between January and October 2013.Table I shows each variable under study.
An exhaustive statistical analysis was performed as aninitial effort to model the recovery response function. First, anormality test was conducted to understand the intrinsicvariation in recovery. Figure 2 shows the normal distributiontest applied to the data. Over the period under analysis,copper recovery at the A2 plant averaged 86.6% with acoefficient of variation of 2.5%. As the figure shows, the datafits well to a normal distribution. Although the coefficient ofvariation could be considered acceptable, it is still necessaryto identify the source of variations in the recovery responsefor accurate predictions.
With long-term evaluation studies it is common practiceto use a fixed average recovery, for instance 86%, for everyyear of the term of evaluation. This average is subsequentlycorrected by variations in copper feed grade. It is expectedthat a geometallurgical model that has a good correlationwith operational and feed characteristic parameters will leadto better results and constitute a better tool for investmentdecisions.
Ore feed sourcesThe A2 plant receives ore feed from three different mines:
Chuquicamata (DCH), which contributes 77% of all the ore feedto the plant, Radomiro Tomic (RT), which contributes 19%,and finally Minitro Hales (DMH), which contributes 4%.
Ore feed grindability Another important characteristic regarding ore feed is itswork index. Defined by Bond (1963), the work index (Wi) isthe specific energy (kWh/t) required to reduce a particulatematerial from an infinite grain size to 100 μm. Therefore highwork indexes are associated with ores which are moredifficult to grind. As defined by Bond, the specific energyrequired for a given grinding process is related to the workindex by the following expression:
[4]
where E is the specific energy consumption (kWh/t) and P80and F80 are the 80% passing sizes (μm) of the product (P)and feed (F).
Geometallurgical model of a copper sulphide mine for long-term planning
551The Journal of The Southern African Institute of Mining and Metallurgy VOLUME 115 JUNE 2015 ▲
Table I
Variables in the data-set
Parameter Variables
Ore size % +65#P80 as calculated by Bond’s equation
Work index As each originWork Index mass weighted based on the origin's throughput
Ore mineralogy Chalcocite, digenite, covellite, chalcopyrite, enargite, bornite, pyrite, molybdenite, and sphalerite mass-weighted based on theorigin's throughput
Grades Copper (Cu), iron (Fe), arsenic (As), molybdenum (Mo), zinc (Zn), lead (Pb)pH Water pH
Froth flotation circuit pHLime consumption index
Reagents Two collectorsOne frother
Flotation model Three sets of fitted parameters
Figure 2 – Normality test result for recovery at A2 plant

Geometallurgical model of a copper sulphide mine for long-term planning
An analysis of the data-set revealed that the work indexat the DCH mine is greater than that observed at RT andDMH. The DCH ore has an average work index of 14.3kWh/t, whereas the work indexes for the RT and DMH oresare 12.8 kWh/t and 12.5 kWh/t respectively. Thesedifferences indicate, as result of applying Equation [4], that itwould not be possible to achieve the same throughput for thesame P80 for the different ores from DCH, DMH, and RT. Infact, an increment in the proportion of DCH ore feed will leadto an increment in the grinding product size P80.
Ore feed mineralogyThe mineralogy of the ore feed differs depending on itsorigin. The main mineral species in the mill feed werechalcocite (Cu2S), digenite (Cu9S5), covellite (CuS),chalcopyrite (CuFeS2), enargite (Cu3AsS4), bornite (Cu5FeS4),pyrite (FeS2), molybdenite (MoS2) and sphalerite (ZnS).Copper feed grades were measured by atomic absorptionanalysis. Each feed sample was assayed for copper (Cu), iron(Fe), arsenic (As), molybdenum (Mo), zinc (Zn), and lead(Pb). Results are summarized in Table II and Table III.
As can be seen, chalcopyrite and pyrite are the mostimportant species in the DCH feed ore. The presence of pyritecould cause recovery problems, because pyrite competes withchalcopyrite for recovery by the collector during frothflotation. Chalcocite is an important species in the RT andDMH ores, and enargite is also significant in the DMH ore.
Table III shows the distribution of feed grades. As shown,the copper grade in the DMH ore is significantly higher thanin the DCH and RT ores. Another important difference is the
arsenic grade, which is very high in the DMH ore, 100 ppmon average, or more than 30 times that in the RT ore andthree times higher than in the DCH ore. The most importantissues concerning arsenic are the smelting penalties incurredand the environmental issues, given that arsenic is adangerous contaminant and must be disposed of properly.
Predicting recovery in long-term mine plans with oreblends from several sources is a complex task, usuallyleading to non-linear behaviour. Because of this, a geometal-lurgical model can be a useful tool for planning purposes ifinteractions, both positive and negative, between variablesare well captured and nonlinear relationships are recognizedat an early stage.
The systemic approachA systemic approach was applied to develop a multivariateregression model representing the copper recovery in theChuquicamata plant. The systemic approach consisted ofreducing all unit operations to a two-step sequential process,grinding and concentration (Figure 4). In this study, aprojection of the average P80 has been done based upon energyconsumption in the grinding step, and the resulting particlefeed size is the input for the froth flotation recovery model.
Geometallurgical multivariate regression modelAs stated previously, the aim of this study is to generate ageometallurgical model for copper recovery in the A2 plant.The data-set collected from Chuquicamata was used toestablish a relationship between the most significantvariables controlling the operational performance of the plant.
▲
552 JUNE 2015 VOLUME 115 The Journal of The Southern African Institute of Mining and Metallurgy
Table III
Feed grades according to source
DCH RT DMH
Average in feed Coeff. var. (%) Average in feed Coeff. var. (%) Average in feed Coeff. var. (%)
Cu (%) 0.87 16.65 0.68 7.98 1.88 13.82Fe (%) 2.16 45.20 1.09 15.90 2.39 17.63As (ppm) 28.20 50.76 3.13 5.06 100.46 30.78Mo (ppm) 32.90 19.76 10.24 28.33 10.37 95.02Zn (ppm) 48.19 45.33 11.69 10.97 63.74 50.98Pb (ppm) 8.92 38.38 1.41 61.15 36.43 22.31
Table II
Mineralogy of feed according to source
DCH RT DMH
Copper content Average in feed Coeff. var. Average in feed Coeff. var. Average in feed Coeff. var. (%) (%) (%) (%) (%) (%) (%)
Chalcocite 79.85 0.12 45 0.54 25 0.72 47Digenite 78 0.19 15 0.00 316 0.01 181Covellite 66.5 0.21 19 0.12 45 0.02 101Chalcopyrite 34.65 0.62 18 0.26 23 0.12 61Enargite 48.4 0.09 69 0.00 316 0.69 76Bornite 63.3 0.15 24 0.14 70 0.07 117Pyrite 0 0.78 16 0.26 30 1.41 29Molybdenite 0 0.05 21 - - - -Sphalerite 0 0.06 55 - - - -Others - 97.74 - 98.67 - 96.96 -

The main variables controlling copper recovery wereselected using a technique based on the Fisher test (F-test).This approach is different from other commonly-usedtechniques based on simple correlations between variablesand redundancy (Boisvert et al., 2013). The method consistsof adding or removing variables from the model, andcalculating iteratively an F-statistic and p-value for eachvariable in the model. The p-value is the probability ofobtaining a test statistic result at least as extreme or as closeto the one that was actually observed, assuming that the nullhypothesis is true. If the model contains j variables, then forany variable Xr the F-statistic is defined as follows:
[5]
where n is the number of observations, SSE(j−Xr) is thesquared error for the model that does not contain Xr, SSEj isthe squared error, and MSEj is the mean squared error for themodel that contains Xr.
If the p-value calculated for any variable in the model isgreater than a defined significance level (α), then the variableis removed. After that, if there are no more variables with ap-value to be removed, the method continues trying to add avariable on the basis of its F-statistic and p-value. If the p-value corresponding to the F-statistic for any variable not inthe model is smaller than a significance value α, then thevariable is added. The entire process is then repeated in aniterative procedure. The method ends when there are no morevariables to be removed or added (Montgomery and Runger,2002).
Analysis of variables used in the regression data-setChuquicamata has historically used a method to projectrecovery as a relationship between recovery and copper feedgrade as described by the following equation:
[6]
where K is the recovery obtained at infinite residence time inthe flotation circuit, T is a constant parameter, and θ is thecopper grade in the tailings. Using a regression technique, theequation can be fitted to the historical data. Results areshown in Table IV.
This model has a small statistical significance, with an R2
of only 7.11% over the historical database under analysis,which indicates a poor copper recovery prediction.
In order to develop a model for the recovery in the A2plant, the previously mentioned variable selectionmethodology was applied to the overall data-set. Results ofthe variable selection method for the data-set collected areshown in Table V.
Column 2 of Table V shows the correlation constant βj ofeach component. The laboratory flotation model representsthe application of Equation [6], Wi DMH is the work index ofthe DMH mill feed ore, constant is β0 in the model as definedin Equation [2], Cp is the chalcopyrite grade of the ore feed,P80 is the mill plant product size, Fe is the iron grade of themill feed, Dg is the digenite, CuS is the soluble gopper grade,and Mo is the molybdenite present in the ore feed.
This regression model (Table V) achieves a coefficient ofdetermination (R2) of 56.6%. Although these resultsrepresent a significant improvement with respect to thestandard method, they were not completely satisfactory,therefore a second-degree polynomial fit was attempted byadding second-degree terms for each of the variables. The
Geometallurgical model of a copper sulphide mine for long-term planning
The Journal of The Southern African Institute of Mining and Metallurgy VOLUME 115 JUNE 2015 553 ▲
Figure 3 – The systemic approach sequence
Table V
First regression model results
Variable Constant P-value
Lab. flotation model 123 0.000Wi DMH -28 0.051Constant -13.24Cp 6.5 0.000P80 6.5 0.143Fe -4.1 0.007Dg -2.82 0.004CuS -2.76 0.000Mo 1.37 0.027
Table IV
Parameters for copper recovery prediction modelas described by Equation [6]
K 87.694θ 0.216T 0.108

Geometallurgical model of a copper sulphide mine for long-term planning
final set of variables selected for the model were iron (Fe)and copper sulphide (CuS) feed grades, molybdenite (Mo),chalcopyrite (Cp), digenite (Dg) grades, the work index of theore from DMH (WiDMH), and product size (P80). Table VIshows the coefficients for this new regression model.
The final model has a correlation coefficient of 75.6% andcoefficient of determination (R2) of 57.2%. Table VII shows asummary of the statistics for the model.
Results and discussionThe final response function for copper recovery, based on theavailable information collected in the A2 mill plant, is asfollows:
[7]
Figure 4 shows a Q-Q plot of the measured copperrecovery vs the predicted recovery during the period underanalysis. The confidence interval is 97.5%. The actualhistorical recovery is compared with the fitted model in Figure 5.
The statistical analysis shows that recovery is moresensitive for specific variables. These variables are copperfeed grade (Cu), iron feed grade (Fe), and the work index ofthe DMH ore. This implies that for long-term projections,better control over these variables will have a beneficialimpact on the recovery projections and control variability.
Each variable in the model has a constant coefficient thatshows its impact on the copper recovery projection. Asexpected, the significant plant variables affect the recovery inthe same way that empirical evidence does. Four variablesbehave as expected: copper, chalcopyrite, the work index ofDMH, and soluble copper. The first two have a positiveimpact. As empirical evidence shows, when copper grade
▲
554 JUNE 2015 VOLUME 115 The Journal of The Southern African Institute of Mining and Metallurgy
Table VII
Final model statisticsCorrelation coefficient 75.61%Coefficient of determination (R2) 57.17%Adjusted R2 52.64%Standard error 3.25Mean absolute error 2.43%
Table VI
Final regression model results
Variable Constant P-value
Lab. flotation model 356.286 0.000Constant -264.744 0.002(WiDMH)2 -15.008 0.035Fe 12.244 0.287Fe2 -6.699 0.165P802 4.036 0.098Cp2 2.937 0.000CuS -2.876 0.000Dg2 -0.923 0.033Mo2 0.599 0.028
Figure 4 – Q-Q plot for real copper recovery vs fitted model
Figure 5 – Historical series for real copper recovery vs fitted model

increases, copper recovery also increases. The presence ofchalcopyrite has the same effect as copper grade, because inporphyry copper deposits such as DCH, RT, and DMH,chalcopyrite is one of the minerals that increases the coppergrade of the ore. On the other hand, the work index of the orefrom DMH mine and soluble copper both have a negative, orinverse, impact on copper recovery. The work index affectsthe liberation, so when the work index increases it becomesmore difficult to liberate copper-bearing minerals from theore, therefore recovery decreases. Soluble copper grade hasan expected adverse effect on flotation recovery, becausesoluble copper ore does not float under sulphide copperflotation conditions.
There are two variables which have unexpectedbehaviour: P80 and digenite. P80 has a positive impact on theestimated recovery, and digenite a negative one. Bothbehaviours are the opposite to what is expected from theempirical evidence. It is known that when P80 increasescopper liberation decreases, therefore recovery shoulddecrease. The model shows the opposite behaviour, whichcould imply that the mill plant operates at the lower boundaryof optimal grinding size. Digenite also has an unexpectedimpact on copper recovery, and further investigation of thisphenomenon is needed.
In addition there is one variable, Fe, which is presented inthe regression model in first and second degrees. Thisvariable has the expected overall effect of reducing coppergrade recovery when Fe is increased in the ore feed.
The final model shows a great advantage compared withusing an average fixed value to project recovery in medium-and long-term studies with a variable ore feed. If a fixedvalue of 86% for recovery were used to predict copperrecovery in the period under analysis, as shown in Figure 6,the mean absolute error would have been 3.9%. The finalmodel gives a mean absolute error in the same period of only2.4%, which represents a significant 1.5% improvement inrecovery.
ValidationThe recovery regression model was validated using monthlyplant data between January and July 2014. The modelprediction shows a correlation coefficient of 89.7% and amean absolute error of 2.75%. Results of the validation areshown in Table VIII and Figure 7.
The low mean absolute error and high correlationcoefficient obtained indicate that the developed model is ableto predict, within an acceptable range, the real copperrecovery in the plant.
The developed geometallurgical model is a significantimprovement compared to the current fixed value used forcopper recovery. Also, the regression equation shows that itis able to capture with confidence any variation in the feedore characteristics.
ConclusionsThe results presented show that is possible to improve, withan acceptable certainty, recovery estimations for a concen-tration process based on operating and ore characteristicsdata. The database used included information relating to feedgrades, ore hardness, particle size, mineralogy, pH, andreagent mix for froth flotation. The final regression modelused only copper, iron, and soluble copper feed grades,molybdenite, chalcopyrite, digenite, the work index of the orefrom DMH, and P80.
Geometallurgical model of a copper sulphide mine for long-term planning
The Journal of The Southern African Institute of Mining and Metallurgy VOLUME 115 JUNE 2015 555 ▲
Table VIII
Validation statisticsCorrelation coefficient 89.73%Coefficient of determination (R2) 80.51%Standard error 0.29Mean absolute error 2.75%
Figure 6 – Historical series for real copper recovery and average fixed value
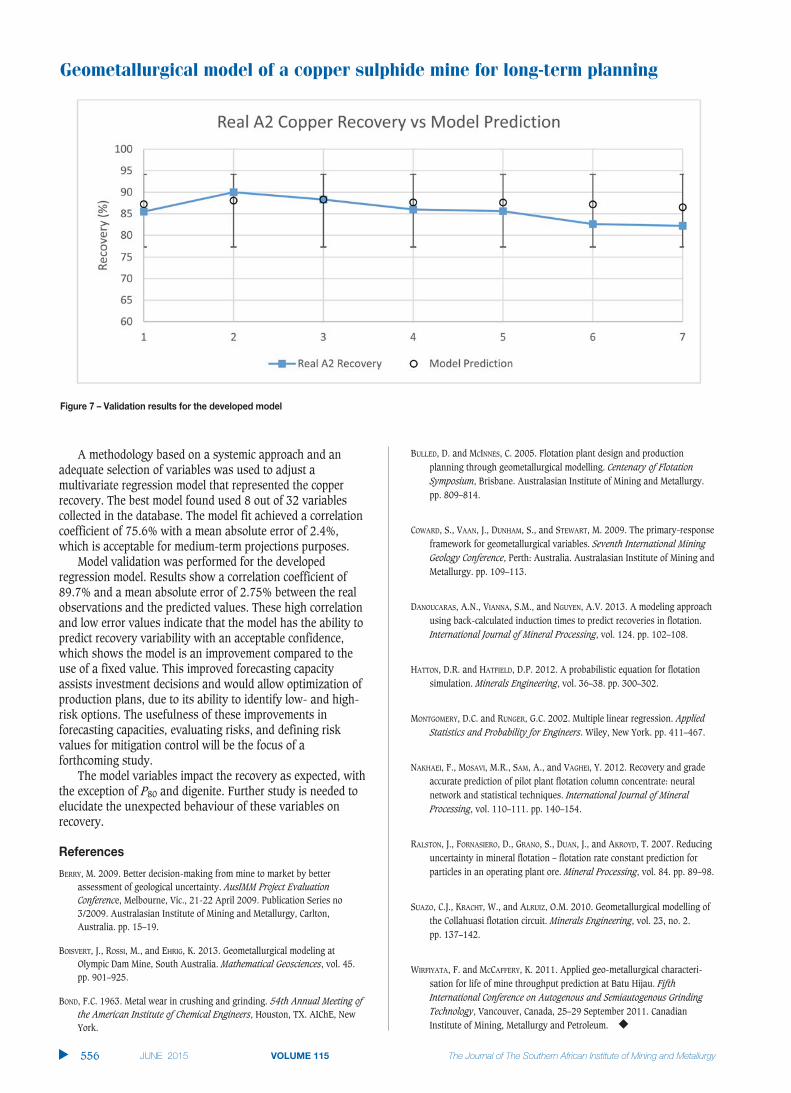
Geometallurgical model of a copper sulphide mine for long-term planning
A methodology based on a systemic approach and anadequate selection of variables was used to adjust amultivariate regression model that represented the copperrecovery. The best model found used 8 out of 32 variablescollected in the database. The model fit achieved a correlationcoefficient of 75.6% with a mean absolute error of 2.4%,which is acceptable for medium-term projections purposes.
Model validation was performed for the developedregression model. Results show a correlation coefficient of89.7% and a mean absolute error of 2.75% between the realobservations and the predicted values. These high correlationand low error values indicate that the model has the ability topredict recovery variability with an acceptable confidence,which shows the model is an improvement compared to theuse of a fixed value. This improved forecasting capacityassists investment decisions and would allow optimization ofproduction plans, due to its ability to identify low- and high-risk options. The usefulness of these improvements inforecasting capacities, evaluating risks, and defining riskvalues for mitigation control will be the focus of aforthcoming study.
The model variables impact the recovery as expected, withthe exception of P80 and digenite. Further study is needed toelucidate the unexpected behaviour of these variables onrecovery.
References
BERRY, M. 2009. Better decision-making from mine to market by betterassessment of geological uncertainty. AusIMM Project EvaluationConference, Melbourne, Vic., 21-22 April 2009. Publication Series no3/2009. Australasian Institute of Mining and Metallurgy, Carlton,Australia. pp. 15–19.
BOISVERT, J., ROSSI, M., and EHRIG, K. 2013. Geometallurgical modeling atOlympic Dam Mine, South Australia. Mathematical Geosciences, vol. 45.pp. 901–925.
BOND, F.C. 1963. Metal wear in crushing and grinding. 54th Annual Meeting ofthe American Institute of Chemical Engineers, Houston, TX. AIChE, NewYork.
BULLED, D. and MCINNES, C. 2005. Flotation plant design and productionplanning through geometallurgical modelling. Centenary of FlotationSymposium, Brisbane. Australasian Institute of Mining and Metallurgy.pp. 809–814.
COWARD, S., VAAN, J., DUNHAM, S., and STEWART, M. 2009. The primary-responseframework for geometallurgical variables. Seventh International MiningGeology Conference, Perth: Australia. Australasian Institute of Mining andMetallurgy. pp. 109–113.
DANOUCARAS, A.N., VIANNA, S.M., and NGUYEN, A.V. 2013. A modeling approachusing back-calculated induction times to predict recoveries in flotation.International Journal of Mineral Processing, vol. 124. pp. 102–108.
HATTON, D.R. and HATFIELD, D.P. 2012. A probabilistic equation for flotationsimulation. Minerals Engineering, vol. 36–38. pp. 300–302.
MONTGOMERY, D.C. and RUNGER, G.C. 2002. Multiple linear regression. AppliedStatistics and Probability for Engineers. Wiley, New York. pp. 411–467.
NAKHAEI, F., MOSAVI, M.R., SAM, A., and VAGHEI, Y. 2012. Recovery and gradeaccurate prediction of pilot plant flotation column concentrate: neuralnetwork and statistical techniques. International Journal of MineralProcessing, vol. 110–111. pp. 140–154.
RALSTON, J., FORNASIERO, D., GRANO, S., DUAN, J., and AKROYD, T. 2007. Reducinguncertainty in mineral flotation – flotation rate constant prediction forparticles in an operating plant ore. Mineral Processing, vol. 84. pp. 89–98.
SUAZO, C.J., KRACHT, W., and ALRUIZ, O.M. 2010. Geometallurgical modelling ofthe Collahuasi flotation circuit. Minerals Engineering, vol. 23, no. 2. pp. 137–142.
WIRFIYATA, F. and MCCAFFERY, K. 2011. Applied geo-metallurgical characteri-sation for life of mine throughput prediction at Batu Hijau. FifthInternational Conference on Autogenous and Semiautogenous GrindingTechnology, Vancouver, Canada, 25–29 September 2011. CanadianInstitute of Mining, Metallurgy and Petroleum. ◆
▲
556 JUNE 2015 VOLUME 115 The Journal of The Southern African Institute of Mining and Metallurgy
Figure 7 – Validation results for the developed model

IntroductionWhen confronted with the term clean steel, myfriend – who is an expert in mineralsprocessing – conjures up images of washinghis car. Although, in pyrometallurgical terms,steel cleanliness affects the body of his car,clean steel production does not include soapywater. This paper presents an overview ofwhat clean steel means to a pyrometallurgist,as well as an explanation of its relevance toSouth Africa.
(Very) simplistic process overview
Car manufacturingIn car manufacturing, the mass of the steelbody structure typically ranges between 200and 400 kg (WorldAutoSteel, 2013).Hydroforming is the manufacturing processused to convert a sheet of steel into the panelof a car door or other shape required (Singh,2003). In a typical hydroforming process cycle,the sheet metal blank is placed onto the lowertool, the die is closed, and fluid pressureapplied to one side of the blank. The pressureis sufficient to cause the blank to deformplastically and take the shape of the tool cavity(Singh, 2003). During plastic deformation,nonmetallic inclusions will cause the steel todeform. Typical nonmetallic inclusions areAl2O3 as a product of deoxidation – explainedlater on – and a solid solution of the spinelMgAl2O4 and Al2O3 (Pistorius, Verma, andFruehan, 2011). These inclusions form duringthe steelmaking process.
Iron oreIn iron ore, iron (Fe) is present in an oxidizedstate as Fe3+ in haematite (Fe2O3) or acombination of Fe2+ and Fe3+ in magnetite(Fe3O4) (Poveromo, 1999). To produce steel,the oxygen is removed from the Fe in order toreduce its oxidation state to zero, Fe0. Inpyrometallurgical processing the principles ofchemistry are applied to achieve this objective.
IronmakingTo reduce the oxidation state of Fe, the ironore is contacted with a reagent that has agreater affinity for oxygen. In commercialironmaking, carbon (C) is used to achieve thisobjective (Sundholm et al., 1999) as oxygen(O) has a higher affinity for C than for Feunder certain conditions. These conditions aregoverned by the rules of thermodynamics(Turkdogan and Fruehan, 1999). According tothe Oxford Dictionary (Oxford UniversityPress, n.d.), pyrometallurgy is the branch ofscience and technology concerned with the useof high temperatures to extract and purifymetals. Therefore, in pyrometallurgy,processing temperature is one of theparameters manipulated to exploit the rules ofthermodynamics.
Carbon, when used to reduce the oxidationstate of the Fe, is referred to as the reducingagent (Sundholm et al., 1999). C reacts withthe O associated with the Fe when the C ispresent as solid carbon, as carbon dissolved ina metal phase, or as carbon present in agaseous phase as carbon monoxide (CO) gas(Burgo, 1999; Turkdogan and Fruehan, 1999).Different technologies are available (Feinman,1999) to exploit these reactions, with the blastfurnace being the main technology (Burgo,1999). The liquid pig iron tapped from the
Introduction to the production of cleansteelby J.D. Steenkamp* and L. du Preez†
SynopsisThis paper introduces the concept of clean steel production from apyrometallurgist’s perspective to the broader metallurgical community. Asimplistic overview of the steelmaking process from iron ore to car bodymanufacturing is followed by an introduction to the South African steelindustry and the technologies that it utilizes. The process is illustrated byan overview of the flow sheet and technologies for the production of cleansteel at Saldanha Steel, South Africa.
Keywordsironmaking, steelmaking, clean steel.
* Mintek.† ArcelorMittal Saldanha Steel.© The Southern African Institute of Mining and
Metallurgy, 2015. ISSN 2225-6253. Paper receivedNov. 2014 and revised paper received May 2015.
557The Journal of The Southern African Institute of Mining and Metallurgy VOLUME 115 JUNE 2015 ▲
ISSN:2411-9717/2015/v115/n6/a12http://dx.doi.org/10.17159/2411-9717/2015/v115n6a12

Introduction to the production of clean steel
blast furnace is saturated in C, with typical contents of 3.5%to 4.4% (Burgo, 1999).
Unfortunately, iron ores contain not only Fe but alsoother elements, all present at higher oxidation states in theform of minerals. These elements include silicon (Si),manganese (Mn), phosphorus (P), aluminium (Al),magnesium (Mg), calcium (Ca), titanium (Ti), potassium (K),sodium (Na), and sulphur (S) (Burgo, 1999; Poveromo,1999). During the ironmaking process, the oxidation states ofsome of these elements – especially Si, Mn, and P – arereduced to zero as well. Apart from Fe and C, the liquid pigiron tapped from a blast furnace therefore also contains Si(1.5%), Mn (1.0–2.0%) and P (<0.4%) as major components(Burgo, 1999).
In ironmaking, coal and anthracite, or products derivedfrom them, are used as sources of C (Sundholm et al., 1999).As in the case of iron ores, the coal and anthracite containnot only carbon, but also other elements in the form ofgangue minerals – most importantly S. This S, together withthe S present in the iron ore, will report to the pig iron,resulting in S contents of 0.05% or less, typical for liquid pigiron tapped from a blast furnace (Burgo, 1999).
SteelmakingTo produce steel suitable for car body manufacturing, theliquid pig iron tapped from a blast furnace has to be refinedto reduce the C, Si, Mn, S, and P content.
In the first refining step, O2 gas is blown under controlledconditions into the liquid pig iron, where it reacts preferen-tially with C, Si, and Mn (Fruehan, 1998), increasing theiroxidation states from zero to C2+ or C4+ as CO or CO2 gas, andto Si4+ as SiO2, and Mn2+ as MnO, both of the latter reportingto a liquid slag phase. By controlling temperature and slagchemistry, P is also oxidized from zero to a higher oxidationstate, and S to S2+ by forming CaS, both reporting to the slagphase (Miller et al., 1998). As with ironmaking, differentsteelmaking technologies are available (Fruehan andNassaralla, 1998; Jones, Bowman, and Lefrank, 1998; Milleret al., 1998) to exploit these reactions, with the basic oxygenfurnace (BOF) being widely applied in the treatment of liquidpig iron (Miller et al., 1998).
During tapping of the BOF, the refined steel is separatedfrom the slag. After O2 blowing, the dissolved O content ofthe steel is too high for casting purposes and has to bereduced. This reduction is achieved by adding Al or Si, whichreact with the dissolved O to form Al2O3 or SiO2 (Kor andGlaws, 1998). Under ideal conditions the reaction productsreport to the slag phase. Under non-ideal conditions, thereaction products remain in the steel as nonmetallicinclusions. Therefore, steel producers actively manage theinclusion content and morphology of their products throughthe introduction of Ca additions and soft purging with Ar gas.The treatment of the steel described here occurs in the ladlefurnace (LF) (Kor and Glaws, 1998). Treatment in the LF alsoincludes further reduction of the S content of the steelthrough synthetic slag additions as well as final adjustmentsto the chemical composition of the steel (Kor and Glaws,1998).
During tapping of the steel from the primary vessel(typically a BOF) or arcing at the ladle furnace, nitrogen (N)in the air dissolves into the steel. Many of the alloys andsynthetic slag components added to the steel at the ladle
furnace contain water, which has the potential to increase thedissolved hydrogen (H) content of the steel. In manyinstances the levels of these gases have to be reduced withvacuum oxygen degassing (VOD) technology – one of thetechnologies available (Kor and Glaws, 1998). VODtechnology is also used to reduce the carbon content of ultra-low carbon steel grades (Kor and Glaws, 1998).
SummaryFigure 1 presents a summary of the iron- and steelmakingprocesses.➤ In iron ore, Fe is present in an oxidized state. Iron ore
contains not only Fe but also other components, suchas Si, Mn, P, and S present in gangue minerals.
➤ During the ironmaking process the desired Fe isreduced from ore together with Si, S, P, and Mn. Thepig iron product is saturated in C.
➤ During the steelmaking process, different refining stepsdrastically reduce the levels of acceptable elementsdissolved in the iron, such as C, Si, and Mn, as well asunacceptable elements such as S, P, N, and H, while atthe same time mitigating the effect of nonmetallicinclusions.
Iron- and steelmaking technologies applied in SouthAfricaIn South Africa, iron and steel are produced at a number ofsteelmaking plants (Jones, n.d.) using various technologies.ArcelorMittal South Africa operates four steelworks namedafter the towns they are based in. EVRAZ Highveld Steel isbased in Emalahleni, and Columbus Stainless in Middelburg;SCAW Metals operates a steelworks in Germiston, Cape Gatein Vanderbijlpark, and SA Steelmakers in Cape Town(Delport, 2014).
▲
558 JUNE 2015 VOLUME 115 The Journal of The Southern African Institute of Mining and Metallurgy
Figure 1 – A very simplistic overview of clean steel production

The largest integrated steel plant is the ArcelorMittalSouth Africa Vanderbijlpark Works (ArcelorMittal, n.d.-a).The Vanderbijlpark Works utilizes blast furnaces for theproduction of pig iron and rotary kilns for the production ofdirect reduced iron (DRI) – a product in the solid state(ArcelorMittal, n.d.-b). Both pig iron and DRI are producedfrom a combination of lumpy iron ore and sintered ore fines.Basic oxygen furnaces (BOFs) are applied for the productionof primary steel. The electric arc furnaces (EAFs) weredecommissioned in 2012 (Mathews, 2012). Secondarysteelmaking is conducted in ladle furnaces, followed bydegassing in either a Ruhrsthal Heraeus (RH) degasser orvacuum arc degasser (VAD).
ArcelorMittal South Africa operates three other plants(ArcelorMittal, n.d.-b): Saldanha Works, Newcastle Works,and Vereeniging Works. The process flow sheet andtechnologies applied at Saldanha Steel are discussed in thenext section in more detail. At the Newcastle Works, iron ismade from lumpy and sintered iron ore in a blast furnace.BOF technology is used for primary steelmaking, and ladlefurnace and RH degasser technologies for secondarysteelmaking. The Vereeniging Works does not have anironmaking facility. During the primary steelmaking step,scrap is melted in EAFs. Secondary steelmaking technologiesapplied are the ladle furnace and vacuum degassing.
At EVRAZ Highveld Steel, iron is made using acombination of rotary kilns for solid-state reduction andopen-bath furnaces for final reduction and melting(Steinberg, Geyser, and Nell, 2011). The choice of technologywas driven by the high levels of titania (TiO2) present in themagnetite ore. As the pig iron tapped from the open-bathfurnaces contains high levels of vanadium, primarysteelmaking is conducted in two steps: a soft oxygen blow atthe shaking ladles to remove the vanadium, followed bytreatment in BOFs. Ladle furnace technology is the onlysecondary steelmaking technology applied.
The only facility for the production of stainless steel inSouth Africa is Columbus Stainless, which uses EAFtechnology to melt recycled steel scrap together with metalalloys containing Cr and Ni, and an argon-oxygendecarburizer (AOD) for refining (Columbus Stainless, n.d.).No secondary steelmaking technologies are described.
Production of clean steel at Saldanha SteelArcelorMittal Saldanha Works was commissioned in 1998,with a unique combination of production units (Figure 2).
A Corex unit produces hot metal, and the surplus gas isfed into a Midrex unit that produces DRI. Both products arefed into a twin-shell Conarc furnace, which is a hybridEAF/BOF. The steel is then treated in a ladle furnace wherefinal chemical adjustments are made before being sent to athin slab caster (TSC). Slab temperatures are equalized in aroller hearth furnace (RHF) where surplus gas from theironmaking units is burned. In a seven-stand hot strip mill(HSM), the slabs are reduced to their final thickness, mainly≤1.5 mm. A temper mill (TM) improves the flatness of thestrip, and a packaging unit puts strapping around it forshipment to customers mainly in East and West Africa.
The Corex unit produces hot metal in a configuration of asplit blast furnace. In the bottom section, the melter-gasifier,coal and coke are gasified with 95% pure O2 to form CO gasand energy. The gas is fed upwards into the second section, ashaft pre-loaded with iron ore, iron pellets, and coke movingdownward. The gas strips the extra oxygen from the iron ore,and the metallized pellets gravitate into the high-temperaturezone of the melter where they are further reduced andmelted. In the process, some C, Si, P, and S from the coal goesinto solution into the molten iron. Most of the SiO2 and Al2O3from the coal is removed by the lime and dolomite added tomake a fluid slag.
The excess gas is cleaned by a wet scrubber, and the CO2is removed by vacuum pressure swing adsorption (VPSA).
Introduction to the production of clean steel
559The Journal of The Southern African Institute of Mining and Metallurgy VOLUME 115 JUNE 2015 ▲
Figure 2 – Flow sheet applied at Saldanha Steel for the production of mild steel from iron ore

Introduction to the production of clean steel
The gas is then heated and passed into a shaft containingiron ore and pellets, similar to that of the Corex unit. Here theoxygen is more thoroughly stripped by the gas, resulting in>90% metallization (typically 90–92%), and DRI is produced.All impurities from the ore and pellets remain in the DRI. TheDRI is cooled by injection of liquefied petroleum gas (LPG), amixture of propane and butane, which ‘cracks’ and depositscarbon on the DRI.
The hot metal can then be desulphurized by the additionof calcium carbide (CaC2), which combines with the Sdissolved in the hot metal to form CaS in a slag on top of theladle. From here the hot metal is charged into one of the twinshells of the Conarc. The name is derived from ‘converter andarc furnace’. In converters, steel is produced from hot metalby the injection of oxygen via a top lance. In an arc furnace,steel scrap and DRI are melted using electrical energydelivered by carbon electrodes.
The Conarc at Saldanha Works consists of two refractory-lined vessels that share one oxygen top lance and oneelectrode gantry between them. In the first step, oxygen isblown to combine with the Si, P, and C to form oxides thatreport to the slag floating on top of the iron, or as gaseousCO. Burned lime (CaO) and dolomite (CaMgO2) are added tohelp with removal of P, and to protect the MgO refractories.The CO gas is withdrawn from the furnace and combustedwith air before being sent to the baghouse for the removal offine particles.
After the blowing phase, DRI is charged while electricalenergy is added via three electrodes. Once again, lime anddolomite are added to form the slag together with SiO2 fromthe DRI. At the same time, a door lance blows oxygen intothe metal to oxidize the remainder of the carbon in the bath.To help promote a foaming slag, carbon is blown into the slagto react with the oxidized iron (FeO) that inevitably formswhen oxygen is injected. The foam protects the refractoriesfrom arc flare and increases the energy transfer from the arcto the bath. When the steel reaches 1630°C it is tapped into aladle, taking care not to transfer the furnace slag with thesteel. During tapping, additions of lime, dolomite, andalumina form a new synthetic slag. Carried-over furnace slagwill lead to an increase in silicon when aluminium additionsreduce the SiO2.
The ladle furnace consists of two stations where the steel
in refractory-lined ladles is stirred by argon injected from thebottom of the ladle. The temperature is once again increasedthrough the use of an electric arc. Aluminium additionsremove the dissolved oxygen from the steel and the CaO fromthe lime combines with sulphur to remove the sulphur fromthe steel. At the ladle furnace, alloy additions take the steel tothe final specification.
No late addition of aluminium is allowed as it can formsmaller oxide inclusions that are difficult to float out. For 10minutes before calcium injection, low stirring with argon iscarried out to help float out inclusions. Just before the ladle issent to the TSC, calcium is injected to combine with aluminaparticles present in the steel bath to form a lower meltingpoint calcium-aluminate that will remain liquid during thecasting process. Another 5 minutes of soft stirring helps toremove some of the aluminates.
The TSC utilizes a water-cooled copper mould to freezethe liquid steel and produce slabs for the rolling mill. The as-cast thickness of the slabs is 85 mm. To prevent oxidation ofthe steel or aluminium in the steel, contact with theatmosphere is limited. A refractory shroud with argon aroundit protects the steel during transfer from the ladle to tundish.The tundish serves as a buffer between ladles to enablecontinuous casting. An artificial slag covers the top of thesteel in the tundish to prevent oxidation and decrease energyloss.
During transfer from the tundish to the mould, the steel isprotected with a submerged entry nozzle (SEN) made fromalumina. Owing to the alumina construction, there is a riskthat small alumina inclusions, products of earlier oxidation,could stick to the perimeter of the hole and reduce steel flowby clogging. Besides shielding from the atmosphere at theTSC, several steps at the LF ensure that the steel is cleanenough to be cast and rolled to a 1 mm sheet.
Table I summarizes the typical chemical compositions andtemperatures of the hot metal and steel at the differentproduction stages.
School on production of clean steelThe Center for Iron and Steelmaking Research at CarnegieMellon University (CMU) in Pittsburgh, Pennsylvania, USAhas a proud history in iron- and steelmaking. Collaborationbetween CMU and the South African iron and steel industry
▲
560 JUNE 2015 VOLUME 115 The Journal of The Southern African Institute of Mining and Metallurgy
Table I
Chemical composition and temperature of hot metal and steel
Hot metal tapped DRI from Midrex Primary steel after Primary steel when Secondary steel after from Corex blow in ConArc taped from ConArc treatment at ladle furnace
Specification Typical Specification Typical Specification Typical Specification Typical Specification TypicalC (%) 4.3–4.8 4.3–4.8 1.2–1.4 0.2–0.5 0.3–0.5 0.040–0.050 0.040–0.050 0.045–0.060 0.045–0.065P (%) 0.12–0.16 0.12–0.14 0.12–0.14 0 0.12–0.14 <0.015 <0.015 <0.015 <0.015Si (%) 0.5–0.8 0.5–0.9 3.0–6.0 as 0 0.0 0 0.0 <0.030 <0.030
SiO2
S (%) 0.020–0.060 0.02–0.06 0.02–0.06 0.020–0.050 0.02–0.06 0.010–0.030 0.02–0.06 <0.008 <0.008Al (%) - - - - - - - - 0.025–0.045 0.025–0.045Ca (%) - - - - - - - 0.0020– 0.0020–
0.0025 0.0025Temp (°C) 1300–1380 1250–1350 1550–1580 1560–1600 1630–1660 1630–1670 1585–1595 1596–1685

has included a school on steelmaking presented by ProfessorRichard Fruehan in Vanderbijlpark in 1996. Professor ChrisPistorius from the University of Pretoria joined ProfessorFruehan in 2008 and is now the POSCO Professor of Iron andSteelmaking in the Department of Materials Science andEngineering at CMU.
Professor Pistorius continues the collaboration betweenCMU and the South African iron and steel industry byaddressing a number of topics under the headings‘controlling dissolved elements’ and ‘controlling micro-inclusions’. The work done by Professor Pistorius describesthe relevant process conditions (temperatures, oxygenactivity, slag basicity, stirring) in the blast furnace,steelmaking converter, EAF, ladle furnace, and caster; andinvestigates ways in which dissolved elements are controlledboth on a theoretical and on a practical level. On the topic ofmicro-inclusions, Professor Pistorius has examined theprinciples of control, sources of micro-inclusions, andtechniques used to assess micro-inclusions.
A future ‘Clean Steel’ event would not only benefits SouthAfrican steel producers, but also allow suppliers of rawmaterials and consumables to obtain a better understandingof their clients’ perspectives on iron- and steelmaking; andinform downstream consumers of the challenges faced bytheir suppliers.
ConclusionsThe conversion of iron ore to steel requires several processingsteps. For each processing step, different types oftechnologies are available and applied in South Africa. Theplant at Saldanha Steel is an example of an integrated mini-mill that produces steel from iron ore.
For a pyrometallurgist producing steel, the term cleansteel refers to the control of the dissolved elements and thenonmetallic inclusions in the steel. A school focusing on thetransfer of knowledge on both aspects would be beneficialnot only to pyrometallurgists producing steel, but also to theirsuppliers and clients.
AcknowledgementsThis paper is published with the permission of Mintek.Thanks are due to Elzaan Behrens for flow sheets of thedifferent steelworks, and to Professor Chris Pistorius for hishelpful comments.
References
ARCELORMITTAL. Not dated (a). Vanderbijlpark works overview.www.arcelormittalsa.com/Operations/VanderbijlparkWorks/Overview.aspxAccessed 17 Nov. 2014.
ARCELORMITTAL. Not dated (b). Operations production processes.www.arcelormittalsa.com/Operations/ProductionProcesses.aspxAccessed 17 Nov. 2014.
BURGO, J.A. 1999. The manufacture of pig iron in the blast furnace. Making,Shaping and Treating of Steel - Ironmaking Volume. 11th edn. Wakelin,D.H. (ed.). AISE Steel Foundation, Pittsburgh, Pensylvania. pp. 699–740.
COLUMBUS STAINLESS. Not dated. Simplified process for making stainless steel.www.columbus.co.za/processes.htmlAccessed 17 Nov. 2014.
DELPORT, H.M.W. 2014. Personal communication.
FEINMAN, J. 1999. Direct reduction and smelting processes. Making, Shapingand Treating of Steel - Ironmaking Volume. 11th edn. Wakelin, D. (ed.).AISE Steel Foundation, Pittsburgh, Pensylvania. pp. 741–780.
FRUEHAN, R J. 1998. Overview of steelmaking processes and their development.Making, Shaping and Treating of Steel - Steelmaking and RefiningVolume. 11th edn. Fruehan, R.J. (ed.). AISE Steel Foundation, Pittsburgh,Pensylvania. pp. 1–12.
FRUEHAN, R.J. and NASSARALLA, C.L. 1998. Alternative oxygen steelmakingprocesses. Making, shaping and Treating of Steel - Steelmaking andRefining Volume. 11th edn. Fruehan, R.J. (ed.). AISE Steel Foundation,Pittsburgh, Pensylvania. pp. 743–759.
JONES, J.A.T., BOWMAN, B., and LEFRANK, P.A. 1998. Electric furnace steelmaking.Making, Shaping and Treating of Steel - Steelmaking and RefiningVolume. 11th edn. Fruehan, R.J. (ed.). AISE Steel Foundation, Pittsburgh,Pensylvania. pp. 525–660.
JONES, R.T. Not dated. Pyrometallurgy in Southern Africa.http://www.pyrometallurgy.co.za/PyroSA/Accessed 17 Nov. 2014.
KOR, G.J.W. and GLAWS, P.C. 1998. Ladle refining and vacuum degassing.Making, Shaping and Treating of Steel - Steelmaking and RefiningVolume. 11th edn. Fruehan, R.J. (ed.). AISE Steel Foundation, Pittsburgh,Pensylvania. pp. 661–713.
MATHEWS, C. 2012. Steel producers - prolonged downturn.www.financialmail.co.za/business/money/2012/11/14/steel-producers---prolonged-downturn
MILLER, T.W., JIMENEZ, J., SHARAN, A., and GOLDSTEIN, D.A. 1998. Oxygensteelmaking processes. The Making, Shaping and Treating of Steel -Steelmaking and Refining volume. 11th edn. Fruehan, R.J. (ed.). AISESteel Foundation, Pittsburgh, Pensylvania. pp. 475–524.
OXFORD UNIVERSITY PRESS. Not dated. Pyrometallurgy, n.http://www.oxforddictionaries.com/definition/english/pyrometallurgyAccessed 17 Nov. 2014.
PISTORIUS, P., VERMA, N., and FRUEHAN, R.J. 2011. Calcium modification ofalumina and spinel inclusions in aluminum-killed steel.http://saimm.co.za/about-saimm/branchessaimm/58-saimm-pretoria/173-calcium-modification-of-alumina-inclusions-in-steel--reaction-mechanisms
POVEROMO, J.J. 1999. Iron ores. Making, Shaping and Treating of Steel -Ironmaking volume. 11th edn. Wakelin, D.H. (ed.). AISE Steel FoundationPittsburgh, Pensylvania. pp. 547–642.
SINGH, H. 2003. Introduction to hydroforming. Fundamentals of Hydroforming.Society of Manufacturing Engineers, Michigan. pp. 1–17.
STEINBERG, W.S., GEYSER, W., and NELL, J. 2011. The history and development ofthe pyrometallurgical processes at Evraz Highveld Steel & Vanadium.Southern African Pyrometallurgy 2011. Jones, R.T. and Den Hoed, P.(eds). Southern African Institute of Mining and Metallurgy, Johannesburg.pp. 63–76.
SUNDHOLM, J. L., VALIA, H. S., KIESSLING, F. J., RICHARDSON, J., BUSS, W. E.,WORBERG, R., SCHWARZ, U., BAER, H., CALDERON, A., and DINITTO, R.G. 1999.Manufacture of metallurgical coke and recovery of coal chemicals. Making,Shaping and Treating of Steel - Ironmaking volume. 11th edn. Wakelin.D.H. (ed.). AISE Steel Foundation, Pittsburgh, Pensylvania. pp. 381–546.
TURKDOGAN, E.T. and FRUEHAN, R.J. 1999. Fundamentals of iron andsteelmaking. Making, Shaping and Treating of Steel - Ironmaking volume.11th edn. Wakelin. D.H. (ed.). AISE Steel Foundation, Pittsburgh,Pensylvania. pp. 37–160.
WORLDAUTOSTEEL. 2013. Steel elimnates weight gap with aluminium for carbodies. http://www.worldsteel.org/dms/internetDocumentList/press-release-downloads/2013/Steel-closes-gap-with-aluminium-for-car-making/Steel closes gap with aluminium for car making.pdf. ◆
Introduction to the production of clean steel
The Journal of The Southern African Institute of Mining and Metallurgy VOLUME 115 JUNE 2015 561 ▲

EFFECTIVE FROTH FLOTATION
IMHOFLOTTM PNEUMATIC FLOTATION
technology has evolved over 25 years in industrial applications.The centrifugal forces of themineral collection, which allows a reduction in the size of vessels required.
Maelgwyn Mineral Services Africa (Pty) LtdTel +27 (0)11 474 0705 Fax +27 (0)11 474 5580 Email [email protected] www.maelgwynafrica.com
Emperors Palace, Hotel CasinoConvention Resort, Johannesburg
Sustaining Zero Harm
Technical Conference andIndustry day
26–27 August 2015—Conference28 August 2015—Industry day
‘Every mine worker returning from work unharmed every day. Striving for Zero Harm’
For further information contact:Head of Conferencing
Raymond van der Berg, SAIMM,P O Box 61127, Marshalltown 2107
Tel: +27 11 834-1273/7Fax: +27 11 833-8156 or +27 11 838-5923
E-mail: [email protected]: http://www.saimm.co.za
MMMA

BACKGROUNDGeostatistics constitutes a globally accepted technicalapproach to mineral resource-reserve estimation and the basictoolkit for mine evaluation practitioners. Following the call forpapers and the publication of the Danie Krige CommemorativeVolumes, the SAIMM invites submission of papers for theDanie Krige Geostatistical Conference to be held inJohannesburg, South Africa, 19–20 August 2015.
Conference Announcement
THE DANIE KRIGE GEOSTATISTICAL CONFERENCE
GEOSTATISTICAL GEOVALUE REWARDS AND RETURNS FOR SPATIAL MODELLING
Crown Plaza, Johannesburg · 19–20 August 2015
EXHIBITION/SPONSORSHIPSponsorship opportunities are available. Companieswishing to sponsor or exhibit should contact theConference co-ordinator.For further information contact:
Conference Co-ordinator, Yolanda RamokgadiSAIMM, P O Box 61127, Marshalltown 2107
Tel: +27 (0) 11 834-1273/7E-mail: [email protected]
Website: http://www.saimm.co.za
THEMEThe theme of the conference is ‘GeostatisticalGeovalue—Rewards and Returns for SpatialModelling’, a theme which emphasizes theimprovement in, or addition to, value that spatialmodelling can bring to the process of mineevaluation and mineral resource and reserveestimation. Spatial modelling of earth relateddata to estimate or enhance attributed value isthe principle domain of geostatistics, the broadcontent of the Danie Krige CommemorativeVolumes, and the focus of this conference.
OBJECTIVESThe conference provides authors who have recentlypublished papers in the SAIMM’s Danie KrigeCommemorative Volumes, a platform to present theirresearch. In addition an invitation to geostatisticians,resource estimation practitioners, and those with an interest ingeostatistics to present new papers for inclusion in the proceedingsis now open. The conference will explore advances in technologyand methodologies, and case studies demonstrating the applicationof geostatistics. It will cross the commodity boundaries, withapplications presented from precious to base metals, and diamonds.This is a valuable opportunity to be involved in constructive dialogueand debate, and to keep abreast with the best practice in thisspecialist field.
WHO SHOULD ATTENDThe conference provides a platform for:
• local and international geostatisticians• geologists• engineers• researchers• software vendors• mineral resource managers and practitioners, across the mining
industry• consultancy and academia, to present their work and contribute
to the advancement of this field.
CONFERENCE SUPPORTER
CONFERENCE SPONSORS

▲
viii JUNE 2015 The Journal of The Southern African Institute of Mining and Metallurgy
201514–17 June 2015 — European MetallurgicalConferenceDusseldorf, GermanyWebsite: http://www.emc.gdmb.de
14–17 June 2015 — Lead Zinc Symposium 2015Dusseldorf, GermanyWebsite: http://www.pb-zn.gdmb.de
16–20 June 2015 — International Trade Fair forMetallurgical Technology 2015Dusseldorf, GermanyWebsite: http://www.metec-tradefair.com
6–8 July 2015 — Copper Cobalt Africa IncorporatingThe 8th Southern African Base Metals ConferenceZambezi Sun Hotel, Victoria Falls, Livingstone, Zambia Contact: Raymond van der BergTel: +27 11 834-1273/7Fax: +27 11 838-5923/833-8156E-mail: [email protected]: http://www.saimm.co.za
15–16 July 2015 — Virtual Reality and spatialinformation applications in the mining industryConference 2015University of PretoriaContact: Camielah JardineTel: +27 11 834-1273/7Fax: +27 11 838-5923/833-8156 E-mail:[email protected]: http://www.saimm.co.za
6–7 August 2015 — MINPROC 2015: SouthernAfrican Mineral Beneficiation and MetallurgyConferenceVineyard Hotel, Newlands, Cape TownContact: Raymond van der BergTel: +27 11 834-1273/7Fax: +27 11 838-5923/833-8156E-mail: [email protected]: http://www.saimm.co.za
19–20 August 2015 — The Danie Krige GeostatisticalConference: Geostatistical geovalue —rewards andreturns for spatial modellingCrown Plaza, JohannesburgContact: Yolanda Ramokgadi
Tel: +27 11 834-1273/7Fax: +27 11 838-5923/833-8156 E-mail: [email protected]: http://www.saimm.co.za
25–27 August 2015 — Coal Processing – UnlockingSouthern Africa’s Coal PotentialGraceland Hotel Casino and Country Club SecundaContact: Ann RobertsonTel: +27 11 433-0063
26–28 August 2015 — MINESafe 2015—SustainingZero Harm: Technical Conference and Industry dayEmperors Palace Hotel Casino, Convention Resort,JohannesburgContact: Raymond van der BergTel: +27 11 834-1273/7Fax: +27 11 838-5923/833-8156E-mail: [email protected],Website: http://www.saimm.co.za
28 September-2 October 2015 — WorldGoldConference 2015Misty Hills Country Hotel and Conference Centre,Cradle of Humankind, Gauteng, South AfricaContact: Camielah JardineTel: +27 11 834-1273/7Fax: +27 11 838-5923/833-8156, E-mail: [email protected]: http://www.saimm.co.za
12–14 October 2015 — Slope Stability 2015:International Symposium on slope stability in openpit mining and civil engineeringIn association with the Surface Blasting School15–16 October 2015Cape Town Convention Centre, Cape TownContact: Raymond van der BergTel: +27 11 834-1273/7Fax: +27 11 838-5923/833-8156 E-mail: [email protected]: http://www.saimm.co.za
20 October 2015 — 13th Annual Southern AfricanStudent ColloquiumMintek, Randburg, JohannesburgContact: Yolanda RamokgadiTel: +27 11 834-1273/7Fax: +27 11 838-5923/833-8156 E-mail: [email protected]: http://www.saimm.co.za
INTERNATIONAL ACTIVITIES

The Journal of The Southern African Institute of Mining and Metallurgy JUNE 2015 ▲x
21–22 October 2015 — Young Professionals 2015ConferenceMaking your own way in the minerals industryMintek, Randburg, JohannesburgContact: Camielah JardineTel: +27 11 834-1273/7Fax: +27 11 838-5923/833-8156 E-mail:[email protected]: http://www.saimm.co.za
28–30 October 2015 — AMI: Nuclear MaterialsDevelopment Network ConferenceNelson Mandela Metropolitan University, North CampusConference Centre, Port ElizabethContact: Raymond van der BergTel: +27 11 834-1273/7Fax: +27 11 838-5923/833-8156 E-mail: [email protected]: http://www.saimm.co.za
8–13 November 2015 — MPES 2015: Twenty ThirdInternational Symposium on Mine Planning &Equipment Selection Sandton Convention Centre, Johannesburg, South AfricaContact: Raj SinghalE-mail: [email protected] or E-mail:[email protected]: http://www.saimm.co.za
201614–17 March 2016 — Diamonds still Sparkle 2016ConferenceBotswanaContact: Yolanda RamokgadiTel: +27 11 834-1273/7Fax: +27 11 838-5923/833-8156 E-mail: [email protected]: http://www.saimm.co.za
13–14 April 2016 — Mine to Market Conference 2016South AfricaContact: Yolanda RamokgadiTel: +27 11 834-1273/7Fax: +27 11 838-5923/833-8156 E-mail: [email protected]: http://www.saimm.co.za
17–18 May 2016 — The SAMREC/SAMVALCompanion Volume ConferenceJohannesburgContact: Raymond van der BergTel: +27 11 834-1273/7Fax: +27 11 838-5923/833-8156E-mail: [email protected]: http://www.saimm.co.za
May 2016 — PASTE 2016 International Seminar onPaste and Thickened TailingsKwa-Zulu Natal, South AfricaContact: Raymond van der BergTel: +27 11 834-1273/7Fax: +27 11 838-5923/833-8156E-mail: [email protected]: http://www.saimm.co.za
9–10 June 2016 — 1st International Conference onSolids Handling and ProcessingA Mineral Processing PerspectiveSouth AfricaContact: Raymond van der BergTel: +27 11 834-1273/7Fax: +27 11 838-5923/833-8156E-mail: [email protected]: http://www.saimm.co.za
1–3 August 2016 — Hydrometallurgy Conference2016‘Sustainability and the Environment’in collaboration with MinProc and the Western CapeBranchCape TownContact: Raymond van der BergTel: +27 11 834-1273/7Fax: +27 11 838-5923/833-8156E-mail: [email protected]: http://www.saimm.co.za
16–19 August 2016 — The Tenth InternationalHeavy Minerals Conference ‘Expanding the horizon’Sun City, South AfricaContact: Camielah JardineTel: +27 11 834-1273/7Fax: +27 11 838-5923/833-8156 E-mail: [email protected]: http://www.saimm.co.za
INTERNATIONAL ACTIVITIES

▲
x JUNE 2015 The Journal of The Southern African Institute of Mining and Metallurgy
Company AffiliatesThe following organizations have been admitted to the Institute as Company Affiliates
AECOM SA (Pty) Ltd
AEL Mining Services Limited
Air Liquide (PTY) Ltd
AMEC Mining and Metals
AMIRA International Africa (Pty) Ltd
ANDRITZ Delkor(Pty) Ltd
Anglo Operations Ltd
Anglo Platinum Management Services (Pty) Ltd
Anglogold Ashanti Ltd
Atlas Copco Holdings South Africa (Pty) Limited
Aurecon South Africa (Pty) Ltd
Aveng Moolmans (Pty) Ltd
Axis House (Pty) Ltd
Bafokeng Rasimone Platinum Mine
Barloworld Equipment -Mining
BASF Holdings SA (Pty) Ltd
Bateman Minerals and Metals (Pty) Ltd
BCL Limited
Becker Mining (Pty) Ltd
BedRock Mining Support (Pty) Ltd
Bell Equipment Company (Pty) Ltd
BHP Billiton Energy Coal SA Ltd
Blue Cube Systems (Pty) Ltd
Bluhm Burton Engineering (Pty) Ltd
Blyvooruitzicht Gold Mining Company Ltd
BSC Resources
CAE Mining (Pty) Limited
Caledonia Mining Corporation
CDM Group
CGG Services SA
Chamber of Mines
Concor Mining
Concor Technicrete
Council for Geoscience Library
CSIR-Natural Resources and theEnvironment
Department of Water Affairs and Forestry
Deutsche Securities (Pty) Ltd
Digby Wells and Associates
Downer EDI Mining
DRA Mineral Projects (Pty) Ltd
DTP Mining
Duraset
Elbroc Mining Products (Pty) Ltd
Engineering and Project Company Ltd
eThekwini Municipality
Exxaro Coal (Pty) Ltd
Exxaro Resources Limited
Fasken Martineau
FLSmidth Minerals (Pty) Ltd
Fluor Daniel SA (Pty) Ltd
Franki Africa (Pty) Ltd Johannesburg
Fraser Alexander Group
Glencore
Goba (Pty) Ltd
Hall Core Drilling (Pty) Ltd
Hatch (Pty) Ltd
Herrenknecht AG
HPE Hydro Power Equipment (Pty) Ltd
Impala Platinum Limited
IMS Engineering (Pty) Ltd
JENNMAR South Africa
Joy Global Inc. (Africa)
Leco Africa (Pty) Limited
Longyear South Africa (Pty) Ltd
Lonmin Plc
Ludowici Africa
Lull Storm Trading (PTY)Ltd T/A WekabaEngineering
Magnetech (Pty) Ltd
Magotteaux(PTY) LTD
MBE Minerals SA Pty Ltd
MCC Contracts (Pty) Ltd
MDM Technical Africa (Pty) Ltd
Metalock Industrial Services Africa (Pty)Ltd
Metorex Limited
Metso Minerals (South Africa) (Pty) Ltd
Minerals Operations Executive (Pty) Ltd
MineRP Holding (Pty) Ltd
Mintek
MIP Process Technologies
Modular Mining Systems Africa (Pty) Ltd
MSA Group (Pty) Ltd
Multotec (Pty) Ltd
Murray and Roberts Cementation
Nalco Africa (Pty) Ltd
Namakwa Sands (Pty) Ltd
New Concept Mining (Pty) Limited
Northam Platinum Ltd - Zondereinde
Osborn Engineered Products SA (Pty) Ltd
Outotec (RSA) (Proprietary) Limited
PANalytical (Pty) Ltd
Paterson and Cooke Consulting Engineers (Pty) Ltd
Polysius A Division of ThyssenkruppIndustrial Solutions (Pty) Ltd
Precious Metals Refiners
Rand Refinery Limited
Redpath Mining (South Africa) (Pty) Ltd
Rosond (Pty) Ltd
Royal Bafokeng Platinum
Roymec Tecvhnologies (Pty) Ltd
Runge Pincock Minarco Limited
Rustenburg Platinum Mines Limited
SAIEG
Salene Mining (Pty) Ltd
Sandvik Mining and Construction Delmas(Pty) Ltd
Sandvik Mining and Construction RSA(Pty) Ltd
SANIRE
Sasol Mining(Pty) Ltd
Scanmin Africa (Pty) Ltd
Sebilo Resources (Pty) Ltd
SENET
Senmin International (Pty) Ltd
Shaft Sinkers (Pty) Limited
Sibanye Gold (Pty) Ltd
Smec SA
SMS Siemag South Africa (Pty) Ltd
SNC Lavalin (Pty) Ltd
Sound Mining Solutions (Pty) Ltd
SRK Consulting SA (Pty) Ltd
Technology Innovation Agency
Time Mining and Processing (Pty) Ltd
Tomra Sorting Solutions Mining (Pty) Ltd
TWP Projects (Pty) Ltd
Ukwazi Mining Solutions (Pty) Ltd
Umgeni Water
VBKOM Consulting Engineers
Webber Wentzel
Weir Minerals Africa

2015◆ CONFERENCE
Copper Cobalt Africa in association with The 8th Southern African Base Metals Conference6–8 July 2015, Zambezi Sun Hotel, Victoria Falls, Livingstone, Zambia
◆ CONFERENCEVirtual Reality and spatial information applications in the mining industry Conference 201515–16 July 2015, University of Pretoria, Pretoria
◆ CONFERENCEMINPROC 2015: Southern African Mineral Beneficiation andMetallurgy Conference6–7 August 2015, Vineyard Hotel, Newlands, Cape Town
◆ CONFERENCEThe Danie Krige Geostatistical Conference 201519–20 August 2015, Crown Plaza, Johannesburg
◆ CONFERENCEMINESafe 2015—Sustaining Zero Harm: Technical Conference andIndustry day26–28 August 2015, Emperors Palace Hotel Casino, Convention Resort,Johannesburg
◆ CONFERENCEWorld Gold Conference 201528 September–2 October 2015, Misty Hills Country Hotel and Conference Centre, Cradle of Humankind, Muldersdrift
◆ SYMPOSIUMInternational Symposium on slope stability in open pit mining and civil engineering12–14– October 2015In association with the Surface Blasting School15–16 October 2015, Cape Town Convention Centre, Cape Town
◆ COLLOQUIUM13th Annual Southern African Student Colloquim 201520 October 2015, Mintek, Randburg, Johannesburg
◆ CONFERENCEYoung Professionals 2015 Conference21–22 October 2015, Mintek, Randburg, Johannesburg
◆ CONFERENCEAMI: Nuclear Materials Development Network Conference28–30 October 2015, Nelson Mandela Metropolitan University, North Campus Conference Centre, Port Elizabeth
◆ SYMPOSIUMMPES 2015: Twenty Third International Symposium on MinePlanning & Equipment Selection8–12 November 2015, Sandton Convention Centre, Johannesburg, South Africa
SAIMM DIARY
Forthcoming SAIMM events...
For further information contact:Conferencing, SAIMM
P O Box 61127, Marshalltown 2107Tel: (011) 834-1273/7
Fax: (011) 833-8156 or (011) 838-5923E-mail: [email protected]
F or the past 120 years, theSouthern African Institute ofMining and Metallurgy, has
promoted technical excellence in theminerals industry. We strive tocontinuously stay at the cutting edgeof new developments in the miningand metallurgy industry. The SAIMMacts as the corporate voice for themining and metallurgy industry in theSouth African economy. We activelyencourage contact and networkingbetween members and thestrengthening of ties. The SAIMMoffers a variety of conferences thatare designed to bring you technicalknowledge and information ofinterest for the good of the industry.Here is a glimpse of the events wehave lined up for 2015. Visit ourwebsite for more information.
Website: http://www.saimm.co.za
EXHIBITS/SPONSORSHIP
Companies wishing to sponsor
and/or exhibit at any of these
events should contact the
conference co-ordinator
as soon as possible
