“sagging transitions” between high pitch accents in ...bob/papers/sag.pdf · 2 abstract the...
TRANSCRIPT
“Sagging transitions” between high pitch accents in English:
experimental evidence
D. R. Ladd and Astrid Schepman*
Edinburgh University
*University of Abertay Dundee
Running title: Sagging transitions between high pitch accents
D. R. Ladd
Department of Theoretical and Applied Linguistics
University of Edinburgh
Adam Ferguson Building
George Square
Edinburgh
EH8 9LL
UK
Astrid Schepman
Division of Psychology
University of Abertay Dundee
158 Marketgait
Dundee
DD1 1NJ
2
Abstract
The ToBI transcription system for English intonation draws a distinction between
two kinds of pitch accents involving local F0 maxima, namely H* and L+H*. In the
L+H*, the rise to the F0 maximum begins with an actual phonological target (L), but
in the H* the beginning of the rise (here “F0min”) supposedly has no phonological
status and its phonetic properties are determined by various contextual factors. The
three experiments reported here provide evidence against this latter claim. The
experiments are based on the phonetic properties of the medial F0min in H* H*
sequences on English given name + surname phrases (e.g. Norman Elson). In
experiment 1, we show that the F0min is reliably aligned with the beginning of the
accented syllable of the surname, thus correlating with the word boundary distinction
in minimal pairs like Norman Elson / Norma Nelson. In experiment 2, we show that
experimentally modifying the alignment of the F0min in such segmentally ambiguous
phrases affects listeners' judgement of which name they are hearing. In experiment 3,
we show that the F0 level of the F0min and of the second H* accent is affected by the
number of syllables intervening between the two accented syllables, in a way that is
not predicted by Pierrehumbert's “sagging transition” model, which is central to the
distinction between H* and L+H*. We therefore argue that in both H* and L+H*
there are distinct L and H targets, and that the two should be regarded as belonging to
a single accent category. This analysis makes the description of English intonation
more theoretically consistent with that of various other European languages. The
analysis also helps explain ToBI transcribers’ demonstrated difficulty in making the
distinction between H* and L+H* reliably.
3
0. Introduction
It is probably accurate to describe as “standard” the phonological analysis of English
intonation proposed by Pierrehumbert (1980). There are actually two current versions
of this analysis, both revised from the original: first, the one presented in Beckman
and Pierrehumbert (1986), which can be regarded as the theoretically fleshed out full
system, and second, the one incorporated into the ToBI transcription standard
(Silverman et al. 1992, ToBI website), which is a somewhat simplified system that
makes various compromises with practical aims and with other theoretical views. A
great deal of current work on intonational function, intonational phonetics, and speech
technology simply presupposes one version or the other of the Pierrehumbert
description.
This is not to say that the system is without problems. A number of important issues
have surfaced repeatedly in the literature (see Ladd 1996 for extensive discussion),
and the establishment of the ToBI standard does not necessarily represent resolution
of these issues, only agreement to postpone resolution. One aspect of the original
analysis which persists in both revisions seems especially due for a reexamination.
This is the notion of a distinction between L+H* and H* accent types, and the
accompanying claim of a “sagging transition” between H* pitch accents The purpose
of this paper is to provide experimental evidence relevant to these issues1.
All versions of the Pierrehumbert system draw a distinction between two types of
basically high or rising pitch accents, namely H* and L+H*. In both types there is a
local peak near the end of the accented syllable, and the phonetic difference between
the two is said to reside primarily in the pitch of the preceding unaccented syllable
(lower before L+H* than before H*). Published definitions and discussions of the
distinction (e.g. Pierrehumbert 1980, Beckman and Pierrehumbert 1986,
Pierrehumbert and Hirschberg 1990, Pitrelli, Beckman and Hirschberg 1994) are not
very explicit and sometimes contradictory. For example, the “background” accents in
the experiments reported by Liberman and Pierrehumbert 1984 are treated as H* by
Pierrehumbert 1980 and L+H* by Pierrehumbert and Hirschberg 1990. Similarly,
4
Beckman and Pierrehumbert (1986: 259f.) say that “examples in Pierrehumbert
(1980) clearly show [that] L+H* contrasts with H*”, while Pitrelli et al. (1994: 125)
describe L+H* as “a minor variant of H*”. However, the basis of the difference
between H* and L+H* is clear in theory: in L+H* there are two distinct tonal targets,
L and H, whereas in H* there is only a single H target. In the L+H* accent, there is
always a pitch rise, produced as a transition from the low target to the high target. In
the H* accent there may or may not be a local rise, depending on a variety of factors;
these factors include the degree of prominence of the accent, the distance between the
accent and any preceding accent, and the segmental make-up of the syllable.
As part of this analysis, Pierrehumbert proposed that between consecutive H* accents
there is a “sagging transition”, unlike the linear transitions that interpolate between
tones in most other cases. The original conception was described informally by
Pierrehumbert (1980: 37) as “the F0 falls until it is time to start aiming for the next
H* level”; this idea is shown in Fig. 1. The details are described more precisely in
Pierrehumbert 1981 and modified in Anderson, Pierrehumbert and Liberman 1984,
but the essential idea – that the F0 minimum does not represent a target, and is simply
a function of the distance between the two accents – remains unchanged.
INSERT FIGURE 1 ABOUT HERE
In her original discussion of this analysis, Pierrehumbert acknowledged that the
sagging transition is not very satisfying theoretically. She says (1980: 70): “This
complication in the interpolation rules is in some ways unattractive, and we have
made a serious attempt to get rid of it by developing an account under which the dip
in contours like [those in Figure 1] arises from a L tone”. However, given her other
analytical decisions, “it does not appear possible to do this without considerably
changing the form of the theory”. The sagging transition was therefore adopted as a
solution, and this solution has remained a part of all versions of the Pierrehumbert
analysis.
However, the reasons for Pierrehumbert’s original theoretical dissatisfaction remain
as valid as ever. (For further discussion of this problem see Ladd 1996: 105ff.)
Moreover, the distinction between H* and L+H* is certainly a problem for ToBI
5
transcribers (Pitrelli, Beckman & Hirschberg, 1994) 2. It is therefore appropriate to
bring new data to bear on this issue, in the hopes of finding evidence for a more
practically robust and theoretically satisfying analysis. This is the goal of this paper.
Specifically, we present the results of three different experiments which all converge
on the conclusion that the F0 valley between two H* peaks is a phonologically
specified tonal target and should therefore be treated as the reflex of a L tone – as
Pierrehumbert originally wanted to do. We do not dismiss the possibility of a
distinction between the two accent types analysed by Pierrehumbert as H* and L+H*,
but on the basis of our results we believe that the distinction, if it exists, must be given
a different phonological interpretation.
1. Experiment 1: Alignment of interpeak L in production
In a number of other studies involving read speech, it has been demonstrated that both
the beginning and the end of the F0 rise of the first major pitch accent of an utterance
are aligned with the segmental string in consistent ways. The specific finding that is
relevant to our concerns here is that in English, Greek, and Dutch, the beginning of
the rise – presumably a low tone – is aligned quite precisely with the beginning of the
accented syllable (Arvaniti et al 1998, Ladd et al 1999, Ladd et al 2000). If the F0
minimum between two putative H* accents is similarly aligned (i.e. with the
beginning of the second accented syllable), it increases the plausibility of analysing
that F0 minimum as a phonological target and hence as a low tone.
If the F0 minimum is precisely aligned in this way, it would serve as a correlate of the
word boundary in such well-known minimal pairs in English as grade A / grey day.
Such pairs were first investigated experimentally by Lehiste (1960), who concluded
that segment duration and other allophonic differences were the most important cues
to boundary location: other things being equal, initial consonants are longer than final
consonants. Lehiste found no consistent F0 effects, but given the techniques available
for measuring F0 in the late 1950s, it would not be surprising if subtle effects had
gone unnoticed. We therefore ran experiment 1 to see if fine differences of alignment
of the F0 valley are correlated with the difference in boundary location) 3. Our
specific hypothesis was that the F0 minimum between the accentual peaks on the two

6
words should be located at the word boundary (actually, of course, the syllable
boundary, but in this specific case the two predictions are the same; see further
below). Thus, in grey day, the F0 minimum would be around the onset of /d/, while
for grade A, the F0 minimum would be at the onset of /e:/. Such a finding would
cause problems for a theory in which the F0 minimum is analysed as the targetless
endpoint of a “sagging transition” between two H* accents.
Before proceeding, we should respond to a general objection that various colleagues
and referees have raised to our overall approach. This revolves around the notion of a
tonal “target”. It is undoubtedly true that the acoustic regularities reported in the
work just cited by Arvaniti, Ladd, and others result from a fairly complex interaction
of phonologically-driven motor intentions with biomechanical and other constraints
on the speech production system. It would be premature to suppose that the precise
temporal alignment observed by these authors forms a basic part of the motor plan of
an utterance; it seems equally likely to be the result of other regularities whose exact
nature we can only guess at. To the extent that any claim about the speech production
mechanism is implied by the term “target”, it is important for us to disavow the claim
explicitly. At the same time, however, the existence of such alignment regularities is
at the very least unexpected in any theory that emphasises the phonological centrality
of F0 change (slope, etc.). Even one of the anonymous referees who raises the point
about the complexity of the relation between phonology and speech production agrees
that the finding of “consistent F0-syllable alignments in speech … is itself worth
reporting.” While we agree that much needs to be learned about how phonological
representations are manifested in motor behaviour, we believe that the regularities of
alignment reported in this paper are legitimately used as one source of evidence about
phonological distinctions and phonological structure.
1.1. Method
Materials
Our general method involved having participants read aloud written sentences
containing two test words in which a word boundary was ambiguously located, as it is
in grade A / grey day. To investigate the behaviour of interpeak F0 minima, we
needed to design materials that met two criteria. First, the segments around the F0
7
minimum needed to be sonorant consonants (nasals and laterals), so that it would be
possible to measure F0 fairly reliably (see Lehiste 1970: 68-71, for more detail on the
kinds of F0 perturbations produced by different types of consonants). Second, the test
phrases needed to be ones in which it is plausible for both words to bear pitch accents,
so that speakers would reliably read them with two successive H* peaks. Good
candidate phrases meeting this criterion were personal names, where both first name
and surname can be accented, especially when contrasted with another similar name.
Our test items were therefore carrier sentences like It was Jay Neeson, not Dave
Seaman and It was Jane Eason, not June Olson, where Jay Neeson and Jane Eason
are the test names and Dave Seaman and June Olson are foils whose purpose is to
provide contrast. Every sentence was of the general form It was [test name], not [foil
name]. Every test name had its own individually chosen foil name; we chose foil
names that might plausibly be confused with the test names (e.g. Eleanor Mullins /
Annabelle Myers).
In constructing the test names, we attempted to find minimal pairs such as Jay Neeson
/ Jane Eason or Norma Nelson / Norman Elson, so that the alignment data could be
compared as directly as possible. However, in some cases this was not possible, and
the materials include non-minimal test pairs like Helena Lonsdale / Helen Alonso and
Malkah Mandelson / Malcolm Anderson. To forestall possible misunderstanding, we
emphasise that we never used both members of a minimal pair in a single sentence as
test name and foil name, i.e. we never had sentences like It was Jay Neeson, not Jane
Eason. Indeed, our intention was that speakers should not be aware of the presence of
minimal pairs in the materials at all, and post-session interviews established that we
were successful for all speakers. As far as possible, we looked for names with which
our speakers might be expected to be familiar, but because of the phonetic constraints
dictated by the purpose of the experiment, some of the names are identifiably non-
English (e.g. first name Julio, Malkah; surname Iwaki, Miranda) or uncommon (e.g.
first name Shea, Kyle, surname Neely, Malaney).
There were 104 test items. There were also 10 practice items and 64 fillers of the
same form. The list was pseudo-randomly ordered, with two halves of the list
separated by a 15-filler buffer. Members of each pair of test names (eg. Jay Neeson /
8
Jane Eason) appeared in different halves, allocated using a Latin Square. The post-
practice list started with 5 fillers. A full list of test items is given in Appendix I.
Design
We investigated two types of word-boundary ambiguity: those involving a single
consonant (Joe Neeson / Joan Eason) and those involving a whole syllable (Al
Maloney / Alma Lonie). We predicted that the alignment of the F0 minimum would
be affected in the former case, but not in the latter. Specifically, we predicted that the
F0 minimum would be aligned later, relative to the onset of the ‘ambiguous’
consonant, in names like Joan Eason than in those like Joe Neeson.
We also tested the possibility that the results would be influenced by whether the first
name is potentially monosyllabic (e.g. Joe Neeson, Al Maloney) or always disyllabic
(e.g. Norman Elson, Brian Iwaki); we assumed the presence of stress clash and/or the
occurrence of word-final accent might affect the details of F0 alignment. We had no
basis for a specific prediction here.
There were thus three factors in the experimental design, which we refer to as
Boundary (Early - Late), Ambiguity (Consonant - Syllable) and Length of First Name
(Short - Long). Boundary was a within-items factor; the other two were between-
items. Data were analysed using 2 x 2 x 2 ANOVAs, with items as the random factor.
We analysed the data for each speaker separately. Comparisons were also planned of
the effect of boundary in the ambiguous consonant condition and ambiguous syllable
condition separately, averaging over the two first name length conditions (simple
effect of Boundary). Although Boundary was a within-items factor in the design, it
was a between-items factor in the analyses to avoid the pairwise loss of data if one
member of the pair was missing. Note that this analysis is less sensitive and therefore
does not bias the results in favour of supporting the hypothesis.
Speakers
Results are reported for two speakers, both female undergraduates at Edinburgh
University, one with an English accent (EF) and one with a Scottish accent (SF). A
number of other speakers were recorded, some in a pilot study, some as additional
9
speakers in this version of the experiment. However, their recordings were not
analysed beyond simple inspection of the F0 contour. This was due to a combination
of problems we encountered with their speech:
1. Some speakers did not put accents on both first name and surname sufficiently
often to get an adequate number of data points for interpeak F0 minima.
2. Some speakers frequently produced glottal onsets of surnames starting in vowels,
which caused major perturbations on the F0 contour, thus masking the effect of
interest.
3. Some speakers had very monotonous F0 contours, which made it impossible to
find reliable minima between accents, as they became indistinguishable from
random or consonant-driven perturbations in F0.
Furthermore, the data from the speakers in the pilot experiment could not be used
because of other problems with the earlier version of the materials.
We recognise the limitations of studies based on so few speakers (cf. the comments
by Xu 1999: 60), but we feel that detailed “case studies”, as Xu calls them, are not
without value. It is clearly appropriate for phoneticians to reconsider their customary
approach to sampling and statistical analysis, especially now that the collection of
acoustic and even articulatory data has become so much easier (cf. the editorial note
at the beginning of volume 26 of Journal of Phonetics); at the same time, however,
the field’s collective experience suggests that phonetic detail of the sort investigated
here is generally remarkably consistent from one speaker to another. Even large-scale
studies explicitly concerned with inter-speaker variability (e.g. Westbury, Severson &
Lindstrom 2000, which is based on data from 53 speakers) show a high degree of
inter-speaker agreement on many fine details. Specifically with regard to the present
paper, we would also note that the perception study in Experiment 2, which used 24
listeners, provides some measure of assurance that the patterns observed in our two
speakers are likely to be generalisable.
Procedure
Speakers were recorded on professional equipment in a sound-attenuated booth in the
Phonetics Laboratory of the Edinburgh University Department of Theoretical and
Applied Linguistics. The recordings were made direct to disk at a sampling rate of 16
kHz. The test sentences were displayed one at a time on a computer screen. Speakers
10
pressed the space bar on the keyboard to call up the next sentence. Speakers were
instructed to read the sentences fluently and to repeat any sentence if they stumbled.
As described above, the contrastiveness of the sentences unfortunately meant that
speakers tended to use a glottal attack at the onset of surnames starting with vowels.
However, our pilot experiments had shown that if we asked speakers to read at a fairly
fast rate “as though talking to a friend”, this problem was minimised. Also, speakers
were given feedback about reading speed after 10 practice items at the beginning of
the experimental session. The whole session lasted about 20 minutes.
Measurements
F0 was extracted using 10 ms windows on ESPS x-waves software. Measurements
were made on simultaneous displays of speech wave, wide-band spectrogram and F0
tracks. Three points were marked in each speech file:
L: the location of the F0 minimum between the first name and surname of each
test phrase;
C1: the beginning of the “test consonant” (the consonant immediately preceding
the stressed vowel of the surname). In the ambiguous consonant condition, the test
consonant is the ambiguous consonant; in the ambiguous syllable condition it is
the onset of the accented syllable of the surname;
V1: the end of the test consonant, i.e. the beginning of the accented vowel of the
surname.
From these three points we calculated two dependent variables for L, namely its
distance from both C1 and V1. The third dependent variable was the duration of the
test consonant (V1 minus C1). Note that when there was a stretch of two or more
identical F0 points at the level of the F0 minimum, we took the first such point as the
basis for calculating the alignment of L.
Datapoints were discarded: 1) when speakers showed glottal stops or glottalisation at
vowel-onset targets, judged from the spectrogram; 2) when speakers deaccented either
the first name or the surname of the test name, or when they used a “flat hat” contour4
on the name phrase as whole; 3) when speakers mispronounced a name in a way that
affected the experimental comparisons (e.g. put stress on a syllable other than the one
11
intended). For speakers EF and SF we discarded 15.5 and 18.4% of utterances
respectively.
Accent test
Since we are using the results of this and the subsequent two experiments to draw
conclusions about H* accents, it is important to be sure that the contours we are
investigating do indeed contain H* as their second accent. In the judgement of the
first author (who has considerable experience with impressionistic transcription of
intonation and was a party to the discussions that led to the establishment of the ToBI
standard), there is no doubt that this condition is met, but because of the possibility of
bias we consulted with four experienced ToBI transcribers unconnected with our
research. We put a set of 12 representative utterances (randomly chosen from the
different experimental conditions) on a website where they could be accessed
remotely, and asked the independent transcribers to give us their opinion about the
nature of the accents on the test names. We specifically pointed out that we were
concerned to establish whether the accents were H* or L+H*, because of the well-
known difficulty in making this distinction.
Overall, there was general agreement (88%) on the part of the four independent
transcribers that the second accent in the sequences was H* (including downstepped
H*) rather than L+H*. One transcriber did report considerably fewer H* accents in
the relevant position (58%) than the three other raters (100%, 100% and 92%), but she
also explicitly advised us to discount her judgements if they differed from those of
more experienced transcribers. (Among other things, this illustrates the amount of
disagreement, even among highly skilled ToBI users, in making categorical
judgements on H* vs L+H* accents.) Two sample pitch traces are given in Fig. 2, and
details of the independent transcribers’ judgements are provided in Appendix II.
XXXXXXXXXXXXX INSERT FIGURE 2 ABOUT HERE XXXXXXXXXX
1.2 Results
12
Figure 3 shows the means of the valid cases for each of the eight cells in the design
for each speaker separately. Analyses for SF and EF will now be reported in turn.
Unreported effects did not reach significance. Note, however, that non-significant
effects in these analyses tended to involve the length of the test words.
XXXXXXXX INSERT FIGURE 3 ABOUT HERE XXXXXXXXXXXXXXXXX
Alignment
Recall that alignment of the F0 minimum (L) was characterised quantitatively in two
different ways, relative to both the beginning (C1) and the end (V1) of the test
consonant. Separate ANOVAs were done for both of these dependent variables, for
each speaker separately.
For speaker SF, the ANOVA for the alignment of L relative to V1 showed a main
effect of Boundary, F(1,83) = 6.18, p = .015, and an interaction between Boundary
and Ambiguity, F(1,83) = 17.49, p < .0001. This interaction was further analysed by
testing the simple main effects of Boundary for ambiguous consonants and ambiguous
syllables separately. This analysis showed that Boundary had a significant effect when
the consonant was ambiguous, F(1,39) = 26.651, p < .0001, (with alignment at 35 ms
before V1 for early boundaries and 9 ms after V1 for late boundaries) but not when
the syllable was ambiguous, F(1,41) = 1.48, p > 0.2 (with alignment of 16 and 28 ms
before V1 for early and late boundaries respectively).
The ANOVA for the alignment of L relative to C1 for SF showed the same overall
pattern. The effect of Boundary approached significance, F(1,83) = 3.14, p = .081, as
did the interaction between Boundary and Ambiguity, F(1,83) = 3.37, p = .070. The
simple effect of Boundary was significant in the ambiguous consonant condition,
F(1,39) = 8.082, p = .007, (with alignment 31 ms after C1 for early boundaries, and
58 ms after C1 for late boundaries) but not in the ambiguous syllable condition,
F(1,41) < 1 (both boundaries showing alignment at 43 ms after C1).
13
Speaker EF showed a similar pattern. The ANOVA for the measure L to V1 revealed
a main effect of Boundary, F(1,86) = 20.42, p < .0001, a main effect of Ambiguity
F(1,86) = 32, p < .0001, and an interaction between Ambiguity and Boundary, F(1,86)
= 15.92, p < .0001. The three-way interaction (with first name length) approached
significance as well, F(1,86) = 3.76, p < .056. As for speaker SF, the simple effect of
Boundary was significant in the ambiguous consonant condition, F(1,43) = 34.380, p
< .0001 (alignment at 55 ms before V1 for early boundaries, and at 19 ms before V1
for late boundaries) but not in the ambiguous syllable condition, F(1,40) = 1.144, p >
.7 (with alignment at 62 and 60 ms before V1 for early and late boundaries
respectively).
The measure L to C1 replicates the pattern. The ANOVA showed a main effect of
Ambiguity, F(1,86) = 5.45, p = .022, and a main effect of Boundary that approached
significance, F(1,86) = 3.17, p = .079. The Ambiguity x Boundary interaction also
approached significance, F(1,86) = 2.66, p = .107, as did the three-way interaction,
F(1,86) = 2.75, p = .101. The simple effect of Boundary was significant in the
ambiguous consonant condition, F(1,43) = 4.192, p = .047, (with alignment at 11 ms
after C1 for the early boundary, and 24 ms after C1 for the late boundary condition)
but not in the ambiguous syllable condition, F(1,40) = .197, p > .6 (with alignment at
6 and 9 ms after C1 respectively for the early and late boundary conditions).
As can be seen from Fig. 3, speaker SF showed later overall alignment than speaker
EF. Although this may be due to individual speaker differences, impressionistic
observation suggests that this is a general difference between English and Scottish
pronunciation. This is a matter for further investigation; no reliable comparative data
currently exist. Crucially, though, the effects of our experimental factors were
consistent across both speakers, despite the overall differences in alignment.
Summarising, the analyses for both speakers broadly support the prediction that
alignment of L would be affected in the ambiguous consonant condition (Joe Neeson /
Joan Eason) but not in the ambiguous syllable condition (Al Maloney / Alma Lonie).
This result emerges regardless of whether the alignment of L is measured relative to
the beginning or the end of the test consonant, although the pattern is statistically
more robust when the L to V1 measure is used.
14
Consonant duration
As noted in the introduction, Lehiste (1960) concluded that the duration of ambiguous
segments plays an important role in signalling boundary location. This finding was
clearly replicated here. The ANOVA for the duration of the test consonant (V1 minus
C1) showed that SF had a main effect of Ambiguity, F(1,83) = 5.49, p = .022, and an
interaction between Ambiguity and Boundary, F(1,83) = 22.15, p < .0001. The simple
effect of Boundary was significant in the ambiguous consonant condition, F(1,39) =
28.714, p < .0001 (with a duration of 67 ms for the early boundary condition, and 47
ms for the late boundary condition), and also in the ambiguous syllable condition,
F(1.41) = 4.952, p < .032 (with a duration of 59 ms for the early boundary condition
and 70 ms for the late boundary condition).
EF showed a main effect of Ambiguity on consonant duration, F(1,86) = 25.39, p <
.0001, a main effect of Boundary, F(1,86) = 16.80, p < .0001, and an interaction
between Boundary and Ambiguity, F(1,86) = 19.61, p < .0001. The simple effect of
Boundary was significant in the ambiguous consonant condition, F(1,43) = 62.618, p
< .0001 (with durations of 66 and 42 ms for the early and late boundary conditions
respectively), but not in the ambiguous syllable condition, F(1,40) < 1 (with durations
of 68 and 69 ms for the early and late boundary conditions respectively).
Overall, what these analyses suggest is that the duration of consonants is strongly
affected by their place in syllable structure (i.e. whether they are onset or coda
consonants), but less clearly affected by position in word when position in syllable is
kept constant. For further on such durational effects see Turk and White (1999).
1.3 Discussion
The above analyses clearly show a pattern in line with our predictions: Both speakers
showed effects of Boundary on the alignment of the local F0 minimum relative to V1
and C1. Early word boundaries (e.g. Jay Neeson) led to earlier alignment of the local
pitch minimum than late boundaries (e.g. Jane Eason), but only when the consonant
15
was ambiguous, not when the syllable was ambiguous (e.g. Al Maloney vs Alma
Lonie). The factor Length of First Name did not have an effect and did not interact
with other factors, showing that potential monosyllabicity did not have a significant
impact on alignment or vowel length.
One complication is that the durations of the test consonants show effects of boundary
when consonants are ambiguous, and no effect (EF) or a smaller effect (SF) when
syllables are ambiguous, following the same pattern as the alignment data. This raises
the possibility that the effects on alignment are artefacts of the differences in
consonant duration. However, this possibility does not appear to stand up to closer
inspection. For SF, the duration of the test consonant is 67 ms when the boundary is
early, and 47 ms when the boundary is late, i.e. a difference in consonant duration of
20 ms. The alignment difference for these conditions, however, is 40 ms, or twice the
size of the consonant effect. Analogous remarks apply to speaker EF. It thus appears
that there is an effect on alignment independent of any difference in segmental
duration.
The results of Experiment 1 may therefore be summarised as indicating that the
alignment of the F0 minimum between two H* pitch accents is sensitive to the
syllable structure of the second accented syllable. Specifically, the F0 minimum
aligns with the beginning of the syllable, which means that its alignment relative to
the potentially ambiguous consonant in pairs like Norman Elson / Norma Nelson is
determined by which syllable the consonant belongs to. The results also show that the
alignment of the F0 minimum is not a general word-boundary correlate, because it is
unaffected by the word membership of the potentially ambiguous syllable in pairs like
Al Maloney / Alma Lonie.
Such clear phonological conditioning of the alignment is consistent with the idea that
the F0 minimum corresponds to a phonologically specified low tonal target. It is also
difficult to reconcile with Pierrehumbert’s claim that the F0 minimum is merely the
manifestation of a sagging transition between the two accent peaks. It is
unfortunately not straightforward to evaluate the present finding directly against the
Pierrehumbert analysis, partly because the two different published quantitative models
based on Pierrehumbert (Pierrehumbert 1981 and Anderson et al. 1984) make

16
somewhat different predictions, and partly because their predictions depend to some
extent on assumptions about the scaling of second accent peak (discussed further
under Experiment 3). However, it seems fair to say that precise coordination of the
F0 minimum with the beginning of the accented syllable is not in keeping with the
idea that the transition between the two peaks is determined by low-level phonetic
factors. Nevertheless, the case for the phonological significance of the alignment of
the F0 minimum would certainly be bolstered if it could be shown that it is not only a
phonetic correlate of the syllable membership of the ambiguous consonant, but also
serves as a perceptual cue. This “perceptual validation” is the goal of the next
experiment.
2. Experiment 2: The alignment of interpeak L as a perceptual cue
Based on the finding in Experiment 1 that the alignment of the interpeak F0 minimum
is affected by the syllable membership of potentially ambiguous consonants, this
experiment tests the hypothesis that the alignment of the F0 minimum is used as a
perceptual cue by listeners, allowing them to distinguish between otherwise identical
utterances that are ambiguous between e.g. Norman Elson and Norma Nelson. If the
alignment of the interpeak F0 minimum affects listeners' percepts, our claim that
interpeak minima are controlled by a tonal target would be strengthened, and would
gain psychological significance.
2.1 Method
The general method for this experiment involved altering the alignment of the F0
minima artificially, and testing the effect of these alterations on listeners’ judgements
on the location of the word boundary.
Materials
We selected two minimal pairs from the materials of experiment 1, Norma Nelson /
Norman Elson and Ella Norwell / Ellen Orwell and used EF’s productions of these
test names as the basis of the stimuli in Experiment 2. Only the first half of the test
sentences, i.e. only ‘It was [test name]’, was used. We did not use any names from

17
the ‘short first name’ condition of Experiment 1, as these names provided additional
segmental cues (especially in the vowel of the first name and the acoustic detail of the
ambiguous consonant) that were impossible to remove.
We intended simply to use the first half of the original utterances as stimuli.
However, on one of the original speech files from Experiment 1, there was some noise
on the sound track at ‘It was...’. We therefore decided to take the phrase ‘It was...’
from one speech file only (originally ‘It was Ella Norwell’), and splice this onto all
the test names. Apart from the test names, therefore, the sources of the stimulus
utterances were identical.
As noted in the discussion of Experiment 1, the test names contained duration cues as
well as F0 alignment cues to word boundary location. In order to avoid confounding
our results with durational cues, we altered all the source utterances to make them
durationally ambiguous. In what follows we refer to these stimuli as “durationally
modified”. In each case, we adjusted the duration of the ambiguous consonant to a
value that was the average of its duration in the early-boundary and late-boundary
conditions in Experiment 1. The early boundary names had the shortest ambiguous
consonants, so those were lengthened by adding additional periods of /n/. In the late
boundary names, periods were removed to shorten them. The splicing and shortening
were done at zero-crossings in parts of the /n/ that were as stable as possible, to avoid
introducing clicks or audible discontinuities.
From the four durationally modified source utterances created in this way, a set of
stimuli was created in which the alignment of the F0 minimum varied systematically
(see fig. 4). Source utterances were manipulated using the PSOLA (Pitch
Synchronous Overlap and Add) resynthesis routine on Praat (Boersma, 1992). The
locations of the F0 minima are shown in Figure 4. They were as follows:
Step 1: 15 ms before onset of ambiguous consonant
Step 2: halfway between steps 1 and 3
Step 3: centre of ambiguous consonant
Step 4: halfway between steps 3 and 5
Step 5: 15 ms after offset of the ambiguous consonant
18
This modification of alignment naturally affects the slope of the pitch movements on
either side, but this appears to reflect the situation in natural speech. The work on F0
alignment inspired by Arvaniti et al. 1998 suggests very clearly that what
characterises pitch accents phonetically is constant alignment rather than constant
slope.
XXXXXXX FIGURE 4 ABOUT HERE XXXXXXXXXXXXX
In addition to the stimuli derived from the four durationally modified source
utterances, we used the unmodified source utterances as further stimuli, to test the
adequacy of the subjects' performance and the sensitivity of the experimental method.
These utterances had the original alignment and original consonant duration, exactly
as produced by speaker EF in Experiment 1.
Design
In all of this experiment, subjects was the random factor. For the durationally
modified names there were three fixed factors, all of which were within-subjects:
Alignment Step (with levels 1, 2, 3, 4, and 5, as described above); Name (Norm* vs
Ell*); and Original Boundary Location (Early vs Late, i.e. whether the source
utterance had an early boundary (Ella, Norma) or a late boundary (Ellen, Norman)).
For the analysis of subject judgements of the unmodified source utterances, only the
second and third of these factors were used, since Alignment Step was of course not
manipulated.
Subjects
The subjects were 24 volunteer first and second year undergraduates from the
Linguistics programme at the University of Edinburgh. They all reported having
normal hearing and reading. They were given course credit for their participation.
Procedure
All sound files were converted to the Sound Designer II format at a sampling
frequency of 22050 Hz., for presentation to the experimental listeners. We presented
the stimuli over Macintosh desktop computers, using professional quality closed
19
headphones. Presentation of the stimuli was controlled by PsyScope software (Cohen
et al., 1993).
Subjects were seated in front of a computer. They were instructed to listen to the
names carefully, and indicate by pressing the D key that they had heard the name
presented on the left of their computer screen, or by pressing the F key that they had
heard the name presented on the right of their screen. Subjects were told that they did
not have to respond at speed, but that they should not think for too long, as we were
interested in their first impressions.
Each trial started with an asterisk on the computer screen, which was displayed until
subjects pressed any key, which was followed by a 500 ms delay, which, in turn, was
followed by the sound file (approximately one second long). Subjects were then
presented with the two alternative names (e.g. Norma Nelson / Norman Elson) on the
computer screen. The names remained on the screen until subjects had indicated by
their key-press which name they had heard. There was then a 400 ms delay until the
next trial appeared. The position (left vs right) of the names on the screen was
counterbalanced across subjects.
Subjects heard each stimulus a total of 10 times The names were presented in six
blocks. The first four blocks each contained all the stimuli derived from one
durationally modified source utterance, presented on each trial with one of the five
alignment steps. The final two blocks involved the durationally unmodified
utterances, with two unaltered source utterances presented in each block. The order
of stimuli within each block was random. The order of the blocks was
counterbalanced. Half the subjects started with the source utterance Ella Norwell, then
Norman Elson, Ellen Orwell and Norma Nelson, followed by the original Ella
Norwell / Ellen Orwell and finishing with the original Norma Nelson / Norman Elson.
The other half of the subjects heard the order Norman Elson, Ella Norwell, Norma
Nelson, Ellen Orwell, original Norma Nelson / Norman Elson, original Ella Norwell /
Ellen Orwell. Each of the first four blocks consisted of fifty trials, ten from each step
condition. The two final blocks consisted of twenty trials, ten of each source
utterance, giving a total of 240 trials in the experiment. Subjects were allowed to rest
between blocks. The whole experiment lasted approximately twenty minutes.
20
2.2. Results
Alignment steps
The mean percentage of ‘late’ responses (i.e. responses in which subjects reported
hearing Ellen or Norman, as opposed to Ella or Norma, respectively) for each
alignment step in the stimuli with altered consonant durations are given in Figure 5,
top panel.
XXXXXXX FIGURE 5 ABOUT HERE XXXXXXXXXXXXXXX
There was a significant main effect of step in a 1 x 5 repeated-measures ANOVA,
F(4,92) = 4.643, p = 0.002, showing that listeners were sensitive to the location of the
F0 minimum when making their word-boundary decisions. As predicted, the later
steps tended to have higher numbers of late responses, suggesting that later alignment,
around the onset of the surname's first vowel, was more likely to be perceived as
indicating a late word boundary. Although this 1 x 5 ANOVA is suggestive, it does
not pinpoint whether later steps actually generated more late responses, as we
hypothesised. To assess this hypothesis, we ran a paired-samples t-test on the average
percentage of late responses for steps 1 and 2 (calculated for each subject), compared
with the percentage of late responses for steps 4 and 5. The means were 45% and 51%
respectively, and this difference was significant, t(23) = -3.26, p = 0.003.
Control
For comparison, the original source names, where both alignment and consonant
duration were as in the original, showed the following mean percentage late
responses: Early: 29.6%, Late: 65.0% . These means differed significantly from each
other in a 1 x 2 repeated measures ANOVA, F(1,23) = 35.42, p < 0.0001. Thus, the
combined effect of consonant duration and alignment had a very strong effect on
subjects' perception of the boundary location. However, it is interesting to note that
even the unmodified source utterances were by no means unambiguous, in the sense
that subjects’ judgements, though not random, were nowhere close to 100%. This
21
suggests that the small differences in the perception of the durationally modified
utterances are meaningful.
Effects of and interactions with original source name
Although the analyses reported above give us information regarding the main
hypothesis of the experiment, showing that alignment alone can serve as a cue to
word boundary (all other factors being equal), the picture is complicated when more
detailed analyses are performed.
The original name (Ell* vs. Norm*) appears to have a significant effect on listeners'
perceptions of boundary location. The mean rate of late responses to Ell* names was
56%, with 40.9% for Norm* names, which was a significant difference, F(1,23) =
9.67, p = 0.005. This factor did not interact with any others. The significance of this
factor may simply reflect preferences based on the frequency of each first name and /
or surname, and is not of major relevance in the assessment of our experimental
hypothesis.
There was also a significant interaction between Boundary and Step, F(4,92) = 4.531,
p = 0.002. The relevant means are depicted in Figure 5, bottom panel. A first concern
is that the effect of Step may not be significant in either the early or the late Boundary
source materials. However, this proved not to be the case, as the simple main effect of
step was significant in both the early condition, F(4,92) = 3.503, p = 0.010, and in the
late condition, F(4,92) = 5.678, p < 0.0001. Thus, the effect does not depend on a
particular type of source utterance. A further way to explore the findings is by
pairwise analyses, inspecting the effect of Boundary for each step. These analyses
revealed that only for step 3 did the two Boundary conditions actually differ, t(23) = -
4.78, p < 0.0001 (all other pairs: p > 0.15). This pattern makes sense if one thinks of
the influence of different acoustic cues on word boundary perception. Normally
consonant duration is a strong cue (cf. control analyses). However, this cue has been
artificially removed from listeners’ use. The next best cue may be alignment, but at
step 3 the alignment is at the centre of the consonant, at its most ambiguous position.
The next best cues may be residual effects of the original boundary on the realisation
of the segments (e.g. strength of juncture, colouring of the ‘ambiguous’ consonant or
the following vowel etc.), but these extremely subtle cues may only come into play
22
when the alignment cue has been neutralised. Such an account would explain the
interaction between Boundary and Step.
2.3. Discussion
The results of Experiment 2, though rather messy in some ways, make clear that the
perception of utterances containing consonants with ambiguous syllable membership
can be affected by the alignment of the inter-accent F0 minimum. This strengthens
the conclusion, based on the production regularities discovered in Experiment 1, that
the F0 minimum has some phonological significance. However, in order to add
weight to the claim that we are dealing with a low tonal target, it is necessary to
investigate not only the alignment of the valley, but also its “scaling” or F0 level.
This is the goal of the third experiment.
3. Experiment 3: Scaling of interpeak L as a function of interpeak distance
This experiment addresses the question of “sagging transitions” between H* accents.
In support of the notion of the sagging transition, Pierrehumbert made two empirical
claims: first, that the extent of the “sag” between two H* peaks – i.e. the amount by
which the F0 declines between the first accent peak and the inter-accent valley – is a
function of the distance between the two peaks; and second, that the height of H*
peaks is determined independently of the amount of “sag” in the transition between
them sags. These claims had two main sources of empirical support: first, informal
observations of the amount of sag in selected phrases in a corpus of extracted F0
contours presented by O’Shaughnessy 1976; and second, auditory evaluation of F0
algorithms for synthetic speech. With regard to the first point, Pierrehumbert notes
that in phrases with no unstressed syllables intervening between the H* peaks, e.g. a
name like May Meyer, the F0 sag is often absent, whereas in phrases with one or more
unstressed syllables intervening between the H* peaks, e.g. names like Norman Elson
or Gwendolyn Delaney, the F0 sag is clearly present. With regard to the second point,
Pierrehumbert herself (1981: 989) notes that “the ear seems to be relatively insensitive
to the shape of the curve between targets” – something that is borne out by our own
experience with synthetic intonation. Overall, then, the quantitative predictions made
23
by any version of the sagging-transition hypothesis have never been subjected to
careful empirical evaluation, but it is clear that if Pierrehumbert’s claims are valid,
then they support her analysis of the H* accent. That is, it would reasonable to treat
the minimum not as a low tonal target but merely as a consequence of the “sag” in the
transition between the two peaks, if:
the “scaling” or pitch level of the F0 minimum is determined by low-level
phonetic factors such as the distance between the two accents; and
if the scaling of the two H* accents is determined independently of the F0
minimum.
However, our own informal observations suggested that the F0 minimum in names
like Norman Elson and Gwendolyn Delaney does have a fairly consistent target level,
and that the difference Pierrehumbert observed between cases like these and the May
Meyer cases is due to specific effects of “stress clash” (i.e. the fact that the two
accented syllables in May Meyer are directly adjacent). In the third experiment,
therefore, we systematically varied the number of unstressed syllables intervening
between the two accents from zero to three, and expected to find a significant effect
on the scaling of the F0 minimum only for the stress clash case. If there is a constant
value for the F0 minimum in the other cases, it would support the contention that the
F0 minimum represents a L target.
3.1 Method
Our general method was to measure the F0 value of the interpeak F0 minimum in
utterances with zero, one, two or three syllables between the two stressed syllables, as
well as the F0 values at the surrounding peaks (H1 and H2, for the first and second
peak, respectively). In addition, we measured the interpeak duration (H1 to H2) and
the distance of the interpeak F0 minimum (L) from each peak. The experimental
materials were recorded in the same recording session as those for Experiment 1.
Materials
24
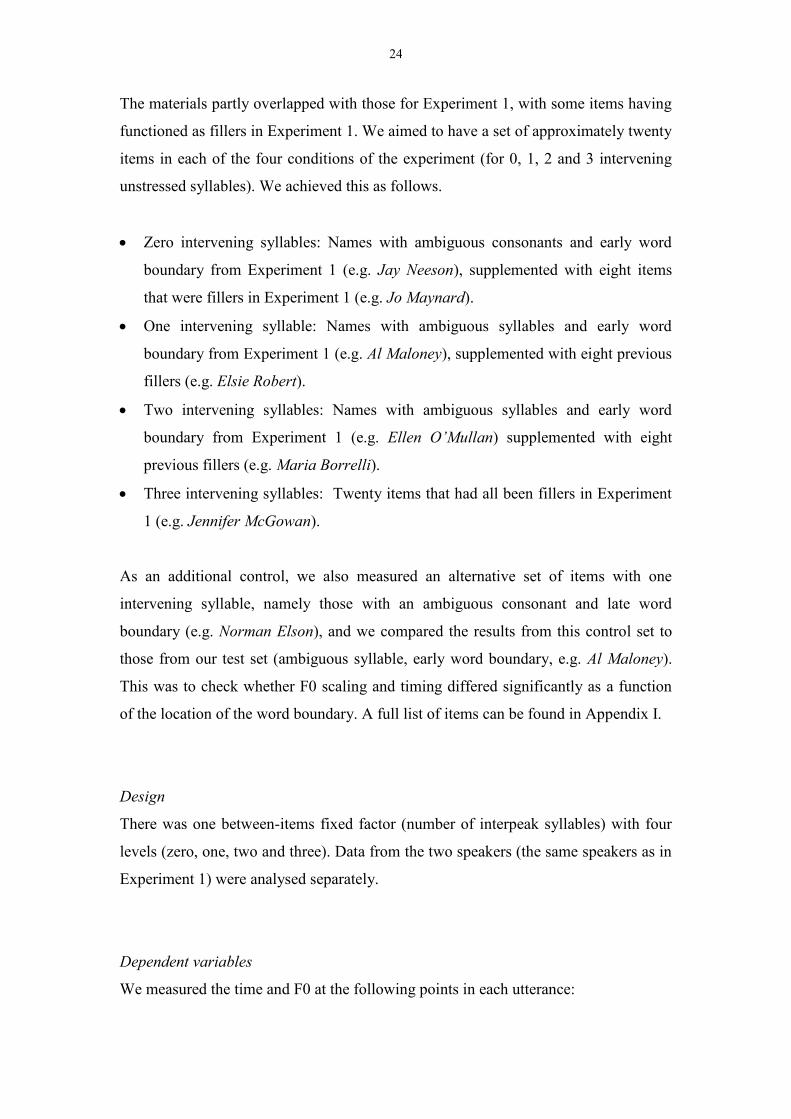
The materials partly overlapped with those for Experiment 1, with some items having
functioned as fillers in Experiment 1. We aimed to have a set of approximately twenty
items in each of the four conditions of the experiment (for 0, 1, 2 and 3 intervening
unstressed syllables). We achieved this as follows.
Zero intervening syllables: Names with ambiguous consonants and early word
boundary from Experiment 1 (e.g. Jay Neeson), supplemented with eight items
that were fillers in Experiment 1 (e.g. Jo Maynard).
One intervening syllable: Names with ambiguous syllables and early word
boundary from Experiment 1 (e.g. Al Maloney), supplemented with eight previous
fillers (e.g. Elsie Robert).
Two intervening syllables: Names with ambiguous syllables and early word
boundary from Experiment 1 (e.g. Ellen O’Mullan) supplemented with eight
previous fillers (e.g. Maria Borrelli).
Three intervening syllables: Twenty items that had all been fillers in Experiment
1 (e.g. Jennifer McGowan).
As an additional control, we also measured an alternative set of items with one
intervening syllable, namely those with an ambiguous consonant and late word
boundary (e.g. Norman Elson), and we compared the results from this control set to
those from our test set (ambiguous syllable, early word boundary, e.g. Al Maloney).
This was to check whether F0 scaling and timing differed significantly as a function
of the location of the word boundary. A full list of items can be found in Appendix I.
Design
There was one between-items fixed factor (number of interpeak syllables) with four
levels (zero, one, two and three). Data from the two speakers (the same speakers as in
Experiment 1) were analysed separately.
Dependent variables
We measured the time and F0 at the following points in each utterance:
25
H1 (first peak),
L (interpeak F0 minimum),
H2 (second peak)
From these measurements were derived a number of dependent variables, including
the F0 level at each of the three points, the F0 interval between successive points, and
the time interval spanned by all three pairs of points.
3.2 Results
F0 data
The means for F0 levels at the first peak (H1), the interpeak F0 minimum (L), and the
second peak (H2), as well as the mean fall and rise sizes (all in Hz) are reported in
Figure 6.
XXXXXXXXXXX FIGURE 6 ABOUT HERE XXXXXXXXXXXXX
For H1, 1 x 4 ANOVAs revealed that there was no effect of number of syllables on F0
for either speaker (both p > 0.2). For L, there was an overall effect, F(3,69) = 3.58, p
= 0.018 for EF; F(3,70) = 8.43, p < 0.0001 for SF. Further analysis shows that the
effect on L is due to the difference between zero and one intervening syllable (F(1,35)
= 3.69, p = 0.069 for EF; F(1,35) = 11.99, p < 0.001 for SF). A 1 x 3 ANOVA on one,
two and three intervening syllables did not reach significance for either speaker (both
F < 1). For H2, there is a similar pattern to L, with a significant overall effect of the
number of intervening syllables on the F0 value at H2 (EF: F(3,68) = 3.43, p = 0.022,
SF: F(3,70) = 4.89, p = 0.004). Again, only the contrast between zero and one
intervening syllable is significant, and only for SF: F(1,35) = 7.00, p = 0.012.
If we consider the difference in F0 between the measurement points, we find a similar
pattern: There were no significant differences in the data for the F0 rise from L to H2,
but the H1 to L fall shows overall significance for both speakers, F(3,68) = 11.14, p <
26
0.0001 for EF; F(3,70) = 6.83, p < 0.0001 for SF. There is a significant difference
between zero and one intervening syllables, again for both speakers (F(1,35) = 6.63, p
= 0.014 for EF and F(1,35) = 7.68, p = 0.008 for SF). For SF there were no further
significant differences, but EF showed a significant effect of number of syllables in a
1 x 3 ANOVA including the 1, 2 and 3 intervening syllables conditions, F(2,50) =
5.940, p = 0.005, with a significant difference between the two and three syllable
conditions only, F(1,33) = 6.41, p = 0.016.
In summary, the height of the initial peak (H1) is not affected by the upcoming
interpeak distance. The F0 minimum (L) is consistently higher when there are no
interpeak syllables, but is generally unaffected by the number of interpeak syllables if
there are one or more: there is a small numerical trend in accordance with
Pierrehumbert's proposal, but this trend is not significant in a 1 x 3 ANOVA. The
height of the second peak (H2) varies in the same way as L: it is lower as the number
of interpeak syllables increases, and only the difference between zero and one
interpeak syllables has a statistically significant effect.
If we look at these findings in terms of F0 change rather than F0 level, we find a
pattern that is exactly consistent with the F0 level data. The rise from L to H2 is
constant across the range of interpeak syllables, but the fall from H1 to L increases in
size as the number of interpeak syllables increases. Once again the most important
difference is that between zero and one interpeak syllables, although EF also shows a
significant difference in F0 fall between two and three interpeak syllables.
The clear linkage between L and H2 is not predicted by Pierrehumbert’s approach.
That, together with the clear independence of L from H1, suggests that we are dealing
with an overall effect of declination on the realisation of the second accent as a whole,
not an effect specific to the transition between two independently scaled H* peaks.
We return to these points in the discussion (sec. 3.3).
Temporal data
27
The durations (in ms) between H1 and L, as well as L and H2 are represented in
Figure 7. We have not included the duration between H1 and H2, as these can be
derived by adding the two temporal intervals reported.
XXXXXXXXXXXXXXX FIGURE 7 ABOUT HERE XXXXXXXXXXXXX
Two 1 x 4 ANOVAs (one for each speaker) revealed that the interval (in ms) between
H1 and H2 varies significantly as a function of the number of intervening syllables, as
would be expected: EF F(3,68) = 47.24; p < 0.00001; and SF F(3,70) = 47.48; p <
0.00001.
Less predictably, the interval in ms between H1 and L also varies significantly as a
function of the number of intervening syllables, EF: F(3,68) = 67.87; p < 0.00001;
SF: F(3,70) = 50.19; p < 0.00001, but not the interval between L and H2, EF:
F(3,68) < 1; SF: F(3,70) = 1.70, p = 0.18. This indicates that the L is located at a
relatively constant distance from the second peak, and is consistent with the finding
just reported above that the F0 levels of L and H2 covary.
Control analyses for one-syllable condition
As described under Materials, we included a control condition within the set of items
with one interpeak syllable. For this we compared items with ambiguous consonant
and late word boundary (e.g. Norman Elson) to the items used in the main dataset for
this experiment, namely those with ambiguous syllable and early word boundary (e.g.
Al Maloney). We compared the durational measures H1 to H2, H1 to L and L to H2,
which were as shown in Table I. For both the F0 data and the duration data we
performed t-tests, establishing the effect of the test name set on each measure for each
speaker. For the F0 measures (both F0 level and F0 change) there was no significant
effect of name set at all: for all analyses, t(20) < 1.61, all p > 0.12. The durational data
yielded one significant effect, namely the H1-H2 interval in ms for speaker EF, which
was longer in the Al Maloney set than in the Norman Elson set, t(14) = -2.31, p =
0.036. Overall, the segmental structure of the stimuli does not appear to form a
confounding factor in this experiment.
28
XXXXXXXXX TABLE I ABOUT HERE XXXXXXXXXXXXXXX
3.3. Discussion
The results of Experiment 3 suggest that the difference in the scaling of the F0
minimum in May Meyer and Gwendolyn Delaney is primarily a difference between
cases involving stress clash (e.g. May Meyer) and cases where there are unstressed
syllables between the accented syllables (e.g. any of Al Maloney, Norman Elson,
Maria Borrelli, Gwendolyn Delaney). For names with one, two, and three unstressed
syllables, we find no significant difference in the level of the F0 minimum: apart
from a small effect of overall declination which also affects the second accent peak,
this is the same for any given speaker. Superficially, this casts doubt on
Pierrehumbert’s proposal that the F0 minimum is lower as a function of the number of
syllables between the peaks, but the case is not clear-cut: as noted under Experiment
1, it is difficult to test her quantitative model directly against our data, and moreover it
is certainly true that the non-significant downward F0 trend for both speakers is
consistent with the idea of a sagging transition.
However, it is rather more of a problem for Pierrehumbert that there is a close relation
between the scaling of the F0 minimum and the scaling of second accent peak, and
that there is no effect of number of interpeak syllables on the duration of the rise from
the F0 minimum to the second accent peak. In different ways, these findings are hard
to square with either the model in Pierrehumbert 1981 or with the idea of the
“ballistic” rise proposed by Anderson et al. 1984. However, they are clearly
consistent with the idea that there is an actual L target at the beginning of the second
accent – the idea that Pierrehumbert was forced by theory-internal considerations to
reject in favour of the sagging-transition analysis.. Taking the F0 scaling data from
Experiment 3 together with the alignment evidence from Experiments 1 and 2,
therefore, we argue that the F0 minimum in the cases we have been examining
reflects a phonologically specified low tonal target. Like other clear tonal targets that
have been investigated in the phonetic literature based on Bruce 1977 and
Pierrehumbert 1980, the F0 minimum between two high pitch accents in English is
scaled and aligned in a consistent and predictable way.
29
4. General discussion
The experimental evidence presented in this paper points to the conclusion that the F0
minimum between two high accents in English corresponds to a phonologically
specified L tone. This finding makes it clear that the dissatisfaction expressed by
Pierrehumbert in her original presentation of the “sagging transition” analysis was
well-founded. However, it does little to remove the original theoretical obstacles to
the desired analysis in which the valley is treated as the reflex of a L tone. It seems
clear that the overall Pierrehumbert system will require some revision if it is to
accommodate the findings presented here.
The simplest and least disruptive revision is to do away with the distinction between
the two analyses of rising accents, and to treat both H* and L+H* as instances of a
single accent category that we might write as (L+H)*. This has the desirable
theoretical consequences that (a) transitions can be regarded as uniformly linear,
because the “sagging transition” would no longer be needed, and (b) turning points in
F0 contours can be consistently seen as reflexes of phonological tones (cf. Ladd 2000
for more discussion of this point). For purposes of this paper, no special significance
should be attached to the notation “(L+H)*”, although some writers (e.g. Arvaniti,
Ladd and Mennen 2000, Hualde 2000) have discussed theoretical reasons for
introducing such a notation for the description of certain accent types. We use this
notation to mean simply “pitch accent rising across the accented syllable and
involving clearly distinct L and H targets”. Our main reason for avoiding the notation
L+H* for this meaning is purely expository: in the following discussion we wish to
distinguish clearly between our analysis of rising accents and Pierrehumbert’s, and it
is therefore important to reserve the L+H* notation for her original usage.
Our proposed revision of the Pierrehumbert analysis has the further advantage of
bringing the description of English intonation into line with recent work on various
other European languages5. For example, D’Imperio (1999) has argued against a
“sagging transition” analysis of two-peak contours in Neapolitan Italian on the basis
of experimental data similar to the data we have presented here. D’Imperio showed a
clear linkage between the F0 minimum and the second F0 peak in sequences of two
accent peaks separated by varying numbers of intervening syllables, and, by exactly
30
the logic we have applied here, she argued that the sagging transition analysis is
empirically inappropriate. Similar considerations have motivated researchers on
Spanish (e.g. Hualde 2000, Face 2001) to analyse rising accents as involving both a L
and a H tone. One could, of course, argue that the analysis of Italian or Spanish is
irrelevant to the description of English, and that if English has a distinction between
two types of rising accents then the sagging transition analysis is necessary for
English. However, as noted by Ladd (1996: 143-147) in connection with the analysis
of calling contours in the European languages, there is a strong argument for applying
the basic autosegmental approach in the same way when one is describing similar
contours with similar functions in related languages. That is, if evidence of a certain
kind can be used to reject the “sagging transition” analysis in Italian or Spanish, the
same kind of evidence should apply equally to comparable contours in English.
A further related consequence of analysing rising accents uniformly as (L+H)* is that
it leaves the H* accent category free for the phonetically transparent description of
cases in which there is no rise to the F0 maximum of the second accent. Such cases
include the “flat hat” contours mentioned in footnote 4, which can be analysed as a
sequence of (L+H)* ... H*, with a linear transition between the accents. This
sequence, with a H* in second position, is thus clearly distinct from the contours we
have considered in this paper, which are sequences of (L+H)* ... (L+H)*. Though flat
hat contours are not especially common in English, they are extensively used in many
other Western European languages, and in all cases are clearly distinct from contours
that have a F0 dip between two accent peaks. Once again we believe that it makes
sense to apply the basic autosegmental approach in a consistent way to the analysis of
similar contours with similar functions in related languages.
In the original Pierrehumbert analysis of English (1980), the flat hat was analysed as a
sequence of H*+H … H*. For theoretical reasons, however, the H*+H accent was
dropped from the Pierrehumbert accent inventory a few years later, and in Beckman
and Pierrehumbert (1986) the flat hat is reanalysed as H* ... H* or L+H* ... H*, i.e. as
tonally identical to the contours we have been considering in this paper. Beckman
and Pierrehumbert claim that there is a sagging transition in the flat hat cases as well,
but that it is produced with an “elevated and compressed” pitch range, so that the sag
is not very noticeable. However, Ladd 1996 (chapter 7, esp. pp. 273-276) discusses a
31
variety of reasons why this analysis is theoretically and empirically problematical. If
we accept the revised analysis of rising accents proposed in this paper, then this issue,
like the theoretical difficulties with the sagging transition, simply vanishes, and the
flat hat comes out with the same tonal description in all the European languages that
use it.
While we feel that the foregoing arguments provide a compelling case in favour of
treating all rising accents as involving both a L and a H tonal target, we may still wish
to consider whether, in English, there is a distinction between two different types of
rise. This, after all, is the reason the whole controversy has arisen: Pierrehumbert,
like Halliday before her, drew a clear distinction between one type of rising accent in
which the rise is fundamental (L+H*, or Halliday's Tone 5) and another type in which
the rise is somehow incidental (H*, or Halliday's Tone 1). For some, the demonstrated
inconsistency in the way ToBI transcribers apply this distinction might justify
eliminating it, but for others it will seem important to respect Pierrehumbert’s and
Halliday’s descriptive intuition that there is some such distinction, even though we
may reinterpret it phonologically.
The most likely reinterpretation is that the difference is one of pitch excursion: all
rising accents are to be regarded as (L+H)*, but the Pierrehumbert L+H* (Tone 5)
cases span a wider F0 interval than the Pierrehumbert H* (Tone 1). The pitch range
difference correlates with the perceived degree of emphasis in some way, with the
original L+H* cases being more emphatic. This solution acknowledges that
Pierrehumbert’s original distinction was motivated by meaningful phonetic
differences, but treats those differences as a matter of gradient variation between two
ends of a continuum. This analysis would explain the ability of ToBI transcribers to
agree some of the time – i.e. on cases that are near one end or the other of the
continuum of pitch excursion and degree of emphasis – but also the substantial extent
of disagreement, which would presumably be greatest on cases in the middle of the
continuum. Given that we need to acknowledge the meaningful gradient variability of
pitch range in any description of intonation anyway, this approach has much to
recommend it.
32
We believe it may also be useful to investigate the alignment of the L and the H with
the accented syllable. Conceivably there is meaningful gradient variation here as
well; specifically, it is possible that the Pierrehumbert L+H* (Tone 5) has slightly
later alignment of the L, which would auditorily enhance the amount of F0 rise on the
accented vowel. Indeed, there might be two semi-independent gradient variables at
work, pitch excursion and alignment, which would account even better for (a) the
descriptive intuition that there are two categories of rising accent and (b) the nature
and extent of inter-transcriber disagreement. For example, suppose canonical
Pierrehumbert L+H* has both late L and wide pitch excursion, while canonical
Pierrehumbert H* has early L and narrow pitch excursion. Suppose also that
alignment and pitch range can vary somewhat independently. This will obviously
create a range of phonetic tokens that may be hard to classify consistently into one of
two types. At the same time, there will be wide agreement on cases in which both the
alignment and the pitch range cues are at corresponding extremes of their respective
continua6.
5. Conclusion
On the basis of the data presented here, we believe we have evidence for collapsing
the distinction between Pierrehumbert’s original L+H* and most cases of her original
H* into a single category (L+H)*. This proposal is consistent with the demonstrated
lack of inter-transcriber consistency in making the distinction between L+H* and H*.
The notation H* should be reserved for high accents that do not involve a local F0
rise. For the most part, this represents a relatively minor revision of Pierrehumbert’s
descriptive framework, yet it has important theoretical benefits: it eliminates the
troublesome “sagging transition”, encourages the uniform phonological treatment of
F0 turning points, allows for consistent cross-language interpretation of
autosegmental notations of intonation, and resolves the theoretical problems
associated with “flat hat” contours. We do not rule out the possibility that other
phonetic differences could provide a basis for Pierrehumbert’s original distinction
between H* and L+H*; as we have suggested, this distinction could be based on
differences in pitch range and/or on differences in the alignment of the beginning or
end of the rise. However, this is a substantial empirical question that we leave as a
matter for future research.
33
Footnotes:
1). An anonymous referee describes these issues as “theory internal”. We disagree.
The proper treatment of rises to accentual peaks in English intonation has been an
important descriptive problem since the heyday of the “British school” in the middle
part of the twentieth century. Some investigators clearly distinguished “high-fall”
from “rise-fall” accents and others did not (cf. the comparative table in Ladd 1980:
32). More specifically, Halliday’s distinction (1967) between “Tone 1” and “Tone 5”
appears to be the same distinction as Pierrehumbert’s distinction between H* and
L+H*, precisely the point at issue here. The descriptive problem is thus of general
interest (and relevance to e.g. speech technology), regardless of the notational guise in
which it is expressed. In this connection it should also be noted that, according to
Pierrehumbert, L+H* contrasts minimally not only with H* but also with L*+H, a
third type of accent in which the accented syllable is mostly low in pitch and the rise
occurs between the accented syllable and the following syllable. L*+H accents
(which may correspond to Halliday’s “Tone 3”) will not be considered further here.
2). Strictly speaking there is no published evaluation of inter-transcriber agreement on
the H* vs. L+H* distinction, because Pitrelli et al. actually combine the two
categories in their analysis. They give no justification for this step, although it makes
good sense in the context of their practical goals: by combining these two very
frequent categories, they are able to get a better sense of the approximate level of
inter-transcriber agreement for the system as a whole. Had they not done this, the
inter-transcriber disagreement on the H* / L+H* distinction would probably have
overwhelmed the greater level of agreement on other distinctions in the system.
However, it should be emphasised that this decision is motivated by expedience, not
by anything in the theoretical basis of the ToBI system.
3) A preliminary report of experiment 1 was presented in Ladd and Schepman 1999.
4) “Flat hat” is the term given by ’t Hart and his colleagues (e.g. ’t Hart and Collier
1975) to a contour in which the F0 rises at the first accented syllable and stays
relatively high, forming a plateau that ends when the F0 falls at the second accented
syllable. These contours are discussed further in section 4.
34
5) We are grateful to Sónia Frota for drawing our attention to this implication of our
work.
6) Support for the speculations in the preceding two paragraphs comes from
preliminary results obtained by Sasha Calhoun in a student phonetics project in
Edinburgh after this paper had been accepted for publication. Calhoun measured the
F0 level and alignment of the valley and peak associated with approximately 300
rising accents from a single speaker in the BU Radio News Corpus (Ostendorf et al.
1995). The accents had been labelled either L+H* or H* in the “official” ToBI
transcription of the corpus. She found no significant difference between the L+H*
and H* accents in either the mean alignment or mean F0 level of the peak, though the
alignment of the L+H* accent peaks was much more variable. She also found no
difference in the mean alignment of the F0 valley (the beginning of the rise), though
again the L+H* accents showed much more variation. The only clear difference
between the two types was in the mean F0 level of the beginning of the rise: the
beginning of the L+H* accents was considerably lower, such that the mean F0 rise for
the L+H* accents was approximately 7.5 semitones while that for the H* accents was
only 5 semitones. Clearly these preliminary findings need to be followed up.

35
Acknowledgements:
We are most grateful to our ToBI raters, Gayle Ayers Elam, Mary Beckman, Laura
Dilley Redi and Jennifer Venditti, for their opinions in the accent test that formed part
of Experiment 1. We also thank John Pitrelli for unpublished information on the
ToBI evaluation study reported in Pitrelli et al. 1994. We gratefully acknowledge the
financial support of the UK Economic and Social Research Council under grant no.
R000-23-7447 to Edinburgh University.
36
References:
Anderson, M., Pierrehumbert, J, and Liberman, M. (1984). Synthesis by rule of
English intonation contours. Proceedings of IEEE Conference on Acoustics, Speech,
and Signal Processing, pp. 2.8.2-2.8.4.
Arvaniti, A. Ladd, D.R, and Mennen, I. (1998). Stability of Tonal Alignment: the
case of Greek prenuclear accents. Journal of Phonetics, 26: 3-25.
Arvaniti, A., Ladd, D. R. , and Mennen, I. (2000). What is a starred tone: Evidence
from Greek. In M. Broe and J. Pierrehumbert (eds.), Papers in Laboratory
Phonology V, Cambridge: Cambridge University Press, pp. 119-131.
Beckman, M. E., and Pierrehumbert, J. B. (1986). Intonational structure in English
and Japanese. Phonology Yearbook 3: 255-309.
Boersma, P. (1992). Praat: A system for doing phonetics by computer. University of
Amsterdam.
Bruce, G. (1977). Swedish word accents in sentence perspective. Lund: Gleerup
Cohen, J.D., MacWhinney, B., Flatt, M., and Provost, J. (1993). PsyScope: A new
graphic interactive environment for designing psychology experiments. Behavioral
Research Methods, Instruments, and Computers, 25(2), 257-271.
D’Imperio, M. (1999). Tonal structure and pitch targets in Italian focus constitutents.
Proceedings of ICPhS XIV, San Francisco, vol. 3, pp.1757-1760.
Face, T. L. (2001). Contrastive focus and local intonation patterns in Spanish.
Probus 13:
Halliday, M. A. K. (1967). Intonation and grammar in British English. The Hague:
Mouton.
37
Hualde, J. I. (2000). Intonation in Spanish and the other Ibero-Romance languages:
overview and status quaestionis.
Ladd, D. R. (1996) Intonational Phonology, Cambridge: Cambridge University Press.
Ladd, D. R. (2000) Bruce, Pierrehumbert, and the elements of intonational phonology.
In M. Horne (ed.), Prosody: Theory and Experiment (Studies presented to Gösta
Bruce), Kluwer Academic Publishers, Dordrecht, pp. 37-50.
Ladd, D. R., Faulkner, D., Faulkner, H. and Schepman, A. (1999). Constant
“segmental anchoring” of F0 movements under changes in speech rate. Journal of the
Acoustical Society of America , 106, 1543-1554.
Ladd, D. R., Mennen, I. and Schepman, A. (2000). Phonological conditioning of peak
alignment in rising pitch accents in Dutch. Journal of the Acoustical Society of
America, 107, 2685-2696 .
Ladd, D. R. and Schepman, A. (1999). Segmental anchoring of tones as a word-
boundary correlate in English. . Proceedings of ICPhS XIV, San Francisco, vol. 3, pp.
1869-1872.
Lehiste, I. (1960). An Acoustic-Phonetics Study of Internal Open Juncture.
Supplement to vol. 5 of Phonetica.
Ostendorf, M., Price, P. and Shattuck-Hufnagel, S. (1995). The Boston University
Radio News Corpus. Technical Report ECS-95-001, Electrical, Computer and
Systems Engineering Department, Boston University. Also available online from
http://www.ldc.upenn.edu/Catalog/CatalogList/LDC96S36/bur_crps.ps
Pitrelli, J., Beckman, M., and Hirschberg, J. (1994). Evaluation of Prosodic
Transcription Labeling Reliability in the {ToBI} Framework, Proceedings of the
Third Intl. Conference on Spoken Language Processing (ICSLP), vol. 2, 123-126.
38
Pierrehumbert, J. (1980). The phonology and phonetics of English intonation.
Doctoral Dissertation. Distribution: Bloomington, IN: Indiana University Linguistics
Club.
Pierrehumbert, J. (1981). Synthesizing Intonation. Journal of the Acoustical Society
of America, 70, 985-995.
Silverman, K., Beckman, M., Pitrelli, J., Ostendorf, M., Wightman, C., Price, P.,
Pierrehumbert, J. and Hirschberg, J., (1992), ToBI: A standard for labeling English
prosody, Proceedings of the 1992 International Conference on Spoken Language
Processing, 867-870.
’t Hart, J. and Collier, R. (1975). Integrating Different Levels of Intonation
Analysis. Journal of Phonetics, 3: 235-255.
ToBI website: http://ling.ohio-state.edu/~tobi
Turk, A.E, and White, L.S. (1999) Structural influences on accentual lengthening in
English. Journal of Phonetics 27.171-206.
Westbury, J. R., Severson, E. J., and Lindstrom, M. J. (2000). Kinematic event
patterns in speech: special problems. Language and Speech 43: 403-428.
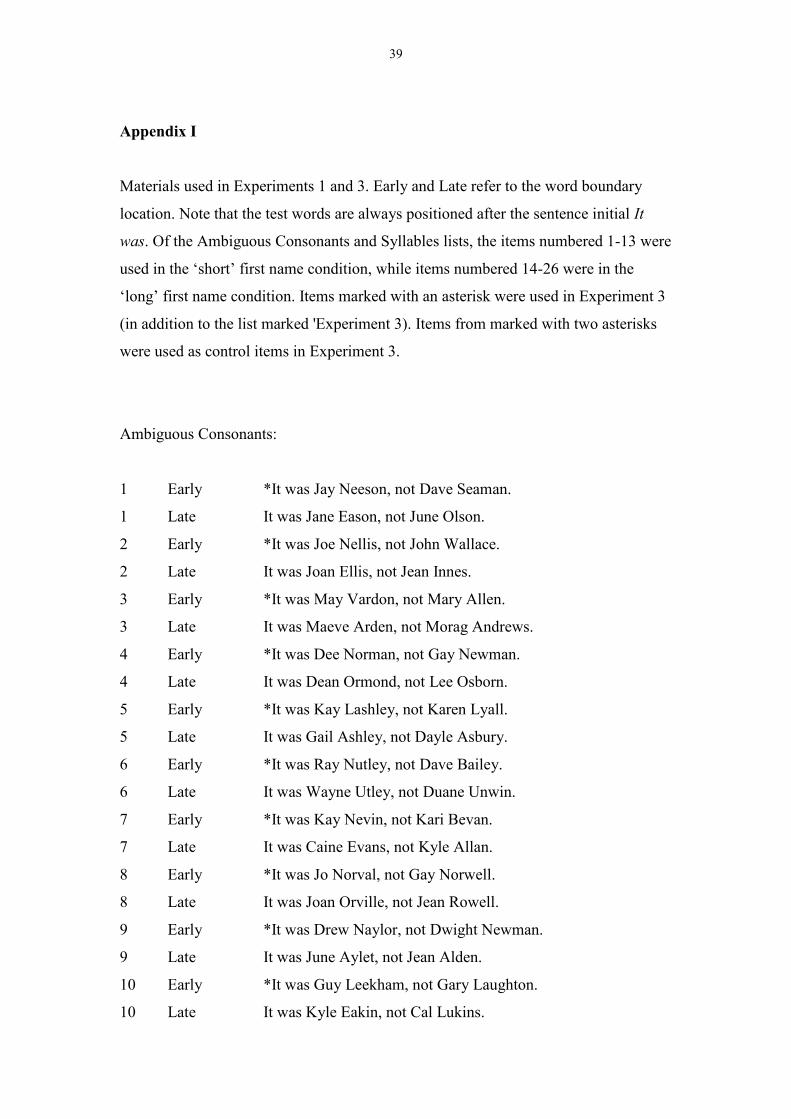
39
Appendix I
Materials used in Experiments 1 and 3. Early and Late refer to the word boundary
location. Note that the test words are always positioned after the sentence initial It
was. Of the Ambiguous Consonants and Syllables lists, the items numbered 1-13 were
used in the ‘short’ first name condition, while items numbered 14-26 were in the
‘long’ first name condition. Items marked with an asterisk were used in Experiment 3
(in addition to the list marked 'Experiment 3). Items from marked with two asterisks
were used as control items in Experiment 3.
Ambiguous Consonants:
1 Early *It was Jay Neeson, not Dave Seaman.
1 Late It was Jane Eason, not June Olson.
2 Early *It was Joe Nellis, not John Wallace.
2 Late It was Joan Ellis, not Jean Innes.
3 Early *It was May Vardon, not Mary Allen.
3 Late It was Maeve Arden, not Morag Andrews.
4 Early *It was Dee Norman, not Gay Newman.
4 Late It was Dean Ormond, not Lee Osborn.
5 Early *It was Kay Lashley, not Karen Lyall.
5 Late It was Gail Ashley, not Dayle Asbury.
6 Early *It was Ray Nutley, not Dave Bailey.
6 Late It was Wayne Utley, not Duane Unwin.
7 Early *It was Kay Nevin, not Kari Bevan.
7 Late It was Caine Evans, not Kyle Allan.
8 Early *It was Jo Norval, not Gay Norwell.
8 Late It was Joan Orville, not Jean Rowell.
9 Early *It was Drew Naylor, not Dwight Newman.
9 Late It was June Aylet, not Jean Alden.
10 Early *It was Guy Leekham, not Gary Laughton.
10 Late It was Kyle Eakin, not Cal Lukins.
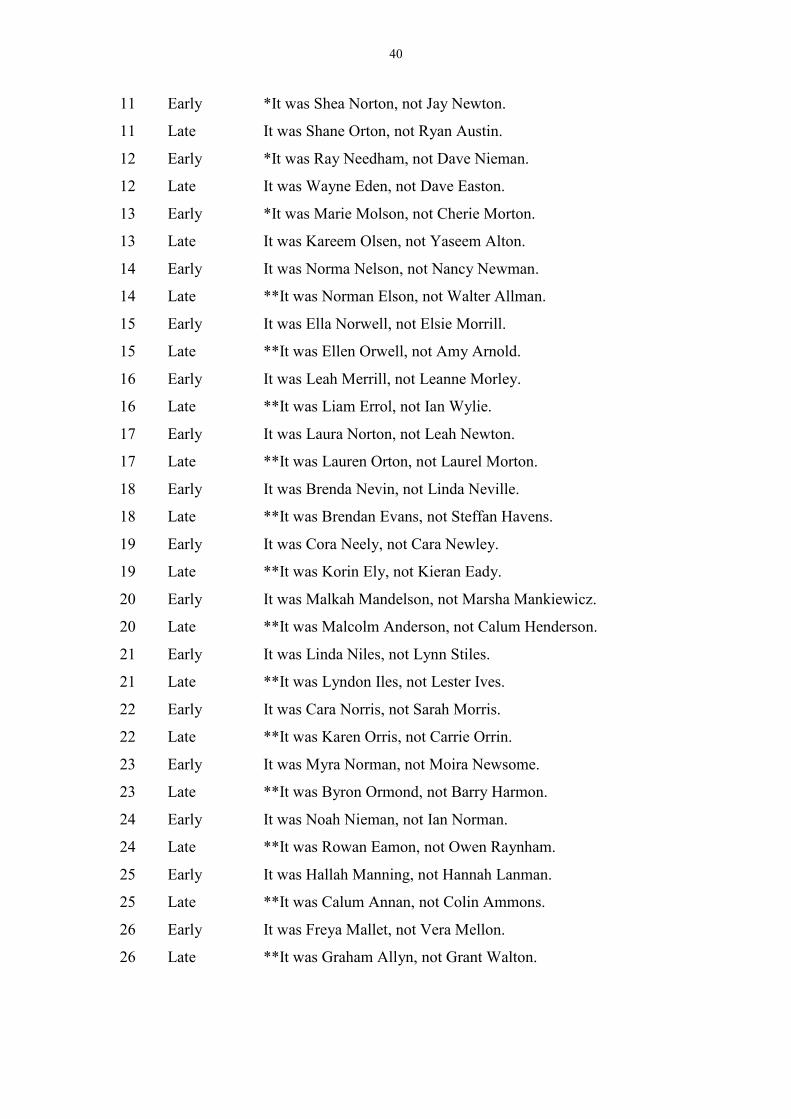
40
11 Early *It was Shea Norton, not Jay Newton.
11 Late It was Shane Orton, not Ryan Austin.
12 Early *It was Ray Needham, not Dave Nieman.
12 Late It was Wayne Eden, not Dave Easton.
13 Early *It was Marie Molson, not Cherie Morton.
13 Late It was Kareem Olsen, not Yaseem Alton.
14 Early It was Norma Nelson, not Nancy Newman.
14 Late **It was Norman Elson, not Walter Allman.
15 Early It was Ella Norwell, not Elsie Morrill.
15 Late **It was Ellen Orwell, not Amy Arnold.
16 Early It was Leah Merrill, not Leanne Morley.
16 Late **It was Liam Errol, not Ian Wylie.
17 Early It was Laura Norton, not Leah Newton.
17 Late **It was Lauren Orton, not Laurel Morton.
18 Early It was Brenda Nevin, not Linda Neville.
18 Late **It was Brendan Evans, not Steffan Havens.
19 Early It was Cora Neely, not Cara Newley.
19 Late **It was Korin Ely, not Kieran Eady.
20 Early It was Malkah Mandelson, not Marsha Mankiewicz.
20 Late **It was Malcolm Anderson, not Calum Henderson.
21 Early It was Linda Niles, not Lynn Stiles.
21 Late **It was Lyndon Iles, not Lester Ives.
22 Early It was Cara Norris, not Sarah Morris.
22 Late **It was Karen Orris, not Carrie Orrin.
23 Early It was Myra Norman, not Moira Newsome.
23 Late **It was Byron Ormond, not Barry Harmon.
24 Early It was Noah Nieman, not Ian Norman.
24 Late **It was Rowan Eamon, not Owen Raynham.
25 Early It was Hallah Manning, not Hannah Lanman.
25 Late **It was Calum Annan, not Colin Ammons.
26 Early It was Freya Mallet, not Vera Mellon.
26 Late **It was Graham Allyn, not Grant Walton.
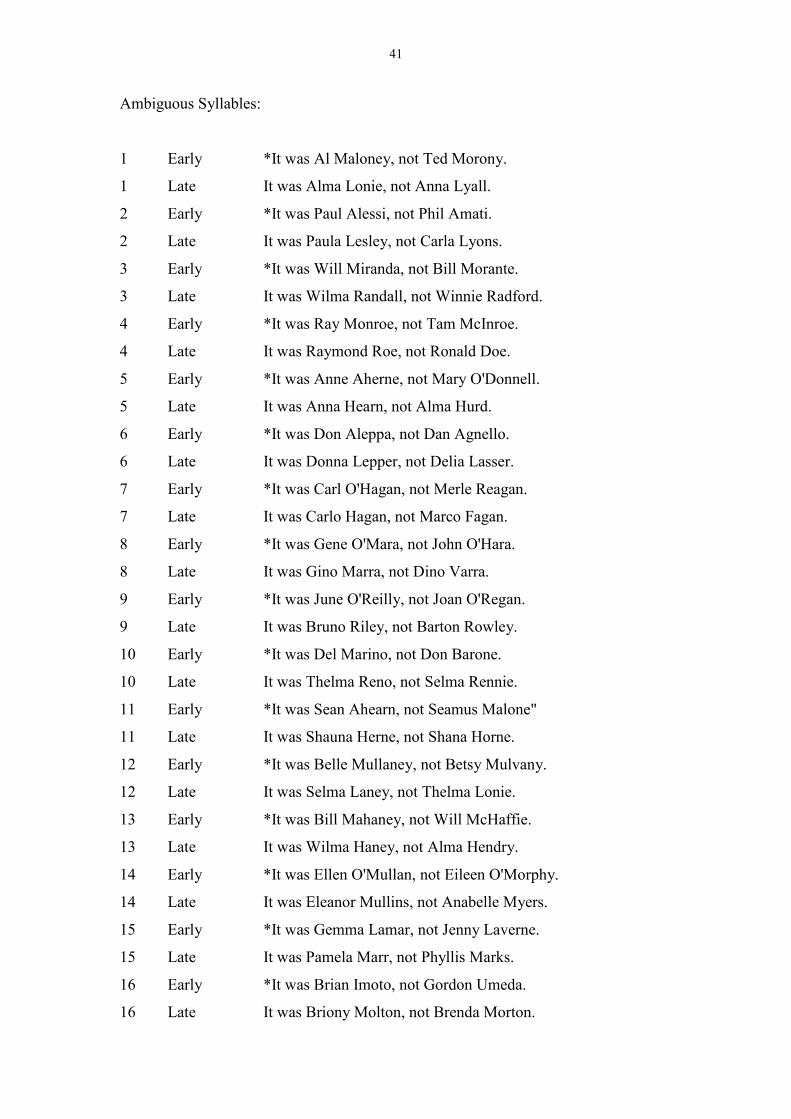
41
Ambiguous Syllables:
1 Early *It was Al Maloney, not Ted Morony.
1 Late It was Alma Lonie, not Anna Lyall.
2 Early *It was Paul Alessi, not Phil Amati.
2 Late It was Paula Lesley, not Carla Lyons.
3 Early *It was Will Miranda, not Bill Morante.
3 Late It was Wilma Randall, not Winnie Radford.
4 Early *It was Ray Monroe, not Tam McInroe.
4 Late It was Raymond Roe, not Ronald Doe.
5 Early *It was Anne Aherne, not Mary O'Donnell.
5 Late It was Anna Hearn, not Alma Hurd.
6 Early *It was Don Aleppa, not Dan Agnello.
6 Late It was Donna Lepper, not Delia Lasser.
7 Early *It was Carl O'Hagan, not Merle Reagan.
7 Late It was Carlo Hagan, not Marco Fagan.
8 Early *It was Gene O'Mara, not John O'Hara.
8 Late It was Gino Marra, not Dino Varra.
9 Early *It was June O'Reilly, not Joan O'Regan.
9 Late It was Bruno Riley, not Barton Rowley.
10 Early *It was Del Marino, not Don Barone.
10 Late It was Thelma Reno, not Selma Rennie.
11 Early *It was Sean Ahearn, not Seamus Malone"
11 Late It was Shauna Herne, not Shana Horne.
12 Early *It was Belle Mullaney, not Betsy Mulvany.
12 Late It was Selma Laney, not Thelma Lonie.
13 Early *It was Bill Mahaney, not Will McHaffie.
13 Late It was Wilma Haney, not Alma Hendry.
14 Early *It was Ellen O'Mullan, not Eileen O'Morphy.
14 Late It was Eleanor Mullins, not Anabelle Myers.
15 Early *It was Gemma Lamar, not Jenny Laverne.
15 Late It was Pamela Marr, not Phyllis Marks.
16 Early *It was Brian Imoto, not Gordon Umeda.
16 Late It was Briony Molton, not Brenda Morton.
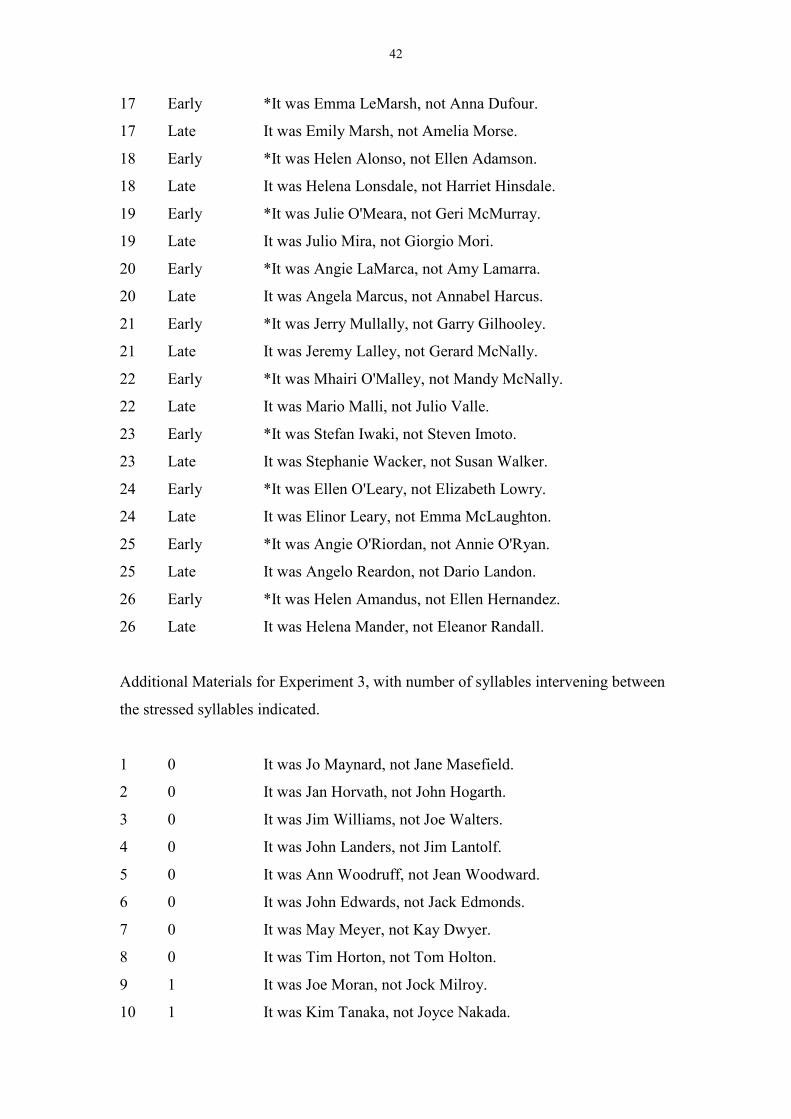
42
17 Early *It was Emma LeMarsh, not Anna Dufour.
17 Late It was Emily Marsh, not Amelia Morse.
18 Early *It was Helen Alonso, not Ellen Adamson.
18 Late It was Helena Lonsdale, not Harriet Hinsdale.
19 Early *It was Julie O'Meara, not Geri McMurray.
19 Late It was Julio Mira, not Giorgio Mori.
20 Early *It was Angie LaMarca, not Amy Lamarra.
20 Late It was Angela Marcus, not Annabel Harcus.
21 Early *It was Jerry Mullally, not Garry Gilhooley.
21 Late It was Jeremy Lalley, not Gerard McNally.
22 Early *It was Mhairi O'Malley, not Mandy McNally.
22 Late It was Mario Malli, not Julio Valle.
23 Early *It was Stefan Iwaki, not Steven Imoto.
23 Late It was Stephanie Wacker, not Susan Walker.
24 Early *It was Ellen O'Leary, not Elizabeth Lowry.
24 Late It was Elinor Leary, not Emma McLaughton.
25 Early *It was Angie O'Riordan, not Annie O'Ryan.
25 Late It was Angelo Reardon, not Dario Landon.
26 Early *It was Helen Amandus, not Ellen Hernandez.
26 Late It was Helena Mander, not Eleanor Randall.
Additional Materials for Experiment 3, with number of syllables intervening between
the stressed syllables indicated.
1 0 It was Jo Maynard, not Jane Masefield.
2 0 It was Jan Horvath, not John Hogarth.
3 0 It was Jim Williams, not Joe Walters.
4 0 It was John Landers, not Jim Lantolf.
5 0 It was Ann Woodruff, not Jean Woodward.
6 0 It was John Edwards, not Jack Edmonds.
7 0 It was May Meyer, not Kay Dwyer.
8 0 It was Tim Horton, not Tom Holton.
9 1 It was Joe Moran, not Jock Milroy.
10 1 It was Kim Tanaka, not Joyce Nakada.
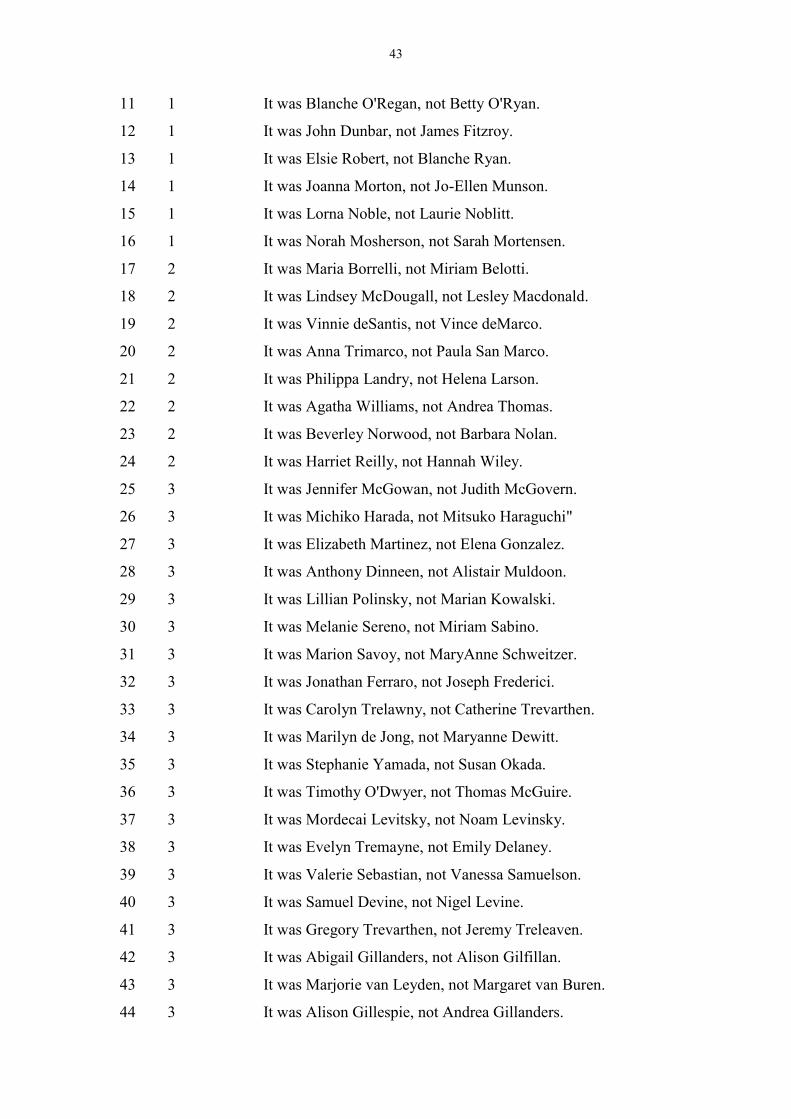
43
11 1 It was Blanche O'Regan, not Betty O'Ryan.
12 1 It was John Dunbar, not James Fitzroy.
13 1 It was Elsie Robert, not Blanche Ryan.
14 1 It was Joanna Morton, not Jo-Ellen Munson.
15 1 It was Lorna Noble, not Laurie Noblitt.
16 1 It was Norah Mosherson, not Sarah Mortensen.
17 2 It was Maria Borrelli, not Miriam Belotti.
18 2 It was Lindsey McDougall, not Lesley Macdonald.
19 2 It was Vinnie deSantis, not Vince deMarco.
20 2 It was Anna Trimarco, not Paula San Marco.
21 2 It was Philippa Landry, not Helena Larson.
22 2 It was Agatha Williams, not Andrea Thomas.
23 2 It was Beverley Norwood, not Barbara Nolan.
24 2 It was Harriet Reilly, not Hannah Wiley.
25 3 It was Jennifer McGowan, not Judith McGovern.
26 3 It was Michiko Harada, not Mitsuko Haraguchi"
27 3 It was Elizabeth Martinez, not Elena Gonzalez.
28 3 It was Anthony Dinneen, not Alistair Muldoon.
29 3 It was Lillian Polinsky, not Marian Kowalski.
30 3 It was Melanie Sereno, not Miriam Sabino.
31 3 It was Marion Savoy, not MaryAnne Schweitzer.
32 3 It was Jonathan Ferraro, not Joseph Frederici.
33 3 It was Carolyn Trelawny, not Catherine Trevarthen.
34 3 It was Marilyn de Jong, not Maryanne Dewitt.
35 3 It was Stephanie Yamada, not Susan Okada.
36 3 It was Timothy O'Dwyer, not Thomas McGuire.
37 3 It was Mordecai Levitsky, not Noam Levinsky.
38 3 It was Evelyn Tremayne, not Emily Delaney.
39 3 It was Valerie Sebastian, not Vanessa Samuelson.
40 3 It was Samuel Devine, not Nigel Levine.
41 3 It was Gregory Trevarthen, not Jeremy Treleaven.
42 3 It was Abigail Gillanders, not Alison Gilfillan.
43 3 It was Marjorie van Leyden, not Margaret van Buren.
44 3 It was Alison Gillespie, not Andrea Gillanders.
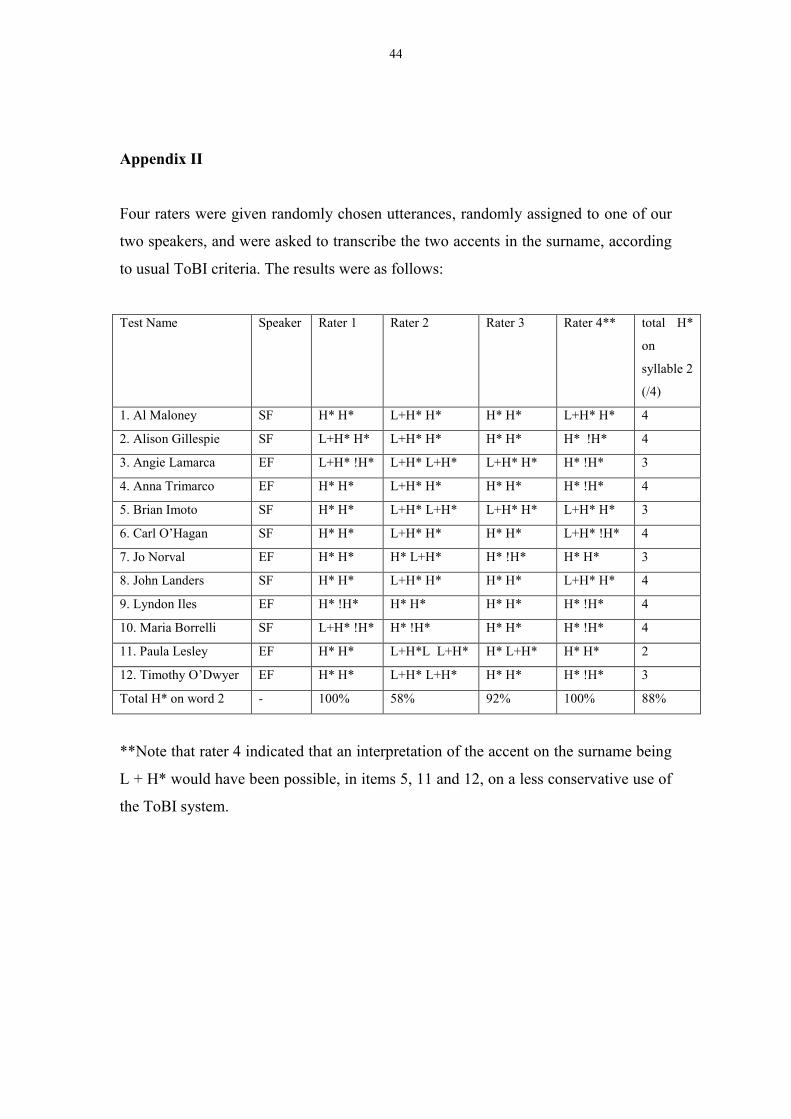
44
Appendix II
Four raters were given randomly chosen utterances, randomly assigned to one of our
two speakers, and were asked to transcribe the two accents in the surname, according
to usual ToBI criteria. The results were as follows:
Test Name Speaker Rater 1 Rater 2 Rater 3 Rater 4** total H*
on
syllable 2
(/4)
1. Al Maloney SF H* H* L+H* H* H* H* L+H* H* 4
2. Alison Gillespie SF L+H* H* L+H* H* H* H* H* !H* 4
3. Angie Lamarca EF L+H* !H* L+H* L+H* L+H* H* H* !H* 3
4. Anna Trimarco EF H* H* L+H* H* H* H* H* !H* 4
5. Brian Imoto SF H* H* L+H* L+H* L+H* H* L+H* H* 3
6. Carl O’Hagan SF H* H* L+H* H* H* H* L+H* !H* 4
7. Jo Norval EF H* H* H* L+H* H* !H* H* H* 3
8. John Landers SF H* H* L+H* H* H* H* L+H* H* 4
9. Lyndon Iles EF H* !H* H* H* H* H* H* !H* 4
10. Maria Borrelli SF L+H* !H* H* !H* H* H* H* !H* 4
11. Paula Lesley EF H* H* L+H*L L+H* H* L+H* H* H* 2
12. Timothy O’Dwyer EF H* H* L+H* L+H* H* H* H* !H* 3
Total H* on word 2 - 100% 58% 92% 100% 88%
**Note that rater 4 indicated that an interpretation of the accent on the surname being
L + H* would have been possible, in items 5, 11 and 12, on a less conservative use of
the ToBI system.
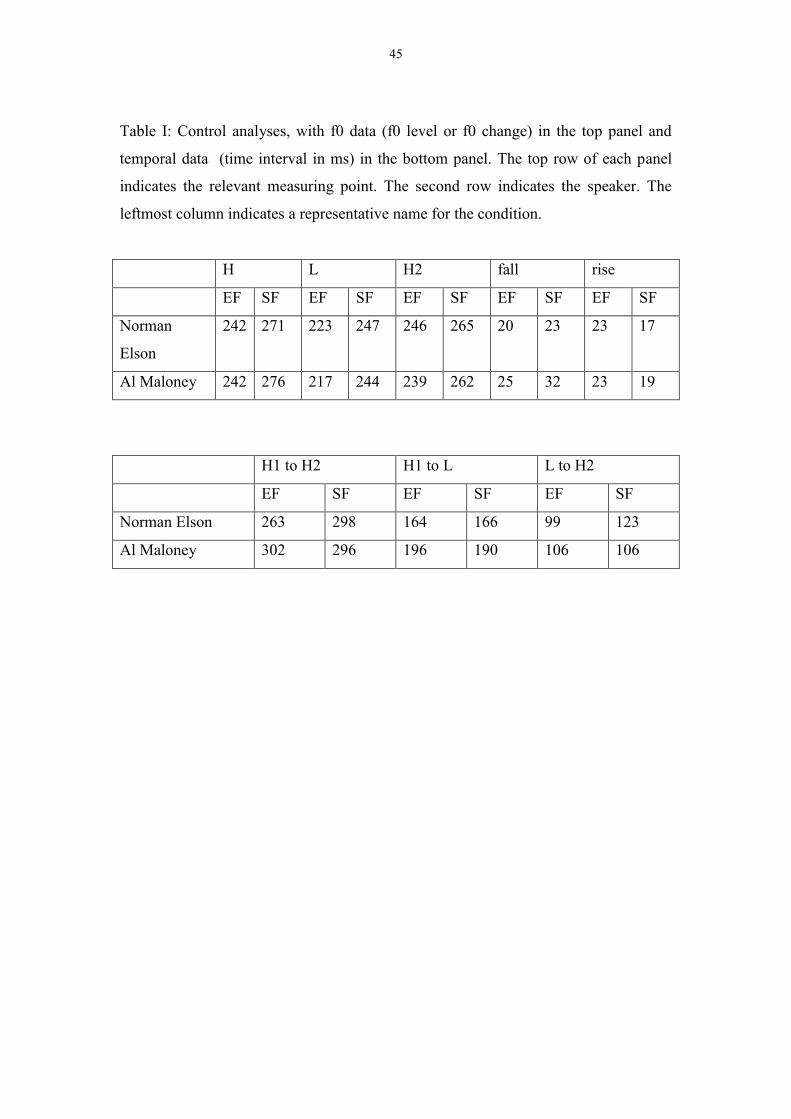
45
Table I: Control analyses, with f0 data (f0 level or f0 change) in the top panel and
temporal data (time interval in ms) in the bottom panel. The top row of each panel
indicates the relevant measuring point. The second row indicates the speaker. The
leftmost column indicates a representative name for the condition.
H L H2 fall rise
EF SF EF SF EF SF EF SF EF SF
Norman
Elson
242 271 223 247 246 265 20 23 23 17
Al Maloney 242 276 217 244 239 262 25 32 23 19
H1 to H2 H1 to L L to H2
EF SF EF SF EF SF
Norman Elson 263 298 164 166 99 123
Al Maloney 302 296 196 190 106 106
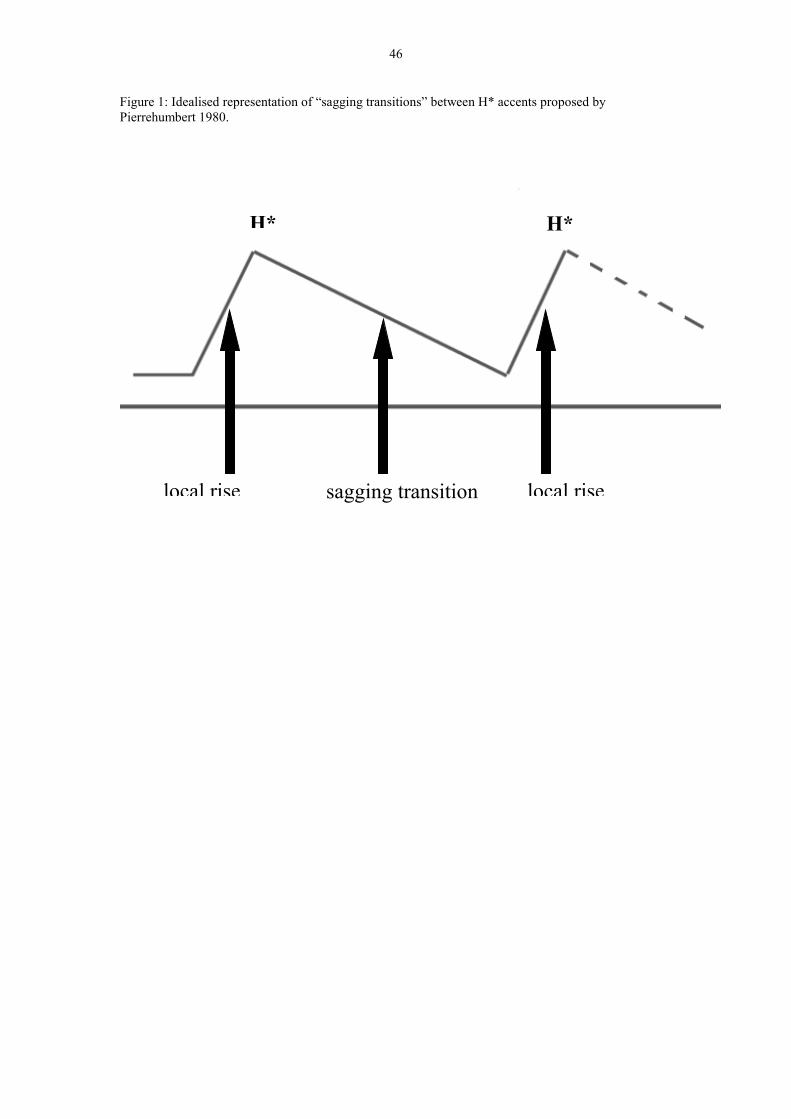
46
Figure 1: Idealised representation of “sagging transitions” between H* accents proposed by
Pierrehumbert 1980.
H* H*
local rise local rise sagging transition

47
Figure 2:
Wide-band spectrogram (top panel) and f0 track (bottom panel) for It was Ellen Orwell
spoken by EF. Vertical lines indicate where measurements were taken for experiments 1
and 3. H1 and H2 are local f0 peaks, L is a local f0 valley, and C1 and V1 represent,
respectively, the onset and offset of the 'ambiguous' consonant, which in this example is
/n/ (Ellen Orwell vs. Ella Norwell).
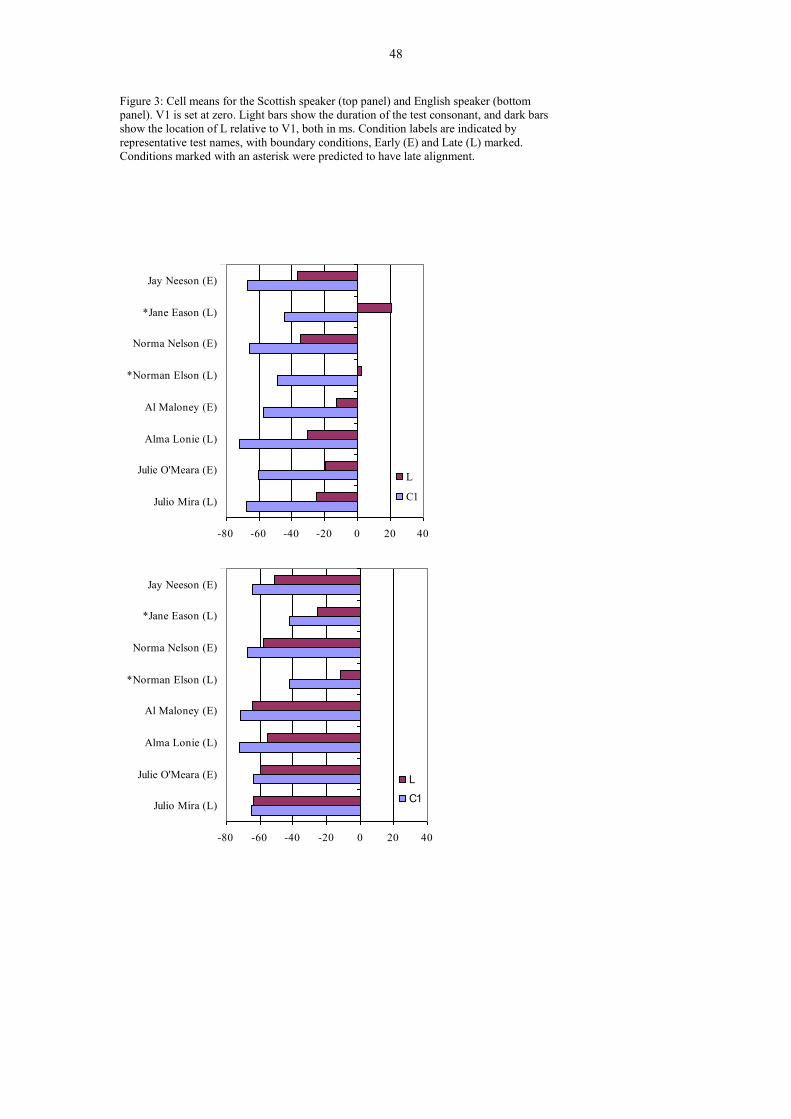
48
Figure 3: Cell means for the Scottish speaker (top panel) and English speaker (bottom
panel). V1 is set at zero. Light bars show the duration of the test consonant, and dark bars
show the location of L relative to V1, both in ms. Condition labels are indicated by
representative test names, with boundary conditions, Early (E) and Late (L) marked.
Conditions marked with an asterisk were predicted to have late alignment.
-80 -60 -40 -20 0 20 40
Julio Mira (L)
Julie O'Meara (E)
Alma Lonie (L)
Al Maloney (E)
Norman Elson (L)
Norma Nelson (E)
Jane Eason (L)
Jay Neeson (E)
L
C1
-80 -60 -40 -20 0 20 40
Julio Mira (L)
Julie O'Meara (E)
Alma Lonie (L)
Al Maloney (E)
Norman Elson (L)
Norma Nelson (E)
Jane Eason (L)
Jay Neeson (E)
L
C
1
-80 -60 -40 -20 0 20 40
Julio Mira (L)
Julie O'Meara (E)
Alma Lonie (L)
Al Maloney (E)
*Norman Elson (L)
Norma Nelson (E)
*Jane Eason (L)
Jay Neeson (E)
L
C1
-80 -60 -40 -20 0 20 40
Julio Mira (L)
Julie O'Meara (E)
Alma Lonie (L)
Al Maloney (E)
*Norman Elson (L)
Norma Nelson (E)
*Jane Eason (L)
Jay Neeson (E)
L
C1
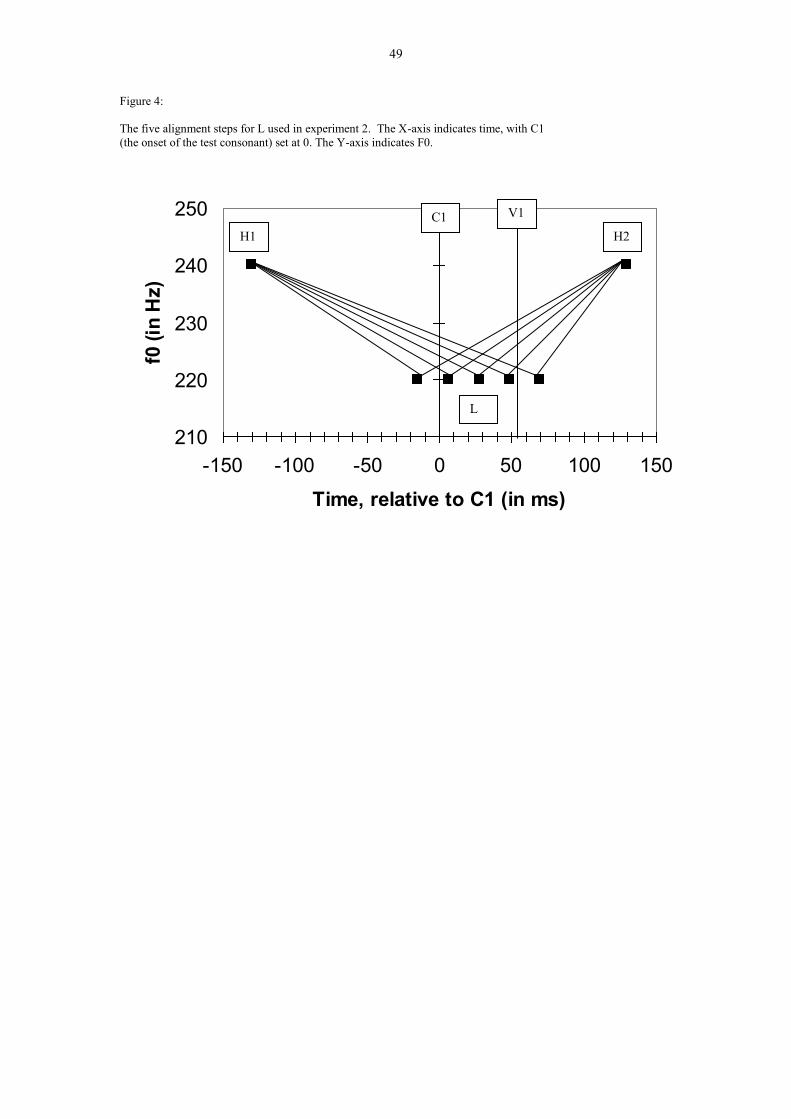
49
Figure 4:
The five alignment steps for L used in experiment 2. The X-axis indicates time, with C1
(the onset of the test consonant) set at 0. The Y-axis indicates F0.
210
220
230
240
250
-150 -100 -50 0 50 100 150
Time, relative to C1 (in ms)
f0 (
in H
z)
H1 H2
L
C1 V1
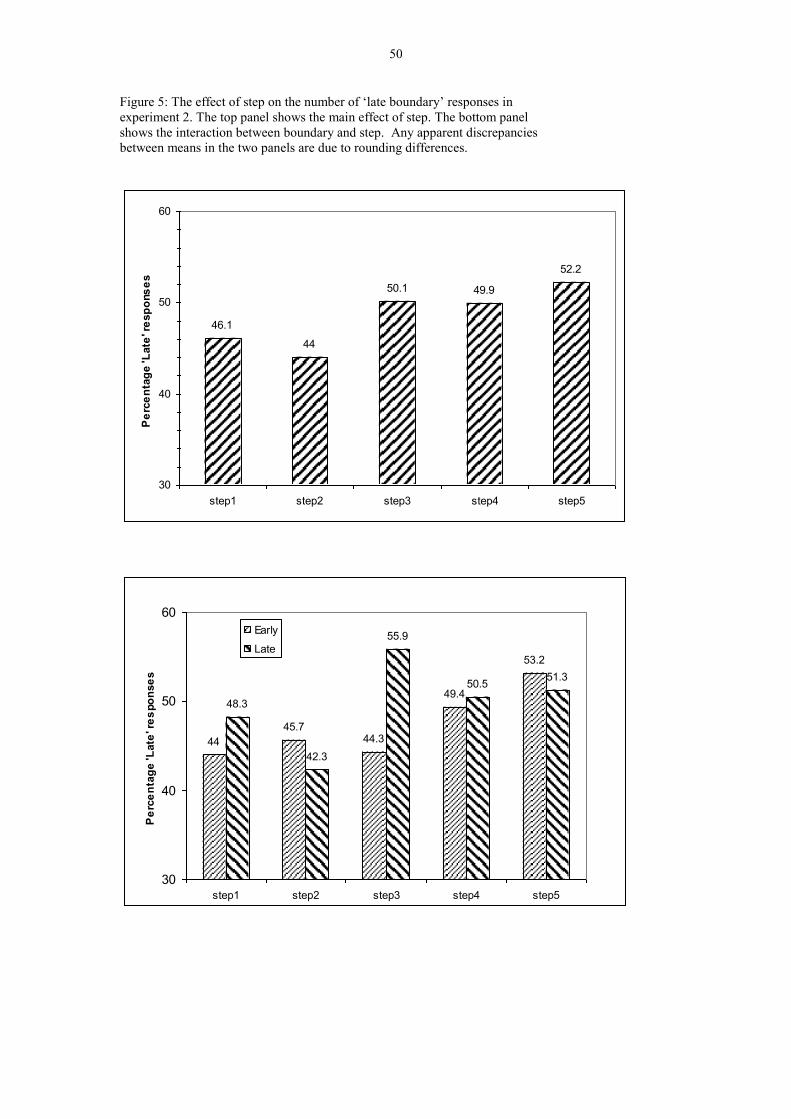
50
Figure 5: The effect of step on the number of ‘late boundary’ responses in
experiment 2. The top panel shows the main effect of step. The bottom panel
shows the interaction between boundary and step. Any apparent discrepancies
between means in the two panels are due to rounding differences.
46.1
44
50.1 49.9
52.2
30
40
50
60
step1 step2 step3 step4 step5
Pe
rce
nta
ge
'Late
' re
sp
ons
es
44
45.744.3
49.4
53.2
48.3
42.3
55.9
50.551.3
30
40
50
60
step1 step2 step3 step4 step5
Pe
rce
nta
ge
'Late
' re
spo
nse
s
Early
Late
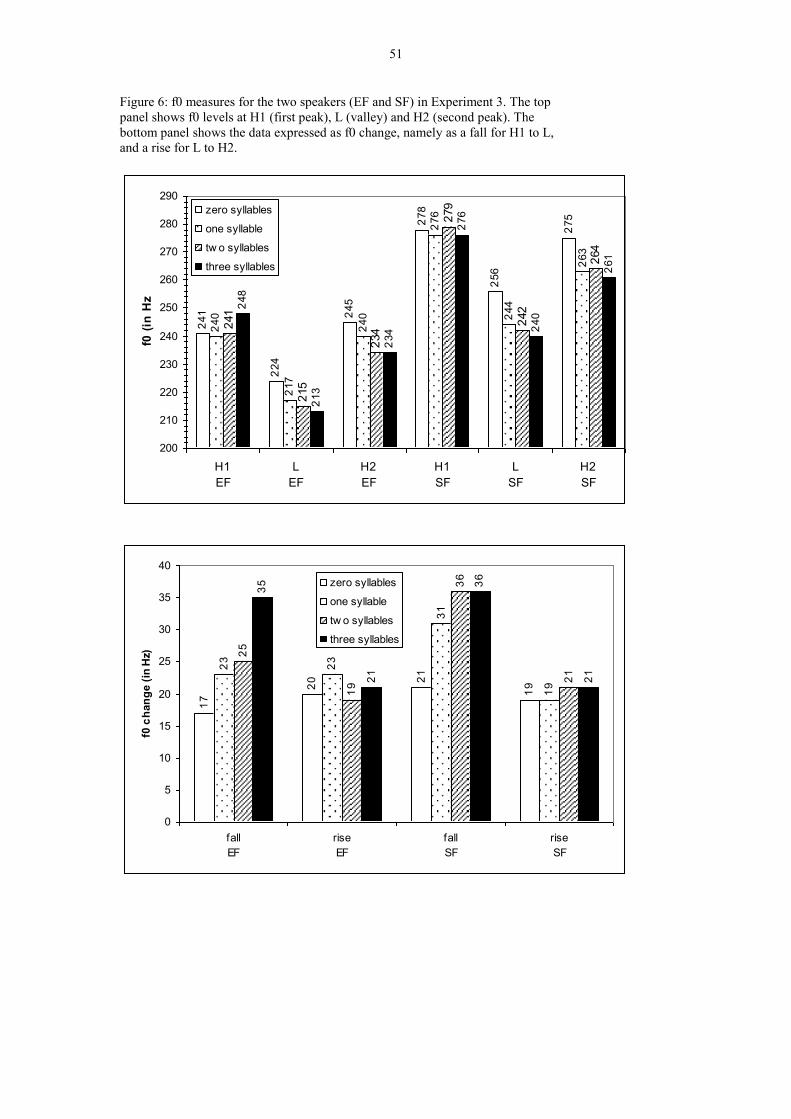
51
Figure 6: f0 measures for the two speakers (EF and SF) in Experiment 3. The top
panel shows f0 levels at H1 (first peak), L (valley) and H2 (second peak). The
bottom panel shows the data expressed as f0 change, namely as a fall for H1 to L,
and a rise for L to H2.
241
224
245
278
256
275
240
217
240
276
244
263
241
215
234
279
242
264
248
213
234
276
240
261
200
210
220
230
240
250
260
270
280
290
H1
EF
L
EF
H2
EF
H1
SF
L
SF
H2
SF
f0 (
in H
z)
zero syllables
one syllable
tw o syllables
three syllables
17
20 2
1
19
23
23
31
19
25
19
36
21
35
21
36
21
0
5
10
15
20
25
30
35
40
fall
EF
rise
EF
fall
SF
rise
SF
f0 c
han
ge (
in H
z)
zero syllables
one syllable
tw o syllables
three syllables
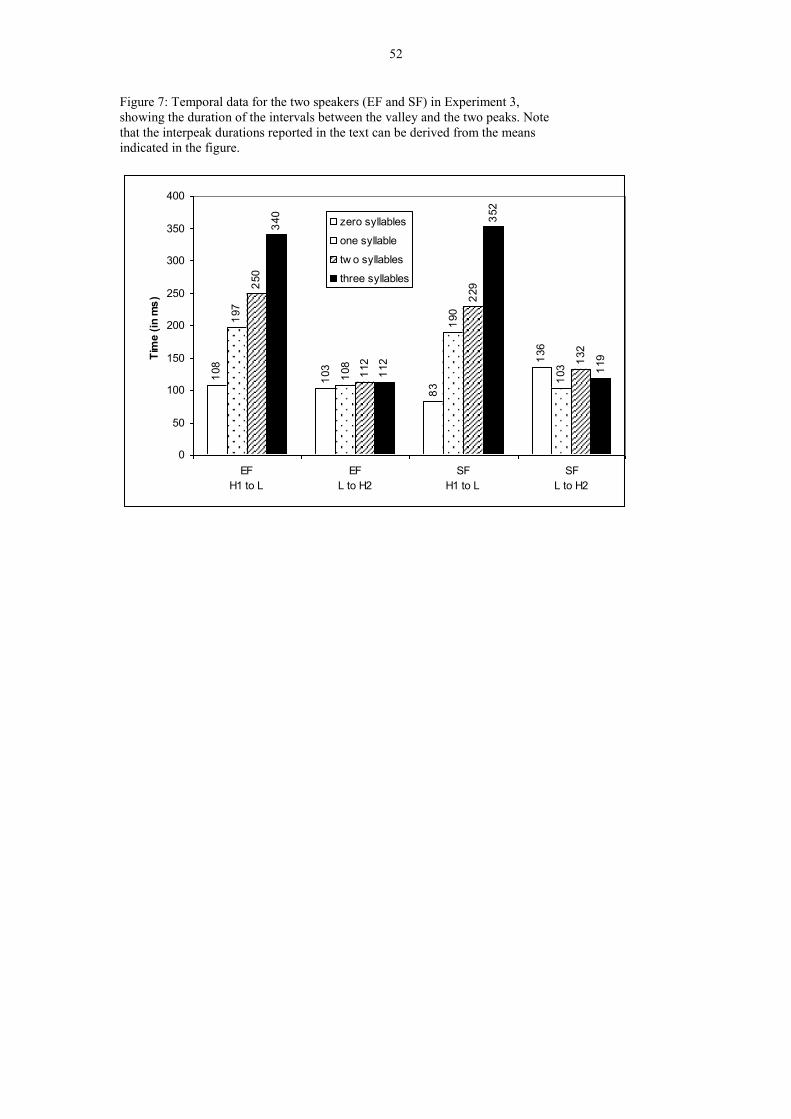
52
Figure 7: Temporal data for the two speakers (EF and SF) in Experiment 3,
showing the duration of the intervals between the valley and the two peaks. Note
that the interpeak durations reported in the text can be derived from the means
indicated in the figure.
108
103
83
136
197
108
190
103
250
112
229
132
340
112
352
119
0
50
100
150
200
250
300
350
400
EF
H1 to L
EF
L to H2
SF
H1 to L
SF
L to H2
Tim
e (
in m
s)
zero syllables
one syllable
tw o syllables
three syllables