sage r. myers, md, msce nih public access charles...
TRANSCRIPT
Safety in Numbers: Are Major Cities the Safest Places in theUnited States?
Sage R. Myers, MD, MSCE, Charles C. Branas, PhD, Benjamin C. French, PhD, Michael L.Nance, MD, Michael J. Kallan, MS, Douglas J. Wiebe, PhD, and Brendan G. Carr, MD, MSDivision of Pediatric Emergency Medicine, Children’s Hospital of Philadelphia, Philadelphia, PA(Myers); the Department of Pediatrics (Myers), the Department of Biostatistics and Epidemiology(Branas, French, Kallan, Wiebe, Carr), and the Department of Emergency Medicine (Branas,Carr), University of Pennsylvania’s Perelman School of Medicine, Philadelphia, PA; and theDepartment of Surgery (Nance), Children’s Hospital of Philadelphia, Philadelphia, PA
Abstract
Study objectives—Many US cities have experienced population reductions, often blamed on
crime and interpersonal injury. Yet the overall injury risk in urban areas compared with suburban
and rural areas has not been fully described. We begin to investigate this evidence gap by looking
specifically at injury-related mortality risk, determining the risk of all injury death across the rural-
urban continuum.
Methods—A cross-sectional time-series analysis of US injury deaths from 1999 to 2006 in
counties classified according to the rural-urban continuum was conducted. Negative binomial
generalized estimating equations and tests for trend were completed. Total injury deaths were the
primary comparator, whereas differences by mechanism and age were also explored.
Results—A total of 1,295,919 injury deaths in 3,141 US counties were analyzed. Injury
mortality increased with increasing rurality. Urban counties demonstrated the lowest death rates,
significantly less than rural counties (mean difference=24.0 per 100,000; 95% confidence interval
16.4 to 31.6 per 100,000). After adjustment, the risk of injury death was 1.22 times higher in the
most rural counties compared with the most urban (95% confidence interval 1.07 to 1.39).
Conclusion—Using total injury death rate as an overall safety metric, US urban counties were
safer than their rural counterparts, and injury death risk increased steadily as counties became
more rural. Greater emphasis on elevated injury-related mortality risk outside of large cities,
attention to locality-specific injury prevention priorities, and an increased focus on matching
emergency care needs to emergency care resources are in order.
Copyright © 2013 by the American College of Emergency Physicians
Address for correspondence: Sage R. Myers, MD, MSCE, [email protected].
Author contributions: CCB, DJW, MLN, and BGC conceived the study. SRM, CCB, BCF, MLN, MJK, and DJW designed themethods. SRM, CCB, and BGC obtained research funding. MJK cleaned the data set. SRM and MJK conducted data analysis. BCFprovided statistical advice. SRM drafted the article and all authors contributed substantially to its revision. SRM takes responsibilityfor the paper as a whole.
Presented at the American College of Emergency Physicians annual conference, October 2011, San Francisco, CA.
NIH Public AccessAuthor ManuscriptAnn Emerg Med. Author manuscript; available in PMC 2014 April 21.
Published in final edited form as:Ann Emerg Med. 2013 October ; 62(4): 408–418.e3. doi:10.1016/j.annemergmed.2013.05.030.
NIH
-PA
Author M
anuscriptN
IH-P
A A
uthor Manuscript
NIH
-PA
Author M
anuscript
INTRODUCTION
Background
By 2008, more than half of the world’s people was living in urban areas for the first time in
human history.1,2 This growing urbanization of global populations has been called an
emerging humanitarian disaster, partly because of prominent urban safety hazards such as
injuries.3 In contrast, during the past few decades the United States has experienced
unprecedented reductions in population in many of its largest cities and population centers.
The reasons for these reductions include the movement of jobs and housing outside of cities,
differences in the quality of public education and municipal services, and levels of crime and
blight in many city centers.4,5 Among these reasons for urban flight in the United States, the
perception of crime risk has been perhaps the most publicized and influential.6,7
Importance
From 1999 to 2006, nearly 1.3 million people died of injuries in the United States.8 Most of
these people were younger than 45 years and lived in urban areas.9 This might be interpreted
as suggesting that young urbanites bear the greatest burden of injury related mortality risk in
the United States and, by extension, that large US cities are unsafe places to live and work.
In addition, previous work on US homicide and crime victimization also supports the notion
that injury risk is concentrated in large US cities.10 However, it is possible that the actual
safety risk in urban America is exaggerated and that the true risk experienced by urban
inhabitants is lower than commonly perceived.11 Paradoxically, research also exists
suggesting that rural areas bear a disproportionately high level of risk for certain serious
injuries such as suicide and motor vehicle injuries, raising the possibility of increased safety
threats to rural inhabitants.10,12
Goals of This Investigation
These different points of view urban areas unsafe on the one hand, rural areas unsafe on the
other are driven by analyses that focus only on specific types or causes of injuries and by the
individual ability to misconceive risk.13 We seek to remedy this by analyzing injury death
rates of all types across all US geographies, from big cities to small towns. Creating a fuller
understanding of the injury related mortality risk across the United States can also inform
the evaluation of trauma systems, given our understanding of the importance of timely
access to trauma care14 and the difficulty of accessing trauma care in many rural areas.15–19
In fact, one of the objectives of the Department of Health and Human Services’ Health
People 2012 initiative is to increase access to trauma care in the United States,20 and an
understanding of where services are needed will inform the implementation of this initiative.
In addition, targeted injury prevention has been previously described as a way to increase
effectiveness and efficiency of prevention work, and understanding how the risk of injury by
mechanism differs across various environments will aid in this effort.21 Finally, staffing of
emergency departments (EDs) is known to vary across the rural urban landscape, with rural
hospitals being significantly less likely to be staffed by emergency physicians.22,23
Understanding the injury mortality distribution across rural areas can help inform the debate
over the future and planning of the ED workforce and the emergency care system as a
whole. Therefore, to address all of these goals, we will examine the relative risk of injury
Myers et al. Page 2
Ann Emerg Med. Author manuscript; available in PMC 2014 April 21.
NIH
-PA
Author M
anuscriptN
IH-P
A A
uthor Manuscript
NIH
-PA
Author M
anuscript
death across the rural urban landscape in aggregate, as well as by age and mechanism
subtype.
MATERIALS AND METHODS
Study Design and Setting
We performed a cross sectional time series analysis of all injury deaths that occurred in the
United States during 1999 through 2006. The study was approved by the institutional review
board at the University of Pennsylvania.
Selection of Participants
Decedents were identified through the non public use Multiple Cause of Death data files
from the National Vital Statistics System of the National Center for Health Statistics. These
data are created through the uniform registration of death certificates and describe all
documented deaths in the United States. Codes defined by the International Statistical
Classification of Diseases and Related Health Problems, 10th Revision (ICD-10)24 were
used to extract decedents with injury as the cause of death (V01 Y36, U01 03, Y85 86, 87.1,
87.2, 89.0, 89.1, and 89.9). Deaths with an invalid or missing Federal Information
Processing Standards code for county of occurrence (n=7,434) and deaths classified as
terrorism (n=2,927) were excluded from this analysis. Injury deaths were further classified
by intent (suicide/homicide/unintentional) and mechanism through the use of ICD-10
external cause codes.25 Injury mechanisms evaluated were cuts, drowning, falls, fire,
firearms, machinery, transportation (including the subset of motor vehicle transport),
environmental (flood, animal attack, cold exposure), overexertion, poisoning, struck (hit by
object/person/animal), and suffocation (Table E1, available online at http://
www.annemergmed.com).
Methods of Measurement
Each decedent was assigned to the US county where injury death occurred according to
Federal Information Processing Standards geographic codes, including deaths in counties
with fewer than 100,000 persons as per a special data request approved by the National
Center for Health Statistics. We chose to use county of occurrence to best describe the injury
related mortality risk according to time spent in a given county, allowing a more direct
understanding of the results. However, home location has been shown to be an appropriate
proxy for injury location, with the majority of injury deaths occurring close to the
residence26; therefore, it is likely that results would be similar if derived according to county
of residence. All 3,141 US counties were included in the analysis, including the District of
Columbia as a county equivalent. We identified 2 changes in county boundaries during the
study period and adjusted population centroid locations and county assignments accordingly
for data years after the changes took effect.27
Counties were classified according to a 10 category ordinal variable representing an urban
rural continuum (Table E2, available online at http://www.annemergmed.com). This
variable distinguishes counties by both population size and proximity to metropolitan areas,
thus providing different information than would a simple categorization of counties on the
Myers et al. Page 3
Ann Emerg Med. Author manuscript; available in PMC 2014 April 21.
NIH
-PA
Author M
anuscriptN
IH-P
A A
uthor Manuscript
NIH
-PA
Author M
anuscript
basis of population size, land area, proximity to metropolitan areas, or population density,
each as a separate variable. Our 10 category variable is based on the 9 category urban rural
continuum codes from the US Department of Agriculture, with an additional category to
distinguish counties with a population of 1 million or greater as these distinct “nuclear”
counties with potential to have increased risk of deaths from injuries.28–30 This 10 category
classification scheme has been used in multiple previous geographic studies and is validated
by the US Department of Agriculture according to census data.28,31
County specific rates of death were calculated and associated population data were used to
derive variables hypothesized to affect the occurrence of injury related deaths, which were
chosen a priori; specifically, county specific median age; median per capita income; and the
proportion of blacks, Hispanics, men, unemployed, households headed by women,
individuals living alone, individuals older than 16 years and living alone, individuals living
under the poverty line, and adults (aged >18 years) with college education. Region of the
country (Northeast, Midwest, South, and West) was also used to account for spatial
heterogeneity. Each of these variables was obtained from the Area Resource File32 and the
2000 US Census Bureau.33 There were no counties with missing demographic data. County
measures of total population were based on annual census estimates, and specific age
subgroup total populations were calculated by projecting the 2000 Census age proportions
onto the annual population estimates.
Outcome Measures
The outcome variable analyzed was injury death rate overall, as well as by cause and intent.
Rates of death in each of these groupings were analyzed at the level of the county.
Primary Data Analysis
We examined variations in county specific rates of death across the 10 classes of the urban
rural continuum, with most urban counties treated as the reference group, after controlling
for confounding factors (above). We used general estimating equations (GEEs) to
appropriately account for longitudinal correlation arising from collecting data on the same
counties over time. We chose to use a negative binomial link function34 rather than the
Poisson distribution to account for overdispersion in the count data.35 The robust variance
estimator was used to account for longitudinal correlation, and the model included an offset
for total population and scale parameter Φ. Alternatively, a mixed effects model approach
that included county level random effects could have been used. We preferred a GEE
approach for 2 main reasons. First, mixed effects models rely on the assumption that the
random effects are correctly specified, whereas the GEE approach is reliable even if the
correlation structure is incorrectly specified.36 Second, GEE generates direct inference for
the population of US citizens as opposed to the mixed effects model’s direct inference to the
population of US counties.37
Excessively collinear independent variables were determined by using variance inflation
factor analysis and limiting the final models to the set of independent variables with
variance inflation factor less than 5.38,39 Analyses were run for each dependent variable as
unadjusted models, as full models adjusting for all possible (but noncollinear) covariates,
Myers et al. Page 4
Ann Emerg Med. Author manuscript; available in PMC 2014 April 21.
NIH
-PA
Author M
anuscriptN
IH-P
A A
uthor Manuscript
NIH
-PA
Author M
anuscript
and as reduced models. Reduced models were created with the quasi likelihood under
independence model criterion to determine the model with the best fit for each dependent
variable compared with the unadjusted model, with each variable being added as an
individual covariate to the model testing the association between rural urban status of the
county and injury death rates to test each covariate’s importance to the model.40
Subsequently, all variables found to be important in this individual analysis were included in
a larger reduced model, which was further refined by testing against models created by
eliminating each variable individually to determine covariates that, though important to the
model individually, lose their importance when other covariates are added. Once
unimportant covariates were removed, we determined the final model to be the reduced
model with best fit. Tests for linear trend were performed by modeling the urban rural
continuum variable as continuous. Given differences in typical injury mechanisms, typical
geographic location of injury occurrence, and physiologic response to injury by age, we also
subdivided our analysis into 5 age categories, using census cut points (≤14 years, 15 to 19
years, 20 to 44 years, 45 to 64 years, and ≥65 years). To explore modification of the
association between risk of injury death and rural urban nature of the county, we used the
total population to test interactions between covariates of interest and rurality. All analyses
were completed with Stata/MP 11 software (StataCorp, College Station, TX).
Given our negative binomial model specification, we did not directly adjust for spatial
autocorrelation. However, we obtained residuals of our model and tested these for spatial
autocorrelation with ArcGIS software (ESRI, Redlands, CA). We ran Moran’s I and Geary’s
c tests on the residual values for each county averaged across the 8 years, using inverse
distances between counties. The Geary’s c test allows only positive values to be tested and
was run with absolute value of the residuals.
Finally, because the robustness of the national trauma system is paramount to the care of
injured patients and there are known gaps in trauma center access in rural areas, we
generated a variable to test the effect of trauma center proximity on the relationship between
injury mortality and county rurality. Using contiguous county data from GreatData (http://
www.greatdata.com) in conjunction with data from the Trauma Information Exchange
Program,41 we determined the number of accredited Level I and II trauma centers in each
county and assigned to each county the total number of trauma centers in it and its
neighboring counties as a way to determine the “proximity” to a trauma center for
inhabitants of that county. We then added this covariate to our GEE model evaluating the
relative rate of injury related mortality by urban rural nature of the county and determined
the effect on our result.
RESULTS
Characteristics of Study Subjects
Our analysis included all 3,141 United States counties, in which there were 1,295,919 injury
deaths during the period studied (1999 to 2006). The overall injury death rate was 56.2 per
100,000 persons in the population. The overall death rate for unintentional injury was 37.5
per 100,000, and the overall death rate for intentional injury (homicide and suicide) was 17.0
per 100,000. The most common mechanisms for injury death across all subjects were motor
Myers et al. Page 5
Ann Emerg Med. Author manuscript; available in PMC 2014 April 21.
NIH
-PA
Author M
anuscriptN
IH-P
A A
uthor Manuscript
NIH
-PA
Author M
anuscript

vehicle related, which occurred at a rate of 14.9 per 100,000, and firearm related, which
occurred at a rate of 10.4 per 100,000. Demographic characteristics of all counties by rural
urban continuum category are described in Table E1 (available online at http://
www.annemergmed.com). The injury death rate increased slightly during the 8 year period,
with a rate ratio of 1.02 (95% confidence interval [CI] 1.01 to 1.02; reference year 1999).
Main Results
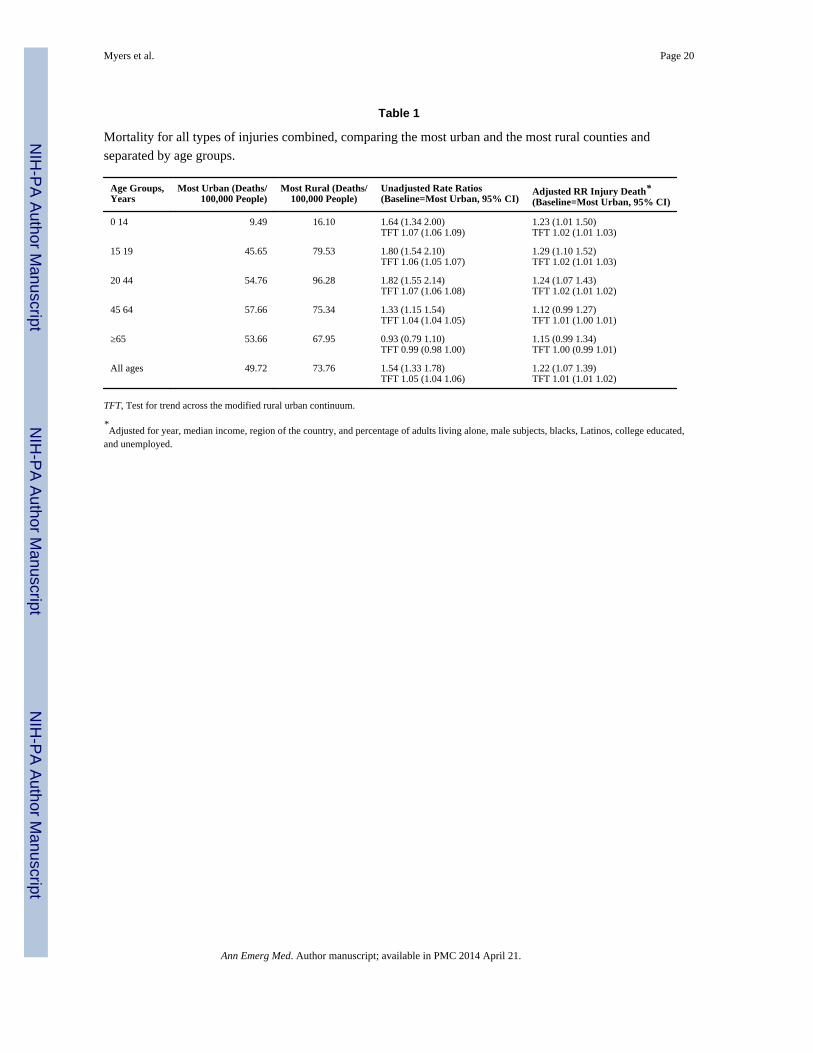
The overall injury death rate increased with increasing rurality (Table 1), and a significant
difference between the injury death rate in the most rural compared with the most urban
counties was identified (difference of 24.0 per 100,000; 95% CI 16.4 to 31.6 per 100,000).
Both unadjusted and adjusted injury death rate ratios were significantly elevated in the most
rural counties compared with the most urban (Tables 1 and 2). Tests for linear trends were
significant across the modified urban rural continuum in both the unadjusted and adjusted
models (Table 1). Significantly elevated risks of injury death in the most rural counties
(compared with the most urban) were found in all age groups younger than 45 years (Table
1). Figure 1 graphically displays the urban rural continuum categories, population density,
and all injury death rates for US counties. Visually, inverse trends exist between rurality and
injury death rate.
Unintentional injury death rates in US counties varied significantly as a function of rurality,
with higher death rates in the most rural [modified rural urban continuum category 9
(mruc9)] compared with the most urban [modified rural urban continuum category 0
(mruc0)] counties [rate ratio (RR) 1.42; 95%CI 1.23 to 1.65]. The suicide injury death rate
also showed some increase with increasing rurality, but the difference between the most
rural and most urban counties did not reach significance (Figure 2; Table 2). On the other
hand, the homicide death rate decreased as counties became more rural (RR 0.44; 95% CI
0.37 to 0.53) (Table 2).
Trends were similar among age subgroups. Increases in unintentional injury death from the
most urban to the most rural counties were observed, and differences were found to be
significant in all fully adjusted models for all age subgroups (RRs [mruc9 counties
compared with mruc0 counties]: 0 to 14 years [1.32, 1.07 to 1.61], 15 to 19 years [1.68, 1.42
to 1.99], 20 to 44 years [1.54, 1.31 to 1.81], 45 to 64 years [1.25, 1.08 to 1.45], and ≥65
years [1.20, 1.01 to 1.41]). For suicides, the general trend of increase in raw suicide death
rates in more rural areas continued; however, this difference reached significance only in the
fully adjusted models for the youngest 2 age groups (RRs [mruc9 counties compared with
mruc0 counties]: 0 to 14 years [2.47, 1.64 to 3.71] and 15 to 19 years [1.68, 1.33 to 2.13]).
For homicide, a trend of decreased homicide death in more rural areas was observed and
was significant in full year adjusted models for all age subgroups except for older adults
(≥65 years) (RRs [mruc9 counties compared with mruc0 counties]: 0 to 14 years [0.50, 0.32
to 0.79], 15 to 19 years [0.28, 0.19 to 0.42], 20 to 44 years [0.46, 0.37 to 0.57], and 45 to 64
years [0.55, 0.44 to 0.68]).
Motor vehicle crashes were the leading cause of injury death across the population, and the
number of motor vehicle crash injury deaths increased sharply with increasing rurality
(27.61/100,000 in most rural, 10.58/100,000 in most urban; RR 2.00; 95% CI 1.67 2.39)
Myers et al. Page 6
Ann Emerg Med. Author manuscript; available in PMC 2014 April 21.
NIH
-PA
Author M
anuscriptN
IH-P
A A
uthor Manuscript
NIH
-PA
Author M
anuscript

(Table 2; Table E3, available online at http://www.annemergmed.com). Tests for linear
trend across the rural urban continuum were significant (P<.001 in unadjusted and fully
adjusted models). Within each age subgroup, this finding remained constant, with a
significantly increased risk of motor vehicle crash death in the most rural counties compared
with the most urban in fully adjusted models.
For the entire population combined, as well as for most age subgroups, the top 3 causes of
death were motor vehicle collisions, firearms, and poisoning (Figure 2). The only age groups
with a different pattern were the youngest (0 to 14 years), in which the top 3 causes of death
were motor vehicle crash, suffocation, and drowning; and the oldest (≥65 years), in which
the top 3 causes were falls, motor vehicle crashes, and firearms. Overall, firearms deaths
showed no significant differences in risk of death between the most rural and most urban
counties (Table 2). However, within the age subgroups, firearm deaths showed very
different patterns across the rural urban landscape. In the youngest age group (0 to 14 years),
as well as in the older age groups (45 to 64 years and ≥65 years), the risk of firearm related
injury death was significantly higher in rural areas compared with the most urban
(respectively, fully adjusted RRs: 1.64 [95% CI 1.10 to 2.46], 1.16 [95% CI 1.00 to 1.33],
and 1.20 [95% CI 1.02 to 1.41]). However, in the 20 to 44 year old age group, the risk of
firearm related injury death was significantly lower in the most rural areas compared with
the most urban (0.85; 95% CI 0.73 to 0.99, fully adjusted). In the 15 to 19 year old age
group, there was no significant difference. On the other hand, poisoning deaths showed a
decreased risk of death in the most rural counties compared with the most urban counties in
all except the 0 to 14 year old age group, in which there was no significant difference across
rurality (fully adjusted RRs: all subjects 0.41 [95% CI 0.34 to 0.50], 15 to 19 years 0.55
[95% CI 0.39 to 0.78], 20 to 44 years 0.46 [95% CI 0.37 to 0.57], 45 to 64 years 0.40 [95%
CI 0.33 to 0.49], and ≥65 years 0.69 [95% CI 0.53 to 0.90]). Finally, fall related injury
deaths, a specific concern in the oldest age group (≥65 years), had a significantly lower risk
in the most rural areas compared with the most urban (0.69; 95% CI 0.52 to 0.92 fully
adjusted).
In order to evaluate the possibility of effect modification on the association between injury
related death rate and rurality, four covariates were studied; race, ethnicity, education level
and income level. Rural counties with the highest quartile of percentage of black inhabitants
showed no difference in the risk of injury death compared with urban counties with the
highest quartile of black inhabitants (rural urban comparison 0.86; 95% CI 0.72 to 1.04).
Rural counties with the highest quartile of black inhabitants showed a significantly lower
risk of injury death compared with rural counties with the lowest quartile of black
inhabitants (intrarural comparison 0.74; 95% CI 0.65 to 0.84). Urban counties with the
highest quartile of black inhabitants showed no difference in the risk of injury death
compared with urban counties with the lowest quartile of black inhabitants (intraurban
comparison 1.02; 95% CI 0.83 to 1.25).
Rural counties with the highest quartile of percentage of Latino inhabitants had a
significantly increased risk of injury death compared with urban counties with the highest
quartile of Latino inhabitants (rural urban comparison 1.66; 95% CI 1.42 to 1.95). Rural
counties with the highest quartile of Latino inhabitants had a significantly increased risk of
Myers et al. Page 7
Ann Emerg Med. Author manuscript; available in PMC 2014 April 21.
NIH
-PA
Author M
anuscriptN
IH-P
A A
uthor Manuscript
NIH
-PA
Author M
anuscript

injury death compared with rural counties with the lowest quartile of Latino inhabitants
(intrarural comparison 1.39; 95% CI 1.24 to 1.55). Urban counties with the highest quartile
of Latino inhabitants showed no difference in risk of injury death compared with urban
counties with the lowest quartile of Latino inhabitants (intraurban 0.64; 95% CI 0.33 to
1.25).
Rural counties with the highest quartile of percentage of college educated inhabitants
showed a significantly increased risk of injury death compared with urban counties with the
highest quartile of college educated inhabitants (rural urban comparison 1.49; 95% CI 1.26
to 1.76). Rural counties with the highest quartile of college educated inhabitants showed an
increased risk of injury death compared with rural counties with the lowest quartile of
college educated inhabitants (intrarural comparison 1.49; 95% CI 1.31 to 1.71). Urban
counties with the highest quartile of college educated inhabitants showed no difference in
the risk of injury death compared with urban counties with the lowest quartile of college
educated inhabitants (intraurban comparison 0.93; 95% CI 0.83 to 1.04).
Rural counties with the highest quartile of median income showed an increased risk of
injury death compared with urban counties with the highest quartile of median income (rural
urban comparison 1.89; 95% CI 1.54 to 2.32). Rural counties with the highest quartile of
median income showed an increased risk of injury death compared with rural counties with
the lowest quartile of median income (intrarural comparison 1.22; 95% CI 1.03 to 1.46).
Urban counties with the highest quartile of median income showed no difference in risk of
injury death compared with urban counties with the lowest quartile of median income
(intraurban mruc 0: 1.12; 95% CI 0.68 to 1.84) but did show a lower risk of injury death
among the next most urban counties (intraurban comparison mruc 1: 0.62, 95% CI 0.50 to
0.76 and mruc 2: 0.83, 95% CI 0.71 to 0.96).
Testing for spatial autocorrelation among the residuals using the Moran’s I statistic showed
a significant level of autocorrelation (P<.01). Testing for spatial autocorrelation among the
residuals using the Geary’s c test did not show significant autocorrelation (P=.11).
We determined the number of trauma centers in each county and its surrounding counties as
a measure of proximity to trauma center care. For each county, the total number of trauma
centers in that county and surrounding counties ranged from 0 to 38, with 61.7% of counties
having no trauma centers (Level I and II) in their own or a surrounding county. Adding this
variable to the model had minimal attenuating effect on the association between injury
related mortality rate and urban rural nature of the county (Table 2).
LIMITATIONS
Although we broadly evaluated all injury deaths across the United States, nonfatal injuries
could not be included, and we recognize that this limits the robustness of our analysis, and
the evaluation of “safety” based only on fatal injuries is incomplete. We were able to control
for a wide variety of county level variables that may have confounded the relationship
between the risk of injury death and the rural/urban category of the county, but residual
confounding may remain. Important variables that we are unable to adjust for are distance to
a trauma center, injury severity, rates of alcohol and substance abuse, and estimates of motor
Myers et al. Page 8
Ann Emerg Med. Author manuscript; available in PMC 2014 April 21.
NIH
-PA
Author M
anuscriptN
IH-P
A A
uthor Manuscript
NIH
-PA
Author M
anuscript
vehicle use. The addition of distance to a trauma center would help to hone in on the reason
behind results found here, and this is an important next step to this work. Ecologic bias may
also exist, but the design and intent of the study are for public health decision making in the
aggregate and not at the level of individuals. We recognize that the experience of any
individual within a county does not necessarily represent the injury related mortality risk
level of the overall county. In addition, we recognize that not all counties within a rural
urban category experience the same risk level. This is demonstrated in small part by the
wide range of injury death rates displayed across the most urban counties shown in Figure 1.
Finally, we used death certificate data in our analysis, and although manner of death is
known to be complete in such data,42 misclassification of intent or mechanism may exist.43
We have no reason to believe that this misclassification would systematically vary across the
rural urban spectrum, and therefore any bias introduced should be random and bias toward
the null, decreasing our ability to detect a true difference.
We chose to exclude terrorist related deaths, the majority of which are associated with the
September 11, 2001 attacks on the United States. Given the infrequent, unpredictable, and
devastating nature of these attacks, it seemed unreasonable to include these deaths in an
evaluation of overall trends of injury related deaths across the nation. It is difficult to
determine the direction of bias, given that deaths occurred both in rural and urban areas, but
it is our belief that the “true” evaluation of injury related deaths in the United States does not
include these outliers. In addition, the data years included in this analysis are somewhat
dated because of the limitation on data available for our special data agreement, under which
we are able to include data for the smallest counties (which are typically excluded because
of their higher degree of identifiability). Although these relationships may have changed in
the years since our data set ended, as new trauma centers have been verified and changes in
injury prevention have occurred, we observed little change in the rate of injury deaths during
the period under study (incidence difference between 1999 and 2006 nonsignificant at 8 per
100,000; 95% CI 15 to 31 per 100,000).
Finally, given the constraints of our model, we were able to adjust directly for longitudinal
correlation, which we believe is the strongest correlation component, but were not able to
adjust directly for spatial autocorrelation. To evaluate its effect, we tested the residuals of
our model for spatial autocorrelation. One of the 2 classic tests of spatial autocorrelation that
we used found significant spatial autocorrelation among the residuals and one did not.
Disparate results from spatial testing have been observed in simulation models because of
differences in map shape and regional structures, as well as with heteroscedasticity caused
by unequal variances.44,45 Given the disparate results from the 2 classic tests for spatial
autocorrelation, we decided to evaluate the effect of direct adjustment for the average injury
mortality rates of surrounding counties. With the addition of average surrounding injury
mortality for each county as a covariate in the fully adjusted model of all injury mortality
risk, we found little effect on the association between rurality and injury mortality (RR 1.13;
95% CI 1.00 to 1.29, most rural compared with most urban). The lack of significant change
in the main effect of the model makes the likelihood of residual spatial autocorrelation less.
However, we recognize that some unmeasured spatial autocorrelation may remain in our
models, but given the obvious tendency for rural areas to be near one another, and likewise
Myers et al. Page 9
Ann Emerg Med. Author manuscript; available in PMC 2014 April 21.
NIH
-PA
Author M
anuscriptN
IH-P
A A
uthor Manuscript
NIH
-PA
Author M
anuscript

urban areas, it may be that residual spatial autocorrelation should be expected for outcomes
that are affected by the rural/urban nature of county locations.
DISCUSSION
Despite public perception to the contrary,12,46,47 when all types of injuries are considered
together, rural areas, not urban, bear a disproportionate amount of injury related mortality
risk in the United States. Although variability among urban areas clearly exists (see Figure 1
city comparisons), when urban areas were considered as a group, risk of serious injury
resulting in death was approximately 20% lower than in the most rural areas of the country.
Although our findings support the belief that homicide rates and risk of homicide are
significantly higher in urban areas compared with rural,48 we demonstrate that the
magnitude of homicide related deaths, even in urban areas, is outweighed by the magnitude
of unintentional injury deaths, particularly those resulting from motor vehicles. In fact, the
rate of unintentional injury death is more than 15 times that of homicide among the entire
population, with the risk resting heavily in rural areas such that the risk of unintentional
injury death is 40% higher in the most rural counties compared with the most urban.
Motor vehicle crash deaths drive this finding as the top mechanism of injury death,
occurring at a rate that is more than 1.4 times higher than the next leading mechanism of
injury death overall and twice the next leading mechanism in rural areas (Figure 2).49,50 By
comparison, the risk of motor vehicle crash death in the most rural areas is 2 times that in
the most urban areas. Factors likely to contribute to this elevated rural risk include speed of
travel,51 increased risk taking,52 adherence to traffic laws,53 and distance to medical care.54
Education, prevention efforts, and evaluation of the trauma system to minimize distance to
medical care are therefore possible interventions that may reverse this injury related
mortality risk difference. Although by and large the increased injury related mortality risk to
rural residents is driven by these motor vehicle crash related injury deaths, other less
common injury mechanisms with increased risk of death in rural areas include machinery
injuries, injuries from being struck, and environmental/exposure injuries (Table E3,
available online at http://www.annemergmed.com).
Differences across age groups in both primary injury mechanism and magnitude across the
rural urban spectrum are important to consider as local injury prevention priorities are being
considered. For example, from the data presented here, we can see that understanding the
increased risk of fall related deaths in the urban elderly and drowning in urban children are
important to allow tailored prevention and treatment efforts to maximally benefit local
safety (Figure 2). In addition, understanding of the magnitude of injury mechanism by
location can lead to efforts to equip local hospitals to care for the injuries that they are most
likely to encounter.
These findings can also be considered in the context of the ongoing ED workforce debate.
Hospitals in rural areas are less frequently staffed by emergency physicians and have less
access to on call specialists, including trauma surgeons, neurosurgeons, and
orthopedists.23,55 Although the emergency medicine trained and board certified workforce
has the most direct training in the care of the severely injured patients among the physician
Myers et al. Page 10
Ann Emerg Med. Author manuscript; available in PMC 2014 April 21.
NIH
-PA
Author M
anuscriptN
IH-P
A A
uthor Manuscript
NIH
-PA
Author M
anuscript

types who may staff EDs, it is unlikely that the workforce pool of emergency medicine
trained physicians will be large enough to cover all EDs completely at any point in the near
future.23,56,57 The fact that the injury related mortality risk is highest in the areas least likely
to be covered by emergency physicians and least likely to have access to trauma care (http://
www.traumamaps.org) could be used to support ongoing efforts to improve emergency and
trauma care systems in the United States, using a population planning approach.18,58,59
Additional efforts should focus on expanding access to expert care by using less traditional
methods, including certification or postresidency training programs for physicians who will
be providing care in EDs from non emergency medicine backgrounds and the continued
examination of how technology based solutions, including telemedicine, can expand the
traditional reach of medical expertise into rural areas.60–62
Through our evaluation of interactions between the rural urban nature of the counties and
adjusting variables, we have found some interesting differences in the risk of injury death by
subpopulations within counties. For example, among counties with the highest percentage of
black inhabitants, we do not observe the same rural urban trend of increasing injury death
risk in rural areas that we do in the entire population. In addition, rural areas with the highest
percentage of black inhabitants were found to be relatively safer than rural areas with lower
percentages of black inhabitants, whereas no similar difference was observed in urban areas.
Given the focus and intent of this study, these results are hypothesis generating only but lead
to interesting avenues of research. Given the lower rate of suicide among the black
community,63 coupled with the high overall rate of suicide in rural areas, it may be that a
higher percentage of black inhabitants is protective, at least in part, for this reason. Or one
could postulate that rural counties with the highest quartile of black population tend to be
farther from highways; with motor vehicle injury the main driver of the increased injury
death risk in rural areas, this would help to reverse the rural urban trend, as we see here.
Evaluation of income and education found that counties within the highest quartile of
income and education showed the same increased risk of injury death with increasing
rurality found in the overall county group. However, among the most rural counties, those
with higher education and income levels had a higher risk of injury death than those with the
lowest education and income levels. This difference was not generally observed among the
most urban counties. Once again, these findings are hypothesis generating and could lead to
interesting focused evaluation of the reasons behind these differences. We could postulate
that the counties with higher income and education levels in rural areas are more likely to be
found near universities, larger hospitals, or larger employers, and that may influence the
differences we have found among this subpopulation, but further studies are needed to test
these inferences.
Our analysis was completed according to the county of injury death occurrence to assess the
safety risk of time spent in each county and the safety risks inherent in the county itself.
However, it is likely that results would be similar if the county of residence were used
because previous work has shown that the majority of injuries occur close to home.26 In
some ways, counties with a large highway, airport, or train station, or those with a large
tourist population, may have a larger effective population than their true residential
population, given the number of people who are visiting the area at any given time
Myers et al. Page 11
Ann Emerg Med. Author manuscript; available in PMC 2014 April 21.
NIH
-PA
Author M
anuscriptN
IH-P
A A
uthor Manuscript
NIH
-PA
Author M
anuscript
compared with those who are registered inhabitants. It is unclear whether this would tend to
affect rural areas or urban areas more because more of these areas are likely to occur in
urban counties, but the effect on the population may be greater in sparsely inhabited areas.
Future analyses may be able to adjust for these differences to validate the results found here,
but the likelihood of injury occurring close to home makes it likely that our results would
still be found valid. In any event, with the analysis structured in this way, it informs the
individual in a logical manner by speaking to the relative risk of fatal injury according to the
exposure to a given county type.
One postulated mechanism through which differences in injury related death may vary by
rurality of the county could be proximity to a trauma center. It is known that rural counties
have fewer trauma centers and that inhabitants of rural counties are more likely to lack
reasonable access to higher level trauma care.18,64,65 It is also known that higher level
trauma center care improves outcomes for injured patients.66 It is thus reasonable to
consider access to specialized care, or lack thereof, as a mediator of the relationship between
the rural nature of a county and its level of injury related mortality. To address this issue, we
introduced a variable related to access to trauma center care into our model as a covariate to
determine whether it would erase the increased injury related mortality risk that we observed
to be associated with the most rural counties. In fact, we observed very little change in the
rural urban relationship when we accounted for “access” to trauma center care. This would
argue against access to specialized care being the driving force behind the disparity in injury
related mortality found for rural areas. We were able to use only a simple count of trauma
centers per county as our determination of access to care, and it is possible that a more
sophisticated model of trauma center access, using true distances and drive times, could
have more influence on this relationship. However, given the very minor effect of our crude
adjustment variable, it is unlikely that the addition of a more accurate access variable would
account for all of the increased risk of injury related mortality found in the most rural
counties compared with the most urban.
Although past work has shown that county population density is inversely correlated with
the risk of overall injury death67 and that unintentional trauma deaths across counties have
hot spots in rural areas,68 this is the first study to focus on the total rates of injury mortality
for all US counties across a detailed rural urban continuum and the first to provide an
understanding of the relation between age and injury type and intent, to our knowledge. Our
findings suggest that urban living is relatively safe when safety is measured in terms of
injury death, and we support the belief that urban rural differences are important for
consideration in injury prevention efforts. We recognize that although our analysis is
complete in that it includes all injury deaths across the country, it does not include injuries
that do not result in death. Therefore, left open is the question about how the access and
quality of care available across the country affect the differences that we have found in
injury mortality. We postulate that the trends that we have found are primarily due to injury
occurrence as opposed to differences in care because both Coben et al69 and Sihler and
Hemmila70 have found similar differences in nonfatal injury hospitalization and disability
across the rural urban landscape. However, this question remains open to further study. Next
steps should focus on creating local injury prevention priority scores71 and considering the
prioritization of trauma center placement in the most at risk areas, in addition to verification
Myers et al. Page 12
Ann Emerg Med. Author manuscript; available in PMC 2014 April 21.
NIH
-PA
Author M
anuscriptN
IH-P
A A
uthor Manuscript
NIH
-PA
Author M
anuscript

of the contribution of injury care by the evaluation of nonfatal injuries across the rural urban
landscape.
When considering all mechanisms of injury death as an overall metric of safety, large cities
appear to be the safest counties in the United States, significantly safer than their rural
counterparts. Greater emphasis on elevated safety risks outside of large US cities is in order,
alongside a changed perception of urban living as a relatively safe experience. Future efforts
should focus on identifying local injury prevention priorities, considering the effect of these
findings on the certification and training requirements for ED staffing, and applying these
findings to the ongoing development of trauma and emergency care systems in the United
States, using a population health perspective.
Supplementary Material
Refer to Web version on PubMed Central for supplementary material.
Acknowledgments
Funding and support: By Annals policy, all authors are required to disclose any and all commercial, financial, andother relationships in any way related to the subject of this article as per ICMJE conflict of interest guidelines (seewww.icmje.org). The authors have stated that no such relationships exist. This study was supported by grantsF32HS018604-01 and K08-HS017960 from the Agency for Healthcare Research and Quality, as well as by grant5RO1CE001615-02 from the Centers for Disease Control and Prevention, National Center for Injury Preventionand Control, and grant1R03HD061523-01from the Eunice Kennedy Shriver National Institute of Child Health andHuman Development. The funding agencies were not involved in the design and conduct of the study; thecollection, analysis, and interpretation of the data; or the preparation of the data or preparation, review, or approvalof the article. Dr. Carr spends a portion of his time as a Senior Policy Analyst in the Office of the AssistantSecretary for Preparedness and Response. The findings and conclusions in this report are those of the author and donot necessarily represent the views of the Department of Health and Human Services or its components.
REFERENCES
1. Sachs, JD. Urbanization. The Earth Institute at Columbia University; Available at: http://www.earth.columbia.edu/articles/view/2128 [Accessed June 25, 2013]
2. Population Institute. Population Institute Issue Brief. Washington, DC: 2006 Aug. Global populationand security.
3. Vlahov D, Freudenberg N, Proietti F, et al. Urban as a determinant of health. J Urban Health. 2007;84(Suppl 1):16–26.
4. Kromer, J. Fixing Broken Cities: The Implementation of Urban Development Strategies. New York,NY: Routledge; 2010.
5. Cullen JB, Levitt SD. Crime, urban flight, and the consequences for cities. Rev Econ Stat. 1999;81:159–169.
6. Rappaport J. US urban decline and growth, 1950 to 2000. Available at: http://kansascityfed.org/publicat/econrev/Pdf/3q03rapp.pdf.
7. Min X, McDowall D. Escaping crime: the effects of direct and indirect victimization on moving.Criminology. 2008; 46:809–840.
8. National Center for Injury Prevention and Control. CDC; WISQARS fatal injury reports. Availableat: http://webappa.cdc.gov/sasweb/ncipc/mortrate10 us.html [Accessed June 25, 2013]
9. [Accessed June 25, 2013] Injury prevention and control: data and statistics (WISQARS). Availableat: http://www.cdc.gov/injury/wisqars/fatal.html
10. Branas CC, Nance ML, Elliott MR, et al. Urban rural shifts in intentional firearm death: differentcauses, same results. Am J Public Health. 2004; 94:1750–1755. [PubMed: 15451745]
Myers et al. Page 13
Ann Emerg Med. Author manuscript; available in PMC 2014 April 21.
NIH
-PA
Author M
anuscriptN
IH-P
A A
uthor Manuscript
NIH
-PA
Author M
anuscript

11. Quillian L, Pager D. Estimating risk: stereotype amplification and the perceived risk of criminalvictimization. Soc Psychol Q. 2012; 73:79–104. [PubMed: 20686631]
12. Sampson RJ, Raudenbush SW. Seeing disorder: neighborhood stigma and the social constructionof “broken windows”. Soc Psychol Q. 2004; 67:319–342.
13. Johnson EJ, Tversky A. Affect, generalization and the perception of risk. J Pers Soc Psychol. 1983;45:20–31.
14. Haas B, Stukel TA, Gomez D, et al. The mortality benefit of direct trauma center transport in aregional trauma system: a population based analysis. J Trauma Acute Care Surg. 2012; 72:1510–1515. [PubMed: 22695414]
15. Clarke JR, Trooskin SZ, Doshi PJ, et al. Time to laparotomy for intra abdominal bleeding fromtrauma does affect survival for delays up to 90 minutes. J Trauma. 2002; 52:420–425. [PubMed:11901314]
16. Feero S, Hedges JR, Simmons E, et al. Does out of hospital EMS time affect trauma survival? AmJ Emerg Med. 1995; 13:133–135. [PubMed: 7893293]
17. Fraser JF, Hartl R. Even in trauma, time is brain. Crit Care Med. 2008; 36:2951–2952. [PubMed:18812808]
18. Branas CC, MacKenzie EJ, Williams JC, et al. Access to trauma centers in the United States.JAMA. 2005; 293:2626–2633. [PubMed: 15928284]
19. MacKenzie EJ, Hoyt DB, Sacra JC, et al. National inventory of hospital trauma centers. JAMA.2003; 289:1515–1522. [PubMed: 12672768]
20. Wiebe DJ, Nance ML, Branas CC. Determining objective injury prevention priorities. Inj Prev.2006; 12:347–350. [PubMed: 17018680]
21. Department of Health and Human Services. Healthy People 2020 [Internet]. Washington, DC:HHS; Injury and violence prevention objectives. [updated June 30, 2011; cited July 14, 2011].Available at: http://www.healthypeople.gov/2020/topicsobjectives2020/overview.aspx?topicid 24[Accessed June 25, 2013]
22. Ginde AA, Sullivan AF, Camargo CA. National study of the emergency physician workforce,2008. Ann Emerg Med. 2009; 54:349–359. [PubMed: 19398242]
23. Camargo CA, Ginde AA, Singer AH, et al. Assessment of emergency physician workforce needsin the United States, 2005. Acad Emerg Med. 2008; (15):1317–1320. [PubMed: 18945242]
24. [Accessed June 25, 2013] International Statistical Classification of Diseases and Related HealthProblems, 10th Revision, Version for 2007. Available at: http://apps.who.int/classifications/apps/icd/icd10online/
25. Recommended framework for presenting injury mortality data. MMWR Recomm Rep. 1997;46:1–30.
26. Myers SR, Branas CC, Kallan MJ, et al. The use of home location to proxy injury location andimplications for regionalized trauma system planning. J Trauma. 2011; 71:1428–1434. [PubMed:21610527]
27. [Accessed June 25, 2013] Geographic areas reference manual. Available at: http://www.census.gov/geo/www/garm.html
28. [Accessed June 26, 2013] Measuring rurality: rural urban continuum codes. Available at: http://www.ers.usda.gov/data products/rural urban continuum codes.aspx
29. [Accessed June 26, 2013] Current Population Survey (CPS) definitions and explanations.Available at: http://www.census.gov/geo/reference/urban rural.html
30. Sing RF, Branas CC, MacKenzie EJ, et al. Geographic variation in serious nonfatal firearm injuriesin Pennsylvania. J Trauma. 1997; 43:825–830. [PubMed: 9390496]
31. Nance ML, Carr BG, Kallan MJ, et al. Variation in pediatric and adolescent firearm mortality ratesin rural and urban US counties. Pediatrics. 2010; 125:1112–1118. [PubMed: 20498168]
32. [Accessed June 26, 2013] Area health resource file. Available at: http://arf.hrsa.gov/
33. Butler, MA.; Beale, CL. AGES 9425. Washington, DC: Department of Agriculture, EconomicResearch Service; 1994. Rural urban continuum codes for metro and nonmetro counties, 1993.
34. Cameron, AC.; Trivedi, PK. Regression Analysis of Count Data. New York, NY: CambridgeUniversity Press; 1998.
Myers et al. Page 14
Ann Emerg Med. Author manuscript; available in PMC 2014 April 21.
NIH
-PA
Author M
anuscriptN
IH-P
A A
uthor Manuscript
NIH
-PA
Author M
anuscript

35. TenHave TR, Chinchilli VM. Two stage negative binomial and overdispersed Poisson models forclustered developmental toxicity data with random cluster size. J Agric Biol Environ Stat. 1998;3:75–98.
36. Liang KY, Zeger SL. Longitudinal data analysis using generalized linear models. Biometrika.1986; 73:13–22.
37. French B, Heagerty PJ. Analysis of longitudinal data to evaluate a policy change. Stat Med. 2008;27:5005–5025. [PubMed: 18618416]
38. Gujarati, DN. Multicollinearity. In: Gujarati, DN., editor. Basic Econometrics. New York, NY:McGraw Hill; 1988. p. 299
39. Fox J, Monette G. Generalized collinearity diagnostics. J Am Stat Assoc. 1992; 87:178–183.
40. Pan W. Akaike’s information criterion in generalized estimating equations. Biometrics. 2001;57:120–125. [PubMed: 11252586]
41. Trauma Information Exchange Program. Available at: http://www.amtrauma.org/programs/tiep/index.aspx.
42. Logan JE, Karch DK, Crosby AE. Reducing “unknown” data in violent death surveillance: a studyof death certificates, coroner/medical examiner and police reports from the national violent deathreporting system, 2003 2004. Homicide Studies. 2009; 13:385–397.
43. Mohler B, Earls F. Trends in adolescent suicide: misclassification bias? Am J Public Health. 2001;91:150–153. [PubMed: 11189813]
44. Walter SD. The analysis of regional patterns in health data II. The power to detect environmentaleffects. Am J Epidemiol. 1992; 136:742–759. [PubMed: 1442740]
45. Waldhör T. The spatial autocorrelation coefficient Moran’s I under heteroscedasticity. Stat Med.1996; 15:887–892. [PubMed: 8861157]
46. America’s 25 most dangerous neighborhoods. ABC News. Available at: http://abcnews.go.com/Travel/LifeStages/americas dangerous neighborhoods areas violent crime/story?id11803334&page 2.
47. Glassner, B. The Culture of Fear: Why Americans Are Afraid of the Wrong Things: Crime, Drugs,Minorities, Teen Moms, Killer Kids, Mutant Microbes, Plane Crashes, Road Rage & So MuchMore. 2nd ed.. New York, NY: Basic Books; 2010.
48. Baker, SP. The Injury Fact Book. 2nd ed.. New York, NY: Oxford University Press; 1992.
49. Baker SP, Whitfield RA, O’Neill B. Geographic variations in mortality from motor vehiclecrashes. N Engl J Med. 1987; 316:1384–1387. [PubMed: 3574414]
50. Brown LH, Khanna A, Hunt RC. Rural vs urban motor vehicle crash death rates: 20 years of FARSdata. Prehosp Emerg Care. 2000; 4:7–13. [PubMed: 10634275]
51. [Accessed September 19, 2011] National Highway Traffic Safety Administration’s National Centerfor Statistics and Analysis. Contrasting rural and urban fatal crashes 1994 2003. Technical report.2005 Dec. DOT HS 809 896. Available at: http://www nrd.nhtsa.dot.gov/Pubs/809896.PDF
52. Rakauskas ME, Ward NJ, Gerberich SG. Identification of differences between rural and urbansafety cultures. Accid Anal Prev. 2009; 41:931–937. [PubMed: 19664429]
53. Keay L, Jasti S, Munoz B, et al. Urban and rural differences in older drivers’ failure to stop at stopsigns. Accid Anal Prev. 2009; 41:995–1000. [PubMed: 19664437]
54. Gonzalez RP, Cummings G, Mulekar M, et al. Increased mortality in rural vehicular trauma:identifying contributing factors through data linkage. J Trauma. 2006; 61:404–409. [PubMed:16917458]
55. McConnell KJ, Johnson LA, Arab N, et al. The on call crisis: a statewide assessment of the costs ofproviding on call specialist coverage. Ann Emerg Med. 2007; 49:727–733. [PubMed: 17210209]
56. EMNet (Emergency Medicine Network) emergency physician workforce calculator. Available at:http://www.emnet usa.org/nedi/workforce.html.
57. Groth H, House H, Overton R, et al. Board certified emergency physicians comprise a minority ofthe emergency department workforce in Iowa. West J Emerg Med. 2013; 14:186–190. [PubMed:23599868]
58. Carr BG, Branas CC, Metlay JP, et al. Access to emergency care in the United States. Ann EmergMed. 2009; 54:261–269. [PubMed: 19201059]
Myers et al. Page 15
Ann Emerg Med. Author manuscript; available in PMC 2014 April 21.
NIH
-PA
Author M
anuscriptN
IH-P
A A
uthor Manuscript
NIH
-PA
Author M
anuscript

59. Eastman AB. Wherever the dart lands: toward the ideal trauma system. J Am Coll Surg. 2010;211:153–168. [PubMed: 20670853]
60. Schneider SM, et al. The future of emergency medicine. J Emerg Med. 2010; 39:210–215.[PubMed: 20634023]
61. Comprehensive advanced life support (CALS), rural emergency medical education. Available at:https://calsprogram.org.
62. Galli R, Keith JC, McKenzie K, et al. TelEmergency: a novel system for delivering emergencycare to rural hospitals. Ann Emerg Med. 2008; 51:275–284. [PubMed: 17764784]
63. Abe K, Mertz KJ, Powell KE, et al. Characteristics of black and white suicide decedents in FultonCounty, Georgia, 1988 2002. Am J Public Health. 2008; 98(9 suppl):S132–S136. [PubMed:18687597]
64. Trauma center maps. Available at: http://www.traumamaps.org.
65. Nance ML, Carr BG, Branas CC. Access to pediatric trauma care in the United States. Arch PediatrAdolesc Med. 2009; 163:512–518. [PubMed: 19487606]
66. MacKenzie EJ, et al. A national evaluation of the effect of trauma center care on mortality. N EnglJ Med. 2006; 354:366–378. [PubMed: 16436768]
67. Rutledge R, Fakhry SM, Baker CC, et al. A population based study of the association of medicalmanpower with county trauma death rates in the United States. Ann Surg. 1994; 219:547–567.[PubMed: 8185404]
68. Baker SP, Whitfield RA, O’Neill B. County mapping of injury mortality. J Trauma. 1988; 28:741–745. [PubMed: 3385814]
69. Coben JH, Tiesman HM, Bossarte RM, et al. Rural urban differences in injury hospitalizations inthe US. 2004. Am J Prev Med. 2009; 36:49–55. [PubMed: 19095165]
70. Sihler KG, Hemmila MR. Injuries in nonurban areas are associated with increased disability athospital discharge. J Trauma. 2009; 67:903–909. [PubMed: 19901647]
71. Wiebe DW, Nance ML, Branas CC. Determining objective injury prevention priorities. Inj Prev.2006; 12:347–350. [PubMed: 17018680]
Myers et al. Page 16
Ann Emerg Med. Author manuscript; available in PMC 2014 April 21.
NIH
-PA
Author M
anuscriptN
IH-P
A A
uthor Manuscript
NIH
-PA
Author M
anuscript

Editor’s Capsule Summary
What is already known on this topic
Injury is the leading cause of death in individuals aged 1 to 44 years in the United States,
with higher reported rates of crime and homicide in urban areas.
What question this study addressed
Are there fewer injury-related deaths in non-urban areas?
What this study adds to our knowledge
In this time-series analysis of 1,295,929 injury-related deaths in the United States, overall
injury and vehicular trauma death rates were higher in rural areas. This pattern was not
seen in firearm-related death rates.
How this is relevant to clinical practice
Although not directly relevant to clinical care, these data support improving access to
trauma centers in rural areas, as well as continued violence prevention efforts in all
locales.
Myers et al. Page 17
Ann Emerg Med. Author manuscript; available in PMC 2014 April 21.
NIH
-PA
Author M
anuscriptN
IH-P
A A
uthor Manuscript
NIH
-PA
Author M
anuscript

Figure 1.Decile maps of all US counties of major cities comparing urban-rural continuum, population density and injury death rates.
Myers et al. Page 18
Ann Emerg Med. Author manuscript; available in PMC 2014 April 21.
NIH
-PA
Author M
anuscriptN
IH-P
A A
uthor Manuscript
NIH
-PA
Author M
anuscript

Figure 2.Death rates per 100,000 population across the rural-urban continuum by intent and for the top three mechanisms of injury,
overall and within subgroups by age.
Myers et al. Page 19
Ann Emerg Med. Author manuscript; available in PMC 2014 April 21.
NIH
-PA
Author M
anuscriptN
IH-P
A A
uthor Manuscript
NIH
-PA
Author M
anuscript
NIH
-PA
Author M
anuscriptN
IH-P
A A
uthor Manuscript
NIH
-PA
Author M
anuscript
Myers et al. Page 20
Table 1
Mortality for all types of injuries combined, comparing the most urban and the most rural counties and
separated by age groups.
Age Groups,Years
Most Urban (Deaths/100,000 People)
Most Rural (Deaths/100,000 People)
Unadjusted Rate Ratios(Baseline=Most Urban, 95% CI)
Adjusted RR Injury Death*(Baseline=Most Urban, 95% CI)
0 14 9.49 16.10 1.64 (1.34 2.00)TFT 1.07 (1.06 1.09)
1.23 (1.01 1.50)TFT 1.02 (1.01 1.03)
15 19 45.65 79.53 1.80 (1.54 2.10)TFT 1.06 (1.05 1.07)
1.29 (1.10 1.52)TFT 1.02 (1.01 1.03)
20 44 54.76 96.28 1.82 (1.55 2.14)TFT 1.07 (1.06 1.08)
1.24 (1.07 1.43)TFT 1.02 (1.01 1.02)
45 64 57.66 75.34 1.33 (1.15 1.54)TFT 1.04 (1.04 1.05)
1.12 (0.99 1.27)TFT 1.01 (1.00 1.01)
≥65 53.66 67.95 0.93 (0.79 1.10)TFT 0.99 (0.98 1.00)
1.15 (0.99 1.34)TFT 1.00 (0.99 1.01)
All ages 49.72 73.76 1.54 (1.33 1.78)TFT 1.05 (1.04 1.06)
1.22 (1.07 1.39)TFT 1.01 (1.01 1.02)
TFT, Test for trend across the modified rural urban continuum.
*Adjusted for year, median income, region of the country, and percentage of adults living alone, male subjects, blacks, Latinos, college educated,
and unemployed.
Ann Emerg Med. Author manuscript; available in PMC 2014 April 21.

NIH
-PA
Author M
anuscriptN
IH-P
A A
uthor Manuscript
NIH
-PA
Author M
anuscript
Myers et al. Page 21
Tab
le 2
Adj
uste
d ra
te r
atio
s fo
r al
l inj
ury
deat
h, b
y in
tent
and
for
the
mos
t com
mon
mec
hani
sms
of in
jury
dea
th.
All
Inju
ries
Suic
ide
Una
djus
ted
Red
uced
*F
ull†
TC
‡U
nadj
uste
dR
educ
ed§
Ful
l†
Mos
t urb
an (
0)R
efR
efR
efR
efR
efR
efR
ef
Cod
e 1
0.97
(0.
8 1.
1)1.
11 (
1.0
1.3)
1.12
(1.
0 1.
3)1.
10 (
1.0
1.2)
1.12
(1.
0 1.
3)1.
25 (
1.1
1.4)
1.13
(1.
0 1.
3)
Cod
e 2
1.15
(1.
0 1.
3)1.
12 (
1.0
1.3)
1.12
(1.
0 1.
3)1.
10 (
1.0
1.3)
1.25
(1.
1 1.
4)1.
22 (
1.1
1.4)
1.1
(1.0
1.2
)
Cod
e 3
1.21
(1.
1 1.
4)1.
11 (
1.0
1.3)
1.1
(1.0
1.2
)1.
07 (
0.9
1.2)
1.32
(1.
2 1.
5)1.
22 (
1.1
1.4)
1.08
(1.
0 1.
2)
Cod
e 4
1.15
(1.
0 1.
3)1.
05 (
0.9
1.2)
1.06
(0.
9 1.
2)1.
03 (
0.9
1.2)
1.31
(1.
2 1.
5)1.
19 (
1.1
1.3)
1.07
(1.
0 1.
2)
Cod
e 5
1.28
(1.
1 1.
5)1.
1 (1
.0 1
.3)
1.08
(1.
0 1.
2)1.
06 (
0.9
1.2)
1.36
(1.
2 1.
6)1.
18 (
1.0
1.3)
1.06
(0.
9 1.
2)
Cod
e 6
1.30
(1.
1 1.
5)1.
11 (
1.0
1.3)
1.12
(1.
0 1.
3)1.
10 (
1.0
1.3)
1.36
(1.
2 1.
5)1.
21 (
1.1
1.3)
1.07
(1.
0 1.
2)
Cod
e 7
1.41
(1.
2 1.
6)1.
13 (
1.0
1.3)
1.14
(1.
0 1.
3)1.
11 (
1.0
1.3)
1.49
(1.
3 1.
7)1.
20 (
1.1
1.3)
1.07
(1.
0 1.
2)
Cod
e 8
1.51
(1.
3 1.
8)1.
22 (
1.1
1.4)
1.23
(1.
1 1.
4)1.
21 (
1.0
1.4)
1.56
(1.
4 1.
8)1.
27 (
1.1
1.4)
1.12
(1.
0 1.
3)
Mos
t rur
al (
9)1.
54 (
1.3
1.8)
1.20
(1.
1 1.
4)1.
22 (
1.1
1.4)
1.19
(1.
0 1.
4)1.
55 (
1.4
1.8)
1.20
(1.
1 1.
4)1.
06 (
1.0
1.2)
Hom
icid
eM
otor
Veh
icle
Cra
shes
Fir
earm
Una
djus
ted
Red
uced‖
Ful
l†U
nadj
uste
dR
educ
ed¶
Ful
l†U
nadj
uste
dR
educ
ed#
Ful
l†
Ref
Ref
Ref
Ref
Ref
Ref
Ref
Ref
Ref
0.59
(0.
5 0.
8)0.
70 (
0.6
0.8)
0.70
(0.
6 0.
8)1.
31 (
1.1
1.6)
1.46
(1.
2 1.
7)1.
42 (
1.2
1.7)
0.95
(0.
8 1.
1)0.
98 (
0.9
1.1)
0.98
(0.
9 1.
1)
0.60
(0.
5 0.
8)0.
67 (
0.6
0.8)
0.67
(0.
6 0.
8)1.
69 (
1.4
2.0)
1.55
(1.
3 1.
8)1.
52 (
1.3
1.8)
1.05
(0.
9 1.
2)0.
91 (
0.8
1.0)
0.91
(0.
8 1.
0)
0.53
(0.
4 0.
7)0.
54 (
0.5
0.6)
0.54
(0.
5 0.
6)1.
82 (
1.5
2.2)
1.55
(1.
3 1.
8)1.
51 (
1.3
1.8)
1.07
(0.
9 1.
3)0.
84 (
0.8
0.9)
0.84
(0.
8 0.
9)
0.49
(0.
4 0.
6)0.
50 (
0.4
0.6)
0.50
(0.
4 0.
6)1.
67 (
1.4
2.0)
1.44
(1.
2 1.
7)1.
40 (
1.2
1.7)
1.06
(0.
9 1.
2)0.
82 (
0.7
0.9)
0.82
(0.
7 0.
9)
0.55
(0.
4 0.
7)0.
49 (
0.4
0.6)
0.49
(0.
4 0.
6)1.
75 (
1.4
2.2)
1.42
(1.
2 1.
7)1.
40 (
1.2
1.7)
1.12
(0.
9 1.
3)0.
85 (
0.7
1.0)
0.85
(0.
7 1.
0)
0.51
(0.
4 0.
7)0.
46 (
0.4
0.5)
0.46
(0.
4 0.
5)2.
24 (
1.9
2.7)
1.74
(1.
5 2.
1)1.
69 (
1.4
2.0)
1.21
(1.
0 1.
4)0.
85 (
0.8
1.0)
0.85
(0.
8 1.
0)
0.47
(0.
4 0.
6)0.
43 (
0.4
0.5)
0.43
(0.
4 0.
5)2.
30 (
1.9
2.8)
1.72
(1.
4 2.
0)1.
69 (
1.4
2.0)
1.25
(1.
1 1.
5)0.
86 (
0.8
1.0)
0.85
(0.
8 1.
0)
0.55
(0.
4 0.
7)0.
51 (
0.4
0.6)
0.51
(0.
4 0.
6)2.
81 (
2.3
3.4)
2.15
(1.
8 2.
6)2.
08 (
1.7
2.5)
1.44
(1.
2 1.
7)0.
96 (
0.8
1.1)
0.96
(0.
8 1.
1)
0.43
(0.
3 0.
6)0.
44 (
0.4
0.5)
0.44
(0.
4 0.
5)2.
75 (
2.3
3.3)
2.05
(1.
7 2.
4)2.
00 (
1.7
2.4)
1.38
(1.
2 1.
6)0.
91 (
0.8
1.0)
0.91
(0.
8 1.
0)
* Var
iabl
es in
clud
ed in
red
uced
mod
el: y
ear,
med
ian
inco
me,
per
cent
age
of a
dults
livi
ng a
lone
, reg
ion.
† Var
iabl
es in
clud
ed in
ful
l mod
el: y
ear;
med
ian
inco
me;
reg
ion
of th
e co
untr
y; a
nd p
erce
ntag
e of
adu
lts li
ving
alo
ne, m
ale
subj
ects
, bla
cks,
Lat
inos
, col
lege
edu
cate
d, a
nd u
nem
ploy
ed.
‡ Full
mod
el w
ith th
e ad
ditio
n of
cov
aria
te r
epre
sent
ing
the
tota
l num
ber
of L
evel
I a
nd I
I tr
aum
a le
fts
in th
at c
ount
y an
d su
rrou
ndin
g co
untie
s.
Ann Emerg Med. Author manuscript; available in PMC 2014 April 21.
NIH
-PA
Author M
anuscriptN
IH-P
A A
uthor Manuscript
NIH
-PA
Author M
anuscript
Myers et al. Page 22§ V
aria
bles
incl
uded
in r
educ
ed m
odel
: yea
r; m
edia
n in
com
e; r
egio
n; m
edia
n ag
e; a
nd p
erce
ntag
e of
adu
lts li
ving
alo
ne, m
ale
subj
ects
, and
bla
cks.
‖ Var
iabl
es in
clud
ed in
red
uced
mod
el: y
ear;
med
ian
inco
me;
reg
ion;
and
per
cent
age
of a
dults
livi
ng a
lone
, mal
e su
bjec
ts, b
lack
s, L
atin
os, c
olle
ge e
duca
ted,
and
une
mpl
oyed
(al
l cov
aria
tes
foun
d to
be
impo
rtan
t in
mod
el b
uild
ing
sequ
ence
).
¶ Var
iabl
es in
clud
ed in
red
uced
mod
el: y
ear;
med
ian
inco
me;
reg
ion;
and
per
cent
age
of b
lack
s, L
atin
os, a
nd u
nem
ploy
ed.
# Var
iabl
es in
clud
ed in
red
uced
mod
el: m
edia
n in
com
e; r
egio
n; a
nd p
erce
ntag
e of
adu
lts li
ving
alo
ne, b
lack
s, L
atin
os, a
nd c
olle
ge e
duca
ted.
Ann Emerg Med. Author manuscript; available in PMC 2014 April 21.