safety risk analysis based on a geotechnical instrumentation data warehouse in metro tunnel project
TRANSCRIPT

Automation in Construction xxx (2012) xxx–xxx
AUTCON-01470; No of Pages 10
Contents lists available at SciVerse ScienceDirect
Automation in Construction
j ourna l homepage: www.e lsev ie r .com/ locate /autcon
Safety risk analysis based on a geotechnical instrumentation data warehouse in metrotunnel project
Ling Ma a, Hanbin Luo a,⁎, Huarong Chen b
a Hubei Key Laboratory of Control Structure, Huazhong University of Science & Technology, Wuhan, 430074, Chinab The Administrative Center for China's Agenda21, Beijing, 100038, Beijing, China
⁎ Corresponding author. Tel.: +86 27 87557824; fax:E-mail address: [email protected] (H. Luo).
0926-5805/$ – see front matter. Crown Copyright © 20http://dx.doi.org/10.1016/j.autcon.2012.10.009
Please cite this article as: L. Ma, et al., SafetAutomation in Construction (2012), http://
a b s t r a c t
a r t i c l e i n f oArticle history:Accepted 16 October 2012Available online xxxx
Keywords:Data warehouseTunnelingSafety riskMultidimensional dataGround settlement
Lack of complete information is the major factor causing accidents on metro tunnel projects. Safety risk con-trol requires a comprehensive analysis of instrumentation data integrated with other safety related data.Based on a multidimensional data model, a safety-oriented geotechnical instrumentation data warehouseis established to integrate all the data from heterogeneous data sources, not only for quick retrieval of infor-mation on site, but also for further analysis. As one of the most important safety indicators, ground settlementis analyzed to take advantage of the data warehouse. A double Gaussian model is proposed to represent thesettlement trough over twin tunnels. Moreover, a revised trough width parameter is proposed to representthe scope of safety risk areas. The ground loss is found to grow in a pattern that can be represented by alogistic curve. The first derivative of ground loss is applied to represent the evolution of safety risk.
Crown Copyright © 2012 Published by Elsevier B.V. All rights reserved.
1. Introduction
China is now enjoying a boom in metro construction. However, formost of the cities, there is no previous experience in the constructionof metro tunnels. Some serious failures in tunnel construction haveresulted in fatalities and major property damage. Most of the failuresare attributed to inadequacies in the management of geotechnicalrisks. Consequently, safety management especially for geotechnicalrisk control has become one of the major issues in the metro tunnelprojects.
During a tunnel project, appropriate geotechnical instrumentationshould be installed to monitor the critical parameters required forsafety risk control. These include ground settlement, convergenceof the tunnel, displacements of adjacent facilities caused by the con-struction works, etc. Such processes generate large amounts of data.Additionally, in order to make a more comprehensive analysis, safetymanagement decision making should combine the daily data collec-tion with other relevant information that is scattered amongmultiple,dispersed and fragmented data sources. These may include construc-tion drawings, geological reports, etc.
As a result, it is vital to store all the data in a standard format inorder to facilitate the retrieval of valued information on site and pro-vide contextual meanings for the instrumentation data. This alsohelps to avoid data loss and to accumulate experience for further
+86 27 87558171.
12 Published by Elsevier B.V. All rig
y risk analysis based on a geodx.doi.org/10.1016/j.autcon.2
research. Kim et al. [1] have concluded that the instrumentationdata should be the best ‘text book’ to evaluate the interaction be-tween tunneling and ground settlement which is one of the most im-portant safety indicators.
Suwansawat [12] developed an Earth Pressure Balance (EPB)tunneling database which contained all shield operational records, in-strumentation data and geological information. It was used to identifyfactors which had an impact on ground settlement and showed thecorrelations among these factors. The system was established byimplementing an entity-relationship (ER) data model. However,Corral et al. proved that the dimensional model, commonly used indata warehouse (DW), was much easily understood than the ERmodel [5]. DW was more flexible in information retrieval, and itcould easily integrate various perspectives in data analysis. As a result,one could reduce reliance on IT professionals for data manipulation.
In this paper, a safety-oriented geotechnical instrumentation datawarehouse is built to facilitate the data analysis process for safetydecisions. Some applications of DW in civil engineering are reviewedin Section 2. The multidimensional data model of the proposed DWis discussed in Section 3. The benefit of implementing the DW is dem-onstrated through a multidimensional analysis of ground settlementin Section 4. Finally, the findings of this study are summarized inSection 5.
2. DW in civil engineering
Data warehouse (DW) is a subject-oriented, integrated, nonvola-tile, and time-variant collection of data in support of management
hts reserved.
technical instrumentation data warehouse in metro tunnel project,012.10.009

Fig. 1. Part of the soil profiles of Wuhan Metro Tunnel.
ProspectingBoreholes
IDNameChainageGroundELevationSiteID
SoilProfile
IDProspetingIDSoilIDThincknessElevation
1:N
SoilType
IDNameCharacteristic
N:1
Fig. 2. ER model for soil profiles.
2 L. Ma et al. / Automation in Construction xxx (2012) xxx–xxx
decisions [19]. It supports information processing by providing a solidplatform of consolidated and historical data. Many researchers haveimplemented this superior tool in the field of civil engineering.
Chau et al. [7] developed a Construction Management DecisionSupport System (CMDSS) as a prototype DW integrated informationmanagement system. The CMDSS was designed to separate the anal-ysis database from the operational database, and use conceptual mul-tidimensional data models for dynamic data presentation. As anexample, a typical material inventory application was proposed to fa-cilitate inventory decision making.
Ahmad et al. [3] applied DW technology to a prototype decisionsupport system (DSS) to select an optimal residential housing site.The methodology and data models of the prototype were illustratedin detail. It was concluded that DW, if well incorporated with othersystems, could create powerful analytical tools to support decisionmaking in the selection of construction sites.
Ma et al. [21] explored the utilization of electronic documentsby means of DW. Based on the characteristics of construction docu-ments, a prototype system called EXPLYZER was developed, whichcould extract useful information from accumulated electronic projectdocuments. Then, a case study of payment analysis was carried outfor a construction project. Finally, the applicability of EXPLYZER wasdiscussed.
Rujirayanyong and Shi [18] presented a Project-oriented DW(PDW) for contractors' company-level data facility, providing a robusttool for collecting, storing, and utilizing historical construction projectdata. The quality data available in the PDW could provide useful in-formation for conducting in-depth business analyses or data miningstudies.
Moon et al. [16] developed a Cost Data Management System(CDMS) in a DWenvironment to improve the effectiveness of utilizinghistorical cost data. A probabilitymodelwas established to analyze theDW. The CDMS showed that the DWcould help people understand theuncertainties in construction cost estimation, and provide a methodfor more reliable construction cost budget planning.
Tseng et al. [15] proposed an information model and a systembased on a spatiotemporal DW to help public road authorities lessentraffic disruptions and increase the pavement lifespan and quality. Itshowed that the proposed spatiotemporal DW was beneficial to facil-itating the utility coordination process between public road authori-ties and utility owners.
The above-mentioned practical applications demonstrate the po-tential of DW to provide flexible and efficient analysis on constructionprojects data. Likewise, safety risk control in metro tunnel project alsorequires a comprehensive evaluation of data from diverse sources.Consequently, a safety-oriented DW was established as a superiordata analysis platform in a real life tunnel project.
3. Instrumentation DW for Wuhan Metro Tunnel Project
Wuhan, the capital city of Hubei Province by the Yangtze River inChina, has approximately 8 million inhabitants. Its metro networkhas been scheduled to include 9 urban lines, 3 intercity lines and 309stations, with a total length of about 540 kmand a total construction in-vestment of about 300 billion Yuan. The first 28.9 km line (27 stations),an elevatedmetro, has been in operation. Now, there are three lines (allunderground) under construction simultaneously. Faced with the greatpressure of safety management in metro construction, Wuhan MetroGroup Co., Ltd decided to implement the proposed safety-oriented DW.
3.1. Data acquisition process
The proposed DW executed a recursive collection, extraction andtransformation process for data acquisition by applying a web-baseddata management system.
Please cite this article as: L. Ma, et al., Safety risk analysis based on a geoAutomation in Construction (2012), http://dx.doi.org/10.1016/j.autcon.2
3.1.1. Data collectionThe metro project is divided into dozens of construction sections
and involves a large number of participants including designers, con-tractors, surveyors and resident engineers. They produce large amountof fundamental and specific data for metro construction and are autho-rized to upload the data to the online database in the form of electronicdocuments. The documents include drawings and geological reports ofthe designers, construction schedules from contractors, instrumenta-tion and installation data from surveyors and inspection reports fromresident engineers.
3.1.2. Data extractionThe construction drawings and some textual reports are classified
as unstructured data, which does not have a pre-defined data model.Therefore some implied details are difficult to identify by the comput-er programs automatically. The valuable information involved in thesematerials must be extracted and represented in a structured form.
Consider a typical soil profile whichwas uploadedwith the geolog-ical report, as shown in Fig. 1. The borings (labeledwith Jz-5 and K-62)were drilled one by one along the tunnel alignment to explore thegeological conditions in the tunnel route. The most important infor-mation is the thickness of each soil layer depicted in this drawing.However, computers may not be able to recognize these valuable de-tails. Also electronic drawings increase the difficulty of information re-trieval. Consequently, the information involved in the soil profiles ismanually extracted and uploaded to the online database. The entity-relationship (ER) model of this part of data is shown in Fig. 2.
3.1.3. Data transformationDifferent participants might have different naming conventions
and measurement units in their reports. Therefore, all data had to be
technical instrumentation data warehouse in metro tunnel project,012.10.009

Fig. 3. Part of the instrumentation scheme in Wuhan Metro Tunnel Project.
3L. Ma et al. / Automation in Construction xxx (2012) xxx–xxx
transformed to a naming standard and standardmeasurement units tomaintain consistency.
All three data acquisition processes are executed on the ER model,which lays the foundation for the database management system. It isa data sharing platform for all participants, and the proposed DW sitson top of it. The DW design is based on a multidimensional datamodel which is superior to an ER model in data analysis.
3.2. Multidimensional modeling of the DW
A multidimensional data model is specifically designed to storedata in a way that emphasizes users' understandability and facilitatessuperior data presentation. It is composed of fact tables and dimen-sion tables.
3.2.1. Fact tablesFact tables store physical information to describe a factual event.
In this metro tunnel project, the instrumentation data is consideredin the safety diagnosis of the site and is a good reference for safety de-cisions. Therefore, all the instrumentation data including the groundsettlement, displacement of the tunnel crown, convergence of thetunnel, settlement of the adjacent facilities, etc. are stored as factualdata in different fact tables.
3.2.2. Dimension tablesDimension tables provide context and meanings for the factual data
(i.e. instrumentationdata in the proposedmodel) to facilitate the explo-ration of data frommultiple perspectives. For example, there are at leasttwo important descriptive dimensions for ground settlement which isthe most important instrumentation type:
Table 1Relevant factors of ground settlement considered in recent research works.
Resent research Tunnel geometry Hy
Tunnel depth Tunneldiameter
Getun
Santos and Celestino [10]Neaupane and Adhikari [6] √ √Suwansawat and Einstein [13] √ √Kim et al. [1] √ √ √Shi et al. [4] √
Please cite this article as: L. Ma, et al., Safety risk analysis based on a geoAutomation in Construction (2012), http://dx.doi.org/10.1016/j.autcon.2
First, it is obvious that a temporal dimension can be implementedto explore the time dependent properties of ground settlement, sincethe ground settlement is measured during the construction process.
Second, a spatial dimension can be applied to depict the distributionof ground settlement. The settlement markers are installed in arrays onthe ground surface (a typical instrumentation scheme is shown inFig. 3). Each array depicts the settlement profile (often referred to asthe settlement trough) of its located cross section. Consequently, group-ing the markers by array is adopted as the grouping manner in spatialdimension (i.e.) to evaluate the distribution of ground settlement.
Third and finally, besides the spatio-temporal dimensions, thereremain some context dimensions to evaluate the relevant factors ofground settlement. According to the recent evaluations on the rele-vant factors of ground settlement (as is shown in Table 1), tunnel ge-ometry and hydro-geological conditions are taken as two contextdimensions in the DW.
Part of the proposed multidimensional data model of ground set-tlement is shown in Fig. 4. The primary difference between ER modelin database (as shown in Fig. 2) and multidimensional model in DWis that while the former is designed and optimized to record, the latterhas to be designed and optimized to respond to analysis. The tablestructures in DW are simpler, standardized, and denormalized to re-duce the linkages between tables and the corresponding complexityof queries. Consequently, the DW drastically reduces the ‘cost-per-analysis’ and is more efficient than application database.
4. Implementation of the proposed DW
The most important benefit of the proposed DW is that it facili-tates the analysis of safety indicators to extract potential and usefulpatterns from large amounts of data. Ground settlement is one ofthe most important safety indicators in the proposed DW, because
dro-geological conditions
ology atnel crown
Geology attunnel invert
Groundwaterstate
Ground waterlevel (m)
√√
√ √√
√ √
technical instrumentation data warehouse in metro tunnel project,012.10.009
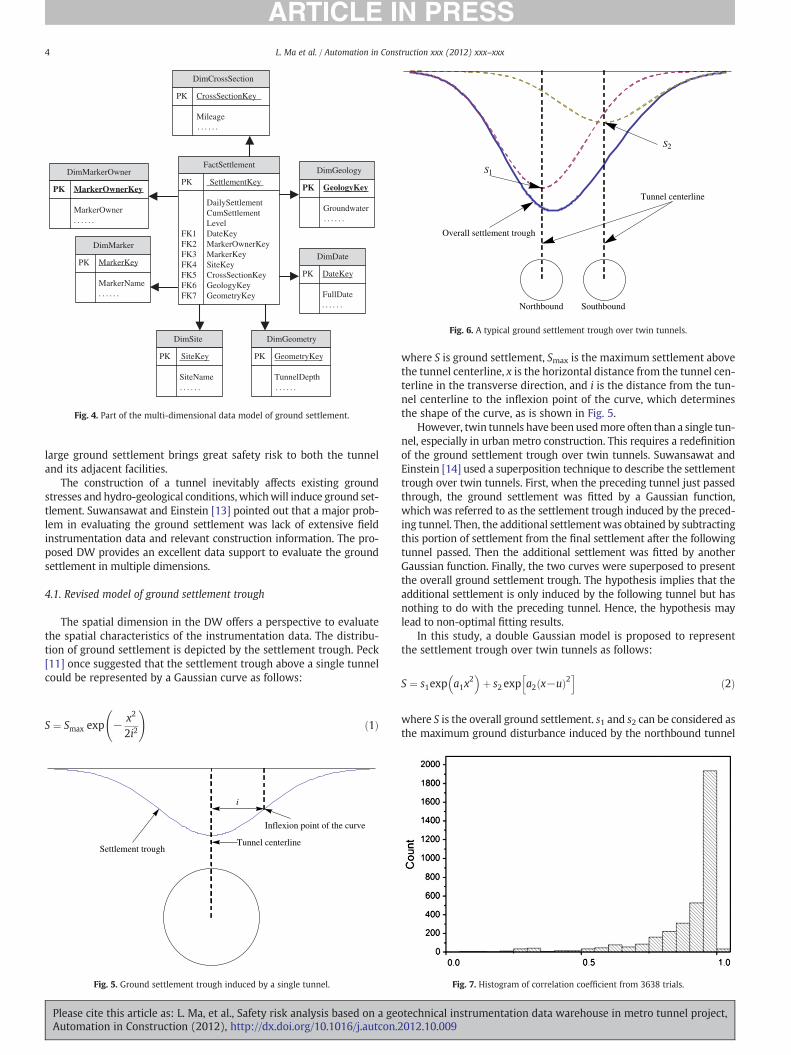
Tunnel centerline
Overall settlement trough
S1
S2
Northbound Southbound
Fig. 6. A typical ground settlement trough over twin tunnels.
DimDate
PK DateKey
FullDate
DimMarker
PK MarkerKey
MarkerName
DimCrossSection
PK CrossSectionKey
Mileage
DimSite
PK SiteKey
SiteName
DimGeometry
PK GeometryKey
TunnelDepth
FactSettlement
PK SettlementKey
DailySettlementCumSettlementLevel
FK1 DateKeyFK2 MarkerOwnerKeyFK3 MarkerKeyFK4 SiteKeyFK5 CrossSectionKeyFK6 GeologyKeyFK7 GeometryKey
DimMarkerOwner
PK MarkerOwnerKey
MarkerOwner. . . . . .
. . . . . .
DimGeology
PK GeologyKey
Groundwater. . . . . .
. . . . . .. . . . . .
. . . . . .. . . . . .
Fig. 4. Part of the multi-dimensional data model of ground settlement.
4 L. Ma et al. / Automation in Construction xxx (2012) xxx–xxx
large ground settlement brings great safety risk to both the tunneland its adjacent facilities.
The construction of a tunnel inevitably affects existing groundstresses and hydro-geological conditions,whichwill induce ground set-tlement. Suwansawat and Einstein [13] pointed out that a major prob-lem in evaluating the ground settlement was lack of extensive fieldinstrumentation data and relevant construction information. The pro-posed DW provides an excellent data support to evaluate the groundsettlement in multiple dimensions.
4.1. Revised model of ground settlement trough
The spatial dimension in the DW offers a perspective to evaluatethe spatial characteristics of the instrumentation data. The distribu-tion of ground settlement is depicted by the settlement trough. Peck[11] once suggested that the settlement trough above a single tunnelcould be represented by a Gaussian curve as follows:
S ¼ Smax exp − x2
2i2
!ð1Þ
i
Inflexion point of the curve
Settlement troughTunnel centerline
Fig. 5. Ground settlement trough induced by a single tunnel.
Please cite this article as: L. Ma, et al., Safety risk analysis based on a geoAutomation in Construction (2012), http://dx.doi.org/10.1016/j.autcon.2
where S is ground settlement, Smax is the maximum settlement abovethe tunnel centerline, x is the horizontal distance from the tunnel cen-terline in the transverse direction, and i is the distance from the tun-nel centerline to the inflexion point of the curve, which determinesthe shape of the curve, as is shown in Fig. 5.
However, twin tunnels have been usedmore often than a single tun-nel, especially in urban metro construction. This requires a redefinitionof the ground settlement trough over twin tunnels. Suwansawat andEinstein [14] used a superposition technique to describe the settlementtrough over twin tunnels. First, when the preceding tunnel just passedthrough, the ground settlement was fitted by a Gaussian function,which was referred to as the settlement trough induced by the preced-ing tunnel. Then, the additional settlementwas obtained by subtractingthis portion of settlement from the final settlement after the followingtunnel passed. Then the additional settlement was fitted by anotherGaussian function. Finally, the two curves were superposed to presentthe overall ground settlement trough. The hypothesis implies that theadditional settlement is only induced by the following tunnel but hasnothing to do with the preceding tunnel. Hence, the hypothesis maylead to non-optimal fitting results.
In this study, a double Gaussian model is proposed to representthe settlement trough over twin tunnels as follows:
S ¼ s1exp a1x2
� �þ s2 exp a2 x−uð Þ2
h ið2Þ
where S is the overall ground settlement. s1 and s2 can be considered asthe maximum ground disturbance induced by the northbound tunnel
Fig. 7. Histogram of correlation coefficient from 3638 trials.
technical instrumentation data warehouse in metro tunnel project,012.10.009

Fig. 10. A typical settlement trough located in DK26+970.
Fig. 8. Box-plot with R of good fitting results.
5L. Ma et al. / Automation in Construction xxx (2012) xxx–xxx
and the southbound tunnel respectively. x is the horizontal distancefrom the northbound tunnel centerline in the transverse direction. a1and a2, as replacements of the original parameter (i.e. i) in Eq. (1), arethe shape parameters of the settlement trough. u, which is alreadyrecorded in the DW, is the distance between the two tunnels. A typicalground settlement trough over twin tunnels is shown in Fig. 6.
While the non-linear single Gaussian model (i.e. Eq. (1)) could beeasily transformed to a linear one by log transformation, the proposeddouble Gaussian model (i.e. Eq. (2)) could not. Consequently, in orderto fit the proposed model to the instrumentation data in the DW, anon-linear least-squares based optimization method (i.e. Levenberg–Marquardt method) is implemented to solve this problem.
According to Eq. (2), the objective function F will be
F ¼Xmj¼1
rj s1; a1; s2; a2ð Þh i2 ð3Þ
where
rj s1; a1; s2; a2ð Þ ¼ s1exp a1xj2
� �þ s2exp a2 xj−u
� �2� �−Sj ð4Þ
Sj is the observed ground settlement at jth settlement marker. Conse-quently, rj(s1,a1,s2,a2) is the deviation of jth data point from the fittedcurve.
r ¼ r1 r2 … rm½ �T ð5Þ
Fig. 9. Box-plot with RMSE of good fitting results.
Please cite this article as: L. Ma, et al., Safety risk analysis based on a geoAutomation in Construction (2012), http://dx.doi.org/10.1016/j.autcon.2
and r is the residual vector of m settlement markers in each groundarray. The Levenberg–Marquardt (LM)method [9] uses a search direc-tion pk to iteratively minimize F and to find an optimum estimation ofthe unknown parameters (i.e. s1, a1, s2 and a2) in Eq. (2). pk is a solu-tion of the linear set of equations as follows:
JkT Jk þ λkI
� �pk ¼ −Jk
TRk ð6Þ
where k is the iteration step and J is the Jacobianmatrix of r as follows:
J ¼ ea1xj2
s1xj2ea1xj
2
ea2 xj−uð Þ2 s2 xj−u� �2
ea2 xj−uð Þ2h ij¼1;2…;m
: ð7Þ
The scalar λk, i.e. damping factor, controls both the magnitude anddirection of pk at each major iteration. If the reduction of F is rapid, asmaller λk can be used, but if an iteration gives insufficient reductionof F, λk can be increased and pk tends to move towards a more steepdescent direction. In this work the initial damping factor λ0 is given as0.001.
4.2. Results from spatial analysis
3638 groups of samples are fitted by LM method in the analysis.The root-mean-square error (RMSE) and correlation coefficient (R) areused to validate the fitting results. Fig. 7 shows the histogram of R.83% of the cases show good fitting results with R>0.8. The RMSE andR of these cases are shown in Figs. 8 and 9. As a result, the proposed dou-ble Gaussian model fit the settlement data well.
DK26+970 is a typical settlement array, as shown in Fig. 3. Actually,due to the interference of the site conditions, only 5 settlementmarkerswere put into use in this ground array, so marker 6 was excluded. Theinstrumentation data, however, could still be fully represented by the
Settlement Marker
Settlement Array
Tunnel face
Moment 1
Northbound
Southbound
Moment 2
Northbound
Southbound
Fig. 11. Two moments depicted in Fig. 10.
technical instrumentation data warehouse in metro tunnel project,012.10.009

Table 2Description of each curve.
Curve Description
A Ground disturbance induced by the following tunnel when the precedingtunnel passed beneath
B Ground disturbance induced by the preceding tunnel when the precedingtunnel passed beneath
C Ground settlement trough over twin tunnels when the preceding tunnelpassed beneath (i.e. A+B)
D Ground disturbance induced by the preceding tunnel when both tunnelspassed through
E Ground disturbance induced by the following tunnel when both tunnelspassed through
F Ground settlement trough over twin tunnels when both tunnels passedthrough (i.e. D+E)
Fig. 13. Trough width parameters of DK25+325.
6 L. Ma et al. / Automation in Construction xxx (2012) xxx–xxx
proposed double Gaussian model, as shown in Fig. 10. Settlement dataof the array at 2 moments (as shown in Fig. 11) was plotted with dif-ferent symbols. Round points indicate the ground settlement recordsat moment 1 when the northbound tunnel (i.e. the preceding tunnel)passed beneath the array whereas square points indicate the groundsettlement records at moment 2 when both tunnels passed throughthe array and the ground stabilized. Each group of data was fitted bythe proposed double Gaussian model (i.e. C and F). According toEq. (2), both the two curves C and F could be decomposed into twoparts to represent the ground disturbance by each tunnel (i.e. C=A+B, F=D+E). Descriptions of each curve are illustrated in Table 2.
As shown in Fig. 10, the northbound tunnel (i.e. the preceding tun-nel) passed under the ground array first, while the southbound tunnel(i.e. the following tunnel) was far away the array. However, the exca-vation of southbound tunnel had still made a small disturbance to theground (i.e. A). When the southbound tunnel also passed through theground array and the ground became stabilized, the ground distur-bance induced by the southbound tunnel had sharply increased fromA to E. Moreover, at this moment, although the northbound tunnelhad passed through for a time, it still enlarged the ground disturbancefrom B to D. Finally, D and E made up the overall ground settlementtrough over twin tunnels (i.e. F).
Some other results are shown in Fig. 12. In the Wuhan Metro Pro-ject, in order to speed up the construction progress, the twin tunnels
Fig. 12. Part of the settlement troughs
Please cite this article as: L. Ma, et al., Safety risk analysis based on a geoAutomation in Construction (2012), http://dx.doi.org/10.1016/j.autcon.2
were divided into several parts by tunnel shafts along the tunnel align-ment. Independent construction procedures were progressed foreach part. DK25+067, DK25+092 and DK26+940 were located ata part where the southbound tunnel was the preceding tunnel, where-as DK25+142 was located, like DK26+970, at a part where thenorthbound tunnel was the preceding tunnel.
It can be concluded that although there is a significant enlargementof ground settlementwhen the tunnel is passing beneath (i.e. B and E–A), both the pre-settlement (i.e. A) and the post-settlement (i.e. D–B)still exist, deserving due attention. This finding can be regarded asthe main difference between Suwansawat and Einstein' work [14]and this study. Their simplified method implied that they omittedthe pre-settlement of the following tunnel, i.e. A, and used B directlyto represent C. Moreover, they considered that the overall additionalsettlement was only induced by the following tunnel. As a result, thesettlement of the preceding tunnel, i.e. (D–B), was also omitted. This
derived from the proposed DW.
technical instrumentation data warehouse in metro tunnel project,012.10.009

7L. Ma et al. / Automation in Construction xxx (2012) xxx–xxx
may lead to a narrower ground settlement trough and underestima-tion of the amount of ground settlement.
4.3. Scoping of the safety risk areas
By directly fitting the datawith the proposed double peak Gaussianmodel, the ground disturbance induced by each tunnel could be moreexactly represented. Recalling Eq. (1) the characteristics of Gaussiancurve, i is a vital parameter which determines the flatness of thecurve. The larger the value of i, the wider the settlement trough onthe ground. Therefore, the former is also defined as a troughwidth pa-rameter. Considering the twin tunnels, i for each tunnel could also be
Fig. 14. Time variations of tr
Please cite this article as: L. Ma, et al., Safety risk analysis based on a geoAutomation in Construction (2012), http://dx.doi.org/10.1016/j.autcon.2
derived from Eq. (2) as follows:
i1 ¼ 1=ffiffiffiffiffiffiffiffi2a1
pand i2 ¼ 1=
ffiffiffiffiffiffiffiffi2a2
p: ð8Þ
With a view to the overlap of ground disturbance of the twin tun-nels (as shown in Fig. 13), a more comprehensive trough width pa-rameter (i.e. ī) for twin tunnels is proposed as follows:
�i ¼ i1 þ i2 þ uð Þ=2: ð9Þ
The proposed ī is considered to be a measurement of the scope ofsafety risk areas, since most of the ground settlement happened
ough with parameters.
technical instrumentation data warehouse in metro tunnel project,012.10.009

Fig. 15. A typical soil profile in Wuhan Metro Project.
8 L. Ma et al. / Automation in Construction xxx (2012) xxx–xxx
within the distance of 3ī on each cross-section above the twin tun-nels. And the area within the distance of ī deserves the most safety at-tention. Consequently, the derived factor from the DW wasimplemented in the safety decisions on the Wuhan Metro Project.
By combining the spatial analysis with temporal dimension, theproposed safety-oriented DW facilitates the evaluation of the evolv-ing scope of risk. As shown in Fig. 14, the time variations of all thetrough width parameters (i.e. i1, i2 and ī) are investigated. All theparameters are listed by normalized time t (a value from 0 through1). Different symbols stand for different ground arrays. Because differ-ent ground arrays are not in use or are notmonitored at the same time,the normalized timemakes the comparisonmore convenient. In addi-tion, since the ground array is put into service before the precedingtunnel passes beneath it and goes out of monitoring after both tunnelspass under the array and the ground has stabilized, the normalizedtime can also illustrate the whole tunneling process around eacharray. Consequently, the results can also reflect the relationship be-tween trough width parameters and the tunneling process.
As shown in Fig. 14, during the tunneling process, there is littlechange in the width of overall settlement trough and that of each tun-nel, but the settlement trough has been enlarged indeed, as shownin Figs. 10 and 12. Therefore, the width of settlement trough may bemainly determined by some time-invariant factors like the geologicalconditions (i.e. soil condition, ground water table, etc.). Also, thetunneling process of each tunnel only deepens the settlement trough,but does not widen it notably.
This finding also implies that ī can only be regarded as a measure-ment of static risk. Although a good control of tunneling process maybe helpful in reducing the ground settlement in a certain area, thescope of the influenced area may be predetermined by the geologicalconditions or some other objective conditions.
Some researchers discussed the factors affecting the width of set-tlement trough. Based on detailed instrumentation data, Mahmutoglu,Y [20] reported that the variations in the settlement trough are relatedto the soil type and the thickness of the tunnel's overburden. Ac-cording to the Gaussian model of a single tunnel, O'Reilly and New[8] made an analysis of case history data and proposed the formula
i ¼ kz ð10Þ
where i is the troughwidth parameter, k is an empirical constant relat-ed to the soil type, and z is tunnel depth, i.e. the vertical distance fromground surface to the tunnel centerline.
Considering the twin tunnels, Suwansawat and Einstein [14]found that the trough width parameter i, which is obtained fromthe additional settlement trough over the following tunnel, was inagreement with O'Reilly and New's work [8]. It found that the empir-ical constant k falls within the bound of 0.4 and 0.5, which was similarto most cases of tunneling projects in clay layers.
Chi, S.Y et al. [17] also summarized the relationship betweentrough width i and tunnel depth z by using the angle of the influencezone of ground settlement (i.e. β) as follows:
tan βð Þ ¼ 2i=z: ð11Þ
By combining Eq. (10) with Eq. (11), we can easily derive thefollowing:
k ¼ tan βð ÞÞ=2: ð12Þ
Table 3Suggested value of k.
Type of soil k
Sandy layers 0.3–0.5Clayey soils 0.5Rock and hard clays 0.1
Please cite this article as: L. Ma, et al., Safety risk analysis based on a geoAutomation in Construction (2012), http://dx.doi.org/10.1016/j.autcon.2
Based on the results of back-analysis by using the monitoring dataof the Taipei Rapid Transit System, Chi, S.Y et al. [17] reported the factthat β=45° for tunneling in clay, while β ranges between 30° and 45°for sandy layers. Moreover, E.J. Cording and W.H. Hansmire [2]suggested that β=11° for rock and hard clays. Consequently,according to Eq. (12), we can get some useful suggestions about thevalue of k, as shown in Table 3.
However, in a real tunnel project, the soil layers in the profile maynot be uniform. The geological conditions inWuhanMetro Project aremore complex. The context dimensions in the DW facilitate the com-bination of spatial analysis results with the structured description ofgeological information. According to the extracted data from geolog-ical reports, the overburden of the tunnel can be mainly dividedinto 3 layers, i.e. fill, clay and rock, as is shown in Fig. 15.
When looking at the soil layers above the tunnel centerline, thethicknesses of soil layers vary from one another at different cross-sections of the tunnel along the tunnel alignment. Apart from this,the influences of these different soil types on the trough width pa-rameter vary significantly (as shown in Table 3). Consequently, theconventional tunnel depth z, i.e. the vertical distance from groundsurface to the tunnel centerline, is redefined as �z, which reflects thecomprehensive influence of the overburden of different soil layerson the trough width. The formula can be expressed as follows:
�z ¼ ∑kjδj ð13Þ
where δj is the thickness of the jth soil layer and kj is the empiricalconstant related to this soil type. In this study, 0.3, 0.5 and 0.1 are cho-sen as the values of kj for fill, clay and rock respectively.
Trough width parameter ī derived from 24 stabilized troughs areshown in Fig. 16 to represent the relationship between ī and �z.Round points indicate that there is no confined water around the
Fig. 16. Relationship between ī and �z .
technical instrumentation data warehouse in metro tunnel project,012.10.009
0.2
0.4
0.6
0.8
a First derivative of Ground loss
9L. Ma et al. / Automation in Construction xxx (2012) xxx–xxx
settlement trough whereas square points indicate that there is con-fined water. It can be concluded that when the revised tunnel depth�z tends to be deeper, the trough width parameter, namely, the radiusof the risk scope, tends to be wider. Moreover, confined water seemsto centralize the safety risk scope around its location by decreasingthe trough width parameter. Consequently, the confined water is con-sidered as an unfavorable geological condition in Wuhan Metro Pro-ject. However, this finding was not considered in former researchworks.
Furthermore, the proposed trough width parameter (i.e. ī) cannotcomprehensively reflect the degree of safety risk as it can only repre-sent the influenced scope of the ground. Because the settlementtrough could still be very shallow sometimeswhen ī tends to be a larg-er value, the degree of safety risk tends to be minor. Consequently, amore comprehensive parameter should be introduced to representboth the depth and width of the settlement trough.
4.4. Evolution of safety risk degree
In the proposed DW, ground loss Vl was introduced to solve theabove-mentioned problem. It is defined as the integral of the groundsettlement trough.
Vl ¼ ∫x¼∞
x¼−∞s1exp a1x
2� �
þ s2exp a2 x−uð Þ½ �2
¼ffiffiffiffiffiffi2π
pði1s1 þ i2s2Þ
ð14Þ
where, i1 and i2 are the trough width parameters of the two tunnels re-spectively (i1 ¼ 1=
ffiffiffiffiffiffiffiffi2a1
p, i2 ¼ 1=
ffiffiffiffiffiffiffiffi2a2
p). It'sworth noting thatmeter (m)
is used as the unit of i1 and i2, and millimeter (mm) for s1 and s2. There-fore, the integral results should be divided by 1000 to get the unit of m2.
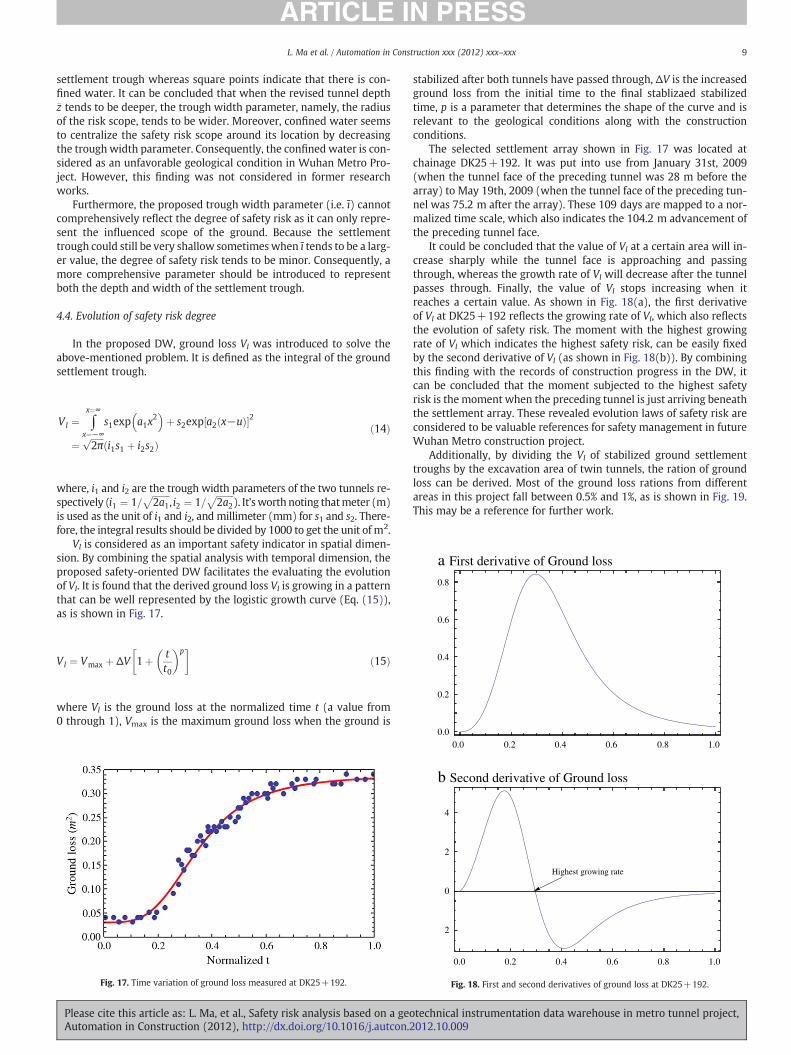
Vl is considered as an important safety indicator in spatial dimen-sion. By combining the spatial analysis with temporal dimension, theproposed safety-oriented DW facilitates the evaluating the evolutionof Vl. It is found that the derived ground loss Vl is growing in a patternthat can be well represented by the logistic growth curve (Eq. (15)),as is shown in Fig. 17.
Vl ¼ Vmax þ ΔV 1þ tt0
� �p� �ð15Þ
where Vl is the ground loss at the normalized time t (a value from0 through 1), Vmax is the maximum ground loss when the ground is
Fig. 17. Time variation of ground loss measured at DK25+192.
Please cite this article as: L. Ma, et al., Safety risk analysis based on a geoAutomation in Construction (2012), http://dx.doi.org/10.1016/j.autcon.2
stabilized after both tunnels have passed through, ΔV is the increasedground loss from the initial time to the final stablizaed stabilizedtime, p is a parameter that determines the shape of the curve and isrelevant to the geological conditions along with the constructionconditions.
The selected settlement array shown in Fig. 17 was located atchainage DK25+192. It was put into use from January 31st, 2009(when the tunnel face of the preceding tunnel was 28 m before thearray) to May 19th, 2009 (when the tunnel face of the preceding tun-nel was 75.2 m after the array). These 109 days are mapped to a nor-malized time scale, which also indicates the 104.2 m advancement ofthe preceding tunnel face.
It could be concluded that the value of Vl at a certain area will in-crease sharply while the tunnel face is approaching and passingthrough, whereas the growth rate of Vl will decrease after the tunnelpasses through. Finally, the value of Vl stops increasing when itreaches a certain value. As shown in Fig. 18(a), the first derivativeof Vl at DK25+192 reflects the growing rate of Vl, which also reflectsthe evolution of safety risk. The moment with the highest growingrate of Vl which indicates the highest safety risk, can be easily fixedby the second derivative of Vl (as shown in Fig. 18(b)). By combiningthis finding with the records of construction progress in the DW, itcan be concluded that the moment subjected to the highest safetyrisk is the moment when the preceding tunnel is just arriving beneaththe settlement array. These revealed evolution laws of safety risk areconsidered to be valuable references for safety management in futureWuhan Metro construction project.
Additionally, by dividing the Vl of stabilized ground settlementtroughs by the excavation area of twin tunnels, the ration of groundloss can be derived. Most of the ground loss rations from differentareas in this project fall between 0.5% and 1%, as is shown in Fig. 19.This may be a reference for further work.
0.0 0.2 0.4 0.6 0.8 1.00.0
Highest growing rate
0.0 0.2 0.4 0.6 0.8 1.0
2
0
2
4
b Second derivative of Ground loss
Fig. 18. First and second derivatives of ground loss at DK25+192.
technical instrumentation data warehouse in metro tunnel project,012.10.009

0.0
0.2
0.4
0.6
0.8
1.0
1.2
1.4
Rat
io o
f gro
und
loss
Fig. 19. Ratio of ground loss in Wuhan Metro Project.
10 L. Ma et al. / Automation in Construction xxx (2012) xxx–xxx
5. Conclusion
The difficulties in safety risk control for metro tunnel constructionprojects fall mainly into two categories:
1) Lack of construction experience2) Lack of complete information of the site
Amultidimensional data model, which includes spatio-temporal di-mensions and context dimensions, is proposed to establish a safety-orientedDW. TheDWfacilitates the information retrieval and safety de-cisions on the basis of large amounts of data. Since large scale metrotunnel construction will continue for a long time in China, the valuableknowledge derived from the DWwill be good references for the futureconstruction projects. The benefits of the proposedDWare demonstrat-ed through a multidimensional analysis of ground settlement. Someother interesting findings are drawn from this study:
1) The proposed double Gaussian model well represents the groundsettlement trough over twin tunnels. 83% of the cases show goodfitting results with R>0.8.
2) The redefined trough width parameter, which is derived from theproposed double Gaussian model, can be considered as a measure-ment of static risk. Since the trough width parameter is almosttime-invariant, it was discovered that the tunneling process ofeach tunnel mainly deepens, but does not significantly widen thesettlement trough. The relationship between the trough widthand geological conditions is also discussed in this paper. The find-ing can be of great help in estimating the scope of safety risk.More-over, since it exerts a negative centralized impact on groundsettlement, confined water is considered to be an unfavorable geo-logical condition.
3) As a more comprehensive parameter that reflects the safety risk,the derived ground loss was used to represent both the depthand width of the settlement trough over twin tunnels. The logisticgrowth curve can be applied to well represent the growth ofground loss over time. The first derivative of ground loss showsthe evolution laws of safety risk while the second derivative ofground loss helps identify the moment with the highest safety
Please cite this article as: L. Ma, et al., Safety risk analysis based on a geoAutomation in Construction (2012), http://dx.doi.org/10.1016/j.autcon.2
risk. It is found that the moment the tunnel reaches beneath a cer-tain point deserves the greatest attention to safety in the nearbyarea, which accords with our common knowledge. Additionally,we may also regard the second derivative of ground loss as a safe-ty warning index when it fails to reach 0 after the tunnel passesthrough.
The spatio distribution and time-dependent characteristic of groundsettlement are investigated in this study. Futureworkwill focus on eval-uation and exploration of the impact of construction and geological con-ditions on the changing regularity of ground settlement, since this studyhas demonstrated that soil properties have some impact on the troughwidth parameter.
References
[1] C.Y. Kim, G.J. Bae, S.W. Hong, C.H. Park, H.K. Moon, H.S. Shin, Neural networkbased prediction of ground surface settlements due to tunnelling, Computersand Geotechnics 28 (6–7) (2001) 517–547.
[2] E.J. Cording, W.H. Hansmire, Displacement around soft ground tunnels, GeneralReport: Session IV, Tunnels in soil, Proceedings of 5th Pan American Conferenceon Soil Mechanics and Foundation Engineering, 1975.
[3] I. Ahmad, S. Azhar, P. Lukauskis, Development of a decision support system usingdata warehousing to assist builders/developers in site selection, Automation inConstruction 13 (4) (2004) 525–542.
[4] J.S. Shi, J. Ortigao, J.L. Bai, Modular neural networks for predicting settlements dur-ing tunneling, Journal of Geotechnical and Geoenvironmental Engineering 124 (5)(1998) 389–395.
[5] K. Corral, D. Schuff, R. Louis, The impact of alternative diagrams on the accuracy ofrecall: a comparison of star–schema diagrams and entity–relationship diagrams,Decision Support Systems 42 (1) (2006) 450–468.
[6] K.M. Neaupane, N.R. Adhikari, Prediction of tunneling-induced ground movementwith the multi-layer perceptron, Tunnelling and Underground Space Technology2 (2006) 151–159.
[7] K.W. Chau, Y. Cao, M. Anson, J.P. Zhang, Application of data warehouse and Deci-sion Support System in construction management, Automation in Construction12 (2) (2003) 213–224.
[8] M.P. O'Reilly, B.M. New, Settlements above tunnels in the United Kingdom, theirmagnitude and prediction, in: Proc. Tunnelling '82, Inst of Mining & Metallurgy,Brighton, 1982, pp. 173–181.
[9] N. Jorge, S.J. Wright, Numerical Optimization, second ed. Springer Verlag, Berlin,Heidelberg, New York, 2006.
[10] O.J. Santos, T.B. Celestino, Artificial neural networks analysis of Sao Paulo subwaytunnel settlement data, Tunnelling and Underground Space Technology 23 (5)(2008) 481–491.
[11] R.B. Peck, Deep excavations and tunnelling in soft ground, in: Proc.7th Interna-tional Conference on Soil Mechanics and Foundation Engineering, Mexico City,1969, pp. 225–290.
[12] S. Suwansawat, Shield tunneling databasemanagement for groundmovement eval-uation, Tunnelling and Underground Space Technology 19 (4–5) (2004) 376–377.
[13] S. Suwansawat, H.H. Einstein, Artificial neural networks for predicting the maxi-mum surface settlement caused by EPB shield tunneling, Tunnelling and Under-ground Space Technology 21 (2) (2006) 133–150.
[14] S. Suwansawat, H.H. Einstein, Describing settlement troughs over twin tunnelsusing a superposition technique, Journal of Geotechnical and GeoenvironmentalEngineering 133 (4) (2007) 445–468.
[15] S. Tseng, C. Chou, T. Ho, C. Lin, T. Chen, A spatiotemporal database approach to themanagement of utility work schedules in transportation projects, Automation inConstruction 20 (6) (2011) 729–739.
[16] S.W. Moon, J.S. Kim, K.N. Kwon, Effectiveness of OLAP-based cost data managementin construction cost estimate, Automation in Construction 16 (3) (2007) 336–344.
[17] S.Y. Chi, J.C. Chern, C.C. Lin, Optimized back-analysis for tunneling-inducedground movement using equivalent ground loss model, Tunnelling and Under-ground Space Technology 16 (3) (2001) 159–165.
[18] T. Rujirayanyong, J.J. Shi, A project-oriented data warehouse for construction,Automation in Construction 15 (6) (2006) 800–807.
[19] W.H. Inmon, Building the Data Warehouse, in: Wiley, New York, 1992.[20] Y. Mahmutoglu, Surface subsidence induced by twin subway tunnelling in soft
ground conditions in Istanbul, Bulletin of Engineering Geology and the Environ-ment 70 (1) (2011) 115–131.
[21] Z.L. Ma, K.D. Wong, L. Heng, Y. Jun, Utilizing exchanged documents in construc-tion projects for decision support based on data warehousing technique, Automa-tion in Construction 14 (3Sp. Iss. SI) (2005) 405–412.
technical instrumentation data warehouse in metro tunnel project,012.10.009