safety evaluation of certain food additives and - ipcs inchem
TRANSCRIPT

Safety evaluation ofcertain food additivesand contaminants
Prepared by theSeventy-third meeting of the Joint FAO/WHO Expert Committee on Food Additives(JECFA)
WHO FOODADDITIVESSERIES: 64
World Health Organization, Geneva, 2011

WHO Library Cataloguing-in-Publication Data
Safety evaluation of certain food additives and contaminants / prepared by the seventy-thirdmeeting of the Joint FAO/WHO Expert Committee on Food Additives (JECFA).
(WHO food additives series ; 64)
1.Food additives - toxicity. 2.Food contamination. 3.Flavoring agents - analysis.4.Flavoring agents - toxicity. 5.Risk assessment. I.Joint FAO/WHO Expert Committeeon Food Additives. Meeting (73rd : 2010: Geneva, Switzerland). II.World HealthOrganization. III.Series.
ISBN 978 924 166064 8 (NLM classification: WA 712)ISSN 0300-0923
© World Health Organization 2011
All rights reserved. Publications of the World Health Organization can be obtained fromWHO Press, World Health Organization, 20 Avenue Appia, 1211 Geneva 27, Switzerland(tel.: +41 22 791 3264; fax: +41 22 791 4857; e-mail: [email protected]). Requestsfor permission to reproduce or translate WHO publications—whether for sale or for non-commercial distribution—should be addressed to WHO Press at the above address(fax: +41 22 791 4806; e-mail: [email protected]).
The designations employed and the presentation of the material in this publication donot imply the expression of any opinion whatsoever on the part of the World HealthOrganization concerning the legal status of any country, territory, city or area or of itsauthorities, or concerning the delimitation of its frontiers or boundaries. Dotted lines onmaps represent approximate border lines for which there may not yet be full agreement.
The mention of specific companies or of certain manufacturers’ products does not implythat they are endorsed or recommended by the World Health Organization in preferenceto others of a similar nature that are not mentioned. Errors and omissions excepted, thenames of proprietary products are distinguished by initial capital letters.
All reasonable precautions have been taken by the World Health Organization to verifythe information contained in this publication. However, the published material is beingdistributed without warranty of any kind, either express or implied. The responsibility forthe interpretation and use of the material lies with the reader. In no event shall the WorldHealth Organization be liable for damages arising from its use.
This publication contains the collective views of an international group of experts anddoes not necessarily represent the decisions or the policies of the World HealthOrganization.
Typeset in IndiaPrinted in India

CONTENTS
Preface ...................................................................................................................
Safety evaluations of groups of related flavouring agentsIntroduction ......................................................................................................Alicyclic ketones, secondary alcohols and related esters (addendum) ...........Alicyclic primary alcohols, aldehydes, acids and related esters
(addendum) ..................................................................................................Aliphatic acyclic and alicyclic -diketones and related -hydroxyketones
(addendum) ..................................................................................................Aliphatic acyclic and alicyclic terpenoid tertiary alcohols and structurally related
substances (addendum) ...............................................................................Aliphatic and aromatic amines and amides (addendum) .................................Aromatic substituted secondary alcohols, ketones and related esters
(addendum) ..................................................................................................Benzyl derivatives (addendum) .......................................................................Phenol and phenol derivatives (addendum) ....................................................Simple aliphatic and aromatic sulfides and thiols (addendum) ........................
ContaminantsCadmium (addendum) .....................................................................................Lead (addendum) ............................................................................................
AnnexesAnnex 1 Reports and other documents resulting from previous meetings of
the Joint FAO/WHO Expert Committee on Food Additives ............Annex 2 Abbreviations used in the monographs ..........................................Annex 3 Participants in the seventy-third meeting of the Joint FAO/WHO
Expert Committee on Food Additives .............................................Annex 4 Tolerable intakes, other toxicological information and information
on specifications .............................................................................Annex 5 Summary of the safety evaluation of secondary components
for flavouring agents with minimum assay values of less than 95% .........................................................................................
iv
37
41
69
91119
157189207255
305381
501513
517
521
535
- iii -


PREFACE
The monographs contained in this volume were prepared at the seventy-thirdmeeting of the Joint Food and Agriculture Organization of the United Nations (FAO)/World Health Organization (WHO) Expert Committee on Food Additives (JECFA),which met at WHO headquarters in Geneva, Switzerland, on 8–17 June 2010.These monographs summarize the data on selected food additives (flavouringagents) and contaminants reviewed by the Committee.
The seventy-third report of JECFA has been published by the World HealthOrganization as WHO Technical Report No. 960. Reports and other documentsresulting from previous meetings of JECFA are listed in Annex 1. The participantsin the meeting are listed in Annex 3 of the present publication.
JECFA serves as a scientific advisory body to FAO, WHO, their Member Statesand the Codex Alimentarius Commission, primarily through the Codex Committeeon Food Additives, the Codex Committee on Contaminants in Food and the CodexCommittee on Residues of Veterinary Drugs in Foods, regarding the safety of foodadditives, residues of veterinary drugs, naturally occurring toxicants and contami-nants in food. Committees accomplish this task by preparing reports of theirmeetings and publishing specifications or residue monographs and toxicologicalmonographs, such as those contained in this volume, on substances that they haveconsidered.
The monographs contained in this volume are based on working papers thatwere prepared by temporary advisers. A special acknowledgement is given at thebeginning of each monograph to those who prepared these working papers. Themonographs were edited by M. Sheffer, Ottawa, Canada.
The designations employed and the presentation of the material in thispublication do not imply the expression of any opinion whatsoever on the part of theorganizations participating in WHO concerning the legal status of any country,territory, city or area or its authorities, or concerning the delimitation of its frontiersor boundaries. The mention of specific companies or of certain manufacturers’products does not imply that they are endorsed or recommended by theorganizations in preference to others of a similar nature that are not mentioned.
Any comments or new information on the biological or toxicological propertiesof the compounds evaluated in this publication should be addressed to: Joint WHOSecretary of the Joint FAO/WHO Expert Committee on Food Additives, Departmentof Food Safety and Zoonoses, World Health Organization, 20 Avenue Appia, 1211Geneva 27, Switzerland.
- v -


SAFETY EVALUATIONS OF GROUPS OF RELATEDFLAVOURING AGENTS


INTRODUCTION
Assignment to structural class
Twelve groups of flavouring agents were evaluated using the Procedure forthe Safety Evaluation of Flavouring Agents as outlined in Figure 1 (Annex 1,references 116, 122, 131, 137, 143, 149, 154, 160, 166, 173 and 178). In applyingthe Procedure, the chemical is first assigned to a structural class as identified bythe Committee at its forty-sixth meeting (Annex 1, reference 122). The structuralclasses are as follows:
• Class I. Flavouring agents that have simple chemical structures and efficientmodes of metabolism that would suggest a low order of toxicity by the oral route.
• Class II. Flavouring agents that have structural features that are less innocuousthan those of substances in class I but are not suggestive of toxicity. Substancesin this class may contain reactive functional groups.
• Class III. Flavouring agents that have structural features that permit no stronginitial presumption of safety or may even suggest significant toxicity.
A key element of the Procedure involves determining whether a flavouringagent and the product(s) of its metabolism are innocuous and/or endogenoussubstances. For the purpose of the evaluations, the Committee used the followingdefinitions, adapted from the report of its forty-sixth meeting (Annex 1, reference122):
• Innocuous metabolic products are defined as products that are known or readilypredicted to be harmless to humans at the estimated dietary exposure to theflavouring agent.
• Endogenous substances are intermediary metabolites normally present inhuman tissues and fluids, whether free or conjugated; hormones and othersubstances with biochemical or physiological regulatory functions are notincluded. The estimated dietary exposure to a flavouring agent that is, or ismetabolized to, an endogenous substance should be judged not to give rise toperturbations outside the physiological range.
Assessment of dietary exposure
MSDI (maximized survey-derived intake)
Estimates of the dietary exposure to flavouring agents by populations arebased on annual volumes of production. These data were derived from surveys inEurope, Japan and the United States of America (USA). Manufacturers wererequested to exclude use of flavouring agents in pharmaceutical, tobacco orcosmetic products when compiling these data. When using these productionvolumes to estimate dietary exposures, a correction factor of 0.8 is applied toaccount for under-reporting.
MSDI (μg/day) = annual volume of production (kg) × 109 (μg/kg) population of consumers × 0.8 × 365 days
- 3 -

Figu
re 1
. Pro
cedu
re fo
r th
e S
afet
y E
valu
atio
n of
Fla
vour
ing
Age
nts
1. D
eter
min
e st
ruct
ural
cla
ss
A3.
Do
the
cond
ition
s of u
se re
sult
in a
n
i
ntak
e gr
eate
r tha
n th
e th
resh
old
of
c
once
rn fo
r the
stru
ctur
al c
lass
?
B3.
Do
the
cond
ition
s of u
se re
sult
in a
n
i
ntak
e gr
eate
r tha
n th
e th
resh
old
of
c
once
rn fo
r the
stru
ctur
al c
lass
?
A4.
Is t
he su
bsta
nce
or a
re it
s
m
etab
olite
s end
ogen
ous?
B4.
Doe
s a N
OEL
exi
st fo
r the
subs
tanc
e th
at
p
rovi
des a
n ad
equa
te m
argi
n of
safe
ty u
nder
con
ditio
ns o
f int
ende
d us
e, o
r doe
s a N
OEL
exi
st fo
r stru
ctur
ally
rela
ted
subs
tanc
es th
at
i
s hig
h en
ough
to a
ccom
mod
ate
any
perc
eive
d
d
iffer
ence
in to
xici
ty b
etw
een
the
subs
tanc
e
a
nd th
e re
late
d su
bsta
nce?
A5.
Doe
s a N
OEL
exi
st fo
r the
subs
tanc
e
t
hat p
rovi
des a
n ad
equa
te m
argi
n of
saf
ety
unde
r con
ditio
ns o
f int
ende
d us
e,
o
r doe
s a N
OEL
exi
st fo
r stru
ctur
ally
rel
ated
subs
tanc
es th
at is
hig
h en
ough
to
acco
mm
odat
e an
y pe
rcei
ved
diff
eren
ce
i
n to
xici
ty b
etw
een
the
subs
tanc
e an
d th
e
r
elat
ed su
bsta
nces
?B
5. D
o th
e co
nditi
ons o
f use
resu
lt in
an
int
ake
grea
ter t
han
1.5
μg/d
ay?
2. C
an th
e su
bsta
nce
be p
redi
cted
to b
e m
etab
oliz
ed to
inno
cuou
s pro
duct
s?
A B
Yes
No
Yes
No
No
No
Subs
tanc
e w
ould
not
be e
xpec
ted
to b
e of
safe
ty c
once
rn
Subs
tanc
e w
ould
not
be e
xpec
ted
to b
e of
safe
ty c
once
rn
Dat
a m
ust b
e av
aila
ble
onth
e su
bsta
nce
or a
clo
sely
rela
ted
subs
tanc
e in
ord
erto
per
form
a sa
fety
eval
uatio
n
Yes
No
Yes
Subs
tanc
e w
ould
not
be e
xpec
ted
to b
e of
safe
ty c
once
rnN
oY
es
Addi
tiona
l dat
a re
quir
ed
No
4 INTRODUCTION

The population of consumers was assumed to be 32 × 106 in Europe,13 × 106 in Japan and 28 × 106 in the USA.
SPET (single portion exposure technique)
The SPET was developed by the Committee at its sixty-seventh meeting(Annex 1, reference 184) to account for presumed patterns of consumer behaviourwith respect to food consumption and the possible uneven distribution of dietaryexposures among consumers of foods containing flavouring agents. It is based onreported use levels supplied by the industry. This single portion–derived estimatewas designed to account for individuals’ brand loyalty to food products and for nicheproducts that would be expected to be consumed by only a small proportion of thepopulation. Its use in the Procedure was endorsed at the sixty-ninth meeting of theCommittee (Annex 1, reference 190) to render the safety assessment more robust,replacing the sole use of MSDI estimates with the higher of the highest MSDI or theSPET estimate as the exposure estimate in the decision-tree. The Committee alsoagreed that it would not be necessary to re-evaluate flavouring agents that hadalready been assessed previously using the Procedure.
The SPET provides an estimate of dietary exposure for an individual whoconsumes a specific food product containing the flavouring agent every day. TheSPET combines an average (or usual) added use level provided by the flavourindustry with a standard portion size from 75 predefined food categories asdescribed by the Committee at its sixty-seventh meeting. The standard portion istaken to represent the mean food consumption for consumers of these foodcategories. Among all the food categories with a reported use level, the calculateddietary exposure from the single food category leading to the highest dietaryexposure from one portion is taken as the SPET estimate.
SPET (μg/day) = standard portion size of food category i (g/day) × uselevel for food category i (μg/g)
The highest result is used in the evaluation.
The use level data provided by industry for each flavouring agent evaluatedat this meeting and used in the SPET calculations are available on the WHO JECFAweb site at http://www.who.int/ipcs/publications/jecfa/en/.
INTRODUCTION 5


ALICYCLIC KETONES, SECONDARY ALCOHOLSAND RELATED ESTERS (addendum)
First draft prepared by
Professor I.G. Sipes,1 Dr M. DiNovi,2 Dr J.C. Larsen3
and Professor A.G. Renwick4
1 College of Medicine, University of Arizona, Tucson, Arizona,United States of America (USA)
2 Center for Food Safety and Applied Nutrition, Food and Drug Administration,College Park, Maryland, USA
3 National Food Institute, Technical University of Denmark, Søborg, Denmark4 School of Medicine, University of Southampton, Southampton, England
1. Evaluation ..............................................................................1.1 Introduction ......................................................................1.2 Assessment of dietary exposure .....................................1.3 Absorption, distribution, metabolism and elimination ......1.4 Application of the Procedure for the Safety Evaluation of
Flavouring Agents ...........................................................1.5 Consideration of combined intakes from use as flavouring
agents ..............................................................................1.6 Consideration of secondary components ........................1.7 Conclusion .......................................................................
2. Relevant background information ..........................................2.1 Explanation ......................................................................2.2 Additional considerations on intake .................................2.3 Biological data .................................................................
2.3.1 Biochemical data: absorption, distribution,metabolism and elimination ....................................
2.3.2 Toxicological studies ..............................................3. References ............................................................................
1. EVALUATION
1.1 Introduction
The Committee evaluated 12 additional flavouring agents that are membersof a group entitled alicyclic ketones, secondary alcohols and related esters. Theadditional flavouring agents included one saturated alicyclic ketone (No. 2050), twounsaturated alicyclic ketones (Nos 2049 and 2052), one alicyclic diether (No. 2051),one alicyclic secondary ester (No. 2053), one alicyclic -hydroxy ketone (No. 2054),two unsaturated alicyclic keto-esters (Nos 2055 and 2056), one tri-unsaturatedalicyclic ketone (No. 2057), one di-unsaturated alicyclic keto-hydroxy-diol (No.2058) and two di-unsaturated bicyclic keto-ethers (Nos 2059 and 2060). Theevaluations were conducted according to the Procedure for the Safety Evaluation
7788
18
19202020202121
212138
- 7 -

of Flavouring Agents (Figure 1, Introduction) (Annex 1, reference 131). None ofthese flavouring agents has been evaluated previously.
The Committee previously evaluated 25 other members of this group offlavouring agents at its fifty-ninth meeting (Annex 1, reference 160). The Committeeconcluded that all 25 flavouring agents in that group were of no safety concernbased on estimated dietary exposures.
Four of the 12 flavouring agents (Nos 2052, 2054, 2057 and 2058) in thisgroup have been reported to occur naturally and can be found in honey, black teas,green and roasted mate, tomatoes and tomato juice, starfruit, clams, coffee,hazelnuts and grapefruit juice (Nijssen, van Ingen-Visscher & Donders, 2009).
1.2 Assessment of dietary exposure
The total annual volumes of production of the 12 alicyclic ketones, secondaryalcohols and related esters are approximately 0.4 kg in the USA and 18 kg in Japan(Japan Flavor and Fragrance Materials Association, 2005; Gavin, Williams &Hallagan, 2008; International Organization of the Flavor Industry, 2009).Approximately 55% of the total annual volume of production in Japan is accountedfor by one substance in this group—namely, cyclotene butyrate (No. 2056).
The estimated dietary exposures for each flavouring agent, calculated eitheras the maximized survey-derived intake (MSDI) or using the single portion exposuretechnique (SPET), are reported in Table 1. The estimated daily dietary exposure isgreatest for (–)-8,9-dehydrotheaspirone (No. 2059) (4000 μg, the SPET valueobtained from milk [dairy] and other fermented milk products). For the otherflavouring agents, the estimated daily dietary exposures range from 0.01 to 600 μg,with the SPET yielding the highest estimates. Annual volumes of production of thisgroup of flavouring agents as well as the daily dietary exposures calculated as theMSDI or using the SPET are summarized in Table 2.
1.3 Absorption, distribution, metabolism and elimination
The esters in this group (Nos 2053 and 2055–2056) and the ketal (No. 2051)are predicted to be hydrolysed to their corresponding alcohols and carboxylic acidsby carboxylesterases found in abundance in hepatocytes (Heymann, 1980; Anders,1989; White et al., 1990; Graffner-Nordberg et al., 1998). The resulting alicyclicsecondary alcohols can be interconverted enzymatically with the correspondingketone in vivo. The principal detoxication pathway involves reduction of the ketoneto yield the corresponding secondary alcohol, which is conjugated with glucuronicacid and excreted mainly in the urine. Side-chain oxidation, glutathione conjugationof , -unsaturated ketones and hydrogenation of endocyclic or exocyclic doublebonds are other elimination pathways involved. Polar oxygenated metabolites areexcreted primarily in the urine, either unchanged or as conjugates.
8 ALICYCLIC KETONES, SECONDARY ALCOHOLS AND RELATED ESTERS (addendum)

Tabl
e 1.
Sum
mar
y of
the
resu
lts o
f the
saf
ety
eval
uatio
ns o
f alic
yclic
ket
ones
, sec
onda
ry a
lcoh
ols
and
rela
ted
este
rs u
sed
asfla
vour
ing
agen
tsa,
b,c
Fla
vour
ing
agen
tN
o.C
AS
No.
and
str
uctu
reS
tep
A3/
B3d
Doe
s in
take
exce
ed th
eth
resh
old
for
hum
an in
take
?
Are
add
ition
al d
ata
avai
labl
e fo
r su
bsta
nces
with
an
estim
ated
inta
keex
ceed
ing
the
thre
shol
d of
conc
ern?
e
Com
men
ts o
npr
edic
ted
met
abol
ism
Con
clus
ion
base
don
cur
rent
estim
ated
die
tary
expo
sure
Str
uctu
ral c
lass
I
Cyc
lohe
xano
ne d
ieth
yl k
etal
2051
1670
-47-
9 OO
CH
3CH
3
A3.
No,
SP
ET
:40
0N
RN
ote
1N
o sa
fety
con
cern
3,3,
5-T
rimet
hylc
yclo
hexy
lac
etat
e20
5367
859-
96-5 O
CH
3
CH
3
CH
3
O
CH
3
A3.
No,
SP
ET
:15
0N
RN
ote
1N
o sa
fety
con
cern
ALICYCLIC KETONES, SECONDARY ALCOHOLS AND RELATED ESTERS (addendum) 9

Tabl
e 1
(con
td)
Fla
vour
ing
agen
tN
o.C
AS
No.
and
str
uctu
reS
tep
A3/
B3d
Doe
s in
take
exce
ed th
eth
resh
old
for
hum
an in
take
?
Are
add
ition
al d
ata
avai
labl
e fo
r su
bsta
nces
with
an
estim
ated
inta
keex
ceed
ing
the
thre
shol
dof
con
cern
?e
Com
men
ts o
npr
edic
ted
met
abol
ism
Con
clus
ion
base
don
cur
rent
estim
ated
die
tary
expo
sure
Str
uctu
ral c
lass
II
2-(t
rans
-2-P
ente
nyl)
cycl
open
tano
ne20
4951
608-
18-5
O
A3.
No,
SP
ET
:45
0N
RN
ote
2N
o sa
fety
con
cern
2-C
yclo
pent
ylcy
clop
enta
none
2050
4884
-24-
6
O
A3.
No,
SP
ET
:40
0N
RN
ote
2N
o sa
fety
con
cern
2-C
yclo
hexe
none
2052
930-
68-7
O
A3.
No,
SP
ET
:20
0N
RN
ote
3N
o sa
fety
con
cern
10 ALICYCLIC KETONES, SECONDARY ALCOHOLS AND RELATED ESTERS (addendum)

Tabl
e 1
(con
td)
Fla
vour
ing
agen
tN
o.C
AS
No.
and
str
uctu
reS
tep
A3/
B3d
Doe
s in
take
exce
ed th
eth
resh
old
for
hum
an in
take
?
Are
add
ition
al d
ata
avai
labl
e fo
r su
bsta
nces
with
an
estim
ated
inta
keex
ceed
ing
the
thre
shol
d of
conc
ern?
e
Com
men
ts o
npr
edic
ted
met
abol
ism
Con
clus
ion
base
don
cur
rent
estim
ated
die
tary
expo
sure
2,6,
6-T
rimet
hyl-2
-hy
drox
ycyc
lohe
xano
ne20
5475
00-4
2-7
O
HO
A3.
No,
SP
ET
:30
0N
RN
ote
4N
o sa
fety
con
cern
Cyc
lote
ne p
ropi
onat
e20
5587
-55-
8
O
O
CH
3
O
CH
3
A3.
No,
SP
ET
:30
0N
RN
ote
1N
o sa
fety
con
cern
Cyc
lote
ne b
utyr
ate
2056
6822
7-51
-0
O
O
O
A3.
No,
SP
ET
:20
0N
RN
ote
1N
o sa
fety
con
cern
ALICYCLIC KETONES, SECONDARY ALCOHOLS AND RELATED ESTERS (addendum) 11

Tabl
e 1
(con
td)
Fla
vour
ing
agen
tN
o.C
AS
No.
and
str
uctu
reS
tep
A3/
B3d
Doe
s in
take
exce
ed th
eth
resh
old
for
hum
an in
take
?
Are
add
ition
al d
ata
avai
labl
e fo
r su
bsta
nces
with
an
estim
ated
inta
keex
ceed
ing
the
thre
shol
d of
conc
ern?
e
Com
men
ts o
npr
edic
ted
met
abol
ism
Con
clus
ion
base
don
cur
rent
estim
ated
die
tary
expo
sure
4-(2
-But
enyl
iden
e)-3
,5,5
-tr
imet
hylc
yclo
hex-
2-en
-1-
one
(mix
ture
of i
som
ers)
2057
1321
5-88
-8
O O
A3.
No,
SP
ET
:30
0N
RN
otes
2 a
nd 3
No
safe
ty c
once
rn
4-H
ydro
xy-4
-(3-
hydr
oxy-
1-bu
teny
l)-3,
5,5-
trim
ethy
l-2-
cycl
ohex
en-1
-one
(m
ixtu
reof
isom
ers)
2058
2442
7-77
-8
O
OH
OH
OH
HO
O
A3.
No,
SP
ET
:30
0N
RN
otes
2 a
nd 3
No
safe
ty c
once
rn
12 ALICYCLIC KETONES, SECONDARY ALCOHOLS AND RELATED ESTERS (addendum)

Tabl
e 1
(con
td)
Fla
vour
ing
agen
tN
o.C
AS
No.
and
str
uctu
reS
tep
A3/
B3d
Doe
s in
take
exce
ed th
eth
resh
old
for
hum
an in
take
?
Are
add
ition
al d
ata
avai
labl
e fo
r su
bsta
nces
with
an
estim
ated
inta
keex
ceed
ing
the
thre
shol
d of
conc
ern?
e
Com
men
ts o
npr
edic
ted
met
abol
ism
Con
clus
ion
base
don
cur
rent
estim
ated
die
tary
expo
sure
Str
uctu
ral c
lass
III
()-
8,9-
Deh
ydro
thea
spiro
ne20
5985
248-
56-2
O
OC
H3
CH
3
CH
3C
H3
B3.
Yes
, SP
ET
:40
00T
he N
OA
EL
of 6
0 m
g/kg
bw p
er d
ay in
a 2
8-da
y or
alst
udy
in r
ats
for
the
stru
ctur
al a
nalo
gue
No.
2060
(Im
atan
aka,
200
3b)
is 9
00 (
base
d on
the
SP
ET
) an
d >
1 m
illio
n(b
ased
on
the
MS
DI)
tim
esth
e es
timat
ed d
aily
die
tary
expo
sure
to N
o. 2
059
whe
n us
ed a
s a
flavo
urin
gag
ent.
Not
es 2
and
3N
o sa
fety
con
cern
(±)-
2,6,
10,1
0-T
etra
met
hyl-1
-ox
aspi
ro[4
.5]d
eca-
2,6-
dien
-8-o
ne
2060
8072
2-28
-7
OO
B3.
Yes
, SP
ET
:60
0T
he N
OA
EL
of 6
0 m
g/kg
bw p
er d
ay in
a 2
8-da
y or
alst
udy
in r
ats
for
No.
206
0(I
mat
anak
a, 2
003b
) is
at
leas
t 600
0 tim
es it
ses
timat
ed d
aily
die
tary
expo
sure
whe
n us
ed a
s a
flavo
urin
g ag
ent.
Not
es 2
and
3N
o sa
fety
con
cern
ALICYCLIC KETONES, SECONDARY ALCOHOLS AND RELATED ESTERS (addendum) 13

Tabl
e 1
(con
td)
bw, b
ody
wei
ght;
CA
S, C
hem
ical
Abs
trac
ts S
ervi
ce; N
OA
EL,
no-
obse
rved
-adv
erse
-effe
ct le
vel;
NR
, not
req
uire
d fo
r ev
alua
tion
beca
use
cons
umpt
ion
of th
e fla
vour
ing
agen
t was
det
erm
ined
to b
e of
no
safe
ty c
once
rn a
t ste
p A
3 of
the
Pro
cedu
re.
a T
wen
ty-f
ive
flavo
urin
g ag
ents
in th
is g
roup
wer
e pr
evio
usly
eva
luat
ed b
y th
e C
omm
ittee
(A
nnex
1, r
efer
ence
161
).b
Ste
p 1:
Tw
o fla
vour
ing
agen
ts in
this
gro
up (
Nos
205
1 an
d 20
53)
are
in s
truc
tura
l cla
ss I.
Eig
ht fl
avou
ring
agen
ts in
this
gro
up (
Nos
204
9, 2
050,
205
2an
d 20
54–2
058)
are
in s
truc
tura
l cla
ss II
. Tw
o fla
vour
ing
agen
ts in
this
gro
up (
Nos
205
9 an
d 20
60)
are
in s
truc
tura
l cla
ss II
I.c
Ste
p 2:
Ten
age
nts
in th
is g
roup
(N
os 2
049–
2058
) ar
e ex
pect
ed to
be
met
abol
ized
to in
nocu
ous
prod
ucts
. Tw
o ag
ents
(N
os 2
059
and
2060
) ar
e no
tex
pect
ed to
be
met
abol
ized
to in
nocu
ous
prod
ucts
.d
The
thre
shol
ds fo
r hu
man
inta
ke fo
r st
ruct
ural
cla
sses
I, II
and
III a
re 1
800,
540
and
90
μg/d
ay, r
espe
ctiv
ely.
All
inta
ke v
alue
s ar
e ex
pres
sed
in μ
g/da
y. E
ither
the
high
est S
PE
T e
stim
ate
or th
e M
SD
I est
imat
es, i
f at l
east
one
is h
ighe
r th
an th
e hi
ghes
t SP
ET
est
imat
e, a
re g
iven
in th
e ta
ble.
e T
he m
argi
n of
saf
ety
was
cal
cula
ted
base
d on
the
high
est d
aily
die
tary
exp
osur
e ca
lcul
ated
eith
er b
y th
e S
PE
T o
r as
the
MS
DI.
Not
es:
1.M
etab
oliz
ed b
y hy
drol
ysis
of e
ster
, glu
curo
nic
acid
con
juga
tion
of th
e re
sulti
ng a
licyc
lic a
lcoh
ol a
nd c
ompl
ete
oxid
atio
n of
the
carb
oxyl
ic a
cid
and/
orre
duct
ion
of th
e ke
tone
, res
ultin
g fr
om k
etal
hyd
roly
sis,
to a
n al
coho
l, w
hich
wou
ld b
e co
njug
ated
and
exc
rete
d.2.
Met
abol
ized
by
redu
ctio
n of
the
keto
ne a
nd a
lkyl
sid
e-ch
ain
oxid
atio
n an
d ex
cret
ion.
3.M
etab
oliz
ed b
y re
duct
ion
of th
e ke
tone
func
tiona
l gro
up, f
ollo
wed
by
gluc
uron
ic a
cid
conj
ugat
ion
of th
e re
sulti
ng a
lcoh
ol a
nd g
luta
thio
ne c
onju
gatio
nof
the
pare
nt k
eton
e.4.
Met
abol
ized
by
redu
ctio
n of
the
keto
ne, f
ollo
wed
by
gluc
uron
ic a
cid
conj
ugat
ion
of th
e co
rres
pond
ing
alco
hol.
14 ALICYCLIC KETONES, SECONDARY ALCOHOLS AND RELATED ESTERS (addendum)

Table 2. Annual volumes of production and dietary exposures for alicyclicketones, secondary alcohols and related esters used as flavouring agents inEurope, the USA and Japan
Flavouring agent (No.) Mostrecentannual
volume ofproduction
(kg)a
Exposure Annualvolume of
naturaloccurrence
in foods(kg)
MSDIb SPETc
μg/day μg/kgbw per
day
μg/day μg/kg bwper day
2-(trans-2-Pentenyl)cyclopentanone (2049)
450 7.5
Europe ND ND ND
USA 0.1 0.01 0.0002
Japan ND ND ND
2-Cyclopentylcyclopentanone(2050)
400 7
Europe ND ND ND
USA ND ND ND
Japan 0.2 0.1 0.001
Cyclohexanone diethyl ketal(2051)
400 7
Europe ND ND ND
USA ND ND ND
Japan 7 1.9 0.03
2-Cyclohexenone (2052) 200 3 +
Europe ND ND ND
USA ND ND ND
Japan 0.1 0.03 0.0005
3,3,5-Trimethylcyclohexylacetate (2053)
150 3
Europe ND ND ND
USA ND ND ND
Japan 1 0.2 0.003
2,6,6-Trimethyl-2-hydroxycyclohexanone(2054)
300 5 +
ALICYCLIC KETONES, SECONDARY ALCOHOLS AND RELATED ESTERS (addendum) 15

Table 2 (contd)
Flavouring agent (No.) Mostrecentannual
volume ofproduction
(kg)a
Exposure Annualvolume of
naturaloccurrence
in foods(kg)
MSDIb SPETc
μg/day μg/kgbw per
day
μg/day μg/kg bwper day
Europe ND ND ND
USA ND ND ND
Japan 0.3 0.1 0.001
Cyclotene propionate (2055) 300 5
Europe ND ND ND
USA ND ND ND
Japan 1 0.2 0.003
Cyclotene butyrate (2056) 200 3
Europe ND ND ND
USA ND ND ND
Japan 10 3 0.05
4-(2-Butenylidene)-3,5,5-trimethylcyclohex-2-en-1-one (mixture of isomers)(2057)
300 5 +
Europe ND ND ND
USA 0.1 0.01 0.0002
Japan ND ND ND
4-Hydroxy-4-(3-hydroxy-1-butenyl)-3,5,5-trimethyl-2-cyclohexen-1-one (2058)
300 5 +
Europe ND ND ND
USA 0.1 0.01 0.0002
Japan ND ND ND
( )-8,9-Dehydrotheaspirone(2059)
4000 67
Europe ND ND ND
USA ND ND ND
Japan 0.1 0.02 0.0003
(±)-2,6,10,10-Tetramethyl-1-oxaspiro[4.5]deca-2,6-dien-8-one (2060)
600 10
16 ALICYCLIC KETONES, SECONDARY ALCOHOLS AND RELATED ESTERS (addendum)

The alicyclic ketones in this group (Nos 2049–2050, 2052 and 2054–2060)are likely to be reduced to the corresponding secondary alcohol and excretedprimarily as the glucuronic acid conjugate (Elliott, Parke & Williams, 1959). If adouble bond is present, it may be reduced to the corresponding dihydro- derivative(Krasavage, O’Donoghue & Divincenzo, 1982). For metabolites excreted into the
Table 2 (contd)
Flavouringagent (No.)
Most recentannual
volume ofproduction
(kg)a
Exposure Annualvolume of
naturaloccurrence in
foods (kg)
MSDIb SPETc
μg/day μg/kgbw per
day
μg/day μg/kg bwper day
Europe ND ND ND
USA 0.1 0.01 0.0002
Japan ND ND ND
Total
Europe ND
USA 0.4
Japan 18
bw, body weight; ND, no data reported; +, reported to occur naturally in foods (Nijssen, vanIngen-Visscher & Donders, 2009), but no quantitative data; , not reported to occur naturallyin foods
a From Gavin, Williams & Hallagan (2008), International Organization of the Flavor Industry(2009) and Japan Flavor and Fragrance Materials Association (2005). Values greater thanzero but less than 0.1 kg were reported as 0.1 kg.
b MSDI (μg/person per day) calculated as follows: (annual volume, kg) × (1 × 10⁹ μg/kg)/(population × survey correction factor × 365 days),
where population (10%, “eaters only”) = 32 × 106 for Europe, 28 × 106 for the USA and 13× 106 for Japan; and where survey correction factor = 0.8 for the surveys in Europe, the USAand Japan, representing the assumption that only 80% of the annual flavour volume wasreported in the poundage surveys (Japan Flavor and Fragrance Materials Association, 2005;Gavin, Williams & Hallagan, 2008; International Organization of the Flavor Industry, 2009).
MSDI (μg/kg bw per day) calculated as follows: (μg/person per day)/body weight, where body weight = 60 kg. Slight variations may occur
from rounding.c SPET (μg/person per day) calculated as follows: (standard food portion, g/day) × (average use level) (International Organization of the Flavor
Industry, 2009). The dietary exposure from the single food category leading to the highestdietary exposure from one portion is taken as the SPET estimate.
SPET (μg/kg bw per day) calculated as follows: (μg/person per day)/body weight, where body weight = 60 kg. Slight variations may occur
from rounding.
ALICYCLIC KETONES, SECONDARY ALCOHOLS AND RELATED ESTERS (addendum) 17

bile, reduction of the double bond may occur, mediated by the gut microflora.Endocyclic double bonds (Nos 2052 and 2055–2060) are more prone to reductioncompared with exocyclic double bonds (Nos 2049 and 2057–2058). In addition toreductive pathways, alicyclic ketones containing an alkyl or alicyclic side-chain (Nos2049, 2050 and 2054–2060) may undergo oxidation of the side-chain to formpolyoxygenated metabolites, which are excreted as the glucuronic acid or sulfateconjugates in the urine and, to a lesser extent, in the faeces.
1.4 Application of the Procedure for the Safety Evaluation of FlavouringAgents
Step 1. In applying the Procedure for the Safety Evaluation of FlavouringAgents to the above-mentioned flavouring agents, the Committee assigned twoflavouring agents (Nos 2051 and 2053) to structural class I, eight flavouring agents(Nos 2049, 2050, 2052 and 2054–2058) to structural class II and two flavouringagents (Nos 2059 and 2060) to structural class III (Cramer, Ford & Hall, 1978).
Step 2. Ten flavouring agents in this group (Nos 2049–2058) are expectedto be metabolized to innocuous products. The evaluation of these flavouring agentstherefore proceeded via the A-side of the Procedure. Two of the flavouring agentsin this group (Nos 2059 and 2060) cannot be predicted to be metabolized toinnocuous products. The evaluation of these two flavouring agents thereforeproceeded via the B-side of the Procedure.
Step A3. The highest estimated daily intakes of the two flavouring agents instructural class I are below the threshold of concern (i.e. 1800 μg/day for class I).The highest estimated daily intakes of the eight flavouring agents in structural classII are below the threshold of concern (i.e. 540 μg/day for class II). The safety of these10 flavouring agents raises no concern at current estimated dietary exposures.
Step B3. The highest estimated daily intakes of the two flavouring agents instructural class III (Nos 2059 and 2060) are above the threshold of concern (i.e.90 μg/day for class III). Accordingly, additional data are necessary for the evaluationof these flavouring agents.
Consideration of flavouring agents with high exposure evaluated via the B-side of the decision-tree:
Additional data were evaluated for ( )-8,9-dehydrotheaspirone (No. 2059)and (±)-2,6,10,10-tetramethyl-1-oxaspiro[4.5]deca-2,6-dien-8-one (No. 2060), astheir estimated intakes exceeded the threshold of concern for structural class III(i.e. 90 μg/day).
A no-observed-adverse-effect level (NOAEL) of 60 mg/kg body weight (bw)per day for (±)-2,6,10,10-tetramethyl-1-oxaspiro[4.5]deca-2,6-dien-8-one (No.2060) was identified in a 28-day oral study (Imatanaka, 2003b). In this study, dosesof 12, 60 or 300 mg/kg bw per day were administered by gavage to rats (10 of eachsex per dose). No changes attributable to No. 2060 were reported for body weight,food or water consumption, haematological examination or urinalyses. Somebehavioural/motor effects were observed at 300 mg/kg bw per day. Changes in
18 ALICYCLIC KETONES, SECONDARY ALCOHOLS AND RELATED ESTERS (addendum)

serum enzyme activities and cholesterol and triglyceride levels were reported at theend of the study in those rats treated with the 300 mg/kg bw per day dose. Anincrease in liver weight was reported for females only at 60 mg/kg bw per day. Thischange was considered non-adverse and led to the designation of 60 mg/kg bw perday as the NOAEL. This NOAEL provides a margin of safety of 6000 in relation tothe highest estimated dietary exposure to No. 2060 (SPET = 600 μg/day) when usedas a flavouring agent.
( )-8,9-Dehydrotheaspirone (No. 2059) is a close structural analogue of(±)-2,6,10,10-tetramethyl-1-oxaspiro[4.5]deca-2,6-dien-8-one (No. 2060), andtoxicological studies on that compound can be used for the evaluation of No. 2059.The NOAEL of 60 mg/kg bw per day provides a margin of safety of 900 in relationto the highest estimated dietary exposure to No. 2059 (SPET = 4000 μg/day) whenused as a flavouring agent. The Committee noted that the margin of safety of 900between the SPET estimate for No. 2059 and the NOAEL for No. 2060 is lower thanthe value of 1000, which was proposed as an adequate margin of safety forflavouring agents on the B-side of the decision-tree at the forty-fourth meeting ofthe Committee (Annex 1, reference 116). The value of 1000 was based on thecomparison of the NOAEL with the MSDI. The Committee noted that the margin ofsafety for No. 2059 based on the MSDI of 0.02 μg/day and the NOAEL of 60 mg/kgbw per day for No. 2060 exceeds 1 million and concluded that the values of 900(based on the SPET) and greater than 1 million (based on the MSDI) provided anadequate margin of safety.
The Committee therefore concluded that both (±)-2,6,10,10-tetramethyl-1-oxaspiro[4.5]deca-2,6-dien-8-one (No. 2060) and ( )-8,9-dehydrotheaspirone (No.2059) would not pose safety concerns at current estimated dietary exposures.
Table 1 summarizes the evaluations of the 12 alicyclic ketones, secondaryalcohols and related esters (Nos 2049–2060) in this group of flavouring agents.
1.5 Consideration of combined intakes from use as flavouring agents
The safety assessment of possible combined intakes of flavouring agentswas based on the presence of common metabolites or a homologous series (asproposed at the sixty-eighth meeting; Annex 1, reference 187) and using the MSDIexposure assessment (as proposed at the sixty-ninth meeting; Annex 1, reference190).
Flavouring agents in this group with the highest intakes that have thecommon metabolite cyclohexanol are Nos 1093, 1094–1097 and 2051 in structuralclass I and No. 1100 in structural class II. In the unlikely event that these were tobe consumed concurrently on a daily basis, the estimated combined intakes inEurope, the USA and Japan would be 10.2, 7.3 and 1.1 μg/day, respectively, whichwould not exceed either threshold of concern (i.e. 1800 μg/day for class I and540 μg/day for class II).
Flavouring agents in this group with the highest intakes that have thecommon metabolite cyclohexanol or a cyclohexenol derivative are Nos 1099 and2053 in structural class I, Nos 1098, 1108, 1109, 1111–1113, 2052 and 2054 instructural class II and No. 2059 in structural class III. In the unlikely event that these
ALICYCLIC KETONES, SECONDARY ALCOHOLS AND RELATED ESTERS (addendum) 19

were to be consumed concurrently on a daily basis, the estimated combined intakesin Europe, the USA and Japan would be 22.5, 4.9 and 0.3 μg/day, respectively,which would not exceed any of the thresholds of concern (i.e. 1800 μg/day for classI, 540 μg/day for class II and 90 μg/day for class III).
Flavouring agents in this group with the highest intakes that have acyclopentanol derivative as the common metabolite are Nos 1101, 1106 and 1114–1117 in structural class I and Nos 2049, 2050, 2055 and 2056 in structural class II.In the unlikely event that these were to be consumed concurrently on a daily basis,the estimated combined intakes in Europe, the USA and Japan would be 31, 21.2and 2.2 μg/day, respectively, which would not exceed either threshold of concern(i.e. 1800 μg/day for class I and 540 μg/day for class II).
The overall evaluation of the data indicates that combined intakes would notraise concern about safety at current estimated dietary exposures.
1.6 Consideration of secondary components
Two flavouring agents in this group (Nos 2053 and 2055) have minimumassay values of less than 95%. The secondary component of 3,3,5-trimethylcyclohexyl acetate (No. 2053) is 3,3,5-trimethylcyclohexanol (No. 1099).The secondary component of cyclotene propionate (No. 2055) is cyclotene (No.418). Nos 1099 and 418 were evaluated at the fifty-ninth and fifty-fifth meetings ofthe Committee (Annex 1, references 160 and 149), respectively, and were found tobe of no safety concern. Information on the safety of the secondary components ofthese flavouring agents is summarized in Annex 5.
1.7 Conclusion
In the previous evaluation of flavouring agents in this group, studies of acutetoxicity, short-term toxicity, long-term toxicity and carcinogenicity, genotoxicity andreproductive toxicity were available. The toxicity data available for this evaluationsupported those from the previous evaluation (Annex 1, reference 160).
The Committee concluded that these 12 flavouring agents, which areadditions to the group of alicyclic ketones, secondary alcohols and related estersevaluated previously, would not give rise to safety concerns at current estimateddietary exposures.
2. RELEVANT BACKGROUND INFORMATION
2.1 Explanation
This monograph summarizes the additional key data relevant to the safetyevaluation of the group of 12 alicyclic ketones, secondary alcohols and relatedesters, including 1 saturated alicyclic ketone (No. 2050), 2 unsaturated alicyclicketones (Nos 2049 and 2052), 1 alicyclic diether (No. 2051), 1 alicyclic secondaryester (No. 2053), 1 alicyclic -hydroxy ketone (No. 2054), 2 unsaturated alicyclicketo-hydroxy-esters (Nos 2055 and 2056), 1 tri-unsaturated alicyclic ketone (No.2057), 1 di-unsaturated alicyclic keto-diol (No. 2058) and 2 di-unsaturated bicyclic
20 ALICYCLIC KETONES, SECONDARY ALCOHOLS AND RELATED ESTERS (addendum)

keto-ethers (Nos 2059 and 2060). These 12 flavouring agents are additions to agroup of 25 flavouring agents evaluated by the Committee at its fifty-ninth meeting(Annex 1, reference 160).
2.2 Additional considerations on intake
There is no additional information on intake. Dietary exposure estimateswere made using the MSDI approach as well as the SPET.
2.3 Biological data
2.3.1 Biochemical data: absorption, distribution, metabolism and elimination
Relevant data on the absorption, distribution, metabolism and excretion ofthese flavouring agents have not been reported since the publication of the originalmonograph (Annex 1, reference 160).
2.3.2 Toxicological studies
(a) Acute toxicity
Oral median lethal doses (LD50 values) have been reported for 3 of the 12additional flavouring agents in this group (Table 3). For 4-(2-butenylidene)-3,5,5-trimethylcyclohex-2-en-1-one (No. 2057), an LD50 value in rats of 1000 mg/kg bwwas reported (Yoshitake, 2001a). For 4-hydroxy-4-(3-hydroxy-1-butenyl)-3,5,5-trimethyl-2-cyclohexen-1-one (No. 2058), an LD50 value in rats of 2000 mg/kg bwwas reported (Uzuka, 2002). For (±)-2,6,10,10-tetramethyl-1-oxaspiro[4.5]deca-2,6-dien-8-one (No. 2060), an LD50 in rats was found to be 1000 mg/kg bw(Yoshitake, 2001b).
These studies demonstrate that the acute oral toxicity of alicyclic ketones,secondary alcohols and related esters is low.
Table 3. Results of acute toxicity studies for alicyclic ketones, secondaryalcohols and related esters used as flavouring agents
No. Flavouring agent Species; sex LD50 (mg/kg bw) Reference
2057 4-(2-Butenylidene)-3,5,5-trimethylcyclohex-2-en-1-one
Rat; M, F 1000 Yoshitake (2001a)
2058 4-Hydroxy-4-(3-hydroxy-1-butenyl)-3,5,5-trimethyl-2-cyclohexen-1-one
Rat; M, F 2000 Uzuka (2002)
2060 (±)-2,6,10,10-Tetramethyl-1-oxaspiro[4.5]deca-2,6-dien-8-one
Rat; M, F 1000 Yoshitake (2001b)
F, female; M, male
ALICYCLIC KETONES, SECONDARY ALCOHOLS AND RELATED ESTERS (addendum) 21

(b) Short-term and long-term studies of toxicity
Results of short-term studies of toxicity are available for 2-cyclohexenone(No. 2052), 4-(2-butenylidene)-3,5,5-trimethylcyclohex-2-en-1-one (No. 2057), 4-hydroxy-4-(3-hydroxy-1-butenyl)-3,5,5-trimethyl-2-cyclohexen-1-one (No. 2058)and (±)-2,6,10,10-tetramethyl-1-oxaspiro[4.5]deca-2,6-dien-8-one (No. 2060).These studies are summarized in Table 4 and described below. No additionalstudies of short-term or long-term toxicity on any of the related flavouring agentspreviously evaluated have become available since their previous evaluation (Annex1, reference 160).
(i) 2-Cyclohexenone (No. 2052)
In a subchronic toxicity study, groups of B6C3F1 mice (10 of each sex perdose) were exposed to atmospheres containing 2-cyclohexenone at concentrationsof 0, 2.5, 5 or 10 parts per million (ppm) via inhalation for 6 h/day, 5 days/week, for13 weeks (Cunningham et al., 2001; NTP, 2009). These concentrations correspondto systemic exposure levels of approximately 0, 4.2, 8.4 and 16.8 mg/kg bw per dayin mice (Fassett, 1978). Body weights were recorded prior to the daily exposure andweekly thereafter. Prior to the last exposure, blood was collected for clinicalpathology. At necropsy, tissue weights were obtained for liver, thymus, right kidney,right testicle, heart and lungs. Additional tissues were collected for histopathology.Vaginal smears were prepared for female mice for the last 12 days of exposure.Vaginal cytology slides were analysed, and the estrous cycle stages weredetermined for each day. At necropsy, the left testis and epididymis from male micewere collected and weighed, and sperm motility and sperm density counts wereconducted. Also, additional blood smears were prepared for 10 animals of each sexper dose, and these slides were stained and evaluated for the presence ofmicronuclei (as in MacGregor et al., 1990).
No compound-related lesions were identified in the trachea, larynx or lungin either sex (Cunningham et al., 2001). In the nasal cavity, thickening of therespiratory epithelium (hyperplasia) occurred in mice exposed to 10, 5 and 2.5 ppm,whereas erosions and squamous metaplasia were present in the high dose group(10 ppm). These lesions were predominately localized to the nasoturbinates andmaxilloturbinates in the most anterior portion (level 1) of the nasal cavity, whereasthe respiratory and olfactory epithelia of levels 2 and 3 were reported to be normal.Because of the route of exposure employed in this study (i.e. inhalation), theseeffects on the respiratory epithelium are not likely to be biologically relevant to theoral administration of the test material or its use as a flavouring agent. Body weightswere not significantly different from those of controls after 13 weeks of exposure,and no haematological abnormalities were detected. Relative liver weights wereincreased significantly in female mice at 5 and 10 ppm and in male mice at 10 ppm,although no accompanying histopathological lesions were reported. The results ofbone marrow micronucleus assay and all reproductive end-points evaluatedindicated that 2-cyclohexenone produced no clastogenic or reproductive toxicity atexposures up to 10 ppm in mice (Cunningham et al., 2001; NTP, 2009). The NOAELwas considered to be 10 ppm (estimated to be equivalent to 16.8 mg/kg bw per day),the highest dose tested.
22 ALICYCLIC KETONES, SECONDARY ALCOHOLS AND RELATED ESTERS (addendum)

Tabl
e 4.
Res
ults
of s
hort
-ter
m s
tudi
es o
f tox
icity
with
alic
yclic
ket
ones
, sec
onda
ry a
lcoh
ols
and
rela
ted
este
rs u
sed
asfla
vour
ing
agen
ts
No.
Fla
vour
ing
agen
tS
peci
es;
sex
No.
of t
est
grou
psa /
no.
per
grou
pb
Rou
teD
urat
ion
(day
s)N
OA
EL
(mg/
kg b
wpe
r da
y)
Ref
eren
ce
2052
2-C
yclo
hexe
none
Mou
se; N
R3/
20In
hala
tion
9016
.8c,
dC
unni
ngha
m e
t al.
(200
1)
2052
2-C
yclo
hexe
none
Rat
; M, F
3/20
Inha
latio
n90
6.2c,
dC
unni
ngha
m e
t al.
(200
1)
2057
4-(2
-But
enyl
iden
e)-3
,5,5
-trim
ethy
lcyc
lohe
x-2-
en-1
-one
Rat
; M, F
3/8
Ora
l (ga
vage
)14
40Y
oshi
take
(20
01d)
2057
4-(2
-But
enyl
iden
e)-3
,5,5
-trim
ethy
lcyc
lohe
x-2-
en-1
-one
Rat
; M, F
3/20
Ora
l (ga
vage
)28
16e
Imat
anak
a (2
003c
)
2058
4-H
ydro
xy-4
-(3-
hydr
oxy-
1-bu
teny
l)-3,
5,5-
trim
ethy
l-2-
cycl
ohex
en-1
-one
Rat
; M, F
3/8
Ora
l (ga
vage
)14
40Im
atan
aka
(200
3a)
2058
4-H
ydro
xy-4
-(3-
hydr
oxy-
1-bu
teny
l)-3,
5,5-
trim
ethy
l-2-
cycl
ohex
en-1
-one
Rat
; M, F
3/20
Ora
l (ga
vage
)28
25Im
atan
aka
(200
4)
2060
(±)-
2,6,
10,1
0-T
etra
met
hyl-1
-oxa
spiro
[4.5
]dec
a-2,
6-di
en-8
-one
Rat
; M, F
3/8
Ora
l (ga
vage
)14
80Y
oshi
take
(20
01c)
2060
(±)-
2,6,
10,1
0-T
etra
met
hyl-1
-oxa
spiro
[4.5
]dec
a-2,
6-di
en-8
-one
Rat
; M, F
3/20
Ora
l (ga
vage
)28
60Im
atan
aka
(200
3b)
F, f
emal
e; M
, mal
e; N
R, n
ot r
epor
ted
a T
otal
num
ber
of te
st g
roup
s do
es n
ot in
clud
e co
ntro
l ani
mal
s.b
Tot
al n
umbe
r pe
r te
st g
roup
incl
udes
bot
h m
ale
and
fem
ale
anim
als.
c T
he h
ighe
st d
ose
test
ed.
d E
xpos
ure
leve
l con
vert
ed fr
om in
hala
tion
dosa
ge to
ora
l dos
age,
as
in F
asse
tt (1
978)
.e
The
Com
mitt
ee c
onsi
dere
d th
at th
e N
OA
EL
may
be
high
er b
ecau
se th
ese
effe
cts
gene
rally
are
not
con
side
red
to b
e ad
vers
e an
d/or
are
mal
e ra
t spe
cific
(hya
line
drop
lets
).
ALICYCLIC KETONES, SECONDARY ALCOHOLS AND RELATED ESTERS (addendum) 23

In a similar subchronic toxicity study by the same authors, groups of Fischer344 rats (10 of each sex per dose) were exposed daily to atmospheres containing2-cyclohexenone at concentrations of 0, 2.5, 5 or 10 ppm for 13 weeks (Cunninghamet al., 2001; NTP, 2009). These concentrations correspond to systemic exposurelevels of approximately 0, 1.55, 3.1 and 6.2 mg/kg bw per day in rats (Fassett, 1978).As with the previous study (i.e. with mice), no compound-related lesions wereidentified in the trachea, larynx or lung in rats of either sex. Similar local effects likelyto be resulting from the route of exposure (as were found in mice), such ashyperplasia and inflammation, were reported. Body weights were not significantlydifferent from those of controls after 13 weeks of exposure, and no haematologicalabnormalities were detected. Increased relative liver weights were observed infemale rats, but were not accompanied by any histopathological evidence of lesions.Both control and treated groups of males exposed to 2-cyclohexenone werereported to show cytoplasmic vacuolization of the centrilobular region of the liver.There was no difference in the incidence or severity of the lesions between test andcontrol animals (NTP, 2009). The results of bone marrow micronucleus assay andall reproductive end-points evaluated indicated that 2-cyclohexenone produced noclastogenic or reproductive toxicity at exposures up to 10 ppm in rats (Cunninghamet al., 2001; NTP, 2009). For rats, the NOAEL was considered to be 10 ppm(estimated to be equivalent to 6.2 mg/kg bw per day), the highest dose tested bythis route of exposure.
(ii) 4-(2-Butenylidene)-3,5,5-trimethylcyclohex-2-en-1-one (No.2057)
In a range-finding study, groups of Crj:CD(SD) IGS rats (four of each sex perdose) were administered via gavage 4-(2-butenylidene)-3,5,5-trimethylcyclohex-2-en-1-one at doses of 0, 40, 200 and 1000 mg/kg bw per day for 14 days (Yoshitake,2001d). In the high dose (1000 mg/kg bw per day) group, decreased spontaneouslocomotion in males (4/4) and females (3/4), salivation in males (3/4) and females(2/4), staining of hair in males (4/4) and females (4/4) and staining around the noseand mouth in males (4/4) and females (4/4) were observed. One male died on day14 of dosing in the 1000 mg/kg bw per day group. Body weights were lower in malesfrom day 3 to day 14 and in females from day 10 to day 14 for the 1000 mg/kg bwper day group. Blood chemistry examination revealed an increase in glutamicpyruvic transaminase (i.e. alanine aminotransferase) activities and total cholesterollevels in both sexes of the high dose group and increases in alkaline phosphataseand -glutamyl transpeptidase activities and triglyceride and total bilirubin levels inthe females of the high dose group. The clinical signs observed in males in themiddle dose group (200 mg/kg bw per day) were staining around the nose andmouth (1/4). No significant differences in blood chemistry values between the 40 or200 mg/kg bw per day groups and the control group were observed.
In males of the 1000 mg/kg bw per day group, decreased absolute andrelative spleen weights as well as increased relative liver and kidney weights werereported. In females of the 200 and 1000 mg/kg bw per day groups, increasedabsolute and relative liver weights and decreased absolute spleen weights werereported. Enlarged livers were reported in all females of the high dose group, but
24 ALICYCLIC KETONES, SECONDARY ALCOHOLS AND RELATED ESTERS (addendum)

were presumed to result from metabolic changes due to administration of the testmaterial. Histopathologically, diffuse hypertrophy of hepatocytes (3/3), prominentnucleoli of hepatocytes of the liver (3/3) and vacuolization of tubular epithelium ofthe kidney (1/3) were reported in males of the 1000 mg/kg bw per day group. Nosignificant changes were reported in the low dose group (40 mg/kg bw per day)(Yoshitake, 2001d), which can be considered the NOAEL for this 14-day study.
In a follow-up 28-day study using the same protocol as above, groups ofCrj:CD(SD) IGS rats (10 of each sex per dose) were administered 4-(2-butenylidene)-3,5,5-trimethylcyclohex-2-en-1-one at doses of 0 (control), 16,80 and 400 mg/kg bw per day via gavage (Imatanaka, 2003c). A recovery studywas also included in which dosed animals (six of each sex at 400 mg/kg bwper day) were allowed to recover for 28 days following the last dose. No significantchanges were attributable to 4-(2-butenylidene)-3,5,5-trimethylcyclohex-2-en-1-one administration with respect to clinical signs, food consumption orhaematological examinations. Lower body weights were reported in males of the400 mg/kg bw per day group from day 8 to day 28 of administration. Both sexes inthe 400 mg/kg bw per day group had increased -glutamyl transpeptidase activitiesand decreased chloride levels. Males of this group had increased glutamic pyruvictransaminase (i.e. alanine aminotransferase) and alkaline phosphatase activitiesand total bilirubin levels, along with decreased sodium levels. Females of this grouphad increased total cholesterol, triglyceride and albumin levels.
Increased absolute and relative liver and kidney weights were reported inboth males and females of the 400 mg/kg bw per day group. Histopathologicalexaminations revealed centrilobular hypertrophy of hepatocytes in males andfemales of the 400 mg/kg bw per day group, as well as focal necrosis in males ofthe 400 mg/kg bw per day group. Histopathology also revealed increased hyalinedroplets in the kidneys of males in the 80 and 400 mg/kg bw per day groups.However, these effects were attributed to -2u-globulin nephropathy of the male rat.Therefore, this mode of action is not relevant to human renal toxicity and is notindicative of a risk to humans (Capen et al., 1999). Statistically significant increasedrelative liver weights (female) and kidney weights (male) were reported in the80 mg/kg bw per day groups. In the recovery study, all changes and variationsobserved during or upon the termination of the administration period disappearedduring the recovery period or at the end of the recovery period.
Based on the increased relative liver weights (females) and kidney weights(males) as well as the increased hyaline droplets in male kidneys, and underthe conditions of the study, the author considered the NOAEL for No. 2057 tobe 16 mg/kg bw per day (Imatanaka, 2003c). The Committee considered that theNOAEL may be higher because these effects generally are not considered to beadverse and/or are male rat specific (hyaline droplets).
(iii) 4-Hydroxy-4-(3-hydroxy-1-butenyl)-3,5,5-trimethyl-2-cyclohexen-1-one (No. 2058)
In a range-finding study using the previously reported protocol (Imatanaka,2003c), groups of Crj:CD(SD) rats (four of each sex per dose) were administered
ALICYCLIC KETONES, SECONDARY ALCOHOLS AND RELATED ESTERS (addendum) 25

4-hydroxy-4-(3-hydroxy-1-butenyl)-3,5,5-trimethyl-2-cyclohexen-1-one via gavageat doses of 0, 40, 200 and 1000 mg/kg bw per day for 14 days (Imatanaka, 2003a).
In the 1000 mg/kg bw per day groups, three out of four males and two out offour females presented with decreased spontaneous locomotion, and one male andone female were observed to have incomplete eyelid closure. Measurement of bodyweights revealed lower values in males and females in the 1000 mg/kg bw per daygroup on day 3. Blood chemistry examinations at 1000 mg/kg bw per day revealedincreased -glutamyl transpeptidase activities and total protein levels in males andfemales; increased glutamic pyruvic transaminase (i.e. alanine aminotransferase)activities and total bilirubin levels as well as decreased triglyceride levels, albuminto globulin ratio and creatinine levels in males; and increased total cholesterol levelsand ketone bodies in females. There were no abnormal clinical signs attributable to4-hydroxy-4-(3-hydroxy-1-butenyl)-3,5,5-trimethyl-2-cyclohexen-1-one in male orfemale groups receiving less than 1000 mg/kg bw per day.
Increased relative kidney weights were also reported in males of the 1000mg/kg bw per day group. At necropsy, enlarged livers were reported in males at200 mg/kg bw per day or more and in females at 1000 mg/kg bw per day.Histopathological examinations revealed hypertrophy of hepatocytes in the liver ofmales at 200 mg/kg bw per day or more and a ground glass–like appearance of theliver of males at 1000 mg/kg bw per day. Increased relative and absolute liverweights were reported in males receiving 40 mg/kg bw per day or more and infemales receiving 200 mg/kg bw per day or more. There were no abnormalhistopathological findings that corresponded with the enlarged liver in females(Imatanaka, 2003a).
Based on these results, the main changes caused by 4-hydroxy-4-(3-hydroxy-1-butenyl)-3,5,5-trimethyl-2-cyclohexen-1-one were revealed as effects onthe liver. Increased organ weights were reported in the kidney, but were notaccompanied by histopathological changes. Therefore, the NOAEL of 4-hydroxy-4-(3-hydroxy-1-butenyl)-3,5,5-trimethyl-2-cyclohexen-1-one was estimated to be40 mg/kg bw per day for this 14-day study (Imatanaka, 2003a).
In a follow-up 28-day study using the same protocol as above, groups ofCrj:CD(SD) IGS rats (10 of each sex per dose) were administered 4-hydroxy-4-(3-hydroxy-1-butenyl)-3,5,5-trimethyl-2-cyclohexen-1-one via gavage at doses of 0(control), 5, 25 and 125 mg/kg bw per day (Imatanaka, 2004). No changesattributable to 4-hydroxy-4-(3-hydroxy-1-butenyl)-3,5,5-trimethyl-2-cyclohexen-1-one were reported in general condition, body weight, food consumption, waterconsumption, urinalysis or haematological examination. In blood chemicalexaminations, increased -glutamyl transpeptidase activity was noted in thefemales of the 125 mg/kg bw per day group. Increased total protein levels werenoted in males of all groups; however, dose dependency was minor, and the effectswere considered incidental. Increased relative liver weights were noted in males ofthe 25 mg/kg bw per day group. Increased absolute and relative liver weights werenoted in males and females of the 125 mg/kg bw per day group. Upon necropsy,enlargement of the liver was observed in males and females of the 125 mg/kg bwper day group. Pelvic dilatation was also reported in the kidney of males in
26 ALICYCLIC KETONES, SECONDARY ALCOHOLS AND RELATED ESTERS (addendum)

the 5 and 125 mg/kg bw per day groups, but was not attributed to adminis-tration of 4-hydroxy-4-(3-hydroxy-1-butenyl)-3,5,5-trimethyl-2-cyclohexen-1-one. Inhistopathological examinations, centrilobular hypertrophy of hepatocytes wasreported in the liver of males and females in the 125 mg/kg bw per day group.Mineralization in the corticomedullary junction was also reported in the kidney offemales in the 125 mg/kg bw per day group, but was not considered attributable to4-hydroxy-4-(3-hydroxy-1-butenyl)-3,5,5-trimethyl-2-cyclohexen-1-one administra-tion, because the finding was also reported in the vehicle control group.
On the basis of the biochemical and histopathological observations of malesand females in the 125 mg/kg bw per day group, the NOAEL under the present studyconditions was concluded to be 25 mg/kg bw per day (Imatanaka, 2004).
(iv) (±)-2,6,10,10-Tetramethyl-1-oxaspiro[4.5]deca-2,6-dien-8-one(No. 2060)
In a range-finding study using the previously reported protocol (Imatanaka,2003c), groups of Crj:CD(SD) rats (four of each sex per dose) were administered2,6,10,10-tetramethyl-1-oxaspiro[4.5]deca-2,6-dien-8-one via gavage at doses of0, 16, 80 and 400 mg/kg bw per day for 14 days (Yoshitake, 2001c). In the highdose (400 mg/kg bw per day) group, clinical signs in females included decreasedspontaneous locomotion (4/4), decreased respiratory rate (1/4), stupor (1/4) andstaggering gait (4/4). Increases in total cholesterol level, -glutamyl transpeptidaseactivity, triglyceride level and blood urea nitrogen were also reported in females ofthe 400 mg/kg bw per day group. Blood chemistry revealed an increase in glutamicpyruvic transaminase (i.e. alanine aminotransferase) activities in males at 16, 80and 400 mg/kg bw per day.
In males and females of the high dose group, increases in absolute andrelative liver weights were reported. Also, increased relative weights of brain andadrenals were reported in females of the high dose group. Macroscopic examinationrevealed enlarged livers in one male and one female in the high dose group (400mg/kg bw per day). In males, this corresponded with histopathological findings,which included periportal fine vacuolization of hepatocytes, periportal prominentnucleoli of hepatocytes and solitary cysts of the renal cortex. There were nomacroscopic or microscopic findings related to the enlarged liver in females(Yoshitake, 2001c). Based on the lack of histological changes, the NOAEL wasconsidered to be 80 mg/kg bw per day.
In a follow-up 28-day study using the same protocol as above, groups ofCrj:CD(SD) IGS rats (10 of each sex per dose) were administered 2,6,10,10-tetramethyl-1-oxaspiro[4.5]deca-2,6-dien-8-one via gavage at doses of 0 (control),12, 60 and 300 mg/kg bw per day (Imatanaka, 2003b). No changes attributable to2,6,10,10-tetramethyl-1-oxaspiro[4.5]deca-2,6-dien-8-one were reported in bodyweight, food consumption, water consumption, haematological examination orurinalysis. Decreased spontaneous locomotion, staggering gait and stupor werereported as changes considered to be attributable to administration of 2,6,10,10-tetramethyl-1-oxaspiro[4.5]deca-2,6-dien-8-one to females in the 300 mg/kg bw perday group. Salivation was reported in males and females in the 300 mg/kg bw per
ALICYCLIC KETONES, SECONDARY ALCOHOLS AND RELATED ESTERS (addendum) 27

day group on day 0, with the incidence of salivation increasing in the first 2 weeksafter administration. Staining of the lower abdomen in males in the 300 mg/kg bwper day group was a secondary change accompanying moist hair caused bysalivation.
Increased -glutamyl transpeptidase activities, total cholesterol levels andtriglyceride levels in males and females and increased glutamic pyruvictransaminase (i.e. alanine aminotransferase) activities in males were reported atthe end of administration in the 300 mg/kg bw per day group. Increased absoluteliver weights in females in the 300 mg/kg bw per day group were reported, as wellas increased relative liver weights (considered an adaptive change) in femalesreceiving 60 or 300 mg/kg bw per day and in males receiving 300 mg/kg bwper day. Upon necropsy, enlargement of the liver and spleen were also reported infemales of the 300 mg/kg bw per day group; these changes corresponded tohistopathological changes, which included diffuse hypertrophy of hepatocytes,increased mitoses of hepatocytes, microgranuloma and periportal lipid droplets ofhepatocytes and increased extramedullary haematopoiesis in the spleen. In males,increased hyaline droplets were reported in the kidney in the 300 mg/kg bw per daygroup. However, these findings were also reported in the vehicle control group andare likely attributable to -2u-globulin nephropathy of the male rat. Therefore, thismode of action is not relevant to human renal toxicity and is not indicative of a riskto humans (Capen et al., 1999).
On the basis of the biochemical and histopathological observations of malesand females in the 300 mg/kg bw per day group, the NOAEL under the present studyconditions was concluded to be 60 mg/kg bw per day (Imatanaka, 2003b).
(d) Genotoxicity studies
Genotoxicity data (in vitro and in vivo) are available for 5 of the 12 flavouringagents in this group (Nos 2051, 2052, 2057, 2058 and 2060). Additionally, studiesof in vitro genotoxicity have been reported on five flavouring agents in this groupthat were previously evaluated (Annex 1, reference 160). The results of all of thesestudies are summarized in Table 5 and described below.
(i) In vitro
No indication of mutagenic potential was reported in the Ames test whenSalmonella typhimurium strains TA98, TA100, TA1535, TA1537 and TA1538 wereincubated in the presence of cyclohexanone diethyl ketal (No. 2051) at 15–5000 μg/plate with or without S9 activation, using both the direct plate incorporation andpreincubation methods (Thompson, 2004). In the direct plate incorporation method,an increase in toxicity was reported in strain TA100 at 5000 μg/plate in the presenceand absence of liver activation. With the preincubation method, the test materialexhibited toxicity to all bacterial strains from 1500 and 500 μg/plate in the presenceand absence of S9 activation, respectively. A light, oily precipitate was reported at5000 μg/plate, but did not prevent scoring of revertant colonies (Thompson, 2004).
28 ALICYCLIC KETONES, SECONDARY ALCOHOLS AND RELATED ESTERS (addendum)

Tabl
e 5.
Stu
dies
of g
enot
oxic
ity w
ith a
licyc
lic k
eton
es, s
econ
dary
alc
ohol
s an
d re
late
d es
ters
use
d as
flav
ouri
ngag
ents
No.
Age
ntE
nd-p
oint
Tes
t obj
ect
Dos
e or
conc
entr
atio
nR
esul
tsR
efer
ence
In v
itro
2051
Cyc
lohe
xano
ne d
ieth
ylke
tal
Rev
erse
mut
atio
nS
alm
onel
la ty
phim
uriu
m T
A98
,T
A10
0, T
A15
35, T
A15
37 a
ndT
A15
38
15–5
000
μg/p
late
with
or
with
out S
9ac
tivat
ion
Neg
ativ
ea,b,
cT
hom
pson
(200
4)
2051
Cyc
lohe
xano
ne d
ieth
ylke
tal
Rev
erse
mut
atio
nS
. typ
him
uriu
m T
A98
, TA
100,
TA
1535
, TA
1537
and
TA
1538
15–5
000
μg/p
late
with
or
with
out S
9ac
tivat
ion
Neg
ativ
ea,d,
eT
hom
pson
(200
4)
2052
2-C
yclo
hexe
none
Rev
erse
mut
atio
nS
. typ
him
uriu
m T
A97
, TA
98, T
A10
0an
d T
A15
3510
, 33,
100
, 333
and
1000
μg/
plat
eN
egat
ivea,
bN
TP
(19
94)
2052
2-C
yclo
hexe
none
Rev
erse
mut
atio
nS
. typ
him
uriu
m T
A10
024
0, 3
60, 7
21 a
nd14
42 μ
g/m
lf
Slig
htly
posi
tivea,
g
Lutz
et a
l. (1
982)
2057
4-(2
-But
enyl
iden
e)-3
,5,5
-tr
imet
hylc
yclo
hex-
2-en
-1-
one
Rev
erse
mut
atio
nS
. typ
him
uriu
m T
A98
, TA
100,
TA
1535
and
TA
1537
9.38
, 18.
8, 3
7.5,
75, 1
50 a
nd 3
00 μ
g/pl
ate
Neg
ativ
ea,b,
hO
tsuk
a (2
000)
2057
4-(2
-But
enyl
iden
e)-3
,5,5
-tr
imet
hylc
yclo
hex-
2-en
-1-
one
Rev
erse
mut
atio
nE
sche
richi
a co
li st
rain
WP
2uvr
A18
.8, 3
7.5,
75,
150
,30
0 an
d 60
0 μg
/pl
ate
Neg
ativ
ea,b,
fO
tsuk
a (2
000)
2057
4-(2
-But
enyl
iden
e)-3
,5,5
-tr
imet
hylc
yclo
hex-
2-en
-1-
one
Chr
omos
omal
aber
ratio
nC
hine
se h
amst
er lu
ng fi
brob
last
cel
ls31
.3, 6
2.5
and
125
μg/m
li
Neg
ativ
eiA
jimi (
2000
a)
50, 1
00 a
nd20
0 μg
/mlj
Slig
htly
posi
tivej
ALICYCLIC KETONES, SECONDARY ALCOHOLS AND RELATED ESTERS (addendum) 29

Tabl
e 5
(con
td)
No.
Age
ntE
nd-p
oint
Tes
t obj
ect
Dos
e or
conc
entr
atio
nR
esul
tsR
efer
ence
2058
4-H
ydro
xy-4
-(3-
hydr
oxy-
1-bu
teny
l)-3,
5,5-
trim
ethy
l-2-
cycl
ohex
en-1
-one
Rev
erse
mut
atio
nS
. typ
him
uriu
m T
A98
, TA
100,
TA
1535
and
TA
1537
156,
313
, 625
,12
50, 2
500
and
5000
μg/
plat
e
Neg
ativ
ea,b
Oza
ki (
2000
a)
2058
4-H
ydro
xy-4
-(3-
hydr
oxy-
1-bu
teny
l)-3,
5,5-
trim
ethy
l-2-
cycl
ohex
en-1
-one
Rev
erse
mut
atio
nE
. col
i str
ain
WP
2uvr
A15
6, 3
13, 6
25,
1250
, 250
0 an
d50
00 μ
g/pl
ate
Neg
ativ
ea,b
Oza
ki (
2000
a)
2058
4-H
ydro
xy-4
-(3-
hydr
oxy-
1-bu
teny
l)-3,
5,5-
trim
ethy
l-2-
cycl
ohex
en-1
-one
Chr
omos
omal
aber
ratio
nC
hine
se h
amst
er lu
ng fi
brob
last
cel
ls31
3, 6
25, 1
250,
2500
and
5000
μg/
ml
Neg
ativ
eO
zaki
(20
00b)
2060
(±)-
2,6,
10,1
0-T
etra
met
hyl-1
-ox
aspi
ro[4
.5]d
eca-
2,6-
dien
-8-
one
Rev
erse
mut
atio
nS
. typ
him
uriu
m T
A98
, TA
100,
TA
1535
and
TA
1537
19.5
, 39.
1, 7
8.1,
156,
313
, 625
and
1250
μg/
plat
e
Neg
ativ
ea,b,
kO
tsuk
a (1
999)
2060
(±)-
2,6,
10,1
0-T
etra
met
hyl-1
-ox
aspi
ro[4
.5]d
eca-
2,6-
dien
-8-
one
Rev
erse
mut
atio
nE
. col
i str
ain
WP
2uvr
A19
.5, 3
9.1,
78.
1,15
6, 3
13, 6
25 a
nd12
50 μ
g/pl
ate
Neg
ativ
ea,b,
lO
tsuk
a (1
999)
2060
(±)-
2,6,
10,1
0-T
etra
met
hyl-1
-ox
aspi
ro[4
.5]d
eca-
2,6-
dien
-8-
one
Chr
omos
omal
aber
ratio
nC
hine
se h
amst
er lu
ng fi
brob
last
cel
ls10
0, 2
00 a
nd40
0 μg
/mli
150,
300
and
600
μg/m
lj
Neg
ativ
eaA
jimi (
1999
a)
1100
Cyc
lohe
xano
neR
ever
se m
utat
ion
S. t
yphi
mur
ium
TA
98 a
nd T
A10
01.
0 an
d 98
μg/
plat
em (
0.01
and
1 m
mol
/l)
Neg
ativ
ea,b
Kub
o, U
rano
&U
tsum
i (20
02)
30 ALICYCLIC KETONES, SECONDARY ALCOHOLS AND RELATED ESTERS (addendum)

Tabl
e 5
(con
td)
No.
Age
ntE
nd-p
oint
Tes
t obj
ect
Dos
e or
conc
entr
atio
nR
esul
tsR
efer
ence
1109
2-se
c-B
utyl
cycl
ohex
anon
eR
ever
sem
utat
ion
S. t
yphi
mur
ium
TA
98, T
A10
0, T
A10
2,T
A15
35 a
nd T
A15
3710
, 33,
100
, 333
,10
00 a
nd 2
500
μg/
plat
e
Neg
ativ
ea,b,
nP
oth
(200
3b)
1109
2-se
c-B
utyl
cycl
ohex
anon
eR
ever
sem
utat
ion
S. t
yphi
mur
ium
TA
98, T
A10
0, T
A10
2,T
A15
35 a
nd T
A15
3733
, 100
, 333
, 100
0,25
00 a
nd 5
000
μg/
plat
e
Neg
ativ
ea,d,
nP
oth
(200
3b)
1112
Isop
horo
neR
ever
sem
utat
ion
S. t
yphi
mur
ium
TA
98 a
nd T
A10
01.
4 an
d 13
8 μg
/pla
teo
(0.0
1 an
d 1
mm
ol/l)
Neg
ativ
ea,b
Kub
o, U
rano
&U
tsum
i (20
02)
1113
3-M
ethy
l-5-p
ropy
l-2-
cycl
ohex
en-1
-one
Rev
erse
mut
atio
nS
. typ
him
uriu
m T
A98
, TA
100,
TA
102,
TA
1535
and
TA
1537
78.1
3, 1
56.3
, 312
.5,
625
and
1250
μg/
plat
ei
78.1
3, 1
56.3
, 312
.5,
625
and
1250
μg/
plat
ej
Neg
ativ
ea,d,
pH
addo
uk (
2004
)
1113
3-M
ethy
l-5-p
ropy
l-2-
cycl
ohex
en-1
-one
Rev
erse
mut
atio
nS
. typ
him
uriu
m T
A98
, TA
100,
TA
102,
TA
1535
and
TA
1537
14.6
5, 2
9.3,
58.
59,
117.
2 an
d 23
4.4
μg/
plat
ei
58.5
9, 1
17.2
, 234
.4,
468.
8, 9
37.5
and
1875
μg/
plat
ej
Neg
ativ
ea,b,
qH
addo
uk (
2004
)
1114
3-M
ethy
l-2-(
2-pe
nten
yl)-
2-cy
clop
ente
n-1-
one
Rev
erse
mut
atio
nS
. typ
him
uriu
m T
A98
, TA
100,
TA
102,
TA
1535
and
TA
1537
3, 1
0, 3
3, 1
00, 3
33,
1000
and
250
0 μg
/pl
ate
Neg
ativ
ea,b,
rP
oth
(200
3a)
ALICYCLIC KETONES, SECONDARY ALCOHOLS AND RELATED ESTERS (addendum) 31

Tabl
e 5
(con
td)
No.
Age
ntE
nd-p
oint
Tes
t obj
ect
Dos
e or
conc
entr
atio
nR
esul
tsR
efer
ence
1114
3-M
ethy
l-2-(
2-pe
nten
yl)-
2-cy
clop
ente
n-1-
one
Rev
erse
mut
atio
nS
. typ
him
uriu
m T
A98
, TA
100,
TA
102,
TA
1535
and
TA
1537
3, 1
0, 3
3, 1
00, 3
33,
1000
and
250
0 μg
/pl
ate
Neg
ativ
ea,c,
rP
oth
(200
3a)
In v
ivo
2052
2-C
yclo
hexe
none
Mic
ronu
cleu
sas
say
Mic
e4.
2, 8
.4 a
nd 1
6.8
mg/
kg b
ws (
2.5,
5.0
and
10 p
pm)
Neg
ativ
eC
unni
ngha
m e
tal
. (20
01)
2052
2-C
yclo
hexe
none
Mic
ronu
cleu
sas
say
Rat
s1.
6, 3
.1 a
nd 6
.2m
g/kg
bw
s (2.
5, 5
.0an
d 10
ppm
)
Neg
ativ
eC
unni
ngha
m e
tal
. (20
01)
2057
4-(2
-But
enyl
iden
e)-3
,5,5
-tr
imet
hylc
yclo
hex-
2-en
-1-o
neM
icro
nucl
eus
assa
yM
ice
125,
250
and
500
mg/
kg b
wt
Neg
ativ
eA
jimi (
2000
b)
2058
4-H
ydro
xy-4
-(3-
hydr
oxy-
1-bu
teny
l)-3,
5,5-
trim
ethy
l-2-
cycl
ohex
en-1
-one
Mic
ronu
cleu
sas
say
Mic
e25
0, 5
00 a
nd 1
000
mg/
kg b
wt
Neg
ativ
eT
oya
(200
0);
Ishi
da (
2008
)
2060
(±)-
2,6,
10,1
0-T
etra
met
hyl-1
-ox
aspi
ro[4
.5]d
eca-
2,6-
dien
-8-
one
Mic
ronu
cleu
sas
say
Mic
e25
0, 5
00 a
nd 1
000
mg/
kg b
wt
Neg
ativ
eA
jimi (
1999
b)
a W
ith a
nd w
ithou
t met
abol
ic a
ctiv
atio
n.b
Pre
incu
batio
n m
etho
d.c
Cyt
otox
icity
was
obs
erve
d in
all
bact
eria
l str
ains
from
150
0 an
d 50
0 μg
/pla
te in
the
pres
ence
and
abs
ence
of S
9 ac
tivat
ion,
res
pect
ivel
y.
32 ALICYCLIC KETONES, SECONDARY ALCOHOLS AND RELATED ESTERS (addendum)

Tabl
e 5
(con
td)
d S
tand
ard
plat
e in
corp
orat
ion
met
hod.
e C
ytot
oxic
ity w
as r
epor
ted
in s
trai
n T
A10
0 at
500
0 μg
/pla
te in
the
pres
ence
and
abs
ence
of l
iver
act
ivat
ion.
f C
alcu
late
d w
ith a
rel
ativ
e m
olec
ular
mas
s of
96.
13.
g C
ytot
oxic
ity w
as o
bser
ved
at 7
21 a
nd 1
442
μg/m
l.h
Cyt
otox
icity
was
obs
erve
d in
all
stra
ins
at c
once
ntra
tions
gre
ater
than
150
μg/
plat
e w
ith a
nd w
ithou
t met
abol
ic a
ctiv
atio
n.i
With
out m
etab
olic
act
ivat
ion.
j W
ith m
etab
olic
act
ivat
ion.
k C
ytot
oxic
ity w
as o
bser
ved
in fo
ur S
. typ
him
uriu
m s
trai
ns a
t con
cent
ratio
ns o
f 625
μg/
plat
e or
gre
ater
.l
Cyt
otox
icity
was
obs
erve
d in
E. c
oli a
t a c
once
ntra
tion
of 1
250
μg/p
late
.m
Cal
cula
ted
with
a r
elat
ive
mol
ecul
ar m
ass
of 9
8.14
.n
Cyt
otox
icity
was
obs
erve
d in
all
stra
ins
at c
once
ntra
tions
gre
ater
than
250
0 an
d 10
00 μ
g/pl
ate
with
and
with
out S
9 ac
tivat
ion,
res
pect
ivel
y.o
Cal
cula
ted
with
a r
elat
ive
mol
ecul
ar m
ass
of 1
38.2
1.p
Cyt
otox
icity
was
obs
erve
d in
str
ains
TA
100
and
TA
102
at a
con
cent
ratio
n of
125
0 μg
/pla
te w
ithou
t S9
activ
atio
n.q
Cyt
otox
icity
was
obs
erve
d in
all
stra
ins
at c
once
ntra
tions
gre
ater
than
or e
qual
to 4
68.8
and
234
.4 μ
g/pl
ate
with
and
with
out S
9 ac
tivat
ion,
resp
ectiv
ely.
r C
ytot
oxic
ity w
as o
bser
ved
in a
ll st
rain
s at
con
cent
ratio
ns g
reat
er th
an 1
000
μg/p
late
with
and
with
out m
etab
olic
act
ivat
ion.
s E
xpos
ure
via
inha
latio
n; c
onve
rsio
n ca
lcul
ated
by
the
met
hod
desc
ribed
by
Fas
sett
(197
8).
t A
dmin
iste
red
via
intr
aper
itone
al in
ject
ion.
ALICYCLIC KETONES, SECONDARY ALCOHOLS AND RELATED ESTERS (addendum) 33

No evidence of mutagenicity was observed when 2-cyclohexenone (No.2052) at 10, 33, 100, 333 and 1000 μg/plate was incubated with S. typhimuriumstrains TA97, TA98, TA100 and TA1535 using the preincubation method, with andwithout S9 liver activation (NTP, 1994).
Evidence of slight mutagenicity was reported in a modified S. typhimuriummutagenicity assay in which strain TA100 was incubated with 2-cyclohexenone (No.2052) at concentrations of 240, 360, 721 and 1442 μg/ml using the preincubationmethod. Following exposure to the test material (721 and 1442 μg/ml) for 48 h at37 °C, the mutagenic activity was determined to be 1 and 3 revertants permicromole, with and without S9 liver activation, respectively. However, thesereversions occurred at concentrations (721 and 1442 μg/ml) that were cytotoxic tothe bacteria, as indicated by a cell survival rate of approximately 50% (Lutz et al.,1982).
No evidence of mutagenicity was observed when 4-(2-butenylidene)-3,5,5-trimethylcyclohex-2-en-1-one (No. 2057) at 9.38, 18.8, 37.5, 75, 150 and 300 μg/plate was incubated with S. typhimurium strains TA98, TA100, TA1535 and TA1537using the preincubation method, with and without metabolic activation (Otsuka,2000). Similar results were obtained when 4-(2-butenylidene)-3,5,5-trimethyl-cyclohex-2-en-1-one at 18.8, 37.5, 75, 150, 300 and 600 μg/plate was incubatedwith Escherichia coli strain WP2uvrA in the presence or absence of metabolicactivation (Otsuka, 2000).
In a chromosomal aberration assay, Chinese hamster lung fibroblast (CHL/IU) cells were incubated with 4-(2-butenylidene)-3,5,5-trimethylcyclohex-2-en-1-one (No. 2057) at 31.3, 62.5 and 125 μg/ml without metabolic activation or 50, 100and 200 μg/ml with metabolic activation for 6 h. Chromosomal aberrations wereobserved without metabolic activation, but no concentration dependence wasreported (Ajimi, 2000a). In a continuous treatment study in which 4-(2-butenylidene)-3,5,5-trimethylcyclohex-2-en-1-one at 25, 50 and 100 μg/ml wasincubated with CHL/IU cells for 24 h, no chromosomal aberrations were reported.As there was no concentration dependence for the induction of chromosomalaberrations and because most aberrations occurred at dose levels associatedwith high toxicity, 4-(2-butenylidene)-3,5,5-trimethylcyclohex-2-en-1-one wasconsidered not to be genotoxic (Ajimi, 2000a).
No evidence of mutagenicity was observed when 4-hydroxy-4-(3-hydroxy-1-butenyl)-3,5,5-trimethyl-2-cyclohexen-1-one (No. 2058) at 156, 313, 625, 1250,2500 and 5000 μg/plate was incubated with S. typhimurium strains TA98, TA100,TA1535 and TA1537 using the preincubation method, with and without metabolicactivation. Similar results were obtained when 4-hydroxy-4-(3-hydroxy-1-butenyl)-3,5,5-trimethyl-2-cyclohexen-1-one at 156, 313, 625, 1250, 2500 and5000 μg/plate was incubated with Escherichia coli strain WP2uvrA in the presenceor absence of metabolic activation (Ozaki, 2000a).
In a chromosomal aberration assay, Chinese hamster lung fibroblast (CHL/IU) cells were incubated with 4-hydroxy-4-(3-hydroxy-1-butenyl)-3,5,5-trimethyl-2-cyclohexen-1-one (No. 2058) at 313, 625, 1250, 2500 and 5000 μg/ml with orwithout metabolic activation for 6 h (Ozaki, 2000b). Chromosomal aberrations
34 ALICYCLIC KETONES, SECONDARY ALCOHOLS AND RELATED ESTERS (addendum)

were not observed with or without metabolic activation. In the continuous treatmentstudy in which 4-hydroxy-4-(3-hydroxy-1-butenyl)-3,5,5-trimethyl-2-cyclohexen-1-one at 313, 625, 1250, 2500 and 5000 μg/ml was incubated with CHL/IU cells for24 h, chromosomal aberrations were reported, but there was no dose dependence.As there was no concentration dependence for the induction of chromosomalaberrations, 4-hydroxy-4-(3-hydroxy-1-butenyl)-3,5,5-trimethyl-2-cyclohexen-1-one was considered not to be genotoxic (Ozaki, 2000b).
No evidence of mutagenicity was observed when (±)-2,6,10,10-tetra-methyl-1-oxaspiro[4.5]deca-2,6-dien-8-one (No. 2060) at 19.5, 39.1, 78.1, 156, 313,625 and 1250 μg/plate was incubated with S. typhimurium strains TA98, TA100,TA1535 and TA1537 using the preincubation method, with and withoutmetabolic activation (Otsuka, 1999). Similar results were obtained when (±)-2,6,10,10-tetramethyl-1-oxaspiro[4.5]deca-2,6-dien-8-one at 19.5, 39.1, 78.1, 156,313 and 625 μg/plate was incubated with Escherichia coli strain WP2uvrA in thepresence or absence of metabolic activation (Otsuka, 1999).
In a chromosomal aberration assay, Chinese hamster lung fibroblast (CHL/IU) cells were incubated with (±)-2,6,10,10-tetramethyl-1-oxaspiro[4.5]deca-2,6-dien-8-one (No. 2060) at 100, 200 and 400 μg/ml without metabolic activation or150, 300 and 600 μg/ml with metabolic activation for 6 h. Chromosomal aberrationswere not observed with or without metabolic activation. In a continuous treatmentstudy in which (±)-2,6,10,10-tetramethyl-1-oxaspiro[4.5]deca-2,6-dien-8-one at 75,150 and 300 μg/ml was incubated with CHL/IU cells for 24 h, no chromosomalaberrations were reported (Ajimi, 1999a).
No indication of mutagenic potential was reported in the Ames test when S.typhimurium strains TA98 and TA100 were incubated in the presence (0.01 and1 mmol/l) of either cyclohexanone (No. 1100) or isophorone (No. 1112) with orwithout S9 activation (Kubo, Urano & Utsumi, 2002).
No indication of mutagenic potential was reported in the Ames test when S.typhimurium strains TA98, TA100, TA1535, TA1537 and TA1538 were incubatedin the presence of 33–5000 μg (0.2–32.4 μmol) of 2-sec-butylcyclohexanone (No.1109) per plate with S9 activation or 10–2500 μg (0.06–16.2 μmol) per plate withoutS9 activation. Toxic effects (i.e. reduction in the number of revertants) wereobserved with metabolic activation at concentrations greater than 2500 μg/plate innearly all strains. Precipitation of 2-sec-butylcyclohexanone was not observed(Poth, 2003b).
No indication of mutagenic potential was reported when S. typhimuriumstrains TA98, TA100, TA102, TA1535 and TA1537 were incubated according to thedirect plate incorporation method in the presence of 3-methyl-5-propyl-2-cyclohexen-1-one (No. 1113) at 78–1250 μg (0.5–8.2 μmol) per plate with andwithout S9 activation. A moderate toxicity was noted in strains TA100 and TA102at a dose level of 1250 μg/plate, without S9 activation (Haddouk, 2004). Similarly,no indication of mutagenic potential was reported when the experiment wasperformed according to the preincubation method, in which S. typhimurium wasincubated in the presence of 3-methyl-5-propyl-2-cyclohexen-1-one at 14.65–234.4μg/plate without S9 activation and at 58.59–1875 μg/plate with S9 activation. A
ALICYCLIC KETONES, SECONDARY ALCOHOLS AND RELATED ESTERS (addendum) 35

moderate to marked toxicity was noted at 234.4 μg/plate in all bacterial strains usedwithout S9 activation, whereas moderate to marked toxicity was reported in variousstrains at dose levels greater than 468.8 μg/plate with liver activation. Precipitationof 3-methyl-5-propyl-2-cyclohexen-1-one was not observed (Haddouk, 2004).
No indication of mutagenic potential was reported in the Ames test when S.typhimurium strains TA98, TA100, TA102, TA1535, TA1537 and TA1538 wereincubated (by both the standard plate incorporation method and the preincubationmethod) in the presence of 3-methyl-2-(2-pentenyl)-2-cyclopenten-1-one (No.1114) at 3–2500 μg (0.02–15.2 μmol) per plate with or without S9 activation. In thepresence and absence of S9 mix, the test material was bacteriotoxic towards allstrains at concentrations greater than 2500 μg/plate. Precipitation was not observed(Poth, 2003a).
(ii) In vivo
No increase in the incidence of micronucleated polychromatic erythrocytesin blood smears was observed when male and female mice were administered 2.5,5.0 or 10 ppm 2-cyclohexenone (No. 2052) (corresponding to systemic exposurelevels of approximately 4.2, 8.4 and 16.8 mg/kg bw per day; Fassett, 1978) for 6 h/day via inhalation (Cunningham et al., 2001).
In a similar assay, no increase in the incidence of micronucleatedpolychromatic erythrocytes in blood smears was observed when male and femalerats were administered 2.5, 5.0 or 10 ppm 2-cyclohexenone (No. 2052)(corresponding to systemic exposure levels of approximately 1.6, 3.1 and 6.2 mg/kg bw per day; Fassett, 1978) for 6 h/day via inhalation (Cunningham et al., 2001).
No increase in the incidence of micronucleated polychromatic erythrocytesin 24 or 48 h femoral bone marrow was observed when male and female ICR micewere administered 125, 250 or 500 mg/kg bw per day of 4-(2-butenylidene)-3,5,5-trimethylcyclohex-2-en-1-one (No. 2057) via intraperitoneal injection (Ajimi, 2000b).
No increase in the incidence of micronucleated polychromatic erythrocytesin 24 or 48 h femoral bone marrow was observed when male and female ICR micewere administered 250, 500 or 1000 mg/kg bw per day of 4-hydroxy-4-(3-hydroxy-1-butenyl)-3,5,5-trimethyl-2-cyclohexen-1-one (No. 2058) via intraperitoneal injection(Toya, 2000; Ishida, 2008).
No increase in the incidence of micronucleated polychromatic erythrocytesin 24 or 48 h femoral bone marrow was observed when male and female ICRmice were administered 250, 500 or 1000 mg/kg bw per day of (±)-2,6,10,10-tetramethyl-1-oxaspiro[4.5]deca-2,6-dien-8-one (No. 2060) via intraperitonealinjection (Ajimi, 1999b).
(iii) Cytotoxicity, genotoxicity and glutathione depletion
In order to evaluate the cytotoxic and genotoxic potentials of 2-cyclo-hexenone (No. 2052) as compared with structurally related 2-alkenals, Glaab et al.(2001) performed a series of experiments in mammalian cell lines. V79 cells(Chinese hamster lung fibroblasts) were incubated with 2-cyclohexenone for 1 h
36 ALICYCLIC KETONES, SECONDARY ALCOHOLS AND RELATED ESTERS (addendum)

and monitored for concentration-dependent cytotoxicity and subsequently for 24 hto evaluate growth inhibition. The cytotoxicity of 2-cyclohexenone expressed as amedian lethal concentration (LC50) (based on membrane integrity) was reported tobe 4.75 mmol/l. As such, 2-cyclohexenone was slightly less effective as a cytotoxicagent than cinnamaldehyde (No. 656) and (E)-hexenal (No. 1353), with LC50 valuesof 4.45 and 3.67 mmol/l, respectively, or significantly less cytotoxic than (2E,6Z)-nona-2,6-dienal (No. 1186), which had an LC50 value of 0.270 mmol/l. The medianinhibitory concentration (IC50) for inhibition of cell growth of V79 cells (percentageof control) was 0.015 mmol/l. Thus, 2-cyclohexenone was less cytotoxic thancinnamaldehyde (No. 656), (E)-hexenal (No. 1353) and (2E,6Z)-nona-2,6-dienal(No. 1186), which had IC50 values of 0.010, 0.017 and 0.005 mmol/l, respectively(Glaab et al., 2001).
The ability of 2-cyclohexenone to cause deoxyribonucleic acid (DNA)damage was evaluated using both a standard comet assay in V79 cells as well asa modified comet assay, in which a modified (alkaline) single cell gel electrophoresisis screened for oxidized purines following lysis of Caco-2 cells. DNA-damagingpotential was expressed with a DC50 value, the concentration at which a test materialwould induce DNA damage in 50% of the cells. In both assays, 2-cyclohexenonewas shown to exhibit a comparable level of DNA-damaging potential compared withthat of 2-alkenals. In V79 cells, 2-cyclohexenone had a DC50 value of 0.27 mmol/l,whereas cinnamaldehyde (No. 656), (E)-hexenal (No. 1353) and (2E,6Z)-nona-2,6-dienal (No. 1186) had DC50 values of 0.49, 0.17 and 0.11 mmol/l, respectively. InCaco-2 cells, 2-cyclohexenone had a DC50 value of 0.46 mmol/l, whereascinnamaldehyde (No. 656), (E)-hexenal (No. 1353) and (2E,6Z)-nona-2,6-dienal(No. 1186) had DC50 values of 0.54, 0.25 and 0.12 mmol/l, respectively (Glaab etal., 2001).
The tendency of 2-cyclohexenone to cause glutathione depletion wasinvestigated using a kinetic assay, in which total glutathione was determined in V79,Caco-2 and primary human colon cells (Glaab et al., 2001). In V79 cells, 2-cyclohexenone and the majority of the other compounds induced a depletion ofglutathione down to approximately 20% of control at concentrations in the rangefrom 10 to 100 μmol/l. In Caco-2 cells and primary human colon cells, about 5-foldhigher concentrations of the test materials had to be incubated with the cells in orderto induce total glutathione depletions similar to those in the V79 cells (Glaab et al.,2001).
In conclusion, 2-cyclohexenone (No. 2052) was demonstrated to inducecytotoxicity, growth inhibition and DNA damage and to deplete total glutathione inthree mammalian cell lines. DNA damage was observed at concentrations that were10-fold or more lower than those necessary to induce cytotoxicity in each cell line.However, glutathione depletion was observed at lower concentrations of 2-cyclohexenone than those required to induce DNA damage. In all cell lines, thisdepletion of glutathione resulted in an increased sensitivity towards reactive oxygenspecies (i.e. hydrogen peroxide), suggesting that the test material may potentiallycause an imbalance of intracellular pro- and anti-oxidants at micromole per litreconcentrations (Glaab et al., 2001). Therefore, it is likely that the DNA damagedemonstrated in these experiments is due to the increase in sensitivity of the cells
ALICYCLIC KETONES, SECONDARY ALCOHOLS AND RELATED ESTERS (addendum) 37

towards oxidative stress related to glutathione depletion. The authors noted that anon-genotoxic mechanism best explains these observed results. The effect ofglutathione depletion may, in part, be responsible for the report of genotoxicity in anin vitro unscheduled DNA synthesis assay using rat hepatocytes at a 10 μmol/lconcentration (Williams, Mori & McQueen, 1989).
The data indicate that the genotoxic potential of 2-cyclohexenone (No. 2052)is low when used as a flavouring agent.
3. REFERENCES
Ajimi S (1999a). Chromosomal aberration test of JTA-3 in cultured mammalian cells.Unpublished report to the Flavor and Extract Manufacturers Association, Washington, DC,USA. Submitted to WHO by the International Organization of the Flavor Industry, Brussels,Belgium.
Ajimi S (1999b). Micronucleus test of JTA-3 in rodents. Unpublished report to the Flavor andExtract Manufacturers Association, Washington, DC, USA. Submitted to WHO by theInternational Organization of the Flavor Industry, Brussels, Belgium.
Ajimi S (2000a). Chromosomal aberration test of JTA-6 in cultured mammalian cells.Unpublished report to the Flavor and Extract Manufacturers Association, Washington, DC,USA. Submitted to WHO by the International Organization of the Flavor Industry, Brussels,Belgium.
Ajimi S (2000b). Micronucleus test of JTA-6 in rodents. Unpublished report to the Flavor andExtract Manufacturers Association, Washington, DC, USA. Submitted to WHO by theInternational Organization of the Flavor Industry, Brussels, Belgium.
Anders MW (1989). Biotransformation and bioactivation of xenobiotics by the kidney. In:Hutson DH, Caldwell J, Paulson GD, eds. Intermediary xenobiotic metabolism inanimals. New York, NY, USA, Taylor and Francis, pp. 81–97.
Capen CC et al. (1999). Species differences in thyroid, kidney and urinary bladdercarcinogenesis. Lyon, France, International Agency for Research on Cancer (IARCScientific Publication No. 147).
Cramer GM, Ford RA, Hall RL (1978). Estimation of toxic hazard—a decision tree approach.Food and Cosmetics Toxicology, 16:255–276.
Cunningham ML et al. (2001). Inhalation toxicity studies of the , -unsaturated ketones: 2-cyclohexene-1-one. Inhalation Toxicology, 13:25–36.
Elliott TH, Parke DV, Williams RT (1959). Studies in detoxication. The metabolism of cyclo-[14C]hexane and its derivatives. Biochemical Journal, 72:193–200.
Fassett D (1978). Conversion of inhalation dose in parts per million to a dose in mg/kg.Personal communication to the Flavor and Extract Manufacturers Association,Washington, DC, USA. Submitted to WHO by the International Organization of the FlavorIndustry, Brussels, Belgium.
Gavin CL, Williams MC, Hallagan JB (2008). 2005 poundage and technical effects updatesurvey. Washington, DC, USA, Flavor and Extract Manufacturers Association.
Glaab V et al. (2001). DNA-damaging potential and glutathione depletion of 2-cyclohexene-1-one in mammalian cells, compared to food relevant 2-alkenals. Mutation Research,497:185–197.
Graffner-Nordberg M et al. (1998). Synthesis and enzyme hydrolysis of esters, constitutingsimple models of soft drugs. Chemical & Pharmaceutical Bulletin, 46(4):591–601.
Haddouk H (2004). Celery ketone bacterial reverse mutation test. Study No. 26508 MMO. CIT,Evreux, France. Unpublished report to the Research Institute for Fragrance Materials,
38 ALICYCLIC KETONES, SECONDARY ALCOHOLS AND RELATED ESTERS (addendum)

Woodcliff Lake, NJ, USA. Submitted to WHO by the International Organization of the FlavorIndustry, Brussels, Belgium.
Heymann E (1980). Carboxylesterases and amidases. In: Jakoby WB, ed. Enzymatic basicsof detoxification, 2nd ed. New York, NY, USA, Academic Press, pp. 291–323.
Imatanaka N (2003a). Repeated dose 14-day oral toxicity of JTA-2 in rodents. Unpublishedreport to the Flavor and Extract Manufacturers Association, Washington, DC, USA.Submitted to WHO by the International Organization of the Flavor Industry, Brussels,Belgium.
Imatanaka N (2003b). Repeated dose 28-day oral toxicity of JTA-3 in rodents. Unpublishedreport to the Flavor and Extract Manufacturers Association, Washington, DC, USA.Submitted to WHO by the International Organization of the Flavor Industry, Brussels,Belgium.
Imatanaka N (2003c). Repeated dose 28-day oral toxicity of JTA-6 in rodents. Unpublishedreport to the Flavor and Extract Manufacturers Association, Washington, DC, USA.Submitted to WHO by the International Organization of the Flavor Industry, Brussels,Belgium.
Imatanaka N (2004). Repeated dose 28-day oral toxicity of JTA-2 in rodents. Unpublishedreport to the Flavor and Extract Manufacturers Association, Washington, DC, USA.Submitted to WHO by the International Organization of the Flavor Industry, Brussels,Belgium.
International Organization of the Flavor Industry (2009). Interim inquiry on volume use andadded use levels for flavoring agents to be presented at the JECFA 73rd meeting.Submitted to WHO by the International Organization of the Flavor Industry, Brussels,Belgium.
Ishida S (2008). Micronucleus test of JTA-2 in rodents—final report amendment. Unpublishedreport to the Flavor and Extract Manufacturers Association, Washington, DC, USA.Submitted to WHO by the International Organization of the Flavor Industry, Brussels,Belgium.
Japan Flavor and Fragrance Materials Association (2005). JFFMA poundage survey 2005:Japanese inquiry on volume use. Unpublished report. Submitted to WHO by theInternational Organization of the Flavor Industry, Brussels, Belgium.
Krasavage WJ, O’Donoghue JL, Divincenzo GD (1982). Ketones. In: Clayton GD, Clayton FE,eds. Patty’s industrial hygiene and toxicology. Vol. IIC. Toxicology. New York, NY, USA,John Wiley and Sons, pp. 4709–4800.
Kubo T, Urano K, Utsumi H (2002). Mutagenicity characteristics of 255 environmentalchemicals. Journal of Health Science, 48(6):545–554.
Lutz D et al. (1982). Structure–mutagenicity relationship in , -unsaturated carbonyliccompounds and their corresponding allylic alcohols. Mutation Research, 93:305–315.
MacGregor JT et al. (1990). The in vivo erythrocyte micronucleus test: measurement at steadystate increases assay efficiency and permits integration with toxicity studies. Fundamentaland Applied Toxicology, 14:513–522.
Nijssen LM, van Ingen-Visscher CA, Donders JJM, eds (2009). VCF (Volatile Compounds inFood) database. Version 11.1.1. Zeist, Netherlands, TNO Quality of Life (http://www.vcf-online.nl/VcfHome.cfm).
NTP (1994). Summary of data on Salmonella typhimurium following an Ames reverse mutation(pre-incubation) assay with 2-cyclohexen-1-one. Draft report. Study No. A33655. ResearchTriangle Park, NC, USA, Department of Health and Human Services, National Institutes ofHealth, National Toxicology Program.
NTP (2009). Short-term individual animal non-neoplastic diagnoses of male F344 rats after13-week inhalation subchronic toxicity study of 2-cyclohexenone. Draft report. Study No.C92007. Research Triangle Park, NC, USA, Department of Health and Human Services,National Institutes of Health, National Toxicology Program.
ALICYCLIC KETONES, SECONDARY ALCOHOLS AND RELATED ESTERS (addendum) 39

Otsuka M (1999). Bacterial reverse mutation test of JTA-3. Unpublished report to the Flavorand Extract Manufacturers Association, Washington, DC, USA. Submitted to WHO by theInternational Organization of the Flavor Industry, Brussels, Belgium.
Otsuka M (2000). Bacterial reverse mutation test of JTA-6. Unpublished report to the Flavorand Extract Manufacturers Association, Washington, DC, USA. Submitted to WHO by theInternational Organization of the Flavor Industry, Brussels, Belgium.
Ozaki M (2000a). Bacterial reverse mutation test of JTA-2. Unpublished report to the Flavorand Extract Manufacturers Association, Washington, DC, USA. Submitted to WHO by theInternational Organization of the Flavor Industry, Brussels, Belgium.
Ozaki M (2000b). Chromosomal aberration test of JTA-2 in cultured mammalian cells.Unpublished report to the Flavor and Extract Manufacturers Association, Washington, DC,USA. Submitted to WHO by the International Organization of the Flavor Industry, Brussels,Belgium.
Poth A (2003a). Salmonella typhimurium reverse mutation assay with freskomenthe. Finalreport. Report No. 757002. RCC Cytotest Cell Research GMBH, Rossdorf, Germany.Unpublished report to the Research Institute for Fragrance Materials, Woodcliff Lake, NJ,USA. Submitted to WHO by the International Organization of the Flavor Industry, Brussels,Belgium.
Poth A (2003b). Salmonella typhimurium reverse mutation assay with jasmine cis. Final report.Study No. 845127. RCC Cytotest Cell Research GMBH, Rossdorf, Germany. Unpublishedreport to the Research Institute for Fragrance Materials, Woodcliff Lake, NJ, USA.Submitted to WHO by the International Organization of the Flavor Industry, Brussels,Belgium.
Thompson PW (2004). Rum acetal: reverse mutation assay “Ames test” using Salmonellatyphimurium. SPL Project No. 1895/010. SafePharm Laboratories, Derbyshire, England.Unpublished report to the Flavor and Extract Manufacturers Association, Washington DC,USA. Submitted to WHO by the International Organization of the Flavor Industry, Brussels,Belgium.
Toya H (2000). Micronucleus test of JTA-2 in rodents. Unpublished report to the Flavor andExtract Manufacturers Association, Washington, DC, USA. Submitted to WHO by theInternational Organization of the Flavor Industry, Brussels, Belgium.
Uzuka R (2002). Acute oral toxicity study of JTA-2 in rodents. Unpublished report to the Flavorand Extract Manufacturers Association, Washington, DC, USA. Submitted to WHO by theInternational Organization of the Flavor Industry, Brussels, Belgium.
White DA et al. (1990). Chemical synthesis of dual-radiolabelled cyclandelate and itsmetabolism in rat hepatocytes and mouse J774 cells. Xenobiotica, 20:71.
Williams GM, Mori H, McQueen CA (1989). Structure–activity relationships in the rathepatocyte DNA-repair test for 300 chemicals. Mutation Research, 221:263–286.
Yoshitake T (2001a). Acute oral toxicity study of JTA-6 in rodents. Unpublished report to theFlavor and Extract Manufacturers Association, Washington, DC, USA. Submitted to WHOby the International Organization of the Flavor Industry, Brussels, Belgium.
Yoshitake T (2001b). Acute oral toxicity study of JTA-3 in rodents. Unpublished report to theFlavor and Extract Manufacturers Association, Washington, DC, USA. Submitted to WHOby the International Organization of the Flavor Industry, Brussels, Belgium.
Yoshitake T (2001c). Repeated dose 14-day oral toxicity study of JTA-6 in rodents.Unpublished report to the Flavor and Extract Manufacturers Association, Washington, DC,USA. Submitted to WHO by the International Organization of the Flavor Industry, Brussels,Belgium.
Yoshitake T (2001d). Repeated dose 14-day oral toxicity study of JTA-3 in rodents.Unpublished report to the Flavor and Extract Manufacturers Association, Washington, DC,USA. Submitted to WHO by the International Organization of the Flavor Industry, Brussels,Belgium.
40 ALICYCLIC KETONES, SECONDARY ALCOHOLS AND RELATED ESTERS (addendum)

ALICYCLIC PRIMARY ALCOHOLS, ALDEHYDES, ACIDS AND RELATEDESTERS (addendum)
First draft prepared by
Dr S.M.F. Jeurissen,1 Dr M. DiNovi,2 Dr A. Mattia2 and Professor A.G.Renwick3
1 Centre for Substances and Integrated Risk Assessment, National Institutefor Public Health and the Environment, Bilthoven, Netherlands
2 Center for Food Safety and Applied Nutrition, Food and Drug Administration,College Park, Maryland, United States of America (USA)
3 School of Medicine, University of Southampton, Southampton, England
1. Evaluation ..............................................................................1.1 Introduction ......................................................................1.2 Assessment of dietary exposure .....................................1.3 Absorption, distribution, metabolism and elimination ......1.4 Application of the Procedure for the Safety Evaluation of
Flavouring Agents ...........................................................1.5 Consideration of combined intakes from use as flavouring
agents ..............................................................................1.6 Consideration of secondary components ........................1.7 Conclusion .......................................................................
2. Relevant background information ..........................................2.1 Explanation ......................................................................2.2 Additional considerations on intake .................................2.3 Biological data .................................................................
2.3.1 Biochemical data: absorption, distribution,metabolism and elimination ....................................
2.3.2 Toxicological studies ..............................................3. References.............................................................................
1. EVALUATION
1.1 Introduction
The Committee evaluated 11 additional flavouring agents belonging to thegroup of alicyclic primary alcohols, aldehydes, acids and related esters that wasevaluated previously. The additional flavouring agents included three saturated andunsaturated primary alcohols (Nos 1903–1905), four aldehydes (Nos 1900, 1902,1906 and 1908), two acids (Nos 1899 and 1907), one acetal (No. 1901) and one re-lated ester (No. 1898). The evaluations were conducted according to the Procedurefor the Safety Evaluation of Flavouring Agents (Figure 1, Introduction) (Annex 1,reference 131). None of these flavouring agents has previously been evaluated bythe Committee.
The Committee previously evaluated 26 other members of this group offlavouring agents at its fifty-ninth meeting (Annex 1, reference 160). The Committee
41414242
42
55555656565657
575766
- 41 -

concluded that all 26 flavouring agents in this group were of no safety concern atestimated dietary exposures.
Three of the 11 flavouring agents in this group are natural components offoods (Nos 1898, 1905 and 1906). Methyl dihydrojasmonate (No. 1898), forexample, has been detected in tea, 1,3-p-menthadien-7-al (No. 1906) in cumin seedand honey and p-menthan-7-ol (No. 1905) in cherries, citrus fruits, berries, dill andgrape brandy (Nijssen, van Ingen-Visscher & Donders, 2009).
1.2 Assessment of dietary exposure
The total annual volumes of production of the 11 flavouring agents in thisgroup are approximately 6321 kg in Europe (European Flavour and FragranceAssociation, 2004), 15 388 kg in the USA (Gavin, Williams & Hallagan, 2008) and93 kg in Japan (Japan Flavor and Fragrance Materials Association, 2005). Methyldihydrojasmonate (No. 1898) contributes the most to the total annual productionvolumes in Europe, Japan and the USA (100%, 94% and 100%, respectively).
The estimated dietary exposures for each of the flavouring agents,calculated either as the maximized survey-derived intake (MSDI) or using the singleportion exposure technique (SPET), are reported in Table 1. The highest dailydietary exposure is estimated for cis-4-(2,2,3-trimethylcyclopentyl)butanoic acid(No. 1899) (3000 μg, the SPET value obtained from non-alcoholic beverages),followed by methyl dihydrojasmonate (No. 1898) (1875 μg, the MSDI). For all butone of the other flavouring agents, the estimated daily dietary exposures werehigher using the SPET and were in the range of 0.01–240 μg. Reported annualvolumes of production of this group of flavouring agents and the calculated dailydietary exposures (MSDI and SPET) are summarized in Table 2.
1.3 Absorption, distribution, metabolism and elimination
Information on the hydrolysis, absorption, distribution, metabolism andelimination of flavouring agents belonging to the group of alicyclic primary alcohols,aldehydes, acids and related esters has previously been described in the report ofthe fifty-ninth meeting of the Committee (Annex 1, reference 160). Some additionaldata on absorption and metabolism have been submitted on one compoundevaluated previously (perillyl alcohol or p-mentha-1,8-dien-7-ol, No. 974) (O’Brien,2004), and these are in line with the information described in the report of the fifty-ninth meeting.
1.4 Application of the Procedure for the Safety Evaluation of FlavouringAgents
Step 1. In applying the Procedure for the Safety Evaluation of FlavouringAgents to the 11 flavouring agents in this group of alicyclic primary alcohols,aldehydes, acids and related esters, the Committee assigned 7 flavouring agents(Nos 1899, 1900 and 1902–1906) to structural class I, 3 flavouring agents (Nos1898, 1907 and 1908) to structural class II and 1 flavouring agent (No. 1901) tostructural class III (Cramer, Ford & Hall, 1978).
42 ALICYCLIC PRIMARY ALCOHOLS, ALDEHYDES, ACIDS AND RELATED ESTERS (addendum)

Tabl
e 1.
Sum
mar
y of
the
resu
lts o
f the
saf
ety
eval
uatio
ns o
f alic
yclic
pri
mar
y al
coho
ls, a
ldeh
ydes
, aci
ds a
nd r
elat
edes
ters
used
as
flavo
urin
g ag
ents
a,b,
c
Fla
vour
ing
agen
tN
o.C
AS
No.
and
str
uctu
reS
tep
A3/
B3d
Doe
s in
take
exce
ed th
eth
resh
old
for
hum
an in
take
?
Ste
p A
5/B
4e
Ade
quat
e m
argi
n of
saf
ety
for
the
flavo
urin
g ag
ent o
rre
late
d su
bsta
nces
?
Com
men
ts o
npr
edic
ted
met
abol
ism
Con
clus
ion
base
don
cur
rent
estim
ated
die
tary
expo
sure
Str
uctu
ral c
lass
I
cis-
4-(2
,2,3
-T
rimet
hylc
yclo
pent
yl)-
buta
noic
aci
d
1899
9571
36-8
0-0
OH
O
A3.
Yes
, SP
ET
:30
00A
5. Y
es. T
he N
OE
L of
12
mg/
kg b
w p
er d
ay fr
om a
90-
day
stud
y in
rat
s w
ith th
est
ruct
ural
ly r
elat
ed s
ubst
ance
2,2,
3-tr
imet
hylc
yclo
pent
-3-
en-1
-yl a
ceta
ldeh
yde
(No.
967)
(B
ritis
h In
dust
rial
Bio
logi
cal R
esea
rch
Ass
ocia
tion,
197
6) is
at l
east
240
times
the
estim
ated
dai
lydi
etar
y ex
posu
re to
No.
189
9w
hen
used
as
a fla
vour
ing
agen
t.
Not
e 1
No
safe
ty c
once
rn
ALICYCLIC PRIMARY ALCOHOLS, ALDEHYDES, ACIDS AND RELATED ESTERS (addendum) 43

Tabl
e 1
(con
td)
Fla
vour
ing
agen
tN
o.C
AS
No.
and
stru
ctur
eS
tep
A3/
B3d
Doe
s in
take
exce
ed th
eth
resh
old
for
hum
an in
take
?
Ste
p A
5/B
4e
Ade
quat
e m
argi
n of
saf
ety
for
the
flavo
urin
g ag
ent o
rre
late
d su
bsta
nces
?
Com
men
ts o
npr
edic
ted
met
abol
ism
Con
clus
ion
base
don
cur
rent
estim
ated
die
tary
expo
sure
Mix
ture
of 2
,4-,
3,5
- an
d 3,
6-D
imet
hyl-3
-cy
cloh
exen
ylca
rbal
dehy
de
1900
2793
9-60
-2 HHO
HO
HO
A3.
No,
SP
ET
: 150
NR
Not
e 1
No
safe
ty c
once
rn
44 ALICYCLIC PRIMARY ALCOHOLS, ALDEHYDES, ACIDS AND RELATED ESTERS (addendum)

Tabl
e 1
(con
td)
Fla
vour
ing
agen
tN
o.C
AS
No.
and
stru
ctur
eS
tep
A3/
B3d
Doe
s in
take
exce
ed th
eth
resh
old
for
hum
an in
take
?
Ste
p A
5/B
4e
Ade
quat
e m
argi
n of
saf
ety
for
the
flavo
urin
g ag
ent o
rre
late
d su
bsta
nces
?
Com
men
ts o
npr
edic
ted
met
abol
ism
Con
clus
ion
base
don
cur
rent
estim
ated
die
tary
expo
sure
(±)-
cis-
and
tran
s-1,
2-D
ihyd
rope
rilla
ldeh
yde
1902
2245
1-50
-9(c
is);
2245
1-49
-6(t
rans
)
OH
A3.
No,
MS
DI:
Eur
ope
ND
US
A 0
.7Ja
pan
ND
NR
Not
e 1
No
safe
ty c
once
rn
d-Li
mon
en-1
0-ol
1903
3814
2-45
-9 OH
A3.
No,
SP
ET
: 3N
RN
ote
1N
o sa
fety
con
cern
ALICYCLIC PRIMARY ALCOHOLS, ALDEHYDES, ACIDS AND RELATED ESTERS (addendum) 45

Tabl
e 1
(con
td)
Fla
vour
ing
agen
tN
o.C
AS
No.
and
stru
ctur
eS
tep
A3/
B3d
Doe
s in
take
exce
ed th
eth
resh
old
for
hum
an in
take
?
Ste
p A
5/B
4e
Ade
quat
e m
argi
n of
saf
ety
for
the
flavo
urin
g ag
ent o
rre
late
d su
bsta
nces
?
Com
men
ts o
npr
edic
ted
met
abol
ism
Con
clus
ion
base
don
cur
rent
estim
ated
die
tary
expo
sure
p-M
enth
an-7
-ol
1904
5502
-75-
0
OH
A3.
No,
SP
ET
: 150
NR
Not
e 1
No
safe
ty c
once
rn
p-M
enth
-1-e
n-9-
ol19
0518
479-
68-0
OH
A3.
No,
SP
ET
: 30
NR
Not
e 1
No
safe
ty c
once
rn
46 ALICYCLIC PRIMARY ALCOHOLS, ALDEHYDES, ACIDS AND RELATED ESTERS (addendum)

Tabl
e 1
(con
td)
Fla
vour
ing
agen
tN
o.C
AS
No.
and
stru
ctur
eS
tep
A3/
B3d
Doe
s in
take
exce
ed th
eth
resh
old
for
hum
an in
take
?
Ste
p A
5/B
4e
Ade
quat
e m
argi
n of
saf
ety
for
the
flavo
urin
g ag
ent o
rre
late
d su
bsta
nces
?
Com
men
ts o
npr
edic
ted
met
abol
ism
Con
clus
ion
base
don
cur
rent
estim
ated
die
tary
expo
sure
1,3-
p-M
enth
adie
n-7-
al19
0611
97-1
5-5 H
O
B3.
No,
SP
ET
: 30
B4.
Yes
. The
NO
ELs
of 1
5, 3
3.9
and
33 m
g/kg
bw
per
day
for,
resp
ectiv
ely,
tran
s,tr
ans-
2,4-
hexa
dien
al (
No.
117
5), 2
-tr
ans-
4-tr
ans-
deca
dien
al (
No.
1190
) an
d 2-
tran
s-4-
cis-
7-ci
s-tr
idec
atrie
nal (
No.
119
8) fr
om14
-wee
k st
udie
s in
rat
s (N
os11
75 a
nd 1
190)
and
a 4
-wee
kst
udy
in r
ats
(No.
119
8)(E
dwar
ds, 1
973;
Dam
ske
et a
l.,19
80; N
TP
, 200
1) a
re a
t lea
st30
000
–67
800
times
the
estim
ated
dai
ly d
ieta
ry e
xpos
ure
to N
o. 1
906
whe
n us
ed a
s a
flavo
urin
g ag
ent.
Not
e 1
No
safe
ty c
once
rn
ALICYCLIC PRIMARY ALCOHOLS, ALDEHYDES, ACIDS AND RELATED ESTERS (addendum) 47

Tabl
e 1
(con
td)
Fla
vour
ing
agen
tN
o.C
AS
No.
and
str
uctu
reS
tep
A3/
B3d
Doe
s in
take
exce
ed th
eth
resh
old
for
hum
an in
take
?
Ste
p A
5/B
4e
Ade
quat
e m
argi
n of
saf
ety
for
the
flavo
urin
g ag
ent o
rre
late
d su
bsta
nces
?
Com
men
ts o
npr
edic
ted
met
abol
ism
Con
clus
ion
base
don
cur
rent
estim
ated
die
tary
expo
sure
Str
uctu
ral c
lass
II
Met
hyl d
ihyd
roja
smon
ate
1898
2485
1-98
-7 O
OO
A3.
Yes
, MS
DI:
Eur
ope
676
US
A 1
875
Japa
n 23
A5.
Yes
. The
NO
EL
of 8
0m
g/kg
bw
per
day
for
mat
erna
l tox
icity
from
ast
udy
of p
rena
tal
deve
lopm
enta
l tox
icity
inra
ts (
Lew
is, 2
007)
is a
tle
ast 2
580
times
the
estim
ated
dai
ly d
ieta
ryex
posu
re to
No.
189
8 w
hen
used
as
a fla
vour
ing
agen
t.
Not
es 1
and
2N
o sa
fety
con
cern
cis-
and
tran
s-2-
Hep
tylc
yclo
prop
anec
arbo
xylic
acid
1907
6972
90-7
6-9
(cis
);69
7290
-77-
0 (t
rans
)
OH
O
A3.
No,
SP
ET
:1
NR
Not
e 1
No
safe
ty c
once
rn
48 ALICYCLIC PRIMARY ALCOHOLS, ALDEHYDES, ACIDS AND RELATED ESTERS (addendum)

Tabl
e 1
(con
td)
Fla
vour
ing
agen
tN
o.C
AS
No.
and
str
uctu
reS
tep
A3/
B3d
Doe
s in
take
exce
ed th
eth
resh
old
for
hum
an in
take
?
Ste
p A
5/B
4e
Ade
quat
e m
argi
n of
saf
ety
for
the
flavo
urin
g ag
ent o
rre
late
d su
bsta
nces
?
Com
men
ts o
npr
edic
ted
met
abol
ism
Con
clus
ion
base
don
cur
rent
estim
ated
die
tary
expo
sure
(±)-
cis-
and
tran
s-2-
Met
hyl-2
-(4
-met
hyl-3
-pen
teny
l)-cy
clop
ropa
neca
rbal
dehy
de
1908
1309
32-1
6-0
(cis
);97
231-
35-1
(tr
ans)
OH
A3.
No,
SP
ET
:24
0N
RN
ote
1N
o sa
fety
con
cern
Str
uctu
ral c
lass
III
Per
illal
dehy
depr
opyl
eneg
lyco
l ace
tal
1901
1211
99-2
8-8 O
O
A3.
No,
SP
ET
: 3N
RN
ote
3N
o sa
fety
con
cern
ALICYCLIC PRIMARY ALCOHOLS, ALDEHYDES, ACIDS AND RELATED ESTERS (addendum) 49

Tabl
e 1
(con
td)
bw, b
ody
wei
ght;
CA
S, C
hem
ical
Abs
trac
ts S
ervi
ce; N
D, n
o da
ta r
epor
ted;
NO
EL,
no-
obse
rved
-effe
ct le
vel;
NR
, not
req
uire
d fo
r ev
alua
tion
beca
use
cons
umpt
ion
of th
e su
bsta
nce
was
det
erm
ined
to b
e of
no
safe
ty c
once
rn a
t ste
p A
3 of
the
Pro
cedu
rea
Tw
enty
-six
flav
ourin
g ag
ents
bel
ongi
ng to
the
sam
e gr
oup
wer
e pr
evio
usly
eva
luat
ed b
y th
e C
omm
ittee
at i
ts fi
fty-n
inth
mee
ting
(Ann
ex 1
, ref
eren
ce16
0).
bS
tep
1: S
even
of t
he fl
avou
ring
agen
ts (
Nos
189
9, 1
900
and
1902
–190
6) in
this
gro
up w
ere
assi
gned
to s
truc
tura
l cla
ss I,
thre
e of
the
flavo
urin
gag
ents
(N
os 1
898,
190
7 an
d 19
08)
wer
e as
sign
ed to
str
uctu
ral c
lass
II a
nd th
e re
mai
ning
flav
ourin
g ag
ent (
No.
190
1) w
as a
ssig
ned
to s
truc
tura
lcl
ass
III.
cS
tep
2: T
en o
f the
flav
ourin
g ag
ents
in th
is g
roup
are
exp
ecte
d to
be
met
abol
ized
to in
nocu
ous
prod
ucts
. The
rem
aini
ng s
ubst
ance
(No.
190
6), w
hich
cont
ains
two
endo
cycl
ic d
oubl
e bo
nds,
can
not b
e pr
edic
ted
to b
e m
etab
oliz
ed to
inno
cuou
s pr
oduc
ts.
d T
he th
resh
olds
for
hum
an in
take
for
stru
ctur
al c
lass
es I,
II a
nd II
I are
180
0, 5
40 a
nd 9
0 μg
/day
, res
pect
ivel
y. A
ll in
take
val
ues
are
expr
esse
d in
μg/
day.
Eith
er th
e hi
ghes
t SP
ET
est
imat
e or
the
MS
DI e
stim
ates
, if a
t lea
st o
ne is
hig
her
than
the
high
est S
PE
T e
stim
ate,
are
giv
en in
the
tabl
e.e
The
mar
gin
of s
afet
y w
as c
alcu
late
d ba
sed
on th
e hi
ghes
t dai
ly d
ieta
ry e
xpos
ure
calc
ulat
ed e
ither
by
the
SP
ET
or
as th
e M
SD
I.N
otes
:1.
Exp
ecte
d to
be
met
abol
ized
larg
ely
by o
xida
tion
of th
e si
de-c
hain
to th
e co
rres
pond
ing
carb
oxyl
ic a
cid,
whi
ch is
exc
rete
d un
chan
ged
and
asco
njug
ates
.2.
Exp
ecte
d to
und
ergo
hyd
roly
sis
to fo
rm th
e co
rres
pond
ing
alco
hol a
nd c
arbo
xylic
aci
d, fo
llow
ed b
y m
etab
olis
m in
the
fatty
aci
d pa
thw
ay o
r tric
arbo
xylic
acid
cyc
le.
3.H
ydro
lysi
s of
the
keta
l to
yiel
d pr
opyl
ene
glyc
ol a
nd p
erill
alde
hyde
, whi
ch w
ill m
ainl
y be
oxi
dize
d to
per
illic
aci
d. P
ropy
lene
gly
col i
s ox
idiz
ed to
pyr
uvic
acid
and
com
plet
ely
oxid
ized
in th
e ci
tric
aci
d cy
cle.
50 ALICYCLIC PRIMARY ALCOHOLS, ALDEHYDES, ACIDS AND RELATED ESTERS (addendum)

Table 2. Annual volumes of production and daily dietary exposures foralicyclic primary alcohols, aldehydes, acids and related esters used asflavouring agents in Europe, the USA and Japan
Flavouring agent (No.) Most recentannual
volume ofproduction
(kg)a
Dietary exposure Annualvolume from
naturaloccurrence
in foods(kg)d,e
MSDIb SPETc
μg/day μg/kgbw per
day
μg/day μg/kgbwperday
Methyl dihydrojasmonate(1898)
25 0.4 +
Europe 6 321 676 11
USA 15 331 1875 31
Japan 87 23 0.4
cis-4-(2,2,3-Trimethylcyclopentyl)-butanoic acid (1899)
3000 50
Europe ND ND ND
USA 50 6 0.1
Japan ND ND ND
Mixture of 2,4-, 3,5- and 3,6-Dimethyl-3-cyclohexenylcarbaldehyde(1900)
150 2.5
Europe ND ND ND
USA ND ND ND
Japan 0.6 0.2 0.003
Perillaldehydepropyleneglycol acetal(1901)
3 0.05
Europe ND ND ND
USA ND ND ND
Japan 3.7 1.0 0.02
(±)-cis- and trans-1,2-Dihydroperillaldehyde(1902)
0.6 0.01
Europe ND ND ND
ALICYCLIC PRIMARY ALCOHOLS, ALDEHYDES, ACIDS AND RELATED ESTERS (addendum) 51

Table 2 (contd)
Flavouring agent (No.) Most recentannual
volume ofproduction
(kg)a
Dietary exposure Annualvolume from
naturaloccurrence
in foods(kg)d,e
MSDIb SPETc
μg/day
μg/kgbw per
day
μg/day
μg/kgbwperday
USA 6.0 0.7 0.01
Japan ND ND ND
d-Limonen-10-ol (1903) 3 0.05
Europe ND ND ND
USA ND ND ND
Japan 1.3 0.3 0.006
p-Menthan-7-ol (1904) 150 2.5
Europe ND ND ND
USA ND ND ND
Japan 0.1 0.03 0.0004
p-Menth-1-en-9-ol (1905) 30 0.5 43
Europe ND ND ND
USA ND ND ND
Japan 0.1 0.03 0.0004
1,3-p-Menthadien-7-al (1906) 30 0.5 +
Europe ND ND ND
USA ND ND ND
Japan 0.1 0.03 0.0004
cis- and trans-2-Heptylcyclopropanecarboxylicacid (1907)
1 0.02
Europe 0.1 0.01 0.0002
USA ND ND ND
Japan ND ND ND
(±)-cis- and trans-2-Methyl-2-(4-methyl-3-pentenyl)-cyclopropanecarbaldehyde(1908)
240 4.0
52 ALICYCLIC PRIMARY ALCOHOLS, ALDEHYDES, ACIDS AND RELATED ESTERS (addendum)

Table 2 (contd)
Flavouring agent (No.) Most recentannual
volume ofproduction
(kg)a
Dietary exposure Annualvolume from
naturaloccurrence
in foods(kg)d,e
MSDIb SPETc
μg/day μg/kg bwperday
μg/day
μg/kgbwperday
Europe ND ND ND
USA 0.1 0.01 0.0002
Japan ND ND ND
Total
Europe 6 321
USA 15 388
Japan 93
bw, body weight; ND, no data reported; +, reported to occur naturally in foods (Nijssen, vanIngen-Visscher & Donders, 2009), but no quantitative data; , not reported to occur naturallyin foods
a From European Flavour and Fragrance Association (2004), Gavin, Williams & Hallagan(2008) and Japan Flavor and Fragrance Materials Association (2005). Values greater thanzero but less than 0.1 kg were reported as 0.1 kg.
b MSDI (μg/person per day) calculated as follows: (annual volume, kg) × (1 × 10⁹ μg/kg)/(population × survey correction factor × 365 days),
where population (10%, “eaters only”) = 32 × 106 for Europe, 28 × 106 for the USA and13 × 106 for Japan; and where survey correction factor = 0.8 for the surveys in Europe, theUSA and Japan, representing the assumption that only 80% of the annual flavour volumewas reported in the poundage surveys (European Flavour and Fragrance Association, 2004;Japan Flavor and Fragrance Materials Association, 2005; Gavin, Williams & Hallagan,2008).
MSDI (μg/kg bw per day) calculated as follows: (μg/person per day)/body weight, where body weight = 60 kg. Slight variations may occur
from rounding.c SPET (μg/person per day) calculated as follows: (standard food portion, g/day) × (average use level) (International Organization of the Flavor
Industry, 2009). The dietary exposure from the single food category leading to the highestdietary exposure from one portion is taken as the SPET estimate.
SPET (μg/kg bw per day) calculated as follows: (μg/person per day)/body weight, where body weight = 60 kg. Slight variations may occur
from rounding.d Qualitative data reported by Nijssen, van Ingen-Visscher & Donders (2009).e Quantitative data for the USA reported by Stofberg & Grundschober (1987). The
consumption ratio (annual consumption via food, kg)/(most recent reported productionvolume as a flavouring agent, kg) was not determined, as no production volume as aflavouring agent was available for the USA.
ALICYCLIC PRIMARY ALCOHOLS, ALDEHYDES, ACIDS AND RELATED ESTERS (addendum) 53

Step 2. Ten flavouring agents in this group (Nos 1898–1905, 1907 and 1908)are expected to be metabolized to innocuous products. The evaluation of theseflavouring agents therefore proceeded via the A-side of the Procedure. Theremaining substance, 1,3-p-menthadien-7-al (No. 1906), which contains twoendocyclic double bonds and is an , -unsaturated aldehyde, cannot be predictedto be metabolized to innocuous products and therefore was assessed via the B-sideof the procedure.
Step A3. The highest estimated daily per capita intakes of five of the sixflavouring agents in structural class I (Nos 1900 and 1902–1905) are below thethreshold of concern (i.e. 1800 μg/person per day for class I). The safety of thesefive flavouring agents raises no concern at current estimated dietary exposures. Thehighest estimated daily intake of the remaining flavouring agent in structural classI (cis-4-(2,2,3-trimethylcyclopentyl)butanoic acid, No. 1899; 3000 μg using theSPET) is above the threshold of concern for class I. Accordingly, the evaluation ofthis flavouring agent proceeded to step A4.
The highest estimated daily per capita intakes of two of the three flavouringagents in structural class II (Nos 1907 and 1908) are below the threshold of concern(i.e. 540 μg/person per day for class II). The safety of these two flavouring agentsraises no concern at current estimated dietary exposures. The highest estimateddaily per capita intake of the remaining agent in structural class II (methyldihydrojasmonate, No. 1898; 1875 μg as the MSDI) is above the threshold ofconcern for class II. Accordingly, the evaluation of this flavouring agent proceededto step A4.
The highest estimated daily per capita intake of the flavouring agent instructural class III (No. 1901) is below the threshold of concern (i.e. 90 μg/personper day for class III). The safety of this flavouring agent raises no concern at currentestimated dietary exposures.
Step A4. Neither the flavouring agents methyl dihydrojasmonate (No. 1898)and cis-4-(2,2,3-trimethylcyclopentyl)butanoic acid (No. 1899) nor their metabolitesare endogenous substances. Accordingly, the evaluation of these two flavouringagents proceeded to step A5.
Step A5. For methyl dihydrojasmonate (No. 1898), the no-observed-effectlevel (NOEL) of 80 mg/kg body weight (bw) per day for maternal toxicity from a studyof prenatal developmental toxicity in rats (Lewis, 2007) is 2580 times the estimateddietary exposure from its use as a flavouring agent (1875 μg/day as the MSDI).
For cis-4-(2,2,3-trimethylcyclopentyl)butanoic acid (No. 1899), the NOEL of12 mg/kg bw per day for the structurally related substance 2,2,3-trimethyl-cyclopent-3-en-1-yl acetaldehyde (No. 967) from a 90-day study of toxicity in rats(British Industrial Biological Research Association, 1976) is 240 times the estimateddietary exposure to No. 1899 from its use as a flavouring agent (3000 μg/day usingthe SPET).
The Committee therefore concluded that methyl dihydrojasmonate(No. 1898) and cis-4-(2,2,3-trimethylcyclopentyl)butanoic acid (No. 1899) would notpose a safety concern at current estimated dietary exposures.
54 ALICYCLIC PRIMARY ALCOHOLS, ALDEHYDES, ACIDS AND RELATED ESTERS (addendum)

Step B3. The highest estimated daily per capita intake of 1,3-p-menthadien-7-al (No. 1906) is below the threshold of concern (i.e. 1800 μg/personper day for class I). Accordingly, its evaluation proceeded to step B4.
Step B4. The NOELs of 15, 33.9 and 33 mg/kg bw per day for, respectively,the structurally related substances trans,trans-2,4-hexadienal (No. 1175), 2-trans-4-trans-decadienal (No. 1190) and 2-trans-4-cis-7-cis-tridecatrienal (No.1198) from 14-week studies in rats (Nos 1175 and 1190) and a 4-week study in rats(No. 1998) (Edwards, 1973; Damske et al., 1980; NTP, 2001) are 30 000–67 800times higher than the highest estimated dietary exposure to 1,3-p-menthadien-7-al(No. 1906) from its use as a flavouring agent (30 μg/day using the SPET). Althoughthese three structurally related compounds are linear compounds, they contain thesame toxicologically relevant groups as No. 1906 (i.e. an , -unsaturated aldehydewith two or more double bonds) and are therefore considered suitable for theevaluation of No. 1906. The Committee therefore concluded that 1,3-p-menthadien-7-al (No. 1906) would not pose a safety concern at current estimateddietary exposures.
Table 1 summarizes the evaluations of the 11 alicyclic primary alcohols,aldehydes, acids and related esters (Nos 1898–1908) in this group.
1.5 Consideration of combined intakes from use as flavouring agents
The safety assessment of possible combined intakes of flavouring agentswas based on the presence of common metabolites or a homologous series (asproposed at the sixty-eighth meeting; Annex 1, reference 187) and using the MSDIexposure assessment (as proposed at the sixty-ninth meeting; Annex 1, reference190). No common metabolites or homologous series could be identified for theadditional flavouring agents in this group. When also considering the flavouringagents in this group evaluated at the fifty-ninth meeting (Annex 1, reference 160),the different flavouring agents were not members of homologous series, despitehaving some common structural characteristics. However, two common metaboliteswere identified: p-menth-1-en-9-ol (No. 1905) and perillic alcohol (No. 974), both ofwhich are in structural class I. In the unlikely event that the flavouring agents withthe common metabolite p-menth-1-en-9-ol (i.e. Nos 971 and 972) and p-menth-1-en-9-ol itself were to be consumed concurrently on a daily basis, the estimatedcombined intakes for Europe, the USA and Japan would not exceed the thresholdof concern (i.e. 1800 μg/person per day for class I). In the unlikely event that theflavouring agents with the common metabolite perillic alcohol (i.e. Nos 973 and 975),perillic alcohol itself and No. 1901, which would be metabolized to a structuralisomer of perillic acid, were to be consumed concurrently on a daily basis, theestimated combined intakes for Europe, the USA and Japan would not exceed thethreshold of concern (i.e. 1800 μg/person per day for class I).
1.6 Consideration of secondary components
Five members of this group of flavouring agents (Nos 1898, 1901, 1902,1906 and 1908) have assay values of less than 95%. The secondary component ofmethyl dihydrojasmonate (No. 1898), methyl epi-dihydrojasmonate, is expected to
ALICYCLIC PRIMARY ALCOHOLS, ALDEHYDES, ACIDS AND RELATED ESTERS (addendum) 55

share the same metabolic fate as the primary substance and was considered notto present a safety concern at current estimated dietary exposures. The secondarycomponents of perillaldehyde propyleneglycol acetal (No. 1901), perillaldehyde(No. 973) and propylene glycol, are metabolites of the primary substance and wereconsidered not to present a safety concern at current estimated dietary exposures.The secondary components of (±)-cis- and trans-dihydroperillaldehyde (No. 1902),trans-4-isopropyl-cyclohexane-1-carboxaldehyde, cis-4-isopropyl-cyclohexane-1-carboxaldehyde and 4-isopropenyl-cyclohex-1-enecarboxaldehyde, are expectedto share the same metabolic fate as the primary substance and were considerednot to present a safety concern at current estimated dietary exposures. Thesecondary component of 1,3-p-menthadien-7-al (No. 1906), cumin aldehyde(No. 868), was evaluated by the Committee at its fifty-seventh meeting (Annex 1,reference 154) and was considered not to present a safety concern at estimateddietary exposures. The secondary component of (±)-cis- and trans-2-methyl-2-(4-methyl-3-pentenyl)cyclopropanecarbaldehyde (No. 1908), [2-methyl-2-(4-methyl-pent-3-en-1-yl)cyclopropyl]methanol, is a metabolite of the primary substance andis expected to share the same metabolic fate. It was considered not to present asafety concern at current estimated dietary exposures.
Information on the safety of the secondary components of these flavouringagents is summarized in Annex 5.
1.7 Conclusion
In the previous evaluation of substances in the group of alicyclic primaryalcohols, aldehydes, acids and related esters, studies of acute toxicity, short-termand long-term toxicity and genotoxicity were available (Annex 1, reference 161).None raised safety concerns. The toxicity data available for this evaluationsupported those from the previous evaluation.
The Committee concluded that these 11 flavouring agents, which areadditions to the group of 26 alicyclic primary alcohols, aldehydes, acids and relatedesters previously evaluated, would not give rise to safety concerns at currentestimated dietary exposures.
2. RELEVANT BACKGROUND INFORMATION
2.1 Explanation
This monograph summarizes key aspects relevant to the safety evaluationof 11 alicyclic primary alcohols, aldehydes, acids and related esters, which areadditions to a group of 26 flavouring agents evaluated previously by the Committeeat its fifty-ninth meeting (Annex 1, reference 160).
2.2 Additional considerations on intake
Production volumes and dietary exposures estimated both as the MSDI andusing the SPET for each flavouring agent are reported in Table 2.
56 ALICYCLIC PRIMARY ALCOHOLS, ALDEHYDES, ACIDS AND RELATED ESTERS (addendum)

Three of the 11 flavouring agents in the group have been reported tooccur naturally in traditional foods (Nijssen, van Ingen-Visscher & Donders, 2009;Table 2). Quantitative data on natural occurrence have been calculated for one ofthem (p-menth-1-en-9-ol, No. 1905) (as described by Stofberg & Grundschober[1987], based on quantitative data reported in Nijssen, van Ingen-Visscher &Donders [2009]).
2.3 Biological data
2.3.1 Biochemical data: absorption, distribution, metabolism and elimination
Information on the hydrolysis, absorption, distribution, metabolism andelimination of flavouring agents belonging to the group of alicyclic primary alcohols,aldehydes, acids and related esters has previously been described in the report ofthe fifty-ninth meeting (Annex 1, reference 160). Some relevant additional data havebeen submitted on one compound evaluated previously (perillyl alcohol or p-mentha-1,8-dien-7-ol, No. 974) (O’Brien, 2004). In the previous evaluation, it wasconcluded that perillyl alcohol is rapidly metabolized and excreted, mainly as urinarymetabolites. The absorption and metabolism of perillyl alcohol have beeninvestigated recently in both rats and humans. The oral bioavailability of perillylalcohol in rats was only about 4.5%. The bioavailability of perillyl alcohol in humanswas estimated to be 2%. CaCO-2 permeability studies suggested that thegastrointestinal tract was highly permeable to perillyl alcohol. Studies with CaCO-2cells, human and liver S9 fractions and cryopreserved human and rat hepatocytesshowed that the low oral bioavailability could be attributed to presystemicmetabolism in both the gastrointestinal tract and the liver. The phase II metabolitesof perillyl alcohol included conjugates of glucuronic acid, cysteine, acetylcysteine,glycine and glutathione (O’Brien, 2004).
2.3.2 Toxicological studies
(a) Acute toxicity
Oral median lethal doses (LD50 values) have been reported for 3 of the 11flavouring agents in this group. Two flavouring agents (Nos 1898 and 1908) weretested in rats only, and one flavouring agent (No. 1900) was tested in rats andin male mice (Table 3). In rats, the oral LD50 values ranged from >2000 to>5000 mg/kg bw (Moreno, 1976, 1977, 1978; Gabriel, 1979; Myers, 1986; Gardner,1987; Szakonyi, 2006). In male mice, the reported oral LD50 value was 1300 mg/kgbw (Gloxhuber & Potokar, 1981). These results support the findings in the previousevaluation (Annex 1, reference 161) that the oral acute toxicity of alicyclic primaryalcohols, aldehydes, acids and related esters is low.
ALICYCLIC PRIMARY ALCOHOLS, ALDEHYDES, ACIDS AND RELATED ESTERS (addendum) 57
Table 3. Results of studies of acute oral toxicity for alicyclic primary alcohols,aldehydes, acids and related esters used as flavouring agents
No. Flavouring agent Species; sex LD50 (mg/kgbw)
Reference
1898 Methyl dihydrojasmonate Rats; NR >5000 Moreno (1976)
1898 Methyl dihydrojasmonate Rats; M, F >5000 Gardner (1987)
1900 Mixture of 2,4-, 3,5- and 3,6-Dimethyl-3-cyclohexenylcarbaldehyde
Rats; M, F 2650 (F)a
3040 (M)a
Myers (1986)
1900 Mixture of 2,4-, 3,5- and 3,6-Dimethyl-3-cyclohexenylcarbaldehyde
Rats; NR 3900b Moreno (1978)
1900 Mixture of 2,4-, 3,5- and 3,6-Dimethyl-3-cyclohexenylcarbaldehyde
Rats; M 2330b Gabriel (1979)
1900 Mixture of 2,4-, 3,5- and 3,6-Dimethyl-3-cyclohexenylcarbaldehyde
Rats; NR 3600 Moreno (1977)
1900 Mixture of 2,4-, 3,5- and 3,6-Dimethyl-3-cyclohexenylcarbaldehyde
Mice; M 1300c Gloxhuber &Potokar (1981)
1908 (±)-cis- and trans-2-Methyl-2-(4-methyl-3-pentenyl)-cyclopropanecarbaldehyde
Rats; F >2000 Szakonyi (2006)
F, female; M, male; NR, not reporteda The LD50 was calculated using a specific gravity of 0.936 g/cm3 for 2,4-, 3,5- and 3,6-
dimethyl-3-cyclohexenylcarbaldehyde.b The test material was the isomer 2,4-dimethyl-3-cyclohexenylcarbaldehyde.c The test material was the isomer 3,6-dimethyl-3-cyclohexenylcarbaldehyde.
(b) Short-term and long-term studies of toxicity
Only for 1 of the 11 flavouring agents in this group have studies on short-term toxicity been reported. The results of these studies with methyl dihydro-jasmonate (No. 1898) are described below. For none of the flavouring agents in thisgroup have studies on long-term toxicity been reported. No additional studies ofshort-term or long-term toxicity on any of the related substances have becomeavailable since their previous evaluation.
In a 14-day range-finding study, groups of five male and five female albinoSprague-Dawley rats were given methyl dihydrojasmonate (No. 1898) at dietarylevels aiming at mean daily intakes of 0, 10, 40, 100 and 400 mg/kg bw. The actualintakes were 11, 54, 196 and 424 mg/kg bw per day for males in the four treatmentgroups and 10, 53 and 102 mg/kg bw per day for females in the three lowest dose
58 ALICYCLIC PRIMARY ALCOHOLS, ALDEHYDES, ACIDS AND RELATED ESTERS (addendum)
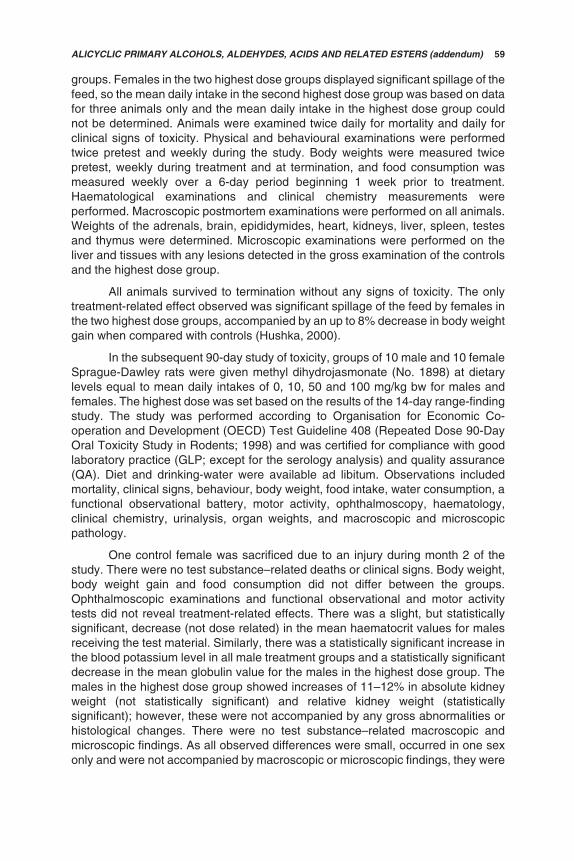
groups. Females in the two highest dose groups displayed significant spillage of thefeed, so the mean daily intake in the second highest dose group was based on datafor three animals only and the mean daily intake in the highest dose group couldnot be determined. Animals were examined twice daily for mortality and daily forclinical signs of toxicity. Physical and behavioural examinations were performedtwice pretest and weekly during the study. Body weights were measured twicepretest, weekly during treatment and at termination, and food consumption wasmeasured weekly over a 6-day period beginning 1 week prior to treatment.Haematological examinations and clinical chemistry measurements wereperformed. Macroscopic postmortem examinations were performed on all animals.Weights of the adrenals, brain, epididymides, heart, kidneys, liver, spleen, testesand thymus were determined. Microscopic examinations were performed on theliver and tissues with any lesions detected in the gross examination of the controlsand the highest dose group.
All animals survived to termination without any signs of toxicity. The onlytreatment-related effect observed was significant spillage of the feed by females inthe two highest dose groups, accompanied by an up to 8% decrease in body weightgain when compared with controls (Hushka, 2000).
In the subsequent 90-day study of toxicity, groups of 10 male and 10 femaleSprague-Dawley rats were given methyl dihydrojasmonate (No. 1898) at dietarylevels equal to mean daily intakes of 0, 10, 50 and 100 mg/kg bw for males andfemales. The highest dose was set based on the results of the 14-day range-findingstudy. The study was performed according to Organisation for Economic Co-operation and Development (OECD) Test Guideline 408 (Repeated Dose 90-DayOral Toxicity Study in Rodents; 1998) and was certified for compliance with goodlaboratory practice (GLP; except for the serology analysis) and quality assurance(QA). Diet and drinking-water were available ad libitum. Observations includedmortality, clinical signs, behaviour, body weight, food intake, water consumption, afunctional observational battery, motor activity, ophthalmoscopy, haematology,clinical chemistry, urinalysis, organ weights, and macroscopic and microscopicpathology.
One control female was sacrificed due to an injury during month 2 of thestudy. There were no test substance–related deaths or clinical signs. Body weight,body weight gain and food consumption did not differ between the groups.Ophthalmoscopic examinations and functional observational and motor activitytests did not reveal treatment-related effects. There was a slight, but statisticallysignificant, decrease (not dose related) in the mean haematocrit values for malesreceiving the test material. Similarly, there was a statistically significant increase inthe blood potassium level in all male treatment groups and a statistically significantdecrease in the mean globulin value for the males in the highest dose group. Themales in the highest dose group showed increases of 11–12% in absolute kidneyweight (not statistically significant) and relative kidney weight (statisticallysignificant); however, these were not accompanied by any gross abnormalities orhistological changes. There were no test substance–related macroscopic andmicroscopic findings. As all observed differences were small, occurred in one sexonly and were not accompanied by macroscopic or microscopic findings, they were
ALICYCLIC PRIMARY ALCOHOLS, ALDEHYDES, ACIDS AND RELATED ESTERS (addendum) 59

considered not to be of toxicological relevance. It can therefore be concluded thatthe NOEL is 100 mg/kg bw per day, the highest dose tested in this study (Kelly,2000).
(c) Genotoxicity
Only for 2 of the 11 flavouring agents in this group have studies ofgenotoxicity in vitro (Nos 1898 and 1900) and in vivo (No. 1898) been reported. Theresults of these studies are listed in Table 4 and described below.
(i) In vitro
No genotoxic potential was observed in Ames assays when methyldihydrojasmonate (No. 1898) and mixture of 2,4-, 3,5- and 3,6-dimethyl-3-cyclohexenylcarbaldehyde (No. 1900) were incubated with Salmonellatyphimurium strains TA98, TA100, TA102, TA1535, TA1537 and TA1538 orEscherichia coli WP2 uvrA with and without S9 activation in concentrations up to5000 μg/plate (Gilroy et al., 1978; Gloxhuber & Bellinger, 1978; Willems, 1979;Glover, 1987; Vergnes & Morabit, 1995; Thompson, 2000; Wagner & Klug, 2000;Bowles, 2007; Wakamatsu, 2007).
Methyl dihydrojasmonate (No. 1898) gave positive results in a forwardmutation assay conducted in L5178 tk+/ mouse lymphoma cells when tested atconcentrations ranging from 58 to 300 μg/ml in the presence and absence ofmetabolic activation (Ross & Harris, 1979), whereas it gave negative results inanother mouse lymphoma forward mutation assay at concentrations ranging from25 to 325 μg/ml, with and without activation (Cifone, 2001).
(ii) In vivo
In a micronucleus assay, groups of male and female ICR mice wereadministered a single dose of methyl dihydrojasmonate (No. 1898) at 280 mg/kgbw (5 animals of each sex), 560 mg/kg bw (5 animals of each sex) or 1120 mg/kgbw (15 animals of each sex) by intraperitoneal injection (Gudi & Krsmanovic, 1998).Bone marrow isolated after 24 or 48 h from the femur of these animals revealed noincrease in micronucleated polychromatic erythrocytes compared with controls.
In male Sprague-Dawley rats given a single dose of methyl dihydro-jasmonate (No. 1898) at 333 or 1000 mg/kg bw by intraperitoneal injection, therewas no evidence of unscheduled deoxyribonucleic acid (DNA) synthesis after liverperfusion 2 or 16 h post-injection (Durward, 2001).
(iii) Conclusion
The results from the genotoxicity studies on methyl dihydrojasmonate(No. 1898) and mixture of 2,4-, 3,5- and 3,6-dimethyl-3-cyclohexenylcarbaldehyde(No. 1900) support the findings in the previous evaluation (Annex 1, reference161) that the members of this group of alicyclic primary alcohols, aldehydes, acidsand related esters are not expected to exhibit genotoxic potential in vivo.
60 ALICYCLIC PRIMARY ALCOHOLS, ALDEHYDES, ACIDS AND RELATED ESTERS (addendum)

Tabl
e 4.
Stu
dies
of g
enot
oxic
ity in
vitr
o an
d in
viv
o w
ith a
licyc
lic p
rim
ary
alco
hols
, ald
ehyd
es, a
cids
and
rela
ted
este
rsus
edas
flav
ouri
ng a
gent
s
No.
Age
ntE
nd-p
oint
Tes
t obj
ect
Con
cent
ratio
nR
esul
tsR
efer
ence
In v
itro
1898
Met
hyl d
ihyd
roja
smon
ate
Rev
erse
mut
atio
n
Sal
mon
ella
typh
imur
ium
TA
98, T
A10
0, T
A15
35,
TA
1537
and
TA
1538
10–3
300
μg/p
late
, ±S
9aN
egat
iveb
Gilr
oy e
t al.
(197
8)
1898
Met
hyl d
ihyd
roja
smon
ate
Rev
erse
mut
atio
nS
. typ
him
uriu
m T
A98
,T
A10
0, T
A15
35 a
ndT
A15
37
1.5–
1500
μg/
plat
e, ±
S9c
Neg
ativ
ebG
love
r (1
987)
1898
Met
hyl d
ihyd
roja
smon
ate
Rev
erse
mut
atio
nS
. typ
him
uriu
m T
A98
,T
A10
0, T
A10
2, T
A15
35an
d T
A15
37
15–5
000
μg/p
late
, ±S
9dN
egat
iveb
Tho
mps
on(2
000)
1898
Met
hyl d
ihyd
roja
smon
ate
Rev
erse
mut
atio
nS
. typ
him
uriu
m T
A98
,T
A10
0, T
A15
35 a
nd T
A15
3710
0–50
00 μ
g/pl
ate,
±S
9N
egat
iveb
Wag
ner
& K
lug
(200
0)
1898
Met
hyl d
ihyd
roja
smon
ate
Rev
erse
mut
atio
nE
sche
richi
a co
li W
P2
uvrA
100–
5000
μg/
plat
e, ±
S9
Neg
ativ
ebW
agne
r &
Klu
g(2
000)
1898
Met
hyl d
ihyd
roja
smon
ate
For
war
d m
utat
ion
L517
8 tk
+/
mou
se ly
mph
oma
cells
25–2
75 μ
g/m
l, S
9e
25–3
25 μ
g/m
l, +
S9f
Neg
ativ
eb,g
Cifo
ne (
2001
)
1898
Met
hyl d
ihyd
roja
smon
ate
For
war
d m
utat
ion
L517
8 tk
+/ m
ouse
lym
phom
ace
lls58
–300
μg/
ml,
±S
9P
ositi
veb,
hR
oss
& H
arris
(197
9)
ALICYCLIC PRIMARY ALCOHOLS, ALDEHYDES, ACIDS AND RELATED ESTERS (addendum) 61

Tabl
e 4
(con
td)
No.
Age
ntE
nd-p
oint
Tes
t obj
ect
Con
cent
ratio
nR
esul
tsR
efer
ence
1900
Mix
ture
of 2
,4-,
3,5
- an
d3,
6-D
imet
hyl-3
-cy
cloh
exen
ylca
rbal
dehy
de
Rev
erse
mut
atio
n
S. t
yphi
mur
ium
TA
98,
TA
100,
TA
1535
and
TA
1537
5–50
00 μ
g/pl
ate,
±S
9i,jN
egat
iveb
Bow
les
(200
7)
1900
Mix
ture
of 2
,4-,
3,5
- an
d3,
6-D
imet
hyl-3
-cy
cloh
exen
ylca
rbal
dehy
de
Rev
erse
mut
atio
nE
. col
i WP
2 uv
rA15
–500
0 μg
/pla
te, ±
S9i,k
Neg
ativ
ebB
owle
s (2
007)
1900
Mix
ture
of 2
,4-,
3,5
- an
d3,
6-D
imet
hyl-3
-cy
cloh
exen
ylca
rbal
dehy
de
Rev
erse
mut
atio
nS
. typ
him
uriu
m T
A98
, TA
100,
TA
1535
, TA
1537
and
TA
1538
30–3
000
μg/p
late
, ±S
9i,lN
egat
iveb
Ver
gnes
&M
orab
it (1
995)
1900
Mix
ture
of 2
,4-,
3,5
- an
d3,
6-D
imet
hyl-3
-cy
cloh
exen
ylca
rbal
dehy
de
Rev
erse
mut
atio
nS
. typ
him
uriu
m T
A98
, TA
100,
TA
1535
, TA
1537
and
TA
1538
0.00
15–0
.936
μg/
plat
e,±
S9i,m
,n
Neg
ativ
ebW
illem
s (1
979)
1900
Mix
ture
of 2
,4-,
3,5
- an
d3,
6-D
imet
hyl-3
-cy
cloh
exen
ylca
rbal
dehy
de
Rev
erse
mut
atio
nS
. typ
him
uriu
m T
A98
, TA
100,
TA
1535
and
TA
1537
9.77
–313
μg/
plat
e, ±
S9o,
pN
egat
iveb
Wak
amat
su(2
007)
1900
Mix
ture
of 2
,4-,
3,5
- an
d3,
6-D
imet
hyl-3
-cy
cloh
exen
ylca
rbal
dehy
de
Rev
erse
mut
atio
nE
. col
i WP
2 uv
rA9.
77–3
13 μ
g/pl
ate,
±S
9o,p
Neg
ativ
ebW
akam
atsu
(200
7)
1900
Mix
ture
of 2
,4-,
3,5
- an
d3,
6-D
imet
hyl-3
-cy
cloh
exen
ylca
rbal
dehy
de
Rev
erse
mut
atio
nS
. typ
him
uriu
m T
A98
, TA
100,
TA
1535
, TA
1537
and
TA
1538
1–10
000
ppm
/pla
te,
±S
9q,r
Neg
ativ
ebG
loxh
uber
&B
ellin
ger
(197
8)
62 ALICYCLIC PRIMARY ALCOHOLS, ALDEHYDES, ACIDS AND RELATED ESTERS (addendum)

Tabl
e 4
(con
td)
No.
Age
ntE
nd-p
oint
Tes
t obj
ect
Con
cent
ratio
nR
esul
tsR
efer
ence
In v
ivo
1898
Met
hyl d
ihyd
roja
smon
ate
Mic
ronu
clei
indu
ctio
nM
ouse
; bon
e m
arro
w
1
× 2
80, 5
60 o
r 11
20 m
g/kg
bw, i
ntra
perit
onea
llys
Neg
ativ
eG
udi &
Krs
man
ovic
(199
8)
1898
Met
hyl d
ihyd
roja
smon
ate
Uns
ched
uled
DN
Asy
nthe
sis
Mal
e ra
t hep
atoc
ytes
1 ×
333
or
1000
mg/
kg b
w,
intr
aper
itone
ally
t
Neg
ativ
eD
urw
ard
(200
1)
DN
A, d
eoxy
ribon
ucle
ic a
cid;
S9,
900
0 ×
g s
uper
nata
nt fr
om r
at li
ver
a P
reci
pita
tion
was
not
ed in
all
stra
ins
with
and
with
out m
etab
olic
act
ivat
ion
from
100
0 μg
/pla
te o
nwar
ds, a
nd s
pars
e ba
cter
ial l
awns
wer
e no
ted
in m
ost
stra
ins
with
and
with
out m
etab
olic
act
ivat
ion
at 3
300
μg/p
late
.b
With
and
with
out m
etab
olic
act
ivat
ion
c T
est c
once
ntra
tions
for
all s
trai
ns w
ithou
t met
abol
ic a
ctiv
atio
n an
d fo
r T
A10
0 an
d T
A15
35 w
ith m
etab
olic
act
ivat
ion
1.5–
150
μg/p
late
in b
oth
assa
ys.
Tes
t con
cent
ratio
ns fo
r st
rain
s T
A98
and
TA
1537
with
met
abol
ic a
ctiv
atio
n 15
–150
0 μg
/pla
te in
firs
t ass
ay a
nd 5
–500
μg/
plat
e in
sec
ond
assa
y. A
t15
00 μ
g/pl
ate,
toxi
city
was
obs
erve
d in
str
ain
TA
1537
, and
thin
ning
of t
he b
ackg
roun
d la
wn
was
obs
erve
d in
str
ain
TA
98.
d P
reci
pita
tion
and/
or s
pars
e ba
cter
ial l
awns
wer
e no
ted
in a
ll st
rain
s w
ith a
nd w
ithou
t met
abol
ic a
ctiv
atio
n at
500
0 μg
/pla
te.
e S
ever
e to
xici
ty (
less
than
20%
rel
ativ
e gr
owth
) w
as n
oted
at h
ighe
st c
once
ntra
tions
test
ed (
275
μg/m
l in
first
ass
ay a
nd 2
00 μ
g/m
l in
seco
nd a
ssay
).f
Sev
ere
toxi
city
(le
ss th
an 2
0% r
elat
ive
grow
th)
was
not
ed a
t hig
hest
con
cent
ratio
ns te
sted
(30
0 μg
/ml i
n fir
st a
ssay
and
325
μg/
ml i
n se
cond
ass
ay).
g In
the
first
ass
ay, a
dou
blin
g of
the
mut
ant f
requ
ency
was
obs
erve
d w
ith m
etab
olic
act
ivat
ion
at th
e hi
ghes
t con
cent
ratio
n te
sted
(30
0 μg
/ml,
whi
chw
as h
ighl
y cy
toto
xic
[<10
% r
elat
ive
grow
th])
. The
res
ult w
as n
ot r
epea
ted
in th
e se
cond
ass
ay w
hen
conc
entr
atio
ns u
p to
325
μg/
ml w
ere
test
ed.
h A
dou
blin
g of
the
mut
ant f
requ
ency
was
obs
erve
d at
200
and
300
μg/
ml (
with
out m
etab
olic
act
ivat
ion)
and
at 3
00 μ
g/m
l (w
ith m
etab
olic
act
ivat
ion)
.i
Tes
t sub
stan
ce w
as 2
,4-d
imet
hyl-3
-cyc
lohe
xeny
lcar
bald
ehyd
e.j
Spa
rse
bact
eria
l law
ns w
ere
note
d in
all
stra
ins
with
and
with
out m
etab
olic
act
ivat
ion
at 5
000
μg/p
late
, in
all s
trai
ns w
ithou
t met
abol
ic a
ctiv
atio
n at
1500
μg/
plat
e an
d in
som
e st
rain
s w
ith m
etab
olic
act
ivat
ion
at 1
500
μg/p
late
.k
Spa
rse
bact
eria
l law
ns w
ere
note
d w
ith a
nd w
ithou
t met
abol
ic a
ctiv
atio
n at
500
0 μg
/pla
te.
ALICYCLIC PRIMARY ALCOHOLS, ALDEHYDES, ACIDS AND RELATED ESTERS (addendum) 63

Tabl
e 4
(con
td)
l B
acte
rial g
row
th in
hibi
tion
was
obs
erve
d in
sev
eral
str
ains
with
and
with
out m
etab
olic
act
ivat
ion
from
100
0 μg
/pla
te o
nwar
ds.T
oxic
ity w
as o
bser
ved
at 3
000
μg/p
late
in a
ll st
rain
s w
ithou
t met
abol
ic a
ctiv
atio
n an
d in
som
e st
rain
s w
ith m
etab
olic
act
ivat
ion.
m B
acte
rial g
row
th in
hibi
tion
and/
or to
xici
ty w
ere
obse
rved
at 0
.936
μg/
plat
e, w
ith a
nd w
ithou
t met
abol
ic a
ctiv
atio
n.n
Cal
cula
ted
usin
g a
dens
ity o
f 0.9
36 g
/cm
3 fo
r th
e te
st c
ompo
und.
o T
est s
ubst
ance
was
a m
ixtu
re o
f 4,6
-dim
ethy
l-3-c
yclo
hexe
nylc
arbo
xald
ehyd
e an
d 3,
6-di
met
hyl-3
-cyc
lohe
xeny
lcar
boxa
ldeh
yde.
p B
acte
rial g
row
th in
hibi
tion
was
obs
erve
d in
all
stra
ins
from
156
μg/
plat
e on
war
ds w
ithou
t met
abol
ic a
ctiv
atio
n an
d at
313
μg/
plat
e w
ith m
etab
olic
activ
atio
n.q
Tes
t sub
stan
ce w
as 3
,6-d
imet
hyl-3
-cyc
lohe
xeny
lcar
boxa
ldeh
yde.
r In
hibi
tion
of c
olon
y gr
owth
was
obs
erve
d in
all
stra
ins
with
and
with
out m
etab
olic
act
ivat
ion
from
100
0 pp
m/p
late
[con
cent
ratio
n as
pro
vide
d in
refe
renc
e] o
nwar
ds.
s H
arve
st o
f fem
ur b
one
mar
row
afte
r 24
h (
all d
oses
) an
d 48
h (
high
est d
ose
only
). M
orta
lity
was
obs
erve
d at
112
0 m
g/kg
bw
, and
clin
ical
sig
ns w
ere
seen
from
560
mg/
kg b
w.
t T
he h
ighe
st d
ose
is th
e m
axim
um to
lera
ted
dose
, bas
ed o
n a
rang
e-fin
ding
stu
dy.
64 ALICYCLIC PRIMARY ALCOHOLS, ALDEHYDES, ACIDS AND RELATED ESTERS (addendum)

(d) Reproductive toxicity
A study on prenatal developmental toxicity has been reported for 1 of the 11flavouring agents in this group (methyl dihydrojasmonate, No. 1898). The results ofthis study are described below.
In a 14-day prenatal developmental toxicity study, groups of 25 presumedpregnant Crl:CD(SD) rats were administered methyl dihydrojasmonate via oralgavage at doses of 0 (corn oil, vehicle), 40, 80 or 120 mg/kg bw per day on days 7through 20 of the presumed gestation. The doses were based on a range-findingstudy in which rats were given 0–1000 mg/kg bw per day according to the samedosing schedule and maternal toxicity was observed at doses of 250 mg/kg bw perday and higher. All rats were examined twice daily for signs of severe toxicity anddeaths, abortions and premature deliveries. Body weights were recorded ongestational day (GD) 0 and throughout the dosage period. Food consumption valueswere recorded on GDs 0, 7, 10, 12, 15, 18, 20 and 21. All rats were sacrificed onGD 21, and caesarean sections and a gross necropsy of the thoracic, abdominaland pelvic viscera were performed on all animals. The number and distribution ofcorpora lutea and implantation sites and the numbers of live and dead fetuses andearly and late resorptions were determined. Placentas were examined for size,colour and shape. All fetuses were weighed and examined for sex and grossexternal alterations. Approximately half of the fetuses in each litter were examinedfor soft tissue alterations (by dissection), and the remaining fetuses were examinedfor skeletal alterations.
Rats in both the 80 and 120 mg/kg bw per day groups lost weight after theinitial dosage was given. Absolute maternal food consumption was reduced duringthe entire dosage period in the group given 120 mg/kg bw per day, with statisticallysignificant reductions on GDs 10–15. Relative maternal food consumption wassignificantly reduced over the entire period in this group. When compared with thevehicle control group, only in the 120 mg/kg bw per day group was the meanmaternal body weight reduced throughout the dosing period (GDs 7–21), withstatistically significant reductions on GDs 11–15. One dam in the 80 mg/kg bw perday group prematurely delivered its litter on GD 21, but this was not consideredrelated to treatment. In the highest dose group, an increase in sparse hair coat anda significant increase in ungroomed coat occurred. In addition, two rats in thehighest dose group had tan areas in the liver lobes and a pale spleen, whereasthese effects were not observed in the lower dose groups and controls. All otherclinical and necropsy observations were considered unrelated to treatment with thetest material. No caesarean section or litter parameters were affected by thetreatment with methyl dihydrojasmonate. No gross external, soft tissue or skeletalalterations or differences in ossification sites were attributable to the test materialat doses as high as 120 mg/kg bw per day.
On the basis of these data, the no-observed-adverse-effect level (NOAEL)for maternal toxicity is 80 mg/kg bw per day, based on reductions in food con-sumption and body weight. The NOEL for developmental toxicity was 120 mg/kgbw per day, the highest dose tested (Lewis, 2007; Politano et al., 2008).
ALICYCLIC PRIMARY ALCOHOLS, ALDEHYDES, ACIDS AND RELATED ESTERS (addendum) 65

3. REFERENCES
Bowles AJ (2007). Ligustral: reverse mutation assay “Ames test” using Salmonellatyphimurium and Escherichia coli. Unpublished report No. 0766/0149 from SafePharmLaboratories Ltd, Shardlow, England. Submitted to WHO by the International Organizationof the Flavor Industry, Brussels, Belgium.
British Industrial Biological Research Association (1976). Short-term toxicity of samplesTT171, TT172, TT173, and TT174 in rats. Unpublished report. Submitted to WHO by theFlavor and Extract Manufacturers Association, Washington, DC, USA [cited in Annex 1,reference 161].
Cifone MA (2001). ST 08 C 99: L5178Y TK+/ mouse lymphoma forward mutation assay witha confirmatory assay. Unpublished report No. 21997-0-431 ICH from CovanceLaboratories Inc., Vienna, VA, USA. Submitted to WHO by the International Organizationof the Flavor Industry, Brussels, Belgium.
Cramer GM, Ford RA, Hall RL (1978). Estimation of toxic hazard—a decision tree approach.Food and Cosmetics Toxicology, 16:255–276.
Damske DR et al. (1980). 90-day toxicity study in rats. 2,4-Decadienal. Unpublished report.Personal communication to the Flavor and Extract Manufacturers Association. Submittedto WHO by the Flavor and Extract Manufacturers Association, Washington, DC, USA [citedin Annex 1, reference 167].
Durward R (2001). ST 41 C 00: in vivo liver unscheduled DNA synthesis (UDS) assay.Unpublished report No. 161/266 from SafePharm Laboratories Ltd, Derby, England.Submitted to WHO by the International Organization of the Flavor Industry, Brussels,Belgium.
Edwards KB (1973). Biological evaluation of 2,6-dodecadienal and 2,4,7-tridecatrienal. 4-week feeding study in rats. Unpublished report. Personal communication to the Flavor andExtract Manufacturers Association. Submitted to WHO by the Flavor and ExtractManufacturers Association, Washington, DC, USA [cited in Annex 1, reference 167].
European Flavour and Fragrance Association (2004). European inquiry on volume of use.Unpublished report. Submitted to WHO by the International Organization of the FlavorIndustry, Brussels, Belgium.
Gabriel KL (1979). PA 299/7: acute oral toxicity—LD50. Unpublished report from Biosearch,Inc., Philadelphia, PA, USA. Submitted to WHO by the International Organization of theFlavor Industry, Brussels, Belgium.
Gardner JR (1987). Acute oral toxicity to rats of methyl dihydrojasmonate. Unpublished reportNo. 861155D/ULR 156/AC from Huntingdon Research Centre Ltd, Huntingdon, England.Submitted to WHO by the International Organization of the Flavor Industry, Brussels,Belgium.
Gavin CL, Williams MC, Hallagan JB (2008). 2005 FEMA poundage and technical effectsupdate survey. Washington, DC, USA, Flavor and Extract Manufacturers Association.
Gilroy AH et al. (1978). Testing for mutagenic activity of six compounds with Salmonellatyphimurium and further testing of one of the compounds with Escherichia coli.Unpublished report No. 1133 from Inveresk Research International, Edinburgh, Scotland.Submitted to WHO by the International Organization of the Flavor Industry, Brussels,Belgium.
Glover W (1987). A bacterial mutation study on methyl dihydrojasmonate. Unpublished reportNo. P.I.870200 from Environmental Safety Laboratory, Unilever Research, Bedford,England. Submitted to WHO by the International Organization of the Flavor Industry,Brussels, Belgium.
Gloxhuber [initials not provided], Bellinger [initials not provided] (1978). Cyclovertal. Testingfor mutagenic activity in the Ames-test. Unpublished report from Henkel Institut für
66 ALICYCLIC PRIMARY ALCOHOLS, ALDEHYDES, ACIDS AND RELATED ESTERS (addendum)

Toxikologie, Düsseldorf, Germany. Submitted to WHO by the International Organization ofthe Flavor Industry, Brussels, Belgium.
Gloxhuber [initials not provided], Potokar [initials not provided] (1981). Cyclovertal. 3,6-Dimethyl-3-cyclohexene-1-carbaldehyde. Examination of acute oral toxicity to the mouse.Unpublished report from Henkel Institut für Toxikologie, Düsseldorf, Germany. Submittedto WHO by the International Organization of the Flavor Industry, Brussels, Belgium.
Gudi R, Krsmanovic L (1998). Mammalian erythrocyte micronucleus test (ST 17 C 97).Unpublished report No. G98AN94.123 from MA BioServices, Inc., Rockville, MD, USA.Submitted to WHO by the International Organization of the Flavor Industry, Brussels,Belgium.
Hushka DR (2000). ST 08 C 99: a 14-day dietary range-finding toxicity study in rats.Unpublished report No. 99-2620 from Huntingdon Life Sciences, East Millstone, NJ, USA.Submitted to WHO by the International Organization of the Flavor Industry, Brussels,Belgium.
International Organization of the Flavor Industry (2009). Interim inquiry on volume of use andadded use levels for flavoring agents to be presented at the JECFA 73rd meeting.Submitted to WHO by the International Organization of the Flavor Industry, Brussels,Belgium.
Japan Flavor and Fragrance Materials Association (2005). Japanese inquiry on volume use.Unpublished report. Submitted to WHO by the International Organization of the FlavorIndustry, Brussels, Belgium.
Kelly CM (2000). ST 08 C99: a 3-month dietary toxicity study in rats. Unpublished report No.99-2643 from Huntingdon Life Sciences, East Millstone, NJ, USA. Submitted to WHO bythe International Organization of the Flavor Industry, Brussels, Belgium.
Lewis EM (2007). Oral (gavage) developmental toxicity study of methyl dihydrojasmonate(MDJ) in rats. Unpublished report No. TIF00024 from Charles River Laboratories,Horsham, NJ, USA. Submitted to WHO by the International Organization of the FlavorIndustry, Brussels, Belgium.
Moreno OM (1976). Acute oral toxicity in rats (76-329, hedione). Unpublished report from MBResearch Laboratories Inc., Spinnerstown, PA, USA. Submitted to WHO by theInternational Organization of the Flavor Industry, Brussels, Belgium.
Moreno OM (1977). Acute oral toxicity in rats (77-142, dimethyl tetrahydro benzaldehyde).Unpublished report from MB Research Laboratories Inc., Spinnerstown, PA, USA.Submitted to WHO by the International Organization of the Flavor Industry, Brussels,Belgium.
Moreno OM (1978). Acute oral toxicity in rats (77-439, aldehyde AA, triplal). Unpublishedreport from MB Research Laboratories Inc., Spinnerstown, PA, USA. Submitted to WHOby the International Organization of the Flavor Industry, Brussels, Belgium.
Myers RC (1986). Aldehyde AA: acute toxicity and primary irritancy studies. Unpublishedreport No. 48-184 from Bushy Run Research Center, Export, PA, USA. Submitted to WHOby the International Organization of the Flavor Industry, Brussels, Belgium.
Nijssen LM, van Ingen-Visscher CA, Donders JJM, eds (2009). VCF (Volatile Compounds inFood) database. Version 11.1.1. Zeist, Netherlands, TNO Quality of Life (http://www.vcf-online.nl/VcfHome.cfm, accessed October 2009).
NTP (2001). Toxicology and carcinogenesis studies of 2,4-hexadienal in F344/N rats andB6C3F1 mice (gavage studies). Draft report No. NTP TR 509. Research Triangle Park,MD, USA, Department of Health and Human Services, National Institutes of Health,National Toxicology Program [cited in Annex 1, reference 167].
O’Brien Z (2004). Pharmacokinetics, in vitro absorption and metabolism of perillyl alcohol, achemopreventive and chemotherapeutic agent [thesis]. Columbus, OH, USA, The OhioState University (http://etd.ohiolink.edu/send-pdf.cgi/OBrien%20Zhihong%20Zhang.pdf?acc_num=osu1078118089).
ALICYCLIC PRIMARY ALCOHOLS, ALDEHYDES, ACIDS AND RELATED ESTERS (addendum) 67
Politano VT et al. (2008). Evaluation of the developmental toxicity of methyl dihydrojasmonate(MDJ) in rats. International Journal of Toxicology, 27:295–300.
Ross C, Harris WJ (1979). Testing of compound 0478/5 in the mouse lymphoma specific locusmutation assay. Unpublished report No. 1479A from Inveresk Research International,Edinburgh, Scotland. Submitted to WHO by the International Organization of the FlavorIndustry, Brussels, Belgium.
Stofberg J, Grundschober F (1987). Consumption ratio and food predominance of flavoringmaterials. Perfumer & Flavorist, 12:27.
Szakonyi IP (2006). Acute oral toxicity study (acute toxic class method) of test item 2-methyl-2-(4-methylpent-3-enyl)cyclopropanecarbaldehyde in rats. Unpublished report No.06/233-001P from LAB International Research Centre Hungary Ltd, Szabadságpuszta,Hungary. Submitted to WHO by the International Organization of the Flavor Industry,Brussels, Belgium.
Thompson PW (2000). ST 41 C 00: reverse mutation assay “Ames test” using Salmonellatyphimurium. Unpublished report No. 161/265 from SafePharm Laboratories Ltd, Derby,England. Submitted to WHO by the International Organization of the Flavor Industry,Brussels, Belgium.
Vergnes JS, Morabit ER (1995). Aldehyde AA (crude): mutagenic potential in theSalmonella/microsome (Ames) assay. Unpublished report No. 94U1472 from Bushy RunResearch Center, Export, PA, USA. Submitted to WHO by the International Organizationof the Flavor Industry, Brussels, Belgium.
Wagner VO, Klug ML (2000). ST 08 C99: bacterial reverse mutation assay. Unpublished reportNo. AA31NK.502.BTL from BioReliance, Rockville, MD, USA. Submitted to WHO by theInternational Organization of the Flavor Industry, Brussels, Belgium.
Wakamatsu S (2007). Mutagenicity test of Vertoliff using microorganisms. Unpublished reportNo. Koi-3895 from Hita Laboratory, Chemicals Evaluation and Research Institute, Tokyo,Japan. Submitted to WHO by the International Organization of the Flavor Industry,Brussels, Belgium.
Willems MI (1979). Evaluation of six samples of “Naarden International” in the Salmonella/microsome mutagenicity test. Unpublished report No. R6165 from Central Institute forNutrition and Food Research, Zeist, Netherlands. Submitted to WHO by the InternationalOrganization of the Flavor Industry, Brussels, Belgium.
68 ALICYCLIC PRIMARY ALCOHOLS, ALDEHYDES, ACIDS AND RELATED ESTERS (addendum)

ALIPHATIC ACYCLIC AND ALICYCLIC -DIKETONES AND RELATED-HYDROXYKETONES (addendum)
First draft prepared by
Professor G.M. Williams,1 Dr M. DiNovi,2 Dr A. Mattia2
and Professor A.G. Renwick3
1 Environmental Pathology and Toxicology, New York Medical College,Valhalla, New York, United States of America (USA)
2 Center for Food Safety and Applied Nutrition, Food and Drug Administration,College Park, Maryland, USA
3 School of Medicine, University of Southampton, Southampton, England
1. Evaluation ..............................................................................1.1 Introduction ......................................................................1.2 Assessment of dietary exposure .....................................1.3 Absorption, distribution, metabolism and elimination ......1.4 Application of the Procedure for the Safety Evaluation of
Flavouring Agents ...........................................................1.5 Consideration of combined intakes from use as flavouring
agents ..............................................................................1.6 Consideration of secondary components ........................1.7 Conclusion .......................................................................
2. Relevant background information ..........................................2.1 Explanation ......................................................................2.2 Additional considerations on intake .................................2.3 Biological data .................................................................
2.3.1 Biochemical data: absorption, distribution,metabolism and elimination ....................................
2.3.2 Toxicological studies ..............................................3. References ............................................................................
1. EVALUATION
1.1 Introduction
The Committee evaluated eight additional flavouring agents belonging to thegroup of aliphatic acyclic and alicyclic -diketones and related -hydroxyketones,which was evaluated previously. The additional flavouring agents included twoaliphatic -diketones, two aliphatic -hydroxyketones, one aliphatic -diketone, onealicyclic , -unsaturated -hydroxyketone and two -hydroxyketals. The group ofsubstances was selected on the basis of the structural criteria of possessing analiphatic acyclic and alicyclic -diketone and related -hydroxyketone. Theevaluations were conducted using the Procedure for the Safety Evaluation ofFlavouring Agents (Figure 1, Introduction) (Annex 1, reference 131). None of theseflavouring agents has previously been evaluated.
69697079
79
80818181818282
828388
- 69 -

The Committee previously evaluated 22 other members of this group offlavouring agents at its fifty-first meeting (Annex 1, reference 138). The Committeeconcluded that all 22 flavouring agents in the group were of no safety concern basedon estimated dietary exposures.
Five of the eight additional flavouring agents (Nos 2032 and 2035–2038)in this group have been reported to occur naturally and have been found in blacktea, green tea, sherry, beef fat, mutton, lamb, fish, turkey, chicken, guinea hen,coffee, roasted peanuts, soya bean, mushroom, prickly pear, lovage leaf, cocoa,black currants, peppermint oil and buchu oil (Nijssen, van Ingen-Visscher &Donders, 2009). Quantitative intake data from natural occurrence were available fortwo substances, 3-methyl-2,4-nonedione (No. 2032) and octan-2,3-dione (No.2036). The consumption ratios (the ratios of their consumption from natural foodsources to their use as flavouring agents) were calculated to be 177 and 125,respectively.
1.2 Assessment of dietary exposure
The total annual volumes of production of the eight aliphatic acyclic andalicyclic -diketones and related -hydroxyketones are 2 kg in Europe, 6 kg in theUSA and 39 kg in Japan (European Flavour and Fragrance Association, 2004;Japan Flavor and Fragrance Materials Association, 2005; Gavin, Williams &Hallagan, 2008; International Organization of the Flavor Industry, 2009). In Europe,65% of the annual volume of production is accounted for by 3-methyl-2,4-nonedione(No. 2032) and octan-2,3-dione (No. 2036), and in the USA, 83% of the annualvolume of production is accounted for by octan-2,3-dione (No. 2036). Over 84% ofthe annual volume of production in Japan is accounted for by acetoinpropyleneglycol acetal (No. 2033).
The estimated dietary exposures for each of the flavouring agents,calculated either as the maximized survey-derived intake (MSDI) or using the singleportion exposure technique (SPET), are reported in Table 1. The highest estimatesare for acetoin propyleneglycol acetal (No. 2033) and the mixture of 3-hydroxy-5-methyl-2-hexanone and 2-hydroxy-5-methyl-3-hexanone (No. 2034) (450 μg forboth, the SPET value obtained for non-alcoholic beverages). For the otherflavouring agents in the group, the daily dietary exposures range from 0.01 to 400μg, with the SPET yielding the highest estimates for all, except for 4,5-octanedione(No. 2037). Reported annual volumes of production of this group of flavouringagents and the calculated daily dietary exposures (MSDI and SPET) aresummarized in Table 2.
70 ALIPHATIC ACYCLIC AND ALICYCLIC -DIKETONES AND RELATED -HYDROXYKETONES

Tabl
e 1.
Sum
mar
y of
the
resu
lts o
f the
saf
ety
eval
uatio
ns o
f alip
hatic
acy
clic
and
alic
yclic
-d
iket
ones
and
rel
ated
-
hydr
oxyk
eton
es u
sed
as fl
avou
ring
age
ntsa,
b,c
Fla
vour
ing
agen
tN
o.C
AS
No.
and
str
uctu
reS
tep
A3d
Doe
s in
take
exce
ed th
eth
resh
old
for
hum
an in
take
?
Ste
p A
4Is
the
subs
tanc
eor
are
its
met
abol
ites
endo
geno
us?
Ste
p A
5A
dequ
ate
mar
gin
ofsa
fety
for
the
flavo
urin
g ag
ent o
rre
late
d su
bsta
nces
?
Com
men
ts o
npr
edic
ted
met
abol
ism
Con
clus
ion
base
d on
curr
ent
estim
ated
diet
ary
expo
sure
Str
uctu
ral c
lass
II
3-M
ethy
l-2,4
-non
edio
ne20
3211
3486
-29-
6
OO
No,
SP
ET
: 20
NR
NR
Not
e 1
No
safe
tyco
ncer
n
Mix
ture
of 3
-Hyd
roxy
-5-
met
hyl-2
-hex
anon
e an
d2-
Hyd
roxy
-5-m
ethy
l-3-
hexa
none
2034
1630
38-0
4-8 O
OH
2465
11-7
4-0 OH O
No,
SP
ET
: 450
NR
NR
Not
e 1
No
safe
tyco
ncer
n
ALIPHATIC ACYCLIC AND ALICYCLIC -DIKETONES AND RELATED -HYDROXYKETONES 71

Tabl
e 1
(con
td)
Fla
vour
ing
agen
tN
o.C
AS
No.
and
str
uctu
reS
tep
A3d
Doe
s in
take
exce
ed th
eth
resh
old
for
hum
an in
take
?
Ste
p A
4Is
the
subs
tanc
eor
are
its
met
abol
ites
endo
geno
us?
Ste
p A
5A
dequ
ate
mar
gin
ofsa
fety
for
the
flavo
urin
g ag
ent o
rre
late
d su
bsta
nces
?
Com
men
ts o
npr
edic
ted
met
abol
ism
Con
clus
ion
base
d on
curr
ent
estim
ated
diet
ary
expo
sure
3-H
ydro
xy-2
-oct
anon
e20
3537
160-
77-3
OH
O
No,
SP
ET
: 400
NR
NR
Not
e 1
No
safe
tyco
ncer
n
2,3-
Oct
aned
ione
2036
585-
25-1
O
O
No,
SP
ET
: 3.6
NR
NR
Not
e 1
No
safe
tyco
ncer
n
4,5-
Oct
aned
ione
2037
5455
-24-
3
O
O
No,
MS
DI:
Eur
ope
0.01
US
A N
DJa
pan
0.9
NR
NR
Not
e 1
No
safe
tyco
ncer
n
72 ALIPHATIC ACYCLIC AND ALICYCLIC -DIKETONES AND RELATED -HYDROXYKETONES

Tabl
e 1
(con
td)
Fla
vour
ing
agen
tN
o.C
AS
No.
and
str
uctu
reS
tep
A3d
Doe
s in
take
exce
ed th
eth
resh
old
for
hum
an in
take
?
Ste
p A
4Is
the
subs
tanc
eor
are
its
met
abol
ites
endo
geno
us?
Ste
p A
5A
dequ
ate
mar
gin
ofsa
fety
for
the
flavo
urin
g ag
ent o
rre
late
d su
bsta
nces
?
Com
men
ts o
npr
edic
ted
met
abol
ism
Con
clus
ion
base
d on
curr
ent
estim
ated
diet
ary
expo
sure
(±)-
2-H
ydro
xypi
perit
one
2038
490-
03-9
OH
O
No,
SP
ET
: 400
NR
NR
Not
e 2
No
safe
tyco
ncer
n
Str
uctu
ral c
lass
III
Ace
toin
pro
pyle
negl
ycol
keta
l20
3394
089-
23-3
O
O
HO
Yes
, SP
ET
:45
0N
oY
es. T
he N
OA
EL
of33
0 m
g/kg
bw
per
day
for
the
met
abol
iteac
etoi
n (N
o. 4
05)
in a
90-d
ay s
tudy
in r
ats
(Gau
nt e
t al.,
197
2) is
at le
ast 4
1 20
0 tim
esth
e es
timat
ed d
aily
diet
ary
expo
sure
to N
o.20
33 w
hen
used
as
afla
vour
ing
agen
t.
Not
e 3
No
safe
tyco
ncer
n
ALIPHATIC ACYCLIC AND ALICYCLIC -DIKETONES AND RELATED -HYDROXYKETONES 73

Tabl
e 1
(con
td)
Fla
vour
ing
agen
tN
o.C
AS
No.
and
stru
ctur
eS
tep
A3d
Doe
s in
take
exce
ed th
eth
resh
old
for
hum
an in
take
?
Ste
p A
4Is
the
subs
tanc
eor
are
its
met
abol
ites
endo
geno
us?
Ste
p A
5A
dequ
ate
mar
gin
ofsa
fety
for
the
flavo
urin
g ag
ent o
rre
late
d su
bsta
nces
?
Com
men
tson
pre
dict
edm
etab
olis
m
Con
clus
ion
base
d on
curr
ent
estim
ated
diet
ary
expo
sure
1,1
-(T
etra
hydr
o-6a
-hy
drox
y-2,
3a,5
-tr
imet
hylfu
ro[2
,3-
d]-1
,3-d
ioxo
le-2
,5-
diyl
)bis
-eth
anon
e
2039
1811
4-49
-3
O O
O
OH
O
O
Yes
, SP
ET
: 400
No
Yes
. The
NO
AE
L of
90
mg/
kg b
wpe
r da
y fo
r th
e m
etab
olite
2,3
-bu
tane
dion
e (N
o. 4
08)
in a
90-
day
stud
y in
rat
s (C
olle
y et
al.,
196
9) is
at le
ast 1
2 80
0 tim
es th
e es
timat
edda
ily d
ieta
ry e
xpos
ure
to N
o. 2
039
whe
n us
ed a
s a
flavo
urin
g ag
ent.
Not
e 3
No
safe
tyco
ncer
n
bw, b
ody
wei
ght;
CA
S, C
hem
ical
Abs
trac
ts S
ervi
ce; N
D, n
o in
take
dat
a re
port
ed; N
OA
EL,
no-
obse
rved
-adv
erse
-effe
ct le
vel;
NR
, not
req
uire
d fo
rev
alua
tion
beca
use
cons
umpt
ion
of th
e fla
vour
ing
agen
t was
det
erm
ined
to b
e of
no
safe
ty c
once
rn a
t ste
p A
3 of
the
Pro
cedu
rea
Tw
enty
-tw
o fla
vour
ing
agen
ts in
this
gro
up w
ere
prev
ious
ly e
valu
ated
by
the
Com
mitt
ee (
Ann
ex 1
, ref
eren
ce 1
38).
bS
tep
1: S
ix fl
avou
ring
agen
ts in
this
gro
up (
Nos
203
2 an
d 20
34–2
038)
are
in s
truc
tura
l cla
ss II
. Tw
o fla
vour
ing
agen
ts in
this
gro
up (
Nos
203
3 an
d20
39)
are
in s
truc
tura
l cla
ss II
I.c
Ste
p 2:
All
of th
e fla
vour
ing
agen
ts in
this
gro
up c
an b
e ex
pect
ed to
be
met
abol
ized
to in
nocu
ous
prod
ucts
.d
The
thre
shol
ds fo
r hu
man
inta
ke fo
r st
ruct
ural
cla
sses
I, II
and
III a
re 1
800,
540
and
90
μg/d
ay, r
espe
ctiv
ely.
All
inta
ke v
alue
s ar
e ex
pres
sed
in μ
g/da
y. E
ither
the
high
est S
PE
T e
stim
ate
or th
e M
SD
I est
imat
es, i
f at l
east
one
is h
ighe
r th
an th
e hi
ghes
t SP
ET
est
imat
e, a
re g
iven
in th
e ta
ble.
Not
es:
1.M
etab
oliz
ed b
y -h
ydro
xyla
tion,
follo
wed
by
oxid
atio
n of
the
term
inal
met
hyl g
roup
to th
e co
rres
pond
ing
keto
carb
oxyl
ic a
cid.
The
aci
d m
ay u
nder
goox
idat
ive
deca
rbox
ylat
ion
to y
ield
car
bon
diox
ide
and
a si
mpl
e al
ipha
tic c
arbo
xylic
aci
d, w
hich
may
be
com
plet
ely
met
abol
ized
in th
e fa
tty a
cid
path
way
and
citr
ic a
cid
cycl
e.2.
Red
uctio
n of
the
hydr
oxyk
eton
e to
yie
ld th
e co
rres
pond
ing
diol
, whi
ch is
con
juga
ted
with
glu
curo
nic
acid
and
exc
rete
d pr
imar
ily in
the
urin
e.3.
Hyd
roly
sis
to fo
rm th
e -h
ydro
xyke
tone
or d
iket
one,
follo
wed
by
oxid
atio
n of
the
term
inal
met
hyl g
roup
, or r
educ
tion
to th
e co
rres
pond
ing
diol
, fol
low
edby
con
juga
tion
with
glu
curo
nic
acid
and
exc
retio
n in
the
urin
e.
74 ALIPHATIC ACYCLIC AND ALICYCLIC -DIKETONES AND RELATED -HYDROXYKETONES

Tabl
e 2.
Ann
ual v
olum
es o
f pro
duct
ion
and
diet
ary
expo
sure
s fo
r al
ipha
tic a
cycl
ic a
nd a
licyc
lic
-dik
eton
es a
ndre
late
d -
hydr
oxyk
eton
es u
sed
as fl
avou
ring
age
nts
in E
urop
e, th
e U
SA
and
Jap
an
Fla
vour
ing
agen
t (N
o.)
Mos
t rec
ent
annu
al v
olum
eof
pro
duct
ion
(kg)
a
Die
tary
exp
osur
eA
nnua
l vol
ume
of n
atur
aloc
curr
ence
info
ods
(kg)
d
Con
sum
ptio
nra
tioe
MS
DIb
SP
ET
c
μg/d
ayμg
/kg
bw p
er d
ayμg
/day
μg/k
g bw
per
day
3-M
ethy
l-2,4
-non
edio
ne (
2032
)20
0.3
1817
7
Eur
ope
0.8
0.09
0.00
1
US
A0.
10.
010.
0002
Japa
n2
0.6
0.01
Ace
toin
pro
pyle
negl
ycol
ace
tal (
2033
)45
08
–N
A
Eur
ope
ND
ND
ND
US
AN
DN
DN
D
Japa
n33
100.
2
Mix
ture
of 3
-Hyd
roxy
-5-m
ethy
l-2-
hexa
none
and
2-H
ydro
xy-5
-met
hyl-3
-he
xano
ne (
2034
)
450
8–
NA
Eur
ope
0.1
0.01
0.00
02
US
A0.
50.
060.
001
Japa
n0.
10.
030.
0005
3-H
ydro
xy-2
-oct
anon
e (2
035)
400
7+
NA
Eur
ope
0.1
0.01
0.00
02
ALIPHATIC ACYCLIC AND ALICYCLIC -DIKETONES AND RELATED -HYDROXYKETONES 75

Tabl
e 2
(con
td)
Fla
vour
ing
agen
t (N
o.)
Mos
t rec
ent
annu
al v
olum
eof
pro
duct
ion
(kg)
a
Die
tary
exp
osur
eA
nnua
l vol
ume
of n
atur
aloc
curr
ence
info
ods
(kg)
d
Con
sum
ptio
nra
tioe
MS
DIb
SP
ET
c
μg/d
ayμg
/kg
bw p
er d
ayμg
/day
μg/k
g bw
per
day
US
AN
DN
DN
D
Japa
nN
DN
DN
D
Oct
an-2
,3-d
ione
(20
36)
3.6
0.06
627
125
Eur
ope
0.5
0.05
0.00
1
US
A5
0.6
0.01
Japa
n0.
10.
030.
0005
4,5-
Oct
aned
ione
(20
37)
0.8
0.01
+N
A
Eur
ope
0.1
0.01
0.00
02
US
AN
DN
DN
D
Japa
n3
0.9
0.01
5
(±)-
2-H
ydro
xypi
perit
one
(203
8)40
07
+N
A
Eur
ope
0.1
0.02
0.00
03
US
AN
DN
DN
D
Japa
n0.
10.
030.
0005
76 ALIPHATIC ACYCLIC AND ALICYCLIC -DIKETONES AND RELATED -HYDROXYKETONES

Tabl
e 2
(con
td)
Fla
vour
ing
agen
t (N
o.)
Mos
t rec
ent
annu
al v
olum
eof
pro
duct
ion
(kg)
a
Die
tary
exp
osur
eA
nnua
l vol
ume
of n
atur
aloc
curr
ence
info
ods
(kg)
d
Con
sum
ptio
nra
tioe
MS
DIb
SP
ET
c
μg/d
ayμg
/kg
bw p
er d
ayμg
/day
μg/k
g bw
per
day
1,1
-(T
etra
hydr
o-6a
-hyd
roxy
-2,3
a,5-
trim
ethy
lfuro
[2,3
-d]-
1,3-
diox
ole-
2,5-
diyl
)bis
-eth
anon
e (2
039)
400
7–
NA
Eur
ope
ND
ND
ND
US
A0.
50.
060.
001
Japa
nN
DN
DN
D
To
tal
Eur
ope
2
US
A6
Japa
n39
bw, b
ody
wei
ght;
NA
, not
ava
ilabl
e; N
D, n
o da
ta r
epor
ted;
+, r
epor
ted
to o
ccur
nat
ural
ly in
food
s (N
ijsse
n, v
an In
gen-
Vis
sche
r &
Don
ders
, 200
9), b
utno
qua
ntita
tive
data
; , n
ot r
epor
ted
to o
ccur
nat
ural
ly in
food
sa
Fro
m E
urop
ean
Fla
vour
and
Fra
gran
ce A
ssoc
iatio
n (2
004)
, Gav
in, W
illia
ms
& H
alla
gan
(200
8), I
nter
natio
nal O
rgan
izat
ion
of th
e F
lavo
r Ind
ustr
y (2
009)
and
Japa
n F
lavo
r an
d F
ragr
ance
Mat
eria
ls A
ssoc
iatio
n (2
005)
. Val
ues
grea
ter
than
zer
o bu
t les
s th
an 0
.1 k
g w
ere
repo
rted
as
0.1
kg.
b M
SD
I (μg
/per
son
per
day)
cal
cula
ted
as fo
llow
s:
ALIPHATIC ACYCLIC AND ALICYCLIC -DIKETONES AND RELATED -HYDROXYKETONES 77

Tabl
e 2
(con
td)
(ann
ual v
olum
e, k
g) ×
(1 ×
109 μ
g/kg
)/(p
opul
atio
n ×
sur
vey
corr
ectio
n fa
ctor
× 3
65 d
ays)
, whe
re p
opul
atio
n (1
0%, “
eate
rs o
nly”
) = 3
2 ×
106 f
or E
urop
e,28
× 1
06 fo
r th
e U
SA
and
13
× 1
06 fo
r Ja
pan;
and
whe
re s
urve
y co
rrec
tion
fact
or =
0.8
for
the
surv
eys
in E
urop
e, th
e U
SA
and
Jap
an, r
epre
sent
ing
the
assu
mpt
ion
that
onl
y 80
% o
f the
ann
ual f
lavo
ur v
olum
e w
as r
epor
ted
in th
e po
unda
ge s
urve
ys (
Eur
opea
n F
lavo
ur a
nd F
ragr
ance
Ass
ocia
tion,
2004
; Jap
an F
lavo
r an
d F
ragr
ance
Mat
eria
ls A
ssoc
iatio
n, 2
005;
Gav
in, W
illia
ms
& H
alla
gan,
200
8; In
tern
atio
nal O
rgan
izat
ion
of th
e F
lavo
r In
dust
ry,
2009
).M
SD
I (μg
/kg
bw p
er d
ay)
calc
ulat
ed a
s fo
llow
s:(μ
g/pe
rson
per
day
)/bo
dy w
eigh
t, w
here
bod
y w
eigh
t = 6
0 kg
. Slig
ht v
aria
tions
may
occ
ur fr
om r
ound
ing.
c S
PE
T (
μg/p
erso
n pe
r da
y) c
alcu
late
d as
follo
ws:
(sta
ndar
d fo
od p
ortio
n, g
/day
) ×
(av
erag
e us
e le
vel)
(Int
erna
tiona
l Org
aniz
atio
n of
the
Fla
vor
Indu
stry
, 200
9). T
he d
ieta
ry e
xpos
ure
from
the
sing
lefo
od c
ateg
ory
lead
ing
to th
e hi
ghes
t die
tary
exp
osur
e fr
om o
ne p
ortio
n is
take
n as
the
SP
ET
est
imat
e.S
PE
T (
μg/k
g bw
per
day
) ca
lcul
ated
as
follo
ws:
(μg/
pers
on p
er d
ay)/
body
wei
ght,
whe
re b
ody
wei
ght =
60
kg. S
light
var
iatio
ns m
ay o
ccur
from
rou
ndin
g.d
Qua
ntita
tive
data
for
the
US
A r
epor
ted
by S
tofb
erg
& G
rund
scho
ber
(198
7).
e T
he c
onsu
mpt
ion
ratio
is c
alcu
late
d as
follo
ws:
(ann
ual c
onsu
mpt
ion
via
food
, kg)
/(m
ost r
ecen
t rep
orte
d vo
lum
e as
a fl
avou
ring
agen
t, kg
).
78 ALIPHATIC ACYCLIC AND ALICYCLIC -DIKETONES AND RELATED -HYDROXYKETONES

1.3 Absorption, distribution, metabolism and elimination
In the report of the fifty-first meeting, biodisposition of flavouring agents inthis group was extensively discussed. In rats and mice, orally administered aliphatic
-diketones are rapidly absorbed from the gastrointestinal tract (Gabriel, Ilbawi &Al-Khalidi, 1972). It is anticipated that at low levels of exposure, humans willmetabolize aliphatic acyclic -diketones principally by -hydroxylation andsubsequent oxidation of the terminal methyl group to yield the correspondingketocarboxylic acid. The acid may undergo oxidative decarboxylation to yieldcarbon dioxide and a simple aliphatic carboxylic acid, which could be completelymetabolized in the fatty acid pathway and citric acid cycle. At higher concentrations,another detoxication pathway is used, which involves reduction to the diol andsubsequent conjugation with glucuronic acid (Westerfeld & Berg, 1943; Williams,1959; Gabriel, Jabara & Al Khalidi, 1971; Gabriel, Ilbawi & Al-Khalidi, 1972; Otsukaet al., 1996). Aliphatic -diketones and alicyclic -hydroxyketones, diketones andhydroxyketones are mainly metabolized by reduction to the corresponding diol,followed by glucuronic acid conjugation and excretion (Mills & Walker, 1990; Onget al., 1991). Ketals (dioxolanes) are predicted to undergo hydrolysis to yield thecorresponding alcohol and ketone (Nos 405, 408 and 2033).
1.4 Application of the Procedure for the Safety Evaluation of FlavouringAgents
Step 1. In applying the Procedure for the Safety Evaluation of FlavouringAgents to the above-mentioned flavouring agents, the Committee assigned sixflavouring agents (Nos 2032 and 2034–2038) to structural class II and the remainingtwo flavouring agents (Nos 2033 and 2039) to structural class III (Cramer, Ford &Hall, 1978).
Step 2. All eight of the flavouring agents in this group are expected to bemetabolized to innocuous products. The evaluation of all flavouring agents in thisgroup therefore proceeded via the A-side of the Procedure.
Step A3. The estimated daily intakes for the six flavouring agents in structuralclass II are below the threshold of concern (i.e. 540 μg/person per day for class II).Therefore, the safety of these six flavouring agents raises no concern at their currentestimated dietary exposures. The estimated daily intakes for the two flavouringagents in structural class III are above the threshold of concern (i.e. 90 μg/personper day for class III). Accordingly, the evaluation of these flavouring agentsproceeded to step A4.
Step A4. Neither the flavouring agents—acetoin propyleneglycol ketal (No.2033) and 1,1 -(tetrahydro-6a-hydroxy-2,3a,5-trimethylfuro[2,3-d]-1,3-dioxole-2,5-diyl)bis-ethanone (No. 2039)—nor their metabolites are endogenous substances.Accordingly, the evaluation of these flavouring agents proceeded to step A5.
Step A5. For acetoin propyleneglycol ketal (No. 2033), the no-observed-adverse-effect level (NOAEL) of 330 mg/kg body weight (bw) per day for themetabolite acetoin (No. 405) in a 90-day study in rats (Gaunt et al., 1972) providesa margin of safety of over 40 000 in relation to the highest estimated dietary
ALIPHATIC ACYCLIC AND ALICYCLIC -DIKETONES AND RELATED -HYDROXYKETONES 79

exposure to No. 2033 (SPET = 450 μg/person per day) when used as a flavouringagent.
For 1,1 -(tetrahydro-6a-hydroxy-2,3a,5-trimethylfuro[2,3-d]-1,3-dioxole-2,5-diyl)bis-ethanone (No. 2039), the NOAEL of 90 mg/kg bw per day for the metabolite2,3-butanedione (No. 408) in a 90-day study in rats (Colley et al., 1969) provides amargin of safety of approximately 13 000 in relation to the highest estimated dietaryexposure to No. 2039 (SPET = 400 μg/person per day) when used as a flavouringagent.
The Committee concluded that the margins of safety indicate that theseflavouring agents would not pose safety concerns at current estimated dietaryexposures.
Table 1 summarizes the evaluations of the eight aliphatic acyclic and alicyclic-diketones and related -hydroxyketones used as flavouring agents (Nos 2032–
2039) in this group.
1.5 Consideration of combined intakes from use as flavouring agents
The safety assessment of possible combined intakes of flavouring agentswas undertaken based on the presence of common metabolites or a homologousseries (as proposed at the sixty-eighth meeting; Annex 1, reference 187) and usingthe MSDI exposure assessment (as proposed at the sixty-ninth meeting; Annex 1,reference 190). In addition, at this meeting, the Committee also consideredcombined intakes for structurally closely related series of flavouring agents.
Flavouring agents in this series that are members of a structurally closelyrelated series of aliphatic acyclic -diketones or related -hydroxyketones, whichare in structural class II, or predicted to be metabolized to such compounds are Nos2033–2037 and 2039. The five related flavouring agents with the highest intakes inEurope are Nos 405, 408, 410, 412 and 413 and in the USA are Nos 405, 406, 408,410 and 412. In the unlikely event that these flavouring agents were to be consumedconcurrently on a daily basis, the estimated combined intakes would beapproximately 6000 μg/person per day in Europe and approximately 10 000 μg/person per day in the USA. These would exceed the threshold of concern (i.e. 540μg/person per day for class II). However, all of these flavouring agents are expectedto be efficiently metabolized and would not saturate available detoxicationpathways. The Committee concluded that under the conditions of use as flavouringagents, the combined intake of the substances in this group would not raise concernabout safety.
The flavouring agent No. 2038 is a member of a structurally closely relatedseries of alicyclic -diketones or related -hydroxyketones, which are in structuralclass II, or predicted to be metabolized to such compounds. The five relatedflavouring agents with the highest intakes in Europe and in the USA are Nos 418–421 and 425; the flavouring agent with the highest intake in Japan is No. 2033. Inthe unlikely event that these flavouring agents were to be consumed concurrentlyon a daily basis, the estimated combined intakes would be approximately 1000 μg/person per day in Europe, 6 μg/person per day in Japan and 800 μg/person per day
80 ALIPHATIC ACYCLIC AND ALICYCLIC -DIKETONES AND RELATED -HYDROXYKETONES

in the USA. These would exceed the threshold of concern (i.e. 540 μg/person perday for class II). However, all of these flavouring agents are expected to be efficientlymetabolized and would not saturate available detoxication pathways. TheCommittee concluded that under the conditions of use as flavouring agents, thecombined intake of these substances would not raise concern about safety.
The remaining flavouring agent (No. 2032) does not share close structuralcharacteristics with others in the group, and consideration of combined intake is notindicated.
The Committee concluded that under the conditions of use as flavouringagents, the combined intakes of flavouring agents in this group would not pose asafety concern.
1.6 Consideration of secondary components
No flavouring agents in this group have minimum assay values of lessthan 95%.
1.7 Conclusion
In the previous evaluation of this group of flavouring agents, studies ofbiological properties, acute toxicity, short-term toxicity, long-term toxicity andcarcinogenicity, genotoxicity and reproductive toxicity were available. None raisedsafety concerns. The additional biochemical and toxicological data available for thisevaluation supported those from the previous evaluation (Annex 1, reference 138).
The Committee concluded that these eight flavouring agents, which areadditions to the group of aliphatic acyclic and alicyclic -diketones and related -hydroxyketones evaluated previously, would not give rise to safety concerns atcurrent estimated dietary exposures.
2. RELEVANT BACKGROUND INFORMATION
2.1 Explanation
This addendum summarizes the additional key data relevant to the safetyevaluation of a group of eight aliphatic acyclic and alicyclic -diketones and related
-hydroxyketones, which included two aliphatic -diketones, two aliphatic -hydroxyketones, one aliphatic -diketone, one alicyclic , -unsaturated -hydroxyketone and one -hydroxyketal. These flavouring agents are additions tothe group of 22 aliphatic acyclic and alicyclic -diketones and -hydroxyketonesevaluated previously by the Committee at its fifty-first meeting (Annex 1, reference138).
ALIPHATIC ACYCLIC AND ALICYCLIC -DIKETONES AND RELATED -HYDROXYKETONES 81

2.2 Additional considerations on intake
There is no additional information on intake. Dietary exposure estimateswere made using the MSDI approach as well as the SPET.
2.3 Biological data
2.3.1 Biochemical data: absorption, distribution, metabolism and elimination
Additional information related to the absorption, distribution, metabolism andexcretion of the flavouring agents in this group and of structurally related agents hasbeen reported since the preparation of the original monograph (Annex 1, reference138) and is described below.
(a) 1,1 -(Tetrahydro-6a-hydroxy-2,3a,5-trimethylfuro[2,3-d]-1,3-dioxole-2,5-diyl)bis-ethanone (No. 2039)
In vitro studies conducted on 1,1 -(tetrahydro-6a-hydroxy-2,3a,5-trimethylfuro[2,3-d]-1,3-dioxole-2,5-diyl)bis-ethanone (No. 2039) in gastric juiceshow 100% hydrolysis to butane-2,3-dione (No. 408) within 12 h (Flavor and ExtractManufacturers Association, 2004). Similar studies conducted in artificial salivashowed 75% hydrolysis of 1,1 -(tetrahydro-6a-hydroxy-2,3a,5-trimethylfuro[2,3-d]-1,3-dioxole-2,5-diyl)bis-ethanone at pH 9 to butane-2,3-dione (No. 408) and100% hydrolysis to butane-2,3-dione at pH 1.5 and 2, within 45 min (Flavor andExtract Manufacturers Association, 2004). These hydrolysis reactions arepredictable.
(b) Butane-2,3-diol,1 a structurally related diol
Butane-2,3-diol is a known metabolic reduction product of acetoin, which isa reduction product of diacetyl (Otsuka et al., 1999). Butane-2,3-diol may also bean intermediate in the in vitro mammalian metabolism of acetaldehyde. Butane-2,3-diol and its oxidation metabolite, acetoin, have been reported as intermediates inthe mammalian metabolism of pyruvate in vitro (Montgomery et al., 1993).
Butane-2,3-diol, 2-butanol and 3-hydroxy-2-butanone were identified asmetabolites in the serum of guinea-pigs administered methyl ethyl ketone byintraperitoneal injection. Methyl ethyl ketone undergoes -hydroxylation to form 3-hydroxy-2-butanone, which is subsequently reduced to 2,3-butanediol. The serumhalf-life of methyl ethyl ketone was reported to be 270 min, and the clearance timeof butane-2,3-diol was 6 h (DiVincenzo, Kaplan & Dedinas, 1976). Subsequently,butane-2,3-diol is eliminated as 2,3-butanediol -glucuronide (Otsuka et al., 1996).
82 ALIPHATIC ACYCLIC AND ALICYCLIC -DIKETONES AND RELATED -HYDROXYKETONES
1 OH
OH

(c) 4-Hydroxy-4-methylpentan-2-one,2 a structurally related -hydroxyketone
4-Hydroxy-4-methylpentan-2-one, a structurally related -hydroxyketone,and 4-methyl-2-pentanol were identified in the serum of guinea-pigs administered4-methyl-2-pentanone by intraperitoneal injection. The principal metabolite, 4-hydroxy-4-methylpentan-2-one, had a clearance time of 16 h. The amount of 4-methyl-2-pentanol in the serum was too low for quantification. These results indicatethat 4-methyl-2-pentanone is metabolized by reduction of the carbonyl group to form4-methyl-2-pentanol and by oxidation at the -1 carbon to form 4-hydroxy-4-methylpentan-2-one (DiVincenzo, Kaplan & Dedinas, 1976).
2.3.2 Toxicological studies
(a) Acute toxicity
Oral median lethal doses (LD50 values) have been reported for two of theeight flavouring agents in this group and are summarized in Table 3. For both themixture of 3-hydroxy-5-methyl-2-hexanone and 2-hydroxy-5-methyl-3-hexanone(No. 2034) and 3-methyl-2,4-nonedione (No. 2032), LD50 values in rats weredemonstrated to be greater than 2000 mg/kg bw (Strobel, 1998; Pooles, 2003).
Table 3. Results of acute oral toxicity studies for aliphatic acyclic and alicyclic-diketones and related -hydroxyketones used as flavouring agents
No. Flavouring agent Species; sex LD50 (mg/kg bw) Reference
2032 3-Methyl-2,4-nonadione Rat; F >2000a Pooles (2003)
2034 Mixture of 3-Hydroxy-5-methyl-2-hexanone and 2-Hydroxy-5-methyl-3-hexanone
Rat; M, F >2000a Strobel (1998)
F, female; M, malea Highest dose tested. Actual LD50 may be higher.
These studies support the Committee’s conclusion in the original monographthat the acute oral toxicity of aliphatic acyclic and alicyclic -diketones and related
-hydroxyketones is low.
(b) Short- and long-term studies of toxicity
No studies of short-term or long-term toxicity have been reported for any ofthe eight flavouring agents in this group. One short-term toxicity study on astructurally related substance not in this group is described below.
ALIPHATIC ACYCLIC AND ALICYCLIC -DIKETONES AND RELATED -HYDROXYKETONES 83
2
O
OH

(i) 4-Hydroxy-4-methylpentan-2-one, a structurally related -hydroxyketone
Groups of 10 albino rats (sex not specified) were administered diacetonealcohol (i.e. 4-hydroxy-4-methylpentan-2-one) (commercial grade), which had beendetermined to be free of acetone, in their drinking-water for 30 days atconcentrations resulting in doses of 0, 10, 40 or 130 mg/kg bw per day. Drinking-water consumption, body weight gain, body length, fatness (g/mm body length), liverweight, kidney weight, macroscopic pathology and histopathology were measuredor evaluated. No deaths occurred. In one of the rats at the 40 mg/kg bw per daydose level, cloudy swelling and degeneration of renal tubular epithelium werereported. No adverse effects were reported in any rats at the 10 mg/kg bw per daydose level (Smyth, 1946).
(c) Genotoxicity studies
Genotoxicity testing has been performed on three flavouring agents in thepresent group (Annex 1, reference 138). The results of these tests are summarizedin Table 4 and described below. Additional studies of genotoxicity on a previouslyevaluated member of this group, on a metabolite of a previously evaluated memberof this group and on a structurally related substance not in this group are alsodescribed below.
(i) In vitro
3-Methyl-2,4-nonanedione (No. 2032) was tested for mutagenicity tobacteria by incubation with Salmonella typhimurium tester strains TA98, TA100,TA1535 and TA1537, as well as Escherichia coli strain WP2uvrA, either alone orwith an exogenous induced male rat liver bioactivation system, using apreincubation assay. The test substance alone and with bioactivation was toxic at1250 and 5000 μg/plate, respectively. At six concentrations up to 1250 μg/plate, thetest substance produced no increase in revertant mutants in any strain, whereasappropriate control substances established the responsiveness of the tester strains(Sasaki, 2006).
The mixture of 3-hydroxy-5-methyl-2-hexanone and 2-hydroxy-5-methyl-3-hexanone (No. 2034) was tested for mutagenicity to bacteria by incubation with S.typhimurium tester strains TA97, TA98, TA100, TA102 and TA1535, either alone orwith an exogenous bioactivation system, using either plate incorporation orpreincubation assays. At concentrations up to 5000 μg/plate, no toxic effects wereobserved in the plate assay, but variable degrees of toxicity were observed in thepreincubation assay. The test substance produced no increase in revertantmutants in any strain, whereas appropriate control substances established theresponsiveness of the tester strains (Gocke, 1997).
84 ALIPHATIC ACYCLIC AND ALICYCLIC -DIKETONES AND RELATED -HYDROXYKETONES

Tabl
e 4.
Stu
dies
of g
enot
oxic
ity w
ith a
lipha
tic a
cycl
ic a
nd a
licyc
lic
-dik
eton
es a
nd r
elat
ed
-hyd
roxy
keto
nes
used
as
flavo
urin
g ag
ents
No.
Fla
vour
ing
agen
tE
nd-p
oint
Tes
t obj
ect
Con
cent
ratio
n (μ
g/pl
ate)
Res
ults
Ref
eren
ce
In v
itro
2032
3-M
ethy
l-2,4
-non
adio
neR
ever
sem
utat
ion
Sal
mon
ella
typh
imur
ium
TA
98,
TA
100,
TA
1535
and
TA
1537
39.1
, 78.
1, 1
56, 3
13, 6
25an
d 12
50N
egat
ivea,
b,c,
dS
asak
i (20
06)
2032
3-M
ethy
l-2,4
-non
adio
neR
ever
sem
utat
ion
Esc
heric
hia
coli
WP
2uvr
A39
.1, 7
8.1,
156
, 313
, 625
and
1250
Neg
ativ
ea,c,
dS
asak
i (20
06)
2034
Mix
ture
of 3
-Hyd
roxy
-5-
met
hyl-2
-hex
anon
e an
d 2-
Hyd
roxy
-5-m
ethy
l-3-h
exan
one
Rev
erse
mut
atio
nS
. typ
him
uriu
mT
A97
, TA
98,
TA
100,
TA
102
and
TA
1535
50–5
000
Neg
ativ
ed,e,
fG
ocke
(19
97)
2034
Mix
ture
of 3
-Hyd
roxy
-5-
met
hyl-2
-hex
anon
e an
d 2-
Hyd
roxy
-5-m
ethy
l-3-h
exan
one
Rev
erse
mut
atio
nS
. typ
him
uriu
mT
A97
, TA
98,
TA
100,
TA
102
and
TA
1535
50–5
000
Neg
ativ
ea,d
Goc
ke (
1997
)
2039
1,1
-(T
etra
hydr
o-6a
-hyd
roxy
-2,
3a,5
-trim
ethy
lfuro
[2,3
-d]-
1,3-
diox
ole-
2,5-
diyl
)bis
-eth
anon
e
Rev
erse
mut
atio
nS
. typ
him
uriu
mT
A98
, TA
100,
TA
102,
TA
1535
and
TA
1537
100,
316
, 100
0, 3
160
and
5000
Neg
ativ
ea,d,
gS
tien
(200
5)
ALIPHATIC ACYCLIC AND ALICYCLIC -DIKETONES AND RELATED -HYDROXYKETONES 85

Tabl
e 4
(con
td)
No.
Fla
vour
ing
agen
tE
nd-p
oint
Tes
t obj
ect
Con
cent
ratio
n (μ
g/pl
ate)
Res
ults
Ref
eren
ce
2039
1,1
-(T
etra
hydr
o-6a
-hyd
roxy
-2,
3a,5
-trim
ethy
lfuro
[2,3
-d]-
1,3-
diox
ole-
2,5-
diyl
)bis
-eth
anon
e
Rev
erse
mut
atio
nS
. typ
him
uriu
mT
A98
, TA
100,
TA
102,
TA
1535
and
TA
1537
10, 3
1.6,
100
, 316
and
100
0N
egat
ived,
e,h
Stie
n (2
005)
408
2,3-
But
aned
ione
For
war
dm
utat
ion
Mou
se ly
mph
oma
L517
8Y T
K+
/ c
ells
100,
150
, 180
, 200
and
250
Pos
itive
Whi
ttake
r et
al.
(200
8)
a S
tand
ard
plat
e in
corp
orat
ion
met
hod.
b C
ytot
oxic
ity w
as o
bser
ved
at g
reat
er th
an 3
13 μ
g/pl
ate
in a
ll te
st s
trai
ns w
ithou
t S9
activ
atio
n.c
Cyt
otox
icity
was
obs
erve
d at
125
0 μg
/pla
te in
all
test
str
ains
with
S9
activ
atio
n.d
With
and
with
out m
etab
olic
act
ivat
ion.
e P
rein
cuba
tion
met
hod.
f Cyt
otox
icity
was
obs
erve
d at
the
high
est c
once
ntra
tion
(i.e.
500
0 μg
/pla
te)
in a
ll te
st s
trai
ns.
g C
ytot
oxic
ity w
as o
bser
ved
at th
e hi
ghes
t con
cent
ratio
n (i.
e. 5
000
μg/p
late
) in
all
test
str
ains
exc
ept T
A98
in th
e pl
ate
inco
rpor
atio
n as
say.
h C
ytot
oxic
ity w
as o
bser
ved
at th
e hi
ghes
t con
cent
ratio
n (i.
e. 1
000
μg/p
late
) in
all
test
str
ains
in th
e pr
einc
ubat
ion
assa
y.
86 ALIPHATIC ACYCLIC AND ALICYCLIC -DIKETONES AND RELATED -HYDROXYKETONES

1,1 -(Tetrahydro-6a-hydroxy-2,3a,5-trimethylfuro[2,3-d]-1,3-dioxole-2,5-diyl)-bis-ethanone (No. 2039) was tested for mutagenicity to bacteria by incubation withS. typhimurium tester strains TA98, TA100, TA102, TA1535 and TA1537, eitheralone or with an exogenous induced rat liver bioactivation system, using either theplate incorporation or preincubation assays. In the plate assay, either alone or withbioactivation, toxicity was observed at 5000 μg/plate, and in the preincubationassay, it was observed at 1000 μg/plate. At five concentrations up to the maximumconcentration of 5000 μg/plate in the plate assay, both alone and with bioactivation,and up to the maximum concentration of 1000 μg/plate in the preincubation assay,the test substance produced no increase in revertant mutants in any strain, whereasappropriate control substances established the responsiveness of the tester strains(Stien, 2005).
2,3-Butanedione (No. 408) (also referred to as diacetyl) was tested formammalian cell gene mutagenicity in an assay using L5178Y TK+/ mouselymphoma cells, with an exogenous human liver bioactivation system pooled from10 individuals of both sexes. Cell death was observed at 500 μg/ml. In themutagenicity assay, mouse lymphoma cells were exposed to the test material atconcentrations up to 500 μg/ml, and the concentrations chosen for cloning were100, 150, 180, 200 and 250 μg/ml. For the three lower doses, the relative growth ofthe exposed colonies was approximately 80%, but for the two higher doses, it wasreduced to 38% and 31% of the control, respectively. 2,3-Butanedione induced adose-related increase in the number of mutant colonies over the range of 150–250μg/ml. The two highest concentrations (i.e. 200 and 250 μg/ml) yielded increasesof 90 mutants above the solvent control, which is the criterion for a positive responsein this assay. The authors suggested that the increase in the frequency of smallcolonies is consistent with changes to multiple loci on chromosome 11 as well asfunctional loss of the thymidine kinase locus (Whittaker et al., 2008).
Butane-2,3-diol, a metabolite of acetoin (No. 405), was tested formutagenicity to bacteria by incubation with S. typhimurium tester strains TA98,TA100, TA1535, TA1537 and TA1538 and Escherichia coli WP2uvrA tester strains.At up to 5000 μg/plate, no toxicity was observed. At eight concentrations up to 5000μg/plate, the test substance produced no increase in revertant mutants in any strain,whereas appropriate control substances established the responsiveness of thetester strains (Iwata et al., 1984).
4-Hydroxy-4-methylpentan-2-one, referred to as diacetone alcohol, which isa structurally related -hydroxyketone, was tested for mutagenicity to bacteria byincubation with S. typhimurium tester strains TA98, TA100, TA1535, TA1537 andTA1538, either alone or with exogenous induced male rat and hamster liverbioactivation systems, using the plate incorporation assay. No toxicity was observedat up to 10 000 μg/plate. At five concentrations up to 10 000 μg/plate, the testsubstance produced no increase in revertant mutants in any of the tester strainsalone or with bioactivation, whereas appropriate control substances established theresponsiveness of the tester strains (San & Klug, 1993).
4-Hydroxy-4-methylpentan-2-one was tested for mutagenicity to bacteria byincubation with S. typhimurium tester strains TA98, TA100, TA1535, TA1537 and
ALIPHATIC ACYCLIC AND ALICYCLIC -DIKETONES AND RELATED -HYDROXYKETONES 87

TA1538 and E. coli WP2 and WP2uvrA tester strains, alone or with an exogenousinduced rat liver bioactivation system, using the plate incorporation assay. A rangeof concentrations at 2-fold intervals up to 4000 μg/plate was tested. In two replicatetests, the test substance produced no increase in revertant mutants in any of thestrains, whereas appropriate control substances established the responsiveness ofthe tester strains (Brooks, Meyer & Hutson, 1988).
4-Hydroxy-4-methylpentan-2-one, referred to as diacetone alcohol, wastested for mutagenicity to yeast in the Saccharomyces cerevisiae mitotic geneconversion assay, either alone or with an exogenous induced rat liver bioactivationsystem. At five concentrations up to 5000 μg/ml, the test substance was negativealone and with a bioactivation system (Brooks, Meyer & Hutson, 1988). 4-Hydroxy-4-methylpentan-2-one was tested for induction of chromosomalaberrations in the cultured RL4 rat liver epithelial-type cell line. An exogenousbioactivation system was not used owing to the fact that RL4 cells are metabolicallycompetent. Exposure to 4-hydroxy-4-methylpentan-2-one at 4000 μg/ml causedsignificant toxicity, with greater than 60% growth inhibition of the cells. A marginalincrease in chromatid gaps was observed within the concentration range of 2000–4000 μg/ml; however, the effect was not concentration related. In the firstexperiment, 4-hydroxy-4-methylpentan-2-one concentrations of 750, 1500 and3000 μg/ml were used, and a small number of chromatid exchanges, breaks andacentric fragments were seen in cultures exposed to 3000 μg/ml. In the secondexperiment, 4-hydroxy-4-methylpentan-2-one concentrations of 2000, 3000 and4000 μg/ml were used; however, although some chromatid exchanges, breaks andacentric fragments were seen in cultures exposed to 2000 μg/ml, similar effectswere not seen at 3000 μg/ml, and only a single chromatid break and two fragmentswere seen at 4000 μg/ml. The authors concluded that the observed effect of 4-hydroxy-4-methylpentan-2-one exposure may be related to the length of treatmentor osmolality effects (Brooks, Meyer & Hutson, 1988). Brooks, Meyer & Hutson(1988) mentioned that osmolality is believed to have a significant influence oncellular metabolism, leading to chromosomal aberrations, and Galloway et al.(1987) postulated that the solvent and detergent-like properties of a bifunctional(ketone and secondary alcohol) chemical such as 4-hydroxy-4-methylpentan-2-onecould lead to a physical effect on the chromosomes of rat liver epithelial-type cells.
3. REFERENCES
Brooks TM, Meyer AL, Hutson DH (1988). The genetic toxicology of some hydrocarbon andoxygenated solvents. Mutagenesis, 3(3):227–232.
Colley J et al. (1969). Acute and short-term toxicity of diacetyl in rats. Food and CosmeticsToxicology, 7:571–580.
Cramer GM, Ford RA, Hall RL (1978). Estimation of toxic hazard—a decision tree approach.Food and Cosmetics Toxicology, 16:255–276.
DiVincenzo GD, Kaplan CJ, Dedinas J (1976). Characterization of the metabolites of methyln-butyl ketone, methyl iso-butyl ketone, and methyl ethyl ketone in guinea pig serum andtheir clearance. Toxicology and Applied Pharmacology, 36(3):511–522.
European Flavour and Fragrance Association (2004). European inquiry on volume of use.Unpublished report. Submitted to WHO by the International Organization of the FlavorIndustry, Brussels, Belgium.
88 ALIPHATIC ACYCLIC AND ALICYCLIC -DIKETONES AND RELATED -HYDROXYKETONES

Flavor and Extract Manufacturers Association (2004). Degradation of FEMA 4303.Unpublished report. Submitted to WHO by the International Organization of the FlavorIndustry, Brussels, Belgium.
Gabriel MA, Ilbawi M, al-Khalidi UA (1972). The oxidation of acetoin to CO2 in intact animalsand in liver mince preparation. Comparative Biochemistry and Physiology B, 41:493–502.
Gabriel MA, Jabara H, al-Khalidi UA (1971). Metabolism of acetoin in mammalian liver slicesand extracts. Interconversion with butane-2,3-diol and biacetyl. Biochemical Journal,124:793–800.
Galloway SM et al. (1987). Chromosome aberrations and sister chromatid exchanges inChinese hamster ovary cells: evaluations of 108 chemicals. Environmental and MolecularMutagenesis, 10(10):1–175.
Gaunt IF et al. (1972). Short-term toxicity of acetoin (acetylmethylcarbinol) in rats. Food andCosmetics Toxicology, 10(2):131–141.
Gavin CL, Williams MC, Hallagan JB (2008). 2005 poundage and technical effects updatesurvey. Washington, DC, USA, Flavor and Extract Manufacturers Association.
Gocke E (1997). Evaluation of the flavoring compound Ro 84-8111/000 for mutagenic activityin the Ames test. Study No. 169M97. Personal communication to the Flavor and ExtractManufacturers Association, Washington, DC, USA. Submitted to WHO by the InternationalOrganization of the Flavor Industry, Brussels, Belgium.
International Organization of the Flavor Industry (2009). Interim inquiry on volume use andadded use levels for flavoring agents to be presented at the JECFA 73rd meeting.Submitted to WHO by the International Organization of the Flavor Industry, Brussels,Belgium.
Iwata T et al. (1984). [Mutagenicity of lenampicillin hydrochloride (KBT-1585)B and itsmetabolites.] Chemotherapy, 32(8):153–159 (in Japanese).
Japan Flavor and Fragrance Materials Association (2005). Japanese inquiry on volume use.Unpublished report. Submitted to WHO by the International Organization of the FlavorIndustry, Brussels, Belgium.
Mills GA, Walker V (1990). Urinary excretion of cyclohexanediol, a metabolite of the solventcyclohexanone, by infants in a special care unit. Clinical Chemistry, 36:870–874.
Montgomery JA et al. (1993). Metabolism of 2,3-butanediol stereoisomers in the perfused ratliver. Journal of Biological Chemistry, 268(27):20185–20190.
Nijssen LM, van Ingen-Visscher CA, Donders JJM, eds (2009). VCF (Volatile Compounds inFood) database. Version 11.1.1. Zeist, Netherlands, TNO Quality of Life (http://www.vcf-online.nl/VcfHome.cfm).
Ong CN et al. (1991). Determination of cyclohexanol in urine and its use in environmentalmonitoring of cyclohexanone exposure. Journal of Analytical Toxicology, 15:13–16.
Otsuka M et al. (1996). A detoxication route for acetaldehyde: metabolism of diacetyl, acetoin,and 2,3-butanediol in liver homogenate and perfused liver of rats. Journal ofBiochemistry, 119:246–251.
Otsuka M et al. (1999). Blood and urinary levels of ethanol, acetaldehyde, and C4 compoundssuch as diacetyl, acetoin, and 2,3-butanediol in normal male students after ethanolingestion. Alcohol, 17(2):119–124.
Pooles A (2003). Acute oral toxicity in the rat of Greedione [3-methyl-2,4-nonedione].Unpublished report to the Flavor and Extract Manufacturers Association, Washington, DC,USA. Submitted to WHO by the International Organization of the Flavor Industry, Brussels,Belgium.
San RHC, Klug ML (1993). Salmonella/mammalian-microsome plate incorporationmutagenicity assay (Ames test). Short-term test programme sponsored by the Division ofCancer Etiology, National Cancer Institute, National Institutes of Health, Department ofHealth and Human Services, Bethesda, MD, USA. Unpublished report. Microbiological
ALIPHATIC ACYCLIC AND ALICYCLIC -DIKETONES AND RELATED -HYDROXYKETONES 89

Associates, Inc., Rockville, MD, USA. Submitted to WHO by the International Organizationof the Flavor Industry, Brussels, Belgium.
Sasaki S (2006). 3-Methyl-2,4-nonedione: reverse mutation test “Ames test” with S.typhimurium and E. coli. Unpublished report to the Flavor and Extract ManufacturersAssociation, Washington, DC, USA. Submitted to WHO by the International Organizationof the Flavor Industry, Brussels, Belgium.
Smyth HF (1946). Subacute toxicity of diacetone alcohol. Special report obtained throughUnion Carbide Corporation; 1995. EPA Document No. 86950000301; Microfiche No.OTS0557741. Submitted to WHO by the International Organization of the Flavor Industry,Brussels, Belgium.
Stien J (2005). Mutagenicity study of FEMA 4303 in the Salmonella typhimurium reversemutation assay (in vitro). LPT Report No. 18432/8/04. Laboratory of Pharmacology andToxicology KG, Hamburg, Germany. Unpublished report to the Flavor and ExtractManufacturers Association, Washington, DC, USA. Submitted to WHO by the InternationalOrganization of the Flavor Industry, Brussels, Belgium.
Stofberg J, Grundschober F (1987). Consumption ratio and food predominance of flavoringmaterials. Perfumer & Flavorist, 12:27.
Strobel R (1998). Acute toxicity study in the rat. Study No. 016 G 98. Personal communicationto the Flavor and Extract Manufacturers Association, Washington, DC, USA. Submitted toWHO by the International Organization of the Flavor Industry, Brussels, Belgium.
Westerfeld WW, Berg RL (1943). Observations on the metabolism of acetoin. Journal ofBiological Chemistry, 148(3):523–528.
Whittaker P et al. (2008). Evaluation of the butter flavoring diacetyl and a fluorochemical paperadditive for mutagenicity and toxicity using the mammalian cell gene mutation assay inL5178Y mouse lymphoma cells. Food and Chemical Toxicology, 46(8):2928–2933.
Williams TR (1959). Detoxication mechanisms: the metabolism and detoxication of drugs,toxic substances and other organic compounds, 2nd ed. New York, NY, USA, John Wiley& Sons, pp. 62–78.
90 ALIPHATIC ACYCLIC AND ALICYCLIC -DIKETONES AND RELATED -HYDROXYKETONES

ALIPHATIC ACYCLIC AND ALICYCLIC TERPENOID TERTIARY ALCOHOLSAND STRUCTURALLY RELATED SUBSTANCES (addendum)
First draft prepared by
Professor G.M. Williams,1 Dr M. DiNovi,2 Dr A. Mattia2 and Professor A.G.Renwick3
1 Environmental Pathology and Toxicology, New York Medical College,Valhalla, New York, United States of America (USA)
2 Center for Food Safety and Applied Nutrition, Food and Drug Administration,College Park, Maryland, USA
3 School of Medicine, University of Southampton, Southampton, England
1. Evaluation ..............................................................................1.1 Introduction ......................................................................1.2 Assessment of dietary exposure .....................................1.3 Absorption, distribution, metabolism and elimination ......1.4 Application of the Procedure for the Safety Evaluation of
Flavouring Agents ...........................................................1.5 Consideration of combined intakes from use as flavouring
agents ..............................................................................1.6 Consideration of secondary components ........................1.7 Conclusion .......................................................................
2. Relevant background information ..........................................2.1 Explanation ......................................................................2.2 Additional considerations on intake .................................2.3 Biological data .................................................................
2.3.1 Biochemical data: absorption, distribution,metabolism and elimination ....................................
2.3.2 Toxicological studies ..............................................3. References ............................................................................
1. EVALUATION
1.1 Introduction
The Committee evaluated seven additional flavouring agents belonging tothe group of aliphatic acyclic and alicyclic terpenoid tertiary alcohols and structurallyrelated substances, which was evaluated previously. The additional flavouringagents included one aliphatic terpene tertiary alcohol (No. 2031), four alicyclictertiary alcohols (Nos 2027–2030) and two esters of phenyl-substituted aliphatictertiary alcohols (Nos 2025 and 2026). The group of flavouring agents was selectedon the basis of the structural criteria of possessing a tertiary alcohol or an esterderived from a tertiary alcohol. The evaluations were conducted using theProcedure for the Safety Evaluation of Flavouring Agents (Figure 1, Introduction)(Annex 1, reference 131). None of these flavouring agents has been evaluatedpreviously by the Committee.
91919292
97
989999999999
100
100102116
- 91 -

The Committee previously evaluated 23 other members of this group offlavouring agents at its fifty-first meeting (Annex 1, reference 137). The Committeeconcluded that 22 of the 23 flavouring agents in that group were of no safety concernbased on estimated dietary exposures. For one flavouring agent, methyl 1-acetoxycyclohexylketone (No. 442), the available metabolic data were inadequateto allow the Committee to predict whether it would be metabolized to innocuousproducts, a relevant no-observed-effect level (NOEL) was lacking and the intakeexceeded 1.5 μg/day. The Committee concluded that additional data were requiredfor the evaluation of methyl 1-acetoxycyclohexylketone.
The Committee subsequently evaluated 15 other members of this group offlavouring agents at the sixty-eighth meeting (Annex 1, reference 187). TheCommittee concluded that all 15 flavouring agents in that group were of no safetyconcern based on estimated dietary exposures.
Five of the seven additional flavouring agents (Nos 2027–2031) in this grouphave been reported to occur naturally and have been found in camomile, figs, lemonjuice, black and green teas, calamus, soya bean, pepper and strawberry guava(Nijssen, van Ingen-Visscher & Donders, 2009).
1.2 Assessment of dietary exposure
The total annual volumes of production of the seven aliphatic acyclic andalicyclic terpenoid tertiary alcohols and structurally related substances areapproximately 18 kg in Europe and 5 kg in Japan (Japanese Flavor and FragranceMaterials Association, 2002, 2005; European Flavour and Fragrance Association,2004; International Organization of the Flavor Industry, 2009). More than 94% ofthe total annual volume of production in Europe is accounted for by (+)-cedrol (No.2030).
The estimated dietary exposures for each of the flavouring agents,calculated either as the maximized survey-derived intake (MSDI) or using the singleportion exposure technique (SPET), are reported in Table 1. The highest estimatesare for ( )-sclareol (No. 2029) and (+)-cedrol (No. 2030) (1500 μg for both, the SPETvalue obtained for non-alcoholic beverages). For the other flavouring agents in thisgroup, the daily dietary exposures range from 0.01 to 900 μg, with the SPET yieldingthe highest estimates for all. Reported annual volumes of production of this groupof flavouring agents and the calculated daily dietary exposures (MSDI and SPET)are summarized in Table 2.
1.3 Absorption, distribution, metabolism and elimination
In the report of the fifty-first meeting, biodisposition of substances in thisgroup was extensively discussed. The esters in this group (Nos 2025 and 2026) canbe readily hydrolysed to their component tertiary alcohols and carboxylic acids(Heymann, 1980; Anders, 1989). The hydrolysis products would be readilydetoxified primarily by conjugation with glucuronic acid and then excreted primarilyin the urine (Williams, 1959; Parke, Rahman & Walker, 1974; Horning et al., 1976;Ventura et al., 1985). The alicyclic tertiary alcohols and alcohols with unsaturation(Nos 2027–2031) undergo -oxidation at the allylic position to yield polarmetabolites, which can be conjugated and excreted. Metabolites of acyclic alcoholscan be further oxidized to eventually yield carbon dioxide.
92 ALIPHATIC ACYCLIC AND ALICYCLIC TERPENOID TERTIARY ALCOHOLS (addendum)

Tabl
e 1.
Sum
mar
y of
the
resu
lts o
f the
saf
ety
eval
uatio
ns o
f alip
hatic
acy
clic
and
alic
yclic
terp
enoi
d te
rtia
ry a
lcoh
ols
and
stru
ctur
ally
rel
ated
sub
stan
ces
used
as
flavo
urin
g ag
ents
a,b,
c
Fla
vour
ing
agen
tN
o.C
AS
No.
and
str
uctu
reS
tep
A3d
Doe
s in
take
exc
eed
the
thre
shol
d fo
r hu
man
inta
ke?
Com
men
ts o
n pr
edic
ted
met
abol
ism
Con
clus
ion
base
d on
curr
ent e
stim
ated
die
tary
expo
sure
Str
uctu
ral c
lass
I
Dim
ethy
lben
zyl c
arbi
nyl
crot
onat
e20
2593
762-
34-6
O
O
No,
SP
ET
: 400
Not
e 1
No
safe
ty c
once
rn
Dim
ethy
lben
zyl c
arbi
nyl
hexa
noat
e20
2689
1781
-90-
1
O
O
No,
SP
ET
: 900
Not
e 1
No
safe
ty c
once
rn
Car
yoph
ylle
ne a
lcoh
ol20
2747
2-97
-9
OH
No,
SP
ET
: 50
Not
e 2
No
safe
ty c
once
rn
ALIPHATIC ACYCLIC AND ALICYCLIC TERPENOID TERTIARY ALCOHOLS (addendum) 93

Tabl
e 1
(con
td)
Fla
vour
ing
agen
tN
o.C
AS
No.
and
str
uctu
reS
tep
A3d
Doe
s in
take
exc
eed
the
thre
shol
d fo
r hu
man
inta
ke?
Com
men
ts o
n pr
edic
ted
met
abol
ism
Con
clus
ion
base
d on
curr
ent e
stim
ated
die
tary
expo
sure
Cub
ebol
2028
2344
5-02
-5
HH
OH
No,
SP
ET
: 3N
ote
2N
o sa
fety
con
cern
()-
Scl
areo
l20
2951
5-03
-7 H
OH
OH
No,
SP
ET
: 150
0N
otes
2 a
nd 3
No
safe
ty c
once
rn
(+)-
Ced
rol
2030
77-5
3-2
CH
3
CH
3C
H3
OHC
H3
H
H
No,
SP
ET
: 150
0N
ote
2N
o sa
fety
con
cern
94 ALIPHATIC ACYCLIC AND ALICYCLIC TERPENOID TERTIARY ALCOHOLS (addendum)

Tabl
e 1
(con
td)
Fla
vour
ing
agen
tN
o.C
AS
No.
and
str
uctu
reS
tep
A3d
Doe
s in
take
exc
eed
the
thre
shol
d fo
r hu
man
inta
ke?
Com
men
ts o
n pr
edic
ted
met
abol
ism
Con
clus
ion
base
d on
cu
rren
t est
imat
ed d
ieta
ryex
posu
re
-Bis
abol
ol20
3123
089-
26-1
CH
3
CH
3
CH
3C
H3
OH
No,
SP
ET
: 150
Not
e 3
No
safe
ty c
once
rn
CA
S, C
hem
ical
Abs
trac
ts S
ervi
cea
Thi
rty-
eigh
t fla
vour
ing
agen
ts in
this
gro
up w
ere
prev
ious
ly e
valu
ated
by
the
Com
mitt
ee (
Ann
ex 1
, ref
eren
ces
137
and
187)
.b
Ste
p 1:
All
seve
n fla
vour
ing
agen
ts in
this
gro
up (
Nos
202
5–20
31)
are
in s
truc
tura
l cla
ss I.
cS
tep
2: A
ll of
the
flavo
urin
g ag
ents
in th
is g
roup
are
exp
ecte
d to
be
met
abol
ized
to in
nocu
ous
prod
ucts
.d
The
thre
shol
ds fo
r hu
man
inta
ke fo
r st
ruct
ural
cla
sses
I, II
and
III a
re 1
800,
540
and
90
g/da
y, r
espe
ctiv
ely.
All
inta
ke v
alue
s ar
e ex
pres
sed
in
g/da
y. E
ither
the
high
est S
PE
T e
stim
ate
or th
e M
SD
I est
imat
es, i
f at l
east
one
is h
ighe
r th
an th
e hi
ghes
t SP
ET
est
imat
e, a
re g
iven
in th
e ta
ble.
Not
es:
1.E
ster
s ar
e ra
pidl
y hy
drol
ysed
, and
the
corr
espo
ndin
g te
rtia
ry a
lcoh
ols
are
met
abol
ized
prim
arily
by
conj
ugat
ion
with
glu
curo
nic
acid
and
exc
retio
nin
the
urin
e.2.
Alic
yclic
tert
iary
alc
ohol
s ar
e m
etab
oliz
ed p
rimar
ily b
y co
njug
atio
n w
ith g
lucu
roni
c ac
id a
nd e
xcre
tion
in th
e ur
ine.
3.T
ertia
ry u
nsat
urat
ed a
lcoh
ols
are
met
abol
ized
prim
arily
by
conj
ugat
ion
with
glu
curo
nic
acid
and
exc
retio
n in
the
urin
e. O
xida
tion
of th
e al
lylic
met
hyl
grou
p m
ay o
ccur
afte
r re
peat
ed e
xpos
ure.
ALIPHATIC ACYCLIC AND ALICYCLIC TERPENOID TERTIARY ALCOHOLS (addendum) 95

Table 2. Annual volumes of production and dietary exposures for aliphaticacyclic and alicyclic terpenoid tertiary alcohols ad structurally relatedsubstances used as flavouring agents in Europe, the USA and Japan
Flavouring agent(No.)
Most recentannualvolume
(kg)a
Dietary exposure Annual volumeof natural
occurrence infoods (kg)
MSDIb SPETc
g/day g/kg bwper day
g/day g/kg bwper day
Dimethylbenzylcarbinyl crotonate(2025)
300 5
Europe ND ND ND
USA ND ND ND
Japan 1 0.3 0.005
Dimethylbenzylcarbinyl hexanoate(2026)
900 15
Europe ND ND ND
USA ND ND ND
Japan 0.2 0.04 0.001
Caryophyllenealcohol (2027)
80 1 +
Europe ND ND ND
USA ND ND ND
Japan 2 0.5 0.008
Cubebol (2028) 3.3 0.06 +
Europe ND ND ND
USA ND ND ND
Japan 1 0.3 0.004
( )-Sclareol (2029) 1500 25 +
Europe 0.7 0.07 0.001
USA ND ND ND
Japan ND ND ND
(+)-Cedrol (2030) 1500 25 +
Europe 17 2 0.03
USA ND ND ND
Japan 0.9 0.2 0.004
96 ALIPHATIC ACYCLIC AND ALICYCLIC TERPENOID TERTIARY ALCOHOLS (addendum)

Table 2 (contd)
Flavouring agent(No.)
Most recentannualvolume
(kg)a
Dietary exposure Annual volumeof natural
occurrence infoods (kg)
MSDIb SPETc
g/day g/kg bwper day
g/day g/kg bwper day
-Bisabolol (2031) 150 3 +
Europe 0.1 0.01 0.0002
USA ND ND ND
Japan 0.1 0.03 0.0005
Total
Europe 18
USA 0
Japan 5
ND, no data reported; +, reported to occur naturally in foods (Nijssen, van Ingen-Visscher &Donders, 2009), but no quantitative data; , not reported to occur naturally in foods
a From European Flavour and Fragrance Association (2004), International Organization ofthe Flavor Industry (2009) and Japan Flavor and Fragrance Materials Association (2002,2005). Values greater than zero but less than 0.1 kg were reported as 0.1 kg.
b MSDI (μg/person per day) calculated as follows:(annual volume, kg) × (1 × 10⁹ μg/kg)/(population × survey correction factor × 365 days),where population (10%, “eaters only”) = 32 × 106 for Europe, 28 × 106 for the USA and 13× 106 for Japan; and where survey correction factor = 0.8 for the surveys in Europe, the USAand Japan, representing the assumption that only 80% of the annual flavour volume wasreported in the poundage surveys (European Flavour and Fragrance Association, 2004;Japan Flavor and Fragrance Materials Association, 2002, 2005; International Organizationof the Flavor Industry, 2009). MSDI (μg/kg bw per day) calculated as follows: (μg/person perday)/body weight, where body weight = 60 kg. Slight variations may occur from rounding.
c SPET (μg/person per day) calculated as follows:(standard food portion, g/day) × (average use level) (International Organization of the FlavorIndustry, 2009). The dietary exposure from the single food category leading to the highestdietary exposure from one portion is taken as the SPET estimate.SPET (μg/kg bw per day) calculated as follows:(μg/person per day)/body weight, where body weight = 60 kg. Slight variations may occurfrom rounding.
1.4 Application of the Procedure for the Safety Evaluation of FlavouringAgents
Step 1. In applying the Procedure for the Safety Evaluation of FlavouringAgents to the above-mentioned flavouring agents, the Committee assigned allseven of the flavouring agents (Nos 2025–2031) to structural class I (Cramer, Ford& Hall, 1978).
ALIPHATIC ACYCLIC AND ALICYCLIC TERPENOID TERTIARY ALCOHOLS (addendum) 97

Step 2. All seven of the flavouring agents in this group are expected to bemetabolized to innocuous products. The evaluation of all agents in this grouptherefore proceeded via the A-side of the Procedure.
Step A3. The estimated daily intakes of all seven flavouring agents instructural class I are below the threshold of concern (i.e. 1800 μg/person per dayfor class I).
The Committee concluded that exposures to these seven flavouring agentswould not pose a safety concern at current estimated dietary exposures.
Table 1 summarizes the evaluations of the seven aliphatic acyclic andalicyclic terpenoid tertiary alcohols and structurally related substances (Nos 2025–2031) in this group.
1.5 Consideration of combined intakes from use as flavouring agents
The safety assessment of possible combined intakes of flavouring agentswas based on the presence of common metabolites or a homologous series (asproposed at the sixty-eighth meeting; Annex 1, reference 187) and using the MSDIexposure assessment (as proposed at the sixty-ninth meeting; Annex 1, reference190).
Flavouring agents in this series with the common metabolite , -dimethylphenethyl alcohol (No. 1653), which is in structural class I, are Nos 2025and 2026. The highest intakes of flavouring agents that are part of a homologousseries with No. 1653 or have this as a common metabolite are Nos 1649, 1650,1653, 1655 and 1656 in Europe, Nos 1649, 1650, 1653, 1655 and 1656 in Japanand Nos 1650 and 1653–1656 in the USA. In the unlikely event that these flavouringagents were to be consumed concurrently on a daily basis, the estimated combinedintakes would be 120 μg/person per day in Europe, 124 μg/person per day in Japanand 1155 μg/person per day in the USA, which would not exceed the threshold ofconcern (i.e. 1800 μg/person per day for class I).
Flavouring agents in this group that are bicyclic tertiary alcohols or relatedesters are Nos 2027–2030. The highest intakes in this series are, in Europe, Nos2029 and 2030 in structural class I and Nos 1647 and 1648 in structural class II; inJapan, Nos 2027, 2028 and 2030 in structural class I and Nos 1647 and 1648 instructural class II; and in the USA, No. 1648 in structural class II. In the unlikelyevent that these flavouring agents were to be consumed concurrently on a dailybasis, the estimated combined intakes would be 2.1 μg/person per day in Europe,1.5 μg/person per day in Japan and 0.05 μg/person per day in the USA, which wouldnot exceed either threshold of concern (i.e. 1800 μg/person per day for class I and540 μg/person per day for class II).
The Committee concluded that under the conditions of use as flavouringagents, the combined intakes at current estimated dietary exposures would not posea safety concern.
98 ALIPHATIC ACYCLIC AND ALICYCLIC TERPENOID TERTIARY ALCOHOLS (addendum)

1.6 Consideration of secondary components
Two flavouring agents in this group (Nos 2027 and 2031) have minimumassay values of less than 95%. The secondary component of caryophyllene alcohol(No. 2027), dihydrocloven-9-ol, is expected to undergo rapid absorption,distribution, metabolism and excretion, sharing the same metabolic fate ascaryophyllene alcohol, and is considered not to present a safety concern at currentestimated dietary exposures. The secondary component of -bisabolol (No. 2031),
-bisabolol, is expected to undergo rapid absorption, distribution, metabolism andexcretion, sharing the same metabolic fate as caryophyllene alcohol, and isconsidered not to present a safety concern at current estimated dietary exposures.Information on the safety of the secondary components of these flavouring agentsis summarized in Annex 5.
1.7 Conclusion
In the two previous evaluations of this group of flavouring agents, studies ofbiological properties, acute toxicity, short-term toxicity, long-term toxicity andcarcinogenicity, genotoxicity and reproductive toxicity were available. None raisedsafety concerns. Additional biochemical and toxicological data that were availablefor this evaluation supported those from the previous evaluations (Annex 1,references 137 and 187).
The Committee concluded that these seven flavouring agents, which areadditions to the group of aliphatic acyclic and alicyclic terpenoid tertiary alcoholsand structurally related substances evaluated previously, would not give rise tosafety concerns at current estimated dietary exposures.
2. RELEVANT BACKGROUND INFORMATION
2.1 Explanation
This monograph summarizes the additional key data relevant to the safetyevaluation of a group of seven aliphatic acyclic and alicyclic terpenoid tertiaryalcohols and structurally related substances (see Table 1), which included onealiphatic terpene tertiary alcohol, four alicyclic tertiary alcohols and two esters ofphenyl-substituted aliphatic tertiary alcohols. These flavouring agents are additionsto the group of 38 aliphatic acyclic and alicyclic terpenoid tertiary alcohols andstructurally related substances evaluated previously by the Committee at its fifty-first and sixty-eighth meetings (Annex 1, references 137 and 187).
2.2 Additional considerations on intake
There is no additional information on intake. Dietary exposure estimateswere made using the SPET in addition to the MSDI approach.
ALIPHATIC ACYCLIC AND ALICYCLIC TERPENOID TERTIARY ALCOHOLS (addendum) 99

2.3 Biological data
2.3.1 Biochemical data: absorption, distribution, metabolism and elimination
As described in the reports of the fifty-first and sixty-eighth meetings,aliphatic acyclic and alicyclic terpenoids and related esters undergo efficientmetabolism. Based on the results of studies in aqueous buffered conditions,simulated gastric juice, simulated human intestinal fluid, blood plasma, wholehepatocytes and liver microsome preparations, terpene esters formed from tertiaryalcohols (e.g. linalool) and simple aliphatic carboxylic acids are expected to undergohydrolysis. Although differences in the rates of hydrolysis occur under in vitroconditions in gastric juice and intestinal fluids, ready hydrolysis is observed in tissuepreparations rich in carboxylesterase, including blood and liver. Esters that surviveintestinal fluids and blood intact are subject to rapid hydrolysis in the liver. It isexpected that the tertiary aromatic alcohols will undergo direct conjugation of thehydroxyl group with glucuronic acid (Williams, 1959).
Additional studies on the absorption, distribution, metabolism and excretionof these flavouring agents have been reported since the preparation of the originalmonograph (Annex 1, reference 137).
Plasma pharmacokinetics were investigated following intravenous admin-istration of ( )-sclareol (No. 2029) at 100 mg/kg body weight (bw) to two male Wistarrats. Plasma samples were collected at 5, 15, 30, 60, 180, 360, 720 and 1440 minafter administration, and ( )-sclareol concentrations were quantified by gas–liquidchromatography using an internal standard. At 5 min post-injection, the plasma levelof ( )-sclareol was 84.9 μg/ml. The ( )-sclareol plasma concentration dropped to42.9 μg/ml after 180 min and was not detectable at 720 min. This study indicated arapid biphasic disappearance of ( )-sclareol from plasma following intravenousdosing. The authors suggested that ( )-sclareol may be distributed in fatty tissueowing to its high lipophilicity (Kouzi, McChesney & Walker, 1993).
In a second study by the above authors, ( )-sclareol (No. 2029) wasadministered to two male Wistar rats by intravenous injection at 100 mg/kg bw andtwo male Wistar rats by intragastric instillation at 1000 mg/kg bw in 3:1 propyleneglycol–ethanol. Urine and faecal samples were collected from all rats at periodicintervals over 144 h or 72 h, respectively. Bile samples were collected only from ratsgiven intravenous injections at periodic intervals over 30 h. No ( )-sclareol wasdetected in urine, either untreated or treated with -glucuronidase to liberateconjugates, at any time. No ( )-sclareol was detected in faecal samples from ratstreated via intravenous injection, but 9% of the initial dose was found in faecalsamples of rats orally administered ( )-sclareol. The bile samples from ratsreceiving ( )-sclareol by intravenous injection showed very low levels (0.02%) ofunchanged ( )-sclareol over a 3 h period. Very low levels (0.04%) of oxidizedmetabolites were found in bile after 3 h, including 3- -hydroxysclareol (0.24%), 3-
-hydroxysclareol (0.075%), 18-hydroxysclareol (0.056%) and 3-ketosclareol(0.03%). ( )-Sclareol or its oxidized metabolites were not observed in bile samplescollected at any other time during the 30 h study. The authors hypothesized that thelow sensitivity of the assay technique may have prevented detection of low levels
100 ALIPHATIC ACYCLIC AND ALICYCLIC TERPENOID TERTIARY ALCOHOLS (addendum)

of ( )-sclareol and its metabolites over the course of the study. Although only a verysmall percentage of intravenously injected ( )-sclareol (<0.05%) could beaccounted for in these experiments, the authors suggested that other mammalianmetabolites were formed that were not detected in the assays used (Kouzi,McChesney & Walker, 1993).
In order to determine the phase I metabolism of (+)-cedrol (No. 2030), Bang& Ourisson (1975) and Trifilieff, Bang & Ourisson (1975) administered (+)-cedrol torabbits and dogs, respectively. In rabbits, hydroxylation occurred exclusively at C3,yielding the two epimers -epiisobiotol and -isobiotol subsequent to dehydrationat C7/C8. The metabolic fate in dogs, however, was far less regioselective, withoxidation occurring at multiple ring locations as well as methyl groups. Initialglucuronidation at the hydroxyl function of cedrol is made difficult by sterichindrance. Therefore, elimination involves additional functionalization prior toconjugation. In the case of (+)-cedrol, the hydroxylation of a non-activated saturatedcarbon atom is the most likely pathway (Bang & Ourisson, 1975; Trifilieff, Bang &Ourisson, 1975; Ishida, 2005).
Terpenoids have been known to affect the activity of various drug-metabolizing hepatic enzymes (Parke & Rahman, 1969). The inhibitory effect ofchamomile essential oil and its major constituents (e.g. -bisabolol, No. 2031) onfour selected human cytochrome P450 (CYP) enzymes (CYP1A2, CYP2C9,CYP2D6 and CYP3A4) was studied. Increasing concentrations of the testcompounds were incubated with individual, recombinant CYP isoforms, and theireffect on the conversion of surrogate substances was measured fluorometrically;enzyme inhibition was expressed as median inhibitory concentration (IC50) andinhibition constant (Ki value) in relation to positive controls. -Bisabolol (IC50 = 2.18mol/l) produced a significant inhibition of CYP2C9 and CYP2D6. As indicated bythese in vitro data, chamomile preparations contain constituents that can inhibit theactivities of major human drug-metabolizing enzymes; interactions with drugswhose route of elimination is mainly through CYP oxidation (especially CYP1A2)are therefore possible (Ganzera, Schneider & Stuppner, 2006).
Studies in humans, dogs, rabbits and rats have shown that aliphatic acyclicand alicyclic terpenoid tertiary alcohols are absorbed to a small or large extentdepending upon lipophilicity and are distributed primarily to adipose tissue.Oxidation to polar metabolites and/or conjugation with glucuronic acid followed byexcretion in the urine are expected for all seven of the flavouring agents in this group.Small amounts may be expired in exhaled air. The two esters within this group (Nos2025 and 2026) are expected to be hydrolysed in humans to their component tertiaryalcohols and butenoic acid and hexanoic acid, respectively.
The available data demonstrate that the seven aliphatic acyclic and alicyclicterpenoid tertiary alcohols and structurally related substances are rapidly absorbed,distributed, metabolized and excreted.
ALIPHATIC ACYCLIC AND ALICYCLIC TERPENOID TERTIARY ALCOHOLS (addendum) 101

2.3.2 Toxicological studies
(a) Acute toxicity
No studies of acute toxicity have been reported for these flavouring agentssince the preparation of the original monograph (Annex 1, reference 137).
(b) Short-term studies of toxicity
Short-term studies of toxicity have been reported for only three of the sevenflavouring agents in this group. The results of these studies with ( )-sclareol (No.2029), (+)-cedrol (No. 2030) and -bisabolol (No. 2031) are summarized in Table 3and described below. Additional short-term (up to 90 days) studies of toxicity forthree structurally related substances not in this group have been reported. Theresults of these studies are also described below.
Table 3. Results of short-term studies of toxicity with aliphatic acyclic andalicyclic terpenoid tertiary alcohols used as flavouring agents
No. Flavouringagent
Species;sex
No. oftest
groupsa/no. pergroupb
Route Duration(days)
NOELc/NOAELd
(mg/kgbw per
day)
Reference
2029 ( )-Sclareol Rat; M, F 1/20 Oral(gavage)
28 8.8c,e Merkel(2006)
2030 (+)-Cedrol Rat; M, F 1/20 Oral(gavage)
28 8.4c,e Merkel(2006)
2031 -Bisabolol Rat; M, F 2/40 Diet 28 1860d,f Habersanget al. (1979)
2031 -Bisabolol Dog; M, F 2/6 Diet 28 1860d,f Habersanget al. (1979)
F, female; M, malea Total number of test groups does not include control animals.b Total number per test group includes both male and female animals.c No-observed-effect level.d No-observed-adverse-effect level.e Study performed with a single dose that had no observed effect; the value is therefore the
highest dose tested.f Adverse effects seen in the lowest dose group; therefore, this is not a true NOAEL.
(i) ( )-Sclareol (No. 2029)
In a 28-day oral toxicity study, Sprague-Dawley rats (10 of each sex perdose) approximately 1 month of age were administered ( )-sclareol (98.3% pure)at a dose of 0 or 10 mg/kg bw per day by intragastric instillation in carboxy-methylcellulose. It was determined that the actual ( )-sclareol dose achieved was
102 ALIPHATIC ACYCLIC AND ALICYCLIC TERPENOID TERTIARY ALCOHOLS (addendum)

8.8 mg/kg bw per day. The rats were observed twice daily for mortality, once dailyfor signs of toxicity and behavioural changes and weekly for more detailed clinicalobservations. Body weights were recorded twice during the acclimation period, atthe initiation of the testing period, weekly during the exposure period andimmediately prior to termination. Individual food consumption was recorded weekly,and water consumption was recorded daily. All rats were fasted overnight prior toeach blood collection, which was done during the fourth week of the study andimmediately prior to termination. Blood samples were used for haematology, clinicalchemistry and serology assessments. All rats were terminated on day 31 of thestudy. Necropsies were performed on all animals, and selected organs and tissueswere evaluated histologically. Group means and standard deviations werecalculated for body weight, weekly body weight gain, weekly food consumption,weekly food conversion efficiency, water consumption, organ weights and ratios oforgan weights to body weight or brain weight.
There were no test substance–related mortalities in the study. There wereno clinical observations, effects on body weight, food consumption, food conversionefficiency, water consumption or clinical chemistry, macroscopic findings orhistopathological alterations that were considered attributable to administration of( )-sclareol. In males that were dosed with ( )-sclareol, increases in mean absoluteand mean relative liver weights (organ weight to body weight and organ weight tobrain weight ratios) were recorded. The increases were not associated with anyevidence of macroscopic or microscopic alterations or increases in serum liverenzymes. Evaluation of individual animal data revealed that the combination of lowrelative liver weight for one male control animal and high relative liver weight for onemale test animal accounted for the majority of the difference in mean liver weightsbetween test and control groups. An increase in kidney weight to brain weight ratiowas also observed for male rats administered ( )-sclareol. However, consideringthe absence of any additional pathological or histopathological findings, thesechanges were judged by the authors to have limited toxicological significance. Infemale rats, increases in absolute heart and spleen weights and heart to brain,spleen to brain, liver to brain and heart to body weight ratios were statisticallysignificant compared with those of controls. Also, in female rats, there was adecrease in the brain to body weight ratio. In general, these changes were not foundto be consistent between the sexes, and there were no associated clinicalpathological or histopathological changes reported in females. The authorsconcluded that these findings were non-adverse and considered them to be oflimited toxicological importance.
In conclusion, in rats dosed with ( )-sclareol, statistically significant changeswere found not to correlate with evidence of macroscopic or microscopic alterationsor associated enzyme activity. The authors concluded that the minor clinicalpathology and histopathological alterations were incidental and thereforetoxicologically non-adverse. Other statistically significant organ weight changeswere isolated and not consistent between the sexes and were therefore considerednot to be related to administration of the test substance. Therefore, under theconditions of the study and based on the toxicological end-points evaluated, the no-observed-adverse-effect level (NOAEL) for ( )-sclareol was 8.8 mg/kg bw per dayfor both male and female rats (Merkel, 2006).
ALIPHATIC ACYCLIC AND ALICYCLIC TERPENOID TERTIARY ALCOHOLS (addendum) 103

(ii) (+)-Cedrol (No. 2030)
In a 28-day oral toxicity study, Sprague-Dawley rats (10 of each sex perdose) approximately 1 month of age were administered (+)-cedrol (99.7% pure) ata dose of 0 or 10 mg/kg bw per day by intragastric instillation in carboxy-methylcellulose. It was determined that the actual (+)-cedrol dose achieved was 8.4mg/kg bw per day. The rats were observed twice daily for mortality, once daily forsigns of gross toxicity and behavioural changes and weekly for more detailed clinicalobservations. Body weights were recorded twice during the acclimation period, atthe initiation of the testing period, weekly during the exposure period andimmediately prior to sacrifice. Individual food consumption was recorded weekly,and water consumption was recorded daily. All animals were fasted overnight priorto each blood collection, which occurred during the fourth week of the study andimmediately prior to sacrifice. Blood samples were used for haematology, clinicalbiochemistry and serology assessments. All animals were terminated on day 31 ofthe study. Necropsies were performed on all animals, and selected organs andtissues were evaluated histologically. Group means and standard deviations werecalculated for body weight, weekly body weight gain, weekly food consumption,weekly food conversion efficiency, water consumption, organ weights and organweight to body weight or brain weight ratios.
There were no test substance–related mortalities in the study. There wereno clinical observations, effects on body weight, food consumption, food conversionefficiency, water consumption or clinical chemistry, macroscopic findings orhistopathological alterations that were considered attributable to administration of(+)-cedrol. There were no statistically significant changes in absolute or relativeorgan weights in male rats treated with (+)-cedrol compared with controls. In femalerats, decreases in absolute brain weight and brain weight to body weight and ovaryweight to body weight ratios in female rats dosed with (+)-cedrol were all statisticallysignificant compared with controls. Considering the absence of any additionalpathological or histopathological findings, these changes were judged by theauthors to be non-adverse and to have limited toxicological significance.
In conclusion, in rats dosed with (+)-cedrol, there were no statisticallysignificant changes in either absolute or relative organ weights. Minor clinicalpathology and histopathological alterations were considered incidental andtherefore toxicologically non-adverse, according to the authors. Other statisticallysignificant organ weight changes were isolated and not consistent between thesexes and therefore considered not to be related to administration of the testsubstance. Therefore, under the conditions of the study and based on thetoxicological end-points evaluated, the NOAEL for (+)-cedrol was 8.4 mg/kg bw perday for both male and female rats (Merkel, 2006).
(iii) -Bisabolol (No. 2031)
Rats
Groups of 40 rats (strain not specified) (20 of each sex per group) weighing128–146 g were administered -bisabolol (98% pure) by intragastric instillation at
104 ALIPHATIC ACYCLIC AND ALICYCLIC TERPENOID TERTIARY ALCOHOLS (addendum)

a dose of 0, 2.0 or 3.0 ml/kg bw per day for 4 weeks. These dose levels correspondto calculated daily intakes of 0, 1860 or 2790 mg/kg bw per day (assuming a specificgravity of 0.931). In the low dose group, slight hyperactivity and decreased bodyweight gain were noted. In the high dose group, the mortality rate was 20%, andincreased hyperactivity and decreased body weight gain were noted. Postmortemfindings in rats of both groups included inflammatory changes in the liver, trachea,spleen, thymus and stomach (Habersang et al., 1979).
Dogs
Groups of Beagle dogs (three of each sex per group) were administered -bisabolol (98% pure) by intragastric instillation at a dose of 0, 2.0 or 3.0 ml/kg bwper day for 4 weeks. These dose levels correspond to calculated intakes of 0, 1860or 2790 mg/kg bw per day (assuming a specific gravity of 0.931). After 2 weeks, thehigh dose was increased to 3720 mg/kg bw per day. A loss of appetite, reducedfeed intake and vomiting were observed in two of the six dogs receiving 1860 mg/kg bw per day. At necropsy, an increase in the liver weight to body weight ratio wasnoted. Reactions and observations were more severe in the high dose group. Noother changes were noted compared with controls (Habersang et al., 1979).
(iv) Dihydromyrcenol, a mixture of 2,6-dimethyloct-7-en-2-ol1 and2,6-dimethyloct-7-en-2-ol formate (50:50), a structurally relatedaliphatic material
A 90-day oral toxicity study was conducted in Sprague-Dawley ratsapproximately 6–8 weeks of age to determine the potential toxicity of 2,6-dimethyloct-7-en-2-ol. Eighty rats were allocated to four groups (10 of each sex pergroup), and the test substance was administered by intragastric instillation in cornoil at dose levels of 10, 50, 500 and 1000 mg/kg bw per day. A vehicle control groupof 10 males and 10 females was administered corn oil alone. All animals wereexamined for overt signs of toxicity, ill-health or behavioural change immediatelybefore and after dosing and 1 and 5 h after dosing during the work week. Prior tothe start of dosing and at weekly intervals thereafter, all rats were observed for signsof functional/behavioural toxicity. Each animal was individually assessed forsensory reactivity to auditory, visual and proprioceptive stimuli. Individual bodyweights were recorded on day 1, at weekly intervals thereafter and at termination.Food consumption was recorded for each cage group at weekly intervals throughoutthe study, and water consumption was measured and recorded for each cage groupfrom day 15 onwards. The eyes of all control and high-dose animals were examinedprior to the start of the study and at week 12. Haematology, blood chemistry,urinalysis and estrous cycle investigations were performed on all animals from eachtest and control group during week 7 and at the end of the study on day 90. Bloodsamples were obtained from the lateral tail vein. On completion of the dosing period,all animals were subjected to a full external and internal examination, anymacroscopic abnormalities were recorded and selected organs and tissues wereevaluated histologically.
1OH
ALIPHATIC ACYCLIC AND ALICYCLIC TERPENOID TERTIARY ALCOHOLS (addendum) 105

There were no test substance–related mortalities. No clinically observablesigns of toxicity were detected in test or control animals throughout the study period.Incidental findings of noisy respiration, increased salivation, hunched posture andtiptoe gait were evident in 1000 mg/kg bw per day animals throughout the dosingperiod. Incidents of increased salivation were also evident in 10, 50 and 500 mg/kgbw per day animals, together with isolated incidents of noisy respiration and red/brown staining on a cage train liner for males dosed with 10 mg/kg bw per day.Observations of this nature are often reported following oral administration ofunpalatable or slightly irritating test material formulation and are not considered tobe an indication of systemic toxicity. Isolated instances of generalized fur loss, scabformation or generalized red/brown stained fur were evident in a number of controland test animals throughout the dosing period. Such observations are commonlyobserved in laboratory-maintained rats and, in view of the sporadic nature of thesefindings, were considered to be unrelated to dosing. There were no toxicologicallyrelevant changes in any of the behavioural parameters, functional performancetests or sensory reactivity assessments measured.
A statistically significant reduction in body weight gain was evident in malesdosed with 1000 mg/kg bw per day during weeks 6, 7 and 11. Females from thehigh-dose treatment group showed a reduction in body weight gain during weeks5, 8, 9 and 10. The effect on body weight gain extended to the 500 mg/kg bw perday group during week 6 for males and during week 9 for females. No such effectswere detected in animals of either sex dosed with 50 or 10 mg/kg bw per day. Malesdosed with 1000 mg/kg bw per day showed a reduced food conversion efficiencyduring weeks 6, 7, 9, 10, 11 and 12, whereas females from this dose group showeda reduction in food conversion efficiency during weeks 6, 7, 9 and 10. The effect onfood conversion efficiency extended to the 500 mg/kg bw per day dose group duringweek 6 for males and during week 9 for females. No such effects were detected infood consumption or in food conversion efficiency for animals of either sex dosedwith 10 or 50 mg/kg bw per day. Measurements of water consumption revealed anincrease for animals of either sex dosed with 500 and 1000 mg/kg bw per day fromday 15 onwards. No such effects were detected in animals of either sex dosed with10 or 50 mg/kg bw per day. There were no test substance–related ocular effects.
Haematological investigation showed a statistically significant reduction inplatelet count at week 7 in males dosed with 500 and 1000 mg/kg bw per day.Animals of either sex dosed with 1000 mg/kg bw per day and females dosed with500 mg/kg bw per day showed a statistically significant reduction in activated partialthromboplastin time. Week 13 assessments revealed reductions in haemoglobin,haematocrit and erythrocyte counts for females dosed with 1000 mg/kg bw per day,with the erythrocyte count extending into the 500 mg/kg bw per day dose groupfemales. No such effects were detected in females dosed with 50 mg/kg bw per dayor animals of either sex dosed with 10 mg/kg bw per day. Blood chemistryexaminations revealed a statistically significant increase in cholesterol levels foranimals of either sex dosed with 500 or 1000 mg/kg bw per day. Males dosed with1000 mg/kg bw per day also showed statistically significant increases in aspartateaminotransferase and alanine aminotransferase activities, whereas females fromthis dose group showed statistically significant increases in phosphorus and
106 ALIPHATIC ACYCLIC AND ALICYCLIC TERPENOID TERTIARY ALCOHOLS (addendum)

chloride levels together with a statistically significant reduction in the albumin toglobulin ratio. There were no test substance–related effects on female estrouscycles or on the type or proportion of females with anomalous estrous cycles.
Rats of either sex dosed with 500 and 1000 mg/kg bw per day showed astatistically significant increase in (absolute and relative) liver and kidney weights.There were no test substance–related effects on the concentration, motility ormorphology of samples of epididymal sperm. At necropsy, no macroscopicabnormalities were detected. Histopathologically, centrilobular hepatocyte enlarge-ment was observed in males and females dosed with 1000 mg/kg bw per day.However, this is commonly observed in rodent liver following the administration ofxenobiotics and, in the absence of associated inflammatory or degenerativechanges, is generally considered to be adaptive in nature. A high incidence orseverity of groups of basophilic tubules or globular accumulations of eosinophilicmaterial was observed in the kidneys of all male test groups. These findings areconsistent with the presence of hydrocarbon nephropathy, which results from theexcessive accumulation of -2u-microglobulin. The incidence of adipose infiltrationof the bone marrow was increased in males dosed with 1000 mg/kg bw per day,indicative of marrow hypoplasia. However, there was no evidence of a dose–response relationship.
In conclusion, the oral administration of 2,6-dimethyloct-7-en-2-ol to rats fora period of 90 consecutive days resulted in test substance–related effects in malesat all dose levels and in females dosed with 500 and 1000 mg/kg bw per day.Therefore, under the conditions of the study and based on the toxicological end-points evaluated, the NOAEL for females was considered by the authors to be 50mg/kg bw per day based on haematological effects at higher doses. For males, thekidney changes identified histopathologically were consistent with well-documentedchanges that are unique to the male rat, as -2u-microglobulin is found only in theproximal tubular epithelium of adult male rats. Therefore, this effect is not indicativeof a hazard to human health, and the NOAEL was considered by the authors to be10 mg/kg bw per day for males based on haematological effects at higher doses(Dunster, Watson & Brooks, 2007).
(v) 4-Cyclohexyl-2-methyl-2-butanol,1 a tertiary alcohol
In a 28-day oral toxicity study, Sprague-Dawley rats (five of each sex perdose) approximately 42 days of age were administered 4-cyclohexyl-2-methyl-2-butanol at 500, 750 or 1500 mg/kg bw per day by intragastric instillation incarboxymethylcellulose, and controls received the vehicle. Animals were observeddaily for mortality and clinical signs, and body weights and food consumption wererecorded weekly throughout the experiment. Ophthalmoscopy was performed onboth eyes of all animals before the start of dosing and on control and high dosegroups during week 4. Blood samples were obtained from all animals during week4, and urine samples were collected from all animals at the end of week 3. At
1 OH
ALIPHATIC ACYCLIC AND ALICYCLIC TERPENOID TERTIARY ALCOHOLS (addendum) 107
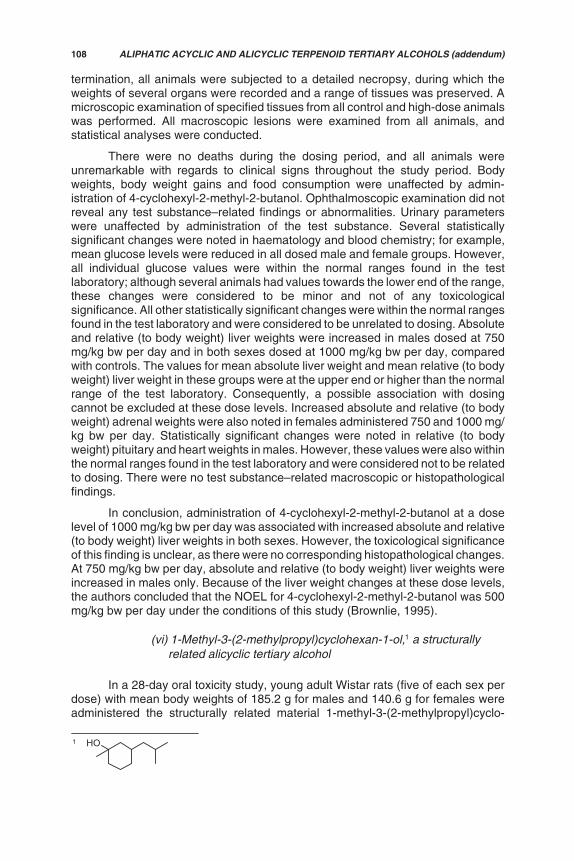
termination, all animals were subjected to a detailed necropsy, during which theweights of several organs were recorded and a range of tissues was preserved. Amicroscopic examination of specified tissues from all control and high-dose animalswas performed. All macroscopic lesions were examined from all animals, andstatistical analyses were conducted.
There were no deaths during the dosing period, and all animals wereunremarkable with regards to clinical signs throughout the study period. Bodyweights, body weight gains and food consumption were unaffected by admin-istration of 4-cyclohexyl-2-methyl-2-butanol. Ophthalmoscopic examination did notreveal any test substance–related findings or abnormalities. Urinary parameterswere unaffected by administration of the test substance. Several statisticallysignificant changes were noted in haematology and blood chemistry; for example,mean glucose levels were reduced in all dosed male and female groups. However,all individual glucose values were within the normal ranges found in the testlaboratory; although several animals had values towards the lower end of the range,these changes were considered to be minor and not of any toxicologicalsignificance. All other statistically significant changes were within the normal rangesfound in the test laboratory and were considered to be unrelated to dosing. Absoluteand relative (to body weight) liver weights were increased in males dosed at 750mg/kg bw per day and in both sexes dosed at 1000 mg/kg bw per day, comparedwith controls. The values for mean absolute liver weight and mean relative (to bodyweight) liver weight in these groups were at the upper end or higher than the normalrange of the test laboratory. Consequently, a possible association with dosingcannot be excluded at these dose levels. Increased absolute and relative (to bodyweight) adrenal weights were also noted in females administered 750 and 1000 mg/kg bw per day. Statistically significant changes were noted in relative (to bodyweight) pituitary and heart weights in males. However, these values were also withinthe normal ranges found in the test laboratory and were considered not to be relatedto dosing. There were no test substance–related macroscopic or histopathologicalfindings.
In conclusion, administration of 4-cyclohexyl-2-methyl-2-butanol at a doselevel of 1000 mg/kg bw per day was associated with increased absolute and relative(to body weight) liver weights in both sexes. However, the toxicological significanceof this finding is unclear, as there were no corresponding histopathological changes.At 750 mg/kg bw per day, absolute and relative (to body weight) liver weights wereincreased in males only. Because of the liver weight changes at these dose levels,the authors concluded that the NOEL for 4-cyclohexyl-2-methyl-2-butanol was 500mg/kg bw per day under the conditions of this study (Brownlie, 1995).
(vi) 1-Methyl-3-(2-methylpropyl)cyclohexan-1-ol,1 a structurallyrelated alicyclic tertiary alcohol
In a 28-day oral toxicity study, young adult Wistar rats (five of each sex perdose) with mean body weights of 185.2 g for males and 140.6 g for females wereadministered the structurally related material 1-methyl-3-(2-methylpropyl)cyclo-
1 HO
108 ALIPHATIC ACYCLIC AND ALICYCLIC TERPENOID TERTIARY ALCOHOLS (addendum)

hexan-1-ol as a mixture of cis and trans isomers (referred to as Rossitol QRM2688)at 0, 5, 15 and 150 mg/kg bw per day by intragastric instillation in corn oil. Animalswere observed twice daily on working days. All abnormalities, signs of ill-health orreactions to dosing were recorded. The body weight of each animal was recordedonce during the acclimatization period, at initiation of dosing and twice per weekthereafter. Food consumption was measured over successive 3- to 4-day periods.At the end of the dosing period, haematology and clinical chemistry were conductedon all rats, necropsies were performed on all animals and selected organs andtissues were evaluated histologically. Group means and standard deviations werecalculated for body weight, weekly body weight gain, weekly food consumption,weekly food conversion efficiency, clinical chemistry, red/white blood cells countsand organ weights.
None of the animals died during the study. The daily observations did notreveal any dosing-related clinical signs. No significant effects of dosing on any ofthe functional (i.e. neurobehavioural) measures were observed at any time pointduring the 4-week dosing period. Mean body weights showed no statisticallysignificant intergroup differences throughout the study. No statistically significantchanges in red blood cell and coagulation variables or total and differential whiteblood cell counts were observed. Clinical chemistry values showed the followingstatistically significant differences between test rats and controls: increased albuminto globulin ratio in males of the high dose group, increased cholesterol levels inmales of the low and intermediate dose groups and increased urea levels in femalesof the high dose group. Male rats of the high dose group showed a statisticallysignificant increase in relative kidney weight (17%) and relative liver weight (15%).Female rats of the high dose group showed a statistically significant increase in themean relative liver weight (12%). Female rats of the low dose group showed astatistically significant increase in the relative weight of the ovaries. The latterobservation, however, was considered by the authors not to be treatment related,because the absolute ovary weights were normal in the two higher dose groups.Macroscopic examination at autopsy did not reveal treatment-related abnormalities.Microscopic examination did not reveal any treatment-related histopathologicalchanges.
The absence of obvious signs of toxicity demonstrated that the testsubstance was well tolerated by the rats. The administration of the test substanceat 150 mg/kg bw per day was associated with increases in relative kidney weight(males only), relative liver weight, plasma albumin to globulin ratio (males only) andplasma urea level (females only). The lone effects found in the low and intermediatedose groups (increase in plasma cholesterol) were not dose related, and thecholesterol levels in these rats were well within the normal range. Therefore, theincreased cholesterol levels in males were not ascribed to exposure to the testsubstance. The NOAEL of 1-methyl-3-(2-methylpropyl)cyclohexan-1-ol under theconditions of this study was 15 mg/kg bw per day (Appel, 1999).
ALIPHATIC ACYCLIC AND ALICYCLIC TERPENOID TERTIARY ALCOHOLS (addendum) 109

(c) Long-term studies of toxicity
No additional long-term studies of toxicity of the flavouring agents in thisgroup have been reported since the preparation of the original monograph (Annex1, reference 137).
(d) Genotoxicity
Genotoxicity testing has been performed on two substances in the presentgroup and one from the former groups since the previous evaluations (Annex 1,references 137 and 187). The results of these tests are summarized in Table 4 anddescribed below.
(i) In vitro
(+)-Cedrol (No. 2030) was tested for mutagenicity to bacteria by incubationwith Salmonella typhimurium tester strains TA97a, TA98, TA100, TA102 andTA1535, either alone or with an exogenous induced rat liver bioactivation system,using a plate incorporation assay. The test substance was toxic at 160 and 500 μg/plate alone and with an exogenous induced rat liver bioactivation system,respectively. At eight concentrations up to 5000 μg/plate, the test substanceproduced no increase in revertant mutants in any strain, whereas appropriatecontrol substances established the responsiveness of the tester strains(Scheerbaum, 2001).
-Bisabolol (No. 2031) was tested for mutagenicity to bacteria by incubationwith S. typhimurium tester strains TA98, TA100, TA102, TA1535 and TA1537, eitheralone or with an exogenous induced rat liver bioactivation system, using a plateincorporation assay. The test substance was toxic at 150 and 500 μg/plate aloneand with an exogenous induced rat liver bioactivation system, respectively. At sevenconcentrations up to 500 μg/plate, the test substance produced no increase inrevertant mutants in any strain, whereas appropriate control substances establishedthe responsiveness of the tester strains (King, 2002).
-Bisabolol (No. 2031) was tested for mutagenicity to bacteria by incubationwith S. typhimurium tester strains TA97a, TA98, TA100 and TA1535, either aloneor with an exogenous induced rat liver bioactivation system, using a plateincorporation assay. The test substance was toxic at 100 and 200 μg/plate aloneand with an exogenous induced rat liver bioactivation system, respectively. At nineconcentrations up to 400 μg/plate, the test substance produced no increase inrevertant mutants in any strain, whereas appropriate control substances establishedthe responsiveness of the tester strains (Gomes-Carneiro et al., 2005).
Dihydromyrcenol (2,6-dimethyloct-7-en-2-ol), a structurally relatedsubstance, was tested for mutagenicity to bacteria by incubation with S.typhimurium tester strains TA98, TA100, TA102, TA1535 and TA1537, either aloneor with an exogenous induced rat liver bioactivation system, using a plateincorporation assay. The test substance alone and with bioactivation was toxic at5000 μg/plate. At seven concentrations up to 5000 μg/plate, the test substanceproduced no increase in revertant mutants in any strain, whereas appropriatecontrol substances established the responsiveness of the tester strains (King,2000).
110 ALIPHATIC ACYCLIC AND ALICYCLIC TERPENOID TERTIARY ALCOHOLS (addendum)

Tabl
e 4.
Stu
dies
of g
enot
oxic
ity w
ith a
lipha
tic a
cycl
ic a
nd a
licyc
lic te
rpen
oid
tert
iary
alc
ohol
s us
ed a
s fla
vour
ing
agen
ts
No.
Fla
vour
ing
agen
tE
nd-p
oint
Tes
t obj
ect
Con
cent
ratio
nR
esul
tsR
efer
ence
In v
itro
2030
(+)-
Ced
rol
Rev
erse
mut
atio
nS
alm
onel
laty
phim
uriu
mT
A97
a,T
A98
, TA
100,
TA
102,
TA
1535
0, 1
.6, 5
, 16,
50,
160
, 500
, 160
0 an
d50
00 μ
g/pl
ate
Neg
ativ
ea,b
Sch
eerb
aum
(20
01)
2031
-Bis
abol
olR
ever
se m
utat
ion
S. t
yphi
mur
ium
TA
98,
TA
100,
TA
102,
TA
1535
, TA
1537
0, 1
.5, 5
, 15,
50,
100
, 150
and
500
μg/
plat
eN
egat
ivea,
c,d
Kin
g (2
002)
2031
-Bis
abol
olR
ever
se m
utat
ion
S. t
yphi
mur
ium
TA
97a,
TA
98, T
A10
0,T
A15
35
0, 1
, 5, 1
0, 2
5, 5
0, 1
00, 2
00, 3
00 a
nd40
0 μg
/pla
teN
egat
ivea,
d,e
Gom
es-C
arne
iro e
t al.
(200
5)
In v
ivo
356
Lina
lool
Mic
ronu
cleu
s as
say
Mal
e an
d fe
mal
e m
ice
(Sw
iss
CD
-1)
0, 5
00, 1
000
and
1500
mg/
kg b
wf
Neg
ativ
eM
eert
s (2
001)
a W
ith a
nd w
ithou
t met
abol
ic a
ctiv
atio
n.b
The
test
mat
eria
l was
bac
terio
toxi
c to
war
ds a
ll st
rain
s at
gre
ater
than
or
equa
l to
500
and
160
μg/p
late
with
and
with
out S
9 ac
tivat
ion,
res
pect
ivel
y.c
The
test
mat
eria
l was
bac
terio
toxi
c to
war
ds a
ll st
rain
s at
dos
es g
reat
er th
an o
r eq
ual t
o 50
0 an
d 15
0 μg
/pla
te w
ith a
nd w
ithou
t S9
activ
atio
n,re
spec
tivel
y.d
Sta
ndar
d pl
ate
inco
rpor
atio
n m
etho
d.e
The
test
mat
eria
l was
bac
terio
toxi
c to
war
ds a
ll st
rain
s at
gre
ater
than
200
and
100
μg/
plat
e w
ith a
nd w
ithou
t S9
activ
atio
n, r
espe
ctiv
ely.
f A
dmin
iste
red
via
gava
ge.
ALIPHATIC ACYCLIC AND ALICYCLIC TERPENOID TERTIARY ALCOHOLS (addendum) 111

Octahydro-2,5,5-trimethyl-2-naphthol,1 a structurally related substance, wastested for mutagenicity to bacteria by incubation with S. typhimurium tester strainsTA98, TA100, TA1535 and TA1537, as well as Escherichia coli strain WP2uvrA,either alone or with an exogenous induced rat liver bioactivation system, using apreincubation assay. At eight concentrations up to 500 μg/plate, the test substanceproduced no increase in revertant mutants in any strain, whereas appropriatecontrol substances established the responsiveness of the tester strains (Watanabe,2002).
1,2-Dihydrolinalool,2 a structurally related substance, was tested formutagenicity to bacteria by incubation with S. typhimurium tester strains TA97,TA98, TA100, TA102 and TA1535, either alone or with an exogenous induced ratliver bioactivation system, using both the plate incorporation and preincubationassays. At six concentrations up to 1000 μg/plate, the test substance produced noincrease in revertant mutants in any strain in either assay, whereas appropriatecontrol substances established the responsiveness of the tester strains (Gocke,1999).
1-Methyl-3-(2-methylpropyl)cyclohexan-1-ol, a structurally related sub-stance, was tested for mutagenicity to bacteria by incubation with S. typhimuriumtester strains TA98, TA100, TA102 and TA1535, either alone or with an exogenousinduced rat liver bioactivation system, using a plate incorporation assay. The testsubstance alone and with bioactivation was toxic at 250 μg/plate. At fiveconcentrations up to 500 μg/plate, the test substance produced no increase inrevertant mutants in any strain, whereas appropriate control substances establishedthe responsiveness of the tester strains (van Ommen, 1999).
1-Methyl-3-(2-methylpropyl)cyclohexan-1-ol, a structurally related sub-stance, was tested for induction of chromosomal aberrations in cultured Chinesehamster ovary cells. An exogenous rat liver bioactivation system was used. Testsubstance concentrations of 200 μg/ml or greater caused significant toxicity, withcell death and precipitation. No biologically relevant or statistically significantincrease in the number of cells with structural aberrations was observed (de Vogel,1999).
(ii) In vivo
Linalool (No. 356) was tested for in vivo mutagenicity in the bone marrowmicronucleus assay in mice. Four groups (five of each sex per group) received asingle dose of the test substance by intragastric instillation in corn oil; two of thesegroups were administered linalool at a dose of 1500 mg/kg bw, and one group eachwas administered 500 or 1000 mg/kg bw. Vehicle controls received corn oil, and
1
OH
2 HO
112 ALIPHATIC ACYCLIC AND ALICYCLIC TERPENOID TERTIARY ALCOHOLS (addendum)

positive controls received cyclophosphamide. Systemic toxic signs were recordedat least once a day. The animals were terminated 24 or 48 h after dosing, bothfemurs were removed and bone marrow smears were made and analysed formicronuclei.
The animals of the groups dosed with linalool showed no decrease in theratio of polychromatic to normochromatic erythrocytes, which reflects a lack of toxiceffects of this compound on erythropoiesis. No increase in the frequency ofmicronucleated polychromatic erythrocytes was found in the linalool-dosed animalscompared with the vehicle controls, whereas cyclophosphamide produced anincrease. Therefore, linalool was not mutagenic in the micronucleus test under theexperimental conditions used (Meerts, 2001).
(e) Developmental and reproductive studies of toxicity
(i) -Bisabolol (No. 2031)
A study was conducted in an unspecified strain of rats to determine thepotential developmental toxicity of -bisabolol. In two experiments, groups ofunspecified numbers of presumed pregnant rats were administered -bisabolol(98% pure) at a dose of 0, 0.25, 0.50 or 1.0 ml/kg bw per day in the first experimentand 3.0 ml/kg bw per day in the second experiment by intragastric instillation ondays 6–15 of pregnancy. These dose levels correspond to calculated daily intakesof 0, 233, 466, 931 and 2793 mg/kg bw per day (assuming a specific gravity of0.931). Upon sacrifice, the uteri of all animals were examined for numbers of live ordead fetuses, resorptions and deformities. At the highest dose of the test substanceadministered, there were reduced numbers of live fetuses in addition to reducedfetal weights and increased numbers of resorptions. No adverse effects wereobserved in any other dose group. The NOAEL for reproductive effects in anunspecified strain of rats is 931 mg/kg bw per day (Habersang et al., 1979).
In a study to assess the developmental toxicity of -bisabolol, an unspecifiednumber of female New Zealand White rabbits 8–9 months of age were administeredthe test material (98% pure) at a dose of 0, 0.3, 1 or 3 ml/kg bw per day by intragastricinstillation on days 6–18 of pregnancy. These dose levels correspond to calculateddaily intakes of 0, 279, 931 and 2793 mg/kg bw (assuming a specific gravity of0.931). Caesarean sections were performed at day 30, and fetuses were examinedfor visceral and skeletal malformations. The highest dose of the test substancereduced the numbers of live fetuses, in addition to reducing fetal weights andincreasing numbers of resorptions. No adverse effects were observed in the middleand low dose groups. The NOAEL for reproductive effects in the New Zealand Whiterabbit is 931 mg/kg bw per day (Habersang et al., 1979).
(ii) Linalool (No. 356)
Linalool was studied for potential developmental toxicity in rats. Four groupsof presumed pregnant female Sprague-Dawley rats (25 per group) wereadministered linalool (99.5% pure) at a dose of 0, 250, 500 or 1000 mg/kg bw perday by intragastric instillation in corn oil on gestational days 7–17. Observations for
ALIPHATIC ACYCLIC AND ALICYCLIC TERPENOID TERTIARY ALCOHOLS (addendum) 113

viability, adverse clinical signs, abortion and premature delivery were conductedbefore and approximately 1 h following dosing and once thereafter. Body weightswere recorded prior to the start of the study and daily during the dosage and post-dosage periods. Food consumption was recorded on days 0, 7, 10, 12, 15, 18 and21. Caesarean section and necropsy were conducted on all animals on gestationalday 21. The uteri of apparently non-pregnant rats were examined while pressedbetween glass plates, to confirm the absence of implantation sites. The number anddistribution of corpora lutea were recorded. The uterus of each rat was removedand examined for pregnancy, number and distribution of implantations, fetalmortality and early and late resorptions. Fetuses were removed from the uterus,weighed, euthanized and examined microscopically for sex and gross externalalterations. Approximately one half of each litter was examined for soft tissuealterations, using a variation of Wilson’s sectioning technique. The remainingfetuses were eviscerated, cleared, stained and examined for skeletal alterations.
No deaths related to the administration of linalool occurred. One dam in thelow dose group delivered early on the day of scheduled sacrifice. This delivery wasconsidered unrelated to administration of linalool because the observation was notdose dependent. There were no macroscopic lesions at necropsy in this dam, andher litter consisted of 12 live-delivered pups and one early in utero resorption. Allpups appeared normal for this dam, and no external, soft tissue or skeletalalterations occurred in these pups.
There were no clinical signs of toxicity. All clinical observations wereconsidered to be unrelated to administration of linalool because they were not dosedependent or the observations were transient. All necropsy observations wereconsidered to be unrelated to administration of linalool because they were not dosedependent or they occurred in a single rat per dosage group. Body weight gainswere reduced by 11% in the 1000 mg/kg bw per day dose group during the dosingperiod (in comparison with control). Body weights and body weight gains wereunaffected by dosages of linalool as high as 500 mg/kg bw per day. In comparisonwith the control group, absolute and relative food consumption values were reducedand significantly reduced (by 7%), respectively, in the 1000 mg/kg bw per day dosegroup for the entire dosage period. Absolute and relative food consumption valueswere unaffected by dosages of linalool as high as 500 mg/kg bw per day.
No caesarean section or litter parameters were affected by dosages oflinalool as high as 1000 mg/kg bw per day. The litter averages for corpora lutea,implantations, litter sizes, live fetuses, early and late resorptions, per cent resorbedconceptuses, per cent live male fetuses and fetal body weights were similar amongthe three dosage groups and vehicle control group. No dam had a litter thatconsisted of all resorbed conceptuses. All placentas appeared normal. Nomacroscopic external, soft tissue or skeletal alterations appeared to be caused bydosages of linalool as high as 1000 mg/kg bw per day. There were no dose-dependent or significant differences in the litter or fetal incidences of anymacroscopic external, soft tissue or skeletal alterations. All ossification averageswere comparable to vehicle control group values and did not significantly differamong the groups.
114 ALIPHATIC ACYCLIC AND ALICYCLIC TERPENOID TERTIARY ALCOHOLS (addendum)

Based on these data, the maternal NOAEL of linalool is 500 mg/kg bw perday. The 1000 mg/kg bw per day dose caused non-significant reductions in bodyweight gain and also reduced absolute and relative food consumption values duringthe dosage period. However, following the completion of the dosing period, theseeffects were reversed. The developmental NOEL is 1000 mg/kg bw per day, thehighest dose tested. No embryo-fetal effects were observed at the highest dosetested (Lewis, 2006).
(iii) 2,6-Dimethyloct-7-en-2-ol, a structurally related aliphaticterpenoid tertiary alcohol
A study was conducted in Sprague-Dawley rats to determine the potentialdevelopmental toxicity of 2,6-dimethyloct-7-en-2-ol. Four groups of presumedpregnant female rats (25 per group) were administered 2,6-dimethyloct-7-en-2-ol ata dose of 0, 250, 500 or 1000 mg/kg bw per day by intragastric instillation in cornoil on gestational days 7–17. Observations for viability, adverse clinical signs,abortion and premature delivery were conducted before and approximately 1 hfollowing dosing and once thereafter. Body weights were recorded prior to the startof the study and daily during the dosage and post-dosage periods. Foodconsumption was recorded on days 0, 7, 10, 12, 15, 18 and 21. On gestational day21, all rats were terminated, and caesarean sections and necropsies wereconducted on all animals. The uteri of apparently non-pregnant rats were examinedwhile pressed between glass plates, to confirm the absence of implantation sites.The number and distribution of corpora lutea were recorded. The uterus of each ratwas removed and examined for pregnancy, number and distribution ofimplantations, fetal mortality and early and late resorptions. Fetuses were removedfrom the uterus, weighed, euthanized and examined microscopically for sex andgross external alterations. Approximately one half of each litter was examined forsoft tissue alterations, using a variation of Wilson’s sectioning technique. Theremaining fetuses were eviscerated, cleared, stained and examined for skeletalalterations.
Body weight gains in the high dose group were reduced by 5% whencompared with controls; weight losses were observed after the first two doses.Although these observations were not significant, they were considered to beevidence of a threshold level for maternal toxicity. Both maternal absolute andrelative food consumption values were significantly reduced in the 1000 mg/kg bwper day group compared with the vehicle control. Reduced food consumption wasmost prominent on gestational days 7–10, which correlated with the weight lossesand reduced weight gains that occurred during the initial days of the dosing period.2,6-Dimethyloct-7-en-2-ol doses of 250 or 500 mg/kg bw per day had no adverseeffects on maternal food consumption or body weight gains.
Pregnancy occurred in 22–25 rats per dosage group. Body weights forcombined male and female fetuses were reduced approximately 3% in the 1000mg/kg bw per day group compared with vehicle controls (the reduction wasstatistically significant for females). Although the values were within the historicalcontrol range for the testing facility, the reduction in fetal body weight correlated withthe reduced maternal body weight gains and food consumption in the dosage period
ALIPHATIC ACYCLIC AND ALICYCLIC TERPENOID TERTIARY ALCOHOLS (addendum) 115

and for the entire dosage and gestation periods. No other caesarean section or litterparameters were affected by dosages of 2,6-dimethyloct-7-en-2-ol as high as 1000mg/kg bw per day.
Fetal evaluations were based on 22–25 litters, which corresponded to 295–358 fetuses per dosage group. Fetal alterations were defined as either mal-formations (irreversible changes that occur at low incidences with this species andstrain) or variations (common findings in this species and strain and reversibledelays or accelerations in development). Upon inspection, there were no fetal grossexternal alterations or fetal soft tissue or skeletal malformations observed in theexperiment. There were no observable soft tissue variations, and skeletal variationswere limited to two reversible minor changes. First, there was evidence of athreshold (but statistically significant) increase in supernumerary ribs, along withassociated significant increases and decreases in the respective numbers ofthoracic and lumbar vertebrae. Second, there was evidence of a small butstatistically significant retardation in ossification of the metatarsal bones in the hindpaws, evident as a reduction in the mean number of ossified metatarsal bones.
Results from the present study indicate that 2,6-dimethyloct-7-en-2-ol at adose of 1000 mg/kg bw per day produced threshold levels of maternal anddevelopmental toxicity. The significant reductions in maternal food consumption andthe associated reductions in maternal body weight gains suggest that a maternallytoxic level was tested. Many of the minor developmental alterations observed in thestudy are often observed at maternally toxic doses (Khera, 1981) and, because theydisappear with continued growth (Wickramaratne et al., 1985; Wickramaratne,1988), are generally not considered to be adverse effects. Other effects (e.g. delayin ossification of metatarsals) were not considered to be of toxicological importancebecause the values were within the historical range observed at the testing facility.As such, the maternal and developmental NOAELs for 2,6-dimethyloct-7-en-2-olare both considered to be 500 mg/kg bw per day, and the test material was notconsidered to be a selective developmental hazard in rats (Politano et al., 2008).
3. REFERENCES
Anders MW (1989). Biotransformation and bioactivation of xenobiotics by the kidney. In:Hutson DH, Caldwell J, Paulson GD, eds. Intermediary xenobiotic metabolism inanimals. New York, NY, USA, Taylor and Francis, pp. 81–97.
Appel MJ (1999). A repeated dose (28-day) oral toxicity study with Rossitol QRM 2688 in rats.Quest International UK Ltd Project No. 40757/01.72.07. Unpublished report to the Flavorand Extract Manufacturers Association, Washington, DC, USA. Submitted to WHO by theInternational Organization of the Flavor Industry, Brussels, Belgium.
Bang L, Ourisson G (1975). Hydroxylation of cedrol by rabbits. Tetrahedron Letters, 24:1881–1884.
Brownlie S-A (1995). Four week oral (gavage) toxicity study in the rat. 4-Cyclohexyl-2-methyl-2-butanol. Toxicol Laboratories Ltd Project No. FCH/7/95. Unpublished report tothe Flavor and Extract Manufacturers Association, Washington, DC, USA. Submitted toWHO by the International Organization of the Flavor Industry, Brussels, Belgium.
Cramer GM, Ford RA, Hall RL (1978). Estimation of toxic hazard—a decision tree approach.Food and Cosmetics Toxicology, 16(3):255–276.
116 ALIPHATIC ACYCLIC AND ALICYCLIC TERPENOID TERTIARY ALCOHOLS (addendum)

de Vogel N (1999). Chromosomal aberration test with Rossitol QRM 2688 in cultured Chinesehamster ovary cells. TNO Nutrition and Food Research Institute Project No.40757/01.73.10. Unpublished report to the Flavor and Extract Manufacturers Association,Washington, DC, USA. Submitted to WHO by the International Organization of the FlavorIndustry, Brussels, Belgium.
Dunster JS, Watson P, Brooks PN (2007). Dimyrcetol: ninety day repeated dose oral (gavage)toxicity study in the rat. SafePharm Laboratories Project No. 2153-0003. Unpublishedreport to the Flavor and Extract Manufacturers Association, Washington, DC, USA.Submitted to WHO by the International Organization of the Flavor Industry, Brussels,Belgium.
European Flavour and Fragrance Association (2004). European inquiry on volume of use.Unpublished report. Submitted to WHO by the International Organization of the FlavorIndustry, Brussels, Belgium.
Ganzera M, Schneider P, Stuppner H (2006). Inhibitory effects of the essential oil of chamomile(Matricaria recutita L.) and its major constituents on human cytochrome P450 enzymes.Life Sciences, 78:856–864.
Gocke E (1999). Mutagenicity evaluation of dihydro linalool (Ro 02-8243/000) in the Amestest. Roche Ltd Project No. 486M99. Personal communication to the Flavor and ExtractManufacturers Association, Washington, DC, USA. Submitted to WHO by the InternationalOrganization of the Flavor Industry, Brussels, Belgium.
Gomes-Carneiro MR et al. (2005). Evaluation of mutagenic and antimutagenic activities ofalpha-bisabolol in the Salmonella/microsome assay. Mutation Research, 585:105–112.
Habersang S et al. (1979). [Pharmacological studies with compounds of chamomile. IV.Studies on toxicity of ( )-alpha-bisabolol.] Planta Medica, 37:115–123 (in German).
Heymann E (1980). Carboxylesterases and amidases. In: Jakoby WB, ed. Enzymatic basis ofdetoxification, 2nd ed. New York, NY, USA, Academic Press, pp. 291–323.
Horning MG et al. (1976). Metabolism of drugs by the epoxide-diol pathway. In: Frigerio A,Catagnoll N, eds. Advances in mass spectroscopy in biochemistry and medicine. Vol. I.New York, NY, USA, Spectrum Publications, pp. 91–108.
International Organization of the Flavor Industry (2009). Interim inquiry on volume of use andadded use levels for flavoring agents to be presented at the JECFA 73rd meeting.Submitted to WHO by the International Organization of the Flavor Industry, Brussels,Belgium.
Ishida T (2005). Biotransformation of terpenoids by mammals, microorganisms, and plant-cultured cells. Chemical Biodiversity, 2:569–589.
Japan Flavor and Fragrance Materials Association (2002). JFFMA poundage survey 2002:Japanese inquiry on volume of use. Submitted to WHO by the International Organizationof the Flavor Industry, Brussels, Belgium.
Japan Flavor and Fragrance Materials Association (2005). JFFMA poundage survey 2005:Japanese inquiry on volume of use. Submitted to WHO by the International Organizationof the Flavor Industry, Brussels, Belgium.
Khera KS (1981). Common fetal aberrations and their teratologic significance: a review.Fundamental and Applied Toxicology, 1:13–18.
King M-T (2000). The mutagenicity of dihydromyrcenol in the Salmonella typhimurium/mammalian microsome reverse mutation assay (Ames-test). Freiburger Labor fürMutagenitatsprufung Project No. AM04000N. Unpublished report to the Flavor and ExtractManufacturers Association, Washington, DC, USA. Submitted to WHO by the InternationalOrganization of the Flavor Industry, Brussels, Belgium.
King T (2002). Mutagenicity study of Bisabolol Alpha Nat. H & R in the Salmonellatyphimurium/mammalian microsome reverse mutation assay (Ames-test). FreiburgerLabor für Mutagenitatsprufung der King & Harnasch GmbH Project No. AM01202N.Unpublished report to the Flavor and Extract Manufacturers Association, Washington, DC,
ALIPHATIC ACYCLIC AND ALICYCLIC TERPENOID TERTIARY ALCOHOLS (addendum) 117

USA. Submitted to WHO by the International Organization of the Flavor Industry, Brussels,Belgium.
Kouzi SA, McChesney JD, Walker LA (1993). Identification of four biliary metabolites of thediterpene sclareol in the laboratory rat. Xenobiotica, 23(6):621–632.
Lewis EM (2006). Oral (gavage) developmental toxicity study of linalool in rats. Charles RiverLaboratories Project No. TIF00009. Unpublished report to the Flavor and ExtractManufacturers Association, Washington, DC, USA. Submitted to WHO by the InternationalOrganization of the Flavor Industry, Brussels, Belgium.
Meerts I (2001). Micronucleus test in bone marrow cells of the mouse with linalool. NOTOXProject No. 328826. Unpublished report to the Flavor and Extract ManufacturersAssociation, Washington, DC, USA. Submitted to WHO by the International Organizationof the Flavor Industry, Brussels, Belgium.
Merkel D (2006). Sclareol and cedrol: subchronic toxicity study (28 day repeated dose oralgavage study in rats). Product Safety Laboratories Project No. 17280. Unpublished reportto the Flavor and Extract Manufacturers Association, Washington, DC, USA. Submitted toWHO by the International Organization of the Flavor Industry, Brussels, Belgium.
Nijssen LM, van Ingen-Visscher CA, Donders JJM, eds (2009). VCF (Volatile Compounds inFood) database. Version 11.1.1. Zeist, Netherlands, TNO Quality of Life (http://www.vcf-online.nl/VcfHome.cfm).
Parke DV, Rahman H (1969). The effects of some terpenoids and other dietary anutrients onhepatic drug metabolizing enzymes. Biochemical Journal, 113(2):12.
Parke DV, Rahman H, Walker R (1974). The absorption, distribution and excretion of linaloolin the rat. Biochemical Society Transactions, 2(4):612–615.
Politano VT et al. (2008). Developmental toxicity of dimyrcetol in rats. Toxicologist, 102(1):313(abstract).
Scheerbaum D (2001). Reverse mutation assay (Ames-test) with Salmonella typhimurium.Cedrol Cryst. Angewandte Biologie Project No. 000915HR. Unpublished report to theFlavor and Extract Manufacturers Association, Washington, DC, USA. Submitted to WHOby the International Organization of the Flavor Industry, Brussels, Belgium.
Trifilieff E, Bang L, Ourisson G (1975). Hydroxylation du cedrol par le chien. TetrahedronLetters, 16(48):4307–4310.
van Ommen B (1999). Bacterial reverse mutation test with Rossitol QRM 2688. QuestInternational UK Ltd Project No. 010.40757/01.73.14. Unpublished report to the Flavor andExtract Manufacturers Association, Washington, DC, USA. Submitted to WHO by theInternational Organization of the Flavor Industry, Brussels, Belgium.
Ventura P et al. (1985). Further studies of trans-sobrerol metabolism: rat, dog and humanurine. Xenobiotica, 15(4):317–325.
Watanabe S (2002). Ambrinol-20: reverse mutation test “Ames test” with S. typhimurium andE. coli. Project No. M-200. Unpublished report to the Flavor and Extract ManufacturersAssociation, Washington, DC, USA. Submitted to WHO by the International Organizationof the Flavor Industry, Brussels, Belgium.
Wickramaratne GA (1988). The post-natal fate of supernumerary ribs in rat teratogenicitystudies. Journal of Applied Toxicology, 8(2):91–94.
Wickramaratne GA et al. (1985). Pre-natal and post-natal changes in the incidence of “extra-ribs” in rat teratology studies. Teratology, 32(2):36A (abstract).
Williams RT (1959). Detoxication mechanisms: the metabolism and detoxication of drugs,toxic substances, and other organic compounds, 2nd ed. London, England, Chapman andHall, p. 318.
118 ALIPHATIC ACYCLIC AND ALICYCLIC TERPENOID TERTIARY ALCOHOLS (addendum)
ALIPHATIC AND AROMATIC AMINES AND AMIDES (addendum)
First draft prepared by
Dr P.J. Abbott,1 Dr M. DiNovi,2 Professor A.G. Renwick3
and Professor R. Walker4
1 Biosearch Consulting, Yarralumla, Canberra, Australia2 Center for Food Safety and Applied Nutrition, Food and Drug Administration,
College Park, Maryland, United States of America (USA)3 School of Medicine, University of Southampton, Southampton, England
4 Ash, Aldershot, Hantfordshire, England
1. Evaluation ..............................................................................1.1 Introduction ......................................................................1.2 Assessment of dietary exposure .....................................1.3 Absorption, distribution, metabolism and elimination ......1.4 Application of the Procedure for the Safety Evaluation of
Flavouring Agents ...........................................................1.5 Consideration of combined intakes from use as flavouring
agents ..............................................................................1.6 Consideration of secondary components ........................1.7 Conclusion .......................................................................
2. Relevant background information ..........................................2.1 Explanation ......................................................................2.2 Additional considerations on intake .................................2.3 Biological data .................................................................
2.3.1 Biochemical data: absorption, distribution,metabolism and elimination ....................................
2.3.2 Toxicological studies ..............................................3. References ............................................................................
1. EVALUATION
1.1 Introduction
The Committee evaluated an additional group of nine flavouring agentsbelonging to the group of aliphatic and aromatic amines and amides. The additionalflavouring agents included one quaternary ammonium salt, one primary amine,three branched-chain aliphatic amides and four amides with alicyclic or aromaticalkyl side-chains, one of which contains a benzeneacetonitrile group. Theevaluations were conducted using the Procedure for the Safety Evaluation ofFlavouring Agents (Figure 1, Introduction) (Annex 1, reference 131). None of theseflavouring agents has previously been evaluated.
The Committee evaluated 49 other members of this group of flavouringagents at its sixty-fifth and sixty-eighth meetings (Annex 1, references 178 and187). For 36 of the 37 flavouring agents evaluated at the sixty-fifth meeting, the
119119120127
128
130131131131131131132
132137151
- 119 -

Committee concluded that they would not give rise to safety concerns based onestimated dietary exposures. For 1 of the 37 flavouring agents—namely, acetamide(No. 1592)—the Committee considered it inappropriate for use as a flavouringagent or for food additive purposes, based on the available data indicatingcarcinogenicity in mice and rats. For 27 flavouring agents, the dietary exposureestimates were based on anticipated annual volumes of production, and theseevaluations were conditional pending submission of use levels or poundage data,which were provided at the sixty-ninth meeting (Annex 1, reference 190).
For the evaluation of 2-isopropyl-N-2,3-trimethylbutyramide (No. 1595),additional data available at the sixty-ninth meeting raised safety concerns, and theCommittee concluded that the Procedure could not be applied to this flavouringagent until additional safety data became available.
For all 12 flavouring agents evaluated at the sixty-eighth meeting (Annex 1,reference 187), the Committee concluded that they would not give rise to safetyconcerns at estimated dietary exposures. The Committee noted, while making thisconclusion, that 4-aminobutyric acid (No. 1771) is an endogenous neurotransmitter;however, the tissue levels arising from consumption of food containing thisflavouring agent would be biologically insignificant.
One of the nine flavouring agents considered at the current meeting—namely, choline chloride (No. 2003)—is a natural component of food and has beendetected in beef liver, chicken liver, eggs, wheat germ, bacon, dried soya beans andpork (Zeisel et al., 2003).
1.2 Assessment of dietary exposure
The total annual volumes of production of the nine additional flavouringagents in this group are 21 kg in Europe, 1001 kg in the USA and 3 kg in Japan(European Flavour and Fragrance Association, 2004; Japan Flavor and FragranceMaterials Association, 2005; Gavin, Williams & Hallagan, 2008; InternationalOrganization of the Flavor Industry, 2009). In Europe and the USA, greater than99% of the annual volume of production is accounted for by N-p-benzeneacetonitrilementhanecarboxamide (No. 2009) and N-ethyl-2,2-diisopropylbutanamide (No.2005), respectively. In Japan, 100% of the annual volume of production is accountedfor by 3-(methylthio)propylamine (No. 2004).
The estimated dietary exposures for each of the flavouring agents,calculated as the maximized survey-derived intake (MSDI) or using the singleportion exposure technique (SPET), are reported in Table 1. The highest estimateis for choline chloride (No. 2003) (200 000 μg, the SPET value obtained from breadand ordinary bakery ware). For the other flavouring agents in the group, the dailydietary exposures range from 0.02 to 48 000 μg, with the SPET yielding the highestestimate for all. Reported annual volumes of production of this group of flavouringagents and the calculated daily dietary exposures (MSDI and SPET) aresummarized in Table 2.
120 ALIPHATIC AND AROMATIC AMINES AND AMIDES (addendum)

Tabl
e 1.
Sum
mar
y of
the
resu
lts o
f the
saf
ety
eval
uatio
ns o
f alip
hatic
and
aro
mat
ic a
min
es a
nd a
mid
es u
sed
as fl
avou
ring
agen
tsa,
b,c
Fla
vour
ing
agen
tN
o.C
AS
No.
and
str
uctu
re
S
tep
A3/
B3d
Doe
s in
take
exce
ed th
eth
resh
old
for
hum
anin
take
?
Ste
p A
4Is
the
subs
tanc
e or
are
itsm
etab
olite
sen
doge
nous
?
Are
add
ition
al d
ata
avai
labl
efo
r su
bsta
nces
with
an
estim
ated
inta
ke e
xcee
ding
the
thre
shol
d of
con
cern
?(f
ollo
w-o
n fr
om s
tep
B3)
e
Com
men
tson
pre
dict
edm
etab
olis
m
Con
clus
ion
base
d on
curr
ent
estim
ated
diet
ary
expo
sure
Str
uctu
ral c
lass
I
Cho
line
chlo
ride
2003
67-4
8-1
N+
OH
Cl-
A3:
Yes
,S
PE
T:
200
000
Cho
line
isen
doge
nous
Not
e 1
No
safe
tyco
ncer
n
3-(M
ethy
lthio
)-pr
opyl
amin
e20
0441
04-4
5-4
S
NH
2
A3:
No,
SP
ET
: 200
NR
Not
e 2
No
safe
tyco
ncer
n
Str
uctu
ral c
lass
III
N-E
thyl
-2,2
-di
isop
ropy
lbut
anam
ide
2005
5111
5-70
-9
NH
O
B3:
Yes
,S
PE
T: 2
700
0
Add
ition
al d
ata
are
not
avai
labl
e.N
ote
3A
dditi
onal
data
requ
ired
toco
mpl
ete
eval
uatio
n
ALIPHATIC AND AROMATIC AMINES AND AMIDES (addendum) 121

Tabl
e 1
(con
td)
Fla
vour
ing
agen
tN
o.C
AS
No.
and
str
uctu
reS
tep
A3/
B3d
Doe
s in
take
exce
ed th
eth
resh
old
for
hum
anin
take
?
Ste
p A
4Is
the
subs
tanc
e or
are
itsm
etab
olite
sen
doge
nous
?
Are
add
ition
al d
ata
avai
labl
efo
r su
bsta
nces
with
an
estim
ated
inta
ke e
xcee
ding
the
thre
shol
d of
con
cern
?(f
ollo
w-o
n fr
om s
tep
B3)
e
Com
men
tson
pre
dict
edm
etab
olis
m
Con
clus
ion
base
d on
curr
ent
estim
ated
diet
ary
expo
sure
Cyc
lopr
opan
ecar
boxy
licac
id (
2-is
opro
pyl-5
-m
ethy
l-cyc
lohe
xyl)-
amid
e
2006
9586
60-0
2-1;
958
660-
04-3
NHO
NHO
B3:
Yes
,S
PE
T: 2
00T
he N
OA
EL
of 8
mg/
kg b
wpe
r da
y in
a 2
8-da
y st
udy
inra
ts fo
r th
e st
ruct
ural
lyre
late
d N
-eth
yl 2
-is
opro
pyl-5
-met
hylc
yclo
-he
xane
carb
oxam
ide
(No.
1601
) (M
iyat
a, 1
995)
is a
tle
ast 2
400
times
the
estim
ated
dai
ly d
ieta
ryex
posu
re to
No.
200
6 w
hen
used
as
a fla
vour
ing
agen
t.
Not
e 3
No
safe
tyco
ncer
n
(±)-
N-L
acto
yl ty
ram
ine
2007
7816
74-1
8-8
NH
OH
OO
H
B3:
Yes
,S
PE
T:
20 0
00
Add
ition
al d
ata
are
avai
labl
e,bu
t ina
dequ
ate
mar
gins
of
safe
ty a
re p
rovi
ded
from
the
NO
ELs
for
stru
ctur
ally
rela
ted
subs
tanc
es.
Not
es 3
and
4A
dditi
onal
data
requ
ired
toco
mpl
ete
eval
uatio
n
122 ALIPHATIC AND AROMATIC AMINES AND AMIDES (addendum)

Tabl
e 1
(con
td)
Fla
vour
ing
agen
tN
o.C
AS
No.
and
str
uctu
reS
tep
A3/
B3d
Doe
s in
take
exce
ed th
eth
resh
old
for
hum
anin
take
?
Ste
p A
4Is
the
subs
tanc
e or
are
itsm
etab
olite
sen
doge
nous
?
Are
add
ition
al d
ata
avai
labl
efo
r su
bsta
nces
with
an
estim
ated
inta
ke e
xcee
ding
the
thre
shol
d of
con
cern
?(f
ollo
w-o
n fr
om s
tep
B3)
e
Com
men
tson
pre
dict
edm
etab
olis
m
Con
clus
ion
base
d on
curr
ent
estim
ated
diet
ary
expo
sure
N-(
2-(P
yrid
in-2
-yl)e
thyl
)-3-
p-m
enth
anec
arbo
xam
ide
2008
8475
65-0
9-7
N
NHO
B3:
Yes
,S
PE
T: 2
400
The
NO
AE
L of
10
mg/
kg b
wpe
r da
y in
a 2
8-da
y st
udy
inra
ts (E
apen
, 200
7) is
at l
east
250
times
the
estim
ated
dai
lydi
etar
y ex
posu
re to
No.
200
8w
hen
used
as
a fla
vour
ing
agen
t.
Not
e 3
No
safe
tyco
ncer
n
N-p
-Ben
zene
acet
onitr
ilem
enth
anec
arbo
xam
ide
2009
8523
79-2
8-3
N
O
H
N
B3:
Yes
,S
PE
T: 3
000
The
NO
EL
of 3
00 m
g/kg
bw
per
day
in a
90-
day
stud
y in
rats
(Eap
en, 2
006)
is a
t lea
st60
00 ti
mes
the
estim
ated
daily
die
tary
exp
osur
e to
No.
2009
whe
n us
ed a
s a
flavo
urin
g ag
ent.
Not
e 3
No
safe
tyco
ncer
n
N-(
2-H
ydro
xyet
hyl)-
2,3-
dim
ethy
l-2-
isop
ropy
lbut
anam
ide
2010
8832
15-0
2-9 N
H
O
OH
B3:
Yes
,S
PE
T: 4
800
0
Add
ition
al d
ata
are
not
avai
labl
e.N
otes
3an
d 4
Add
ition
alda
tare
quire
d to
com
plet
eev
alua
tion
ALIPHATIC AND AROMATIC AMINES AND AMIDES (addendum) 123

Tabl
e 1
(con
td)
Fla
vour
ing
agen
tN
o.C
AS
No.
and
str
uctu
re
S
tep
A3/
B3d
Doe
s in
take
exce
ed th
eth
resh
old
for
hum
anin
take
?
Ste
p A
4Is
the
subs
tanc
e or
are
itsm
etab
olite
sen
doge
nous
?
Are
add
ition
al d
ata
avai
labl
efo
r su
bsta
nces
with
an
estim
ated
inta
ke e
xcee
ding
the
thre
shol
d of
con
cern
?(f
ollo
w-o
n fr
om s
tep
B3)
e
Com
men
tson
pre
dict
edm
etab
olis
m
Con
clus
ion
base
d on
curr
ent
estim
ated
diet
ary
expo
sure
N-(
1,1-
Dim
ethy
l-2-
hydr
oxye
thyl
)-2,
2-di
ethy
lbut
anam
ide
2011
5111
5-77
-6
NH
O
OH
B3:
Yes
,S
PE
T: 2
700
0
Add
ition
al d
ata
are
not
avai
labl
e.N
otes
3 a
nd4
Add
ition
alda
tare
quire
d to
com
plet
eev
alua
tion
bw, b
ody
wei
ght;
CA
S, C
hem
ical
Abs
trac
ts S
ervi
ce; N
OA
EL,
no-
obse
rved
-adv
erse
-effe
ct le
vel;
NO
EL,
no-
obse
rved
-effe
ct le
vel;
NR
, not
req
uire
d fo
rev
alua
tion
beca
use
cons
umpt
ion
of th
e su
bsta
nce
was
det
erm
ined
to b
e of
no
safe
ty c
once
rn a
t ste
p A
3 of
the
Pro
cedu
rea
For
ty-n
ine
flavo
urin
g ag
ents
in th
is g
roup
wer
e pr
evio
usly
eva
luat
ed b
y th
e C
omm
ittee
(A
nnex
1, r
efer
ence
s17
8 an
d 18
7).
bS
tep
1: T
wo
flavo
urin
g ag
ents
(N
os 2
003
and
2004
) ar
e in
str
uctu
ral c
lass
I, a
nd s
even
flav
ourin
g ag
ents
(N
os 2
005–
2011
) ar
e in
str
uctu
ral c
lass
III.
cS
tep
2: F
lavo
urin
g ag
ents
Nos
200
3 an
d 20
04 a
re p
redi
cted
to b
e m
etab
oliz
ed to
inno
cuou
s pr
oduc
ts. T
he re
mai
ning
sev
en a
mid
es (N
os 2
005–
2011
)ca
nnot
be
pred
icte
d to
be
met
abol
ized
to in
nocu
ous
prod
ucts
.d
The
thre
shol
ds fo
r hu
man
inta
ke fo
r st
ruct
ural
cla
sses
I, II
and
III a
re 1
800,
540
and
90
μg/d
ay, r
espe
ctiv
ely.
All
inta
ke v
alue
s ar
e ex
pres
sed
in μ
g/da
y. E
ither
the
high
est S
PE
T e
stim
ate
or th
e M
SD
I est
imat
es, i
f at l
east
one
is h
ighe
r th
an th
e hi
ghes
t SP
ET
est
imat
e, a
re g
iven
in th
e ta
ble.
e T
he m
argi
n of
saf
ety
was
cal
cula
ted
base
d on
the
high
est d
aily
die
tary
exp
osur
e ca
lcul
ated
eith
er b
y th
e S
PE
T o
r as
the
MS
DI.
Not
es:
1.C
holin
e is
end
ogen
ous
and
excr
eted
as
such
in h
uman
urin
e.2.
Alip
hatic
prim
ary
amin
es r
eadi
ly u
nder
go o
xida
tive
deam
inat
ion,
with
the
resu
lting
ald
ehyd
es a
nd k
eton
es e
nter
ing
exis
ting
path
way
s of
met
abol
ism
and
excr
etio
n.3.
Am
ides
are
exp
ecte
d to
und
ergo
oxi
datio
n an
d en
ter
know
n pa
thw
ays
of m
etab
olis
m.
4.It
is a
ntic
ipat
ed th
at th
e fr
ee h
ydro
xyl g
roup
will
form
con
juga
tes
with
sul
fate
or
gluc
uron
ic a
cid,
follo
wed
by
excr
etio
n in
the
urin
e.
124 ALIPHATIC AND AROMATIC AMINES AND AMIDES (addendum)

Table 2. Annual volumes of production and daily dietary exposures foraliphatic and aromatic amines and amides used as flavouring agents inEurope, the USA and Japan
Flavouring agent (No.) Mostrecentannual
volume ofproduction
(kg)a
Dietary exposure Annualvolume
fromnatural
occurrencein foods
(kg)
MSDIb SPETc
μg/day μg/kgbw per
day
μg/day μg/kgbw per
day
Choline chloride (also includescholine) (2003)
125 000 2083 +d
Europe 0.5 0.05 0.0008
USA ND ND ND
Japan ND ND ND
3-(Methylthio)propylamine (2004) 200 3
Europe ND ND ND
USA ND ND ND
Japan 3 1 0.02
N-Ethyl-2,2-diisopropylbutanamide (2005)
35 000 583
Europe ND ND ND
USA 1000 122 2
Japan ND ND ND
Cyclopropanecarboxylic acid (2-isopropyl-5-methyl-cyclohexyl)-amide (2006)
800 13
Europe ND ND ND
USA 1 0.06 0.001
Japan ND ND ND
(±)-N-Lactoyl tyramine (2007) 20 000 333
Europe 0.2 0.02 0.0003
USA ND ND ND
Japan ND ND ND
N-(2-(Pyridin-2-yl)ethyl)-3-p-menthanecarboxamide (2008)
2 400 40
Europe 0.1 0.01 0.0001
ALIPHATIC AND AROMATIC AMINES AND AMIDES (addendum) 125

Table 2 (contd)
Flavouring agent (No.) Mostrecentannual
volume ofproduction
(kg)a
Dietary exposure Annualvolume
fromnatural
occurrencein foods
(kg)
MSDIb SPETc
μg/day μg/kgbw per
day
μg/day μg/kgbw per
day
USA ND ND ND
Japan ND ND ND
N-p-Benzeneacetonitrilementhanecarboxamide (2009)
3 000 50
Europe 20 2 0.04
USA ND ND ND
Japan ND ND ND
N-(2-Hydroxyethyl)-2,3-dimethyl-2-isopropylbutanamide (2010)
63 000 1050
Europe ND ND ND
USA 0.1 0.01 0.0002
Japan ND ND ND
N-(1,1-Dimethyl-2-hydroxyethyl)-2,2-diethylbutanamide (2011)
35 000 583
Europe ND ND ND
USA 0.1 0.01 0.0002
Japan ND ND ND
Total
Europe 21
USA 1001
Japan 3
ND, no data reported; +, reported to occur naturally in foods, but no quantitative data; , notreported to occur naturally in foods
a From European Flavour and Fragrance Association (2004), Gavin, Williams & Hallagan(2008), International Organization of the Flavor Industry (2009) and Japan Flavor andFragrance Materials Association (2005). Values greater than zero but less than 0.1 kg werereported as 0.1 kg.
b MSDI (μg/person per day) calculated as follows:
126 ALIPHATIC AND AROMATIC AMINES AND AMIDES (addendum)

Table 2 (contd)
(annual volume, kg) × (1 × 10⁹ μg/kg)/(population × survey correction factor × 365 days),where population (10%, “eaters only”) = 32 × 106 for Europe, 28 × 106 for the USA and 13 ×106 for Japan; and where survey correction factor = 0.8 for the surveys in Europe, the USAand Japan, representing the assumption that only 80% of the annual flavour volume wasreported in the poundage surveys (European Flavour and Fragrance Association, 2004;Japan Flavor and Fragrance Materials Association, 2005; Gavin, Williams & Hallagan, 2008;International Organization of the Flavor Industry, 2009).MSDI (μg/kg bw per day) calculated as follows:(μg/person per day)/body weight, where body weight = 60 kg. Slight variations may occurfrom rounding.
c SPET (μg/person per day) calculated as follows:(standard food portion, g/day) × (average use level) (International Organization of the FlavorIndustry, 2009). The dietary exposure from the single food category leading to the highestdietary exposure from one portion is taken as the SPET estimate.SPET (μg/kg bw per day) calculated as follows:(μg/person per day)/body weight, where body weight = 60 kg. Slight variations may occurfrom rounding.
d Natural occurrence in food reported in Zeisel et al. (2003).
1.3 Absorption, distribution, metabolism and elimination
The metabolism of aliphatic and aromatic amines and amides was describedpreviously in the report of the sixty-fifth meeting of the Committee (Annex 1,reference 178) and further considered in the report of the sixty-eighth meeting(Annex 1, reference 187).
In general, aliphatic and aromatic amines and amides are rapidly absorbedfrom the gastrointestinal tract and metabolized by deamination, hydrolysis oroxidation to polar metabolites that are readily eliminated in the urine. Many aminesare endogenous and have been identified as normal constituents of urine inhumans. Aliphatic amides have been reported to undergo hydrolysis in mammals;the rate of hydrolysis is dependent on the chain length and the extent of sterichindrance and may involve a number of different enzymes.
Additional studies were provided on N1-(2,4-dimethoxybenzyl)-N2-(2-(pyridin-2-yl)ethyl)oxalamide (No. 1768), which was previously considered at thesixty-eighth meeting (Annex 1, reference 187). Rapid absorption and rapid bloodclearance were noted in rats and dogs following gavage or intraperitoneal dosingand in humans following oral administration, after which blood levels returned tobaseline by 24 h.
In relation to these additional flavouring agents, only limited informationregarding metabolic pathways is available for specific substances. The availabledata suggest that the likely metabolic pathway for the amides in this group, whichwould be resistant to amide hydrolysis, is cytochrome P450 (CYP)–induced C-hydroxylation, followed by sulfation or glucuronidation and excretion.
ALIPHATIC AND AROMATIC AMINES AND AMIDES (addendum) 127

Unpublished studies on (±)-N-lactoyl tyramine (No. 2007) indicate nosignificant hydrolysis of this amide, whereas a published study identified aglucuronic acid conjugate formed in an in vitro study with rat hepatocytes.
Published studies on choline chloride (No. 2003) show that it is absorbedreadily, metabolized to betaine in the liver and kidney and used in the synthesis ofendogenous substances, such as acetylcholine.
1.4 Application of the Procedure for the Safety Evaluation of FlavouringAgents
Step 1. In applying the Procedure for the Safety Evaluation of FlavouringAgents to the additional flavouring agents, the Committee assigned two flavouringagents (Nos 2003 and 2004) to structural class I. The remaining seven flavouringagents (Nos 2005–2011) were assigned to structural class III (Cramer, Ford & Hall,1978).
Step 2. The two flavouring agents in structural class I (Nos 2003 and 2004)are predicted to be metabolized to innocuous products. The evaluation of thesesubstances therefore proceeded via the A-side of the Procedure. The remainingseven flavouring agents (Nos 2005–2011) could not be predicted to be metabolizedto innocuous products. Therefore, the evaluation of these flavouring agentsproceeded via the B-side of the Procedure.
Step A3. The highest estimated daily intake (calculated either as the MSDIor by the SPET) of 3-(methylthio)propylamine (No. 2004) is below the threshold ofconcern (i.e. 1800 μg/person per day for class I). This substance would not beexpected to be of safety concern at current estimated dietary exposures. Thehighest estimated daily intake (calculated by the SPET) of choline chloride (No.2003) is above the threshold of concern (i.e. 1800 μg/person per day for class I).Accordingly, the evaluation of this substance proceeded to step A4.
Step A4. Choline derived from choline chloride (No. 2003) is endogenous.This substance would not be expected to be of safety concern.
Step B3. The highest estimated daily intake (calculated by the SPET) for theseven flavouring agents in structural class III are above the threshold of concern(i.e. 90 μg/person per day for class III). Accordingly, for all of these substances, dataare required on the substance or a closely related substance in order to perform asafety evaluation.
Consideration of flavouring agents with high exposure evaluated via the B-side of the decision-tree:
For cyclopropanecarboxylic acid (2-isopropyl-5-methyl-cyclohexyl)-amide(No. 2006), available data on the structurally related N-ethyl-2-isopropyl-5-methylcyclohexanecarboxamide (No. 1601) give a no-observed-adverse-effectlevel (NOAEL) of 8 mg/kg body weight (bw) per day from a 28-day study in rats(Miyata, 1995). This provides a margin of safety of about 2400 in relation to the
128 ALIPHATIC AND AROMATIC AMINES AND AMIDES (addendum)

highest estimated dietary exposure to No. 2006 (SPET = 200 μg/day) when usedas a flavouring agent.
For N-(2-(pyridin-2-yl)ethyl)-3-p-menthanecarboxamide (No. 2008), avail-able data give a NOAEL of 10 mg/kg bw per day from a 28-day study in rats (Eapen,2007). This provides a margin of safety of 250 in relation to the highest estimateddietary exposure to No. 2008 (SPET = 2400 μg/day) when used as a flavouringagent. The Committee noted that the margin of safety of No. 2008 based on theMSDI of 0.01 μg/day exceeds 60 million and concluded that the values of 250 (basedon the SPET) and greater than 60 million (based on the MSDI) provide an adequatemargin of safety.
For N-p-benzeneacetonitrile menthanecarboxamide (No. 2009), availabledata give a no-observed-effect level (NOEL) of 300 mg/kg bw per day from a 90-day study in rats (Eapen, 2006). This provides an adequate margin of safety of 6000in relation to the highest estimated dietary exposure to No. 2009 (SPET = 3000 μg/day) when used as a flavouring agent.
The Committee therefore concluded that these three flavouring agents,cyclopropanecarboxylic acid (2-isopropyl-5-methyl-cyclohexyl)-amide (No.2006), N-(2-(pyridin-2-yl)ethyl)-3-p-menthanecarboxamide (No. 2008) and N-p-benzeneacetonitrile menthanecarboxamide (No. 2009), would not pose a safetyconcern at current estimated dietary exposures.
For (±)-N-lactoyl tyramine (No. 2007), available data on the structurallyrelated nonanoyl 4-hydroxy-3-methoxybenzylamide (No. 1599) give a NOEL of 8.4mg/kg bw per day from a 90-day study in rats (Posternak, Linder & Vodoz, 1969).This provides a margin of safety of 25 in relation to the highest estimateddietary exposure to No. 2007 (SPET = 20 000 μg/day) when used as a flavouringagent. The NOELs for other structurally related flavouring agents, such asN-[2-(3,4-dimethoxy-phenyl)ethyl]-3,4-dimethoxycinnamic acid (No. 1777) or N-[(ethoxycarbonyl)methyl]-p-menthane-3-carboxamide (No. 1776), give similarly lowmargins of safety. The Committee therefore concluded that additional data on (±)-N-lactoyl tyramine (No. 2007) would be necessary to complete the safety evaluation.
For N-ethyl-2,2-diisopropylbutanamide (No. 2005), N-(2-hydroxyethyl)-2,3-dimethyl-2-isopropylbutanamide (No. 2010) and N-(1,1-dimethyl-2-hydroxy-ethyl)-2,2-diethylbutanamide (No. 2011), NOELs for these substances orstructurally related substances were not available. Therefore, for these threesubstances, the Committee concluded that additional data would be necessary tocomplete the safety evaluation. For these three substances, the previouslyconsidered substance, 2-isopropyl-N-2,3-trimethylbutyramide (No. 1595), isstructurally related; however, at the sixty-ninth meeting (Annex 1, reference 190),the Committee concluded that additional data would be necessary to complete theevaluation for this substance, and therefore this substance was not suitable tosupport the evaluation of these three flavouring agents.
Table 1 summarizes the evaluations of the nine aliphatic and aromaticamines and amides used as flavouring agents in this group (Nos 2003–2011).
ALIPHATIC AND AROMATIC AMINES AND AMIDES (addendum) 129

1.5 Consideration of combined intakes from use as flavouring agents
The safety assessment of possible combined intakes of flavouring agentswas based on the presence of common metabolites or a homologous series asproposed at the sixty-eighth meeting (Annex 1, reference 187) and using the MSDIexposure assessment as proposed at the sixty-ninth meeting (Annex 1, reference190).
This group of flavouring agents contains members of several homologous orclosely related series—namely, aliphatic primary amines, aliphatic tertiary amines,amines with an alkyl aromatic side-chain and aliphatic unsaturated amides. In theunlikely event that the flavouring agents in this group in any of these homologous,closely related series were to be consumed concurrently on a daily basis, theestimated combined intakes would be as shown in Table 3.
For the homologous or closely related series of aliphatic unsaturated amides,the combined intakes would exceed the threshold of concern (i.e. 90 μg/person perday for class III) in Europe, the USA and Japan. However, in this case, all of theflavouring agents are expected to be efficiently metabolized and would not saturateavailable detoxication pathways. Therefore, the combined intake of thesesubstances is not expected to raise any safety concerns.
Table 3. Combined dietary exposure for the homologous or closely relatedseries within this group of aliphatic and aromatic amines and amides used asflavouring agents
Homologous orclosely relatedseries
Substanceswith highest percapita dietaryexposure (Nos)
Structuralclass
Estimated combineddietary exposure inEurope, USA and Japan(μg/person per day)
Dietaryexposurerelative to thethreshold ofconcern forthat structuralclass
Aliphatic primaryamines
1582, 1584,1587, 1591,2004
I 160 (Europe), 21 (USA)and 1 (Japan)
Not exceeded
Aliphatic tertiaryamines
1610–1612,1614
I 195 (Japan) and 90(Europe and USA)
Not exceeded
Amines with analkyl aromaticside-chain
1589, 1590,1613
III 0.1 (Europe and USA) Not exceeded
Aliphaticunsaturatedamides
1596–1600,1779
III 102 (Japan) and 259(Europe and USA)
Exceeded
130 ALIPHATIC AND AROMATIC AMINES AND AMIDES (addendum)

1.6 Consideration of secondary components
Two flavouring agents in this group (Nos 2007 and 2009) have minimumassay values of less than 95%. The secondary components of (±)-N-lactoyltyramine (No. 2007) are lactic acid and ethyl lactate. Lactic acid (No. 930) isendogenous, and ethyl lactate (No. 931) is expected to be hydrolysed to lactic acid.These substances were evaluated at the fifty-seventh meeting of the Committee(Annex 1, reference 154) and concluded to be of no safety concern at estimateddietary exposures as flavouring agents. The secondary component of N-p-benzeneacetonitrile menthanecarboxamide (No. 2009) is N-p-benzeneacetonitrilementhanecarboxamide, (1R, 3S, 4S). This substance is a stereoisomer of No. 2009,is expected to share the same metabolic fate as the primary substance and is notconsidered to present a safety concern at current estimated dietary exposures.Information on the safety of the secondary components of these flavouring agentsis summarized in Annex 5.
1.7 Conclusion
In the previous evaluations of members of this group (Annex 1, references178, 187 and 190), studies of acute toxicity, short-term toxicity, long-term toxicityand carcinogenicity, genotoxicity and reproductive toxicity were available. Thetoxicity data available for the evaluation of these additional substances supportedthose from the previous evaluations.
The Committee concluded that five of the nine additional flavouring agentsevaluated at the present meeting do not raise any safety concerns at currentestimated dietary exposures. For one of the remaining four flavouring agents (No.2007), the available additional data did not provide an adequate margin of safety,and for the other three flavouring agents (Nos 2005, 2010 and 2011), no additionaldata were available. The Committee concluded that for these four flavouring agents,further data would be required to complete the safety evaluation.
2. RELEVANT BACKGROUND INFORMATION
2.1 Explanation
This monograph summarizes key aspects relevant to the safety evaluationof nine aliphatic and aromatic amines and amides, which are additions to a groupof 49 flavouring agents evaluated previously by the Committee at its sixty-fifth, sixty-eighth and sixty-ninth meetings (Annex 1, references 178, 187 and 190).
2.2 Additional considerations on intake
There is no additional information on estimated dietary exposures. Dietaryexposure estimates were made using the SPET in addition to the MSDI approach.
ALIPHATIC AND AROMATIC AMINES AND AMIDES (addendum) 131

2.3 Biological data
2.3.1 Biochemical data: absorption, distribution, metabolism and elimination
General information on the metabolism of the aliphatic and aromatic aminesand amides was previously provided in the reports of the sixty-fifth and sixty-eighthmeetings (Annex 1, references 178 and 187). Further information relevant to thesubstances considered in this report is provided below.
(a) Choline chloride (No. 2003)
Choline is endogenous to humans and other mammals. Choline and itsderivatives serve as precursors to acetylcholine and phospholipids. Choline alsoplays important roles in structural integrity of cell membranes, methyl metabolism,cholinergenic neurotransmission, transmembrane signalling and lipid and choles-terol transport and metabolism.
Dietary choline is absorbed primarily in the jejunum and, because it is watersoluble, enters the portal circulation (Sanford & Smyth, 1971; Flower et al., 1972;Kuczler, Nahrwold & Rose, 1977). The principal products of choline biodegradationare trimethylamine (Asatoor & Simenhoff, 1965) and betaine. The formation oftrimethylamine has been attributed to gut microflora, as markedly reducedtrimethylamine formation is observed in germ-free rats and antibiotic-sterilizedhuman guts or when choline is administered via intravenous injection (De La Huerga& Popper, 1951; De La Huerga, Popper & Steigmann, 1951; Prentiss et al., 1961;Zeisel, Wishnok & Blusztajn, 1983).
Choline is readily transformed into betaine by the actions of cholinedehydrogenase and betaine aldehyde dehydrogenase, which are present in the liver(Bernheim & Bernheim, 1938) and kidney (Bernheim & Bernheim, 1933). Somecholine is biotransformed into acetylcholine, a neurotransmitter, via cholineacetyltransferase and acetyl coenzyme A (Nachmansohn & Machado, 1943).Choline kinase, which is widely distributed in mammalian tissues, is responsible forthe phosphorylation of choline (Brophy et al., 1977).
A group of eight healthy male volunteers was provided a diet deficient incholine for 3 weeks, while a control group of seven healthy male volunteers wasprovided a diet with typical levels of choline (700 mg/day). During the first week ofthe study, the control and test groups were fed the same diet, including choline. Inweeks 2–4, the test group was provided the choline-deficient diet, and then at week5, both control and test groups were fed a diet providing typical levels of choline.For the test group, plasma choline and phosphatidylcholine levels dropped by 30%,while erythrocyte phosphatidylcholine levels dropped by 15%. For the test groupduring choline deprivation, the serum alanine aminotransferase activity increasedsteadily during the test period until choline was restored to the diet at week 5. Allother parameters were comparable to those of control volunteers (Zeisel et al.,1991).
132 ALIPHATIC AND AROMATIC AMINES AND AMIDES (addendum)

(b) (±)-N-Lactoyl tyramine (No. 2007)
Hydrolysis studies have been performed on (±)-N-lactoyl tyramine in vitrounder acid conditions and subsequently in both simulated gastric and intestinalconditions. In the initial experiment under acid conditions, a solution of 10 mg of (±)-N-lactoyl tyramine in 1 ml of 6 N DCl/D2O was prepared, and the hydrolytic reactionwas carried out at room temperature, followed by measuring 1H-nuclear magneticresonance after various reaction times. The experiment showed that (±)-N-lactoyltyramine was highly stable under acid conditions, as only a small percentage oflactic acid was observed after 19 h.
In the hydrolysis studies under simulated gastric fluid conditions,experiments were carried out in triplicate at 37 °C, with 1.6 ml of a 0.6 g/ml (±)-N-lactoyl tyramine solution in 50 ml of simulated gastric fluid, with or without theaddition of 0.6 g of pepsin. Following shaking (100 revolutions per minute [rpm]),1 ml samples were taken for analysis at 0, 1 and 3 h. Based on the results, presentedin Figure 1, it was determined that no significant hydrolysis of (±)-N-lactoyl tyramineoccurred in gastric conditions, either with or without pepsin.
In the hydrolysis study under simulated intestinal fluid conditions,experiments were carried out in triplicate at 37 °C, with 1.6 ml of a 0.6 g/ml (±)-N-lactoyl tyramine solution in 50 ml of simulated intestinal fluid, with or without theaddition of 0.5 g of pancreatin. Following shaking (100 rpm), 1 ml samples weretaken for analysis at 0, 1 and 15 h. Additional experiments were carried out in10 ml simulated intestinal fluid with 150 μl of 0.6 g/ml (±)-N-lactoyl tyramine and with0.25 g of peptidase or 10 μl Flavourzyme 1000L (a fungal complex of exopeptidasesand endoproteases), after which 1 ml samples were taken at 0, 1.5, 6 and 21 h.Based on the data shown in Figure 2, it was determined that no significant hydrolysisoccurred in simulated intestinal fluid or in simulated intestinal fluid with pancreatin.
These in vitro data support the conclusion that no significant hydrolysis of(±)-N-lactoyl tyramine occurs in the digestive or intestinal tract environment (Anon.,2006).
Figure 1. Metabolism of (±)-N-lactoyl tyramine in simulated gastric fluid (SGF)
ALIPHATIC AND AROMATIC AMINES AND AMIDES (addendum) 133
2.001.801.601.401.201.000.800.600.400.200.00
0 2 4time (h)
(+/-)-N-Lactoyl tyramine hydrolysis in SGF
SGF 37C no enzymeSGF 37C pepsin
% o
f pro
duct
deg
rade

In order to determine the metabolic fate of and identify potential detoxicationpathways for (±)-N-lactoyl tyramine (No. 2007), a metabolite profile following in vitroincubation with rat hepatocytes was performed. A liquid chromatography–photodiode array–mass spectrometry (LC-PDA-MS) method was developed toanalyse incubated samples containing (±)-N-lactoyl tyramine and its metabolites.The test material was incubated at a concentration of 10 μmol/l at 37 °C withSprague-Dawley rat hepatocytes for 1, 60 and 120 min in duplicate, and themetabolic activity of the hepatocytes was verified by measuring CYP-dependentand phase II enzymatic activities in the sample. An insignificant difference (3%) inviability between hepatocytes exposed to (±)-N-lactoyl tyramine and solvent controlindicated that the test substance was not cytotoxic at 10 μmol/l. The samples werecentrifuged for 5 min and subjected to LC-PDA-MS analysis. Two additional peakswere formed during the incubation of (±)-N-lactoyl tyramine with Sprague-Dawleyrat hepatocytes. One peak, with m/z 386, was identified as a glucuronic acidconjugate of (±)-N-lactoyl tyramine. The second peak, with m/z 301, could not beidentified, and it was questioned by the authors whether this compound was truly ametabolite of (±)-N-lactoyl tyramine, as essential structural features of the parentcompound were not reflected in the fragmentation pattern in this metabolite (Meerts,2007).
(c) N-p-benzeneacetonitrile menthanecarboxamide (No. 2009)
The potential for N-p-benzeneacetonitrile menthanecarboxamide (No. 2009)to metabolize and release cyanide after ingestion to levels above the humanbackground levels of cyanide (in the range of 3.5–106 μg/l) (Maehly & Swensson,1970; IPCS, 2004) has been examined. An in vitro metabolism experiment wasperformed in cryopreserved hepatocytes prepared from rat and human livers.Incubation of N-p-benzeneacetonitrile menthanecarboxamide was carried out with
Figure 2. Metabolism of (±)-N-lactoyl tyramine in simulated intestinal fluid(SIF)
134 ALIPHATIC AND AROMATIC AMINES AND AMIDES (addendum)
(SIF)
(+/-)-N-Lactoyl tyramine hydrolysis in SIF
SIF 37C no enzyme
SIF 37C pancreatine
SIF 37C intestinal peptidase
SIF 37C Flavourzyme
18.0016.0014.0012.0010.008.006.004.002.000.00
0 5 10 15 20 25
time (h)
% o
f hyd
roly
sis

hepatocytes (1 × 10⁶ cells/ml) suspended in 0.25 ml of Waymouth’s mediumsupplemented with fetal bovine serum, insulin, L-glutamine, sodium pyruvate anddexamethasone. Sodium thiosulfate (800 μmol/l) was added to the medium toensure that cyanide was trapped under conditions of the test system and wasenzymatically transformed to thiocyanate (NCS–). The medium was saturated witha 95:5 mixture of oxygen and carbon dioxide. The incubation temperature was 37± 1 °C, and the atmosphere was a 95:5 mixture of air and carbon dioxide at 95%humidity. Cyanide release was evaluated over a range of concentrations of N-p-benzeneacetonitrile menthanecarboxamide (0, 50, 150 and 250 μmol/l). After 0, 1,2 and 4 h of incubation, the reactions were stopped by centrifugation. Incubationsof N-p-benzeneacetonitrile menthanecarboxamide with boiled hepatocytes atconcentrations of 0, 50, 150 and 250 μmol/l were used to distinguish between actualmetabolites and chemical degradation products. Positive control incubations werecarried out with hepatocytes in which the test article was replaced with one of twopositive controls (sodium cyanide and benzyl cyanide) to determine if thehepatocytes were metabolically competent for this type of compound. Viability ofthe hepatocytes was determined in the presence and absence of test articles andpositive controls at each time point by Trypan Blue exclusion.
Per cent viability patterns were consistent between rat and humanhepatocytes, although the human cells showed better viability overall. N-p-Benzeneacetonitrile menthanecarboxamide did not appear to cause significant celldeath in rat or human hepatocytes at 250 μmol/l. Sodium cyanide showed sometoxicity over the 4 h time frame of the experiment in rat and human hepatocytes at150 μmol/l. However, at 250 μmol/l, benzyl cyanide showed dramatic toxicity at both0 and 4 h in rat and human hepatocytes; at 150 μmol/l in human hepatocytes,survival was improved, but still low at 4 h.
Control samples without any N-p-benzeneacetonitrile menthanecarbox-amide in rat and human hepatocytes showed a small increase in thiocyanate levelswith time. As there was no external source of cyanide, this was determined to beattributable to metabolism of endogenous cyanide. N-p-Benzeneacetonitrilementhanecarboxamide at 250 μmol/l in rat and human hepatocytes also showeda small increase in thiocyanate levels with time. These levels of thiocyanate werenot different from background and much lower than levels observed with thepositive controls. Sodium cyanide and benzyl cyanide (positive controls) at 50 and150 μmol/l, respectively, in rat hepatocytes and 150 and 250 μmol/l, respectively,in human hepatocytes showed an increase in thiocyanate levels with time, indicatingthat cyanide is released in these test systems and metabolically transformed tothiocyanate (Table 4). N-p-Benzeneacetonitrile menthanecarboxamide at 0 and250 μmol/l in boiled rat and human hepatocytes showed no increase in thiocyanatelevels with time, confirming that measured increases in thiocyanate levels with theother samples were attributable to the metabolism of sodium cyanide and benzylcyanide.
In conclusion, thiocyanate levels from N-p-benzeneacetonitrile menthane-carboxamide are low and do not increase during 4 h of incubation at 250 μmol/l withrat or human hepatocytes, indicating that little or no cyanide is released. Themaximum test concentration for N-p-benzeneacetonitrile menthanecarboxamide
ALIPHATIC AND AROMATIC AMINES AND AMIDES (addendum) 135
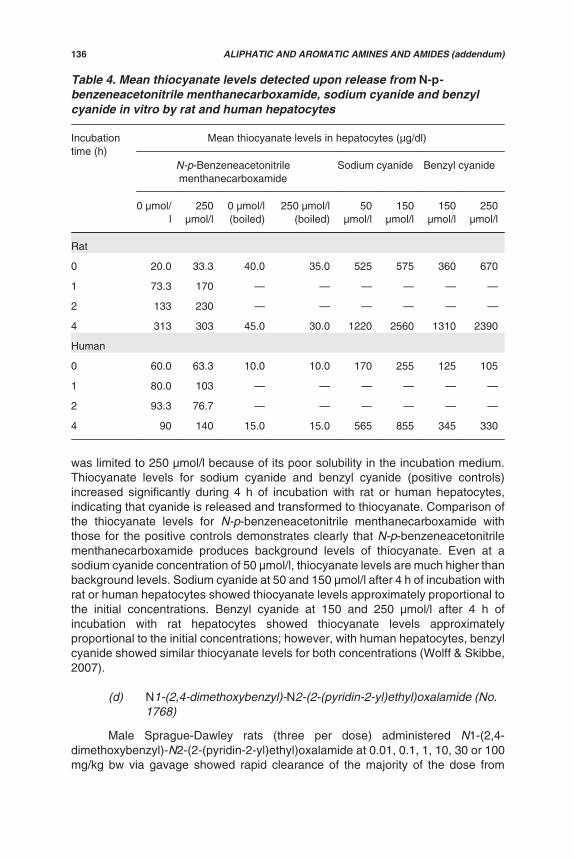
was limited to 250 μmol/l because of its poor solubility in the incubation medium.Thiocyanate levels for sodium cyanide and benzyl cyanide (positive controls)increased significantly during 4 h of incubation with rat or human hepatocytes,indicating that cyanide is released and transformed to thiocyanate. Comparison ofthe thiocyanate levels for N-p-benzeneacetonitrile menthanecarboxamide withthose for the positive controls demonstrates clearly that N-p-benzeneacetonitrilementhanecarboxamide produces background levels of thiocyanate. Even at asodium cyanide concentration of 50 μmol/l, thiocyanate levels are much higher thanbackground levels. Sodium cyanide at 50 and 150 μmol/l after 4 h of incubation withrat or human hepatocytes showed thiocyanate levels approximately proportional tothe initial concentrations. Benzyl cyanide at 150 and 250 μmol/l after 4 h ofincubation with rat hepatocytes showed thiocyanate levels approximatelyproportional to the initial concentrations; however, with human hepatocytes, benzylcyanide showed similar thiocyanate levels for both concentrations (Wolff & Skibbe,2007).
(d) N1-(2,4-dimethoxybenzyl)-N2-(2-(pyridin-2-yl)ethyl)oxalamide (No.1768)
Male Sprague-Dawley rats (three per dose) administered N1-(2,4-dimethoxybenzyl)-N2-(2-(pyridin-2-yl)ethyl)oxalamide at 0.01, 0.1, 1, 10, 30 or 100mg/kg bw via gavage showed rapid clearance of the majority of the dose from
Table 4. Mean thiocyanate levels detected upon release from N-p-benzeneacetonitrile menthanecarboxamide, sodium cyanide and benzylcyanide in vitro by rat and human hepatocytes
Incubationtime (h)
Mean thiocyanate levels in hepatocytes (μg/dl)
N-p-Benzeneacetonitrilementhanecarboxamide
Sodium cyanide Benzyl cyanide
0 μmol/l
250μmol/l
0 μmol/l(boiled)
250 μmol/l(boiled)
50μmol/l
150μmol/l
150μmol/l
250μmol/l
Rat
0 20.0 33.3 40.0 35.0 525 575 360 670
1 73.3 170 — — — — — —
2 133 230 — — — — — —
4 313 303 45.0 30.0 1220 2560 1310 2390
Human
0 60.0 63.3 10.0 10.0 170 255 125 105
1 80.0 103 — — — — — —
2 93.3 76.7 — — — — — —
4 90 140 15.0 15.0 565 855 345 330
136 ALIPHATIC AND AROMATIC AMINES AND AMIDES (addendum)

serum within 4–24 h post-administration. With all dosed groups except for the100 mg/kg bw group, the serum concentration of N1-(2,4-dimethoxybenzyl)-N2-(2-(pyridin-2-yl)ethyl)oxalamide was below the limit of detection between 24 and 48 h.The time to maximum serum concentration (Tmax) across all groups was 0.3 h,demonstrating the rapid clearance. Similarly, when male Sprague-Dawley rats wereinjected intraperitoneally with N1-(2,4-dimethoxybenzyl)-N2-(2-(pyridin-2-yl)ethyl)-oxalamide at 0.1 mg/kg bw, the serum levels of the test material were cleared withinthe first 8 h post-injection and below the limit of detection at 24 h (Ikeda, 2008a).
Male Beagle dogs (three per dose) administered N1-(2,4-dimethoxybenzyl)-N2-(2-(pyridin-2-yl)ethyl)oxalamide at 0, 0.01, 0.1, 1, 10, 30 or 100 mg/kg bw viagavage also showed efficient clearance of the majority of the test material from theserum within the first 24 h. The Tmax across all of the groups ranged from 1 to 2 h,demonstrating rapid clearance. The group of male Beagle dogs administered N1-(2,4-dimethoxybenzyl)-N2-(2-(pyridin-2-yl)ethyl)oxalamide at 0.1 mg/kg bw by intra-peritoneal injection also showed rapid clearance of the test material from the serumin the first 24 h, dropping below the limit of detection by 48 h (Ikeda, 2008b).
Eight healthy male volunteers consumed gelatine capsules providing N1-(2,4-dimethoxybenzyl)-N2-(2-(pyridin-2-yl)ethyl)oxalamide doses of 0.01 mg/kg bwor 0.02 mg/kg bw, and blood samples were taken at 5, 15 and 30 min and 1, 2, 3,4, 6, 8 and 24 h. The N1-(2,4-dimethoxybenzyl)-N2-(2-(pyridin-2-yl)ethyl)oxalamidewas well absorbed following oral administration, and the peak plasma concentrationwas observed at 4 h post-ingestion. The plasma concentration returned to baselinelevels by 24 h post-ingestion (Ikeda, 2008c).
When comparing the three studies, Ikeda (2008c) concluded that clearanceof N1-(2,4-dimethoxybenzyl)-N2-(2-(pyridin-2-yl)ethyl)oxalamide from the serumwhen administered via gavage followed the order rat > dog > human.
2.3.2 Toxicological studies
(a) Acute toxicity
Oral median lethal doses (LD50 values) have been reported for four of thenine flavouring agents in this group and are summarized in Table 5. In rats, anLD50 of 550 mg/kg bw has been reported for N-ethyl-2,2-diisopropylbutanamide (No.2005), whereas LD50 values of >2000 mg/kg bw have been reported forcyclopropanecarboxylic acid (2-isopropyl-5-methyl-cyclohexyl)-amide (No. 2006),N-(2-(pyridin-2-yl)ethyl)-3-p-menthanecarboxamide (No. 2008) and N-p-benzeneacetonitrile menthanecarboxamide (No. 2009) (Mallory, 2004; Findlay,2006; Moore & Groom, 2006; Vaeth, 2007).
These data indicate that the acute oral toxicity of these aliphatic and aromaticamides is low.
(b) Short-term studies of toxicity
Results of short-term studies of toxicity are available for N-(2-(pyridin-2-yl)-ethyl)-3-p-menthanecarboxamide (No. 2008), N-p-benzeneacetonitrile menthane-
ALIPHATIC AND AROMATIC AMINES AND AMIDES (addendum) 137

carboxamide (No. 2009) and N1-(2,4-dimethoxybenzyl)-N2-(2-(pyridin-2-yl)ethyl)-oxalamide (No. 1768). They are summarized in Table 6 and described below.
(i) N-(2-(Pyridin-2-yl)ethyl)-3-p-menthanecarboxamide (No. 2008)
In a 28-day subchronic toxicity study, male and female Crl:CD(SD) rats (fiveof each sex per group) were fed a diet that provided N-(2-(pyridin-2-yl)ethyl)-3-p-menthanecarboxamide (No. 2008) at dose levels of 0 (control), 100, 300 or 1000mg/kg bw per day. Animal survival, clinical condition, detailed physical and arenaobservations, sensory reactivity, grip strength, motor activity, body weight, foodconsumption, haematology, blood chemistry, urinalysis, organ weight, macroscopicobservations and microscopic histopathological investigations were used to assesspotential toxicity. Overall body weight gains (days 1–28) for treated males andfemales were reduced when compared with those of the controls. This was the resultof an initial suppression of weight gain over the first few days of the study. Bodyweight gains during the recovery (R) period (days R1–R14) for previously treatedanimals were similar to those of controls. Food consumption for week 1 was reducedfor males receiving 300 or 1000 mg/kg bw per day. Food intake for these animalsremained slightly reduced for weeks 2–4 of treatment (but not dose related) and forpreviously treated males in weeks R1 and R2. The appearance and behaviour ofthe animals were unaffected by treatment. Haematological investigations on day 29of treatment revealed slightly reduced haemoglobin concentration in males andfemales receiving 1000 mg/kg bw per day. Platelet counts were increased for malesreceiving 100, 300 or 1000 mg/kg bw per day. Activated partial thromboplastin timewas prolonged for males receiving 1000 mg/kg bw per day. Investigations on day15 of the recovery period revealed that the mean haemoglobin concentration forpreviously treated males and the haematocrit, haemoglobin and red blood cellvalues for previously treated females were still reduced. Biochemical investigationson day 29 of treatment revealed reduced alkaline phosphatase activity for all treated
Table 5. Results of oral acute toxicity studies with aliphatic and aromaticamides used as flavouring agents
No. Flavouring agent Species; sex LD50 (mg/kg bw)
Reference
2005 N-Ethyl-2,2-diisopropylbutanamide Rat; F 550 Findlay (2006)
2006 Cyclopropanecarboxylic acid (2-isopropyl-5-methyl-cyclohexyl)-amide
Rat; F >2000 Vaeth (2007)
2008 N-(2-(Pyridin-2-yl)ethyl)-3-p-menthanecarboxamide
Rat; F >300 Moore & Groom(2006)
2008 N-(2-(Pyridin-2-yl)ethyl)-3-p-menthanecarboxamide
Rat; F >2000 Moore & Groom(2006)
2009 N-p-Benzeneacetonitrilementhanecarboxamide
Rat; M, F >2000 Mallory (2004)
F, female; M, male
138 ALIPHATIC AND AROMATIC AMINES AND AMIDES (addendum)

female groups and reduced aspartate aminotransferase activity for femalesreceiving 300 or 1000 mg/kg bw per day. Bilirubin levels were reduced for malesand females receiving 300 and 1000 mg/kg bw per day. Cholesterol and triglycerideconcentrations were increased for all treated male groups and females receiving300 or 1000 mg/kg bw per day. In addition, females receiving 1000 mg/kg bw perday had increased glucose values. Sodium and phosphorus concentrations werereduced for males receiving 1000 mg/kg bw per day, calcium concentrations wereincreased for males and females receiving 300 or 1000 mg/kg bw per day andincreased potassium levels were recorded for both sexes at 1000 mg/kg bw per day.Total protein concentration, mainly due to globulin, was slightly increased in femalesreceiving 300 or 1000 mg/kg bw per day, resulting in a corresponding decrease inalbumin to globulin ratio. Investigations on day 15 of the recovery period revealedthat, with the exception of triglyceride values in females (which did show a gooddegree of resolution), the above-mentioned differences were no longer evident.Urinalysis during week 4 revealed reduced protein concentrations and pH levels formales receiving 1000 mg/kg bw per day. These changes were no longer apparentduring week 2 of the recovery period.
Table 6. Results of short-term studies of toxicity for aliphatic and aromaticamides used as flavouring agents
No. Flavouring agent Species;sex
No. of testgroupsa/
no. pergroupb
Route Duration(days)
NOAEL(mg/kgbw per
day)
Reference
2008 N-(2-(Pyridin-2-yl)-ethyl)-3-p-menthanecarboxamide
Rat; M, F 3/10 Diet 28 100c Chase(2006)
2008 N-(2-(Pyridin-2-yl)-ethyl)-3-p-menthanecarboxamide
Rat; M, F 3/16 Diet 28 10 Eapen(2007)
2009 N-p-Benzeneacetonitrilementhanecarboxamide
Rat; M, F 2/20d
1/30e
Diet 91 300 Eapen(2006)
1768 N1-(2,4-dimethoxybenzyl)-N2-(2-(pyridin-2-yl)ethyl)-oxalamide
Dog; M, F 3/8 Oral 90 30 Hopson(2008)
F, female; M, malea Total number of test groups does not include control animals.b Total number per test group includes both male and female animals.c Lowest dose tested. A true NOAEL could not be established owing to the presence of fatty
vacuolation in the liver at all dose levels.d For dose levels of 100 and 300 mg/kg bw per day.e For dose level of 1000 mg/kg bw per day.
ALIPHATIC AND AROMATIC AMINES AND AMIDES (addendum) 139

Liver weights were increased for males and females that received 100, 300or 1000 mg/kg bw per day, and spleen weights were slightly increased for femalesthat received 300 or 1000 mg/kg bw per day. At the end of the recovery period, liverweights for previously treated females were still slightly increased. Dark or enlargedlivers were observed for males and females that received 300 or 1000 mg/kg bwper day. Pale areas were also seen in the liver of males and females that received100, 300 or 1000 mg/kg bw per day. There were no liver changes seen oncompletion of the 2-week recovery period. Centrilobular hepatocyte hypertrophywas seen in males and females that received 100, 300 or 1000 mg/kg bw per day.For males, this was associated with hepatocyte cytoplasmic fat vacuolation, mainlyin the midzonal region. Following the 2-week recovery period, centrilobularhepatocyte hypertrophy (minimal) was recorded in one out of five males previouslyreceiving 1000 mg/kg bw per day, and increased hepatocyte cytoplasmicvacuolation (minimal or slight) was recorded in two out of five. For females, therewas no evidence of centrilobular hepatocyte hypertrophy following the 2-weekrecovery period. Follicular cell hypertrophy in the thyroid gland was seen in malesand females that received 100, 300 or 1000 mg/kg bw per day. Following the 2-week recovery period, follicular cell hypertrophy (minimal) was noted in two out offive males previously receiving 1000 mg/kg bw per day. There was no evidence offollicular cell hypertrophy in females following the 2-week recovery period.
In summary, dietary administration of N-(2-(pyridin-2-yl)ethyl)-3-p-menthane-carboxamide to CD rats for 4 weeks at doses of 100, 300 and 1000 mg/kg bw perday was generally well tolerated, although treatment-related changes were detectedin the liver and thyroid. The follicular cell hypertrophy in the thyroid at 100, 300 and1000 mg/kg bw per day is considered secondary to the liver hepatocyte hypertrophy.The majority of changes present at termination had resolved or showed partialrecovery after a 2-week period without treatment. However, owing to the presenceof fatty vacuolation in the liver at all dose levels, a NOAEL could not be establishedin this study (Chase, 2006).
In a second study at lower dose levels, three groups of CD rats (eight of eachsex per group) received N-(2-(pyridin-2-yl)ethyl)-3-p-menthanecarboxamide via thediet at doses of 10, 50 or 300 mg/kg bw per day. A control group of eight male andfive female rats received basal diet throughout the treatment period. During thestudy, body weight, food consumption, clinical condition, detailed physical andarena observations, sensory reactivity, grip strength, motor activity, haematology,blood chemistry, special chemistry (triiodothyronine [T3], thyroxine [T4], thyroidstimulating hormone [TSH], reverse T3), urinalysis, organ weight, macroscopicobservations and microscopic histopathological investigations were conducted andsubsequently used to assess potential toxicity. All rats survived to the schedulednecropsy. There were no clear differences in final body weights between groups.There were no treatment-related effects on haematological parameters. However,some statistically significant (P < 0.05 or P < 0.01 using Dunnett’s test) differenceswere observed when the control and treated groups were compared. These findingsincluded lower absolute monocyte counts in the 10 and 50 mg/kg bw per day groupmales; however, these group mean differences were not considered to be treatmentrelated, because the values did not show a dose-related response and were not of
140 ALIPHATIC AND AROMATIC AMINES AND AMIDES (addendum)

a magnitude that would be considered to be toxicologically significant. Treatment-related changes in serum chemistry parameters found on day 28 included highertotal protein, albumin and globulin in the 300 mg/kg bw per day group males; highercholesterol in the 300 mg/kg bw per day group males and females; lowertriglycerides in the 300 mg/kg bw per day group males; higher total T3 in the 300mg/kg bw per day group males and females and the 50 mg/kg bw per day groupfemales; and higher TSH in the 50 and 300 mg/kg bw per day group males. Therewere no treatment-related effects on urinalysis parameters that were considered tobe toxicologically significant.
Macroscopic changes that could be attributed to treatment were notobserved during the primary necropsy. Upon histopathological examination, one ofthe eight males in the 300 mg/kg bw per day group had mild centrilobularhepatocellular hypertrophy. Males and females in the 300 mg/kg bw per day grouphad minimal or mild follicular cell hypertrophy of the thyroid gland. One male in the50 mg/kg bw per day group had mild follicular cell hypertrophy of the thyroid gland.
In conclusion, dietary administration of N-(2-(pyridin-2-yl)ethyl)-3-p-men-thanecarboxamide to CD rats for 4 weeks at doses of 10, 50 and 300 mg/kg bw perday was generally well tolerated. Treatment-related changes were detected in theliver and thyroid. The follicular cell hypertrophy in the thyroid at 50 and 300 mg/kgbw per day is considered to be associated with the liver hepatocyte hypertrophy.Therefore, the NOAEL was determined to be 10 mg/kg bw per day under theconditions of this study (Eapen, 2007).
(ii) N-p-Benzeneacetonitrile menthanecarboxamide (No. 2009)
In a 90-day subchronic toxicity study, male and female Crl:CD(SD) rats werefed a diet providing N-p-benzeneacetonitrile menthanecarboxamide at doses of 0(control), 100, 300 or 1000 mg/kg bw per day for 90 consecutive days. Animalsurvival, clinical condition, body weight, food consumption, haematology, bloodchemistry, urinalysis, organ weight, macroscopic observations and microscopichistopathological investigations were used to assess potential toxicity. All male andfemale rats survived until the scheduled primary and recovery necropsies. Thefemales administered 1000 mg/kg bw per day exhibited a slightly higher meanmethaemoglobin value at study week 13. This minor change was not believed to beadverse owing to the very low magnitude of the difference, its occurrence within thereference range (0.0–1.6%) and the complete recovery by study week 17. Therewere no other treatment-related effects on haematology data in males or females.However, some statistically significant (P < 0.05 or 0.01 using Dunnett’s test)differences were observed when the control and treatment groups were compared.These findings included haemoglobin, monocyte percentage, large unstained cellpercentage and absolute counts in the males at study week 17; absolute monocytecounts in the 1000 mg/kg bw per day group males; haemoglobin and haematocritin treated female groups; red cell count in the 100 mg/kg bw per day group females;and mean corpuscular volume, absolute neutrophil count, absolute monocyte countand large unstained cell count in the females at study week 17. These group meandifferences were not considered to be treatment related, because the values did not
ALIPHATIC AND AROMATIC AMINES AND AMIDES (addendum) 141
show a dose-related response and were of a magnitude that was not considered tobe toxicologically significant.
Cholesterol and potassium levels were slightly higher in the 300 and 1000mg/kg bw per day group males at study week 13, but the increases were notconsidered to be toxicologically significant. Except for aspartate aminotransferaseactivity in the 300 mg/kg bw per day group females, alanine and aspartateaminotransferase activities were statistically significantly lower in all test article–treated female groups at study week 13. Triglyceride levels were statisticallysignificantly lower at study week 13 in the 300 and 1000 mg/kg bw per day groupfemales. The changes in aspartate aminotransferase and alanine aminotransferaseactivities and triglyceride levels were not believed to be adverse, as slight loweringof these values is of no known toxicological importance. All of the aforementionedserum chemistry changes recovered by study week 17. There were no othertreatment-related effects on serum chemistry end-points. However, somestatistically significant (P < 0.05 or 0.01 using Dunnett’s test) differences wereobserved when the control and treatment groups were compared. These findingsincluded aspartate aminotransferase activity in the 300 mg/kg bw per day groupmales; phosphorus and sodium concentrations in the males at study week 17; andalbumin to globulin ratio in the females at study week 17. These group meandifferences were not considered to be test article related, because the valuesshowed an effect at lower but not higher doses or occurred only at the recoveryinterval. There were no treatment-related effects or statistically significant findingsfor urinalysis end-points.
There were no organ weight changes in the spleen of rats from the 90-daystudy. However, liver weights (relative to body weight) in male and female ratsadministered 300 or 1000 mg/kg bw per day were marginally increased in astatistically significant manner, probably associated with hepatic enzyme induction.At the primary necropsy, absolute brain weight was lower in female rats in the 100mg/kg bw per day group only. Following the recovery period, heart weight (relativeto body weight) of male rats in the 1000 mg/kg bw per day group was higher,whereas the absolute heart and relative (to body and brain weights) heart weightvalues were lower in female cohorts. In addition, these females also exhibited lowervalues for the ovary (absolute) and thymus (absolute and relative to body or brainweight) weights relative to the control group. However, these differences in absoluteweights and relative to body or brain weight ratios were discordant, or the doseassociation was incoherent with no histological correlates; thus, these organ weightchanges were considered to be of no toxicological significance. There were notreatment-related histological changes in rats examined after the primary andrecovery necropsies. Histological changes encountered were considered to beincidental findings, manifestations of spontaneous diseases or related to someaspect of experimental manipulation other than administration of the test article.There was no treatment-related alteration in the incidence, severity or histologicalcharacter of those incidental and spontaneous tissue alterations.
142 ALIPHATIC AND AROMATIC AMINES AND AMIDES (addendum)

In conclusion, administration of N-p-benzeneacetonitrile menthanecar-boxamide via the diet to Crl:CD(SD) rats at doses of 100, 300 or 1000 mg/kg bwper day for 90 days was well tolerated with no clinical signs of toxicity or mortality.Based on clinical pathology, organ weight and morphological pathology data, theNOAEL was 300 mg/kg bw per day in this study (Eapen, 2006).
(iii) N1-(2,4-Dimethoxybenzyl)-N2-(2-(pyridin-2-yl)ethyl)oxalamide(No. 1768)
In a 90-day oral toxicity study, Beagle dogs (four of each sex per group) wereprovided a daily oral capsule delivering 0, 10, 30 or 100 mg/kg bw. Parametersrecorded included survival, clinical observation, body weight, food consumption,ophthalmic and electrocardiogram examinations, clinical pathology, organ weightsand macroscopic and microscopic pathology.
There were no treatment-related changes in clinical observations, bodyweight, food consumption, electrocardiogram examination, haematology,coagulation or urine chemistry parameters. The 100 mg/kg bw per day femalegroups showed a decrease in mean body weight relative to controls. One male inthe 100 mg/kg bw per day group was found moribund on day 15. He presentedocular opacity, body weight loss and hypoactive behaviour on day 14. On day 15,the condition had deteriorated, with the addition of a jaundiced appearance. Theanimal was euthanized and at necropsy showed hepatotoxicity, evidenced byhepatocellular degeneration/necrosis, bile stasis and a neutrophilic infiltrate of theliver. Another male in the high intake group showed similar ocular opacity on day15 and was removed from treatment for 4 days while blood samples were collectedand analysed. The clinical pathology data for both animals indicated elevatedalanine aminotransferase and alkaline phosphatase activities and total bilirubinlevels. The second animal’s condition improved, with no recurrence of the clinicalsigns, and dosing resumed on day 19. Liver weight parameters were increased inthe males (significantly) and females given 100 mg/kg bw per day and females given30 mg/kg bw per day compared with controls. Microscopically, moderateperivascular extramedullary granulopoiesis (males only) or increased vacuolationof hepatocytes may have contributed to the increased liver weight in these dosegroups. A treatment relationship is possible for the perivascular extramedullarygranulopoiesis but is less certain with regard to the vacuolation.
The NOAEL was 30 mg/kg bw per day based on the adverse liver findingsin the 100 mg/kg bw male group and unscheduled death (Hopson, 2008).
(c) Genotoxicity studies
In vitro and in vivo genotoxicity testing has been performed on five flavouringagents in this group. The results of these studies are summarized in Table 7 anddescribed below.
ALIPHATIC AND AROMATIC AMINES AND AMIDES (addendum) 143

Tabl
e 7.
Res
ults
of g
enot
oxic
ity s
tudi
es w
ith th
e al
ipha
tic a
nd a
rom
atic
am
ines
and
am
ides
use
d as
flav
ouri
ng a
gent
s
No.
Fla
vour
ing
agen
tE
nd-p
oint
Tes
t obj
ect
Con
cent
ratio
nR
esul
tsR
efer
ence
In v
itro
2005
N-E
thyl
-2,2
-diis
opro
pylb
utan
amid
eR
ever
se m
utat
ion
Sal
mon
ella
typh
imur
ium
TA
98,
TA
100,
TA
1535
,T
A15
37
25, 5
0, 1
00, 2
50, 5
00,
1000
, 250
0 an
d50
00 μ
g/pl
ate
Neg
ativ
eaW
ells
(20
06)
2005
N-E
thyl
-2,2
-diis
opro
pylb
utan
amid
eR
ever
se m
utat
ion
S. t
yphi
mur
ium
TA
98,
TA
100,
TA
1535
,T
A15
37
100,
250
, 500
, 100
0, 2
500
and
5000
μg/
plat
eN
egat
ivea,
b,c
Wel
ls (
2006
)
2005
N-E
thyl
-2,2
-diis
opro
pylb
utan
amid
eR
ever
se m
utat
ion
Esc
heric
hia
coli
WP
2uv
rA p
KM
101
25, 5
0, 1
00, 2
50, 5
00,
1000
, 250
0 an
d50
00 μ
g/pl
ate
Neg
ativ
eaW
ells
(20
06)
2005
N-E
thyl
-2,2
-diis
opro
pylb
utan
amid
eR
ever
se m
utat
ion
E. c
oli W
P2
uvrA
pKM
101
100,
250
, 500
, 100
0, 2
500
and
5000
μg/
plat
eN
egat
ivea,
b,c
Wel
ls (
2006
)
2006
Cyc
lopr
opan
ecar
boxy
lic a
cid
(2-
isop
ropy
l-5-m
ethy
l-cyc
lohe
xyl)-
amid
e
Rev
erse
mut
atio
nS
. typ
him
uriu
m T
A98
,T
A10
0, T
A10
2,T
A15
35, T
A15
37
10, 3
1.6,
100
, 316
and
1000
μg/
plat
eN
egat
ivea,
dA
ugus
t (20
07)
2006
Cyc
lopr
opan
ecar
boxy
lic a
cid
(2-
isop
ropy
l-5-m
ethy
l-cyc
lohe
xyl)-
amid
e
Rev
erse
mut
atio
nS
. typ
him
uriu
m T
A98
,T
A10
0, T
A10
2,T
A15
35, T
A15
37
10, 3
1.6,
100
, 316
and
1000
μg/
plat
eN
egat
ivea,
b,d
Aug
ust (
2007
)
2007
(±)-
N-L
acto
yl ty
ram
ine
Rev
erse
mut
atio
nS
. typ
him
uriu
m T
A98
,T
A10
0, T
A15
35,
TA
1537
100,
333
, 100
0, 3
330
and
5000
μg/
plat
eN
egat
ivea
Sik
kele
rus
(200
5)
144 ALIPHATIC AND AROMATIC AMINES AND AMIDES (addendum)

Tabl
e 7
(con
td)
No.
Fla
vour
ing
agen
tE
nd-p
oint
Tes
t obj
ect
Con
cent
ratio
nR
esul
tsR
efer
ence
2007
(±)-
N-L
acto
yl ty
ram
ine
Rev
erse
mut
atio
nE
. col
i WP
2 uv
rA3,
10,
33,
100
, 333
,10
00, 3
330
and
5000
μg/
plat
e
Neg
ativ
eaS
ikke
leru
s (2
005)
2007
(±)-
N-L
acto
yl ty
ram
ine
For
war
d m
utat
ion
L517
8Y T
K+
/ m
ouse
lym
phom
a ce
lls1,
3, 1
0, 3
3, 1
00, 3
33,
1000
and
195
2 μg
/ml
Neg
ativ
ea,e
Bus
kens
(20
05)
2007
(±)-
N-L
acto
yl ty
ram
ine
For
war
d m
utat
ion
L517
8Y T
K+
/ m
ouse
lym
phom
a ce
lls1,
3, 1
0, 3
3, 1
00, 3
33,
1000
and
195
2 μg
/ml
Pos
itive
a,f,g
Bus
kens
(20
05)
2008
N-(
2-(P
yrid
in-2
-yl)e
thyl
)-3-
p-m
enth
anec
arbo
xam
ide
Rev
erse
mut
atio
nS
. typ
him
uriu
m T
A98
,T
A10
0, T
A15
35,
TA
1537
5, 1
5, 5
0, 1
50, 5
00, 1
500
and
5000
μg/
plat
eN
egat
ivea,
hM
ay (
2007
)
2008
N-(
2-(P
yrid
in-2
-yl)e
thyl
)-3-
p-m
enth
anec
arbo
xam
ide
Rev
erse
mut
atio
nS
. typ
him
uriu
m T
A98
,T
A10
0, T
A15
35,
TA
1537
50, 1
50, 5
00, 1
500
and
5000
μg/
plat
eN
egat
ivea,
b,h
May
(20
07)
2008
N-(
2-(P
yrid
in-2
-yl)e
thyl
)-3-
p-m
enth
anec
arbo
xam
ide
Rev
erse
mut
atio
nE
. col
i WP
2 uv
rApK
M10
150
, 150
, 500
, 150
0 an
d50
00 μ
g/pl
ate
Neg
ativ
ea,h
May
(20
07)
2008
N-(
2-(P
yrid
in-2
-yl)e
thyl
)-3-
p-m
enth
anec
arbo
xam
ide
Rev
erse
mut
atio
nE
. col
i WP
2 uv
rApK
M10
150
, 150
, 500
, 150
0 an
d50
00 μ
g/pl
ate
Neg
ativ
ea,b,
hM
ay (
2007
)
2008
N-(
2-(P
yrid
in-2
-yl)e
thyl
)-3-
p-m
enth
anec
arbo
xam
ide
Chr
omos
omal
aber
ratio
nH
uman
lym
phoc
ytes
260,
280
and
300
μg/
mli
100,
200
and
300
μg/
mlj
Neg
ativ
eM
ason
(20
07)
ALIPHATIC AND AROMATIC AMINES AND AMIDES (addendum) 145

Tabl
e 7
(con
td)
No.
Fla
vour
ing
agen
tE
nd-p
oint
Tes
t obj
ect
Con
cent
ratio
nR
esul
tsR
efer
ence
2008
N-(
2-(P
yrid
in-2
-yl)e
thyl
)-3-
p-m
enth
anec
arbo
xam
ide
Chr
omos
omal
aber
ratio
nH
uman
lym
phoc
ytes
25, 5
0 an
d 16
0 μg
/mlk
Neg
ativ
eM
ason
(20
07)
2009
N-p
-Ben
zene
acet
onitr
ilem
enth
anec
arbo
xam
ide
Rev
erse
mut
atio
nS
. typ
him
uriu
m T
A98
,T
A10
0, T
A15
35,
TA
1537
3, 1
0, 3
3, 1
00, 3
33,
1000
, 250
0 an
d50
00 μ
g/pl
ate
Neg
ativ
eaS
okol
owsk
i (20
04)
2009
N-p
-Ben
zene
acet
onitr
ilem
enth
anec
arbo
xam
ide
Rev
erse
mut
atio
nS
. typ
him
uriu
m T
A98
,T
A10
0, T
A15
35,
TA
1537
33, 1
00, 3
33, 1
000,
250
0an
d 50
00 μ
g/pl
ate
Neg
ativ
ea,b
Sok
olow
ski (
2004
)
2009
N-p
-Ben
zene
acet
onitr
ilem
enth
anec
arbo
xam
ide
Rev
erse
mut
atio
nE
. col
i WP
2uv
rApK
M10
13,
10,
33,
100
, 333
,10
00, 2
500
and
5000
μg/
plat
e
Neg
ativ
eaS
okol
owsk
i (20
04)
2009
N-p
-Ben
zene
acet
onitr
ilem
enth
anec
arbo
xam
ide
Rev
erse
mut
atio
nE
. col
i WP
2uv
rApK
M10
133
, 100
, 333
, 100
0, 2
500
and
5000
μg/
plat
eN
egat
ivea,
bS
okol
owsk
i (20
04)
2009
N-p
-Ben
zene
acet
onitr
ilem
enth
anec
arbo
xam
ide
Chr
omos
omal
aber
ratio
nH
uman
lym
phoc
ytes
746.
08, 1
492.
15 a
nd29
84.3
μg/
mli
373.
04, 1
492.
15 a
nd29
84.3
μg/
mlj
Neg
ativ
eB
owen
(20
06)
2009
N-p
-Ben
zene
acet
onitr
ilem
enth
anec
arbo
xam
ide
Chr
omos
omal
aber
ratio
nH
uman
lym
phoc
ytes
46.6
3, 1
86.5
2 an
d14
92.1
5 μg
/ml
Neg
ativ
ekB
owen
(20
06)
146 ALIPHATIC AND AROMATIC AMINES AND AMIDES (addendum)

Tabl
e 7
(con
td)
No.
Fla
vour
ing
agen
tE
nd-p
oint
Tes
t obj
ect
Con
cent
ratio
nR
esul
tsR
efer
ence
In v
ivo
2007
(±)-
N-L
acto
yl ty
ram
ine
Mic
ronu
cleu
s in
duct
ion
NM
RI B
R m
ouse
bone
mar
row
cel
ls50
0, 1
000
and
2000
mg/
kgbw
per
day
l
Neg
ativ
emS
ikke
leru
s (2
006)
2009
N-p
-Ben
zene
acet
onitr
ilem
enth
anec
arbo
xam
ide
Mic
ronu
cleu
s in
duct
ion
CD
-1 m
ouse
bon
em
arro
w c
ells
500,
100
0 an
d 20
00 m
g/kg
bw p
er d
ayl
Neg
ativ
enP
ritch
ard
(200
6)
a W
ith a
nd w
ithou
t met
abol
ic a
ctiv
atio
n.b
Pre
incu
batio
n m
etho
d.c
Red
uced
bac
kgro
und
law
ns w
ere
obse
rved
at c
once
ntra
tions
of 1
000
μg/p
late
and
hig
her.
d P
reci
pita
tion
was
obs
erve
d at
100
0 μg
/pla
te.
e T
hree
hou
rs o
f tre
atm
ent.
f T
wen
ty-f
our
hour
s of
trea
tmen
t.g
Cyt
otox
icity
was
obs
erve
d at
88%
and
100
% a
t 100
0 μg
/ml a
nd 1
952
μg/m
l, re
spec
tivel
y.h
Cyt
otox
icity
was
obs
erve
d at
500
0 μg
/pla
te.
i T
hese
con
cent
ratio
ns w
ere
test
ed w
ithou
t S9
met
abol
ic a
ctiv
atio
n an
d w
ith 3
h o
f tre
atm
ent a
nd 1
8 h
of r
ecov
ery.
j T
hese
con
cent
ratio
ns w
ere
test
ed w
ith S
9 m
etab
olic
act
ivat
ion,
3 h
of t
reat
men
t and
18
h of
rec
over
y.k
The
se c
once
ntra
tions
wer
e te
sted
with
out S
9 m
etab
olic
act
ivat
ion
and
with
21
h of
trea
tmen
t.l
Adm
inis
tere
d vi
a ga
vage
.m
Bon
e m
arro
w w
as h
arve
sted
at 2
4 an
d 48
h.
n B
one
mar
row
was
har
vest
ed a
t 24
h.
ALIPHATIC AND AROMATIC AMINES AND AMIDES (addendum) 147

(i) In vitro
In reverse mutation assays with Salmonella typhimurium TA98, TA100,TA102, TA1535 and TA1537 and Escherichia coli WP2 uvrA, there was noevidence of genotoxicity with N-ethyl-2,2-diisopropylbutanamide (No. 2005),cyclopropanecarboxylic acid (2-isopropyl-5-methyl-cyclohexyl)-amide (No. 2006),(±)-N-lactoyl tyramine (No. 2007), N-(2-(pyridin-2-yl)ethyl)-3-p-menthanecar-boxamide (No. 2008) or N-p-benzeneacetonitrile menthanecarboxamide (No. 2009)at concentrations of up to 5000 μg/plate, with and without S9 activation (Sokolowski,2004; Sikkelerus, 2005; Wells, 2006; August, 2007; May, 2007).
In two independent forward mutation assays with L5178Y mouse lymphomacells, there was no evidence of genotoxicity with (±)-N-lactoyl tyramine atconcentrations of 1, 3, 10, 33, 100, 333, 1000 and 1952 μg/ml, with and withoutmetabolic activation. In the first experiment, the incubation time was 3 h. No toxicitywas observed, and (±)-N-lactoyl tyramine did not induce a significant increase inthe mutation frequency at the thymidine kinase (TK) locus, in the presence orabsence of metabolic activation. In the second experiment, the incubation timeswere 24 h and 3 h in the absence and presence of metabolic activation, respectively.With metabolic activation (3 h incubation time), no toxicity was observed in themouse lymphoma cells, and (±)-N-lactoyl tyramine did not induce a significantincrease in the mutation frequency at the TK locus. After incubation for 24 h in theabsence of metabolic activation, (±)-N-lactoyl tyramine did induce a dose-relatedincrease in the mutant frequency at the TK locus at the highest test conditions inwhich there were viable cell colonies (1000 μg/ml). However, cytotoxicity wasobserved to be 88% at 1000 μl/ml and approached 100% when cells were subjectedto the highest test level of 1952 μg/ml. It is concluded that under these experimentalconditions, (±)-N-lactoyl tyramine was non-mutagenic in this in vitro experiment(Buskens, 2005).
In a standard chromosomal aberration assay when human lymphocyteswere cultured in the presence of N-(2-pyridin-2-yl)ethyl)-3-p-menthanecarboxamide(No. 2008) at 0, 25, 50, 100, 160, 200, 220, 260, 280 and 300 μg/ml with and withoutS9 metabolic activation, there was no evidence of genotoxicity (Mason, 2007). Nogenotoxicity was reported in a similar chromosomal aberration assay when humanlymphocytes were cultured in the presence of N-p-benzeneacetonitrile menthane-carboxamide (No. 2009) at 0, 46, 190, 370, 750, 1500 or 3000 μg/ml with and withoutS9 metabolic activation (Bowen, 2006).
(ii) In vivo
In a standard micronucleus bone marrow assay, groups of five male NMRIBR mice were administered (±)-N-lactoyl tyramine (No. 2007) at 0 (negative orpositive control), 500, 1000 or 2000 mg/kg bw per day via a single oral (gavage)dose. Bone marrow of the groups treated with (±)-N-lactoyl tyramine was sampled24 h or 48 h (highest dose only) after dosing. Bone marrow of the negative andpositive control groups was harvested 24 h and 48 h after dosing, respectively. Noincrease in the mean frequency of micronucleated polychromatic erythrocytes wasobserved in the polychromatic erythrocytes of the bone marrow of animals treated
148 ALIPHATIC AND AROMATIC AMINES AND AMIDES (addendum)

with (±)-N-lactoyl tyramine. The incidence of micronucleated polychromaticerythrocytes in the bone marrow of all negative control animals was within thehistorical negative control data range. Cyclophosphamide, the positive controlsubstance, induced a statistically significant increase in the number ofmicronucleated polychromatic erythrocytes. It is concluded that (±)-N-lactoyltyramine is not clastogenic in the micronucleus test under the experimentalconditions of this in vivo test procedure (Sikkelerus, 2006).
In a similar micronucleus bone marrow assay, groups of seven male CD-1mice were administered N-p-benzeneacetonitrile menthanecarboxamide (No.2009) at 0 (negative or positive control), 500, 1000 or 2000 mg/kg bw per day viagavage on two occasions approximately 24 h apart. Bone marrow smears wereobtained from seven male animals in the negative control and in each of thetreatment groups 24 h after the second dose, and bone marrow smears were alsoobtained from five animals in the positive control group 24 h after a single dose(mitomycin C; 12 mg/kg bw). No statistically significant increases in the frequencyof micronucleated polychromatic erythrocytes and no substantial decreases in theproportion of polychromatic erythrocytes were observed in mice treated with N-p-benzeneacetonitrile menthanecarboxamide at any treatment level, compared withvehicle control values. The positive control compound produced significantincreases in the frequency of micronucleated polychromatic erythrocytes. It isconcluded that N-p-benzeneacetonitrile menthanecarboxamide did not showevidence of causing an increase in the induction of micronucleated polychromaticerythrocytes or bone marrow cell toxicity in mice, when administered orally viagavage in this in vivo test procedure (Pritchard, 2006).
(iii) Conclusions for genotoxicity
The five flavouring agents of this group gave consistently negative results inin vitro mutation assays conducted in S. typhimurium and E. coli with and withoutmetabolic activation. The genotoxicity assays conducted in mammalian cells (i.e.human lymphocytes) with two of the same flavouring agents of this group were alsonegative. Micronucleus assays conducted in two strains of mice with two of the sameflavouring agents were also negative.
(d) Developmental and reproductive toxicity studies
In a teratology study, groups of 6–7 female Sprague-Dawley rats were fed adiet providing N1-(2,4-dimethoxybenzyl)-N2-(2-(pyridin-2-yl)ethyl)oxalamide (No.1768) at doses of 0, 10, 30 and 100 mg/kg bw per day for 15 days from day 6 today 20 during gestation. On day 20, the dams were sacrificed, and grossexamination of the females was performed, followed by caesarean section. For eachlitter, half of the live fetuses were examined for visceral changes and the other halffor skeletal abnormalities. In the dams, there were no test material effects on clinicalsigns, body weight, food consumption or water consumption. There were no grosspathological findings or variations in organ weights when compared with controlanimals. With respect to the fetuses, there were no differences observed in bodyweight, placental weight, litter size or external, visceral or skeletal examinationsbetween treatment and control groups. The maternal and fetal NOEL for N-(2,4-
ALIPHATIC AND AROMATIC AMINES AND AMIDES (addendum) 149
dimethoxybenzyl)-N2-(2-(pyridin-2-yl)ethyl)oxalamide was 100 mg/kg bw per day inrats (Tomita, 2007).
In a two-generation reproductive and developmental toxicity study, Sprague-Dawley rats (30 of each sex per group) were fed a diet providing N1-(2,4-dimethoxybenzyl)-N2-(2-(pyridin-2-yl)ethyl)oxalamide (No. 1768) at doses of 0, 10,30 and 100 mg/kg bw per day for 10 weeks prior to mating (day 70), throughout themating process, gestation, lactation and weaning (day 91) and up to sacrifice (day126) (Weaver, 2007). Parameters evaluated included mortality, clinical signs oftoxicity, body weight and body weight gain, food consumption and test articleconsumption, fertility indices, litter data, gross findings, histopathology of male andfemale reproductive organs, sperm analysis, ovarian counts, pup weights andlandmark data (vaginal opening and preputial separation for F1 pups).
For the F0 generation, all animals survived to termination, with no remarkableclinical signs observed. During the first 28 days of the studies, males showeddecreases in body weight, body weight gain and food consumption that were mostlikely attributable to palatability of the test material at such high concentrations. The100 mg/kg bw per day female group showed a treatment-related decrease in bodyweights during the premating phase up to day 70. As these changes were less than10%, they were not considered biologically relevant. There was no evidence ofeffects on estrous cycle or reproductive performance, pregnancy or litter data (livebirth, viability and weaning indices, mean pup weights, vaginal opening or preputialgland separation), the F0 fertility indices or the macroscopic or microscopic findingsin F0 parents or F1 pups.
The females in the 100 mg/kg bw per day groups showed increased meanrelative uterine weight; however, there were no histopathological findingsassociated with the increase, so it was not considered relevant to administration ofthe test material. Also, an increased mean relative liver weight was observed in the100 mg/kg bw per day male group. No microscopic examination of the liver wasperformed, so the relevance of this finding is not known. The per cent motility, caudalepididymal sperm count, testicular sperm count, sperm morphology and ovarianprimordial follicle count were unaffected by the intake of N-(2,4-dimethoxybenzyl)-N2-(2-(pyridin-2-yl)ethyl)oxalamide in the diet.
For the F0 generation, one high intake level female was found dead onlactation day 0 during delivery. The remaining rats showed no evidence of clinicalsigns of toxicity. No test article–related effects on mean body weight or body weightgain occurred in males during the premating phase or in females during thegestation, lactation or resting phase, and no effects on mean food consumption infemales during the premating, gestation, lactation or resting phase were observed.Prolonged diestrus cycles (longer than 4 days) were observed in 2 out of 30, 9 outof 30, 7 out of 27 and 6 out of 29 females in the 0, 10, 30 and 100 mg/kg bw perday groups, respectively. These rates were not dose related, were not statisticallysignificant and showed no impact on the fertility of the rats.
Pregnancy rates were 93%, 97%, 96% and 86% and delivery rates were90%, 97%, 96% and 86% for the 0 (control), 10, 30 and 100 mg/kg bw per daygroups, respectively. While not statistically significant, the duration of pregnancy
150 ALIPHATIC AND AROMATIC AMINES AND AMIDES (addendum)

increased with increasing intake level: 21–22 days for control and 21–23 days at 10and 30 mg/kg bw per day, with a 23-day gestation phase occurring for 1 out of 29and 3 out of 27 rats, respectively. At 100 mg/kg bw per day, the duration of gestationranged from 21 to 27 days (1 out of 24 rats each with a gestation phase of 23, 24and 27 days, respectively). All other litter data were comparable with those ofcontrols. There was no evidence of a test article effect on litter data (live birth,viability and weaning indices, mean pup weights at any dose level) or macroscopicor microscopic findings in F1 parents or F2 pups. The 100 mg/kg bw per day femalesexhibited increased relative uterus weight. This finding, however, did not correlatewith any macroscopic or microscopic finding and was found to be not of biologicalsignificance.
The per cent motility, caudal epididymal sperm count, testicular sperm count,sperm morphology and ovarian primordial follicle count were not affected bytreatment with N-(2,4-dimethoxybenzyl)-N2-(2-(pyridin-2-yl)ethyl)oxalamide at aconcentration of 100 mg/kg bw per day. A reduction in the mean number of spermper gram of caudal epididymal tissue in the 100 mg/kg bw per day dietary intakelevel group, compared with the control of the F0 generation, was not observed in theF1 generation. The reduction, therefore, was not considered biologically significant.
The NOAEL is 30 mg/kg bw per day for maternal and paternal toxicity andis based on absence of clinical signs and minimal or no effects on body weight andfood consumption at this dose level as well as the single death of a 100 mg/kg bwper day female during delivery. There were no or minimal effects on maternal andpaternal parameters at doses of 10 and 30 mg/kg bw per day in F0 and F1 rats. TheNOAEL for embryo/fetal survival and for growth and development in F1 and F2 pupsis 100 mg/kg bw per day, as there were no statistically significant decreases in eitherof these parameters from lactation day 0 through lactation day 21 in eithergeneration. The NOAEL for F0 and F1 fertility parameters is 100 mg/kg bw per dayfor males and 30 mg/kg bw per day for females and is based on the lack of effectson male reproductive tissues in either generation at any dose level tested and thefemale F1 generation findings of an extended duration of gestation of up to 27 daysat 100 mg/kg bw per day. The 14% reduction in the male fertility index does notappear to be a male reproductive issue based on the sperm analysis data (Weaver,2007).
3. REFERENCES
Anon. (2006). In vitro hydrolysis of lactoyl tyramine in conditions simulating stomach intestinalenvironment. Personal communication to the Flavor and Extract ManufacturersAssociation, Washington, DC, USA. Submitted to WHO by the International Organizationof the Flavor Industry, Brussels, Belgium.
Asatoor A, Simenhoff M (1965). The origin of urinary dimethylamines. Biochimica etBiophysica Acta, 111:384–392.
August M (2007). Mutagenicity study of cyclopropanecarboxylic acid (2-isopropyl-5-methyl-cyclohexyl)-amide in the Salmonella typhimurium reverse mutation assay (in vitro).Unpublished report to the Flavor and Extract Manufacturers Association, Washington, DC,USA. Submitted to WHO by the International Organization of the Flavor Industry, Brussels,Belgium.
ALIPHATIC AND AROMATIC AMINES AND AMIDES (addendum) 151

Bernheim F, Bernheim MLC (1933). Oxidation of choline by tissues. American Journal ofPhysiology, 104:438–440.
Bernheim F, Bernheim MLC (1938). The choline oxidase of liver. American Journal ofPhysiology, 121:55–60.
Bowen R (2006). In vitro mammalian chromosome aberration test with GR-72-0180 [N-p-benzeneacetonitrile-menthanecarboxamide] in human lymphocytes. Unpublished report tothe Flavor and Extract Manufacturers Association, Washington, DC, USA. Submitted toWHO by the International Organization of the Flavor Industry, Brussels, Belgium.
Brophy P et al. (1977). Choline kinase and ethanolamine kinase are separate soluble enzymesin rat liver. European Journal of Biochemistry, 78:491–496.
Buskens CAF (2005). Evaluation of the mutagenic activity of lactoyl tyramine in an in vitromammalian cell gene mutation test with L5178Y mouse lymphoma cells (with independentrepeat). Unpublished report to the Flavor and Extract Manufacturers Association,Washington, DC, USA. Submitted to WHO by the International Organization of the FlavorIndustry, Brussels, Belgium.
Chase KR (2006). Toxicity study of GR-72-1814 by oral (dietary) administration to CD rats for4 weeks followed by a 2 week recovery period. Unpublished report to the Flavor and ExtractManufacturers Association, Washington, DC, USA. Submitted to WHO by the InternationalOrganization of the Flavor Industry, Brussels, Belgium.
Cramer GM, Ford RA, Hall RL (1978). Estimation of toxic hazard—a decision tree approach.Food and Cosmetics Toxicology, 16:255–276.
De La Huerga J, Popper H (1951). Urinary excretion of choline metabolites following cholineadministration in normals and patients with hepatobiliary diseases. Journal of ClinicalInvestigation, 30:463–470.
De La Huerga J, Popper H, Steigmann F (1951). Urinary excretion of choline andtrimethylamines after intravenous administration of choline in liver diseases. Journal ofClinical Investigations, 38:904–920.
Eapen AK (2006). A 90-day oral (dietary) toxicity study of GR-72-0180 (N-p-benzeneacetonitrile-menthanecarboxamide) in rats with a 28-day recovery period.Unpublished report to the Flavor and Extract Manufacturers Association, Washington, DC,USA. Submitted to WHO by the International Organization of the Flavor Industry, Brussels,Belgium.
Eapen AK (2007). A 28-day oral (dietary) toxicity study of GR-72-1814 (N-(2-(pyridin-2-yl)-ethyl)-3-p-menthanecarboxamide) in rats. Unpublished report to the Flavor and ExtractManufacturers Association, Washington, DC, USA. Submitted to WHO by the InternationalOrganization of the Flavor Industry, Brussels, Belgium.
European Flavour and Fragrance Association (2004). European inquiry on volume use.Personal communication to the Flavor and Extract Manufacturers Association,Washington, DC, USA. Submitted to WHO by the International Organization of the FlavorIndustry, Brussels, Belgium.
Findlay J (2006). Acute up-and-down oral toxicity study of N-ethyl-2,2-diisopropylbutanamidein rats. Unpublished report to the Flavor and Extract Manufacturers Association,Washington, DC, USA. Submitted to WHO by the International Organization of the FlavorIndustry, Brussels, Belgium.
Flower RJ et al. (1972). Metabolism and transfer of choline in hamster small intestine. Journalof Physiology, 226:473–489.
Gavin CL, Williams MC, Hallagan JB (2008). 2005 poundage and technical effects updatesurvey. Washington, DC, USA, Flavor and Extract Manufacturers Association.
Hopson LD (2008). 13-week oral capsule toxicity study with S336 in dogs. Vienna, VA, USA,Covance Laboratories. Unpublished report to the Flavor and Extract ManufacturersAssociation, Washington, DC, USA. Submitted to WHO by the International Organizationof the Flavor Industry, Brussels, Belgium.
152 ALIPHATIC AND AROMATIC AMINES AND AMIDES (addendum)

Ikeda H (2008a). Determination of S336 in rat plasma—Study for collection of samples fordetermination of drug concentration in blood after oral administration or single intravenousadministration of S336 in rats. JCL Bioassay Corporation Study No. JCL081181.Unpublished report to the Flavor and Extract Manufacturers Association, Washington, DC,USA. Submitted to WHO by the International Organization of the Flavor Industry, Brussels,Belgium.
Ikeda H (2008b). Determination of S336 in dog plasma—Study for collection of samples fordetermination of drug concentration in blood after single oral gradually-increasedadministrations or single intravenous administration of S336 in Beagle dogs. JCL BioassayCorporation Study No. JCL081153. Unpublished report to the Flavor and ExtractManufacturers Association, Washington, DC, USA. Submitted to WHO by the InternationalOrganization of the Flavor Industry, Brussels, Belgium.
Ikeda H (2008c). Summary report for human pharmacokinetic study of TF001 in human.Personal communication to the Flavor and Extract Manufacturers Association,Washington, DC, USA. Submitted to WHO by the International Organization of the FlavorIndustry, Brussels, Belgium.
International Organization of the Flavor Industry (2009). Interim inquiry on volume use andadded use levels for flavoring agents to be presented at the JECFA 73rd meeting.Submitted to WHO by the International Organization of the Flavor Industry, Brussels,Belgium.
IPCS (2004). Hydrogen cyanide and cyanides: human health aspects. Geneva, Switzerland,World Health Organization, International Programme on Chemical Safety (ConciseInternational Chemical Assessment Document 61).
Japan Flavor and Fragrance Materials Association (2005). Japanese inquiry on volume use.Personal communication to the Flavor and Extract Manufacturers Association,Washington, DC, USA. Submitted to WHO by the International Organization of the FlavorIndustry, Brussels, Belgium.
Kuczler FJ, Nahrwold DL, Rose RC (1977). Choline influx across brush border of the guineapig jejunum. Biochimica et Biophysica Acta, 465:131–137.
Maehly AC, Swensson Å (1970). Cyanide and thiocyanate levels in blood and urine ofworkers with low-grade exposure to cyanide. Internationales Archiv für Arbeitsmedizin,27:195–209.
Mallory VT (2004). An acute oral toxicity study in rats with GR-72-0180 (N-p-benzeneacetonitrile-menthanecarboxamide). Unpublished report to the Flavor and ExtractManufacturers Association, Washington, DC, USA. Submitted to WHO by the InternationalOrganization of the Flavor Industry, Brussels, Belgium.
Mason C (2007). In vitro mammalian chromosome aberration test with GR-72-1814 [N-(2-(pyridin-2-yl)ethyl)-3-p-menthanecarboxamide] in human lymphocytes. Unpublishedreport to the Flavor and Extract Manufacturers Association, Washington, DC, USA.Submitted to WHO by the International Organization of the Flavor Industry, Brussels,Belgium.
May K (2007). Bacterial reverse mutation test on GR-72-1814 [N-(2-(pyridin-2-yl)ethyl)-3-p-menthanecarboxamide]. Unpublished report to the Flavor and Extract ManufacturersAssociation, Washington, DC, USA. Submitted to WHO by the International Organizationof the Flavor Industry, Brussels, Belgium.
Meerts IATM (2007). Metabolite profiling of N-lactoyl tyramine after in vitro incubations usingrat hepatocytes in suspension. Unpublished report to the Flavor and Extract ManufacturersAssociation, Washington, DC, USA. Submitted to WHO by the International Organizationof the Flavor Industry, Brussels, Belgium.
ALIPHATIC AND AROMATIC AMINES AND AMIDES (addendum) 153

Miyata [initial not provided] (1995). Summary of 28-day repeated-dose oral toxicity study ofWS-3. Unpublished report to the Flavor and Extract Manufacturers Association,Washington, DC, USA. Submitted to WHO by the International Organization of the FlavorIndustry, Brussels, Belgium.
Moore EL, Groom CJ (2006). Acute oral toxicity of GR-72-1814 [N-(2-(pyridin-2-yl)ethyl)-3-p-menthanecarboxamide] in the rat. Unpublished report to the Flavor and ExtractManufacturers Association, Washington, DC, USA. Submitted to WHO by the InternationalOrganization of the Flavor Industry, Brussels, Belgium.
Nachmansohn D, Machado AL (1943). The formation of acetylcholine, a new enzyme: cholineacetylase. Journal of Neurophysiology, 6:397–403.
Posternak JM, Linder A, Vodoz CA (1969). Summaries of toxicological data. Toxicologicaltests on flavoring matters. Food and Cosmetics Toxicology, 7:405–407.
Prentiss PG et al. (1961) Metabolism of choline by the germ free rat. Archives of Biochemistryand Biophysics, 94:424–429.
Pritchard L (2006). Mouse micronucleus test with GR-72-0180 [N-p-benzeneacetonitrile-menthanecarboxamide]. Unpublished report to the Flavor and Extract ManufacturersAssociation, Washington, DC, USA. Submitted to WHO by the International Organizationof the Flavor Industry, Brussels, Belgium.
Sanford PA, Smyth DH (1971). Intestinal transport of choline in the rat and hamster. Journalof Physiology, 215:769–788.
Sikkelerus BPC (2005). Evaluation of the mutagenic activity of lactoyl tyramine in theSalmonella typhimurium reverse mutation assay and the Escherichia coli reverse mutationassay (with independent repeat). Unpublished report to the Flavor and ExtractManufacturers Association, Washington, DC, USA. Submitted to WHO by the InternationalOrganization of the Flavor Industry, Brussels, Belgium.
Sikkelerus BPC (2006). Micronucleus test in bone marrow cells of the mouse with lactoyltyramine. Unpublished report to the Flavor and Extract Manufacturers Association,Washington, DC, USA. Submitted to WHO by the International Organization of the FlavorIndustry, Brussels, Belgium.
Sokolowski A (2004). Salmonella typhimurium and Escherichia coli reverse mutation assaywith GR-72-0180 [N-p-benzeneacetonitrile-menthanecarboxamide]. Unpublished report tothe Flavor and Extract Manufacturers Association, Washington, DC, USA. Submitted toWHO by the International Organization of the Flavor Industry, Brussels, Belgium.
Tomita A (2007). Preliminary teratology study of S336 with rats by dietary administration. Finalreport No. 07R001. Unpublished report to the Flavor and Extract ManufacturersAssociation, Washington, DC, USA. Submitted to WHO by the International Organizationof the Flavor Industry, Brussels, Belgium.
Vaeth A (2007). Acute oral toxicity study of cyclopropanecarboxylic acid (2-isopropyl-5-methyl-cyclohexyl)-amide in the rat. Unpublished report to the Flavor and Extract ManufacturersAssociation, Washington, DC, USA. Submitted to WHO by the International Organizationof the Flavor Industry, Brussels, Belgium.
Weaver EV (2007). Reproduction study of S336 in rats by dietary administration (test for effectson two-generation reproduction). Vienna, VA, USA, Covance Laboratories Inc.Unpublished report to the Flavor and Extract Manufacturers Association, Washington, DC,USA. Submitted to WHO by the International Organization of the Flavor Industry, Brussels,Belgium.
Wells M (2006). Salmonella/E. coli mammalian microsome reverse mutation assay on N-ethyl-2,2-diisopropylbutanamide. Unpublished report to the Flavor and ExtractManufacturers Association, Washington, DC, USA. Submitted to WHO by the InternationalOrganization of the Flavor Industry, Brussels, Belgium.
154 ALIPHATIC AND AROMATIC AMINES AND AMIDES (addendum)

Wolff AR, Skibbe J (2007). In vitro metabolism of two new chemical entities by hepatocytes:GR-72-0178 and GR-72-0180 (N-p-benzeneacetonitrile-menthanecarboxamide).Unpublished report to the Flavor and Extract Manufacturers Association, Washington, DC,USA. Submitted to WHO by the International Organization of the Flavor Industry, Brussels,Belgium.
Zeisel SH, Wishnok JS, Blusztajn JK (1983). Formation of methylamines from ingested cholineand lecithin. Journal of Pharmacology and Experimental Therapeutics, 225(2):320–324.
Zeisel SH et al. (1991). Choline, an essential nutrient in humans. FASEB Journal, 5:2093–2098.
Zeisel SH et al. (2003). Concentrations of choline-containing compounds and betaine incommon foods. Journal of Nutrition, 133:1302–1307.
ALIPHATIC AND AROMATIC AMINES AND AMIDES (addendum) 155


AROMATIC SUBSTITUTED SECONDARY ALCOHOLS, KETONES ANDRELATED ESTERS (addendum)
First draft prepared by
Professor I.G. Sipes,1 Dr M. DiNovi,2 Professor A.G. Renwick3 and ProfessorR. Walker4
1 College of Medicine, University of Arizona, Tucson, Arizona, United Statesof America (USA)
2 Center for Food Safety and Applied Nutrition, Food and Drug Administration,College Park, Maryland, USA
3 School of Medicine, University of Southampton, Southampton, England4 Ash, Aldershot, Hantfordshire, England
1. Evaluation ..............................................................................1.1 Introduction ......................................................................1.2 Assessment of dietary exposure......................................1.3 Absorption, distribution, metabolism and elimination ......1.4 Application of the Procedure for the Safety Evaluation of
Flavouring Agents ...........................................................1.5 Consideration of combined intakes from use as flavouring
agents ..............................................................................1.6 Consideration of secondary components ........................1.7 Conclusion .......................................................................
2. Relevant background information ..........................................2.1 Explanation ......................................................................2.2 Additional considerations on intake .................................2.3 Biological data .................................................................
2.3.1 Biochemical data: absorption, distribution,metabolism and elimination ....................................
2.3.2 Toxicological studies ..............................................3. References ............................................................................
1. EVALUATION
1.1 Introduction
The Committee was requested to evaluate nine additional flavouring agentsthat belong to the group of aromatic substituted secondary alcohols, ketones andrelated esters. This group of nine compounds includes eight ketones (Nos 2040–2045 and 2047–2048) and one diester (No. 2046). The safety of one submittedsubstance, 2-aminoacetophenone (No. 2043), was not assessed, because theCommittee decided that this compound should be evaluated in the future in a groupof aliphatic and aromatic amines and amides. The evaluations of the remaining eightwere conducted using the Procedure for the Safety Evaluation of Flavouring Agents(Figure 1, Introduction) (Annex 1, reference 131). None of these flavouring agentshas previously been evaluated.
157157158158
166
167168168168168168169
169169186
- 157 -

The Committee previously evaluated 38 other members of this group offlavouring agents at its fifty-seventh meeting (Annex 1, reference 154). TheCommittee concluded that all 38 flavouring agents in that group were of no safetyconcern based on estimated dietary exposures.
Six of the eight flavouring agents (Nos 2040–2042 and 2044–2046) havebeen reported to occur naturally in various foods and have been detected in honey,milk, tomato, mango, coffee, cloudberry, starfruit, peas, whiskey, papaya, chicken,sherry, beer and white wine (Nijssen, van Ingen-Visscher & Donders, 2009). ForNo. 2041, the consumption from natural sources is estimated to be 7 times thevolume used as a flavouring agent.
1.2 Assessment of dietary exposure
The total annual volumes of production of the eight aromatic substitutedsecondary alcohols, ketones and related esters are approximately 5 kg in Europe,52 kg in the USA and 2 kg in Japan (European Flavour and Fragrance Association,2004; Japan Flavor and Fragrance Materials Association, 2005; Gavin, Williams &Hallagan, 2008; International Organization of the Flavor Industry, 2009).Approximately 80% and 96% of the total annual volumes of production in Europeand the USA, respectively, are accounted for by 4-(3,4-methylenedioxyphenyl)-2-butanone (No. 2048). In Japan, approximately 50% of the total annual volume ofproduction is accounted for by 4-hydroxyacetophenone (No. 2040).
The estimated dietary exposures for each flavouring agent, calculated eitheras the maximized survey-derived intake (MSDI) or using the single portion exposuretechnique (SPET), are reported in Table 1. The estimated daily intake is greatestfor dihydrogalangal acetate (No. 2046) (10 000 μg, calculated using the SPETobtained from six different food categories). For the other flavouring agents, theestimated daily intakes ranged from 0.01 to 1600 μg, with the SPET yielding thehighest estimates for all. Reported annual volumes of production of this group offlavouring agents and the calculated daily dietary exposures (MSDI and SPET) aresummarized in Table 2.
1.3 Absorption, distribution, metabolism and elimination
Aromatic secondary alcohols, ketones and related esters are rapidlyabsorbed from the gut. Hydrolysis of the esters occurs in the intestine and liver. Thearomatic secondary alcohols (and aromatic ketones after reduction to thecorresponding secondary alcohols) are then either conjugated with glucuronic acidand excreted primarily in the urine or further oxidized to carboxylic acids, which areexcreted mainly as glycine conjugates. Studies on absorption, distribution,metabolism and elimination were considered at the fifty-seventh meeting of theCommittee (Annex 1, reference 154).
158 AROMATIC SUBSTITUTED SECONDARY ALCOHOLS, KETONES, ESTERS (addendum)

Tabl
e 1.
Sum
mar
y of
the
resu
lts o
f the
safe
ty e
valu
atio
ns o
f aro
mat
ic s
ubst
itute
d se
cond
ary
alco
hols
, ket
ones
and
rela
ted
este
rs u
sed
as fl
avou
ring
age
ntsa,
b,c
Fla
vour
ing
agen
tN
o.C
AS
No.
and
str
uctu
reS
tep
A3/
B3d
Doe
s in
take
exce
ed th
eth
resh
old
for
hum
an in
take
?
Ste
p A
5/H
igh
expo
sure
B-s
idee
Ade
quat
e m
argi
n of
saf
ety
for t
hefla
vour
ing
agen
t or
rela
ted
subs
tanc
es?
/ Are
add
ition
alda
ta a
vaila
ble
for
subs
tanc
esw
ith a
n es
timat
ed in
take
exce
edin
g th
e th
resh
old
ofco
ncer
n?
Com
men
ts o
npr
edic
ted
met
abol
ism
Con
clus
ion
base
d on
cur
rent
estim
ated
die
tary
expo
sure
Str
uctu
ral c
lass
I
4-H
ydro
xyac
etop
heno
ne20
4099
-93-
4
O
OH
No,
SP
ET
: 300
NR
Not
es 1
and
2N
o sa
fety
conc
ern
3-H
ydro
xy-4
-phe
nylb
utan
-2-
one
2041
5355
-63-
5
O
OH
No,
SP
ET
:16
00N
RN
otes
1 a
nd 2
No
safe
tyco
ncer
n
AROMATIC SUBSTITUTED SECONDARY ALCOHOLS, KETONES, ESTERS (addendum) 159

Tabl
e 1
(con
td)
Fla
vour
ing
agen
tN
o.C
AS
No.
and
stru
ctur
eS
tep
A3/
B3d
Doe
s in
take
exce
ed th
eth
resh
old
for
hum
an in
take
?
Ste
p A
5/H
igh
expo
sure
B-s
idee
Ade
quat
e m
argi
n of
saf
ety
for
the
flavo
urin
g ag
ent o
r re
late
dsu
bsta
nces
? / A
re a
dditi
onal
data
ava
ilabl
e fo
r su
bsta
nces
with
an
estim
ated
inta
keex
ceed
ing
the
thre
shol
d of
conc
ern?
Com
men
ts o
npr
edic
ted
met
abol
ism
Con
clus
ion
base
d on
cur
rent
estim
ated
die
tary
expo
sure
2-M
etho
xyac
etop
heno
ne20
4257
9-74
-8
O O
No,
SP
ET
: 150
0N
RN
otes
1, 2
, 3 a
nd4
No
safe
ty c
once
rn
2-M
ethy
lace
toph
enon
e20
4457
7-16
-2
O
No,
SP
ET
: 80
NR
Not
es 1
and
4N
o sa
fety
con
cern
2-H
ydro
xy-5
-m
ethy
lace
toph
enon
e20
4514
50-7
2-2
OH
O
No,
SP
ET
: 10
NR
Not
es 1
and
2N
o sa
fety
con
cern
160 AROMATIC SUBSTITUTED SECONDARY ALCOHOLS, KETONES, ESTERS (addendum)

Tabl
e 1
(con
td)
Fla
vour
ing
agen
tN
o.C
AS
No.
and
str
uctu
reS
tep
A3/
B3d
Doe
s in
take
exce
ed th
eth
resh
old
for
hum
an in
take
?
Ste
p A
5/H
igh
expo
sure
B-s
idee
Ade
quat
e m
argi
n of
saf
ety
for
the
flavo
urin
g ag
ent o
r re
late
dsu
bsta
nces
? / A
re a
dditi
onal
data
ava
ilabl
e fo
r su
bsta
nces
with
an
estim
ated
inta
keex
ceed
ing
the
thre
shol
d of
conc
ern?
Com
men
ts o
npr
edic
ted
met
abol
ism
Con
clus
ion
base
d on
cur
rent
estim
ated
die
tary
expo
sure
Dih
ydro
gala
ngal
acet
ate
2046
1293
19-1
5-9
O
O
O
O
CH
3
CH
3
HC 3
Yes
, SP
ET
:10
000
A5.
No.
The
NO
EL
of 1
5 m
g/kg
bw
per
day
for
the
stru
ctur
ally
rel
ated
subs
tanc
e -m
ethy
lben
zyl a
ceta
tefr
om a
n or
al to
xici
ty s
tudy
in r
ats
(Gau
nt e
t al.,
197
4) is
at l
east
86
times
gre
ater
than
the
estim
ated
daily
die
tary
exp
osur
e to
No.
204
6w
hen
used
as
a fla
vour
ing
agen
t.
Not
es 1
and
5A
dditi
onal
dat
are
quire
d to
com
plet
eev
alua
tion
2,3,
3-T
rimet
hylin
dan-
1-on
e
2047
5444
0-17
-4
O
No,
SP
ET
: 25
NR
Not
es 1
and
4N
o sa
fety
con
cern
AROMATIC SUBSTITUTED SECONDARY ALCOHOLS, KETONES, ESTERS (addendum) 161

Tabl
e 1
(con
td)
Fla
vour
ing
agen
tN
o.C
AS
No.
and
stru
ctur
eS
tep
A3/
B3d
Doe
s in
take
exce
ed th
eth
resh
old
for
hum
an in
take
?
Ste
p A
5/H
igh
expo
sure
B-s
idee
Ade
quat
e m
argi
n of
saf
ety
for
the
flavo
urin
g ag
ent o
r re
late
dsu
bsta
nces
? / A
re a
dditi
onal
data
ava
ilabl
e fo
r su
bsta
nces
with
an
estim
ated
inta
keex
ceed
ing
the
thre
shol
d of
conc
ern?
Com
men
ts o
npr
edic
ted
met
abol
ism
Con
clus
ion
base
d on
cur
rent
estim
ated
die
tary
expo
sure
Str
uctu
ral c
lass
III
4-(3
,4-
Met
hyle
nedi
oxyp
heny
l)-2-
buta
none
2048
5541
8-52
-5
O
O O
Yes
, SP
ET
: 640
Yes
. The
NO
EL
of 5
7 m
g/kg
bw
per
day
for
No.
204
8 in
a 9
0-da
y st
udy
in r
ats
(Pos
tern
ak, L
inde
r &
Vod
oz,
1969
) is
at l
east
500
0 tim
es it
ses
timat
ed d
ieta
ry e
xpos
ure
whe
nus
ed a
s a
flavo
urin
g ag
ent.
Not
es 1
, 2 a
nd3
No
safe
ty c
once
rn
bw, b
ody
wei
ght;
CA
S, C
hem
ical
Abs
trac
ts S
ervi
ce; N
OE
L, n
o-ob
serv
ed-e
ffect
leve
l; N
R, n
ot r
equi
red
for
eval
uatio
n be
caus
e co
nsum
ptio
n of
the
flavo
urin
g ag
ent w
as d
eter
min
ed to
be
of n
o sa
fety
con
cern
at s
tep
A3
of th
e P
roce
dure
a T
hirt
y-ei
ght f
lavo
urin
g ag
ents
in th
is g
roup
wer
e pr
evio
usly
eva
luat
ed b
y th
e C
omm
ittee
(A
nnex
1, r
efer
ence
131
).b
Ste
p 1:
Sev
en fl
avou
ring
agen
ts in
this
gro
up (N
os 2
040–
2042
and
204
4–20
47) a
re in
str
uctu
ral c
lass
I. O
ne fl
avou
ring
agen
t in
this
gro
up (N
o. 2
048)
is in
str
uctu
ral c
lass
III.
cS
tep
2: A
ll fla
vour
ing
agen
ts in
this
gro
up e
xcep
t 4-(
3,4-
met
hyle
nedi
oxyp
heny
l)-2-
buta
none
(N
o. 2
048)
can
be
pred
icte
d to
be
met
abol
ized
toin
nocu
ous
prod
ucts
.d
The
thre
shol
ds fo
r hu
man
inta
ke fo
r st
ruct
ural
cla
sses
I, II
and
III a
re 1
800,
540
and
90
μg/d
ay, r
espe
ctiv
ely.
All
inta
ke v
alue
s ar
e ex
pres
sed
in μ
g/da
y. E
ither
the
high
est S
PE
T e
stim
ate
or th
e M
SD
I est
imat
es, i
f at l
east
one
is h
ighe
r th
an th
e hi
ghes
t SP
ET
est
imat
e, a
re g
iven
in th
e ta
ble.
e T
he m
argi
n of
saf
ety
was
cal
cula
ted
base
d on
the
high
est d
aily
die
tary
exp
osur
e ca
lcul
ated
eith
er b
y th
e S
PE
T o
r as
the
MS
DI.
162 AROMATIC SUBSTITUTED SECONDARY ALCOHOLS, KETONES, ESTERS (addendum)

Tabl
e 1
(con
td)
Not
es:
1.A
ceto
phen
one
deriv
ativ
es (
or a
nalo
gues
) ar
e ex
pect
ed to
und
ergo
red
uctio
n at
the
keto
ne fu
nctio
n an
d fo
rm-m
ethy
lben
zyl a
lcoh
ol d
eriv
ativ
es,
whi
ch w
ill b
e co
njug
ated
with
glu
curo
nic
acid
and
exc
rete
d pr
imar
ily in
the
urin
e. T
he k
eton
e m
ay a
lso
unde
rgo
-met
hyl o
xida
tion.
2.D
etox
icat
ion
of th
e ph
enol
der
ivat
ive
prim
arily
invo
lves
con
juga
tion
of th
e hy
drox
yl g
roup
with
sul
fate
or
gluc
uron
ic a
cid.
3.M
ay u
nder
go d
emet
hyla
tion,
gen
erat
ing
a ph
enol
der
ivat
ive,
whi
ch is
exp
ecte
d to
und
ergo
con
juga
tion
with
sul
fate
or
gluc
uron
ic a
cid.
4.A
rom
atic
rin
gs m
ay u
nder
go c
ytoc
hrom
e P
450–
med
iate
d ox
idat
ion
to a
phe
nolic
met
abol
ite, w
hich
can
be
conj
ugat
ed w
ith g
lucu
roni
c ac
id o
r su
lfate
prio
r to
exc
retio
n in
the
urin
e or
bile
.5.
Est
er g
roup
s w
ill u
nder
go h
ydro
lysi
s to
form
the
corr
espo
ndin
g al
coho
l or
phen
ol a
nd a
cid.
AROMATIC SUBSTITUTED SECONDARY ALCOHOLS, KETONES, ESTERS (addendum) 163

Table 2. Annual volumes of production and dietary exposures for aromaticsubstituted secondary alcohols, ketones and related esters used asflavouring agents in Europe, the USA and Japan
Flavouring agent (No.) Mostrecentannual
volume ofproduction
(kg)a
Dietary exposure Annualvolume of
naturaloccurrence
in foods(kg)d
Consumptionratioe
MSDIb SPETc
μg/day
μg/kgbw per
day
μg/day
μg/kgbwperday
4-Hydroxyacetophenone(2040)
300 5 + NA
Europe 0.1 0.01 0.0002
USA ND ND ND
Japan 1 0.4 0.0059
3-Hydroxy-4-phenylbutan-2-one(2041)
1 600 27 6 7
Europe 0.1 0.01 0.0002
USA 0.9 0.1 0.002
Japan ND ND ND
2-Methoxyacetophenone(2042)
1 500 25 + NA
Europe 0.1 0.01 0.0002
USA ND ND ND
Japan ND ND ND
2-Methylacetophenone(2044)
80 1 + NA
Europe 0.1 0.01 0.0002
USA 0.1 0.01 0.0002
Japan ND ND ND
2-Hydroxy-5-methylacetophenone(2045)
10 0.2 + NA
Europe ND ND ND
USA ND ND ND
Japan 0.1 0.03 0.0005
164 AROMATIC SUBSTITUTED SECONDARY ALCOHOLS, KETONES, ESTERS (addendum)

Table 2 (contd)
Flavouring agent (No.) Mostrecentannual
volume ofproduction
(kg)a
Dietary exposure Annualvolume of
naturaloccurrence
in foods(kg)d
Consumptionratioe
MSDIb SPETc
μg/day
μg/kgbwperday
μg/day μg/kgbwperday
Dihydrogalangal acetate(2046)
10 000 167 NA
Europe ND ND ND
USA 1 0.1 0.001
Japan ND ND ND
2,3,3-Trimethylindan-1-one (2047)
25 0.4 NA
Europe ND ND ND
USA 0.4 0.05 0.001
Japan ND ND ND
4-(3,4-Methylenedioxyphenyl)-2-butanone (2048)
640 11 NA
Europe 4 0.4 0.007
USA 50 6.1 0.1
Japan 0.3 0.1 0.001
Total
Europe 5
USA 52
Japan 2
bw, body weight; NA, not available; ND, no data reported; +, reported to occur naturally in foods(Nijssen, van Ingen-Visscher & Donders, 2009), but no quantitative data; , not reported tooccur naturally in foods
a From European Flavour and Fragrance Association (2004), Gavin, Williams & Hallagan(2008), International Organization of the Flavor Industry (2009) and Japan Flavor andFragrance Materials Association (2005). Values greater than zero but less than 0.1 kg werereported as 0.1 kg.
AROMATIC SUBSTITUTED SECONDARY ALCOHOLS, KETONES, ESTERS (addendum) 165

Table 2 (contd)
b MSDI (μg/person per day) calculated as follows: (annual volume, kg) × (1 × 10⁹ μg/kg)/(population × survey correction factor × 365 days),
where population (10%, “eaters only”) = 32 × 106 for Europe, 28 × 106 for the USA and 13× 106 for Japan; and where survey correction factor = 0.8 for the surveys in Europe, the USAand Japan, representing the assumption that only 80% of the annual flavour volume wasreported in the poundage surveys (European Flavour and Fragrance Association, 2004;Japan Flavor and Fragrance Materials Association, 2005; Gavin, Williams & Hallagan, 2008;International Organization of the Flavor Industry, 2009).
MSDI (μg/kg bw per day) calculated as follows: (μg/person per day)/body weight, where body weight = 60 kg. Slight variations may occur
from rounding.c SPET (μg/person per day) calculated as follows: (standard food portion, g/day) × (average use level) (International Organization of the Flavor
Industry, 2009). The dietary exposure from the single food category leading to the highestdietary exposure from one portion is taken as the SPET estimate.
SPET (μg/kg bw per day) calculated as follows: (μg/person per day)/body weight, where body weight = 60 kg. Slight variations may occur
from rounding.d Quantitative data for the USA reported by Stofberg & Grundschober (1987).e The consumption ratio is calculated as follows: (annual consumption via food, kg)/(most recent reported volume as a flavouring agent, kg).
1.4 Application of the Procedure for the Safety Evaluation of FlavouringAgents
Step 1. In applying the Procedure for the Safety Evaluation of FlavouringAgents to the above-mentioned flavouring agents, the Committee assigned sevenflavouring agents (Nos 2040–2042 and 2044–2047) to structural class I. Oneflavouring agent (No. 2048) was assigned to structural class III (Cramer, Ford &Hall, 1978).
Step 2. Seven flavouring agents in this group (Nos 2040–2042 and 2044–2047) are expected to be metabolized to innocuous products. The evaluation ofthese flavouring agents therefore proceeded via the A-side of the Procedure. Oneflavouring agent (No. 2048) cannot be predicted to be metabolized to innocuousproducts, and its evaluation therefore proceeded via the B-side of the Procedure.
Step A3. The highest estimated daily intakes of six flavouring agents instructural class I are below the threshold of concern (i.e. 1800 μg/person per dayfor class I). The safety of these flavouring agents raises no concern at currentestimated dietary exposures. The highest estimated daily intake of one of theflavouring agents (No. 2046) in structural class I is above the threshold of concern(i.e. 1800 μg/person per day for class I). Accordingly, the evaluation of this flavouringagent proceeded to step A4.
Step A4. Neither the flavouring agent dihydrogalangal acetate (No. 2046)nor its metabolites are endogenous. Accordingly, the evaluation of this flavouringagent proceeded to step A5.
166 AROMATIC SUBSTITUTED SECONDARY ALCOHOLS, KETONES, ESTERS (addendum)

Step A5. The no-observed-effect level (NOEL) of 15 mg/kg body weight (bw)per day for the structurally related substance, -methylbenzyl acetate, from an oralstudy of toxicity in rats (Gaunt et al., 1974) provided a margin of safety of less than100 in relation to the highest estimated dietary exposure to dihydrogalangal acetate(No. 2046) (SPET = 10 000 μg/day) when used as a flavouring agent. TheCommittee expressed concern that the reported NOEL was insufficient toaccommodate any potential differences in toxicity between No. 2046 and the relatedsubstance. The Committee therefore concluded that additional data are required tocomplete the evaluation of this flavouring agent.
Step B3. The highest daily intake of the flavouring agent in structural classIII (No. 2048) is above the threshold of concern (i.e. 90 μg/person per day for classIII). Therefore, additional data are necessary for the evaluation of this flavouringagent (see below).
Consideration of flavouring agents with high exposure evaluated on the B-side of the decision-tree:
In accordance with the Procedure, additional data were evaluated for 4-(3,4-methylenedioxyphenyl)-2-butanone (No. 2048), as the estimated intake exceededthe threshold for structural class III (i.e. 90 μg/person per day).
A NOEL for 4-(3,4-methylenedioxyphenyl)-2-butanone (No. 2048) ofapproximately 57 mg/kg bw per day in a 90-day study in rats was identified(Posternak, Linder & Vodoz, 1969). Groups of 10–16 male and female rats pergroup were fed a diet formulated to provide intake in excess of 100 times themaximum estimated daily human dietary exposure. The animals were monitored forfood intake and body weight. End-points evaluated included haematology, clinicalchemistry, organ weights and organ pathology. No adverse effects on any of theseparameters were observed. The NOEL provides a margin of safety of more than5000 in relation to the highest estimated dietary exposure to No. 2048 (SPET =640 μg/day) when used as a flavouring agent. The Committee therefore concludedthat 4-(3,4-methylenedioxyphenyl)-2-butanone would not pose a safety concern atcurrent estimated dietary exposures.
Table 1 summarizes the evaluations of the eight aromatic substitutedsecondary alcohols, ketones and related esters used as flavouring agents (Nos2040–2042 and 2044–2048) in this group.
1.5 Consideration of combined intakes from use as flavouring agents
The safety assessment of possible combined intakes of flavouring agentswas based on the presence of common metabolites or a homologous series (asproposed at the sixty-eighth meeting; Annex 1, reference 187) and using the MSDIexposure assessment (as proposed at the sixty-ninth meeting; Annex 1, reference190).
Flavouring agents in this group with the highest intakes and with the commonmetabolite -methylbenzyl alcohol (No. 799), which is in structural class I, are Nos799, 801, 804, 807 and 810. In the unlikely event that these were to be consumed
AROMATIC SUBSTITUTED SECONDARY ALCOHOLS, KETONES, ESTERS (addendum) 167

concurrently on a daily basis, the estimated combined intakes in Europe, the USAand Japan would be 395, 753 and 76 μg/person per day, respectively, which wouldnot exceed the threshold of concern (i.e. 1800 μg/person per day for class I).
Other members of this group with intakes greater than 20 μg/person per daydo not share common metabolites or represent members of a homologous series.
1.6 Consideration of secondary components
One member of this group of flavouring agents, 3-hydroxy-4-phenylbutan-2-one (No. 2041), has a minimum assay value of less than 95%. The secondarycomponent of No. 2041, 4-hydroxy-4-phenylbutan-2-one, is expected to undergorapid absorption, distribution, metabolism and excretion, sharing the samemetabolic fate as the primary substance, and is considered not to present a safetyconcern at current estimated dietary exposures. Information on the safety of thesecondary component of this flavouring agent is summarized in Annex 5.
1.7 Conclusion
In the previous evaluation of the flavouring agents in this group, studies ofacute toxicity, short-term toxicity, long-term toxicity and carcinogenicity, andgenotoxicity were available. None raised safety concerns. The toxicity dataavailable for this evaluation supported those from the previous evaluation (Annex1, reference 154).
The Committee concluded that seven of these eight flavouring agents, whichare additions to the group of aromatic substituted secondary alcohols, ketones andrelated esters evaluated previously, would not give rise to safety concerns at currentestimated dietary exposures. For dihydrogalangal acetate (No. 2046), theCommittee concluded that additional data would be necessary to complete theevaluation of this flavouring agent.
2. RELEVANT BACKGROUND INFORMATION
2.1 Explanation
This monograph summarizes the additional key data relevant to the safetyevaluation of the group of eight aromatic substituted secondary alcohols, ketonesand related esters, which includes seven ketones (Nos 2040–2042 and 2045–2048)and one diester (No. 2046). These eight flavouring agents are additions to a groupof 38 flavouring agents evaluated by the Committee at its fifty-seventh meeting(Annex 1, reference 154).
2.2 Additional considerations on intake
There is no additional information on intake. Dietary exposure estimateswere made using both the MSDI approach and the SPET.
168 AROMATIC SUBSTITUTED SECONDARY ALCOHOLS, KETONES, ESTERS (addendum)

2.3 Biological data
2.3.1 Biochemical data: absorption, distribution, metabolism and elimination
No additional information on absorption, distribution, metabolism orelimination of the flavouring agents in this group was identified since the previousevaluation.
2.3.2 Toxicological studies
(a) Acute toxicity
Oral median lethal doses (LD50 values) have been reported for two of theadditional flavouring agents in this group (Table 3). For 2,3,3-trimethylindan-1-one(No. 2047), LD50 values in rats were reported as >2000 mg/kg bw (Arcelin, 2004).For 4-(3,4-methylenedioxyphenyl)-2-butanone (No. 2048), the LD50 value in ratswas found to be 4000 mg/kg bw (Wohl, 1974).
Table 3. Results of acute oral toxicity studies for aromatic substitutedsecondary alcohols, ketones and related esters used as flavouring agents
No. Flavouring agent Species; sex LD50 (mg/kg bw) Reference
2047 2,3,3-Trimethylindan-1-one Rats; F >2000 Arcelin (2004)
2048 4-(3,4-Methylenedioxyphenyl)-2-butanone
Rats; NR 4000 Wohl (1974)
F, female; NR, not reported
These studies demonstrate that the acute oral toxicity of aromatic substitutedsecondary alcohols, ketones and related esters used as flavouring agents is low.
(b) Short-term studies of toxicity
A 90-day study with 4-(3,4-methylenedioxyphenyl)-2-butanone (No. 2048)and a 28-day gavage test with 2,3,3-trimethylindan-1-one (No. 2047) were reported.Further short-term studies of toxicity were also published on benzophenone(No. 831) during the interim period between the original submission of the group ofaromatic substituted secondary alcohols, ketones and related esters at the fifty-seventh meeting of the Committee and preparation of the background informationfor this group of additional flavouring agents. These studies have been summarizedin Table 4 and are described below.
(i) 2,3,3-Trimethylindan-1-one (No. 2047)
In a 28-day range-finding study, Wistar rats (five of each sex per dose) wereadministered 2,3,3-trimethylindan-1-one at doses of 50, 150 and 450 mg/kg bw perday via gavage (Fischer, 2007). The rats were given drinking-water ad libitum.Periodic observations of the animals in their cages were performed to assess
AROMATIC SUBSTITUTED SECONDARY ALCOHOLS, KETONES, ESTERS (addendum) 169
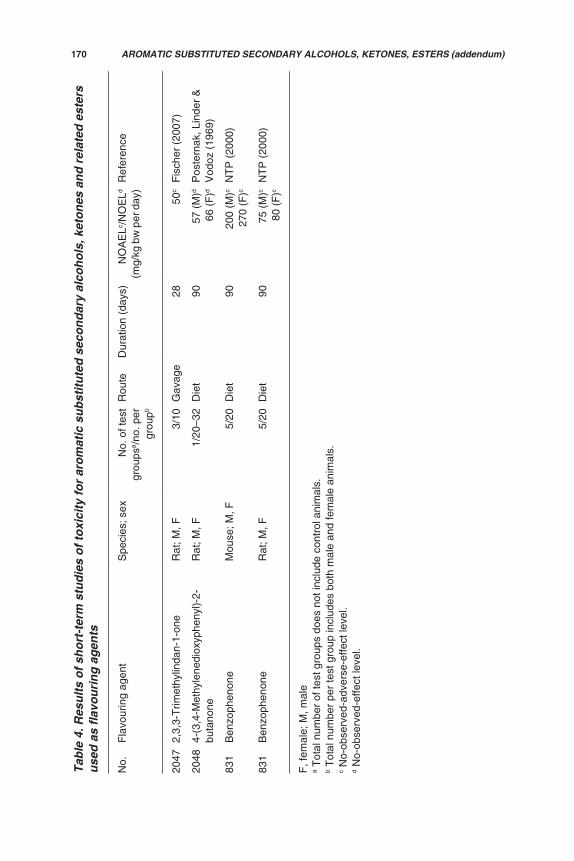
Tabl
e 4.
Res
ults
of s
hort
-ter
m s
tudi
es o
f tox
icity
for
arom
atic
sub
stitu
ted
seco
ndar
y al
coho
ls, k
eton
es a
nd r
elat
edes
ters
used
as
flavo
urin
g ag
ents
No.
Fla
vour
ing
agen
tS
peci
es; s
exN
o. o
f tes
tgr
oups
a /no
. per
grou
pb
Rou
teD
urat
ion
(day
s)N
OA
ELc /N
OE
Ld
(mg/
kg b
w p
er d
ay)
Ref
eren
ce
2047
2,3,
3-T
rimet
hylin
dan-
1-on
eR
at; M
, F3/
10G
avag
e28
50c
Fis
cher
(20
07)
2048
4-(3
,4-M
ethy
lene
diox
yphe
nyl)-
2-bu
tano
neR
at; M
, F1/
20–3
2D
iet
9057
(M
)d
66 (
F)d
Pos
tern
ak, L
inde
r &
Vod
oz (
1969
)
831
Ben
zoph
enon
eM
ouse
; M, F
5/20
Die
t90
200
(M)c
270
(F)c
NT
P (
2000
)
831
Ben
zoph
enon
eR
at; M
, F5/
20D
iet
9075
(M
)c
80 (
F)c
NT
P (
2000
)
F, f
emal
e; M
, mal
ea
Tot
al n
umbe
r of
test
gro
ups
does
not
incl
ude
cont
rol a
nim
als.
b T
otal
num
ber
per
test
gro
up in
clud
es b
oth
mal
e an
d fe
mal
e an
imal
s.c N
o-ob
serv
ed-a
dver
se-e
ffect
leve
l.d
No-
obse
rved
-effe
ct le
vel.
170 AROMATIC SUBSTITUTED SECONDARY ALCOHOLS, KETONES, ESTERS (addendum)
mortality and severe signs of toxicity. Locomotor activity and grip strength wereassessed during week 4. Following the 28-day treatment period, there was a14-day treatment-free period. Clinical analyses, including urinalysis, haematologyand plasma analysis, were performed following the treatment and recovery periods.All animals were killed, necropsied and examined postmortem. Histologicalexaminations were performed on organs, tissues and gross lesions from all controland high-dose animals. Histological examinations were performed on liver,adrenals, vagina, uterus and all gross lesions from low- and mid-dose animals.
All animals survived to termination without any signs of toxicity. In males, amoderate decrease in absolute food consumption was recorded in the 450 mg/kgbw per day group, and a slight decrease in relative food consumption (based onbody weight) was recorded in the 150 and 450 mg/kg bw per day groups, whichresulted in slight to moderate decreases in body weights in males of these dosegroups. These findings were considered not to be adverse owing to their reversibilityafter the recovery period. No test item–related changes in food consumption, bodyweight or body weight gain were noted in males treated with 50 mg/kg bw per dayor in females at any dose level. Dose-related decreases in red blood cell counts,haemoglobin and haematocrit were noted in females treated with 50, 150 and450 mg/kg bw per day. Consequently, the relative and absolute reticulocyte countswere increased for females in this group. All haematological findings wereconsidered by the author not to be adverse owing to their reversibility after therecovery period. Increased triglyceride concentrations and -glutamyl transferaseactivities were noted in animals administered 450 mg/kg bw per day. Malesadministered 450 mg/kg bw per day and females administered 150 and 450 mg/kgbw per day showed increases in total blood protein and globulin levels anddecreases in albumin to globulin ratios. These changes disappeared during therecovery period and were considered by the author to be of no toxicologicalrelevance.
No test item–related macroscopic findings were observed at the end of thetreatment period. Microscopic changes observed were hepatocyte hypertrophy,adrenal cell hypertrophy and balloonated cells of the vaginal mucosa, leading to amicrocystic appearance of animals treated with 150 and 450 mg/kg bw per day. Allof the microscopic changes disappeared during the recovery period and were notconsidered by the author to be of toxicological relevance. There were dose-dependent increases in absolute and relative liver weights in male and female ratsin all treatment groups, as well as increases in adrenal weights in males treated atall dose levels and in females in the 150 and 450 mg/kg bw per day groups. Theliver and adrenal weight changes were considered to be adaptive and stressresponses, respectively, and were not considered by the author to be toxicologicallyrelevant. In females treated at 150 and 450 mg/kg bw per day, there were dose-related increases in absolute and relative spleen weights. These effects wereconsidered by the author to be secondary to anaemia and were not toxicologicallyrelevant. Females administered 450 mg/kg bw per day showed dose-relateddecreases in absolute and relative ovary weights, but no microscopic changes wereobserved, and the decreases were not considered by the author to be toxicologicallyrelevant (Fischer, 2007).
AROMATIC SUBSTITUTED SECONDARY ALCOHOLS, KETONES, ESTERS (addendum) 171
Based on the above findings, the author found the no-observed-adverse-effect level (NOAEL) to be 450 mg/kg bw per day (Fischer, 2007). However,because of the microcystic changes observed in the vagina at 150 mg/kg bw perday, the Committee considered the NOAEL to be 50 mg/kg bw per day.
(ii) 4-(3,4-Methylenedioxyphenyl)-2-butanone (No. 2048)
Groups of 20–32 male and female Charles River CD rats (10–16 of eachsex) were fed diets containing 4-(3,4-methylenedioxyphenyl)-2-butanone for aperiod of 90 days at concentrations resulting in average dietary intakes of 57 and66 mg/kg bw per day for males and females, respectively. Throughout the studyperiod, body weights and food consumption were monitored on a weekly basis, andthe food conversion efficiency was subsequently calculated. Blood samples weretaken at weeks 7 and 13 for haematological and clinical chemistry analysis. At studycompletion, animals were necropsied and subjected to gross examination. Thekidneys and liver were excised and weighed, and microscopic examination wasperformed on a wide range of major organs. In comparison with the basal diet controlgroup, no significant variations were observed in any of the toxicological parametersevaluated. Furthermore, no compound-related histopathological abnormalities werereported (Posternak, Linder & Vodoz, 1969). The NOAELs were considered to be57 and 66 mg/kg bw per day in males and females, respectively, the only dosestested.
(iii) Benzophenone (No. 831)
Mice
In a 14-week study, benzophenone was provided to groups of B6C3F1 mice(10 of each sex per dose) in the feed at concentrations of 0, 1250, 2500, 5000,10 000 or 20 000 mg/kg. These concentrations in the feed were estimated by thestudy authors to provide a daily intake of 0, 200, 400, 800, 1600 or 3300 mg/kg bwfor males and 0, 270, 540, 1000, 1900 or 4200 mg/kg bw for females. All animalswere observed twice daily, clinical signs were recorded twice weekly and bodyweights were measured weekly. Necropsies were performed on all animals,including those that died or were killed moribund during the study. All organs andtissues were evaluated for the presence of gross lesions, which were examinedhistopathologically. Histological examinations were performed on prepared tissues,including the adrenal gland, bone and marrow, brain, clitoral gland, oesophagus,eye, gallbladder, heart, large intestine, small intestine, kidney, liver, lung, lymphnodes, mammary gland, nose, ovary, pancreas, parathyroid gland, pituitary gland,preputial gland, prostate gland, salivary gland, spleen, stomach (forestomach andglandular stomach), testis, thymus, thyroid gland, trachea, urinary bladder anduterus from all animals in the control, 10 000 mg/kg feed and 20 000 mg/kg feedgroups, as well as test animals that died during the study. Owing to the potentialphotoionizing properties of benzophenone, complete histopathologial examinationof the eyes, including the lens, retina and other ocular structures, was performed.Microsomal cytochrome P450 content of the liver was also measured.
172 AROMATIC SUBSTITUTED SECONDARY ALCOHOLS, KETONES, ESTERS (addendum)
One male in the 1250 mg/kg feed group was accidentally killed on day 26.Four males in the 20 000 mg/kg feed group died in week 1, and one male and onefemale in the 20 000 mg/kg feed group died in week 2. Two males were removedfrom the study at week 10, three males were removed at week 11 and three femaleswere removed at week 12 in the 20 000 mg/kg feed groups owing to significantlyreduced body weights compared with controls. Body weights of the mice in the 5000and 10 000 mg/kg feed groups were significantly reduced, as were body weights inthe surviving females of the 20 000 mg/kg feed group. Clinical observations includedlethargy for both males and females in the 20 000 mg/kg feed groups. Foodconsumption for the 20 000 mg/kg feed groups was reduced compared withcontrols. The authors attributed this to the lack of palatability of the diet. Nohaematology or clinical chemistry was performed at week 14 for males in the20 000 mg/kg feed group. The males in the 5000 and 10 000 mg/kg feed groupsshowed anaemia, with minimal decreases in haematocrit values, haemoglobinlevels and erythrocyte counts. At intakes of 20 000, 10 000 and 5000 mg/kg feed,females showed erythrocytosis. The authors found this consistent with haemo-concentration caused by dehydration, which is supported by reported increases inalbumin and total protein concentrations. Total bile salt concentrations and sorbitoldehydrogenase activities were increased in all treated females and in males in the2500 mg/kg feed or higher groups. The kidney weights of males exposed to2500 mg/kg feed or higher and the liver weights of all exposed males weresignificantly increased. The absolute and relative liver weights of all exposedfemales except those in the 20 000 mg/kg feed group were significantly increased.Females in the 2500 and 10 000 mg/kg feed groups showed a significant increasein absolute kidney weights, and females exposed to 2500 mg/kg feed or highershowed a significant increase in relative kidney weights. The absolute and relativethymus weights of females at the 20 000 mg/kg feed exposure level and absolutethymus weights at the 5000 and 10 000 mg/kg feed levels were significantly lowerthan those of controls. Other organ weight differences were considered to be dueto the overall lower body weights of the exposed mice. No significant changes inthe ocular structures or tissues were observed.
There were no exposure-related gross lesions at necropsy. Significanthistopathological findings were limited to centrilobular hypertrophy of hepatocytes,which corresponded to an increase in liver weights at all exposure levels in bothsexes. No microscopic finding supported the increased kidney weights. Males in the10 000 mg/kg feed exposure group showed significantly greater hepatic cytochromeP450 activity, which was considered by the authors to be an adaptive response.Ethoxyresorufin de-ethylase activities and pentoxyresorufin dealkylase activitieswere significantly increased for all exposed male groups compared with controls(NTP, 2000).
Based on the increases observed in kidney weights of both males andfemales exposed to diets containing 2500 mg of benzophenone per kilogram of feedfor 14 weeks, the Committee considered the NOAELs to be 200 mg/kg bw per day(males) and 270 mg/kg bw per day (females).
AROMATIC SUBSTITUTED SECONDARY ALCOHOLS, KETONES, ESTERS (addendum) 173
Rats
In another 14-week study, benzophenone was provided to groups of F344/N rats (10 of each sex per dose) in the feed at concentrations of 0, 1250, 2500,5000, 10 000 or 20 000 mg/kg. These concentrations in the feed are estimated bythe study authors to provide a daily intake of 0, 75, 150, 300, 700 or 800 mg/kg bwfor males and 0, 80, 160, 300, 700 or 1000 mg/kg bw for females. The protocol wasessentially the same as in the mouse study described above.
One female in the 20 000 mg/kg feed exposure group died on day 12.Owing to the significant decrease in body weights for the remaining females in the20 000 mg/kg feed group, they were removed from the study at week 6. Bodyweights for males at 2500 mg/kg feed and higher and all female exposure groupswere significantly reduced compared with those of controls. Clinical findings werenoted as lethargy for females in the 20 000 mg/kg feed group and thinness in malesin the 10 000 mg/kg feed group. Two males in the 20 000 mg/kg feed group hadprolapsed penises. Males and females at the 20 000 mg/kg feed exposure levelconsumed significantly reduced amounts of food compared with controls andother exposure groups. Owing to mortality and early removal from the study, no14-week clinical chemistry or haematology data were collected for animals at the20 000 mg/kg feed exposure level.
Haematology data revealed a number of findings. Anaemia was observed inmales and females at 2500 mg/kg feed and higher, as indicated by decreasedhaematocrit values, haemoglobin concentrations and erythrocyte levels. In malerats, increased reticulocyte counts were observed, indicating an erythropoieticresponse. Platelet count decreases were seen in males in the 10 000 mg/kg feedexposure group and in females in the 5000 and 10 000 mg/kg feed exposure groups.Alanine aminotransferase activity levels were increased for females in the10 000 mg/kg feed group and in males in the 20 000 mg/kg feed group at 14 weeksand in females in the 20 000 mg/kg feed group at 6 weeks. Sorbitol dehydrogenaseactivity was increased for females in the 10 000 mg/kg feed group. Minimal tomarked increases in bile salts and minimal to mild decreases in alkalinephosphatase activity were reported at various time points in the study for allexposure groups. Hyperproteinaemia was persistent at week 14 for all exposedfemales and was accompanied by hyperalbuminaemia, which is indicative ofdehydration in animals. Plasma creatinine concentration was decreased minimallyat 5000 mg/kg feed and higher for males and females at all time points in aconcentration-dependent manner. Creatinine levels can be related to muscle massin rats (Finco, 1989; Ragan, 1989), and rats in the higher exposure groups weighedless and had lower muscle mass than controls.
Kidney and liver weights of all exposed male and female rats weresignificantly greater than those of controls, with the exception of the kidney weightsfrom females in the 1250 mg/kg feed group. The absolute heart and thymus weightsof males in the 10 000 mg/kg feed group and the absolute thymus weights of femalesin the 5000 and 10 000 mg/kg feed exposure groups were significantly less thanthose of controls. Other organ weight differences were attributed to lower bodyweights of the exposed animals.
174 AROMATIC SUBSTITUTED SECONDARY ALCOHOLS, KETONES, ESTERS (addendum)

At necropsy, exposed males had significantly smaller seminal vesicles whencompared with controls. There were no microscopic changes accompanying thisgross finding. Increased kidney weights were accompanied by a broad range ofmicroscopic findings. Papillary necrosis, as indicated by acute coagulative necrosisof the distal tips of the renal papillae, occurred in 20% of the 10 000 mg/kg feed and60% (P = 0.001) of the 20 000 mg/kg feed exposure groups. In male rats exposedto 2500 mg/kg feed and higher and females at 10 000 and 20 000 mg/kg feed, well-demarcated, wedge-shaped areas of prominent dilatation were observed. Theseareas were based at the capsular surface and extended deep into the medulla.Within these areas, tubules were dilated and generally empty, but some containedfine granulated eosinophilic material. Increased incidences of severe focal tubuleregeneration were observed in all exposure groups. Foci of tubule regeneration are acomponent of chronic nephropathy in the ageing rat. Exposure-related increases inliver weights were attributed to hypertrophy or cytoplasmic vacuolization of hepato-cytes. All exposure groups of females showed increased centrilobular vacuolizationof hepatocytes. Vacuolization was observed in all male exposure groups andindicated by a bubbly appearance in the cytosol. Males in the 20 000 mg/kg feedexposure group showed minimal hyperplasia of immature bile ducts in portal areasextending into adjacent sinusoids. Hypercellularity of the bone marrow in males andfemales and poorly developed seminiferous tubules in males were observed for the20 000 mg/kg feed exposure groups. These findings were considered by the authorsto be secondary to reduced body weight gain and inanition. No microscopic changeswere observed for the eye or any substructures or tissues. Males and femalesexposed to 2500 and 5000 mg/kg feed and females exposed to 1250 mg/kg feedshowed significant increases in liver microsomal cytochrome P450. All exposuregroups showed increased levels of pentoxyresorufin dealkylase activity (NTP,2000).
Based on the haematological findings in male and female rats exposed tobenzophenone for 14 weeks in the diet at 2500 mg/kg feed, the Committeeconsidered the NOAELs to be 75 mg/kg bw per day (males) and 80 mg/kg bw perday (females).
(c) Long-term studies of toxicity and carcinogenicity
Long-term studies of toxicity and carcinogenicity were published onbenzophenone (No. 831) during the interim period between the original submissionof the group of aromatic substituted secondary alcohols, ketones and related estersat the fifty-seventh meeting of the Committee and preparation of the backgroundinformation for this group of additional flavouring agents. These studies have beensummarized in Table 5 and are described below.
(i) Benzophenone (No. 831)
Mice
In a National Toxicology Program (NTP) study, groups of 50 male and 50female B6C3F1 mice were maintained on diets containing benzophenone atconcentrations of 0, 312, 625 or 1250 mg/kg for 105 weeks. The administered
AROMATIC SUBSTITUTED SECONDARY ALCOHOLS, KETONES, ESTERS (addendum) 175
dietary levels were estimated to provide a daily intake of 0, 40, 80 and 160 mg/kgbw in male mice and 0, 35, 70 and 150 mg/kg bw in female mice (NTP, 2006).Animals were observed twice daily, and clinical signs were recorded monthly. Bodyweights were measured weekly for the first 12 weeks and monthly thereafter.Necropsies were performed on all animals, including those that died or were killedmoribund during the study. All organs and tissues were evaluated for the presenceof gross lesions, which were histopathologically examined. Histological exam-inations were performed on prepared tissues from all control and test animals thatdied during the study. Organs of the treated rats that were targeted for potentialneoplastic and non-neoplastic effects were histopathologically examined.
No significant differences in mortality rates were reported betweencontrols and any of the three test groups of male mice. Although there was a slightdecrease in survival in females on the 1250 mg/kg diet, there was no significantdifference in survival between the control group and any of the three treatmentgroups. No significant differences in mean body weights were reported betweencontrol and test groups in male mice. Mean body weights of females in the 35, 70and 150 mg/kg bw per day test groups were less than those of controls after weeks86, 52 and 37, respectively.
Neoplastic and non-neoplastic lesions associated with the dietaryadministration of benzophenone at 0, 312, 625 or 1250 mg/kg feed to micedeveloped principally in the liver in males. There was an increase in the incidenceof hepatocellular adenomas in males—control, 11/50 (22%); 40 mg/kg bw per day,15/50 (30%); 80 mg/kg bw per day, 23/50 (46%); 160 mg/kg bw per day, 23/50(46%)—that was statistically significant at the two highest dietary levels. Theincidence of hepatocellular carcinomas was greater in control males than in anygroup of test group males—control, 8/50 (16%); 40 mg/kg bw per day, 5/50 (10%);80 mg/kg bw per day, 6/50 (12%); 160 mg/kg bw per day, 6/50 (12%)—whereas theincidence of hepatoblastomas in test groups was less than 6% and not statistically
Table 5. Results of long-term studies of toxicity and carcinogenicity foraromatic substituted secondary alcohols, ketones and related esters used asflavouring agents
No. Flavouring agent Species;sex
No. oftest
groupsa/no. pergroupb
Route Duration(days)
NOAEL/NOEL
(mg/kg bwper day)
Reference
831 Benzophenone Mouse; M,F
3/100 Diet 730 <40c NTP (2006)
831 Benzophenone Rat; M, F 3/100 Diet 730 <15c NTP (2006)
F, female; M, malea Total number of test groups does not include control animals.b Total number per test group includes both male and female animals.c The lowest dose tested. See text for relevance to humans.
176 AROMATIC SUBSTITUTED SECONDARY ALCOHOLS, KETONES, ESTERS (addendum)

different from controls. The incidence of combined hepatocellular adenomas,carcinomas and blastomas in males maintained on the 625 and 1250 mg/kg dietswas increased (P < 0.01) compared with the control group: control, 18/50 (36%);40 mg/kg bw per day, 20/50 (40%); 80 mg/kg bw per day, 25/50 (50%); 160 mg/kgbw per day, 29/50 (58%).
Non-neoplastic effects in the liver of males included an increase in clear cellfoci, eosinophilic cell foci and mixed cell foci and a significant increase incentrilobular hepatocellular hypertrophy, multinucleated cells and hepatic necrosisin all treatment groups and cystic degeneration in the two highest dietary groups.Chronic active inflammation was observed, but the effect was also prevalent incontrol animals.
Female mice exhibited a low incidence of non-neoplastic and neoplasticlesions compared with male mice. There was no significant difference in theincidence of combined hepatocellular adenomas and carcinomas: control, 5/50(10%); 35 mg/kg bw per day, 5/50 (10%); 75 mg/kg bw per day, 10/50 (20%); 150mg/kg bw per day, 9/50 (18%). The historical incidences of adenomas andcombined adenomas and carcinomas for mice on the NTP-2000 diet are 9.6% and11.8%, respectively; a much lower incidence of non-neoplastic effects wasobserved in females compared with males. The incidence of eosinophilic cell fociand mixed cell foci was slightly increased over controls. Although hypertrophy ofhepatocytes was reported in test groups, there was no significant difference inmultinucleated cells, necrosis, inflammation or cystic degeneration between testand control groups. These data support the conclusion that the male mouse liverexhibits increased susceptibility to neoplastic changes compared with the femalemouse liver.
A statistically significant (P = 0.03, 5/50) increase in histiocytic sarcoma wasreported in female mice maintained on the 625 mg/kg diet. The incidence was lower(3/50; not statistically significant) in the 1250 mg/kg feed group and was absent inthe 312 mg/kg feed and control groups. The authors noted that the historicalincidence of histiocytic sarcoma in 2-year feed (NTP-2006 diet) controls was 2/459(0.4%) and was 18/1258 (1.4%)1 for all routes of administration.
Under the conditions of these 2-year gavage studies, the NTP (2006) reportconcluded: “There was some evidence of carcinogenic activity of benzophenone inmale B6C3F1 mice based on increased incidences of hepatocellular neoplasms,primarily adenoma. There was some evidence of carcinogenic activity in femaleB6C3F1 mice based on increased incidences of histiocytic sarcoma.”
The primary neoplastic effects observed in the treated mice in the 2-yearNTP (2006) gavage study were associated with the liver. The high incidence ofhepatocellular adenomas and carcinomas in both control and treated groups of maleand female mice is indicative of the sensitivity of the B6C3F1 mouse liver toneoplastic changes. The high incidences of hepatocellular adenoma in treated andcontrol male mice were not significantly different. The incidences of non-neoplasticlesions and adenomas in the male control group were higher than the incidences in
1 Given as 0.3% ± 0.8% (range 0–2%) and 1.5% ± 2.2% (range 0–8%) in NTP (2006).
AROMATIC SUBSTITUTED SECONDARY ALCOHOLS, KETONES, ESTERS (addendum) 177

any group of treated females. Although the incidences of hepatocellular adenomasand combined hepatocellular adenomas and carcinomas in all groups of treatedmale mice were greater than the incidence in the control group, there was nodifference in the incidence of malignant neoplasms (hepatocellular carcinomas andhepatoblastomas). The incidence of hepatocellular neoplasms (adenomas andcombined adenomas and carcinomas) in treated females was not significantlydifferent from the control group, and the overall incidence of neoplastic and non-neoplastic lesions was significantly less than in males.
The profile of neoplastic responses is consistent with the historically highlevels of background hepatocellular neoplasms in male and female B6C3F1 mice(Maronpot et al., 1987). The historical spontaneous incidence of liver neoplasms incontrol male and female B6C3F1 mice has revealed background incidences ofcombined hepatocellular adenomas and carcinomas of 32.4% for males, with arange of 20–47%, and 11.8% for females, with a range of 8–16% (NTP, 2006).Similar incidences were reported in the benzophenone study. The high incidenceof spontaneous hepatocellular neoplasms (adenomas and carcinomas) in the maleB6C3F1 mouse, the absence of consistent dose–response data, the benign natureof the lesion (adenomas), the lack of hepatocellular neoplastic effects in the parallelrat study (discussed below) and the relatively high dose levels administered castdoubt on the applicability of these lesions to humans with respect to currentestimated dietary exposures to benzophenone used as a flavouring agent. Thecomparison of the incidence of histiocytic sarcomas in female mice—5/50 (10%) at625 mg/kg feed and 3/50 (6%) at 1250 mg/kg feed—with the low historical incidenceof these neoplasms in control mice maintained on the NTP-2000 diet—2/459(0.4%)1—was the basis for the conclusion of “some evidence of carcinogenic activityin female B6C3F1 mice” (NTP, 2006). Although the NTP (2006) report did notconsider the appearance of histiocytic sarcoma to be sufficient evidence ofcompound-related carcinogenesis, a low, non-statistically significant increase (i.e.1/50 at 30 mg/kg bw and 2/50 at 65 mg/kg bw) in histiocytic sarcoma was observedin female rats at the two highest dietary levels.
The female mouse historical database upon which the above comparisonwas based is relatively small (seven dietary studies containing a total of 3592 femalemice; incidence of 2/359 or 0.6%). When the database is expanded to includecontrol animals maintained on the NTP-2000 diet and administered the test articleby all routes of administration, the incidence of histiocytic sarcomas in controlsincreases (1.5% ± 2.2%, range 0–8%), and the incidences of tumours in thebenzophenone study (10% and 6%) are nearly within the historical range.
In order to evaluate the relevance of these tumours to the potential cancerrisk for humans consuming benzophenone as a flavouring agent, it is important tonote that histiocytic sarcomas were found only at dose levels inducing severetoxicity. Increased incidences of hepatic and renal lesions were recorded in bothspecies, and increased incidences of splenic extramedullary haematopoiesis werereported in female mice. For example, the majority of female mice (four of five) that
1 Given as 0.3% ± 0.8% (range 0–2%) in NTP (2006).2 Not 459, as reported in the original study.
178 AROMATIC SUBSTITUTED SECONDARY ALCOHOLS, KETONES, ESTERS (addendum)

exhibited histiocytic sarcomas also showed hepatocellular adenomas. In femalerats in the middle and high dose groups, there were marked decreases in theincidences of thyroid C-cell hyperplasia and mammary gland fibroadenomas, whichmay be indicative of high doses of benzophenone interfering with hormones suchas calcitonin and estradiol (Boorman, DeLellis & Elwell, 1996).
Clearly, low incidences of histiocytic sarcomas occurred in only one sex, andonly then at dose levels inducing toxicity and possibly affecting hormonal balance,rendering it highly likely that the occurrence of these tumours is a high-dosephenomenon that becomes manifest in severely affected female mice. A NOAELwas not defined.
Rats
Groups of 50 male and 50 female F344/N rats were maintained on dietscontaining benzophenone at concentrations of 0, 312, 625 or 1250 mg/kg for 105weeks (NTP, 2006). These dietary levels were estimated to provide a daily intakeof 0, 15, 30 or 60 mg/kg bw for males and 0, 15, 30 or 65 mg/kg bw for females,respectively. All animals were observed twice daily, and clinical signs were recordedmonthly. Body weights were measured weekly for the first 12 weeks and monthlythereafter. Necropsies were performed on all animals, including those that died orwere killed moribund during the study. All organs and tissues were evaluated forthe presence of gross lesions, which were histopathologically examined. Histo-logical examinations were performed on prepared tissues from all control and testanimals that died during the study. Organs of the treated rats that were targeted forpotential neoplastic and non-neoplastic effects were histopathologically examined.
Mortality rates for male rats approached 100% (96%) in the 1250 mg/kg feedgroup, but were high in all groups, including controls. A majority of the controlanimals that died during the study did so by week 93. No significant differences inmortality rates were reported between controls and any of the three test groups offemale rats. Mean body weights of males in the control and test groups peakedbetween weeks 62 (1250 mg/kg feed) and 86 (control) and then steadily decreaseduntil the end of the study.
The kidney was noted to be the principal target organ for toxic and neoplasticresponses in male rats. Chronic nephropathy and mineralization of the medulla werereported in essentially all (90–100%) control and test animals. The severity ofchronic nephropathy increased with dose. Dose-dependent increases in theincidence of renal tubule hyperplasia (1/50, 5/50, 20/50 and 23/50) and pelvictransitional epithelial hyperplasia (1/50, 11/50, 29/50 and 34/50) were reported.Upon microscopic evaluation of standard sectioning of the kidney, a non-statisticallysignificant increase in the incidence of renal tubule adenomas (1/50, 1/50, 2/50 and4/50) was reported. When microscopic evaluations were extended to stepsectioning, the incidences (2/50, 2/50, 4/50 and 8/50) of renal tubular neoplasmincreased to become statistically significant at the two highest dietary levels.
The NTP concluded that “Under the conditions of these 2-year studies, therewas some evidence of carcinogenic activity of benzophenone in male F344/N rats
AROMATIC SUBSTITUTED SECONDARY ALCOHOLS, KETONES, ESTERS (addendum) 179

based on increased incidences of renal tubular cell adenoma.” A NOEL was notidentified.
The results of this 2-year bioassay for benzophenone in the male F344/N ratmimic those of a number of NTP bioassays for other substances. The classic profileof results involves poor survival, mean body weight changes, chronic nephropathyand associated renal toxicity that are specific to this strain and sex of rat. Analysesby NTP researchers (Haseman, Hailey & Morris, 1998) have shown that the survivalrates of F344 male rats, both those in control groups and those in test groups oflong-term studies, have decreased significantly over the last several years. One ofthe major causes of death is severe chronic nephropathy, which has beenincreasing in incidence in more recent control groups (Eustis et al., 1994). Thisspecies-specific phenomenon is male predominant and in all probability reflects thesensitivity of the male rat kidney to chronic progressive nephropathy, focal tubularand pelvic transitional urothelial hyperplasia and specific tumorigenic responses.The interaction of test substances with spontaneous, age-related renal disease inlaboratory rats has recently been reviewed (Hard, 1998; Lock & Hard, 2004). Basedon a comprehensive review of renal tumours of all types reported in NTP bioassays,it seems that the interaction of chemical agents and spontaneous chronicprogressive nephropathy occurs at two levels: one, to exacerbate the rate of chronicprogressive nephropathy, and two, to stimulate tubule hyperplasia into foci ofatypical hyperplasia, eventually leading to adenomas. The induction of tumours viathis pathway normally produces a minimal response in male rats, leading to a lowincidence of tumours of relatively small size and low grade.
In the benzophenone study, poor survival, especially in control and high-dose animals, severely reduced the sensitivity of the study for detecting thepresence of a carcinogenic response in chemically exposed groups of male rats.Excessive mortality in the control group, which occurred primarily during the lastquarter of the study, limited the ability to detect the renal effects resulting fromchronic nephropathy. Mean body weights of both control and test males peakedlong before study termination (week 86 for control males to week 62 for high-dosemales), suggesting that systemic changes related to chronic nephropathy occurredand that the overall health of the animals was adversely affected. These weightchanges are similar to those observed in numerous bioassays for other substances(Hard, 1998). Nevertheless, the severity of the chronic nephropathy wassignificantly greater with increasing dose, as seen by increased renal tubulehyperplasia, increased hyperplasia of the transitional epithelium of the pelvis andincreased renal tubule adenoma in both single section evaluation and step sectionevaluation.
Sex specificity for renal pathology can, in part, be understood in terms of sex-specific differences for renal clearance of the major urinary metabolites. Themajority of ingested benzophenone is metabolized via reduction to yield theglucuronic acid conjugate of diphenylmethanol (benzhydrol) (Nakagawa, Suzuki &Tayama, 2000). As for other aliphatic and aromatic ketones (e.g. acetophenone), asteady state develops between the ketone and corresponding alcohol in vivo.Conjugation of the alcohol form and subsequent renal clearance of the conjugateshift the steady state, decreasing the in vivo concentration of the ketone. The fact
180 AROMATIC SUBSTITUTED SECONDARY ALCOHOLS, KETONES, ESTERS (addendum)

that female rats experience higher plasma concentrations of benzophenonecompared with male rats suggests that renal clearance is slower for females (NTP,2006). Conversely, renal tubular concentrations of the conjugate of diphenyl-methanol are expected to be higher in males. The observed sex difference issupported by other biochemical evidence.
The severity scores of ageing nephropathy were 1.3, 2.4, 3.3 and 3.8 for the0, 312, 625 and 1250 mg/kg feed groups of males, respectively. Ageing chronicnephropathy (Seely et al., 2002; Haseman et al., 2003; Hard & Khan, 2004; Hard &Seely, 2005) is considerably more severe in male rats compared with female ratsin most strains, including the F344. Although the reason for this difference is notcompletely understood, the much higher urinary concentration of protein, primarilybecause of -2u-globulin, in male rats is considered a major contributing factor.
Several modes of action for renal carcinogenesis in rats and mice haverecently been summarized (Lock & Hard, 2004). One of these modes is a markedincrease in the severity of ageing chronic nephropathy associated with an increaseof tumours, mostly adenomas. One of the characteristics of ageing chronicnephropathy is increased renal tubular degeneration and regenerative hyperplasia.Under normal circumstances, the degree of tubular proliferation is insufficient togenerate atypical hyperplastic foci adenomas. However, if the chronic nephropathyincreases in severity, as in the 2-year rat study, there is considerably more tubulardegeneration, but also, more importantly, an increase in tubular proliferation,hyperplastic foci and atypical hyperplastic foci and an increase in the incidence ofadenomas. The findings of the 2-year rat study support a conclusion that increasedseverity of ageing chronic nephropathy is an explanation for the renal tubular effectsproduced by benzophenone, together with a correlating dose-related change intubular proliferation response, a predominant (or exclusive) effect in malescompared with females, the lack of other changes (i.e. tubular necrosis, -2u-globulin, increased apoptosis) that could explain the effect and the lack of sucheffects in the mouse. Thus, in the 2-year rat study with benzophenone, it can beconcluded that the increasing severity of ageing chronic nephropathy is largelyresponsible for the renal tubular proliferation in the male rat. This mode of action isnot relevant to human renal carcinogenesis.
(d) Genotoxicity studies
In vitro and in vivo genotoxicity studies with three flavouring agents in thisgroup are summarized in Table 6 and described below.
(i) In vitro
No genotoxic potential was observed in the Ames test when Salmonellatyphimurium strain TA100 was incubated in the presence of 4-hydroxy-acetophenone (No. 2040) at 0.1–1000 μg/plate (Rapson, Nazar & Butsky, 1980).
No genotoxic potential was observed in the Ames test when S.typhimurium strains TA98, TA100, TA102, TA1535 and TA1537 were incubated inthe presence of 2,3,3-trimethylindan-1-one (No. 2047) at concentrations up to 5000μg/plate (Sokolowski, 2004).
AROMATIC SUBSTITUTED SECONDARY ALCOHOLS, KETONES, ESTERS (addendum) 181

Tabl
e 6.
Stu
dies
of g
enot
oxic
ity w
ith a
rom
atic
sub
stitu
ted
seco
ndar
y al
coho
ls, k
eton
es a
nd re
late
d es
ters
use
d as
flavo
urin
gag
ents
No.
Age
ntE
nd-p
oint
Tes
t obj
ect
Max
imum
conc
entr
atio
nR
esul
tsR
efer
ence
In v
itro
2040
4-H
ydro
xyac
etop
heno
neR
ever
se m
utat
ion
Sal
mon
ella
typh
imur
ium
TA
100
0.1,
1, 1
0, 1
00 a
nd10
00 μ
g/pl
ate
Neg
ativ
eR
apso
n, N
azar
&B
utsk
y (1
980)
2047
2,3,
3-T
rimet
hylin
dan-
1-on
eR
ever
se m
utat
ion
S. t
yphi
mur
ium
TA
98, T
A10
0,T
A10
2, T
A15
35 a
ndT
A15
37
1, 3
, 10,
33,
100
, 333
,10
00, 2
500
and
5000
μg/p
late
Neg
ativ
eS
okol
owsk
i (20
04)
2047
2,3,
3-T
rimet
hylin
dan-
1-on
eC
hrom
osom
alab
erra
tions
Chi
nese
ham
ster
ovar
y V
793.
9, 7
.8, 1
5.6,
31.
3,62
.5 a
nd 1
25 μ
g/m
lE
quiv
ocal
a,b
(see
text
)S
chul
z (2
006)
2048
4-(3
,4-M
ethy
lene
diox
yphe
nyl)-
2-bu
tano
neR
ever
se m
utat
ion
S. t
yphi
mur
ium
TA
98, T
A10
0,T
A15
35 a
ndT
A15
37
10, 3
3, 1
00, 3
33,
900,
100
0 an
d33
33 μ
g/pl
ate
Neg
ativ
eM
orte
lman
s et
al.
(198
6)
2048
4-(3
,4-M
ethy
lene
diox
yphe
nyl)-
2-bu
tano
neR
ever
se m
utat
ion
S. t
yphi
mur
ium
TA
98, T
A10
0,T
A15
35 a
ndT
A15
38
Up
to 3
600
μg/p
late
Neg
ativ
eW
ild e
t al.
(198
3)
In v
ivo
2047
2,3,
3-T
rimet
hylin
dan-
1-on
eM
icro
nucl
eus
assa
yM
ouse
312.
5, 6
25 a
nd 1
250
mg/
kg b
wN
egat
ivec,
dH
onar
var
(200
6)
182 AROMATIC SUBSTITUTED SECONDARY ALCOHOLS, KETONES, ESTERS (addendum)

Tabl
e 6
(con
td)
No.
Age
ntE
nd-p
oint
Tes
t obj
ect
Max
imum
con
cent
ratio
nR
esul
tsR
efer
ence
2047
2,3,
3-T
rimet
hylin
dan-
1-on
eM
icro
nucl
eus
assa
yM
ouse
1250
mg/
kg b
wN
egat
ivee
Hon
arva
r (2
006)
2048
4-(3
,4-M
ethy
lene
diox
yphe
nyl)-
2-bu
tano
neS
ex-li
nked
leth
alm
utat
ion
Dro
soph
ilam
elan
ogas
ter
5 m
mol
/lN
egat
ivef
Wild
et a
l. (1
983)
2048
4-(3
,4-M
ethy
lene
diox
yphe
nyl)-
2-bu
tano
neM
icro
nucl
eus
assa
yM
ouse
384,
576
and
768
mg/
kgbw
Neg
ativ
egW
ild e
t al.
(198
3)
a C
ytot
oxic
abo
ve 3
1.3
μg/m
l.b
With
met
abol
ic a
ctiv
atio
n.c
Adm
inis
tere
d vi
a ga
vage
.d
Tw
enty
-fou
r-ho
ur p
repa
ratio
n in
terv
al.
e F
orty
-eig
ht-h
our
prep
arat
ion
inte
rval
.f
Fee
ding
ass
ay.
g A
dmin
iste
red
via
intr
aper
itone
al in
ject
ions
.
AROMATIC SUBSTITUTED SECONDARY ALCOHOLS, KETONES, ESTERS (addendum) 183

2,3,3-Trimethylindan-1-one (No. 2047) dissolved in ethanol (at concen-trations of 3.9, 7.8, 15.6, 31.3, 62.5, 125 and 250 μg/ml, depending on theexperiment) was assessed for its potential to induce structural chromosomalaberrations in V79 cells of the Chinese hamster in vitro. In the absence of S9metabolic activation, no statistically significant differences in the number of cellscarrying structural chromosomal aberrations were observed between cells treatedwith 2,3,3-trimethylindan-1-one at 7.8, 15.6, 31.3, 62.5, 125 or 250 μg/ml andsolvent controls. In the presence of S9 mix, the author reported a statisticallysignificant concentration-dependent increase in the number of cells carryingstructural chromosomal aberrations in cells treated with 2,3,3-trimethylindan-1-oneat 31.3–125 μg/ml compared with solvent controls. However, at concentrationsabove 31.3 μg/ml, the results could not be evaluated, and at concentrations below31.3 μg/ml, the results were not listed as significant. The study author concludedthat 2,3,3-trimethylindan-1-one is clastogenic in this chromosomal aberration testin the presence of metabolic activation (Schulz, 2006).
In the above assays with S9 activation, the two highest doses wereconsidered cytotoxic owing to low cell viability compared with solvent controls(37.5% and 21.1%, respectively). The 31.3 μg/ml dose was not consideredcytotoxic, despite the fact that the cell viability was only 77.3% and the fact that inpre-study toxicity tests, cells exposed to 2,3,3-trimethylindan-1-one at 27.3 μg/mland 54.7 μg/ml for 4 h were only 60.2% and 39.9% viable, respectively. Additionally,the mitotic index of the 31.3 μg/ml dose-treated cells was 79% that of solventcontrols. At 31.3 μg/ml, it was not determined whether the positive evidence ofchromosomal aberration was due to genotoxic effects or to the displayedcytotoxicity. Additionally, the lack of positive effects in the absence of S9 metabolicactivation and the uniformly negative results of the other genotoxicity assays usingin vitro bacterial and in vivo mammalian systems argue for a more rigorousevaluation by the author (Schulz, 2006).
No genotoxic potential was observed in the Ames test when S.typhimurium strains TA98, TA100, TA1535 and TA1537 were incubated in the pres-ence of 4-(3,4-methylenedioxyphenyl)-2-butanone (No. 2048) at 10–3333 μg/plate(Mortelmans et al., 1986). In a similar group of tests, no genotoxic potential wasobserved in the Ames test when S. typhimurium strains TA98, TA100, TA1535 andTA1538 were incubated in the presence of 4-(3,4-methylenedioxyphenyl)-2-butanone at concentrations up to 3600 μg/plate (Wild et al., 1983).
It was also noted that benzophenone (No. 831) was not mutagenic whenevaluated in the Ames test (Mortelmans et al., 1986).
(ii) In vivo
In a standard micronucleus induction assay, mice were administered 2,3,3-trimethylindan-1-one (No. 2047) at doses up to 1250 mg/kg bw by gavage(Honarvar, 2006). Bone marrow isolated from the femur of each animal revealed noincrease in micronucleated polychromatic erythrocytes (Honarvar, 2006).
184 AROMATIC SUBSTITUTED SECONDARY ALCOHOLS, KETONES, ESTERS (addendum)
In a standard basc assay, no sex-linked lethal mutations were observedwhen Drosophila melanogaster were fed 5 mmol/l solutions of 4-(3,4-methylenedioxyphenyl)-2-butanone (No. 2048) (Wild et al., 1983).
No increases in micronuclei were observed in bone marrow smears whengroups of male NMRI mice (four per dose) were administered 4-(3,4-methylenedioxyphenyl)-2-butanone (No. 2048) at doses of 384, 576 or 768 mg/kgbw by intraperitoneal injection (Wild et al., 1983).
(e) Developmental and reproductive studies of toxicity
New information was provided on the developmental and reproductiveeffects of two members of this group of flavouring agents that had been evaluatedpreviously.
In a limited developmental toxicity study, groups of 10 female Sprague-Dawley rats were administered acetophenone (No. 806) via gavage at doses of 0,75, 225 or 750 mg/kg bw per day for a minimum of 14 days through day 3 of lactation.There were no parental deaths. Mating and fertility indices and mean gestationlength were unaffected by acetophenone administration up to 750 mg/kg bw perday. The live birth index, pup survival during lactation and pup body weights weredecreased for the 750 mg/kg bw per day group offspring. The authors of this abstractconcluded that the NOAEL for reproductive effects was 225 mg/kg bw per day (Kappet al., 2003).
In a developmental toxicity study, 25 female CD rats were administeredbenzophenone (No. 831) via gavage at a dose of 0, 100, 200 or 300 mg/kg bw perday on gestational days 6 through 19. Dams were monitored for clinical signs, foodand water intake and body weight. At necropsy on gestational day 20, maternalclinical condition, body, liver, paired kidney and gravid uterine weights, pregnancystatus and number of corpora lutea were recorded. In the gravid uterus, the numbersof resorbed, dead or live fetuses were recorded. All live fetuses were weighed,sexed and examined for external morphological anomalies. Approximately half ofthe fetuses were examined for visceral anomalies, including internal headstructures, and the remainder of the fetuses were examined for skeletalirregularities. Confirmed pregnancy rates were 88–100% per group. No treatment-related maternal deaths occurred. Clinical signs observed were lethargy,piloerection, weight loss and rooting in the bedding after dosing. Maternal bodyweight gain was reduced for all doses from gestational days 6 to 9 and at the highdose from days 9 to 12. Increased body weight gain was observed for the middledose group on gestational days 9–12 and 19–20 and for the high dose group ongestational days 18–20. Gestational weight gain corrected for gravid uterine weightwas reduced at all doses. Maternal liver and kidney weights were significantlyincreased at all doses. A significant decrease in feed intake was noted for all highdose groups throughout the study. Relative water intake throughout the study wascomparable between test animals and controls. Average fetal weight per litterdecreased relative to increasing dose of benzophenone. There was no effect onprenatal viability or overall incidences of fetal malformations. The incidence ofunossified sternebrae was increased at all doses, and the incidence of an extra rib
AROMATIC SUBSTITUTED SECONDARY ALCOHOLS, KETONES, ESTERS (addendum) 185

on lumbar I was increased at the middle and high doses. Overall, the authorsconcluded that evidence of maternal toxicity was present at each dose level,precluding the determination of a NOAEL. The authors explained that this outcomeshould not be considered atypical. They noted that NOAELs were not establishedin previous studies of developmental toxicity in female rats with benzophenone(NTP, 2002).
3. REFERENCES
Arcelin G (2004). Acute oral toxicity study in rats. RCC Ltd, Füllinsdorf, Switzerland.Unpublished report to the Flavor and Extract Manufacturers Association, Washington, DC,USA. Submitted to WHO by the International Organization of the Flavor Industry, Brussels,Belgium.
Boorman GA, DeLellis RA, Elwell MR (1996). C-cell hyperplasia, C-cell adenoma, and C-cellcarcinoma thyroid, rat. In: Jones TC, Capen CC, Mohr U, eds. Endocrine system:monograph of pathology of laboratory animals. Berlin, Germany, Springer-Verlag,pp. 262–274.
Cramer GM, Ford RA, Hall RL (1978). Estimation of toxic hazard—a decision tree approach.Food and Cosmetics Toxicology, 16:255–276.
European Flavour and Fragrance Association (2004). European inquiry on volume of use.Unpublished report. Submitted to WHO by the International Organization of the FlavorIndustry, Brussels, Belgium.
Eustis SL et al. (1994). The utility of multiple-section sampling in the histopathologicalevaluation of the kidney for carcinogenicity studies. Toxicologic Pathology, 22(5):457–472.
Finco DR (1989). Kidney function. In: Kaneko JJ, ed. Clinical biochemistry of domesticanimals, 4th ed. San Diego, CA, USA, Academic Press, pp. 496–542.
Fischer L (2007). 28-day oral toxicity (gavage) study of Wistar rat. RCC Ltd, Itinger,Switzerland. Unpublished report to the Flavor and Extract Manufacturers Association,Washington, DC, USA. Submitted to WHO by the International Organization of the FlavorIndustry, Brussels, Belgium.
Gaunt IF et al. (1974). Short-term toxicity of methyl phenylcarbinyl acetate in rats. Food andCosmetics Toxicology, 12:185–194.
Gavin CL, Williams MC, Hallagan JB (2008). 2005 poundage and technical effects updatesurvey. Washington, DC, USA, Flavor and Extract Manufacturers Association.
Hard GC (1998). Mechanisms of chemically induced renal carcinogenesis in the laboratoryrodent. Toxicologic Pathology, 26(1):104–112.
Hard GC, Khan KN (2004). A contemporary overview of chronic progressive nephropathy inthe laboratory rat, and its significance for human risk assessment. Toxicologic Pathology,32:171–180.
Hard GC, Seely JC (2005). Recommendations for the interpretation of renal tubule proliferativelesions occurring in rat kidneys with advanced chronic progressive nephropathy (CPN).Toxicologic Pathology, 33:641–649.
Haseman JK, Hailey JR, Morris RW (1998). Spontaneous neoplasm incidences in Fischer 344rats and B6C3F1 mice in two-year carcinogenicity studies: a National Toxicology Programupdate. Toxicologic Pathology, 26(3):428–441.
Haseman JK et al. (2003). Effect of diet and animal care/housing protocols on body weight,survival, tumor incidences, and nephropathy severity of F344 rats in chronic studies.Toxicologic Pathology, 31:674–681.
Honarvar N (2006). Micronucleus assay in bone marrow cells of the mouse with safraleine.Cytotest Cell Research, Rossdorf, Germany. Unpublished report to the Flavor and Extract
186 AROMATIC SUBSTITUTED SECONDARY ALCOHOLS, KETONES, ESTERS (addendum)

Manufacturers Association, Washington, DC, USA. Submitted to WHO by the InternationalOrganization of the Flavor Industry, Brussels, Belgium.
International Organization of the Flavor Industry (2009). Interim inquiry on volume use andadded use levels for flavoring agents to be presented at the JECFA 73rd meeting.Submitted to WHO by the International Organization of the Flavor Industry, Brussels,Belgium.
Japan Flavor and Fragrance Materials Association (2005). JFFMA poundage survey 2005:Japanese inquiry on volume use. Submitted to WHO by the International Organization ofthe Flavor Industry, Brussels, Belgium.
Kapp RW et al. (2003). A combined repeated dose toxicity study and reproduction/developmental screening study in Sprague-Dawley rats with acetophenone (OECDGuideline No. 422). Toxicologist, 72(Suppl. 1):76–77 (abstract).
Lock EA, Hard GC (2004). Chemically induced renal tubule tumors in the laboratory rat andmouse: review of the NCI/NTP database and categorization of renal carcinogens basedon mechanistic information. Critical Reviews in Toxicology, 34(3):211–299.
Maronpot RR et al. (1987). Liver lesions in B6C3F1 mice: the National Toxicology Program,experience and position. Archives of Toxicology, Supplement, 10:10–26.
Mortelmans K et al. (1986). Salmonella mutagenicity tests: II. Results from the testing of 270chemicals. Environmental Mutagenesis, 8(7):1–119.
Nakagawa Y, Suzuki T, Tayama S (2000). Metabolism and toxicology of benzophenone inisolated rat hepatocytes and estrogenic activity of its metabolites in MCF-7 cells.Toxicology, 156(1):27–36.
Nijssen B, van Ingen-Visscher K, Donders J, eds (2009). VCF (Volatile Compounds in Food)database. Version 9.1. Zeist, Netherlands, TNO Quality of Life (http://www.vcf-online.nl/VcfHome.cfm).
NTP (2000). NTP technical report on the toxicity studies of benzophenone (CAS No. 119-61-9)administered in feed to F344 rats and B6C3F1 mice. Research Triangle Park, NC, USA,Department of Health and Human Services, National Institutes of Health, NationalToxicology Program (NIH Publication No. 00-3943).
NTP (2002). NTP final report on the developmental toxicity evaluation for benzophenone (CASNo. 119-61-9) administered by gavage to Sprague-Dawley (CD) rats on gestational days6 through 19. Research Triangle Park, NC, USA, Department of Health and HumanServices, National Institutes of Health, National Toxicology Program (NIH Publication No.00-3943).
NTP (2006). Toxicology and carcinogenesis studies of benzophenone (CAS No. 119-61-9) inF344/N rats and B6C3F1 mice (feed studies). Research Triangle Park, NC, USA,Department of Health and Human Services, National Institutes of Health, NationalToxicology Program (NTP TR 533; NIH Publication No. 05-4469).
Posternak JM, Linder A, Vodoz CA (1969). Summaries of toxicological data. Toxicologicaltests on flavoring matters. Food and Cosmetics Toxicology, 7:405–407.
Ragan HA (1989). Markers of renal function and injury. In: Loeb WF, Quimby FW, eds. Theclinical chemistry of laboratory animals. New York, NY, USA, Pergamon Press,pp. 321–343.
Rapson WH, Nazar MA, Butsky VV (1980). Mutagenicity produced by aqueous chlorination oforganic compounds. Bulletin of Environmental Contamination and Toxicology,24:590–596.
Schulz M (2006). In vitro chromosome aberration test in Chinese hamster V79 cells withsafraleine. Cytotest Cell Research, Rossdorf, Germany. Unpublished report to the Flavorand Extract Manufacturers Association, Washington, DC, USA. Submitted to WHO by theInternational Organization of the Flavor Industry, Brussels, Belgium.
Seely JC et al. (2002) The effect of chronic progressive nephropathy on the incidence of renaltubule cell neoplasms in control male F344 rats. Toxicologic Pathology, 30(6):681–686.
AROMATIC SUBSTITUTED SECONDARY ALCOHOLS, KETONES, ESTERS (addendum) 187

Sokolowski A (2004). Salmonella typhimurium reverse mutation assay with GR-84-4441.Cytotest Cell Research, Rossdorf, Germany. Unpublished report to the Flavor and ExtractManufacturers Association, Washington, DC, USA. Submitted to WHO by the InternationalOrganization of the Flavor Industry, Brussels, Belgium.
Stofberg J, Grundschober F (1987). Consumption ratio and food predominance of flavoringmaterials. Perfumer & Flavorist, 12:27.
Wild D et al. (1983). Study of artificial flavoring substances for mutagenicity in theSalmonella/microsome, basc, and micronucleus tests. Food and Chemical Toxicology,21(6):707–719.
Wohl AJ (1974). Acute oral toxicity (rat); dermal toxicity (rabbit) of piperonyl acetone.Unpublished report to the Flavor and Extract Manufacturers Association, Washington, DC,USA. Submitted to WHO by the International Organization of the Flavor Industry, Brussels,Belgium.
188 AROMATIC SUBSTITUTED SECONDARY ALCOHOLS, KETONES, ESTERS (addendum)

BENZYL DERIVATIVES (addendum)
First draft prepared by
Professor I.G. Sipes,1 Dr M. DiNovi,2 Dr J.C. Larsen3 andProfessor A.G. Renwick4
1 College of Medicine, University of Arizona, Tucson, Arizona, United Statesof America (USA)
2 Center for Food Safety and Applied Nutrition, Food and Drug Administration,College Park, Maryland, USA
3 National Food Institute, Technical University of Denmark, Søborg, Denmark4 School of Medicine, University of Southampton, Southampton, England
1. Evaluation ..............................................................................1.1 Introduction ......................................................................1.2 Assessment of dietary exposure .....................................1.3 Absorption, distribution, metabolism and elimination ......1.4 Application of the Procedure for the Safety Evaluation of
Flavouring Agents ...........................................................1.5 Consideration of combined intakes from use as flavouring
agents ..............................................................................1.6 Consideration of secondary components ........................1.7 Conclusion .......................................................................
2. Relevant background information ..........................................2.1 Explanation ......................................................................2.2 Additional considerations on intake .................................2.3 Biological data .................................................................
2.3.1 Biochemical data: absorption, distribution,metabolism and elimination ....................................
2.3.2 Toxicological studies ..............................................3. References ............................................................................
1. EVALUATION
1.1 Introduction
The Committee evaluated eight additional flavouring agents belonging to thegroup of benzyl derivatives that was previously evaluated. The structural featurecommon to all members of the group is a primary oxygenated functional groupbonded directly to a benzene ring or a functional group metabolized to a benzylalcohol or benzoic acid derivative. The ring may also have alkyl substituents. Theevaluations were conducted using the Procedure for the Safety Evaluation ofFlavouring Agents (Figure 1, Introduction) (Annex 1, reference 131). None of theseflavouring agents has previously been evaluated.
The Committee previously evaluated 37 other members of this group offlavouring agents at its fifty-seventh meeting (Annex 1, reference 155). The
189189190190
197
197198198198198199199
199199204
- 189 -

Committee concluded that all 37 flavouring agents in this group were of no safetyconcern based on estimated dietary exposures.
Three of the additional eight flavouring agents (Nos 2061, 2062 and 2068)have been reported to occur naturally and can be found in passion fruit juice,cinnamon bark, cassia leaf, Tahitian vanilla and raw cabbage (Nijssen, van Ingen-Visscher & Donders, 2009).
1.2 Assessment of dietary exposure
The total annual volumes of production of the eight benzyl derivatives areapproximately 27 kg in Europe, 3 kg in the USA and 17 kg in Japan (EuropeanFlavour and Fragrance Association, 2004; Japan Flavour and Fragrance MaterialsAssociation, 2005; Gavin, Williams & Hallagan, 2008; International Organization ofthe Flavor Industry, 2009). Approximately 70% and 100% of the total annualvolumes of production in Europe and in the USA, respectively, are accounted for byo-anisaldehyde (No. 2062). In Japan, approximately 50% of the total annual volumeof production is accounted for by benzyl levulinate (No. 2064).
The estimated dietary exposures for each of the flavouring agents,calculated either as the maximized survey-derived intake (MSDI) or using the singleportion exposure technique (SPET), are reported in Table 1. The highest estimateis for benzyl hexanoate (No. 2061) (300 μg, the SPET value obtained for non-alcoholic beverages). For the other flavouring agents in the group, the daily dietaryexposures range from 0.004 to 240 μg, with the SPET yielding the highest estimatesfor all. Annual volumes of production of this group of flavouring agents as well asthe daily dietary exposures calculated as the MSDI or using the SPET aresummarized in Table 2.
1.3 Absorption, distribution, metabolism and elimination
Metabolic information on this group was considered at the fifty-seventhmeeting of the Committee (Annex 1, reference 155). In general, aromatic esters andacetals are hydrolysed in vivo through the catalytic activity of A-type carboxyl-esterases that predominate in hepatocytes (Heymann, 1980; Anders, 1989). Benzylesters and acetals are hydrolysed to benzyl alcohol and benzaldehyde,respectively, followed by oxidation to yield benzoic acid. Benzoate esters arehydrolysed to benzoic acid.
Benzyl derivatives have been shown to be rapidly absorbed through the gut,metabolized primarily in the liver and excreted in the urine as glycine conjugates ofbenzoic acid derivatives (Davison, 1971; Abdo et al., 1985; Temellini, 1993). At highdose levels, formation of the glycine conjugate is glycine limited. When glycine isdepleted, free benzoic acid may sequester acetyl coenzyme A or be excretedunchanged or as the glucuronic acid conjugate. Alkyl substituents on the aromaticring have little influence on the principal pathways of metabolism.
190 BENZYL DERIVATIVES (addendum)

Tabl
e 1.
Sum
mar
y of
the
resu
lts o
f the
saf
ety
eval
uatio
ns o
f ben
zyl d
eriv
ativ
es u
sed
as fl
avou
ring
age
ntsa,
b,c
Fla
vour
ing
agen
tN
o.C
AS
No.
and
str
uctu
reS
tep
A3d
Doe
s in
take
exce
ed th
eth
resh
old
for
hum
an in
take
?
Com
men
ts o
npr
edic
ted
met
abol
ism
Con
clus
ion
base
don
cur
rent
estim
ated
die
tary
expo
sure
Str
uctu
ral c
lass
I
Ben
zyl h
exan
oate
2061
6938
-45-
0
O
OH
No,
SP
ET
: 300
Not
e 1
No
safe
ty c
once
rn
o-A
nisa
ldeh
yde
2062
135-
02-4
O
OH
No,
SP
ET
: 40
Not
e 2
No
safe
ty c
once
rn
Pre
nyl b
enzo
ate
2063
5205
-11-
8
O O
No,
SP
ET
: 180
Not
e 3
No
safe
ty c
once
rn
BENZYL DERIVATIVES (addendum) 191

Tabl
e 1
(con
td)
Fla
vour
ing
agen
tN
o.C
AS
No.
and
str
uctu
reS
tep
A3d
Doe
s in
take
exce
ed th
eth
resh
old
for
hum
an in
take
?
Com
men
ts o
npr
edic
ted
met
abol
ism
Con
clus
ion
base
don
cur
rent
estim
ated
die
tary
expo
sure
Ben
zyl l
evul
inat
e20
6469
39-7
5-9
O
No,
SP
ET
: 240
Not
e 1
No
safe
ty c
once
rn
4-M
ethy
lben
zyl a
lcoh
ol20
6558
9-18
-4
OH
O
No,
SP
ET
: 3N
ote
4N
o sa
fety
con
cern
Ben
zyl n
onan
oate
2066
6471
-66-
5
O
O
O
O
CH
3
CH
3
HC 3
No,
SP
ET
: 125
Not
e 1
No
safe
ty c
once
rn
192 BENZYL DERIVATIVES (addendum)

Tabl
e 1
(con
td)
Fla
vour
ing
agen
tN
o.C
AS
No.
and
str
uctu
reS
tep
A3d
Doe
s in
take
exce
ed th
eth
resh
old
for
hum
an in
take
?
Com
men
ts o
npr
edic
ted
met
abol
ism
Con
clus
ion
base
don
cur
rent
estim
ated
die
tary
expo
sure
Str
uctu
ral c
lass
II
2-E
thyl
hexy
l ben
zoat
e20
6854
44-7
5-7
O
No,
SP
ET
: 3N
ote
3N
o sa
fety
con
cern
Str
uctu
ral c
lass
III
4-M
ethy
lben
zald
ehyd
epr
opyl
eneg
lyco
l ace
tal
2067
5824
4-29
-4
O
O O
No,
SP
ET
: 80
Not
es 4
and
5N
o sa
fety
con
cern
CA
S, C
hem
ical
Abs
trac
ts S
ervi
cea
Thi
rty-
seve
n fla
vour
ing
agen
ts in
this
gro
up w
ere
prev
ious
ly e
valu
ated
by
the
Com
mitt
ee (
Ann
ex 1
, ref
eren
ce 1
55).
bS
tep
1: S
ix o
f the
flav
ourin
g ag
ents
in th
is g
roup
(N
os 2
061–
2066
) ar
e in
str
uctu
ral c
lass
I; o
ne (
No.
206
8) is
in s
truc
tura
l cla
ss ll
; and
one
(N
o. 2
067)
is in
str
uctu
ral c
lass
IIl.
cS
tep
2: A
ll of
the
flavo
urin
g ag
ents
in th
is g
roup
can
be
pred
icte
d to
be
met
abol
ized
to in
nocu
ous
prod
ucts
.d
The
thre
shol
ds fo
r hu
man
inta
ke fo
r st
ruct
ural
cla
sses
I, II
and
III a
re 1
800,
540
and
90
μg/d
ay, r
espe
ctiv
ely.
All
inta
ke v
alue
s ar
e ex
pres
sed
in μ
g/da
y. E
ither
the
high
est S
PE
T e
stim
ate
or th
e M
SD
I est
imat
es, i
f at l
east
one
is h
ighe
r th
an th
e hi
ghes
t SP
ET
est
imat
e, a
re g
iven
in th
e ta
ble.
BENZYL DERIVATIVES (addendum) 193

Tabl
e 1
(con
td)
Not
es:
1.It
is a
ntic
ipat
ed th
at th
e es
ter
will
hyd
roly
se to
form
ben
zyl a
lcoh
ol a
nd a
n al
kano
ic a
cid.
The
ben
zyl a
lcoh
ol is
ant
icip
ated
to u
nder
go o
xida
tion
tobe
nzoi
c ac
id, w
hich
form
s co
njug
ates
with
gly
cine
that
are
exc
rete
d in
the
urin
e. T
he a
lkan
oic
acid
will
und
ergo
fatty
aci
d de
grad
atio
n.2.
Ben
zald
ehyd
es a
re a
ntic
ipat
ed to
und
ergo
oxi
datio
n to
the
corr
espo
ndin
g be
nzoi
c ac
id d
eriv
ativ
e an
d fo
rm c
onju
gate
s w
ith g
lyci
ne th
at a
re e
limin
ated
in th
e ur
ine.
3.It
is a
ntic
ipat
ed th
at th
e es
ter
will
rea
dily
hyd
roly
se, f
orm
ing
benz
oic
acid
and
pre
nyl a
lcoh
ol. B
enzo
ic a
cid
read
ily fo
rms
conj
ugat
es w
ith g
lyci
ne,
whi
ch a
re e
limin
ated
in th
e ur
ine.
Pre
nyl a
lcoh
ol w
ill u
nder
go o
xida
tive
met
abol
ism
.4.
Oxi
dize
d to
a b
enzo
ic a
cid
anal
ogue
and
exc
rete
d in
the
urin
e as
a g
lyci
ne o
r gl
ucur
onic
aci
d co
njug
ate.
5.H
ydro
lysi
s of
the
acet
al to
a b
enza
ldeh
yde
deriv
ativ
e.
194 BENZYL DERIVATIVES (addendum)
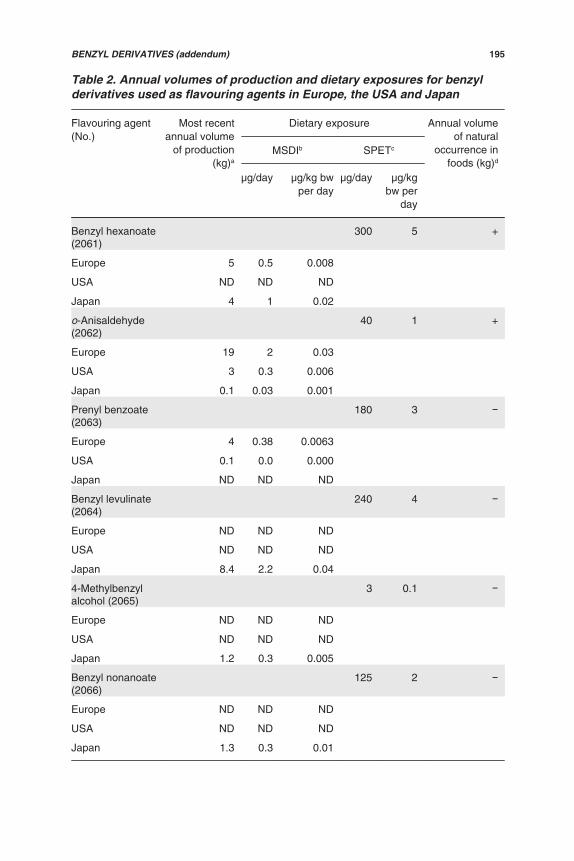
Table 2. Annual volumes of production and dietary exposures for benzylderivatives used as flavouring agents in Europe, the USA and Japan
Flavouring agent(No.)
Most recentannual volume
of production(kg)a
Dietary exposure Annual volumeof natural
occurrence infoods (kg)d
MSDIb SPETc
μg/day μg/kg bwper day
μg/day μg/kgbw per
day
Benzyl hexanoate(2061)
300 5 +
Europe 5 0.5 0.008
USA ND ND ND
Japan 4 1 0.02
o-Anisaldehyde(2062)
40 1 +
Europe 19 2 0.03
USA 3 0.3 0.006
Japan 0.1 0.03 0.001
Prenyl benzoate(2063)
180 3
Europe 4 0.38 0.0063
USA 0.1 0.0 0.000
Japan ND ND ND
Benzyl levulinate(2064)
240 4
Europe ND ND ND
USA ND ND ND
Japan 8.4 2.2 0.04
4-Methylbenzylalcohol (2065)
3 0.1
Europe ND ND ND
USA ND ND ND
Japan 1.2 0.3 0.005
Benzyl nonanoate(2066)
125 2
Europe ND ND ND
USA ND ND ND
Japan 1.3 0.3 0.01
BENZYL DERIVATIVES (addendum) 195
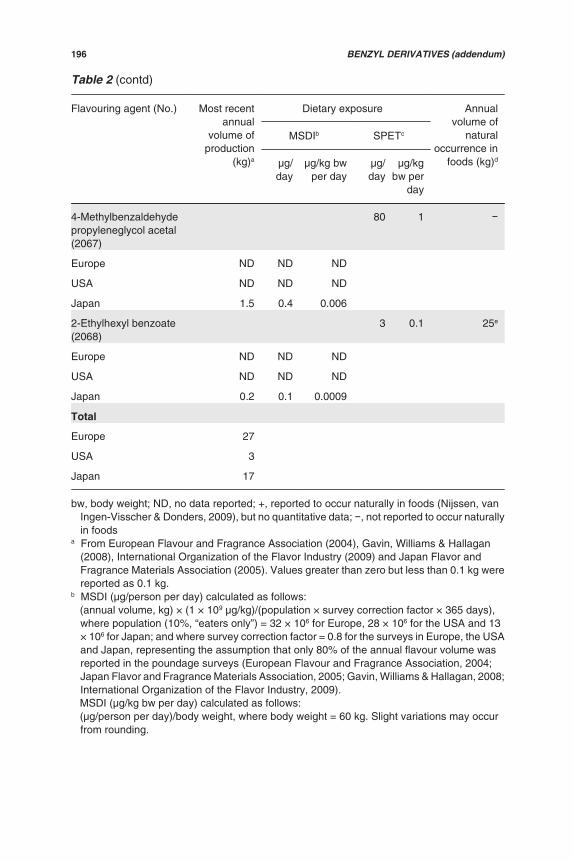
Table 2 (contd)
Flavouring agent (No.) Most recentannual
volume ofproduction
(kg)a
Dietary exposure Annualvolume of
naturaloccurrence in
foods (kg)d
MSDIb SPETc
μg/day
μg/kg bwper day
μg/day
μg/kgbw per
day
4-Methylbenzaldehydepropyleneglycol acetal(2067)
80 1
Europe ND ND ND
USA ND ND ND
Japan 1.5 0.4 0.006
2-Ethylhexyl benzoate(2068)
3 0.1 25e
Europe ND ND ND
USA ND ND ND
Japan 0.2 0.1 0.0009
Total
Europe 27
USA 3
Japan 17
bw, body weight; ND, no data reported; +, reported to occur naturally in foods (Nijssen, vanIngen-Visscher & Donders, 2009), but no quantitative data; , not reported to occur naturallyin foods
a From European Flavour and Fragrance Association (2004), Gavin, Williams & Hallagan(2008), International Organization of the Flavor Industry (2009) and Japan Flavor andFragrance Materials Association (2005). Values greater than zero but less than 0.1 kg werereported as 0.1 kg.
b MSDI (μg/person per day) calculated as follows: (annual volume, kg) × (1 × 10⁹ μg/kg)/(population × survey correction factor × 365 days),
where population (10%, “eaters only”) = 32 × 106 for Europe, 28 × 106 for the USA and 13× 106 for Japan; and where survey correction factor = 0.8 for the surveys in Europe, the USAand Japan, representing the assumption that only 80% of the annual flavour volume wasreported in the poundage surveys (European Flavour and Fragrance Association, 2004;Japan Flavor and Fragrance Materials Association, 2005; Gavin, Williams & Hallagan, 2008;International Organization of the Flavor Industry, 2009).
MSDI (μg/kg bw per day) calculated as follows: (μg/person per day)/body weight, where body weight = 60 kg. Slight variations may occur
from rounding.
196 BENZYL DERIVATIVES (addendum)

Table 2 (contd)
c SPET (μg/person per day) calculated as follows: (standard food portion, g/day) × (average use level) (International Organization of the Flavor
Industry, 2009). The dietary exposure from the single food category leading to the highestdietary exposure from one portion is taken as the SPET estimate.
SPET (μg/kg bw per day) calculated as follows: (μg/person per day)/body weight, where body weight = 60 kg. Slight variations may occur
from rounding.d Quantitative data for the USA reported by Stofberg & Grundschober (1987).e The consumption ratio (annual consumption via food, kg)/(most recent reported volume of
production as a flavouring agent, kg) was not determined, as no volume of production as aflavouring substance was available for the USA.
1.4 Application of the Procedure for the Safety Evaluation of FlavouringAgents
Step 1. In applying the Procedure for the Safety Evaluation of FlavouringAgents to the above-mentioned flavouring agents, the Committee assigned six ofthe flavouring agents (Nos 2061–2066) to structural class I, one of the flavouringagents (No. 2068) to structural class II and one (No. 2067) to structural class III(Cramer, Ford & Hall, 1978).
Step 2. All the flavouring agents in this group (Nos 2061–2068) are expectedto be metabolized to innocuous products. The evaluation of all flavouring agents inthis group therefore proceeded via the A-side of the Procedure.
Step A3. The highest estimated daily intakes of all six of the flavouring agentsin structural class I are below the threshold of concern (i.e. 1800 μg/person per dayfor class I). The highest estimated daily intake for the one flavouring agent instructural class II is below the threshold of concern (i.e. 540 μg/person per day forclass II). The highest estimated daily intake for the one flavouring agent in structuralclass III is below the threshold of concern (i.e. 90 μg/person per day for class III).The safety of these eight flavouring agents raises no concern at current estimateddietary exposures.
Table 1 summarizes the evaluations of the eight benzyl derivatives (Nos2061–2068) in this group when used as flavouring agents.
1.5 Consideration of combined intakes from use as flavouring agents
The safety assessment of possible combined intakes of flavouring agentswas based on the presence of common metabolites or a homologous series (asproposed at the sixty-eighth meeting; Annex 1, reference 187) and using the MSDIexposure assessment (as proposed at the sixty-ninth meeting; Annex 1, reference190).
Flavouring agents with the highest intakes in this group that have thecommon metabolite benzyl alcohol, which is in structural class I, are Nos 23–25,842 and 843. In the unlikely event that these were to be consumed concurrently ona daily basis, the estimated combined intakes in Europe and the USA would be
BENZYL DERIVATIVES (addendum) 197

18 000 and 4700 μg/person per day, respectively, which would exceed the thresholdof concern (i.e. 1800 μg/person per day for class I). The majority of this combinedintake would be from benzyl alcohol itself (No. 25). All of these agents are expectedto be efficiently metabolized and would not saturate metabolic pathways. TheCommittee concluded that combined intake would not raise concern about safety.
Flavouring agents with the highest intakes in this group that have thecommon metabolite benzaldehyde, which is in structural class I, are Nos 22, 837–839 and 867. In the unlikely event that these were to be consumed concurrently ona daily basis, the estimated combined intakes in Europe and the USA would be 9300and 36 200 μg/person per day, respectively, which would exceed the threshold ofconcern (i.e. 1800 μg/person per day for class I). The majority of this combinedintake would be from benzaldehyde itself (No. 22). All of these agents are expectedto be efficiently metabolized and would not saturate metabolic pathways. TheCommittee concluded that combined intake would not raise concern about safety.
Flavouring agents with the highest intakes in this group that have thecommon metabolite benzoic acid, which is in structural class I, are Nos 850–852,854, 857 and 861. In the unlikely event that these were to be consumed concurrentlyon a daily basis, the estimated combined intakes in Europe and the USA would be800 and 1800 μg/person per day, respectively, which would not exceed thethreshold of concern (i.e. 1800 μg/person per day for class I). The Committeeconcluded that combined intake would not raise concern about safety.
1.6 Consideration of secondary components
No members of this group of flavouring agents have a minimum assay valueof less than 95%.
1.7 Conclusion
In the previous evaluation of flavouring agents in this group, studies of acutetoxicity, short-term toxicity and genotoxicity were available. None raised safetyconcerns. The toxicity data available for this evaluation supported those from theprevious evaluation (Annex 1, reference 155). The Committee concluded that theseeight flavouring agents, which are additions to the group of benzyl derivativesevaluated previously, would not give rise to safety concerns at current estimateddietary exposures.
2. RELEVANT BACKGROUND INFORMATION
2.1 Explanation
This monograph summarizes the additional key data relevant to the safetyevaluation of the group of eight benzyl derivatives. The structural feature commonto all members of the group is a primary oxygenated functional group bondeddirectly to a benzene ring or a functional group metabolized to a benzyl alcohol orbenzoic acid derivative. The ring may also have alkyl substituents. The eight benzylderivatives are additions to a group of 37 flavouring agents evaluated by theCommittee at its fifty-seventh meeting (Annex 1, reference 155).
198 BENZYL DERIVATIVES (addendum)

2.2 Additional considerations on intake
There is no additional information on intake. Dietary exposures wereestimated using the MSDI approach or the SPET.
2.3 Biological data
2.3.1 Biochemical data: absorption, distribution, metabolism and elimination
Relevant data on the absorption, distribution, metabolism and excretion ofthese flavouring agents have not been reported since the publication of the originalmonograph (Annex 1, reference 155).
2.3.2 Toxicological studies
(a) Acute toxicity
Oral median lethal doses (LD50 values) have been reported for three of theeight flavouring agents in this group and for three previously evaluated flavouringagents (Table 3). For o-anisaldehyde (No. 2062), LD50 values in rats ranged from500 to 2500 mg/kg body weight (bw) (Bär & Griepentrog, 1967; Bailey, 1976;Moreno, 1977). For prenyl benzoate (No. 2063), LD50 values in rats ranged from2000 to 4700 mg/kg bw (Moreno, 1978; Gardner, 1987). For 4-methylbenzyl alcohol(No. 2065), an LD50 of 3900 mg/kg bw in rats was found (Moreno, 1978).
These studies demonstrate that the acute oral toxicity of benzyl derivativesis low.
Table 3. Results of acute oral toxicity studies for benzyl derivatives used asflavouring agents
No. Flavouring agent Species; sex LD50 (mg/kg bw) Reference
2062 o-Anisaldehyde Rat; NR 2500 Moreno (1977)
2062 o-Anisaldehyde Rat; NR 1510 Bär & Griepentrog (1967)
2062 o-Anisaldehyde Rat; NR >500 but <5000 Bailey (1976)
2063 Prenyl benzoate Rat; NR 4700 Moreno (1978)
2063 Prenyl benzoate Rat; M, F >2000 but <5000 Gardner (1987)
2065 4-Methylbenzyl alcohol Rat; NR 3900 Moreno (1978)
850 Benzoic acid Mouse; M >2000a Sasaki et al. (2002)
870 Butyl p-hydroxybenzoate Mouse; NR 230 Sokol (1952)
878 cis-3-Hexenyl benzoate Rat; NR >5000a Moreno (1976)
F, female; M, male; NR, not reporteda A single-dose study or the highest dose tested. The actual LD50 may be higher.
BENZYL DERIVATIVES (addendum) 199

(b) Short-term studies of toxicity
The results of short-term studies of toxicity have been reported for o-anisaldehyde (No. 2062). In addition, there is a newly available study on thepreviously evaluated benzyl alcohol (No. 25) (Annex 1, references 50, 122 and155). The short-term studies of toxicity on the benzyl derivatives are summarizedin Table 4.
(i) o-Anisaldehyde (No. 2062)
Fischer 344 rats (five of each sex per group) were maintained on dietscontaining o-anisaldehyde at a level calculated to provide an average daily intakeof 0 or 140 mg/kg bw for a period of 14 days. Observations on mortality were madetwice a day for the duration of the experiment. Weekly measurement of body weightand food consumption revealed no significant differences between test and controlgroups. At necropsy, absolute liver and kidney weights were measured, andhistopathological examinations were performed. The test material produced noapparent signs of toxicity on a gross or microscopic level (Gill & Van Miller, 1987).
Weanling Osborne-Mendel rats (10 of each sex) were maintained on dietscontaining o-anisaldehyde at a level calculated to provide an average daily intakeof 0 or 1000 mg/kg bw per day for 16 weeks (Hagan et al., 1967). Weeklymeasurement of body weight, general condition and food intake revealed nodifferences between test rats and controls. At termination, haematologicalexaminations (i.e. white and red cell counts, haemoglobin levels and haematocrits)and histological examination of tissues were performed. No effects in rats were
Table 4. Results of short-term studies of toxicity on benzyl derivatives
No. Flavouringagent
Species;sex
No. oftest
groupsa/no. pergroupb
Route Duration(days)
NOAEL(mg/kgbw per
day)
Reference
2062 o-Anisaldehyde Rat; M, F 1/10 Diet 14 140c Gill & VanMiller (1987)
2062 o-Anisaldehyde Rat; M, F 1/20 Gavage 112 1000c
(10 000mg/kg
diet)
Hagan et al.(1967)
25 Benzyl alcohol Rat; M, F 3/20 Gavage 42 300 Foulon et al.(2005)
F, female; M, male; NOAEL, no-observed-adverse-effect levela Total number of test groups does not include control animals.b Total number per test group includes both male and female animals.c Only one dose tested. The actual NOAEL may be higher.
200 BENZYL DERIVATIVES (addendum)

observed that were attributable to the dietary intake of o-anisaldehyde for 16 weeks(Hagan et al., 1967).
An unspecified number and strain of rats were maintained on diets containingo-anisaldehyde at a level calculated to provide an average daily intake of 1000 mg/kg bw per day for 15 weeks. No further experimental detail was provided. Noadverse effects were reported (Bär & Griepentrog, 1967).
(ii) Benzyl alcohol (No. 25)
In a 6-week study to examine the susceptibility of rat pups to the toxic actionsof benzyl alcohol, groups of 10 male and 10 female rat pups were administeredbenzyl alcohol via oral gavage at dose levels of 100, 300 or 600 mg/kg bw per dayfrom postnatal day 22. In addition to body weight, clinical observations,ophthalmology, haematology, clinical chemistry, urinalysis and histopathology, thestudy evaluated reactivity, learning and memory, motor activity, sexual developmentand respiratory function. During the first half of the study, body weight gain wasdecreased in males (14%, P < 0.05) and females (13%) treated with 600 mg/kg bwper day. No other significant treatment-related changes in body weight or foodconsumption were reported in males or females. No treatment-related effects onhaematology or blood biochemistry parameters were reported in either sex. After 3weeks of treatment, at the 600 mg/kg bw per day dose level, respiratory problemssuch as audible or loud breathing, dyspnoea and abdominal breathing wereobserved in males and females. These effects were persistent and so severe at thehigh dose that premature euthanasia of some animals was necessary. Excessivesalivation was seen also, primarily with the high dose. There were no treatment-related histopathology findings in animals killed at the end of the treatment period;specifically, there was no indication of histopathological changes in the lungs at anydose level. Based on significant decreased body weight gain in males at the 600mg/kg bw per day level, a NOAEL of 300 mg/kg bw per day was established (Foulonet al., 2005).
(c) Genotoxicity studies
In vitro genotoxicity data are available for three of the eight flavouring agentsin this group (Nos 2062, 2063 and 2065). Additionally, studies of in vitro genotoxicityhave been reported on three flavouring agents in this group that were previouslyevaluated (Annex 1, reference 155). The results of all of these studies aresummarized in Table 5 and described below.
(i) In vitro
Negative results were reported in the standard assay for reverse mutation invarious strains of Salmonella typhimurium (strains used were TA97, TA98, TA100,TA102, TA1535 and/or TA1537, depending on the flavouring agent being tested).Specific details, results and references are presented in Table 5.
BENZYL DERIVATIVES (addendum) 201

Tabl
e 5.
Stu
dies
of g
enot
oxic
ity w
ith b
enzy
l der
ivat
ives
use
d as
flav
ouri
ng a
gent
s
No.
Fla
vour
ing
agen
tE
nd-p
oint
Tes
t obj
ect
Con
cent
ratio
nR
esul
tsR
efer
ence
In v
itro
2062
o-A
nisa
ldeh
yde
Rev
erse
mut
atio
nS
alm
onel
laty
phim
uriu
m T
A97
and
TA
102
10, 5
0, 1
00, 5
00 a
nd 1
000
μg/p
late
Neg
ativ
ea,b
Fuj
ita &
Sas
aki
(198
7)
2062
o-A
nisa
ldeh
yde
Sis
ter
chro
mat
idex
chan
geH
uman
per
iphe
ral
lym
phoc
ytes
0–34
μg/
ml (
0–0.
25 m
mol
/l)c
Pos
itive
Jans
son
et a
l.(1
988)
2063
Pre
nyl b
enzo
ate
Rev
erse
mut
atio
nS
. typ
him
uriu
mT
A98
, TA
100,
TA
1535
and
TA
1537
0.5,
5, 5
0, 5
00 a
nd 5
000
μg/p
late
Neg
ativ
ea,d
Glo
ver
& R
icho
ld(1
987)
2063
Pre
nyl b
enzo
ate
Rev
erse
mut
atio
nS
. typ
him
uriu
mT
A98
, TA
100,
TA
1535
and
TA
1537
1.5,
5, 1
5, 5
0 an
d 15
0 μg
/pla
teN
egat
ivee
Glo
ver
& R
icho
ld(1
987)
2063
Pre
nyl b
enzo
ate
Rev
erse
mut
atio
nS
. typ
him
uriu
mT
A98
, TA
100,
TA
1535
and
TA
1537
0.15
, 0.5
, 1.5
, 5 a
nd 1
5 μg
/pla
teN
egat
ived
Glo
ver
& R
icho
ld(1
987)
2063
Pre
nyl b
enzo
ate
Chr
omos
omal
aber
ratio
nC
hine
se h
amst
erov
ary
cells
0, 3
.3, 1
0, 3
3.3,
100
, 333
.3 a
nd10
00 μ
g/pl
ate
Neg
ativ
ea,f
Taa
lman
(19
88)
2065
4-M
ethy
lben
zyl
alco
hol
Rev
erse
mut
atio
nS
. typ
him
uriu
mT
A97
, TA
98, T
A10
0,T
A15
35 a
nd T
A15
37
33, 1
00, 3
33, 1
000,
166
6, 3
333,
666
6an
d 10
000
μg/
plat
eN
egat
ivea
Zei
ger
et a
l. (1
992)
2065
4-M
ethy
lben
zyl
alco
hol
Rev
erse
mut
atio
nS
. typ
him
uriu
mT
A10
050
, 100
, 200
and
500
μg/
plat
eN
egat
ived
Bal
l, F
oxal
l-Van
Ake
n &
Jen
sen
(198
4)
202 BENZYL DERIVATIVES (addendum)

Tabl
e 5
(con
td)
No.
Fla
vour
ing
agen
tE
nd-p
oint
Tes
t obj
ect
Con
cent
ratio
nR
esul
tsR
efer
ence
22B
enza
ldeh
yde
Rev
erse
mut
atio
nS
. typ
him
uriu
m T
A98
and
TA
100
1 an
d 10
6 μg
/pla
te (
0.01
and
1m
mol
/l)g
Neg
ativ
ea,b
Kub
o, U
rano
& U
tsum
i(2
002)
25B
enzy
l alc
ohol
Rev
erse
mut
atio
nS
. typ
him
uriu
m T
A98
and
TA
100
1 an
d 10
8 μg
/pla
te (
0.01
and
1m
mol
/l)h
Neg
ativ
ea,b
Kub
o, U
rano
& U
tsum
i(2
002)
850
Ben
zoic
aci
dR
ever
se m
utat
ion
S. t
yphi
mur
ium
TA
98 a
ndT
A10
01
and
122
μg/p
late
Neg
ativ
eb,c
Kub
o, U
rano
& U
tsum
i(2
002)
859
Lina
lyl b
enzo
ate
Rev
erse
mut
atio
nS
. typ
him
uriu
m T
A98
, TA
100,
TA
102,
TA
1535
and
TA
1537
100,
333
, 100
0, 2
500
and
5000
μg/p
late
Neg
ativ
ea,b
Tho
mps
on (
2004
)
a W
ith a
nd w
ithou
t met
abol
ic a
ctiv
atio
n.b
Pre
incu
batio
n as
say.
c C
alcu
late
d us
ing
a re
lativ
e m
olec
ular
mas
s of
136
.15.
d C
ytot
oxic
ity w
as o
bser
ved
at c
once
ntra
tions
gre
ater
than
50
μg/p
late
in th
e ab
senc
e of
S9
and
at 5
000
μg/p
late
in th
e pr
esen
ce o
f S9.
e W
ith m
etab
olic
act
ivat
ion.
f P
reny
l ben
zoat
e w
as c
ytot
oxic
at c
once
ntra
tions
gre
ater
than
100
μg/
ml,
as e
vide
nced
by
lack
of c
ell g
row
th.
g C
alcu
late
d w
ith a
rel
ativ
e m
olec
ular
mas
s of
106
.12.
h C
alcu
late
d w
ith a
rel
ativ
e m
olec
ular
mas
s of
108
.14.
BENZYL DERIVATIVES (addendum) 203

In a sister chromatid exchange assay, human peripheral lymphocytes fromnon-smokers were incubated in the presence of o-anisaldehyde (No. 2062) at0–0.25 mmol/l (0–34 μg/ml) for 88 h. Under the described conditions, the authorsof this study reported a significant increase in the number of sister chromatidexchanges observed (Jansson et al., 1988).
No chromosomal aberration activity was observed when prenyl benzoate(No. 2063) at 0–1000 μg/ml was incubated with Chinese hamster ovary cells for24 h (Taalman, 1988).
(ii) Conclusion for genotoxicity
The testing of these representative materials in vitro in prokaryotic andeukaryotic test systems indicates some positive results in the sister chromatidexchange assay. However, sister chromatid exchange is considered of limitedrelevance for the evaluation of genotoxic potential, as this end-point may reflectunspecific interference with DNA replication.
3. REFERENCES
Abdo KM et al. (1985). Benzyl acetate carcinogenicity, metabolism and disposition in Fischer344 rats and B6C3F1 mice. Toxicology, 37:159–170.
Anders MW (1989). Biotransformation and bioactivation of xenobiotics by the kidney. In:Hutson DH, Caldwell J, Paulson GD, eds. Intermediary xenobiotic metabolism inanimals. New York, NY, USA, Taylor and Francis, pp. 81–97.
Bailey DE (1976). Acute toxicity studies in rats and rabbits. Unpublished report to the ResearchInstitute of Fragrance Materials, Woodcliff Lake, NJ, USA. Submitted to WHO by theInternational Organization of the Flavor Industry, Brussels, Belgium.
Ball JC, Foxall-Van Aken S, Jensen TE (1984). Mutagenicity studies of p-substituted benzylderivatives in the Ames Salmonella plate-incorporation assay. Mutation Research, 138(2–3):145–151.
Bär VF, Griepentrog F (1967). Where we stand concerning the evaluation of flavoringsubstances from the viewpoint of health. Federal Public Health Office, Max von PettenkoferInstitute, Berlin-Dahlem, Germany.
Cramer GM, Ford RA, Hall RL (1978). Estimation of toxic hazard—a decision tree approach.Food and Cosmetics Toxicology, 16:255–276.
Davison C (1971). Salicylate metabolism in man. Annals of the New York Academy ofSciences, 179:249–268.
European Flavour and Fragrance Association (2004). EFFA poundage survey 2004: Europeaninquiry on volume of use. Unpublished report. Submitted to WHO by the InternationalOrganization of the Flavor Industry, Brussels, Belgium.
Foulon O et al. (2005). Benzyl alcohol: safety assessment in juvenile rats. Toxicologist,84(Suppl. 1):55 (abstract).
Fujita H, Sasaki M (1987). Mutagenicity test of food additives with Salmonella typhimuriumTA97 and TA102. II. Annual Report of the Tokyo Metropolitan Research Laboratory ofPublic Health, 38:423–430.
Gardner JR (1987). Acute oral toxicity to rats of PM484 (prenylbenzoate). Unpublished reportto the Research Institute of Fragrance Materials, Woodcliff Lake, NJ, USA. Submitted toWHO by the International Organization of the Flavor Industry, Brussels, Belgium.
Gavin CL, Williams MC, Hallagan JB (2008). 2005 poundage and technical effects updatesurvey. Washington, DC, Flavor and Extract Manufacturers Association.
204 BENZYL DERIVATIVES (addendum)

Gill MW, Van Miller JP (1987). Fourteen-day dietary minimum toxicity screen (MTS) in albinorats, o-methoxybenzaldehyde. Project No. 50-528. Bushy Run Research Center, Export,PA, USA. Unpublished report to the Flavor and Extract Manufacturers Association,Washington, DC, USA. Submitted to WHO by the International Organization of the FlavorIndustry, Brussels, Belgium.
Glover W, Richold M (1987). A bacterial mutation study on methyl 3 but 2 enyl benzoate(PM484). Study No. PI870299A. Environmental Safety Laboratory, Unilever Research,Bedford, England. Unpublished report to the Research Institute of Fragrance Materials,Woodcliff Lake, NJ, USA. Submitted to WHO by the International Organization of the FlavorIndustry, Brussels, Belgium.
Hagan EC et al. (1967). Food flavorings and compounds of related structure. ll. Subacute andchronic toxicity. Food and Cosmetics Toxicology, 5:141–157.
Heymann E (1980). Carboxylesterases and amidases. In: Jakoby WB, ed. Enzymatic basis ofdetoxification, 2nd ed. New York, NY, USA, Academic Press, pp. 291–323.
International Organization of the Flavor Industry (2009). Interim inquiry on volume use andadded use levels for flavouring agents to be presented at the JECFA 73rd meeting.Submitted to WHO by the International Organization of the Flavor Industry, Brussels,Belgium.
Jansson T et al. (1988). In vitro studies of the biological effects of cigarette smoke condensate.III. Induction of SCE by some phenolic and related constituents derived from cigarettesmoke—A study of structure–activity relationships. Mutation Research, 206(1):17–24.
Japan Flavor and Fragrance Materials Association (2005). JFFMA poundage survey 2005:Japanese inquiry on volume use. Submitted to WHO by the International Organization ofthe Flavor Industry, Brussels, Belgium.
Kubo T, Urano K, Utsumi H (2002). Mutagenicity characteristics of 255 environmentalchemicals. Journal of Health Science, 48(6):545–554.
Moreno OM (1976). Acute toxicity study in rats, rabbits and guinea pigs. Unpublished reportto the Research Institute of Fragrance Materials, Woodcliff Lake, NJ, USA. Submitted toWHO by the International Organization of the Flavor Industry, Brussels, Belgium.
Moreno OM (1977). Acute oral toxicity in rats (o-anisaldehyde). Unpublished report to theResearch Institute of Fragrance Materials, Woodcliff Lake, NJ, USA. Submitted to WHOby the International Organization of the Flavor Industry, Brussels, Belgium.
Moreno OM (1978). Acute oral toxicity in rats (prenyl benzoate). Unpublished report to theResearch Institute of Fragrance Materials, Woodcliff Lake, NJ, USA. Submitted to WHOby the International Organization of the Flavor Industry, Brussels, Belgium.
Nijssen LM, van Ingen-Visscher CA, Donders JJM, eds (2009). VCF (Volatile Compounds inFood) database. Version 11.1.1. Zeist, Netherlands, TNO Quality of Life (http://www.vcf-online.nl/VcfHome.cfm).
Sasaki YF et al. (2002). The comet assay with 8 mouse organs: results with 39 currently usedfood additives. Mutation Research, 519(1–2):103–119.
Sokol H (1952). Recent developments in the preservation of pharmaceuticals. DrugStandards, 20(56):89–106.
Stofberg J, Grundschober F (1987). Consumption ratio and food predominance of flavoringmaterials. Perfumer & Flavorist, 12:27.
Taalman RDFM (1988). Clastogenic evaluation of PM 484 (prenyl benzoate) in an in vitrocytogenic assay measuring chromosome aberration frequencies in Chinese hamster ovary(CHO) cells. Final report. Study No. E-9748-0-439. Hazelton Biotechnologies, Veenendaal,Netherlands. Unpublished report to the Research Institute of Fragrance Materials,Woodcliff Lake, NJ, USA. Submitted to WHO by the International Organization of the FlavorIndustry, Brussels, Belgium.
BENZYL DERIVATIVES (addendum) 205

Temellini A (1993). Conjugation of benzoic acid with glycine in human liver and kidney: a studyon the interindividual variability. Fifth North American ISSX Meeting, Tucson, AZ, USA,17–21 October 1993. International Society for the Study of Xenobiotics, Washington, DC,USA, p. 4.
Thompson PW (2004). Linalyl benzoate: reverse mutation assay “Ames test” using Salmonellatyphimurium. Unpublished report to the Research Institute of Fragrance Materials,Woodcliff Lake, NJ, USA. Submitted to WHO by the International Organization of the FlavorIndustry, Brussels, Belgium.
Zeiger E et al. (1992). Salmonella mutagenicity tests: V. Results from the testing of 311chemicals. Environmental and Molecular Mutagenesis, 19(Suppl. 21):2–141.
206 BENZYL DERIVATIVES (addendum)

PHENOL AND PHENOL DERIVATIVES (addendum)
First draft prepared by
Professor G.M. Williams,1 Dr M. DiNovi,2 Professor J.-C. Larsen3
and Professor A.G. Renwick4
1 Environmental Pathology and Toxicology, New York Medical College,Valhalla, New York, United States of America (USA)
2 Center for Food Safety and Applied Nutrition, Food and Drug Administration,College Park, Maryland, USA
3 National Food Institute, Division of Toxicology and Risk Assessment,Technical University of Denmark, Søborg, Denmark
4 School of Medicine, University of Southampton, Southampton, England
1. Evaluation ..............................................................................1.1 Introduction ......................................................................1.2 Assessment of dietary exposure .....................................1.3 Absorption, distribution, metabolism and elimination ......1.4 Application of the Procedure for the Safety Evaluation of
Flavouring Agents ...........................................................1.5 Consideration of combined intakes from use as flavouring
agents ..............................................................................1.6 Consideration of secondary components ........................1.7 Conclusion .......................................................................
2. Relevant background information ..........................................2.1 Explanation ......................................................................2.2 Additional considerations on intake .................................2.3 Biological data .................................................................
2.3.1 Biochemical data: absorption, distribution,metabolism and elimination ....................................
2.3.2 Toxicological studies ..............................................3. References ............................................................................
1. EVALUATION
1.1 Introduction
The Committee evaluated 13 additional flavouring agents belonging to thegroup of phenol and phenol derivatives used as flavouring agents, which wasevaluated previously. The additional substances included an ester of phenol (No.2019), two polyphenols (Nos 2022 and 2024), a phenol glucoside (No. 2018), alkyl-,alkenyl- or aryl-substituted phenols or their esters (Nos 2012, 2013 and 2023),alkoxyphenols or their esters (Nos 2014–2017) and phenol derivatives with alkylside-chains containing a ketone function (Nos 2020 and 2021). The group ofsubstances was selected on the basis of the structural criteria that all memberseither possess an aromatic ring containing one or more free hydroxyl groups or arethe esters of phenol derivatives. The evaluations were conducted using the
207207208218
218
219220221221221221221
221222248
- 207 -

the esters of phenol derivatives. The evaluations were conducted using theProcedure for the Safety Evaluation of Flavouring Agents (Figure 1, Introduction)(Annex 1, reference 131). None of these substances has been evaluated previouslyby the Committee.
The Committee previously evaluated 48 other members of this group offlavouring agents at its fifty-fifth meeting (Annex 1, reference 149). The Committeeconcluded that all 48 flavouring agents in that group were of no safety concernbased on estimated dietary exposures.
Four of the 13 additional flavouring agents (Nos 2012, 2013, 2019 and 2021)in this group have been reported to occur naturally and have been found in driedbonito, apple cider, various cheeses and ginger (Nijssen, van Ingen-Visscher &Donders, 2009).
1.2 Assessment of dietary exposure
The total annual volumes of production of the 13 flavouring agents belongingto the group of phenol and phenol derivatives are approximately 241 kg in Europe,0.05 kg in Japan and 2602 kg in the USA (European Flavour and FragranceAssociation, 2004; Japan Flavor and Fragrance Materials Association, 2005;International Organization of the Flavor Industry, 2009). Approximately 99% of thetotal annual volume of production in Europe is accounted for by 5,7-dihydroxy-2-(3-hydroxy-4-methoxy-phenyl)-chroman-4-one (No. 2024), and approximately 99% ofthe total annual volume of production in the USA is accounted for by magnolol (No.2023) and 5,7-dihydroxy-2-(3-hydroxy-4-methoxy-phenyl)-chroman-4-one (No.2024). Approximately 100% of the total annual volume of production in Japan isaccounted for by phenyl butyrate (No. 2019).
The estimated dietary exposures for each of the flavouring agents,calculated either as the maximized survey-derived intake (MSDI) or using the singleportion exposure technique (SPET), are reported in Table 1. The highest estimatesare for 4-(2-propenyl)phenyl- -D-glucopyranoside (No. 2018) and magnolol (No.2023) (6000 μg for both, the SPET value from non-alcoholic beverages for No. 2018and from chewing gum or other confections for No. 2023). For the other flavouringagents in this group, the daily dietary exposures range from 0.01 to 3000 μg, withthe SPET yielding the highest estimates for all except 5,7-dihydroxy-2-(3-hydroxy-4-methoxy-phenyl)-chroman-4-one (No. 2024). Reported annual volumes ofproduction and calculated daily dietary exposures (MSDI and SPET) for this groupof flavouring agents are summarized in Table 2.
208 PHENOL AND PHENOL DERIVATIVES (addendum)

Tabl
e 1.
Sum
mar
y of
the
resu
lts o
f the
saf
ety
eval
uatio
ns o
f phe
nol a
nd p
heno
l der
ivat
ives
use
d as
flav
ouri
ng a
gent
sa,b,
c
Fla
vour
ing
agen
tN
o.C
AS
No.
and
str
uctu
reS
tep
A3d
Doe
s in
take
exce
ed th
eth
resh
old
for
hum
an in
take
?
Ste
p A
4Is
the
subs
tanc
eor
are
its
met
abol
ites
endo
geno
us?
Ste
p A
5e
Ade
quat
e m
argi
n of
safe
ty fo
r th
efla
vour
ing
agen
t or
rela
ted
subs
tanc
es?
Com
men
tson
pre
dict
edm
etab
olis
m
Con
clus
ion
base
don
cur
rent
estim
ated
diet
ary
expo
sure
Str
uctu
ral c
lass
I
4-P
rope
nylp
heno
l20
1253
9-12
-8
OH
No,
SP
ET
: 400
NR
NR
Not
e 1
No
safe
ty c
once
rn
2,4,
6-T
rimet
hylp
heno
l20
1352
7-60
-6
OH
No,
SP
ET
: 300
NR
NR
Not
e 1
No
safe
ty c
once
rn
PHENOL AND PHENOL DERIVATIVES (addendum) 209

Tabl
e 1
(con
td)
Fla
vour
ing
agen
tN
o.C
AS
No.
and
str
uctu
reS
tep
A3d
Doe
s in
take
exce
ed th
eth
resh
old
for
hum
an in
take
?
Ste
p A
4Is
the
subs
tanc
eor
are
its
met
abol
ites
endo
geno
us?
Ste
p A
5e
Ade
quat
e m
argi
n of
safe
ty fo
r th
efla
vour
ing
agen
tor
rel
ated
sub
stan
ces?
Com
men
tson
pre
dict
edm
etab
olis
m
Con
clus
ion
base
don
cur
rent
estim
ated
diet
ary
expo
sure
Sod
ium
3-m
etho
xy-4
-hy
drox
ycin
nam
ate
2014
2427
6-84
-4
OO
H
NaO
O
No,
SP
ET
:15
00N
RN
RN
otes
1 a
nd 2
No
safe
ty c
once
rn
Gua
icol
but
yrat
e20
1541
12-9
2-9
OO
O
No,
SP
ET
: 60
NR
NR
Not
es 1
and
3N
o sa
fety
con
cern
Gua
icol
isob
utyr
ate
2016
7237
59-6
2-4
OOO
No,
SP
ET
: 60
NR
NR
Not
es 1
and
3N
o sa
fety
con
cern
210 PHENOL AND PHENOL DERIVATIVES (addendum)

Tabl
e 1
(con
td)
Fla
vour
ing
agen
tN
o.C
AS
No.
and
str
uctu
reS
tep
A3d
Doe
s in
take
exce
ed th
eth
resh
old
for
hum
an in
take
?
Ste
p A
4Is
the
subs
tanc
eor
are
its
met
abol
ites
endo
geno
us?
Ste
p A
5e
Ade
quat
e m
argi
n of
safe
ty fo
r th
efla
vour
ing
agen
t or
rela
ted
subs
tanc
es?
Com
men
tson
pre
dict
edm
etab
olis
m
Con
clus
ion
base
don
cur
rent
estim
ated
diet
ary
expo
sure
Gua
icol
pro
pion
ate
2017
7598
-60-
9 OOO
No,
SP
ET
: 60
NR
NR
Not
es 1
and
3N
o sa
fety
con
cern
4-(2
-Pro
peny
l)ph
enyl
--D
-gl
ucop
yran
osid
e
2018
6470
3-98
-6
OO O
HO
HO
H
OH
Yes
, SP
ET
:60
00N
oY
es. T
he N
OA
EL
of 6
00m
g/kg
bw
per
day
for
the
stru
ctur
ally
rela
ted
euge
nol (
No.
1529
) in
a 9
0-da
y st
udy
in ra
ts (N
TP
, 198
3) is
at
leas
t 600
0 tim
es th
ees
timat
ed d
aily
die
tary
expo
sure
to N
o. 2
018
whe
n us
ed a
s a
flavo
urin
g ag
ent.
Not
e 1
No
safe
ty c
once
rn
Phe
nyl b
utyr
ate
2019
4346
-18-
3
O
O
No,
SP
ET
: 30
NR
NR
Not
es 1
and
3N
o sa
fety
con
cern
PHENOL AND PHENOL DERIVATIVES (addendum) 211

Tabl
e 1
(con
td)
Fla
vour
ing
agen
tN
o.C
AS
No.
and
str
uctu
reS
tep
A3d
Doe
s in
take
exce
ed th
eth
resh
old
for
hum
an in
take
?
Ste
p A
4Is
the
subs
tanc
eor
are
its
met
abol
ites
endo
geno
us?
Ste
p A
5e
Ade
quat
e m
argi
n of
safe
ty fo
r th
efla
vour
ing
agen
tor
rel
ated
sub
stan
ces?
Com
men
tson
pre
dict
edm
etab
olis
m
Con
clus
ion
base
don
cur
rent
estim
ated
diet
ary
expo
sure
Hyd
roxy
(4-
hydr
oxy-
3-m
etho
xyph
enyl
)-ac
etic
aci
d
2020
55-1
0-7 O O
H
OH
OH O
No,
SP
ET
:15
00N
RN
RN
ote
1N
o sa
fety
conc
ern
Str
uctu
ral c
lass
II
1-(4
-Hyd
roxy
-3-
met
hoxy
phen
yl)-
deca
n-3-
one
2021
2711
3-22
-0
HO
O
O
Yes
, SP
ET
:30
00N
oY
es. T
he N
OA
EL
of 7
0m
g/kg
bw
per
day
for
the
stru
ctur
ally
rel
ated
4-(p
-hyd
roxy
phen
yl)-
2-bu
tano
ne (N
o. 7
28) i
n a
90-d
ay s
tudy
in r
ats
(Hof
fman
, 200
4) is
at
leas
t 140
0 tim
es th
ees
timat
ed d
aily
die
tary
expo
sure
to N
o. 2
021
whe
n us
ed a
s a
flavo
urin
g ag
ent.
Not
e 1
No
safe
tyco
ncer
n
212 PHENOL AND PHENOL DERIVATIVES (addendum)

Tabl
e 1
(con
td)
Fla
vour
ing
agen
tN
o.C
AS
No.
and
str
uctu
reS
tep
A3d
Doe
s in
take
exce
ed th
eth
resh
old
for
hum
an in
take
?
Ste
p A
4Is
the
subs
tanc
eor
are
its
met
abol
ites
endo
geno
us?
Ste
p A
5e
Ade
quat
e m
argi
n of
safe
ty fo
r th
efla
vour
ing
agen
t or
rela
ted
subs
tanc
es?
Com
men
tson
pre
dict
edm
etab
olis
m
Con
clus
ion
base
don
cur
rent
estim
ated
diet
ary
expo
sure
Str
uctu
ral c
lass
III
3-(4
-Hyd
roxy
-ph
enyl
)-1-
(2,4
,6-
trih
ydro
xy-
phen
yl)-
prop
an-1
-one
2022
60-8
2-2
OO
H
HO
OH
OH
Yes
, SP
ET
:48
0N
oY
es. T
he N
OA
EL
ofap
prox
imat
ely
750
mg/
kgbw
per
day
for
the
stru
ctur
ally
rel
ated
neoh
espe
ridin
dihy
droc
halc
one
in a
90-
day
stud
y in
rat
s (L
ina,
Dre
ef-v
ande
rMeu
len
& L
eegw
ater
, 199
0) is
at
leas
t 93
000
times
the
estim
ated
dai
ly d
ieta
ryex
posu
re to
No.
202
2 w
hen
used
as
a fla
vour
ing
agen
t.
Not
e 1
No
safe
ty c
once
rn
Mag
nolo
l20
2352
8-43
-8
HO
OH
Yes
, SP
ET
:60
00N
oY
es. T
he N
OA
EL
of
240
mg/
kg b
w p
er d
ay in
a 9
0-da
y st
udy
in r
ats
(Liu
et a
l.,20
07)
is a
t lea
st 2
400
times
the
estim
ated
dai
ly d
ieta
ryex
posu
re to
mag
nolo
l whe
nus
ed a
s a
flavo
urin
g ag
ent.
Not
e 1
No
safe
ty c
once
rn
PHENOL AND PHENOL DERIVATIVES (addendum) 213

Tabl
e 1
(con
td)
Fla
vour
ing
agen
tN
o.C
AS
No.
and
str
uctu
reS
tep
A3d
Doe
s in
take
exce
ed th
eth
resh
old
for
hum
an in
take
?
Ste
p A
4Is
the
subs
tanc
eor
are
its
met
abol
ites
endo
geno
us?
Ste
p A
5e
Ade
quat
e m
argi
n of
safe
ty fo
r th
efla
vour
ing
agen
t or
rela
ted
subs
tanc
es?
Com
men
tson
pre
dict
edm
etab
olis
m
Con
clus
ion
base
don
cur
rent
estim
ated
diet
ary
expo
sure
5,7-
Dih
ydro
xy-2
-(3
-hyd
roxy
-4-
met
hoxy
-ph
enyl
)-ch
rom
an-4
-one
2024
6909
7-99
-0
O
OO
H
OO
H
HO
Yes
, MS
DI:
Eur
ope
26U
SA
153
Japa
n N
D
No
Yes
. The
NO
AE
L of
appr
oxim
atel
y 75
0 m
g/kg
bw
per
day
for
the
stru
ctur
ally
rel
ated
neoh
espe
ridin
dih
ydro
chal
cone
in a
90-
day
stud
y in
rat
s (L
ina,
Dre
ef-v
ande
rMeu
len
&Le
egw
ater
, 199
0) is
at l
east
290
000
times
the
estim
ated
dai
lydi
etar
y ex
posu
re to
No.
202
4w
hen
used
as
a fla
vour
ing
agen
t.
Not
e 1
No
safe
ty c
once
rn
bw, b
ody
wei
ght;
CA
S, C
hem
ical
Abs
trac
ts S
ervi
ce; N
D, n
o da
ta r
epor
ted;
NO
AE
L, n
o-ob
serv
ed-a
dver
se-e
ffect
leve
l; N
R, n
ot r
equi
red
for
eval
uatio
nbe
caus
e co
nsum
ptio
n of
the
subs
tanc
e w
as d
eter
min
ed to
be
of n
o sa
fety
con
cern
at s
tep
A3
of th
e P
roce
dure
aF
orty
-eig
ht fl
avou
ring
agen
ts in
this
gro
up w
ere
prev
ious
ly e
valu
ated
by
the
Com
mitt
ee (
Ann
ex 1
, ref
eren
ce 1
49).
bS
tep
1: N
ine
flavo
urin
g ag
ents
in th
is g
roup
(N
os 2
012–
2020
) ar
e in
str
uctu
ral c
lass
I. O
ne fl
avou
ring
agen
t in
this
gro
up (
No.
202
1)is
in s
truc
tura
l cla
ssII.
The
rem
aini
ng th
ree
flavo
urin
g ag
ents
(N
os 2
022–
2024
) ar
e in
str
uctu
ral c
lass
III.
cS
tep
2: A
ll of
the
flavo
urin
g ag
ents
in th
is g
roup
can
be
pred
icte
d to
be
met
abol
ized
to in
nocu
ous
prod
ucts
.d
The
thre
shol
ds fo
r hu
man
inta
ke fo
r st
ruct
ural
cla
sses
I, II
and
III a
re 1
800,
540
and
90
μg/d
ay, r
espe
ctiv
ely.
All
inta
ke v
alue
s ar
e ex
pres
sed
in μ
g/da
y.E
ither
the
high
est S
PE
T e
stim
ate
or th
e M
SD
I est
imat
es, i
f at l
east
one
is h
ighe
r th
an th
e hi
ghes
t SP
ET
est
imat
e, a
re g
iven
in th
e ta
ble.
eT
he m
argi
n of
saf
ety
was
cal
cula
ted
base
d on
the
high
est d
aily
die
tary
exp
osur
e ca
lcul
ated
as
the
MS
DI o
r by
the
SP
ET
.N
otes
:1.
Det
oxic
atio
n of
phe
nol p
rimar
ily in
volv
es c
onju
gatio
n of
the
hydr
oxyl
gro
up w
ith s
ulfa
te a
nd g
lucu
roni
c ac
id a
nd s
ubse
quen
t elim
inat
ion
in th
e ur
ine.
2.C
inna
mic
aci
d de
rivat
ives
are
exp
ecte
d to
und
ergo
-o
xida
tion
and
are
excr
eted
as
hipp
uric
aci
d.3.
The
phe
nolic
est
er w
ill h
ydro
lyse
to p
heno
l and
the
corr
espo
ndin
g ca
rbox
ylic
aci
d.
214 PHENOL AND PHENOL DERIVATIVES (addendum)

Table 2. Annual volumes of production and dietary exposures for phenol andphenol derivatives used as flavouring agents in Europe, the USA and Japan
Flavouring agent (No.) Most recentannual
volume ofproduction
(kg)a
Dietary exposure Annualvolume from
naturaloccurrence
in foods (kg)d
MSDIb SPETc
μg/day μg/kgbw per
day
μg/day μg/kgbw per
day
4-Propenylphenol (2012) 400 7 +
Europe 0.1 0.01 0.0002
USA ND ND ND
Japan ND ND ND
2,4,6-Trimethylphenol(2013)
300 5 +
Europe 0.1 0.01 0.0002
USA ND ND ND
Japan ND ND ND
Sodium 3-methoxy-4-hydroxycinnamate (2014)
1500 25 –
Europe 0.1 0.01 0.0002
USA ND ND ND
Japan ND ND ND
Guaiacol butyrate (2015) 60 1 –
Europe ND ND ND
USA 0.4 0.05 0.001
Japan ND ND ND
Guaiacol isobutyrate(2016)
60 1 –
Europe ND ND ND
USA 0.4 0.05 0.001
Japan ND ND ND
Guaiacol propionate(2017)
60 1 –
Europe ND ND ND
USA 0.4 0.05 0.001
Japan ND ND ND
PHENOL AND PHENOL DERIVATIVES (addendum) 215

Table 2 (contd)
Flavouring agent (No.) Most recentannual
volume ofproduction
(kg)a
Dietary exposure Annualvolume from
naturaloccurrence
in foods(kg)d
MSDIb SPETc
μg/day μg/kgbw per
day
μg/day μg/kgbw per
day
4-(2-Propenyl)phenyl- -D-glucopyranoside (2018)
6000 100 –
Europe ND ND ND
USA 5.0 0.6 0.01
Japan ND ND ND
Phenyl butyrate (2019) 30 1 +
Europe ND ND ND
USA ND ND ND
Japan 0.05 0.01 0.0002
Hydroxy(4-hydroxy-3-methoxyphenyl)acetic acid(2020)
1500 25 –
Europe ND ND ND
USA 0.4 0.05 0.001
Japan ND ND ND
1-(4-Hydroxy-3-methoxyphenyl)-decan-3-one (2021)
3000 50 +
Europe ND ND ND
USA 0.1 0.01 0.0002
Japan ND ND ND
3-(4-Hydroxy-phenyl)-1-(2,4,6-trihydroxy-phenyl)-propan-1-one (2022)
480 8 –
Europe ND ND ND
USA 4.0 0.5 0.008
Japan ND ND ND
Magnolol (2023) 6000 100 –
Europe ND ND ND
216 PHENOL AND PHENOL DERIVATIVES (addendum)

Table 2 (contd)
Flavouring agent (No.) Mostrecentannual
volume ofproduction
(kg)a
Dietary exposure Annualvolume
from naturaloccurrence
in foods(kg)d
MSDIb SPETc
μg/day μg/kgbw per
day
μg/day μg/kgbw per
day
USA 1342 164 3
Japan ND ND ND
5,7-Dihydroxy-2-(3-hydroxy-4-methoxy-phenyl)-chroman-4-one (2024)
140 2 –
Europe 241 26 0.4
USA 1250 153 3
Japan ND ND ND
Total
Europe 241
USA 2602
Japan 0.05
ND, no data reported; +, reported to occur naturally in foods (Nijssen, van Ingen-Visscher &Donders, 2009), but no quantitative data; –, not reported to occur naturally in foods
a From European Flavour and Fragrance Association (2004), Japan Flavor and FragranceMaterials Association (2005) and International Organization of the Flavor Industry (2009).Values greater than zero but less than 0.1 kg were reported as 0.1 kg.
b MSDI (μg/person per day) calculated as follows:(annual volume, kg) × (1 × 10⁹ μg/kg)/(population × survey correction factor × 365 days),where population (10%, “eaters only”) = 32 × 106 for Europe, 28 × 106 for the USA and 13× 106 for Japan; and where survey correction factor = 0.8 for the surveys in Europe, the USAand Japan, representing the assumption that only 80% of the annual flavour volume wasreported in the poundage surveys (European Flavour and Fragrance Association, 2004;Japan Flavor and Fragrance Materials Association, 2005; International Organization of theFlavor Industry, 2009).MSDI (μg/kg bw per day) calculated as follows:(μg/person per day)/body weight, where body weight = 60 kg. Slight variations may occurfrom rounding.
c SPET (μg/person per day) calculated as follows:(standard food portion, g/day) × (average use level) (International Organization of the FlavorIndustry, 2009). The dietary exposure from the single food category leading to the highestdietary exposure from one portion is taken as the SPET estimate.SPET (μg/kg bw per day) calculated as follows:(μg/person per day)/body weight, where body weight = 60 kg. Slight variations may occurfrom rounding.
PHENOL AND PHENOL DERIVATIVES (addendum) 217

1.3 Absorption, distribution, metabolism and elimination
In the report of the fifty-fifth meeting, biodisposition of flavouring agents inthis group was extensively discussed. When ingested as natural or addedcomponents of food, phenol and its derivatives are rapidly absorbed from thegastrointestinal tract and participate in common pathways of metabolic detoxication(Hughes & Hall, 1997). Phenol and phenol derivatives are conjugated with sulfateand glucuronic acid and excreted primarily in the urine. Other metabolic pathways,observed mainly at high dose levels, include ring hydroxylation and side-chainoxidation. Phenols containing alkoxy groups and those that contain a ketonefunction on an alkyl side-chain are also detoxified mainly via conjugation. Alternativedetoxication pathways include dealkylation of alkoxyphenols, reduction of side-chain ketones, side-chain oxidation and ring hydroxylation. At very high dose levels,a bioactivation pathway has been characterized; high dose levels of p-cresol (i.e.4-methylphenol; No. 693), p-ethylphenol (No. 694), 2-methoxy-4-methylphenol (No.715), 2-methoxy-4-propylphenol (No. 717), 2-methoxy-4-vinylphenol (No. 725) and4-allyl-2,6-dimethoxyphenol (No. 726) are oxidized to reactive quinone methideintermediates (Thompson et al., 1994, 1995; Thompson, Perera & London, 1995).
1.4 Application of the Procedure for the Safety Evaluation of FlavouringAgents
Step 1. In applying the Procedure for the Safety Evaluation of FlavouringAgents to the above-mentioned flavouring agents, the Committee assigned nineflavouring agents (Nos 2012–2020) to structural class I. One flavouring agent (No.2021) was assigned to structural class II, and three flavouring agents (Nos 2022–2024) were assigned to structural class III (Cramer, Ford & Hall, 1978).
Step 2. All the flavouring agents in this group are expected to be metabolizedto innocuous products. The evaluation of all flavouring agents in this group thereforeproceeded via the A-side of the Procedure.
Step A3. For all compounds in this group (except No. 2024; see below), theSPET resulted in the highest estimated daily intakes. Of eight of the nine flavouringagents (Nos 2012–2017, 2019 and 2020) in structural class I, all were below thethreshold of concern (i.e. 1800 μg/person per day for class I). The safety of theseeight flavouring agents raises no concern at current estimated dietary exposures.The estimated daily intake for one flavouring agent (No. 2018) in structural class Iis above the threshold of concern (i.e. 1800 μg/person per day for class I). Theestimated daily intake for the one flavouring agent (No. 2021) in structural class IIis above the threshold of concern (i.e. 540 μg/person per day for class II). Theestimated daily intake for all three flavouring agents (Nos 2022–2024) in structuralclass III are above the threshold of concern (i.e. 90 μg/person per day for class III).Accordingly, the evaluation of these five substances proceeded to step A4.
Step A4. None of the flavouring agents—4-(2-propenyl)phenyl- -D-glucopyranoside (No. 2018), 1-(4-hydroxy-3-methoxyphenyl)-decan-3-one (No.2021), 3-(4-hydroxy-phenyl)-1-(2,4,6-trihydroxy-phenyl)-propan-1-one (No. 2022),magnolol (No. 2023) and 5,7-dihydroxy-2-(3-hydroxy-4-methoxy-phenyl)-chroman-4-one (No. 2024)—or their metabolites are endogenous substances.Accordingly, the evaluation of these substances proceeded to step A5.
218 PHENOL AND PHENOL DERIVATIVES (addendum)
Step A5. For 4-(2-propenyl)phenyl- -D-glucopyranoside (No. 2018), the no-observed-adverse-effect level (NOAEL) of 600 mg/kg body weight (bw) per day forthe structurally related eugenol (No. 1529) in a 90-day study in rats (NTP, 1983)provides a margin of safety of 6000 in relation to the highest estimated dietaryexposure to No. 2018 (SPET = 6000 μg/person per day) when used as a flavouringagent.
For 1-(4-hydroxy-3-methoxyphenyl)-decan-3-one (No. 2021), the NOAEL of70 mg/kg bw per day for the structurally related 4-(p-hydroxyphenyl)-2-butanone(No. 728) in a 90-day study in rats (Hoffman, 2004) provides a margin of safety of1400 in relation to the highest estimated dietary exposure to No. 2021 (SPET =3000 μg/person per day) when used as a flavouring agent.
For 3-(4-hydroxy-phenyl)-1-(2,4,6-trihydroxy-phenyl)-propan-1-one (No.2022), the NOAEL of approximately 750 mg/kg bw per day for the structurally relatedneohesperidin dihydrochalcone in a 90-day study in rats (Lina, Dreef-vanderMeulen& Leegwater, 1990) provides a margin of safety of greater than 93 000 in relationto the highest estimated dietary exposure to No. 2022 (SPET = 480 μg/person perday) when used as a flavouring agent.
The NOAEL of 240 mg/kg bw per day for magnolol (No. 2023) in a 90-daystudy in rats (Liu et al., 2007) provides a margin of safety of 2400 in relation to thehighest estimated dietary exposure to No. 2023 (SPET = 6000 μg/person per day)when used as a flavouring agent.
For 5,7-dihydroxy-2-(3-hydroxy-4-methoxy-phenyl)-chroman-4-one (No.2024), the NOAEL of approximately 750 mg/kg bw per day for the structurally relatedneohesperidin dihydrochalcone in a 90-day study in rats (Lina, Dreef-vanderMeulen& Leegwater, 1990) provides a margin of safety of greater than 290 000 in relationto the highest estimated dietary exposure to No. 2024 (MSDI = 153 μg/person perday) when used as a flavouring agent.
The Committee concluded that the calculated margins of safety indicate thatthese flavouring agents would not pose safety concerns at current estimated dietaryexposures.
Table 1 summarizes the evaluations of the 13 phenol and phenol derivatives(Nos 2012–2024) in this group.
1.5 Consideration of combined intakes from use as flavouring agents
The safety assessment of possible combined exposures to flavouring agentswas undertaken based on the presence of common metabolites or a homologousseries (as proposed at the sixty-eighth meeting; Annex 1, reference 187) and usingthe MSDI exposure assessment (as proposed at the sixty-ninth meeting; Annex 1,reference 190). In addition, at this meeting, the Committee also consideredcombined intakes for structurally closely related series of flavouring agents.
Flavouring agents in this series that are members of a structurally closelyrelated series of simple phenols or alkylphenols or predicted to be metabolized tosuch compounds, in structural class I, are Nos 2012, 2013, 2018 and 2019. The fiverelated flavouring agents with the highest intakes in Europe are Nos 690, 691, 694,
PHENOL AND PHENOL DERIVATIVES (addendum) 219

697 and 705 and in the USA are Nos 693, 695, 698, 699 and 703. In the unlikelyevent that these flavouring agents were to be consumed concurrently on a dailybasis, the estimated combined intakes would be 316 μg/person in Europe and81 μg/person in the USA, which would not exceed the threshold of concern (i.e.1800 μg/person per day for class I). The Committee concluded that the combinedintake of these substances, when used as flavouring agents, would not raise safetyconcerns.
Flavouring agents in this series that are members of a structurally closelyrelated series of methoxyphenols or predicted to be metabolized to suchcompounds, in structural class I, are Nos 2015, 2016 and 2017. The five relatedcompounds with the highest intakes in Europe are Nos 713, 715, 717, 721 and 725and in the USA are Nos 711, 713, 715, 721 and 726. In the unlikely event that theseflavouring agents were to be consumed concurrently on a daily basis, the estimatedcombined intakes would be 307 μg/person in Europe and 43 μg/person in the USA,which would not exceed the threshold of concern (i.e. 1800 μg/person per day forclass I). The Committee concluded that the combined intake of these substances,when used as flavouring agents, would not raise safety concerns.
Flavouring agents in this series that are members of a structurally closelyrelated series of phenols or methoxyphenols containing an additional oxygenatedfunctional group or predicted to be metabolized to such compounds, in structuralclass I, are Nos 2014 and 2020. The related compounds with the highest intakes inEurope are Nos 727, 728, 736 and 731 and in the USA are Nos 727, 728, 736, 730and 731. In the unlikely event that these substances were to be consumedconcurrently on a daily basis, the estimated combined intakes would beapproximately 3000 μg/person in Europe and approximately 4000 μg/person in theUSA, which would exceed the threshold of concern (i.e. 1800 μg/person per day forclass I). However, all five flavouring agents in this group are expected to beefficiently metabolized and would not saturate metabolic pathways. The Committeeconcluded that the combined intake of these substances, when used as flavouringagents, would not raise safety concerns.
The remaining flavouring agents (Nos 2022–2024) do not share closestructural characteristics with others in the group, and consideration of combinedintake is not indicated.
The Committee concluded that the combined intakes of these substances,when used as flavouring agents, would not raise safety concerns.
1.6 Consideration of secondary components
Two members of this group of flavouring agents, sodium 3-methoxy-4-hydroxycinnamate (No. 2014) and magnolol (No. 2023), have minimum assayvalues of less than 95%. The secondary component in No. 2014, vanillin (No. 889),was previously evaluated and found to be of no concern. The secondarycomponents of magnolol (No. 2023), honokiol and eudesmol, are expected toshare the same metabolic fate as the flavouring agent and are considered not topresent a safety concern at current estimated dietary exposures. Information on thesafety of the secondary components of these flavouring agents is summarized inAnnex 5.
220 PHENOL AND PHENOL DERIVATIVES (addendum)

1.7 Conclusion
In the previous evaluations of substances in this group of flavouring agents,studies of biological properties, acute toxicity, short-term toxicity and genotoxicitywere available. None raised safety concerns. The additional biochemical andtoxicological data available for this evaluation supported those from the previousevaluation (Annex 1, reference 149).
The Committee concluded that these 13 flavouring agents, which areadditions to the group of phenol and phenol derivatives evaluated previously, wouldnot give rise to safety concerns at current estimated dietary exposures.
2. RELEVANT BACKGROUND INFORMATION
2.1 Explanation
This monograph summarizes the additional key data relevant to the safetyevaluation of a group of 13 phenol and phenol derivatives (see Table 1), including1 ester of phenol, 3 polyhydroxyphenols, 3 alkyl-, alkenyl- or aryl-substitutedphenols and 6 alkoxyphenols or phenol derivatives with alkyl side-chains containinga ketone function. These flavouring agents are additions to the group of 48 phenoland phenol derivatives evaluated previously by the Committee at its fifty-fifthmeeting (Annex 1, reference 149).
2.2 Additional considerations on intake
There is no additional information on intake. Dietary exposure estimateswere made using the SPET in addition to the MSDI approach.
2.3 Biological data
2.3.1 Biochemical data: absorption, distribution, metabolism and elimination
Additional studies related to the absorption, distribution, metabolism andelimination of the additional and previously evaluated flavouring agents have beenreported since the preparation of the original monograph and are described below.
In a study designed to extrapolate oral systemic toxicity results to theinhalation route for phenol exposure, male and female F344 rats were administeredsingle daily doses of [14C]phenol by 1) intragastric instillation (1.5, 15 and 150 mg/kg bw per day), 2) drinking-water (5000 mg/l) or 3) inhalation (96 mg/m3 for 6 h) for8 consecutive days. For all exposure routes, radioactivity was rapidly eliminated inurine (>94% in 24 h), and less than 1% remained in tissues and carcass. The urinarymetabolite profile was dose dependent. The ratio of glucuronide to sulfateconjugates of phenol was 0.61 after oral gavage administration for 8 days of 1.5 or15 mg/kg bw per day and increased to 1.16 following a 150 mg/kg bw per day dose,suggesting saturation of the sulfate conjugation pathway at the high dose level.Metabolic profiles obtained after drinking-water exposure were equivalent to the
PHENOL AND PHENOL DERIVATIVES (addendum) 221

high-dose oral gavage profile, and results for male and female rats were equivalentin all studies (Hiser et al., 1993).
The kinetic behaviour of p-cresol (No. 693) was investigated in a group ofcontrol (n = 6) and dosed (n = 7) male OFA rats (mean body weight, 310 g) thatreceived an intravenous bolus of either 2 ml isotonic saline or 3 mg p-cresol in 2 mlisotonic saline, respectively. Serum samples were collected at 0, 5, 30, 60, 120, 180and 240 min after administration of p-cresol, and urine was collected at 1 h intervals.The maximum serum concentration of p-cresol at 5 min was 6.7 ± 1.4 mg/l, and theconcentration decreased gradually to 0.6 ± 0.3 mg/l at 240 min post-administration.No p-cresol was detected in the serum of control rats. Urinary excretion of p-cresolwas 23 ± 10% of the administered dose, and the excretion half-life was 1.5 ± 0.8 h.Total clearance was 23.2 ± 4.5 ml/min per kilogram body weight, but renal clearancewas substantially lower, at 4.8 ± 2.0 ml/min per kilogram body weight. The volumeof distribution was determined to be 2.9 ± 1.4 l/kg (Lesaffer et al., 2001).
2.3.2 Toxicological studies
(a) Acute toxicity
Oral median lethal dose (LD50) studies have been reported for 3 of the 13additional flavouring agents in this group. New LD50 values have been published fortwo flavouring agents previously evaluated by the Committee at its fifty-fifth meeting.In rats, LD50 values ranged from 632 mg/kg bw for 2-methoxy-4-methylphenol (No.715) to 1320 mg/kg bw for 4-(p-hydroxyphenyl)-2-butanone (No. 728) and greaterthan 2000 mg/kg bw for 3-(4-hydroxy-phenyl)-1-(2,4,6-trihydroxy-phenyl)-propan-1-one (No. 2022) and 5,7-dihydroxy-2-(3-hydroxy-4-methoxy-phenyl)-chroman-4-one(No. 2024) (Scheerbaum, 2001; Merkel, 2003; Vaeth, 2005, 2006). In mice, anLD50 value of 270 mg/kg bw for 1-(4-hydroxy-3-methoxyphenyl)-decan-3-one (No.2021) was reported (Lee et al., 1991). Results of oral acute toxicity studies aresummarized in Table 3.
These studies demonstrate that the acute oral toxicity of phenol and phenolderivatives is low. The hepatotoxicity of p-cresol (No. 693), p-[ , , -d3]-cresol, 4-methylanisole (No. 1243), 2,4-dimethylphenol, 2,4,6-trimethylphenol (No. 2013)and 2-methoxy-4-methylphenol was studied using rat liver slices and livermicrosomes. The liver slices were exposed to varying concentrations of p-cresolanalogues for 6 h, and the median lethal concentration (LC50) was measured by lossof intracellular potassium. 2,4,6-Trimethylphenol (LC50 2.22 mmol/l) was less toxicthan p-cresol (LC50 1.32 mmol/l) and 2,4-dimethylphenol (LC50 1.33 mmol/l). 4-Methylanisole showed the least toxicity, with an LC50 of 4.35 mmol/l. The reducedcellular toxicity is consistent with increased glutathione conjugation when incubatedwith either liver microsomal fractions or liver slices (Table 4). Presumably, theincreased rate of glutathione conjugation of the reactive quinone methide metaboliteis in part responsible for the decrease in toxicity. In the case of 4-methylanisole, noglutathione conjugates were detected (Thompson, Perera & London, 1996).
222 PHENOL AND PHENOL DERIVATIVES (addendum)

(b) Short-term studies of toxicity
The results of short-term toxicological studies have been reported for oneadditional member of this group, magnolol (No. 2023). Studies with phenol (No.690), o-, m- and p-cresol (Nos 691–693), p-ethylphenol (No. 694), resorcinol (No.712) and 4-(p-hydroxyphenyl)-2-butanone (No. 728) were described in detail by theCommittee at its fifty-fifth meeting (Annex 1, reference 149). Only the results ofstudies on the flavouring agents in the group that were not reported at the fifty-fifthmeeting are presented below. The short-term studies of toxicity on phenol andphenol derivatives are summarized in Table 5.
Table 3. Results of oral acute toxicity studies with phenol and phenolderivatives used as flavouring agents
No. Flavouring agent Species; sex LD50 (mg/kg bw)
Reference
715 2-Methoxy-4-methylphenol Rat; M, F 632 Scheerbaum(2001)
728 4-(p-Hydroxyphenyl)-2-butanone Rat; F 1320 Merkel (2003)
2021 1-(4-Hydroxy-3-methoxyphenyl)-decan-3-one
Mouse; M, F 270 Lee et al. (1991)
2022 3-(4-Hydroxy-phenyl)-1-(2,4,6-trihydroxy-phenyl)-propan-1-one
Rat; M, F >2000 Vaeth (2006)
2024 5,7-Dihydroxy-2-(3-hydroxy-4-methoxy-phenyl)-chroman-4-one
Rat; M, F >2000 Vaeth (2005)
F, female; M, male
Table 4. Data summary of the comparative rates of glutathione conjugateformation from 4-methylphenol analogues in rat liver microsomes and slices
Test substance Glutathione conjugate formation
Microsomes (nmol/min per milligramprotein)
Slices (nmol/h per slice)
p-Cresol 0.39 ± 0.02 2.31 ± 0.14
4-Methylanisole ND ND
2,4-Dimethylphenol 0.24 ± 0.04 2.18 ± 0.21
2,4,6-Trimethylphenol 0.13 ± 0.03 1.00 ± 0.10
p-[ , , -d3]-Cresol 0.13 ± 0.02 1.39 ± 0.07
ND, not detectedSource: Thompson, Perera & London (1996)
PHENOL AND PHENOL DERIVATIVES (addendum) 223

Tabl
e 5.
Res
ults
of s
hort
-ter
m s
tudi
es o
n ph
enol
and
phe
nol d
eriv
ativ
es
No.
Age
ntS
peci
es;
sex
No.
of t
est g
roup
sa /no
. per
gro
upb
Rou
teD
urat
ion
(day
s)N
OA
ELc /
NO
ELd
(mg/
kg b
w p
er d
ay)
Ref
eren
ce
690
Phe
nol
Rat
; M, F
3/30
Drin
king
-wat
er91
308.
2d (M
)35
9.8d
(F)
Bey
rout
y (1
998)
692
m-C
reso
lR
at; M
, F3/
24G
avag
e17
30c
Koi
zum
i et a
l. (2
003)
692
m-C
reso
lR
at; M
, F3/
14G
avag
e28
300c
Koi
zum
i et a
l. (2
003)
692/
693
m/p
-Cre
sol
Rat
; M3/
50D
iet
735
230c
NT
P (
2008
)
692/
693
m/p
-Cre
sol
Mou
se; F
3/50
Die
t73
530
0cN
TP
(20
08)
694
p-E
thyl
phen
olR
at; M
, F4/
6G
avag
e18
30c
Tak
ahas
hi e
t al.
(200
6)
694
p-E
thyl
phen
olR
at; M
, F4/
7G
avag
e28
100c
Tak
ahas
hi e
t al.
(200
6)
712
Res
orci
nol
Rat
; M, F
4/30
Drin
king
-wat
er12
610
00d
(mg/
l)W
elsc
h, N
emec
& L
awre
nce
(200
6)
728
4-(p
-Hyd
roxy
phen
yl)-
2-b
utan
one
Rat
; M, F
3/10
Die
t90
70c
Hof
fman
(20
04)
2023
Mag
nolo
lR
at; M
, F5/
5D
iet
2148
0c,e
Liu
et a
l. (2
007)
2023
Mag
nolo
lR
at; M
, F4/
20D
iet
9024
0c,e
Liu
et a
l. (2
007)
F, f
emal
e; M
, mal
ea
Tot
al n
umbe
r of
test
gro
ups
does
not
incl
ude
cont
rol a
nim
als.
b T
otal
num
ber
per
test
gro
up in
clud
es b
oth
mal
e an
d fe
mal
e an
imal
s.c N
o-ob
serv
ed-a
dver
se-e
ffect
leve
l.d
No-
obse
rved
-effe
ct le
vel.
e H
ighe
st d
ose
test
ed. T
he a
ctua
l NO
AE
L/N
OE
L m
ay b
e hi
gher
.
224 PHENOL AND PHENOL DERIVATIVES (addendum)

(i) Phenol (No. 690)
The potential neurotoxicity of phenol was investigated in three groupsof 15 male and 15 female Sprague-Dawley rats dosed for 13 weeks with phenol(purity 100%) in the drinking-water at concentrations of 0 (control), 200, 1000 or5000 mg/l, which correspond to 0, 18.1, 83.1 and 308.2 mg/kg bw per day for malesand 0, 24.6, 107.0 and 359.8 mg/kg bw per day for females, respectively (USFDA,1993), followed by a 4-week recovery phase. Body weights and food consumptionwere determined weekly, water intake was measured daily and clinical signs wererecorded daily. A functional observational battery (FOB) and motor activity test wereconducted before initiation of exposures and once during each of weeks 4, 8, 13and 17 (recovery animals). At the end of 13 weeks of dosing, five rats of each sexper group were anaesthetized and subjected to whole-body perfusion with awashout solution followed by a fixative for neuropathological evaluation. Theremaining animals were terminated at the end of the recovery period. Five rats ofeach sex per group were subjected to fixation perfusion but not further examined,and the remainder underwent necropsy.
One high-dose female was euthanized at 14 days owing to poor condition.All others survived for the study duration. Food consumption in 5000 mg/l malesand females was reduced, and mean body weights were lower for these groupsfrom days 64 and 8, respectively, until dosing termination. Marked body weight gainsoccurred during the recovery period for both sexes, resulting in no significantdifference between dosed and control groups. Mean food consumption and dailywater intake were significantly lower for high dose group males and females duringvarious intervals of the dosing period, and mean food consumption and daily waterintake for high-dose animals were increased during the recovery period.
No differences in group mean motor activity counts were detected for malesin any of the dosed groups; some reductions in activity counts were observed infemales, but were attributed to reduction in water or food intake. The FOB evaluationdid not reveal any findings of neurotoxicological significance following qualitative(observations in home cage, removal from home cage, observations in area,handling observations on surface and on top of box) or quantitative (grip strength,hind limb splay or body temperature) measurements throughout dosing or followingthe recovery period. No macroscopic or histopathological lesions in nervous tissueattributed to dosing were noted. A no-observed-effect level (NOEL) for neurotoxicitywas established as 5000 mg/l in drinking-water (308.2 and 359.8 mg/kg bw per dayfor males and females, respectively) under the conditions of this study (Beyrouty,1998).
(ii) m-Cresol (No. 692)
In order to determine the susceptibility of neonates to m-cresol (referred toas 3-methylphenol), newborn Sprague-Dawley rats (12 of each sex per group) wereadministered m-cresol (purity 99.13%) at doses of 0, 30, 100 or 300 mg/kg bw perday on postnatal days 4–21 by intragastric instillation in olive oil. At 300 mg/kg bwper day, clinical signs, including deep respiration, hypersensitivity on handling andtremors under contact stimulus, and depressed body weight gain were observed.
PHENOL AND PHENOL DERIVATIVES (addendum) 225

Hypersensitivity and tremors were also reported occasionally during the dosingperiod in a small number of males. There were no abnormalities in physicaldevelopment, sexual maturation or reflex ontogeny at any dose level, and noadverse effects were reported in the 30 mg/kg bw per day dose group. In the samereport, a 28-day toxicity study was described in which 5-week-old Sprague-Dawleyrats (seven of each sex per group) were administered m-cresol at doses of 0, 100,300 or 1000 mg/kg bw per day by intragastric instillation in olive oil with a 2-weekrecovery period. At 1000 mg/kg bw per day, clinical signs and body weightdepression occurred in both sexes, as was observed in the newborn animals. Nochanges were observed at lower doses. At the end of the recovery period, nosignificant change in any parameter was observed. The authors concluded thatnewborn rats are 3–4 times more susceptible than adult rats to toxicity fromexposure to m-cresol (Koizumi et al., 2003).
(iii) m/p-cresol (Nos 692 and 693)
In a 2-year multiple dose study, groups of 50 male F344/N rats approximately6 weeks of age were maintained on diets containing 0, 1500, 5000 or 15 000 mg/kg (equivalent to average daily doses of approximately 0, 70, 230 and 720 mg/kgbw per day) of a 60:40 mixture of m/p-cresol (overall purity 99.5%). Foodconsumption and body weights were measured weekly for the first 13 weeks andat 4-week intervals thereafter. Clinical signs were measured at week 5 and at 4-week intervals thereafter. Following necropsy, complete histopathology wasperformed on all animals, including examination of macroscopic lesions and tissuemasses.
Mean body weights of the 720 mg/kg bw per day group were less than thoseof the control group throughout the study. Owing to lack of palatability, foodconsumption by the 720 mg/kg bw per day group was less than that by the controlgroup during the first week of the study but increased to control levels by the secondweek of the study. No clinical signs of toxicity were observed. At necropsy andhistopathology, the severity of nephropathy was slightly increased in the 720 mg/kgbw per day group. Renal tubule adenomas in the kidney were reported in animalsmaintained at this dietary level (720 mg/kg bw per day). The incidence of hyperplasiaof the transitional epithelium of the renal pelvis was significantly increased in the720 mg/kg bw per day group as well. Examination of the liver showed that theincidences of eosinophilic foci were significantly increased in the 720 mg/kg bw perday group. Exposure to cresols increased the incidences of hyperplasia of the gobletcells and respiratory epithelium of the nose in all exposed groups of rats in this study.The incidences of squamous metaplasia of the respiratory epithelium weresignificantly increased at the 230 and 720 mg/kg bw per day dose levels, andinflammation was significantly increased in the 720 mg/kg bw per day group. Basedon increased incidences of renal tubule adenomas in male rats at 720 mg/kg bw perday, a NOAEL of 230 mg/kg bw per day (5000 mg/kg) was reported (NTP, 2008).
In a similar 2-year multiple dose study, groups of 50 6-week-old femaleB6C3F1 mice were maintained on diets calculated to provide an average dailyintake of m/p-cresol (40:60 mixture; overall purity 99.5%) of 0, 1000, 3000 or 10 000mg/kg (equivalent to average daily doses of approximately 0, 100, 300 or
226 PHENOL AND PHENOL DERIVATIVES (addendum)

1040 mg/kg bw per day). Food consumption and body weights were measuredweekly for the first 13 weeks and at 4-week intervals thereafter. Clinical signs weremeasured at week 5 and at 4-week intervals thereafter. Complete necropsies andhistopathology were performed on all animals. At necropsy, all organs and tissueswere examined for visible lesions. Mean body weights of the animals maintained atthe 300 and 1040 mg/kg bw per day doses were less than those of the control groupafter weeks 12 and 9, respectively. Food consumption was temporarily decreasedin animals treated in the 1040 mg/kg bw per day group. In females maintained atthe 1040 mg/kg bw per day dose, the incidence of squamous cell papilloma of theforestomach was significantly greater when compared with the control group. In the300 and 1040 mg/kg bw per day groups, increased epithelial hyperplasia of the nosewas reported, and occurrences of minimal to moderate bronchiolar hyperplasiawere significantly increased in all exposed groups, but the severity increased withincreasing concentrations. In the 1040 mg/kg bw per day group, increasedincidences of eosinophilic foci of the liver were reported. Based on the increasedincidence of forestomach squamous cell papilloma in the females maintained at adose of 1040 mg/kg bw per day, a NOAEL of 300 mg/kg bw per day (3000 mg/kgdiet) was reported (NTP, 2008).
The development of forestomach tumours in rodents in these studies,together with their relevance to the potential for human carcinogenicity, has beenthe subject of much consideration (Grice, 1988; Wester & Kroes, 1988; Clayson etal., 1990; IARC, 2003). The mucosa of the rodent forestomach is not similar to thatof the human oesophagus; it is partially composed of a keratinizing squamousepithelial layer. The rodent forestomach stores food and is constantly exposed toacidic gastric juice. Conversely, the human distal oesophagus is not involved instorage and does not have constant contact with the acidic gastric medium. Thehuman oesophagus contains a non-keratinizing squamous epithelium that isadversely affected by strongly acidic medium (Adams et al., 2008). Therefore, theincidences of forestomach lesions in rodent studies where high concentrations oftest material were administered by intragastric instillation are not relevant tohumans, as these lesions occur at the contact site (forestomach) and arise from theirritating effect of a bolus dose of the irritant given intragastrically.
In the NTP (2008) studies described above, the papillomas in the rodentforestomach were likely due to prolonged contact with high concentrations ofirritating cresols (Adams et al., 2008).
(iv) p-Ethylphenol (No. 694)
In an 18-day repeated-dose study, newborn Sprague-Dawley rats (six ofeach sex per dose) were administered p-ethylphenol (98.4% pure) at doses of 0,30, 100 or 300 mg/kg bw per day by intragastric instillation in olive oil on postnataldays 4–21. Recovery groups (six of each sex per dose) were maintained for 9 weeksand examined at 12 weeks. General condition, body weights, haematology, bloodchemistry, necropsy and organ weights were examined. Clinical signs ofhypoactivity, hypothermia, tremor, deep respiration, emaciation and decreasedbody weights occurred in both sexes at 300 mg/kg bw per day. Two out of the 12females dosed with 300 mg/kg bw per day were found dead on days 10 and 12 of
PHENOL AND PHENOL DERIVATIVES (addendum) 227

dosing. One showed dark red lungs and congestive oedema of the lung, and theother showed distension of the gastrointestinal tract and atrophy of the thymic cortexat necropsy. A delay in the righting reflex was observed in 4 out of 12 males at 300mg/kg bw per day and in 1 out of 12 females at 100 mg/kg bw per day as well as in1 out of 10 females at 300 mg/kg bw per day. At necropsy at the end of dosing, anincrease in the relative weights of the livers was observed in males and females at300 mg/kg bw per day. There were no changes in blood biochemistry or histo-pathological findings related to liver damage. No effects of dosing were found at theend of the recovery period. A NOAEL of 30 mg/kg bw per day in the newborn ratwas based on the delay in the development of the righting reflex at 100 mg/kg bwper day (Takahashi et al., 2006).
In a 28-day repeated-dose study, 5-week-old Sprague-Dawley rats (sevenof each sex per dose) were given p-ethylphenol (98.4% pure) at doses of 0, 100,300 or 1000 mg/kg bw per day by intragastric instillation in olive oil. Recovery groups(0 or 1000 mg/kg bw per day) (seven of each sex per dose) were maintained for 2weeks and examined at 11 weeks of age. At 1000 mg/kg bw per day, clinical signsof toxicity, including salivation, staggering gait, lateral position and soiled perigenitalfur, were observed in 11 out of 14 males and 9 out of 14 females. Decreased bodyweights were also reported at this dose level. A high volume of urine was seen infemales at 1000 mg/kg bw per day. Compared with controls, clinical chemistryrevealed elevated alanine aminotransferase activities in males and total cholesterollevels in females at 1000 mg/kg bw per day. At necropsy at the end of dosing,thinning of the mucosa in the glandular stomach in both sexes and reddish spots inthe glandular stomach in females were evident. In males dosed with 300 and 1000mg/kg bw per day, increases in relative liver weights were observed. Males dosedwith 1000 mg/kg bw per day showed a significant increase in relative kidney weight.Females dosed with 1000 mg/kg bw per day showed an increase in liver weight.Erosion, hyperplasia of squamous cells, degeneration of squamous cells or oedemaof the submucosa in the forestomach was observed in all seven males at 1000 mg/kg bw per day. Hyperplasia of squamous cells in the forestomach was observed inone out of seven males at 300 mg/kg bw per day. Hyperplasia of squamous cells inthe oesophagus, degeneration of squamous cells, oedema of the submucosa,granulation of the submucosa, hyperplasia of squamous cells or ulcer in theforestomach was observed in six out of seven females at 1000 mg/kg bw per day.The NOAEL in the 5-week-old rat was 100 mg/kg bw per day based on the lesionsin the forestomach at 300 mg/kg bw per day. At the end of the recovery period, theonly effect of dosing was lowered body weight of males (Takahashi et al., 2006).
(v) Resorcinol (No. 712)
In order to assess the potential adverse effects of resorcinol (No. 712) onreproduction, test guideline criteria (Organisation for Economic Co-operation andDevelopment [OECD], United States Environmental Protection Agency) withexpanded thyroid gland end-points were evaluated at termination of either the F0 orF1 generation. Male and female Sprague-Dawley rats, 30 of each sex per group,were provided concentrations of resorcinol (purity not stated) of 0, 120, 360, 1000and 3000 mg/l in the drinking-water for 18 weeks starting at 6 weeks of age and at
228 PHENOL AND PHENOL DERIVATIVES (addendum)

least 70 days before mating. Body weights and food consumption were measuredweekly. Thyroid hormone function assessment was performed at study termination.None of the reproductive end-points assessed according to OECD Test Guideline416 was affected by resorcinol exposure at any concentration. There was a slightdecrease in mean body weights among the 3000 mg/l F0 animals of both sexes atcertain times during the study and in F1 males during the entire 18 weeks. Therewere no statistically significant changes in the mean concentrations of thyroidstimulating hormone (TSH), triiodothyronine (T3) or thyroxine (T4) in either foodintake or food conversion efficiency. Resorcinol-induced colloid depletion wasmarginal in the 1000 mg/l males and not detectable in the females. Because therewere no detectable adverse effects on the set of reproductive toxicity end-points oron the thyroid end-points, it was concluded that the NOAEL for continuous exposurewas 3000 mg/l. A NOEL for histopathology and stereomicroscopy of follicular colloidfor resorcinol intake in the drinking-water was concluded to be 1000 mg/l (Welsch,Nemec & Lawrence, 2006).
(vi) 4-(p-Hydroxyphenyl)-2-butanone (No. 728)
In a 90-day study, male and female Sprague-Dawley rats approximately 8weeks of age were fed diets containing 4-(p-hydroxyphenyl)-2-butanone (purity12%),1 referred to as Raspberry Ketone GMP, at levels calculated to provide anaverage intake of 0, 70, 275 or 700 mg/kg bw per day. Body weights and foodconsumption were measured weekly. A FOB and motor activity test wereconducted on all animals at weeks 12 and 13. At the end of the 90 days, haematology,clinical chemistry, organ weight measurements, macroscopic examination andhistopathology were performed. Males in the highest dietary intake group (700 mg/kg bw per day) showed dose-related decreases in body weight gain. There were notest substance–related or statistically significant differences in body weights in the70 and 275 mg/kg bw per day dose groups for males or in any dose group forfemales when compared with the controls. Minimal decreases in food consumptionwere reported in males only in the 275 and 700 mg/kg bw per day groups duringthe first and second weeks of dosing. There were no test substance–relateddifferences in food consumption during the remainder of the study in males andfemales compared with the control animals. No effect on motor activity was reportedat any dietary level. The only dosing-related effect on organ weights occurred withliver weights; statistically significant but mild increases in liver weights were notedin the 275 and 700 mg/kg bw per day dose groups, which may correlate with serumenzyme increases. Haematology revealed a decrease in reticulocyte counts inmales at 700 mg/kg bw per day compared with controls. However, the differenceswere not considered biologically significant, because the majority of the individualvalues were within the range for the control group. No other haematologyparameters were affected in the males or females. Significant increases in alanineaminotransferase, aspartate aminotransferase and alkaline phosphatase activitieswere noted in the 700 mg/kg bw per day male and female groups. The increases in
1 Raspberry ketone from a commercial dietary supplement preparation was used toincorporate the test material into the feed. The intake levels were calculated based on 12%of 4-(p-hydroxyphenyl)-2-butanone in the preparation.
PHENOL AND PHENOL DERIVATIVES (addendum) 229

alanine aminotransferase and aspartate aminotransferase activities were alsonoted in the 275 mg/kg bw per day group of females. However, as nohistopathological effects were observed for the liver, the increased enzyme activitiesmay represent an adaptive metabolic response of the liver to the test article.Statistically significant decreases from control values in serum creatinine levelswere noted in females in the 275 and 700 mg/kg bw per day dose groups, but theabsolute differences were minimal and considered not to be test substance related.No significant dosing-related macroscopic findings were noted. A NOAEL of 70 mg/kg bw per day was reported for both male and female rats (Hoffman, 2004).
(vii) Magnolol (No. 2023)
In a 21-day pilot study, groups of five Sprague-Dawley rats, 6–7 weeks old,were administered magnolia bark extract (94% magnolol and 1.5% honokiol) in thediet at doses of 0, 60, 120, 240 or 480 mg/kg bw per day. No deaths occurred, andthere were no dosing-related effects on body weight gain, clinical observations,haematology, clinical chemistry, urinalysis, organ weight measurements ormacroscopic or microscopic findings. Similarly, in a 90-day study, groups of five ratswere fed magnolia bark extract at doses of 0, 60, 120 or 240 mg/kg bw per day. Nomortality, ophthalmic abnormalities or dosing-related findings in clinical obser-vations, haematology, coagulation or organ weight measurements were observed.There were no test substance–related macroscopic or microscopic findings.Differences between dosed and control groups in body weight, body weight gain,food consumption and food conversion efficiency, clinical chemistry and urinalysisparameters were not considered toxicologically significant, as they were not doserelated or because values remained within historical control ranges. A NOAEL of240 mg/kg bw per day, the highest dose tested, was established based on thefindings of the 90-day study (Liu et al., 2007).
(c) Genotoxicity studies
Genotoxicity testing has been performed on six additional flavouring agentsand seven previously evaluated flavouring agents (Annex 1, reference 149). Theresults of these tests are summarized in Table 6 and are described below.
(i) In vitro
2,4,6-Trimethylphenol (No. 2013) was tested for mutagenicity by incubationwith Salmonella typhimurium tester strains TA98, TA100, TA1535 and TA1537either alone or with an exogenous induced male rat liver bioactivation system usinga spot test and subsequently in TA98 using the plate incorporation assay. The testsubstance alone and with bioactivation was toxic at 4086 μg (30 μmol) per plate. Atconcentrations up to 4086 μg/plate, the test substance was reported to produce noincrease in revertant mutants in any strain (data not given), whereas appropriatecontrol substances established the responsiveness of the tester strains (Florin etal., 1980). Negative results were also reported (data not given) in strains TA98 andTA100 (Epler, Rao & Guerin, 1979; Kubo, Urano & Utsumi, 2002).
230 PHENOL AND PHENOL DERIVATIVES (addendum)
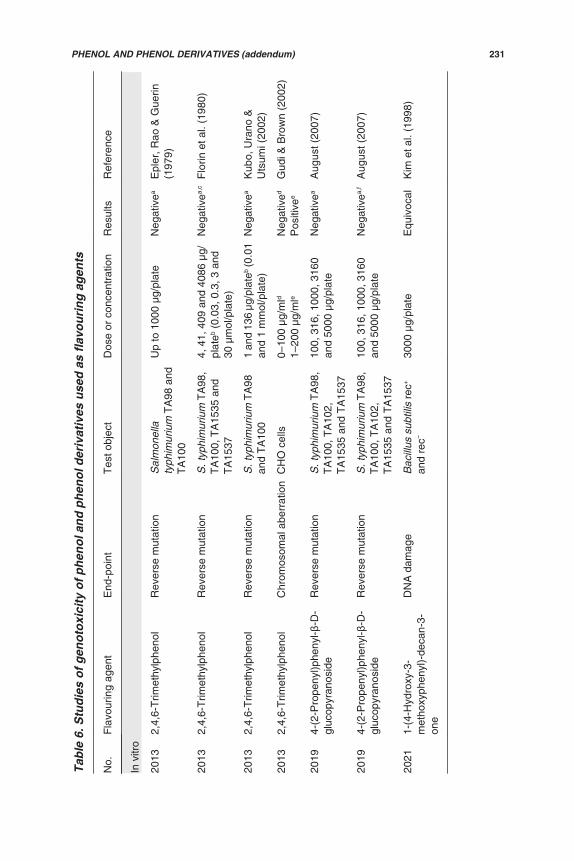
Tabl
e 6.
Stu
dies
of g
enot
oxic
ity o
f phe
nol a
nd p
heno
l der
ivat
ives
use
d as
flav
ouri
ng a
gent
s
No.
Fla
vour
ing
agen
tE
nd-p
oint
Tes
t obj
ect
Dos
e or
con
cent
ratio
nR
esul
tsR
efer
ence
In v
itro
2013
2,4,
6-T
rimet
hylp
heno
lR
ever
se m
utat
ion
Sal
mon
ella
typh
imur
ium
TA
98 a
ndT
A10
0
Up
to 1
000
μg/p
late
Neg
ativ
eaE
pler
, Rao
& G
uerin
(197
9)
2013
2,4,
6-T
rimet
hylp
heno
lR
ever
se m
utat
ion
S. t
yphi
mur
ium
TA
98,
TA
100,
TA
1535
and
TA
1537
4, 4
1, 4
09 a
nd 4
086
μg/
plat
eb (0
.03,
0.3
, 3 a
nd30
μm
ol/p
late
)
Neg
ativ
ea,c
Flo
rin e
t al.
(198
0)
2013
2,4,
6-T
rimet
hylp
heno
lR
ever
se m
utat
ion
S. t
yphi
mur
ium
TA
98an
d T
A10
01
and
136
μg/p
late
b (0.
01an
d 1
mm
ol/p
late
)N
egat
ivea
Kub
o, U
rano
&U
tsum
i (20
02)
2013
2,4,
6-T
rimet
hylp
heno
lC
hrom
osom
al a
berr
atio
nC
HO
cel
ls0–
100
μg/m
ld
1–20
0 μg
/mle
Neg
ativ
ed
Pos
itive
e
Gud
i & B
row
n (2
002)
2019
4-(2
-Pro
peny
l)phe
nyl-
-D-
gluc
opyr
anos
ide
Rev
erse
mut
atio
nS
. typ
him
uriu
m T
A98
,T
A10
0, T
A10
2,T
A15
35 a
nd T
A15
37
100,
316
, 100
0, 3
160
and
5000
μg/
plat
eN
egat
ivea
Aug
ust (
2007
)
2019
4-(2
-Pro
peny
l)phe
nyl-
-D-
gluc
opyr
anos
ide
Rev
erse
mut
atio
nS
. typ
him
uriu
m T
A98
,T
A10
0, T
A10
2,T
A15
35 a
nd T
A15
37
100,
316
, 100
0, 3
160
and
5000
μg/
plat
eN
egat
ivea,
fA
ugus
t (20
07)
2021
1-(4
-Hyd
roxy
-3-
met
hoxy
phen
yl)-
deca
n-3-
one
DN
A d
amag
eB
acill
us s
ubtil
is r
ec+
and
rec
3000
μg/
plat
eE
quiv
ocal
Kim
et a
l. (1
998)
PHENOL AND PHENOL DERIVATIVES (addendum) 231

Tabl
e 6
(con
td)
No.
Fla
vour
ing
agen
tE
nd-p
oint
Tes
t obj
ect
Dos
e or
con
cent
ratio
nR
esul
tsR
efer
ence
2021
1-(4
-Hyd
roxy
-3-
met
hoxy
phen
yl)-
deca
n-3-
one
Rev
erse
mut
atio
nS
. typ
him
uriu
m T
A98
,T
A10
0, T
A15
35 a
ndT
A15
37
0.06
9, 0
.69,
6.9
and
13.
8μg
/pla
teN
egat
ivea,
fK
im e
t al.
(199
8)
2022
3-(4
-Hyd
roxy
-phe
nyl)-
1-(2
,4,6
-trih
ydro
xy-p
heny
l)-pr
opan
-1-o
ne
Rev
erse
mut
atio
nS
. typ
him
uriu
m T
A98
,T
A10
0, T
A10
2, T
A15
35an
d T
A15
37
3.16
, 10,
31.
6, 1
00 a
nd31
6 μg
/pla
teN
egat
ivea
Aug
ust (
2006
)
2022
3-(4
-Hyd
roxy
-phe
nyl)-
1-(2
,4,6
-trih
ydro
xy-p
heny
l)-pr
opan
-1-o
ne
Rev
erse
mut
atio
nS
. typ
him
uriu
m T
A98
,T
A10
0, T
A10
2, T
A15
35an
d T
A15
37
3.16
, 10,
31.
6, 1
00 a
nd31
6 μg
/pla
teN
egat
ivea,
fA
ugus
t (20
06)
2023
Mag
nolo
lR
ever
se m
utat
ion
S. t
yphi
mur
ium
TA
98,
TA
100,
TA
1535
and
TA
1537
18.5
, 37.
5, 7
5, 1
50 a
nd30
0 μg
/pla
teN
egat
ivea
Li e
t al.
(200
7)
2023
Mag
nolo
lR
ever
se m
utat
ion
Esc
heric
hia
coli
WP
2uv
rA18
.5, 3
7.5,
75,
150
and
300
μg/p
late
Neg
ativ
eaLi
et a
l. (2
007)
2023
Mag
nolo
lC
hrom
osom
al a
berr
atio
nC
HO
cel
ls W
B1
2.2,
7, 2
0, 2
5 an
d 30
μg/
ml
Neg
ativ
ef,gZ
hang
et a
l. (2
008)
2023
Mag
nolo
lC
hrom
osom
al a
berr
atio
nC
HO
cel
ls W
B1
1.25
, 2.5
and
7 μ
g/m
lN
egat
ivee
Zha
ng e
t al.
(200
8)
2023
Mag
nolo
lC
hrom
osom
al a
berr
atio
nC
HO
cel
ls W
B1
0.6,
1.7
, 5 a
nd 1
5 μg
/ml
Neg
ativ
ed,f
Zha
ng e
t al.
(200
8)
2023
Mag
nolo
lC
hrom
osom
al a
berr
atio
nV
79 C
hine
se h
amst
erlu
ng c
ells
6.5,
13,
26
and
52 μ
g/m
ld
7.5,
15,
30
and
59 μ
g/m
le
Neg
ativ
eaZ
hang
et a
l. (2
008)
232 PHENOL AND PHENOL DERIVATIVES (addendum)

Tabl
e 6
(con
td)
No.
Fla
vour
ing
agen
tE
nd-p
oint
Tes
t obj
ect
Dos
e or
con
cent
ratio
nR
esul
tsR
efer
ence
2024
5,7-
Dih
ydro
xy-2
-(3-
hydr
oxy-
4-m
etho
xy-
phen
yl)-
chro
man
-4-o
ne
Rev
erse
mut
atio
nS
. typ
him
uriu
m T
A98
,T
A10
0, T
A10
2, T
A15
35an
d T
A15
37
10, 3
1.6,
100
, 316
and
1000
μg/
plat
eN
egat
ivea,
hS
tien
(200
5)
2024
5,7-
Dih
ydro
xy-2
-(3-
hydr
oxy-
4-m
etho
xy-
phen
yl)-
chro
man
-4-o
ne
Rev
erse
mut
atio
nS
. typ
him
uriu
m T
A98
,T
A10
0, T
A10
2, T
A15
35an
d T
A15
37
10, 3
1.6,
100
, 316
and
1000
μg/
plat
eN
egat
ivea,
f,hS
tien
(200
5)
690
Phe
nol
UD
SM
ouse
lym
phom
a ce
lls0.
1–94
.1 μ
g/m
li
(1.0
μm
ol/l
– 1.
0 m
mol
/l)N
egat
ive
Pel
lack
-Wal
ker
&B
lum
er (
1986
)
690
Phe
nol
Rev
erse
mut
atio
nS
. typ
him
uriu
m T
A97
,T
A98
, TA
100,
TA
102,
TA
104
and
TA
1535
100–
5000
μg/
plat
ed
20–5
000
μg/p
late
e
Neg
ativ
eaG
latt
et a
l. (1
989)
690
Phe
nol
SC
EH
uman
per
iphe
ral b
lood
lym
phoc
ytes
5, 5
0, 5
00, 1
000,
500
0 an
d70
00 μ
g/m
lP
ositi
veE
rexs
on, W
ilmer
&K
liger
man
(19
85)
690
Phe
nol
SC
EC
hine
se h
amst
er V
79ce
lls94
μg/
mlj (
1000
μm
ol/l)
Neg
ativ
eG
latt
et a
l. (1
989)
690
Phe
nol
Mic
ronu
clei
ass
ayC
hine
se h
amst
er V
79ce
lls37
6 μg
/mlj (
4000
μm
ol/l)
Neg
ativ
eG
latt
et a
l. (1
989)
690
Phe
nol
Mic
ronu
clei
ass
ayC
HO
cel
ls (
CH
O-K
5)10
, 50,
100
, 175
and
250
μg/m
lg,e
350,
475
, 600
, 800
, 100
0,15
00 a
nd 2
000
μg/m
ld
Wea
kly
posi
tivek
Mill
er, P
ujad
as &
Goc
ke (
1995
)
PHENOL AND PHENOL DERIVATIVES (addendum) 233

Tabl
e 6
(con
td)
No.
Fla
vour
ing
agen
tE
nd-p
oint
Tes
t obj
ect
Dos
e or
con
cent
ratio
nR
esul
tsR
efer
ence
690
Phe
nol
Chr
omos
omal
abe
rrat
ion
Syr
ian
ham
ster
em
bryo
cel
ls0.
3, 1
, 3 a
nd 9
μg/
mlj (
3, 1
0,30
and
100
μm
ol/l)
Pos
itive
Tsu
tsui
et a
l. (1
997)
690
Phe
nol
SC
ES
yria
n ha
mst
er e
mbr
yo c
ells
1, 9
, 28,
94
and
282
μg/m
lj
(10,
100
, 300
, 100
0 an
d 30
00μm
ol/l)
Pos
itive
Tsu
tsui
et a
l. (1
997)
690
Phe
nol
UD
SS
yria
n ha
mst
er e
mbr
yo c
ells
0.09
, 0.3
, 1, 3
and
9 μ
g/m
lj (1,
3, 1
0, 3
0 an
d 10
0 μm
ol/l)
Pos
itive
Tsu
tsui
et a
l. (1
997)
690
Phe
nol
Rev
erse
mut
atio
nS
. typ
him
uriu
m T
A98
and
TA
100
1 an
d 94
μg/
plat
ej (0.
01 a
nd 1
mm
ol/p
late
)N
egat
ivea
Kub
o, U
rano
& U
tsum
i(2
002)
691
o-C
reso
lR
ever
se m
utat
ion
E. c
oli W
3110
(po
lA+)
and
p347
8 (p
olA
)0,
50,
100
, 500
, 100
0 an
d50
00 μ
g/pl
ate
Neg
ativ
eaP
eppe
r, H
amilt
on &
Sch
eetz
(19
80)
691
o-C
reso
lR
ever
se m
utat
ion
S. t
yphi
mur
ium
TA
98 a
ndT
A10
01
and
108
μg/p
late
l (0.
01–1
mm
ol/p
late
)N
egat
ivea
Kub
o, U
rano
& U
tsum
i(2
002)
691
o-C
reso
lR
ever
se m
utat
ion
S. t
yphi
mur
ium
TA
98,
TA
100,
TA
1535
, TA
1537
and
TA
1538
0.01
, 0.1
, 1, 5
, 10,
26
and
52μg
/pla
tem (
0.01
, 0.1
, 1, 5
, 10,
25 a
nd 5
0 μl
/pla
te)
Neg
ativ
eaJa
gann
ath
& B
rusi
ck(1
981)
691
o-C
reso
lS
CE
CH
O c
ells
0.01
, 0.0
3, 0
.05,
0.0
8 an
d 0.
1μg
/mld,
m (
12.5
, 25.
0, 5
0.6,
75.0
and
100
nl/m
l)0.
002,
0.0
03, 0
.006
, 0.0
1 an
d0.
02 μ
g/m
le,m (
1.56
, 3.1
3,6.
25, 1
2.5
and
15 n
l/ml)
Pos
itive
aG
allo
way
& B
rusi
ck (1
981)
234 PHENOL AND PHENOL DERIVATIVES (addendum)

Tabl
e 6
(con
td)
No.
Fla
vour
ing
agen
tE
nd-p
oint
Tes
t obj
ect
Dos
e or
con
cent
ratio
nR
esul
tsR
efer
ence
691
o-C
reso
lS
CE
CH
O c
ells
0.4,
0.5
, 0.6
, 0.7
and
0.8
μg/m
le,m (4
00, 5
00, 6
00, 7
00an
d 80
0 nl
/ml)
Pos
itive
nG
allo
way
& B
rusi
ck(1
981)
691,
692
, 693
o-,m
-,p-
Cre
sol (
33.3
%ea
ch, m
ixtu
re)
SC
EC
HO
cel
ls0.
005,
0.0
01, 0
.005
, 0.0
1,0.
05 a
nd 0
.1 μ
g/m
ld,m (
0.5,
1, 5
, 10,
50
and
100
nl/m
l)0.
0007
, 0.0
01, 0
.003
,0.
005,
0.0
1 an
d0.
02 μ
g/m
le,m (
0.62
5, 1
.25,
2.5,
5, 1
0 an
d 15
nl/m
l)
Pos
itive
Gal
low
ay &
Bru
sick
(198
0)
691,
692
, 693
o-,m
-,p-
Cre
sol (
33.3
%ea
ch, m
ixtu
re)
SC
EC
HO
cel
ls0.
05, 0
.08,
0.1
and
0.13
μg/
mld,
m (
50, 7
5, 1
00an
d 12
5 nl
/ml)
0.01
, 0.0
2, 0
.03,
0.0
4, 0
.05,
0.8
and
0.1
μg/m
le,m (1
0, 2
0,30
, 40,
50,
75
and
100
nl/
ml)
Pos
itive
Gal
low
ay &
Bru
sick
(198
0)
691,
692
, 693
o-,m
-,p-
Cre
sol (
33.3
%ea
ch, m
ixtu
re)
UD
SR
at p
rimar
y he
pato
cyte
s0.
0005
, 0.0
01, 0
.003
,0.
005,
0.0
1, 0
.03,
0.0
5 an
d0.
1 μg
/mld,
m (
0.5,
1, 2
.5, 5
,10
, 25,
50
and
100
nl/m
l)
Slig
htly
pos
itive
Myh
r &
Bru
sick
(19
80)
692
m-C
reso
lU
DS
Rat
prim
ary
hepa
tocy
tes
0.25
1, 0
.502
, 1, 2
.51,
5.0
2,10
, 25.
1, 5
0.2,
100
, 251
and
502
μg/m
l
Neg
ativ
eoC
ifone
(19
88)
PHENOL AND PHENOL DERIVATIVES (addendum) 235

Tabl
e 6
(con
td)
No.
Fla
vour
ing
agen
tE
nd-p
oint
Tes
t obj
ect
Dos
e or
con
cent
ratio
nR
esul
tsR
efer
ence
693
p-C
reso
lU
DS
Hum
an e
mbr
yoni
c lu
ngfib
robl
ast c
ells
10, 8
0 an
d 80
0 μg
/ml
Pos
itive
pC
row
ley
& M
arga
rd(1
978)
693
p-C
reso
lU
DS
Hum
an p
erip
hera
lly
mph
ocyt
es0.
5–3
μg/m
ll (5–
25μm
ol/l)
Neg
ativ
eD
augh
erty
& F
rank
s(1
986)
693
p-C
reso
lR
ever
se m
utat
ion
S. t
yphi
mur
ium
TA
98,
TA
100,
TA
1535
,T
A15
37 a
nd T
A15
38
0.00
8, 0
.04,
0.2
and
1μg
/pla
tem (
0.00
8, 0
.04,
0.2
and
1 μl
/pla
te)
Neg
ativ
eaC
row
ley
& M
arga
rd(1
978)
693
p-C
reso
lR
ever
se m
utat
ion
S. t
yphi
mur
ium
TA
98an
d T
A10
01
and
108
μg/p
late
l (0.
01an
d 1
mm
ol/p
late
)N
egat
ivea
Kub
o, U
rano
&U
tsum
i (20
02)
693
p-C
reso
lT
rans
form
atio
nC
3H10
t1/2
mou
sefib
robl
asts
6–60
00 μ
g/pl
atem
(0.0
06–6
.0 μ
l/pla
te)
Neg
ativ
eC
row
ley
& M
arga
rd(1
978)
709
Thy
mol
Chr
omos
omal
abe
rrat
ion
Chi
nese
ham
ster
lung
cells
Up
to 1
5 00
0 μg
/ml
Slig
htly
pos
itive
d
Neg
ativ
ee
Kus
akab
e et
al.
(200
2)
712
Res
orci
nol
Rev
erse
mut
atio
nS
. typ
him
uriu
m T
A98
and
TA
100
1 an
d 11
0 μg
/pla
teq (
0.01
and
1 m
mol
/pla
te)
Neg
ativ
eaK
ubo,
Ura
no &
Uts
umi (
2002
)
733
4-(1
,1-D
imet
hyl)-
ethy
l phe
nol
Chr
omos
omal
abe
rrat
ion
Chi
nese
ham
ster
lung
cells
Up
to 3
0 00
0 μg
/ml
Slig
htly
pos
itive
d
Neg
ativ
ee
Kus
akab
e et
al.
(200
2)
236 PHENOL AND PHENOL DERIVATIVES (addendum)

Tabl
e 6
(con
td)
No.
Fla
vour
ing
agen
tE
nd-p
oint
Tes
t obj
ect
Dos
e or
con
cent
ratio
nR
esul
tsR
efer
ence
In v
ivo
2013
2,4,
6-T
rimet
hylp
heno
lM
icro
nucl
eiM
ice
bone
mar
row
0–16
00 m
g/kg
bw
Neg
ativ
eG
udi &
Krs
man
ovic
(200
2)
2023
Mag
nolo
lM
icro
nucl
eiS
wis
s al
bino
CD
-1 m
ice
bone
mar
row
625,
125
0 an
d 25
00 m
g/kg
bwr
Neg
ativ
esLi
et a
l. (2
007)
690
Phe
nol
Sex
-link
ed le
thal
mut
atio
nD
roso
phila
mel
anog
aste
r20
00t a
nd 5
250u
μg/m
lN
egat
ive
Woo
druf
f et a
l. (1
985)
690
Phe
nol
Mic
ronu
clei
Pre
gnan
t mou
se b
one
mar
row
265
mg/
kg b
wN
egat
ive
Cira
nni e
t al.
(198
8a)
690
Phe
nol
Mic
ronu
clei
Fet
al m
ouse
live
r26
5 m
g/kg
bw
to d
ams
Neg
ativ
eC
irann
i et a
l. (1
988a
)
690
Phe
nol
Mic
ronu
clei
Mou
se b
one
mar
row
265
mg/
kg b
wP
ositi
ver
Cira
nni e
t al.
(198
8b)
690
Phe
nol
Mic
ronu
clei
Mou
se b
one
mar
row
265
mg/
kg b
wP
ositi
vev
Cira
nni e
t al.
(198
8b)
691
o-C
reso
lS
ex-li
nked
leth
alm
utat
ion
D. m
elan
ogas
ter
100,
500
and
100
0 μg
/ml
Neg
ativ
erS
erna
u (1
989)
CH
O, C
hine
se h
amst
er o
vary
; DN
A, d
eoxy
ribon
ucle
ic a
cid;
SC
E, s
iste
r ch
rom
atid
exc
hang
e; U
DS
, uns
ched
uled
DN
A s
ynth
esis
a W
ith a
nd w
ithou
t an
exog
enou
s bi
oact
ivat
ion
syst
em.
b C
alcu
late
d us
ing
a re
lativ
e m
olec
ular
mas
s of
136
.19.
c T
oxic
at 3
0 μm
ol/p
late
.d
With
out e
xoge
nous
bio
activ
atio
n sy
stem
.e
With
exo
geno
us b
ioac
tivat
ion
syst
em.
f P
rein
cuba
tion
assa
y.g
Med
ia s
uppl
emen
ted
with
rat
ser
um.
PHENOL AND PHENOL DERIVATIVES (addendum) 237

Tabl
e 6
(con
td)
h S
carc
e ba
ckgr
ound
law
n ob
serv
ed a
t 100
0 μg
/pla
te.
i T
oxic
ity o
bser
ved
at c
once
ntra
tions
of 1
75 μ
l/ml a
nd h
ighe
r w
ithou
t exo
geno
us b
ioac
tivat
ion
syst
em.
j C
alcu
late
d w
ith a
rel
ativ
e m
olec
ular
mas
s of
94.
11.
k O
bser
ved
only
in th
e ab
senc
e of
exo
geno
us b
ioac
tivat
ion
syst
em.
l C
alcu
late
d us
ing
a re
lativ
e m
olec
ular
mas
s of
108
.14.
m C
alcu
late
d us
ing
a de
nsity
of 1
.044
g/m
l.n
Tox
ic a
t 800
nl/m
l.o
Exc
essi
ve to
xici
ty o
bser
ved
at c
once
ntra
tions
gre
ater
than
10
μg/m
l.p
Pos
itive
onl
y at
the
high
est c
once
ntra
tion
test
ed, w
hich
is m
ore
than
dou
ble
the
med
ian
effe
ctiv
e co
ncen
trat
ion
(EC
50)
of 3
10 μ
g/m
l.q
Cal
cula
ted
usin
g a
rela
tive
mol
ecul
ar m
ass
of 1
10.1
1.r
Sho
rt-t
erm
, 24
h tr
eatm
ent.
s A
dmin
iste
red
via
oral
gav
age.
t T
wen
ty-f
our-
hour
and
48
h sa
mpl
ing.
u F
eedi
ng r
oute
of a
dmin
istr
atio
n.v
Inje
ctio
n ro
ute
of a
dmin
istr
atio
n.
238 PHENOL AND PHENOL DERIVATIVES (addendum)

2,4,6-Trimethylphenol (No. 2013) was tested for induction of chromosomalaberration in the cultured Chinese hamster ovary (CHO) cell line, either alone orwith an exogenous induced rat liver bioactivation system. Data were provided forthe cells exposed to test substance, either alone at three concentrations up to 300μg/ml for 4 h or up to 100 μg/ml for 20 h or with the bioactivation system at threeconcentrations up to 200 μg/ml for 4 h. Increases in the percentages of cells withstructural aberrations above solvent control levels were observed at concentrationsof 100 and 200 μg/ml with bioactivation (Gudi & Brown, 2002).
4-(2-Propenyl)phenyl- -D-glucopyranoside (No. 2019), referred to asChavicol- -O-D-glucoside, was tested for mutagenicity to bacteria by incubationwith S. typhimurium tester strains TA98, TA100, TA102, TA1535 and TA1537, eitheralone or with an exogenous induced male rat liver bioactivation system, using boththe plate incorporation and preincubation assays. At five concentrations up to 5000μg/plate, the test substance produced no cytotoxicity and no increase in revertantmutants in any strain, whereas appropriate control substances established theresponsiveness of the tester strains (August, 2007).
1-(4 -Hydroxy-3 -methoxyphenyl)-decan-3-one (No. 2021), referred to as 6-paradol, was tested for deoxyribonucleic acid (DNA) damaging activity to bacteriain the spore rec assay using Bacillus subtilis tester strains H17 rec+ (repair proficient)and M45 rec (repair deficient). At three doses up to 3 mg/disc, the test substanceproduced no difference in the surrounding growth zone of the rec strain comparedwith the rec+ strain, whereas the positive control was active (Kim et al., 1998).
1-(4 -Hydroxy-3 -methoxyphenyl)-decan-3-one (No. 2021) was tested formutagenicity to bacteria by incubation with S. typhimurium tester strains TA98,TA100, TA1535 and TA1537, either alone or with an exogenous induced male ratliver bioactivation system, using a preincubation assay. Either alone at fourconcentrations up to 13.8 μg/plate or with the bioactivation system at fourconcentrations up to 1.38 g/plate, the test substance produced no increase inrevertant mutants in any strain, whereas appropriate control substances establishedthe responsiveness of the tester strains (Kim et al., 1998).
3-(4-Hydroxy-phenyl)-1-(2,4,6-trihydroxy-phenyl)-propan-1-one (No. 2022),referred to as Phoretin Kadem, was tested for mutagenicity to bacteria by incubationwith S. typhimurium tester strains TA98, TA100, TA102, TA1535 and TA1537, eitheralone or with an exogenous induced male rat liver bioactivation system, using bothplate incorporation and preincubation assays. The test substance either alone orwith the bioactivation system was toxic at 316 μg/plate. At five concentrations up to316 μg/plate, the test substance either alone or with the bioactivation systemproduced no increase in revertant mutants in any strain, whereas appropriatecontrol substances established the responsiveness of the tester strains (August,2006).
Magnolol (No. 2023) was tested for mutagenicity to bacteria by incubationwith S. typhimurium tester strains TA98, TA100, TA1535 and TA1537, as well asEscherichia coli strain WP2 uvrA, either alone or with an exogenous induced malerat liver bioactivation system, using a plate incorporation assay. At fiveconcentrations up to 300 μg/plate, the test substance either alone or with the
PHENOL AND PHENOL DERIVATIVES (addendum) 239

bioactivation system produced no increase in revertant mutants in any strain,whereas appropriate control substances established the responsiveness of thetester strains (Li et al., 2007).
Magnolia bark extract, which contained 40–90% magnolol (No. 2023), wastested for induction of chromosomal aberration in CHO WB1 and V79 with rat serumand no exogenous rat liver bioactivation system or with an exogenous rat liverbioactivation system. In the first experiment, concentrations of 0, 2.2, 7, 20 and 30μg/ml of magnolia bark extract were used; one aberrant chromosome was observedat 2.2 μg/ml, and three aberrant chromosomes were observed at 30 μg/ml. In thesecond experiment, 0, 1.25, 2.5 and 7 μg/ml of magnolia bark extract were used;one chromatid break and one chromosome break were observed at 7 μg/ml. Inexperiment 3, 0, 0.6, 1.7, 5 and 15 μg/ml of magnolia bark extract were used; oneisochromatid break and one ring were observed at 0.6 μg/ml. In all threeexperiments, the levels of structural aberrations were not concentration related andwere not consistent with spontaneous mutation. Structural aberrations in testsubstance–dosed groups were not observed under any conditions. In a fourthexperiment with V79 cells using magnolol concentrations of 6.5, 13, 26 and 52 μg/ml with exogenous bioactivation and 7.5, 15, 30 and 59 μg/ml alone, no statisticallysignificant structural aberrations were observed (Zhang et al., 2008).
5,7-Dihydroxy-2-(3-hydroxy-4-methoxy-phenyl)-chroman-4-one (No. 2024)was tested for mutagenicity to bacteria by incubation with S. typhimurium testerstrains TA98, TA100, TA102, TA1535 and TA1537 either alone or with anexogenous induced male rat liver bioactivation system, using both plateincorporation and preincubation assay. The test substance alone and withbioactivation was toxic at 1000 g/plate. At five concentrations up to 1000 μg/plate,the test substance produced no increase in revertant mutants in any strain, whereasappropriate control substances established the responsiveness of the tester strains(Stien, 2005).
Phenol (No. 690) was tested for induction of unscheduled DNA synthesis(UDS) in cultured mouse lymphoma cells (L5178YS). Phenol concentrations of 1μmol/l – 1 mmol/l were used in the mouse lymphoma cells. No increase in UDS wasobserved (Pellack-Walker & Blumer, 1986).
Phenol (No. 690) was tested for induction of UDS in tertiary cultures of Syrianhamster embryo cells. Phenol concentrations of 1–30 μmol/l for 1 h in the presenceof hydroxyurea were used. UDS was induced in a concentration-dependent manner(Tsutsui et al., 1997).
Phenol (No. 690) was tested for mutagenicity to bacteria by incubation withS. typhimurium tester strains TA97, TA98, TA100, TA102, TA104 and TA1535 eitheralone or with an exogenous induced rat liver bioactivation system, using thepreincubation assay. At concentrations up to 100–5000 μg/plate alone or 20–5000μg/plate with bioactivation, the test substance was reported to produce no increasein revertant mutants in any strain (data not given), whereas appropriate controlsubstances established the responsiveness of the tester strains (Glatt et al., 1989).
240 PHENOL AND PHENOL DERIVATIVES (addendum)

Phenol (No. 690) was tested for mutagenicity to bacteria by incubation withS. typhimurium tester strains TA98 and TA100 either alone or with an exogenousinduced rat liver bioactivation system, using the plate incorporation assay. At twoconcentrations up to 94 μg/plate, the test substance was reported to produce noincrease in revertant mutants in any strain (data not given), whereas appropriatecontrol substances established the responsiveness of the tester strains (Kubo,Urano & Utsumi, 2002).
Phenol (No. 690) was tested for mutagenicity to Syrian hamster embryocells. Mutations were assessed at the hypoxanthine–guanine–phosphoribosyltransferase (HGPRT) (6-thioguanine resistance and ouabain resistance) loci. Atconcentrations of 3, 10 and 30 μmol/l for 48 h, the test substance induced dose-related increases in mutations (Tsutsui et al., 1997).
Phenol (No. 690) was tested for induction of sister chromatid exchange(SCE) in human peripheral blood lymphocyte cells. No exogenous metabolicbioactivation system was used. Phenol concentrations of 5, 50, 500, 700, 1000 and3000 μmol/l were used. At increasing concentrations, an increase in SCE wasobserved (Erexson, Wilmer & Kligerman, 1985).
Phenol (No. 690) was tested for induction of SCE in Chinese hamster V79cultured cells. No exogenous metabolic bioactivation system was used. A testsubstance concentration of 94 μg/ml (1000 μmol/l) was used. No increase in SCEwas observed (Glatt et al., 1989).
Phenol (No. 690) was tested in an in vitro micronucleus assay in Chinesehamster V79 cultured cells. A phenol concentration of 376 μg/ml (4000 μmol/l) wasused. No significant increase in micronucleated cells was observed (Glatt et al.,1989).
Phenol (No. 690) was tested in an in vitro micronucleus assay in culturedCHO cells either alone or with an exogenous rat liver bioactivation system. Phenolconcentrations of 10, 50, 100, 175 and 250 μg/ml alone and 350, 475, 600, 800,1000, 1500 and 2000 μg/ml with the bioactivation system were used. A weakincrease in the occurrence of micronucleated cells was observed with highconcentrations of phenol (Miller, Pujadas & Gocke, 1995).
Phenol (No. 690) was tested for induction of morphological transformationin Syrian hamster embryo cells. No effect was found with exposure for 48 h at 3μmol/l, but 10, 30 and 100 μmol/l induced increases without dose dependence(Tsutsui et al., 1997).
o-Cresol (No. 691) (as Guaiacol Special C, which is 60% by weight o-cresol)was tested for DNA damaging activity in E. coli. At five concentrations up to 5000μg/ml, no preferential killing of the pol A repair-deficient strain was found. Thus,there was no evidence of DNA damage (Pepper, Hamilton & Scheetz, 1980).
o-Cresol (No. 691) was tested for mutagenicity to bacteria by incubation withS. typhimurium tester strains TA98, TA100, TA1535, TA1537 and TA1538, eitheralone or with an exogenous induced male rat liver bioactivation system, using aplate incorporation assay. At greater than 1.044 mg (10 μl) per plate, the test
PHENOL AND PHENOL DERIVATIVES (addendum) 241

substance killed all strains. At four concentrations up to 5220 μg (5.0 μl) per plate,the test substance produced no increase in revertant mutants in any strain, whereasappropriate control substances established the responsiveness of the tester strains(Jagannath & Brusick, 1981). Negative results were also reported (data not given)in TA98 and TA100 strains (Kubo, Urano & Utsumi, 2002).
o-Cresol (No. 691) was tested for induction of SCE in cultured CHO cellsalone and with an exogenous rat liver bioactivation system. The test substanceeither alone or with the bioactivation system was toxic at 0.8 μg/ml. A concentration-related increase in SCE was observed with the test substance alone and with theexogenous bioactivation system (Galloway & Brusick, 1981).
m-Cresol (No. 692) was tested for induction of UDS in primary rat hepatocytecells. m-Cresol concentrations of 0.251, 0.502, 1, 2.51, 5.02 and 10 μg/ml wereused; the test substance was toxic at concentrations greater than 10 μg/ml. Therewas no increase in nuclear labelling among the cells treated with the test substance.m-Cresol did not induce UDS in primary rat hepatocyte cells (Cifone, 1988).
p-Cresol (No. 693) was tested for induction of UDS in human embryonic lungfibroblast WI-38 cells. p-Cresol concentrations of 0.01, 0.08 and 0.8 mg/ml wereused. There was an increase in nuclear labelling among the cells dosed with thetest substance (Crowley & Margard, 1978).
p-Cresol (No. 693) was tested for induction of UDS in primary humanperipheral blood lymphocyte cells. p-Cresol concentrations of 5–25 μmol/l wereused. There was no increase in nuclear labelling among the cells dosed with thetest substance (Daugherty & Franks, 1986).
p-Cresol (No. 693) was tested for mutagenicity to bacteria by incubation withS. typhimurium tester strains TA98, TA100, TA1535, TA1537 and TA1538, eitheralone or with an exogenous induced male rat liver bioactivation system, using aplate incorporation assay. At four concentrations up to 108 μg (1 μl) per plate, eitheralone or with the bioactivation system, the test substance produced no increase inrevertant mutants in any strain, whereas appropriate control substances establishedthe responsiveness of the tester strains (Crowley & Magard, 1978). Negative resultswere also reported (data not given) for strains TA98 and TA100 by Kubo, Urano &Utsumi (2002).
p-Cresol (No. 693) was tested for morphological transformation ofC3H10T1/2 cells. Cells were exposed to test substance at up to 6000 μg/plate (6.0μl/plate) for 24 h and then maintained for 6 weeks before assessment of foci oftransformed cells. No increase in transformation was found (Crowley & Margard,1978).
A mixture of cresols (33.3% of each of p-cresol, m-cresol and o-cresol; Nos691, 692 and 693, respectively) was tested for UDS in primary rat hepatocyte cells.Based on a preliminary cytotoxicity study, the test substance mixture atconcentrations of 0.0005, 0.001, 0.003, 0.005, 0.01, 0.03, 0.05 and 0.1 μg/ml (0.5,1, 2.5, 5, 10, 25, 50 and 100 nl/ml) was applied for 1 h followed by incubation with[3H]thymidine for 3 h for incorporation during repair synthesis. The test substanceswere toxic at the highest concentration. The criteria for UDS assessed by
242 PHENOL AND PHENOL DERIVATIVES (addendum)

autoradiography were increases in the nuclear grain count exceeding 7.74, at least17.3% of nuclei containing 6 or more grains or at least 2% of the nuclei containing20 or more grains. The latter two were observed at 0.0005 and 0.001 μg/ml.However, this trend was not continued in a concentration-dependent manner. Thetest substance was considered weakly active in the primary rat hepatocyte UDSassay (Myhr & Brusick, 1980).
A mixture of cresols (33.3% of each of p-cresol, m-cresol and o-cresol; Nos691, 692 and 693, respectively) was tested for SCE in cultured CHO cells alone andwith an exogenous rat liver metabolic activation system. In the first experiment,cresols were used alone at 0.5, 1, 5, 10, 50 and 100 nl/ml or with an exogenousmetabolic bioactivation system at 0.625, 1.25, 2.50, 5, 10 and 15 nl/ml. The testsubstance caused a marked cell cycle delay in the test without the exogenousmetabolic bioactivation system, but no cell cycle delay was observed in the test withthe exogenous metabolic bioactivation system. At 50 nl/ml, there was a smallincrease in SCE, and in the test with exogenous metabolic bioactivation, an increasein SCE was observed at 10 nl/ml. In the second experiment, cresols were used aloneat 50, 75, 100 and 125 nl/ml or with an exogenous metabolic bioactivation systemat 10, 20, 30, 40, 50, 75 and 100 nl/ml. A significant concentration-dependentincrease in SCE was observed. In the third experiment, cresols were used with anexogenous metabolic bioactivation system at 100, 150, 200, 250, 300, 400 and 500nl/ml. Significant increases in SCE were observed at concentrations of 200 nl/mland above. The authors of the study concluded that cresols induce increases inSCE but are less effective in the presence of an exogenous metabolic bioactivationsystem (Galloway & Brusick, 1980).
Thymol (No. 709) was tested for induction of chromosomal aberration inChinese hamster lung cells (CHL/IU) alone and with an exogenous rat livermetabolic bioactivation system. Exposures were for 6, 24 or 48 h alone or 6 h withbioactivation at concentrations up to 15 000 μg/ml. The test substance alone did notinduce structural chromosomal aberrations, but it induced 10–20% aberrations withbioactivation (Kusakabe et al., 2002).
Resorcinol (No. 712) was tested for mutagenicity to bacteria by incubationwith S. typhimurium tester strains TA98 and TA100 either alone or with anexogenous induced rat liver bioactivation system, using the plate incorporationassay. At two concentrations up to 110 μg (1 mmol) per plate, either alone or withthe bioactivation system, the test substance was reported to produce no increasein revertant mutants in any strain (data not given), whereas appropriate controlsubstances established the responsiveness of the tester strains (Kubo, Urano &Utsumi, 2002).
4-(1,1-Dimethyl)-ethyl phenol (No. 733), referred to as p-tert-butylphenol,was tested for induction of chromosomal aberration in Chinese hamster lung cells(CHL/IU) alone and with an exogenous rat liver metabolic bioactivation system.Exposures were for 6, 24 or 48 h alone or 6 h with bioactivation at concentrationsup to 30 000 μg/ml. The test substance alone did not induce structural chromosomalaberration, but it induced 10–20% aberrations with bioactivation. Also, polyploidyup to 93% was observed with 48 h of exposure (Kusakabe et al., 2002).
PHENOL AND PHENOL DERIVATIVES (addendum) 243

(ii) In vivo
2,4,6-Trimethylphenol (No. 2013) was tested for mutagenicity in the mousebone marrow micronucleus assay. ICR mice (five of each sex per dose) wereadministered 0, 125, 250 or 500 mg/kg bw of the test substance by intragastricinstillation in corn oil. Twenty-four hours after dosing, the bone marrow from thefemur was harvested, fixed and stained. There was no indication of an increase inthe numbers of micronucleated polychromatic erythrocytes (Gudi & Krsmanovic,2002).
Magnolol (No. 2023) was tested for mutagenicity in the mouse bone marrowmicronucleus assay. Male and female Swiss albino CD-1 mice (five of each sex pergroup) were administered test substance at a dose of 625, 1250 or 2500 mg/kg bwby intragastric instillation. At 24 or 48 h after dosing, the bone marrow from the femurwas harvested, fixed and stained. There was no indication of an increase in thenumbers of micronucleated polychromatic or normochromatic erythrocytes (Li et al.,2007).
Phenol (No. 690) was tested for mutagenicity by assessment of micro-nucleus induction in erythrocytes in the bone marrow of pregnant mice and livers offetuses. Pregnant CD-1 mice were administered phenol at 265 mg/kg bw byintragastric instillation on day 13 of gestation. At six intervals of 15–40 h, bonemarrow cells of pregnant mice were harvested, and at six intervals of 9–24 h, fetalliver cells were harvested. Both were analysed for micronucleated polychromaticerythrocytes. Statistically significant (P < 0.05) differences of about 2-fold from thecontrols in micronucleated polychromatic erythrocytes were observed at the threeearly time points (15–24 h) for the pregnant female mice, but statistically significantdifferences were not observed in liver polychromatic erythrocytes. The transientincreases in micronucleated polychromatic erythrocytes observed in the pregnantfemale mice were not considered to be biologically significant (Ciranni et al., 1988a).
Phenol (No. 690) was tested for mutagenicity in the mouse bone marrowmicronucleus assay. Male Swiss CD-1 mice were administered phenol at 265 mg/kg bw by intragastric instillation and were killed at 18–48 h after dosing. Bonemarrow cells were harvested and analysed for micronucleated polychromaticerythrocytes. Dosing produced a 3- to 4-fold increase (P < 0.05) in micronucleatedcells at 24 h, but not at 18, 42 or 48 h, despite immediate and severe bone marrowcellularity depression that persisted for 48 h after dosing. In the same study, whenphenol was administered to male Swiss CD-1 mice by intraperitoneal injection at265 mg/kg bw, an increase in micronucleated polychromatic erythrocytes wasobserved at 18 h, which rapidly decreased and was no longer significant at 42 h.Bone marrow depression was higher and longer lasting following injectioncompared with oral administration (Ciranni et al., 1988b).
Phenol (No. 690) was tested for mutagenicity in the sex-linked recessivelethal assay in adult Drosophila melanogaster. The test substance was fed for 3days at 2000 μg/ml or injected at 5250 μg/ml in males before mating. These doseswere intended to achieve 30% mortality. No increase in mutations in broods wasfound, whereas the positive control was active (Woodruff et al., 1985).
244 PHENOL AND PHENOL DERIVATIVES (addendum)

o-Cresol (No. 691) was tested for mutagenicity in the sex-linked recessivelethal assay in adult D. melanogaster. The test substance was fed to males for 3days at 100, 500 and 1000 μg/ml in water before mating. The high doseapproximated an LD50. No increase in mutations in broods was found, whereas thepositive control was active (Sernau, 1989).
(d) Reproductive toxicology
Phenol (No. 690) was studied in a standard two-generation reproductivetoxicity study. Groups of 30 male and 30 female Sprague-Dawley rats wereadministered phenol (100% pure) in the drinking-water at target doses of 0 (control),20, 100 and 500 mg/kg bw per day beginning 10 weeks prior to mating andcontinuing uninterrupted for two generations (P1 and P2). The average daily intakewas calculated to be 0, 14.7, 70.9 and 301.0 mg/kg bw per day for parental (P1)males and 0, 20.0, 93.0 and 320.5 mg/kg bw per day for females for control, low,middle and high dose groups, respectively. Significant reductions in waterconsumption (probably due to taste aversion) and, to a lesser extent, foodconsumption were observed in the 500 mg/kg bw per day group across bothgenerations, with concomitant reductions in body weight and body weight gain.Mating performance and fertility in both generations were similar in dosed groupscompared with control animals. Vaginal cytology/cyclicity and male reproductivefunctions (sperm counts, motility and morphology) were unaffected by dosing or theeffects were not biologically significant, and no adverse dosing-related findings wereobserved microscopically in the testes, ovaries, uterus, prostate or any other tissuesexamined in either generation. Litter survival and offspring body weight werelowered in the 500 mg/kg bw per day group across both generations. The NOEL forreproductive toxicity of phenol in drinking-water was determined to be 70.9 and 93.0mg/kg bw per day for males and females, respectively, based on decreased pupsurvival (probably due to taste aversion) at the highest administered dose, 320.5mg/kg bw per day (Ryan et al., 2000, 2001).
Phenol (No. 690) was tested for developmental toxicity in rats. Phenol (90%United States Pharmacopeia [USP]) was administered to 25 presumed pregnantfemale Sprague-Dawley rats at doses of 0, 20, 40 and 120 mg/kg bw per dose 3times daily by instragastric instillation on days 6 through 15 of gestation for dailydoses of 0, 60, 120 and 360 mg/kg bw. The maternal NOEL is 60 mg/kg bw per daybased on significantly reduced body weights and body weight gains at doses greaterthan or equal to 120 mg/kg bw per day. The NOEL for developmental toxicity is 120mg/kg bw per day based on significantly reduced fetal body weights and reducedaverage number of ossification sites for the metatarsals in the high dose group(York, 1997).
o-Cresol (No. 691), m-cresol (No. 692) or p-cresol (No. 693) was tested fordevelopmental toxicity in rabbits. Groups of 28 control and 14 treated timed-pregnant primiparous New Zealand White rabbits were administered 0, 5, 50 or 100mg o-cresol (99.7% pure), m-cresol (99.4% pure) or p-cresol (98.93% pure) perkilogram body weight in corn oil by gastric instillation on gestation days 6–18. Thepregnant animals were observed twice daily for clinical signs of toxicity, and all wereweighed on gestation days 0, 6, 12, 18, 24 and 29. All does were killed on day 29
PHENOL AND PHENOL DERIVATIVES (addendum) 245

of gestation, and liver and uterine contents were weighed and/or examined. All livefetuses were removed from the uterus, counted, weighed, sexed and examined forexternal malformations and variations. The heads of approximately one half of thefetuses were preserved and prepared for assessment of soft tissue craniofacialmalformations, and all of the fetuses were preserved and prepared for skeletalexaminations. Oral administration of o-cresol, m-cresol or p-cresol during organo-genesis resulted in maternal toxicity at 50 and 100 mg/kg bw per day for all threecompounds. No embryotoxicity or teratogenicity was observed at any of the doselevels employed for the three cresol isomers. Slight fetotoxicity was reported at100 mg/kg bw per day for o-cresol only. The NOEL for maternal toxicity was 5 mg/kg bw per day for all three cresol isomers, and the NOEL for developmental toxicitywas 50 mg/kg bw per day for o-cresol and 100 mg/kg bw per day for m-cresol andp-cresol (Tyl, 1988b).
o-Cresol (No. 691) was tested in a standard two-generation reproductivetoxicity assay in rats. Groups of 25 male and 25 female Sprague-Dawley rats wereadministered test substance (97% pure) by intragastric instillation in corn oil atdoses of 0 (control), 30, 175 and 450 mg/kg bw per day, 5 days/week, beginning 10weeks prior to mating and continuing uninterrupted for two generations (P1 andP2). Dosing of o-cresol at 450 mg/kg bw per day resulted in significant parentalmortality or other signs of toxicity in the P1 and P2 generations. The observed clinicalsigns of toxicity in F1 males and females (i.e. P2 generation) at 175 mg/kg bw perday resulted in a NOEL for o-cresol of 30 mg/kg bw per day for the parental animals.F1 male offspring dosed at 450 mg/kg bw per day exhibited reduced body weightsprior to initiation of their premating treatment; therefore, for offspring, the NOEL foro-cresol was determined to be 175 mg/kg bw per day. There were no dosing-relatedreproductive effects observed in this study (Tyl & Neeper-Bradley, 1989a).
m-Cresol (No. 692) was tested in a standard two-generation reproductivetoxicity assay in rats. Test substance (99.4% pure) was administered by intragastricinstillation in corn oil to 25 male and 25 female Sprague-Dawley rats at target dosesof 0 (control), 30, 175 and 450 mg/kg bw per day, 5 days/week, beginning 10 weeksprior to mating and continuing uninterrupted for two generations (P1 and P2). Dosingof m-cresol at 450 mg/kg bw per day resulted in significant parental mortality or othersigns of toxicity in the P1 and P2 generations. Indications of concomitant perinataltoxicity were observed in F1 and F2 pups at 450 mg/kg bw per day. F1 parental malesat approximately 4–6 weeks of age exhibited reduced body weights at all doselevels, as did females at 30 and 450 mg/kg bw per day. Because of the consistentlyreduced body weights of F1 males and females (i.e. P2 generation) at all dose levels,a NOEL could not be determined. For offspring, the NOEL for m-cresol wasdetermined to be 175 mg/kg bw per day. There were no dosing-related reproductiveeffects observed in this study (Tyl & Neeper-Bradley, 1989b).
p-Cresol (No. 693) was tested for reproductive toxicity in a standard two-generation assay in rats. p-Cresol (98.9% pure) was administered by intragastricinstillation in corn oil to 25 male and 25 female Sprague-Dawley rats at target dosesof 0 (control), 30, 175 and 450 mg/kg bw per day, 5 days/week, beginning 10 weeksprior to mating and continuing uninterrupted for two generations (F1 and F2).Administration of p-cresol at 450 mg/kg bw per day resulted in significant parental
246 PHENOL AND PHENOL DERIVATIVES (addendum)

mortality or other signs of toxicity in the F1 and F2 generations. F2 pups exhibitedoccasionally reduced body weight gains at 450 mg/kg bw per day. The observedclinical signs of toxicity in F0 and F1 males and F1 females (i.e. F2 generation) at 175mg/kg bw per day resulted in a NOEL for p-cresol of 30 mg/kg bw per day for theparental animals. For offspring, the NOEL for p-cresol was determined to be 175mg/kg bw per day. There were no treatment-related reproductive effects observedin this study (Tyl & Neeper-Bradley, 1989c).
o-Cresol (No. 691), m-cresol (No. 692) or p-cresol (No. 693) was tested fordevelopmental toxicity in rats. Groups of 50 control and 25 treated timed-pregnantprimiparous Sprague-Dawley rats were administered 0, 30, 175 or 450 mg o-cresol(99.7% pure), m-cresol (99.4% pure) or p-cresol (98.93% pure) per kilogram bodyweight by intragastric instillation in corn oil on gestation days 6–15. The pregnantanimals were observed twice daily for clinical signs of toxicity, and all were weighedon gestation days 0, 6, 11, 15 and 21. All dams were killed on day 21 of gestation,and liver and uterine contents were weighed and/or examined. All live fetuses wereremoved from the uterus, counted, weighed, sexed and examined for externalmalformations and variations. Approximately one half of the fetuses were preservedand prepared for visceral examinations, and the remaining fetuses were preservedand prepared for skeletal examinations. Oral administration of o-cresol, m-cresol orp-cresol during organogenesis resulted in maternal toxicity at 450 mg/kg bw per dayfor all three compounds. No embryotoxicity or teratogenicity was observed at anyof the dose levels employed for the three cresol isomers. Slight toxicity was reportedat 450 mg/kg bw per day for o-cresol and p-cresol. The NOEL for maternal toxicitywas 175 mg/kg bw per day for all three cresol isomers, and the NOEL fordevelopmental toxicity was 175 mg/kg bw per day for o-cresol and p-cresol and 450mg/kg bw per day for m-cresol (Tyl, 1988a).
A mixture of m- and p-cresol isomers (58.7% and 41.3%, respectively) wastested for reproductive toxicity in mice using the Fertility Assessment by ContinuousBreeding protocol (Heindel et al., 1997), which consisted of four related tasks, asfollows:
• Task 1: Dose range–finding phase
• Task 2: Continuous breeding phase
• Task 3: Crossover mating trial• Task 4: Offspring reproductive performance phase.
After the dose range–finding phase, the m-cresol/p-cresol mixture (purity notgiven) was administered in the diet to three groups of 20 male and 20 female miceat concentrations of 0%, 0.25%, 1.0% and 1.5% in feed (calculated to be 0, 370,1500 and 2100 mg/kg bw per day for 18 weeks during the continuous breedingphase). A small number of deaths occurred in all groups, but not in a dose-relatedmanner. There was no effect on the mean number of litters per mating pair at thelow and middle doses, whereas in the high dose group, the number of live pups perlitter was reduced by approximately 20%, and the cumulative days to deliver eachlitter was increased by 1–4 days. Although pup viability was unaffected by exposureto m-cresol/p-cresol in the diet, pup body weights were significantly lower than those
PHENOL AND PHENOL DERIVATIVES (addendum) 247

of controls after postnatal day 7 in the middle and high dose groups, and by postnatalday 21, these mean pup body weights were reduced 28% and 23%, respectively.
In Task 3, animals from the control and high dose groups were tested in acrossover mating trial to determine whether males, females or both sexes hadcompromised reproductive performance when mated with control animals. Theresults indicated that there were no changes in any fertility or reproductive end-point,except that body weight for the pups from either treated males or treated femaleswas reduced by 6–8%; however, pup number and viability were unaffected.
In Task 4, the reproductive performance of the offspring from litters of alldose groups exposed to m-cresol/p-cresol via lactation and diet and control groupswas evaluated. No significant differences were seen for mating index, fertilityindices, litter size, proportion of pups born alive or sex ratio. The only adverse effectobserved was a 13% reduction in adjusted pup weight in the high dose group. Inthe F1 adults, there were reductions in the weights of the reproductive organs atnecropsy at the middle and high dose levels. However, in these animals, changesin pup growth and weights of somatic organs occurred at all dose levels (Heindel etal., 1997).
3. REFERENCES
Adams TB et al. (2008). The FEMA GRAS assessment of , -unsaturated aldehydes andrelated substances used as flavor ingredients. Food and Chemical Toxicology, 46(9):2935–2967.
August M (2006). Mutagenicity study of phloretin kaden in the Salmonella typhimurium reversemutation assay (in vitro). Report No. 18432/32/04. LPT Laboratory of Pharmacology andToxicology GmbH & Co. KG, Hamburg, Germany. Unpublished report to the Flavor andExtract Manufacturers Association, Washington, DC, USA. Submitted to WHO by theInternational Organization of the Flavor Industry, Brussels, Belgium.
August M (2007). Mutagenicity study of Chavicol- -O-D-glucoside in the Salmonellatyphimurium reverse mutation assay (in vitro). Report No. 18432/17/04. LPT Laboratory ofPharmacology and Toxicology GmbH & Co. KG, Hamburg, Germany. Unpublished reportto the Flavor and Extract Manufacturers Association, Washington, DC, USA. Submitted toWHO by the International Organization of the Flavor Industry, Brussels, Belgium.
Beyrouty P (1998). A thirteen week neurotoxicity study of phenol administered in the drinkingwater to the rat. Chemical Manufacturers Association. EPA Document No. 409900000001;Microfiche No. OTS0559602. Unpublished report to the Flavor and Extract ManufacturersAssociation, Washington, DC, USA. Submitted to WHO by the International Organizationof the Flavor Industry, Brussels, Belgium.
Cifone MA (1988). Mutagenicity test on meta-cresol in a rat primary hepatocyte unscheduledDNA synthesis assay. Obtained through Chemical Manufacturers Association with coverletter dated 07/06/88. EPA Document No. 40-8860250; Microfiche No. OTS0517692.Unpublished report to the Flavor and Extract Manufacturers Association, Washington, DC,USA. Submitted to WHO by the International Organization of the Flavor Industry, Brussels,Belgium.
Ciranni R et al. (1988a). Benzene and the genotoxicity of its metabolites. I. Transplacentalactivity in mouse foetuses and in their dams. Mutation Research, 208(1):61–67.
Ciranni R et al. (1988b). Benzene and the genotoxicity of its metabolites. II. The effect of theroute of administration on the micronuclei and bone marrow depression in mouse bonemarrow cells. Mutation Research, 209:23–28.
248 PHENOL AND PHENOL DERIVATIVES (addendum)

Clayson DB et al. (1990). The significance of induced forestomach tumors. Annual Review ofPharmacology and Toxicology, 30:441–463.
Cramer GM, Ford RA, Hall RL (1978). Estimation of toxic hazard—a decision tree approach.Food and Cosmetics Toxicology, 16:255–276.
Crowley JP, Margard W (1978). Determination of mutagenic/carcinogenic and cytotoxicpotential of four chemical compounds. Sherwin Williams Co. EPA Document No.40-7860090; Microfiche No. OTS0517540. Unpublished report to the Flavor and ExtractManufacturers Association, Washington, DC, USA. Submitted to WHO by the InternationalOrganization of the Flavor Industry, Brussels, Belgium.
Daugherty JP, Franks H (1986). Effect of monocyclic derivatives on DNA repair in humanlymphocytes. Research Communications in Chemical Pathology and Pharmacology,54(1):133–136.
Epler JL, Rao TK, Guerin MR (1979). Evaluation of feasibility of mutagenic testing of shale oilproducts and effluents. Environmental Health Perspectives, 30:179–184.
Erexson GL, Wilmer JL, Kligerman AD (1985). Sister chromatid exchange induction in humanlymphocytes exposed to benzene and its metabolites in vitro. Cancer Research, 45(6):2471–2477.
European Flavour and Fragrance Association (2004). European inquiry on volume of use.Unpublished report. Submitted to WHO by the International Organization of the FlavorIndustry, Brussels, Belgium.
Florin I et al. (1980). Screening of tobacco smoke constituents for mutagenicity using theAmes’ test. Toxicology, 18:219–232.
Galloway SM, Brusick DJ (1980). Mutagenicity evaluation of sample containing 33 1/3% eachortho-, meta-, and para-cresol in sister chromatid exchange assay with Chinese hamsterovary (CHO) cells. Cresol Task Force. EPA Document No. FYI-OTS-0780-0079;Microfiche No. OTS0000079-0. Unpublished report to the Flavor and ExtractManufacturers Association, Washington, DC, USA. Submitted to WHO by the InternationalOrganization of the Flavor Industry, Brussels, Belgium.
Galloway SM, Brusick DJ (1981). Sister chromatid exchange assay, Ames assay, mouselymphoma forward mutation assay, and cell transformation on o-cresol. Pepper, Hamilton& Scheetz. EPA Document No. 40-8160079; Microfiche No. OTS0517531. Unpublishedreport to the Flavor and Extract Manufacturers Association, Washington, DC, USA.Submitted to WHO by the International Organization of the Flavor Industry, Brussels,Belgium.
Gavin CL, Williams MC, Hallagan JB (2008). 2005 poundage and technical effects updatesurvey. Washington, DC, USA, Flavor and Extract Manufacturers Association.
General Electric (2002). General Electric Company – Plastics: Response to comments on thetest plan for 2,4,6-trimethylphenol (CAS RN 527-60-6). Communication with the UnitedStates Environmental Protection Agency. Unpublished report to the Flavor and ExtractManufacturers Association, Washington, DC, USA. Submitted to WHO by the InternationalOrganization of the Flavor Industry, Brussels, Belgium.
Glatt H et al. (1989). Multiple activation pathways of benzene leading to products with varyinggenotoxic characteristics. Environmental Health Perspectives, 82:81–89.
Grice HC (1988). Safety evaluation of butylated hydroxyanisole from the perspective of effectson forestomach and oesophageal squamous epithelium. Food and Chemical Toxicology,26:717–723.
Gudi R, Brown C (2002). In vitro mammalian chromosome aberration test. Unpublished reportNo. AA52LV.331.BTL. Submitted to General Electric Company, Pittsfield, MA, USA, byBioReliance Corporation, Rockville, MD, USA [cited in General Electric, 2002]. Submittedto WHO by the International Organization of the Flavor Industry, Brussels, Belgium.
Gudi R, Krsmanovic L (2002). Mammalian erythrocyte micronucleus test; 2,4,6-trimethylphenol (TMP; CAS RN 527-60-6). Unpublished report No. AA52LV.123.BTL.
PHENOL AND PHENOL DERIVATIVES (addendum) 249

Submitted to General Electric Company, Pittsfield, MA, USA, by BioReliance Corporation,Rockville, MD, USA [cited in General Electric, 2002]. Submitted to WHO by theInternational Organization of the Flavor Industry, Brussels, Belgium.
Heindel J et al. (1997). Reproductive toxicology, m-/p-cresol. Environmental HealthPerspectives,105(1):295–296.
Hiser MF et al. (1993). Pharmacokinetics of phenol in rats after gavage, drinking water, andinhalation exposures. Toxicologist, 1391:174 (abstract).
Hoffman GM (2004). A 90-day dietary toxicity study of 4-(p-hydroxyphenyl)-2-butanone(raspberry ketone) in rats. Unpublished report to the Research Institute of FragranceMaterials, Woodcliff Lake, NJ, USA. Submitted to WHO by the International Organizationof the Flavor Industry, Brussels, Belgium.
Hughes MF, Hall LL (1997). In vivo disposition of p-substituted phenols in the young rat afterintraperitoneal and dermal administration. Food and Chemical Toxicology, 35:697–704.
IARC (2003). Predictive value of rodent forestomach and gastric neuroendocrine tumours inevaluating carcinogenic risks to humans. Lyon, International Agency for Research onCancer (IARC Technical Publication No. 39).
International Organization of the Flavor Industry (2009). Interim inquiry on volume of use andadded use levels for flavoring agents to be presented at the JECFA 73rd meeting.Submitted to WHO by the International Organization of the Flavor Industry, Brussels,Belgium.
Jagannath DR, Brusick DJ (1981). Mutagenicity evaluation of N50C-81-3 in the AmesSalmonella/microsome plate test. LBI Project No. 20988. Litton Bionetics, Fort Detrick, MD,USA. Submitted to WHO by the International Organization of the Flavor Industry, Brussels,Belgium.
Japan Flavor and Fragrance Materials Association (2005). Japanese inquiry on volume use.Unpublished report. Submitted to WHO by the International Organization of the FlavorIndustry, Brussels, Belgium.
Kim OH et al. (1998). [Cytotoxicological and pathological studies of 6-paradol, a pungentprinciple (sic) in ginger.] Environmental Mutagens and Carcinogens, 18(1):32–36 (inKorean).
Koizumi M et al. (2003). Higher susceptibility of newborn than young rats to 3-methylphenol.Journal of Toxicological Sciences, 28(2):59–70.
Kubo T, Urano K, Utsumi H (2002). Mutagenicity characteristics of 255 environmentalchemicals. Journal of Health Science, 48(6):545–554.
Kusakabe H et al. (2002). Relevance of chemical structure and cytotoxicity to the induction ofchromosome aberrations based on the testing results of 98 high production volumeindustrial chemicals. Mutation Research, 517(1–2):187–198.
Lee SS et al. (1991). Neurotoxicity and long lasting analgesia induced by capsaicinoids.Journal of Toxicological Sciences, 16(Suppl. 1):3–20.
Lesaffer G et al. (2001). Kinetics of the protein-bound, lipophilic, uremic toxin p-cresol inhealthy rats. Life Sciences, 69(19):2237–2248.
Li N et al. (2007). Evaluation of the in vitro and in vivo genotoxicity of magnolia bark extract.Regulatory Toxicology and Pharmacology, 49(3):154–159.
Lina BAR, Dreef-vanderMeulen HC, Leegwater DC (1990). Subchronic (13-week) oral toxicityof neohesperidin dihydrochalcone in rats. Food and Chemical Toxicology, 28(7):507–513.
Liu Z et al. (2007). Evaluation of short-term and subchronic toxicity of magnolia bark extractin rats. Regulatory Toxicology and Pharmacology, 49(3):160–171.
Merkel D (2003). Acute oral toxicity up and down procedure in rats with 4-(p-hydroxyphenyl)-2-butanone. Unpublished report to the Research Institute of Fragrance Materials, WoodcliffLake, NJ, USA. Submitted to WHO by the International Organization of the Flavor Industry,Brussels, Belgium.
250 PHENOL AND PHENOL DERIVATIVES (addendum)

Miller BM, Pujadas E, Gocke E (1995). Evaluation of the micronucleus test in vitro usingChinese hamster cells: results of four chemicals weakly positive in the in vivo micronucleustest. Environmental and Molecular Mutagenesis, 26(3):240–247.
Myhr BC, Brusick DJ (1980). Evaluation of ortho-, meta-, and para-cresol 33 1/3% each inprimary rat hepatocyte unscheduled DNA synthesis assay. Cresol Task Force. EPADocument No. FYI-OTS-0980-0079; Microfiche No. OTS0000079-0. Unpublished reportto the Research Institute of Fragrance Materials, Woodcliff Lake, NJ, USA. Submitted toWHO by the International Organization of the Flavor Industry, Brussels, Belgium.
Nijssen LM, van Ingen-Visscher CA, Donders JJM, eds (2009). VCF (Volatile Compounds inFood) database. Version 11.1.1. Zeist, Netherlands, TNO Quality of Life (http://www.vcf-online.nl/VcfHome.cfm).
NTP (1983). Carcinogenesis studies of eugenol in F344/N rats and B6C3F1 mice (feedstudies). Research Triangle Park, NC, USA, Department of Health and Human Services,National Institutes of Health, National Toxicology Program (NTP-TR-223).
NTP (2008). Toxicology and carcinogenesis studies of cresols (CAS No. 1319-77-3) in maleF344/N rats and female B6C3F1 mice (feed studies). Research Triangle Park, NC, USA,Department of Health and Human Services, National Institutes of Health, NationalToxicology Program (NTP-TR-550; NIH Publication No. 08-5891).
Pellack-Walker P, Blumer JL (1986). DNA damage in L5178YS cells following exposure tobenzene metabolites. Molecular Pharmacology, 30(1):42–47.
Pepper, Hamilton & Scheetz (1980). Evaluation of R-1044 in the E. coli DNA repair-suspensionassay. Prepared for Tenneco Chemicals, Inc. EPA Document No. 40-8360166; MicroficheNo. OTS0507480. Unpublished report to the Research Institute of Fragrance Materials,Woodcliff Lake, NJ, USA. Submitted to WHO by the International Organization of the FlavorIndustry, Brussels, Belgium.
Ryan BM et al. (2000). Two-generation oral (drinking water) reproductive toxicity study ofphenol in rats. Toxicologist, 54(1):367 (abstract).
Ryan BM et al. (2001). Two-generation reproduction study and immunotoxicity screen inrats dosed with phenol via the drinking water. International Journal of Toxicology, 20(3):121–142.
Scheerbaum D (2001). Acute toxicity study of 2-methoxy-4-methylphenol by oraladministration to Sprague-Dawley rats. Unpublished report to the Flavor and ExtractManufacturers Association, Washington, DC, USA. Submitted to WHO by the InternationalOrganization of the Flavor Industry, Brussels, Belgium.
Sernau D (1989). Mutagenicity tests on ortho- and para-cresol: Drosophila melanogaster sex-linked recessive lethal test. Chemical Manufacturers Association. EPA Document No.40-8960320; Microfiche No. OTS0529221. Unpublished report to the Research Institute ofFragrance Materials, Woodcliff Lake, NJ, USA. Submitted to WHO by the InternationalOrganization of the Flavor Industry, Brussels, Belgium.
Stien J (2005). Mutagenicity study of hesperetin in the Salmonella typhimurium reversemutation assay (in vitro). Report No. 18432/12/04. LPT Laboratory of Pharmacology andToxicology GmbH & Co. KG, Hamburg, Germany. Unpublished report to the Flavor andExtract Manufacturers Association, Washington, DC, USA. Submitted to WHO by theInternational Organization of the Flavor Industry, Brussels, Belgium.
Takahashi M et al. (2006). Susceptibility of newborn rats to 3-ethylphenol and 4-ethylphenolcompared with that of young rats. Congenital Anomalies (Kyoto), 46(1):26–33.
Thompson DC, Perera K, London R (1995). Quinone methide formation from para isomers ofmethylphenol (cresol), ethylphenol, and isopropylphenol: relationship to toxicity. ChemicalResearch in Toxicology, 8(1):55–60.
Thompson DC, Perera K, London R (1996). Studies on the mechanism of hepatotoxicity of 4-methylphenol (p-cresol): effects of deuterium labeling and ring substitution. Chemico-Biological Interactions, 101:1–11.
PHENOL AND PHENOL DERIVATIVES (addendum) 251

Thompson DC et al. (1994). Cresol isomers: comparison of toxic potency in rat liver slices.Toxicology and Applied Pharmacology, 125(1):51–58.
Thompson DC et al. (1995). o-Methoxy-4-alkylphenols that form quinone methides ofintermediate reactivity are the most toxic in rat liver slices. Chemical Research inToxicology, 8(3):323–327.
Tsutsui T et al. (1997). Benzene-, catechol-, hydroquinone- and phenol-induced celltransformation, gene mutations, chromosome aberrations, aneuploidy, sister chromatidexchanges and unscheduled DNA synthesis in Syrian hamster embryo cells. MutationResearch, 373(1):113–123.
Tyl RW (1988a). Initial submission: developmental toxicity evaluation with o-cresol, m-cresol,and p-cresol administered by gavage to Sprague-Dawley rats. Obtained through MilesIMNC with cover letter dated 08/24/92. EPA Document No. 88-920006747; Microfiche No.OTS0545285. Unpublished report to the Research Institute of Fragrance Materials,Woodcliff Lake, NJ, USA. Submitted to WHO by the International Organization of the FlavorIndustry, Brussels, Belgium.
Tyl RW (1988b). Developmental toxicity evaluation of o-, m-, or p-cresol administered bygavage to rabbits and rats. Obtained through Chemical Manufacturers Association withcover letter dated 07/06/88. EPA Document No. 40-8860253; Microfiche No. OTS0517695.Unpublished report to the Research Institute of Fragrance Materials, Woodcliff Lake, NJ,USA. Submitted to WHO by the International Organization of the Flavor Industry, Brussels,Belgium.
Tyl RW, Neeper-Bradley TL (1989a). Two-generation reproduction study on ortho-cresoladministered by gavage to Sprague-Dawley (CD) rats. Final report obtained through UnionCarbide Corporation with attachments and cover letter dated 12/06/89. EPA Document No.40-8960311; Microfiche No. OTS0529224. Unpublished report to the Research Institute ofFragrance Materials, Woodcliff Lake, NJ, USA. Submitted to WHO by the InternationalOrganization of the Flavor Industry, Brussels, Belgium.
Tyl RW, Neeper-Bradley TL (1989b). Two-generation reproduction study on meta-cresoladministered by gavage to Sprague-Dawley (CD) rats. Final report obtained through UnionCarbide Corporation with attachments and cover letter dated 12/06/89. EPA Document No.40-8960311; Microfiche No. OTS0529224. Unpublished report to the Research Institute ofFragrance Materials, Woodcliff Lake, NJ, USA. Submitted to WHO by the InternationalOrganization of the Flavor Industry, Brussels, Belgium.
Tyl RW, Neeper-Bradley TL (1989c). Two-generation reproduction study on para-cresoladministered by gavage to Sprague-Dawley (CD) rats. Final report obtained through UnionCarbide Corporation with attachments and cover letter dated 12/06/89. EPA Document No.40-8960311; Microfiche No. OTS0529224. Unpublished report to the Research Institute ofFragrance Materials, Woodcliff Lake, NJ, USA. Submitted to WHO by the InternationalOrganization of the Flavor Industry, Brussels, Belgium.
USFDA (1993). Priority-based assessment of food additives (PAFA) database. Washington,DC, USA, United States Department of Health and Human Services, Food and DrugAdministration, Center for Food Safety and Applied Nutrition, p. 58.
Vaeth A (2005). Acute oral toxicity study in the rat. Unpublished report to the Flavor and ExtractManufacturers Association, Washington, DC, USA. Submitted to WHO by the InternationalOrganization of the Flavor Industry, Brussels, Belgium.
Vaeth A (2006). Acute oral toxicity study in the rat. Unpublished report to the Flavor and ExtractManufacturers Association, Washington, DC, USA. Submitted to WHO by the InternationalOrganization of the Flavor Industry, Brussels, Belgium.
Welsch F, Nemec MD, Lawrence WB (2006). Two-generation reproductive toxicity study ofresorcinol in rats. Toxicologist, 90(1):254 (abstract).
Wester PW, Kroes R (1988). Forestomach carcinogens: pathology and relevance to man.Toxicologic Pathology, 16:165–171.
252 PHENOL AND PHENOL DERIVATIVES (addendum)

Woodruff RC et al. (1985). Chemical mutagenesis testing in Drosophila. V. Results of 53 codedcompounds tested for the National Toxicology Program. Environmental Mutagenesis,7:677–702.
York RG (1997). Oral (gavage) developmental toxicity study of phenol in rats. Procter &Gamble Co. EPA Document No. 8697000023; Microfiche No. OTS0573686. Unpublishedreport to the Research Institute of Fragrance Materials, Woodcliff Lake, NJ, USA.Submitted to WHO by the International Organization of the Flavor Industry, Brussels,Belgium.
Zhang B et al. (2008). Evaluation of magnolia bark extract in chromosomal aberration assays.Unpublished report to the Flavor and Extract Manufacturers Association, Washington, DC,USA. Submitted to WHO by the International Organization of the Flavor Industry, Brussels,Belgium.
PHENOL AND PHENOL DERIVATIVES (addendum) 253


SIMPLE ALIPHATIC AND AROMATIC SULFIDES AND THIOLS (addendum)
First draft prepared by
Dr S.M.F. Jeurissen,1 Dr M. DiNovi,2 Dr A. Mattia2 andProfessor A.G. Renwick3
1 Centre for Substances and Integrated Risk Assessment, National Institutefor Public Health and the Environment, Bilthoven, Netherlands
2 Center for Food Safety and Applied Nutrition, Food and Drug Administration,College Park, Maryland, United States of America (USA)
3 School of Medicine, University of Southampton, Southampton, England
1. Evaluation...............................................................................1.1 Introduction.......................................................................1.2 Assessment of dietary exposure......................................1.3 Absorption, distribution, metabolism and elimination.......1.4 Application of the Procedure for the Safety Evaluation of
Flavouring Agents............................................................1.5 Consideration of combined intakes from use as flavouring
agents...............................................................................1.6 Consideration of secondary components.........................1.7 Conclusion........................................................................
2. Relevant background information...........................................2.1 Explanation.......................................................................2.2 Additional considerations on intake..................................2.3 Biological data..................................................................
2.3.1 Biochemical data: absorption, distribution,metabolism and elimination.....................................
2.3.2 Toxicological studies...............................................3. References.............................................................................
1. EVALUATION
1.1 Introduction
The Committee evaluated 36 additional flavouring agents belonging to thegroup of simple aliphatic and aromatic sulfides and thiols that was evaluatedpreviously. This group included 4 simple sulfides (Nos 1909–1911 and 1939),13 acyclic sulfides with oxidized side-chains (Nos 1912, 1913, 1915–1922 and1940–1942), 3 cyclic sulfides (Nos 1923, 1943 and 1944), 1 simple thiol (No. 1924),8 thiols with oxidized side-chains (Nos 1914, 1925–1929, 1936 and 1938), 5 simpledisulfides (Nos 1930–1933 and 1935), 1 trisulfide (No. 1934) and 1 thioester(No. 1937). The evaluations were conducted according to the Procedure for theSafety Evaluation of Flavouring Agents (Figure 1, Introduction) (Annex 1, reference131). None of these flavouring agents has previously been evaluated by theCommittee.
255255256287
287
291293293294294294294
294294301
- 255 -

The Committee previously evaluated 137 other members of this group offlavouring agents at its fifty-third meeting (Annex 1, reference 143). The group wasdivided into 12 subgroups on the basis of the position of the sulfur atom, in order tofacilitate the assessment of the relevant data on metabolism and toxicity. TheCommittee concluded that all 137 flavouring agents in that group were of no safetyconcern at estimated dietary exposures.
The Committee also evaluated 12 additional members of this group offlavouring agents at its sixty-first meeting (Annex 1, reference 166). The Committeeconcluded that all 12 additional flavouring agents in that group were of no safetyconcern at estimated dietary exposures.
The Committee evaluated another 51 additional members of this group offlavouring agents at its sixty-eighth meeting (Annex 1, reference 187). TheCommittee concluded that all 51 additional flavouring agents in that group were ofno safety concern at estimated dietary exposures.
Ten of the 36 flavouring agents evaluated at the current meeting are naturalcomponents of foods (Nos 1909, 1910, 1913, 1915, 1916, 1918, 1923, 1932, 1933and 1937) and have been detected in beef, fish oil, onion, shallot, potato chips,cabbage, peanut, apple, pineapple, melon, yellow passion fruit, coffee and beer(Nijssen, van Ingen-Visscher & Donders, 2008).
1.2 Assessment of dietary exposure
The total annual volumes of production of the 36 flavouring agents in thisgroup are approximately 0.3 kg in Europe (European Flavour and FragranceAssociation, 2004), 2 kg in the USA (Gavin, Williams & Hallagan, 2008) and 19 kgin Japan (Japan Flavor and Fragrance Materials Association, 2005). In Europe, onlymethyl 1-propenyl sulfide (No. 1910), 2-(methylthio)ethyl acetate (No. 1913) and3-mercaptohexanal (No. 1929) are produced (each accounts for one third of thetotal annual volume of production). Only four are produced in the USA, with (±)-ethyl3-mercapto-2-methylbutanoate (No. 1928) and 3-(methylthio)propyl hexanoate(No. 1941) accounting for the largest part of the total annual volume of production(42% each). All but five of these flavouring agents are produced in Japan, withmethyl octyl sulfide (No. 1909) and 2-ethylhexyl 3-mercaptopropionate (No. 1938)making the largest contribution to the total annual volume of production (32% each).
The estimated dietary exposures for each of the flavouring agents,calculated either as the maximized survey-derived intake (MSDI) or using the singleportion exposure technique (SPET), are reported in Table 1. The estimated dailydietary exposure is the highest for 3-(methylthio)propyl hexanoate (No. 1941)(1500 μg, the SPET value obtained for composite foods). For the other flavouringagents, the estimated daily per capita dietary exposures varied from 0.1 from400 μg. For all of these flavouring agents except (±)-ethyl 3-mercapto-2-methylbutanoate (No. 1928) and 3-mercaptopropionic acid (No. 1936), the SPETgave the highest estimate. Annual volumes of production of this group of flavouringagents and the calculated daily dietary exposures (MSDI and SPET) aresummarized in Table 2.
256 SIMPLE ALIPHATIC AND AROMATIC SULFIDES AND THIOLS (addendum)

Tabl
e 1.
Sum
mar
y of
the
resu
lts o
f the
safe
ty e
valu
atio
ns o
f sim
ple
alip
hatic
and
arom
atic
sulfi
des
and
thio
ls u
sed
asfla
vour
ing
agen
tsa,
b,c
Fla
vour
ing
agen
tN
o.C
AS
No.
and
str
uctu
reS
tep
B3d
Doe
s in
take
exce
ed th
eth
resh
old
for
hum
an in
take
?
Ste
p B
4e
Ade
quat
e m
argi
n of
saf
ety
for
the
flavo
urin
g ag
ent o
r re
late
dsu
bsta
nces
? / A
re a
dditi
onal
dat
aav
aila
ble
for
subs
tanc
es w
ith a
nes
timat
ed in
take
exc
eedi
ng th
eth
resh
old
of c
once
rn?
Ste
p B
5D
oes
inta
keex
ceed
1.5
μg/
day?
Com
men
ts o
npr
edic
ted
met
abol
ism
Con
clus
ion
base
d on
curr
ent d
ieta
ryex
posu
re
Su
bg
rou
p i:
Sim
ple
sulf
ides
Str
uctu
ral
clas
s I
Met
hyl o
ctyl
sulfi
de19
0936
98-9
5-1
S
No,
SP
ET
: 400
B4.
Yes
. The
NO
EL
of 2
50 m
g/kg
bw
per
day
for
the
rela
ted
subs
tanc
em
ethy
l sul
fide
(No.
452
) (B
utte
rwor
thet
al.,
197
5) is
at l
east
37
500
times
the
estim
ated
dai
ly d
ieta
ry e
xpos
ure
to N
o. 1
909
whe
n us
ed a
s a
flavo
urin
g ag
ent.
NR
Not
e 1
No
safe
tyco
ncer
n
Met
hyl 1
-pr
open
ylsu
lfide
1910
0152
-77-
9
S
No,
SP
ET
: 2B
4. Y
es. T
he N
OE
L of
250
mg/
kg b
wpe
r da
y fo
r th
e re
late
d su
bsta
nce
met
hyl s
ulfid
e (N
o. 4
52)
(But
terw
orth
et a
l., 1
975)
is a
t lea
st 7
500
000
times
the
estim
ated
dai
ly d
ieta
ryex
posu
re to
No.
191
0 w
hen
used
as
a fla
vour
ing
agen
t.
NR
Not
e 1
No
safe
tyco
ncer
n
SIMPLE ALIPHATIC AND AROMATIC SULFIDES AND THIOLS (addendum) 257

Tabl
e 1
(co
ntd)
Fla
vour
ing
agen
tN
o.C
AS
No.
and
str
uctu
reS
tep
B3d
Doe
s in
take
exce
ed th
eth
resh
old
for
hum
anin
take
?
Ste
p B
4e
Ade
quat
e m
argi
n of
saf
ety
for
the
flavo
urin
g ag
ent o
r re
late
dsu
bsta
nces
? / A
re a
dditi
onal
dat
aav
aila
ble
for
subs
tanc
es w
ith a
nes
timat
ed in
take
exc
eedi
ng th
eth
resh
old
of c
once
rn?
Ste
p B
5D
oes
inta
keex
ceed
1.5
μg/d
ay?
Com
men
ts o
npr
edic
ted
met
abol
ism
Con
clus
ion
base
d on
curr
ent d
ieta
ryex
posu
re
Di-(
1-pr
open
yl)-
sulfi
de(m
ixtu
re o
fis
omer
s)
1911
6581
9-74
-1;3
7981
-37-
6;37
981-
36-5
S
S
S
No,
SP
ET
:80
B4.
Yes
. The
NO
EL
of 2
50 m
g/kg
bw
per
day
for
the
rela
ted
subs
tanc
em
ethy
l sul
fide
(No.
452
) (B
utte
rwor
thet
al.,
197
5) is
at l
east
187
500
tim
esth
e es
timat
ed d
aily
die
tary
exp
osur
eto
No.
191
1 w
hen
used
as
afla
vour
ing
agen
t.
NR
Not
e 1
No
safe
tyco
ncer
n
Str
uctu
ral
clas
s III
But
anal
dibe
nzyl
thio
acet
al
1939
1017
80-7
3-8
S
S
No,
SP
ET
:40
B4.
No.
Yes
.N
ote
1A
dditi
onal
dat
are
quire
d to
com
plet
eev
alua
tion
258 SIMPLE ALIPHATIC AND AROMATIC SULFIDES AND THIOLS (addendum)

Tabl
e 1
(co
ntd)
Fla
vour
ing
agen
tN
o.C
AS
No.
and
stru
ctur
eS
tep
B3d
Doe
s in
take
exce
ed th
eth
resh
old
for
hum
anin
take
?
Ste
p B
4e
Ade
quat
e m
argi
n of
saf
ety
for
the
flavo
urin
g ag
ent o
r re
late
dsu
bsta
nces
? / A
re a
dditi
onal
dat
aav
aila
ble
for
subs
tanc
es w
ith a
nes
timat
ed in
take
exc
eedi
ng th
eth
resh
old
of c
once
rn?
Ste
p B
5D
oes
inta
keex
ceed
1.5
μg/d
ay?
Com
men
ts o
npr
edic
ted
met
abol
ism
Con
clus
ion
base
d on
curr
ent d
ieta
ryex
posu
re
Su
bg
rou
p ii
:A
cycl
ic s
ulf
ides
wit
h o
xid
ized
sid
e-ch
ain
s
Str
uctu
ral c
lass
I
Eth
yl 2
-hy
drox
yeth
ylsu
lfide
1912
110-
77-0 S
OH
No,
SP
ET
: 3B
4. Y
es. T
he N
OE
L of
1.4
mg/
kg b
wpe
r da
y fo
r th
e re
late
d su
bsta
nce
2-(m
ethy
lthio
met
hyl)-
3-ph
enyl
prop
enal
(No.
505
) (C
ox, R
ucci
& B
abis
h, 1
979)
is a
t lea
st 2
8 00
0 tim
es th
e es
timat
edda
ily d
ieta
ry e
xpos
ure
to N
o. 1
912
whe
n us
ed a
s a
flavo
urin
g ag
ent.
NR
Not
es 1
and
2N
o sa
fety
conc
ern
2-(M
ethy
lthio
)-et
hyl a
ceta
te19
1358
62-4
7-5
SO
O
No,
SP
ET
:30
0B
4. Y
es. T
he N
OE
L of
1.4
mg/
kg b
wpe
r da
y fo
r th
e re
late
d su
bsta
nce
2-(m
ethy
lthio
met
hyl)-
3-ph
enyl
prop
enal
(No.
505
) (C
ox, R
ucci
& B
abis
h, 1
979)
is a
t lea
st 2
80 ti
mes
the
estim
ated
dai
lydi
etar
y ex
posu
re to
No.
191
3 w
hen
used
as
a fla
vour
ing
agen
t.
NR
Not
es 1
and
3N
o sa
fety
conc
ern
SIMPLE ALIPHATIC AND AROMATIC SULFIDES AND THIOLS (addendum) 259

Tabl
e 1
(co
ntd)
Fla
vour
ing
agen
tN
o.C
AS
No.
and
stru
ctur
eS
tep
B3d
Doe
s in
take
exce
ed th
eth
resh
old
for
hum
anin
take
?
Ste
p B
4e
Ade
quat
e m
argi
n of
saf
ety
for
the
flavo
urin
g ag
ent o
r re
late
dsu
bsta
nces
? / A
re a
dditi
onal
dat
aav
aila
ble
for
subs
tanc
es w
ith a
nes
timat
ed in
take
exc
eedi
ng th
eth
resh
old
of c
once
rn?
Ste
p B
5D
oes
inta
keex
ceed
1.5
μg/d
ay?
Com
men
ts o
npr
edic
ted
met
abol
ism
Con
clus
ion
base
d on
curr
ent d
ieta
ryex
posu
re
Eth
yl 3
-(m
ethy
lthio
)-(2
Z)-
prop
enoa
te
1915
1361
15-6
6-7 O
OS
No,
SP
ET
:30
0B
4. Y
es. T
he N
OE
L of
1.4
mg/
kg b
wpe
r da
y fo
r th
e re
late
d su
bsta
nce
2-(m
ethy
lthio
met
hyl)-
3-ph
enyl
prop
enal
(No.
505
) (C
ox, R
ucci
& B
abis
h, 1
979)
is a
t lea
st 2
80 ti
mes
the
estim
ated
daily
die
tary
exp
osur
e to
No.
191
5w
hen
used
as
a fla
vour
ing
agen
t.
NR
Not
es 1
and
3N
o sa
fety
conc
ern
Eth
yl 3
-(m
ethy
lthio
)-(2
E)-
prop
enoa
te
1916
1361
15-6
5-6
SO
O
No,
SP
ET
:30
0B
4. Y
es. T
he N
OE
L of
1.4
mg/
kg b
wpe
r da
y fo
r th
e re
late
d su
bsta
nce
2-(m
ethy
lthio
met
hyl)-
3-ph
enyl
prop
enal
(No.
505
) (C
ox, R
ucci
& B
abis
h, 1
979)
is a
t lea
st 2
80 ti
mes
the
estim
ated
daily
die
tary
exp
osur
e to
No.
191
6w
hen
used
as
a fla
vour
ing
agen
t.
NR
Not
es 1
and
3N
o sa
fety
conc
ern
260 SIMPLE ALIPHATIC AND AROMATIC SULFIDES AND THIOLS (addendum)
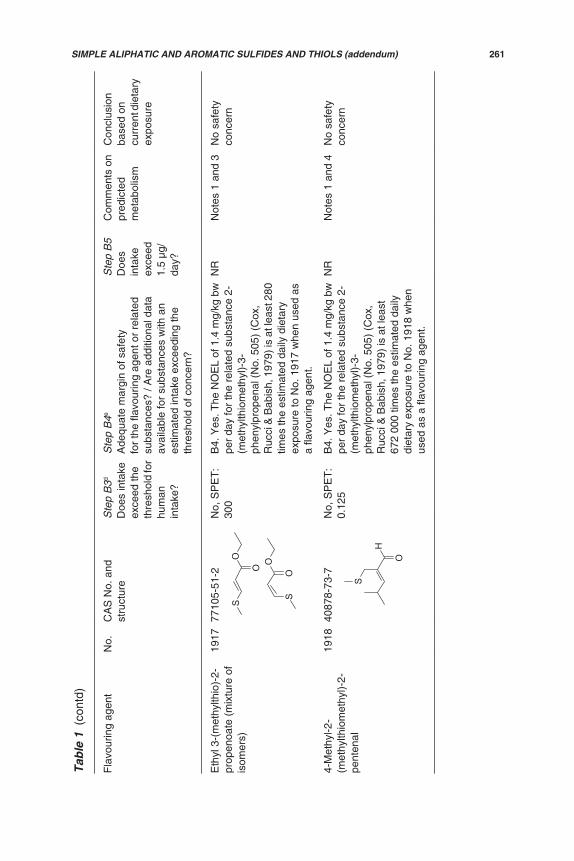
Tabl
e 1
(co
ntd)
Fla
vour
ing
agen
tN
o.C
AS
No.
and
stru
ctur
eS
tep
B3d
Doe
s in
take
exce
ed th
eth
resh
old
for
hum
anin
take
?
Ste
p B
4e
Ade
quat
e m
argi
n of
saf
ety
for
the
flavo
urin
g ag
ent o
r re
late
dsu
bsta
nces
? / A
re a
dditi
onal
dat
aav
aila
ble
for
subs
tanc
es w
ith a
nes
timat
ed in
take
exc
eedi
ng th
eth
resh
old
of c
once
rn?
Ste
p B
5D
oes
inta
keex
ceed
1.5
μg/
day?
Com
men
ts o
npr
edic
ted
met
abol
ism
Con
clus
ion
base
d on
curr
ent d
ieta
ryex
posu
re
Eth
yl 3
-(m
ethy
lthio
)-2-
prop
enoa
te (
mix
ture
of
isom
ers)
1917
7710
5-51
-2
SO
OO
OS
No,
SP
ET
:30
0B
4. Y
es. T
he N
OE
L of
1.4
mg/
kg b
wpe
r da
y fo
r th
e re
late
d su
bsta
nce
2-(m
ethy
lthio
met
hyl)-
3-ph
enyl
prop
enal
(N
o. 5
05)
(Cox
,R
ucci
& B
abis
h, 1
979)
is a
t lea
st 2
80tim
es th
e es
timat
ed d
aily
die
tary
expo
sure
to N
o. 1
917
whe
n us
ed a
sa
flavo
urin
g ag
ent.
NR
Not
es 1
and
3N
o sa
fety
conc
ern
4-M
ethy
l-2-
(met
hylth
iom
ethy
l)-2-
pent
enal
1918
4087
8-73
-7
H
O
S
No,
SP
ET
:0.
125
B4.
Yes
. The
NO
EL
of 1
.4 m
g/kg
bw
per
day
for
the
rela
ted
subs
tanc
e 2-
(met
hylth
iom
ethy
l)-3-
phen
ylpr
open
al (
No.
505
) (C
ox,
Ruc
ci &
Bab
ish,
197
9) is
at l
east
672
000
times
the
estim
ated
dai
lydi
etar
y ex
posu
re to
No.
191
8 w
hen
used
as
a fla
vour
ing
agen
t.
NR
Not
es 1
and
4N
o sa
fety
conc
ern
SIMPLE ALIPHATIC AND AROMATIC SULFIDES AND THIOLS (addendum) 261

Tabl
e 1
(co
ntd)
Fla
vour
ing
agen
tN
o.C
AS
No.
and
stru
ctur
eS
tep
B3d
Doe
s in
take
exce
ed th
eth
resh
old
for
hum
anin
take
?
Ste
p B
4e
Ade
quat
e m
argi
n of
saf
ety
for
the
flavo
urin
g ag
ent o
r re
late
dsu
bsta
nces
? / A
re a
dditi
onal
dat
aav
aila
ble
for
subs
tanc
es w
ith a
nes
timat
ed in
take
exc
eedi
ng th
eth
resh
old
of c
once
rn?
Ste
p B
5D
oes
inta
keex
ceed
1.5
μg/
day?
Com
men
ts o
npr
edic
ted
met
abol
ism
Con
clus
ion
base
d on
curr
ent d
ieta
ryex
posu
re
4-M
ethy
l-2-
(met
hylth
iom
ethy
l)-2-
hexe
nal
1919
9991
0-84
-6
H
SO
No,
SP
ET
:1.
5B
4. Y
es. T
he N
OE
L of
1.4
mg/
kg b
wpe
r da
y fo
r th
e re
late
d su
bsta
nce
2-(m
ethy
lthio
met
hyl)-
3-ph
enyl
prop
enal
(N
o. 5
05)
(Cox
,R
ucci
& B
abis
h, 1
979)
is a
t lea
st56
000
tim
es th
e es
timat
ed d
aily
diet
ary
expo
sure
to N
o. 1
919
whe
nus
ed a
s a
flavo
urin
g ag
ent.
NR
Not
es 1
and
4N
o sa
fety
conc
ern
5-M
ethy
l-2-
(met
hylth
iom
ethy
l)-2-
hexe
nal
1920
8540
7-25
-6
H
SO
No,
SP
ET
: 3B
4. Y
es. T
he N
OE
L of
1.4
mg/
kg b
wpe
r da
y fo
r th
e re
late
d su
bsta
nce
2-(m
ethy
lthio
met
hyl)-
3-ph
enyl
prop
enal
(N
o. 5
05)
(Cox
,R
ucci
& B
abis
h, 1
979)
is a
t lea
st28
000
tim
es th
e es
timat
ed d
aily
diet
ary
expo
sure
to N
o. 1
920
whe
nus
ed a
s a
flavo
urin
g ag
ent.
NR
Not
es 1
and
4N
o sa
fety
conc
ern
262 SIMPLE ALIPHATIC AND AROMATIC SULFIDES AND THIOLS (addendum)

Tabl
e 1
(co
ntd)
Fla
vour
ing
agen
tN
o.C
AS
No.
and
str
uctu
reS
tep
B3d
Doe
s in
take
exce
ed th
eth
resh
old
for
hum
anin
take
?
Ste
p B
4e
Ade
quat
e m
argi
n of
saf
ety
for
the
flavo
urin
g ag
ent o
r re
late
dsu
bsta
nces
? / A
re a
dditi
onal
dat
aav
aila
ble
for
subs
tanc
es w
ith a
nes
timat
ed in
take
exc
eedi
ng th
eth
resh
old
of c
once
rn?
Ste
p B
5D
oes
inta
keex
ceed
1.5
μg/d
ay?
Com
men
ts o
npr
edic
ted
met
abol
ism
Con
clus
ion
base
d on
curr
ent d
ieta
ryex
posu
re
But
yl
-(m
ethy
lthio
)-ac
ryla
te
1921
7710
5-53
-4 OS
O
No,
SP
ET
:0.
3B
4. Y
es. T
he N
OE
L of
1.4
mg/
kg b
wpe
r da
y fo
r th
e re
late
d su
bsta
nce
2-(m
ethy
lthio
met
hyl)-
3-ph
enyl
prop
enal
(No.
505
) (C
ox, R
ucci
& B
abis
h, 1
979)
is a
t lea
st 2
80 0
00 ti
mes
the
estim
ated
daily
die
tary
exp
osur
e to
No.
192
1w
hen
used
as
a fla
vour
ing
agen
t.
NR
Not
es 1
and
3N
o sa
fety
conc
ern
Eth
yl 3
-(e
thyl
thio
)-bu
tyra
te
1922
9020
1-28
-8 OS
O
No,
SP
ET
: 24
B4.
Yes
. The
NO
EL
of 1
.4 m
g/kg
bw
per d
ay fo
r the
rela
ted
subs
tanc
e et
hyl
2-(m
ethy
lthio
met
hyl)-
3-ph
enyl
prop
enal
(No.
505
) (C
ox, R
ucci
& B
abis
h, 1
979)
is a
t lea
st 3
500
times
the
estim
ated
dai
ly d
ieta
ry e
xpos
ure
to N
o. 1
922
whe
n us
ed a
s a
flavo
urin
gag
ent.
NR
Not
es 1
and
3N
o sa
fety
conc
ern
SIMPLE ALIPHATIC AND AROMATIC SULFIDES AND THIOLS (addendum) 263

Tabl
e 1
(co
ntd)
Fla
vour
ing
agen
tN
o.C
AS
No.
and
str
uctu
reS
tep
B3d
Doe
s in
take
exce
ed th
eth
resh
old
for
hum
anin
take
?
Ste
p B
4e
Ade
quat
e m
argi
n of
saf
ety
for
the
flavo
urin
g ag
ent o
r re
late
dsu
bsta
nces
? / A
re a
dditi
onal
dat
aav
aila
ble
for
subs
tanc
es w
ith a
nes
timat
ed in
take
exc
eedi
ng th
eth
resh
old
of c
once
rn?
Ste
p B
5D
oes
inta
keex
ceed
1.5
μg/
day?
Com
men
ts o
npr
edic
ted
met
abol
ism
Con
clus
ion
base
d on
curr
ent
diet
ary
expo
sure
Met
hion
aldi
ethy
l ace
tal
1940
1663
0-61
-8
OS
O
No,
SP
ET
:6
B4.
Yes
. The
NO
EL
of 1
.4 m
g/kg
bw
per
day
for
the
rela
ted
subs
tanc
eet
hyl 2
-(m
ethy
lthio
met
hyl)-
3-ph
enyl
prop
enal
(N
o. 5
05)
(Cox
,R
ucci
& B
abis
h, 1
979)
is a
t lea
st14
000
tim
es th
e es
timat
ed d
aily
diet
ary
expo
sure
to N
o. 1
940
whe
nus
ed a
s a
flavo
urin
g ag
ent.
NR
Not
e 1
No
safe
tyco
ncer
n
3-(M
ethy
lthio
)-pr
opyl
hexa
noat
e
1941
9060
79-6
3-8
S
O
O
No,
SP
ET
:15
00B
4. N
o.Y
es.
Not
es 1
and
3A
dditi
onal
data
req
uire
dto
com
plet
eev
alua
tion
264 SIMPLE ALIPHATIC AND AROMATIC SULFIDES AND THIOLS (addendum)

Tabl
e 1
(co
ntd)
Fla
vour
ing
agen
tN
o.C
AS
No.
and
stru
ctur
eS
tep
B3d
Doe
s in
take
exce
ed th
eth
resh
old
for
hum
anin
take
?
Ste
p B
4e
Ade
quat
e m
argi
n of
saf
ety
for
the
flavo
urin
g ag
ent o
r re
late
dsu
bsta
nces
? / A
re a
dditi
onal
dat
aav
aila
ble
for
subs
tanc
es w
ith a
nes
timat
ed in
take
exc
eedi
ng th
eth
resh
old
of c
once
rn?
Ste
p B
5D
oes
inta
keex
ceed
1.5
μg/
day?
Com
men
ts o
npr
edic
ted
met
abol
ism
Con
clus
ion
base
d on
curr
ent
diet
ary
expo
sure
Str
uctu
ral c
lass
III
1-(3
-(M
ethy
lthio
)-bu
tyry
l)-2,
6,6-
trim
ethy
lcyc
lohe
xene
1942
6869
7-67
-6
S
O
No,
SP
ET
:0.
25B
4. Y
es. T
he N
OE
L of
1.4
mg/
kg b
wpe
r da
y fo
r th
e re
late
d su
bsta
nce
2-(m
ethy
lthio
met
hyl)-
3-ph
enyl
prop
enal
(N
o. 5
05)
(Cox
,R
ucci
& B
abis
h, 1
979)
is a
t lea
st33
6 00
0 tim
es th
e es
timat
ed d
aily
diet
ary
expo
sure
to N
o. 1
942
whe
nus
ed a
s a
flavo
urin
g ag
ent.
NR
Not
es 1
and
5N
o sa
fety
conc
ern
Su
bg
rou
p ii
i: C
yclic
sulf
ides
Str
uctu
ral c
lass
II
2-O
xoth
iola
ne19
2310
03-1
0-7 S
O
No,
SP
ET
: 6B
4. Y
es. T
he N
OE
L of
9.2
mg/
kg b
wpe
r day
for t
he re
late
d su
bsta
nce
4,5-
dihy
dro-
3(2H
)-th
ioph
enon
e (N
o.49
8) (
Mor
gare
idge
, 197
0) is
at l
east
92 0
00 ti
mes
the
estim
ated
dai
lydi
etar
y ex
posu
re to
No.
192
3 w
hen
used
as
a fla
vour
ing
agen
t.
NR
Not
e 1
No
safe
tyco
ncer
n
SIMPLE ALIPHATIC AND AROMATIC SULFIDES AND THIOLS (addendum) 265

Tabl
e 1
(co
ntd)
Fla
vour
ing
agen
tN
o.C
AS
No.
and
str
uctu
reS
tep
B3d
Doe
s in
take
exce
ed th
eth
resh
old
for
hum
anin
take
?
Ste
p B
4e
Ade
quat
e m
argi
n of
saf
ety
for
the
flavo
urin
g ag
ent o
r re
late
dsu
bsta
nces
? / A
re a
dditi
onal
dat
aav
aila
ble
for
subs
tanc
es w
ith a
nes
timat
ed in
take
exc
eedi
ng th
eth
resh
old
of c
once
rn?
Ste
p B
5D
oes
inta
keex
ceed
1.5
μg/
day?
Com
men
ts o
npr
edic
ted
met
abol
ism
Con
clus
ion
base
d on
curr
ent d
ieta
ryex
posu
re
Str
uctu
ral
clas
s III
(±)-
cis-
and
tran
s-2-
Pen
tyl-4
-pr
opyl
-1,3
-ox
athi
ane
1943
5932
3-81
-8
S
O
Yes
, SP
ET
:30
0A
dditi
onal
dat
a: N
o.N
RN
ote
1A
dditi
onal
data
req
uire
dto
com
plet
eev
alua
tion
2-P
ente
nyl-4
-pr
opyl
-1,3
-ox
athi
ane
(mix
ture
of
isom
ers)
1944
1094
004-
39-3 S
O
Yes
, SP
ET
:30
0A
dditi
onal
dat
a: N
o.N
RN
ote
1A
dditi
onal
data
req
uire
dto
com
plet
eev
alua
tion
266 SIMPLE ALIPHATIC AND AROMATIC SULFIDES AND THIOLS (addendum)

Tabl
e 1
(co
ntd)
Fla
vour
ing
agen
tN
o.C
AS
No.
and
str
uctu
reS
tep
B3d
Doe
sin
take
exce
ed th
eth
resh
old
for
hum
anin
take
?
Ste
p B
4e
Ade
quat
e m
argi
n of
saf
ety
for
the
flavo
urin
g ag
ent o
r re
late
dsu
bsta
nces
? / A
re a
dditi
onal
dat
aav
aila
ble
for
subs
tanc
es w
ith a
nes
timat
ed in
take
exc
eedi
ng th
eth
resh
old
of c
once
rn?
Ste
p B
5D
oes
inta
keex
ceed
1.5
μg/
day?
Com
men
tson
pre
dict
edm
etab
olis
m
Con
clus
ion
base
d on
curr
ent
diet
ary
expo
sure
Su
bg
rou
p iv
:S
imp
le t
hio
ls
Str
uctu
ral c
lass
I
Dod
ecan
ethi
ol19
2411
2-55
-0
SH
No,
SP
ET
:1.
5B
4. Y
es. T
he N
OE
L of
0.5
6 m
g/kg
bw p
er d
ay fo
r the
rela
ted
subs
tanc
ecy
clop
enta
neth
iol (
No.
516
)(M
orga
reid
ge &
Ose
r, 1
970a
) is
at
leas
t 22
400
times
the
estim
ated
daily
die
tary
exp
osur
e to
No.
192
4w
hen
used
as
a fla
vour
ing
agen
t.
NR
Not
es 6
and
7N
o sa
fety
conc
ern
SIMPLE ALIPHATIC AND AROMATIC SULFIDES AND THIOLS (addendum) 267

Tabl
e 1
(co
ntd)
Fla
vour
ing
agen
tN
o.C
AS
No.
and
stru
ctur
eS
tep
B3d
Doe
s in
take
exce
ed th
eth
resh
old
for
hum
anin
take
?
Ste
p B
4e
Ade
quat
e m
argi
n of
saf
ety
for
the
flavo
urin
g ag
ent o
r re
late
dsu
bsta
nces
? / A
re a
dditi
onal
dat
aav
aila
ble
for
subs
tanc
es w
ith a
nes
timat
ed in
take
exc
eedi
ng th
eth
resh
old
of c
once
rn?
Ste
p B
5D
oes
inta
keex
ceed
1.5
μg/d
ay?
Com
men
ts o
npr
edic
ted
met
abol
ism
Con
clus
ion
base
d on
curr
ent d
ieta
ryex
posu
re
Su
bg
rou
p v
: T
hio
lsw
ith
oxi
diz
ed s
ide-
chai
ns
Str
uctu
ral c
lass
I
2-H
ydro
xyet
hane
thio
l19
2560
-24-
2
HO
SH
No,
SP
ET
:60
0B
4. Y
es. T
he N
OE
Ls o
f 1.9
, 2.8
and
1.9
mg/
kg b
w p
er d
ay fo
r, re
spec
tivel
y,2-
mer
capt
o-3-
buta
nol (
No.
546
),
-m
ethy
l--m
erca
ptop
ropy
l sul
fide
(No.
547)
and
3-m
erca
pto-
2-pe
ntan
one
(No.
560
) fr
om 9
0-da
y st
udie
s in
rat
s(M
orga
reid
ge, 1
971a
; Cox
, Bai
ley
&M
orga
reid
ge, 1
974;
Mor
gare
idge
,B
aile
y &
Cox
, 197
4) a
re a
t lea
st 1
90–
280
times
the
estim
ated
dai
ly d
ieta
ryex
posu
re to
No.
192
5 w
hen
used
as
afla
vour
ing
agen
t.
NR
Not
es 2
, 6 a
nd 7
No
safe
tyco
ncer
n
268 SIMPLE ALIPHATIC AND AROMATIC SULFIDES AND THIOLS (addendum)
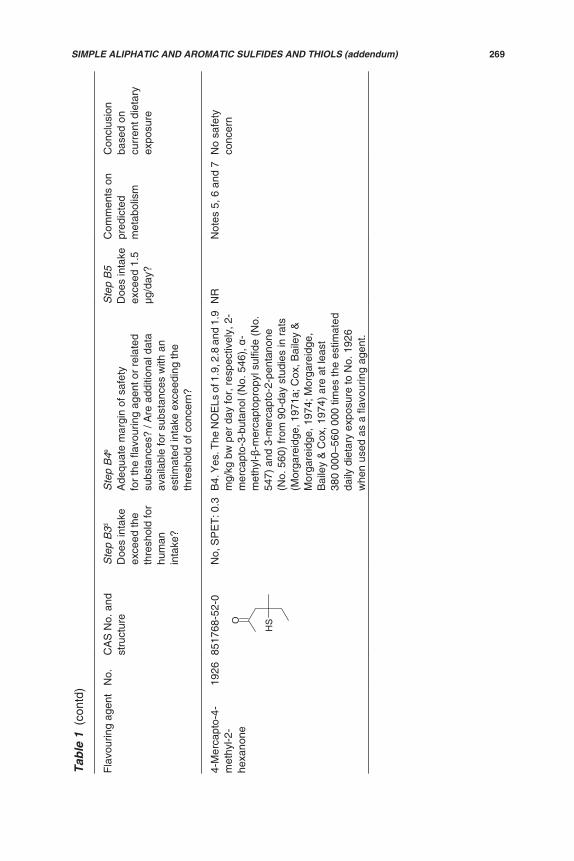
Tabl
e 1
(co
ntd)
Fla
vour
ing
agen
tN
o.C
AS
No.
and
stru
ctur
eS
tep
B3d
Doe
s in
take
exce
ed th
eth
resh
old
for
hum
anin
take
?
Ste
p B
4e
Ade
quat
e m
argi
n of
saf
ety
for
the
flavo
urin
g ag
ent o
r re
late
dsu
bsta
nces
? / A
re a
dditi
onal
dat
aav
aila
ble
for
subs
tanc
es w
ith a
nes
timat
ed in
take
exc
eedi
ng th
eth
resh
old
of c
once
rn?
Ste
p B
5D
oes
inta
keex
ceed
1.5
μg/d
ay?
Com
men
ts o
npr
edic
ted
met
abol
ism
Con
clus
ion
base
d on
curr
ent d
ieta
ryex
posu
re
4-M
erca
pto-
4-m
ethy
l-2-
hexa
none
1926
8517
68-5
2-0
O
HS
No,
SP
ET
: 0.3
B4.
Yes
. The
NO
ELs
of 1
.9, 2
.8 a
nd 1
.9m
g/kg
bw
per
day
for,
res
pect
ivel
y, 2
-m
erca
pto-
3-bu
tano
l (N
o. 5
46),
-
met
hyl-
-mer
capt
opro
pyl s
ulfid
e (N
o.54
7) a
nd 3
-mer
capt
o-2-
pent
anon
e(N
o. 5
60)
from
90-
day
stud
ies
in r
ats
(Mor
gare
idge
, 197
1a; C
ox, B
aile
y &
Mor
gare
idge
, 197
4; M
orga
reid
ge,
Bai
ley
& C
ox, 1
974)
are
at l
east
380
000–
560
000
times
the
estim
ated
daily
die
tary
exp
osur
e to
No.
192
6w
hen
used
as
a fla
vour
ing
agen
t.
NR
Not
es 5
, 6 a
nd 7
No
safe
tyco
ncer
n
SIMPLE ALIPHATIC AND AROMATIC SULFIDES AND THIOLS (addendum) 269

Tabl
e 1
(co
ntd)
Fla
vour
ing
agen
tN
o.C
AS
No.
and
str
uctu
reS
tep
B3d
Doe
s in
take
exce
ed th
eth
resh
old
for
hum
anin
take
?
Ste
p B
4e
Ade
quat
e m
argi
n of
saf
ety
for
the
flavo
urin
g ag
ent o
r re
late
dsu
bsta
nces
? / A
re a
dditi
onal
dat
aav
aila
ble
for
subs
tanc
es w
ith a
nes
timat
ed in
take
exc
eedi
ng th
eth
resh
old
of c
once
rn?
Ste
p B
5D
oes
inta
keex
ceed
1.5
μg/d
ay?
Com
men
ts o
npr
edic
ted
met
abol
ism
Con
clus
ion
base
d on
curr
ent d
ieta
ryex
posu
re
3-M
erca
pto-
3-m
ethy
lbut
ylis
oval
erat
e
1927
6120
71-2
7-9 O
SH
O
No,
SP
ET
: 20
B4.
Yes
. The
NO
ELs
of 1
.9, 2
.8 a
nd1.
9 m
g/kg
bw
per
day
for,
resp
ectiv
ely,
2-m
erca
pto-
3-bu
tano
l (N
o. 5
46),
-
met
hyl-
-mer
capt
opro
pyl s
ulfid
e (N
o.54
7) a
nd 3
-mer
capt
o-2-
pent
anon
e(N
o. 5
60)
from
90-
day
stud
ies
in r
ats
(Mor
gare
idge
, 197
1a; C
ox, B
aile
y &
Mor
gare
idge
, 197
4; M
orga
reid
ge,
Bai
ley
& C
ox, 1
974)
are
at l
east
570
0–84
00 ti
mes
the
estim
ated
dai
ly d
ieta
ryex
posu
re to
No.
192
7 w
hen
used
as
afla
vour
ing
agen
t.
NR
Not
es 3
, 6 a
nd 7
No
safe
tyco
ncer
n
270 SIMPLE ALIPHATIC AND AROMATIC SULFIDES AND THIOLS (addendum)

Tabl
e 1
(co
ntd)
Fla
vour
ing
agen
tN
o.C
AS
No.
and
stru
ctur
eS
tep
B3d
Doe
s in
take
exce
ed th
eth
resh
old
for
hum
anin
take
?
Ste
p B
4e
Ade
quat
e m
argi
n of
saf
ety
for
the
flavo
urin
g ag
ent o
r re
late
dsu
bsta
nces
? / A
re a
dditi
onal
dat
aav
aila
ble
for
subs
tanc
es w
ith a
nes
timat
ed in
take
exc
eedi
ng th
eth
resh
old
of c
once
rn?
Ste
p B
5D
oes
inta
keex
ceed
1.5
μg/d
ay?
Com
men
ts o
npr
edic
ted
met
abol
ism
Con
clus
ion
base
d on
curr
ent d
ieta
ryex
posu
re
(±)-
Eth
yl 3
-m
erca
pto-
2-m
ethy
lbut
anoa
te
1928
8880
21-8
2-7
SH
O
O
No,
MS
DI:
Eur
ope
ND
US
A 0
.1Ja
pan
ND
B4.
Yes
. The
NO
ELs
of 1
.9, 2
.8 a
nd1.
9 m
g/kg
bw
per
day
for,
resp
ectiv
ely,
2-m
erca
pto-
3-bu
tano
l(N
o. 5
46),
-m
ethy
l--
mer
capt
opro
pyl s
ulfid
e (N
o. 5
47)
and
3-m
erca
pto-
2-pe
ntan
one
(No.
560
)fr
om 9
0-da
y st
udie
s in
rat
s(M
orga
reid
ge, 1
971a
; Cox
, Bai
ley
&M
orga
reid
ge, 1
974;
Mor
gare
idge
,B
aile
y &
Cox
, 197
4) a
re a
t lea
st1
140
000–
1 68
0 00
0 tim
es th
ees
timat
ed d
aily
die
tary
exp
osur
e to
No.
192
8 w
hen
used
as
a fla
vour
ing
agen
t.
NR
Not
es 3
, 6 a
nd7
No
safe
tyco
ncer
n
SIMPLE ALIPHATIC AND AROMATIC SULFIDES AND THIOLS (addendum) 271

Tabl
e 1
(co
ntd)
Fla
vour
ing
agen
tN
o.C
AS
No.
and
stru
ctur
eS
tep
B3d
Doe
s in
take
exce
ed th
eth
resh
old
for
hum
anin
take
?
Ste
p B
4e
Ade
quat
e m
argi
n of
saf
ety
for
the
flavo
urin
g ag
ent o
r re
late
dsu
bsta
nces
? / A
re a
dditi
onal
dat
aav
aila
ble
for
subs
tanc
es w
ith a
nes
timat
ed in
take
exc
eedi
ng th
eth
resh
old
of c
once
rn?
Ste
p B
5D
oes
inta
keex
ceed
1.5
μg/d
ay?
Com
men
ts o
npr
edic
ted
met
abol
ism
Con
clus
ion
base
d on
curr
ent d
ieta
ryex
posu
re
3-M
erca
ptoh
exan
al19
2951
755-
72-7
H
OS
H
No,
SP
ET
: 3B
4. Y
es. T
he N
OE
Ls o
f 1.9
, 2.8
and
1.9
mg/
kg b
w p
er d
ay fo
r, re
spec
tivel
y,2-
mer
capt
o-3-
buta
nol (
No.
546
),
-m
ethy
l--m
erca
ptop
ropy
l sul
fide
(No.
547)
and
3-m
erca
pto-
2-pe
ntan
one
(No.
560
) fr
om 9
0-da
y st
udie
s in
rat
s(M
orga
reid
ge, 1
971a
; Cox
, Bai
ley
&M
orga
reid
ge, 1
974;
Mor
gare
idge
,B
aile
y &
Cox
, 197
4) a
re a
t lea
st38
000
–56
000
times
the
estim
ated
daily
die
tary
exp
osur
e to
No.
192
9w
hen
used
as
a fla
vour
ing
agen
t.
NR
Not
es 4
, 6 a
nd7
No
safe
tyco
ncer
n
272 SIMPLE ALIPHATIC AND AROMATIC SULFIDES AND THIOLS (addendum)

Tabl
e 1
(co
ntd)
Fla
vour
ing
agen
tN
o.C
AS
No.
and
stru
ctur
eS
tep
B3d
Doe
s in
take
exce
ed th
eth
resh
old
for
hum
anin
take
?
Ste
p B
4e
Ade
quat
e m
argi
n of
saf
ety
for
the
flavo
urin
g ag
ent o
r re
late
dsu
bsta
nces
? / A
re a
dditi
onal
dat
aav
aila
ble
for
subs
tanc
es w
ith a
nes
timat
ed in
take
exc
eedi
ng th
eth
resh
old
of c
once
rn?
Ste
p B
5D
oes
inta
keex
ceed
1.5
μg/
day?
Com
men
ts o
npr
edic
ted
met
abol
ism
Con
clus
ion
base
d on
curr
ent d
ieta
ryex
posu
re
3-M
erca
ptop
ropi
onic
acid
1936
107-
96-0
HS
OH
O
No,
MS
DI:
Eur
ope
ND
US
A N
DJa
pan
0.5
B4.
Yes
. The
NO
ELs
of 1
.9, 2
.8 a
nd1.
9 m
g/kg
bw
per
day
for,
resp
ectiv
ely,
2-m
erca
pto-
3-bu
tano
l(N
o. 5
46),
-m
ethy
l--
mer
capt
opro
pyl s
ulfid
e (N
o. 5
47) a
nd3-
mer
capt
o-2-
pent
anon
e (N
o. 5
60)
from
90-
day
stud
ies
in r
ats
(Mor
gare
idge
, 197
1a; C
ox, B
aile
y &
Mor
gare
idge
, 197
4; M
orga
reid
ge,
Bai
ley
& C
ox, 1
974)
are
at l
east
228
000–
336
000
times
the
estim
ated
daily
die
tary
exp
osur
e to
No.
193
6w
hen
used
as
a fla
vour
ing
agen
t.
NR
Not
es 6
and
7N
o sa
fety
conc
ern
SIMPLE ALIPHATIC AND AROMATIC SULFIDES AND THIOLS (addendum) 273

Tabl
e 1
(co
ntd)
Fla
vour
ing
agen
tN
o.C
AS
No.
and
str
uctu
reS
tep
B3d
Doe
sin
take
exce
ed th
eth
resh
old
for
hum
anin
take
?
Ste
p B
4e
Ade
quat
e m
argi
n of
saf
ety
for
the
flavo
urin
g ag
ent o
r re
late
dsu
bsta
nces
? / A
re a
dditi
onal
dat
aav
aila
ble
for
subs
tanc
es w
ith a
nes
timat
ed in
take
exc
eedi
ng th
eth
resh
old
of c
once
rn?
Ste
p B
5D
oes
inta
keex
ceed
1.5
μg/
day?
Com
men
tson
pre
dict
edm
etab
olis
m
Con
clus
ion
base
d on
curr
ent
diet
ary
expo
sure
2-E
thyl
hexy
l 3-
mer
capt
opro
pion
ate
1938
5044
8-95
-8
OSH
O
No,
SP
ET
:30
B4.
Yes
. The
NO
ELs
of 1
.9, 2
.8 a
nd1.
9 m
g/kg
bw
per
day
for,
resp
ectiv
ely,
2-m
erca
pto-
3-bu
tano
l(N
o. 5
46),
-m
ethy
l--
mer
capt
opro
pyl s
ulfid
e (N
o. 5
47)
and
3-m
erca
pto-
2-pe
ntan
one
(No.
560)
from
90-
day
stud
ies
in r
ats
(Mor
gare
idge
, 197
1a; C
ox, B
aile
y &
Mor
gare
idge
, 197
4; M
orga
reid
ge,
Bai
ley
& C
ox, 1
974)
are
at l
east
3800
–560
0 tim
es th
e es
timat
edda
ily d
ieta
ry e
xpos
ure
to N
o. 1
938
whe
n us
ed a
s a
flavo
urin
g ag
ent.
NR
Not
es 3
, 6an
d 7
No
safe
tyco
ncer
n
Str
uctu
ral c
lass
III
3-(M
ethy
lthio
)pro
pyl
mer
capt
oace
tate
1914
8529
97-3
0-9
SO
SH
O
Yes
, SP
ET
:30
0A
dditi
onal
dat
a: N
o.N
RN
otes
1, 3
, 6an
d 7
Add
ition
alda
ta r
equi
red
to c
ompl
ete
eval
uatio
n
274 SIMPLE ALIPHATIC AND AROMATIC SULFIDES AND THIOLS (addendum)

Tabl
e 1
(co
ntd)
Fla
vour
ing
agen
tN
o.C
AS
No.
and
str
uctu
reS
tep
B3d
Doe
s in
take
exce
ed th
eth
resh
old
for
hum
anin
take
?
Ste
p B
4e
Ade
quat
e m
argi
n of
saf
ety
for
the
flavo
urin
g ag
ent o
r re
late
dsu
bsta
nces
? / A
re a
dditi
onal
dat
aav
aila
ble
for
subs
tanc
es w
ith a
nes
timat
ed in
take
exc
eedi
ng th
eth
resh
old
of c
once
rn?
Ste
p B
5D
oes
inta
keex
ceed
1.5
μg/d
ay?
Com
men
ts o
npr
edic
ted
met
abol
ism
Con
clus
ion
base
d on
curr
ent d
ieta
ryex
posu
re
Su
bg
rou
p v
ii:S
imp
led
isu
lfid
es
Str
uctu
ral
clas
s I
Diis
oam
yldi
sulfi
de19
3020
51-0
4-9 S
S
No,
SP
ET
: 10
B4.
Yes
. The
NO
EL
of 7
.3 m
g/kg
bw
per
day
for
the
rela
ted
subs
tanc
epr
opyl
dis
ulfid
e (N
o. 5
66)
(Pos
tern
ak,
Lind
er &
Vod
oz, 1
969)
is a
t lea
st43
800
tim
es th
e es
timat
ed d
aily
diet
ary
expo
sure
to N
o. 1
930
whe
nus
ed a
s a
flavo
urin
g ag
ent.
NR
Not
es 7
, 8 a
nd 9
No
safe
tyco
ncer
n
But
yl p
ropy
ldi
sulfi
de19
3272
437-
64-0 S
S
No,
SP
ET
:0.
2B
4. Y
es. T
he N
OE
L of
7.3
mg/
kg b
wpe
r da
y fo
r th
e re
late
d su
bsta
nce
prop
yl d
isul
fide
(No.
566
) (P
oste
rnak
,Li
nder
& V
odoz
, 196
9) is
at l
east
2 19
0 00
0 tim
es th
e es
timat
ed d
aily
diet
ary
expo
sure
to N
o. 1
932
whe
nus
ed a
s a
flavo
urin
g ag
ent.
NR
Not
es 7
, 8 a
nd 9
No
safe
tyco
ncer
n
SIMPLE ALIPHATIC AND AROMATIC SULFIDES AND THIOLS (addendum) 275

Tabl
e 1
(co
ntd)
Fla
vour
ing
agen
tN
o.C
AS
No.
and
stru
ctur
eS
tep
B3d
Doe
s in
take
exce
ed th
eth
resh
old
for
hum
anin
take
?
Ste
p B
4e
Ade
quat
e m
argi
n of
saf
ety
for
the
flavo
urin
g ag
ent o
r re
late
dsu
bsta
nces
? / A
re a
dditi
onal
dat
aav
aila
ble
for
subs
tanc
es w
ith a
nes
timat
ed in
take
exc
eedi
ng th
eth
resh
old
of c
once
rn?
Ste
p B
5D
oes
inta
keex
ceed
1.5
μg/d
ay?
Com
men
ts o
npr
edic
ted
met
abol
ism
Con
clus
ion
base
d on
curr
ent d
ieta
ryex
posu
re
Di-s
ec-b
utyl
disu
lfide
1933
5943
-30-
6 SS
No,
SP
ET
: 50
B4.
Yes
. The
NO
EL
of 7
.3 m
g/kg
bw
per
day
for
the
rela
ted
subs
tanc
epr
opyl
dis
ulfid
e (N
o. 5
66)
(Pos
tern
ak,
Lind
er &
Vod
oz, 1
969)
is a
t lea
st 8
760
times
the
estim
ated
dai
ly d
ieta
ryex
posu
re to
No.
193
3 w
hen
used
as
afla
vour
ing
agen
t.
NR
Not
es 7
, 8 a
nd9
No
safe
tyco
ncer
n
Str
uctu
ral c
lass
III
Bis
(2-
met
hylp
heny
l)di
sulfi
de
1931
4032
-80-
8 SS
Yes
, SP
ET
:35
0A
dditi
onal
dat
a: N
o.N
RN
otes
7, 8
and
9A
dditi
onal
dat
are
quire
d to
com
plet
eev
alua
tion
276 SIMPLE ALIPHATIC AND AROMATIC SULFIDES AND THIOLS (addendum)

Tabl
e 1
(co
ntd)
Fla
vour
ing
agen
tN
o.C
AS
No.
and
str
uctu
reS
tep
B3d
Doe
s in
take
exce
ed th
eth
resh
old
for
hum
anin
take
?
Ste
p B
4e
Ade
quat
e m
argi
n of
saf
ety
for
the
flavo
urin
g ag
ent o
r re
late
dsu
bsta
nces
? / A
re a
dditi
onal
dat
aav
aila
ble
for
subs
tanc
es w
ith a
nes
timat
ed in
take
exc
eedi
ng th
eth
resh
old
of c
once
rn?
Ste
p B
5D
oes
inta
keex
ceed
1.5
μg/d
ay?
Com
men
ts o
npr
edic
ted
met
abol
ism
Con
clus
ion
base
d on
curr
ent d
ieta
ryex
posu
re
Met
hyl 2
-m
ethy
lphe
nyl
disu
lfide
1935
3537
9-09
-0
SS
No,
SP
ET
:0.
2B
4. Y
es. T
he N
OE
L of
3.4
mg/
kg b
wpe
r da
y fo
r th
e re
late
d su
bsta
nce
2-na
phth
alen
ethi
ol (
No.
531
)(M
orga
reid
ge, 1
971b
) is
at l
east
1 02
0 00
0 tim
es th
e es
timat
ed d
aily
diet
ary
expo
sure
to N
o. 1
935
whe
nus
ed a
s a
flavo
urin
g ag
ent.
NR
Not
es 7
, 8 a
nd9
No
safe
tyco
ncer
n
Su
bg
rou
p ix
:T
risu
lfid
es
Str
uctu
ral c
lass
I
Diis
oam
yltr
isul
fide
1934
9553
71-6
4-9
SS
S
No,
SP
ET
: 2B
4. Y
es. T
he N
OE
L of
4.8
mg/
kg b
wpe
r da
y fo
r th
e re
late
d su
bsta
nce
dipr
opyl
tris
ulfid
e (N
o. 5
85)
(Mor
gare
idge
& O
ser,
197
0b)
is a
tle
ast 1
44 0
00 ti
mes
the
estim
ated
daily
die
tary
exp
osur
e to
No.
193
4w
hen
used
as
a fla
vour
ing
agen
t.
NR
Not
es 7
, 8 a
nd9
No
safe
tyco
ncer
n
SIMPLE ALIPHATIC AND AROMATIC SULFIDES AND THIOLS (addendum) 277

Tabl
e 1
(co
ntd)
Fla
vour
ing
agen
tN
o.C
AS
No.
and
stru
ctur
eS
tep
B3d
Doe
s in
take
exce
ed th
eth
resh
old
for
hum
anin
take
?
Ste
p B
4e
Ade
quat
e m
argi
n of
saf
ety
for
the
flavo
urin
g ag
ent o
r re
late
dsu
bsta
nces
? / A
re a
dditi
onal
dat
aav
aila
ble
for
subs
tanc
es w
ith a
nes
timat
ed in
take
exc
eedi
ng th
eth
resh
old
of c
once
rn?
Ste
p B
5D
oes
inta
keex
ceed
1.5
μg/d
ay?
Com
men
ts o
npr
edic
ted
met
abol
ism
Con
clus
ion
base
d on
curr
ent d
ieta
ryex
posu
re
Su
bg
rou
p x
i:T
hio
este
rs
Str
uctu
ral c
lass
I
Met
hyl
isob
utan
ethi
oate
1937
4207
5-42
-3 S
O
No,
SP
ET
: 60
B4.
Yes
. The
NO
EL
of 6
.5 m
g/kg
bw
per d
ay fo
r the
rela
ted
subs
tanc
e et
hyl
thio
acet
ate
(No.
483
) (S
helle
nber
ger,
1970
) is
at l
east
650
0 tim
es th
ees
timat
ed d
aily
die
tary
exp
osur
e to
No.
193
7 w
hen
used
as
a fla
vour
ing
agen
t.
NR
Not
e 10
No
safe
tyco
ncer
n
bw, b
ody
wei
ght;
CA
S, C
hem
ical
Abs
trac
ts S
ervi
ce; N
D, n
o da
ta r
epor
ted;
NO
EL,
no-
obse
rved
-effe
ct le
vel;
NR
, not
req
uire
d fo
r ev
alua
tion
a
by th
e C
omm
ittee
at i
ts fi
fty-t
hird
mee
ting
(Ann
ex 1
, ref
eren
ce 1
43),
12
addi
tiona
l mem
bers
at i
ts s
ixty
-firs
t mee
ting
(Ann
ex 1
, ref
eren
ce 1
66)
and
51ad
ditio
nal m
embe
rs a
t its
six
ty-e
ight
h m
eetin
g (A
nnex
1, r
efer
ence
187
).b
Ste
p 1:
Tw
enty
-eig
ht fl
avou
ring
agen
ts in
this
gro
up a
re in
str
uctu
ral c
lass
I (N
os 1
909–
1913
, 191
5–19
22, 1
924–
1930
, 193
2–19
34, 1
936–
1938
, 194
0an
d 19
41),
1 is
in s
truc
tura
l cla
ss II
(N
o. 1
923)
and
the
rem
aini
ng 7
are
in s
truc
tura
l cla
ss II
I (N
os 1
914,
193
1, 1
935,
193
9 an
d 19
42–1
944)
.c
Ste
p 2:
Non
e of
the
flavo
urin
g ag
ents
in th
is g
roup
can
be
pred
icte
d to
be
met
abol
ized
to in
nocu
ous
prod
ucts
.d
The
thre
shol
ds fo
r hu
man
inta
ke fo
r st
ruct
ural
cla
sses
I, II
and
III a
re 1
800,
540
and
90
g/da
y, r
espe
ctiv
ely.
All
inta
ke v
alue
s ar
e ex
pres
sed
in
g/da
y. E
ither
the
high
est S
PE
T e
stim
ate
or th
e M
SD
I est
imat
es, i
f at l
east
one
is h
ighe
r th
an th
e hi
ghes
t SP
ET
est
imat
e, a
re g
iven
in th
e ta
ble.
e T
he m
argi
n of
saf
ety
was
cal
cula
ted
base
d on
the
high
est d
aily
die
tary
exp
osur
e ca
lcul
ated
eith
er b
y th
e S
PE
T o
r as
the
MS
DI.
278 SIMPLE ALIPHATIC AND AROMATIC SULFIDES AND THIOLS (addendum)
One
hun
dred
and
thirt
y-se
ven
flavo
urin
g ag
ents
bel
ongi
ng to
the
grou
p of
sim
ple
alip
hatic
and
aro
mat
ic s
ulfid
es a
nd th
iols
wer
e pr
evio
usly
eva
luat
ed
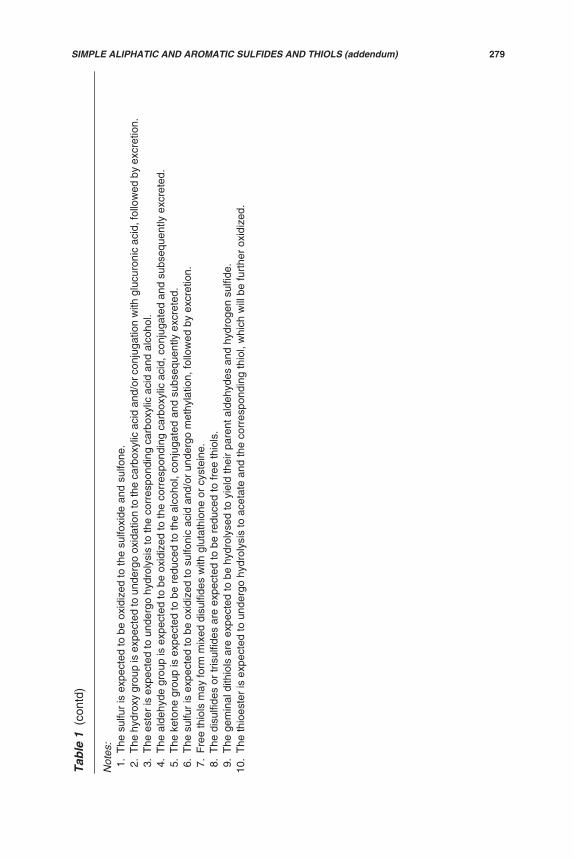
Tabl
e 1
(co
ntd)
Not
es:
1.
The
sul
fur
is e
xpec
ted
to b
e ox
idiz
ed to
the
sulfo
xide
and
sul
fone
. 2
.T
he h
ydro
xy g
roup
is e
xpec
ted
to u
nder
go o
xida
tion
to th
e ca
rbox
ylic
aci
d an
d/or
con
juga
tion
with
glu
curo
nic
acid
, fol
low
ed b
y ex
cret
ion.
3.
The
est
er is
exp
ecte
d to
und
ergo
hyd
roly
sis
to th
e co
rres
pond
ing
carb
oxyl
ic a
cid
and
alco
hol.
4.
The
ald
ehyd
e gr
oup
is e
xpec
ted
to b
e ox
idiz
ed to
the
corr
espo
ndin
g ca
rbox
ylic
aci
d, c
onju
gate
d an
d su
bseq
uent
ly e
xcre
ted.
5.
The
ket
one
grou
p is
exp
ecte
d to
be
redu
ced
to th
e al
coho
l, co
njug
ated
and
sub
sequ
ently
exc
rete
d. 6
.T
he s
ulfu
r is
exp
ecte
d to
be
oxid
ized
to s
ulfo
nic
acid
and
/or
unde
rgo
met
hyla
tion,
follo
wed
by
excr
etio
n. 7
.F
ree
thio
ls m
ay fo
rm m
ixed
dis
ulfid
es w
ith g
luta
thio
ne o
r cy
stei
ne.
8.
The
dis
ulfid
es o
r tr
isul
fides
are
exp
ecte
d to
be
redu
ced
to fr
ee th
iols
. 9
.T
he g
emin
al d
ithio
ls a
re e
xpec
ted
to b
e hy
drol
ysed
to y
ield
thei
r pa
rent
ald
ehyd
es a
nd h
ydro
gen
sulfi
de.
10.
The
thio
este
r is
exp
ecte
d to
und
ergo
hyd
roly
sis
to a
ceta
te a
nd th
e co
rres
pond
ing
thio
l, w
hich
will
be
furt
her
oxid
ized
.
SIMPLE ALIPHATIC AND AROMATIC SULFIDES AND THIOLS (addendum) 279

Table 2. Annual volumes of production and daily dietary exposures for simplealiphatic and aromatic sulfides and thiols used as flavouring agents inEurope, the USA and Japan
Flavouring agent(No.)
Most recentannual volume
of production(kg)a
Dietary exposure Annual volumefrom natural
occurrence infoods (kg)
MSDIb SPETc
g/day g/kg bwper day
g/day g/kg bwper day
Methyl octylsulfide (1909)
400 6.7 +
Europe ND ND ND
USA ND ND ND
Japan 6 1.5 0.02
Methyl 1-propenyl sulfide(1910)
2 0.03 +
Europe 0.1 0.01 0.0002
USA ND ND ND
Japan 0.4 0.1 0.002
Di-(1-propenyl)-sulfide (mixtureof isomers)(1911)
80 1.3
Europe ND ND ND
USA 0.2 0.02 0.0004
Japan ND ND ND
Ethyl 2-hydroxyethylsulfide (1912)
3 0.05
Europe ND ND ND
USA ND ND ND
Japan 0.1 0.03 0.0004
2-(Methylthio)-ethyl acetate(1913)
300 5.0 +
Europe 0.1 0.01 0.0002
USA ND ND ND
Japan 0.2 0.06 0.001
280 SIMPLE ALIPHATIC AND AROMATIC SULFIDES AND THIOLS (addendum)

Table 2 (contd)
Flavouring agent(No.)
Most recentannual volume
of production(kg)a
Dietary exposure Annual volumefrom natural
occurrence infoods (kg)
MSDIb SPETc
g/day
g/kg bwper day
g/day g/kg bwper day
3-(Methylthio)propylmercaptoacetate(1914)
300 5.0
Europe ND ND ND
USA ND ND ND
Japan 0.4 0.09 0.002
Ethyl 3-(methylthio)-(2Z)-propenoate(1915)
300 5.0 +
Europe ND ND ND
USA ND ND ND
Japan 0.2 0.05 0.001
Ethyl 3-(methylthio)-(2E)-propenoate(1916)
300 5.0 +
Europe ND ND ND
USA ND ND ND
Japan 0.2 0.05 0.001
Ethyl 3-(methylthio)-2-propenoate (1917)
300 5.0
Europe ND ND ND
USA ND ND ND
Japan 0.2 0.05 0.001
4-Methyl-2-(methylthiomethyl)-2-pentenal (1918)
0.1 0.002 +
Europe ND ND ND
USA ND ND ND
Japan 0.1 0.03 0.0004
SIMPLE ALIPHATIC AND AROMATIC SULFIDES AND THIOLS (addendum) 281

Table 2 (contd)
Flavouring agent(No.)
Most recentannual volume
of production(kg)a
Dietary exposure Annual volumefrom natural
occurrence infoods (kg)
MSDIb SPETc
g/day
g/kg bwper day
g/day g/kg bwper day
4-Methyl-2-(methylthiomethyl)-2-hexenal (1919)
1.5 0.03
Europe ND ND ND
USA ND ND ND
Japan 0.1 0.03 0.0004
5-Methyl-2-(methylthiomethyl)-2-hexenal (1920)
3 0.05
Europe ND ND ND
USA ND ND ND
Japan 0.8 0.2 0.004
Butyl -(methylthio)-acrylate (1921)
0.3 0.01
Europe ND ND ND
USA ND ND ND
Japan 0.1 0.03 0.0004
Ethyl 3-(ethylthio)-butyrate (1922)
24 0.4
Europe ND ND ND
USA ND ND ND
Japan 0.1 0.03 0.0004
2-Oxothiolane (1923) 6 0.1 +
Europe ND ND ND
USA ND ND ND
Japan 0.1 0.03 0.0004
Dodecanethiol (1924) 1.5 0.025
Europe ND ND ND
USA ND ND ND
Japan 0.2 0.06 0.0009
282 SIMPLE ALIPHATIC AND AROMATIC SULFIDES AND THIOLS (addendum)

Table 2 (contd)
Flavouring agent(No.)
Most recentannual volume
of production(kg)a
Dietary exposure Annual volumefrom natural
occurrence infoods (kg)
MSDIb SPETc
g/day
g/kg bwper day
g/day g/kg bwper day
2-Hydroxyethanethiol(1925)
600 10
Europe ND ND ND
USA ND ND ND
Japan 0.5 0.1 0.002
4-Mercapto-4-methyl-2-hexanone(1926)
0.3 0.005
Europe ND ND ND
USA ND ND ND
Japan 0.1 0.03 0.0004
3-Mercapto-3-methylbutylisovalerate (1927)
20 0.3
Europe ND ND ND
USA ND ND ND
Japan 0.1 0.03 0.0004
(±)-Ethyl 3-mercapto-2-methylbutanoate(1928)
0.001 0.000 02
Europe ND ND ND
USA 1 0.1 0.002
Japan ND ND ND
3-Mercaptohexanal(1929)
3 0.05
Europe 0.1 0.01 0.0002
USA ND ND ND
Japan 0.8 0.2 0.004
SIMPLE ALIPHATIC AND AROMATIC SULFIDES AND THIOLS (addendum) 283

Table 2 (contd)
Flavouringagent(No.)
Most recentannual volume
of production(kg)a
Dietary exposure Annual volumefrom natural
occurrence infoods (kg)
MSDIb SPETc
g/day
g/kg bwper day
g/day g/kg bwper day
Diisoamyldisulfide (1930)
10 0.2
Europe ND ND ND
USA ND ND ND
Japan 0.1 0.03 0.0004
Bis(2-methylphenyl)disulfide (1931)
350 5.8
Europe ND ND ND
USA ND ND ND
Japan 0.1 0.03 0.0004
Butyl propyldisulfide (1932)
0.2 0.003 +
Europe ND ND ND
USA ND ND ND
Japan 0.1 0.03 0.0004
Di-sec-butyldisulfide (1933)
50 0.8 +
Europe ND ND ND
USA ND ND ND
Japan 0.1 0.03 0.0004
Diisoamyltrisulfide (1934)
2 0.03
Europe ND ND ND
USA ND ND ND
Japan 0.1 0.03 0.0004
Methyl 2-methylphenyldisulfide (1935)
0.2 0.003
Europe ND ND ND
USA ND ND ND
Japan 0.1 0.03 0.0004
284 SIMPLE ALIPHATIC AND AROMATIC SULFIDES AND THIOLS (addendum)
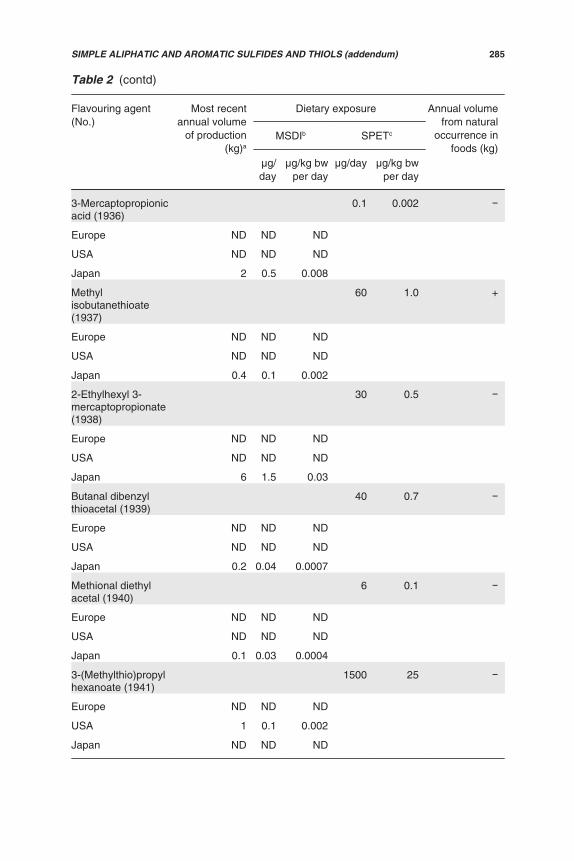
Table 2 (contd)
Flavouring agent(No.)
Most recentannual volume
of production(kg)a
Dietary exposure Annual volumefrom natural
occurrence infoods (kg)
MSDIb SPETc
g/day
g/kg bwper day
g/day g/kg bwper day
3-Mercaptopropionicacid (1936)
0.1 0.002
Europe ND ND ND
USA ND ND ND
Japan 2 0.5 0.008
Methylisobutanethioate(1937)
60 1.0 +
Europe ND ND ND
USA ND ND ND
Japan 0.4 0.1 0.002
2-Ethylhexyl 3-mercaptopropionate(1938)
30 0.5
Europe ND ND ND
USA ND ND ND
Japan 6 1.5 0.03
Butanal dibenzylthioacetal (1939)
40 0.7
Europe ND ND ND
USA ND ND ND
Japan 0.2 0.04 0.0007
Methional diethylacetal (1940)
6 0.1
Europe ND ND ND
USA ND ND ND
Japan 0.1 0.03 0.0004
3-(Methylthio)propylhexanoate (1941)
1500 25
Europe ND ND ND
USA 1 0.1 0.002
Japan ND ND ND
SIMPLE ALIPHATIC AND AROMATIC SULFIDES AND THIOLS (addendum) 285

Table 2 (contd)
Flavouring agent(No.)
Most recentannual volume
of production(kg)a
Dietary exposure Annual volumefrom natural
occurrence infoods (kg)
MSDIb SPETc
g/day
g/kg bwper day
g/day g/kg bwper day
1-(3-(Methylthio)-butyryl)-2,6,6-trimethylcyclohexene(1942)
0.25 0.004
Europe ND ND ND
USA ND ND ND
Japan 0.1 0.03 0.0004
(±)-cis- and trans-2-Pentyl-4-propyl-1,3-oxathiane (1943)
300 5.0
Europe ND ND ND
USA 0.1 0.01 0.0002
Japan ND ND ND
2-Pentenyl-4-propyl-1,3-oxathiane(mixture of isomers)(1944)
300 5.0
Europe ND ND ND
USA 0.1 0.01 0.0002
Japan ND ND ND
Total
Europe 0.3
USA 2
Japan 19
286 SIMPLE ALIPHATIC AND AROMATIC SULFIDES AND THIOLS (addendum)
bw, body weight; ND, no data reported; +, reported to occur naturally in foods (Nijssen, vanIngen-Visscher & Donders, 2008), but no quantitative data; , not reported to occur naturallyin foods
a From European Flavour and Fragrance Association (2004), Gavin, Williams & Hallagan(2008) and Japan Flavor and Fragrance Materials Association (2005). Values greater thanzero but less than 0.1 kg were reported as 0.1 kg.
b MSDI (μg/person per day) calculated as follows:

SIMPLE ALIPHATIC AND AROMATIC SULFIDES AND THIOLS (addendum) 287
1.3 Absorption, distribution, metabolism and elimination
Information on the absorption, distribution, metabolism and elimination of theflavouring agents belonging to the group of simple aliphatic and aromatic sulfidesand thiols has previously been described in the monographs of the fifty-third, sixty-first and sixty-eighth meetings (Annex 1, references 144, 167 and 188). Noadditional relevant data have been reported since these meetings.
1.4 Application of the Procedure for the Safety Evaluation of FlavouringAgents
Step 1. In applying the Procedure for the Safety Evaluation of FlavouringAgents to the 36 flavouring agents in this group of simple aliphatic and aromaticsulfides and thiols, the Committee assigned 28 flavouring agents to structural classI (Nos 1909–1913, 1915–1922, 1924–1930, 1932–1934, 1936–1938, 1940 and1941), 1 flavouring agent to structural class II (No. 1923) and 7 flavouring agents tostructural class III (Nos 1914, 1931, 1935, 1939 and 1942–1944) (Cramer, Ford &Hall, 1978).
Step 2. None of the flavouring agents in this group can be predicted to bemetabolized to innocuous products. The evaluation of these substances thereforeproceeded via the B-side of the Procedure.
Step B3. The highest estimated daily per capita intakes of the 28 flavouringagents in structural class I and the 1 flavouring agent in structural class II are belowthe respective thresholds of concern (i.e. 1800 μg/person per day for class I and540 μg/person per day for class II). Accordingly, the evaluation of these 29flavouring agents proceeded to step B4.
The highest estimated daily per capita intakes of three flavouring agents instructural class III (Nos 1935, 1939 and 1942) are below the threshold of concern(i.e. 90 μg/person per day for class III). Accordingly, the evaluation of these three
Table 2 (contd)
(annual volume, kg) × (1 × 10⁹ μg/kg)/(population × survey correction factor × 365 days),where population (10%, “eaters only”) = 32 × 106 for Europe, 28 × 106 for the USA and13 × 106 for Japan; and where survey correction factor = 0.8 for the surveys in Europe, theUSA and Japan, representing the assumption that only 80% of the annual flavour volumewas reported in the poundage surveys (European Flavour and Fragrance Association, 2004;Japan Flavor and Fragrance Materials Association, 2005; Gavin, Williams & Hallagan,2008).MSDI (μg/kg bw per day) calculated as follows:(μg/person per day)/body weight, where body weight = 60 kg. Slight variations may occurfrom rounding.
c SPET (μg/person per day) calculated as follows:(standard food portion, g/day) × (average use level) (International Organization of the FlavorIndustry, 2009). The dietary exposure from the single food category leading to the highestdietary exposure from one portion is taken as the SPET estimate.SPET (μg/kg bw per day) calculated as follows:(μg/person per day)/body weight, where body weight = 60 kg. Slight variations may occurfrom rounding.

flavouring agents proceeded to step B4. The highest estimated daily per capitaintakes of the four remaining flavouring agents in structural class III (Nos 1914,1931, 1943 and 1944) are 350 μg for No. 1931 and 300 μg for Nos 1914, 1943 and1944 (calculated using the SPET) and are above the threshold of concern (i.e.90 μg/person per day for class III). Therefore, additional data are necessary for theevaluation of these flavouring agents.
Consideration of flavouring agents with high exposure evaluated via theB-side of the decision tree:
In accordance with the Procedure, additional data were evaluated for3-(methylthio)propyl mercaptoacetate (No. 1914), bis(2-methylphenyl) disulfide(No. 1931), (±)-cis- and trans-2-pentyl-4-propyl-1,3-oxathiane (No. 1943) and 2-pentenyl-4-propyl-1,3-oxathiane (mixture of isomers) (No. 1944), as the estimatedintakes exceeded the threshold of concern for structural class III (90 μg/person perday).
No. 1914
No data are available for 3-(methylthio)propyl mercaptoacetate (No. 1914)or closely related substances with which to perform a safety evaluation. Therefore,the Committee determined that additional metabolic or toxicological data would benecessary to complete the evaluation of No. 1914 at current estimated dietaryexposures.
No. 1931
No data are available for bis(2-methylphenyl) disulfide (No. 1931) or closelyrelated substances with which to perform a safety evaluation. Bis(2-methylphenyl)disulfide is expected to be reduced rapidly to a thiophenol analogue; however, therate and extent of reduction are unknown. Therefore, the Committee determinedthat additional metabolic or toxicological data would be necessary to complete theevaluation of No. 1931 at current estimated dietary exposures.
No. 1943
No data are available for (±)-cis- and trans-2-pentyl-4-propyl-1,3-oxathiane(No. 1943). The no-observed-effect level (NOEL) of 0.44 mg/kg body weight (bw)per day for the closely related substance 2-methyl-4-propyl-1,3-oxathiane (No. 464)from a 90-day study in rats (British Industrial Biological Research Association, 1976)provides a margin of safety of 88 (SPET for No. 1943 = 300 μg/day). The Committeeconsidered that this margin of safety is inadequate and that additional data wouldbe necessary to complete the evaluation of No. 1943 at current estimated dietaryexposures.
No. 1944
No data are available for 2-pentenyl-4-propyl-1,3-oxathiane (mixture ofisomers) (No. 1944). The NOEL of 0.44 mg/kg bw per day for the closely related
288 SIMPLE ALIPHATIC AND AROMATIC SULFIDES AND THIOLS (addendum)

substance 2-methyl-4-propyl-1,3-oxathiane (No. 464) from a 90-day study in rats(British Industrial Biological Research Association, 1976) provides a margin ofsafety of 88 (SPET for No. 1944 = 300 μg/day). The Committee considered that thismargin of safety is inadequate and that additional data would be necessary tocomplete the evaluation of No. 1944 at current estimated dietary exposures.
Step B4. Subgroup i: Simple sulfides. The NOEL of 250 mg/kg bw per dayfor the structurally related substance methyl sulfide (No. 452) from a 14-week oralgavage study in rats (Butterworth et al., 1975) provides adequate margins of safety(ranging from 37 500 to 7 500 000) for methyl octyl sulfide (No. 1909; SPET =400 μg/day), methyl 1-propenyl sulfide (No. 1910; SPET = 2 μg/day) and di-(1-propenyl)-sulfide (mixture of isomers) (No. 1911; SPET = 80 μg/day) when used asflavouring agents. The Committee therefore concluded that these three flavouringagents are not of safety concern at current estimated dietary exposures.
No NOEL is available for butanal dibenzyl thioacetal (No. 1939). Althoughthe thioacetal group in butanal dibenzyl thioacetal can be expected to be hydrolysed,the rate and extent of hydrolysis are unknown. A NOEL was not available for astructurally related substance. Accordingly, the evaluation of butanal dibenzylthioacetal proceeded to step B5.
Subgroup ii: Acyclic sulfides with oxidized side-chains. The NOEL of1.4 mg/kg bw per day for the structurally related substance 2-(methylthiomethyl)-3-phenylpropenal (No. 505) from a 90-day oral study in rats (Cox, Rucci & Babish,1979) provides adequate margins of safety, ranging from 3500 to 672 000, for ethyl2-hydroxyethyl sulfide (No. 1912; SPET = 3 μg/day), 4-methyl-2-(methylthiomethyl)-2-pentenal (No. 1918; SPET = 0.125 μg/day), 4-methyl-2-(methylthiomethyl)-2-hexenal (No. 1919; SPET = 1.5 μg/day), 5-methyl-2-(methylthiomethyl)-2-hexenal(No. 1920; SPET = 3 μg/day), butyl -(methylthio)acrylate (No. 1921; SPET =0.3 μg/day), ethyl 3-(ethylthio)butyrate (No. 1922; SPET = 24 μg/day), methionaldiethyl acetal (No. 1940; SPET = 6 μg/day) and 1-(3-(methylthio)-butyryl)-2,6,6-trimethylcyclohexene (No. 1942; SPET = 0.25 μg/day) when used as flavouringagents. The Committee therefore concluded that these eight flavouring agents arenot of safety concern at current estimated dietary exposures.
The NOEL of 1.4 mg/kg bw per day for the structurally related substance 2-(methylthiomethyl)-3-phenylpropenal (No. 505) provides a margin of safety of 280for 2-(methylthio)ethyl acetate (No. 1913), ethyl 3-(methylthio)-(2Z)-propenoate(No. 1915), ethyl 3-(methylthio)-(2E)-propenoate (No. 1916) and ethyl 3-(methylthio)-2-propenoate (No. 1917) (SPET for Nos 1913 and 1915–1917 =300 μg/day) when used as flavouring agents. This margin of safety is lower than thevalue of 1000 proposed at the forty-fourth meeting of the Committee as an adequatemargin for flavouring agents on the B-side of the Procedure (Annex 1, reference116). However, No. 505 bears more structural alerts for toxicity compared withNos 1913 and 1915–1917 because of its more complex molecular structure. Also,the value of 1000 was based on the comparison of the no-observed-adverse-effectlevel (NOAEL) with the MSDI. The Committee noted that the margin of safety forthese compounds based on the MSDI (range 0.05–0.06 μg/day) is about 1 400 000.The Committee concluded that the values of 280 (based on the SPET) and about
SIMPLE ALIPHATIC AND AROMATIC SULFIDES AND THIOLS (addendum) 289
1 400 000 (based on the MSDI) provide an adequate margin of safety and concludedthat these four flavouring agents are not of safety concern at current estimateddietary exposures.
The NOEL of 1.4 mg/kg bw per day for the structurally related substance 2-(methylthiomethyl)-3-phenylpropenal (No. 505) from a 90-day oral study in rats(Cox, Rucci & Babish, 1979) provides a margin of safety of 56 for 3-(methylthio)-propyl hexanoate (No. 1941; SPET = 1500 μg/day). This margin of safety isapproximately 20 times lower than the value of 1000 proposed at the forty-fourthmeeting of the Committee (Annex 1, reference 116) and is not considered adequate.Accordingly, the evaluation of 3-(methylthio)propyl hexanoate proceeded tostep B5.
Subgroup iii: Cyclic sulfides. The NOEL of 9.2 mg/kg bw per day for thestructurally related substance 4,5-dihydro-3(2H)-thiophenone (No. 498) from a90-day study in rats (Morgareidge, 1970) provides an adequate margin of safety of92 000 for 2-oxothiolane (No. 1923; SPET = 6 μg/day). The Committee concludedthat this flavouring agent is not of safety concern at current estimated dietaryexposures.
Subgroup iv: Simple thiols. The NOEL of 0.56 mg/kg bw per day for thestructurally related substance cyclopentanethiol (No. 516) from a 90-day study inrats (Morgareidge & Oser, 1970a) provides an adequate margin of safety of 22 400for dodecanethiol (No. 1924; SPET = 1.5 μg/day) when used as a flavouring agent.The Committee concluded that this flavouring agent is not of safety concern atcurrent estimated dietary exposures.
Subgroup v: Thiols with oxidized side-chains. For 2-hydroxyethanethiol(No. 1925), several studies of short-term toxicity were available, but it was notpossible to derive an overall NOAEL for this compound. From the limitedly reportedstudies available, the NOAEL appears to be lower than 11 mg/kg bw per day. TheNOELs of 1.9, 2.8 and 1.9 mg/kg bw per day for, respectively, the structurally relatedsubstances 2-mercapto-3-butanol (No. 546), -methyl- -mercaptopropyl sulfide(No. 547) and 3-mercapto-2-pentanone (No. 560) from 90-day studies in rats(Morgareidge, 1971a; Cox, Bailey & Morgareidge, 1974; Morgareidge, Bailey &Cox, 1974) provide a margin of safety of at least 190 for No. 1925 (SPET = 600 μg/day). This margin of safety is lower than the value of 1000 proposed at the forty-fourth meeting of the Committee (Annex 1, reference 116). However, the value of1000 was based on the comparison of the NOAEL with the MSDI. The Committeenoted that the margin of safety for No. 1925 based on the MSDI of 0.1 μg/personper day is at least 950 000. The Committee concluded that the values of at least190 (based on the SPET) and at least 950 000 (based on the MSDI) provide anadequate margin of safety. The Committee therefore concluded that this flavouringagent is not of safety concern at current estimated dietary exposures.
The NOELs of 1.9, 2.8 and 1.9 mg/kg bw per day for, respectively, Nos 546,547 and 560 provide adequate margins of safety, ranging from 3800 to 1 680 000,for 4-mercapto-4-methyl-2-hexanone (No. 1926; SPET = 0.3 μg/day), 3-mercapto-3-methylbutyl isovalerate (No. 1927; SPET = 20 μg/day), (±)-ethyl 3-mercapto-2-methylbutanoate (No. 1928; MSDI = 0.1 μg/day), 3-mercaptohexanal
290 SIMPLE ALIPHATIC AND AROMATIC SULFIDES AND THIOLS (addendum)

(No. 1929; SPET = 3 μg/day), 3-mercaptopropionic acid (No. 1936; MSDI = 0.5 μg/day) and 2-ethylhexyl 3-mercaptopropionate (No. 1938; SPET = 30 μg/day) whenused as flavouring agents. The Committee therefore concluded that these sixflavouring agents are not of safety concern at current estimated dietary exposures.
Subgroup vii: Simple disulfides. The NOEL of 7.3 mg/kg bw per day for thestructurally related substance propyl disulfide (No. 566) from a 90-day study in rats(Posternak, Linder & Vodoz, 1969) provides adequate margins of safety (range8760–2 190 000) for diisoamyl disulfide (No. 1930; SPET = 10 μg/day), butyl propyldisulfide (No. 1932; SPET = 0.2 μg/day) and di-sec-butyl disulfide (No. 1933; SPET= 50 μg/day) when used as flavouring agents. The NOEL of 3.4 mg/kg bw per dayfor 2-naphthalenethiol (No. 531) from a 90-day study in rats (Morgareidge, 1971b)provides an adequate margin of safety (1 020 000) for methyl 2-methylphenyldisulfide (No. 1935; SPET = 0.2 μg/day) when used as a flavouring agent. No. 1935is predicted to be reduced rapidly to the corresponding thiophenol. The Committeetherefore concluded that these four flavouring agents are not of safety concern atcurrent estimated dietary exposures.
Subgroup ix: Trisulfides. The NOEL of 4.8 mg/kg bw per day for thestructurally related substance dipropyl trisulfide (No. 585) from a 90-day study in rats(Morgareidge & Oser, 1970b) provides an adequate margin of safety of 144 000 fordiisoamyl trisulfide (No. 1934; SPET = 2 μg/day) when used as a flavouring agent.The Committee therefore concluded that this flavouring agent is not of safetyconcern at current estimated dietary exposures.
Subgroup xi: Thioesters. The NOEL of 6.5 mg/kg bw per day for thestructurally related substance ethyl thioacetate (No. 483) from a 90-day study in rats(Shellenberger, 1970) provides an adequate margin of safety of 6500 for methylisobutanethioate (No. 1937; SPET = 60 μg/day) when used as a flavouring agent.The Committee therefore concluded that this flavouring agent is not of safetyconcern at current estimated dietary exposures.
Step B5. The conditions of use for butanal dibenzyl thioacetal (No. 1939;SPET = 40) result in an intake greater than 1.5 μg/day. Therefore, the Committeedetermined that additional data would be necessary to complete the evaluation ofthis flavouring agent.
The conditions of use for 3-(methylthio)propyl hexanoate (No. 1941;SPET = 1500 μg/day) result in an intake greater than 1.5 μg/day. Therefore, theCommittee determined that additional data would be necessary to complete theevaluation of this flavouring agent.
Table 1 summarizes the evaluations of the 36 additional members of thegroup of simple aliphatic and aromatic sulfides and thiols (Nos 1909–1944).
1.5 Consideration of combined intakes from use as flavouring agents
The safety assessment of possible combined intakes of flavouring agentswas based on the combined intakes of the five compounds with the highestestimated dietary exposure in each subgroup in which additional compounds wereevaluated, using the MSDI exposure assessment (as proposed at the sixty-ninthmeeting; Annex 1, reference 190).
SIMPLE ALIPHATIC AND AROMATIC SULFIDES AND THIOLS (addendum) 291

Subgroup i: Simple sulfides
In the unlikely event that the flavouring agents belonging to the subgroup ofsimple sulfides, of which the highest estimated intakes are for Nos 452, 454, 455,533 and 1909 (all structural class I) in Europe, the USA and Japan, were to beconsumed concurrently on a daily basis, the estimated combined intakes would notexceed the threshold of concern (i.e. 1800 μg/person per day for class I).
Subgroup ii: Acyclic sulfides with oxidized side-chains
In the unlikely event that the flavouring agents belonging to the subgroup ofacyclic sulfides with oxidized side-chains, of which the highest estimated intakesare for Nos 466, 472, 476, 478 and 481 (all structural class I) in Europe and theUSA, were to be consumed concurrently on a daily basis, the estimated combinedintakes would not exceed the threshold of concern (i.e. 1800 μg/person per day forclass I).
Subgroup iii: Cyclic sulfides
In the unlikely event that the flavouring agents belonging to the subgroup ofcyclic sulfides, of which the highest estimated intakes correspond to Nos 464, 498,499, 534 and 543 (all structural class II) in Europe and the USA, were to beconsumed concurrently on a daily basis, the estimated combined intakes would notexceed the threshold of concern (i.e. 540 μg/person per day for class II).
Subgroup iv: Simple thiols
In the unlikely event that the flavouring agents belonging to the subgroup ofsimple thiols, of which the highest estimated intakes correspond to Nos 508, 509,520, 525 and 528 (belonging to structural class I or II) in Europe and the USA, wereto be consumed concurrently on a daily basis, the estimated combined intakeswould not exceed either threshold of concern (i.e. 1800 μg/person per day for classI and 540 μg/person per day for class II).
Subgroup v: Thiols with oxidized side-chains
In the unlikely event that the flavouring agents in the subgroup of thiols withoxidized side-chains, of which the highest estimated intakes are for Nos 546, 551,553, 558 and 561 (belonging to structural class I or II) in Europe and the USA, wereto be consumed concurrently on a daily basis, the estimated combined intakeswould not exceed either threshold of concern (i.e. 1800 μg/person per day for classI and 540 μg/person per day for class II).
Subgroup vii: Simple disulfides
In the unlikely event that the flavouring agents in the subgroup of simpledisulfides, of which the highest estimated intakes are for Nos 564, 565, 567, 570and 572 (belonging to structural class I or II) in Europe and the USA, were to beconsumed concurrently on a daily basis, the estimated combined intakes would notexceed either threshold of concern (i.e. 1800 μg/person per day for class I and540 μg/person per day for class II).
292 SIMPLE ALIPHATIC AND AROMATIC SULFIDES AND THIOLS (addendum)

Subgroup ix: Trisulfides
In the unlikely event that the flavouring agents in the subgroup of trisulfides,of which the highest estimated intakes are for Nos 582, 585, 587, 588 and 1701 (allstructural class I) in Europe and the USA, were to be consumed concurrently on adaily basis, the estimated combined intakes would not exceed the threshold ofconcern (i.e. 1800 μg/person per day for class I).
Subgroup xi: Thioesters
In the unlikely event that the flavouring agents in the subgroup of thioesters,of which the highest estimated intakes correspond to Nos 484, 492, 493, 1295 and1676 in Europe, the USA and Japan (all structural class I), were to be consumedconcurrently on a daily basis, the estimated combined intakes of 5 and 14 μg/personin Europe and the USA, respectively, would not exceed the threshold of concern(i.e. 1800 μg/person per day for class I).
1.6 Consideration of secondary components
Four flavouring agents in this group (Nos 1915, 1916, 1932 and 1944) haveassay values of less than 95%. The secondary component of ethyl 3-(methylthio)-(2Z)-propenoate (No. 1915) is ethyl 3-(methylthio)-(2E)-propenoate (No. 1916), andthe secondary component of ethyl 3-(methylthio)-(2E)-propenoate (No. 1916) isethyl 3-(methylthio)-(2Z)-propenoate (No. 1915). These compounds are expectedto share the same metabolic fate and are considered not to present a safety concernat current estimated dietary exposures. The secondary components of butyl propyldisulfide (No. 1932) are dipropyl disulfide and dibutyl disulfide. They are bothexpected to share the same metabolic fate as the primary substance and areconsidered not to present a safety concern at current estimated dietary exposures.The secondary components of 2-pentenyl-4-propyl-1,3-oxathiane (mixture ofisomers) (No. 1944), (2-[(2E)-pent-2-en-1-yl]-4-propyl-1,3-oxathiane and 2-[(1Z)-pent-1-en-1-yl]-4-propyl-1,3-oxathiane), are expected to share the same metabolicfate as the primary substance and are considered not to present a safety concernat current estimated dietary exposures. Information on the safety of the secondarycomponents of these flavouring agents is summarized in Annex 5.
1.7 Conclusion
In the previous evaluations of flavouring agents in the group of simplealiphatic and aromatic sulfides and thiols, studies of biological properties, acutetoxicity, short-term and long-term toxicity, genotoxicity and developmental toxicityas well as observations in humans were available (Annex 1, references 144, 167and 188). The toxicity data available for this evaluation supported those fromprevious evaluations.
The Committee concluded that 30 flavouring agents (Nos 1909–1913, 1915–1930, 1932–1938, 1940 and 1942), which are additions to the group of simplealiphatic and aromatic sulfides and thiols, would not give rise to safety concerns atcurrent estimated dietary exposures. For the other six flavouring agents (Nos 1914,1931, 1939, 1941, 1943 and 1944), the Committee concluded that the evaluations
SIMPLE ALIPHATIC AND AROMATIC SULFIDES AND THIOLS (addendum) 293

could not be completed and that additional data would be necessary to completethese evaluations at current estimated dietary exposures.
2. RELEVANT BACKGROUND INFORMATION
2.1 Explanation
This monograph summarizes key aspects relevant to the safety evaluationof 36 simple aliphatic and aromatic sulfides and thiols, which are additions to a groupof, in total, 200 flavouring agents evaluated previously by the Committee at its fifty-third, sixty-first and sixty-eighth meetings (Annex 1, references 143, 166 and 187).
2.2 Additional considerations on intake
Annual volumes of production and dietary exposures estimated both as theMSDI and using the SPET for each flavouring agent are reported in Table 2.
Ten of the 36 flavouring agents in the group have been reported to occurnaturally in traditional foods (Nijssen, van Ingen-Visscher & Donders, 2008;Table 2), but quantitative data on their natural occurrence have not been reported.
2.3 Biological data
2.3.1 Biochemical data: absorption, distribution, metabolism and elimination
No relevant information additional to that available and described in themonographs of the fifty-third, sixty-first and sixty-eighth meetings (Annex 1,references 144, 167 and 188) was available on the absorption, distribution,metabolism or elimination of flavouring agents belonging to the group of simplealiphatic and aromatic sulfides and thiols.
2.3.2 Toxicological studies
(a) Acute toxicity
Oral median lethal doses (LD50 values) have been reported for 1 of the 36flavouring agents evaluated in this group and are summarized in Table 3. OralLD50 values ranging from 244 to 330 and from 190 to 345 mg/kg bw have beenreported for 2-hydroxyethanethiol (No. 1925) in rats and mice, respectively (Smyth& Carpenter, 1944; BASF AG, 1964; Pugaeva et al., 1971; White, Bruckner &Guess, 1973; Sax et al., 1979). These results support the findings in the previousevaluations (Annex 1, references 144, 167 and 188) that the oral acute toxicity ofsimple aliphatic and aromatic sulfides and thiols is low to moderate.
(b) Short-term and long-term studies of toxicity
Only for 1 of the 36 flavouring agents evaluated in this group have results ofstudies of short-term toxicity been reported, although the reporting was very limitedin all cases. The results of these studies with 2-hydroxyethanediol (No. 1925) aresummarized in Table 4 and described below. No additional studies of short-term or
294 SIMPLE ALIPHATIC AND AROMATIC SULFIDES AND THIOLS (addendum)

long-term toxicity of any of the related flavouring agents evaluated previously havebeen submitted (Annex 1, references 144, 167 and 188).
Table 3. Results of studies of oral acute toxicity with simple aliphatic andaromatic sulfides and thiols used as flavouring agents
No. Flavouring agent Species; sex LD50 (mg/kg bw) References
1925 2-Hydroxyethanethiol Rat; NR 244 Pugaeva et al. (1971)
1925 2-Hydroxyethanethiol Rat; NR 330 BASF AG (1964)
1925 2-Hydroxyethanethiol Rat; M 300 Smyth & Carpenter (1944)
1925 2-Hydroxyethanethiol Rat; NR 300 Sax et al. (1979)
1925 2-Hydroxyethanethiol Mouse; M 345 White, Bruckner & Guess(1973)
1925 2-Hydroxyethanethiol Mouse; NR 190 Pugaeva et al. (1971)
M, male; NR, not reported
Table 4. Results of studies of oral short-term toxicity with simple aliphatic andaromatic sulfides and thiols used as flavouring agents
No. Flavouring agent Species;sex
No. oftestgroupsa/no. pergroupb
Route Duration(days)
NOAEL(mg/kgbw per
day)
Reference
1925 2-Hydroxyethanethiol Rat; M,F
3/15 Oralgavage
49 15 Regnier et al.(2006)
1925 2-Hydroxyethanethiol Rabbit;NR
3/NR Oralgavage
NR <11c BASF AG(1967); BASFCorporation(1992)
1925 2-Hydroxyethanethiol Cat; NR 1/NR Orald 10–19e 28 BASF AG(1967)
1925 2-Hydroxyethanethiol Guinea-pig; NR
3/NR Orald 28e 22c BASF AG(1967); BASFCorporation(1992)
F, female; M, male; NR, not reporteda Total number of test groups does not include control animals.b Total number per test group includes both male and female animals.c Lowest dose tested.d Route not further specified.e Number of doses; frequency not stated.
SIMPLE ALIPHATIC AND AROMATIC SULFIDES AND THIOLS (addendum) 295

In a combined repeated-dose oral toxicity study and reproductive/developmental toxicity screening test, groups of 10 male and 5 female Sprague-Dawley rats were given 2-hydroxyethanediol (No. 1925) by gavage at doses of 0,15, 50 or 75 mg/kg bw per day for 7 weeks. Groups of 10 female rats were treatedwith the same doses from premating to day 21 of lactation. Only a brief abstract ofthis study was available. The study was reported to be conducted under goodlaboratory practice (GLP) and according to Organisation for Economic Co-operationand Development (OECD) Test Guidelines 422 (Combined Repeated Dose ToxicityStudy with the Reproduction/Developmental Toxicity Screening Test) and 407(Repeated Dose 28-day Oral Toxicity Study in Rodents). The reproductive/developmental toxicity part of this study is described below in section (d).
Males in the two highest dose groups had significantly lower cholesterol andtriglyceride levels, accompanied by increased liver weights and slight hepatocellularhypertrophy. Males from the highest dose group also had marked degenerativecardiomyopathy. Females from the two highest dose groups had moderatelyincreased liver weights with minimal to slight hepatocellular hypertrophy and highincidences of vacuolated hepatocytes. In addition, these animals showedcardiomyopathy. It is not completely clear from the abstract whether these effectswere observed in the females of the general toxicity study or from the reproductive/developmental toxicity study. The NOAEL for general toxicity reported in theabstract was 15 mg/kg bw per day in both sexes (Regnier et al., 2006).
In the International Uniform Chemical Information Database (IUCLID) of theEuropean Commission, an additional three oral short-term studies of toxicity with 2-hydroxyethanediol have been summarized briefly (European Commission, 2000),but the original study reports were not submitted. These summaries have beenprovided by the European chemicals industry, but they have not undergone anyevaluation by the European Commission.
Rabbits (sex and number not specified) were given doses of 2-hydroxyethanediol (No. 1925) at approximately 11, 28 or 56 mg/kg bw by gavagefor an unknown period of time. No rabbits survived after three doses of 56 mg/kgbw, and 3 out of 11 rabbits died after two doses of 11 mg/kg bw. Effects on whiteblood cell counts and liver and kidney function were observed. Body weights weredecreased by about 10%. Necropsy showed fatty liver and kidney plus oedema ofthe lungs (BASF AG, 1967; BASF Corporation, 1992). From this limited description,the NOAEL that can be established for this study was less than 11 mg/kg bw, thelowest dose tested.
Cats (sex and number not specified) were orally administered 10 or 19 dosesof 2-hydroxyethanediol (No. 1925) at approximately 28 mg/kg bw (frequency oftreatment not stated). The administration of the test compound induced vomiting.No decrease in body weight was observed. Blood values and liver function werenormal. After 19 doses of 2-hydroxyethanediol, blood urea was elevated. Therewere no abnormal pathological findings (BASF AG, 1967). From this limiteddescription, the NOAEL in this study was probably 28 mg/kg bw, the only dosetested.
296 SIMPLE ALIPHATIC AND AROMATIC SULFIDES AND THIOLS (addendum)

Guinea-pigs (sex and number not specified) were administered 2-hydroxyethanediol (No. 1925) at approximately 22, 56 or 112 mg/kg bw orally forup to 28 doses (frequency of treatment not stated). At 112 mg/kg bw, all animalsdied overnight. After 19–28 doses of 56 mg/kg bw, there were no clinical signs untilthe last dose, when, shortly before death, animals displayed atonia, difficultybreathing and lateral position. Animals at the lowest dose survived and showed noclinical signs. Minimal weight loss and unspecific changes in blood parameters, liverfunction and blood urea were reported after several doses. There were no abnormalpathological findings (BASF AG, 1967; BASF Corporation, 1992). From this limiteddescription, the NOAEL in this study was probably 22 mg/kg bw, the lowest dosetested.
(c) Genotoxicity
(i) In vitro
Studies of genotoxicity in vitro have been reported for 3 of the 36 flavouringagents evaluated in this group (Nos 1911, 1924 and 1925). The results of thesestudies are summarized in Table 5 and described below. All studies were from thepublic literature and were not performed according to OECD guidelines, except forthe study of Stien (2005).
No evidence of mutagenicity was observed in Ames assays when di-(1-propenyl)-sulfide (No. 1911), docedanethiol (No. 1924) and 2-hydroxyethanethiol(No. 1925) were incubated with Salmonella typhimurium strains TA98, TA100,TA102, TA1535 or TA1537 with or without metabolic activation at concentrationsup to 10 000 μg/plate (Carter & Josephy, 1986; Zeiger et al., 1987; Stien, 2005).
No evidence of induction of chromosomal malsegregation or recombination/mutation was observed when 2-hydroxyethanethiol (No. 1925; up to 560 μg/ml) wasincubated with Saccharomyces cerevisiae D61.M (Albertini, Brunner & Würgler,1993).
In two limited chromosomal aberration assays with 2-hydroxyethanethiol inhuman lymphocytes, an increase in gaps but not in breaks or exchanges wasobserved. The gaps could be attributed to a denaturing effect on the protein moietyof the chromosome, and therefore 2-hydroxyethanethiol was concluded to benegative in these assays (Brøgger, 1975; Brøgger & Waksvik, 1978). In anotherchromosomal aberration assay, 2-hydroxyethanethiol (No. 1925) gave inconclusiveresults in Chinese hamster V79 cells (Speit, Wolf & Vogel, 1980).
2-Hydroxyethanethiol (No. 1925) was negative in a sister chromatidexchange assay with human lymphocytes (Brøgger & Waksvik, 1978), whereasinconclusive results were obtained in a sister chromatid exchange assay withChinese hamster V79 cells (Speit, Wolf & Vogel, 1980).
SIMPLE ALIPHATIC AND AROMATIC SULFIDES AND THIOLS (addendum) 297
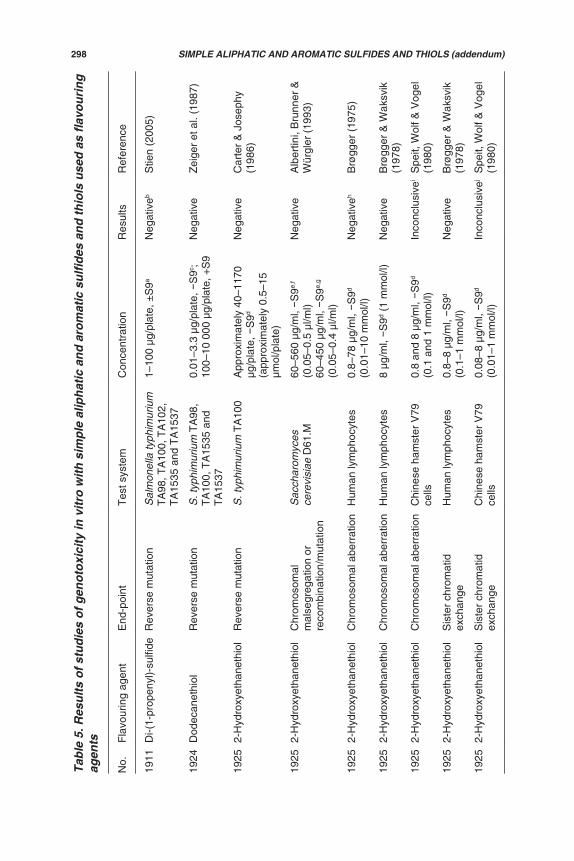
Tabl
e 5.
Res
ults
of s
tudi
es o
f gen
otox
icity
in v
itro
with
sim
ple
alip
hatic
and
aro
mat
ic s
ulfid
es a
nd th
iols
use
d as
flavo
urin
gag
ents
No.
Fla
vour
ing
agen
tE
nd-p
oint
Tes
t sys
tem
Con
cent
ratio
nR
esul
tsR
efer
ence
1911
Di-(
1-pr
open
yl)-
sulfi
deR
ever
se m
utat
ion
Sal
mon
ella
typh
imur
ium
TA
98, T
A10
0, T
A10
2,T
A15
35 a
nd T
A15
37
1–10
0 μg
/pla
te, ±
S9a
Neg
ativ
ebS
tien
(200
5)
1924
Dod
ecan
ethi
olR
ever
se m
utat
ion
S. t
yphi
mur
ium
TA
98,
TA
100,
TA
1535
and
TA
1537
0.01
–3.3
μg/
plat
e,
S9c ;
100–
10 0
00 μ
g/pl
ate,
+S
9N
egat
ive
Zei
ger
et a
l. (1
987)
1925
2-H
ydro
xyet
hane
thio
lR
ever
se m
utat
ion
S. t
yphi
mur
ium
TA
100
App
roxi
mat
ely
40–1
170
μg/p
late
, S
9d
(app
roxi
mat
ely
0.5–
15μm
ol/p
late
)
Neg
ativ
eC
arte
r &
Jos
ephy
(198
6)
1925
2-H
ydro
xyet
hane
thio
lC
hrom
osom
alm
alse
greg
atio
n or
reco
mbi
natio
n/m
utat
ion
Sac
char
omyc
esce
revi
siae
D61
.M60
–560
μg/
ml,
S9e,
f
(0.0
5–0.
5 μl
/ml)
60–4
50 μ
g/m
l, S
9e,g
(0.0
5–0.
4 μl
/ml)
Neg
ativ
eA
lber
tini,
Bru
nner
&W
ürgl
er (
1993
)
1925
2-H
ydro
xyet
hane
thio
lC
hrom
osom
al a
berr
atio
nH
uman
lym
phoc
ytes
0.8–
78 μ
g/m
l, S
9d
(0.0
1–10
mm
ol/l)
Neg
ativ
ehB
røgg
er (
1975
)
1925
2-H
ydro
xyet
hane
thio
lC
hrom
osom
al a
berr
atio
nH
uman
lym
phoc
ytes
8 μg
/ml,
S9d
(1 m
mol
/l)N
egat
ive
Brø
gger
& W
aksv
ik(1
978)
1925
2-H
ydro
xyet
hane
thio
lC
hrom
osom
al a
berr
atio
nC
hine
se h
amst
er V
79ce
lls0.
8 an
d 8
μg/m
l, S
9d
(0.1
and
1 m
mol
/l)In
conc
lusi
vei
Spe
it, W
olf &
Vog
el(1
980)
1925
2-H
ydro
xyet
hane
thio
lS
iste
r ch
rom
atid
exch
ange
Hum
an ly
mph
ocyt
es0.
8–8
μg/m
l, S
9d
(0.1
–1 m
mol
/l)N
egat
ive
Brø
gger
& W
aksv
ik(1
978)
1925
2-H
ydro
xyet
hane
thio
lS
iste
r ch
rom
atid
exch
ange
Chi
nese
ham
ster
V79
cells
0.08
–8 μ
g/m
l, S
9d
(0.0
1–1
mm
ol/l)
Inco
nclu
sive
jS
peit,
Wol
f & V
ogel
(198
0)
298 SIMPLE ALIPHATIC AND AROMATIC SULFIDES AND THIOLS (addendum)

Tabl
e 5
(con
td)
aT
wo
inde
pend
ent e
xper
imen
ts u
sing
the
prei
ncub
atio
n m
etho
d an
d th
e pl
ate
inco
rpor
atio
n m
etho
d, r
espe
ctiv
ely.
bT
oxic
ity w
as o
bser
ved
in a
ll st
rain
s, w
ith a
nd w
ithou
t met
abol
ic a
ctiv
atio
n, a
t the
hig
hest
con
cent
ratio
n te
sted
.c
Tes
t con
cent
ratio
ns w
ere
0.01
–1 μ
g/pl
ate
for
stra
ins
TA
100
and
TA
1535
and
0.0
3–3.
3 μg
/pla
te fo
r st
rain
s T
A98
and
TA
1537
.d
Cal
cula
ted
usin
g th
e m
olec
ular
wei
ght o
f 2-h
ydro
xyet
hane
thio
l = 7
8.13
g/m
ol.
eC
alcu
late
d us
ing
the
dens
ity o
f 2-h
ydro
xyet
hane
thio
l = 1
.117
g/m
l.f
Incu
bate
d fo
r 16
h a
t 28
°C.
gIn
cuba
ted
for
4 h
at 2
8 °C
, fol
low
ed b
y 16
h a
t 4 °
C a
nd a
noth
er 4
h a
t 28
°C.
hIn
crea
ses
in c
hrom
atid
con
stric
tions
and
gap
s w
ere
obse
rved
, as
wel
l as
a ve
ry s
mal
l inc
reas
e in
bre
aks,
but
no
exch
ange
s w
ere
obse
rved
.i
At b
oth
conc
entr
atio
ns, a
n in
crea
se in
chr
omat
id a
berr
atio
ns a
nd a
berr
ant m
etap
hase
s w
as o
bser
ved,
but
the
effe
cts
wer
e no
t dos
e re
late
d.j
At c
once
ntra
tions
from
0.1
mm
ol/l
onw
ards
, the
num
ber
of s
iste
r ch
rom
atid
exc
hang
es p
er c
ell w
as n
early
dou
bled
, but
no
clea
r do
se–r
espo
nse
rela
tions
hip
was
obs
erve
d.
SIMPLE ALIPHATIC AND AROMATIC SULFIDES AND THIOLS (addendum) 299

(ii) Conclusion
The available data for the current evaluation are in line with the conclusionin the previous evaluation of the group of simple aliphatic and aromatic sulfides andthiols that this group is not expected to exhibit any mutagenic or genotoxicproperties.
(d) Developmental/reproductive toxicity
The results of one developmental/reproductive screening test and twoteratogenicity studies with 2-hydroxyethanediol (No. 1925) are described below.
In a combined repeated-dose oral toxicity study and reproductive/developmental toxicity screening test, groups of 10 male and 5 female Sprague-Dawley rats were given 2-hydroxyethanediol (No. 1925) by gavage at doses of 0,15, 50 or 75 mg/kg bw per day for 7 weeks. Groups of 10 female rats were treatedwith the same doses from premating to day 21 of lactation. Only a brief abstract ofthis study was available. The study was reported to be conducted under GLP andaccording to OECD Test Guidelines 422 (Combined Repeated Dose Toxicity Studywith the Reproduction/Developmental Toxicity Screening Test) and 407 (RepeatedDose 28-day Oral Toxicity Study in Rodents). The repeated-dose toxicity part of thisstudy is described above in section (b).
At the two highest dose levels, some pregnant rats (number not specified)were found dead or had to be euthanized on days 19–23 of gestation owing to poorclinical conditions, with no sign of delivery seen at that time. Surviving females inthese groups had a prolonged mean duration of gestation, resulting in higher pupbirth weights (statistical significance not stated). 2-Hydroxyethanediol treatmentwas stopped at the end of pregnancy to allow delivery and was resumed afterwards.At the highest dose, there were high post-implantation losses associated with lownumber of live births; pup survival was decreased (statistical significance notstated). As reported in the abstract, the NOAEL was 15 mg/kg bw per day formaternal toxicity and parturition and 75 mg/kg bw per day for male reproductiveperformance and fertility (Regnier et al., 2006).
Two teratogenicity studies were limitedly reported in IUCLID (EuropeanCommission, 2000).
Five pregnant Sprague-Dawley rats were gavaged with 2-hydroxyethanediol(No. 1925) at 168 mg/kg bw per day on gestation days 12 and 13 (BASF AG, 1965;BASF Corporation, 1992). Three of the treated rats died within 2 days of treatment.Of the two surviving rats, one had severely diminished body weight at the end ofthe study compared with controls. No further details were given.
Six pregnant Sprague-Dawley rats were gavaged with 2-hydroxyethanediol(No. 1925) at 67 mg/kg bw per day on gestation days 12–16 (BASF AG, 1965). Aconcurrent control group received no treatment. Maternal body weights were slightlylower than those of controls. The mean number of fetuses, fetal weight, fetal lengthand the incidence of malformations were similar to those of controls. The resorptionrate (18.7%) was higher than in controls, but 10 out of the 12 observed resorptionswere from one animal.
300 SIMPLE ALIPHATIC AND AROMATIC SULFIDES AND THIOLS (addendum)

(e) Other studies
A few studies were submitted on the supposed beneficial effects of 2-hydroxyethanethiol (No. 1925) on ageing. A review of these studies is, however,beyond the scope of this monograph, which deals with the safety aspects offlavouring agents.
3. REFERENCES
Albertini S, Brunner M, Würgler FE (1993). Analysis of the six additional chemicals for in vitroassays of the European Economic Communities’ EEC Aneuploidy Programme usingSaccharomyces cerevisiae D61.M and the in vitro porcine brain tubulin assembly assay.Environmental and Molecular Mutagenesis, 21:180–192.
BASF AG (1964). Unpublished study (XIII/503), dated 25 February 1964. Department ofToxicology, BASF AG [cited in European Commission, 2000].
BASF AG (1965). Unpublished study (XIV/362), dated 31 December 1965. Department ofToxicology, BASF AG [cited in European Commission, 2000].
BASF AG (1967). Unpublished study (XIV/362), dated 14 February 1967. Department ofToxicology, BASF AG [cited in European Commission, 2000].
BASF Corporation (1992). Initial submission: 2-mercaptoethanol: toxicology report with coverletter dated 052692. Microfiche No. OTS0539597, Document Control No. 88-920003009,27 May 1992 [cited in European Commission, 2000, as TSCATS (Toxic Substance ControlAct Test Submission Database), 1992].
Brøgger A (1975). Is the chromatid gap a folding defect due to protein change? Evidence frommercaptoethanol treatment of human lymphocyte chromosomes. Hereditas, 80:131–136.
Brøgger A, Waksvik H (1978). Further evidence that the chromatid gap is a folding defect.Hereditas, 89:131–132.
British Industrial Biological Research Association (1976). Short-term toxicity of samplesTT171, TT172, TT173, and TT174 in rats. Unpublished report submitted to the Flavor andExtract Manufacturers’ Association, Washington, DC, USA [cited in Annex 1, reference144].
Butterworth KR et al. (1975). Short-term toxicity of dimethyl sulfide in rat. Food and CosmeticsToxicology, 13:15–22 [cited in Annex 1, reference 144].
Carter MH, Josephy PD (1986). Mutagenicity of thionitrites in the Ames test. The biologicalactivity of thiyl free radicals. Biochemical Pharmacology, 35:3847–3851.
Cox GE, Bailey DE, Morgareidge K (1974). 90-day feeding study in rats with compound 14935(2-mercapto-3-butanol). Unpublished report submitted to the Flavor and ExtractManufacturers Association, Washington, DC, USA, by Food and Drug ResearchLaboratories, Inc. [cited in Annex 1, reference 144].
Cox GE, Rucci G, Babish JG (1979). 90-day subacute dietary toxicity study of IFF code No.78-002-2 in Sprague-Dawley rats. Unpublished report submitted to the Flavor and ExtractManufacturers Association, Washington, DC, USA, by Food and Drug ResearchLaboratories, Inc. [cited in Annex 1, reference 144].
Cramer GM, Ford RA, Hall RL (1978). Estimation of toxic hazard—a decision tree approach.Food and Cosmetics Toxicology, 16:255–276.
European Commission (2000). IUCLID dataset: 2-mercaptoethanol. European Commission,European Chemicals Bureau, International Uniform Chemical Information Database, 18February 2000 (http://ecb.jrc.ec.europa.eu/iuclid- datasheet/60242.pdf).
European Flavour and Fragrance Association (2004). European inquiry on volume use.Unpublished report. Submitted to WHO by the International Organization of the FlavorIndustry, Brussels, Belgium.
SIMPLE ALIPHATIC AND AROMATIC SULFIDES AND THIOLS (addendum) 301

Gavin CL, Williams MC, Hallagan JB (2008). 2005 FEMA poundage and technical effectsupdate survey. Washington, DC, USA, Flavor and Extract Manufacturers Association.
International Organization of the Flavor Industry (2009). Interim inquiry on volume of use andadded use levels for flavoring agents to be presented at the JECFA 73rd meeting.Submitted to WHO by the International Organization of the Flavor Industry, Brussels,Belgium.
Japan Flavor and Fragrance Materials Association (2005). Japanese inquiry on volume use.Unpublished report. Submitted to WHO by the International Organization of the FlavorIndustry, Brussels, Belgium.
Morgareidge K (1970). 90-day feeding study in rats with tetrahydrothiophene-3-one (31015).Unpublished report submitted to the Flavor and Extract Manufacturers Association,Washington, DC, USA [cited in Annex 1, reference 144].
Morgareidge K (1971a). 90-day feeding study with 2-keto-3-pentanethiol in rats. Unpublishedreport submitted to the Flavor and Extract Manufacturers Association, Washington, DC,USA [cited in Annex 1, reference 144].
Morgareidge K (1971b). 90-day feeding study with 2-naphthalenethiol in rats. Unpublishedreport submitted to the Flavor and Extract Manufacturers Association, Washington, DC,USA [cited in Annex 1, reference 144].
Morgareidge K, Oser BL (1970a). 90-day feeding studies in rats with cyclopentanethiol.Unpublished report submitted to the Flavor and Extract Manufacturers Association,Washington, DC, USA. Submitted to WHO by the International Organization of the FlavorIndustry, Brussels, Belgium [cited in Annex 1, reference 144].
Morgareidge K, Oser BL (1970b). 90-day feeding studies in rats with dipropyltrisulfide (30204).Unpublished report submitted to the Flavor and Extract Manufacturers Association,Washington, DC, USA [cited in Annex 1, reference 144].
Morgareidge K, Bailey DE, Cox GE (1974). 90-day feeding study in rats with compound 14966.Unpublished report submitted to the Flavor and Extract Manufacturers Association,Washington, DC, USA [cited in Annex 1, reference 144].
Nijssen LM, van Ingen-Visscher CA, Donders JJM, eds (2008). VCF (Volatile Compounds inFood) database. Version 10.1.1. Zeist, Netherlands, TNO Quality of Life (http://www.vcf-online.nl/VcfHome.cfm, accessed July 2008).
Posternak JM, Linder A, Vodoz CA (1969). Summaries of toxicological data. Toxicologicaltests on flavoring matters. Food and Cosmetics Toxicology, 7:405–407 [cited in Annex I,reference 144].
Pugaeva VP et al. (1971). [Hygienic standardization of beta-hydroxyethylmercaptan in the airof industrial establishments.] Gigiena truda i professional'nye zabolevaniia, 15:56–58 (inRussian) [cited in European Commission, 2000, as RTECS (Registry of Toxic Effects ofChemical Substances) update 9412].
Regnier J et al. (2006). A combined repeated dose oral toxicity and reproductive/developmental toxicity screening study of 2-mercaptoethanol in rats. Abstract No. 940 fromthe 45th Annual Meeting of the Society of Toxicology, 5–9 March 2006, San Diego, CA,USA.
Sax NI et al. (1979). Dangerous properties of industrial materials, 5th ed. New York, NY, USA,Van Nostrand Reinhold, p. 792 [cited in European Commission, 2000].
Shellenberger TE (1970). Subacute toxicity evaluation of ethyl thioacetate in rats. Final report.Unpublished report GSRI Project NC-373. Submitted to the Flavor and ExtractManufacturers Association, Washington, DC, USA, by the Gulf South Research Institute[cited in Annex I, reference 144].
Smyth HF, Carpenter CP (1944). The place of the range-finding test in the industrial toxicologylaboratory. Journal of Industrial Hygiene and Toxicology, 26:269–273.
Speit G, Wolf M, Vogel W (1980). The effect of sulfhydryl compounds on sister-chromatidexchanges. Mutation Research, 78:267–272.
302 SIMPLE ALIPHATIC AND AROMATIC SULFIDES AND THIOLS (addendum)

Stien J (2005). Mutagenicity study of di-(1-propenyl)-sulfid [sic] in the Salmonellatyphimurium reverse mutation assay (in vitro). Unpublished report No. 18432/11/04 fromLaboratory of Pharmacology and Toxicology KG, Hamburg, Germany. Submitted to WHOby the International Organization of the Flavor Industry, Brussels, Belgium.
White K, Bruckner JV, Guess WL (1973). Toxicological studies of 2-mercaptoethanol. Journalof Pharmaceutical Science, 62:237–241.
Zeiger E et al. (1987). Salmonella mutagenicity tests: III. Results from the testing of 255chemicals. Environmental Mutagenesis, 9(Suppl. 9):1–110.
SIMPLE ALIPHATIC AND AROMATIC SULFIDES AND THIOLS (addendum) 303

CONTAMINANTS

CADMIUM (addendum)
First draft prepared by
Dr U. Mueller,1 Dr A. Agudo,2 Dr A. Åkesson,3* Dr C. Carrington,4
Ms S.K. Egan,4 Dr M.V. Rao5 and Dr J. Schlatter6
1 Food Standards Australia New Zealand, Canberra, Australia2 Catalan Institute of Oncology, L’Hospitalet de Llobregat, Spain
3 Nutritional Epidemiology Unit, Institute of Environmental Medicine,Karolinska Institutet, Stockholm, Sweden
4 Center for Food Safety and Applied Nutrition, Food and Drug Administration,College Park, Maryland, United States of America (USA)
5 Department of the President’s Affairs, Al Ain, United Arab Emirates6 Federal Office of Public Health, Zurich, Switzerland
1. Explanation.............................................................................2. Biological data........................................................................
2.1 Biochemical aspects.........................................................2.1.1 Absorption...............................................................2.1.2 Elimination...............................................................
2.2 Toxicological studies........................................................2.2.1 Acute toxicity...........................................................2.2.2 Long-term studies of toxicity and
carcinogenicity........................................................2.2.3 Developmental toxicity............................................2.2.4 Genotoxicity............................................................
2.3 Observations in humans...................................................2.3.1 Absorption...............................................................2.3.2 Renal effects...........................................................2.3.3 Osteoporosis and fractures.....................................2.3.4 Cardiovascular disease...........................................2.3.5 Cancer.....................................................................2.3.6 Reproductive toxicity...............................................2.3.7 Mortality...................................................................
3. Analytical methods..................................................................3.1 Chemistry.........................................................................3.2 Description of analytical methods.....................................
3.2.1 Determination of cadmium in foods.........................3.2.2 Determination of cadmium in blood and biological
materials..................................................................4. Sampling protocols.................................................................5. Prevention and control............................................................6. Levels and patterns of contamination in food
commodities...........................................................................6.1 National and regional occurrence data............................
307308308308309310310
310311312312312313315319319321322324324325327
331334334
335335
* Did not participate in the meeting or in the discussions on the dose–response and riskassessments.
- 305 -

6.1.1 Australia..................................................................6.1.2 Brazil.......................................................................6.1.3 Canada....................................................................6.1.4 Chile........................................................................6.1.5 China.......................................................................6.1.6 Europe.....................................................................6.1.7 France.....................................................................6.1.8 Ghana.....................................................................6.1.9 Japan......................................................................6.1.10 Singapore..............................................................6.1.11 USA.......................................................................6.1.12 Viet Nam...............................................................6.1.13 Food industry........................................................
6.2 Cadmium occurrence data by food category...................7. Food consumption and dietary exposure estimates...............
7.1 National and regional estimates of dietary exposure.......7.1.1 Australia..................................................................7.1.2 China.......................................................................7.1.3 Europe.....................................................................7.1.4 USA.........................................................................7.1.5 Estimates of dietary exposure from the published
literature..................................................................7.1.6 Summary of national estimates of dietary exposure
to cadmium..............................................................7.2 Regional estimates of dietary exposure...........................
8. Dose–response analysis and estimation of carcinogenic/toxicrisk..........................................................................................8.1 Biomarker studies.............................................................8.2 Pivotal data from human clinical/epidemiological
studies..............................................................................8.3 General modelling considerations....................................
8.3.1 Data check..............................................................8.3.2 Selection of mathematical model............................8.3.3 Use of the bioexponential model in the
evaluation................................................................8.3.4 Toxicodynamic variability........................................8.3.5 Toxicokinetic modelling...........................................
8.4 Estimating the relationship between urinary cadmiumexcretion and dietary cadmium exposure.........................
9. Comments..............................................................................9.1 Absorption, distribution, metabolism and excretion..........9.2 Toxicological data.............................................................9.3 Observations in humans...................................................9.4 Analytical methods...........................................................9.5 Sampling protocols...........................................................9.6 Prevention and control.....................................................9.7 Levels and patterns of contamination in food
commodities.....................................................................9.8 Food consumption and dietary exposure
assessment......................................................................9.9 Dose–response analysis..................................................
9.9.1 Biomarker meta-analysis.........................................
337337345345345346346347347347347348348348350350350351352355
356
357358
358358
359359359362
362363364
366366366367367370370370
370
371372372
306 CADMIUM (addendum)

9.9.2 Toxicodynamic variability........................................9.9.3 Toxicokinetic modelling...........................................9.9.4 Estimating the relationship between urinary
cadmium excretion and dietary cadmium exposure.................................................................
10. Evaluation.............................................................................11. References...........................................................................
1. EXPLANATION
The presence of cadmium (Cd) in food results from contamination of soil andwater both from natural sources and from anthropogenic activities. Crops differ withrespect to absorption of cadmium, and cadmium is known to accumulate in thetissues (particularly the liver and kidney) of terrestrial animals and in aquatic animals(particularly detritus feeders, such as molluscs).
Cadmium was evaluated by the Committee at its sixteenth, thirty-third, forty-first, fifty-fifth, sixty-first and sixty-fourth meetings (Annex 1, references 30, 83,107, 149, 166 and 176). At the thirty-third meeting, a provisional tolerable weeklyintake (PTWI) of 400–500 μg or 7 μg/kg body weight (bw) (assuming a body weightof 60 kg) was derived from a critical concentration of cadmium in the kidneys(200 mg/kg tissue), which caused an increase in 2-microglobulin ( 2MG)concentration in urine, and a toxicokinetic model that related cadmium bio-accumulation in the kidneys to dietary exposure. In 1992, Environmental HealthCriteria 134 (IPCS, 1992a) provided a detailed description of the model on whichthe PTWI was based and its various assumptions. At the forty-first meeting, theCommittee concluded that the model estimates used to derive the PTWI wereconservative, but it did not include a safety factor and reiterated that there was onlya small margin of safety between exposure via the diet and the exposure that wouldresult in deleterious effects.
At its fifty-fifth meeting, the Committee concluded that the prevalences ofrenal tubular dysfunction that correspond to various dietary exposures to cadmiumwere still appropriate for risk assessment and that the risk of renal tubulardysfunction in the general population would be negligible below a urinary cadmiumexcretion of 2.5 μg/g creatinine. The estimate of 2.5 μg/g creatinine was based onoccupational data and involved a number of assumptions about creatinineexcretion, cadmium absorption and bioavailability and the ratio of dietary exposureto cadmium to excreted cadmium.
At the sixty-first meeting, the Committee considered studies includingepidemiological investigations of environmental exposure to cadmium, such as theCadmiBel studies from Belgium and a series of Japanese reports. The Committeereaffirmed that renal tubular dysfunction remained the critical health outcome withregard to the toxicity of cadmium and that an excess prevalence of renal tubulardysfunction would not be expected to occur if the urinary cadmium concentrationdid not exceed 2.5 μg/g creatinine. The Committee concluded that the new data didnot provide a sufficient basis for revising the PTWI and therefore maintained thePTWI of 7 μg/kg bw.
373373
373373374
CADMIUM (addendum) 307

At its sixty-fourth meeting, the Committee evaluated the impact of differentmaximum levels (MLs) for cadmium in commodities that contribute to dietaryexposure. The dietary assessment took into account the potential impact of differentMLs on the distribution of concentrations of cadmium in each commodity and thedietary exposures to cadmium from each individual commodity. The Committeeconcluded that a change in the proposed Codex Alimentarius Commission MLswould result in a change of only 1–6% in the dietary exposure to cadmium andtherefore was of no significance in terms of risk to human health, considering thatthe total dietary exposure to cadmium was only 40–60% of the PTWI of 7 μg/kg bw.
At the request of the Codex Committee on Contaminants in Food, theCommittee considered new information that had become available since cadmiumwas last evaluated, together with the data it had previously reviewed. TheCommittee also considered new information on cadmium levels in food and dietaryexposure. As it is now acknowledged that renal dysfunction is the most sensitivetoxicological end-point arising from cadmium exposure, most of the new datainvolved the use of urinary biomarkers to estimate risk based on statisticalmodelling. The Committee considered whether these recent modelled riskestimates for cadmium would support the current PTWI.
2. BIOLOGICAL DATA
A number of detailed evaluations have reviewed data on the kinetics andtoxicity of cadmium (IPCS, 1992a; ATSDR, 2008; EFSA, 2009a). Overall, theabsorption or bioavailability of cadmium from the gastrointestinal tract is generallyconsidered to be slightly lower (0.5–3.0%) in experimental animals (mice, rats andmonkeys) than in humans (1–10%). Previous reviews have described how thecomposition of the diet, including fibre, protein (sunflower seeds) and carbohydrates(rice), can also affect the bioavailability of cadmium (Annex 1, references 149 and166). Following absorption, cadmium binds to metallothionein, but this binding canbe overloaded at relatively moderate doses. In adult experimental animals,cadmium concentrations in liver and kidneys are comparable after short-termexposure, but the kidney concentration generally exceeds the liver concentrationfollowing prolonged exposure, except at very high exposures. Cadmium is virtuallyabsent at birth but accumulates with time, especially in the liver and kidneys; renalconcentration occurs mainly during the early years of life, and 50–75% of the totalbody burden is found in these two organs at autopsy. An additional 20% is found inmuscle, whereas the quantity of cadmium in bone is small. In human cadavers, nostatistically significant relationship has been observed linking bone cadmiumcontent with demineralization (Knuuttila et al., 1982).
2.1 Biochemical aspects
2.1.1 Absorption
Groups of 12 male ICR mice were fed a diet with sufficient iron (120 mg/kg)or insufficient iron (2–6 mg/kg) for 4 weeks. Tissue iron concentrations wereanalysed in half the animals at the end of the study, whereas tissue cadmium
308 CADMIUM (addendum)

concentrations were analysed in the remaining mice 24 h after a single oral doseof 109CdCl2 at 100 μg/kg bw. The expression of divalent metal transporter 1(DMT1) and metal transporter protein 1 (MTP1) genes was also analysed in varioustissues. Iron stores were shown to be depleted in mice on the iron-deficient diet.The majority of the tissues analysed from the iron-deficient mice containedsignificantly higher (P < 0.05) concentrations of cadmium compared with the tissuesfrom the iron-sufficient mice. In particular, the duodenums of the iron-deficient micecontained approximately 3-fold more cadmium than those of the iron-sufficient mice.The body burden of cadmium was also approximately 3-fold higher in iron-deficientthan in iron-sufficient mice. The DMT1 and MTP1 genes were expressed in all ofthe tissues analysed in both groups of mice. However, in the iron-deficient mice,there was a 65- and 8-fold upregulation of the DMT1 and MTP1 genes, respectively,in the duodenum. These results indicate that iron deficiency increases the uptakeof cadmium from the digestive tract, which appears to be associated with theincreased expression of DMT1 and MTP1 in the duodenum (Kim et al., 2007).
Reeves & Chaney (2008) reviewed the effect of marginal deficiencies of zinc,iron and calcium on the gastrointestinal absorption of cadmium in rats. Absorptionand retention of cadmium (present at 0.25–0.45 mg/kg) from diets containingsuboptimal concentrations of zinc, iron and calcium were increased up to 10-foldfollowing repeated dosing.
2.1.2 Elimination
From previously evaluated reports, the retention of cadmium in varioustissues is variable, and its release appears to be multiphasic. The apparent half-lifeestimates range between 200 and 700 days for mice and rats and up to 2 years inthe squirrel monkey. In humans, the reported half-life of cadmium in kidneys rangesfrom 10 to 33 years, and in liver, from 4 to 19 years.
Recently, Amzal et al. (2009) estimated the apparent half-life of kidneycadmium in 680 Swedish women aged between 56 and 70 years who had neversmoked to be lognormally distributed, with a mean of 11.6 years (95% confidenceinterval [CI] 10.1–14.7) and a standard deviation of 3.0 years. The half-life ofcadmium in kidneys was calculated using toxicokinetic modelling based on a one-compartment model (IPCS, 1992a). By assuming that cadmium concentration inurine was proportional to the cadmium concentration in the kidney cortex, thatgastrointestinal absorption among females ranged between 1% and 10% and thatapproximately one third of the absorbed fraction was transported to the kidney, themodel accurately predicted the observed level of cadmium in the urine except at thelowest concentrations (<0.1 μg/g creatinine).
The Amzal et al. (2009) study was the first to investigate, on a populationlevel, variability in cadmium kinetics using paired individual data on dietary intakeand urinary excretion. A determination of intervariability in a population isconsidered important in risk assessment because it overcomes the need to useuncertainty or safety factors to protect a portion of the population. Of particular valuein this study was the availability of data matching dietary exposure with urinarycadmium levels on three separate occasions over a 20-year period (i.e. 1987, 1997
CADMIUM (addendum) 309

and 2007). The overall average daily dietary exposure from the three measurementswas 14 μg (0.2 μg/kg bw; range 0.1–0.4 μg/kg bw) after an adjustment for a totaldaily energy intake of 1700 kcal. The mean urinary cadmium level was 0.34 μg/gcreatinine (median 0.31 μg/g; range 0.09–1.23 μg/g).
2.2 Toxicological studies
2.2.1 Acute toxicity
Oral median lethal doses (LD50 values) for experimental animals (mainlyrodents) range from approximately 100 to 300 mg/kg bw and are dependent on theform of cadmium administered (Annex 1, reference 166).
2.2.2 Long-term studies of toxicity and carcinogenicity
The kidney is the critical organ in humans and other mammals exposed forlong periods to the relatively small amounts of cadmium that might occur in foodsand feed, respectively. Many studies in experimental animals have demonstratedan association between morphological and/or functional changes in the kidney andthe renal concentration of cadmium. In most of these studies, cadmium was givenparenterally rather than in food or water. The many studies of this type performedbefore 1990 were reported in detail and tabulated by IPCS (1992a) and are onlysummarized here. Although a variety of toxicological end-points have beenobserved in experimental animals (reproductive toxicity, neurotoxicity, carcino-genicity), those of relevance to humans are the renal effects that manifest after low-level, long-term exposure to cadmium and accumulation of cadmium to a criticalconcentration in the kidney (Annex 1, reference 166).
(a) Renal effects
Long-term exposure to cadmium eventually results in a variety of renalchanges involving damage to proximal tubule epithelial cells, degeneration andapoptosis. Morphological changes observed include atrophy, interstitial fibrosis,glomerular sclerosis and focal necrosis. Earlier indications usually associated withrenal damage include low molecular weight proteinuria, glucosuria and amino-aciduria. The results of relevant experimental studies are summarized in Table 1.In general, although some variability exists, renal effects in laboratory animalsare associated with kidney concentrations of cadmium of between 200and 300 μg/g, resulting from long-term exposures of, on average, between 1 and10 mg/kg bw per day.
(b) Carcinogenicity
Studies in experimental animals treated by injection or inhalation haveprovided considerable evidence that cadmium is carcinogenic. In rats, cadmiumcauses a variety of tumours, including malignant tumours at the site of injection andin the lungs after inhalation. Oral intake is associated with proliferative lesions ofthe ventral lobe of the prostate gland in rats fed diets that are adequate in zinc,whereas deficiency in zinc in the diet appears to inhibit the tumorigenic effect of
310 CADMIUM (addendum)

cadmium. The relevance of these studies to carcinogenesis in the human prostategland is questionable because of anatomical differences between the prostate glandin humans and that in rodents.
2.2.3 Developmental toxicity
Groups of 7–9 pregnant Wistar rats were given drinking-water containingcadmium chloride (10 mg/l) from day 0 to day 21 of gestation. A control groupreceived deionized water. At the end of the dosing period, concentrations ofcadmium and lead were measured in placenta, fetal brain, fetal blood and maternalblood. Metallothionein was analysed in placenta and fetal brain. The average fetalweight of the cadmium-treated group was approximately 20% lower than that of thecontrol group (P < 0.05). The average dam weight of the cadmium-treated groupwas approximately 14% lower than that of the control group, whereas the numberof fetuses per dam was slightly lower (10 versus 13, respectively); neither differencewas statistically significant. Fetal brain weight and placenta weight were similarbetween control and treated groups. Significantly elevated (P < 0.05) concentrationsof cadmium were detected in dam blood, fetal blood, placenta and fetal brain(approximately 13-, 2.5-, 17- and 3-fold higher than the controls, respectively).Metallothionein concentrations in placenta, but not in brain, in the cadmium-treatedgroup were significantly higher (P < 0.05) than those of the controls (4.39 μg/gversus 2.96 μg/g, respectively). Statistical analysis indicated a significant (P =0.017) linear relationship between metallothionein and cadmium concentrations in
Table 1. NOAELs and LOAELs for renal effects of cadmium chlorideadministered in drinking-water
Species Strain Sex Effect NOAEL(mg/kg bw
per day)
LOAEL(mg/kg bw
per day)
Rabbit New Zealand/Flemish Giant
Male Tubular necrosisInterstitial necrosis at200 days
ND 15
Rat Sprague-Dawley Male andfemale
Cloudy swelling oftubular epithelium at92 weeks (males)and 84 weeks(females)
0.8 1.5
Wistar Male Increased urinarymetallothionein; notubular dysfunction
2.6 ND
Sprague-Dawley Female Albuminuria ND 13
Monkey Rhesus Male Tubular dysfunction 0.4 4.0
LOAEL, lowest-observed-adverse-effect level; ND, not determined; NOAEL, no-observed-adverse-effect level
Source: Adapted from Annex 1, reference 150
CADMIUM (addendum) 311
the placenta. Immunohistochemistry indicated a normal appearance of the placentain the cadmium-treated group (Benitez et al., 2009).
2.2.4 Genotoxicity
Although cadmium is not a redox-active metal and therefore cannot binddirectly to deoxyribonucleic acid (DNA), it has been shown to indirectly induceoxidative stress and thereby compromise the integrity of the genome. In addition toindirect DNA damage, cadmium also inhibits the mechanism necessary for DNArepair, although its precise mode of action has not been elucidated (reviewed inGiaginis, Gatzidou & Theocharis, 2006). Through this inhibition process, cadmiumis able to enhance the mutagenicity induced by other DNA-damaging agents.
(a) In vitro
The excision repair of bulky DNA adducts induced by benzo(a)pyrenediolepoxide and of ultraviolet C–induced photolesions in two human cell lines wasinhibited by non-cytotoxic concentrations of cadmium chloride or particulatecadmium oxide. Inhibition was associated with the dose-dependent uptake ofCd2+ into the nucleus. The mechanism of inhibition appeared to be via the disruptionof the assembly and disassembly of nucleotide excision repair proteins (Schwerdtleet al., 2010).
(b) In vivo
In a micronucleus assay, cadmium chloride (15 mg/kg bw) in distilled waterwas administered to male Wistar rats (four per group) as a single dose or a dailygavage dose for 60 days. Negative and positive control groups received isotonicsaline and mitomycin C at 2 mg/kg bw, respectively. Bone marrow and peripheralblood were sampled from the single- and repeated-dose groups, respectively, theday after the last dose. In the repeated-dose group, there was a significant increasein micronuclei in peripheral blood (5.5 versus 2.5 per 2000 polychromaticerythrocytes in the negative control; P < 0.01). A similar magnitude of increaseoccurred in bone marrow from the single-dose group (4.25 versus 2.25 per 2000polychromatic erythrocytes in the negative control; P < 0.001), concomitant withcytotoxicity. These increases were approximately 4- to 5-fold lower than those ofthe positive control group. Blood cadmium levels were significantly higher (P <0.001) in the treated groups relative to the control (approximately 2-fold higher)(Çelik et al., 2009).
2.3 Observations in humans
2.3.1 Absorption
Based on studies reviewed previously by the Committee, the gastrointestinalabsorption of cadmium is influenced by diet and nutritional status, with iron statusbeing particularly important. On average, a few per cent of the total oral exposureto cadmium is absorbed, but individual values range from less than 1% up to 5% inmales and 10% in females. For women with a low iron status, gastrointestinalabsorption estimates of up to 10% seem to be in concordance with toxicokineticmodelling of long-term dietary exposures and observed urinary cadmium levels
312 CADMIUM (addendum)

(Amzal et al., 2009). A recent study by Kippler et al. (2007) appears to confirm theimportant influence of iron status on cadmium absorption in women. They found thatamong 890 pregnant Bangladeshi women, urinary cadmium levels were higher forthose with low serum ferritin and adequate plasma zinc than for those with adequateiron and zinc status (P = 0.03).
The cadmium content in the kidneys of 109 living donors (aged 24–70 years;median 51 years) in Sweden was determined from kidney biopsies. The averagekidney cadmium concentration was 15 μg/g wet weight (median 12.9 μg/g wetweight). The concentrations of cadmium in the kidneys of non-smokers were similarto those observed in the 1970s, suggesting that exposure via the diet had changedlittle over the previous 40 years. Multiple linear regression analysis revealed thatthe kidney cadmium concentration increased by 3.9 μg/g (P < 0.001) for each 10-year increase in age and by 3.7 μg/g (P < 0.001) for each 10 pack-years of smoking.The cadmium concentrations increased by 4.5 μg/g (P = 0.03) for women with lowiron stores (serum ferritin below 30 μg/l) and by 1.3 μg/g (P = 0.03) for a 10 kgreduction in body weight, suggesting that a low iron status is at least as importantas 10 pack-years of smoking or a 10-year increase in age and much more importantthan a 10 kg reduction in body weight for cadmium accumulation in the kidney(Barregård et al., 2010).
2.3.2 Renal effects
Although there is good evidence to indicate a relationship between theurinary excretion of cadmium following renal damage and various renal biomarkers(e.g. 2MG, retinol binding protein [RBP], 1-microglobulin [ 1MG] and N-acetyl- -D-glucosaminidase), especially from occupational exposure, the health significanceof these nonspecific biomarkers in relation to renal damage in the general populationremains uncertain. Assuming that the associations between the excretion of renalbiomarkers and cadmium exposure observed in population-based studies reflect acausal relationship, then these associations imply potentially adverse effects,rendering the kidneys more susceptible to other stressors. However, these effectsmight also reflect only an early renal response to cadmium, which may be purelyadaptive or reversible in nature. Another explanation is that the observedassociation between low molecular weight proteins and cadmium in urine mightsimply be a result of a co-excretion of markers of exposure and effect.
Several studies monitoring populations following a reduction in cadmiumexposure have attempted to address the question of the reversibility of early renalchanges. A modest increase in urinary excretion of 2MG or RBP (Table 2) in therange of 300–1000 μg/g creatinine, as found at the early stage, is unlikely tocompromise renal function. Such a small increase is usually reversible afterindustrial cadmium exposure has ceased. Low molecular weight proteinuria in itselfdoes not appear to give rise to any subjective symptoms or objective disease andis, in its early stage, not accompanied by any histological changes. By contrast,when the urinary excretion of these proteins is increased by more than an order ofmagnitude (10 000 μg/g creatinine), tubular dysfunction caused by cadmiumbecomes irreversible and may be associated with a lower glomerular filtration rate(GFR) and an accelerated decline of the GFR with ageing.
CADMIUM (addendum) 313

Table 2. Interpretation of elevated urinary 2MG and RBP concentrationsinduced by occupational or environmental exposure to cadmium
2MG or RBP concentration inurine (μg/g creatinine)
Significance
<300 Normal value
300–1000 Incipient cadmium tubulopathy (possibility of some reversalafter removal of exposure if urinary cadmium is not too high,i.e. below 20 μg/g creatinine)
>1000–10 000 Irreversible tubular proteinuria that may accelerate thedecline of GFR with age. At this stage, GFR is normal orslightly impaired.
>10 000 Overt cadmium nephropathy usually associated with adecreased GFR.
Source: Adapted from Bernard (2008)
In a large cross-sectional study representative of adults in the USA (NationalHealth and Nutrition Examination Survey [NHANES], n = 14 778), both cadmiumand lead concentrations in blood were assessed in relation to chronic kidneydisease (i.e. urinary albumin excretion and an estimate of GFR). Increased bloodcadmium and lead levels were strong independent risk factors for the prevalenceof albuminuria, reduced GFR and both outcomes together. The geometric meancadmium and lead concentrations in blood were 0.41 μg/l and 16 μg/l, respectively.After adjustment for survey year, sociodemographic factors, chronic kidney diseaserisk factors and blood lead concentration, the odds ratios (ORs) for albuminuria( 30 mg/g creatinine), reduced GFR (<60 ml/min per 1.73 m2) and both albuminuriaand reduced GFR were 1.92 (95% CI 1.53–2.43), 1.32 (95% CI 1.04–1.68) and 2.91(95% CI 1.76–4.81), respectively, comparing the highest with the lowest bloodcadmium quartiles. The ORs comparing participants in the highest with the lowestquartiles of both cadmium and lead concentrations were 2.34 (95% CI 1.72–3.18)for albuminuria, 1.98 (95% CI 1.27–3.10) for reduced GFR and 4.10 (95% CI 1.58–10.65) for both outcomes. Among the subgroup of persons who reported neverhaving smoked, the OR for albuminuria was 1.43 (95% CI 1.12–1.84), comparingthe 75th percentile with the 25th percentile, but was not significant for reduced GFR.The major advantages with the present study were that the kidney effects representclinically defined end-points and that for albuminuria, the exposure and effectsmarkers were not assessed in the same medium (i.e. cadmium in blood versusalbumin in urine). Thus, a possible co-excretion of cadmium and proteins is of noconcern. The main limitation with the study is its cross-sectional design. As the effectmarkers used in the present study are related to glomerular damage only, the resultsmay be of greater concern. According to the authors, their analysis mayunderestimate the consequences of the exposure due to the known limitations ofalbuminuria and creatinine-based GFR as markers of kidney damage, and the ORobserved in models with both outcomes may reflect, in part, improved specificity inoutcome assessment (Navas-Acien et al., 2009).
314 CADMIUM (addendum)

2.3.3 Osteoporosis and fractures
It has been established that prolonged exposure to cadmium affects themetabolism of calcium, leading to osteomalacia subsequent to proximal tubulardysfunction in the damaged kidneys; in the most severe cases, patients developitai-itai disease, with osteomalacia as well as osteoporosis. A possible link betweenosteoporosis and exposure to cadmium at concentrations considerably lower thanthose found in itai-itai disease has been evaluated starting in 1999.
Except for fracture incidence, considered the most adverse end-point withregard to bone, reduced bone mineral density is frequently used as a biomarker ofan adverse effect on bone. Osteoporosis is defined as a t-score below 2.5 (i.e. 2.5standard deviations below the mean bone mineral density for young adults) (WHO,1994). A z-score below –1 is sometimes used to define low bone mineral density(i.e. 1 standard deviation below a sex- and age-standardized mean bone mineraldensity) (Kanis et al., 1997). Based on a meta-analysis, a 1 standard deviationreduction in bone mineral density was reported to result in a relative risk (RR) of 1.5(95% CI 1.4–1.6) for a fracture at any site. However, a 1 standard deviationreduction in spinal bone density was reported to result in an RR of 2.3 (95% CI 1.9–2.8) for vertebral fractures, and for hip bone density, another measurement forpredicting vertebral fractures, the RR was 2.6 (95% CI 2.0–3.5) (Marshall, Johnell& Wedel, 1996).
Several epidemiological studies have reported on the association betweencadmium and bone mineral density. So far, two studies have considered fractureincidence, whereas the other studies have included markers of bone metabolism.
In the OSCAR (Osteoporosis—Cadmium as a Risk Factor) study, both bonemineral density and risk of fractures were assessed in relation to urinary and bloodcadmium levels. The OSCAR study involved all people aged 16–80 years who hadlived for at least 5 years during the period 1910–1992 in the proximity of a nickel–cadmium battery plant in southern Sweden. An additional group of age- and sex-matched people was randomly selected from a general medical practice register ina nearby area and was included in this “environmentally exposed” group. A groupof workers at the battery plant was also enrolled. The overall participation rate was60%, resulting in a total sample size of 1021. The mean (10th–90th percentiles)urinary concentration of cadmium was 0.82 (0.18–1.8) mg/g creatinine in men and0.66 (0.21–1.3) mg/g creatinine in women. Bone mineral density was measured ata distal site on an individual’s non-dominant forearm while in the supine position.The degree of osteoporosis was expressed as an individual’s z-score. The risk ofthe z-score being less than 1 was assessed in relation to both urinary cadmiumand blood cadmium concentrations. Inverse relationships were found betweencadmium and both tubular proteinuria and bone mineral density. It was particularlyapparent in people over 60 years of age. There was also a dose–responserelationship between urinary cadmium concentration and z-score being less than
1. The ORs for men were 2.2 (95% CI 1.0–4.8) for the group having a urinarycadmium concentration of 0.5–3 nmol/mmol creatinine and 5.3 (2.0–14) for thegroup with the highest urinary cadmium concentrations ( 3 nmol/mmol creatinine)compared with the group with the lowest urinary cadmium concentrations
CADMIUM (addendum) 315

(<0.5 nmol/mmol creatinine). For women, the OR was 1.8 (95% CI 0.65–5.3) in thegroup with urinary cadmium concentrations of 0.5–3 nmol/mmol creatinine (Alfvénet al., 2000). For the analysis with blood cadmium levels, in a multiple linearregression, there was a negative association between blood cadmiumconcentration and bone mineral density for both men and women in the older agegroup (>60 years of age)—significant for women and close to significant for men.In the whole group (all ages), no significant correlations could be found among bloodcadmium concentration, blood lead concentration and bone mineral density.Smoking did not appear to affect the outcome. The dose–response relationships inrelation to low bone mineral density (z-score less than 1) showed ORs for threeblood cadmium groups for people over 60 years of age, adjusted for weight andsmoking (z-score already includes adjustment for age and sex). Compared with thegroup with blood cadmium concentrations below 5 nmol/l, ORs were 2.0 (95% CI1.1–3.9) for the group with blood cadmium concentrations greater than or equal to5 nmol/l and less than 10 nmol/l (mean 7.2 nmol/l) and 2.0 (95% CI 1.4–5.8) for thegroup with blood cadmium concentrations greater than or equal to 10 nmol/l (mean21 nmol/l) (Alfvén, Järup & Elinder, 2002).
Fracture incidence was also assessed retrospectively in the SwedishOSCAR study. For fractures occurring after the age of 50 years (n = 558, 32 forearmfractures), the fracture hazard ratio, adjusted for sex and other relevant covariates,increased by 18% (95% CI 1.0–38%) per unit urinary cadmium (1 nmol/mmolcreatinine). When subjects were grouped in exposure categories, the hazard ratioreached 3.5 (90% CI 1.1–11) in the group of subjects with urinary cadmiumconcentrations between 2 and 4 nmol/mmol creatinine and 8.8 (90% CI 2.6–30) inthe group of subjects with urinary cadmium concentrations greater than or equal to4 nmol/mmol creatinine. Associations between cadmium and fracture risk wereabsent before the age of 50 (Alfvén et al., 2004).
In Belgium, the exposure to cadmium in relation to fracture incidence wasassessed in populations living close to zinc smelters and in control areas (Staessenet al., 1999). Urinary cadmium excretion in the 225 residents of the six districts nearthe smelters (mean 9.7 nmol/day; 10th–90th percentiles 6.9–24.1 nmol/day) was22.8% higher (P = 0.001) than in the 281 inhabitants of the four low-exposuredistricts (mean 7.9 nmol/day; 10th–90th percentiles 3.4–16.3 nmol/day). Theselevels correspond to approximately 0.58 and 0.83 μg/g creatinine in men andwomen, respectively. The approximate 90th percentile urinary cadmium excretioncorresponds to 2 μg/g creatinine. In their prospective cohort, including 506 subjects,Staessen et al. (1999) observed RRs associated with doubled urinary cadmiumconcentrations of 1.73 (95% CI 1.16–2.57; P = 0.007) for fractures in women and1.60 (95% CI 0.94–2.72; P = 0.08) for height loss in men. Similar risk estimates wereobserved if cadmium concentrations in soil, leek and celery sampled in the relevantdistrict of residence were used as a proxy of cadmium exposure instead of urinarycadmium concentration.
316 CADMIUM (addendum)

More recent Swedish and Belgian data confirmed the adverse effects of low-level cadmium exposure on bone mineral density. The median urinary cadmiumconcentration was 0.67 (5th–95th percentiles 0.31–1.6) μg/g creatinine in theSwedish study, and the median blood cadmium concentration was 0.38 (5th–95thpercentiles 0.16–1.8) μg/l (Åkesson et al., 2006); the median blood cadmiumconcentration was 8 nmol/l (0.90 μg/l) in the Belgian study (Schutte et al., 2008a).Both studies suggest direct effects of cadmium on bone resorption, which seemedto be intensified after menopause. Even in the absence of cadmium-induced renaltubular dysfunction, low-level environmental exposure to cadmium seems tomobilize bone minerals from the skeletal tissue, indicated by increased calciuria andreactive changes in calciotropic hormones. Because cadmium was associated withlower levels of parathyroid hormone in both studies, the cadmium-associatedcalciuria was most likely a result of increased bone resorption, rather thandecreased tubular reabsorption. If the calciuria was due to kidney damage, anincrease in parathyroid hormone levels would then be a more likely scenario. Anassessment of the benchmark dose (BMD) of cadmium in relation to bone mineraldensity was recently performed in the study on Swedish women mentioned above(Åkesson et al., 2006).
A large study in the USA using NHANES data reported an increased risk ofosteoporosis in the hip in 3207 women aged 50 years and older; the ORs were 1.43(95% CI 1.03–2.0) at urinary cadmium levels between 0.50 and 1.0 μg/g creatinineand 1.40 (95% CI 0.97–2.03) for urinary cadmium concentrations greater than1.0 μg/g creatinine compared with the reference (<0.50 μg/g creatinine) (Gallagheret al., 2008). Only 15% of the women had urinary cadmium concentrations above1.0 μg/g creatinine. Osteoporosis was defined according to t-score less than 2.5(in this case, <0.56 g/cm2), and this study was the first to assess bone mineraldensity at a site on the skeleton with high relevance to a fracture with great publichealth concern (i.e. hip fracture). This multivariate-adjusted model includedadjustment for age, race, income, ever-smoking and underweight. Dose–responserelationships were reported between the risk of osteoporosis and urinary cadmiumas a continuous variable expressed in microgram per gram creatinine (OR 1.15;95% CI 1.00–1.33).
In a recent publication, an association between urinary cadmium levels andbone mineral density was confirmed in occupationally exposed individuals (Nawrotet al., 2010). In 83 male (ex-)workers (mean age 45 years; range 24–64 years) ofa radiator factory using cadmium-containing solder, bone mineral density in distalforearm, hip and lumbar spine (by dual-energy photon absorptiometry) and urinarycalcium excretion were assessed. The geometric mean urinary cadmium concen-tration was 1.02 μg/g creatinine (5th–95th percentiles 0.17–5.51 μg/g creatinine).Bone mineral density was negatively correlated with urinary excretion of cadmium:the partial correlation coefficients (r) adjusted for age, body mass index (BMI) andcurrent smoking were 0.30 (P = 0.008) for bone mineral density in the forearm,
0.27 (P = 0.017) in the hip and 0.17 (P = 0.15) in the spine. Urinary calcium levelscorrelated positively (r = 0.23; P = 0.044) with the urinary cadmium excretion.Adjusted for the same covariates, the risk of osteoporosis (defined as a t-scorebelow 2.5 in at least one measured bone site) increased dose dependently.
CADMIUM (addendum) 317

Compared with the lowest tertile of urinary cadmium concentration, the risks were4.8- and 9.9-fold higher in the middle and highest tertiles, respectively. Only four(5%) men had evidence of renal tubular dysfunction ( 2MG concentration above300 μg/g creatinine). It was concluded that even in the absence of renal tubulardysfunction, occupational exposure of men to cadmium is associated with lowerbone mineral density, a higher risk of osteoporosis and higher urinary calciumexcretion, suggesting a direct osteotoxic effect of cadmium (Nawrot et al., 2010).
The long-term effects of cadmium on forearm bone mineral density after thecessation of the ingestion of cadmium-polluted rice were investigated in 458persons (294 women, 164 men) from three cadmium exposure areas (low,moderate and heavy) in China. Those living in the moderate and heavy exposureareas ceased ingesting cadmium-polluted rice (0.51 mg/kg and 3.7 mg/kg,respectively) in 1996 (10 years prior to the present analysis). The bone mineraldensity was measured by dual-energy X-ray absorptiometry at the proximal radiusand ulna. The cadmium concentrations in urine and blood in 1998 were used ascadmium exposure markers. The values of the absolute decrease and per centdecrease in bone mineral density from 1998 to 2006 increased with increasingurinary and blood cadmium levels and were significant at urinary cadmium concen-trations above 5 μg/g creatinine and at blood cadmium concentrations above 10 μg/lcompared with the low exposure groups (urinary cadmium <2 μg/g creatinine andblood cadmium <2 μg/l) in all subjects (after stratification by sex, these differenceswere significant in the women only; P < 0.001). Analysis of the z-score revealed thatthe prevalence of osteoporosis in 2006 was higher than that in 1998 and increasedalong with the level of urinary and blood cadmium in both men and women,especially for those women with higher blood cadmium (blood cadmium >5 μg/l, OR= 3.45 [0.95–13.6]; blood cadmium >10 μg/l, OR = 4.51 [1.57–13.54]) and urinarycadmium (urinary cadmium >10 μg/g creatinine, OR = 4.74 [1.82–12.81]). Theauthors concluded that decreasing dietary cadmium exposure at the populationlevel is not associated with bone recovery at the individual level (Chen et al., 2009).
Two other studies have failed to establish any association between urinarycadmium levels and bone mineral density. In 196 men and 184 women (Swedishfishermen and their wives), there was no significant association between urinarycadmium concentration and forearm bone mineral density (Wallin et al., 2005). In astudy comprising 170 women and 100 men, urinary and blood cadmiumconcentrations and the markers of renal tubular dysfunction and forearm bonemineral density were measured. The results of the multivariate analysis did notindicate an association between exposure to cadmium and a reduction in bonedensity. The authors concluded that the excretion of low molecular weight proteinsoccurred at a lower level of cadmium exposure than that associated with potentialloss of bone mass (Trzcinka-Ochocka et al., 2010).
A third study included 908 Swedish women with data on single photonabsorptiometry in the non-dominant forearm. Cadmium level in blood wasnegatively associated with bone mineral density and parathyroid hormone level andpositively associated with the biochemical marker of bone resorption (serumcrosslinked C-telopeptide of type I collagen, or CTX). However, this associationdisappeared after adjustment for smoking, and it was concluded that no convincing
318 CADMIUM (addendum)

associations were observed between cadmium concentration in blood and bonemineral density (Rignell-Hydbom et al., 2009).
2.3.4 Cardiovascular disease
A cross-sectional analysis of data from the NHANES in the USA found anassociation between urinary cadmium concentration and myocardial infarction(Everett & Frithsen, 2008) and between blood cadmium concentration and risk ofreported stroke and heart failure (Peters et al., 2010). In subjects with environmentalcadmium exposure in Belgium, the urinary cadmium excretion was correlated withchanges in some physiological indicators of cardiovascular function: pulse wavevelocity, arterial pulse pressures and arterial compliance and distensibility (Schutteet al., 2008b). The pathogenesis of these cadmium-associated abnormalities isunclear at present. In a study conducted in the Republic of Korea, blood cadmiumlevel was associated with increased risk of hypertension (Eum, Lee & Paek, 2008),and cadmium levels in blood, but not in urine, were associated with a modestelevation in blood pressure levels in the NHANES data (Tellez-Plaza et al., 2008).
2.3.5 Cancer
Cadmium is classified as a cancer-causing agent in humans based on anelevated incidence of lung cancer and mortality data derived from occupationalgroups with evidence of elevated exposure to cadmium. Occupational exposureshave historically been through inhalation (IARC, 1993). The available evidence wasconsidered sufficient for lung cancer, but limited for kidney, liver and prostatecancer.
The previous evidence with respect to prostate cancer has not beenregarded as convincing (Verougstraete, Lison & Hotz, 2003; Sahmoun et al., 2005),but the available human studies have limited ability to detect an effect (Huff et al.,2007). A recent case–control study (40 cases and 58 hospital-based controls fromtwo provinces in southern and northern Italy), which compared newly diagnosedcases of prostate cancer with the cadmium levels in their toenails, showed anapparent relationship for an increased prostate cancer risk. An excess prostatecancer risk in subjects in the third and fourth (highest) quartiles of toenail cadmiumconcentration (ORs of 1.3 and 4.7, respectively), compared with subjects in thebottom quartile, was observed. Results were basically unchanged when limiting theanalysis to each province or entering toenail cadmium concentrations as continuousvalues in the regression model (P = 0.004). Despite the limited statistical stability ofthe point estimates, these findings appear to support the hypothesis that cadmiumexposure increases prostate cancer risk (Vinceti et al., 2007).
A prospective cohort study from Belgium assessed the association betweenenvironmental exposure to cadmium and cancer incidence. This study was aprolongation of the Flemish part of the CadmiBel study, including six districts withhigh cadmium exposure close to zinc smelters and four districts with low exposure.In total, 994 subjects were included at baseline. Occupationally exposed peoplewere not excluded, but a sensitivity analysis was performed based on environ-mentally exposed people alone. The population-attributable risk of lung cancer was
CADMIUM (addendum) 319

67% (95% CI 33–101) in a high exposure area, compared with 73% (95% CI 38–108) for smoking. For lung cancer (n = 19, of which 18 occurred in the high exposurearea), the adjusted hazard ratio was 1.70 (95% CI 1.13–2.57; P = 0.011) for adoubling of the 24 h urinary cadmium excretion, 4.17 (95% CI 1.21–14.4; P = 0.024)for residence in the high exposure area compared with the low exposure area and1.57 (95% CI 1.11– 2.24; P = 0.012) for a doubling of cadmium concentration in soil(Nawrot et al., 2006). Overall cancer incidence (n = 70) was also increased inthe high exposure group, but a clear excess was seen only with regard to lung. Themedian urinary cadmium excretion in this study was 0.8 μg/g creatinine, andthe 25th–75th percentile range was about 0.5–1.4 μg/g creatinine (EFSA, 2009a).The exact relevance to dietary cadmium exposure is not clear.
A Belgian case–control study of bladder cancer (172 cases and 359population controls) showed an OR of 5.7 (95% CI 3.3–9.9) for bladder cancer,comparing the highest tertile of blood cadmium with the lowest after adjustmentsfor sex, age, smoking status (current/non-current), number of cigarettes smoked perday, number of years of smoking and occupational exposure to polycyclic aromatichydrocarbons or aromatic amines (Kellen et al., 2007).
More recently, a case–control study (246 cases and 254 controls) in the USAshowed that women in the highest quartile of creatinine-adjusted urinary cadmiumlevels had twice the breast cancer risk of those in the lowest quartile after adjustmentfor established risk factors, and there was a statistically significant increase in riskwith increasing cadmium level (McElroy et al., 2006).
The significance of the estrogen-mimicking effects, such as the well-characterized estrogenic responses of the endometrial lining (hypertrophy andhyperplasia), observed in experimental animals exposed to environmentallyrelevant doses of cadmium (Johnson et al., 2003) was further explored in humans.In a large population-based prospective cohort among Swedish postmenopausalwomen (n = 32 210), the association between dietary cadmium exposure andendometrial cancer incidence was assessed (Åkesson, Julin & Wolk, 2008). This isthe first study exploring health effects in relation to dietary cadmium exposure, incontrast to smaller studies in which cadmium concentration has been monitored inurine. Thus, based on the construction of a food cadmium database in the cohort,a large study population was utilized, and the incidence was assessed pros-pectively. This design, on one hand, reduces the selection bias that often occurs incase–control studies, but it is, on the other hand, dependent on the assumptionthat estimated dietary cadmium exposure is a valid reflection of the internal doseof cadmium. The average estimated dietary cadmium exposure was 15 μg/day(1.5 μg/kg bw per week). During 16 years of follow-up, 378 cases of endometrialadenocarcinoma were ascertained through computerized linkage to the SwedishCancer Registry, with virtually no loss to follow-up. The highest versus lowest tertileof cadmium exposure was associated with risk of endometrial cancer (RR 1.39,95% CI 1.04–1.85; P for trend = 0.02). To reduce the influence of endogenousestrogen exposure, analyses were stratified by BMI and by postmenopausalhormone use. Analyses were also stratified by smoking status, because an anti-estrogenic effect of cigarette smoking on circulating estrogen concentrations hasbeen shown as a result of increased metabolic clearance, a reduction in relative
320 CADMIUM (addendum)

body weight and an earlier age at menopause (Terry et al., 2002). Among never-smoking, non-overweight women, the RR was 1.86 (95% CI 1.13–3.08; P for trend= 0.009). A 2.9-fold increased risk (95% CI 1.05–7.79) was observed with long-termcadmium exposure consistently above the median exposure in 1987 and in 1997 innever-smoking women with low available estrogen (non-overweight and non-usersof postmenopausal hormones). Although the data support the hypothesis thatcadmium may exert estrogenic effects and possibly increase the risk of hormone-related cancers, this needs to be confirmed by other studies.
The association between cancer mortality and cadmium of dietary origin wasassessed in Japanese cohorts. In the Kakehashi cohort with high baseline urinarycadmium concentrations (median urinary cadmium concentrations for men andwomen were 7.0 and 12.1 μg/g creatinine, respectively), a 2.5-fold increase incancer mortality was observed among women with permanent tubular impairment(Nishijo et al., 2006). Similarly, Arisawa et al. (2007a) observed a 2.58-foldconcurrent increased risk of cancer mortality among those with tubular impairmentin the Nagasaki cohort I.
2.3.6 Reproductive toxicity
Maternal blood cadmium concentration is not highly correlated with bloodcadmium concentration in the newborn, but it is correlated with cord blood cadmiumconcentration, with correlation coefficients of 0.5–0.6 (Galicia-Garcia et al., 1997;Salpietro et al., 2002). Limited evidence suggests that neonatal outcomes, such asreduced birth weight (Galicia-Garcia et al., 1997; Nishijo et al., 2002; Salpietro etal., 2002) and reduced length of gestation (Nishijo et al., 2002), are related to indicesof prenatal exposure to cadmium (maternal urinary cadmium level, maternal bloodcadmium level). The fact that, in the study by Nishijo et al. (2002), urinary cadmiumconcentration was not significantly associated with infant height and weight afteradjustment was made for gestational age suggested that fetuses with higherprenatal exposures to cadmium were of appropriate gestational age for date, buttended to be born earlier. In this study, conducted among women living in the JinzuRiver basin in Toyama, the area in which itai-itai disease was most common, mostadverse fetal outcomes were no longer significantly associated with urinarycadmium concentration after adjustment was made for maternal age. Because thestudy area was known to have been contaminated with cadmium over a long period,maternal age is likely to have been a marker for duration of exposure and thus forbody burden of cadmium. Thus, controlling for maternal age might representovercontrol, and alternative analytical approaches, such as stratification, might havebeen preferable.
Concentrations of cadmium were measured in the placenta, cord blood andurine of 44 non-smoking, rural Bangladeshi women. The concentrations ofmagnesium, calcium, manganese, copper, zinc, arsenic and selenium in theplacenta and cord blood and the level of metallothionein in the placenta were alsomeasured. Concentrations of cadmium in urine, placenta and cord blood werevariable, with means (range) of 1.4 μg/l (0.29–10 μg/l), 130 mg/kg (40–492 mg/kg)and 0.16 μg/kg (0.074–0.32 μg/kg), respectively. The concentration of cadmium inthe placenta was positively associated with that in cord blood (rs = 0.62; P < 0.001),
CADMIUM (addendum) 321

but negatively associated with zinc concentration in cord blood (rs = 0.30; P = 0.05).Placenta metallothionein protein expression was positively associated withcadmium (P < 0.01) and arsenic (P = 0.04) concentrations in placenta, but not withzinc or copper concentration in placenta. The authors concluded that the cadmiumconcentrations in placenta were clearly elevated, which seemed to impair zinctransfer to the fetus. Induction of metallothionein explained the placentalaccumulation of cadmium, but not the impairment of zinc transport (Kippler et al.,2010).
2.3.7 Mortality
(a) Japanese data
Recent studies from Japan found that the mortality risk was significantlyincreased among subjects with a urinary cadmium concentration of more than 3 μg/gcreatinine in proportion to the increases in the urinary cadmium concentrationafter adjustment for age, especially in women (Nakagawa et al., 2006). In a recentstudy on mortality of targeted participants in the 1974–1975 health impact surveyin the Kakehashi River basin, Japan, standardized mortality ratios were assessedinstead of proportional mortality ratios. An increased mortality risk from cerebralinfarction in men was found in the category with a urinary 2MG concentration of300–1000 μg/g creatinine during observation for 15 years. Therefore, the increasein mortality from cerebral infarction may contribute to the increase in mortality formen exposed to cadmium. Whereas the increase in mortality from cerebralinfarction did not reach significance in women with urinary 2MG concentrations of300–1000 μg/g creatinine (hazard ratio 1.88, 95% CI 0.82–4.29), the mortality fromheart failure was significantly increased in this subgroup of women (hazard ratio1.94, 95% CI 1.08–3.48) (Nishijo et al., 2006).
In 1992, Iwata et al. reported that individuals who resided in the cadmium-polluted areas of Nagasaki and Akita prefectures in Japan and had renal tubulardysfunction and glomerular dysfunction had a reduced life expectancy. In a follow-up study 23 years later, Arisawa et al. (2007b) compared the same cohort (cohortI) with a second younger cohort of adults ( 40 years) from the same area. The dailycadmium exposure from food had decreased from over 200 μg/day in 1967 to lessthan 100 μg/day after 1980–1983 due to the restoration of cadmium-polluted paddyfields. In the older cohort I, the mortality rate among those with urinary 2MGconcentration greater than or equal to 1000 μg/g creatinine was 1.41 (95% CI 1.07–1.83) times higher than the regional reference rate. After adjusting for age and othervariables, urinary N-acetyl- -D-glucosaminidase activity in men and serumcreatinine level, 2MG clearance and urinary 2MG concentration in women weresignificantly associated with increased mortality. However, in cohort II, urinary
2MG or total protein level was not significantly associated with survival. Theauthors concluded that these findings indicated that cadmium-induced renaldysfunction was a significant predictor of mortality, but that such an association isdisappearing, probably because of the selective loss of advanced cases andreduced exposure and body burden.
322 CADMIUM (addendum)

(b) Data from Europe and the USA
A recent European prospective cohort study (n = 1107 subjects at baseline,of the original 1419 subjects invited to participate between 1985 and 1989)assessed the long-term changes in body burden of cadmium and the incidence ofmortality simultaneously. The study was a prolongation of the Flemish part of theCadmiBel study, including six districts with high cadmium exposure close to zincsmelters (cadmium concentrations above 3 mg/kg soil) and four districts with lowexposure more than 10 km away from the smelters (cadmium concentrations below1 mg/kg soil). The median urinary cadmium concentrations at baseline were 1.03μg/g creatinine and 0.74 μg/g creatinine in high and low exposure areas,respectively. Individuals reporting possible exposure to cadmium at work wereexcluded from the baseline population of 1107 subjects, and some subjects did notprovide blood or urine samples, leaving 956 persons to be followed up (50% fromeach of low and high exposure areas). Except for blood cadmium level and 24 hurinary cadmium excretion, blood pressure, serum creatinine level, high-densitylipoprotein concentration, total cholesterol level, serum -glutamyltransferaseactivity (as index of alcohol intake), urinary creatinine concentration and RBP levelwere assessed. Among the group with data on urinary cadmium concentration, 208deaths occurred during an average 20.3 years of follow-up. Multivariate-adjustedhazard ratios (adjusted for age, sex, BMI, smoking, serum -glutamyltransferaseactivity and socioeconomic status) for all-cause and non-cardiovascular mortalityand the risk of death from all cancers and lung cancer increased with high urinarycadmium excretion. The risks (P 0.04) associated with a doubling of baselineurinary cadmium concentration were 20% (95% CI 4–39%), 44% (95% CI 16–79%)and 43% (95% CI 8–89%) for total mortality, non-cardiovascular mortality and totalcancer mortality, and those associated with a doubling of blood cadmiumconcentration were 25% (95% CI 4–50%) for total mortality and 33% (95% CI 1–75%) for non-cardiovascular mortality. The increase in risk corresponds to adifference in urinary cadmium concentration between 0.68 μg/g creatinine (themean in the analysed population) and 1.36 μg/g creatinine. The authors concludedthat the increased mortality was directly related to the toxic effects of cadmium, butnot directly related to renal dysfunction, as measured by urinary RBP level andserum creatinine level; and that even if zinc smelters close, historical environmentalcontamination remains a persistent source of exposure, and this exposureincreases mortality in a continuous fashion (Nawrot et al., 2008). This study providesthe strong advantage of being a prospective cohort with longitudinal exposureassessment. The relevance to dietary cadmium exposure alone cannot beestimated.
Mortality was also assessed in a prospective cohort based on the NHANES(baseline 1988–1994) data, including 13 956 people followed through December2000. Multivariate models included adjustments for age, race/ethnicity, menopausalstatus, urban/rural residence, cigarette smoking, alcohol consumption, education,physical activity, income, serum C-reactive protein, total cholesterol, diabetes,blood pressure, use of antihypertensive drugs and GFR. The hazard ratios (95%CI) for all-cause mortality, cancer mortality, cardiovascular disease mortality andcoronary heart disease mortality associated with a 2-fold higher creatinine-
CADMIUM (addendum) 323

corrected urinary cadmium concentration were 1.28 (1.15–1.43), 1.55 (1.21–1.98),1.21 (1.07–1.36) and 1.36 (1.11–1.66), respectively, for men and 1.06 (0.96–1.16),1.07 (0.85–1.35), 0.93 (0.84–1.04) and 0.82 (0.76–0.89), respectively, for women.A 2-fold increase in urinary cadmium corresponds approximately to the differencebetween the median (0.32 μg/g creatinine) and the 75th percentile (0.61 μg/gcreatinine). Thus, environmental cadmium exposure was associated with anincreased risk of all-cause, cancer, cardiovascular disease and coronary heartdisease mortality among men, but not among women (Menke et al., 2009).
A recent study that monitored glomerular dysfunction in 50 subjects who hadingested household rice for 10 years after cadmium-polluted soil in rice paddies wasreplaced revealed very little improvement based on measured urinary biomarkers( 2MG, RBP, total protein, amino acid nitrogen and glucose levels), with theexception of urinary amino acid nitrogen level in men. The urinary concentration ofthese biomarkers continued to increase in both sexes over time, with statisticallysignificant differences in RBP and total protein levels in both sexes and glucoselevel in men. Therefore, although cadmium concentrations in rice and urine wereshown to be less after soil replacement, cadmium-induced renal tubular injury (i.e.where 2MG concentration is greater than or equal to 1000 μg/g creatinine) seemedto be irreversible (Kobayashi et al., 2008).
In a study reported in 2009 that investigated the effects of environmental co-exposure to arsenic and cadmium in 290 adults (86 males, 204 females) in theRepublic of Korea, biomarkers of kidney toxicity (the concentrations of N-acetyl- -D-glucosaminidase and 2MG in urine) and biomarkers of oxidative stress (urinarymalondialdehyde and 8-hydroxy-2 -deoxyguanosine) were determined. The concen-trations of these biomarkers were matched to the urinary concentrations of arsenicand cadmium. Oxidative stress biomarkers, such as urinary malondialdehyde and8-hydroxy-2 -deoxyguanosine, were positively correlated with both cadmium andarsenic levels in urine. However, the correlation was more pronounced with co-exposure than with each metal separately. The urinary concentration of N-acetyl-
-D-glucosaminidase but not 2MG was positively correlated with urinary levels ofcadmium and arsenic and indices of oxidative stress. The authors concluded thatthese data indicated that tubular damage in the kidneys was probably related tooxidative stress and that the effect of co-exposure to arsenic and cadmium wasmore pronounced than exposure to each individual metal (Huang et al., 2009).
3. ANALYTICAL METHODS
3.1 Chemistry
Cadmium is a soft, ductile and silvery-white heavy metal with the atomicnumber 48, atomic weight 112.411 and density 8.65 g/cm3 (at 25 °C). It occursmostly in the valence state of +2. Cadmium forms a number of inorganic salts, andthe salts exhibit properties similar to those of the corresponding zinc compounds.The halides and the nitrate of Cd2+ are very soluble in water, whereas the hydroxideis insoluble. Cadmium oxide and cadmium carbonate might, however, be soluble atgastric pH.
324 CADMIUM (addendum)

Cadmium occurs naturally in Earth’s crust as part of cadmium-rich geologicalmaterials, such as greenockite (cadmium sulfide). Cadmium is also found in orescontaining other elements, mainly associated with zinc, and is recovered as a by-product of zinc mining. Approximately 3 kg of cadmium is produced for each tonneof zinc. Cadmium is primarily used for metal plating and coating operations,including transportation equipment, machinery and baking enamels, photographyand television phosphors. It is also used in nickel–cadmium and solar batteries andin pigments.
Cadmium occurs in the environment in its inorganic form as a result ofvolcanic emissions and exfoliation of rocks and minerals (Pacyna & Pacyna, 2001).It is released into the environment via the smelting of other metals, burning of fossilfuels, incineration of waste materials and use of phosphate and sewage sludgefertilizers. An increase in cadmium levels in soil results in an increase in the uptakeof cadmium by plants. Although cadmium may bind to proteins and other organicmolecules and form salts with organic acids, these compounds are regarded asinorganic with respect to cadmium (IPCS, 1992a). Organic cadmium compounds(compounds in which cadmium binds covalently to carbon) are normally notidentified in nature (IPCS, 1992b). Although studies in marine polar regions indicatemicrobial formation of monomethyl cadmium (CdCH3
+), the significance of thesefindings is currently not known (Pongratz & Heumann, 1999; Fairbrother et al.,2007). In the aquatic environment at low salinity, cadmium is present as the freeCd2+ ion with cadmium hydroxide and organic complexes at levels dependent onpH and amounts of soluble organic material. As salinity increases, the degree ofcomplexation with chloride increases; in 100% seawater, the cadmium exists almostsolely as cadmium chloride and CdCl+ complexes (Simpson, 1981). Cadmium ismost readily absorbed by aquatic organisms in its free form, Cd2+, and increasedsalinity has been found to reduce its bioaccumulation (IPCS, 1992a). Shellfish,crustaceans and fungi are natural accumulators of cadmium.
3.2 Description of analytical methods
Analytical methods for the determination of cadmium in foods, water andbiological materials are well established. The detection techniques include flameatomic absorption spectrometry (FAAS), electrothermal (graphite furnace andZeeman furnace) atomic absorption spectrometry (ETAAS), beam injection flamefurnace atomic absorption spectrometry (BIFF-AAS), thermospray flame furnaceatomic absorption spectrometry (TS-FF-AAS), hydride generation atomic fluor-escence spectrometry (HG-AFS), inductively coupled plasma optical emissionspectrometry (ICP-OES) and inductively coupled plasma mass spectrometry(ICP-MS).
The sensitivity of FAAS can be improved by increasing the efficiency ofaerosol generation/transport and the residence time of free atoms in the absorptionvolume. In the TS-FF-AAS technique, a nickel tube is placed above an air/acetyleneflame, and the sample is directly introduced through a ceramic capillary connectedto the nickel tube positioned on the burner of the atomic absorption spectrometer(Da-Col, Domene & Pereira-Filho, 2009). This procedure, unlike FAAS, allows
CADMIUM (addendum) 325

introduction of total sample and long residence time of gaseous atoms in thespectral zone, which offers good sensitivity (Pereira-Filho, Berndt & Arruda, 2002).
Owing to the high sensitivity (limit of detection [LOD] approximately 100times lower than that of FAAS) and selectivity, ETAAS has been widely used for thedetermination of cadmium. However, the response of ETAAS is often perturbed bymultiple physical or chemical reactions in the atomizer, and the LODs are not alwaysadequate for trace analysis (Sardans, Montes & Peñuelas, 2010). This techniquerequires the use of modifiers to stabilize cadmium, allowing its quantification withoutmatrix effect. Various modifiers used include palladium(II) nitrate/palladium (Daftsis& Zachariadis, 2007), palladium(II) chloride/palladium and ascorbic acid (Licata etal., 2004) and ammonium phosphate, Triton X-100 and monoammonium di-hydrogen phosphate (Viñas, Pardo-Martínez & Hernández-Córdoba, 2000). Manyimprovements have enhanced the performance of ETAAS, including backgroundcorrection systems, especially the Zeeman background correction; advances inatomizer designs; development of in situ trapping methods; improvements in thelight source and detector; and use of appropriate modifiers. Use of transversallyheated atomizers with platforms further improved the sensitivity. In recent years,the high-resolution continuum source electrothermal atomic absorption spectrom-eter (HR-CS-ETAAS) allows the direct analysis of solids with low LODs.
ICP-OES and ICP-MS methods offer simultaneous determination of severalelements and are used for the determination of cadmium in foods, water andbiological samples. ICP-OES instruments are available in two configurations: radialand axial. The benefit of the axial design is that more photons are seen by thedetector; as a result, it offers 5–10 times lower LODs compared with the radialconfiguration. The fundamental difference between ICP-OES and ICP-MS is thatthe plasma is used in the latter not to generate photons of light, but to generate ions.The ions produced in the plasma are transported and separated according to theiratomic mass to charge ratio by means of a mass spectrometer. The generation oflarge numbers of positively charged ions allows ICP-MS to achieve LODs betterthan those attainable using ETAAS. Additionally, ICP-MS offers high specificitythrough spectral interpretation and isotopic information (Nardi et al., 2009).However, polyatomic interferences resulting from the combination of matrix ionswith argon may affect this technique. Some of the interferences can be controlledor eliminated by using different sample preparation techniques, such as ashing ormicrowave digestion prior to determination, whereas others have to be controlledusing a mathematical approach (Rocha et al., 2009). The recent use of the dynamicreaction cell technology combined with ICP-MS (DRC-ICP-MS) has allowed theremoval of the interferences with a minimum loss of sensitivity. This technology maybe considered an interesting alternative to the above-mentioned spectrometrictechniques, because it offers various possibilities for the element’s determination indifferent matrices (D’Llio et al., 2008).
Alternative methods, such as stripping voltammetry (Melucci, Torsi &Locatelli, 2007; Jannat, et al., 2009), have limitations for the determination ofcadmium.
326 CADMIUM (addendum)

3.2.1 Determination of cadmium in foods
ETAAS and ICP-MS have been largely used for the determination ofcadmium in foods and water. FAAS has been used to a lesser extent, owing to itslow sensitivity. ICP-MS has been the method of choice, as it offers lower LODs andwide dynamic range and allows simultaneous determination of several elements.Additionally, ICP-MS offers high specificity through spectral interpretation andisotopic information.
Sample preparation for the analysis of cadmium depends on the type of foodmatrix as well as the quantification method. The two most common techniques usedare wet digestion using acids and dry ashing following leaching. The wet digestiontechnique, which uses a combination of highly pure acids (nitric, hydrochloric,sulfuric) along with oxidants such as hydrogen peroxide to assist digestion, hasbeen most commonly employed in sample preparation. Microwave-assisted aciddigestion has been extensively used. This technique allows the use of large samplemasses (1–2 g) under controlled temperature and pressure, reducing contaminationand avoiding losses of the element during mineralization. The dry ashing andleaching technique has been used to a limited extent, as calcinations at temper-atures above 400 °C may induce losses of cadmium. Another technique, which isless commonly used, is the slurry sampling technique. It has some advantages overthe microwave-assisted acid digestion technique, such as low sample preparationtime, safety and cost. However, this technique requires the optimization of particlesize, slurry concentration and homogeneity. This technique may be used incombination with ETAAS, as the ashing step is carried out in the graphite furnaceitself.
The performances of some analytical methods for the determination ofcadmium contamination levels in different foods are presented in Table 3.
(a) Quality assurance for the determination of cadmium in foods
In general, most countries used validated analytical methods and followedgood quality assurance programmes to demonstrate the accuracy and reliability ofthe data. Certified standards and certified reference materials (CRMs) availablefrom institutions such as the Institute for Reference Materials and Measurements(European Commission), the National Institute of Standards and Technology (USA),the Federal Institute for Materials Research and Testing (Germany) and the LGC(formerly the Laboratory of the Government Chemist; United Kingdom) have beenused during method validation and accuracy studies. Many laboratories have alsoparticipated in the proficiency testing programmes and achieved good z-scores indifferent participation rounds. Samples from proficiency testing programmes havealso been used in method validation as well as internal quality control.
CADMIUM (addendum) 327

Tabl
e 3.
Ana
lytic
al m
etho
ds fo
r th
e de
term
inat
ion
of c
adm
ium
in fo
ods
Com
mod
ityn
Cou
ntry
(ye
ar)
Sam
ple
prep
arat
ion
met
hod
Det
erm
inat
ion
met
hod
LOD
/LO
Qn
<LO
Dor
<LO
QM
ean
conc
entr
atio
n(r
ange
)
Ref
eren
ce
Milk
42B
razi
l (20
04)
ET
AA
S0.
13 n
g/m
l(L
OQ
)42
<LO
QS
oare
s et
al.
(201
0)
Tom
ato,
pep
per,
onio
n9
Med
iterr
anea
nco
untr
ies
Mic
row
ave-
assi
sted
dig
estio
n(H
NO
3 +
H2O
2)E
TA
AS
0.05
/0.1
5 ng
/g0
(10.
7–19
.9 n
g/g)
Bak
kali
et a
l.(2
009)
Anc
hovy
, spi
nach
,ca
bbag
e, o
nion
,di
ll, p
arsl
ey,
lettu
ce, t
ea, r
ice,
sala
mi,
chic
ken
23T
urke
yC
opre
cipi
tatio
n w
ith M
BT
ET
AA
S0.
02 n
g/g
(LO
D)
2(2
.67–
510
ng/g
)O
ymak
et a
l.(2
009)
Veg
etab
les
(100
varie
ties)
416
Chi
naA
cid
dige
stio
n (H
NO
3 +
HC
lO4
+ H
2SO
4)E
TA
AS
1 ng
/g (
LOD
)—
10 n
g/g
(ND
–101
ng/g
)S
ong
et a
l.(2
009)
Kon
jac
flour
7C
hina
Enz
ymat
ic h
ydro
lysi
s an
dsl
urry
pre
para
tion
ET
AA
S3
ng/g
(LO
D)
0(5
2.6–
130.
7 ng
/g)
Che
n et
al.
(200
8)
Cab
bage
, whe
at,
pota
to, e
ggs,
inst
ant m
ilk,
mus
sels
, mar
ine
fish,
riv
er fi
sh,
baby
milk
form
ula,
baby
food
s
14S
love
nia
Mic
row
ave-
assi
sted
dige
stio
n (H
NO
3 +
HF
)E
TA
AS
0.03
μg/
g(L
OD
)13
(<0.
03–0
.57
μg/g
)M
ilaci
c &
Kra
lj (2
003)
328 CADMIUM (addendum)
Aci
d di
gest
ion
(HN
O +
HC
l)3

Tabl
e 3
(con
td)
Com
mod
ityn
Cou
ntry
(ye
ar)
Sam
ple
prep
arat
ion
met
hod
Det
erm
inat
ion
met
hod
LOD
/LO
Qn
<LO
Dor
<LO
QM
ean
conc
entr
atio
n(r
ange
)
Ref
eren
ce
Spi
nach
, pal
mito
, cra
b,sh
rimps
, mus
sel,
sard
ine,
squ
id
7B
razi
lC
ryog
enic
grin
ding
+ s
lurr
ypr
epar
atio
nE
TA
AS
3.3
ng/g
(LO
D)
1(N
D–2
2.3
ng/g
)S
anto
s et
al.
(200
2)
Sea
food
(C
RM
)0
—S
olid
sam
plin
gS
S-Z
AA
S0.
0013
ng/
g(L
OD
)—
—D
etch
eva
&G
robe
cker
(200
6)
Sea
wee
d: P
orph
yra,
Lam
inar
ia4
Fra
nce,
Jap
an,
Rep
ublic
of
Kor
ea a
ndS
pain
(20
04)
Mic
row
ave-
assi
sted
dige
stio
n (H
NO
3 +
H2O
2)IC
P-M
S0.
28 n
g/g
(LO
D)
0(0
.31–
3.18
ng/
g)R
ocha
et a
l.(2
009)
Ric
e, w
heat
, bea
ns,
egg,
mea
t, fis
h, b
read
,su
gar,
che
ese,
milk
pow
der,
but
ter,
vege
tabl
es, p
ear,
Bra
zil n
ut, c
offe
e,ch
ocol
ate,
bis
cuits
,pa
sta
18B
razi
lM
icro
wav
e-as
sist
eddi
gest
ion
(HN
O3
+ H
2O2)
ICP
-MS
0.2
ng/g
(LO
D)
1(N
D–9
.1 n
g/g)
Nar
di e
t al.
(200
9)
Sem
olin
a3
Italy
Mic
row
ave-
assi
sted
dige
stio
n (H
NO
3 +
H2O
2)IC
P-M
S6.
1 ng
/l (L
OD
)0
(15.
9–26
.4 n
g/g)
Cub
adda
&R
aggi
(20
05)
Milk
and
infa
nt fo
rmul
a8
Italy
Mic
row
ave-
assi
sted
dige
stio
n (H
NO
3 +
H2O
2)D
RC
-IC
P-M
S0.
08/0
.24
ng/g
9(N
D–3
.7 n
g/g)
D’L
lio e
t al.
(200
8)
CADMIUM (addendum) 329

Tabl
e 3
(con
td)
Com
mod
ityn
Cou
ntry
(ye
ar)
Sam
ple
prep
arat
ion
met
hod
Det
erm
inat
ion
met
hod
LOD
/LO
Qn
<LO
Dor
<LO
QM
ean
conc
entr
atio
n(r
ange
)
Ref
eren
ce
Gua
raná
, cab
bage
2B
razi
lA
cid
dige
stio
n +
sol
id-p
hase
extr
actio
n (m
inic
olum
n of
Am
berli
te X
AD
-4 m
odifi
edw
ith D
HB
)
ICP
-OE
S0.
02/0
.07
ng/m
l0
(0.1
–0.2
5 μg
/g)
Bez
erra
et a
l.(2
007)
Cof
fee,
fish
, bla
ckte
a, g
reen
tea
4T
urke
yC
opre
cipi
tatio
n w
ithzi
rcon
ium
(IV
) hy
drox
ide
FA
AS
0.27
ng/
ml
(LO
D)
4N
DC
itak,
Tuz
en&
Soy
lak
(200
9)
Foo
d su
pple
men
t1
Bra
zil
Mic
row
ave-
assi
sted
dige
stio
n (H
NO
3 +
H2O
2)T
S-F
F-A
AS
0.6/
2.0
ng/m
l—
—D
a-C
ol,
Dom
ene
&P
erei
ra-F
ilho
(200
9)
Infa
nt fo
rmul
a1
Isla
mic
Rep
ublic
of Ir
anA
cid
dige
stio
n (H
NO
3) +
dry
ashi
ngD
PA
SV
5 ng
/g (
LOD
)0
0.35
9 m
g/kg
Jann
at e
t al.
(200
9)
CR
M, c
ertif
ied
refe
renc
e m
ater
ial;
DH
B, d
ihyd
roxy
benz
oic
acid
; DP
AS
V, d
iffer
entia
l pul
se a
nodi
c st
rippi
ng v
olta
mm
etry
; LO
Q, l
imit
of q
uant
ifica
tion;
MB
T, 2
-mer
capt
oben
zoth
iazo
le; n
, num
ber o
f sam
ples
ana
lyse
d; N
D, n
ot d
etec
ted;
SS
-ZA
AS
,sol
id s
ampl
ing
Zee
man
ato
mic
abs
orpt
ion
spec
trom
etry
330 CADMIUM (addendum)

A proficiency testing programme for determining cadmium in seawatershrimp under the auspices of the Asia-Pacific Laboratory Accreditation Cooperationwas discussed by Kong, Chan & Wong (2008). The performance of aninterlaboratory collaborative study for the determination of cadmium by ICP-MSafter pressure digestion including microwave heating was reported. Thirteenlaboratories participated, and the method was tested on a total of seven foodstuffs:carrot purée, fish muscle, mushroom, wheat flour, simulated diet, scampi andmussel powder. The elemental concentration of cadmium (dry matter) ranged from0.28 to 1.70 mg/kg. The study indicated that the ICP-MS method is satisfactory forthe determination of cadmium in foods (Julshamn et al., 2007).
3.2.2 Determination of cadmium in blood and biological materials
Determination of cadmium in biological materials such as blood, urine andtissues poses problems, mainly due to its presence in low concentrations as wellas the complexity of the sample matrix. ETAAS has been widely used for thedetermination of cadmium in blood and clinical analyses. Ashing and atomizationof the sample in the presence of chemical modifiers and use of Zeeman backgroundcorrection were studied (Sardans, Montes & Peñuelas, 2010). A simultaneousatomic absorption spectrometry (SIMAAS) method for the determination ofcadmium was proposed by Kummrow et al. (2008). The method requires a samplevolume of 200 μl and presented an LOD of 0.026 ng/ml for cadmium.
ICP-MS has proven to be a superior and attractive alternative method toETAAS, owing to its low LODs and its simple sample pretreatment. Whole bloodsamples could be analysed directly after dilution or decomposition of the organicmatrix by ICP-MS (Heitland & Köster, 2006). However, the direct analysis of wholeblood after dilution can cause clogging of the sample introduction devices and signalinstability in the ICP-MS. Several digestion procedures have been reported,including high-pressure ashing.
The performances of some analytical methods for the determination ofcadmium in blood and other biological materials are presented in Table 4.
Cadmium exposure in children and their mothers living in the vicinity ofindustrial sources (city of Duisburg and a rural area of North Rhine Westphalia,Germany) was assessed by a cross-sectional study performed in 2000. In total, 238children (mean age 6.4 years, range 5.5–7.7 years; 49% males, 51% females) and213 mothers (mean age 36 years, range 23–48 years) were included in the study.Mean cadmium levels (children/mothers) in the blood from the industrialized areawere higher (0.21/0.61 ng/ml) than those from the rural area (0.19/0.44 ng/ml). Meancadmium levels (children/mothers) in the urine from the industrialized area werehigher (0.13/0.43 ng/ml) than those from the rural area (0.11/0.30 ng/ml) (Wilhelmet al., 2005).
The Centre for Environment and Health in Flanders, in the northern part ofBelgium, started a biomonitoring programme on adolescents in 2003. In total, 1679adolescents from nine areas with different patterns of pollution were selected toparticipate in this study. Possible confounding effects of lifestyle and personalcharacteristics were taken into account. A median blood cadmium level of 0.39 ng/ml was reported (Schroijen et al., 2008).
CADMIUM (addendum) 331

Tabl
e 4.
Ana
lytic
al m
etho
ds fo
r th
e de
term
inat
ion
of c
adm
ium
in b
lood
and
urin
e
Cou
ntry
(yea
r)n
Ana
lytic
alsa
mpl
esi
ze
Sam
ple
prep
arat
ion
Tec
hniq
ueLO
D/L
OQ
Mea
n co
ncen
trat
ion
(ran
ge)
n <
LOQ
or
<LO
QR
efer
ence
Spa
in (
2010
)0
(met
hod
valid
atio
n on
ly, n
osa
mpl
esan
alys
ed)
—M
icro
wav
edi
gest
ion
ET
AA
S0.
03/0
.09
ng/m
l—
—O
lmed
o et
al.
(201
0)
Bra
zil (
2007
)40
200
μlP
rote
inpr
ecip
itatio
nan
d di
lutio
n
ET
AA
S0.
026
ng/m
l (LO
D)
0.32
ng/
ml (
0.13
–0.7
1ng
/ml)
—K
umm
row
et
al. (
2008
)
——
5 m
lW
et d
iges
tion
(HN
O3)
ET
AA
S1–
11 n
g/g
(LO
D)
for
diffe
rent
frac
tions
(ND
–4 n
g/g)
—D
afts
is &
Zac
haria
dis
(200
7)
Ger
man
y(2
002–
2003
)43
0 (c
hild
ren,
age
abou
t 10
year
s)5
ml
—Z
F-A
AS
0.15
ng/
ml (
LOQ
)0.
29 n
g/m
l(<
0.15
–3.1
ng/
ml)
43Li
nk e
t al.
(200
7)
—C
RM
2 m
lM
icro
wav
e-as
sist
eddi
gest
ion
ET
AA
Sw
ith P
dm
odifi
er
0.02
1/0.
057
ng/m
l—
—V
iitak
&V
olyn
sky
(200
6)
Ger
man
y(2
000)
Chi
ldre
n/m
othe
rsB
lood
: 238
/213
Urin
e: 1
49/1
29
——
ET
AA
S0.
03 n
g/m
l (LO
Q)
for
bloo
d an
d ur
ine
Chi
ldre
n/m
othe
rsB
lood
0.2
1/0.
57 n
g/m
lU
rine
0.12
/0.3
9 ng
/ml
Chi
ldre
n/m
othe
rsB
lood
57/
6U
rine
13/0
Wilh
elm
et a
l.(2
005)
332 CADMIUM (addendum)

Tabl
e 4
(con
td)
Cou
ntry
(yea
r)n
Ana
lytic
alsa
mpl
e si
zeS
ampl
epr
epar
atio
nT
echn
ique
LOD
/LO
QM
ean
conc
entr
atio
n(r
ange
)
n <
LOQ
or
<LO
QR
efer
ence
Egy
ptB
lood
and
urin
e: 9
3H
air:
93
Nai
ls: 6
8
1 m
l (bl
ood
and
urin
e)50
0 m
g(h
air
and
nail)
Oxi
datio
n w
ithK
MnO
4
ET
AA
SB
lood
0.2
3/0.
59 n
g/m
lU
rine
0.32
/0.6
8 ng
/ml
Hai
r 0.
015/
0.03
1 μg
/gN
ails
0.0
18/0
.037
μg/
g
Blo
od 2
.07
ng/m
lU
rine
1.93
ng/
ml
Hai
r 0.
35 μ
g/g
Nai
ls 1
.35
μg/g
—M
orta
da e
t al.
(200
2)
Italy
(200
4)11
010
ml
Wet
dig
estio
n(H
NO
3)IC
P-M
S—
0.99
ng/
ml
—A
limon
ti et
al.
(200
5)
Sw
eden
311
ml
Mic
row
ave
dige
stio
nIC
P-M
S0.
03 n
g/m
l (LO
D)
0.11
6 ng
/ml
(<0.
03–0
.317
ng/
ml)
6R
odus
hkin
,Ö
dman
&B
rant
h (1
999)
Bel
gium
(200
3)16
79 a
dole
scen
ts50
0 μl
Wet
dig
estio
n(H
NO
3 +
H2O
2)H
R-I
CP
-MS
0.09
ng/
ml (
LOD
)M
edia
n 0.
39(0
.045
–1.2
6 ng
/ml)
—S
chro
ijen
etal
. (20
08)
Ger
man
y(2
005)
130
500
μlD
ilutio
n (T
riton
X-1
00 +
NH
4OH
)D
RC
-IC
P-
MS
0.1
ng/m
l (LO
Q)
0.57
ng/
ml (
0.1–
4.1
ng/m
l)—
Hei
tland
&K
öste
r (2
006)
——
1 m
lM
icro
wav
e-as
sist
ed a
cid
dige
stio
n
SF
-IC
P-M
SB
lood
: 0.0
3 ng
/ml
(LO
D)
Urin
e: 0
.007
ng/
ml
(LO
D)
——
Boc
ca e
t al.
(200
5)
HR
-IC
P-M
S, h
igh-
reso
lutio
n in
duct
ivel
y co
uple
d pl
asm
a m
ass
spec
trom
etry
; LO
Q, l
imit
of q
uant
ifica
tion;
n, n
umbe
r of
sam
ples
ana
lyse
d; N
D, n
otde
tect
ed; S
F-I
CP
-MS
, sec
tor
field
indu
ctiv
ely
coup
led
plas
ma
mas
s sp
ectr
omet
ry; Z
F-A
AS
, Zee
man
furn
ace
atom
ic a
bsor
ptio
n sp
ectr
omet
ry
CADMIUM (addendum) 333

Heitland & Köster (2006) evaluated 37 trace metals, including cadmium, inblood of 130 people (ranging in age from 18 to 70 years) living in northern Germanywho were assumed to be unexposed to cadmium from environmental sources.Samples were collected in 2005, and trace metals in blood were determined byDRC-ICP-MS. External quality assurance was performed by participation in threenational and international quality assessment schemes to ensure the accuracyand reliability of the data. The mean cadmium level in blood was found to be0.57 ng/ml.
4. SAMPLING PROTOCOLS
Guidelines on sampling of various foods are described in the CodexAlimentarius Commission guidelines CAC/GL 50-2004 (FAO/WHO, 2004).
5. PREVENTION AND CONTROL
Cadmium contamination of food arises mainly from the uptake of cadmiumfrom soil by plants and grass, resulting in increased cadmium levels in food andfeeds (UNEP, 2006). Background cadmium levels in surface soils range from 0.01to 2.7 mg/kg (Kabata-Pendias, 2001). Cadmium levels in soil are given in the reportsof the United Nations Environment Programme (e.g. UNEP, 2006, 2008). However,cadmium is much less mobile in soils than in air and water. The major factorsgoverning cadmium mobility in soils are speciation, pH, soluble organic mattercontent, hydrous metal oxide content, clay content and type, presence of organicand inorganic ligands, and competition from other metal ions. Cadmium in soil tendsto be more available when the soil pH is low (OECD, 1994). Elevated concentrationsof cadmium in soils (compared with background values) have also been reportedfollowing the application of sewage sludge and farmyard manure, which containvariable and occasionally excessive cadmium concentrations (Steineck et al., 1999;Eriksson, 2000; Bergkvist et al., 2003). Fertilizers also play a role in the cadmiumcontent of plants. The European Union suggested a cadmium limit of 46 mg/kgphosphorus in phosphate fertilizers (European Commission, 2001).
Analyses showed that cadmium levels in fruits and vegetables could be upto 9-fold higher than, and in meat and offal twice as high as, in non-contaminatedareas. Cadmium levels appear to be higher in samples produced conventionallythan in the corresponding organic products. The observed differences varied from17% in green beans to 90% in lettuce. This observation could be explained by thecadmium impurities in phosphate fertilizers used in conventional productionsystems (EFSA, 2009a).
Washing of fruits and vegetables and peeling of roots and tubers can reducecadmium contamination to some extent. There have been worldwide efforts toreduce cadmium exposure, including implementation of MLs for cadmium in foods,food additives and water. Other prevention and control measures include controllingcadmium levels in fertilizers and feeds and following good agricultural andmanufacturing practices.
334 CADMIUM (addendum)

6. LEVELS AND PATTERNS OF CONTAMINATION IN FOODCOMMODITIES
6.1 National and regional occurrence data
The Committee reviewed new cadmium occurrence data submitted by theEuropean Food Safety Authority (EFSA) covering 19 European countries (Austria,Belgium, Bulgaria, Cyprus, Estonia, France, Germany, Greece, Iceland, Ireland,Italy, the Netherlands, Poland, Romania, Slovakia, Slovenia, Spain, Sweden andthe United Kingdom); France also submitted data independently of EFSA.Occurrence data were submitted by 10 other countries (Australia, Brazil, Canada,Chile, China, Ghana, Japan, Singapore, the USA and Viet Nam). The food industrysubmitted data on cadmium levels in products that are distributed and usedworldwide.
The majority of data submitted were individual analytical results for a widerange of foods. Aggregated data were also submitted, with the mean and maximumvalues reported. Most countries analysed samples using validated analyticalmethods and followed good internal and external quality control programmes toensure the accuracy and reliability of the data.
As the Committee last conducted a complete assessment on cadmium in2003, only data from 2003 to the present were included in the present assessment.In addition, data for certain foods that could not be linked to a specific commodity(e.g. multi-ingredient foods, infant formula, dietary supplements) were excludedfrom the assessment.
The total number of samples represented by the data submissions was155 496, with 84.4% coming from Europe, 5.2% from North America, 1.5% fromAsia, 1.4% from Latin America, 0.3% from the Pacific region and 0.1% from Africa(Table 5). The data submitted by industry accounted for 7.0% of the data.
In order to summarize and compare all submitted data, it was necessary togroup the data by food category. As there were no common food codings or fooddescriptors used among all data sets, the following food categories were used tosummarize the data and have been used throughout this section when presentingand discussing the data:
• Wheat (including breads)
• Rice
• Oats• Baked goods
• Cereals/grains, other
• Roots & tubers
• Pulses & legumes
• Fruits• Dried fruit
• Fruit juices
• Vegetables
CADMIUM (addendum) 335

• Vegetables, dried
• Meat & poultry muscle, not further specified (NFS)
• Meat & poultry offal, NFS
• Meat muscle
• Meat kidney• Meat liver
• Meat offal, NFS
• Poultry muscle• Poultry liver
• Poultry kidney
• Poultry offal, NFS
• Eggs
Table 5. Distribution of new cadmium occurrence data by region
Region Country Total no. ofsamples
Samples with no detectablelevels of cadmium (ND)a
% ofsamples
byregionNo. of samples % of total
Asia China 1 491 569 38.2 1.5
Japan 67 0 0.0
Singapore 482 208 43.2
Viet Nam 317 0 0.0
Subtotal 2 357 777 33.0
Europe Combined data from 19European countriesb
131 167 44 133 33.6 84.4
Latin America Brazil 2 241 2 067 92.2 1.4
Chile 9 0 0.0
Subtotal 2 250 2 067 91.9
North America Canada 706 0 0.0 5.2
USA 7 411 3 064 41.3
Subtotal 8 117 3 064 37.7
Pacific region Australia 532 190 35.7 0.3
Africa Ghana 144 132 91.7 0.1
Food industry — 10 929 4 418 40.4 7.0
Total 155 496 54 781 35.2 100
ND, non-detectsa Samples with results below the LOD, LOQ or level of reporting (LOR).b Submitted by EFSA.
336 CADMIUM (addendum)

• Fish & seafood, NFS
• Finfish• Shellfish/molluscs
• Dairy products
• Nuts & oilseeds• Vegetable oils & fats
• Animal fats
• Coffee, tea & cocoa
• Sugar, honey & sweets
• Spices• Alcoholic beverages
• Drinking-water (bottled & tap)
It was not always possible to determine the form (e.g. fresh versus dried) ofthe foods that were analysed, so in some cases both fresh and dried products mayhave been included in the same food category. Additionally, specific foods within afood category are known to contain higher levels of cadmium than most other foodsin the category (e.g. horse meat compared with other meat muscle). Both casescould account for an unusually high maximum concentration of cadmium reportedwithin a food category when compared with the mean concentration.
The data from each country or region that were included in the assessmentare described below and are summarized in Table 6. Unless otherwise specified,mean values were calculated, assuming a value of zero for samples with resultsbelow the LOD, level of quantification (LOQ) or level of reporting (LOR) (i.e. non-detects or ND). In the case of aggregated data, weighted means were calculatedbased on sample size.
6.1.1 Australia
Food Standards Australia New Zealand submitted data collected in the 23rdAustralian Total Diet Study (TDS) conducted in 2008–2009. Individual analyticalresults for a total of 532 samples covering all food categories were used in theassessment. The LOR for Australian TDS samples was 0.005 mg/kg. The highestmean cadmium levels were found in roots and tubers (0.033 mg/kg) and nuts andoilseeds (0.019 mg/kg).
6.1.2 Brazil
Brazil provided data on cadmium levels in kidney and muscle of meat andpoultry samples collected from 2003 to 2009. Aggregated results representing 2241samples were provided for meat muscle, meat kidney, poultry muscle and poultrykidney; weighted means were calculated for each of the four categories. The LODwas 0.005 mg/kg, and the LOQ was 0.01 mg/kg. Mean cadmium concentrationswere higher in kidney (0.012–0.025 mg/kg) than in muscle (0.003 mg/kg), althoughthe maximum cadmium level (0.286 mg/kg) was found in one sample of meatmuscle.
CADMIUM (addendum) 337

Table 6. Cadmium occurrence data by data source
Data source Food category No. ofsamples
No. ofnon-
detects
Meanconcentration
(mg/kg)(ND = 0)a
Maximumconcentration
(mg/kg)
Australia
Wheat (including breads) 16 2 0.009 0.025
Rice 4 2 0.004 0.009
Oats 4 0 0.004 0.005
Baked goods 20 3 0.012 0.032
Cereals/grains, other 24 1 0.013 0.044
Roots & tubers 12 0 0.033 0.087
Pulses & legumes 4 0 0.004 0.006
Fruits 80 48 0.006 0.051
Dried fruit 12 1 0.009 0.030
Fruit juices 12 2 0.001 0.002
Vegetables 118 12 0.006 0.046
Meat muscle 44 19 0.002 0.010
Poultry muscle 20 18 0.000 2 0.003
Poultry liver 4 0 0.006 0.010
Eggs 10 8 0.000 3 0.002
Finfish 18 1 0.006 0.015
Shellfish/molluscs 8 0 0.014 0.070
Dairy products 42 30 0.004 0.105
Nuts & oilseeds 8 1 0.019 0.037
Animal fats 4 4 ND ND
Vegetable oils & fats 8 8 ND ND
Coffee, tea & cocoa 12 10 0.000 1 0.001
Sugar, honey & sweets 8 7 0.000 1 0.001
Spices 8 0 0.006 0.009
Alcoholic beverages 20 5 0.002 0.007
Drinking-water (bottled &tap)
12 8 0.000 09 0.000 5
Total number 532 190
338 CADMIUM (addendum)

Table 6 (contd)
Data source Food category No. ofsamples
No. of non-detects
Meanconcentration
(mg/kg)(ND = 0)a
Maximumconcentration
(mg/kg)
Brazil
Meat muscle 476 438 0.003 0.286
Meat kidney 118 85 0.025 0.271
Poultry muscle 1 503 1 418 0.003 0.228
Poultry kidney 144 126 0.012 0.285
Total number 2 241 2 067
Canada
Shellfish/molluscs
706 0 4.820 94.65
Chile
Shellfish/molluscs
9 0 0.949 1.364
China (TDS)
Cereals/grains 12 0 0.010 0.068
Roots & tubers 12 0 0.006 0.024
Pulses &legumes
12 0 0.016 0.100
Fruits 12 1 0.001 0.007
Vegetables 12 0 0.010 0.033
Meat & poultry,NFS
12 0 0.042 0.249
Eggs 12 0 0.002 0.011
Fish &seafood, NFS
12 1 0.077 0.414
Dairy products 12 12 ND ND
Sugar 12 12 ND ND
Alcoholicbeverages
12 10 0.000 4 0.000 2
Beverages &water
12 12 ND ND
Total number 144 48
CADMIUM (addendum) 339
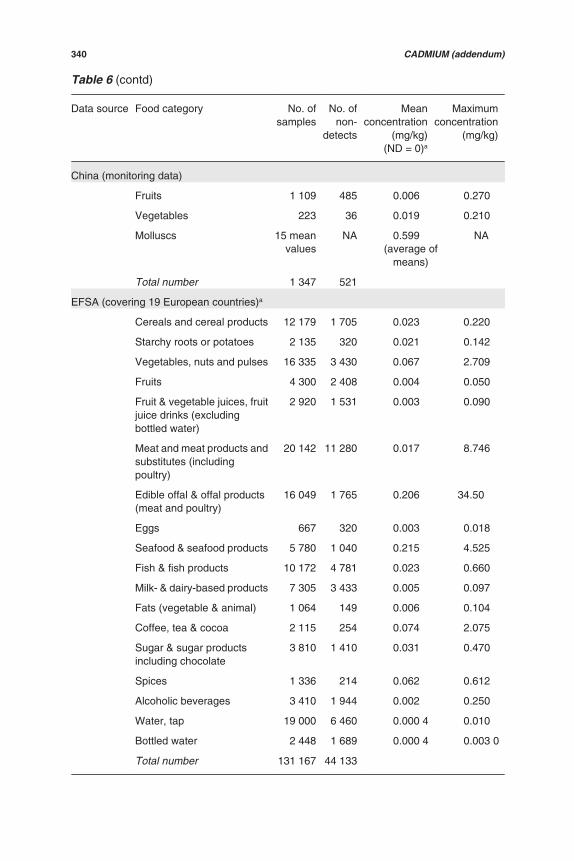
Table 6 (contd)
Data source Food category No. ofsamples
No. ofnon-
detects
Meanconcentration
(mg/kg)(ND = 0)a
Maximumconcentration
(mg/kg)
China (monitoring data)
Fruits 1 109 485 0.006 0.270
Vegetables 223 36 0.019 0.210
Molluscs 15 meanvalues
NA 0.599(average of
means)
NA
Total number 1 347 521
EFSA (covering 19 European countries)a
Cereals and cereal products 12 179 1 705 0.023 0.220
Starchy roots or potatoes 2 135 320 0.021 0.142
Vegetables, nuts and pulses 16 335 3 430 0.067 2.709
Fruits 4 300 2 408 0.004 0.050
Fruit & vegetable juices, fruitjuice drinks (excludingbottled water)
2 920 1 531 0.003 0.090
Meat and meat products andsubstitutes (includingpoultry)
20 142 11 280 0.017 8.746
Edible offal & offal products(meat and poultry)
16 049 1 765 0.206 34.50
Eggs 667 320 0.003 0.018
Seafood & seafood products 5 780 1 040 0.215 4.525
Fish & fish products 10 172 4 781 0.023 0.660
Milk- & dairy-based products 7 305 3 433 0.005 0.097
Fats (vegetable & animal) 1 064 149 0.006 0.104
Coffee, tea & cocoa 2 115 254 0.074 2.075
Sugar & sugar productsincluding chocolate
3 810 1 410 0.031 0.470
Spices 1 336 214 0.062 0.612
Alcoholic beverages 3 410 1 944 0.002 0.250
Water, tap 19 000 6 460 0.000 4 0.010
Bottled water 2 448 1 689 0.000 4 0.003 0
Total number 131 167 44 133
340 CADMIUM (addendum)

Table 6 (contd)
Data source Food category No. ofsamples
No. ofnon-
detects
Meanconcentration
(mg/kg)(ND = 0)a
Maximumconcentration
(mg/kg)
France
Wheat (including breads) 36 2 0.051 0.170
Rice 30 18 0.010 0.043
Cereals/grains, other 62 10 0.085 1.260
Roots & tubers 74 10 0.029 0.560
Pulses & legumes 28 23 0.008 0.115
Fruits 1 178 1 047 0.005 3.000
Dried fruit 27 16 0.003 0.019
Fruit juices 8 8 ND ND
Vegetables 1 279 181 0.203 6.130
Vegetables, dried 5 0 1.952 7.500
Meat muscle 6 875 5 245 0.061 40.02
Meat liver 2 960 328 0.099 40.02
Meat offal, NFS 1 324 1 035 1.086 47.66
Poultry muscle 1 149 122 0.005 2.620
Poultry offal 1 070 255 0.069 10.13
Finfish 834 681 0.010 1.655
Shellfish 61 14 0.390 12.27
Molluscs 357 15 0.467 6.480
Dairy products 3 3 ND ND
Nuts & oilseeds 168 57 0.083 0.740
Vegetable oils & fats 16 13 0.007 0.055
Coffee, tea & cocoa 107 6 0.492 5.239
Sugar, honey & sweets 3 2 0.002 0.005
Spices 141 18 0.046 0.500
Alcoholic beverages 104 76 0.0002 0.002
Drinking-water (bottled &tap)
40 40 ND ND
Total number 17 939 9 225
Ghana
Finfish 144 132 0.000 02 0.000 2
CADMIUM (addendum) 341

Table 6 (contd)
Data source Food category No. ofsamples
No. ofnon-
detects
Meanconcentration
(mg/kg)(ND = 0)a
Maximumconcentration
(mg/kg)
Japan
Shellfish/molluscs 67 0 0.346 1.400
Singapore
Baked goods 8 8 ND ND
Cereals/grains, other 2 2 ND ND
Fruit juices 2 2 ND ND
Vegetables 28 24 0.015 0.130
Vegetables, dried 228 35 0.986 14.87
Shellfish/molluscs 17 1 0.288 0.790
Finfish 1 1 ND ND
Nuts & oilseeds 9 2 0.086 0.430
Vegetable oils & fats 27 27 ND ND
Coffee, tea & cocoa 74 30 0.149 0.490
Sugar, honey & sweets 58 58 ND ND
Spices 27 17 0.024 0.130
Alcoholic beverages 1 1 ND ND
Total number 482 208
USA (USFDA TDS)
Wheat (including breads) 160 1 0.021 0.047
Rice 20 0 0.007 0.014
Oats 20 1 0.003 0.004
Cereals/grains, other 40 20 0.008 0.029
Roots & tubers 100 2 0.015 0.058
Pulses & legumes 60 4 0.003 0.010
Fruits 360 167 0.003 0.054
Dried fruit 20 16 0.001 0.006
Fruit juices 166 106 0.001 0.008
Vegetables 640 69 0.018 0.420
Meat muscle 200 183 0.000 3 0.011
Meat liver 20 0 0.060 0.171
342 CADMIUM (addendum)

Table 6 (contd)
Data source Food category No. ofsamples
No. ofnon-
detects
Meanconcentration
(mg/kg)(ND = 0)a
Maximumconcentration
(mg/kg)
Poultry muscle 60 52 0.000 4 0.006
Eggs 40 38 0.000 1 0.003
Finfish 60 32 0.005 0.029
Shellfish/molluscs 20 6 0.005 0.026
Dairy products 140 134 0.000 2 0.005
Nuts & oilseeds 80 12 0.131 0.874
Animal fats 20 17 0.001 0.006
Vegetable oils & fats 40 39 0.000 1 0.004
Coffee, tea & cocoa 20 19 0.000 1 0.001
Sugar, honey & sweets 20 19 0.002 0.042
Total number 2 306 937
USA (USFDA monitoring data)
Rice 6 0 0.021 0.047
Baked goods 27 2 0.020 0.040
Cereals/grains, other 9 3 0.025 0.058
Roots & tubers 1 1 ND ND
Pulses & legumes 5 3 0.000 8 0.003
Fruits 84 57 0.002 0.023
Dried fruit 47 31 0.004 0.070
Fruit juice 36 28 0.001 0.011
Vegetables 37 18 0.026 0.360
Vegetables, dried 2 0 0.085 0.130
Finfish 124 90 0.006 0.139
Shellfish 354 8 0.429 3.420
Molluscs 90 9 0.091 0.799
Dairy products 117 109 0.000 3 0.009
Nuts & oilseeds 7 0 0.117 0.508
Spices 5 0 0.228 0.251
Total number 951 359
CADMIUM (addendum) 343
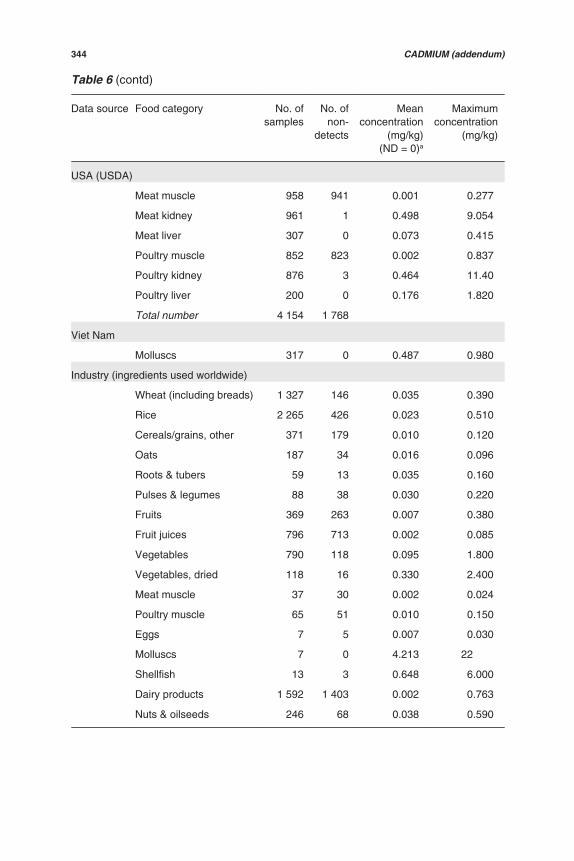
Table 6 (contd)
Data source Food category No. ofsamples
No. ofnon-
detects
Meanconcentration
(mg/kg)(ND = 0)a
Maximumconcentration
(mg/kg)
USA (USDA)
Meat muscle 958 941 0.001 0.277
Meat kidney 961 1 0.498 9.054
Meat liver 307 0 0.073 0.415
Poultry muscle 852 823 0.002 0.837
Poultry kidney 876 3 0.464 11.40
Poultry liver 200 0 0.176 1.820
Total number 4 154 1 768
Viet Nam
Molluscs 317 0 0.487 0.980
Industry (ingredients used worldwide)
Wheat (including breads) 1 327 146 0.035 0.390
Rice 2 265 426 0.023 0.510
Cereals/grains, other 371 179 0.010 0.120
Oats 187 34 0.016 0.096
Roots & tubers 59 13 0.035 0.160
Pulses & legumes 88 38 0.030 0.220
Fruits 369 263 0.007 0.380
Fruit juices 796 713 0.002 0.085
Vegetables 790 118 0.095 1.800
Vegetables, dried 118 16 0.330 2.400
Meat muscle 37 30 0.002 0.024
Poultry muscle 65 51 0.010 0.150
Eggs 7 5 0.007 0.030
Molluscs 7 0 4.213 22
Shellfish 13 3 0.648 6.000
Dairy products 1 592 1 403 0.002 0.763
Nuts & oilseeds 246 68 0.038 0.590
344 CADMIUM (addendum)

6.1.3 Canada
Aggregated data on cadmium levels in wild and farmed molluscs (scallops)were submitted by Canada. A weighted mean cadmium level of 4.82 mg/kg wascalculated from the 43 aggregated results representing 706 samples collected in2003–2004. The maximum cadmium level was 94.65 mg/kg. Neither the LOD northe LOQ was specified.
6.1.4 Chile
Chile submitted one aggregated mean value representing nine samples ofmussels collected in 2008. The mean cadmium level was found to be 0.949 mg/kg,and the maximum value was 1.364 mg/kg. The LOQ was 0.01 mg/kg.
6.1.5 China
Data from three different sources were provided by China.
Results from the 2007 Chinese TDS included cadmium levels in 12 foodgroup composites collected from 12 provinces; the national average cadmium levelsand maximum values reported are provided in Table 6. The highest mean cadmiumlevels were found in fish and seafood (0.077 mg/kg) and in meat and poultry (0.042).The highest maximum values were reported for fish and seafood (0.414 mg/kg) andmeat and poultry (0.249 mg/kg). The LOD was 0.0005 mg/kg.
Individual results were also submitted by China for 1332 samples of fruitsand vegetables collected in 2004–2005. Mean cadmium levels were 0.006 mg/kgin fruits and 0.019 mg/kg in vegetables. The highest cadmium level (0.270 mg/kg)was found in one sample of fruit. Neither the LOD nor the LOQ was specified.
Table 6 (contd)
Data source Foodcategory
No. ofsamples
No. ofnon-
detects
Meanconcentration
(mg/kg)(ND = 0)a
Maximumconcentration
(mg/kg)
Vegetableoils & fats
447 409 0.002 0.031
Coffee, tea &cocoa
1 284 196 1.750 1327
Spices 861 307 0.106 1.400
Total number 10 929 4 418
NA, not available; ND, non-detectsa In calculation of mean cadmium concentration, cadmium concentration set at 0 mg/kg for
non-detects, except for EFSA results, in which cadmium concentration set at LOD/2 or LOQ/2 for non-detects.
CADMIUM (addendum) 345
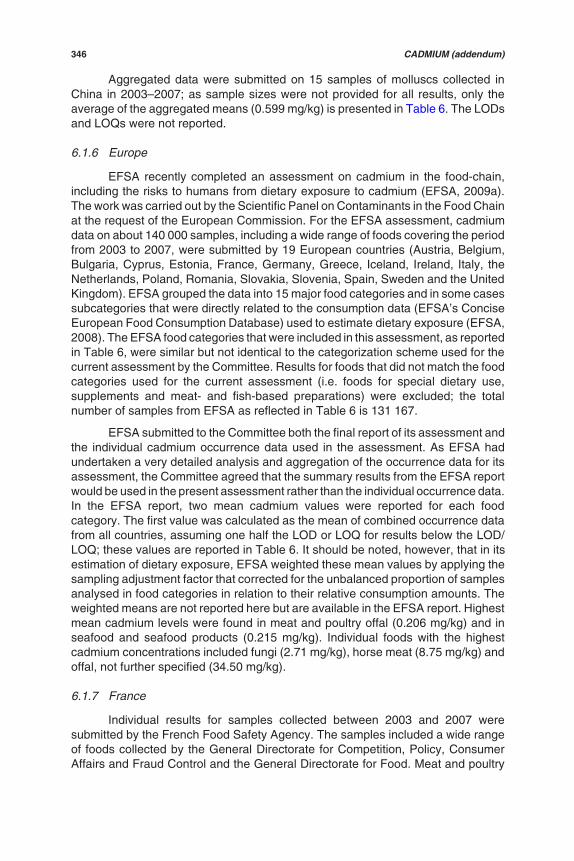
Aggregated data were submitted on 15 samples of molluscs collected inChina in 2003–2007; as sample sizes were not provided for all results, only theaverage of the aggregated means (0.599 mg/kg) is presented in Table 6. The LODsand LOQs were not reported.
6.1.6 Europe
EFSA recently completed an assessment on cadmium in the food-chain,including the risks to humans from dietary exposure to cadmium (EFSA, 2009a).The work was carried out by the Scientific Panel on Contaminants in the Food Chainat the request of the European Commission. For the EFSA assessment, cadmiumdata on about 140 000 samples, including a wide range of foods covering the periodfrom 2003 to 2007, were submitted by 19 European countries (Austria, Belgium,Bulgaria, Cyprus, Estonia, France, Germany, Greece, Iceland, Ireland, Italy, theNetherlands, Poland, Romania, Slovakia, Slovenia, Spain, Sweden and the UnitedKingdom). EFSA grouped the data into 15 major food categories and in some casessubcategories that were directly related to the consumption data (EFSA’s ConciseEuropean Food Consumption Database) used to estimate dietary exposure (EFSA,2008). The EFSA food categories that were included in this assessment, as reportedin Table 6, were similar but not identical to the categorization scheme used for thecurrent assessment by the Committee. Results for foods that did not match the foodcategories used for the current assessment (i.e. foods for special dietary use,supplements and meat- and fish-based preparations) were excluded; the totalnumber of samples from EFSA as reflected in Table 6 is 131 167.
EFSA submitted to the Committee both the final report of its assessment andthe individual cadmium occurrence data used in the assessment. As EFSA hadundertaken a very detailed analysis and aggregation of the occurrence data for itsassessment, the Committee agreed that the summary results from the EFSA reportwould be used in the present assessment rather than the individual occurrence data.In the EFSA report, two mean cadmium values were reported for each foodcategory. The first value was calculated as the mean of combined occurrence datafrom all countries, assuming one half the LOD or LOQ for results below the LOD/LOQ; these values are reported in Table 6. It should be noted, however, that in itsestimation of dietary exposure, EFSA weighted these mean values by applying thesampling adjustment factor that corrected for the unbalanced proportion of samplesanalysed in food categories in relation to their relative consumption amounts. Theweighted means are not reported here but are available in the EFSA report. Highestmean cadmium levels were found in meat and poultry offal (0.206 mg/kg) and inseafood and seafood products (0.215 mg/kg). Individual foods with the highestcadmium concentrations included fungi (2.71 mg/kg), horse meat (8.75 mg/kg) andoffal, not further specified (34.50 mg/kg).
6.1.7 France
Individual results for samples collected between 2003 and 2007 weresubmitted by the French Food Safety Agency. The samples included a wide rangeof foods collected by the General Directorate for Competition, Policy, ConsumerAffairs and Fraud Control and the General Directorate for Food. Meat and poultry
346 CADMIUM (addendum)

products make up the majority of samples. LODs ranged from 0.0002 to 0.01 mg/kg. In all, results for 17 939 samples were included in the current assessment. Thehighest mean cadmium levels were found in meat offal (1.086 mg/kg) and driedvegetables (1.952 mg/kg). The maximum cadmium value of 47.60 mg/kg was foundin meat offal.
The majority of cadmium occurrence data submitted by France were alsoincluded in the EFSA cadmium assessment and are reflected in the EFSA datasummary. Although the data submitted by France are presented separately in Table6, to avoid double-counting of data, they have not been included in the total countof sample results submitted for the present assessment (Table 5) or in the summaryof data by food category (see Table 7 below).
6.1.8 Ghana
Data on cadmium levels in two species of marine finfish in Ghana weresubmitted for the present assessment. A total of 144 samples of fish were collectedin 2008–2009. Of those, only 12 samples had detectable levels of cadmium (LOD= 0.002 mg/kg); the mean cadmium level overall was 0.000 02 mg/kg.
6.1.9 Japan
Aggregated data on cadmium levels in molluscs were submitted by theEnvironmental Science Research Laboratory in Japan. The data represented 67samples of molluscs collected from 2004 to 2007. The weighted mean level wasfound to be 0.346 mg/kg, with a maximum cadmium level reported to be 1.4 mg/kg.
6.1.10 Singapore
Cadmium data on a range of foods were provided by Singapore. A total of482 individual results were submitted for samples collected in 2008. The majority(228) of samples were dried vegetables; these foods also had the highest cadmiumlevels, with a mean of 0.986 mg/kg and a maximum value of 14.87 mg/kg. Otherfoods that contained relatively high cadmium levels were shellfish/molluscs (meanof 0.288 mg/kg) and coffee, tea and cocoa (mean of 0.149 mg/kg). The LOD was0.04 mg/kg.
6.1.11 USA
Three different sources of individual data were provided by the USA. TheUnited States Food and Drug Administration (USFDA) provided 2306 results fromsamples collected in its TDSs between 2004 and 2008. LODs ranged from 0.001 to0.004 mg/kg. Nuts and oilseeds were found to have the highest cadmium levels(mean of 0.131 mg/kg and maximum of 0.874 mg/kg). Meat liver had a meancadmium concentration of 0.06 mg/kg. All other foods had mean concentrations of0.021 mg/kg or less.
Cadmium results from other USFDA monitoring programmes were alsosubmitted; these included 951 results from samples collected from 2003 to 2006.Nine food categories were represented, although finfish and shellfish comprise the
CADMIUM (addendum) 347

majority of samples. LODs or LOQs were not reported. Nuts and oilseeds, spicesand shellfish had the highest mean cadmium levels (0.117, 0.228 and 0.429 mg/kg,respectively).
The United States Department of Agriculture (USDA) submitted a total of4154 results for three subcategories (muscle, liver and kidney) of meat and poultrytissue. The samples were collected from 2003 through 2008. Kidney and livertissues were found to contain higher mean cadmium levels than muscle. Highestlevels were found in meat kidney (mean of 0.498 mg/kg and maximum of 9.054 mg/kg) and poultry kidney (mean of 0.464 mg/kg and maximum of 11.40 mg/kg).
6.1.12 Viet Nam
Aggregated data on cadmium levels in oysters and clams from samplescollected in 2007 were submitted by Viet Nam. The weighted mean of all sampleswas found to be 0.487 mg/kg. The maximum level found was 0.980 mg/kg. Neitherthe LOD nor the LOQ was specified.
6.1.13 Food industry
Aggregated data on raw materials used worldwide were submitted by thefood industry. The samples were collected between 2002 and 2009; it was notpossible to separate the data by sampling year, so results prior to 2003 are includedin the data summaries. Overall, the data represented analytical results of 10 929samples. Weighted mean cadmium levels were calculated for all food categories.Highest mean levels were found in molluscs (4.213 mg/kg) and in coffee, tea andcocoa (particularly the latter) (1.75 mg/kg). LODs and LOQs were not reported.
6.2 Cadmium occurrence data by food category
Cadmium occurrence data submitted for this meeting are summarized byfood category in Table 7. For each food category, the total number of samples andthe number of countries or region (i.e. Europe or industry) represented by the dataare reported. As noted above, because the data for Europe that were submitted byEFSA included data from France, the data submitted separately by France have notbeen included in Table 7. The range of national or regional mean cadmiumconcentrations is reported, as well as the current Codex MLs that have beenestablished for commodities within the food category.
For all food categories, calculations of mean concentrations included resultsbelow the LOD or LOQ (i.e. non-detects). EFSA assumed a value of one half theLOD or LOQ when calculating mean concentrations; mean cadmium levels for othercountries were calculated assuming a concentration of 0 mg/kg for non-detects.
National mean concentrations of cadmium ranged between not detected(ND) and 0.04 mg/kg in most food categories. Higher national mean concentrations,ranging from 0.1 to 4.8 mg/kg, were reported for vegetables (including dried); meatand poultry offal; shellfish/molluscs; nuts and oilseeds; coffee, tea and cocoa; andspices.
348 CADMIUM (addendum)

Table 7. Cadmium occurrence data summarized by food category
Food category Totalno. of
samples
No. ofcountries/region
contributing data
Range of national orregional mean cadmiumconcentrations (mg/kg)
Codex MLs(mg/kg)
Wheat (includingbreads)
1 503 3 0.009–0.04 0.2
Rice 2 295 3 0.004–0.02 0.4
Oats 211 3 0.003–0.02 0.1
Baked goods 55 3 ND–0.02 —
Cereals/grains, other 12 637 6 ND–0.02 0.1
Roots & tubers 2 319 5 0.006–0.04 0.1
Pulses & legumes 169 4 0.003–0.03 0.1 (pulses)
Fruits 6 314 5 0.001–0.007 —
Fruit juices 3 932 5 ND–0.003 —
Dried fruit 79 2 0.003–0.009 —
Vegetables 18 183 6 0.006–0.1 0.05–0.2a
Dried vegetables 348 3 0.09–1.0 —
Meat and poultry, NFS 20 154 2 0.008–0.04 —
Meat and poultry offal,NFS
16 049 1 0.1 —
Meat muscle 1 715 4 0.001–0.003 —
Meat offal 1 406 3 0.03–0.5 —
Poultry muscle 2 500 4 0.0002–0.01 —
Poultry offal 1 224 3 0.006–0.5 —
Eggs 736 5 0.0001–0.007 —
Finfish 10 531 6 ND–0.008 —
Shellfish/molluscs 7 403 10 0.01–4.8 2b
Dairy products 9 208 5 ND–0.004 —
Nuts & oilseeds 350 4 0.02–0.1 —
Animal & vegetable fats 1 610 5 ND–0.006 —
Coffee, tea & cocoa 3 505 5 0.0001–1.8 —
Sugar, honey & sweets 3 908 5 ND–0.03 —
Spices 2 237 5 0.006–0.2 —
CADMIUM (addendum) 349

7. FOOD CONSUMPTION AND DIETARY EXPOSURE ESTIMATES
7.1 National and regional estimates of dietary exposure
New information on national estimates of dietary exposure to cadmium wassubmitted by Australia, China, Japan and the USA. EFSA submitted dietaryexposure estimates for Europe. Additional information on national dietary exposurefor Chile, Lebanon and the Republic of Korea was obtained from the scientificliterature. National and regional exposure estimates were expressed on either adaily or weekly basis, as these estimates are based on 1- to 7-day food consumptionsurveys. During the meeting, the Committee concluded that a provisional tolerablemonthly intake (PTMI) was appropriate for cadmium (see section 10). Forcontaminants such as cadmium that are widely distributed in foods at approximatelyconstant levels, day-to-day variability in dietary exposure over the long term wouldbe low, so extrapolating dietary exposure from a daily or weekly basis to a monthlybasis would not have a substantial impact on exposure estimates. Therefore, thenational and regional exposure estimates as reported below were extrapolated to amonthly basis by multiplying daily exposures by 30 or weekly exposures by 4.
7.1.1 Australia
Food Standards Australia New Zealand has conducted two recent TDSs thatincluded assessments of cadmium in foods: the 20th Australian TDS in 2000–2001and the 23rd Australian TDS in 2008–2009. Analytical results from the 23rdAustralian TDS were described and summarized in the previous section of thisreport. As dietary exposure estimates from the most recent TDS have not yet beencompleted, those from the 20th TDS (2000–2001) are presented in Table 8.
Table 7 (contd)
Foodcategory
Total no.of
samples
No. ofcountries/region
contributing data
Range of national orregional mean cadmiumconcentrations (mg/kg)
Codex MLs (mg/kg)
Alcoholicbeverages
3 443 4 ND–0.004 —
Drinking-water(bottled &tap)
21 472 3 ND–0.0004 0.003 (naturalmineral water)
Total no. ofsamples
155 496
ND, not detecteda MLs for vegetables: 0.05 mg/kg for brassica, bulb and fruiting vegetables, excluding tomatoes
and fungi; 0.1 mg/kg for stalk, stem and legume vegetables; and 0.2 mg/kg for leafyvegetables.
b ML for cephalopods and bivalves, excluding scallops and oysters.
350 CADMIUM (addendum)

Table 8. Dietary exposure to cadmium in Australia (2000–2001)
Population subgroup Averagebody weight
(kg)
Exposure (μg/kg bw per month)
Lower bound (ND = 0) Upper bound (ND = LOR)
Infants 9 months 9.2 3.9 20.4
Toddlers 2 years 14 5.4 17.1
Boys 12 years 49 3.3 8.7
Girls 12 years 52 2.7 6.6
Adult males 25–34 years 82 2.4 7.2
Adult females 25–34years
66 2.1 6.6
Lower- and upper-bound estimates of exposure were calculated for sixpopulation subgroups. Both estimates were based on mean food consumption datafrom the 1995 Australian National Nutrition Survey. The lower-bound estimateswere based on median cadmium concentrations in foods, assuming that resultsbelow the LOR were equal to zero, whereas upper-bound estimates assumed thatresults below the LOR were equal to the LOR. Table 8 summarizes the range ofexposure estimates per kilogram of body weight per month. Estimates of exposuresfor infants and toddlers range (from lower to upper bound) from 3.9 to 20.4 μg/kgbw per month. Exposures for boys and girls 12 years of age range from 2.7 to 8.7μg/kg bw per month, whereas those for adults range from 2.1 to 7.2 μg/kg bw permonth. No information was provided regarding contributions of specific foodcategories to overall exposure.
7.1.2 China
China completed its most recent TDS in 2007, from which the mean cadmiumconcentrations in 12 food group composites from 12 geographic regions (provinces)were reported above (Table 6). Dietary exposures were estimated from thesecadmium occurrence data, but assuming a value of one half the LOD for non-detectsrather than zero, as reported in Table 6.
Estimated regional cadmium exposures ranged from 0.5 μg/kg bw per monthin Ningxia province to 36.5 μg/kg bw per month in Sichuan province (Table 9). Thenational average cadmium exposure was estimated to be 9.9 μg/kg bw per month.
Based on the national average estimate of exposure, the food categoriesthat contributed most to cadmium exposure were cereals/grains (32%) andvegetables (25%). For Sichuan province, which had the highest cadmium exposure,cereals accounted for 85% of the total exposure; the cadmium level in the cerealscomposite sample from this province was 0.067 mg/kg, which is about 6 times thenational mean concentration in cereals.
CADMIUM (addendum) 351

Although cereals were the main source of dietary exposure to cadmium inmost provinces, vegetables, meat and seafood were significant sources in severalprovinces. Vegetables accounted for 62% and 69% of total cadmium exposure inShanxi and Shanghai provinces, respectively. Meat was the major source ofcadmium in the diet in Heilongjiang and Hubei provinces. Seafood contributed 88%of the total dietary cadmium in Liaoning province.
7.1.3 Europe
Dietary exposure estimates for Europe were calculated for the recent EFSAassessment on cadmium in foods (EFSA, 2009a). The cadmium occurrence datasummarized in Table 6 were used in the exposure estimates, after applying thesampling adjustment factor to the mean cadmium concentrations to correct for theunbalanced proportion of samples analysed in food categories in relation to theirrelative consumption amounts.
Several food consumption databases were used in order to estimateexposure for different population subgroups: the EFSA Concise European FoodConsumption Database (EFSA, 2008), French data on food consumption byovolactovegetarians and Italian data on food consumption by children.
Table 9. Dietary exposure to cadmium in China (2007)
Province Mean exposure(μg/kg bw per month)a
Major sources of exposure (% of total exposure)
Heilongjiang 6.8 Meat (93%)
Liaoning 5.2 Seafood (88%)
Hebei 2.6 Legumes (36%) + seafood (34%)
Shanxi 1.2 Vegetables (62%)
Henan 2.7 Cereals (50%) + vegetables (45%)
Ningxia 0.5 Cereals (39%) + potatoes (23%)
Shanghai 4.7 Vegetables (69%)
Fujian 14.7 Cereals (40%) + vegetables (37%)
Jiangxi 22.4 Cereals (92%)
Hubei 9.7 Meat (53%) + vegetables (41%)
Sichuan 36.5 Cereals (85%)
Guangxi 10.3 Cereals (37%) + legumes (24%)
National average 9.9 Cereals (32%) + vegetables (25%)
a Based on mean cadmium concentration (ND = LOD/2) and body weight of 63 kg.
352 CADMIUM (addendum)

The EFSA Concise European Food Consumption Database was compiledfrom data provided by 16 European countries on food consumption by adults. (Notethat the countries that provided the cadmium occurrence data summarized in Table6 are not necessarily the same countries represented in the consumption database.)The EFSA database includes mean consumption estimates for each of 15 broadfood categories for each of the 16 countries. The cadmium occurrence datasubmitted for the EFSA assessment were aggregated to these same foodcategories so that the consumption and occurrence data could be linked. Dietaryexposure was estimated by multiplying mean consumption per food category foreach country by the adjusted (weighted) mean cadmium concentration for each foodcategory. A body weight of 60 kg was used as the default for all countries whenconverting exposure estimated from a per person basis to exposure per kilogramof body weight.
Mean exposure for adults ranged from 7.6 μg/kg bw per month (Bulgaria) to11.8 μg/kg bw per month (Germany), with an estimated median European exposureof 9.1 μg/kg bw per month (Table 10). As the same mean cadmium concentrationsper food category were used in all calculations, differences in exposure estimatesreflect variability in national consumption patterns only.
National estimates of high exposures were also estimated for the adultpopulation based on the EFSA Concise European Food Consumption Database bysumming the 95th percentile exposures (consumers only) from the two foodcategories contributing most to exposure and the mean exposure (whole popu-lation) for other food categories. High exposure estimates ranged from 10.2 μg/kgbw per month (Finland) to 15.6 μg/kg bw per month (Slovakia), with an overallEuropean estimate of 12.1 μg/kg bw per month.
Regarding cadmium exposures for certain subpopulations, food consump-tion data from Italy were used to estimate exposure for children. Exposure forchildren 0.5–12 years of age was estimated to be 11.9 and 22.0 μg/kg bw per monthat the mean and 95th percentile, respectively. For estimating dietary exposure forvegetarians, detailed French consumption data for ovolactovegetarians were usedto represent vegetarians as a whole. From the French consumption data, it wasshown that vegetarians consume greater amounts of nuts, oilseeds, pulses andcereals. Average exposure of vegetarians in Europe to cadmium was modelled byusing results of exposure estimates for adults but replacing consumption of meatand fish groups with added consumption of nuts and oilseeds. The resultingestimate of average exposure was 21.60 μg/kg bw per month; high exposure wasnot estimated for this subgroup.
EFSA reported cadmium exposures from specific food categories (Table 11)for adults only. These were estimated by multiplying the median consumption values(consumers only) across the 16 European countries that submitted consumptiondata by the adjusted mean cadmium occurrence values for each food category.Food categories contributing most to adult exposure to cadmium included cerealsand grains; vegetables, nuts and pulses; and edible offal and offal products. Asthese estimates were based on consumers-only consumption data, they could notbe summed to calculate the total exposure or the relative contributions of each foodcategory to total exposure.
CADMIUM (addendum) 353
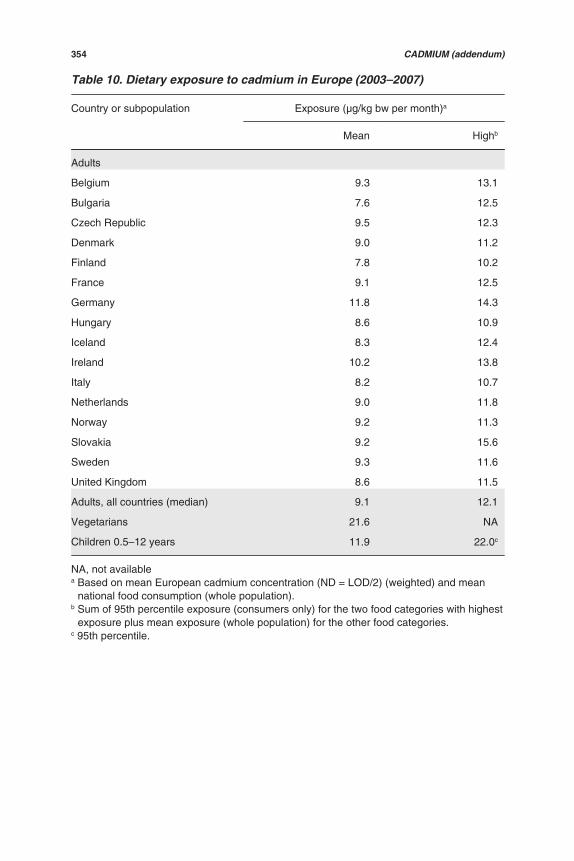
Table 10. Dietary exposure to cadmium in Europe (2003–2007)
Country or subpopulation Exposure (μg/kg bw per month)a
Mean Highb
Adults
Belgium 9.3 13.1
Bulgaria 7.6 12.5
Czech Republic 9.5 12.3
Denmark 9.0 11.2
Finland 7.8 10.2
France 9.1 12.5
Germany 11.8 14.3
Hungary 8.6 10.9
Iceland 8.3 12.4
Ireland 10.2 13.8
Italy 8.2 10.7
Netherlands 9.0 11.8
Norway 9.2 11.3
Slovakia 9.2 15.6
Sweden 9.3 11.6
United Kingdom 8.6 11.5
Adults, all countries (median) 9.1 12.1
Vegetarians 21.6 NA
Children 0.5–12 years 11.9 22.0c
NA, not availablea Based on mean European cadmium concentration (ND = LOD/2) (weighted) and mean
national food consumption (whole population).b Sum of 95th percentile exposure (consumers only) for the two food categories with highest
exposure plus mean exposure (whole population) for the other food categories.c 95th percentile.
354 CADMIUM (addendum)

Table 11. Main sources of dietary exposure for adults in Europe
Food category Mean cadmiumoccurrencea
(mg/kg)
Medianconsumptionb
(consumers only)(g/day)
Cadmiumexposure
(consumers only)(μg/day)
Cereals/grains 0.016 257 4.2
Vegetables, nuts, pulses 0.019 194 3.7
Meat + offal combined 0.017 151 2.5
Offal only 0.126 24 3.0
Meat 0.008 132 1.0
Starchy vegetables/roots 0.021 129 2.7
Alcoholic beverages 0.004 413 1.7
Fish and seafood 0.027 62 1.7
Sugars 0.026 43 1.1
Milk and dairy products 0.004 287 1.1
Coffee, tea, cocoa 0.002 601 1.1
Juices, soft drinks, bottledwater
0.001 439 0.4
Miscellaneous foods 0.024 14 0.3
Fats (vegetable + animal) 0.006 38 0.2
Tap water 0.000 349 0.1
Eggs 0.003 25 0.08
a Mean (ND = LOD/2) (adjusted).b Median of national estimates, consumers only.
7.1.4 USA
The USFDA conducts its TDS continuously, and foods are routinely analysedfor cadmium. Cadmium levels in samples collected between 2004 and 2008 (Table6) and consumption data from the 2003–2006 NHANES were used to estimatedietary exposure. Monte Carlo simulations were run for 14 population subgroupsusing the full distribution of both consumption and cadmium occurrence data; forthe latter, all samples with results below the LOD were assigned a value of zero.
Estimates of mean and 90th percentile exposures are reported in Table 12.Infants and children 2 years and 6 years of age had the highest cadmium exposures,with means of 9.4, 12.9 and 10.9 μg/kg bw per month, respectively. Exposures atthe 90th percentile were 17.6, 21.5 and 17.1 μg/kg bw per month, respectively.
Mean exposures for teenagers and adults were similar, ranging from 4.1 to5.5 μg/kg bw per month. Boys 14–16 years of age had the highest 90th percentileexposures, at 10.1 μg/kg bw per month.
CADMIUM (addendum) 355

Table 12. Dietary exposure to cadmium in the USA (2004–2008)
Population subgroup Exposure (μg/kg bw per month)a
Mean 90th percentile
M + F 6–11 months 9.4 17.6
M + F 2 years 12.9 21.5
M + F 6 years 10.9 17.1
M + F 10 years 7.2 12.7
M 14–16 years 5.5 10.1
F 14–16 years 5.3 8.9
M 25–30 years 5.3 9.5
F 25–30 years 4.6 8.6
M 40–45 years 4.7 7.2
F 40–45 years 4.5 8.4
M 60–65 years 4.7 8.9
F 60–65 years 4.3 7.2
M 70+ years 4.1 6.9
F 70+ years 4.5 8.3
F, female; M, malea Based on distributions of cadmium occurrence data (ND = 0) and individual consumption
data and self-reported body weights of consumption survey participants.
7.1.5 Estimates of dietary exposure from the published literature
In addition to the dietary exposure estimates that were submitted for thepresent assessment, information on dietary exposure to cadmium in four countries(Chile, Japan, Lebanon and the Republic of Korea) was obtained from the literature.
Results of a TDS conducted in Chile in 2001–2002 showed an estimatedcadmium exposure of 21 μg/day or 0.3 μg/kg bw per day, based on a body weightof 68 kg (Munoz et al., 2005). This was extrapolated for the present assessment toan estimated exposure of 9 μg/kg bw per month. The major sources of cadmium inthe diet were fish and shellfish, spices and cereals.
In a study by Matsudo (2007), cadmium exposure in Japan was estimatedto be 21.1 μg/person per day, calculated as 0.4 μg/kg bw per day using a bodyweight of 53 kg. This was extrapolated to 12 μg/kg bw per month.
A TDS was conducted in Lebanon in 2004 in order to estimate dietaryexposure of urban adults to heavy metals and radionuclides (Nasreddine et al.,2006). Five market baskets consisting of 77 foods were collected in Beirut, and thefoods were prepared “as consumed” before analysis. Cadmium levels in those foods
356 CADMIUM (addendum)

were multiplied by national food consumption data, resulting in estimated mean andmaximum exposures of 1.2 and 1.6 μg/kg bw per week (or 0.17 and 0.23 μg/kg bwper day), respectively. These were extrapolated to 4.8 and 6.4 μg/kg bw per month.Grains, vegetables and drinking-water were the major sources of cadmium in thediet.
A study in the Republic of Korea reported an estimated cadmium exposureof 14.3 μg/person per day or 0.26 μg/kg bw per day, based on a body weight of 55kg (Lee et al., 2006). On a monthly basis, this would result in an exposure of 7.7 μg/kg bw. The two major sources of dietary exposure to cadmium were vegetables(especially seaweed) and fish.
7.1.6 Summary of national estimates of dietary exposure to cadmium
In summary, the national estimates of mean cadmium exposure for adultsranged from 2.2 to 12 μg/kg bw per month (Table 13). Estimates of high exposurefor adults reported for Europe, Lebanon and the USA were 12.1, 6.9, and 8.1 μg/kgbw per month, respectively.
For Australia, Europe and the USA, mean dietary exposure for children 0.5–12 years of age ranged from 2.7 to 12.9 μg/kg bw per month; the highest exposurefor this age group was reported for Europe (22.0 μg/kg bw per month). Dietaryexposure for vegetarians, as reported by EFSA, was estimated to be 21.6 μg/kg bwper month. Overall, the food categories that contributed most to cadmium exposure
Table 13. National estimates of dietary exposure to cadmium for adults
Country or region Treatment of NDoccurrence data inexposure estimates
Mean exposure (μg/kg bw per month)
High exposure (μg/kgbw per month)
Australia ND = 0 and ND = LOD 2.2–6.9 —
Chile Not specified 9 —
China ND = LOD/2 9.9 —
Europe ND = LOD/2 9.1a 12.1b
Japan Not specified 12 —
Lebanon ND = LOQ/2 5.2 6.9c
Republic of Korea ND = LOD 7.7 —
USAd ND = 0 4.6 8.1
a Median of mean exposure estimates for 16 European countries.b Sum of 95th percentile exposure (consumers only) for the two food categories with highest
exposure plus mean exposure (whole population) for the other food categories.c Calculated from mean food consumption and highest cadmium concentrations in each food
category.d Calculated from distributions of both food consumption and cadmium occurrence data; high
exposure equals 90th percentile of exposure.
CADMIUM (addendum) 357

were cereals/grains, vegetables, meat and poultry offal, and seafood (especiallymolluscs).
7.2 Regional estimates of dietary exposure
The Codex Alimentarius Commission guidelines for conducting exposureassessments for contaminants in foods (FAO/WHO, 2010) recommend thatregional dietary exposure estimates should be calculated using regional averagecontaminant values and the Global Environment Monitoring System – FoodContamination Monitoring and Assessment Programme (GEMS/Food) consump-tion cluster diets. Such estimates were not calculated for the present meetingbecause occurrence data were submitted by countries that represented only 2 ofthe 13 GEMS/Food clusters. Furthermore, national exposure estimates based onnational food consumption data were submitted by the countries that also submittedthe majority of new occurrence data. As the national estimates provided morerefined estimates than could be calculated with the consumption cluster diets, onlythe national estimates were considered in this assessment.
8. DOSE–RESPONSE ANALYSIS AND ESTIMATION OF CARCINOGENIC/TOXIC RISK
8.1 Biomarker studies
The predominant sites of cadmium accumulation that contribute to bodyburden are the liver, kidney and several other tissues, but particularly muscle, skinand bone. The highest concentrations are found in the liver and renal cortex. Theprimary toxic effect resulting from chronic cadmium exposure is impaired tubularreabsorption of filtered solutes. However, the critical concentration of cadmium inthe renal cortex that is likely to produce renal dysfunction remains a source ofinvestigation and discussion. Nevertheless, excess urinary excretion of lowmolecular weight proteins and solutes appears to be associated with reducedtubular reabsorption. It should be noted that low molecular weight proteins (e.g.
2MG, 1MG, RBP and N-acetyl- -D-glucosaminidase) are nonspecific for a givencadmium exposure and may not necessarily be adverse, but may indicate potentialrenal impairment. Clinically, impaired kidney function is usually apparent throughincreased levels of protein, amino acids, uric acid, calcium, copper and phosphorusin urine and/or serum. After prolonged cadmium exposure, increased levels of highmolecular weight proteins in urine or decreased serum clearance of creatinine areindicative of glomerular dysfunction, which is generally associated with progressiverenal damage.
A number of investigators have examined different data sets and cut-offcriteria to estimate a safe cadmium body burden as a function of cadmiumconcentration in urine. BMD analyses of data from populations living in areas inSweden (Suwazono et al., 2006) or Japan (Uno et al., 2005; Kobayashi et al., 2006)that are not polluted with cadmium or in cadmium-polluted areas in Japan (Shimizuet al., 2006) have been completed. These analyses used urinary cadmium level asa biomarker of cadmium exposure and the prevalence of abnormal levels of 2MG,
358 CADMIUM (addendum)

1MG (also known as pHC or protein heterogeneous in charge), total protein, N-acetyl- -D-glucosaminidase, RBP, albumin or GFR as biomarkers of renal tubulareffects. As summarized in Table 14, the BMDs for urinary cadmium levels varywidely between the studies, depending on the renal biomarker and the cut-off levelused.
8.2 Pivotal data from human clinical/epidemiological studies
To overcome the limitations inherent in a “key study” analysis, EFSA (2009b)undertook a comprehensive systematic literature review (published betweenJanuary 1966 and October 2008), using Cochrane methodology (see Higgins &Green, 2008), to compile a database for the purpose of deriving a BMD and its 95%confidence lower bound (BMDL) using cut-off points relevant to clinical changes intarget organs. Most published studies reported a relationship between urinarycadmium levels and renal biomarkers of cadmium toxicity. The most frequentlystudied low molecular weight protein biomarker of renal dysfunction was 2MG. Thedatabase compiled by EFSA covered approximately 30 000 predominately non-occupationally exposed individuals (99%) reported in 35 studies, but 2MG andcadmium concentrations in urine were expressed only as group means withstandard deviations. The majority of the individuals were of Asian descent (93.5%)and female (75%). The age distribution was approximately equally divided around50 years (i.e. 50 years: 51.5%; <50 years: 48.5%). The data for the populationaged 50 years and over in the 35 studies were assigned to concentration classes,resulting in 98 groups containing matched pairs of urinary cadmium and 2MGlevels. The 98 groups ranged in size from 3 to 908 individuals, with a median of 56.
EFSA (2009b) noted that there were few studies on effects of cadmium onbone; of those, most were considered to be heterogeneous and unsuitable. Theyalso considered associations between cadmium exposure and other non-renalhealth effects, including diabetes, hypertension, carcinogenicity, reproductive out-comes and neurotoxicity. EFSA (2009b) found the results of these studies to be toopreliminary to serve as the basis for its evaluation. Further work is needed to clarifythe contribution of exposure to cadmium to these diseases.
8.3 General modelling considerations
8.3.1 Data check
The database containing the 35 suitable studies and described in detail byEFSA (2009b) was checked for consistency and accuracy. Only one alteration wasmade to the database. In the study reported by Hotz et al. (1999), it was consideredunnecessary to transform the reported means and standard deviations to geometricvalues because it appeared as though they were already geometric values.
CADMIUM (addendum) 359

Tabl
e 14
. Ove
rvie
w o
f rec
ent s
tudi
es re
port
ing
benc
hmar
k do
se e
stim
atio
ns fo
r cad
miu
m le
vels
in u
rine
and
eff
ects
on
rena
ltu
bula
r fun
ctio
n
Stu
dypo
pula
tion
Cut
-off
leve
lS
ampl
e si
ze (
age
inye
ars)
Effe
ctbi
omar
ker
BM
Dm
odel
Urin
ary
cadm
ium
crit
ical
dos
e le
vel
(2M
G, μ
g/g
crea
tinin
e; N
AG
, U/g
crea
tinin
e; P
RO
T,
1MG
, mg/
g cr
eatin
ine)
Ref
eren
ce
BM
D5
/ BM
DL 5
BM
D10
/ B
MD
L 10
Gen
eral
popu
latio
n(J
apan
)
84%
upp
erlim
it va
lue
ofth
e ta
rget
popu
latio
n
410
M; 4
18 F
(40
–59
yea
rs)
Urin
e sa
mpl
ing
occu
rred
199
7–19
98
2MG
NA
GP
RO
T
Qua
ntal
linea
r m
odel
2MG
M: 0
.5 /
0.4
F: 0
.9 /
0.8
NA
GM
: 0.3
/ 0.
3F
: 0.8
/ 0.
6P
RO
TM
: 0.9
/ 0.
6F
: 3.2
/ 1.
8
2MG
M: 1
.0 /
0.7
F: 1
.8 /
1.3
NA
GM
: 0.7
/ 0.
6F
: 1.6
/ 1.
2P
RO
TM
: 1.9
/ 1.
2F
: 6.6
/ 3.
6
Uno
et a
l. (2
005)
Gen
eral
popu
latio
n(J
apan
)
84%
upp
erlim
it va
lue
ofth
e ta
rget
popu
latio
n of
thos
e w
ho h
adne
ver
smok
ed
1114
M; 1
664
F(
50 y
ears
), n
on-
smok
ers
2MG
NA
GP
RO
T
Log-
logi
stic
mod
el2M
GM
: 2.9
/ 2.
4F
: 3.8
/ 3.
3N
AG
M: 4
.8 /
3.3
F: 4
.7 /
3.7
PR
OT
M: 3
.6 /
3.1
F: 4
.8 /
4.2
2MG
M: 5
.0 /
4.0
F: 6
.6 /
5.5
NA
GM
: 8.3
/ 5.
7F
: 8.3
/ 6.
4P
RO
TM
: 5.6
/ 4.
9F
: 7.5
/ 6.
6
Kob
ayas
hi e
t al.
(200
6)
360 CADMIUM (addendum)
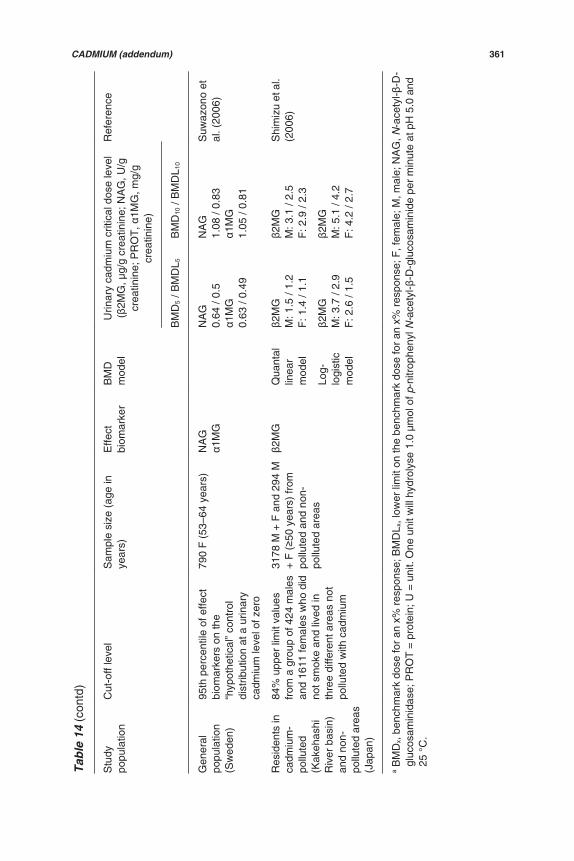
Tabl
e 14
(co
ntd)
Stu
dypo
pula
tion
Cut
-off
leve
lS
ampl
e si
ze (
age
inye
ars)
Effe
ctbi
omar
ker
BM
Dm
odel
Urin
ary
cadm
ium
crit
ical
dos
e le
vel
(2M
G, μ
g/g
crea
tinin
e; N
AG
, U/g
crea
tinin
e; P
RO
T,
1MG
, mg/
gcr
eatin
ine)
Ref
eren
ce
BM
D5
/ BM
DL 5
BM
D10
/ B
MD
L 10
Gen
eral
popu
latio
n(S
wed
en)
95th
per
cent
ile o
f effe
ctbi
omar
kers
on
the
“hyp
othe
tical
” co
ntro
ldi
strib
utio
n at
a u
rinar
yca
dmiu
m le
vel o
f zer
o
790
F (
53–6
4 ye
ars)
NA
G1M
GN
AG
0.64
/ 0.
51M
G0.
63 /
0.49
NA
G1.
08 /
0.83
1MG
1.05
/ 0.
81
Suw
azon
o et
al. (
2006
)
Res
iden
ts in
cadm
ium
-po
llute
d(K
akeh
ashi
Riv
er b
asin
)an
d no
n-po
llute
d ar
eas
(Jap
an)
84%
upp
er li
mit
valu
esfr
om a
gro
up o
f 424
mal
esan
d 16
11 fe
mal
es w
ho d
idno
t sm
oke
and
lived
inth
ree
diffe
rent
are
as n
otpo
llute
d w
ith c
adm
ium
3178
M +
F a
nd 2
94 M
+ F
(50
yea
rs)
from
pollu
ted
and
non-
pollu
ted
area
s
2MG
Qua
ntal
linea
rm
odel
2MG
M: 1
.5 /
1.2
F: 1
.4 /
1.1
2MG
M: 3
.1 /
2.5
F: 2
.9 /
2.3
Shi
miz
u et
al.
(200
6)
Log-
logi
stic
mod
el
2MG
M: 3
.7 /
2.9
F: 2
.6 /
1.5
2MG
M: 5
.1 /
4.2
F: 4
.2 /
2.7
a B
MD
x, b
ench
mar
k do
se fo
r an
x%
res
pons
e; B
MD
L x, l
ower
lim
it on
the
benc
hmar
k do
se fo
r an
x%
res
pons
e; F
, fem
ale;
M, m
ale;
NA
G, N
-ace
tyl-
-D-
gluc
osam
inid
ase;
PR
OT
= p
rote
in; U
= u
nit.
One
uni
t will
hyd
roly
se 1
.0 μ
mol
of p
-nitr
ophe
nyl N
-ace
tyl-
-D-g
luco
sam
inid
e pe
r m
inut
e at
pH
5.0
and
25 °
C.
CADMIUM (addendum) 361

8.3.2 Selection of mathematical model
Three different models were considered:
1) the Hill model, which is a four-parameter sigmoidal model (minimum, maximum,median effective dose [ED50] and a shape parameter);
2) an exponential model with a threshold, which has three parameters (minimum,threshold and slope);
3) a biexponential model with four parameters (minimum, slope 1, slope 2 and abreakpoint).
All three models provided a similar visual goodness of fit, but the biexpo-nential model was selected because it best showed the obvious transition orbreakpoint between the slope observed at low and high concentrations of cadmiumin urine (Figure 1). As the breakpoint is indicative of the onset of pathologicalchanges in renal tubular dysfunction, the Committee considered this model to besuitable to characterize the urinary cadmium/ 2MG dose–response relationship.The biexponential model is essentially the same as the piecewise-linear modeldescribed by EFSA (2009b). As individual subject data were not available andbecause much of the variation in outcome is attributable to within-group variation ofurinary cadmium, it is not possible to model potential variation in the cause–effectrelationship between the two biomarkers. This precluded the calculation of a BMDdefined by a population percentile (e.g. a BMD10), although a population averageBMD associated with a specific urinary concentration (e.g. 300–1000 μg/gcreatinine) could be calculated. In addition, an additional parameter was used toaccount for differences between Asians and Caucasians.
Parameter estimates were generated with linear regression, minimizing thesum of squares of the logs of the residuals. Log residuals were used in order toprevent domination of the parameter estimates by very high 2MG levels.
From Figures 1 and 2, it is apparent that Caucasians excrete less 2MG thanAsians for an equivalent concentration of cadmium. A possible explanation for thisdifference may be the way in which urinary 2MG and urinary cadmium excretionare expressed as a function of excreted creatinine. Creatinine excretion is knownto be affected by BMI and protein intake. This source of variation needs to beconsidered when comparing urinary cadmium data expressed as a function ofcreatinine between sexes and populations (Suwazono et al., 2005; Gerchman etal., 2009). In general, the mean or median BMI for Asian populations is lower thanthat observed for non-Asian populations (WHO Expert Consultation, 2004).
8.3.3 Use of the biexponential model in the evaluation
As described in section 8.3.2, the Committee chose the breakpoint for thesecond slope, which characterizes where the urinary 2MG concentration beginsto rapidly increase with increasing urinary cadmium concentration, as the basis ofthe evaluation. The breakpoint derived for the population aged 50 years and overcorresponds to 5.24 (5th–95th percentiles 4.94–5.57) μg/g creatinine. Hence, thebreakpoint value of 5.24 (5th–95th percentiles 4.94–5.57) μg of cadmium per gramcreatinine and associated uncertainty are similar to those reported by EFSA (2009b)
362 CADMIUM (addendum)

for the entire data set without covariates (i.e. 5.54; 95% CI 5.24–5.82). An inspectionof the plotted data using the biexponential model (Figure 3) illustrates that thisurinary cadmium concentration of 5.24 μg/g creatinine corresponds to the point atwhich the urinary 2MG concentration rises dramatically.
8.3.4 Toxicodynamic variability
Toxicodynamic variability in the dose–response relationship (i.e. variabilityin toxic response of the kidney to cadmium that has reached the target organ) is nottaken into account by the model, because the data represent only a populationaverage rather than individual data points. The lack of empirical evidence of aresponse below a urinary cadmium concentration of 5.24 (5th–95th percentiles4.94–5.57) μg/g creatinine indicates that the variance is small. Toxicodynamicvariability in the model was accounted for by introducing a log triangular distributionto represent individuals with increased or decreased susceptibility. The extremevalues of the distribution were defined with a maximum variability in either direction(increased or decreased susceptibility) that ranged from 1 to 3, with a median of 2.The value of 3 approximately corresponds to the toxicodynamic component of aconventional 10-fold uncertainty factor for interindividual variability (IPCS, 2005).Individual subjects were presumed to have a critical concentration (breakpoint)somewhere between the range defined by the mean multiplied or divided by themaximum value. As the same maximum value was used for both increased andreduced individual susceptibility, the adjustment resulted in broadened distributionsof both population variability and uncertainty without affecting the geometric centralestimates.
Figure 1. Data and models with log–log plot
CADMIUM (addendum) 363
10000
1000
100
10100
Cd-U (μg/g Creatinine)
β2M
G (μ
g/g
Cre
atin
ine)
Asians over 50
Caucasians over 50
Exponential + T - Asians
Exponential + T - Caucasians
Hill - Asians
Hill - Caucasians

8.3.5 Toxicokinetic modelling
The relationship between urinary cadmium concentration and dietarycadmium exposure was characterized by a one-compartment model reported byAmzal et al. (2009), which was based on a long-term study of Swedish women.Amzal et al. (2009) compared a complex eight-compartment model with a simplifiedone-compartment model and found that the simplified model provided an adequatedescription of the toxicokinetic relationship, while also allowing for an accounting ofpopulation variability. This one-compartment model consisted of two toxicokineticparameters (cadmium half-life and a constant that subsumed several physiologicalparameters) and a statistical parameter for variation in apparent half-life that wasused to account for individual variability.
This one-compartment model was used by the Committee for the evaluation.The confidence intervals associated with each of the parameters provided by Amzalet al. (2009) were used to generate the confidence intervals associated with themodel estimates. The calculated relationship between dietary cadmium exposureand urinary cadmium concentration is linear; therefore, the outcome may beexpressed as a population distribution of the ratio with confidence intervals(Figure 4).
Figure 2. Data and models with linear plot
364 CADMIUM (addendum)
Cd-U (μg/g Creatinine)
β2M
G (μ
g/g
Cre
atin
ine)
10
20000
18000
16000
14000
12000
10000
8000
6000
4000
2000
200
0
Asians over 50
Caucasians over 50
Exponential + T - AsiansExponential + T - CaucasiansHill - Asians

Figure 4. Population distribution of urinary to dietary cadmium ratios
Figure 3. The EFSA biexponential (piecewise-linear) dose–response model forurinary cadmium and 2MG concentrations
CADMIUM (addendum) 365
0%
10%
20%
30%
40%
50%
60%
70%
80%
90%
100%
0 1 2 3 4 5 6 7 8
C d-U (μg /g C rea�nine) / C d-diet (μg /kg bw-day)
Cumula�v
ePopula�o
nFrequen
cy
10
100
1000
10000
100000
1000000
1001010
Cd-U (μg/g Creatinine)
β2M
G (μ
g/g
Cre
atin
ine)
Asians
Caucasians
Biexponential

8.4 Estimating the relationship between urinary cadmium excretion anddietary cadmium exposure
A two-dimensional Monte Carlo simulation was used to estimate thepopulation percentiles with associated 5th to 95th percentile confidence intervalsfrom the variability and uncertainty in the breakpoint, the adjustment for toxico-dynamic variability and the toxicokinetic model (Figure 5). The simulation employed1000 iterations for the variability dimension and 300 for the uncertainty dimension.The dietary cadmium exposure (μg/kg bw per day) that equates to a urinarycadmium concentration of 5.24 (5th–95th percentiles 4.94–5.57) μg/g creatininewas estimated to be 1.2 (5th–95th percentiles 0.8–1.8) μg/kg bw per day at the 5thpopulation percentile. This is equivalent to 36 (5th–95th percentiles 24–54) μg/kgbw per month. The Committee decided to use the lower bound of the CI to accountfor particularly susceptible individuals so that they would remain below the point atwhich renal pathology is indicated by increased urinary 2MG levels.
9. COMMENTS
9.1 Absorption, distribution, metabolism and excretion
In previously reviewed studies, the Committee noted that most ingestedcadmium passes through the gastrointestinal tract largely without being absorbed.In mice, rats and monkeys, the absorption of cadmium from the gastrointestinal tract
Figure 5. Population distribution of dietary cadmium exposure with 5th–95thpercentile confidence intervals
366 CADMIUM (addendum)
0%
10%
20%
30%
40%
50%
60%
70%
80%
90%
100%
0 50 100 150 200
Dietary C d (μg /kg bw per month)
Cum
ulat
ive
Pop
ulat
ion
Fre
quen
cy

depends on the type of cadmium compound, dose and frequency, age andinteraction with various dietary components. A recent study has shown thatexpression of DMT1 and MTP1 genes is upregulated in response to iron-deficientdiets. This upregulation may explain the observation that both the urinary cadmiumexcretion and kidney cadmium concentration were significantly higher in womenwith low iron stores (serum ferritin concentration below 30 μg/l).
The oral bioavailability of cadmium in laboratory animals ranges from 0.5%to 3.0%, on average. Following absorption, cadmium binds to metallothionein, butthis binding can be overloaded at relatively moderate doses. Cadmium is distributedmainly to the liver, kidneys and placenta. The cadmium concentrations in liver andkidneys are comparable after short-term exposure, but the kidney concentrationgenerally exceeds the liver concentration following prolonged exposure, except atvery high exposures. Cadmium present in liver and kidney accounts for more thanhalf of the body burden. The retention of cadmium in various tissues is variable, andits release appears to be multiphasic. The apparent half-life estimates rangebetween 200 and 700 days for mice and rats and up to 2 years in the squirrelmonkey.
In humans, about 50% of the cadmium body burden is found in kidneys.Other major bioaccumulating organs or tissues contributing to the body burden areliver (15%) and muscle (20%). The quantity of cadmium in bone is small. The slowexcretion of cadmium results in a long biological half-life, which has been estimatedto be between 10 and 33 years. A recent estimate, based on long-term dietaryexposure data covering a period of 20 years from a Swedish cohort of 680 womenaged between 56 and 70 years, indicated an apparent half-life of kidney cadmiumof 11.6 years, with a standard deviation of 3.0 years (Amzal et al., 2009). A one-compartment toxicokinetic model was applied to these dietary exposure data. Theaverage daily dietary exposure was reported to be 14 μg (0.2 μg/kg bw), and themean urinary cadmium level was 0.34 μg/g creatinine. Based on the model, thepopulation distribution of the daily dietary cadmium exposure corresponding to agiven level of urinary cadmium could be obtained (see section 9.9.3).
9.2 Toxicological data
In previously reviewed studies, the Committee noted that long-term oralexposure to cadmium resulted in a variety of progressive histopathological changesin the kidney, including epithelial cell damage of proximal tubules, interstitial fibrosisand glomerular basal cell damage with limited tubular cell regeneration. Biochemicalindications of renal damage were seen in the form of low molecular weightproteinuria, glucosuria and aminoaciduria. Tubular dysfunction also caused anincrease in the urinary excretion of cadmium.
9.3 Observations in humans
A number of new epidemiological studies have assessed factors influencingcadmium concentrations in kidney and urine following environmental exposure, aswell as the relationship between cadmium exposure and several health effects.
CADMIUM (addendum) 367

The kidney is the critical target organ for the long-term effects of cadmium,showing a variety of progressive histopathological changes, including epithelial celldamage in the proximal tubule, interstitial fibrosis and glomerular basal cell damage.The earliest manifestation of cadmium-induced nephrotoxicity is renal tubulardysfunction, which most often manifests as the urinary excretion of low molecularweight proteins and enzymes, such as 2MG, RBP, 1MG and N-acetyl- -D-glucosaminidase. Urinary 2MG level has been the most widely used marker ofrenal tubular dysfunction.
Several studies monitoring populations following a reduction in cadmiumexposure have attempted to address the question of the reversibility of early renalchanges. A modest increase in urinary excretion of 2MG or RBP, in the range of300–1000 μg/g creatinine, is unlikely to indicate compromised renal function and isusually reversible after cadmium exposure is reduced. With 2MG or RBP excretionabove 1000 μg/g creatinine, proteinuria due to renal tubular dysfunction becomesirreversible, although GFR is normal or only slightly impaired; when the urinaryexcretion of these proteins is increased up to 10 000 μg/g creatinine, renal tubulardysfunction progresses to overt nephropathy usually associated with a lower GFR.These values have been used as cut-off criteria to estimate cadmium nephrotoxicity(measured by urinary 2MG excretion) as a function of cadmium concentration inurine. Although there is good evidence demonstrating relationships between urinaryexcretion of cadmium and various renal biomarkers (e.g. urinary 2MG or RBPconcentration), the health significance of these nonspecific biomarkers in relationto cadmium-induced renal damage remains somewhat uncertain. These biomarkerchanges in the lower range (i.e. 300–1000 μg/g creatinine) might reflect an earlyrenal response to cadmium, which may be purely adaptive or reversible.
Previously reviewed studies have shown that effects on bone generally ariseonly after kidney damage has occurred and are likely to be secondary to resultingchanges in calcium, phosphorus and vitamin D metabolism. Recent studies haveevaluated the association between cadmium and bone mineral density orosteoporosis in populations with low-level cadmium exposure. Although thesestudies found a significant inverse association between the score of bone mineraldensity and urinary excretion of cadmium at low levels of exposure, they did notassess renal damage. In one of these studies, in Sweden, the incidence of forearmfractures was significantly increased (by 18%) per unit of urinary cadmium (1 μg/gcreatinine). In a Belgian study, a significant relative risk of fractures of 1.73 wasassociated with a doubling of mean cadmium excretion in the urine (1.66 versus0.83 μg/g creatinine) among women. There was no association between fracturesand cadmium levels among men. Another study in Belgium that investigated theassociation between urinary cadmium and bone mineral density also measuredmarkers of bone resorption, renal tubular dysfunction and calcium metabolism. Inthis study, even in the absence of renal tubular dysfunction, urinary cadmium levelwas associated with reduced bone mineral density, increased calciuria and reducedlevels of serum parathyroid hormone. However, four additional studies failed toshow any association between urinary cadmium and bone mineral density orcalcium metabolism, or the association was no longer significant after controllingfor age, body weight and smoking, in the absence of renal tubular damage. The
368 CADMIUM (addendum)

assessment of the association between urinary cadmium and bone mineral densityis based upon different types of epidemiological designs, including prospective andcross-sectional studies, with variable power and different degrees of control of therelevant confounders. Although the overall evidence at present points to anassociation between urinary cadmium and a decrease in bone mineral density, it isunclear whether the effect is secondary to renal tubular dysfunction. Therefore, thedata do not provide a basis for a dose–response analysis of the direct effects ofcadmium on bone mineral density.
Cadmium has been classified by the International Agency for Research onCancer (IARC) as carcinogenic to humans (group 1), with sufficient evidence forlung cancer and limited evidence for kidney, liver and prostate cancer. Most of theevidence is derived from high cadmium exposure of workers exposed throughinhalation. Some case–control studies have reported associations of bladder cancerwith increased levels of blood cadmium, breast cancer with increased urinaryexcretion of cadmium and prostate cancer with increased levels of cadmium intoenails; the relationship between cadmium concentration in toenails and dietaryexposure is unknown. A prospective study in Sweden reported a significantlyincreased risk of endometrial cancer in relation to dietary intake of cadmium inpostmenopausal women.
In several cross-sectional studies, increased levels of cadmium measuredin blood or urine have been found to be associated with various cardiovascular end-points, including myocardial infarction, stroke, heart failure, hypertension andchanges in measures of arterial function (aortic pulse wave velocity and carotid,brachial and femoral pulse pressures). The epidemiological evidence for anassociation between cardiovascular diseases and cadmium is weak.
Prospective studies of the relationship between mortality and environmentalexposure to cadmium were also available. In one study, based on a representativesample of the population of the USA with 9 years of follow-up, a doubling of theurinary cadmium level (0.64 versus 0.32 μg/g creatinine) was observed. This wasassociated with a 28% increased mortality by all causes, 55% increased mortalityby cancer, 21% increased mortality by cardiovascular diseases and 36% increasedmortality by coronary heart disease, which were statistically significant among men.No significant effects were observed among women. In a study from Belgium ofsubjects from a cadmium-polluted area and a control area with a follow-up of 20years, a doubling of the mean urinary cadmium concentration (1.36 versus 0.68 μg/gcreatinine) was significantly associated with 20% increased risk of mortality by allcauses, 43% increased mortality for cancer and 44% increased mortality for non-cardiovascular diseases. Two prospective studies assessed mortality, renal tubulardysfunction and environmental exposure to cadmium in cohorts of residents inhighly polluted areas in Japan. One of them reported a significant increase of 41%in mortality for subjects with 2MG excretion greater than or equal to 1000 μg/gcreatinine, compared with the regional reference death rate, after 20 years of follow-up. The other study, with a follow-up of 15 years, found a significant increase inoverall mortality of 27% in men and 46% in women with 2MG urinary levels above1000 μg/g creatinine; moreover, among subjects with 2MG urinary levels between
CADMIUM (addendum) 369

300 and 1000 μg/g creatinine, there was a significantly increased risk of death bycerebral infarction, digestive diseases (men) and heart failure (women).
9.4 Analytical methods
Analytical methods for the determination of cadmium in foods, water andbiological materials are well established; the detection techniques include FAAS,ETAAS, BIFF-AAS, HG-AFS, ICP-OES and ICP-MS. HR-CS-ETAAS allows directanalysis of solids with improved LODs. In recent years, the use of DRC-ICP-MS hasallowed the removal of the interferences with a minimum loss of sensitivity. AlthoughETAAS has been extensively used, ICP-MS could be considered as the method ofchoice, as it offers lower LODs and wide dynamic range and allows simultaneousdetermination of several elements. Additionally, ICP-MS offers high specificitythrough spectral interpretation and isotopic information. Microwave-assisted aciddigestion has been the preferred sample preparation technique, although othertechniques, such as ashing and slurry preparation, have been used.
Most data submitted were obtained using the above methods, which werevalidated. Laboratories followed good quality assurance programmes; some hadalso participated in proficiency testing schemes and achieved good z-scores.
9.5 Sampling protocols
General guidance for sampling is described in the Codex AlimentariusCommission guidelines CAC/GL 50-2004 (FAO/WHO, 2004).
9.6 Prevention and control
There have been worldwide efforts to reduce cadmium exposure, includingimplementation of MLs for cadmium in foods, food additives and water. Otherprevention and control measures include controlling cadmium levels in fertilizersand feeds and following good agricultural and manufacturing practices.
9.7 Levels and patterns of contamination in food commodities
At its present meeting, the Committee reviewed new cadmium occurrencedata submitted by EFSA, covering 19 European countries (Austria, Belgium,Bulgaria, Cyprus, Estonia, France, Germany, Greece, Iceland, Ireland, Italy, theNetherlands, Poland, Romania, Slovakia, Slovenia, Spain, Sweden and the UnitedKingdom), as well as data submitted by 11 other countries (Australia, Brazil,Canada, Chile, China, France, Ghana, Japan, Singapore, the USA and Viet Nam).The food industry also submitted data on cadmium levels in products that aredistributed and used worldwide. The total number of analytical results (single orcomposite samples) was 155 496, with 84.4% coming from Europe, 5.2% from NorthAmerica, 1.5% from Asia, 1.4% from Latin America, 0.3% from the Pacific regionand 0.1% from Africa. The data submitted by industry accounted for 7.0% of thedata.
A summary of the new occurrence data by food category is provided in Table7 (see section 6.2). For all food categories, calculations of mean concentrations
370 CADMIUM (addendum)
included results below the LOD or LOQ (i.e. non-detects or ND), although the valuesassigned to those results varied by country. National average concentrations ofcadmium range between not detected and 0.04 mg/kg in most food categories.Higher national mean concentrations, ranging from 0.1 to 4.8 mg/kg, were reportedfor vegetables (including dried); meat and poultry offal; shellfish/molluscs; nuts andoilseeds; coffee, tea and cocoa; and spices.
9.8 Food consumption and dietary exposure assessment
New information on national estimates of dietary exposure to cadmium wassubmitted by Australia, China, Japan and the USA. EFSA submitted dietaryexposure estimates for Europe. Additional information on national dietary exposurefor Chile, Lebanon and the Republic of Korea was obtained from the scientificliterature. National and regional exposure estimates were expressed on either adaily or weekly basis, as these estimates are based on 1- to 7-day food consumptionsurveys. During the meeting, the Committee concluded that a PTMI was appropriatefor cadmium (see section 10). For contaminants such as cadmium that are widelydistributed in foods at approximately constant levels, day-to-day variability in dietaryexposure over the long term would be low, so extrapolating dietary exposure froma daily or weekly basis to a monthly basis would not have a substantial impact onexposure estimates. Therefore, the national and regional exposure estimates wereextrapolated to a monthly basis by multiplying daily exposures by 30 or weeklyexposures by 4.
Mean cadmium exposure for adults ranged from 2.2 to 12 μg/kg bw permonth (see Table 13 in section 7.1.6). Estimates of high exposures reported forEurope, Lebanon and the USA ranged from 6.9 to 12.1 μg/kg bw per month. ForAustralia and the USA, dietary exposure for children 0.5–12 years of age rangedfrom 3.9 to 20.6 μg/kg bw per month. Dietary exposure for vegetarians, as reportedby EFSA, was estimated to be 23.2 μg/kg bw per month.
The food categories that contributed most to cadmium exposure werereported by Chile, China, Europe, Lebanon and the Republic of Korea. For Chile,the major sources of cadmium in the diet were fish and shellfish, spices and cereals/grains. For China, the main contributors to dietary exposure to cadmium on anational basis were cereals/grains and vegetables; meat and seafood were foundto be the main dietary sources of cadmium in several regions within China. Cereals/grains, vegetables/nuts/pulses and animal offal were the main dietary sources ofcadmium in Europe. In the Republic of Korea, the main sources of cadmium in thediet were rice, vegetables/seaweed and seafood. The major sources of cadmium inthe Lebanese diet were reported to be cereals/grains and vegetables.
The Codex Alimentarius Commission guidelines for conducting exposureassessments for contaminants in foods (FAO/WHO, 2010) recommend thatregional dietary exposure estimates should be calculated using regional averagecontaminant values and the GEMS/Food consumption cluster diets. Such estimateswere not calculated for the present meeting because occurrence data weresubmitted by countries that represented only 2 of the 13 GEMS/Food clusters.Furthermore, national exposure estimates based on national food consumption data
CADMIUM (addendum) 371

were submitted by the countries that also submitted the majority of new occurrencedata. As the national estimates provided more refined estimates than could becalculated with the GEMS/Food consumption cluster diets, only the nationalestimates were considered in this assessment.
9.9 Dose–response analysis
The basis of the current PTWI is an estimate of a critical cadmiumconcentration in the kidney cortex at or below which there is no observed increasein 2MG concentrations in urine. A toxicokinetic model was used to estimate thedietary exposure required to reach this critical cadmium concentration in the kidneycortex. An alternative approach is to identify a threshold level of a urinary biomarkerof renal tubular damage, such as 2MG, and then use a toxicokinetic model tocalculate the dietary exposure corresponding to that threshold level.
9.9.1 Biomarker meta-analysis
In order to determine a dose–response relationship between a suitablebiomarker and urinary cadmium levels for the general population, the data availablein published studies were compiled and used for a meta-analysis to characterizethe relationship between urinary 2MG and urinary cadmium levels (EFSA, 2009b).Urinary 2MG level was chosen as the most suitable biomarker for the meta-analysis because it is widely recognized as a marker for renal pathology andconsequently had the largest number of available data. The database coversapproximately 30 000 predominantly non-occupationally exposed individuals (99%)reported in 35 studies, but the data are expressed only as group means withstandard deviations. The majority of these non-occupationally exposed individualswere of Asian descent (93.5%) and female (75%). The age distribution wasapproximately equally divided above and below 50 years (i.e. 50 years: 51.5%;<50 years: 48.5%). As the apparent half-life of cadmium in human kidneys is about15 years, steady state would be achieved after 45–60 years of exposure. Therefore,data relating 2MG excretion in urine to cadmium excretion in urine for individualswho are 50 years of age and older should provide the most reliable basis todetermine a critical concentration of cadmium in the urine. The data for thepopulation aged 50 years and over in the 35 studies were categorized according tourinary cadmium concentration, resulting in 98 groups containing matched pairs ofurinary cadmium and 2MG levels. The 98 groups ranged in size from 3 to 908individuals, with a median of 56.
The Committee identified the biexponential model as being suitable tocharacterize the cadmium– 2MG dose–response relationship. In the model, thefirst (low urinary cadmium concentration) slope is virtually flat, and only the second(high urinary cadmium concentration) slope was considered by the Committee tobe indicative of renal pathology (see Figure 3 in section 8.3.3 above). Therefore,the Committee chose the breakpoint for the second slope, which is the point at whichthe urinary 2MG concentration begins to rapidly increase with increasing urinarycadmium level, as the basis of the evaluation. This breakpoint derived for thepopulation aged 50 years and over corresponds to 5.24 (5th–95th percentiles 4.94–5.57) μg of cadmium per gram of creatinine (Figure 3).
372 CADMIUM (addendum)

9.9.2 Toxicodynamic variability
Toxicodynamic variability in the dose–response relationship is not taken intoaccount by the model, because the data represent only a population average ratherthan individual data points. The lack of empirical evidence of elevated 2MG levelsbelow a urinary cadmium concentration of 5.24 (5th–95th percentiles 4.94–5.57) μgof cadmium per gram creatinine indicates that the variance is small.
Toxicodynamic variability in the model was accounted for by incorporating amaximum variability that ranges from 1 to 3. The value of 3 approximately corres-ponds to the toxicodynamic component of the conventional 10-fold uncertaintyfactor for interindividual variability (IPCS, 2005). Individual subjects were presumedto have a critical concentration (breakpoint) somewhere within the range defined bythe mean multiplied or divided by the maximum value. As the same maximum valuewas used for both increased and reduced individual susceptibility, the adjustmentresulted in broadened distributions of both population variability and uncertaintywithout affecting the geometric central estimates.
9.9.3 Toxicokinetic modelling
A one-compartment model was used to characterize the relationshipbetween urinary cadmium concentration and dietary cadmium exposure (seesection 9.1 above). This model included a statistical parameter for variation inapparent half-life. The calculated relationship between dietary cadmium exposureand urinary cadmium concentration is linear; therefore, the outcome may beexpressed as population distribution of the ratio with confidence intervals (seeFigure 4 in section 8.3.5 above).
9.9.4 Estimating the relationship between urinary cadmium excretion and dietarycadmium exposure
A two-dimensional Monte Carlo simulation was used to estimate thepopulation percentiles with associated 5th–95th percentile confidence intervalsfrom the variability and uncertainty in the breakpoint, the adjustment fortoxicodynamic variability and the toxicokinetic model (see Figure 5 in section 8.4above). The dietary cadmium exposure (μg/kg bw per day) that equates to 5.24(5th–95th percentiles 4.94–5.57) μg of cadmium per gram creatinine in urine wasestimated to be 1.2 (5th–95th percentiles 0.8–1.8) μg/kg bw per day at the 5thpopulation percentile. This is equivalent to 36 (5th–95th percentiles 24–54) μg/kgbw per month. The Committee decided to use the lower bound of the confidenceinterval to account for particularly susceptible individuals so that they would remainbelow the dietary exposure at which renal pathology is indicated.
10. EVALUATION
Since cadmium was last considered by the Committee, there have been anumber of new epidemiological studies that have reported cadmium-relatedbiomarkers in urine following environmental exposure. The Committee noted that alarge meta-analysis of studies that measured the dose–response relationshipbetween 2MG and cadmium excretion in urine was available. As the apparent half-life of cadmium in human kidneys is about 15 years, steady state would be achieved
CADMIUM (addendum) 373

after 45–60 years of exposure. Therefore, data relating 2MG excretion in urine tocadmium excretion in urine for individuals who are 50 years of age and olderprovided the most reliable basis on which to determine a critical concentration ofcadmium in the urine. An analysis of the group mean data from individuals who were50 years of age and older showed that the urinary excretion of less than 5.24 (5th–95th percentiles 4.94–5.57) μg of cadmium per gram creatinine was not associatedwith an increased excretion of 2MG. Higher urinary cadmium levels wereassociated with a steep increase in 2MG excretion.
To determine a corresponding dietary exposure that would result in a urinarycadmium concentration at the breakpoint of 5.24 (5th–95th percentiles 4.94–5.57)μg of cadmium per gram creatinine, a one-compartment toxicokinetic model wasused. The lower bound of the 5th population percentile dietary cadmium exposurethat equates to the breakpoint was estimated to be 0.8 μg/kg bw per day or about25 μg/kg bw per month.
The Committee noted that the existing health-based guidance value forcadmium was expressed on a weekly basis (PTWI), but, owing to cadmium’sexceptionally long half-life, considered that a monthly value was more appropriate.The PTWI of 7 μg/kg bw was therefore withdrawn.
In view of the long half-life of cadmium, daily ingestion in food has a small oreven a negligible effect on overall exposure. In order to assess long- or short-termrisks to health due to cadmium exposure, total or average intake should beassessed over months, and tolerable intake should be assessed over a period of atleast 1 month. To encourage this view, the Committee decided to express thetolerable intake as a monthly value in the form of a PTMI. The PTMI establishedwas 25 μg/kg bw.
The estimates of exposure to cadmium through the diet for all age groups,including consumers with high exposure and subgroups with special dietary habits(e.g. vegetarians), examined by the Committee at this meeting are below the PTMI.
11. REFERENCES
Åkesson A, Julin B, Wolk A (2008). Long-term dietary cadmium intake and postmenopausalendometrial cancer incidence: a population-based prospective cohort study. CancerResearch, 68:6435–6441.
Åkesson A et al. (2006). Cadmium-induced effects on bone in a population-based study ofwomen. Environmental Health Perspectives, 114:830–834.
Alfvén T et al. (2000). Low-level cadmium exposure and osteoporosis. Journal of Bone andMineral Research, 15(8):1579–1586.
Alfvén T, Järup L, Elinder CG (2002). Cadmium and lead in blood in relation to low bonemineral density and tubular proteinuria. Environmental Health Perspectives, 110(7):699–702.
Alfvén T et al. (2004). Cadmium exposure and distal forearm fractures. Journal of Bone andMineral Research, 19:900–905.
Alimonti A et al. (2005). Assessment of reference values for selected elements in a healthyurban population. Annali dell’Istituto superiore di sanità, 41(2):181–187.
Amzal B et al. (2009). Population toxicokinetic modeling of cadmium for health riskassessment. Environmental Health Perspectives, 117:1293–1301.
374 CADMIUM (addendum)

Arisawa K et al. (2007a). Cause-specific mortality and cancer incidence rates in relation tourinary 2-microglobulin: 23-year follow-up study in a cadmium-polluted area. ToxicologyLetters, 173:168–174.
Arisawa K et al. (2007b). Cadmium-induced renal dysfunction and mortality in two cohorts:disappearance of the association in a generation born later. Toxicology Letters, 169:214–221.
ATSDR (2008). Toxicological profile for cadmium. Atlanta, GA, USA, Agency for ToxicSubstances and Disease Registry.
Bakkali K et al. (2009). Characterization of trace metals in vegetables by graphite furnaceatomic absorption spectrometry after closed vessel microwave digestion. FoodChemistry, 116(2):590–594.
Barregård L et al. (2010). Cadmium, mercury, and lead in kidney cortex of living kidney donors:impact of different exposure sources. Environmental Research, 110:47–54.
Benitez MA et al. (2009). Mother–fetus transference of lead and cadmium in rats: involvementof metallothionein. Histology and Histopathology, 24:1523–1530.
Bergkvist P et al. (2003). Long-term effects of sewage sludge applications on soil properties,cadmium availability and distribution in arable soil. Agriculture, Ecosystems &Environment, 97(1–3):167–179.
Bernard A (2008). Cadmium & its adverse effects on human health. Indian Journal of MedicalResearch, 128:557–564.
Bezerra MA et al. (2007). On-line system for preconcentration and determination of metals invegetables by inductively coupled plasma optical emission spectrometry. Journal ofHazardous Materials, 148(1–2):334–339.
Bocca B et al. (2005). Development of methods for the quantification of essential and toxicelements in human biomonitoring. Annali dell’Istituto superiore di sanità, 41(2):165–170.
Çelik A et al. (2009). Assessment of cadmium genotoxicity in peripheral blood and bonemarrow tissues of male Wistar rats. Toxicology Mechanisms and Methods, 19:135–140.
Chen H et al. (2008). Direct determination of Cd and Pb in gel forming konjac samples byenzymatic hydrolysis assisted slurry sampling graphite furnace atomic absorptionspectrometry. Microchimica Acta, 162:133–139.
Chen X et al. (2009). Changes in bone mineral density 10 years after marked reduction ofcadmium exposure in a Chinese population. Environmental Research, 109:874–879.
Citak D, Tuzen M, Soylak M (2009). Simultaneous coprecipitation of lead, cobalt, copper,cadmium, iron and nickel in food samples with zirconium(IV) hydroxide prior to their flameatomic absorption spectrometric determination. Food and Chemical Toxicology, 47(9):2302–2307.
Cubadda F, Raggi A (2005). Determination of lead, cadmium, iron, nickel and chromium inselected food matrices by plasma spectrometric techniques. Microchemical Journal,79:91–96.
Da-Col JA, Domene SMA, Pereira-Filho ER (2009). Fast determination of Cd, Fe, Pb, and Znin food using AAS. Food Analytical Methods, 2:110–115.
Daftsis EJ, Zachariadis GA (2007). Analytical performance of ETAAS method for Cd, Co, Crand Pb determination in blood fractions samples. Talanta, 71:722–730.
Detcheva A, Grobecker KH (2006). Determination of Hg, Cd, Mn, Pb and Sn in seafood bysolid sampling Zeeman atomic absorption spectrometry. Spectrochimica Acta. Part B:Atomic Spectroscopy, 61:454–459.
D’Llio S et al. (2008). Method validation for determination of arsenic, cadmium, chromium andlead in milk by means of dynamic reaction cell inductively coupled plasma massspectrometry. Analytica Chimica Acta, 624(1):59–67.
EFSA (2008). Guidance document for the use of the Concise European Food ConsumptionDatabase in exposure assessment. Parma, Italy, European Food Safety Authority(http://www.efsa.europa.eu/en/datex/docs/datexfooddbguidance.pdf).
CADMIUM (addendum) 375

EFSA (2009a). Cadmium in food: Scientific opinion of the panel on contaminants in the foodchain. EFSA Journal, 980:1–139.
EFSA (2009b). Meta-analysis of dose–effect relationship of cadmium for benchmark doseevaluation. EFSA Scientific Report, 254:1–162.
Eriksson JE (2000). Critical load set to “no further increase in Cd content of agricultural soils”—consequences. In: Proceedings from Ad hoc international expert group on effect-basedcritical limits for heavy metals, 11–13 October 2000. Bratislava, Slovak Republic, SoilScience and Conservation Research Institute.
Eum KD, Lee MS, Paek D (2008). Cadmium in blood and hypertension. Science of the TotalEnvironment, 407:147–153.
European Commission (2001). DG Enterprise: Analysis and conclusions from Member States’assessment of the risk to health and the environment from cadmium in fertilisers. ContractNo. ETD/00/503201. October 2001.
Everett CJ, Frithsen IL (2008). Association of urinary cadmium and myocardial infarction.Environmental Research, 106:284–286.
Fairbrother A et al. (2007). Framework for metals risk assessment. Ecotoxicology andEnvironmental Safety, 68(2):145–227.
FAO/WHO (2004). General guidelines on sampling. Rome, Italy, FAO/WHO Food StandardsProgramme, Codex Alimentarius Commission, 69 pp. (CAC/GL 50-2004; http://www.codexalimentarius.net/download/standards/10141/CXG_050e.pdf).
FAO/WHO (2010). Policy of the Codex Committee on Contaminants in Foods for exposureassessment of contaminants and toxins in foods or food groups. In: Codex AlimentariusCommission procedural manual, 19th ed. Rome, Italy, Food and Agriculture Organizationof the United Nations, Joint FAO/WHO Food Standards Programme, Codex AlimentariusCommission.
Food Safety Commission of Japan (2009). Assessment report: cadmium, 2nd ed. August.Galicia-Garcia V et al. (1997). Cadmium levels in maternal, cord and newborn blood in Mexico
City. Toxicology Letters, 91:57–61.Gallagher GM et al. (2008). Urinary cadmium and osteoporosis in U.S. women 50 years of
age: NHANES 1988–1994 and 1999–2004. Environmental Health Perspectives, 116(10):1338–1343.
Gerchman F et al. (2009). Body mass index is associated with increased creatinine clearanceby a mechanism independent of body fat distribution. Journal of Clinical Endocrinology andMetabolism, 94:3781–3788.
Giaginis C, Gatzidou E, Theocharis S (2006). DNA repair systems as targets of cadmiumtoxicity. Toxicology and Applied Pharmacology, 213:282–290.
Heitland P, Köster HD (2006). Biomonitoring of 37 trace elements in blood samples frominhabitants of northern Germany by ICP-MS. Journal of Trace Elements in Medicine andBiology, 20:253–262.
Higgins J, Green S, eds (2008). Cochrane handbook for systematic reviews of interventions.Version 5.0.1 (updated September 2008). The Cochrane Collaboration (http://www.cochrane-handbook.org).
Hotz P et al. (1999).Renal effects of low-level environmental cadmium exposure: 5-year follow-up of a subcohort from the CadmiBel study. Lancet, 354:1508–1513.
Huang M et al. (2009). Risk assessment of low-level cadmium and arsenic on the kidney.Journal of Toxicology and Environmental Health, 72:1439–1498.
Huff J et al. (2007). Cadmium-induced cancers in animals and in humans. International Journalof Occupational and Environmental Health, 13:202–212.
IARC (1993). Beryllium, cadmium, mercury and exposures in the glass manufacturingindustry. Lyon, France, International Agency for Research on Cancer, 444 pp. (IARCMonographs on the Evaluation of Carcinogenic Risk of Chemicals to Humans, Vol. 58;http://monographs.iarc.fr/ENG/Monographs/vol58/volume58.pdf).
376 CADMIUM (addendum)

IPCS (1992a). Cadmium. Geneva, Switzerland, World Health Organization, InternationalProgramme on Chemical Safety, 280 pp. (Environmental Health Criteria 134).
IPCS (1992b). Cadmium—environmental aspects. Geneva, Switzerland, World HealthOrganization, International Programme on Chemical Safety (Environmental HealthCriteria 135).
IPCS (2005). Chemical-specific adjustment factors for interspecies differences and humanvariability: guidance document for use of data in dose/concentration–responseassessment. Geneva, Switzerland, World Health Organization, International Programmeon Chemical Safety (Harmonization Project Document No. 2).
Iwata K et al. (1992). Follow up study of renal tubular dysfunction and mortality in residents ofan area polluted with cadmium. British Journal of Industrial Medicine, 49:736–737.
Jannat B et al. (2009). Simultaneous determination of lead, cadmium, copper and zinc in infantformula by anodic stripping voltammetry. Iranian Journal of Pharmaceutical Research,8(3):159–162.
Johnson MD et al. (2003). Cadmium mimics the in vivo effects of estrogen in the uterus andmammary gland. Nature Medicine, 9:1081–1084.
Julshamn K et al. (2007). Determination of arsenic, cadmium, mercury, and lead by inductivelycoupled plasma/mass spectrometry in foods after pressure digestion: NMKL1interlaboratory study. Journal of AOAC International, 90(3):844–856.
Kabata-Pendias A (2001). Cadmium. In: Trace elements in soils and plants, 3rd ed. BocaRaton, FL, USA, CRC Press, pp. 143–156.
Kanis J et al. (1997). Guidelines for diagnosis and management of osteoporosis. TheEuropean Foundation for Osteoporosis and Bone Disease. Osteoporosis International,7:390–406.
Kellen E et al. (2007). Blood cadmium may be associated with bladder carcinogenesis: theBelgian case–control study on bladder cancer. Cancer Detection and Prevention, 31:77–82.
Kim D-W et al. (2007). Regulation of metal transporters by dietary iron, and the relationshipbetween body iron levels and cadmium uptake. Archives of Toxicology, 81:327–334.
Kippler M et al. (2007). Influence of iron and zinc status on cadmium accumulation inBangladeshi women. Toxicology and Applied Pharmacology, 222:221–226.
Kippler M et al. (2010). Accumulation of cadmium in human placenta interacts with thetransport of micronutrients to the fetus. Toxicology Letters, 192:162–168.
Knuuttila M et al. (1982). Cadmium content of human cancellous bone. Archives ofEnvironmental Health, 37:290–294.
Kobayashi E et al. (2006). Estimation of benchmark dose as the threshold levels of urinarycadmium, based on excretion of total protein, 2-microglobulin, and N-acetyl- -D-glucosaminidase in cadmium nonpolluted regions in Japan. Environmental Research,101:401–406.
Kobayashi E et al. (2008). Serial changes in urinary cadmium concentrations and degree ofrenal tubular injury after soil replacement in cadmium-polluted rice paddies. ToxicologyLetters, 176:124–130.
Kong MF, Chan S, Wong YC (2008). Proficiency testing program for the determination of totalarsenic, lead and cadmium in seawater shrimp. Journal of AOAC International, 91(4):858–864.
Kummrow F et al. (2008). Biomonitoring method for the simultaneous determination ofcadmium and lead in whole blood by electrothermal atomic absorption spectrometry forassessment of environmental exposure. Talanta, 75:246–252.
Lee H-S et al. (2006). Dietary exposure of the Korean population to arsenic, cadmium, leadand mercury. Journal of Food Composition and Analysis, 19(Suppl. 1):S31–S37.
Licata P et al. (2004). Levels of “toxic” and “essential” metals in samples of bovine milk fromvarious dairy farms in Calabria, Italy. Environment International, 30:1–6.
CADMIUM (addendum) 377

Link B et al. (2007). Baden-Wuerttemberg Environmental Health Survey (BW-EHS) from 1996to 2003: toxic metals in blood and urine of children. International Journal of Hygiene andEnvironmental Health, 210(3–4):357–371.
Marshall D, Johnell O, Wedel H (1996). Meta-analysis of how well measures of bone mineraldensity predict occurrence of osteoporotic fractures. BMJ (Clinical research ed.),312:1254–1259.
Matsudo R (2007). A study on surveys and assessments of toxic substance intake from food,research on intakes of contaminants from food and contaminant monitoring surveys.Supported by Health and Labour Sciences Research Grant, research report for fiscal year2007 [cited in Food Safety Commission of Japan, 2009].
McElroy JA et al. (2006). Cadmium exposure and breast cancer risk. Journal of the NationalCancer Institute, 98:869–873.
Melucci D, Torsi G, Locatelli C (2007). Analytical procedure for the simultaneous voltammetricdetermination of trace metals in food and environmental matrices. Critical comparison withatomic absorption spectroscopic measurements. Annali di Chimica, 97(3–4):141–151.
Menke A et al. (2009). Cadmium levels in urine and mortality among U.S. adults.Environmental Health Perspectives, 117:190–196.
Milacic R, Kralj B (2003). Determination of Zn, Cu, Cd, Pb, Ni and Cr in some Slovenianfoodstuffs. European Food Research and Technology, 217:211–214.
Mortada WI et al. (2002). Reference intervals of cadmium, lead, and mercury in blood, urine,hair, and nails among residents in Mansoura city, Nile delta, Egypt. EnvironmentalResearch, 90:104–110.
Munoz O et al. (2005). Estimation of the dietary intake of cadmium, lead, mercury, and arsenicby the population of Santiago (Chile) using a total diet study. Food and ChemicalToxicology, 43:1647–1655.
Nakagawa H et al. (2006). Urinary cadmium and mortality among inhabitants of a cadmium-polluted area in Japan. Environmental Research, 100:323–329.
Nardi EP et al. (2009). The use of inductively coupled plasma mass spectrometry (ICP MS)for the determination of toxic and essential elements in different types of food samples.Food Chemistry, 112:727–732.
Nasreddine L et al. (2006). Dietary exposure to lead, cadmium, mercury and radionuclides ofan adult urban population in Lebanon: a total diet study approach. Food Additives andContaminants, 23(6):579–590.
Navas-Acien A et al. (2009). Blood cadmium and lead and chronic kidney disease in US adults:a joint analysis. American Journal of Epidemiology, 170:1156–1164.
Nawrot T et al. (2006). Environmental exposure to cadmium and risk of cancer: a prospectivepopulation-based study. Lancet Oncology, 7:119–126.
Nawrot TS et al. (2008). Cadmium-related mortality and long-term secular trends in thecadmium body burden of an environmentally exposed population. Environmental HealthPerspectives, 116(12):1620–1628.
Nawrot T et al. (2010). Occupational cadmium exposure and calcium excretion, bone density,and osteoporosis in men. Journal of Bone and Mineral Research, 25(6):1441–1445.
Nishijo M et al. (2002). Effects of maternal exposure to cadmium on pregnancy outcome andbreast milk. Occupational and Environmental Medicine, 59:394–397.
Nishijo M et al. (2006). Causes of death and renal tubular dysfunction in residents exposed tocadmium in the environment. Occupational and Environmental Medicine, 63:545–550.
OECD (1994). Cadmium. Paris, France, Organisation for Economic Co-operation andDevelopment, Environment Directorate (Risk Reduction Monograph No. 5).
Olmedo P et al. (2010). Validation of a method to quantify chromium, cadmium, manganese,nickel and lead in human whole blood, urine, saliva and hair samples by electrothermalatomic absorption spectrometry. Analytica Chimica Acta, 659:60–67.
378 CADMIUM (addendum)
Oymak T et al. (2009). Determination of lead and cadmium in food samples by thecoprecipitation method. Food Chemistry, 113(4):1314–1317.
Pacyna JM, Pacyna EG (2001). An assessment of global and regional emissions of tracemetals to the atmosphere from anthropogenic sources worldwide. EnvironmentalReview, 9:269–298.
Pereira-Filho ER, Berndt H, Arruda MAZ (2002). Simultaneous sample digestion anddetermination of cadmium, copper and lead in biological samples using thermospray flamefurnace atomic absorption spectrometry (TS-FF-AAS) with slurry sample introduction.Journal of Analytical Atomic Spectrometry, 17:1308–1315.
Peters JL et al. (2010). Cadmium exposure in association with history of stroke and heartfailure. Environmental Research, 110:199–206.
Pongratz R, Heumann KG (1999). Production of methylated mercury, lead, and cadmium bymarine bacteria as a significant natural source for atmospheric heavy metals in polarregions. Chemosphere, 39(1):89–102.
Reeves PG, Chaney RL (2008). Bioavailability as an issue in risk assessment of foodcadmium: a review. Science of the Total Environment, 398:13–19.
Rignell-Hydbom A et al. (2009). Exposure to cadmium and persistent organochlorinepollutants and its association with bone mineral density and markers of bone metabolismon postmenopausal women. Environmental Research, 109(8):991–996.
Rocha SR et al. (2009). Trace elements determination in edible seaweeds by an optimizedand validated ICP-MS method. Journal of Food Composition and Analysis, 22:330–336.
Rodushkin I, Ödman F, Branth S (1999). Multielement analysis of whole blood by highresolution inductively coupled plasma mass spectrometry. Fresenius’ Journal of AnalyticalChemistry, 464:338–346.
Sahmoun AE et al. (2005). Cadmium and prostate cancer: a critical epidemiologic analysis.Cancer Investigation, 23:256–263.
Salpietro CD et al. (2002). Cadmium concentration in maternal and cord blood and infant birthweight: a study on healthy nonsmoking women. Journal of Perinatal Medicine, 30:395–399.
Santos D Jr et al. (2002). Determination of Cd and Pb in food slurries by GFAAS usingcryogenic grinding for sample preparation. Analytical and Bioanalytical Chemistry,373:183–189.
Sardans J, Montes F, Peñuelas J (2010). Determination of As, Cd, Cu, Hg and Pb in biologicalsamples by modern electrothermal atomic absorption spectrometry. Spectrochimica Acta.Part B: Atomic Spectroscopy, 65:97–112.
Schroijen C et al. (2008). Internal exposure to pollutants measured in blood and urine ofFlemish adolescents in function of area of residence. Chemosphere, 71(7):1317–1325.
Schutte R et al. (2008a). Bone resorption and environmental exposure to cadmium in women:a population study. Environmental Health Perspectives, 116:777–783.
Schutte R et al. (2008b). Arterial structure and function and environmental exposure tocadmium. Occupational and Environmental Medicine, 65:412–419.
Schwerdtle T et al. (2010). Genotoxicity of soluble and particulate cadmium compounds:impact on oxidative DNA damage and nucleotide excision repair. Chemical Research inToxicology, 23(2):432–442.
Shimizu A et al. (2006). Estimation of benchmark doses for urinary cadmium based on 2-microglobulin excretion in cadmium-polluted regions of the Kakehashi River basin,Japan. International Journal of Environmental Health Research, 16:329–337.
Simpson WR (1981). A critical review of cadmium in the marine environment. Progress inOceanography, 10:1–70.
Soares VA et al. (2010). Determination of nutritional and toxic elements in pasteurized bovinemilk from Vale do Paraíba region (Brazil). Food Control, 21(1):45–49.
CADMIUM (addendum) 379

Song B et al. (2009). Assessing the health risk of heavy metals in vegetables to the generalpopulation in Beijing, China. Journal of Environmental Sciences (China), 21(12):1702–1709.
Staessen JA et al. (1999). Environmental exposure to cadmium, forearm bone density, andrisk of fractures: prospective population study. Public health and environmental exposureto cadmium (PheeCad) Study Group. Lancet, 353:1140–1144.
Steineck S et al. (1999). Animal manure—content of nutrients and trace elements. Stockholm,Sweden, Swedish Environmental Protection Agency (Report No. 4974).
Suwazono Y et al. (2005). Creatinine versus specific gravity–adjusted urinary cadmiumconcentrations. Biomarkers, 10:117–126.
Suwazono Y et al. (2006). Benchmark dose for cadmium-induced renal effects in humans.Environmental Health Perspectives, 114:1072–1076.
Tellez-Plaza M et al. (2008). Cadmium exposure and hypertension in the 1999–2004 NationalHealth and Nutrition Examination Survey (NHANES). Environmental HealthPerspectives, 116:51–56.
Terry PD et al. (2002). Cigarette smoking and the risk of endometrial cancer. LancetOncology, 3:470–480.
Trzcinka-Ochocka M et al. (2010). The effects of low environmental cadmium exposure onbone density. Environmental Research, 110:286–293.
UNEP (2006). Interim review of scientific information on cadmium (Version of October2006). United Nations Environment Programme, Division of Technology, Industry andEconomics, Chemicals Branch, 170 pp. (http://www.chem.unep.ch/Pb_and_Cd/SR/Files/Interim_reviews/UNEP_Cadmium_review_Interim_Oct2006.doc).
UNEP (2008). Draft final review of scientific information on cadmium (Version of November2008). United Nations Environment Programme, Division of Technology, Industry andEconomics, Chemicals Branch, 185 pp. (http://www.chem.unep.ch/Pb_and_Cd/SR/Draft_final_reviews/Cd_Review/Final_UNEP_Cadmium_review_Nov_2008.doc).
Uno T et al. (2005). Health effects of cadmium exposure in the general environment in Japanwith special reference to the lower limit of the benchmark dose as the threshold level ofurinary cadmium. Scandinavian Journal of Work, Environment and Health, 31:307–315.
Verougstraete V, Lison D, Hotz P (2003). Cadmium, lung and prostate cancer: a systematicreview of recent epidemiological data. Journal of Toxicology and Environmental Health.Part B, Critical Reviews, 6:227–255.
Viitak A, Volynsky AB (2006). Simple procedure for the determination of Cd, Pb, As and Se inbiological samples by electrothermal atomic absorption spectrometry using colloidal Pdmodifier. Talanta, 70:890–895.
Viñas P, Pardo-Martínez M, Hernández-Córdoba M (2000). Rapid determination of selenium,lead and cadmium in baby food samples using electrothermal atomic absorptionspectrometry and slurry atomization. Analytica Chimica Acta, 412:121–130.
Vinceti M et al. (2007). Case–control study of toenail cadmium and prostate cancer risk in Italy.Science of the Total Environment, 373:77–81.
Wallin E et al. (2005). Exposure to CB-153 and p,p -DDE and bone mineral density and bonemetabolism markers in middle-aged and elderly men and women. OsteoporosisInternational, 16:2085–2094.
WHO (1994). Assessment of fracture risk and its application to screening for postmenopausalosteoporosis. Report of a WHO Study Group. Geneva, Switzerland, World HealthOrganization, pp. 1–129 (WHO Technical Report Series 843).
WHO Expert Consultation (2004). Appropriate body-mass index for Asian populations and itsimplications for policy and intervention strategies. Lancet, 363:157–163.
Wilhelm M et al. (2005). Human biomonitoring of cadmium and lead exposure of child–motherpairs from Germany living in the vicinity of industrial sources (hot spot study NRW). Journalof Trace Elements in Medicine and Biology, 19(1):83–90.
380 CADMIUM (addendum)

LEAD (addendum)
First draft prepared by
Dr D.J. Benford,1 Dr D. Bellinger,2 Dr M. Bolger,3 Dr C. Carrington,3 Dr K.Hailemariam,3 Dr B. Petersen,4 Professor S. Rath5 and Dr Y. Zang3
1 Food Standards Agency, London, England2 Harvard Medical School Children’s Hospital, Boston, Massachusetts, United
States of America (USA)3 Center for Food Safety and Applied Nutrition, Food and Drug Administration,
College Park, Maryland, USA4 Exponent, Washington, DC, USA
5 Department of Analytical Chemistry, University of Campinas, Campinas, SãoPaulo, Brazil
1. Explanation.............................................................................2. Biological data........................................................................
2.1 Biochemical aspects.........................................................2.1.1 Absorption, distribution and elimination..................2.1.2 Biotransformation....................................................2.1.3 Effects on enzymes and other biochemical
parameters..............................................................2.1.4 Physiologically based pharmacokinetic (PBPK)
modelling.................................................................2.2 Toxicological studies........................................................
2.2.1 Acute toxicity...........................................................2.2.2 Short-term studies of toxicity...................................2.2.3 Long-term studies of toxicity and
carcinogenicity........................................................2.2.4 Genotoxicity............................................................2.2.5 Reproductive and developmental toxicity................2.2.6 Special studies........................................................
2.3 Observations in humans...................................................2.3.1 Biomarkers of exposure..........................................2.3.2 Biomarkers of effect................................................2.3.3 Clinical observations...............................................2.3.4 Epidemiological studies...........................................
3. Analytical methods..................................................................3.1 Determination of lead in food...........................................
3.1.1 Quality assurance...................................................3.1.2 Sample preparation.................................................
3.2 Determination of lead in blood.........................................3.2.1 Quality assurance...................................................
4. Sampling protocols.................................................................5. Prevention and control............................................................6. Levels and patterns of contamination in food
commodities...........................................................................6.1 Australia...........................................................................
383384384384385
386
387387387388
388389390391393393399399400425425426432433434434438
438439
- 381 -

6.2 Brazil................................................................................6.3 China................................................................................6.4 Europe..............................................................................6.5 Singapore.........................................................................6.6 United States of America..................................................
7. Food consumption and dietary exposure estimates...............7.1 Introduction.......................................................................7.2 Considerations in determining dietary exposure to
lead...................................................................................7.3 Assessment of dietary exposure to lead..........................
7.3.1 Australia..................................................................7.3.2 Brazil.......................................................................7.3.3 Canada....................................................................7.3.4 Chile........................................................................7.3.5 China.......................................................................7.3.6 Egypt.......................................................................7.3.7 Europe.....................................................................7.3.8 India........................................................................7.3.9 Lebanon..................................................................7.3.10 New Zealand.........................................................7.3.11 Nigeria...................................................................7.3.12 Singapore..............................................................7.3.13 United States of America......................................7.3.14 Comparisons between countries...........................
7.4 Relative contribution of diet to total lead exposure..........7.5 Temporal changes in lead exposures..............................
8. Dose–response analysis.........................................................8.1 Identification of key data for risk assessment...................
8.1.1 Pivotal data from biochemical and toxicologicalstudies.....................................................................
8.1.2 Pivotal data from human clinical/epidemiologicalstudies.....................................................................
8.2 General modelling considerations....................................8.2.1 Selection of data.....................................................8.2.2 Selection of mathematical model............................
8.3 Dose–response modelling................................................8.3.1 Blood lead and IQ in children..................................8.3.2 Dietary lead exposure and IQ.................................8.3.3 Blood lead and blood pressure in adults.................8.3.4 Dietary lead exposure and blood pressure
in adults...................................................................9. Comments..............................................................................
9.1 Absorption, distribution, metabolism and excretion..........9.2 Toxicological data.............................................................9.3 Observations in humans...................................................9.4 Analytical methods for the determination of lead in food
and blood..........................................................................9.5 Sampling protocols...........................................................9.6 Prevention and control.....................................................9.7 Levels and patterns of contamination in food
commodities.....................................................................
439439443444445448448
448449449449450451452453453456458458459459459460461462464464
464
464465465465466466466468
468469469470471
473473473
474
382 LEAD (addendum)

9.8 Food consumption and dietary exposure assessment......................................................................9.8.1 Food category contributions to exposure................9.8.2 Temporal changes in estimates of dietary exposure
to lead since the 1980s...........................................9.9 Dose–response analysis..................................................
10. Evaluation.............................................................................11. References...........................................................................
1. EXPLANATION
Lead (Pb) occurs in Earth’s crust primarily as the mineral galena (lead(II)sulfide) and, to a lesser extent, as anglesite (lead(II) sulfate) and cerussite (leadcarbonate). It occurs in the environment both naturally and, to a greater extent, fromanthropogenic activities such as mining and smelting, battery manufacturing andthe use of leaded petrol (gasoline). Lead contamination of food arises mainly fromthe environment or from food processing, food handling and food packaging.Atmospheric lead can contaminate food through deposition on agricultural crops.Water is another source of lead contamination of food. Although lead exists in bothorganic and inorganic forms, only inorganic lead has been detected in food.
Lead was previously evaluated by the Committee at its sixteenth, twenty-second, thirtieth, forty-first and fifty-third meetings (Annex 1, references 30, 47, 73,107 and 143). At the sixteenth meeting, the Committee established a provisionaltolerable weekly intake (PTWI) of 3 mg of lead per person, equivalent to 50 μg/kgbody weight (bw), stating that this did not apply to infants and children. At its twenty-second meeting, the Committee retained the PTWI for adults, noting thatestablishing a PTWI for children was not yet possible owing to the lack of relevantscientific data. The health risks associated with exposure of infants and children tolead were evaluated at the thirtieth meeting, and a PTWI of 25 μg/kg bw wasestablished for this population group, based on the information that a mean dailyexposure to lead of 3–4 μg/kg bw for infants and children was not associated withan increase in blood lead levels. At the forty-first meeting, the Committee withdrewthe previous PTWI of 50 μg/kg bw for adults and extended the PTWI of 25 μg/kg bwto all age groups. In these previous evaluations, it was emphasized that the PTWIapplied to lead from all sources. At its fifty-third meeting, the Committee was askedto assess the risk of dietary exposure of infants and children to lead. It concludedthat current concentrations of lead in food would have very little impact on theneurobehavioural development of infants and children but stressed that a full riskassessment of lead should take other sources of exposure into account.
At its present meeting, the Committee considered information on lead relatedto the toxicology, epidemiology, exposure assessment and analytical methodology,in particular for a dose–response analysis below blood lead levels of 10 μg/dl, atthe request of the Codex Committee on Contaminants in Food.
The literature relating to lead is extensive, and the present Committee usedthe recent review of the European Food Safety Authority (EFSA, 2010) as thestarting point for its evaluation, together with newer studies that were considered to
476478
478479480482
LEAD (addendum) 383

be informative. Only brief summaries of toxicological effects are given, but studiesof the effects critical for the risk assessment are evaluated in more detail. The mainemphasis is on studies in humans.
2. BIOLOGICAL DATA
2.1 Biochemical aspects
2.1.1 Absorption, distribution and elimination
Exposure to lead and lead chemicals can occur through ingestion, inhalationand dermal contact. Gastrointestinal absorption of ingested lead varies dependingon physiological factors such as age, fasting, nutritional calcium and iron status,pregnancy and physicochemical characteristics of particles (size, solubility and leadspecies) (EFSA, 2010).
Several studies have reported that lead absorption from the gastrointestinaltract appears to be higher in children than in adults (Alexander, Clayton & Delves,1974; Ziegler et al., 1978; Rabinowitz, Kopple & Wetherill, 1980; Heard &Chamberlain, 1982; James, Hilburn & Blair, 1985), although another studysuggested that children aged 6–11 years and their mothers absorb a similarpercentage of ingested lead (Gulson et al., 1997). Experimental studies with Rhesusmonkeys and rats have provided additional evidence for age-dependent differencesin gastrointestinal absorption (Forbes & Reina, 1972; Kostial et al., 1978; Pounds,Marlar & Allen, 1978; Aungst, Dolce & Fung, 1981).
Fasting humans absorb much larger fractions of lead than do their fedcounterparts. The presence of food in the gastrointestinal tract decreases theabsorption of water-soluble lead (Rabinowitz, Kopple & Wetherill, 1980; Heard &Chamberlain, 1982; Blake & Mann, 1983; Blake, Barbezat & Mann, 1983; James,Hilburn & Blair, 1985; Maddaloni et al., 1998). Fasting subjects absorbedapproximately 63% of a tracer dose of lead acetate in water, whereas fed subjectsabsorbed 3% (Heard & Chamberlain, 1982; James, Hilburn & Blair, 1985).
Iron is believed to impair lead uptake in the gut, whereas iron deficiency isassociated with increased blood lead concentrations in children (Cheng et al., 1998;Bárány et al., 2005). Studies in rats also showed that iron deficiency increased leadabsorption, possibly by enhancing its binding to iron-binding carriers (Barton et al.,1978; Morrison & Quaterman, 1987; Bannon et al., 2003). Diets with low levels ofcalcium have been shown to increase lead absorption in children (Ziegler et al.,1978; Mahaffey et al., 1982) and in laboratory animals (Mykkänen & Wasserman,1981, 1982).
Absorption through the respiratory tract is influenced by the particle sizedistribution and the ventilation rate. In adults, the rate of deposition of airborne leadis approximately 30–50%. This rate is dependent on the size of the particles andthe ventilation rate of the individual. Smaller particles (<1 μm) have been shown tohave greater deposition and absorption rates than larger particles (USEPA, 1986).Once deposited in the lower respiratory tract, lead appears to be almost completelyabsorbed (Morrow et al., 1980).
384 LEAD (addendum)

Dermal absorption of lead compounds is substantially lower than absorptionby inhalation or oral routes of exposure. Dermal absorption of lead in humans hasbeen estimated to be 0.06% during normal use of lead-containing preparations(Moore et al., 1980).
Inorganic lead is minimally absorbed through the skin, but organic lead, suchas tetraethyl lead (as in leaded gasoline), which is still legally allowed to be used inaircraft, watercraft and farm machinery, is well absorbed through the skin (Patrick,2006).
Once absorbed, 96–99% of circulating lead in blood is bound to erythrocytes.At low blood lead concentrations, whole blood lead levels increase linearly withserum levels. However, at higher blood lead concentrations, owing to saturation oflead-binding sites in the erythrocytes, the relationship between serum lead andblood lead is non-linear. The distribution of lead in the body is route independent;in adults, approximately 90% of the total body burden of lead is in the bones,compared with approximately 70% in children, but its concentration increases withage (EFSA, 2010).
Bone lead can contribute to elevated blood levels long after the exposureceases (Fleming et al., 1997). Studies have reported that conditions such as ageing(Drasch, Bohm & Baur, 1987), osteoporosis (Gulson, Palmer & Bryce, 2002),pregnancy (Lagerkvist et al., 1996; Maldonado-Vega et al., 1996; Schuhmacher etal., 1996; Franklin et al., 1997; Gulson et al., 1997), lactation (Gulson et al., 2003,2004), menopause and postmenopause (Hernandez-Avila et al., 2000; Gulson,Palmer & Bryce, 2002; Berkowitz et al., 2004; Nash et al., 2004; Popovic et al., 2005)increase bone resorption and consequently also increase lead levels in blood. Leadcan be transferred from the mother to the fetus (Goyer, 1990; Graziano et al., 1990;Carbone et al., 1998) and also from the mother to infants via maternal milk (Gulsonet al., 1998b; Ettinger et al., 2006).
The unexcreted fraction of absorbed lead is distributed among blood, softtissues and bones (Barry, 1975). Half-lives for inorganic lead in blood and bone areapproximately 30 days and between 10 and 30 years, respectively (Rabinowitz,1991).
It has been reported that liver is the largest repository of soft tissue lead,followed by kidney cortex and medulla, pancreas, ovary, spleen, prostate, adrenalgland, brain, fat, testis, heart and skeletal muscle. Despite lead’s faster turnover inthese tissues, its concentrations are relatively constant (Barry, 1975; Treble &Thompson, 1997). Regardless of the route of exposure, lead is excreted primarilyin urine and faeces (Rabinowitz, 1991). Minor routes of excretion include sweat,saliva, hair, nails and breast milk (Hursh & Suomela, 1968; Hursh et al., 1969;Rabinowitz, Wetherill & Kopple, 1976; Kehoe, 1987; Stauber et al., 1994).
2.1.2 Biotransformation
Metabolism of inorganic lead consists primarily of reversible ligand reactions,including the formation of complexes with amino acids and non-protein thiols andbinding to various proteins (Goering & Fowler, 1985; Goering, 1993).
LEAD (addendum) 385

Organic lead compounds are metabolized to inorganic lead both in humansand in experimental animals. Organic or alkyl lead, such as tetraethyl andtetramethyl lead, undergo oxidative dealkylation to the highly neurotoxic metabolitestriethyl and trimethyl lead, respectively. In the liver, the reaction is catalysed by acytochrome P450–dependent mono-oxygenase system (IARC, 2006).
2.1.3 Effects on enzymes and other biochemical parameters
The toxicity of lead may be attributed to the affinity of lead for thiol groups(–SH) (Vallee & Ulmer, 1972) and other organic ligands in proteins.
Lead has been known to alter the haematological system by inhibiting theactivities of enzymes essential for haem biosynthesis, such as -aminolaevulinicacid synthase (ALAS), -aminolaevulinic acid dehydratase (ALAD) andferrochelatase. The enzyme most sensitive to the effect of lead is ALAD (EFSA,2010).
Inhibition of ALAD by lead results in increased circulating aminolaevulinicacid (ALA), a weak -aminobutyric acid (GABA) agonist that decreases GABArelease by presynaptic inhibition, which may account for some of the behaviouraldisorders seen in patients with porphyria and perhaps in lead toxicity. Inhibition ofALAD activity occurs over a wide range of blood lead concentrations beginning atless than 10 μg/dl (ATSDR, 2007).
Simmonds, Luckhurst & Woods (1995) observed a decrease in ALAD activityin erythrocytes in rats given lead acetate at 1000 mg/l in the drinking-water for 6days. Blood lead concentrations increased to 44 μg/dl after the first day andremained within 10 μg/dl of that value until the end of the exposure period.
It has been reported that lead indirectly stimulates the mitochondrial enzymeALAS, which catalyses the condensation of glycine and succinyl coenzyme A toform ALA. The activity of ALAS is the rate-limiting step in haem biosynthesis; ALASis induced by negative feedback from the depression of haem synthesis (EFSA,2010).
Lead is also known to inhibit the activity of the zinc-containing mitochondrialenzyme ferrochelatase, which catalyses the insertion of iron(II) into theprotoporphyrin ring to form haem (USEPA, 1986; Goering, 1993). Lead-relatedanaemia is known to be a late complication when blood lead levels exceed50 μg/dl (USEPA, 1986; Goering, 1993).
Other enzymes have also been reported to be inhibited by lead. Lead wasshown to inhibit Na+,K+-adenosine triphosphatase (ATPase) activity and to increaseintracellular Ca2+ levels, possibly with activation of protein kinase C (Kramer,Gonick & Lu, 1986; Watts, Chai & Webb, 1995; Hwang et al., 2001), resulting inhypertension (Carmignani et al., 2000; Ni et al., 2004; Vaziri & Sica, 2004) andsubsequent depletion of nitric oxide, which is involved in the regulation of bloodpressure (Gonick et al., 1997; Vaziri et al., 1997; Vaziri, 2008).
The activity of dihydrobiopterin reductase, an enzyme involved in thesynthesis of catecholamines, is reduced by lead in rat brain. The activity ofnicotinamide adenine dinucleotide synthetase in erythrocytes may also be inhibitedby lead (Annex 1, reference 144).
386 LEAD (addendum)

Lead also competitively interferes with divalent cations, such as calcium,magnesium and zinc. Subsequent impairment of mitochondrial oxidativephosphorylation and the intracellular messenger system affects endocrine andneuronal function and smooth muscle contraction (ATSDR, 2007).
Lead is reported to compete with calcium for binding sites on cerebellarphosphokinase C, thereby affecting neuronal signalling (Markovac & Goldstein,1988). Furthermore, high lead exposure in children has been shown to decreasecirculating levels of the active form of vitamin D, 1,25-dihydroxyvitamin D, resultingin perturbation of calcium homeostasis (Mahaffey et al., 1982; Rosen & Chesney,1983).
2.1.4 Physiologically based pharmacokinetic (PBPK) modelling
The relationship between dietary exposure to lead and blood lead levelshas been previously evaluated by the Committee (Annex 1, reference 144). Forinfants, the evaluation is based on data from a study of a group of Scottish infantsexposed to lead from drinking-water (Lacey, Moore & Richards, 1985). In this study,the kinetic relationship between exposure to lead and blood lead levels wasanalysed. An analysis conducted by the United States Environmental ProtectionAgency (USEPA) concluded that there is a linear relationship between exposureand blood lead levels, with a linear slope of 0.16 μg/dl per 1 μg/day of dietaryexposure (USEPA, 1989). This analysis is the basis for the USEPA’s toxicokineticmodel used in the EFSA (2010) evaluation. The previous evaluation by theCommittee (Annex 1, reference 144) presented a reanalysis of the same data thatincluded an intercept parameter to account for unquantified sources of exposureother than drinking-water and concluded that a range between 0.05 and 0.10 μg/dlper 1 μg/day of dietary exposure was appropriate for low levels of lead exposure.In the present analysis, the Committee employed a range of 0.05–0.16 μg/dl per1 μg/day for children.
The Committee (Annex 1, reference 144) also previously evaluated therelationship between dietary exposure to lead and blood lead levels in adults. Basedon a similar study of drinking-water in Scotland (Sherlock et al., 1982), theCommittee identified a range of 0.023–0.07 μg/dl per 1 μg/day for adults.
2.2 Toxicological studies
2.2.1 Acute toxicity
Lead has been described as a classic chronic poison. Health effects aregenerally not observed after a single exposure, and oral median lethal doses(LD50 values) for lead salts have been reported to be greater than 2000 mg/kg bw.The lowest observed lethal doses in experimental animals after multiple short-termoral exposures to lead acetate, lead chlorate, lead nitrate, lead oleate, lead oxideor lead sulfate range from 300 to 4000 mg/kg bw (Annex 1, reference 143).
Acute kidney damage was reported in male rats following intraperitonealadministration of lead acetate (0, 0.05, 0.15 and 0.30 mmol/kg bw as Pb2+) to groupsof five male and five female rats. Minimal kidney damage, as shown by increasedurinary -glutamyl transferase activity, was observed only in males given the highest
LEAD (addendum) 387
dose. It was also observed that in all animals and at all doses, natriuria wassignificantly decreased on the first day (from 4 h after administration). Such changesevoke mild tubular abnormalities, but glomerular disturbances may also be involved(IARC, 2006).
2.2.2 Short-term studies of toxicity
There are very few short-term studies of the toxicity of lead reported in theliterature. In a study of exposure by the inhalation route, Bizarro et al. (2003)observed that CD-1 male mice exposed to a mist containing lead acetate at aconcentration of 0.01 mol/l in deionized water intermittently for 4 weeks showed atime-related increase in the fraction of damaged mitochondria in Sertoli cells, which,according to the investigators, could lead to a transformation process that mayinterfere with spermatogenesis.
Sundström & Karlsson (1987) reported that lead administered to newbornrats postnatally on days 1–15 by daily intraperitoneal injections of lead nitrate at adose of 10 mg/kg bw was found to cause haemorrhagic encephalopathy in thecerebellum at 15 days.
Sokol (1987) reported that Wistar rats given 0.3% (3000 mg/l) lead acetatein their drinking-water for 30 days manifested a hyper-responsiveness to stimulationwith both gonadotropin-releasing hormone and luteinizing hormone, whereas theymanifested a blunted response to naloxone, indicating that lead exerts its toxiceffects at hypothalamic or supra-hypothalamic sites.
2.2.3 Long-term studies of toxicity and carcinogenicity
The studies on the long-term toxicity of lead in experimental animals areextensive, and most findings are in agreement with the observations in humans(ATSDR, 2007). Chronic oral exposure to inorganic lead has effects on multipleorgans, such as kidney and liver, and systems, including cardiovascular,haematological, immune, reproductive and nervous systems. Increased mortality,weight loss and depression of weight gain have also been reported in rats (IARC,2006).
Studies of the carcinogenicity of lead in experimental animals have beenreviewed by the International Agency for Research on Cancer (IARC), and no newstudies have been published since the last monograph (IARC, 2006). Inorganic leadsalts are the main lead compounds tested via oral exposure, mostly in rats.
A substantial body of literature has demonstrated the association betweenlead exposure and renal tumours in rats. With an extremely low spontaneousincidence in rodents, renal tumours have been consistently observed in ratsexposed to lead acetate or lead subacetate for 1 year or longer. The exposure levelsin these studies, however, are considered very high compared with humandietary exposure (EFSA, 2010). A 2-year study in rats found 500 mg/kg in diet to bethe highest lead acetate concentration at which no renal tumours occurred and100 mg/kg in diet to be the concentration at which no renal pathological lesions wereobserved. Renal tumours have also been found in lead-treated mice, but the results
388 LEAD (addendum)

are not as consistent as those in rats. In one study using hamsters, no tumoursdeveloped following lead exposure (IARC, 2006).
Brain gliomas, also rarely spontaneous in rodents, seem to be associatedwith chronic inorganic lead exposure as well. Lead-induced brain gliomas werereported in three independent studies, each using a different strain of rat (IARC,2006).
Results of genotoxicity (see section 2.2.4) and mechanistic studies suggestindirect mechanisms, including the inhibition of deoxyribonucleic acid (DNA) repair,interference with cellular redox regulation and induction of oxidative stress, andderegulation of cell proliferation for lead carcinogenicity (Beyersmann & Hartwig,2008). It is therefore possible that lead can augment the effects of othercarcinogens, and lead has been examined together with various organiccarcinogens in a number of studies. Oral exposure to lead salts enhanced theincidence of renal tumours induced by N-ethyl-N-hydroxyethylnitrosamine and N-nitrosodimethylamine. However, there is not enough evidence showing that leadincreases the incidence of chemical-induced skin tumours and lung tumours (IARC,2006).
In summary, there is sufficient evidence for the carcinogenicity of inorganiclead compounds in experimental animals (IARC, 2006). Lead induces renal andbrain tumours in experimental animals and may also act as a tumour promotertogether with other renal carcinogens.
2.2.4 Genotoxicity
(a) In vitro studies
When tested in bacterial and yeast systems, lead compounds usually givenegative results. The few positive results might have resulted because of themutagenic effects of the anions, such as chromium in lead chromate. In cell-freesystems, lead acetate causes DNA strand breaks, increases 8-hydroxy-deoxyguanosine and inhibits tubulin assembly (IARC, 2006; EFSA, 2010).
Genotoxic assays using different animal cells and measuring differentgenotoxic end-points are summarized in Table 93 in the IARC (2006) monograph.Mutagenesis assays have given equivocal results. Among those showing positiveresults, the type of mutation, the extent of mutagenicity and the effective dosesvaried with experimental conditions. Several studies revealed an increase inmutation frequency stimulated by lead in combination with other mutagens, such asultraviolet C (UVC) irradiation. Lead-induced inhibition of DNA repair was alsoobserved in X-ray or UVC-treated cells. As for chromosomal aberrations, results aremostly negative, except for lead chromate, the positive results for which may be dueto the action of chromate, but not lead. Equivocal results have been published forDNA strand breaks and sister chromatid exchange. A dose-dependent increase ofmicronuclei was induced by lead chloride and lead acetate, but not by lead nitrate.
The above evidence indicates that it is not likely that lead interacts directlywith DNA. The mechanisms of lead genotoxicity probably involve multiple indirect
LEAD (addendum) 389

effects, such as the production of reactive oxygen species, the generation of proteincrosslinks and the inhibition of DNA repair.
(b) In vivo studies in experimental animals
Results from in vivo animal studies have been summarized in Table 92 inthe IARC (2006) monograph. Most rat studies have demonstrated DNA damageand micronucleus formation in kidney cells and aneuploidy in bone marrow cells.However, studies with mice and monkeys have not yielded consistent results.
(c) In vivo studies in humans
Genetic effects such as DNA damage, chromosomal aberrations andmicronucleus formation have been observed in individuals occupationally exposedto lead, whereas there is no evidence showing similar effects related to non-occupational exposure. A complete list of the human studies can be found in Table91 in the IARC (2006) monograph. Depending on the genotoxic end-point, the effectis noted when blood lead concentration falls in the range of 15–65 μg/dl (IARC,2006). A major limitation in these studies is the occupational co-exposure to othergenotoxic metals, such as cadmium, and therefore the contribution of lead alone isdifficult to evaluate. In addition, many studies did not consider smoking as a potentialconfounder, making it difficult to derive a dose–response relationship.
A number of studies in male rats and other rodent species indicate that bloodlead concentrations above 30–40 μg/dl for at least 30 days are associated withreductions in spermatogenesis and serum testosterone levels. Equivocal resultshave been reported for end-points such as reproductive organ histopathology,spermatozoal end-points and levels of pituitary hormones. It appears that certainanimal species and strains are quite resistant to the reproductive toxicity of lead,probably as a result of the physiology-based differences in lead accumulation anddistribution in target organs (Apostoli et al., 1998). Increased DNA damage,cytotoxicity and reactive oxygen species have been found in male germ cells, yet itis still not clear whether the reproductive toxicity of lead is caused by its directinteraction with reproductive organs or by the impairment of the pituitary testicularaxis, or both.
In female rats chronically exposed to lead, irregular estrous cycles andmorphological changes in ovaries have been observed. Ronis et al. (1996) reportedthat exposure of the dams to lead acetate caused a significant dose-responsivedecrease in birth weight of rat litters. In addition, reduced serum testosterone leveland dose-dependent pubertal delay were observed in male offspring. Delayedvaginal opening in female offspring and suppression of circulating estradiol werealso observed.
Exposure to lead in early development results in several endocrinedisruptions, accompanied by delayed puberty, suppression of prepubertal growthand suppression of the male pubertal growth spurt. Studies on hormonal changes
390 LEAD (addendum)
2.2.5 Reproductive and developmental toxicity

suggest that functions of the hypothalamic–pituitary–gonadal axis can be affectedwhen related structures are undergoing rapid proliferation (IARC, 2006).
2.2.6 Special studies
(a) Neurological and behavioural effects
In rodent and non-human primate models, it has been demonstrated thatchronic exposure to low-level lead affects learning abilities and behaviour,particularly in the developing animals. The magnitude of these effects appears tobe strongly dependent on the developmental period in which exposure takes place(IARC, 2006). Deficits in reversal or repeated learning have consistently beenobserved in lead-exposed animals, the magnitude of which varied by species andstimulus dimensions (EFSA, 2010). It has also been suggested that lead isassociated with some symptoms of attention deficit hyperactivity disorder (ADHD),particularly impulsivity and inattention (EFSA, 2010).
Effects of lead on visual and hearing functions have also been observed inexperimental animals. Outcomes of chronic exposure to lead include the impairmentof scotopic visual function (night blindness), decreased amplitudes and prolongedlatencies of flash-evoked visual potentials, and reduction of ocular motor function.However, there is not enough evidence for loss of the spatial and temporal contrastsensitivity functions of the visual system (IARC, 2006; EFSA, 2010). The effects oflead on auditory functions have been studied in monkeys, but the associationremains unclear. Changes in the auditory brainstem-evoked potentials and puretone detection were observed in some, but not all, studies. It seems that the resultswere influenced by the age of the test animals and the level and length of theexposures (IARC, 2006).
Although the exact mechanism or site of action is not clear, effects of leadon motor function and aggressive behaviour have been reported and reviewed byIARC (2006). Results of behavioural tests performed primarily in rats and monkeyshave suggested that the impaired performance is the result, at least in part, of acombination of distractibility, inability to inhibit inappropriate responding andperseverance of behaviours that are no longer appropriate (ATSDR, 2007).
(b) Nephrotoxicity
The renal effects of lead in animal models occur as a result of both acuteand chronic exposures. Studies on the mechanisms of lead nephrotoxicity suggestthe involvement of oxidative stress. Chronic exposure to lead induces the formationof characteristic intranuclear inclusion bodies in the proximal tubular epithelial cellsin various animal species. These inclusion bodies may function as an intracellulardepot of non-diffusible lead.
In rats, the lowest chronic lead dose related to detectable renal effects is5 mg/l in drinking-water. At this exposure level, pathological changes in renalproximal tubular cells, formation of intranuclear inclusion bodies, inhibition of renalmitochondrial respiration and swollen mitochondria were seen after 9 months ofexposure. At higher doses, various nephropathy symptoms were observed,
LEAD (addendum) 391

including increased glomerular filtration rate (GFR), focal tubular atrophy, interstitialfibrosis, elevated urinary N-acetyl- -D-glucosaminidase and glutathione S-trans-ferase. Many symptoms appear only at certain stages of exposure. For example,the hyperfiltration effect is observed only during the first 3 months of lead exposure(EFSA, 2010). A comparative study of prenatal and postnatal exposure suggestedthat lead exposure during kidney development resulted in more severe damagecompared with later lead exposure and that exposure to lead starting at weaningwas more nephrotoxic than exposure starting 2 months later (Vyskocil, Cizkova &Tejnorova, 1995).
(c) Cardiovascular effects
The cardiovascular effects of lead in experimental animals have beenreviewed by IARC (2006) and EFSA (2010). Low-level (<100 mg/l in drinking-water)chronic lead exposure has consistently been associated with a hypertensive effectin rats. However, the effects of high-level lead on blood pressure are equivocal,making it difficult to derive a dose–response relationship. In some studies, high-levelexposure failed to demonstrate increased blood pressure, suggesting a biphasicresponse (Victery, 1988). In one study, exposure of spontaneously hypertensiverats to low-level lead resulted in an enhanced susceptibility to ischaemia-inducedarrhythmias, although this effect was less marked when the exposure level washigher (IARC, 2006). In rats given lead acetate at 100 mg/l in their drinking-water,increased heart rate and heart contraction were seen (Reza et al., 2008).Observations in a large number of experimental animal studies suggest that thecardiovascular effects are secondary to lead-induced nephropathy. However, thereis also evidence suggesting that direct actions, such as the alteration in intracellularcalcium concentration and the inactivation of nitric oxide synthase, may also play arole (Vaziri, 2008).
(d) Immunotoxicity
Lead reduces resistance to bacterial and viral infections and decreasesantibody production in different experimental animals (IPCS, 1995). Theimmunological effects of lead in experimental animals have been previouslyreviewed (IARC, 2006). Decreased B-lymphocyte responsiveness, suppressedhumoral antibody titres and inhibited mitogenic responses of lymphocytes havebeen observed in mice. Lead also attenuates the delayed-type hypersensitivity(DTH) response, causes the shift of immune responses away from thymus-dependent T helper 1 (Th1)–associated responses towards Th2-dependentresponses and increases serum immunoglobulin E levels (Farrer et al., 2008). Leadnitrate has effects on the proliferative responses of B and T lymphocytes of manyanimal species (IARC, 2006). The underlying mechanisms for lead-inducedimmunomodulation have remained elusive. Overall, available data suggest thatnitric oxide, produced via the modulation of inducible nitric oxide synthase activity,is a key mediator in lead-induced immunomodulation (Farrer et al., 2008).
In rats exposed to lead in utero, depressed cell-mediated immune functionwas observed, as shown by a decrease in DTH reactions. Exposure of pregnantfemales to moderate levels of lead produces chronic immunomodulation in their
392 LEAD (addendum)

offspring. Rat embryos may be more sensitive to lead-induced immunotoxic effectswhen exposed during late gestation, with the effects on DTH function being morepronounced in females. Dietert et al. (2004) reviewed the recent findings pertainingto the effects of lead on the developing immune system compared with effects onthe adult immune system. Several rodent studies have shown that the adult bloodlead level required for immunotoxicity appears to be significantly greater than theminimum blood lead level needed for embryonic- or neonatal-associated immuneimpairment, suggesting that the sensitivity to lead immunotoxicity during embryonicand neonatal periods is much greater than that in the adult.
(e) Effects on haematopoietic system
The effects of lead on the haematopoietic system in experimental animalshave been studied and reviewed extensively (IPCS, 1995; IARC, 2006; ATSDR,2007). Lead is known to be a potent inhibitor of haem synthesis. A reduction inhaem-containing enzymes could compromise energy metabolism.
A number of studies have shown that the haem biosynthesis enzyme ALASis induced by lead as a feedback regulation. Haem oxygenase in liver and kidneyis also induced, leading to increased haem degradation. The mechanism ofalteration in the haem synthesis pathway is suggested to be lead-induced oxidativestress (Gautam & Flora, 2010).
2.3 Observations in humans
2.3.1 Biomarkers of exposure
Blood is the tissue used most frequently to estimate exposure to lead and itsassociation with health outcomes. This is largely because blood is easily sampledand the methods for measuring blood lead concentration are well developed. Theelimination half-life of lead in blood is approximately 30–40 days in adults, however,so the blood lead level provides information primarily about an individual’s exposurein recent months. The exposure averaging time will vary among individuals,depending on the extent to which endogenous pools of lead, representing pastexposure, are contributing to blood lead. Under conditions of steady-state exposure,only a small percentage of total body burden of lead is in blood (~5%), and nearlyall of this is bound to erythrocytes (96–99%), with the balance in plasma. The ratioof erythrocyte to plasma lead decreases as lead levels increase owing to saturationof binding sites on erythrocytes. Typically, whole blood lead concentration ismeasured. Although the fraction in plasma is thought to be more relevant than wholeblood lead to lead’s toxicity, it has rarely been used as the exposure biomarkerowing to the analytical challenges and the cost of measuring such low concen-trations accurately.
Because 90% of the body lead burden in adults, and 70% in children, is inbone, methods based on X-ray fluorescence (primarily K-line) have been developedfor measuring the concentration of lead in bone, expressed as grams of lead pergram of bone mineral (Hu et al., 2007). The half-life of lead in bone varies dependingon bone type, being longer in cortical bone (approximately 30 years) than in
LEAD (addendum) 393

trabecular bone (5–10 years). The bones in which measurements are mostfrequently made are tibia, patella and calcaneus. The technology required to makethese measurements is limited to only a small number of laboratories, however.Moreover, the correlation between bone lead level and a concurrent blood lead levelis often poor because of the very different exposure averaging times that these twobiomarkers capture. For instance, in one study of 50- to 70-year-olds with primarilyonly environmental exposures to lead, the correlation between bone and blood leadlevels was 0.12 (Martin et al., 2006). The correlation can be much higher inindividuals who, in the past, had substantial occupational exposures to lead, forwhom bone stores contributed to blood lead in later life (i.e. after occupationalexposure ended) (Morrow et al., 2007). These considerations make it difficult tobase risk assessments, particularly for food, on the dose–response relationshipsderived from studies that relied on bone lead level as the exposure biomarker incohorts with only environmental exposures to lead.
The X-ray fluorescence methods currently available have been used almostexclusively with adults, as they are not sufficiently sensitive for measuring bone leadin children, presumably because of the rapid remodelling of bones that occurs duringa child’s growth. Some epidemiological studies have measured the leadconcentration in shed deciduous teeth as an alternative assay of mineralized tissue.Efforts have been made to reconstruct temporal features of a child’s exposurehistory from the spatial distribution of stable lead isotopes in a tooth (Gulson &Wilson, 1994).
Lead is excreted in urine, but urinary lead levels have not been widely usedin health outcome studies. Lead diuresis in response to a chelating agent challengeis used clinically, however, to determine the need for therapeutic chelation and tomonitor treatment efficacy. The relationship between blood lead and urinary leadlevels under other conditions is weak (Gulson et al., 1998a).
Because of the possibility of external contamination by ambient lead, theconcentration of lead in hair is not viewed as an acceptable biomarker.
(a) Blood lead level during pregnancy
Lead crosses the placenta by passive diffusion, and blood lead levels innewborns are generally 80–90% of the maternal venous level at delivery. Thekinetics of lead during pregnancy are complex. The blood lead level duringpregnancy changes as a result of a variety of factors, even if external exposuresremain stable. These factors include changes in plasma volume, red cell mass andthe redistribution of lead among the different body pools caused by pregnancy-related physiological changes. During the first half of pregnancy, blood lead leveldeclines by approximately 15%, most likely due to haemodilution, organ growth andincreased GFR or increased lead excretion (Rothenberg et al., 1994). After the 20thweek of pregnancy, however, an increase of 14–40% in blood lead level, in bothwhole blood and plasma, has been observed in numerous cohorts (Hertz-Picciottoet al., 2000; Tellez-Rojo et al., 2004). Considerable evidence now supports thehypothesis that this is the result, at least in part, of increased influx of lead into theblood by means of the mobilization of bone lead stores. The timing of this increasecoincides with the increased requirement for calcium to support fetal ossification.
394 LEAD (addendum)

Other studies suggest that bone lead is mobilized at rates that are consistent withthe pattern of bone loss in menopausal women (Symanski & Hertz-Picciotto, 1995;Nash et al., 2004). In pregnant women, plasma lead level was highest in womenwho had both a high bone lead level and greater bone resorption activity (Tellez-Rojo et al., 2004). Studies evaluating changes in the ratios of stable lead isotopesover the course of pregnancy provide compelling evidence that lead stored in deeppools, such as bone, is, indeed, redistributed to the blood compartment duringpregnancy (Gulson et al., 2003; Manton et al., 2003). There are several case reportsof women who were lead poisoned in early life and, when they became pregnant,again developed symptoms of lead toxicity (e.g. Riess & Halm, 2007). Someepidemiological evidence (Hertz-Picciotto et al., 2000; Gulson et al., 2004) and onerandomized trial conducted during lactation, when calcium needs exceed thoseduring pregnancy (Hernandez-Avila et al., 2003), suggest that increased calciumintake can reduce the amount of mobilization of bone lead.
(b) Estimates of blood lead levels by region
For the World Health Organization’s (WHO) Global Burden of Disease 2005project, an updating of the estimates of the global burden of disease for the period1990–2005, A. Pruss-Ustun (unpublished data, 2010) derived estimates of thedistribution of blood lead levels for the 21 regions being considered in the project(Table 1). Where possible, separate estimates are provided by age (child versusadult), sex and area of residence (urban versus rural). Clearly, the average level ofexposure varies considerably across regions, with the means for some subgroupsexceeding 10 μg/dl. In an analysis to estimate the global burden of lead-relateddisease, Fewtrell, Kaufmann & Pruss-Ustun (2003) noted that, worldwide, 40% ofchildren had a blood lead level greater than 5 μg/dl, 20% had a level greater than10 μg/dl and less than 10% of children had a blood lead level greater than 20 μg/dl.However, 99% of the children with a level above 20 μg/dl lived in developingcountries, demonstrating the regional disparities in exposure that exist.
(c) Sources of exposure
Lead is a “multimedia” contaminant, with sources or pathways that includeair, water, soil, dust, food, paint and consumer products. This complexity can makesource attribution very challenging. Airborne lead is largely attributable to industrialemissions. The reduction in the use of lead as a petrol additive, which began around1980 worldwide, had a substantial impact on the blood lead distribution. WHOestimated that, in the years following phase-down of lead in petrol, the mean bloodlead level in a country declined by an average of 7.8% per year (Fewtrell, Kaufmann& Pruss-Ustun, 2003). This value varies depending on the relative importance ofthe different sources or pathways in a particular population, however. Studies fromseveral regions suggest that exposures can continue to be elevated for a largepercentage of children even after the removal of lead from gasoline. For example,after the phase-out of leaded petrol in India, the percentage of children lessthan 12 years of age in Mumbai who had a blood lead level above 10 μg/dlfell to half the percentage measured in 1997, but one third (33.2%) of children stillhad a level above this value, and the geometric mean blood lead level was 8.4 μg/dl
LEAD (addendum) 395

Tabl
e 1.
Est
imat
ed b
lood
lead
leve
ls w
orld
wid
e,a 1
990
and
2005 B
lood
lead
leve
l (μg
/dl)
Asi
aCA
siaE
Asi
aPhi
Asi
aSA
siaS
EA
usC
arE
urC
Eur
EE
urW
LAA
LAC
LAS
LAT
NA
HI
NA
ME
OC
SS
Afr
ica
1990
Chi
ldre
n, u
rban
mea
n10
.78.
53.
812
.06.
86.
38.
46.
27.
06.
812
.713
.910
.911
.12.
711
.44.
79.
7
Chi
ldre
n, r
ural
mea
n2.
97.
51.
98.
25.
22.
42.
24.
24.
73.
38.
58.
54.
64.
62.
77.
34.
71.
9
Adu
lts, u
rban
mea
n10
.79.
13.
613
.95.
56.
38.
86.
27.
06.
912
.712
.710
.911
.12.
211
.42.
29.
4
Adu
lts, r
ural
mea
n2.
98.
11.
98.
25.
22.
42.
24.
24.
73.
310
.310
.34.
64.
62.
27.
32.
21.
9
Urb
an G
SD
1.6
1.7
1.8
1.6
1.5
1.6
2.1
2.0
1.5
1.4
1.4
1.4
1.5
1.3
NA
1.7
1.9
1.6
Rur
al G
SD
2.0
1.7
1.8
1.7
1.7
2.0
2.2
2.7
1.6
1.8
1.9
1.9
1.8
1.8
NA
2.0
1.9
2.8
Chi
ldre
n G
SD
NA
NA
NA
NA
NA
NA
NA
NA
NA
NA
NA
NA
NA
NA
2.2
NA
NA
NA
Adu
lts G
SD
NA
NA
NA
NA
NA
NA
NA
NA
NA
NA
NA
NA
NA
NA
2.1
NA
NA
NA
2005
Chi
ldre
n, u
rban
mea
n3.
74.
62.
19.
05.
42.
19.
73.
43.
01.
63.
25.
43.
84.
51.
96.
52.
66.
8
Chi
ldre
n, r
ural
mea
n2.
44.
11.
98.
25.
32.
42.
22.
93.
01.
63.
63.
62.
22.
21.
96.
52.
61.
9
Adu
lts, u
rban
mea
n3.
74.
23.
210
.24.
62.
19.
73.
83.
02.
93.
26.
03.
84.
51.
56.
50.
66.
6
Adu
lts, r
ural
mea
n2.
43.
81.
98.
25.
32.
42.
22.
93.
02.
93.
63.
62.
22.
21.
56.
50.
61.
9
Urb
an G
SD
2.4
1.9
1.8
1.6
1.7
2.4
1.8
1.5
1.5
NA
2.1
1.6
1.9
1.6
NA
1.8
2.4
1.9
Rur
al G
SD
1.6
1.9
1.8
1.7
1.7
2.0
2.2
1.5
1.5
NA
1.8
1.8
2.2
2.2
NA
1.8
2.4
2.6
Chi
ldre
n G
SD
NA
NA
NA
NA
NA
NA
NA
NA
NA
1.9
NA
NA
NA
NA
2.17
NA
NA
NA
Adu
lts G
SD
NA
NA
NA
NA
NA
NA
NA
NA
NA
1.6
NA
NA
NA
NA
2.18
NA
NA
NA
396 LEAD (addendum)

Tabl
e 1
(con
td)
GS
D, g
eom
etric
sta
ndar
d de
viat
ion;
mea
n, g
eom
etric
mea
n; N
A, n
ot a
vaila
ble
or a
pplic
able
a T
he c
ount
ry g
roup
ings
use
d in
the
tabl
e ar
e as
follo
ws:
Asi
aC: A
sia,
Cen
tral
Arm
enia
, Aze
rbai
jan,
Geo
rgia
, Kaz
akhs
tan,
Kyr
gyzs
tan,
Mon
golia
, Taj
ikis
tan,
Tur
kmen
ista
n, U
zbek
ista
nA
siaE
: Asi
a, E
ast
Chi
na, D
emoc
ratic
Peo
ple’
s R
epub
lic o
f Kor
eaA
siaP
HI:
Asi
a P
acifi
c, H
igh
Inco
me
Bru
nei,
Japa
n, R
epub
lic o
f Kor
ea, S
inga
pore
Asi
aS: A
sia,
Sou
thA
fgha
nist
an, B
angl
ades
h, B
huta
n, In
dia,
Nep
al, P
akis
tan
Asi
aSE
: Asi
a, S
outh
east
Cam
bodi
a, In
done
sia,
Lao
Peo
ple’
s D
emoc
ratic
Rep
ublic
, Mal
aysi
a, M
aldi
ves,
Mau
ritiu
s, M
ayot
te, M
yanm
ar, P
hilip
pine
s, S
eych
elle
s, S
ri La
nka,
Tha
iland
, Tim
ore
Lest
e, V
iet N
amA
us: A
ustr
alas
iaA
ustr
alia
, New
Zea
land
Car
: Car
ibbe
anA
ngui
lla, A
ntig
ua a
nd B
arbu
da, A
ruba
, Bah
amas
, Bar
bado
s, B
eliz
e, B
erm
uda,
Brit
ish
Virg
in Is
land
s, C
aym
an Is
land
s, C
uba,
Dom
inic
a, D
omin
ican
Rep
ublic
, Fre
nch
Gui
ana,
Gre
nada
, Gua
dalo
upe,
Guy
ana,
Hai
ti, J
amai
ca, M
artin
ique
, Mon
tser
rat,
Net
herla
nds
Ant
illes
, Sai
nt K
itts
and
Nev
is, S
aint
Luci
a, S
aint
Vin
cent
and
the
Gre
nadi
nes,
Sur
inam
e, T
rinid
ad a
nd T
obag
o, T
urks
and
Cai
cos
Isla
nds
Eur
C: E
urop
e, C
entr
alA
lban
ia, B
osni
a an
d H
erze
govi
na, B
ulga
ria, C
roat
ia, C
zech
Rep
ublic
, Hun
gary
, Mon
tene
gro,
Pol
and,
Rom
ania
, Ser
bia,
Slo
vaki
a, S
love
nia,
The
form
erY
ugos
lav
Rep
ublic
of M
aced
onia
Eur
E: E
urop
e, E
aste
rnB
elar
us, E
ston
ia, L
atvi
a, L
ithua
nia,
Rep
ublic
of M
oldo
va, R
ussi
an F
eder
atio
n, U
krai
neE
urW
: Eur
ope,
Wes
tern
And
orra
, Aus
tria
, Bel
gium
, Cha
nnel
Isla
nds,
Cyp
rus,
Den
mar
k, F
aero
e Is
land
s, F
inla
nd, F
ranc
e, G
erm
any,
Gib
ralta
r, G
reec
e, G
reen
land
, Hol
y S
ee,
Icel
and,
Irel
and,
Isle
of M
an, I
srae
l, Ita
ly, L
iech
tens
tein
, Lux
embo
urg,
Mal
ta, M
onac
o, N
ethe
rland
s, N
orw
ay, P
ortu
gal,
Sai
nt P
ierr
e et
Miq
uelo
n, S
anM
arin
o, S
pain
, Sw
eden
, Sw
itzer
land
, Uni
ted
Kin
gdom
LEAD (addendum) 397

Tabl
e 1
(con
td)
LAA
: Lat
in A
mer
ica,
And
ean
Ecu
ador
, Per
u, P
lurin
atio
nal S
tate
of B
oliv
iaLA
C: L
atin
Am
eric
a, C
entr
alC
olom
bia,
Cos
ta R
ica,
El S
alva
dor,
Gua
tem
ala,
Hon
dura
s, M
exic
o, N
icar
agua
, Pan
ama,
Ven
ezue
la (
Bol
ivar
ian
Rep
ublic
of)
LAS
: Lat
in A
mer
ica,
Sou
ther
nA
rgen
tina,
Chi
le, F
alkl
and
Isla
nds
(Mal
vina
s), U
rugu
ayLA
T: L
atin
Am
eric
a, T
ropi
cal
Bra
zil,
Par
agua
yN
AH
I: N
orth
Am
eric
a, H
igh
Inco
me
Can
ada,
Uni
ted
Sta
tes
of A
mer
ica
NA
ME
: Nor
th A
fric
a / M
iddl
e E
ast
Alg
eria
, Bah
rain
, Egy
pt, I
ran
(Isl
amic
Rep
ublic
of)
, Ira
q, J
orda
n, K
uwai
t, Le
bano
n, L
ibya
n A
rab
Jam
ahiri
ya, M
oroc
co, O
man
, Qat
ar, S
audi
Ara
bia,
Syr
ian
Ara
b R
epub
lic, T
unis
ia, T
urke
y, U
nite
d A
rab
Em
irate
s, W
est B
ank
and
Gaz
a S
trip
, Wes
tern
Sah
ara,
Yem
enO
C: O
cean
iaA
mer
ican
Sam
oa, C
ook
Isla
nds,
Fiji
, Fre
nch
Pol
ynes
ia, G
uam
, Kiri
bati,
Mar
shal
l Isl
ands
, Mic
rone
sia
(Fed
erat
ed S
tate
s of
), N
auru
, New
Cal
edon
ia,
Niu
e, N
orth
ern
Mar
iana
Isla
nds,
Pal
au, P
apua
New
Gui
nea,
Pitc
airn
, Sam
oa, S
olom
on Is
land
s, T
okel
au, T
onga
, Tuv
alu,
Van
uatu
, Wal
lis a
nd F
utun
aIs
land
sS
SA
C: S
ub-S
ahar
an A
fric
a, C
entr
alA
ngol
a, C
entr
al A
fric
an R
epub
lic, C
ongo
, Dem
ocra
tic R
epub
lic o
f the
Con
go, E
quat
oria
l Gui
nea,
Gab
onS
SA
E: S
ub-S
ahar
an A
fric
a, E
ast
Bur
undi
, Com
oros
, Djib
outi,
Erit
rea,
Eth
iopi
a, K
enya
, Mad
agas
car,
Mal
awi,
Moz
ambi
que,
Rw
anda
, Som
alia
, Sud
an, U
gand
a, U
nite
d R
epub
lic o
fT
anza
nia,
Zam
bia
SS
AS
: Sub
-Sah
aran
Afr
ica,
Sou
ther
nB
otsw
ana,
Les
otho
, Nam
ibia
, Sou
th A
fric
a, S
waz
iland
, Zim
babw
eS
SA
W: S
ub-S
ahar
an A
fric
a, W
est
Ben
in, B
urki
na F
aso,
Cam
eroo
n, C
ape
Ver
de, C
had,
Côt
e d’
Ivoi
re, G
ambi
a, G
hana
, Gui
nea,
Gui
nea-
Bis
sau,
Lib
eria
, Mal
i, M
aurit
ania
, Nig
er, N
iger
ia,
Sai
nt H
elen
a, S
ao T
ome
and
Prin
cipe
, Sen
egal
, Sie
rra
Leon
e, T
ogo
NB
: For
the
purp
ose
of le
ad e
xpos
ure
estim
ates
, all
sub-
Sah
aran
reg
ions
hav
e be
en p
oole
d in
to o
ne (
SS
Afr
ica)
bec
ause
of a
lack
of d
ata.
398 LEAD (addendum)

(Nichani et al., 2006). After the phase-out in Uganda, 20% of 4- to 8-year-oldchildren still had a blood lead level greater than 10 μg/dl (Graber et al., 2010). In apooled analysis of studies of Chinese children, the mean blood lead level after thephase-out was 8.1 μg/dl, with 24% of children having a level greater than 10 μg/dl(He, Wang & Zhang, 2009).
Some sources of lead exposure are specific to particular regions or cultures.Some traditional medicines (e.g. Ayervedic preparations) and spices from Asia havebeen reported to have high lead content and to have caused lead toxicity (Kales &Saper, 2009; Shamshirsaz et al., 2009; Lin et al., 2010), as have some cosmeticsused primarily in the Middle East and South Asia (e.g. surma) (Rahbar et al., 2002).In Mexico, the preparation of food in lead-glazed ceramics that were not fired atsufficiently high temperatures has been identified as a major risk factor for elevatedlead exposure (Villalobos et al., 2009). With the large-scale migration acrossnational boundaries and international transport of foods, this problem has contrib-uted to increased exposure in Hispanic subpopulations elsewhere (Handley et al.,2007; Lynch, Elledge & Peters, 2008). Electronic wastes sent to developingcountries for recycling of materials have been reported to be associated with greaterlead exposure to children in proximity to the recovery facilities (Albalak et al., 2003;Huo et al., 2007).
2.3.2 Biomarkers of effect
A variety of biomarkers of effect have been used in studies on the healtheffects of exposure to lead. Because lead inhibits the activity of certain enzymes inthe haem pathway, such as ALAD and ferrochelatase, the accumulation productsALA and free erythrocyte protoporphyrin (or zinc protoporphyrin) have been used.For studies in which renal function was the end-point of interest, biomarkers offunction such as GFR, serum creatinine level and serum uric acid concentrationhave been used. Studies of cardiovascular health have relied on biomarkers suchas blood pressure, heart rate variability and pulse pressure. Studies of nervoussystem toxicity have employed biomarkers such as nerve conduction velocity,postural balance, tremor and intelligence quotient (IQ). Typically, these biomarkershave been considered both as continuously distributed variables and as categoricalvariables, with category boundaries specified according to judgements aboutclinical significance.
2.3.3 Clinical observations
High-dose exposure is associated with toxic effects on several organsystems, affecting haematopoiesis, renal function and, most prominently,particularly in children, the central nervous system. The haematological effectsinclude anaemia, which is attributable to the inhibition of the enzymes ALAD andferrochelatase. Effects on the kidney include an acute renal nephropathy involvingproximal tubule dysfunction due to impairment of mitochondrial respiration and amore chronic nephropathy that is associated with reductions in GFR and atrophy ofproximal and distal tubules. The neurological effects include encephalopathycharacterized by brain oedema and haemorrhage due to microvascular damage.
LEAD (addendum) 399

Clinical signs and symptoms at presentation are variable and occur atblood lead levels that differ widely across individuals. In some people, blood leadlevels of several hundred micrograms per decilitre have been reported to beasymptomatic, whereas others with a blood lead level of 100 μg/dl might presentwith an encephalopathy. Many of the symptoms and signs are nonspecific and mightinclude abdominal colic, nausea, vomiting, constipation, anorexia, changes inconsciousness, lethargy, irritability, paraesthesias and other signs of peripheralneuropathy, and pallor.
2.3.4 Epidemiological studies
(a) Mortality
Recent prospective cohort studies provide reasonably consistent evidence,in both men and women, that higher lead levels are associated with higher all-causemortality and that deaths from cardiovascular diseases are largely responsible forthe associations.
In the first of several studies in the USA that relied on data from the NationalHealth and Nutrition Examination Survey (NHANES) to evaluate this association,Lustberg & Silbergeld (2002) followed up, in 1992, individuals who participated inNHANES II (1976–1980) (n = 4292, 30–74 years of age). A baseline blood leadlevel of 20–29 μg/dl was associated with an adjusted hazard ratio (HR) for all-causemortality of 1.46 (95% confidence interval [CI] 1.14–1.86), using individuals with abaseline blood lead level below 10 μg/dl as the reference group. The HRs werealso significant for circulatory mortality (1.39, 95% CI 1.01–1.91) and cancer(1.68, 95% CI 1.02–2.78). The HRs for individuals with baseline blood lead levelsof 10–19 μg/dl were increased, but not significantly.
Menke et al. (2006) used NHANES III data (1988–1994) to consider theassociation between blood lead level and all-cause and cause-specific mortality inthe adult population in the USA. The follow-up interval was 12 years in the 13 946individuals with a blood lead level less than 10 μg/dl (mean 2.6 μg/dl). The causesof death considered in the analyses were cardiovascular disease, myocardialinfarction, stroke, cancer and lung cancer. Cox proportional hazard regression wasused to estimate HRs for individuals in baseline blood lead tertiles, adjusting forage, race, sex, diabetes mellitus, body mass index, smoking, alcohol consumption,physical activity, income, C-reactive protein, total cholesterol, education, urbanresidence, postmenopausal status, hypertension and kidney function (GFR <60 ml/min per 1.73 m3). Comparing individuals in the highest versus the lowest tertile, theadjusted HR for all-cause mortality was 1.25 (95% CI 1.0–1.5, P for trend = 0.002).The associations with baseline blood lead level were also significant for cardio-vascular deaths (HR 1.6, 95% CI 1.1–2.2), myocardial infarction (HR 1.9, 95%CI 1.0–3.4) and stroke (HR 2.5, 95% CI 1.2–5.3). Spline regressions, used todescribe the shapes of the relationships, suggested that the increase in mortalitywas evident at blood lead levels greater than 2 μg/dl.
Schober et al. (2006) also evaluated mortality among participants in theNHANES III survey (n = 9757). Compared with the group with a baseline blood lead
400 LEAD (addendum)

level below 5 μg/dl, individuals with a baseline blood lead level of 5–9 μg/dl had asignificantly increased adjusted risk of all-cause mortality (HR 1.24, 95% CI 1.05–1.48), as did individuals with a baseline blood lead level of 10 μg/dl or higher (HR1.59, 95% CI 1.28–1.98). The HRs were similar in these two exposure strata fordeaths from cardiovascular disease or cancer.
The associations between lead biomarkers and total and cause-specificmortality were evaluated in approximately 868 men enrolled in the United StatesVeterans Administration Normative Aging Study (Weisskopf et al., 2009). The meanage at baseline was 67.3 years (standard deviation [SD] 7.3 years), and a meanlength of follow-up was 8.9 (SD 3.9) years. Blood lead level at baseline, whichaveraged 5.6 (SD 3.4) μg/dl, was not associated with mortality. Adjusting for age,smoking and education, lead concentration in patella was significantly associatedwith all-cause, cardiovascular (HR 5.6, 95% CI 1.7–18.3) and ischaemic heartdisease deaths. For example, the HR for men in the highest tertile of patella lead,compared with men in the lowest tertile, was 2.5 (95% CI 1.2–5.4). Adjustment forhypertension, race, alcohol use, physical activity, body mass index, high-densitylipoprotein, cholesterol and diabetes mellitus did not affect the results appreciably.Exploration of the functional forms of the associations suggested linear dose–response relationships. The HRs associated with tibia lead concentration weregreater than 1 for these three end-points, but the 95% CIs included 1.
Khalil et al. (2009b) followed up 533 women, aged 65–87 at baseline, for amean of 12 (SD 3) years. The mean blood lead level was 5.3 (SD 2.3) μg/dl (range1–21 μg/dl). For the purposes of analyses, the mortality among women with abaseline blood lead level less than 8 μg/dl was compared with the mortality ofwomen with a level of 8 μg/dl or greater. For all-cause mortality, the HR for womenwith a blood lead level of 8 μg/dl or greater was 1.6 (95% CI 1.0–2.5, P = 0.04). Fordeaths from cardiovascular diseases, the HR was 3.1 (95% CI 1.2–7.7, P = 0.02).Blood lead level was not significantly associated with stroke, cancer or non-cardiovascular deaths.
(b) Cancer
IARC (2006) recently reviewed studies of the carcinogenicity of inorganiclead. These included studies of both occupational and environmental (i.e. generalpopulation) exposures. The following section summarizes IARC’s conclusionsabout the evidence.
(i) Occupational exposures
In one study conducted on primary smelter workers in Sweden, a 2-foldexcess in the number of lung cancer cases was observed. However, these workerswere also exposed to arsenic, a known risk factor for lung cancer. In a Finnish studyof workers from a variety of industries, blood lead level, measured as part ofsurveillance programmes, showed a modest, but non-significant, dose–responserelationship between blood lead level and incidence of lung cancer. In five otherstudies, involving battery and smelter workers in the USA, the United Kingdom andItaly, no consistent increase in risk was found as exposures increased. Data onsmoking were not available for some of these cohorts.
LEAD (addendum) 401

In five of the cohorts considered with regard to lung cancer, the associationbetween blood lead level and stomach cancer was also evaluated. Compared withthe reference populations, the numbers of stomach cancer cases were 30–50%higher in the workers than in the reference populations, but data necessary toconduct dose–response analyses were not available. In addition, it was not possibleto consider the possible contributions of other risk factors for stomach cancer, suchas ethnicity, diet, socioeconomic status or Helicobacter pylori infection.
In one of five cohort studies, a 2-fold excess of kidney cancers was reported,but in the other four studies, the rates were close to the expected values. It wasnoted that the numbers of cases in these cohorts were small.
In four cohort studies that evaluated tumours of the brain and nervoussystem, no excess risk was observed among the exposed workers, compared withthe reference population. A nested case–control study of Finnish workers reporteda significant association between blood lead level and risk for glioma. As with kidneycancers, however, the numbers of cases on which these conclusions are basedwere small.
(ii) Environmental exposures
One study analysed data for a subgroup of participants in NHANES II, whichwas conducted between 1976 and 1980 (Jemal et al., 2002). The mean blood leadlevel was 7.3 μg/dl in the lowest quartile and 19.7 μg/dl in the highest quartile.Adjusting for a variety of baseline variables (age, poverty, alcohol and tobacco use,region and year of examination), risk of cancer mortality across blood lead quartileswas not significant for men or women, nor were site-specific cancer risks. Thenumbers of cases observed for some specific cancers were small, however.
Lustberg & Silbergeld (2002) analysed a somewhat different subgroup ofNHANES II participants, including non-Caucasians but excluding participantswhose blood lead level was 30 μg/dl or higher. In analyses that adjusted for baselinevalues of age, sex, race, education, income, smoking, body mass index, exerciseand region, a positive association was found between blood lead level and risk ofcancer. Using individuals with a blood lead level below 10 μg/dl as the referentgroup, the relative risk observed among individuals with a blood lead level of 10–19 μg/dl was 1.46 (95% CI 0.87–2.48). The relative risk among individuals with ablood lead level of 20–29 μg/dl was 1.68 (95% CI 1.02–2.78). The relative risks forlung cancer in these two blood lead groups were 1.70 (95% CI 0.60–4.81) and 2.20(95% CI 0.80–6.06), respectively. The IARC working group expressed concernabout possible residual confounding resulting from the investigators’ failure to adjustfor duration of smoking.
Based on its evaluation, IARC concluded that although the evidence forcarcinogenicity is sufficient in animals, there is limited evidence in humans for thecarcinogenicity of inorganic lead and that inorganic lead compounds are probablycarcinogenic to humans (group 2A).
Since the completion of the IARC evaluation, additional studies have beenpublished in which the association between lead exposure and mortality from cancerhas been evaluated, but the results do not indicate that any revision to the IARC
402 LEAD (addendum)

conclusions is required. In a study using the data on 13 946 participants in NHANESIII, conducted between 1988 and 1994, Menke et al. (2006) evaluated theassociation between blood lead level (mean of 2.6 μg/dl) and overall cancermortality and mortality from lung cancer. In analyses adjusting for age, race/ethnicity, sex, diabetes mellitus, body mass index, smoking, alcohol consumption,physical activity, income, C-reactive protein, total cholesterol, education, residence,postmenopausal status, hypertension and kidney function, the HR for individuals intertile 2 of blood lead level ( 1.94–3.62 μg/dl) was 0.72 (95% CI 0.46–1.12). TheHR for individuals in tertile 3 of blood lead level (3.63 μg/dl) was 1.10 (95% CI 0.82–1.47). The P for trend was 0.10. The HRs for lung cancer in tertiles 2 and 3 were0.70 (95% CI 0.34–1.42) and 0.79 (95% CI 0.40–1.58), respectively.
Among 868 men participating in the United States Veterans AdministrationNormative Aging Study, Weisskopf et al. (2009) found that neither baselineblood lead level nor patella lead level, measured using K-line X-ray fluorescence,was significantly associated with cancer mortality. For baseline blood leadlevel, adjusting for age, smoking and education, the HR for individuals in tertile 2(4–6 μg/dl) was 1.03 (95% CI 0.42–2.55), and the HR for individuals in tertile3 (>6 μg/dl) was 0.53 (95% CI 0.20–1.39) (P for trend = 0.15). For patella lead level,the HR for individuals in tertile 2 (22–35 μg/g bone) was 0.82 (95% CI 0.26–2.59),and the HR for individuals in tertile 3 (>35 μg/g bone) was 0.32 (95% CI 0.08–1.35)(P for trend = 0.14).
In a case–control study of primary smelter workers, arsenic exposure, butnot lead exposure, was a risk factor for lung cancer in 141 cases and age-matchedcontrols (Lundstrom et al., 2006).
Alatise & Schrauzer (2010) reported that women newly diagnosed withinfiltrating ductal carcinoma of the breast had higher levels of blood and hair leadand that hair lead level correlated significantly with tumour volume.
In a study of 362 patients with brain tumours (glioma or meningioma) and494 controls, gene–environment interactions were found. Specifically, cumulativelead exposure as a main effect, estimated on the basis of job history, was notassociated with glioblastoma multiforme and meningioma, but polymorphisms in theRAC2 and GPX1 genes (for glioblastoma multiforme) and the GPX1 and XDH genes(for meningioma) were observed to modify the association (Bhatti et al., 2009).
(c) Renal function
In a sample of 769 adolescents (12–20 years old) in NHANES III, Fadrowskiet al. (2010) evaluated the association between blood lead level and GFR, estimatedon the basis of both serum cystatin C level and serum creatinine level. The formeris considered preferable to the latter as a marker of kidney function, as it appearsto be less dependent than creatinine-based estimates on age, sex, height andmuscle mass. The median blood lead level was 1.5 μg/dl (interquartile range 0.7–2.9 μg/dl). Models were adjusted for age, sex, race/ethnicity, urban/rural, tobaccosmoke exposure, annual household income and educational level of familyreference person. Participants with a blood lead level in the highest quartile( 3 μg/dl) had a 6.6 ml/min per 1.73 m3 lower cystatin C–estimated GFR (95%CI of 0.7 to 12.6 ml/min per 1.73 m3) compared with those in the first quartile
LEAD (addendum) 403

(<1 μg/dl), with a significant trend (P = 0.009). Restricted quadratic spline analysesshowed no departures from linearity and no threshold. The associations werequalitatively similar but weaker using creatinine to estimate GFR, suggesting thatprevious studies that depended on creatinine-based estimates of kidney functionmight have underestimated the association between GFR and blood lead level.Many of the previous studies had been conducted in adults with chronic kidneydisease or hypertension. This study extends the association to the generalpopulation of adolescents in the USA in whom significant co-morbidities wereabsent. A limitation of this study is its cross-sectional design, leaving open thepossibility of reverse causation (i.e. kidney disease causes decreased excretion oflead). This appears unlikely, however, as at least some prospective studies haveshown that baseline blood lead level is associated with subsequent decline in kidneyfunction (Kim et al., 1996), particularly among participants with diabetes orhypertension (Tsaih et al., 2004).
Using adult ( 20 years old) participants in NHANES III (n = 15 211), Muntneret al. (2003) evaluated the associations between blood lead level and two indicesof renal dysfunction: serum creatinine (cut-points representing the 99th percentilesfor race/sex) and chronic kidney disease (GFR <60 ml/min per 1.73 m3). Modelswere adjusted for age, sex, systolic blood pressure, diabetes mellitus, currentsmoking, history of cardiovascular disease, body mass index, alcohol consumption,household income, marital status and health insurance. Significant associationsbetween blood lead level and kidney dysfunction were found among individuals withhypertension (n = 4813), but not among those without hypertension (n = 10 398).Among those with hypertension, the adjusted odds ratio (OR) for elevated serumcreatinine level for individuals in the highest quartile of blood lead level (6.0–56.0μg/dl) was 2.4 (95% CI 1.5–4.0), and the adjusted OR for chronic kidney diseasefor the same individuals was 2.6 (95% CI 1.5–4.5). For both outcomes, the adjustedORs were also significant for individuals in quartiles 2 (2.5–3.8 μg/dl) and 3 (3.9–5.9 μg/dl), with the trend across quartiles significant (P < 0.001). Muntner et al.(2005) subsequently reported similar associations using data from NHANES1999–2002 (n = 9961). Adjusting for the same set of covariates plus race/ethnicity,they found that individuals in the highest quartile of blood lead level (2.47 μg/dl)were 2.7 (95% CI 1.5–5.0) times more likely than individuals in quartile 1 ofblood lead level (<1.1 μg/dl) to have chronic kidney disease (defined as a GFR<60 ml/min per 1.73 m3).
In a sample of adults from Taiwan, China (n = 1565), Lai et al. (2008)evaluated the associations between blood lead level and two indices of renaldysfunction: serum creatinine level (levels above 1.2 mg/dl considered abnormal)and serum uric acid level (levels above 7 mg/dl in males and 6 mg/dl in femalesconsidered abnormal). Adjusting for age, sex, occupation, education, marital status,smoking, alcohol, betel nut chewing, hypertension and lipid levels, they found thatthe ORs for individuals with blood lead levels in the highest tertile (>7.5 μg/dl; 0.8%of individuals had blood lead levels above 10 μg/dl) were 1.9 (95% CI 1.2–3.1) forelevated serum creatinine level and 2.7 (95% CI 1.6–4.5) for hyperuricaemia (bothP < 0.01).
404 LEAD (addendum)

Lin and colleagues reported a series of studies on patients with chronickidney disease, evaluating whether the rate of decline in kidney function over timediffers depending on lead burden. Some studies have been observational. Forexample, Yu, Lin & Lin-Tan (2004) followed 121 patients for 4 years, classifying theirbaseline ethylenediaminetetraacetic acid (EDTA)-chelatable lead as “low” (urinarylead level below 80 μg/72 h urine collection following a provocative chelation dose)or “high” (urinary lead level between 80 and 600 μg/72 h). Significantly more patientswith high compared with low baseline lead burdens experienced a doubling of serumcreatinine level or required haemodialysis (P = 0.001). Each microgram per decilitreincrease in baseline blood lead level, which was 4.9 μg/dl in the high-chelatable leadgroup and 3.4 μg/dl in the low-chelatable lead group, was associated with areduction of 4.0 ml/min per 1.73 m3 in GFR over the period of observation. Otherstudies by this group involved random assignment of patients with chronic kidneydisease to receive therapeutic chelation, with decline in kidney function as theprimary end-point. For instance, in one study involving 64 patients, whose baselinechelatable lead levels ranged from 80 to 600 μg/72 h, the patients randomized toactive treatment received EDTA for up to 3 months, with additional rounds oftreatment if indicated. The mean baseline blood lead levels of the chelation andplacebo groups were 6.1 and 5.9 μg/dl, respectively. At the end of 2 years, the meanestimated GFR had increased by 2.1 ml/min per 1.73 m3 in the chelated group anddeclined by 6.0 ml/min per 1.73 m3 in the placebo group (P < 0.01) (Lin et al., 2003).In a subsequent study involving 108 patients with chronic kidney disease withchelatable lead levels between 20 and 80 μg/72 h and baseline blood lead levels of1.2–4.6 μg/dl, the mean change in GFR was 6.6 ml/min per 1.73 m3 in the chelatedgroup and 4.6 ml/min per 1.73 m3 in the placebo group (P < 0.001) (Lin et al.,2006a). This group conducted a study similar in design on 87 patients with type IIdiabetes and diabetic nephropathy, baseline chelatable lead levels between 30 and373 μg/72 h and a mean blood lead level of 6.5 μg/dl (range 1.6–19.1 μg/dl) (Lin etal., 2006b). In the 12-month observation period following random assignment ofpatients to chelation or placebo, the rate of decline in GFR was 5.0 (SD 5.7) ml/minper 1.73 m3 in the chelation group and 11.8 (SD 7.0) ml/min per 1.73 m3 in theplacebo group. Baseline blood and chelatable lead levels were both significantpredictors of progressive nephropathy in patients with diabetes.
A case–control study compared the blood and tibia lead levels of 55 AfricanAmericans with end-stage renal disease (patients receiving chronic haemodialysistreatment) with those of 53 age- and sex-matched controls (Muntner et al., 2007).The cause of end-stage renal disease was hypertension for 40% of the cases,diabetes for 36%, glomerulosclerosis for 6% and unknown for 18%. The mean bloodlead level was significantly higher among cases (6 versus 3 μg/dl, P < 0.001), with67% of cases (compared with 6% of controls) having a level of 5–9 μg/dl and 15%(compared with no controls) having a level of 10 μg/dl or greater. The tibia leadlevels of cases were somewhat higher than those of controls, but the difference wasnot significant. The authors suggested that this finding, along with the fact that bloodand tibia lead levels were more highly correlated for cases than for controls, mightindicate greater bone turnover in the cases, resulting in higher blood lead levels.
LEAD (addendum) 405

The association between lead exposure and renal function in children hasnot been studied extensively. The few data available suggest that higher blood leadlevels are associated with increased GFR (as estimated by serum creatinine orcystatin C levels), suggesting a paradoxical effect, perhaps a hyperfiltrationphenomenon (Staessen et al., 2001; de Burbure et al., 2006).
Several factors have been found to modify the association between bloodlead level and kidney function, although the evidence is inconsistent. Among theseare certain genetic polymorphisms, including ALAD, the vitamin D receptor and nitricoxide synthase (Weaver et al., 2003, 2006; Wu et al., 2003). Among adults whoparticipated in NHANES 1999–2006 (n = 14 778), Navas-Acien et al. (2009) foundthat higher cadmium exposure resulted in more striking positive associationsbetween blood lead level and renal dysfunction. Adjusting for survey year, age, sex,race/ethnicity, body mass index, education, smoking, cotinine, alcohol consump-tion, hypertension, diabetes mellitus and menopausal status, individuals with bloodlead and blood cadmium levels that placed them in the highest quartile for bothmetals had ORs of 2.3 (95% CI 1.7–3.2) for albuminuria and 2.0 (95% CI 1.3–3.1)for reduced GFR (estimated based on serum creatinine). The same ORs calculatedwithout taking blood cadmium level into account were much smaller: 1.2 (95% CI1.0–1.5) and 1.6 (95% CI 1.2–2.1), respectively. For individuals in the highestquartiles of both metals, the OR associated with having both indicators of kidneydysfunction was 4.1 (95% CI 1.6–10.7).
(d) Cardiovascular system
Increased blood pressure/hypertension have long been recognized as aconsequence of occupational exposure to lead, raising the question of whether asimilar, but more modest, association between lead burden and other cardio-vascular outcomes is evident as well at the lower lead exposures experienced bythe general population. A variety of reviews (e.g. Navas-Acien et al., 2007) haveevaluated the evidence with regard to blood pressure, generally finding that itsupports the presence of a positive relationship, with the magnitude of the increasein blood pressure per microgram per decilitre being modest, approximately 1 mmHg(0.13 kPa). The CIs of the estimates derived from consideration of the integratedevidence are mostly positive values but usually include 0 as well (e.g. in the USEPA[2006] integrative analysis, the 95% CI was 3.9 to 11 for systolic pressure and
1.3 to 7.3 for diastolic pressure).
Some analyses suggest that the association between lead exposure andblood pressure varies across sociodemographic strata. Limiting analyses ofNHANES III data to women aged 40–59 years (n = 2165), Nash et al. (2003)reported that, compared with women with blood lead levels in the lowest quartile(0.5–1.6 μg/dl), women in the highest quartile (4–31 μg/dl) had an adjusted OR of3.4 (95% CI 1.3–8.7) for diastolic hypertension (>90 mmHg [12 kPa]) and anadjusted OR of 1.5 (95% CI 0.7–3.2) for systolic hypertension (>140 mmHg [19kPa]). The associations were strongest for postmenopausal women. In analyses ofNHANES III data stratifying by race, Vupputuri et al. (2003) found significantadjusted associations between blood lead level and blood pressure in black malesand females: each 3.3 μg/dl increase was associated with a 0.82 mmHg (0.11 kPa)
406 LEAD (addendum)

increase in systolic blood pressure in black males (95% CI 0.19–1.44 mmHg [0.025–0.19 kPa]) and a 1.55 mmHg (0.21 kPa) increase in systolic pressure in blackfemales (95% CI 0.47–2.64 mmHg [0.063–0.35 kPa]). No associations were foundin white males or females.
Glenn et al. (2003, 2006) conducted two longitudinal studies, in occupa-tionally exposed cohorts, of the association between changes in blood lead leveland changes in systolic blood pressure. In a cohort of 496 current and formerworkers followed for 4 years, the baseline blood lead level was 4.6 ± 2.6 μg/dl.Adjusting for covariates, systolic blood pressure increased 0.64 mmHg (0.085 kPa)(standard error [SE]: 0.25 mmHg [0.033 kPa]), 0.73 mmHg (0.097 kPa) (SE: 0.26mmHg [0.035 kPa]) and 0.61 mmHg (0.081 kPa) (SE: 0.27 mmHg [0.036 kPa]) foreach standard deviation increase in blood lead level at baseline, tibia lead at year3 or peak past tibia lead levels, respectively (Glenn et al., 2003). In a cohort of 575Korean workers also followed for 4 years, the baseline blood lead level was 31.4 ±14.2 μg/dl. Adjusting for covariates, systolic blood pressure increased 0.9 mmHg(0.12 kPa) (95% CI 0.1–0.6 mmHg [0.013–0.08 kPa]) for each 10 μg/dl increase inblood lead per year (Glenn et al., 2006).
Park et al. (2009) used a prediction model, developed using data from theUnited States Veterans Administration Normative Aging Study, for predicting bonelead level from blood lead level to reanalyse the association between lead andhypertension in NHANES III. The association was stronger using estimated bonelead level compared with using blood lead level, suggesting that use of a biomarkerof shorter-term exposure to lead might result in an underestimate of the association.Among the potential mechanisms proposed to underlie this association are lead-related impairments in renal function, oxidative stress, effects on the renin–angiotensin system and suppression of nitric oxide. Another potential mechanismis suggested by the finding, in a random sample of 1140 50- to 70-year-olds in theBaltimore Memory Study, that blood lead level is significantly correlated withhomocysteine levels after adjustment for age, sex, race/ethnicity, education,tobacco use, alcohol consumption and body mass index (Schafer et al., 2005). Thesame finding was reported in a smaller cross-sectional study in occupationallyexposed workers (Chia et al., 2007a).
Published studies used by WHO in estimating the global burden of diseaseattributable to lead indicate that relative risks of ischaemic heart disease andcerebrovascular stroke associated with small increases in blood pressure (0.4–3.7 mmHg [0.053–0.49 kPa] systolic blood pressure) have been estimated to be inthe range of 1.01–1.4, with higher relative risks at younger ages. A large meta-analysis that included 61 prospective studies showed that increases in bloodpressure, even among individuals who are clinically normotensive, are associatedwith increased vascular mortality (Prospective Studies Collaboration, 2002). Thisanalysis included 12.7 million person-years of follow-up for 958 000 adults who werefree of known vascular disease at baseline. Blood pressure was significantlyassociated with age-specific mortality rates for stroke, ischaemic heart disease andother vascular causes, with the relationships apparent throughout the bloodpressure range, extending down to 115 mmHg (15 kPa) systolic blood pressure and75 mmHg (10 kPa) diastolic blood pressure. The association was log-linear, such
LEAD (addendum) 407

that the proportional difference in risk associated with a given increase in bloodpressure was similar across the entire range. For example, among those of middleage, reducing systolic blood pressure by 2 mmHg (0.3 kPa) would be estimated toproduce a 10% reduction in stroke mortality and a 7% decrease in mortality fromischaemic heart disease.
As noted previously, studies relating lead exposure to overall mortality havetended to find that deaths from cardiovascular disease are largely responsible forthe association (Lustberg & Silbergeld, 2002; Schober et al., 2006). The evidenceregarding lead and clinical cardiovascular end-points is mixed, however, with mostof the studies focusing on individuals with occupational exposure. In cross-sectionalanalyses of NHANES 1999–2002, an association was reported between concurrentblood lead level and the risk of peripheral artery disease (Navas-Acien et al., 2004;Muntner et al., 2005). Other studies have shown a non-significant elevation in riskof stroke. In a study of non-occupational exposure and heart rate variability in asample of people from the Republic of Korea (n = 331, comparing blood lead levelsbelow 1.39 μg/dl with those above 3.45 μg/dl), Jhun, Kim & Paek (2005) reportedinverse associations between low-frequency, high-frequency and total powerspectrum, but these associations were not significant in adjusted analyses. Incommunity-exposed adult men (n = 413) in the United States Veterans Adminis-tration Normative Aging Study, Park et al. (2006) also did not find significantadjusted associations between higher tibia or patella lead levels and indices of heartrate variability, although they did find significant associations between patella leadlevel and heart rate variability (higher low-frequency power and the ratio of low- tohigh-frequency power) among men with metabolic syndrome. No such associationswere found for tibia lead level, however. The authors interpreted these findings asevidence that oxidative stress induced by lead exposure in these men wasresponsible for autonomic dysfunction in the cardiovascular system. In analyses ofthe same cohort (n = 593), Perlstein et al. (2007) found a significant associationbetween tibia lead level and pulse pressure (the difference between systolic anddiastolic pressures), an index of arterial stiffening, but not between blood lead leveland pulse pressure. One mechanism of arterial stiffening is thought to be vascularoxidative stress. Men with tibia lead levels greater than the median value(19.0 μg/g) had pulse pressures that were 4.2 mmHg (0.56 kPa) higher (95% CI1.9–6.5 mmHg [0.25–0.87 kPa]), compared with men with tibia lead levels belowthe median, adjusting for age, race, diabetes, family history of hypertension,education, waist circumference, alcohol intake, smoking, height, heart rate, fastingglucose and ratio of total cholesterol to high-density lipoprotein cholesterol. Patellalead levels were also measured, but results were not reported.
Limited data are available on the association between lead exposure andblood pressure in children. Among the children participating in the Kosovoprospective lead study (Factor-Litvak et al., 1996), in whom blood lead levels weresubstantially elevated (mean of 37 μg/dl in children in the exposed town, 8.7 μg/dlin children in the unexposed town), an increase in blood lead level of 10 μg/dl wasassociated with a very small increase in systolic blood pressure (0.5 mmHg [0.07kPa], 95% CI 0.2 to 1.3 mmHg [ 0.027 to 0.17 kPa]) and diastolic blood pressure(0.4 mmHg [0.05 kPa], 95% CI 0.1 to 0.9 mmHg [ 0.013 to 0.12 kPa]). In contrast,
408 LEAD (addendum)

Gerr et al. (2002) reported significant adjusted associations between higher tibialead levels and higher systolic and diastolic blood pressures in young adults, halfof whom had grown up in the vicinity of a lead smelter. Subjects in the highestquartile of tibia lead level (>10 μg/g) had systolic pressures that were 4.3 mmHg(0.57 kPa) higher than those in the lowest quartile (<1 μg/g) and diastolic pressuresthat were 2.8 mmHg (0.37 kPa) higher. Although the current blood lead levels werelow for subjects in all tibia lead quartiles and were unrelated to either systolic ordiastolic blood pressure, the subjects with tibia lead levels in the highest quartilewere estimated to have had a mean childhood blood lead level of 65 μg/dl. Noassociation between blood lead level and blood pressure was found in children 12–33 months of age (n = 780) who participated in the Treatment of Lead-ExposedChildren (Chen et al., 2006), a randomized clinical trial in which oral succimer wasadministered to children with baseline blood lead levels of 20–44 μg/dl. Childrenwere followed up for 5 years post-chelation.
A series of studies in 9-year-old children (n = 108) suggest that early leadexposure (blood lead level measured at a mean of 2.6 years: mean 4.0 μg/dl, range1.5–13.0 μg/dl) mediates the association between lower family socioeconomicstatus and greater salivary cortisol response to acute stress (Gump et al., 2005,2007, 2008, 2009).
(e) Reproduction
A recent review (Bellinger, 2005) on lead and pregnancy concluded thatfertility is reduced in couples during periods in which the male has a blood lead levelgreater than 40 μg/dl or a blood lead level greater than 25 μg/dl for several years.The reduced fertility is manifested as fewer live births, reduced likelihood ofconception or increased time to pregnancy. Although the evidence regarding leadand spontaneous abortion is limited, in one well-designed study of 668 women inMexico (Borja-Aburto et al., 1999), the risk was doubled (OR 2.3) at maternal bloodlead levels of 5–9 μg/dl and was 5-fold higher (OR 5.4) at maternal blood lead levelsof 10–14 μg/dl.
High-dose lead exposure has long been recognized as a risk factor foreclampsia (Troesken, 2006), and a case–control study conducted in the IslamicRepublic of Iran of women and newborns suggested that risk of pre-eclampsia isincreased among women with blood lead levels largely below 20 μg/dl (Vigeh et al.,2006). Hypertension is a clinical feature of pre-eclampsia, so several studies haveinvestigated the link between blood pressure during pregnancy and lead. Two case–control studies suggest that the risk of pregnancy hypertension is increased at bloodlead levels below 10 μg/dl (Sowers et al., 2002; Magri, Sammut & Savona-Ventura,2003). A prospective cohort study (Rothenberg et al., 2002) found that leadconcentration in the calcaneus, but not lead concentration in the tibia or blood leadlevel, was significantly associated with third-trimester hypertension. In a studyconducted in Kosovo (Factor-Litvak et al., 1993), the OR for proteinuria was 4.5(95% CI 1.5–13.6) for women in the highest decile of pregnancy blood lead level(>40 μg/dl), although the OR rose above 1 for women with a blood lead level greaterthan 5.8 μg/dl.
LEAD (addendum) 409

Increased paternal or maternal lead exposure has been linked to the risk ofa congenital malformation in offspring, although the evidence is somewhatinconsistent across studies. In some studies demonstrating such an association,exposure status was based solely on job title rather than on a lead biomarker. Anincreased risk of neural tube defects has been reported in offspring of womenresiding in an area with high lead levels in water (Bound et al., 1997). A studyconducted using data from a regional birth defect surveillance programme in theUSA found that men who were presumed (on the basis of self-report, an industrialhygiene assessment or job exposure matrix) to have been exposed to lead in the3-month period prior to conception through the first trimester had an OR of 1.83(95% CI 1.00–3.42) of delivering a child with total anomalous pulmonary venousreturn (Jackson et al., 2004). For maternal exposure during this interval, the OR was1.57 (95% CI 0.64–3.47).
Evidence continues to mount that higher prenatal exposure to lead impairsfetal growth. In a cohort of Mexican women in whom bone lead level was measured1 month postpartum, higher tibia lead levels were significantly associated withshorter birth length (infants in the highest quintile of maternal tibia lead level had anOR of 1.79 [95% CI 1.10–3.22]) (Hernandez-Avila et al., 2002). In the same cohort,infants of mothers with higher patella lead levels, measured 1 month postpartum,had a significantly smaller head circumference (Hernandez-Avila et al., 2002) aswell as lower weight at 1 month of age and less weight gain between birth and 1month (Sanin et al., 2001). Similar relationships between cord blood lead level(mean 3.9 [SD 3.6] μg/dl) and birth weight and length have been reported in astudy conducted in Brazil (Zentner et al., 2006). In a study of 262 pregnancies inCalifornia (Jellife-Pawlowski et al., 2006), women with a blood lead level greaterthan 10 μg/dl during pregnancy were at increased risk of delivering an infant thatwas preterm (OR 3.2, 95% CI 1.2–7.4) or small for gestational age (OR 4.2, 95%CI 1.3–13.9). Second-trimester blood lead level was a particularly strong predictorof length of gestation ( 1.0 days for each microgram per decilitre above 10 μg/dl).
(f) Nervous system
(i) Nerve conduction velocity
A recent meta-analysis was conducted investigating the associationbetween blood lead level and peripheral nerve conduction velocities, latencies andamplitudes in adults (Krieg, Chrislip & Brightwell, 2008). Forty-nine studies, whichincluded 2825 individuals exposed to lead, primarily as a result of occupation, and1629 controls, were included in the analysis. The nerves measured in these studiesincluded the median, ulnar and radial nerves in the arm and the deep and superficialperoneal, posterior tibial, aural and fibular nerves in the leg. Mixed models wereused to estimate the slopes of the dose–effect relationships. The slopes of therelationships were generally negative for velocities, positive for latencies and flat foramplitudes. The lowest blood lead levels at which relationships were found rangedfrom 33.0 μg/dl (conduction velocity of the median sensory nerve) to 64.0 μg/dl(distal motor latency of the median nerve). The authors noted that these should notbe interpreted as estimates of a biological threshold but merely as estimates of the
410 LEAD (addendum)

blood lead levels at which the exposure-related changes in nerve function reachedstatistical significance. Increasing the number or the precision of the nerveconduction measurements or increasing the number of subjects with lower bloodlead levels might have produced lower estimates.
(ii) Postural balance
The association between blood lead level and postural sway, measuredusing the Neuromotor Test System (CATSYS), was evaluated in a cohort of 181Japanese workers (121 lead-exposed, 60 controls) (Iawata et al., 2005). Analyseswere adjusted for age, height, smoking and alcohol use. Most postural swaymeasures were significantly greater in the lead-exposed workers and significantlyrelated, in multiple regression analyses, to blood lead level. Benchmark dose (BMD)modelling produced lower bounds on the BMD (BMDLs) in the range of 12–17 μg/dl for the different indices of sway.
(iii) Essential tremor
In a case–control study, the mean blood lead level of 100 patients withessential tremor (3.3 [SD 2.4] μg/dl) was significantly higher than the mean bloodlead level of 143 controls (2.6 [SD 1.6] μg/dl) (Louis et al., 2003). In a logisticregression analysis adjusting for age and current cigarette smoking, the OR was1.19 (95% CI 1.03–1.57, P = 0.02). The adjusted OR was somewhat greater whenpatients with a family history of essential tremor were excluded (OR 1.38, 95% CI1.15–1.64, P = 0.001). This association was also found in a subsequent study of105 essential tremor cases and 105 controls (Dogu et al., 2007). In this study, themean blood lead level of cases was 3.2 (SD 1.9) μg/dl, compared with a mean bloodlead level of 1.6 (SD 0.8) μg/dl in the controls. Adjusting for age, sex, education,cigarette smoking, cigarette pack-years and alcohol use, the OR was 4.19 (95% CI2.59–6.78, P < 0.001). In addition, the correlation between tremor severity and bloodlead level was 0.48 (P < 0.001), although this relationship was not found when theanalysis was restricted to essential tremor cases.
Neither of these studies involved incident cases of essential tremor, and thecross-sectional design used in each study makes it uncertain whether the higherblood lead levels measured in the cases preceded or followed the diagnosis ofessential tremor. More importantly, as the authors noted, even if elevated leadexposure preceded the diagnosis and the role of lead can be considered causal,these studies cannot be used to identify the critical blood lead level. If a blood leadlevel as low as 3 μg/dl were sufficient to cause essential tremor, the observedprevalence in the population would be much higher than it is (1–6%). Given that themean age of the participants was greater than 50 years in the Louis et al. (2003)study and greater than 66 years in the Dogu et al. (2007) study, it is possible thattheir blood lead levels had been considerably higher in the past.
(iv) Amyotrophic lateral sclerosis
Past lead exposure has been associated with the risk of amyotrophic lateralsclerosis (ALS) in case–control studies (Kamel et al., 2002, 2008; Fang et al., 2010)
LEAD (addendum) 411

and one case report (Oh et al., 2007). Information on lead exposure was obtainedfor 109 cases recruited from two hospitals in Boston, Massachusetts, USA, andfrom 256 community controls frequency matched on age, sex and residence (Kamelet al., 2002). Bone and blood lead levels were measured in most cases (n = 107)and a subset (n = 41) of controls. Self-reported occupational exposure to leadwas associated with an OR of 1.9 (95% CI 1.1–3.3). The risk of ALS increased,as well, with increasing patella lead level (OR 3.6, 95% CI 0.6–20.6, for each1 μg/g increase), increasing tibia lead level (OR 2.3, 95% CI 0.4–14.5, for each1 μg/g increase) and increasing blood lead level (OR 1.9, 95% CI 1.4–2.6, for each1 μg/dl increase). A follow-up study using Cox proportional hazard analysis founda weak association between longer survival and high baseline blood lead level (HR0.9, 95% CI 0.8–1.0), baseline patella lead level (HR 0.5, 95% CI 0.2–1.0) andbaseline tibia lead level (HR 0.3, 95% CI 0.1–0.7) (Kamel et al., 2008). In anadditional study involving 184 cases and 194 controls, a doubling of blood lead levelwas associated with a 1.9-fold (95% CI 1.3–2.7) increase in risk of ALS, adjustingfor age and an index of bone resorption (C-terminal telopeptides of type 1 collagen)(Fang et al., 2010). Additional adjustment for an index of bone formation(procollagen type 1 amino-terminal peptide) did not affect the results.
(v) Adult cognitive function
Seeber, Meyer-Baron & Schaper (2002) reviewed two meta-analysesinvolving data from 24 studies of neurobehavioural performance of workersoccupationally exposed to lead. They concluded that although the evidence is notentirely consistent across studies, deficits in different domains are present at bloodlead levels between 37 and 52 μg/dl. Several recent studies have reported on theassociations between measurements of bone lead levels and cognitive function,both in occupationally exposed adults and in the general adult population. Khalil etal. (2009a) administered a battery of neuropsychological tests to 83 lead batteryplant workers and 51 controls who had previously been part of a cohort of 469individuals administered the same battery 22 years earlier. Current mean blood leadlevels were 12 μg/dl for the workers and 3 μg/dl for the controls. Tibia lead level wasassociated with lower scores, both cross-sectionally and longitudinally, in that itpredicted declines in performance over the follow-up interval in the workers, but notin the controls, adjusting for baseline scores, age, education, years of employmentand lifestyle factors. The domains most strongly related to cumulative lead exposurewere spatial ability, executive functions and learning/memory. Other studies ofoccupationally exposed workers have also reported that bone lead levels predictdecline in test scores over time (Schwartz et al., 2005).
Similar findings have also been reported in cohorts drawn from the generalpopulation. Using the Baltimore Memory Study, a longitudinal cohort study of urbanadults of diverse ethnicity, Bandeen-Roche et al. (2009) evaluated the associationbetween tibia lead levels and performance on a battery of neuropsychological tests(n = 943–1140 for the baseline and two follow-up assessments). Previous cross-sectional analyses of these data had revealed relationships between tibia leadlevels and test scores (Shih et al., 2006). In adjusted longitudinal analyses, highertibia lead levels were significantly associated with greater decline in eye–hand
412 LEAD (addendum)

coordination over time. Tibia lead level–associated deficits were also found inmultiple other skills, including executive functioning, verbal memory and learning.Weisskopf et al. (2004, 2007) reported similar findings in the United States VeteransAdministration Normative Aging Study, with the domains of response speed,visuospatial and visuomotor being most strongly associated with bone lead levelmeasured 3.5 years earlier, but not with concurrent blood or bone lead levels.
Most studies of lead and adult cognitive function have been conducted inmales. Weuve et al. (2009) assessed biomarkers of lead exposure (tibia, patella,blood) in 587 women 47–74 years of age drawn from the Nurses’ Health Studycohort in the USA. Five years later, their cognitive function was assessed. Meanblood lead level at baseline was 2.9 (SD 1.9) μg/dl. All three biomarkers wereinversely associated with women’s test scores.
Several types of variables have been investigated as potential effectmodifiers of the association between increased lead exposure and adult cognition.In a study of workers, Bleecker et al. (2007b) found that among pairs of workersmatched in terms of lifetime weighted blood lead level, the inverse associationbetween lead and test scores was more pronounced, at least in certain domains(not motor function), among the members of the pairs that had low “cognitivereserve”, operationalized as poorer reading achievement. They suggested thatgreater cognitive reserve is protective against lead’s adverse effects. Analyses ofboth the Baltimore Memory Study (Glass et al., 2009) and the VeteransAdministration Normative Aging Study suggest that greater levels of stress, eitherself-reported (Peters et al., 2010) or operationalized as the level of psychosocialhazards in the neighbourhood of residence, render an individual more vulnerableto the adverse effects of lead. Finally, several genetic polymorphisms have beeninvestigated as potential effect modifiers. Stewart et al. (2002) reported that theslope of the inverse association between tibia lead level and cognitive test scorewas steeper among workers carrying at least one 4 allele of the apolipoprotein Egene than among workers not carrying one. Analysing NHANES III data, Krieg etal. (2009, 2010) reported that effect modifications of the association between leadand cognition by both vitamin D receptor genotypes and ALAD genotypes werecomplex and differed as a function of age (e.g. 12–16 years, 20–59 years, >60years). Other studies have investigated the role of ALAD polymorphisms. Chia etal. (2004, 2007b) suggested that workers carrying the ALAD2 allele are, to someextent, protected against lead neurotoxicity. In contrast, among men in the VeteransAdministration Normative Aging Study, those with the ALAD2 allele showed astronger inverse association between blood lead level and performance on the Mini-Mental Status Examination (Weuve et al., 2006) and poorer scores on a spatialcopying test (Rajan et al., 2008). In the same cohort, however, carriers of theALAD1 allele were at greater risk of lead-associated changes in mood (Rajan et al.,2007).
(vi) Brain imaging
Several studies suggest that white matter is particularly vulnerable to injuryas a result of lead exposure. Stewart et al. (2006) found that increasing tibia leadlevels were significantly associated with grade of white matter lesion in 536 former
LEAD (addendum) 413
organolead workers (for a 1 μg/g increase in lead concentration, adjusted ORassociated with having a lesion of grade 5+ was 1.04, 95% CI 1.02–1.06, P = 0.004).Because the workers were all at least 15 years removed from occupationalexposure, these changes likely represent progressive or persistent structurallesions.
T.J. Hsieh et al. (2009) used diffusion-tensor imaging to compare theintegrity of white matter in workers occupationally exposed to lead (n = 19) inTaiwan, China, with that of age- and sex-matched community controls (n = 18). Themean blood lead level of the workers was 11.5 (SD 1.5) μg/dl, compared with3.2 (SD 1.2) μg/dl in the controls (P < 0.001). Tibia and patella lead levels were alsomeasured. The fractional anisotropy values of the workers and controls differedsignificantly bilaterally in parietal, occipital and temporal white matter (all P < 0.05).Moreover, significant correlations were found between fractional anisotropy valuesin these regions and the three lead exposure indices. Fractional anisotropy valuesfor the genu and splenium of the corpus callosum did not differ, nor did meandiffusion values in any of the regions measured. These findings suggest that whitematter is injured, as reduced fractional anisotropy is widely interpreted as anindication of axonal damage (fibre orientation and organization) and demyelination.This hypothesis is supported by the results of a study of workers at a primary leadsmelter, with blood lead levels that averaged 29 μg/dl (range 16–42 μg/dl),conducted by Bleecker et al. (2007a). Damage to white matter, presenting ashyperintensities on T2-weighted magnetic resonance imaging, mediated, to someextent, the inverse association between lead exposure and motor performance.
There is also evidence that grey matter volume in the adult brain isassociated with past lead exposure. In the study of occupational lead exposuresconducted by Stewart et al. (2006), significant associations were found betweenhigher tibia lead levels and reduced total brain volume, total grey matter andvolumes in several specific regions, including frontal, the cingulate gyrus and theinsula. These analyses were adjusted for age, education, height and apolipoprotein4 status. Cecil et al. (2008) and Brubaker et al. (2010) reported on structural and
volumetric imaging studies in young adulthood (mean age 21 [SD 1.5] years) ofindividuals enrolled prior to birth in the Cincinnati Prospective Lead Study.Significant inverse linear associations were found between annual mean blood leadlevel measured in the interval from 3 to 6 years of age and grey matter volume, withthe magnitude of volume loss increasing with age. The associations were moststriking in the frontal regions, particularly the anterior cingulate cortex andventrolateral prefrontal cortex. Associations were more striking for males than forfemales. In diffusion-tensor imaging studies of 91 subjects in this cohort, Brubakeret al. (2009) found diverse changes in white matter that were significantly associatedwith childhood blood lead levels. Specifically, reduced fractional anisotropy andaxial diffusivity were found throughout the white matter, as well as changes in thegenu, body and splenium of the corpus callosum. Together, these changes suggestlead-related alterations in myelination and in axonal integrity. Finally, usingfunctional magnetic resonance imaging in members of this study cohort (n = 42),Yuan et al. (2006) reported that significant lead-associated changes in activationpatterns in the left frontal cortex and left middle temporal gyrus were found assubjects completed a verb generation task.
414 LEAD (addendum)

As found with respect to white matter changes, there is some evidence thatthe lead-associated changes in brain volume might mediate the lead-associatedchanges observed in adults’ cognitive function. In their cohort of former organoleadworkers, Schwartz et al. (2007) found that larger volumes of different brain regionswere associated with better scores on tests of visuoconstruction, processing speed,visual memory, executive functioning and eye–hand coordination. Furthermore, forthe three domains for which test scores were significantly associated with peak tibialead level (visuoconstruction, eye–hand coordination, executive functioning),volumetric mediation was found. Specifically, the magnitudes of the associationswere reduced when volumes of the regions of interest were included as covariatesin regression models relating tibia lead level to test scores (Caffo et al., 2007).
(vii) Child IQ and neuropsychological function
To enable a more powerful exploration of the quantitative characteristics ofthe dose–response relationship between children’s blood lead levels and their IQscores, particularly at blood lead levels below 10 μg/dl, the data from sevenprospective cohort studies were pooled (Lanphear et al., 2005). The studies wereconducted in the USA (Boston, Rochester, Cincinnati, Cleveland), Mexico City,Kosovo and Port Pirie, South Australia. The analyses included a total of 1333children, followed from infancy to 5–10 years of age, for whom serial assessmentsof blood lead level were available. Four indices of lead exposure history werecompared in terms of their relationship to IQ: concurrent (the blood lead levelmeasured closest in time to the IQ test), maximum blood lead level measured priorto the IQ test, average lifetime blood lead level (mean blood lead level between6 months of age and the measurement of IQ) and early childhood blood lead level(mean blood lead level from 6 to 24 months of age). Adjustments were made for10 covariates measured in each study: HOME Inventory (a measure of the homeenvironment and parental practices and attitudes), sex, birth weight, birth order,maternal education, maternal IQ, maternal age, marital status, prenatal smokingand prenatal alcohol use. A variety of functional forms relating blood lead indicesto IQ were evaluated in terms of their relative fit to the data. Of the four blood leadvariables, concurrent blood lead level provided the best fit to the data andwas selected as the primary exposure metric. A restricted cubic spline modelindicated that a log-linear model provided the best fit and suggested that a declineof 6.9 (95% CI 4.2–9.4) IQ points occurred over the blood lead level range of 2.4–30 μg/dl (the upper and lower 5th percentiles of the blood lead distribution).Moreover, a restricted spline model, which does not impose any assumptions aboutthe shape of the dose–response relationship, suggested that the steepest declinesin IQ were apparent at blood lead levels below 10 μg/dl. An IQ decrement of 3.9(95% CI 2.4–5.3) points was associated with an increase in blood lead level from2.4 to 10 μg/dl; a decrement of 1.9 (95% CI 1.2–2.6) points was associated with anincrease in blood lead level from 10 to 20 μg/dl; and a decrement of 1.1 (95% CI0.7–1.5) points was associated with an increase in blood lead level from 20 to30 μg/dl. Piecewise linear models were also fit to specific ranges of blood leadlevels, defined a priori. Among children for whom the maximum blood lead levelmeasured was below 7.5 μg/dl (n = 103), the regression coefficient for concurrentblood lead level was 2.94 (95% CI 5.16 to 0.71), compared with a regression
LEAD (addendum) 415

coefficient of 0.16 (95% CI 2.4 to 0.08) for children with a maximum blood leadlevel greater than or equal to 7.5 μg/dl (P = 0.015). Sensitivity analyses indicatedthat the results did not depend unduly on the data from any one study, as thecoefficient for concurrent blood lead level changed only by 2.6% to +8.6% whenthe data from any one of the seven studies were excluded.
The importance of a lead-associated shift of a relatively small number ofpoints in mean IQ can best be appreciated by examining the impact on thepopulation IQ distribution (Bellinger, 2004). Consider the example of a downwardshift of 3 points from the expected value of 100 to 97. A reduction of this size wouldbe of uncertain importance to an individual child. However, if all other characteristicsof the IQ distribution remain the same (i.e. its dispersion), the shift in the mean wouldresult in an increase of 8% in the number of children with an IQ below 100 and a57% increase in the number of children with an IQ below 70, the criterion often usedto identify those with an intellectual disability. It would also result in a 40% reductionin the number of children with a score of 130 or higher. A downward shift of 5 pointsin the mean IQ would result in a doubling of the number of children with a scorebelow 70. Using data from a study of low-level lead exposure, Needleman et al.(1982) demonstrated these phenomena empirically. Rose & Day (1990) providedsimilar demonstrations for changes in mean body mass and the prevalence ofobesity, as well as changes in systolic blood pressure and the prevalence ofhypertension. A mean reduction of 5 mmHg (0.7 kPa) in systolic blood pressurewould result in a reduction of 50% in the prevalence of hypertension, for example.
Although no explanation has been found for a supralinear relationshipbetween blood lead level and child IQ, the same relationship has been reported inseveral independent studies since the publication of the international pooledanalyses (e.g. Kordas et al., 2006; Tellez-Rojo et al., 2006). Tellez-Rojo et al. (2006)evaluated blood lead levels and neurodevelopmental outcome data at 12 and 24months from 294 children participating in a prospective study conducted in MexicoCity, Mexico (note: this is not the Mexico City study that was included in theinternational pooled analysis). Analyses were restricted to children whose bloodlead levels were less than 10 μg/dl at both 12 and 24 months. Adjusting forcovariates, blood lead level at 24 months was significantly associated, inversely,with both mental and motor development scores at 24 months, whereas blood leadlevel at 12 months was inversely associated with the motor development score at24 months of age, but not with concurrent mental or motor development. The resultswere stable when adjustment was made for prenatal (cord) blood lead level. Forboth mental and motor development scores at 24 months, the coefficients that wereassociated with concurrent blood lead level were significantly larger among childrenwith blood lead levels less than 10 μg/dl than among children with blood level levelsgreater than or equal to 10 μg/dl.
Numerous other studies have reported adverse neurodevelopmentaloutcomes in children at blood lead levels below 10 μg/dl. In cross-sectional analysesof 534 6- to 10-year-old children, Surkan et al. (2007) found, using children withblood lead levels of 1–2 μg/dl as the reference group and adjusting for age, race,socioeconomic status and caregiver IQ, that children with blood lead levels of5–10 μg/dl had a 5-point deficit in IQ (P = 0.03), a 7.8-point deficit in reading, a6.9-point deficit in mathematics as well as deficits in specific neuropsychologicaldomains, such as spatial attention and executive functions.
416 LEAD (addendum)

In a cohort of 246 7.5-year-old African American children (mean blood leadlevel of 5.4 μg/dl, range 1–25 μg/dl), Chiodo, Jacobson & Jacobson (2004) foundsignificant covariate-adjusted inverse associations between blood lead level andperformance on a variety of neuropsychological tests. The domains for whichsignificant associations were observed included intelligence, reaction time,visuomotor integration, fine motor skills and executive functions. Non-parametricregression analyses failed to identify non-linearities for 12 of 15 end-points. For theremaining three end-points, the deviation from linearity was a steeper slope at thelowest blood lead levels. On the basis of analyses exploring the significance ofdifferent cut-point values, the authors concluded that a threshold is not readilyapparent, with most associations apparent at blood lead levels as low as 3–5 μg/dl.
Chandramouli et al. (2009) investigated the associations between blood leadlevel at 30 months of age and academic performance and behaviour of 488 7- to 8-year-old children participating in the Avon Longitudinal Study of Parents andChildren. The mean blood lead level was 4.2 μg/dl, with 21% of children having alevel of 5–10 μg/dl and 6% having a level exceeding 10 μg/dl. Adjusting forcovariates, which included sex, child IQ, maternal education, home ownership,maternal smoking, home facilities, paternal socioeconomic status, Family AdversityIndex and parenting attitudes, blood lead level was inversely related to reading,writing, spelling and mathematics scores (P-values of 0.004, 0.001, 004 and 0.053,respectively). The results of analyses in which blood lead level was categorized (2–5, 5–10, >10 μg/dl) indicated that the associations became significant when theblood lead level exceeded 5 μg/dl.
Solon et al. (2008) reported a cross-sectional study of 877 children, ages6 months to 5 years, from the Philippines. This was a population-based stratifiedrandom sample of children, in whom the mean blood lead level was 7.1 μg/dl. Inage-stratified analyses (0.5–3 years, 3–5 years) and adjusting for covariates, each1 μg/dl increase in blood lead level was associated with a 3.3-point decline inneurodevelopmental score in the younger age group and a 2.5-point decline in theolder age group. Nutritional factors, notably folate status and haemoglobin levels,appear to be effect modifiers, with deficiency states exacerbating the inverseassociations between lead and neurodevelopment.
In a cohort of 261 8- to 11-year-old children from the Republic of Korea, witha mean blood lead level of 1.7 μg/dl (range 0.42–4.91 μg/dl), blood lead level wasinversely associated with IQ score (coefficient 0.18, P = 0.003), adjusting for age,sex, maternal education, paternal education, income, maternal smoking duringpregnancy, exposure to second-hand smoke after birth, birth weight, maternal ageat birth and blood manganese level (Kim et al., 2009). In addition, an additiveinteraction was observed between blood lead and blood manganese levels, suchthat the inverse associations between blood lead level and IQ scores were morestrongly inverse among children with blood manganese levels greater than themedian value (14 μg/l) compared with children with blood manganese levels belowthe median value.
Miranda and colleagues have linked existing state-wide databases in NorthCarolina, USA, including blood lead surveillance data and children’s scores on an
LEAD (addendum) 417

end-of-grade (Grade 4) reading test. In a study involving 8603 children, theyreported that children with a higher blood lead level were at significantly increasedrisk of failing the reading test, with the association evident at blood lead levels aslow as 2 μg/dl (Miranda et al., 2007). In a subsequent study of blood lead screeningresults at ages 9–36 months and end-of-grade (again Grade 4) reading score, datawere available on 57 678 children from all 100 counties in North Carolina. Usingchildren with a blood lead level of 1 μg/dl as the referent group and creating dummyvariables for groups of children with each integer unit increase in blood lead level,Miranda et al. (2009) found significant inverse coefficients for all blood leadcategories. For instance, for children with a blood lead level of 2 μg/dl, the linearregression coefficient was 0.30 (95% CI 0.58 to 0.01); for children with a bloodlead level of 5 μg/dl, the coefficient was 0.80 (95% CI 1.08 to 0.51); and forchildren with a blood lead level greater than 10 μg/dl, the coefficient was 1.75 (95%CI 2.09 to 1.41). Quantile regression analyses revealed a significant differencein the association between blood lead level and reading score depending on locationin the reading score distribution. Specifically, the difference between the readingscores of children with high versus low blood lead levels was greater among childrenwho were performing in the lower tail of the reading distribution. In other words,higher blood lead levels had a disproportionately greater impact on children who,for reasons other than lead, were at risk of reading difficulties. This implies an effectmodification, such that the impact of a given level of lead exposure can varydepending on a child’s circumstances, specifically the presence or absence of otherrisk factors for the outcome of interest.
The initial reports of an apparently steeper slope of the relationship betweenblood lead level and IQ at blood lead levels below 10 μg/dl compared with above10 μg/dl generated concern that this reflects only a statistical artefact. Bowers &Beck (2006) argued, for instance, that “the dose–response curve between anenvironmental measure that is lognormally distributed and any cognitive score thatis normally distributed will by necessity have a non-linear slope” (p. 523). Thiscontention was dismissed by several respondents to this paper (e.g. Hornung,Lanphear & Dietrich, 2006; Jusko et al., 2006; Bergdahl, 2006, 2007; Svensgaardet al., 2007), all of whom argued that it was based on inappropriate assumptions.Bowers & Beck (2007) responded to the technical issues raised, but, in an importantrespect, the issue is moot. In the analyses of the pooled international studies,piecewise linear models were fit to different ranges of the blood lead distribution(e.g. <7.5 μg/dl, <10 μg/dl), with the results showing that the linear slopes weresignificantly steeper in the lower than in the higher ranges and that the linear fitswere adequate within these more restricted ranges. Moreover, it was found that foreach of the studies included in the pooled analysis, a linear model provided the bestfit across the blood lead range in the individual studies. As had been noted morethan a decade before (Schwartz, 1994), the inverse slopes of the studies in whichparticipants tended to have lower blood lead levels appeared to be greater than theslopes in studies involving children with higher blood lead levels. From thisobservation, it follows, then, that when the individual studies were combined in apooled analysis, the functional form that would provide the best fit over the moreextended blood lead range covered by the studies, in aggregate, is one that is non-linear. This was the result that was obtained when relative fits of different modelswere compared.
418 LEAD (addendum)

(viii) Attention deficit hyperactivity disorder (ADHD)
Older studies in children consistently identified dose-related increases inbehavioural outcomes such as inattention, distractibility and hyperactivity(Needleman et al., 1979; Yule et al., 1984; Thomson et al., 1989; Bellinger et al.,1994). The exposures of the children who participated in these studies wereconsiderably higher than the exposures of contemporary children, and theoutcomes were based on teacher or parent reports instead of formal diagnosticevaluations. Recent studies have addressed at least some of these limitations.
In NHANES 1999–2002, parents were asked whether they had ever beentold by a health professional that their 6- to 16-year-old child met criteria for ADHDand whether the child was taking a stimulant medication. Braun et al. (2006) foundthat the OR for children in the fifth quintile in terms of blood lead level (>2 μg/dl),compared with children in the first quintile (<0.8 μg/dl), was 4.1 (95% CI 1.2–14.0).The increase in risk was dose dependent, as the ORs associated with theintermediate three quintiles were 1.1 (95% CI 0.4–3.4), 2.1 (95% CI 0.7–6.8) and2.7 (95% CI 0.9–8.4), respectively. In these analyses, adjustments were made forage, sex, prenatal and postnatal exposure to environmental tobacco smoke,preschool or child-care attendance, health insurance coverage and serum ferritinlevel.
The same group analysed data (n = 2588) from NHANES 2001–2004, inwhich the diagnosis of ADHD in 8- to 15-year-old children was based on theDiagnostic Interview Schedule for Children, a structured interview based on thefourth edition of the American Psychiatric Association’s Diagnostic and StatisticalManual of Mental Disorders (DSM-IV) (Froehlich et al., 2009). Children with a bloodlead level that placed them in the upper tertile had an adjusted OR for ADHD of 2.3(95% CI 1.5–3.8). Children with both prenatal exposure to tobacco and a currentblood lead level in the upper tertile were at particularly increased risk (adjusted OR8.1, 95% CI 3.5–18.7).
In a study of 1778 school-age children in the Republic of Korea, for whomblood lead levels ranged from 0.1 to 10.1 μg/dl (geometric mean 1.8 μg/dl), parentscompleted the Connors’ scale for ADHD, a screening tool (Ha et al., 2009). Adjustingfor age, sex, income, place of residence, parental history of neuropsychiatricdisease (but not specifically ADHD) and blood mercury level, the risk of ADHD,defined as a score exceeding a cut-off derived for children from the Republic ofKorea, increased linearly with increasing blood lead level. Compared with childrenwith a blood lead level below 1 μg/dl, the OR associated with a blood lead levelabove 3.5 μg/dl was 1.96 (95% CI 0.76–5.11). The P for trend across blood leadcategories was 0.07. A child’s blood lead level was significantly and positivelycorrelated with the number of ADHD symptoms a parent endorsed (P < 0.001),although it appeared from a scatterplot that this association was largely attributableto the small number of children with a blood lead level greater than 5 μg/dl.
In a case–control study conducted among Chinese children aged 4–12years, 630 children who met diagnostic criteria established by the DSM-IV (revisededition) were matched to 630 controls on age, sex and socioeconomic status (Wanget al., 2008). In a conditional logistic regression analysis in which children with a
LEAD (addendum) 419

blood lead level below 5 μg/dl was the referent group and adjusting for householdcomposition, birth weight, family history of ADHD, pregnancy, labour and deliverycomplications, medical history, maternal and paternal age, maternal and paternaleducation, and use of alcohol and cigarettes during pregnancy, risk of ADHDwas 5.19 (P < 0.01) among children with a blood lead level of 5–10 μg/dl and7.15 (P < 0.01) among children with a blood lead level above 10 μg/dl.
Nigg et al. (2008) implemented a multistage screening and verificationprocess to confirm a diagnosis of ADHD using DSM-IV criteria and to rule out co-morbidities in a sample of 150 8- to 17-year-old children (97 cases and 53 controls).Blood lead levels ranged from 0.40 to 3.47 μg/dl (mean 1.03 μg/dl). Blood lead levelwas significantly related to the ADHD symptom count for total symptoms and forhyperactivity-impulsivity counts (P < 0.05). Adjusting for income and sex, childrenwith ADHD combined subtype had a significantly higher blood lead level than didcontrols (P < 0.04). This group did an additional study of 236 6- to 17-year-olds, 108of whom met diagnostic criteria for ADHD (Nigg et al., 2010). With adjustment forconfounders (e.g. IQ, parental smoking), blood lead level (mean 0.73 μg/dl,maximum 2.2 μg/dl) was associated with risk of ADHD combined subtype, but notthe inattentive subtype.
(ix) Adult psychiatric status
Two studies followed up in adulthood children in the Childhood Health andDevelopment Study (Oakland, California, USA) and the New England cohort of theNational Collaborative Perinatal Project (Opler et al., 2004, 2008). Cases ofschizophrenia spectrum disorder were identified in each cohort, and archived serumsamples from pregnancy were analysed for ALA, which accumulates when ALADis inhibited by lead. Based on the relationship between ALA and blood lead level,cases and controls were stratified into groups with a fetal blood lead level estimatedto be greater than or equal to 15 μg/dl or less than 15 μg/dl. In analyses that pooledthe data in the two cohorts and adjusted for maternal age at delivery and maternaleducation, the OR for schizophrenia associated with an estimated blood lead levelof 15 μg/dl or higher was 1.92 (95% CI 1.05–3.87).
In NHANES 1999–2004, 1987 20- to 39-year-olds were administered aDSM-IV-based Composite International Diagnostic Interview. Individuals with acurrent blood lead level in the highest quintile (>2.11 μg/dl; 13 individuals had levelsabove 10 μg/dl), compared with those in the lowest quintile (<0.7 μg/dl), had 2.3(95% CI 1.1–4.8) times the odds of meeting criteria for a major depressive disorderand 4.9 (95% CI 1.3–18.5) times the odds of meeting criteria for panic disorder,adjusting for sex, age, race/ethnicity, education and poverty to income ratio(Bouchard et al., 2009). Blood lead level was not significantly associated withgeneralized anxiety disorder.
(x) Violence and aggression
Lead has long been known to impair behaviour in myriad ways, with animportant early case series report (Byers & Lord, 1943) noting that lead-poisonedchildren exhibited explosive tempers and poor impulse control. Denno (1993)
420 LEAD (addendum)

assembled retrospective evidence that childhood lead poisoning is a risk factor forjuvenile crime. Studies exploring the association between lower levels of leadexposure and aggression began with Needleman et al. (1996), who found thatchildren with higher bone lead levels were more likely to receive parent and teacherratings categorizing their behaviours in the range of clinical concern. Needleman etal. (2002) followed this study up with a case–control study of 216 adjudicateddelinquents in Pittsburgh, Pennsylvania, USA. Compared with controls, andadjusting for race, parent education, parent occupation, family size, presence of twobiological parents and presence of two parental figures in the home, the ORassociated with having an elevated bone lead level was 2.0 (95% CI 1.1–31.0)among the delinquent boys and 7.8 (95% CI 1.7–35.0) among the delinquent girls.
Several studies using ecological designs have reported significantassociations between air lead concentrations and homicide rate (Stretesky & Lynch,2001) and property and violent crime rates (Stretesky & Lynch, 2004) and betweenlead production and murder rate (Nevin, 2000, 2007). Using aggregated data fromAustralia, Canada, Finland, France, Germany, Great Britain, Italy, New Zealand andthe USA, Nevin (2007) examined the association between preschool blood leadlevel and different types of crime. Relative fits were compared for modelsincorporating lags of various durations between measurement of blood lead leveland outcome measurement. The lags identified in this way coincided well with theknown peak offending ages for various offences (e.g. burglary versus homicide).The ability to adjust for potential confounders in studies of ecological design islimited, however, making inferences about causality tenuous.
Braun et al. (2008) used data for 2619 children 8–15 years of age whoparticipated in NHANES 1999–2002 to evaluate the association between concur-rent blood lead level and the diagnosis of conduct disorder. A total of 68 childrenmet DSM-IV criteria, established by parental interview. Adjusting for age, maternalage, sex, race, prenatal tobacco exposure and serum cotinine level and usingchildren in the lowest quartile of blood lead as the referent group (0.8–1.0 μg/dl),significant ORs were found for children in quartile 3 (1.1–1.4 μg/dl) (12.4, 95% CI2.4–64.6) and quartile 4 (1.5–10 μg/dl) (8.6, 95% CI 1.9–40.0).
In a cross-sectional study of 173 14- to 18-year-olds from Brazil, surfacedental enamel lead level was associated, adjusting for familial and socio-demographic confounders, with clinically significant elevation of children’s rule-breaking behaviour (by parent report) on the Child Behavior Check List (OR 3.72,95% CI 0.99–14.04) (Olympio et al., 2010). Enamel lead level was not significantlyassociated with children’s self-report of delinquent behaviours, however.
Three prospective studies of environmental lead exposure in children andlater criminal activities have been reported. In the Christchurch Health andDevelopment Study, a birth cohort of 1265 children in New Zealand, dentine leadlevels in deciduous teeth, measured at 6–9 years of age, were related, in a dose-dependent manner, to the number of violent/property convictions and self-reportedviolent/property offences between the ages of 14 and 21 (Fergusson, Boden &Horwood, 2008). The effect sizes for both outcomes were reduced by adjustmentfor sociodemographic variables and aspects of family functioning, but remained
LEAD (addendum) 421

significant (P < 0.005 for convictions and 0.047 for self-reported offences).Additional analyses suggested that educational underachievement (leaving schoolwithout qualifications, low grade point average) might mediate the associationbetween increased early lead exposure and criminal behaviour.
Among 488 children in the Avon Longitudinal Study of Parents and Childrencohort (Avon, England), a higher blood lead level at 30 months of age wassignificantly associated with greater antisocial behaviours at age 7–8, as reportedby an adult (Chandramouli et al., 2009). Although the association was present whenblood lead level was treated as a continuous variable, the increase in thesebehaviours was most apparent among children whose earlier blood lead levels hadexceeded 10 μg/dl.
County records of arrests were collected for 250 19- to 24-year-olds enrolledin a prospective study in Cincinnati, Ohio, USA (Wright et al., 2008). Prenatal bloodlead levels and childhood blood lead levels had been measured frequently,providing an unusually detailed blood lead history for the participants up to the ageof 6.5 years. The median prenatal blood lead level (first or second trimester) was7.8 μg/dl (range 2.9–16.0 μg/dl); the median early childhood average blood leadlevel was 12.3 μg/dl (range 6.0–26.3 μg/dl); and the median blood lead level at 6.5years was 6.8 μg/dl (range 3.4–18.3 μg/dl). A previous analysis of this cohort hadfound that adolescents who had had higher blood lead levels in early childhood self-reported more delinquent acts. In analyses of total arrests after age 18, adjustingfor maternal IQ, sex, socioeconomic status and maternal education, the rate ratiosassociated with each 5 μg/dl increase were significant for prenatal blood lead level(1.4, 95% CI 1.1–1.9) and 6-year blood lead level (1.3, 95% CI 1.0–1.6). In analysesof arrests for violent offences, the adjusted rate ratios were significant for averagechildhood blood lead level (1.3, 95% CI 1.0–1.6) and for 6-year blood lead level (1.5,95% CI 1.1–1.9). Among the strengths of this study are the prospective collectionof data on exposure and potential confounding variables, as well as reliance onadministrative records rather than self-report as the basis for assessment of theoutcomes (Dietrich et al., 2001).
The biological plausibility of the hypothesis that elevated lead exposure iscausally associated with aggression is supported by studies in experimentalmodels, such as cats (Li et al., 2003), primates (Moore et al., 2008) and hamsters(Cervantes et al., 2005).
(f) Sexual maturation
Several cross-sectional studies have reported that higher blood lead levelsin children are associated with delayed sexual maturation. Selevan et al. (2003)evaluated the relationship between blood lead level and age at menarche andTanner stage for pubic hair and breast development in 2186 girls 8–18 years oldwho participated in NHANES II. Both breast and pubic hair development as well asage at menarche were significantly delayed in African American and MexicanAmerican girls with a blood lead level greater than 3 μg/dl, compared with girls witha blood lead level of 1 μg/dl. Each 1 μg/dl increase in blood lead level was associatedwith a delay of 2.1–6.0 months in progressing from one Tanner stage to the next in
422 LEAD (addendum)

breast and pubic hair development. The delay in age at menarche among girls witha blood lead level greater than 3 μg/dl was 3.6 months. These indices of maturationwere also delayed in white females, but not significantly.
In another set of analyses using NHANES III data, Wu, Buck & Mendola(2003) studied girls 10–16 years of age. Data on age at menarche were availablefor 1235 girls, and physician-determined data on Tanner stage 2 pubic hair andbreast development were available for 1706 girls. Blood lead level was categorizedas 0.7–2.0 μg/dl, 2.1–4.9 μg/dl and 5.0–21.7 μg/dl. Blood lead level was inverselyrelated to both pubic hair development and age at menarche, but not breastdevelopment, adjusting for race/ethnicity, age, family size, residence in a metro-politan area, poverty-to-income ratio and body mass index. In the three blood leadgroups, for example, 60.0%, 51.2% and 44.4% of 10-year-olds, respectively, hadreached Tanner stage 2 for pubic hair, and 68.0%, 44.3% and 38.5% of 12-year-olds, respectively, had reached menarche.
In a study of 138 10- to 17-year-old girls from the Akwesasne Mohawk Nationin the USA, Denham et al. (2005) found that, among those with a blood lead levelabove the median value of 1.2 μg/dl, menarche was reached 10.5 months later thanit was among girls with a blood lead level below the median, adjusting for age,socioeconomic status and other pollutants (dichlorodiphenyldichloroethylene, hexa-chlorobenzene, mirex, mercury).
One cohort study has investigated sexual maturation in boys in relation tolead exposure. Hauser et al. (2008) studied 489 8- to 9-year-old boys in Chapaevsk,Russian Federation. The end-points assessed were physician-assessed testicularvolume and genitalia stage. The median blood lead level was 3 μg/dl (interquartilerange 2–5 μg/dl). In cross-sectional analyses, adjusting for birth weight, gestationalage and age at examination, boys with a blood lead level of 5 μg/dl or greater hadreduced odds of having reached genitalia stage 2 (OR 0.6, 95% CI 0.3–0.95, P =0.03). This cohort was followed up (n = 481) several years later (Williams et al.,2010), when more boys had entered puberty, with similar findings. After adjustingfor baseline body mass index and height, boys with a baseline blood lead levelgreater than or equal to 5 μg/dl had a reduced risk of pubertal onset based ontesticular volume (HR 0.73, 95% CI 0.55–0.97), genitalia staging (HR 0.76, 95% CI0.59–0.98) and pubic hair staging (HR 0.69, 95% CI 0.44–1.07). The effect sizescorresponded to delays of 6–8 months in the onset of puberty.
(g) Dental health
Lead has been reported to be a risk factor for dental caries among childrenwith blood lead levels less than 10 μg/dl, but the evidence is mixed and lacksconsistency across studies in terms of the patterns of associations. Among 24 901participants ages 2 years and older in NHANES III, blood lead level was evaluatedin relation to the number of decayed, filled and missing surfaces (Moss, Lanphear& Auinger, 1999). In all age strata, higher blood lead level was significantlyassociated with the number of affected surfaces in both deciduous and permanentteeth, adjusting for age, race, poverty-to-income ratio, cigarette exposure, sex,region, parent education, carbohydrate intake, dietary calcium intake and dental
LEAD (addendum) 423

care. For instance, using dental caries as the outcome, among 5- to 17-year-oldchildren, the OR associated with a 5 μg/dl increase in blood lead level was 1.8 (95%CI 1.3–2.5). Among children with blood lead levels in the upper tertile of thedistribution (greater than approximately 3 μg/dl), the OR was 1.66 (95% CI 1.1–2.5).
The association between blood lead level and caries was examined insecondary analyses of 543 6- to 10-year-old children participating in the NewEngland Children’s Amalgam Trial (Gemmel et al., 2002). The mean blood lead levelwas 2.3 (SD 1.7) μg/dl. No association between blood lead level and the number ofcarious surfaces was observed among children from a rural area. An associationwas observed, however, in the half of the cohort recruited from an urban area (P =0.005), adjusting for age, sex, family income, ethnicity, maternal education,maternal smoking, dental hygiene habits (frequency of brushing, firmness of brush)and gum chewing. This association was somewhat stronger in deciduous than inpermanent teeth. The ranges of both blood lead levels and the numbers of carioustooth surfaces were greater in the urban than in the rural subgroup, which mighthave made it easier to detect an association. Alternatively, the possibility of residualconfounding or the influence of effect modifying factors whose distributions differedacross regions cannot be dismissed.
In another set of secondary analyses of 507 8- to 12-year-old children fromLisbon, Portugal, participating in a study of dental amalgam, Martin et al. (2007)reported that blood lead level (mean 4.6 [SD 2.4] μg/dl) was significantly associatedwith number of carious surfaces, but only among males, and only in primary teeth(adjusting for age, race, IQ and scores on tests of attention, memory and visuomotorfunction). In contrast, in a study of 292 6- to 11-year-old children in Thailand whosemean blood lead level was 7.2 (SD 1.5) μg/dl, a significant adjusted OR wasobserved for the number of decayed/filled surfaces (2.4, 95% CI 1.4–4.2), but onlyin deciduous teeth, not primary teeth (Youravong et al., 2006). Finally, in aretrospective cohort study evaluating blood lead level and the number of decayed,filled and missing surfaces in second and fifth graders, Campbell, Moss & Raubertas(2000) found that children with a mean blood lead level greater than 10 μg/dl in theinterval of 18–37 months of age were not at increased risk.
In adults, greater lead exposure has been associated with risk of tooth loss(Arora et al., 2009). In the United States Veterans Administration Normative AgingStudy cohort, men in the highest tertile of tibia lead level had an OR of 3.0 (95% CI1.6–5.8) for having more than nine missing teeth, whereas men in the highest tertileof patella lead level had an OR of 2.4 (95% CI 1.3–4.5) (Arora et al., 2009). Among4899 men and women 20–56 years of age included in NHANES III (1988–1994),the adjusted prevalence of periodontitis (presence of more than 20% of mesial siteswith greater than or equal to 4 mm of attachment loss) was significantly greateramong men and women with a blood lead level greater than 7 μg/dl (men:prevalence ratio 1.7, 95% CI 1.0–2.9; women: prevalence ratio 3.8, 95% CI 1.7–8.7) than among men and women with a blood lead level less than 3 μg/dl (Saraivaet al., 2007). Similar findings were reported in smaller studies (Yetkin-Ay et al., 2007;El-Said et al., 2008).
424 LEAD (addendum)

3. ANALYTICAL METHODS
3.1 Determination of lead in food
The analytical methods for the determination of lead are well established.The most common detection techniques are flame atomic absorption spectrometry(FAAS), electrothermal atomic absorption spectrometry (ETAAS), hydride gener-ation atomic fluorescence spectrometry (HG-AFS), inductively coupled plasmaoptical emission spectrometry (ICP-OES) and, more recently, inductively coupledplasma mass spectrometry (ICP-MS).
The method for the determination of lead by FAAS has been widely used inthe past. The method is selective and practically free from interferences. Somecommon interferences caused by aluminium and iron can be overcome by theaddition of ascorbic acid, citric acid or EDTA. The threshold of sensitivity of thistechnique is around 10 ng/ml. For trace lead quantification in food matrices,preconcentration steps before quantification are usually required. The sensitivity ofFAAS is limited by several factors, such as low atomization efficiency andinefficiency of the nebulization process. To overcome this limitation and improve theprocess of sample introduction, methods such as thermospray flame furnace atomicabsorption spectrometry (TS-FF-AAS) were developed (Da-Col, Domene & Pereira-Filho, 2009). By using this procedure, total sample introduction, long residence timeand good sensitivity can be achieved (Pereira-Filho, Berndt & Arruda, 2002).
ETAAS is a good alternative to FAAS and is widely employed for thedetermination of the trace elements in biological samples. Preconcentration andseparation steps are often employed with this technique before quantification of leadin food. However, several constraints have limited its performance, because theresponse is often perturbed by multiple physical or chemical reactions in theatomizer, and the limits of detection (LODs) are not always adequate for traceanalysis (Sardans, Montes & Peñuelas, 2010). In general, the technique requiresthe use of a modifier to stabilize lead, allowing its quantification without matrix effect.Various modifiers are used for the determination of lead, among them palladium(II)nitrate/palladium (Daftsis & Zachariadis, 2007), palladium(II) chloride/palladiumplus ascorbic acid (Licata et al., 2004), palladium(II) nitrate/palladium plusmagnesium nitrate (Tüzen & Soylak, 2005) and ammonium phosphate, Triton X-100plus monoammonium dihydrogen phosphate (Viñas, Pardo-Martínez & Hernández-Córdoba, 2000). Many improvements have enhanced the use of ETAAS for thedetermination of traces of lead in biological samples, including advances in atomizerdesigns, background correction systems, the development of in situ trappingmethods, appropriate modifiers and improvements in the light source and detector.Significant enhancement of the technique has been achieved using transversallyheated atomizers with platforms, which allow the reduction of LODs. In recent years,the high-resolution continuum source electrothermal atomic absorption spectrom-eter (HR-CS-ETAAS) has allowed the direct analysis of lead in solid materials withlow LODs.
ICP-OES has been widely employed to determine lead in various types ofsamples. Owing to several spectral interferences, this technique is more useful for
LEAD (addendum) 425

measuring high levels of lead contamination. When lower levels of lead are present,preconcentration steps are necessary. This technique also suffers from inter-ferences and was replaced in the last decade by the use of ICP-MS.
The use of ICP-MS has become more common in food laboratory analysisbecause of its capability for multielement measurements coupled to low LODs (inthe order of nanograms per gram). Additionally, compared with ICP-OES, thetechnique provides simpler spectral interpretation and isotopic information (Nardi etal., 2009). However, polyatomic interferences resulting from the combination ofmatrix ions with argon may interfere in this technique; to ensure correct results,some of the interferences must be eliminated or controlled by microwave digestionat high temperatures, whereas others have to be controlled using a mathematicalapproach (Rocha et al., 2009). The recent use of the dynamic reaction celltechnology combined with ICP-MS (DRC-ICP-MS) has allowed the removal of theinterferences with a minimum loss of sensitivity. This technology may be consideredas a valid alternative to the above-mentioned spectrometric techniques, because itoffers various possibilities for the element’s determination in different matrices(D’Llio et al., 2008).
Alternative methods, such as stripping voltammetry, have been sporadicallyemployed for the determination of lead in food at the nanogram per gram level(Melucci, Torsi & Locatelli, 2007; Jannat, et al., 2009).
The analytical performances of some techniques for the determination oflead in food are presented in Table 2.
3.1.1 Quality assurance
Certified reference materials (CRMs) have been widely employed in newmethods reported in the literature for the determination of lead in food todemonstrate analytical quality assurance.
Julshamn et al. (2007) reported on an interlaboratory method performance(collaborative) study for the determination of lead by ICP-MS after pressuredigestion including microwave heating. Thirteen laboratories participated, and themethod was tested on a total of seven foodstuffs: carrot purée, fish muscle,mushroom, graham flour, simulated diet, scampi and mussel powder. The elementalconcentration of lead (dry matter) ranged from 0.01 to 2.4 mg/kg. The repeatabilityrelative standard deviation and reproducibility relative standard deviation for leadranged from 3% to 27% and from 8% to 50%, respectively. The study showed thatthe ICP-MS method is satisfactory as a standard method for the determination ofelemental lead in foodstuffs.
A proficiency testing programme for determining lead in seawater shrimp for97 laboratories worldwide under the auspices of the Asia-Pacific LaboratoryAccreditation Cooperation is discussed by Kong, Chan & Wong (2008). Pooled datafor lead were normally distributed, with interlaboratory variations of about 35%.
426 LEAD (addendum)

Tabl
e 2.
Ana
lytic
al m
etho
ds fo
r the
det
erm
inat
ion
of le
ad in
food
Com
mod
ityn
Cou
ntry
(ye
ar)
Sam
ple
prep
arat
ion
(EF
)T
echn
ique
LOD
n <
LOD
Mea
n co
ncen
trat
ion
(ran
ge)
Ref
eren
ce
Sea
wee
d:P
orph
yra,
Lam
inar
ia
4F
ranc
e, J
apan
,R
epub
lic o
fK
orea
, Spa
in(2
004)
Mic
row
ave-
assi
sted
dige
stio
n (H
NO
3 +
H2O
2)
ICP
-MS
1.74
ng/
g0
(312
–848
ng/
g)R
ocha
et a
l. (2
009)
Ric
e, b
ean,
egg
,m
eat,
fish,
bre
ad,
suga
r, v
eget
able
s,ch
eese
, milk
pow
der,
but
ter,
whe
at, p
ear,
Bra
zil
nut,
coffe
e,ch
ocol
ate,
bis
cuit,
past
a
18B
razi
lM
icro
wav
e-as
sist
eddi
gest
ion
(HN
O3
+H
2O2)
ICP
-MS
4 ng
/g2
(ND
–104
.4 n
g/g)
Nar
di e
t al.
(200
9)
Milk
and
infa
ntfo
rmul
a8
Italy
Mic
row
ave-
assi
sted
dige
stio
n (H
NO
3 +
H2O
2)
DR
C-I
CP
-MS
0.5
ng/g
0(3
.1–1
9.2
ng/g
)D
’Llio
et a
l. (2
008)
Sem
olin
a3
—M
icro
wav
e-as
sist
eddi
gest
ion
(HN
O3
+H
2O2)
ICP
-MS
16 n
g/l
0(1
.9–1
2.8
ng/g
)C
ubad
da &
Rag
gi(2
005)
Milk
42B
razi
l (20
04)
Aci
d di
gest
ion
(HN
O3
+ H
Cl)
ET
AA
S0.
41 n
g/m
l(L
OQ
)4
230
ng/m
l (62
–476
ng/m
l)S
oare
s et
al.
(201
0)
LEAD (addendum) 427

Tabl
e 2
(con
td)
Com
mod
ityn
Cou
ntry
(ye
ar)
Sam
ple
prep
arat
ion
(EF
)T
echn
ique
LOD
n <
LOD
Mea
n co
ncen
trat
ion
(ran
ge)
Ref
eren
ce
Non
-fat
milk
pow
der
(CR
M),
wat
er (
CR
M)
2—
Ioni
c liq
uid-
base
dsi
ngle
dro
pm
icro
extr
actio
n (7
6)
ET
AA
S0.
017
ng/m
l—
—M
anzo
ori,
Am
jadi
&A
bdul
hass
ani
(200
9)
Tom
ato,
pep
per,
onio
n9
Med
iterr
anea
nco
untr
ies
Mic
row
ave-
assi
sted
dige
stio
n (H
NO
3 +
H2O
2)
ET
AA
S0.
81 n
g/g
0(1
2.2–
70.6
ng/
g)B
akka
li et
al.
(200
9)
Anc
hovy
, spi
nach
,ca
bbag
e, o
nion
,di
ll, p
arsl
ey,
lettu
ce, t
ea, r
ice,
sala
mi,
chic
ken
23T
urke
yC
opre
cipi
tatio
n w
ithM
BT
ET
AA
S1.
38 n
g/g
0(0
.58–
73.8
ng/
g)O
ymak
et a
l. (2
009)
Veg
etab
les
(100
varie
ties)
416
Chi
naA
cid
dige
stio
n (H
NO
3
+ H
ClO
4 +
H2S
O4)
ET
AA
S1
ng/g
—46
ng/
g (<
1–65
5 ng
/g)
Son
g et
al.
(200
9)
Milk
97Is
lam
ic R
epub
lic o
fIr
an (
2004
)P
rote
in p
reci
pita
tion
+ac
id d
iges
tion
(HN
O3)
ET
AA
S—
—7.
9 ng
/ml (
1–46
ng/
ml)
Taj
karim
ia e
t al.
(200
8)
Kon
jac
flour
7C
hina
Enz
ymat
ic h
ydro
lysi
san
d sl
urry
pre
para
tion
ET
AA
S27
.8 n
g/g
0(9
6.76
–859
.91
ng/g
)C
hen
et a
l. (2
008)
Milk
54T
urke
y (2
003–
2004
)F
iltra
tion
+ce
ntrif
ugat
ion
+m
icro
wav
e-as
sist
eddi
gest
ion
(HN
O3
+H
2O2)
ET
AA
S0.
62 n
g/m
l0
31.4
ng/
g (2
.5–3
13ng
/g)
Sar
ica
& T
urke
r(2
007)
428 LEAD (addendum)

Tabl
e 2
(con
td)
Com
mod
ityn
Cou
ntry
(ye
ar)
Sam
ple
prep
arat
ion
(EF
)T
echn
ique
LOD
n <
LOD
Mea
n co
ncen
trat
ion
(ran
ge)
Ref
eren
ce
Rai
sins
46T
urke
y (2
005)
Aci
d di
gest
ion
(HN
O3
+ H
ClO
4 +
H2S
O4)
ET
AA
S6.
2 ng
/g—
0.05
6 μg
/g (
0.01
2–0.
359
μg/g
)C
alis
ir &
Aka
mn
(200
7)
Cab
bage
, whe
at,
pota
to, e
gg, b
aby
food
form
ula,
baby
food
, ins
tant
milk
, gilt
head
brea
m, a
ncho
vy,
gold
en g
rey
mul
let,
trou
t
14S
love
nia
Mic
row
ave-
assi
sted
dig
estio
n(H
NO
3 +
HF
)
ET
AA
S0.
2 m
g/kg
13<
LOD
Mila
cic
& K
ralj
(200
3)
Mus
sels
0.85
mg/
kg
Spi
nach
, pal
mito
,cr
ab, s
hrim
ps,
mus
sel,
sard
ine,
squi
d
7B
razi
lC
ryog
enic
grin
ding
+ s
lurr
ypr
epar
atio
n
ET
AA
S75
ng/
g2
(228
–574
ng/
g)S
anto
s et
al.
(200
2)
Infa
nt fo
rmul
apo
wde
rs15
2 (3
8br
ands
)—
Dry
ash
ing
ET
AA
S6.
4 ng
/g0
(25.
7–45
.5 n
g/g)
Mor
eno-
Roj
as e
tal
. (20
02)
Whe
at fl
our,
cor
nflo
ur3
Tur
key
Wet
dig
estio
n(H
NO
3 +
H2O
2 an
dm
embr
ane
filtr
atio
n of
the
PA
N–P
b co
mpl
ex)
(20)
FA
AS
3.5
μg/l
(bla
nksa
mpl
e)0
(4.1
–54.
7 μg
/g)
Soy
lak
et a
l.(2
010)
LEAD (addendum) 429

Tabl
e 2
(con
td)
Com
mod
ityn
Cou
ntry
(ye
ar)
Sam
ple
prep
arat
ion
(EF
)T
echn
ique
LOD
n <
LOD
Mea
n co
ncen
trat
ion
(ran
ge)
Ref
eren
ce
Tom
ato,
app
le,
mus
tard
2Is
lam
ic R
epub
licof
Iran
Wet
dig
estio
n (H
NO
3 +
H2O
2; H
ClO
4) a
nd S
PE
on s
odiu
m d
odec
ylsu
lfate
–coa
ted
alum
ina
(63)
FA
AS
1.6–
2.8
μg/l
(bla
nk s
ampl
e)0
(0.0
54–1
1.6
ng/m
g)G
haed
i et a
l.(2
009)
Cof
fee,
fish
, bla
ckte
a, g
reen
tea
4—
Cop
reci
pita
tion
with
zirc
oniu
m(I
V)
hydr
oxid
e (2
5)
FA
AS
2.5
ng/m
l4
—C
itak,
Tuz
en &
Soy
lak
(200
9)
Bla
ck te
a, b
lack
pepp
er, p
lant
,co
coa
pow
der
4In
dia
Wet
dig
estio
n (H
NO
3 +
HC
lO4)
SP
E-C
18 m
embr
ane
disc
impr
egna
ted
with
Cya
nex
302
(400
)
FA
AS
1 ng
/ml
0(1
2.85
–49.
3 ng
/mg)
Kar
ve &
Raj
gor
(200
7)
Foo
d su
pple
men
t—
Bra
zil
Mic
row
ave-
assi
sted
dige
stio
n (H
NO
3 +
H2O
2)
TS
-FF
-AA
S6
ng/m
l—
—D
a-C
ol, D
omen
e&
Per
eira
-Filh
o(2
009)
Sea
food
(C
RM
)—
—S
olid
sam
plin
gS
S-Z
AA
S0.
008
ng—
—D
etch
eva
&G
robe
cker
(20
06)
Gua
raná
, cab
bage
2B
razi
lA
cid
dige
stio
n +
SP
E(m
inic
olum
n of
Am
berli
te X
AD
-4m
odifi
ed w
ith D
HB
)(5
3)
ICP
-OE
S0.
54 n
g/m
l0
(2.7
–3.3
ng/
mg)
Bez
erra
et a
l.(2
007)
430 LEAD (addendum)

Tabl
e 2
(con
td)
Com
mod
ityn
Cou
ntry
(ye
ar)
Sam
ple
prep
arat
ion
(EF
)T
echn
ique
LOD
n <
LOD
Mea
n co
ncen
trat
ion
(ran
ge)
Ref
eren
ce
Who
le m
eal,
mai
ze m
eal,
cere
al p
lant
mea
ls, c
erea
lpl
ants
5—
Wet
dig
estio
n(H
Cl +
HN
O3
+H
2SO
4)
SW
AS
V0.
15–0
.103
μg/g
0(0
.349
–3.7
1 μg
/g)
Mel
ucci
, Tor
si &
Loca
telli
(20
07)
Infa
nt fo
rmul
a1
Isla
mic
Rep
ublic
of
Iran
Aci
d di
gest
ion
(HN
O3)
+ d
ryas
hing
DP
AS
V5
ng/g
00.
384
mg/
kgJa
nnat
et a
l.(2
009)
CR
M, c
ertif
ied
refe
renc
e m
ater
ial;
DH
B, d
ihyd
roxy
benz
oic
acid
; DP
AS
V, d
iffer
entia
l pul
se a
nodi
c st
rippi
ng v
olta
mm
etry
; EF
, enr
ichm
ent f
acto
r; n
,nu
mbe
r of s
ampl
es a
naly
sed;
MB
T, 2
-mer
capt
oben
zoth
iazo
le; N
D, n
ot d
etec
ted;
PA
N, 1
-(2-
pyrid
ylaz
o)-2
-nap
htho
l; S
PE
, sol
id-p
hase
ext
ract
ion;
SS
-Z
AA
S, s
olid
sam
plin
g Z
eem
an a
tom
ic s
pect
rom
etry
; SW
AS
V, s
quar
e w
ave
anod
ic s
trip
ping
vol
tam
met
ry
LEAD (addendum) 431

3.1.2 Sample preparation
Food samples in general require mineralization and dissolution prior to leadquantification. Sample preparation for food and biological matrices depends on thequantification method and usually begins with matrix pretreatment (acid digestion,slurry, leaching or ashing). Acid digestion with strong acids and oxidants (nitric acidand hydrogen peroxide) is the most employed sample treatment in analysis of foodfor the determination of lead. Microwave-assisted acid digestion has beenextensively employed for this purpose, as it allows the use of large sample masses(1–2 g) under controlled temperature and pressure of the system, which reducescontamination and limits losses of the element during mineralization.
Slurry sampling techniques are also employed, to a lesser extent, but mayoffer some advantages over microwave-assisted acid digestion, such as time,safety and economy. This technique requires the optimization of particle size, slurryconcentration and homogeneity.
Ashing and leaching have been used in only a few studies. Calcination attemperatures above 400 °C may induce losses of lead. In general, ashing methodsprovide lower analyte recovery when compared with acid digestion methods.
Owing to the very low lead levels in food matrices, insufficient detectabilityof some techniques and matrix effects, the direct determination of trace amounts oflead is not always reliable, and preliminary preconcentration steps are oftenrequired. For this purpose, techniques such as coprecipitation, liquid–liquidextraction, solid-phase extraction, cloud point extraction and on-line coprecipitationusing a knotted reactor have been widely employed for lead determination inbiological matrices. More recently, in order to reduce amounts of toxic organicsolvents, liquid-phase microextraction, single drop microextraction, room temper-ature ionic liquids and membrane filtration have been proposed (Manzoori, Amjadi& Abdulhassani, 2009; Soylak et al., 2010).
Coprecipitation is one of the most efficient separation techniques for traceheavy metal ions, based on the separation of the collector from the matrix solution.For this purpose, inorganic (aluminium, cerium(IV), erbium, iron(III), magnesium,gallium, samarium and zirconium hydroxides and manganese dioxide) and organiccoprecipitants (bismuth diethyldithiocarbamate, ammonium pyrrolidine dithio-carbamate, cobalt tris(pyrrolidine dithioate), sodium diethyldithiocarbamate) havebeen used as efficient collectors of trace elements (Korn et al., 2006).Coprecipitation has mainly been applied to water analyses.
Separation and concentration procedures using liquid–liquid extractionusually result in high enrichment factors and have been carried out in batch modeand in flow injection or sequential injection systems. The last two have theadvantage that all manipulations are carried out automatically, minimizing the riskof sample contamination. To allow the extraction of the lead from an aqueoussolution, lead needs to be complexed in a previous step. For this purpose, dithizoneand ammonium pyrrolidine dithiocarbamate have been widely employed.
Solid-phase extraction enables the selective removal of trace amounts ofmetal ions from solutions containing complex matrices with minimal usage of
432 LEAD (addendum)

organic solvents. Several procedures for lead have been reported using varioussolid supports, such as activated carbon, silica gel, cellulose, Amberlite XAD seriesresins, Chromosorb resin, Ambersorb resin, polyurethane foam and sodium dodecylsulfate–coated alumina (Karve & Rajgor, 2007; Ghaedi et al., 2009). Many reagentshave been used to load these supports and to retain lead by complexation, amongthem 2-(2 -thiazolylazo)-p-cresol, 2-propylpiperidine-1-carbodithioate, 2-(2-benzothiazolylazo)-2-p-cresol, pyrogallol red, 1-(2-pyridylazo)-2-naphthol, dithi-zone and 2-(5-bromo-2-pyridilazol)-5-diethyl-aminophenol (Korn et al., 2006).
The cloud point extraction procedure offers advantages over conventionalliquid–liquid extraction, such as high extraction and preconcentration factors,operational safety due to low surfactant flammability and lower toxicity for theanalyst and the environment. The cloud point phenomenon occurs when a non-ionicor amphoteric surfactant above its critical micellar concentration causes theseparation of the original solution into two phases when heated at a characteristictemperature called the cloud point temperature. Triton X-114 and PONPE 7.5 havebeen used as surfactants (Korn et al., 2006).
3.2 Determination of lead in blood
The determination of lead in biological materials, such as blood, urine andtissues, poses several problems, mainly due to the low concentration and thecomplexity of the sample matrix. In general, the techniques employed for thedetermination of lead in blood are the same as those described previously for theanalysis of lead in food.
Electrothermal absorption spectrometry has been widely employed for bloodand clinical analyses. Ashing and atomizing the sample in the presence of achemical modifier and Zeeman effect background correction are essential forprecise direct determination of trace elements in blood fractions. A simultaneousatomic absorption spectrometric (SIMAAS) method for the determination of lead andcadmium was proposed by Kummrow et al. (2008). The method requires a samplevolume of 200 μl and presents an LOD of 0.65 ng/ml for lead.
More recently, ICP-MS has proven to be an good alternative method to otheranalytical techniques that have frequently been applied for this purpose, such asETAAS, due to its low LODs, wide dynamic range, capability for rapid multielementdetermination and simple sample pretreatment. Whole blood samples can beanalysed directly after simple dilution or decomposition of the organic matrix by ICP-MS. LODs in the picograms per millilitre range can be achieved (Heitland & Köster,2006).
However, the direct analysis of whole blood after dilution can cause cloggingof the sample introduction devices and signal instability in the ICP-MS. Severaldigestion procedures have been reported, including high-pressure ashing in quartzampoules and microwave-assisted acid digestion in open or closed vessels. Thelatter is more frequently used for efficient mineralization and reduced contaminationrisk.
LEAD (addendum) 433

The volume of the sample for analysis is an important aspect that needs tobe considered. It is difficult to acquire blood samples from children through invasivepaediatric venipuncture. Furthermore, blood samples must be conserved properlyimmediately after sampling and stored at low temperatures. To overcome theselimitations, the preparation of dried blood spots on filter paper has been proposedas an alternative. H.-F. Hsieh et al. (2009) proposed a method for lead determinationin whole blood by laser ablation coupled with ICP-MS, requiring a sample volumeof 0.5 μl and with a reported LOD of 0.1–2 ng/ml.
The analytical performance of some methods for the determination of leadin blood is shown in Table 3.
3.2.1 Quality assurance
CRMs have been extensively employed in new methods reported in theliterature for the determination of lead in blood to demonstrate analytical qualityassurance.
The network of external quality assessment scheme organizers in the fieldof occupational and environmental laboratory medicine sets standards ofperformance for laboratories. It aims to develop procedures that permit equivalenceof assessment among schemes, so that performance of laboratories taking part indifferent external quality assessment schemes can be directly compared. The useof a z-score clearly demonstrates when a laboratory achieves results that are fit forpurpose and allows for comparison of performance among schemes. The networkorganized a study in 2005, with 420 participants, for the determination of lead inblood. The analytical techniques employed were ETAAS, ICP-MS and others,representing 85%, 13% and 2%, respectively. For a target concentration of 2 μmol/l(416 ng/ml) blood lead, a typical between-laboratory precision (coefficient ofvariation) in the range of 10–16% was established. The quality specification thatwas proposed based on the desirable total allowable error for lead in blood was±40 μg/l or ±10%, whichever is the greater value (Taylor et al., 2006).
4. SAMPLING PROTOCOLS
In recent years, considerable attention has been directed towards improvingand ensuring the quality of analytical data on contaminants in foods. Whether thedata are used for assessing risk from exposure (food surveillance), for food control(regulatory monitoring) or for monitoring standards for trading purposes, it is criticalthat contaminants be identified correctly and that quantitative data be reliable.Sampling should be based on the use of appropriate sampling techniques, samplingplans and testing methodology. Data collected should be sufficient for the statisticalanalyses required. Information on appropriate sampling procedures should besupplied.
Sampling plans to be implemented either by food control authorities or bycommercial entities (self-inspection performed by producers and/or traders) aredescribed in the general guidelines for sampling for food, provided in the CodexAlimentarius Commission guidelines CAC/GL 50-2004 (FAO/WHO, 2004a).
434 LEAD (addendum)

Tabl
e 3.
Ana
lytic
al m
etho
ds fo
r the
det
erm
inat
ion
of le
ad in
blo
od
Cou
ntry
(ye
ar)
nS
ampl
eam
ount
Sam
ple
prep
arat
ion
(EF
)T
echn
ique
LOD
(ng
/ml)
Mea
n co
ncen
trat
ion
(ran
ge)
Ref
eren
ce
Bra
zil (
2007
)92
(m
othe
rs)
100
μlA
cid
dige
stio
n(H
NO
3)IC
P-M
S0.
22.
7 ng
/ml (
med
ian)
(1.0
–5.5
ng/
ml)
Koy
ashi
ki e
t al.
(201
0)
—C
RM
0.5
μlS
ampl
e is
load
edon
to th
e su
rfac
e of
a hy
drop
hobi
c fil
ter
mem
bran
e
LA-I
CP
-MS
0.1–
2—
H.-
F. H
sieh
et a
l.(2
009)
Sou
th A
fric
a(1
995)
Sch
oolc
hild
ren
(8–1
0ye
ars)
1 m
lW
et d
iges
tion
(HN
O3
+ H
2O2)
ICP
-MS
0.72
56.4
ng/
ml
Baz
zi, N
riagu
&Li
nder
(20
08)
Bel
gium
(20
03)
1679
ado
lesc
ents
500
μlW
et d
iges
tion
(HN
O3
+ H
2O2)
HR
-IC
P-M
S2
21.7
ng/
mla
(9.9
–45
.4 n
g/m
l) (P
<0.
0001
)
Sch
roije
n et
al.
(200
8)
Ger
man
y (2
005)
130
500
μlD
ilutio
n (T
riton
X-1
00 +
NH
4OH
)D
RC
-IC
P-M
S0.
008
22 n
g/m
l (5–
83 n
g/m
l)H
eitla
nd &
Kös
ter
(200
6)
US
A93
4 (A
fric
an A
mer
ican
com
mun
ities
)16
μl
Dilu
tion
with
HN
O3
ICP
-MS
1527
ng/
ml (
<15
–200
ng/m
l)N
riagu
et a
l.(2
006)
——
—M
icro
wav
e-as
sist
ed a
cid
dige
stio
n
SF
-IC
P-M
S0.
32—
Boc
ca e
t al.
(200
5)
Sw
eden
311
ml
Mic
row
ave
dige
stio
nIC
P-S
MS
0.08
517
ng/
ml (
4–43
ng/
ml)
Rod
ushk
in,
Ödm
an &
Bra
nth
(199
9)
LEAD (addendum) 435

Tabl
e 3
(con
td)
Cou
ntry
(ye
ar)
nS
ampl
eam
ount
Sam
ple
prep
arat
ion
(EF
)T
echn
ique
LOD
(ng
/ml)
Mea
nco
ncen
trat
ion
(ran
ge)
Ref
eren
ce
——
—M
icro
wav
e di
gest
ion
(2.7
1)E
TA
AS
0.83
—O
lmed
o et
al.
(201
0)
Sw
eden
530
μl
Dro
p-to
-dro
pm
icro
extr
actio
nas
sist
ed w
ithul
tras
onic
atio
n
ET
AA
S0.
0835
.6 n
g/m
l (15
.5–
50.5
ng/
ml)
Shr
ivas
& P
atel
(201
0)
Bra
zil (
2007
)40
200
μlP
rote
in p
reci
pita
tion
and
dilu
tion
ET
AA
S0.
6525
.1 n
g/m
l (9.
3–56
.7 n
g/m
l)K
umm
row
et a
l.(2
008)
—C
RM
50–1
00 μ
lD
irect
sam
plin
g of
the
punc
hed
bloo
d fil
ter
pape
r
ET
AA
S2.
5—
Res
ano
et a
l.(2
007)
——
5 m
lW
et d
iges
tion
(HN
O3)
ET
AA
S16
–19
ng/g
pel
let
45–1
52 n
g/g
supe
rnat
ant
—D
afts
is &
Zac
haria
dis
(200
7)
—C
RM
2 m
lM
icro
wav
e-as
sist
eddi
gest
ion
ET
AA
S(c
ollo
idal
Pd
mod
ifier
)
1.2
—V
iitak
& V
olyn
sky
(200
6)
Ger
man
y(2
000)
238
(chi
ldre
n)21
3 (m
othe
rs)
——
ET
AA
S1.
3C
hild
ren
31.5
ng/
ml
(6–8
6 ng
/ml)
Mot
hers
26.
6 ng
/ml
(2–9
1 ng
/ml)
Wilh
elm
et a
l.(2
005)
Egy
pt93
(28
–40
year
s)1
ml
Oxi
datio
n w
ithK
MnO
4
ET
AA
S0.
9512
4 ng
/ml (
65–1
75ng
/ml)
Mor
tada
et a
l.(2
002)
436 LEAD (addendum)

Tabl
e 3
(con
td)
Cou
ntry
(ye
ar)
nS
ampl
eam
ount
Sam
ple
prep
arat
ion
(EF
)T
echn
ique
LOD
(ng
/ml)
Mea
n co
ncen
trat
ion
(ran
ge)
Ref
eren
ce
Ger
man
y(2
002–
2003
)43
0 (c
hild
ren,
aged
abo
ut 1
0ye
ars)
——
FA
AS
12.5
(LO
Q)
22.2
ng/
ml (
42sa
mpl
es <
LOQ
)Li
nk e
t al.
(200
7)
Italy
(20
04)
110
—W
et d
iges
tion
(HN
O3)
ICP
-OE
S0.
3239
.5 n
g/m
lA
limon
ti et
al.
(200
5)
—C
RM
50 μ
lW
et d
iges
tion
and
then
onlin
e re
sin
colu
mn
prec
once
ntra
tion
HG
-AF
S0.
004
—W
an, X
u &
Wan
g(2
006)
Chi
na5
3 m
lW
et d
iges
tion
(HN
O3)
CL
521
.1 n
g/m
l (5.
3–44
.3ng
/ml)
Qu
et a
l. (2
008)
CL,
che
milu
min
esce
nce;
CR
M, c
ertif
ied
refe
renc
e m
ater
ial;
EF
, enr
ichm
ent f
acto
r; H
R-I
CP
-MS
, hig
h-re
solu
tion
indu
ctiv
ely
coup
led
plas
ma
mas
ssp
ectr
omet
ry; I
CP
-SM
S, d
oubl
e fo
cusi
ng s
ecto
r fie
ld in
duct
ivel
y co
uple
d pl
asm
a m
ass
spec
trom
etry
; LA
-IC
P-M
S, l
aser
abl
atio
n co
uple
d w
ithin
duct
ivel
y co
uple
d pl
asm
a m
ass
spec
trom
etry
; LO
Q, l
imit
of q
uant
ifica
tion;
n, n
umbe
r of
sam
ples
ana
lyse
d; S
F-I
CP
-MS
, sec
tor
field
indu
ctiv
ely
coup
led
plas
ma
mas
s sp
ectr
omet
rya
Geo
met
ric m
ean.
LEAD (addendum) 437
5. PREVENTION AND CONTROL
Lead contamination of food arises mainly from the environment (air and soil)and from food processing (lead paint and lead-containing equipment), food handlingand food packaging (lead-soldered cans, coloured plastic bags and wrappingpapers, lead-glazed ceramic, lead-containing metal vessels). Atmospheric leadfrom industrial pollution or leaded gasoline can contaminate food through depositionon agricultural crop plants. Water is also a source of lead contamination of food.
There have been worldwide efforts to reduce lead exposure from food,focusing on implementing standards for allowable lead levels in food and foodadditives; ending the use of lead-soldered cans; controlling lead levels in water;reducing leaching from lead-containing vessels or restricting their use for decorativepurposes; and identifying and reacting to additional sources of lead contaminationin foods or dietary supplements. Although not targeted specifically at food, effortsto reduce environmental sources of lead, including restrictions on industrialemissions and restricted use of leaded gasoline, have also contributed to declininglead levels in food (FAO/WHO, 2004b).
For the prevention and control of lead in food, good agricultural andmanufacturing practices should be followed. The main source of lead in vegetablesarises from atmospheric lead deposition. During processing, maximum removal ofsurface lead from plants should be practised, for example, by thoroughly washingvegetables, particularly leafy vegetables; removing the outer leaves of leafyvegetables; and peeling root vegetables, where appropriate. The transfer of leadfrom soil to crop tissues is generally low; the bioconcentration factor is in the rangeof 0.001–0.5, depending on plant species, environmental conditions and experi-mental setup (Chamberlain, 1983).
Food processors should ensure that the water supply for food processingcomplies with maximum limits for lead established by national or local authorities.Food processors should choose foods and food ingredients, including ingredientsused for dietary supplements, that have the lowest lead levels possible.
6. LEVELS AND PATTERNS OF CONTAMINATION IN FOODCOMMODITIES
The Committee, at its present meeting, reviewed data on lead occurrence indifferent food commodities received from seven countries—namely, Australia,Brazil, China, France, Germany, Singapore and the USA—and from the EuropeanFood Safety Authority (EFSA), covering data from Austria, Belgium, Czech Repub-lic, Denmark, Estonia, Finland, France, Germany, Great Britain, Ireland, Norway,Poland, Romania, Spain, Sweden and three commercial operators (EFSA, 2010).The Committee conducted a literature search and identified published literature forfive additional countries: Egypt, India, Lebanon, New Zealand and Nigeria.
The data submitted by France and Germany were included in theassessment report of EFSA (2010). In order to avoid duplicating the data in thisanalysis, the individual data submitted from both countries were not separatelyconsidered in the assessment of the current meeting.
The total number of analytical results (single or composite samples) was110 899, with 84.9% coming from Europe, 7.6% from the USA, 1.9% from Latin
438 LEAD (addendum)

America, 3.1% from Asia and 2.5% from the Pacific region. No data were receivedfrom Africa.
The Committee noted that the occurrence data reported by the countrieswere, in general, obtained using validated analytical methods.
The data submitted for each country are summarized below. The occurrencedata obtained by the Committee from the published literature are summarized insection 7.
6.1 Australia
Food Standards Australia New Zealand (FSANZ) submitted lead datacollected in the 23rd Australian Total Diet Study (TDS) conducted in 2008–2009.The data submitted were not in the Global Environment Monitoring System – FoodContaminant Monitoring and Assessment Programme (GEMS/Food) format. Theanalytical method used for the determination of lead was ICP-MS, and the LOD andlimit of quantification (LOQ) were reported as the same value, varying in the rangeof 0.0001–0.005 mg/kg, according to the food commodity. Lead concentrations indifferent food commodities (570 individual samples) were reported (Table 4). Thehighest lead value of 0.248 mg/kg was determined in a food in the baked goodscategory (a “fancy bread”). Sixteen per cent of the samples analysed presented alead concentration below the LOD of the method.
Data from the 20th and 19th Australian TDSs were also submitted (FSANZ,2001, 2003). For these data, the analytical methods used were not reported. Theweighted mean lead levels for the food commodities are presented in Tables 5 and6 for the 20th and 19th Australian TDSs, respectively.
6.2 Brazil
Brazil submitted data on lead levels in three meat categories: meat muscles(beef and pork), poultry muscles (chicken and turkey) and kidneys (beef, chickenand turkey). The data were provided from industry, and the samples were collectedduring the 2002–2009 period. The results were aggregated and reported in38 groups. No information was provided about the analytical method used forthe quantification of lead. The LOD and LOQ were reported as 0.005 mg/kg and0.010 mg/kg, respectively. In total, 2163 samples were analysed (616 pork andbeef muscles; 1368 poultry muscles; 179 kidneys); the lead concentrations werebelow the LOQ of the method in 91% of these samples. The maximum weightedmean lead concentrations were in meat muscles, poultry muscles and kidney, at0.345 mg/kg, 0.270 mg/kg and 0.140 mg/kg, respectively.
6.3 China
Data from two different sources were provided by China. Results fromChina’s 2007 TDS (China, 2010) included lead levels in 12 food composites from12 provinces. The mean lead levels were as follows: cereals, 0.015 mg/kg; legumes,0.060 mg/kg; potatoes, 0.064 mg/kg; meat, 0.038 mg/kg; eggs, 0.039 mg/kg;aquatic foods, 0.075 mg/kg; milk, 0.003 mg/kg; vegetables, 0.037 mg/kg; fruits,0.033 mg/kg; sugar, 0.004 mg/kg; beverages and water, 0.001 mg/kg; and alcoholicbeverages, 0.002 mg/kg.
LEAD (addendum) 439

Table 4. Lead concentration in different food commodities from Australia(23rd Australian TDS)
Food category n n <LOD Mean lead concentration(mg/kg)
Maximum leadconcentration (mg/kg)
Cereals/grains notincluded elsewhere andmixed grains
24 2 0.008 0.022
Wheat (includingbreads)
16 1 0.009 0.020
Rice 4 1 0.003 0.007
Baked goods includingfancy bread
20 0 0.027 0.248
Oats 4 0 0.003 0.003
Roots and tubers 12 0 0.004 0.011
Pulses + legumes 4 0 0.005 0.007
Fruits 80 20 0.003 0.031
Dried fruit 12 0 0.016 0.030
Fruit juices 12 0 0.013 0.032
Vegetables includingjuices
118 21 0.013 0.072
Meat muscle 36 0 0.010 0.057
Poultry muscle 20 0 0.005 0.017
Poultry liver 4 0 0.007 0.008
Eggs 10 3 0.002 0.039
Finfish 18 0 0.005 0.010
Shellfish 8 0 0.010 0.019
Dairy products 42 13 0.004 0.056
Nuts and oilseeds 8 1 0.004 0.007
Animal fats 4 2 0.002 0.008
Vegetable oils and fats 8 7 0.0001 0.001
Stimulants 12 1 0.015 0.101
Sugar and honey 8 4 0.026 0.095
Spices 8 0 0.002 0.005
Alcoholic beverages 20 3 0.007 0.018
Miscellanous 50 15 0.009 0.143
Total samples 570 94 — —
440 LEAD (addendum)

Table 5. Lead concentration in different food commodities from Australia(20th Australian TDS)
Food category n n <LOD Weighted mean (maximum) leadconcentration (mg/kg)
Cereals/grains not includedelsewhere and mixed grains
48 33 0.006 (0.05)
Wheat (including most breads) 46 31 0.009 (0.06)
Rice 9 9 <LOD
Baked goods (including fancybreads)
30 22 0.004 (0.02)
Oats 9 9 <LOD
Roots and tubers 28 26 0.001 (0.01)
Pulses + legumes 9 9 <LOD
Fruits 144 142 0.0003 (0.01)
Dried fruit 9 0 0.038 (0.06)
Fruit juices 28 28 <LOD
Vegetables including juices 202 177 0.002 (0.05)
Meat muscle 133 113 0.004 (0.17)
Poultry muscle 21 20 0.001 (0.01)
Poultry liver 21 19 0.002 (0.04)
Eggs 28 26 0.001 (0.01)
Finfish 51 48 0.001 (0.02)
Shellfish 21 13 0.189 (0.05)
Dairy products 67 58 0.003 (0.04)
Nuts and oilseeds 18 18 <LOD
Vegetable oils and fats 28 28 <LOD
Stimulants 9 9 <LOD
Sugar and honey 9 9 <LOD
Spices 21 21 <LOD
Alcoholic beverages 21 0 0.018 (0.06)
Total samples 1010 868 —
LEAD (addendum) 441

Table 6. Lead concentration in different food commodities from Australia(19th Australian TDS)
Food category n Weighted mean leadconcentration (mg/kg)
Maximum leadconcentration (mg/kg)
Cereals/grains not includedelsewhere and mixed grains
45 0.0142 0.290
Wheat (including breads) 48 0.010 0.010
Rice 18 0.005 0.019
Baked goods 27 0.007 0.050
Oats 9 0.003 0.007
Roots and tubers 27 0.001 0.022
Pulses + legumes 27 0.012 0.050
Fruits 168 0.004 0.040
Dried fruit 9 0.020 0.050
Fruit juices 27 <LOD 0.006
Vegetables including juices 198 0.003 0.030
Organ meats 48 0.106 0.630
Meat muscle 8331 0.002 0.037
Minced meats 69 0.003 0.078
Eggs 27 <LOD 0.007
Finfish 30 0.003 0.007
Shellfish 30 0.147 1.100
Dairy products 84 0.008 0.050
Nuts and oilseeds 18 0.003 0.014
Vegetable oils and fats 18 <LOD <LOD
Stimulants 9 0.003 0.010
Sugar and honey 9 0.079 0.110
Spices 21 <LOD <LOD
Alcoholic beverages 21 <LOD <LOD
Miscellaneous 27 0.004 0.020
Total samples 9345 — —
442 LEAD (addendum)

Individual results were also submitted by China from its monitoringprogramme using the GEMS/Food format and comprising the 2000–2006 period.In total, 2255 samples of fruits and vegetables were analysed; 707 of the samplespresented a quantifiable result (above the LOQ of the method). The analyticalmethod used was not reported. The LOQs of the method were in the range of0.0005–0.05 mg/kg. The LOD was reported as the same value as the LOQ. Thehighest lead concentration (3.73 mg/kg) was reported for a sample of pome fruitcollected in 2000. The mean and maximum lead concentrations and number ofsamples analysed are reported in Table 7.
6.4 Europe
EFSA carried out an assessment on lead in food, including the risks tohumans from dietary exposure to lead (EFSA, 2010). The work was conducted bythe Scientific Panel on Contaminants in the Food Chain at the request of theEuropean Commission.
The Committee at the present meeting decided that the summary resultsfrom the EFSA report would be used in the current assessment.
EFSA received a total of 139 423 results from food testing, of which 97.9%were from 14 member states (Austria, Belgium, Czech Republic, Denmark, Estonia,Finland, France, Germany, Great Britain, Ireland, Poland, Romania, Spain andSweden) and Norway and 2.1% from three commercial operators.
Approximately 94 000 results covered the period from 2003 to 2009 and weresuitable for calculating lead concentrations in 15 major food categories (Table 8).Germany was the major contributor, providing 44% of the concentration data,followed by France (15%), the Czech Republic (9.7%) and Romania (9.6%).
The analytical methods used to perform the determination of lead weregraphite furnace atomic absorption spectrometry (GFAAS) (24.3% of the analyses),followed by ICP-MS (9.8% of the analyses). For 52.5% of the samples analysed, noinformation was provided on the analytical method used, apart from detection andquantification limits. The median LODs for non-specified atomic absorptionspectrometry, GFAAS and ICP-MS were 0.006 mg/kg, 0.01 mg/kg and 0.003 mg/kg, respectively.
Table 7. Lead concentration in different food commodities from China
Food category n n <LOD Mean lead concentration(mg/kg)
Maximum leadconcentration (mg/kg)
Fruits 1929 643 0.075 3.73
Leeks and onions 326 64 0.104 2.72
Total 2255 707 — —
LEAD (addendum) 443

6.5 Singapore
In total, 1009 samples were collected during 2008. Lead was determined in437 samples. The analytical method used for the quantification of lead was notreported. The LOD and LOQ were 0.09 mg/kg and 0.3 mg/kg, respectively. Fifty-seven per cent of the samples presented a lead content lower than the LOD. Thehighest lead levels were reported for three cocoa powder samples (45.4, 35.4 and25.3 mg/kg). Lead concentrations in different food commodities are presented inTable 9 (Singapore, 2010).
Table 8. Lead concentration in different food commodities from Europe
Food category n % of samples<LOD
Mean leadconcentration
(mg/kg)
Maximum leadconcentration
(mg/kg)
All cereal and cerealproducts
4 774 56.6 0.0286 7.120
Sugar and sugarproducts includingchocolate
1 794 63.6 0.0339 4.100
Fat 518 76.7 0.0387 7.300
All vegetables, nutsand pulses
11 011 52.3 0.0733 16.20
Starchy root andpotatoes
1 059 47.8 0.0223 1.321
Fruits 3 915 61.4 0.0137 3.700
Juices, soft drinks andbottled water
3 565 69.7 0.0047 0.660
Coffee, tea, cocoa 655 36.2 0.222 6.210
Alcoholic beverages 2 228 36.2 0.0216 5.800
All meat and meatproducts and offal
40 301 52.3 0.2534 867.0
All fish and seafood 11 453 68.7 0.0543 4.060
Eggs 615 88.6 0.0052 0.205
Milk and dairyproducts
3 210 80.6 0.0089 4.550
Miscellaneous/special dietaryproducts
4 923 42.8 0.3652 155.0
Tap water 4 087 38.2 0.0052 1.950
Total 94 108 — — —
444 LEAD (addendum)

6.6 United States of America
The USA published data on selected food items in its TDS comprising theperiod from 1999 to 2008. In total, 4841 samples were analysed using GFAAS. TheLOD and the LOQ of the method were in the range of 0.004–0.02 mg/kg and 0.01–0.06 mg/kg, respectively. Eighty-three per cent of the samples presented a leadcontent lower than the LOD of the method. The highest lead content of 0.18 mg/kgwas reported for a shrimp sample collected in 2006.
Lead levels in different food commodities from the TDS (1999–2008) arepresented in Table 10 (USFDA, 2010).
Table 9. Lead levels in different food commodities from Singapore
Food category n n <LOD Mean leadconcentration (mg/kg)
Maximum leadconcentration (mg/kg)
Cereals/grains notincluded elsewhere andmixed grains
5 5 <LOD <LOD
Baked goods 8 7 0.018 0.14
Fruit juices 5 4 0.032 0.16
Vegetables includingjuices
66 20 0.402 1.97
Mushrooms/fungus 113 28 0.616 10.1
Molluscs 8 4 0.074 0.19
Finfish 9 0 0.224 0.45
Shellfish 2 0 0.125 0.14
Seaweed 101 38 0.180 1.44
Cocoa products exceptfor cocoa butter
206 44 0.692 45.4
Cocoa butter 34 34 <LOD <LOD
Nuts and oilseeds 3 3 <LOD <LOD
Animal fats 59 59 <LOD <LOD
Vegetable oils and fats 197 196 0.001 0.1
Stimulants 40 0 1.029 3.9
Sugar and honey 66 61 0.019 0.72
Spices 27 11 0.107 0.44
Alcoholic beverages 2 2 <LOD <LOD
Miscellaneous 58 55 0.004 0.16
Total 1009 572 — —
LEAD (addendum) 445

The USA also provided non-TDS monitoring/surveillance data from theperiod 1999–2006 (Table 11) (USFDA, 2010). In total, 3633 samples were analysedusing four different analytical methods: FAAS, GFAAS, ICP-OES and ICP-MS. Thehighest lead content of 74 mg/kg was reported for a fruit juice sample collected in2000. Fifty-six per cent of all samples analysed presented a lead concentrationlower than the LOD of the method.
Table 10. Lead levels in different food commodities from the USA (TDS 1999–2008)
Food category n n <LOD Mean leadconcentration (mg/kg)
Maximum leadconcentration (mg/kg)
Cereals/grains notincluded elsewhere andmixed grains
93 90 0.0004 0.017
Wheat (includingbreads)
366 311 0.002 0.026
Rice 39 39 <LOD <LOD
Baked goods 39 28 0.004 0.019
Oats 39 38 0.0004 0.014
Roots and tubers 117 104 0.001 0.019
Pulses + legumes 156 146 0.001 0.013
Fruits 769 565 0.003 0.046
Dried fruit 54 34 0.006 0.032
Fruit juices 361 223 0.003 0.029
Vegetables includingjuices
1302 1055 0.003 0.136
Meat muscle 483 465 0.001 0.054
Organ meats 39 18 0.013 0.049
Poultry muscle 102 99 0.0004 0.014
Eggs 93 93 <LOD <LOD
Finfish 102 96 0.001 0.013
Shellfish 39 23 0.012 0.180
Dairy products 288 269 0.001 0.033
Nuts and oilseeds 117 114 0.001 0.033
Animal fats 39 38 0.001 0.029
Vegetable oils and fats 63 61 0.001 0.021
Stimulants 39 36 0.0004 0.007
Sugar and honey 39 39 <LOD <LOD
Miscellaneous 63 51 0.002 0.021
Total 4841 4035 — —
446 LEAD (addendum)

Table 11. Lead levels in different food commodities from the USA (non-TDS1999–2006)
Food category n n <LOD Mean leadconcentration (mg/kg)
Maximum leadconcentration (mg/kg)
Cereals/grains notincluded elsewhere andmixed grains
35 27 0.013 0.123
Rice 15 11 0.004 0.021
Baked goods 79 49 0.232 16.50
Oats 2 2 <LOD <LOD
Pulses + legumes 24 16 0.006 0.063
Fruits 425 238 0.130 28.86
Dried fruit 198 90 0.046 1.336
Fruit juices 428 220 0.352 74
Vegetables includingjuices
277 158 0.300 27.56
Mushrooms and otherfungi
18 9 0.224 3.670
Seaweed 1 0 0.100 0.1
Dairy products 130 113 0.013 0.290
Nuts and oilseeds 20 15 0.024 0.299
Sugar and honeyincluding candy
25 10 0.082 0.750
Meat muscle 319 285 0.013 1.359
Organ meats 319 124 0.047 1.237
Poultry muscle 200 152 0.003 0.075
Mollusc 3 0 0.065 0.102
Finfish 446 288 0.009 0.233
Shellfish 665 211 0.075 11.80
Miscellaneous 4 3 0.012 0.046
Total 3633 2021 — —
LEAD (addendum) 447

7. FOOD CONSUMPTION AND DIETARY EXPOSURE ESTIMATES
7.1 Introduction
Human exposure to lead can occur via food, water, air, soil and dust. Leadis found in all categories of food, including meat, milk, fruits and vegetables, cocoaand cocoa products and processed foods. Water can also contain lead, dependingupon the source and the water system characteristics. Although non-dietary sourcesare potentially important sources of exposure, the Committee generally did not havedata to estimate exposure via non-dietary routes and thus did not evaluate therelative contributions of non-dietary sources of exposure.
7.2 Considerations in determining dietary exposure to lead
The sources of lead in food may include soil remaining in or on the food,atmospheric deposition, water, contact with lead-containing processing equipmentand packaging. Therefore, it is important to estimate lead levels in food that is asclose as possible to the form of the food that is consumed. Levels in raw agriculturalcommodities do not necessarily reflect levels in foods as they are consumed.
The guidelines for conducting exposure assessments for contaminants infoods (http://www.who.int/ipcs/food/principles/en/index1.html) recommend thatregional dietary exposure estimates should be calculated using regional averagecontaminant concentration data and the GEMS/Food consumption cluster diets(http://www.who.int/foodsafety/chem/gems/en/index1.html). The Committee con-sidered estimates from the TDS or similar studies to be the most relevant in the caseof lead, as lead may be introduced during cooking and processing. In contrast, theWHO GEMS/Food consumption cluster diets cannot distinguish the form of the foodthat is consumed. Therefore, the Committee focused on exposure assessments inwhich the data were collected on foods as they are consumed and did not use theGEMS/Food data to calculate exposure to lead for this evaluation.
Lead occurrence data were submitted by seven countries. All but one ofthose countries provided a national exposure assessment using the submitted datain combination with national food consumption data. Most of the exposureassessments were conducted using TDS data that took into consideration theeffects of processing/cooking. EFSA provided data for 14 countries and used thosedata to estimate exposures for 19 countries. Cooking and processing wereconsidered where possible. In addition to the submitted studies, the Committeeconducted a literature search and identified several additional national exposureassessments that also took into account cooking and processing.
The Committee included estimates of children’s exposure whereverpossible. Most of the submitted TDSs estimated children’s exposure. The GEMS/Food consumption cluster diets do not include estimates of children’s consumption.For those countries that did not report children’s exposure, the Committee assumedthat children’s exposure would be 2–3 times that of the entire population andincluded those values in this report.
448 LEAD (addendum)

7.3 Assessment of dietary exposure to lead
Dietary exposure estimates were available to the Committee for 29countries. Each region/country made its own decisions as to the appropriatematching of food lead levels to food consumption data as well as the treatment ofsamples without detectable lead levels. Estimates of dietary exposure for individualcountries are presented below. EFSA conducted assessments for 19 Europeancountries, and those are presented together. In addition, results from the UnitedKingdom and France TDSs are presented as part of the Committee’s evaluation oftrends in dietary exposure to lead.
Exposure assessments for each country are presented below.
7.3.1 Australia
FSANZ conducted exposure assessments for Australian1 consumers usingthe 19th and 20th Australian TDSs and provided those assessments to theCommittee. Although there are more recent Australian TDSs, exposure assess-ments are not yet available for lead. Therefore, the Committee relied on the 19thand 20th TDSs for evaluating exposures. The 19th Australian TDS was publishedin 2001 (FSANZ, 2001), with samples collected and analysed in 1998–1999. The20th Australian TDS was published in 2003 (FSANZ, 2003), with samples collectedand analysed in 2000–2001. FSANZ reported a range of exposures based on meanfood consumption and either the lower- or upper-bound median concentrations oflead in the analysed foods. The lower end of the range of reported exposures in theAustralian TDSs assumed that results less than the limit of reporting (LOR) are equalto zero (lower-bound approach), and the upper end of the range assumed thatresults less than the LOR are the same as the LOR (upper-bound approach). TheLOQ of the method was reported to be 0.0005–0.001 mg/kg food. The foodconsumption data used in estimating exposures for both the 19th and 20thAustralian TDSs were from the 1995 National Nutrition Survey. For infants,estimated dietary exposures are based on a constructed infant diet. The resultingAustralian dietary exposures to lead are summarized in Table 12.
The highest estimated exposures (per unit body weight) were for toddlers (2years), whose mean exposures were 1.19–1.92 μg/kg bw per day in the 19thAustralian TDS and 0.03–0.93 μg/kg bw per day in the 20th Australian TDS.
7.3.2 Brazil
Brazil provided lead levels for meat only. Lead levels in beef and poultrymuscle meat and kidney from beef and poultry were provided. The Committeedecided that it would be misleading to estimate dietary exposure from a single foodcategory; thus, no estimate was undertaken.
1 New Zealand also conducts a TDS, which is published separately and is summarized underNew Zealand.
LEAD (addendum) 449
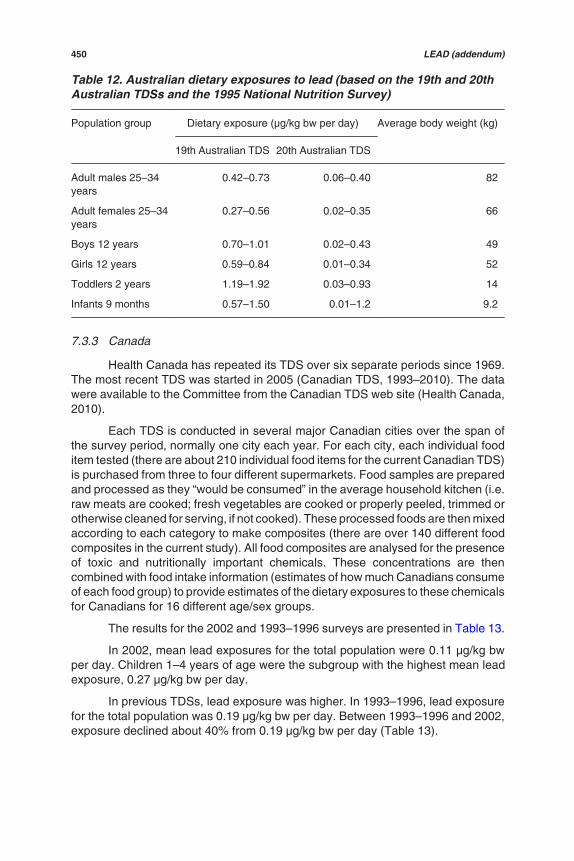
7.3.3 Canada
Health Canada has repeated its TDS over six separate periods since 1969.The most recent TDS was started in 2005 (Canadian TDS, 1993–2010). The datawere available to the Committee from the Canadian TDS web site (Health Canada,2010).
Each TDS is conducted in several major Canadian cities over the span ofthe survey period, normally one city each year. For each city, each individual fooditem tested (there are about 210 individual food items for the current Canadian TDS)is purchased from three to four different supermarkets. Food samples are preparedand processed as they “would be consumed” in the average household kitchen (i.e.raw meats are cooked; fresh vegetables are cooked or properly peeled, trimmed orotherwise cleaned for serving, if not cooked). These processed foods are then mixedaccording to each category to make composites (there are over 140 different foodcomposites in the current study). All food composites are analysed for the presenceof toxic and nutritionally important chemicals. These concentrations are thencombined with food intake information (estimates of how much Canadians consumeof each food group) to provide estimates of the dietary exposures to these chemicalsfor Canadians for 16 different age/sex groups.
The results for the 2002 and 1993–1996 surveys are presented in Table 13.
In 2002, mean lead exposures for the total population were 0.11 μg/kg bwper day. Children 1–4 years of age were the subgroup with the highest mean leadexposure, 0.27 μg/kg bw per day.
In previous TDSs, lead exposure was higher. In 1993–1996, lead exposurefor the total population was 0.19 μg/kg bw per day. Between 1993–1996 and 2002,exposure declined about 40% from 0.19 μg/kg bw per day (Table 13).
Table 12. Australian dietary exposures to lead (based on the 19th and 20thAustralian TDSs and the 1995 National Nutrition Survey)
Population group Dietary exposure (μg/kg bw per day) Average body weight (kg)
19th Australian TDS 20th Australian TDS
Adult males 25–34years
0.42–0.73 0.06–0.40 82
Adult females 25–34years
0.27–0.56 0.02–0.35 66
Boys 12 years 0.70–1.01 0.02–0.43 49
Girls 12 years 0.59–0.84 0.01–0.34 52
Toddlers 2 years 1.19–1.92 0.03–0.93 14
Infants 9 months 0.57–1.50 0.01–1.2 9.2
450 LEAD (addendum)

7.3.4 Chile
No data on Chilean lead exposures were submitted to the Committee, but apublished study was available (Muñoz et al., 2005). In that study, dietary exposureto lead by the population of Santiago, Chile, was determined using the ChileanTDS. The most frequently consumed food products were included in the basket.Prior to analysis, the foods were prepared according to typical Chilean proceduresand then grouped into 17 food categories according to their chemical characteristicsand analysed. The LOD for lead was 50 μg/kg dry weight for solid samples and1.6 μg/l for liquid samples. The estimated dietary exposure to lead was 210 μg/day(3 μg/kg bw per day for a 63 kg individual). The authors acknowledged that theseexposures were quite high and that they were due to high lead levels in foods ratherthan from high amounts of food consumption. Milk and milk products, fruits, breadsand sugars contributed most to the dietary exposure.
Children’s exposures were not reported. The Committee assumed thatchildren would have 2–3 times the exposure of adults per unit body weight and thatthe range of Chilean children’s exposures would be 6–9 μg/kg bw per day.
Table 13. Average dietary exposures of lead for Canadians in different age/sex groups for TDSs in 2002 (Vancouver) and in 1993–1996 (Montreal)
Population subgroup Dietary exposure (μg/kg bw per day)
2002 (Vancouver) 1993–1996 (Montreal)
0–1 month, male + female 0.20 0.45
2–3 months, male + female 0.26 0.54
4–6 months, male + female 0.19 0.42
7–9 months, male + female 0.22 0.45
10–12 months, male + female 0.24 0.50
1–4 years, male + female 0.27 0.49
5–11 years, male + female 0.21 0.36
12–19 years, male 0.15 0.25
12–19 years, female 0.12 0.19
20–39 years, male 0.13 0.22
20–39 years, female 0.11 0.18
40–64 years, male 0.12 0.20
40–64 years, female 0.10 0.17
65+ years, male 0.09 0.16
65+ years, female 0.08 0.14
All ages, male + female 0.11 0.19
LEAD (addendum) 451

7.3.5 China
China submitted two exposure assessments based on the results of the 2007and the 2000 Chinese TDSs (Wang et al., 2009).
The 2007 Chinese TDS estimated exposure for the total population. Theoverall exposure to lead for Chinese consumers was estimated to be 55 μg/day(0.87 μg/kg bw day, assuming a mean body weight of 63 kg). The food categoriesmaking the largest contributions were cereals (34%) and vegetables (21%). Thecontributions to exposure from these and other food categories are presented inTable 14.
In the 2000 Chinese TDS (Wang, 2009), the exposures for various agegroups were determined. The results are presented in Table 15. When exposuresare presented on a microgram per day basis, adults have the highest exposures. Ifdata are adjusted by body weight, children 2–7 years of age have estimatedexposures of 3.1 μg/kg bw per day (mean) and 8.2 μg/kg bw per day (upper 97.5thpercentile).
Table 14. Chinese consumer lead exposures by food category (2007 ChineseTDS)
Food category Mean exposure(μg/day)
SD Mean exposure(μg/kg bw per day)a
% of total
Cereals 16.44 20.87 0.26 34
Legumes 4.11 5.72 0.07 9
Potatoes 5.7 12.74 0.09 8
Meat 3.32 8.26 0.05 7
Eggs 1.74 3.03 0.03 2
Aquatic foods 3.06 5.51 0.05 9
Milk 0.08 0.07 0.00 0
Vegetables 16.85 34.36 0.27 21
Fruits 2.57 5.94 0.04 8
Sugar 0.01 0.02 0.00 0
Beverages and water 0.58 0.41 0.01 2
Alcoholic beverages 0.02 0.02 0.00 0
Total 54.48 62.61 0.86 100
a Assuming a body weight of 63 kg.
452 LEAD (addendum)

7.3.6 Egypt
No data were submitted to the Committee for Egypt. The Committeeobtained a published report of a market basket survey that contained levels of leadin various fruits and vegetables sold in Egyptian markets. Atomic absorptionspectrometry was used to estimate and evaluate the levels of lead (Radwan &Salama, 2006). The authors reported dietary exposures of 21 μg/day from fruits, 30μg/day from vegetables and 1 μg/day from potatoes. Total exposure was notestimated. Assuming a body weight of 68 kg, total exposure from these categorieswould be 0.74 μg/kg bw per day.
7.3.7 Europe
EFSA released an assessment of lead exposure on 18 March 2010. SomeEuropean countries also conduct exposure assessments using their own TDSs. Forexample, the United Kingdom has conducted exposure assessments using theUnited Kingdom TDS since 1980.
Table 15. Lead dietary exposures of different age/sex population groups inChina (2000 Chinese TDS)
Age/sex Body weight(kg)
Mean exposure ±SD (μg/day)
97.5th percentileexposure (μg/day)
Mean exposure(μg/kg bw per
day)
2–7 years,male + female
17.9 54.9 ± 37.5 146.8 3.1
8–12 years,male + female
33.1 78.0 ± 54.0 207.9 2.4
13–19 years,male
56.4 99.0 ± 59.2 250.5 1.8
13–19 years,female
50 92.1 ± 56.7 230 1.8
20–50 years,male
63 112.7 ± 83.5 308.3 1.8
20–50 years,female
56 101.2 ± 68.9 279.7 1.8
51–65 years,male
65 102.9 ± 56.5 228.4 1.6
51–65 years,female
58 92.8 ± 51.8 253.3 1.6
>65 years,male
59.5 102.0 ± 65.2 250.9 1.7
>65 years,female
52 79.4 ± 49.8 202.8 1.5
LEAD (addendum) 453

(a) EFSA
The Committee reviewed the EFSA report and included the results in thepresent evaluation of European consumer exposures to lead.
EFSA conducted a detailed evaluation of the submitted data and created asingle database of occurrences of lead in foods, which was then used to estimatelead exposure in 19 countries. Some data were determined by the study authors tobe outliers and were excluded. The foods were grouped into categories. The numberof test results for each food in a category was not proportional to the food’s relativecontribution to the diet. Therefore, sampling adjustment factors were developed toallow the determination of a weighted lead level for each food category.
For the purposes of exposure assessment, EFSA assumed that the leadlevels were the same in all countries and that only the diet varied. EFSA combinedthe occurrence data with consumption information obtained from the EFSA ConciseEuropean Food Consumption Database. According to the EFSA report, individualfood consumption data that were available in the Concise European FoodConsumption Database were used for the lead exposure analysis. This provides amore accurate estimate, in that individual body weights are used for the calculations.Only aggregated food consumption statistics for this database are presented on theEFSA web site (http://www.efsa.europa.eu/en/datex/datexfooddb.htm). The individ-ual data were not available to the Committee.
EFSA divided the food consumption data into 15 broad food groups andsome subgroups, giving a total of 28 separate groups. Individual data on sex, ageand body weight were included.
EFSA determined lead dietary exposure for average adult consumers in19 European countries—Austria, Belgium, Bulgaria, Czech Republic, Denmark,Estonia, Finland, France, Germany, Great Britain, Hungary, Iceland, Ireland, Italy,the Netherlands, Norway, Poland, Slovakia and Sweden—by combining the leadlevels in the analysed foods with information on consumption from the EFSAConcise European Food Consumption Database.
EFSA recognized the variation in the methods used to collect and analysethe data as well as the need to consider the impact of assumptions regardingcensored data. Thus, EFSA estimated exposures using several different assump-tions and methods. For example, mean exposures were estimated with two differentassumptions regarding residue levels in samples without detectable lead (lower-bound estimates assumed a zero concentration for samples without detectablelead, and upper-bound estimates assumed that lead was present at the limits ofthe analytical method). Two different exposure assessment methods were alsoused: 1) a deterministic approach and 2) a probabilistic approach. The probabilisticassessment was conducted twice, using lower-bound and upper-bound values forthe non-quantifiable samples. EFSA concluded that estimates of exposure weresimilar for assessments that used probabilistic and deterministic methods.Therefore, only the results of the deterministic approach were reported by EFSA(upper- and lower-bound deterministic estimates). The Committee reviewed theestimates of dietary exposure to identify the most useful information to include in
454 LEAD (addendum)

this analysis. In order to facilitate cross-country comparisons, the Committeeselected the results of analyses that were as similar as possible to those that wereavailable for other countries (e.g. lower-bound estimates).
The Committee selected the ranges that estimate the lower bound for thecountry with the lowest average exposure and the upper bound for the country withthe highest average exposure. The range was 0.36–1.24 μg/kg bw per day forconsumers with mean dietary exposures and 0.73–2.43 μg/kg bw per day forconsumers with high dietary exposures, respectively.
EFSA estimated mean and 95th percentile lead dietary exposures for eachcountry using the standardized European-wide distribution of lead occurrence infoods in combination with national estimates of food consumption. Mean and 95thpercentile lead dietary exposures were determined for each country’s wholepopulation and subgroups of the population. In a separate analysis, EFSA estimatedexposures for children and infants by combining the results of multiple surveys ofexposure.
EFSA estimated children’s exposures based on a compilation of severaldifferent surveys of children’s exposure to lead. Mean exposures for children aged1–3 years ranged from 1.10 to 3.10 μg/kg bw per day based on lower-bound andupper-bound assumptions, respectively. Estimates for children aged 1–3 years withhigh dietary exposure ranged from 1.71 to 5.51 μg/kg bw per day. Thecorresponding exposures for children aged 4–7 years are 0.80–2.61 μg/kg bw perday based on lower-bound and upper-bound assumptions, respectively, for themean and 1.30–4.4 μg/kg bw per day for children with high dietary exposure.
EFSA also concluded that “the available evidence for women of child-bearingage and vegetarians does not indicate a dietary exposure that is different from thatof the general adult population”.
EFSA estimated exposures for breastfed infants to be 0.21 μg/kg bw per dayon average and 0.32 μg/kg bw per day for consumers with high dietary exposure.EFSA noted that the lead levels in breast milk were very variable.
EFSA also estimated exposures for infants fed infant formula and reportedaverage exposures from 0.27 to 0.63 μg/kg bw per day, based on lower-bound andupper-bound assumptions, respectively. For infants with high dietary exposure, leadexposures ranged from 0.40 to 0.94 μg/kg bw per day.
Lead exposures for vegetarians from the adult population were reportedto be similar to those of other consumers. EFSA estimated exposures to be 1.98–2.44 μg/kg bw per day for consumers of game and 0.81–1.27 μg/kg bw per day forconsumers of offal.
EFSA evaluated the contribution of different food categories to exposure andnoted that it varied widely between countries. EFSA reported that
the largest contributors to the calculated overall lead exposure are vegetables, nuts andpulses contributing 19 % to the lower bound and 14 % to the upper bound estimates.Cereals and cereal products contributed 13 % to the lower bound and 14 % to the upperbound. For the lower bound miscellaneous products and food for special uses
LEAD (addendum) 455

contributed 12 %, starchy roots and potatoes 8%, meat and meat products 8 %, alcoholicbeverages 7 % and milk and dairy products 6 %. For the upper bound the contributionswere: juices, soft drinks and bottled water (11 %), alcoholic beverages (9%) meat andmeat products including offal (9 %), milk and dairy products (8 %), miscellaneousproducts and food for special uses (7 %) and starchy roots and potatoes (6 %).
Additional detail is available in the EFSA study report (EFSA, 2010).
(b) European TDSs
France and the United Kingdom submitted TDS data to the Committee.
(i) France
In addition to the results presented by EFSA, the Committee reviewed theresults of a lead exposure assessment conducted by France based on the FrenchTDS (Leblanc et al., 2005), which provided information about trends in dietaryexposure to lead. The estimated average daily dietary exposure of the Frenchpopulation to lead was 18 μg for adults aged 15 years or more (0.26 μg/kg bw perday for a 70 kg person) and 13 μg for children aged 3–14 (0.43 μg/kg bw per dayfor a 30 kg child).
The 97.5th percentile exposure for adults was 3.6 μg/kg bw per week(0.51 μg/kg bw per day), and for children, 6.4 μg/kg bw per week (0.91 μg/kg bwper day).
The food groups contributing most to exposure of the population were bread,rusk, soups, vegetables, fruits, drinking-water, non-alcoholic beverages, alcoholicbeverages, and sugars and confectionery.
The study authors noted that “compared to existing French data, the Pbexposures have declined by a factor of 2 to 4”. No information was available as tothe time frame for these declines.
(ii) United Kingdom
The Committee also reviewed the United Kingdom exposure assessmentsbased on its TDS since 1980. The United Kingdom TDS allowed the Committee toevaluate trends in lead levels in the diet over time. Based on the 2006 TDS, thepopulation dietary exposure to lead was 0.006 mg/day. In the 2006 TDS, the majorcontributors to the population dietary exposure were the beverages, bread and othervegetables groups. Dietary exposures of the general United Kingdom population inthe 1980 TDS were estimated to be 0.12 mg/day. Lead exposure declined by 95%from 1980 to 2006.
7.3.8 India
No occurrence data were submitted for India. The Committee obtained apublished study of lead exposures that was conducted from a TDS-like marketbasket study in Mumbai, India, in 1991–1994 (Tripathi et al., 1997). Lead levels wereestimated in air particulates, water and food samples collected from differentsuburbs in Mumbai. The data were used to estimate exposure via inhalation andingestion. In the study, food samples were purchased from different grocery stores
456 LEAD (addendum)

situated in different suburbs. The foods were selected to represent the food andliquids consumed during a 24 h period by the adult population. The samples weredivided into seven groups: cereals (rice, wheat and Jowar); pulses (red gram, blackgram and green gram); vegetables (potato, tomato, carrot, brinjal, cauliflower,beans, cabbage and ladies finger); leafy vegetables (amaranth, spinach andfenugreek); milk; meat; and fruits. The concentrations of lead and cadmium in allthese samples were estimated by the differential pulse anodic stripping voltam-metric (DPASV) technique using PARC Model 174 A Polarographic Analyser.Approximately 1000 ml drinking-water samples were collected from 13 houseslocated in different suburbs of Mumbai.
The concentration of lead in water varied between 0.6 and 2.6 μg/l, with ageometric mean of 1.2 μg/l and a geometric standard deviation of 1.73 μg/l(Table 16).
The total dietary lead exposure was reported to be 25.1 μg/day (Table 17).
Table 16. Mean concentrations of lead in food in India
Food No. of samples Geometric mean lead concentration (μg/kg)
Cereal 15 18.2
Pulses 13 253.3
Leafy vegetables 11 100.4
Other vegetables 32 4.1
Milk and milk products 4 1.6
Meat 6 57.0
Fruits 7 7.4
Water 13 1.2
Table 17. Food consumption and dietary lead exposure of Mumbai adults
Name of food Food consumption (g/day) Dietary lead exposure (μg/day)
Cereal 445 8.1
Pulses 5.5 13.9
Leafy vegetables 17 1.7
Other vegetables 88 0.4
Milk and milk products 113 0.2
Meat 14 0.8
Fruits 18 0.02
Total — 25.1
LEAD (addendum) 457

The study also measured levels of lead in air and estimated uptake byhumans. The total intake of lead through air, water and food was reported to be30 μg/day. The diet was reported to account for about 60% of total exposure to lead.
7.3.9 Lebanon
No occurrence data were submitted for Lebanon. The Committee obtaineda published study of lead exposures in adult urban populations of Lebanon(Nasreddine et al., 2006). According to the report, the exposure assessment wasperformed using the TDS approach, as recommended by WHO. Five “total diets”were collected during 2003–2004. The concentrations in food were expressed inmilligrams of lead per kilogram fresh matter, and lead exposures were expressedin milligrams per day per person. For foods containing levels of lead below the LOQ,a value equal to half the LOQ was assigned and used for calculation purposes. TheLOD for lead was 2 μg/kg. Average and maximal consumer exposures to lead werecalculated. Using these data in conjunction with a TDS, the mean and maximal dailydietary exposures per person per day from “total diet” food groups were determined.The mean exposure was estimated to be 18.5 μg/day, and the maximum exposurewas 29.6 μg/day. Water contributed the most to exposure. The foods contributingmost to exposure were bread and toast, fruits, pizza and pies, and vegetables (rawand cooked).
The study did not estimate exposure for children or other subgroups of thepopulation. The Committee estimated exposure for children by assuming thatchildren’s exposures would be 2–3 times the adult exposures (37–55.5 μg/day).
7.3.10 New Zealand
No occurrence data were submitted for New Zealand. The Committeeobtained the New Zealand TDS for 2003–2004 (NZFSA, 2005; Vannoort &Thomson, 2005), which provided dietary exposure estimates for lead. In that study,the New Zealand TDS sampled 121 different foods, 110 of which represented atleast 70% of the most commonly consumed food items for the majority of NewZealanders. The foods were analysed for lead. Fourteen-day simulated typical dietsusing these 121 foods were derived mainly from food frequency and 24 h diet recalldata from the 1997 National Nutrition Study for adults 15+ years of age and the 2002Children’s Nutrition Study for 5- to 14-year-olds (both commissioned by the NewZealand Ministry of Health). Data from recent studies were used to simulate typicaldiets for children younger than 5 years of age. The simulated typical diets wereestablished for the following eight age/sex groups: 25+ years, male; 25+ years,female; 19–24 years, young male; 11–14 years, boy; 11–14 years, girl; 5–6 years,child; 1–3 years, toddler; and 6–12 months, infant.
Approximately 4440 different food samples that were intended to be typicalof what was available at the point of sale were obtained. All foods were bought attwo different times of the year to provide a measure of seasonal variation. Most ofthese were composited to provide a total of 968 different food samples for elementalanalyses. The foods in the 2003–2004 New Zealand TDS were prepared ready forconsumption, prior to analysis.
458 LEAD (addendum)

The estimates of dietary exposure were calculated by using the meanconcentration of lead in the food samples and the model diets. The estimatedexposures were 0.13 μg/kg bw per day (0.91 μg/kg bw per week) for a young maleand 0.34 μg/kg bw per day (2.4 μg/kg bw per week) for an infant.
Most food groups contributed to dietary lead exposure for all age/sex groups.Grains contributed 24–27% of dietary lead for adults and 36–39% for children.Chicken, eggs, fish and meat contributed 12–16%, and takeaways contributed9–24%, of adult dietary lead; the corresponding percentages for children were7–12% and 10–15%. The main food groups contributing to weekly dietary exposureto lead for infants are grain (18%), chicken, eggs, fish and meat (4%), takeaways(6%), fruit (18%) and infant formula and weaning foods (38%).
7.3.11 Nigeria
No occurrence data were submitted for Nigeria. The Committee obtained apublished study (Maduabuchi et al., 2006) that estimated the levels of lead in somefoods (canned and non-canned beverages, paediatric syrups, fish, spinach, flutedpumpkin, root crop [type not specified] and cocoa yam). Only very limitedinformation is available about the study. There is no information about the analyticalmethods used, LODs or numbers of samples. The authors reported leadconcentrations of 2–7.3 μg/l in canned beverages and 1–92 μg/l in non-cannedbeverages. No further details were presented about the types of beverages, eithercanned or non-canned. Several paediatric syrups were also analysed. One syrupwas reported to contain lead at 90 μg/l. One fish (Ethmaliosa timbriata) was reportedto contain lead at a concentration of 2400 μg/kg. No further details are availableabout the study.
No dietary exposure assessment was provided. Given the limited informationabout the data and the limited numbers of foods, the Committee could not conductan assessment.
7.3.12 Singapore
No exposure assessment was provided by Singapore. The Committeedecided that it would not be reliable to use the GEMS/Food consumption clusterdiets to estimate exposure, as many of the sampled foods do not have consumptionestimates in the consumption cluster diets; conversely, many foods that arecommonly eaten were not analysed for lead in the Singapore study (see section 6.5above).
7.3.13 United States of America
Estimates of dietary exposure to lead were provided based on the analyticalresults of the USA TDS samples collected from 2004 through 2008 and foodconsumption data collected in the 2003–2006 NHANES. The TDS is an ongoingmonitoring programme in which about 280 foods and beverages representing allmajor components of the average American diet are collected and analysed forvarious contaminants and nutrients. TDS samples are collected 4 times each year.Samples are collected from grocery stores and fast food restaurants in three
LEAD (addendum) 459
different cities. The foods are prepared table-ready (i.e. as they would beconsumed), and the three samples of each TDS food are then composited beforeanalysis.
Consumption data from the NHANES 2003–2006 Dietary Interview wereused to calculate daily dietary exposures to lead. During the 2003–2006 NHANES,consumption records were collected on 2 non-consecutive days for approximately16 800 individuals. Survey participants reported detailed information about the typesand amounts of foods consumed on those days; in all, approximately 6000 differentfoods and beverages were reported in the survey.
For calculating dietary exposures, lead analytical results for TDS foods werelinked to the 2003–2006 NHANES consumption data by mapping TDS foods toNHANES food codes that were most similar in composition. As an example, theTDS food “white bread” was linked to all NHANES codes for yeast breads and rollsmade from white flour. As another example, the TDS food “applesauce” was linkedto NHANES codes for applesauce as well as other cooked apple products. Thisapproach assumes that, based on the similarity of their ingredients, the analyticalresult for a TDS food would be an acceptable surrogate for the NHANES foods towhich it is mapped. Exposure to lead was estimated via Monte Carlo simulations.For each instance of food consumption as reported by a survey participant, a valuefor lead was randomly selected from the distribution of analytical results for TDSsamples collected from 2004 to 2008. Total daily exposures were calculated foreach of 14 age/sex subgroups and the total population of the USA; self-reportedbody weights of survey participants were used to convert exposure estimates to aper kilogram of body weight basis.
Table 18 summarizes the results for the mean and 90th percentile exposuresto lead for consumers in the USA.
7.3.14 Comparisons between countries
The Committee selected a representative dietary exposure value for eachcountry in order to allow comparisons across countries and across regions for thetotal and/or adult population (Table 19) and for children (Table 20). Unfortunately,estimates of exposure for the same population were not always available for everycountry. In order to improve comparability, the Committee adjusted some data bystandard body weight assumptions if the study reported only dietary exposure perday. For the total/adult population, mean exposures ranged from 0.02 to 3 μg/kg bwper day, depending on the country and also on the assumptions made in conductingthe assessments. Children’s exposures ranged from 0.03 to 9 μg/kg bw per day,again depending on the country, age of the children and assumptions made inconducting the assessments.
Lead is widely distributed in food. Lead was reported in all but one of thefood categories for which data were submitted for this evaluation. The relativecontribution of a food category to dietary exposure to lead depends upon the levelin the food (both the quantities and the frequency of occurrence) and the amount ofthe food that is consumed. Among the data submitted, foods with the highestfrequency of detection were shellfish (especially bivalves), cocoa products, organ
460 LEAD (addendum)

meats, tea, roots and tubers, seaweed and mushrooms/fungi. Foods with thehighest amounts of residues were found within every category. No single food orfood category always had high or low levels of lead. Levels greater than 1 mg/kgwere reported by some countries in wild game, some meat and meat products(especially organ meats and offal), cereals and cereal products, fruits andvegetables. Some countries identified water as having low but frequently detectedconcentrations of lead. Food consumption, a third determinant of exposure, alsovaried widely and was considered in all of the assessments. The assignment ofvalues to samples without detectable lead has important effects. The most importantcontributors to overall dietary exposure were reported by some countries. Foodscontributing most to exposure are noted for each country in the sections above.
7.4 Relative contribution of diet to total lead exposure
The relative contribution of diet to total lead exposure is not well known butwill probably vary depending upon locale and the contribution from non-dietarysources. Estimates from EFSA suggest that at least half of children’s exposure maybe due to non-dietary sources of exposure and that soil and dust are majorcontributors to the non-dietary exposures. The diet was reported to contribute 60%of lead exposure for adults in Mumbai, India.
Table 18. Consumer dietary exposure to lead in the USA (USA 2004–2008TDSs)
Population group Dietary lead exposure (μg/kg bw per day)
Mean 90th percentile
6–11 months, male + female 0.13 0.30
2 years, male + female 0.11 0.23
6 years, male + female 0.06 0.13
10 years, male + female 0.04 0.09
14–16 years, female 0.02 0.05
14–16 years, male 0.02 0.05
25–30 years, female 0.03 0.06
25–30 years, male 0.02 0.06
40–45 years, female 0.03 0.06
40–45 years, male 0.03 0.06
60–65 years, female 0.02 0.05
60–65 years, male 0.02 0.06
70+ years, female 0.03 0.06
70+ years, male 0.02 0.05
Total, male + female 0.03 0.08
LEAD (addendum) 461

7.5 Temporal changes in lead exposures
Lead levels in foods have declined over time. The estimated values dependupon the population, the time frame and, to some extent, the methods for leadanalysis. The Committee had access to data from five countries (Canada, France,New Zealand, the United Kingdom and the USA) that allowed the trends in leadexposure to be estimated.
Table 19. National lead dietary exposure estimates for total/adult population
Country/region Population group Exposure (μg/kg bw per day)
Mean High
Australia Adult males 25–34years
0.06–0.40a —
Adult females 25–34years
0.02–0.35a —
Canada All (2002 study) 0.11b —
Chile Adults in Santiago 3c —
China Adults 0.9d 1.8 (97.5th percentile)
Egypt All (exposuresmeasured for selectedcrops only)
0.74 —
Europe Adults (individualestimates by country)
0.36–1.24e 0.73–2.43 (95thpercentile)
India Adults in Mumbai 0.44c —
Lebanon All 0.27f 0.43
New Zealand Adult males 0.13g —
USA All 0.03h 0.08 (90th percentile)
a The lower end of the range of reported exposures assumed that results less than the LORare equal to zero, and the upper end of the range assumed that results less than the LORare the same as the LOR (data from the 20th TDS).
b LOD/LOQ not provided; mean values were specified for all but a few foods.c Assuming a body weight of 68 kg.d From the 2007 study and assuming a body weight of 63 kg.e Range between country with lowest mean exposure and country with highest mean
exposure. For lowest mean exposure values, results less than the LOQ were set to zero; forhighest mean exposure values, results less than the LOQ were set equal to the LOQ.
f Assuming a body weight of 68 kg; foods with concentrations less than the LOQ wereassigned a concentration of ½ LOQ.
g Samples with concentrations less than the LOD were assigned a concentration of ½ LOD.h Samples with concentrations less than the LOQ were assigned a concentration of zero.
462 LEAD (addendum)

New Zealand summarized changes in dietary exposure to lead since 1982in its 2003–2004 TDS report. Lead exposures for 19- to 24-year-old males were 3.6μg/kg bw per day in 1982 and 0.13 μg/kg bw per day in 2003–2004. This representsa decline of approximately 75%.
Table 20. National lead dietary exposure estimates for children
Country/region Age Exposure (μg/kg bw per day)
Mean High
Australia 2 years 0.03–0.93a
Canada 4 years 0.19b
2–3 years 0.26b
Chile Children 6–9c
China 2–7 years 3.1 8.2 (97.5th percentile)
Europe 1–3 years 1.10–3.10d 1 year: 2.1–5.5 (95thpercentile)e
3 years: 1.7–5.2 (95thpercentile)
4–7 years 0.80–2.61d 4 years: 1.5–4.4 (95thpercentile)
7 years: 1.4–4.4 (95thpercentile)
India Children 0.9–1.3c
New Zealand Infants 0.34f
1–3 years 0.31f
USA 6–11 months 0.13g 0.3 (90th percentile)
2 years 0.11g 0.2 (90th percentile)
a The lower end of the range of reported exposures assumed that results less than the LORare equal to zero, and the upper end of the range assumed that results less than the LORare the same as the LOR.
b LOD/LOQ not provided; mean values were specified for all but a few foods.c Assuming that children have 2–3 times the adult exposure per unit body weight, respectively.d Means for the country with the lowest exposure and the country with the highest exposure.
Lowest mean exposure (lower bound) calculated with results less than the LOQ assignedzero; highest mean exposure (upper bound) calculated with results less than the LOQ setat the LOQ.
e Children’s estimates for consumers with high exposure are based on EFSA’s combinationof estimates from multiple surveys (depending upon the age group, 8–13 surveys werecombined).
f Samples with concentrations less than the LOD were assigned a concentration of ½ LOD.g Samples with concentrations less than the LOQ were assigned a concentration of zero.
LEAD (addendum) 463

Dietary exposures for the general population in the United Kingdom havedeclined approximately 95% between 1980 and 2006. Exposures were estimatedto be 0.12 mg/day in the 1980 TDS and 0.006 mg/day in the 2006 TDS.
Canada and France have reported a 50% decline in exposure to lead overthe past 10–15 years.
The USA reported declines in lead exposure for all age groups (M. Bolger,personal communication, 2010). Teenage males (14–16 years) showed thegreatest decline, from 70 μg/day in 1976 to 3.45 μg/day in 2000.
8. DOSE–RESPONSE ANALYSIS
8.1 Identification of key data for risk assessment
8.1.1 Pivotal data from biochemical and toxicological studies
The data from biochemical and toxicological studies in experimental animalsprovide support for the plausibility of associations reported in epidemiologicalstudies. However, in view of the large numbers of studies providing quantitative dataon dose–response relationships in humans, the studies in experimental animals arenot considered to be pivotal for the dose–response analysis.
8.1.2 Pivotal data from human clinical/epidemiological studies
Exposure to lead has been shown to be associated with a wide range ofeffects, including various neurological effects, mortality (mainly due to cardio-vascular diseases), impaired renal function, hypertension, impaired fertility andadverse pregnancy outcomes, reduced sexual maturation and effects on dentalhealth. EFSA (2010) identified three effects as providing pivotal data for its riskassessment: 1) developmental neurotoxicity in young children, as measured bydecreased IQ score; 2) cardiovascular effects in adults, measured by increasedsystolic blood pressure; and 3) increased prevalence of chronic kidney disease inadults, as measured by a decrease in GFR. For each of these end-points, EFSAcalculated a BMD and its lower 95th percentile confidence limit (BMDL). The lowestBMD and BMDL were for a decrease in cognitive ability by 1 IQ point, which couldbe adverse at the population level. The Committee agreed that the neurode-velopmental effects of lead occurred at lower blood lead concentrations than theother effects and therefore considered these to be the pivotal data in its assessmentfor children. For adults, the Committee concluded that the pivotal data were for thelead-associated increase in systolic blood pressure, as this was associated with thelowest blood lead concentrations and with the greatest and most consistent weightof evidence.
464 LEAD (addendum)

8.2 General modelling considerations
8.2.1 Selection of data
As it is the most recent and most comprehensive meta-analysis available,the results of Lanphear et al. (2005) were used as the basis for a dose–responsemodel. This meta-analysis is based on the same studies used in the EFSA (2010)analysis. Although four different measures of dose were examined as part of themeta-analysis, concurrent blood lead level as the measure of exposure was usedfor dose–response modelling because it showed the highest correlation withchanges in IQ. The mean values for each of the five dose groups are shownin Figure 1.
8.2.2 Selection of mathematical model
Six different models were initially considered. The first four have a linearform, whereas the last two are sigmoidal:
1) Linear: The change in IQ from the zero intercept is proportional to dose. Thismodel has two adjustable parameters: intercept and slope. The linear model isequivalent to the hockey stick model with a threshold of zero.
2) Hockey stick: The change in IQ above a threshold is proportional to the doseabove the threshold. This model has three adjustable parameters: intercept,threshold and slope. The hockey stick model is equivalent to a bilinear modelwith a low-dose slope of 0.
3) Bilinear10: High- and low-dose slopes, with an inflection point at a leadconcentration of 10 μg/dl. Although 10 μg/dl has traditionally been used as a
Figure 1. Five models fit to central estimates from Lanphear et al. (2005)
LEAD (addendum) 465
90.0
92.0
94.0
96.0
98.0
100.0
102.0
0.0 5.0 10.0 15.0 20.0 25.0 30.0 35.0
Blood lead level (μg/dL)
IQ
Data
Linear, r = 0.943
Hill, r = 0.996
Mass action, r = 0.985
Bilinear10, r = 0.982
Bilinear, r = 0.993

cut-off level to distinguish between high and low exposures to lead, there is noempirical support for the use of this value as an inflection point. This model wasincluded because it is one of the models used in the EFSA analysis (i.e. thepiecewise linear model). The bilinear10 has three adjustable parameters:intercept, low-dose slope and high-dose slope.
4) Bilinear: High- and low-dose slopes, with an inflection point as an additionalparameter. This model has four adjustable parameters: intercept, low-doseslope, high-dose slope and the inflection point.
5) Mass action: A simple sigmoidal model that is theoretically based on reversibleligand–receptor interaction. This model has three adjustable parameters:intercept, maximum effect (amplitude) and median effective dose (ED50). Massaction is equivalent to the Hill model with the power parameter equal to one.
6) Hill: This model is a more complex sigmoidal model that is theoretically basedon reversible ligand interaction with multiple binding sites. From a curve-fittingpoint of view, the inclusion of an additional power parameter makes the slopeof the model more flexible. This model has four adjustable parameters:intercept, maximum effect (amplitude), ED50 and power.
8.3 Dose–response modelling
8.3.1 Blood lead and IQ in children
All six models were fit to the central estimates using least-squaresregression. The results for five of the models are shown in Figure 1 above. Thehockey stick model provided the same fit with the same slope parameter as thelinear model. CIs were estimated with a 1000-iteration bootstrap analysis, in whicheach model was successively fit to a set of dose–response pairs generated byrandom sampling from the CIs from the Lanphear et al. (2005) meta-analysis.
Table 21 compares the blood lead levels associated with a change of 1 IQpoint for each model with estimates from the previous evaluation by the Committeeand the EFSA evaluation. It may be noted that while the central (median) estimatesfrom the present analysis are quite similar to those presented by EFSA (Budtz-Jørgensen, 2010), the CIs are wider. This difference is attributable to the wider CIspresent in the estimates from the Lanphear et al. (2005) meta-analysis. Similarly,the estimates from the 2000 evaluation by the Committee (Annex 1, reference144) do not have CIs, as they are based on a meta-analysis (Schwartz, 1993) thathad no representation of uncertainty. The slight differences in central estimates arepresumably attributable to the fact that the Schwartz (1993) meta-analysis does notinclude some of the newer studies used by Lanphear et al. (2005) and Budtz-Jørgensen (2010).
8.3.2 Dietary lead exposure and IQ
The relationship between dietary lead exposure and blood lead level wasassumed to be linear with a slope somewhere between 0.052 and 0.16 μg/dl per 1μg/day of lead exposure. The high end of this range comes from a USEPA (1986)analysis of infants consuming lead-contaminated drinking-water in Scotland. Thisestimate underlies the USEPA lead model used by EFSA (2010). The low end ofthe range comes from the 2000 reanalysis by the Committee (Annex 1, reference
466 LEAD (addendum)

144) of the same data with an intercept parameter included that presumablyaccounts for other sources of lead exposure.
Since the Hill and bilinear models provided the best fit and have thecharacteristics of the other models, they were chosen for characterization of thedose–response relationship. Each of these two models is superimposed over theLanphear et al. (2005) meta-analysis results in Figures 2 and 3, respectively. Inorder to integrate model uncertainty with the uncertainty inherent in the meta-analysis, a dose–response function was also developed with combined output fromboth the Hill and bilinear models, with each model considered to be equiprobable(i.e. the outputs from the 1000-iteration bootstrap analysis for each model werecombined to produce a set of 2000 estimates). This function is shown in Figure 4.It may be noted that the uncertainty associated with this function is greater at lowdoses. This is attributable to the contribution of model uncertainty in addition to theuncertainty from the meta-analysis. In particular, the bilinear model tends to yieldhigher estimated impacts on IQ at low doses compared with the Hill model. Dietaryexposures associated with specific decreases in IQ are presented in Table 22.
However, it should be noted that these estimates presume that there are noother exposures to lead. As dietary exposure is less than exposure from air, water,soil and paint for many people in the world, this assumption is often not correct. Thisis particularly important for the Hill model, where impacts on IQ are greatest whenlead exposure is close to the ED50. So, although a few micrograms per day mayhave a negligible impact on IQ without other exposures, such a dietary exposuremay be a concern when other lead exposures push total exposure to the steeperpart of the curve. As the bilinear model is linear at low doses, the impact of a givendietary exposure will be about the same regardless of what the other exposures are.Because the bilinear model may provide a better estimate when other exposuresare unknown or highly variable, estimates using the bilinear model only arepresented in Table 23.
Table 21. Blood lead levels associated with a decrease of 1 IQ point in children
Model Blood lead level (μg/dl) associated with a decrease of 1 IQ point
FAO/WHO (2000)a EFSA (2010): BMD(BMDL)
Present analysis: Centralestimate (CI)
Linear 2.6 5.6 (4.1)b 5.1 (2.8–25)
Hockey stick 7.6 — 5.1 (2.8–25)
Mass action — — 1.4 (0.1–9)
Hill 6.9 — 8.5 (0.7–27)
Bilinear10 — 1.8 (1.2) 2.3 (0.9–19)
Bilinear — — 2.1 (0.8–17)
a Annex 1, reference 144.b From Budtz-Jørgensen (2010).
LEAD (addendum) 467

8.3.3 Blood lead and blood pressure in adults
For adults, increased systolic blood pressure was selected as the mostsensitive end-point. A linear slope relating increases in systolic blood pressure asa function of blood lead level was derived by averaging the estimates from fourdifferent studies (Table 24). This resulted in a median of 0.28 mmHg (0.037 kPa)per 1 μg/dl, with an SD of 0.15 mmHg (0.02 kPa) per 1 μg/dl (5th to 95th percentiles0.03–0.53 mmHg [0.004–0.071 kPa] per 1 μg/dl).
8.3.4 Dietary lead exposure and blood pressure in adults
Blood lead levels were converted to dietary exposures using the range ofvalues previously used by the Committee for adults (blood lead level of 0.023–0.07μg/dl per 1 μg/day of dietary lead exposure). Dietary exposure corresponding to anincrease in systolic blood pressure of 1 mmHg (0.1333 kPa) was estimated to be80 (5th to 95th percentiles 34–1700) μg/day, or about 1.3 (5th to 95th percentiles0.6–28) μg/kg bw per day, assuming a body weight of 60 kg. As the relationship islinear, the changes in blood pressure associated with other dietary exposures areproportional.
Figure 2. Hill model bootstrap analysis, superimposed over Lanphear et al.(2005)
Note: The data points and associated CIs are derived from the the Lanphear et al. (2005)meta-analysis. The thin line and shaded area represent a log-linear model and associated CIs,which are also from the Lanphear et al. (2005) meta-analysis. The thicker line plots the Hillmodel from the current analysis, with associated CIs given by the dotted lines.
468 LEAD (addendum)
85
87
89
91
93
95
97
99
101
103
105
0 5 10 15 20 25 30 35 40
Blood lead level (ug/dL)
IQ

9. COMMENTS
9.1 Absorption, distribution, metabolism and excretion
Absorption of lead from the gastrointestinal tract is influenced byphysiological factors (e.g. age, fasting, calcium and iron status, pregnancy) and thephysicochemical characteristics of the ingested material. Absorption is higher inchildren than in adults and is lower in the presence of food. Absorbed lead istransferred to soft tissues, including liver and kidney, and to bone tissue, where itaccumulates with age. Under certain conditions, such as pregnancy and osteo-porosis, bone resorption can result in increased concentrations of lead in blood.Lead readily crosses the placenta and is transferred into breast milk. In humans,the half-life of lead is approximately 30 days in blood and 10–30 years in bone. Urineand faeces are the major routes of excretion. Lead binds to thiol groups and otherligands in proteins. Its toxicity has been attributed to inhibition of enzymes (e.g.those involved in haem synthesis) and to interference with calcium, magnesium andzinc homeostasis.
Figure 3. Bilinear model bootstrap analysis, superimposed over Lanphear etal. (2005)
Note: The data points and associated CIs are derived from the Lanphear et al. (2005) meta-analysis. The thin line and shaded area represent a log-linear model and associated CIs, whichare also from the Lanphear et al. (2005) meta-analysis. The thicker line plots the bilinear modelfrom the current analysis, with associated CIs given by the dotted lines.
LEAD (addendum) 469
85
87
89
91
93
95
97
99
101
103
105
0 5 10 15 20 25 30 35 40
Pb lead level (ug/dL)
IQ

9.2 Toxicological data
The acute toxicity of lead is low. Chronic oral exposure of experimentalanimals to inorganic lead has effects on multiple organs, including kidney and liver,and systems, including the cardiovascular, haematological, immune, reproductiveand nervous systems. IARC has concluded that there is sufficient evidence for thecarcinogenicity of inorganic lead compounds in experimental animals, causing renaland brain tumours, and that the evidence for the carcinogenicity of organic lead
Figure 4. Dose–response function from pooled bilinear and Hill models
Table 22. Estimated dietary lead exposures associated with decreases in IQin children using the combined outputs of the bilinear and Hill models
IQ decrease in children Dietary exposure (μg/day)a Dietary exposure for 20 kg child (μg/kgbw per day)a
0.5 17 (2–194) 0.8 (0.1–9.7)
1 30 (4–208) 1.5 (0.2–10.4)
1.5 40 (5–224) 2.0 (0.3–11.2)
2 48 (7–241) 2.4 (0.4–12.0)
2.5 55 (9–261) 2.8 (0.4–13.1)
3 63 (11–296) 3.1 (0.5–14.8)
a Median estimate with 5th to 95th percentile CI in parentheses.
470 LEAD (addendum)
80
85
90
95
100
105
110
0 5 10 15 20 25 30 35 40 45
Blood lead level (ug/dL)
IQ

compounds is inadequate. The results of genotoxicity studies and the inhibition ofDNA repair suggest a non-DNA-reactive mode of action for the carcinogenicity oflead.
9.3 Observations in humans
There is an extensive body of literature on epidemiological studies of lead.Blood is the tissue used most frequently to estimate exposure to lead, and bloodlead levels generally reflect exposure in recent months. However, if the level ofexposure is relatively stable, then blood lead level is a good indicator of exposureover the longer term. Longitudinal surveys in some countries have shownsubstantial reductions in population blood lead levels in recent decades.Programmes such as those that have eliminated the use of leaded petrol areconsidered to be an important factor, resulting in an average reduction of 39% inmean blood lead level over the 5-year period following implementation. Reductions
Table 23. Estimated dietary exposures associated with IQ impacts using thebilinear model onlya
IQ decrease in children Dietary exposure (μg/day)a Dietary exposure for 20 kg child (μg/kgbw per day)a
0.5 6 (2–124) 0.3 (0.1–6.2)
1 12 (4–145) 0.6 (0.2–7.2)
1.5 19 (6–170) 0.9 (0.3–8.5)
2 25 (8–193) 1.3 (0.4–9.7)
2.5 31 (9–217) 1.6 (0.5–10.9)
3 38 (11–237) 1.9 (0.6–11.8)
a Median estimate with 5th to 95th percentile CI in parentheses.
Table 24. Slope estimates relating blood lead level to systolic blood pressure
Reference Slope estimate (mmHga per 1 μg/dl)
Median estimate Standard deviation
Glenn et al. (2003) 0.25 0.12
Vupputuri et al. (2003) 0.47 0.20
Nash et al. (2003) 0.32 0.19
Glenn et al. (2006) 0.09 0.05
Average 0.28 0.15
a 1 mmHg = 0.1333 kPa.
LEAD (addendum) 471

in population blood lead levels in some countries have also been associated withthe discontinued use of lead solder in food cans.
Exposure to lead has been shown to be associated with a wide range ofeffects, including various neurological and behavioural effects, mortality (mainly dueto cardiovascular diseases), impaired renal function, hypertension, impaired fertilityand adverse pregnancy outcomes, delayed sexual maturation and impaired dentalhealth. IARC concluded that there is sufficient evidence in animals but only limitedevidence in humans for the carcinogenicity of inorganic lead and that inorganic leadcompounds are probably carcinogenic to humans (group 2A). More recent studiesdo not indicate that any revision to the IARC conclusions is required.
For children, the weight of evidence is greatest, and evidence across studiesis most consistent, for an association of blood lead levels with impaired neuro-development, specifically reduction of IQ. Moreover, this effect has generally beenassociated with lower blood lead concentrations than those associated with theeffects observed in other organ systems. Although the estimated IQ decrease permicrogram of lead per decilitre of blood is small when viewed as the impact on anindividual child (6.9 points over the range of 2.4–30 μg/dl), the decrement isconsidered to be important when interpreted as a reduction in population IQ. Forexample, if the mean IQ were reduced by 3 points, from 100 to 97, while the standarddeviation and other characteristics of the distribution remained the same, therewould be an 8% increase in the number of individuals with a score below 100.Moreover, there would be a 57% increase in the number of individuals with an IQscore below 70 (2 standard deviations below the expected population mean,commonly considered to be the cut-off for identifying individuals with an intellectualdisability) and a 40% reduction in the number of individuals with an IQ score greaterthan 130 (considered to be the cut-off for identifying individuals with a “very superior”IQ). Furthermore, the Committee noted that a lead-associated reduction in IQ maybe regarded as a marker for many other neurodevelopmental effects for which theevidence is not as robust but which have been observed in children at approximatelythe same blood lead levels (e.g. ADHD, reading deficit, executive dysfunction, finemotor deficit).
For adults, the adverse effect for which the weight of evidence is greatestand most consistent is a lead-associated increase in blood pressure. As with thelead-associated reduction in IQ, the increase is small when viewed as the effect onan individual’s blood pressure, but important when viewed as a shift in thedistribution of blood pressure within a population. Increased blood pressure isassociated with increased risk of cardiovascular mortality. In a meta-analysis of 61prospective studies involving more than 1 million adults, increased blood pressurewas associated with age-specific increased mortality rates for ischaemic heartdisease and stroke, and the proportional difference in risk associated with a givenabsolute difference in blood pressure was similar at all blood pressures above 115mmHg (15 kPa) systolic or 75 mmHg (10 kPa) diastolic.
472 LEAD (addendum)

9.4 Analytical methods for the determination of lead in food and blood
The analytical methods for the determination of lead in food are wellestablished. The techniques of choice are ETAAS and ICP-MS. To a minor extent,FAAS and ICP-OES are used. In the last decade, many technical improvementshave been made to ETAAS, such as the design of the atomizer, backgroundcorrection systems and improvement in the light source and detector. These haveallowed the determination of lead in food at the low microgram per kilogram level.ICP-MS is increasingly used in food laboratories owing to its capability to performmulti-element measurements in a wide variety of food matrices. In addition, the useof DRC-ICP-MS has allowed the removal of interferences with a minimum loss ofsensitivity, while lowering the LOQs for lead, to allow the determination of lead infood at levels lower than 0.1 μg/kg.
The determination of lead in blood has been carried out using mainly ETAASor ICP-MS. The methods are well established, and the LODs at the 0.1 ng/ml levelare adequate to quantify lead in blood. Sample preparation is simple, but advancescan be made in reducing the volume of sample required for analyses. One noveltechnique is the use of laser ablation coupled with ICP-MS, which requires a samplevolume of less than 1 μl of whole blood for the quantification of lead.
The sample preparation procedure used most frequently for the deter-mination of lead in food is acid digestion in the presence of strong oxidants in openor closed vessels. Microwave-assisted acid digestion has been extensivelyemployed, which allows the use of large sample masses (1–2 g) under controlledtemperature and pressure of the system, reducing contamination and avoidinglosses of the element during mineralization.
Lead data for different food commodities submitted and evaluated at thismeeting were almost all obtained by validated analytical methods or generated byaccredited laboratories. The LODs and LOQs depend on the food matrix and theanalytical technique employed. Analytical methods with poor LODs (>0.01 mg/kg)may erroneously lead to the conclusion that there is no lead present in the food.
As an example, Australia used a more sensitive analytical method for its 23rdTDS than previously used in its 19th and 20th TDSs. This resulted in a significantincrease in the percentage of samples with detectable lead. However, moresensitive methods require greater resources and may limit the numbers of samplesthat can be analysed. Therefore, an appropriate balance in number of samples thatcan be analysed and the sensitivity of the method will be required in the planningof surveillance programmes.
9.5 Sampling protocols
General guidance for sampling for foods is described in the CodexAlimentarius Commission guidelines CAC/GL 50-2004 (FAO/WHO, 2004a).
9.6 Prevention and control
There have been widespread efforts to reduce lead exposure from food,focusing on implementing standards for lead levels in food, water and food additives;
LEAD (addendum) 473

ending the use of lead-soldered cans; regulating the use of lead in paint and petrol;controlling lead levels in water; reducing leaching from lead-containing vessels; andidentifying and reacting to additional sources of lead contamination in foods ordietary supplements. Dust on foods should be removed before processing and/orconsumption. For the prevention and control of lead in foods, good agricultural andmanufacturing practices should be followed.
9.7 Levels and patterns of contamination in food commodities
At its present meeting, the Committee reviewed data on lead occurrence indifferent food commodities received from seven countries—Australia, Brazil, China,France, Germany, Singapore and the USA. In addition, EFSA submitted data fromAustria, Belgium, Czech Republic, Denmark, Estonia, Finland, France, Germany,Great Britain, Ireland, Norway, Poland, Romania, Spain and Sweden and threecommercial operators. The data from France and Germany were included in theassessment report of EFSA. In order to avoid duplicating the data in this analysis,the individual data submitted from both countries were not separately considered inthe assessment of the current meeting.
The total number of analytical results (single or composite samples) was110 899, with 84.9% coming from Europe, 7.6% from the USA, 1.9% from LatinAmerica, 3.1% from Asia and 2.5% from the Pacific region. No data were receivedfrom Africa.
A summary of the available occurrence data submitted for this meeting byfood category is presented in Table 25. The weighted mean is provided for eachfood category and for the range of means across countries. The means wereweighted to adjust for different numbers of samples for foods within a category fromdifferent countries. All but one food category contained at least some foods withdetectable lead levels. Maximum lead concentrations were determined for eachcategory. However, some data sets, such as the Chinese TDS, provided mean leadconcentrations only, so it was not possible to determine maximum concentrationsfor every data set. Thus, data contributing high concentrations to the countrymean could not be included in the evaluation of the maximum concentrations.Each category contains a number of foods with similar characteristics (e.g. bakedgoods, muscle meats). The miscellaneous category includes beverages, foodsupplements, infant formula, tap and bottled water and other foods for specialdietary purposes, as well as foods that did not fit in other categories. Within themiscellaneous category, generally the highest reported concentrations were forfoods for special dietary uses and not for beverages. Infant formula essentiallycontained no detectable lead. EFSA reported that breast milk contained highlyvariable levels of lead. Sugar and sugar products and animal and vegetable fatsrarely contained detectable levels of lead. Food categories with the highestfrequency of detectable lead include meat, especially offal, organ meats and wildgame, shellfish (particularly bivalves), cocoa, tea, cereal grains and cereal products,and vegetables.
474 LEAD (addendum)
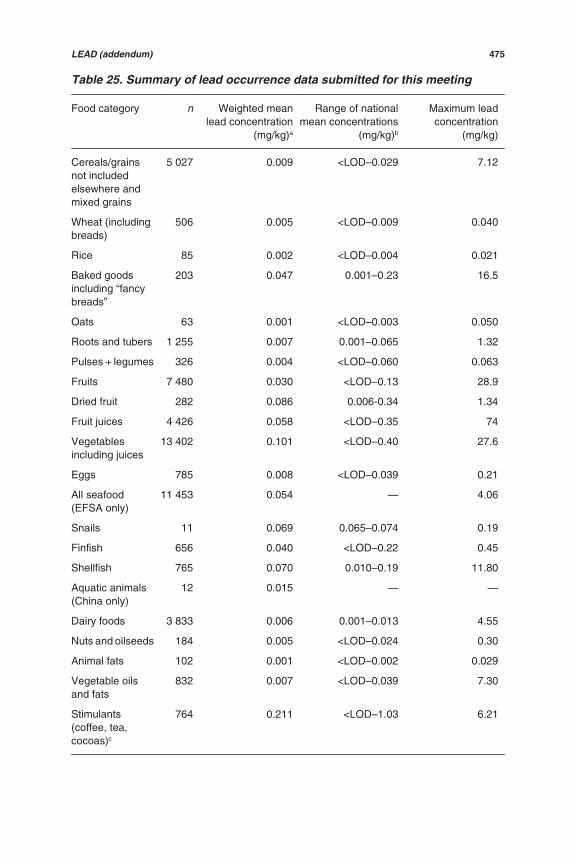
Table 25. Summary of lead occurrence data submitted for this meeting
Food category n Weighted meanlead concentration
(mg/kg)a
Range of nationalmean concentrations
(mg/kg)b
Maximum leadconcentration
(mg/kg)
Cereals/grainsnot includedelsewhere andmixed grains
5 027 0.009 <LOD–0.029 7.12
Wheat (includingbreads)
506 0.005 <LOD–0.009 0.040
Rice 85 0.002 <LOD–0.004 0.021
Baked goodsincluding “fancybreads”
203 0.047 0.001–0.23 16.5
Oats 63 0.001 <LOD–0.003 0.050
Roots and tubers 1 255 0.007 0.001–0.065 1.32
Pulses + legumes 326 0.004 <LOD–0.060 0.063
Fruits 7 480 0.030 <LOD–0.13 28.9
Dried fruit 282 0.086 0.006-0.34 1.34
Fruit juices 4 426 0.058 <LOD–0.35 74
Vegetablesincluding juices
13 402 0.101 <LOD–0.40 27.6
Eggs 785 0.008 <LOD–0.039 0.21
All seafood(EFSA only)
11 453 0.054 — 4.06
Snails 11 0.069 0.065–0.074 0.19
Finfish 656 0.040 <LOD–0.22 0.45
Shellfish 765 0.070 0.010–0.19 11.80
Aquatic animals(China only)
12 0.015 — —
Dairy foods 3 833 0.006 0.001–0.013 4.55
Nuts and oilseeds 184 0.005 <LOD–0.024 0.30
Animal fats 102 0.001 <LOD–0.002 0.029
Vegetable oilsand fats
832 0.007 <LOD–0.039 7.30
Stimulants(coffee, tea,cocoas)c
764 0.211 <LOD–1.03 6.21
LEAD (addendum) 475

9.8 Food consumption and dietary exposure assessment
The Committee obtained estimates of exposure to lead based on TDSs fornine countries (Australia, Canada, Chile, China, France, Lebanon, New Zealand,the United Kingdom and the USA) or from other evaluations that had consideredlevels in foods as consumed (Egypt, India and EFSA). EFSA conductedassessments for 19 European countries, and those are presented together.
Table 25 (contd)
Food category n Weighted meanlead concentration
(mg/kg)a
Range of nationalmean concentrations
(mg/kg)b
Maximum leadconcentration
(mg/kg)
Sugar and honey 1 962 0.032 <LOD–0.082 4.10
Spices 86 0.027 <LOD–0.11 0.44
Alcoholic beverages 2 304 0.070 <LOD–0.38 5.80
Cocoa & chocolate &productsc
206 0.692 <LOD–0.69 45.4
Cocoa butter 34 <LOD <LOD <LOD
Muscle meatexcluding poultry
1 817 0.047 0.0001–0.013 1.36
Meat not includedelsewhere
131 0.420 0.22–0.25 10.10
Organ meats exceptkidney
102 0.140 0.10–0.18 1.44
Muscle meat andpoultry combined
40313
0.134 0.004–0.25 867
Muscle minced 69 0.001 0.001 0.078
Kidney 537 0.067 0.013–0.14 1.24
Muscle poultry 1 589 0.098 0.003–0.021 0.075
Offal 73 0.018 0.006–0.042 0.008
Miscellaneous 9 224 0.035 <LOD–0.20 155
Total 110899
— — —
a The means were weighted to adjust for different numbers of samples for foods within acategory.
b Range includes means from the 2007 Chinese TDS and the 20th Australian TDS; maximumlead values were not available from the Chinese TDS and the 20th Australian TDS.
c In some cases, cocoas were included in a stimulants category, and in others, they wereseparately categorized.
476 LEAD (addendum)

The guidelines for conducting exposure assessments for contaminants infoods recommend that dietary exposure estimates should be calculated usingregional average contaminant concentration data and the GEMS/Food con-sumption cluster diets. The WHO GEMS/Food consumption cluster diets containlimited information on the forms of the foods that are considered. Dietary exposureestimates were available to the Committee for 28 countries, mostly based on foodas consumed. Lead is taken up from soil into food crops, and the sources of lead infood may also include soil remaining in or on the food, atmospheric deposition,water, contact with lead-containing processing equipment and packaging. It isimportant to estimate lead levels in food that is as close as possible to the form ofthe food that is consumed, as levels in raw agricultural commodities do notnecessarily reflect levels in foods as they are consumed. The Committee concludedthat the submitted data reflected lead exposures in foods as consumed and weremore appropriate than the GEMS/Food consumption cluster diets for use in leadassessments. Limited information was available describing lead levels in foods orestimating dietary exposures in developing countries.
The Committee included estimates of children’s exposure whereverpossible. The GEMS/Food consumption cluster diets do not include estimates ofchildren’s consumption. Estimates of children’s exposure were available for 19European countries (in the EFSA assessment) and for Australia, Canada, China,New Zealand and the USA. Where exposure assessments were available for theadult population but not for children, the Committee assumed that children’sexposure would be 2–3 times that of the general population on a body weight basis,based on the general observation that children consume 2–3 times more food thanadults relative to their body weight, and included those values in this report.
Estimates of dietary exposure for individual countries are presented below.Each region/country made its own decisions as to the appropriate matching of foodlead levels to food consumption data and also in the treatment of samples withoutdetectable lead levels.
The Committee selected a representative dietary exposure value for eachcountry in order to allow comparisons across countries and across regions for thetotal/adult population (see Table 19 in section 7.3.14 above) and for children (seeTable 20 in section 7.3.14 above). Unfortunately, estimates for the same populationsubgroup were not always available. In particular, estimates were provided fordifferent age groups by different countries. The Committee selected subgroups thatwere as similar as possible for comparison purposes. In order to improvecomparability, the Committee adjusted some data by standard body weightassumptions. For the total/adult population, mean exposures ranged from 0.02 to3 μg/kg bw per day (see Table 19). Some of the countries also provided estimatesof high exposure for consumers. The definition of a consumer with high exposureranged from the 90th to 97.5th percentile for the population, depending on thecountry. The estimated high exposures ranged from 0.06 to 2.43 μg/kg bw per day(see Table 19). Children’s mean exposures ranged from 0.03 to 9 μg/kg bw per day(see Table 20). Some countries also provided estimates of high exposures forchildren. The definition of a consumer with high exposure ranged from the 90th to97.5th percentile exposures for children. The estimated exposures for children who
LEAD (addendum) 477
were defined by the country as consumers with high exposure ranged from 0.2 to8.2 μg/kg bw per day (see Table 20).
9.8.1 Food category contributions to exposure
The most important contributors to overall dietary exposure were reportedby some countries. EFSA evaluated the categories of foods contributing most toexposure and reported large differences between countries. EFSA reported that
the largest contributors to the calculated overall lead exposure are vegetables, nuts andpulses contributing 19 % to the lower bound and 14 % to the upper bound estimates.Cereals and cereal products contributed 13 % to the lower bound and 14 % to the upperbound. For the lower bound miscellaneous products and food for special usescontributed 12 %, starchy roots and potatoes 8%, meat and meat products 8 %, alcoholicbeverages 7 % and milk and dairy products 6 %. For the upper bound the contributionswere: juices, soft drinks and bottled water (11 %), alcoholic beverages (9%) meat andmeat products including offal (9 %), milk and dairy products (8 %), miscellaneousproducts and food for special uses (7 %) and starchy roots and potatoes (6 %).
Milk and milk products, fruits, breads and sugars contributed most to thedietary exposure in a published Chilean TDS. In the 2007 Chinese TDS, the foodcategories making the largest contributions were cereals (34%) and vegetables(21%). The Lebanese TDS included water and food, water contributing the most toexposure. The foods contributing most to Lebanese exposure were bread and toast,fruits, pizza and pies, and vegetables (raw and cooked). In the New Zealand TDS,grains contributed 24–27% of dietary lead for adults and 36–39% for children.Chicken, eggs, fish and meat contributed 12–16% of adult dietary lead, andtakeaways contributed 9–24%; for children, the corresponding contributions were7–12% and 10–15%. New Zealand also identified the main food groups contributingto weekly dietary exposure to lead for infants: grains (18%), chicken, eggs, fish andmeat (4%), takeaways (6%), fruit (18%) and infant formula and weaning foods(38%).
The relative contribution of diet to total lead exposure is not well known butwill probably vary depending upon locale and the contribution from non-dietarysources. Estimates from EFSA suggest that at least half of children’s exposure maybe due to non-dietary sources of exposure and that soil and dust are majorcontributors to the non-dietary exposures.
9.8.2 Temporal changes in estimates of dietary exposure to lead since the 1980s
Lead levels in foods have declined over time in many developed countries.The Committee had access to data from five countries (Canada, France, NewZealand, the United Kingdom and the USA) that allowed the trends in lead exposureto be estimated. New Zealand reported changes in dietary exposure to lead since1982 in its 2003–2004 TDS report. Lead exposure estimates for 19- to 24-year-oldmales were 3.6 μg/kg bw per day in 1982 and 0.13 μg/kg bw per day in 2003–2004.This represents an apparent decline in exposure to lead of approximately 75%.Dietary exposure estimates for the general population in the United Kingdomdeclined by approximately 95% between 1980 and 2006, from 0.12 mg/day
478 LEAD (addendum)

estimated in the 1980 TDS to 0.006 mg/day in the 2006 TDS. Canada and Francehave also reported a 50% decline in exposure to lead over the past 10–15 years.The USA reported declines in lead exposure for all age groups, with the greatestdecline in teenage males (from 70 μg/day in 1976 to 3.45 μg/day in 2000). Duringthe time periods reported by these countries, there were changes in the food supplythat likely contributed to actual declines in dietary exposures. However, some of theapparent decline in exposure may actually be due to improved sensitivity of theanalytical methods and the corresponding selection of less conservative values forthose samples without detectable levels of lead.
9.9 Dose–response analysis
The dose–response modelling for blood lead levels and children’s IQ isbased on estimates in the Lanphear et al. (2005) pooled analysis, which includesseveral newer studies that were not included in the meta-analysis used by theCommittee at its fifty-third meeting (Annex 1, reference 143). The Lanphear et al.(2005) analysis included 1333 children enrolled in seven longitudinal cohort studiesconducted in the USA, Mexico, Kosovo and Australia, who were followed from birthor early infancy to 5–10 years of age. In this analysis, use of a log-linear modelproduced an estimated IQ decline of 6.9 points in concurrent blood lead level overa range of 2.4–30 μg/dl. The slope of the inverse association between IQ andconcurrent blood lead level was steeper among children with a maximum observed(at any time point) blood lead level below 7.5 μg/dl than it was among children witha maximum blood lead level of 7.5 μg/dl or higher. After initial consideration of sixdifferent dose–response models, the bilinear and Hill models were selected for usein characterizing the dose–response relationship between blood lead level and IQbecause they provided the best fit.
The relationship between blood lead levels and dietary exposure to lead wasestimated to be between 0.052 and 0.16 μg/dl of lead in blood per 1 μg/day of dietarylead exposure. This range was based on toxicokinetic analyses of data on Scottishinfants exposed to lead in drinking-water. These analyses were used by theCommittee previously.
Dietary exposures associated with a range of decreases in IQ (i.e. 0.5–3 IQpoints) were calculated by combining the dose–response models with thetoxicokinetic data, using a Monte Carlo simulation. The resulting CIs reflect theuncertainties in both the dose–response modelling of blood lead levels and theextrapolation to dietary exposure. When the outputs from the Monte Carlosimulation of the alternative bilinear and Hill models were combined, the chronicdietary exposure corresponding to a decrease of 1 IQ point was estimated to be 30μg of lead per day, with a 5th to 95th percentile CI ranging from 4 to 208 μg/day(see Table 22 in section 8.3.2 above). This is equivalent to 1.5 μg/kg bw per day(5th to 95th percentiles 0.2–10.4 μg/kg bw per day) for a 20 kg child.
Although the combined outputs of the bilinear and Hill models provide a morecomplete accounting of the uncertainties associated with the dose–responserelationship of lead and IQ, the bilinear model may be more useful in circumstanceswhere other, non-dietary exposures are highly variable or unknown, because the
LEAD (addendum) 479

incremental effect of any given lead source/exposure is theoretically independentof other exposures (i.e. the impact of a given dietary exposure will be about thesame, regardless of other exposures). Using the bilinear model alone, the chronicdietary exposure corresponding to a decrease of 1 IQ point was estimated to be 12μg/day, with a 5th to 95th percentile CI ranging from 4 to 145 μg/day (see Table 23in section 8.3.2 above). This is equivalent to 0.6 μg/kg bw per day (5th to 95thpercentiles 0.2–7.2 μg/kg bw per day) for a 20 kg child. The Committee decided touse the results of the bilinear model in its evaluation because it represents a moreconservative approach at low doses and allows non-dietary sources of exposure tobe considered independently. However, application of the results of the combinedmodel outputs might be more appropriate in situations where non-dietary exposureis minimal.
For adults, increased systolic blood pressure was selected as the mostsensitive end-point. A linear slope relating increases in systolic blood pressure asa function of blood lead level was derived by averaging the estimates from fourdifferent studies: 0.28 mmHg (0.037 kPa) per 1 μg/dl (5th to 95th percentiles 0.03–0.53 mmHg [0.004–0.071 kPa] per μg/dl). Blood lead levels were converted todietary exposures using the range of values previously used by the Committee foradults (blood lead level 0.023–0.07 μg/dl per 1 μg/day of dietary lead exposure).Dietary exposure corresponding to an increase in systolic blood pressure of 1 mmHg(0.1333 kPa) was estimated to be 80 (5th to 95th percentiles 34–1700) μg/day, orabout 1.3 (5th to 95th percentiles 0.6–28) μg/kg bw per day. As the relationship islinear, the increases in blood pressure associated with other dietary exposures areproportional. Published studies used by WHO in estimating the global burden ofdisease attributable to lead indicate that relative risks of ischaemic heart diseaseand cerebrovascular stroke associated with small increases in blood pressure (0.4–3.7 mmHg [0.053–0.49 kPa] systolic blood pressure) have been estimated to be inthe range of 1.01–1.4, with higher relative risks at younger ages.
10. EVALUATION
Exposure to lead is associated with a wide range of effects, including variousneurodevelopmental effects, mortality (mainly due to cardiovascular diseases),impaired renal function, hypertension, impaired fertility and adverse pregnancyoutcomes. Impaired neurodevelopment in children is generally associated withlower blood lead concentrations than the other effects, the weight of evidence isgreater for neurodevelopmental effects than for other health effects and the resultsacross studies are more consistent than those for other effects. For adults, theadverse effect associated with lowest blood lead concentrations for which the weightof evidence is greatest and most consistent is a lead-associated increase in systolicblood pressure. Therefore, the Committee concluded that the effects on neuro-development and systolic blood pressure provided the appropriate bases for dose–response analyses.
Based on the dose–response analyses, the Committee estimated that thepreviously established PTWI of 25 μg/kg bw is associated with a decrease of at least3 IQ points in children and an increase in systolic blood pressure of approximately
480 LEAD (addendum)

3 mmHg (0.4 kPa) in adults. These changes are important when viewed as a shiftin the distribution of IQ or blood pressure within a population. The Committeetherefore concluded that the PTWI could no longer be considered health protective,and it was withdrawn.
Because the dose–response analyses do not provide any indication of athreshold for the key effects of lead, the Committee concluded that it was notpossible to establish a new PTWI that would be considered to be health protective.The dose–response analyses conducted by the Committee should be used toidentify the magnitude of effect associated with identified levels of dietary leadexposure in different populations.
The Committee reaffirmed that because of the neurodevelopmental effects,fetuses, infants and children are the subgroups that are most sensitive to lead. Themean dietary exposure estimates for children aged about 1–4 years range from0.03 to 9 μg/kg bw per day. The health impact at the lower end of this range isconsidered negligible by the Committee, because it is below the exposure level of0.3 μg/kg bw per day calculated to be associated with a population decrease of0.5 IQ point. The higher end of the exposure range is higher than the level of1.9 μg/kg bw per day calculated to be associated with a population decrease of3 IQ points, which is deemed by the Committee to be a concern. For adults, themean dietary lead exposure estimates range from 0.02 to 3 μg/kg bw per day. Thelower end of this range (0.02 μg/kg bw per day) is considerably below the exposurelevel of 1.2 μg/kg bw per day calculated by the Committee to be associated with apopulation increase in systolic blood pressure of 1 mmHg (0.1333 kPa). TheCommittee considered that any health risk that would be expected to occur at thisexposure level is negligible. At the higher end of the range (3 μg/kg bw per day), apopulation increase of approximately 2 mmHg (0.3 kPa) in systolic blood pressurewould be expected to occur. An increase of this magnitude has been associated, ina large meta-analysis, with modest increases in the risks of ischaemic heart diseaseand cerebrovascular stroke.
The Committee considered this to be of some concern, but less than that forthe neurodevelopmental effects observed in children.
The Committee stressed that these estimates are based on dietary exposure(mainly food) and that other sources of exposure to lead also need to be considered.The Committee concluded that, in populations with prolonged dietary exposures tolead that are at the higher end of the ranges identified above, measures should betaken to identify major contributing sources and foods and, if appropriate, to identifymethods of reducing dietary exposure that are commensurate with the level of riskreduction.
LEAD (addendum) 481

11. REFERENCES
Alatise Ol , Schrauzer GN (2010). Lead exposure. A contributing cause of the current breastcancer epidemic in Nigerian women. Biological Trace Element Research, 136(2):127–139.
Albalak R et al. (2003). Blood lead levels and risk factors for lead poisoning among childrenin Jakarta, Indonesia. Science of the Total Environment, 301:75–85.
Alexander FW, Clayton BE, Delves HT (1974). Mineral and trace-metal balances in childrenreceiving normal and synthetic diets. Quarterly Journal of Medicine, 43:89–111.
Alimonti A et al. (2005). Assessment of reference values for selected elements in a healthyurban population. Annali dell’Istituto superiore di sanità, 41(2):181–187.
Apostoli P et al. (1998). Male reproductive toxicity of lead in animals and humans.Occupational and Environmental Medicine, 55:364–374.
Arora M et al. (2009). Cumulative lead exposure and tooth loss in men: the Normative AgingStudy. Environmental Health Perspectives, 117:1531–1534.
ATSDR (2007). Toxicological profile for lead. Atlanta, GA, USA, United States Departmentof Health and Human Services, Agency for Toxic Substances and Disease Registry,pp. 1–582.
Aungst BJ, Dolce JA, Fung HL (1981). The effect of dose on the disposition of lead in rats afterintravenous and oral administration. Toxicology and Applied Pharmacology, 61:48–57.
Bakkali K et al. (2009). Characterization of trace metals in vegetables by graphite furnaceatomic absorption spectrometry after closed vessel microwave digestion. FoodChemistry, 116(2):590–594.
Bandeen-Roche K et al. (2009). Cumulative lead dose and cognitive function in older adults.Epidemiology, 20:831–839.
Bannon DI et al. (2003). Effect of DMT1 knockdown on iron, cadmium, and lead uptake inCaco-2 cells. American Journal of Physiology. Cell Physiology, 284:C44–C50.
Bárány E et al. (2005). Iron status influences trace element levels in human blood and serum.Environmental Research, 98:215–223.
Barry PSI (1975). Comparison of concentrations of lead in human tissues. British Journal ofIndustrial Medicine, 32:119–139.
Barton JC et al. (1978). Effects of iron on the absorption and retention of lead. Journal ofLaboratory and Clinical Medicine, 92:536–547.
Bazzi A, Nriagu JO, Linder AM (2008). Determination of toxic and essential elements inchildren’s blood with inductively coupled plasma–mass spectrometry. Journal ofEnvironmental Monitoring, 10(10):1226–1232.
Bellinger DC (2004). What is an adverse effect? A possible resolution of clinical andepidemiological perspectives on neurobehavioral toxicity. Environmental Research,95:394–405.
Bellinger DC (2005). Teratogen update: lead and pregnancy. Birth Defects Research. PartA, Clinical and Molecular Teratology, 73(6):409–420.
Bellinger D et al. (1994). Pre- and post-natal lead exposure and behavior problems in school-aged children. Environmental Research, 66:12–30.
Bergdahl IA (2006). Response to, “What is the meaning of non-linear dose–responserelationships between blood lead concentration and IQ?” Neurotoxicology, 27:1125.
Bergdahl IA (2007). Another fundamental error in “What is the meaning of non-linear dose–response relationships between blood lead concentration and IQ” became obvious in theauthors’ response to comments. Neurotoxicology, 26:705–706.
Berkowitz GS et al. (2004). Prospective study of blood and tibia lead in women undergoingsurgical menopause. Environmental Health Perspectives, 112:1673–1678.
Beyersmann D, Hartwig A (2008). Carcinogenic metal compounds: recent insight intomolecular and cellular mechanisms. Archives of Toxicology, 82:493–512.
482 LEAD (addendum)

Bezerra MA et al. (2007). On-line system for preconcentration and determination of metals invegetables by inductively coupled plasma optical emission spectrometry. Journal ofHazardous Materials, 148(1–2):334–339.
Bhatti P et al. (2009). Lead exposure, polymorphisms in genes related to oxidative stress, andrisk of adult brain tumors. Cancer Epidemiology, Biomarkers & Prevention, 18:1841–1848.
Bizarro P et al. (2003). Ultrastructural modifications in the mitochondrion of mouse Sertoli cellsafter inhalation of lead, cadmium or lead–cadmium mixture. Reproductive Toxicology,17:561–566.
Blake KCH, Mann M (1983). Effect of calcium and phosphorus on the gastrointestinalabsorption of Pb-203 in man. Environmental Research, 30:188–194.
Blake KCH, Barbezat GO, Mann M (1983). Effect of dietary constituents on the gastrointestinalabsorption of Pb-203 in man. Environmental Research, 30:182–187.
Bleecker ML et al. (2007a). The association of lead exposure and motor performance mediatedby cerebral white matter change. Neurotoxicology, 28:318–323.
Bleecker ML et al. (2007b). Impact of cognitive reserve on the relationship of lead exposureand neurobehavioral performance. Neurology, 69:470–476.
Bocca B et al. (2005). Development of methods for the quantification of essential and toxicelements in human biomonitoring. Annali dell’Istituto superiore di sanità, 41(2):165–170.
Borja-Aburto VH et al. (1999). Blood lead levels measured prospectively and risk ofspontaneous abortion. American Journal of Epidemiology, 150(6):590–597.
Bouchard MF et al. (2009). Blood lead levels and major depressive disorder, panic disorder,and generalized anxiety disorder in US young adults. Archives of General Psychiatry,66:1313–1319.
Bound J et al. (1997). Involvement of deprivation and environmental lead in neural tubedefects: a matched case–control study. Archives of Disease in Childhood, 76:107–112.
Bowers TS, Beck BD (2006). What is the meaning of non-linear dose–response relationshipsbetween blood lead concentration and IQ? Neurotoxicology, 27:520–524.
Bowers TS, Beck BD (2007). Response to second comment by Bergdahl on “What is themeaning of non-linear dose–response relationships between blood lead concentration andIQ?” Neurotoxicology, 26:706.
Braun J et al. (2006). Exposures to environmental toxicants and attention deficit hyperactivitydisorder in US children. Environmental Health Perspectives, 114:1904–1909.
Braun J et al. (2008). Association of environmental toxicants and conduct disorder in U.S.children: NHANES 2001–2004. Environmental Health Perspectives, 116:956–962.
Brubaker CJ et al. (2009). Altered myelination and axonal integrity in adults with childhoodlead exposure: a diffusion tensor imaging study. Neurotoxicology, 30:867–875.
Brubaker CJ et al. (2010). The influence of age of lead exposure on adult gray matter volume.Neurotoxicology, 31(3):259–266.
Budtz-Jørgensen E (2010). An international pooled analysis for obtaining a benchmark dosefor environmental lead exposure in children. Scientific/technical report submitted to theEuropean Food Safety Authority (http://www.efsa.europa.eu/en/scdocs/scdoc/47e.htm).
Byers RK, Lord EE (1943). Late effects of lead poisoning on mental development. AmericanJournal of Diseases of Children, 66:471–494.
Caffo B et al. (2007). Are brain volumes based on magnetic resonance imaging mediators ofthe associations of cumulative lead dose with cognitive function? American Journal ofEpidemiology, 167:429–437.
Calisir F, Akamn S (2007). Survey of lead and copper in Turkish raisins. Food Additives andContaminants, 24(9):960–968.
Campbell JR, Moss ME, Raubertas RF (2000). The association between caries and childhoodlead exposure. Environmental Health Perspectives, 70:409–414.
Carbone R et al. (1998). Maternal and neonatal lead exposure in southern Italy. Biology of theNeonate, 73:362–366.
LEAD (addendum) 483

Carmignani M et al. (2000). Catecholamine and nitric oxide systems as targets of chronic leadexposure in inducing selective functional impairment. Life Sciences, 68(4):401–415.
Cecil KM et al. (2008). Decreased brain volume in adults with childhood lead exposure. PLoSMedicine, 5:e112.
Cervantes MC et al. (2005). Lead exposure alters the development of agonistic behavior ingolden hamsters. Developmental Psychobiology, 47:158–165.
Chamberlain AC (1983). Fallout of lead and uptake by crops. Atmospheric Environment,17:693–706.
Chandramouli L et al. (2009). Effects of early childhood lead exposure on academicperformance and behaviour of school age children. Archives of Diseases in Childhood,94:844–848.
Chen A et al. (2006) The effect of chelation on blood pressure in lead-exposed children: arandomized study. Environmental Health Perspectives, 114:579–583.
Chen H et al. (2008). Direct determination of Cd and Pb in gel forming konjac samples byenzymatic hydrolysis assisted slurry sampling graphite furnace atomic absorptionspectrometry. Microchimica Acta, 162:133–139.
Cheng Y et al. (1998). Relation of nutrition to bone lead and blood lead levels in middle-agedto elderly men. The Normative Aging Study. American Journal of Epidemiology,147:1147–1174.
Chia S-E, Yap E, Chia K-S (2004). -Aminolevulinic acid dehydratase (ALAD) polymorphismand susceptibility of workers exposed to inorganic lead and its effects on neurobehavioralfunctions. Neurotoxicology, 25:1041–1047.
Chia S-E et al. (2007a). Association of blood lead and homocysteine levels among leadexposed subjects in Vietnam and Singapore. Occupational and Environmental Medicine,64:688–693.
Chia S-E et al. (2007b). Possibilities of newer ALAD polymorphism influencing humansusceptibility to effects of inorganic lead on the neurobehavioral functions.Neurotoxicology, 28:312–317.
China (2010). Chinese Total Diet Study (2007). Data submitted to FAO/WHO.Chiodo LM, Jacobson SW, Jacobson JL (2004). Neurodevelopmental effects of postnatal lead
exposure at very low levels. Neurotoxicology and Teratology, 26:359–371.Citak D, Tuzen M, Soylak M (2009). Simultaneous coprecipitation of lead, cobalt, copper,
cadmium, iron and nickel in food samples with zirconium(IV) hydroxide prior to their flameatomic absorption spectrometric determination. Food and Chemical Toxicology, 47(9):2302–2307.
Cubadda F, Raggi A (2005). Determination of cadmium, lead, iron, nickel and chromium inselected food matrices by plasma spectrometric techniques. Microchemical Journal,79:91–96.
Da-Col JA, Domene SMA, Pereira-Filho ER (2009). Fast determination of Cd, Fe, Pb, and Znin food using AAS. Food Analytical Methods, 2:110–115.
Daftsis EJ, Zachariadis GA (2007). Analytical performance of ETAAS method for Cd, Co, Crand Pb determination in blood fractions samples. Talanta, 71:722–730.
De Burbure C et al. (2006). Renal and neurological effects of cadmium, lead, mercury, andarsenic in children: evidence of early effects and multiple interactions at environmentalexposure levels. Environmental Health Perspectives, 115:584–590.
Denham M et al. (2005). Relationship of lead, mercury, mirex, dichlorodiphenyldichloro-ethylene, hexachlorobenzene, and polychlorinated biphenyls to timing of menarche amongAkwesasne Mohawk girls. Pediatrics, 115:e127–134.
Denno D (1993). Considering lead poisoning as a criminal defense. Fordham Urban LawJournal, 20:377–400.
484 LEAD (addendum)

Detcheva A, Grobecker KH (2006). Determination of Hg, Cd, Mn, Pb and Sn in seafood bysolid sampling Zeeman atomic absorption spectrometry. Spectrochimica Acta. Part B:Atomic Spectroscopy, 61:454–459.
Dietert RR et al. (2004). Developmental immunotoxicology of lead. Toxicology and AppliedPharmacology, 198(2):86–94.
Dietrich KN et al. (2001). Early exposure to lead and juvenile delinquency. Neurotoxicologyand Teratology, 23(6):511–518.
D’Llio S et al. (2008). Method validation for determination of arsenic, cadmium, chromium andlead in milk by means of dynamic reaction cell inductively coupled plasma massspectrometry. Analytica Chimica Acta, 624(1):59–67.
Dogu O et al. (2007). Elevated blood lead concentrations in essential tremor: a case–controlstudy in Mersin, Turkey. Environmental Health Perspectives, 115(11):1564–1568.
Drasch GA, Bohm J, Baur C (1987). Lead in human bones. Investigations on an occupationallynon-exposed population in southern Bavaria (F.R.G.). I. Adults. Science of the TotalEnvironment, 64:303–315.
EFSA (2010). Scientific opinion on lead in food. EFSA Panel on Contaminants in the FoodChain (CONTAM), European Food Safety Authority, Parma, Italy. EFSA Journal, 8(4):1570(http://www.efsa.europa.eu/en/scdocs/doc/1570.pdf).
El-Said KF et al. (2008). Chronic occupational exposure to lead and its impact on oral health.Journal of the Egyptian Public Health Association, 83:451–466.
Ettinger AS et al. (2006). Influence of maternal bone lead burden and calcium intake on levelsof lead in breast milk over the course of lactation. American Journal of Epidemiology,163:48–56.
Factor-Litvak P et al. (1993). Increased risk of proteinuria among a cohort of lead-exposedpregnant women. Environmental Health Perspectives, 101:418–421.
Factor-Litvak P et al. (1996). Blood lead and blood pressure in young children.Epidemiology, 7:633–637.
Fadrowski JJ et al. (2010). Blood lead level and kidney function in US adolescents. Archivesof Internal Medicine, 170:75–82.
Fang F et al. (2010). Association between blood lead and the risk of amyotrophic lateralsclerosis. American Journal of Epidemiology, 171:1126–1133.
FAO/WHO (2004a). General guidelines on sampling. Rome, Italy, Food and AgricultureOrganization of the United Nations and World Health Organization, Joint FAO/WHO FoodStandards Programme, Codex Alimentarius Commission, 69 pp. (CAC/GL 50-2004; http://www.codexalimentarius.net/download/standards/10141/CXG_050e.pdf).
FAO/WHO (2004b). Code of practice for the prevention and reduction of lead contaminationin foods. Rome, Italy, Food and Agriculture Organization of the United Nations and WorldHealth Organization, Joint FAO/WHO Food Standards Programme, Codex AlimentariusCommission, 5 pp. (CAC/RCP 56-2004; http://www.codexalimentarius.net/download/standards/10099/CXC_056_2004e.pdf;jsessionid=25175BA7DF311AE7532E4E84FD575088).
Farrer DG et al. (2008). Reduction of myeloid suppressor cell derived nitric oxide provides amechanistic basis of lead enhancement of alloreactive cd4+ T cell proliferation. Toxicologyand Applied Pharmacology, 229(2):135–145.
Fergusson DM, Boden JM, Horwood LJ (2008). Dentine lead levels in childhood and criminalbehaviour in late adolescence and early adulthood. Journal of Epidemiology andCommunity Health, 62:1045–1050.
Fewtrell L, Kaufmann R, Pruss-Ustun A (2003). Lead. Assessing the environmental burden ofdisease at national and local levels. Geneva, Switzerland, World Health Organization(Environmental Burden of Disease Series, No. 2).
Fleming DE et al. (1997). Accumulated body burden and endogenous release of lead inemployees of a lead smelter. Environmental Health Perspectives, 105:224–233.
LEAD (addendum) 485

Forbes GB, Reina JC (1972). Effect of age on gastrointestinal absorption (Fe, Sr, Pb) in therat. Journal of Nutrition, 102:647–652.
Franklin CA et al. (1997). Use of sequentially administered stable lead isotopes to investigatechanges in blood lead during pregnancy in a nonhuman primate (Macaca fascicularis).Fundamental and Applied Toxicology, 39:109–119.
Froehlich TE et al. (2009). Association of tobacco and lead exposures with attention-deficithyperactivity disorder. Pediatrics, 124:e1054–1063.
FSANZ (2001). 19th Australian Total Diet Study. Canberra, Australia, Food StandardsAustralia New Zealand (http://210.9.231.45/scienceandeducation/monitoringandsurveillance/australiantotaldiets1914.cfm).
FSANZ (2003). 20th Australian Total Diet Study. Canberra, Australia, Food StandardsAustralia New Zealand (http://210.9.231.45/scienceandeducation/monitoringandsurveillance/australiantotaldiets1914.cfm).
Gautam P, Flora SJ (2010). Oral supplementation of gossypin during lead exposure protectsalteration in heme synthesis pathway and brain oxidative stress in rats. Nutrition, 26(5):563–570.
Gemmel A et al. (2002). Blood lead level and dental caries in school-age children.Environmental Health Perspectives, 110:625–630.
Gerr F et al. (2002). Association between bone lead concentration and blood pressure amongyoung adults. American Journal of Industrial Medicine, 42:98–106.
Ghaedi M et al. (2009). Flame atomic absorption spectrometric determination of zinc, nickel,iron and lead in different matrixes after solid phase extraction on sodium dodecyl sulfate(SDS)-coated alumina as their bis (2-hydroxyacetophenone)-1,3-propanediimine chelates.Journal of Hazardous Materials, 166:1441–1448.
Glass TA et al. (2009). Neighborhood psychosocial hazards and the association of cumulativelead dose with cognitive function in older adults. American Journal of Epidemiology,169:683–692.
Glenn BS et al. (2003). The longitudinal association of lead with blood pressure.Epidemiology, 14:30–36.
Glenn BS et al. (2006). Changes in systolic blood pressure associated with lead in blood andbone. Epidemiology, 17(5):538–544.
Goering PL (1993). Lead–protein interactions as a basis for lead toxicity. Neurotoxicology,14:45–60.
Goering PL, Fowler BA (1985). Mechanism of renal lead-binding protein reversal of delta-aminolevulinic acid dehydratase inhibition by lead. Journal of Pharmacology andExperimental Therapeutics, 234:365–371.
Gonick HC et al. (1997). Lead-induced hypertension: interplay of nitric oxide and reactiveoxygen species. Hypertension, 30:1487–1492.
Goyer RA (1990). Transplacental transport of lead. Environmental Health Perspectives,89:101–105.
Graber LK et al. (2010). Childhood lead exposure after the phase-out of leaded gasoline: anecological study of school-age children in Kampala, Uganda. Environmental HealthPerspectives, 118(6):884–889.
Graziano JH et al. (1990). Determinants of elevated blood lead during pregnancy in apopulation surrounding a lead smelter in Kosovo, Yugoslavia. Environmental HealthPerspectives, 89:95–100.
Gulson B, Wilson D (1994). History of lead exposure in children revealed from isotopicanalyses of teeth. Archives of Environmental Health, 49:279–283.
Gulson BL, Palmer JM, Bryce A (2002). Changes in blood lead of a recreational shooter.Science of the Total Environment, 293:143–150.
Gulson BL et al. (1997). Dietary lead intakes for mother/child pairs and relevance topharmacokinetic models. Environmental Health Perspectives, 105:1334–1342.
486 LEAD (addendum)

Gulson BL et al. (1998a). Blood lead–urine relationships in adults and children. EnvironmentalResearch, 78:152–160.
Gulson BL et al. (1998b). Relationships of lead in breast milk to lead in blood, urine, and dietof the infant and mother. Environmental Health Perspectives, 106:667–674.
Gulson BL et al. (2003). Mobilization of lead from human bone tissue during pregnancy andlactation—a summary of long-term research. Science of the Total Environment,303:79–104.
Gulson BL et al. (2004). Blood lead changes during pregnancy and postpartum with calciumsupplementation. Environmental Health Perspectives, 112:1499–1507.
Gump BB et al. (2005). Prenatal and childhood blood lead levels and cardiovascularfunctioning in 9½ year old children. Neurotoxicology and Teratology, 27:655–665.
Gump BB et al. (2007). Blood lead (Pb) levels: a potential environmental mechanismexplaining the relation between socioeconomic status and cardiovascular reactivity inchildren. Health Psychology, 26:296–304.
Gump BB et al. (2008). Low-level prenatal and postnatal blood lead exposure andadrenocortical responses to acute stress in children. Environmental Health Perspectives,116:249–255.
Gump BB et al. (2009). Blood lead (Pb) levels: further evidence for an environmentalmechanism explaining the association between socioeconomic status and psychophysio-logical dysregulation in children. Health Psychology, 28:614–620.
Ha M et al. (2009). Low blood levels of lead and mercury and symptoms of attention deficithyperactivity in children: a report of the Children’s Health and Environment Research(CHEER). Neurotoxicology, 30:31–36.
Handley MA et al. (2007). Globalization, binational communities, and imported food risks:results of an outbreak investigation of lead poisoning in Monterey County, California.American Journal of Public Health, 97:900–906.
Hauser R et al. (2008). Association of blood lead levels with onset of puberty in Russian boys.Environmental Health Perspectives, 116:976–980.
He K, Wang S, Zhang J (2009). Blood lead levels of children and its trends in China. Scienceof the Total Environment, 407:3986–3993.
Health Canada (2010). Canadian Total Diet Study (1993–2010). Ottawa, Canada, HealthCanada (http://www.hc-sc.gc.ca/fn-an/surveill/total-diet/index-eng.php).
Heard MJ, Chamberlain AC (1982). Effect of minerals and food on uptake of lead from thegastrointestinal tract in humans. Human Toxicology, 1:411–415.
Heitland P, Köster HD (2006). Biomonitoring of 37 trace elements in blood samples frominhabitants of northern Germany by ICP-MS. Journal of Trace Elements in Medicine andBiology, 20:253–262.
Hernandez-Avila M et al. (2000). Determinants of blood lead levels across the menopausaltransition. Archives of Environmental Health, 55:355–360.
Hernandez-Avila M et al. (2002). Effect of maternal bone lead on length and headcircumference of newborns and 1-month-old infants. Archives of Environmental Health,57(5):482–488.
Hernandez-Avila M et al. (2003). Dietary calcium supplements to lower blood lead levels inlactating women: a randomized placebo-controlled trial. Epidemiology, 14:206–212.
Hertz-Picciotto I et al. (2000). Patterns and determinants of blood lead during pregnancy.American Journal of Epidemiology, 152:829–837.
Hornung R, Lanphear B, Dietrich K (2006). Response to “What is the meaning of non-lineardose–response relationships between blood lead concentration and IQ?”Neurotoxicology, 27:635.
Hsieh H-F et al. (2009). Lead determination in whole blood by laser ablation coupled withinductively coupled plasma mass spectrometry. Talanta, 79:183–188.
LEAD (addendum) 487

Hsieh TJ et al. (2009). Subclinical white matter integrity in subjects with cumulative leadexposure. Radiology, 252:509–517.
Hu H et al. (2007). The epidemiology of lead toxicity in adults: measuring dose andconsideration of other methodologic issues. Environmental Health Perspectives, 115:455–462.
Huo X et al. (2007). Elevated blood lead levels of children in Guiyu, an electronic wasterecycling town in China. Environmental Health Perspectives, 115:1113–1117.
Hursh JB, Suomela J (1968). Absorption of 212Pb from the gastrointestinal tract of man. ActaRadiologica: Therapy, Physics, Biology, 7:108–120.
Hursh JB et al. (1969). Fate of 212Pb inhaled by human subjects. Health Physics, 16:257–267.Hwang KY et al. (2001). Associations of lead exposure and dose measures with erythrocyte
protein kinase C activity in 212 current Korean lead workers. Toxicological Sciences,62:280–288.
IARC (2006). Inorganic and organic lead compounds. Lyon, France, International Agency forResearch on Cancer, p. 519 (IARC Monographs on the Evaluation of Carcinogenic Risksto Humans, Vol. 87).
Iawata T et al. (2005). Critical dose of lead affecting postural balance in workers. AmericanJournal of Industrial Medicine, 48:319–325.
IPCS (1995). Inorganic lead. Geneva, Switzerland, World Health Organization, InternationalProgramme on Chemical Safety (Environmental Health Criteria 165).
Jackson LW et al. (2004). Parental lead exposure and total anomalous pulmonary venousreturn. Birth Defects Research. Part A, Clinical and Molecular Teratology, 70:185–193.
James HM, Hilburn ME, Blair JA (1985). Effects of meals and meal times on uptake of leadfrom the gastrointestinal tract in humans. Human Toxicology, 4:401–407.
Jannat B et al. (2009). Simultaneous determination of lead, cadmium, copper and zinc in infantformula by anodic stripping voltammetry. Iranian Journal of Pharmaceutical Research,8(3):159–162.
Jellife-Pawlowski LL et al. (2006). Effect of magnitude and timing of maternal pregnancy bloodlead (Pb) levels on birth outcomes. Journal of Perinatology, 26:154–162.
Jemal A et al. (2002). The association of blood lead level and cancer mortality among whitesin the United States. Environmental Health Perspectives, 110:325–329.
Jhun HJ, Kim H, Paek DM (2005). The association between blood metal concentrations andheart rate variability: a cross-sectional study. International Archives of Occupational andEnvironmental Health, 78:243–247.
Julshamn K et al. (2007). Determination of arsenic, cadmium, mercury, and lead by inductivelycoupled plasma/mass spectrometry in foods after pressure digestion: NMKL1 inter-laboratory study. Journal of AOAC International, 90(3):844–856.
Jusko TA et al. (2006). Response to “What is the meaning of non-linear dose–responserelationships between blood lead concentration and IQ?” Neurotoxicology, 27:1123–1125.
Kales SN, Saper RB (2009). Ayervedic lead poisoning: an under-recognized internationalproblem. Indian Journal of Medical Sciences, 63:379–381.
Kamel F et al. (2002). Lead exposure and amyotrophic lateral sclerosis. Epidemiology,13:311–319.
Kamel F et al. (2008). Association of lead exposure with survival in amyotrophic lateralsclerosis. Environmental Health Perspectives, 116:943–947.
Karve M, Rajgor RV (2007). Solid phase extraction of lead on octadecyl bonded silicamembrane disk modified with Cyanex 302 and determination by flame atomic absorptionspectrometry. Journal of Hazardous Materials, 141:607–613.
Kehoe RA (1987). Studies of lead administration and elimination in adult volunteers undernatural and experimentally induced conditions over extended periods of time. Food andChemical Toxicology, 25: i–iv, 425–453.
488 LEAD (addendum)

Khalil N et al. (2009a). Association of cumulative lead and neurocognitive function in anoccupational cohort. Neuropsychology, 23:10–19.
Khalil N et al. (2009b). Association of blood lead concentration with mortality in older women:a prospective cohort study. Environmental Health, 8:15.
Kim R et al. (1996). A longitudinal study of low-level lead exposure and impairment of renalfunction. Journal of the American Medical Association, 275:1177–1181.
Kim Y et al. (2009). Co-exposure to environmental lead and manganese affects the intelligenceof school-aged children. Neurotoxicology, 30:564–571.
Kong MF, Chan S, Wong YC (2008). Proficiency testing program for the determination of totalarsenic, cadmium, and lead in seawater shrimp. Journal of AOAC International, 91(4):858–864.
Kordas K et al. (2006). Deficits in cognitive function and achievement in Mexican first-graderswith low blood lead concentrations. Environmental Research, 100:371–386.
Korn MGA et al. (2006). Separation and preconcentration procedures for the determination oflead using spectrometric techniques: a review. Talanta, 69:16–24.
Kostial K et al. (1978). Influence of age on metal metabolism and toxicity. Environmental HealthPerspectives, 25:81–86.
Koyashiki GAK et al. (2010). Lead levels in milk and blood from donors to the Breast Milk Bankin southern Brazil. Environmental Research, 110:265–271.
Kramer HJ, Gonick HC, Lu E (1986). In vitro inhibition of Na-K-ATPase by trace metals: relationto renal and cardiovascular damage. Nephron, 44:329–336.
Krieg EF, Chrislip DW, Brightwell WS (2008). A meta-analysis of studies investigating theeffects of lead exposure on nerve conduction. Archives of Toxicology, 82:531–542.
Krieg EF et al. (2009). Lead and cognitive function in ALAD genotypes in the third NationalHealth and Nutrition Examination Survey. Neurotoxicology and Teratology, 31:364–371.
Krieg EF et al. (2010). Lead and cognitive function in VDR genotypes in the third NationalHealth and Nutrition Examination Survey. Neurotoxicology and Teratology, 32:262–272.
Kummrow F et al. (2008). Biomonitoring method for the simultaneous determination ofcadmium and lead in whole blood by electrothermal atomic absorption spectrometry forassessment of environmental exposure. Talanta, 75:246–252.
Lacey RF, Moore MR, Richards WN (1985). Lean in water, infant diet and blood. The Glasgowduplicate diet study. Science of the Total Environment, 42:235–247.
Lagerkvist BJ et al. (1996). Increased blood lead and decreased calcium levels duringpregnancy: a prospective study of Swedish women living near a smelter. American Journalof Public Health, 86:1247–1252.
Lai L-H et al. (2008). Renal dysfunction and hyperuricemia with low blood lead levels andethnicity in community-based study. Science of the Total Environment, 401:39–43.
Lanphear BP et al. (2005). Low-level environmental lead exposure and children’s intellectualfunction: an international pooled analysis. Environmental Health Perspectives, 113:894–899.
Leblanc J-C et al. (2005). Dietary exposure estimates of 18 elements from the 1st French TotalDiet Study. Food Additives and Contaminants, 22(7):624–641.
Li W et al. (2003). Lead exposure potentiates predatory attack behavior in the cat.Environmental Research, 92:197–206.
Licata P et al. (2004). Levels of “toxic” and “essential” metals in samples of bovine milk fromvarious dairy farms in Calabria, Italy. Environment International, 30:1–6.
Lin CG et al. (2010). Pediatric lead exposure from imported Indian spices and cultural powders.Pediatrics, 125:e828–835.
Lin JL et al. (2003). Environmental lead exposure and progression of chronic renal diseasesin patients without diabetes. New England Journal of Medicine, 348:277–286.
Lin JL et al. (2006a). Low-level environmental exposure to lead and progressive chronic kidneydiseases. American Journal of Medicine, 119:707.e1–707.e9.
LEAD (addendum) 489

Lin JL et al. (2006b). Environmental exposure to lead and progressive diabetic nephropathyin patients with type II diabetes. Kidney International, 69:2049–2056.
Link B et al. (2007). Baden-Wuerttemberg Environmental Health Survey (BW-EHS) from 1996to 2003: toxic metals in blood and urine of children. International Journal of Hygiene andEnvironmental Health, 210(3–4):357–371.
Louis ED et al. (2003). Association between essential tremor and blood lead concentration.Environmental Health Perspectives, 111:1707–1711.
Lundstrom NG et al. (2006). Lung cancer development in primary smelter workers: a nestedcase–referent study. Journal of Occupational and Environmental Medicine, 48:376–380.
Lustberg M, Silbergeld EK (2002). Blood lead levels and mortality. Archives of InternalMedicine, 162:2443–2449.
Lynch R, Elledge B, Peters C (2008). An assessment of lead leachability from lead-glazedceramic cooking vessels. Journal of Environmental Health, 70:36–40.
Maddaloni M et al. (1998). Bioavailability of soilborne lead in adults, by stable isotope dilution.Environmental Health Perspectives, 106(Suppl. 6):1589–1594.
Maduabuchi CN et al. (2006). Lead and cadmium exposures from canned and non-cannedbeverages in Nigeria: a public health concern. Science of the Total Environment,366:621–626.
Magri J, Sammut M, Savona-Ventura C (2003). Lead and other metals in gestationalhypertension. International Journal of Gynaecology and Obstetrics, 83(1):29–36.
Mahaffey KR, Annest JL (1986). Association of erythrocyte protoporphyrin with blood leadlevel and iron status in the second National Health and Nutrition Examination Survey,1976–1980. Environmental Research, 41:327–338.
Mahaffey KR et al. (1982). Association between age, blood lead concentration, and serum1,25-dihydroxycholecalciferol levels in children. American Journal of Clinical Nutrition,35:1327–1331.
Maldonado-Vega M et al. (1996). Lead: intestinal absorption and bone mobilization duringlactation. Human & Experimental Toxicology, 15:872–877.
Manton WI et al. (2003). Release of lead from bone in pregnancy and lactation. EnvironmentalResearch, 92:139–151.
Manzoori JL, Amjadi M, Abdulhassani J (2009). Ultra-trace determination of lead in water andfood samples by using ionic liquid-based single drop microextraction–electrothermalatomic absorption spectrometry. Analytica Chimica Acta, 644:48–52.
Markovac J, Goldstein GW (1988). Picomolar concentrations of lead stimulate brain proteinkinase C. Nature, 334:71–73.
Martin D et al. (2006). Association of blood lead and tibia lead with blood pressure andhypertension in a community sample of older adults. American Journal of Epidemiology,163:467–478.
Martin MD et al. (2007). The association of dental caries with blood lead in children whenadjusted for IQ and neurobehavioral performance. Science of the Total Environment,377:159–164.
Melucci D, Torsi G, Locatelli C (2007). Analytical procedure for the simultaneous voltammetricdetermination of trace metals in food and environmental matrices. Critical comparison withatomic absorption spectroscopic measurements. Annali di Chimica, 97(3–4):141–151.
Menke A et al. (2006). Blood lead below 0.48 μmol/L (10 μg/dL) and mortality among US adults.Circulation, 114:1388–1394.
Milacic K, Kralj B (2003). Determination of Zn, Cu, Cd, Pb, Ni and Cr in some Slovenianfoodstuffs. European Food Research Technology, 217:211–214.
Miranda ML et al. (2007). The relationship between early childhood blood lead levels andperformance on end of grade tests. Environmental Health Perspectives, 115:1242–1247.
Miranda ML et al. (2009). Environmental contributors to the achievement gap. Neuro-toxicology, 30:1019–1024.
490 LEAD (addendum)

Moore CF et al. (2008). Developmental lead exposure induces tactile defensiveness in Rhesusmonkeys (Macaca mulatta). Environmental Health Perspectives, 116:1322–1326.
Moore MR et al. (1980). The percutaneous absorption of lead-203 in humans from cosmeticpreparations containing lead acetate, as assessed by whole-body counting and othertechniques. Food and Cosmetics Toxicology, 18:399–405.
Moreno-Rojas R et al. (2002). Lead content in Spanish market infant formulas and toxicologicalcontribution. Food Additives and Contaminants, 19(3):241–245.
Morrison JN, Quarterman J (1987). The relationship between iron status and lead absorptionin rats. Biological Trace Element Research, 14:115–126.
Morrow L et al. (2007). Past occupational exposure to lead: association between current bloodlead and bone lead. Archives of Environmental and Occupational Health, 62:183–186.
Morrow PE et al. (1980). Pulmonary retention of lead: an experimental study in man.Environmental Research, 21:373–384.
Mortada WI et al. (2002). Reference intervals of cadmium, lead, and mercury in blood, urine,hair, and nails among residents in Mansoura city, Nile delta, Egypt. EnvironmentalResearch, 90:104–110.
Moss ME, Lanphear BP, Auinger P (1999). Association of dental caries and blood lead levels.Journal of the American Medical Association, 281:2294–2298.
Muñoz O et al. (2005). Estimation of the dietary intake of cadmium, lead, mercury, and arsenicby the population of Santiago (Chile) using a Total Diet Study. Food and ChemicalToxicology, 43:1647–1655.
Muntner P et al. (2003). Blood lead and chronic kidney disease in the general United Statespopulation: results from NHANES III. Kidney International, 63:1044–1050.
Muntner P et al. (2005). Continued decline in blood lead levels among adults in the UnitedStates. Archives of Internal Medicine, 165:2155–2161.
Muntner P et al. (2007). Association of tibia and blood lead with end-stage renal disease: apilot study of African-Americans. Environmental Research, 104:396–401.
Mykkänen HM, Wasserman RH (1981). Gastrointestinal absorption of lead (203Pb) in chicks:influence of lead, calcium, and age. Journal of Nutrition, 111:1757–1765.
Mykkänen HM, Wasserman RH (1982). Effect of vitamin D on the intestinal absorptionof 203Pb and 47Ca in chicks. Journal of Nutrition, 112:520–527.
Nardi EP et al. (2009). The use of inductively coupled plasma mass spectrometry (ICP MS)for the determination of toxic and essential elements in different types of food samples.Food Chemistry, 112:727–732.
Nash D et al. (2003). Blood lead, blood pressure, and hypertension in perimenopausal andpostmenopausal women. JAMA: the journal of the American Medical Association,289:1523–1532.
Nash D et al. (2004). Bone density–related predictors of blood lead level among peri- andpostmenopausal women in the United States: the Third National Health and NutritionExamination Survey, 1988–1994. American Journal of Epidemiology, 160:901–911.
Nasreddine L et al. (2006). Dietary exposure to lead, cadmium, mercury and radionuclides ofan adult urban population in Lebanon: a total diet study approach. Food Additives &Contaminants, Part A, 23(6):579–590.
Navas-Acien A et al. (2004). Lead, cadmium, smoking, and increased risk of peripheral arterialdisease. Circulation, 109:3196–3201.
Navas-Acien A et al. (2007). Lead exposure and cardiovascular disease—a systematic review.Environmental Health Perspectives, 115:472–482.
Navas-Acien A et al. (2009). Blood cadmium and lead and chronic kidney disease in US adults:a joint analysis. American Journal of Epidemiology, 170:1156–1164.
Needleman HL et al. (1979). Deficits in psychologic and classroom performance of childrenwith elevated dentine lead levels. New England Journal of Medicine, 300:689–695.
LEAD (addendum) 491

Needleman HL et al. (1982). Lead-associated intellectual deficit. New England Journal ofMedicine, 306:367.
Needleman HL et al. (1996). Bone lead levels and delinquent behavior. Journal of theAmerican Medical Association, 275:363–369.
Needleman HL et al. (2002). Bone lead levels in adjudicated delinquents: a case–control study.Neurotoxicology and Teratology, 24:711–717.
Nevin R (2000). How lead exposure relates to temporal changes in IQ, violent crime, andunwed pregnancy. Environmental Research, 83:1–22.
Nevin R (2007). Understanding international crime trends: the legacy of preschool leadexposure. Environmental Research, 104:315–336.
Ni Z et al. (2004). Lead exposure raises superoxide and hydrogen peroxide in humanendothelial and vascular smooth muscle cells. Kidney International, 66:2329–2336.
Nichani V et al. (2006). Blood lead levels in children after phase-out of leaded gasoline inBombay, India. Science of the Total Environment, 363:95–106.
Nigg JT et al. (2008). Low blood lead levels associated with clinically diagnosed attentiondeficit/hyperactivity disorder and mediated by weak cognitive control. BiologicalPsychiatry, 63:325–331.
Nigg JT et al. (2010). Confirmation and extension of association of blood lead with attention-deficit/hyperactivity disorder (ADHD) and ADHD symptom domains at population-typicalexposure levels. Journal of Child Psychology and Psychiatry, 51:58–65.
Nriagu J et al. (2006). Lead levels in blood and saliva in a low-income population of Detroit,Michigan. International Journal of Hygiene and Environmental Health, 209:109–121.
NZFSA (2005). 2003–2004 New Zealand Total Diet Survey. Wellington, New Zealand, NewZealand Food Safety Authority (http://www.nzfsa.govt.nz/science/research-projects/total-diet-survey/2003-2004.htm).
Oh S-S et al. (2007). A case of amyotrophic lateral sclerosis in electronic parts manufacturingworker exposed to lead. Neurotoxicology, 28:324–327.
Olmedo P et al. (2010). Validation of a method to quantify chromium, cadmium, manganese,nickel and lead in human whole blood, urine, saliva and hair samples by electrothermalatomic absorption spectrometry. Analytica Chimica Acta, 659:60–67.
Olympio KPK et al. (2010). Surface dental enamel lead levels and antisocial behavior inBrazilian adolescents. Neurotoxicology and Teratology, 32:273–279.
Opler MG et al. (2004). Prenatal lead exposure, delta-aminolevulinic acid, and schizophrenia.Environmental Health Perspectives, 112:548–552.
Opler MG et al. (2008). Prenatal exposure to lead, delta-aminolevulinic acid, andschizophrenia: further evidence. Environmental Health Perspectives, 116:1586–1590.
Oymak T et al. (2009). Determination of lead and cadmium in food samples by thecoprecipitation method. Food Chemistry, 113(4):1314–1317.
Park SK et al. (2006). Low-level lead exposure, metabolic syndrome, and heart rate variability:the VA Normative Aging Study. Environmental Health Perspectives, 114:1718–1724.
Park SK et al. (2009). Bone lead level prediction models and their application to examine therelationship of lead exposure and hypertension in the Third National Health and NutritionExamination Survey. Journal of Occupational and Environmental Medicine, 51:1422–1436.
Patrick L (2006). Lead toxicity, a review of the literature. Part 1: Exposure, evaluation, andtreatment. Alternative Medicine Review, 11(1):2–22.
Pereira-Filho ER et al. (2002). Simultaneous sample digestion and determination of Cd, Cuand Pb in biological samples using thermospray flame furnace atomic absorptionspectrometry (TS-FF-AAS) with slurry sample introduction. Journal of Analytical AtomicSpectrometry, 17:1308–1315.
Perlstein T et al. (2007). Cumulative community-level lead exposure and pulse pressure: theNormative Aging Study. Environmental Health Perspectives, 115:1696–1700.
492 LEAD (addendum)

Peters JL et al. (2010). Interaction of stress, lead burden and age on cognition in older men:the VA Normative Aging Study. Environmental Health Perspectives, 118:505–510.
Popovic M et al. (2005). Impact of occupational exposure on lead levels in women.Environmental Health Perspectives, 113:478–484.
Pounds JG, Marlar RJ, Allen JR (1978). Metabolism of lead-210 in juvenile and adult Rhesusmonkeys (Macaca mulatta). Bulletin of Environmental Contamination and Toxicology,19:684–691.
Prospective Studies Collaboration (2002). Age-specific relevance of usual blood pressure tovascular mortality: a meta-analysis of individual data for one million adults in 61 prospectivestudies. Lancet, 360:1903–1913.
Qu P et al. (2008). Flow-injection chemiluminescence determinations for human blood leadusing controlled reagent release technology. Microchimica Acta, 163:321–326.
Rabinowitz MB (1991). Toxicokinetics of bone lead. Environmental Health Perspectives,91:33–37.
Rabinowitz MB, Kopple JD, Wetherill GW (1980). Effect of food intake and fasting ongastrointestinal lead absorption in humans. American Journal of Clinical Nutrition,33:1784–1788.
Rabinowitz MB, Wetherill GW, Kopple JD (1976). Kinetic-analysis of lead metabolism inhealthy humans. Journal of Clinical Investigation, 58:260–270.
Radwan MA, Salama AK (2006). Market basket survey for some heavy metals in Egyptianfruits and vegetables. Food and Chemical Toxicology, 44:1273–1278.
Rahbar MH et al. (2002). Factors associated with elevated blood lead concentrations inchildren in Karachi, Pakistan. Bulletin of the World Health Organization, 80:769–775.
Rajan P et al. (2007). Lead burden and psychiatric symptoms and the modifying influence ofthe delta-aminolevulinic acid dehydratase (ALAD) polymorphism: the VA Normative AgingStudy. American Journal of Epidemiology, 166:1400–1408.
Rajan P et al. (2008). Interaction of the delta-aminolevulinic acid dehydratase polymorphismand lead burden on cognitive function: the VA Normative Aging Study. Journal ofOccupational and Environmental Medicine, 50:1053–1061.
Resano M et al. (2007). Minimally-invasive filter paper test in combination with solid sampling–graphite furnace atomic absorption spectrometry for Pb determination in whole blood.Journal of Analytical Atomic Spectrometry, 22:1250–1259.
Reza B et al. (2008). Effects of low-level lead exposure on blood pressure and function of therat isolated heart. Indian Journal of Pharmacology, 40(2):69–72.
Riess ML, Halm JK (2007). Lead poisoning in an adult: lead mobilization by pregnancy?Journal of General Internal Medicine, 22:1212–1215.
Rocha SR et al. (2009). Trace elements determination in edible seaweeds by an optimizedand validated ICP-MS method. Journal of Food Composition and Analysis, 22:330–336.
Rodushkin I, Ödman F, Branth S (1999). Multielement analysis of whole blood by highresolution inductively coupled plasma mass spectrometry. Fresenius’ Journal of AnalyticalChemistry, 464:338–346.
Ronis MJ et al. (1996). Reproductive toxicity and growth effects in rats exposed to lead atdifferent periods during development. Toxicology and Applied Pharmacology, 136:361–371.
Rose G, Day S (1990). The population mean predicts the number of deviant individuals. BritishMedical Journal, 301:1031–1034.
Rosen JF, Chesney RW (1983). Circulating calcitriol concentration in health and disease.Journal of Pediatrics, 103:1–17.
Rothenberg SJ et al. (1994). Changes in serial blood lead levels during pregnancy.Environmental Health Perspectives, 82:81–90.
Rothenberg SJ et al. (2002). Increases in hypertension and blood pressure during pregnancywith increased bone lead levels. American Journal of Epidemiology, 156(12):1079–1087.
LEAD (addendum) 493

Sanin LH et al. (2001). Effect of maternal lead burden on infant weight and weight gain at onemonth of age among breastfed infants. Pediatrics, 107:1016–1023.
Santos D Jr et al. (2002). Determination of Cd and Pb in food slurries by GFAAS usingcryogenic grinding for sample preparation. Analytical and Bioanalytical Chemistry,373:183–189.
Saraiva MC et al. (2007). Lead exposure and periodontitis in US adults. Journal of PeriodontalResearch, 42:45–52.
Sardans J, Montes F, Peñuelas J (2010). Determination of As, Cd, Cu, Hg and Pb in biologicalsamples by modern electrothermal atomic absorption spectrometry. Spectrochimica Acta.Part B: Atomic Spectroscopy, 65:97–112.
Sarica DY, Turker AR (2007). Method validation for the determination of lead in raw cow’s milkby electrothermal atomic absorption spectrometry. Annali di Chimica, 97(10):983–993.
Schafer JH et al. (2005). Blood lead as a predictor of homocysteine levels in a population-based study of older adults. Environmental Health Perspectives, 113:31–35.
Schober SE et al. (2006). Blood lead levels and death from all causes, cardiovascular disease,and cancer: results from the NHANES III mortality study. Environmental HealthPerspectives, 114:1538–1541.
Schroijen C et al. (2008). Internal exposure to pollutants measured in blood and urine ofFlemish adolescents in function of area of residence. Chemosphere, 71(7):1317–1325.
Schuhmacher M et al. (1996). A longitudinal study of lead mobilization during pregnancy:concentrations in maternal and umbilical cord blood. Trace Elements and Electrolytes,13:177–181.
Schwartz BS et al. (2005). Occupational lead exposure and longitudinal decline inneurobehavioral test scores. Epidemiology, 16:106–113.
Schwartz BS et al. (2007). Relations of brain volumes with cognitive function in males 45 yearsand older with past lead exposure. Neuroimage, 37:633–641.
Schwartz J (1993). Beyond LOEL’s, p values, and vote counting: methods for looking at theshapes and strengths of associations. Neurotoxicology, 14:237–246.
Schwartz J (1994). Low-level lead exposure and children’s IQ: a meta-analysis and search fora threshold. Environmental Research, 65:42–55.
Seeber A, Meyer-Baron M, Schaper M (2002). A summary of two meta-analyses onneurobehavioural effects due to occupational lead exposure. Archives of Toxicology,76(3):137–145.
Selevan SG et al. (2003). Blood lead concentration and delayed puberty in girls. New EnglandJournal of Medicine, 346:1527–1536.
Shamshirsaz AA et al. (2009). Severe lead poisoning caused by use of health supplementspresenting as acute abdominal pain during pregnancy. Obstetrics and Gynecology,114:448–450.
Sherlock JC et al. (1982). Assessment of lead intakes and dose–response for a population inAyr exposed to a plumbosolvent water supply. Human Toxicology, 1:115–122.
Shih RA et al. (2006). Environmental lead exposure and cognitive function in community-dwelling older adults. Neurology, 67:1556–1562.
Shrivas K, Patel DK (2010). Separation and preconcentration of trace level of lead in one dropof blood sample by using graphite furnace atomic absorption spectrometry. Journal ofHazardous Materials, 176:414–417.
Simmonds PL, Luckhurst CL, Woods JS (1995). Quantitative evaluation of heme biosyntheticpathway parameters as biomarkers of low-level lead exposure in rats. Journal ofToxicology and Environmental Health, 44:351–367.
Singapore (2010). Lead levels in food commodities. Data submitted to FAO/WHO.Soares VA et al. (2010). Determination of nutritional and toxic elements in pasteurized bovine
milk from Vale do Paraíba region (Brazil). Food Control, 21(1):45–49.
494 LEAD (addendum)

Sokol RZ (1987). Hormonal effects of lead acetate in the male rat: mechanism of action.Biology of Reproduction, 37:1135–1138.
Solon O et al. (2008). Associations between cognitive function, blood lead concentration, andnutrition among children in the central Philippines. Journal of Pediatrics, 152:237–243.
Song B et al. (2009). Assessing the health risk of heavy metals in vegetables to the generalpopulation in Beijing, China. Journal of Environmental Sciences (China), 21(12):1702–1709.
Sowers M et al. (2002). Blood lead concentrations and pregnancy outcomes. Archives ofEnvironmental Health, 57:489–495.
Soylak M et al. (2010). Utilization of membrane filtration for preconcentration anddetermination of Cu(II) and Pb(II) in food, water and geological samples by atomicabsorption spectrometry. Food and Chemical Toxicology, 48:517–521.
Staessen JA et al. (2001). Renal function, cytogenetic measurements, and sexualdevelopment in adolescents in relation to environmental pollutants: a feasibility study ofbiomarkers. Lancet, 357:1660–1669.
Stauber JL et al. (1994). Percutaneous absorption of inorganic lead compounds. Science ofthe Total Environment, 145:55–70.
Stewart WF et al. (2002). ApoE genotype, past adult lead exposure, and neurobehavioralfunction. Environmental Health Perspectives, 110:501–505.
Stewart WF et al. (2006). Past adult lead exposure is linked to neurodegeneration measuredby brain MRI. Neurology, 66:1476–1484.
Stretesky PB, Lynch MJ (2001). The relationship between lead exposure and homicide.Archives of Pediatrics and Adolescent Medicine, 155:579–582.
Stretesky PB, Lynch MJ (2004). The relationship between lead and crime. Journal of Healthand Social Behavior, 45:214–219.
Sundström R, Karlsson B (1987). Myelin basic protein in brains of rats with low dose leadencephalopathy. Archives of Toxicology, 59:341–345.
Surkan PJ et al. (2007). Neuropsychological function in children with blood lead levels <10 μg/dL. Neurotoxicology, 28:1170–1177.
Svensgaard D et al. (2007). A conclusion regarding, “What is the meaning of non-linear dose–response relationships between blood lead concentration and IQ?” Neurotoxicology,28:196–197.
Symanski E, Hertz-Picciotto I (1995). Blood lead levels in relation to menopause, smoking,and pregnancy history. American Journal of Epidemiology, 141:1047–1058.
Tajkarimia M et al. (2008). Lead residue levels in raw milk from different regions of Iran. FoodControl, 19(5):495–498.
Taylor A et al. (2006). Quality specifications for evaluation and comparison of performanceamong external quality assessment schemes in occupational and environmental laboratorymedicine. Accreditation and Quality Assurance, 11:440–445.
Tellez-Rojo MM et al. (2004). Impact of bone lead and bone resorption on plasma and wholeblood lead levels during pregnancy. American Journal of Epidemiology, 160:668–678.
Tellez-Rojo MM et al. (2006). Longitudinal associations between blood lead concentrationslower than 10 μg/dL and neurobehavioral development in environmentally exposedchildren in Mexico City. Pediatrics, 118:e323–330.
Thomson GO et al. (1989). Blood-lead levels and children’s behaviour—results from theEdinburgh Lead Study. Journal of Child Psychology and Psychiatry, 30:515–528.
Treble RG, Thompson TS (1997). Preliminary results of a survey of lead levels in human livertissue. Bulletin of Environmental Contamination and Toxicology, 59:688–695.
Tripathi RM et al. (1997). Dietary intake of heavy metals in Bombay city, India. Science of theTotal Environment, 208:149–159.
Troesken W (2006). Lead exposure and eclampsia in Britain, 1883–1934. EnvironmentalResearch, 101:395–400.
LEAD (addendum) 495

Tsaih SW et al. (2004). Lead, diabetes, hypertension, and renal function: the Normative AgingStudy. Environmental Health Perspectives, 112:1178–1182.
Tüzen M, Soylak M (2005). Trace heavy metal levels in microwave digested honey samplesfrom middle Anatolia, Turkey. Journal of Food and Drug Analysis, 13:343–347.
USEPA (1986). Air quality criteria for lead. Washington, DC, USA, United StatesEnvironmental Protection Agency, Office of Research and Development, Office of Healthand Environmental Assessment, Environmental Criteria and Assessment Office(EPA600883028F).
USEPA (2006). Air quality criteria for lead. Washington, DC, USA, United StatesEnvironmental Protection Agency, Office of Research and Development, National Centerfor Environmental Assessment.
USFDA (2010). United States Total Diet Study (1999–2008) and United States non-TDSmonitoring (1999–2006). Data submitted to FAO/WHO.
Vallee BL, Ulmer DD (1972). Biochemical effects of mercury, cadmium, and lead. AnnualReview of Biochemistry, 41:91–128.
Vannoort RW, Thomson BM (2005). Auxiliary data for the 2003/04 New Zealand Total DietSurvey. Wellington, New Zealand, New Zealand Food Safety Authority.
Vaziri ND (2008). Mechanisms of lead-induced hypertension and cardiovascular disease.American Journal of Physiology. Heart and Circulatory Physiology, 295(2):H454–H465.
Vaziri ND, Sica DA (2004). Lead-induced hypertension: role of oxidative stress. CurrentHypertension Reports, 6:314–320.
Vaziri ND et al. (1997). Altered nitric oxide metabolism and increased oxygen free radicalactivity in lead-induced hypertension: effect of lazaroid therapy. Kidney International,52:1042–1046.
Victery W (1988). Evidence for effects of chronic lead exposure on blood pressure inexperimental animals: an overview. Environmental Health Perspectives, 78:71–76.
Vigeh M et al. (2006). Lead and other trace metals in preeclampsia: a case–control study inTehran, Iran. Environmental Research, 100:268–275.
Viitak A, Volynsky AB (2006). Simple procedure for the determination of Cd, Pb, As and Se inbiological samples by electrothermal atomic absorption spectrometry using colloidal Pdmodifier. Talanta, 70:890–895.
Villalobos M et al. (2009). Lead (II) detection and contamination routes in environmentalsources, cookware and home-prepared foods from Zimlatlan, Oaxaxa, Mexico. Science ofthe Total Environment, 407:2836–2844.
Viñas P, Pardo-Martínez M, Hernández-Córdoba M (2000). Rapid determination of selenium,lead and cadmium in baby food samples using electrothermal atomic absorptionspectrometry and slurry atomization. Analytica Chimica Acta, 412:121–130.
Vupputuri S et al. (2003). Relation of blood lead to blood pressure in African-Americans andwhites: the Third National Health and Examination Survey. Hypertension, 41:463–468.
Vyskocil A, Cizkova M, Tejnorova I (1995). Effect of prenatal and postnatal exposure to leadon kidney function in male and female rats. Journal of Applied Toxicology, 15(4):327–328.
Wan Z, Xu Z, Wang J (2006). Flow injection on-line solid phase extraction for ultra-trace leadscreening with hydride generation atomic fluorescence spectrometry. Analyst, 131:141–147.
Wang CN et al. (2009). Dietary exposure to lead by children and adults in the Jinhu area ofChina. Food Additives & Contaminants. Part A, Chemistry, Analysis, Control, Exposure &Risk Assessment, 26(6):821–828.
Wang H-L et al. (2008). Case–control study of blood lead levels and attention deficithyperactivity disorder in Chinese children. Environmental Health Perspectives, 116:1401–1406.
Watts SW, Chai S, Webb RC (1995). Lead acetate–induced contraction in rabbit mesentericartery: interaction with calcium and protein kinase C. Toxicology, 99:55–65.
496 LEAD (addendum)

Weaver VM et al. (2003). Associations of renal function with polymorphisms in the -aminolevulinic acid dehydratase, vitamin D receptor, and nitric oxide synthase genes inKorean lead workers. Environmental Health Perspectives, 111:1613–1619.
Weaver VM et al. (2006). Effect modification by delta-aminolevulinic acid dehydratase, vitaminD receptor, and nitric oxide synthase gene polymorphisms on associations between patellalead and renal function in lead workers. Environmental Research, 102:61–69.
Weisskopf MG et al. (2004). Cumulative lead exposure and prospective change in cognitionamong elderly men: the VA Normative Aging study. American Journal of Epidemiology,160:1184–1193.
Weisskopf MG et al. (2007). Cumulative lead exposure and cognitive performance amongelderly men. Epidemiology, 18:59–66.
Weisskopf MG et al. (2009). A prospective study of bone lead concentration and death fromall causes, cardiovascular diseases, and cancer in the Department of Veteran AffairsNormative Aging Study. Circulation, 120:1056–1064.
Weuve J et al. (2006). Delta-aminolevulinic acid dehydratase polymorphism and the relationbetween low level lead exposure and the Mini-Mental Status Examination in older men:the Normative Aging Study. Occupational and Environmental Medicine, 63:746–753.
Weuve J et al. (2009). Cumulative exposure to lead in relation to cognitive function in olderwomen. Environmental Health Perspectives, 117:574–580.
Wilhelm M et al. (2005). Human biomonitoring of cadmium and lead exposure of child–motherpairs from Germany living in the vicinity of industrial sources (hot spot study NRW). Journalof Trace Element in Medicine and Biology, 19(1):83–90.
Williams PL et al. (2010). Blood lead levels and delayed onset of puberty in a longitudinal studyof Russian boys. Pediatrics, 125:e1088–1096.
Wright JP et al. (2008). Association of prenatal and childhood blood lead concentrations withcriminal arrests in early adulthood. PLoS Medicine, 5(5):e101.
Wu MT et al. (2003). A -aminolevulinic acid dehydratase (ALAD) polymorphism may modifythe relationship of low-level lead exposure to uricemia and renal function: the NormativeAging Study. Environmental Health Perspectives, 111:335–340.
Wu T, Buck GM, Mendola P (2003). Blood lead levels and sexual maturation in U.S. girls: theThird National Health and Nutrition Examination Survey, 1988–1994. EnvironmentalHealth Perspectives, 111:737–741.
Yetkin-Ay Z et al. (2007). The periodontal status of indirectly lead-exposed apprenticesworking in autorepair workshops. Toxicology and Industrial Health, 23:599–606.
Youravong N et al. (2006). Lead associated caries development in children living in a leadcontaminated area, Thailand. Science of the Total Environment, 361:88–96.
Yu CC, Lin JL, Lin-Tan DT (2004). Environmental exposure to lead and progression of chronicrenal diseases: a four-year prospective longitudinal study. Journal of the American Societyof Nephrology, 15:1016–1022.
Yuan W et al. (2006). The impact of early childhood lead exposure on brain organization: afunctional magnetic resonance imaging study of language function. Pediatrics, 118:971–977.
Yule W et al. (1984). Teachers’ ratings of children’s behaviour in relation to blood lead levels.British Journal of Developmental Psychology, 2:295–305.
Zentner LEA, Rondo PHC, Mastroeni SSBS (2006). Lead contamination and anthropometryof the newborn baby. Journal of Tropical Pediatrics, 52:369–371.
Ziegler EE et al. (1978). Absorption and retention of lead by infants. Pediatric Research,12:29–34.
LEAD (addendum) 497


ANNEXES


ANNEX 1
REPORTS AND OTHER DOCUMENTS RESULTING FROM PREVIOUSMEETINGS OF THE JOINT FAO/WHO EXPERT COMMITTEE ON FOOD
ADDITIVES
1. General principles governing the use of food additives (First report of the JointFAO/WHO Expert Committee on Food Additives). FAO Nutrition MeetingsReport Series, No. 15, 1957; WHO Technical Report Series, No. 129, 1957(out of print).
2. Procedures for the testing of intentional food additives to establish their safetyfor use (Second report of the Joint FAO/WHO Expert Committee on FoodAdditives). FAO Nutrition Meetings Report Series, No. 17, 1958; WHOTechnical Report Series, No. 144, 1958 (out of print).
3. Specifications for identity and purity of food additives (antimicrobialpreservatives and antioxidants) (Third report of the Joint FAO/WHO ExpertCommittee on Food Additives). These specifications were subsequentlyrevised and published as Specifications for identity and purity of foodadditives, Vol. I. Antimicrobial preservatives and antioxidants, Rome, Food andAgriculture Organization of the United Nations, 1962 (out of print).
4. Specifications for identity and purity of food additives (food colours) (Fourthreport of the Joint FAO/WHO Expert Committee on Food Additives). Thesespecifications were subsequently revised and published as Specifications foridentity and purity of food additives, Vol. II. Food colours, Rome, Food andAgriculture Organization of the United Nations, 1963 (out of print).
5. Evaluation of the carcinogenic hazards of food additives (Fifth report of theJoint FAO/WHO Expert Committee on Food Additives). FAO NutritionMeetings Report Series, No. 29, 1961; WHO Technical Report Series, No. 220,1961 (out of print).
6. Evaluation of the toxicity of a number of antimicrobials and antioxidants (Sixthreport of the Joint FAO/WHO Expert Committee on Food Additives). FAONutrition Meetings Report Series, No. 31, 1962; WHO Technical Report Series,No. 228, 1962 (out of print).
7. Specifications for the identity and purity of food additives and their toxicologicalevaluation: emulsifiers, stabilizers, bleaching and maturing agents (Seventhreport of the Joint FAO/WHO Expert Committee on Food Additives). FAONutrition Meetings Series, No. 35, 1964; WHO Technical Report Series, No.281, 1964 (out of print).
8. Specifications for the identity and purity of food additives and their toxicologicalevaluation: food colours and some antimicrobials and antioxidants (Eighthreport of the Joint FAO/WHO Expert Committee on Food Additives). FAONutrition Meetings Series, No. 38, 1965; WHO Technical Report Series, No.309, 1965 (out of print).
9. Specifications for identity and purity and toxicological evaluation of someantimicrobials and antioxidants. FAO Nutrition Meetings Report Series, No.38A, 1965; WHO/Food Add/24.65 (out of print).
- 501 -

10. Specifications for identity and purity and toxicological evaluation of foodcolours. FAO Nutrition Meetings Report Series, No. 38B, 1966; WHO/FoodAdd/66.25.
11. Specifications for the identity and purity of food additives and their toxicologicalevaluation: some antimicrobials, antioxidants, emulsifiers, stabilizers, flourtreatment agents, acids, and bases (Ninth report of the Joint FAO/WHO ExpertCommittee on Food Additives). FAO Nutrition Meetings Series, No. 40, 1966;WHO Technical Report Series, No. 339, 1966 (out of print).
12. Toxicological evaluation of some antimicrobials, antioxidants, emulsifiers,stabilizers, flour treatment agents, acids, and bases. FAO Nutrition MeetingsReport Series, No. 40A, B, C; WHO/Food Add/67.29.
13. Specifications for the identity and purity of food additives and their toxicologicalevaluation: some emulsifiers and stabilizers and certain other substances(Tenth report of the Joint FAO/WHO Expert Committee on Food Additives).FAO Nutrition Meetings Series, No. 43, 1967; WHO Technical Report Series,No. 373, 1967.
14. Specifications for the identity and purity of food additives and their toxicologicalevaluation: some flavouring substances and non nutritive sweetening agents(Eleventh report of the Joint FAO/WHO Expert Committee on Food Additives).FAO Nutrition Meetings Series, No. 44, 1968; WHO Technical Report Series,No. 383, 1968.
15. Toxicological evaluation of some flavouring substances and non nutritivesweetening agents. FAO Nutrition Meetings Report Series, No. 44A, 1968;WHO/Food Add/68.33.
16. Specifications and criteria for identity and purity of some flavouring substancesand non-nutritive sweetening agents. FAO Nutrition Meetings Report Series,No. 44B, 1969; WHO/Food Add/69.31.
17. Specifications for the identity and purity of food additives and their toxicologicalevaluation: some antibiotics (Twelfth report of the Joint FAO/WHO ExpertCommittee on Food Additives). FAO Nutrition Meetings Series, No. 45, 1969;WHO Technical Report Series, No. 430, 1969.
18. Specifications for the identity and purity of some antibiotics. FAO NutritionMeetings Series, No. 45A, 1969; WHO/Food Add/69.34.
19. Specifications for the identity and purity of food additives and their toxicologicalevaluation: some food colours, emulsifiers, stabilizers, anticaking agents, andcertain other substances (Thirteenth report of the Joint FAO/WHO ExpertCommittee on Food Additives). FAO Nutrition Meetings Series, No. 46, 1970;WHO Technical Report Series, No. 445, 1970.
20. Toxicological evaluation of some food colours, emulsifiers, stabilizers,anticaking agents, and certain other substances. FAO Nutrition MeetingsReport Series, No. 46A, 1970; WHO/Food Add/70.36.
21. Specifications for the identity and purity of some food colours, emulsifiers,stabilizers, anticaking agents, and certain other food additives. FAO NutritionMeetings Report Series, No. 46B, 1970; WHO/Food Add/70.37.
22. Evaluation of food additives: specifications for the identity and purity of foodadditives and their toxicological evaluation: some extraction solvents andcertain other substances; and a review of the technological efficacy of some
502 ANNEX 1

antimicrobial agents. (Fourteenth report of the Joint FAO/WHO ExpertCommittee on Food Additives). FAO Nutrition Meetings Series, No. 48, 1971;WHO Technical Report Series, No. 462, 1971.
23. Toxicological evaluation of some extraction solvents and certain othersubstances. FAO Nutrition Meetings Report Series, No. 48A, 1971; WHO/Food Add/70.39.
24. Specifications for the identity and purity of some extraction solvents and certainother substances. FAO Nutrition Meetings Report Series, No. 48B, 1971;WHO/Food Add/70.40.
25. A review of the technological efficacy of some antimicrobial agents. FAONutrition Meetings Report Series, No. 48C, 1971; WHO/Food Add/70.41.
26. Evaluation of food additives: some enzymes, modified starches, and certainother substances: Toxicological evaluations and specifications and a reviewof the technological efficacy of some antioxidants (Fifteenth report of the JointFAO/WHO Expert Committee on Food Additives). FAO Nutrition MeetingsSeries, No. 50, 1972; WHO Technical Report Series, No. 488, 1972.
27. Toxicological evaluation of some enzymes, modified starches, and certainother substances. FAO Nutrition Meetings Report Series, No. 50A, 1972; WHOFood Additives Series, No. 1, 1972.
28. Specifications for the identity and purity of some enzymes and certain othersubstances. FAO Nutrition Meetings Report Series, No. 50B, 1972; WHO FoodAdditives Series, No. 2, 1972.
29. A review of the technological efficacy of some antioxidants and synergists.FAO Nutrition Meetings Report Series, No. 50C, 1972; WHO Food AdditivesSeries, No. 3, 1972.
30. Evaluation of certain food additives and the contaminants mercury, lead, andcadmium (Sixteenth report of the Joint FAO/WHO Expert Committee on FoodAdditives). FAO Nutrition Meetings Series, No. 51, 1972; WHO TechnicalReport Series, No. 505, 1972, and corrigendum.
31. Evaluation of mercury, lead, cadmium and the food additives amaranth,diethylpyrocarbamate, and octyl gallate. FAO Nutrition Meetings ReportSeries, No. 51A, 1972; WHO Food Additives Series, No. 4, 1972.
32. Toxicological evaluation of certain food additives with a review of generalprinciples and of specifications (Seventeenth report of the Joint FAO/WHOExpert Committee on Food Additives). FAO Nutrition Meetings Series, No. 53,1974; WHO Technical Report Series, No. 539, 1974, and corrigendum (out ofprint).
33. Toxicological evaluation of some food additives including anticaking agents,antimicrobials, antioxidants, emulsifiers, and thickening agents. FAO NutritionMeetings Report Series, No. 53A, 1974; WHO Food Additives Series, No. 5,1974.
34. Specifications for identity and purity of thickening agents, anticaking agents,antimicrobials, antioxidants and emulsifiers. FAO Food and Nutrition Paper,No. 4, 1978.
35. Evaluation of certain food additives (Eighteenth report of the Joint FAO/WHOExpert Committee on Food Additives). FAO Nutrition Meetings Series, No. 54,1974; WHO Technical Report Series, No. 557, 1974, and corrigendum.
ANNEX 1 503

36. Toxicological evaluation of some food colours, enzymes, flavour enhancers,thickening agents, and certain other food additives. FAO Nutrition MeetingsReport Series, No. 54A, 1975; WHO Food Additives Series, No. 6, 1975.
37. Specifications for the identity and purity of some food colours, enhancers,thickening agents, and certain food additives. FAO Nutrition Meetings ReportSeries, No. 54B, 1975; WHO Food Additives Series, No. 7, 1975.
38. Evaluation of certain food additives: some food colours, thickening agents,smoke condensates, and certain other substances. (Nineteenth report of theJoint FAO/WHO Expert Committee on Food Additives). FAO NutritionMeetings Series, No. 55, 1975; WHO Technical Report Series, No. 576, 1975.
39. Toxicological evaluation of some food colours, thickening agents, andcertain other substances. FAO Nutrition Meetings Report Series, No. 55A,1975; WHO Food Additives Series, No. 8, 1975.
40. Specifications for the identity and purity of certain food additives. FAO NutritionMeetings Report Series, No. 55B, 1976; WHO Food Additives Series, No. 9,1976.
41. Evaluation of certain food additives (Twentieth report of the Joint FAO/WHOExpert Committee on Food Additives). FAO Food and Nutrition MeetingsSeries, No. 1, 1976; WHO Technical Report Series, No. 599, 1976.
42. Toxicological evaluation of certain food additives. WHO Food Additives Series,No. 10, 1976.
43. Specifications for the identity and purity of some food additives. FAO Food andNutrition Series, No. 1B, 1977; WHO Food Additives Series, No. 11, 1977.
44. Evaluation of certain food additives (Twenty-first report of the Joint FAO/WHOExpert Committee on Food Additives). WHO Technical Report Series, No. 617,1978.
45. Summary of toxicological data of certain food additives. WHO Food AdditivesSeries, No. 12, 1977.
46. Specifications for identity and purity of some food additives, includingantioxidant, food colours, thickeners, and others. FAO Nutrition MeetingsReport Series, No. 57, 1977.
47. Evaluation of certain food additives and contaminants (Twenty-second reportof the Joint FAO/WHO Expert Committee on Food Additives). WHO TechnicalReport Series, No. 631, 1978.
48. Summary of toxicological data of certain food additives and contaminants.WHO Food Additives Series, No. 13, 1978.
49. Specifications for the identity and purity of certain food additives. FAO Foodand Nutrition Paper, No. 7, 1978.
50. Evaluation of certain food additives (Twenty-third report of the Joint FAO/WHOExpert Committee on Food Additives). WHO Technical Report Series, No. 648,1980, and corrigenda.
51. Toxicological evaluation of certain food additives. WHO Food Additives Series,No. 14, 1980.
52. Specifications for identity and purity of food colours, flavouring agents, andother food additives. FAO Food and Nutrition Paper, No. 12, 1979.
504 ANNEX 1
53. Evaluation of certain food additives (Twenty-fourth report of the Joint FAO/WHO Expert Committee on Food Additives). WHO Technical Report Series,No. 653, 1980.
54. Toxicological evaluation of certain food additives. WHO Food Additives Series,No. 15, 1980.
55. Specifications for identity and purity of food additives (sweetening agents,emulsifying agents, and other food additives). FAO Food and Nutrition Paper,No. 17, 1980.
56. Evaluation of certain food additives (Twenty-fifth report of the Joint FAO/WHOExpert Committee on Food Additives). WHO Technical Report Series, No. 669,1981.
57. Toxicological evaluation of certain food additives. WHO Food Additives Series,No. 16, 1981.
58. Specifications for identity and purity of food additives (carrier solvents,emulsifiers and stabilizers, enzyme preparations, flavouring agents, foodcolours, sweetening agents, and other food additives). FAO Food and NutritionPaper, No. 19, 1981.
59. Evaluation of certain food additives and contaminants (Twenty-sixth report ofthe Joint FAO/WHO Expert Committee on Food Additives). WHO TechnicalReport Series, No. 683, 1982.
60. Toxicological evaluation of certain food additives. WHO Food Additives Series,No. 17, 1982.
61. Specifications for the identity and purity of certain food additives. FAO Foodand Nutrition Paper, No. 25, 1982.
62. Evaluation of certain food additives and contaminants (Twenty-seventh reportof the Joint FAO/WHO Expert Committee on Food Additives). WHO TechnicalReport Series, No. 696, 1983, and corrigenda.
63. Toxicological evaluation of certain food additives and contaminants. WHOFood Additives Series, No. 18, 1983.
64. Specifications for the identity and purity of certain food additives. FAO Foodand Nutrition Paper, No. 28, 1983.
65. Guide to specifications—General notices, general methods, identificationtests, test solutions, and other reference materials. FAO Food and NutritionPaper, No. 5, Rev. 1, 1983.
66. Evaluation of certain food additives and contaminants (Twenty-eighth reportof the Joint FAO/WHO Expert Committee on Food Additives). WHO TechnicalReport Series, No. 710, 1984, and corrigendum.
67. Toxicological evaluation of certain food additives and contaminants. WHOFood Additives Series, No. 19, 1984.
68. Specifications for the identity and purity of food colours. FAO Food andNutrition Paper, No. 31/1, 1984.
69. Specifications for the identity and purity of food additives. FAO Food andNutrition Paper, No. 31/2, 1984.
70. Evaluation of certain food additives and contaminants (Twenty-ninth report ofthe Joint FAO/WHO Expert Committee on Food Additives). WHO TechnicalReport Series, No. 733, 1986, and corrigendum.
ANNEX 1 505

71. Specifications for the identity and purity of certain food additives. FAO Foodand Nutrition Paper, No. 34, 1986.
72. Toxicological evaluation of certain food additives and contaminants. WHOFood Additives Series, No. 20. Cambridge University Press, 1987.
73. Evaluation of certain food additives and contaminants (Thirtieth report of theJoint FAO/WHO Expert Committee on Food Additives). WHO TechnicalReport Series, No. 751, 1987.
74. Toxicological evaluation of certain food additives and contaminants. WHOFood Additives Series, No. 21. Cambridge University Press, 1987.
75. Specifications for the identity and purity of certain food additives. FAO Foodand Nutrition Paper, No. 37, 1986.
76. Principles for the safety assessment of food additives and contaminants infood. WHO Environmental Health Criteria, No. 70. Geneva, World HealthOrganization, 1987 (out of print). The full text is available electronically atwww.who.int/pcs.
77. Evaluation of certain food additives and contaminants (Thirty-first report of theJoint FAO/WHO Expert Committee on Food Additives). WHO TechnicalReport Series, No. 759, 1987 and corrigendum.
78. Toxicological evaluation of certain food additives. WHO Food Additives Series,No. 22. Cambridge University Press, 1988.
79. Specifications for the identity and purity of certain food additives. FAO Foodand Nutrition Paper, No. 38, 1988.
80. Evaluation of certain veterinary drug residues in food (Thirty-second report ofthe Joint FAO/WHO Expert Committee on Food Additives). WHO TechnicalReport Series, No. 763, 1988.
81. Toxicological evaluation of certain veterinary drug residues in food. WHO FoodAdditives Series, No. 23. Cambridge University Press, 1988.
82. Residues of some veterinary drugs in animals and foods. FAO Food andNutrition Paper, No. 41, 1988.
83. Evaluation of certain food additives and contaminants (Thirty-third report of theJoint FAO/WHO Expert Committee on Food Additives). WHO TechnicalReport Series, No. 776, 1989.
84. Toxicological evaluation of certain food additives and contaminants. WHOFood Additives Series, No. 24. Cambridge University Press, 1989.
85. Evaluation of certain veterinary drug residues in food (Thirty-fourth report ofthe Joint FAO/WHO Expert Committee on Food Additives). WHO TechnicalReport Series, No. 788, 1989.
86. Toxicological evaluation of certain veterinary drug residues in food. WHO FoodAdditives Series, No. 25, 1990.
87. Residues of some veterinary drugs in animals and foods. FAO Food andNutrition Paper, No. 41/2, 1990.
88. Evaluation of certain food additives and contaminants (Thirty-fifth report of theJoint FAO/WHO Expert Committee on Food Additives). WHO TechnicalReport Series, No. 789, 1990, and corrigenda.
89. Toxicological evaluation of certain food additives and contaminants. WHOFood Additives Series, No. 26, 1990.
506 ANNEX 1

90. Specifications for identity and purity of certain food additives. FAO Food andNutrition Paper, No. 49, 1990.
91. Evaluation of certain veterinary drug residues in food (Thirty-sixth report of theJoint FAO/WHO Expert Committee on Food Additives). WHO TechnicalReport Series, No. 799, 1990.
92. Toxicological evaluation of certain veterinary drug residues in food. WHO FoodAdditives Series, No. 27, 1991.
93. Residues of some veterinary drugs in animals and foods. FAO Food andNutrition Paper, No. 41/3, 1991.
94. Evaluation of certain food additives and contaminants (Thirty-seventh reportof the Joint FAO/WHO Expert Committee on Food Additives). WHO TechnicalReport Series, No. 806, 1991, and corrigenda.
95. Toxicological evaluation of certain food additives and contaminants. WHOFood Additives Series, No. 28, 1991.
96. Compendium of food additive specifications (Joint FAO/WHO ExpertCommittee on Food Additives (JECFA)). Combined specifications from 1stthrough the 37th meetings, 1956–1990. Rome, Food and AgriculturalOrganization of the United Nations, 1992 (2 volumes).
97. Evaluation of certain veterinary drug residues in food (Thirty-eighth report ofthe Joint FAO/WHO Expert Committee on Food Additives). WHO TechnicalReport Series, No. 815, 1991.
98. Toxicological evaluation of certain veterinary residues in food. WHO FoodAdditives Series, No. 29, 1991.
99. Residues of some veterinary drugs in animals and foods. FAO Food andNutrition Paper, No. 41/4, 1991.
100. Guide to specifications—General notices, general analytical techniques,identification tests, test solutions, and other reference materials. FAO Foodand Nutrition Paper, No. 5, Rev. 2, 1991.
101. Evaluation of certain food additives and naturally occurring toxicants (Thirty-ninth report of the Joint FAO/WHO Expert Committee on Food Additives).WHO Technical Report Series No. 828, 1992.
102. Toxicological evaluation of certain food additives and naturally occurringtoxicants. WHO Food Additive Series, No. 30, 1993.
103. Compendium of food additive specifications: addendum 1. FAO Food andNutrition Paper, No. 52, 1992.
104. Evaluation of certain veterinary drug residues in food (Fortieth report of theJoint FAO/WHO Expert Committee on Food Additives). WHO TechnicalReport Series, No. 832, 1993.
105. Toxicological evaluation of certain veterinary drug residues in food. WHO FoodAdditives Series, No. 31, 1993.
106. Residues of some veterinary drugs in animals and food. FAO Food andNutrition Paper, No. 41/5, 1993.
107. Evaluation of certain food additives and contaminants (Forty-first report of theJoint FAO/WHO Expert Committee on Food Additives). WHO TechnicalReport Series, No. 837, 1993.
108. Toxicological evaluation of certain food additives and contaminants. WHOFood Additives Series, No. 32, 1993.
ANNEX 1 507

109. Compendium of food additive specifications: addendum 2. FAO Food andNutrition Paper, No. 52, Add. 2, 1993.
110. Evaluation of certain veterinary drug residues in food (Forty-second report ofthe Joint FAO/WHO Expert Committee on Food Additives). WHO TechnicalReport Series, No. 851, 1995.
111. Toxicological evaluation of certain veterinary drug residues in food. WHO FoodAdditives Series, No. 33, 1994.
112. Residues of some veterinary drugs in animals and foods. FAO Food andNutrition Paper, No. 41/6, 1994.
113. Evaluation of certain veterinary drug residues in food (Forty-third report of theJoint FAO/WHO Expert Committee on Food Additives). WHO TechnicalReport Series, No. 855, 1995, and corrigendum.
114. Toxicological evaluation of certain veterinary drug residues in food. WHO FoodAdditives Series, No. 34, 1995.
115. Residues of some veterinary drugs in animals and foods. FAO Food andNutrition Paper, No. 41/7, 1995.
116. Evaluation of certain food additives and contaminants (Forty-fourth report ofthe Joint FAO/WHO Expert Committee on Food Additives). WHO TechnicalReport Series, No. 859, 1995.
117. Toxicological evaluation of certain food additives and contaminants. WHOFood Additives Series, No. 35, 1996.
118. Compendium of food additive specifications: addendum 3. FAO Food andNutrition Paper, No. 52, Add. 3, 1995.
119. Evaluation of certain veterinary drug residues in food (Forty-fifth report of theJoint FAO/WHO Expert Committee on Food Additives). WHO TechnicalReport Series, No. 864, 1996.
120. Toxicological evaluation of certain veterinary drug residues in food. WHO FoodAdditives Series, No. 36, 1996.
121. Residues of some veterinary drugs in animals and foods. FAO Food andNutrition Paper, No. 41/8, 1996.
122. Evaluation of certain food additives and contaminants (Forty-sixth report of theJoint FAO/WHO Expert Committee on Food Additives). WHO TechnicalReport Series, No. 868, 1997.
123. Toxicological evaluation of certain food additives. WHO Food Additives Series,No. 37, 1996.
124. Compendium of food additive specifications, addendum 4. FAO Food andNutrition Paper, No. 52, Add. 4, 1996.
125. Evaluation of certain veterinary drug residues in food (Forty-seventh report ofthe Joint FAO/WHO Expert Committee on Food Additives). WHO TechnicalReport Series, No. 876, 1998.
126. Toxicological evaluation of certain veterinary drug residues in food. WHO FoodAdditives Series, No. 38, 1996.
127. Residues of some veterinary drugs in animals and foods. FAO Food andNutrition Paper, No. 41/9, 1997.
128. Evaluation of certain veterinary drug residues in food (Forty-eighth report ofthe Joint FAO/WHO Expert Committee on Food Additives). WHO TechnicalReport Series, No. 879, 1998.
508 ANNEX 1

129. Toxicological evaluation of certain veterinary drug residues in food. WHO FoodAdditives Series, No. 39, 1997.
130. Residues of some veterinary drugs in animals and foods. FAO Food andNutrition Paper, No. 41/10, 1998.
131. Evaluation of certain food additives and contaminants (Forty-ninth report of theJoint FAO/WHO Expert Committee on Food Additives). WHO TechnicalReport Series, No. 884, 1999.
132. Safety evaluation of certain food additives and contaminants. WHO FoodAdditives Series, No. 40, 1998.
133. Compendium of food additive specifications: addendum 5. FAO Food andNutrition Paper, No. 52, Add. 5, 1997.
134. Evaluation of certain veterinary drug residues in food (Fiftieth report of the JointFAO/WHO Expert Committee on Food Additives). WHO Technical ReportSeries, No. 888, 1999.
135. Toxicological evaluation of certain veterinary drug residues in food. WHO FoodAdditives Series, No. 41, 1998.
136. Residues of some veterinary drugs in animals and foods. FAO Food andNutrition Paper, No. 41/11, 1999.
137. Evaluation of certain food additives (Fifty-first report of the Joint FAO/WHOExpert Committee on Food Additives). WHO Technical Report Series, No. 891,2000.
138. Safety evaluation of certain food additives. WHO Food Additives Series, No.42, 1999.
139. Compendium of food additive specifications, addendum 6. FAO Food andNutrition Paper, No. 52, Add. 6, 1998.
140. Evaluation of certain veterinary drug residues in food (Fifty-second report ofthe Joint FAO/WHO Expert Committee on Food Additives). WHO TechnicalReport Series, No. 893, 2000.
141. Toxicological evaluation of certain veterinary drug residues in food. WHO FoodAdditives Series, No. 43, 2000.
142. Residues of some veterinary drugs in animals and foods. FAO Food andNutrition Paper, No. 41/12, 2000.
143. Evaluation of certain food additives and contaminants (Fifty-third report of theJoint FAO/WHO Expert Committee on Food Additives). WHO TechnicalReport Series, No. 896, 2000.
144. Safety evaluation of certain food additives and contaminants. WHO FoodAdditives Series, No. 44, 2000.
145. Compendium of food additive specifications, addendum 7. FAO Food andNutrition Paper, No. 52, Add. 7, 1999.
146. Evaluation of certain veterinary drug residues in food (Fifty-fourth report of theJoint FAO/WHO Expert Committee on Food Additives). WHO TechnicalReport Series, No. 900, 2001.
147. Toxicological evaluation of certain veterinary drug residues in food. WHO FoodAdditives Series, No. 45, 2000.
148. Residues of some veterinary drugs in animals and foods. FAO Food andNutrition Paper, No. 41/13, 2000.
ANNEX 1 509

149. Evaluation of certain food additives and contaminants (Fifty-fifth report of theJoint FAO/WHO Expert Committee on Food Additives). WHO TechnicalReport Series No. 901, 2001.
150. Safety evaluation of certain food additives and contaminants. WHO FoodAdditives Series, No. 46, 2001.
151. Compendium of food additive specifications: addendum 8. FAO Food andNutrition Paper, No. 52, Add. 8, 2000.
152. Evaluation of certain mycotoxins in food (Fifty-sixth report of the Joint FAO/WHO Expert Committee on Food Additives). WHO Technical Report SeriesNo. 906, 2002.
153. Safety evaluation of certain mycotoxins in food. WHO Food Additives Series,No. 47/FAO Food and Nutrition Paper 74, 2001.
154. Evaluation of certain food additives and contaminants (Fifty-seventh report ofthe Joint FAO/WHO Expert Committee on Food Additives). WHO TechnicalReport Series, No. 909, 2002.
155. Safety evaluation of certain food additives and contaminants. WHO FoodAdditives Series, No. 48, 2002.
156. Compendium of food additive specifications: addendum 9. FAO Food andNutrition Paper, No. 52, Add. 9, 2001.
157. Evaluation of certain veterinary drug residues in food (Fifty-eighth report of theJoint FAO/WHO Expert Committee on Food Additives). WHO TechnicalReport Series, No. 911, 2002.
158. Toxicological evaluation of certain veterinary drug residues in food. WHO FoodAdditives Series, No. 49, 2002.
159. Residues of some veterinary drugs in animals and foods. FAO Food andNutrition Paper, No. 41/14, 2002.
160. Evaluation of certain food additives and contaminants (Fifty-ninth report of theJoint FAO/WHO Expert Committee on Food Additives). WHO TechnicalReport Series, No. 913, 2002.
161. Safety evaluation of certain food additives and contaminants. WHO FoodAdditives Series, No. 50, 2003.
162. Compendium of food additive specifications: addendum 10. FAO Food andNutrition Paper No. 52, Add. 10, 2002.
163. Evaluation of certain veterinary drug residues in food (Sixtieth report of theJoint FAO/WHO Expert Committee on Food Additives). WHO TechnicalReport Series, No. 918, 2003.
164. Toxicological evaluation of certain veterinary drug residues in food. WHO FoodAdditives Series, No. 51, 2003.
165. Residues of some veterinary drugs in animals and foods. FAO Food andNutrition Paper, No. 41/15, 2003.
166. Evaluation of certain food additives and contaminants (Sixty-first report of theJoint FAO/WHO Expert Committee on Food Additives). WHO TechnicalReport Series, No. 922, 2004.
167. Safety evaluation of certain food additives and contaminants. WHO FoodAdditives Series, No. 52, 2004.
168. Compendium of food additive specifications: addendum 11. FAO Food andNutrition Paper, No. 52, Add. 11, 2003.
510 ANNEX 1

169. Evaluation of certain veterinary drug residues in food (Sixty-second report ofthe Joint FAO/WHO Expert Committee on Food Additives). WHO TechnicalReport Series, No. 925, 2004.
170. Residues of some veterinary drugs in animals and foods. FAO Food andNutrition Paper, No. 41/16, 2004.
171. Toxicological evaluation of certain veterinary drug residues in food. WHO FoodAdditives Series, No. 53, 2005.
172. Compendium of food additive specifications: addendum 12. FAO Food andNutrition Paper, No. 52, Add. 12, 2004.
173. Evaluation of certain food additives (Sixty-third report of the Joint FAO/WHOExpert Committee on Food Additives). WHO Technical Report Series, No. 928,2005.
174. Safety evaluation of certain food additives. WHO Food Additives Series, No54, 2005.
175. Compendium of food additive specifications: addendum 13. FAO Food andNutrition Paper, No. 52, Add. 13 (with Errata), 2005.
176. Evaluation of certain food contaminants (Sixty-fourth report of the Joint FAO/WHO Expert Committee on Food Additives). WHO Technical Report Series,No. 930, 2005.
177. Safety evaluation of certain contaminants in food. WHO Food Additives Series,No. 55/FAO Food and Nutrition Paper, No. 82, 2006.
178. Evaluation of certain food additives (Sixty-fifth report of the Joint FAO/WHOExpert Committee on Food Additives). WHO Technical Report Series, No. 934,2006.
179. Safety evaluation of certain food additives. WHO Food Additives Series, No.56, 2006.
180. Combined compendium of food additive specifications. FAO JECFAMonographs 1, Volumes 1–4, 2005, 2006.
181. Evaluation of certain veterinary drug residues in food (Sixty-sixth report of theJoint FAO/WHO Expert Committee on Food Additives). WHO TechnicalReport Series, No. 939, 2006.
182. Residue evaluation of certain veterinary drugs. FAO JECFA Monographs 2,2006.
183. Toxicological evaluation of certain veterinary drug residues in food. WHO FoodAdditives Series, No. 57, 2006.
184. Evaluation of certain food additives and contaminants (Sixty-seventh report ofthe Joint FAO/WHO Expert Committee on Food Additives). WHO TechnicalReport Series, No. 940, 2007.
185. Compendium of food additive specifications. FAO JECFA Monographs 3,2006.
186. Safety evaluation of certain food additives and contaminants. WHO FoodAdditives Series, No. 58, 2007.
187. Evaluation of certain food additives and contaminants (Sixty-eighth report ofthe Joint FAO/WHO Expert Committee on Food Additives). WHO TechnicalReport Series, No. 947, 2007.
188. Safety evaluation of certain food additives and contaminants. WHO FoodAdditives Series, No. 59, 2008.
ANNEX 1 511

189. Compendium of food additive specifications, FAO JECFA Monographs 4,2007.
190. Evaluation of certain food additives (Sixty-ninth report of the Joint FAO/WHOExpert Committee on Food Additives). WHO Technical Report Series, No. 952,2009.
191. Safety evaluation of certain food additives. WHO Food Additives Series, No.60, 2009.
192. Compendium of food additive specifications. FAO JECFA Monographs 5,2009.
193. Evaluation of certain veterinary drug residues in food (Seventieth report of theJoint FAO/WHO Expert Committee on Food Additives). WHO TechnicalReport Series, No. 954, 2009.
194. Toxicological evaluation of certain veterinary drug residues in food. WHO FoodAdditives Series, No. 61, 2009.
195. Residue evaluation of certain veterinary drugs. FAO JECFA Monographs 6,2009.
196. Evaluation of certain food additives (Seventy-first report of the Joint FAO/WHOExpert Committee on Food Additives). WHO Technical Report Series, No. 956,2010.
197. Safety evaluation of certain food additives. WHO Food Additives Series, No.62, 2010.
198. Compendium of food additive specifications. FAO JECFA Monographs 7,2009.
199. Evaluation of certain contaminants in food (Seventy-second report of the JointFAO/WHO Expert Committee on Food Additives). WHO Technical ReportSeries, No. 959, 2011.
200. Safety evaluation of certain contaminants in food. WHO Food Additives Series,No. 63/FAO JECFA Monographs 8, 2011.
201. Residue evaluation of certain veterinary drugs. FAO JECFA Monographs 9,2010.
202. Evaluation of certain food additives and contaminants (Seventy-third report ofthe Joint FAO/WHO Expert Committee on Food Additives). WHO TechnicalReport Series, No. 960, 2011.
203. Safety evaluation of certain food additives and contaminants. WHO FoodAdditives Series, No. 64, 2011.
204. Compendium of food additive specifications. FAO JECFA Monographs 10,2010.
512 ANNEX 1

ANNEX 2
ABBREVIATIONS USED IN THE MONOGRAPHS
1MG 1-microglobulin2MG 2-microglobulin
ADHD attention deficit hyperactivity disorderADI acceptable daily intakeALA aminolaevulinic acidALAD -aminolaevulinic acid dehydrataseALAS -aminolaevulinic acid synthaseALS amyotrophic lateral sclerosisATPase adenosine triphosphataseBIFF-AAS beam injection flame furnace atomic absorption
spectrometryBMD benchmark doseBMDx benchmark dose for an x% responseBMDL 95% lower confidence limit on the benchmark doseBMDLx 95% lower confidence limit on the benchmark dose for an
x% responseBMI body mass indexBMR benchmark responsebw body weightCAS Chemical Abstracts ServiceCHL Chinese hamster lungCHO Chinese hamster ovaryCI confidence intervalCL chemiluminescenceCRM certified reference materialCTX serum crosslinked C-telopeptide of type I collagenCYP cytochrome P450DC50 concentration at which a test material would induce
deoxyribonucleic acid damage in 50% of the cellsDHB dihydroxybenzoic acidDMT1 divalent metal transporter 1DNA deoxyribonucleic acidDPASV differential pulse anodic stripping voltammetryDRC-ICP-MS dynamic reaction cell technology combined with
inductively coupled plasma mass spectrometryDSM-IV Diagnostic and Statistical Manual of Mental Disorders,
4th editionDTH delayed-type hypersensitivityEC50 median effective concentrationED50 median effective doseEDTA ethylenediaminetetraacetic acidEF enrichment factor
- 513 -

EFSA European Food Safety AuthorityETAAS electrothermal (graphite furnace and Zeeman furnace)
atomic absorption spectrometryF female; filial generation (e.g. F0, F1)FAAS flame atomic absorption spectrometryFAO Food and Agriculture Organization of the United NationsFOB functional observational batteryFSANZ Food Standards Australia New ZealandGABA -aminobutyric acidGD gestational dayGEMS/Food Global Environment Monitoring System – Food
Contamination Monitoring and Assessment ProgrammeGFAAS graphite furnace atomic absorption spectrometryGFR glomerular filtration rateGLP good laboratory practiceGSD geometric standard deviationHG-AFS hydride generation atomic fluorescence spectrometryHGPRT hypoxanthine–guanine–phosphoribosyl transferaseHR hazard ratioHR-CS-ETAAS high-resolution continuum source electrothermal atomic
absorption spectrometryHR-ICP-MS high-resolution inductively coupled plasma mass
spectrometryIARC International Agency for Research on CancerIC50 median inhibitory concentrationICP-MS inductively coupled plasma mass spectrometryICP-OES inductively coupled plasma optical emission
spectrometryICP-SMS double focusing sector field inductively coupled plasma
mass spectrometryIQ intelligence quotientIUCLID International Uniform Chemical Information DatabaseJECFA Joint FAO/WHO Expert Committee on Food AdditivesKi inhibition constantLA-ICP-MS laser ablation coupled with inductively coupled plasma
mass spectrometryLC50 median lethal concentrationLC-PDA-MS liquid chromatography–photodiode array–mass
spectrometryLD50 median lethal doseLOAEL lowest-observed-adverse-effect levelLOD limit of detectionLOQ limit of quantificationLOR limit of reportingM male
514 ANNEX 2

MBT 2-mercaptobenzothiazoleML maximum levelMSDI maximized survey-derived intakeMTP1 metal transporter protein 1NA not applicable; not availableNAG N-acetyl- -D-glucosaminidaseND no data reported; not detected; non-detects; not
determinedNFS not further specifiedNHANES National Health and Nutrition Examination Survey (USA)NOAEL no-observed-adverse-effect levelNOEL no-observed-effect levelNR not required for evaluation; not reportedNTP National Toxicology Program (USA)OECD Organisation for Economic Co-operation and
DevelopmentOR odds ratioOSCAR Osteoporosis—Cadmium as a Risk FactorP parental generation (e.g. P1)PAN 1-(2-pyridylazo)-2-naphtholPBPK physiologically based pharmacokineticpHC protein heterogeneous in chargePON1 paraoxanaseppm parts per millionPROT proteinPTMI provisional tolerable monthly intakePTWI provisional tolerable weekly intakeQA quality assurancer correlation coefficientR recoveryRBP retinol-binding proteinrpm revolutions per minuteRR relative riskS9 9000 × g supernatant from rat liverSCE sister chromatid exchangeSD standard deviationSE standard errorSF-ICP-MS sector field inductively coupled plasma mass
spectrometrySGF simulated gastric fluidSIF simulated intestinal fluidSIMAAS simultaneous atomic absorption spectrometrySPE solid-phase extractionSPET single portion exposure techniqueSS-ZAAS solid sampling Zeeman atomic absorption spectrometry
ANNEX 2 515

SWASV square wave anodic stripping voltammetryT3 triiodothyronineT4 thyroxineTDS total diet studyTh T helperTK thymidine kinaseTmax time to maximum concentrationTS-FF-AAS thermospray flame furnace atomic absorption
spectrometryTSH thyroid stimulating hormoneU unitsUDS unscheduled DNA synthesisUSA United States of AmericaUSDA United States Department of AgricultureUSEPA United States Environmental Protection AgencyUSFDA United States Food and Drug AdministrationUSP United States PharmacopeiaUV ultravioletUVC ultraviolet CWHO World Health OrganizationZF-AAS Zeeman furnace atomic absorption spectrometry
516 ANNEX 2

ANNEX 3
JOINT FAO/WHO EXPERT COMMITTEE ON FOOD ADDITIVES
Geneva, 8–17 June 2010
MEMBERS
Dr M. Bolger, Center for Food Safety and Applied Nutrition, Food and DrugAdministration, College Park, MD, USA
Dr M. DiNovi, Center for Food Safety and Applied Nutrition, Food and DrugAdministration, College Park, MD, USA
Dr Y. Kawamura, Division of Food Additives, National Institute of HealthSciences, Tokyo, Japan
Dr J.C. Larsen, National Food Institute, Technical University of Denmark,Søborg, Denmark
Dr A. Mattia, Center for Food Safety and Applied Nutrition, Food and DrugAdministration, College Park, MD, USA (Chairperson)
Mrs I. Meyland, National Food Institute, Technical University of Denmark,Søborg, Denmark (Vice-Chairperson)
Professor A. Renwick, Emeritus Professor, School of Medicine, University ofSouthampton, Ulverston, England (Joint Rapporteur)
Dr J. Schlatter, Nutritional and Toxicological Risks Section, Federal Office ofPublic Health, Zurich, Switzerland
Dr M. Veerabhadra Rao, Department of the President’s Affairs, Al Ain, UnitedArab Emirates
Professor R. Walker, Ash, Aldershot, Hantfordshire, England
Mrs H. Wallin, National Food Safety Authority (Evira), Helsinki, Finland (JointRapporteur)
SECRETARIAT
Dr P.J. Abbott, Biosearch Consulting, Canberra, Australia (WHO TemporaryAdviser)
Dr A. Agudo, Catalan Institute of Oncology, L’Hospitalet de Llobregat, Spain(WHO Temporary Adviser)
Dr D.C. Bellinger, Harvard Medical School Children’s Hospital, Boston, MA,USA (WHO Temporary Adviser)
Dr D. Benford, Food Standards Agency, London, England (WHO TemporaryAdviser)
- 517 -

Dr A. Bruno, Joint FAO/WHO Food Standards Programme, Food andAgriculture Organization of the United Nations, Rome, Italy (FAO CodexSecretariat)
Dr C. Carrington, Center for Food Safety and Applied Nutrition, Food and DrugAdministration, College Park, MD, USA (WHO Temporary Adviser)
Mrs R. Charrondiere, Nutrition and Consumer Protection Division, Food andAgriculture Organization of the United Nations, Rome, Italy (FAO StaffMember)
Dr J. Chen, Chairman of the Codex Committee on Food Additives, ChineseCenters for Disease Control and Prevention, Beijing, China (WHOTemporary Adviser)
Ms S.K. Egan, Center for Food Safety and Applied Nutrition, Food and DrugAdministration, College Park, MD, USA (WHO Temporary Adviser)
Dr D. Folmer, Center for Food Safety and Applied Nutrition, Food and DrugAdministration, College Park, MD, USA (FAO Expert)
Dr S.M.F. Jeurissen, Centre for Substances and Integrated Risk Assessment,National Institute for Public Health and the Environment, Bilthoven,Netherlands (WHO Temporary Adviser)
Dr F. Kayama, School of Medicine, Jichi Medical University, Tochigi, Japan(WHO Temporary Adviser)
Professor S.M. Mahungu, Department of Dairy, Food Science andTechnology, Egerton University, Egerton, Kenya (FAO Expert)
Dr U.W. Mueller, Food Standards Australia New Zealand, Canberra, Australia(WHO Temporary Adviser)
Dr B. Petersen, Exponent, Washington, DC, USA (FAO Expert)
Professor S. Rath, Department of Analytical Chemistry, University ofCampinas, Campinas, São Paulo, Brazil (FAO Expert)
Ms M. Sheffer, Ottawa, Canada (WHO Editor)
Professor I.G. Sipes, College of Medicine, University of Arizona, Tucson, AZ,USA (WHO Temporary Adviser)
Dr A. Tritscher, Department of Food Safety and Zoonoses, World HealthOrganization, Geneva, Switzerland (WHO Joint Secretary)
Dr T. Umemura, Biological Safety Research Center, National Institute ofHealth Sciences, Tokyo, Japan (WHO Temporary Adviser)
Dr P. Verger, Department of Food Safety and Zoonoses, World HealthOrganization, Geneva, Switzerland (WHO Staff Member)
518 ANNEX 3

Dr A. Wennberg, Nutrition and Consumer Protection Division, Food andAgriculture Organization of the United Nations, Rome, Italy (FAO JointSecretary)
Professor G.M. Williams, Department of Pathology, New York MedicalCollege, Valhalla, NY, USA (WHO Temporary Adviser)
ANNEX 3 519

ANNEX 4
TOLERABLE INTAKES, OTHER TOXICOLOGICAL INFORMATION ANDINFORMATION ON SPECIFICATIONS
FOOD ADDITIVES CONSIDERED FOR SPECIFICATIONS ONLY
Food additive Specificationsa
Activated carbon R
Annatto extract (oil-processed bixin) W
Cassia gum R
Indigotine R
Steviol glycosides R
Sucrose esters of fatty acids R
Sucrose monoesters of lauric, palmitic or stearic acid N, T
Titanium dioxide R
a N, new specifications; R, existing specifications revised; T, tentative specifications; W,existing specifications withdrawn.
FLAVOURING AGENTS EVALUATED BY THE PROCEDURE FOR THESAFETY EVALUATION OF FLAVOURING AGENTS1
A. Alicyclic ketones, secondary alcohols and related esters
Flavouring agent No. Specificationsa Conclusion based oncurrent estimated dietaryexposure
Structural class I
Cyclohexanone diethyl ketal 2051 N No safety concern
3,3,5-Trimethylcyclohexyl acetate 2053 N No safety concern
1 The flavouring agent 2-aminoacetophenone (No. 2043) was on the agenda to be evaluatedin the group of aromatic substituted secondary alcohols, ketones and related esters.Although the compound fulfils some of the structural requirements for this group, the maintoxicologically relevant structural feature is the amino group; hence, the compound was notevaluated and should be evaluated in the future in the group of aliphatic and aromaticamines and amides. The flavouring agent (±)-2-phenyl-4-methyl-2-hexenal (No. 2069) wason the agenda to be evaluated in the group of benzyl derivatives. However, as thiscompound did not meet the structural requirements for this group, the compound was notevaluated at this meeting.
- 521 -

A. (contd)
Flavouring agent No. Specificationsa Conclusion based oncurrent estimated dietaryexposure
Structural class II
2-(trans-2-Pentenyl)cyclopentanone 2049 N No safety concern
2-Cyclopentylcyclopentanone 2050 N No safety concern
2-Cyclohexenone 2052 N No safety concern
2,6,6-Trimethyl-2-hydroxycyclohexanone 2054 N No safety concern
Cyclotene propionate 2055 N No safety concern
Cyclotene butyrate 2056 N No safety concern
4-(2-Butenylidene)-3,5,5-trimethylcyclohex-2-en-1-one (mixture ofisomers)
2057 N No safety concern
4-Hydroxy-4-(3-hydroxy-1-butenyl)-3,5,5-trimethyl-2-cyclohexen-1-one (mixture ofisomers)
2058 N No safety concern
Structural class III
( )-8,9-Dehydrotheaspirone 2059 N No safety concern
(±)-2,6,10,10-Tetramethyl-1-oxaspiro[4.5]deca-2,6-dien-8-one
2060 N No safety concern
a N, new specifications.
B. Alicyclic primary alcohols, aldehydes, acids and related esters
Flavouring agent No. Specificationsa Conclusion based oncurrent estimated dietaryexposure
Structural class I
cis-4-(2,2,3-Trimethylcyclopentyl)butanoic acid
1899 N No safety concern
Mixture of 2,4-, 3,5- and 3,6-Dimethyl-3-cyclohexenylcarbaldehyde
1900 N No safety concern
(±)-cis- and trans-1,2-Dihydroperillaldehyde
1902 N No safety concern
d-Limonen-10-ol 1903 N No safety concern
p-Menthan-7-ol 1904 N No safety concern
522 ANNEX 4

B (contd)
Flavouring agent No. Specificationsa Conclusion based oncurrent estimateddietary exposure
p-Menth-1-en-9-ol 1905 N No safety concern
1,3-p-Menthadien-7-al 1906 N No safety concern
Structural class II
Methyl dihydrojasmonate 1898 N No safety concern
cis- and trans-2-Heptylcyclopropanecarboxylic acid
1907 N No safety concern
(±)-cis- and trans-2-Methyl-2-(4-methyl-3-pentenyl)cyclopropanecarbaldehyde
1908 N No safety concern
Structural class III N
Perillaldehyde propyleneglycol acetal 1901 N No safety concern
a N, new specifications.
C. Aliphatic acyclic and alicyclic -diketones and related -hydroxyketones
Flavouring agent No. Specificationsa Conclusion based oncurrentestimated dietary exposure
Structural class II
3-Methyl-2,4-nonedione 2032 N No safety concern
Mixture of 3-Hydroxy-5-methyl-2-hexanone and 2-Hydroxy-5-methyl-3-hexanone
2034 N No safety concern
3-Hydroxy-2-octanone 2035 N No safety concern
2,3-Octanedione 2036 N No safety concern
4,5-Octanedione 2037 N No safety concern
(±)-2-Hydroxypiperitone 2038 N No safety concern
Structural class III
Acetoin propyleneglycol ketal 2033 N No safety concern
1,1 -(Tetrahydro-6a-hydroxy-2,3a,5-trimethylfuro[2,3-d]-1,3-dioxole-2,5-diyl)bis-ethanone
2039 N No safety concern
a N, new specifications.
ANNEX 4 523

D. Aliphatic acyclic and alicyclic terpenoid tertiary alcohols and structurallyrelated substances
Flavouring agent No. Specificationsa Conclusion based on currentestimated dietary exposure
Structural class I
Dimethylbenzyl carbinyl crotonate 2025 N No safety concern
Dimethylbenzyl carbinyl hexanoate 2026 N No safety concern
Caryophyllene alcohol 2027 N No safety concern
Cubebol 2028 N No safety concern
( )-Sclareol 2029 N No safety concern
(+)-Cedrol 2030 N No safety concern
-Bisabolol 2031 N No safety concern
a N, new specifications.
E. Aliphatic and aromatic amines and amides
Flavouring agent No. Specificationsa Conclusion based on currentestimated dietary exposure
Structural class I
Choline chloride 2003 N No safety concern
3-(Methylthio)propylamine 2004 N No safety concern
Structural class III
N-Ethyl-2,2-diisopropylbutanamide 2005 N Additional data required tocomplete evaluation
Cyclopropanecarboxylic acid (2-isopropyl-5-methyl-cyclohexyl)-amide
2006 N No safety concern
(±)-N-Lactoyl tyramine 2007 N Additional data required tocomplete evaluation
N-(2-(Pyridin-2-yl)ethyl)-3-p-menthanecarboxamide
2008 N No safety concern
N-p-Benzeneacetonitrilementhanecarboxamide
2009 N No safety concern
N-(2-Hydroxyethyl)-2,3-dimethyl-2-isopropylbutanamide
2010 N Additional data required tocomplete evaluation
N-(1,1-Dimethyl-2-hydroxyethyl)-2,2-diethylbutanamide
2011 N Additional data required tocomplete evaluation
a N, new specifications.
524 ANNEX 4

F. Aliphatic lactones
Flavouring agent No. Specificationsa Conclusion based on currentestimated dietary exposure
Structural class II
5-Pentyl-3H-furan-2-one 1989 N No safety concern
5-Hydroxy-4-methylhexanoic acid -lactone
1990 N No safety concern
Isoambrettolide 1991 N No safety concern
7-Decen-4-olide 1992 N No safety concern
9-Decen-5-olide 1993 N No safety concern
8-Decen-5-olide 1994 N No safety concern
Orin lactone 1995 N No safety concern
9-Dodecen-5-olide 1996 N No safety concern
9-Tetradecen-5-olide 1997 N No safety concern
-Octadecalactone 1998 N No safety concern
-Octadecalactone 1999 N No safety concern
Structural class III
4-Hydroxy-2-butenoic acid -lactone 2000 N No safety concern
2-Nonenoic acid -lactone 2001 N No safety concern
4-Hydroxy-2,3-dimethyl-2,4-nonadienoic acid -lactone
2002 N No safety concern
a N, new specifications.
G. Aliphatic primary alcohols, aldehydes, carboxylic acids, acetals andesters containing additional oxygenated functional groups
Flavouring agent No. Specificationsa Conclusion based on currentestimated dietary exposure
Structural class I
Hydroxyacetone 1945 N No safety concern
Propyl pyruvate 1946 N No safety concern
Methyl 3-hydroxybutyrate 1947 N No safety concern
Dodecyl lactate 1948 N No safety concern
(±)-Ethyl 3-hydroxy-2-methylbutyrate 1949 N No safety concern
Hexadecyl lactate 1950 N No safety concern
ANNEX 4 525

G (contd)
Flavouring agent No. Specificationsa Conclusion based on currentestimated dietary exposure
Methyl 3-acetoxy-2-methylbutyrate 1951 N No safety concern
1-Hydroxy-4-methyl-2-pentanone 1952 N No safety concern
Ethyl 2-acetylhexanoate 1953 N No safety concern
3-Isopropenyl-6-oxoheptanoic acid 1954 N No safety concern
Ethyl 3-hydroxyoctanoate 1955 N No safety concern
Methyl 3-acetoxyoctanoate 1956 N No safety concern
5-Oxooctanoic acid 1957 N No safety concern
Ethyl 2-acetyloctanoate 1958 N No safety concern
Ethyl 5-acetoxyoctanoate 1959 N No safety concern
5-Oxodecanoic acid 1960 N No safety concern
Ethyl 5-oxodecanoate 1961 N No safety concern
Ethyl 5-hydroxydecanoate 1962 N No safety concern
5-Oxododecanoic acid 1963 N No safety concern
Dimethyl adipate 1964 N No safety concern
Dipropyl adipate 1965 N No safety concern
Diisopropyl adipate 1966 N No safety concern
Diisobutyl adipate 1967 N No safety concern
Dioctyl adipate 1968 N No safety concern
Methyl levulinate 1970 N No safety concern
Propyl levulinate 1971 N No safety concern
Isoamyl levulinate 1972 N No safety concern
cis-3-Hexenyl acetoacetate 1974 N No safety concern
Propyleneglycol diacetate 1976 N No safety concern
Mixture of 6-(5-Decenoyloxy)decanoicacid and 6-(6-Decenoyloxy)decanoicacid
1977 N No safety concern
Propyleneglycol dipropionate 1978 N No safety concern
Propyleneglycol monobutyrate(mixture of isomers)
1979 N No safety concern
Propyleneglycol dibutyrate 1980 N No safety concern
Propyleneglycol mono-2-methylbutyrate (mixture of isomers)
1981 N No safety concern
526 ANNEX 4

G (contd)
Flavouring agent No. Specificationsa Conclusion based on currentestimated dietary exposure
Propyleneglycol di-2-methylbutyrate 1982 N No safety concern
Propyleneglycol monohexanoate(mixture of isomers)
1983 N No safety concern
Propyleneglycol dihexanoate 1984 N No safety concern
Propyleneglycol dioctanoate 1985 N No safety concern
2-Oxo-3-ethyl-4-butanolide 1986 N No safety concern
Ethyl 5-hydroxyoctanoate 1987 N No safety concern
Structural class III
Ethyl acetoacetate ethyleneglycol ketal 1969 N No safety concern
Ethyl levulinate propyleneglycol ketal 1973 N Additional data required tocomplete evaluation
Hydroxycitronellal propyleneglycol acetal 1975 N No safety concern
Mixture of Isopropylideneglyceryl 5-hydroxyoctanoate and -Decalactone(No. 232)
1988 N Additional data required tocomplete evaluation
a N, new specifications.
H. Aliphatic secondary alcohols, ketones and related esters and acetals
Flavouring agent No. Specificationsa Conclusion based on currentestimated dietary exposure
Structural class I
(±)-Octan-3-yl formate 2070 N No safety concern
2-Pentyl 2-methylpentanoate 2072 N No safety concern
3-Octyl butyrate 2073 N No safety concern
Structural class II
(R)-( )-1-Octen-3-ol 2071 N No safety concern
2-Decanone 2074 N No safety concern
Structural class III
6-Methyl-5-hepten-2-onepropyleneglycol acetal
2075 N No safety concern
2-Nonanone propyleneglycol acetal 2076 N No safety concern
a N, new specifications.
ANNEX 4 527

I. Aromatic substituted secondary alcohols, ketones and related esters
Flavouring agent No. Specificationsa Conclusion based oncurrent estimated dietaryexposure
Structural class I
4-Hydroxyacetophenone 2040 N No safety concern
3-Hydroxy-4-phenylbutan-2-one 2041 N No safety concern
2-Methoxyacetophenone 2042 N No safety concern
2-Methylacetophenone 2044 N No safety concern
2-Hydroxy-5-methylacetophenone 2045 N No safety concern
Dihydrogalangal acetate 2046 N Additional data required tocomplete evaluation
2,3,3-Trimethylindan-1-one 2047 N No safety concern
Structural class III
4-(3,4-Methylenedioxyphenyl)-2-butanone
2048 N No safety concern
a N, new specifications.
J. Benzyl derivatives
Flavouring agent No. Specificationsa Conclusion based on currentestimated dietary exposure
Structural class I
Benzyl hexanoate 2061 N No safety concern
o-Anisaldehyde 2062 N No safety concern
Prenyl benzoate 2063 N No safety concern
Benzyl levulinate 2064 N No safety concern
4-Methylbenzyl alcohol 2065 N No safety concern
Benzyl nonanoate 2066 N No safety concern
Structural class II
2-Ethylhexyl benzoate 2068 N No safety concern
Structural class III
4-Methylbenzaldehydepropyleneglycol acetal
2067 N No safety concern
a N, new specifications.
528 ANNEX 4

K. Phenol and phenol derivatives
Flavouring agent No. Specificationsa Conclusion based on currentestimated dietary exposure
Structural class I
4-Propenylphenol 2012 N No safety concern
2,4,6-Trimethylphenol 2013 N No safety concern
Sodium 3-methoxy-4-hydroxycinnamate
2014 N No safety concern
Guaicol butyrate 2015 N No safety concern
Guaicol isobutyrate 2016 N No safety concern
Guaicol propionate 2017 N No safety concern
4-(2-Propenyl)phenyl- -D-glucopyranoside
2018 N No safety concern
Phenyl butyrate 2019 N No safety concern
Hydroxy(4-hydroxy-3-methoxyphenyl)acetic acid
2020 N No safety concern
Structural class II
1-(4-Hydroxy-3-methoxyphenyl)-decan-3-one
2021 N No safety concern
Structural class III
3-(4-Hydroxy-phenyl)-1-(2,4,6-trihydroxy-phenyl)-propan-1-one
2022 N No safety concern
Magnolol 2023 N No safety concern
5,7-Dihydroxy-2-(3-hydroxy-4-methoxy-phenyl)-chroman-4-one
2024 N No safety concern
a N, new specifications.
L. Simple aliphatic and aromatic sulfides and thiols
Flavouring agent No. Specificationsa Conclusion based on currentestimated dietary exposure
Subgroup i: Simple sulfides
Structural class I
Methyl octyl sulfide 1909 N No safety concern
Methyl 1-propenyl sulfide 1910 N No safety concern
Di-(1-propenyl)-sulfide (mixtureof isomers)
1911 N No safety concern
ANNEX 4 529

L (contd)
Flavouring agent No. Specificationsa Conclusion based on currentestimated dietary exposure
Structural class III
Butanal dibenzyl thioacetal 1939 N Additional data required tocomplete evaluation
Subgroup ii: Acyclic sulfides with oxidizedside-chains
Structural class I
Ethyl 2-hydroxyethyl sulfide 1912 N No safety concern
2-(Methylthio)ethyl acetate 1913 N No safety concern
Ethyl 3-(methylthio)-(2Z)-propenoate 1915 N No safety concern
Ethyl 3-(methylthio)-(2E)-propenoate 1916 N No safety concern
Ethyl 3-(methylthio)-2-propenoate(mixture of isomers)
1917 N No safety concern
4-Methyl-2-(methylthiomethyl)-2-pentenal 1918 N No safety concern
4-Methyl-2-(methylthiomethyl)-2-hexenal 1919 N No safety concern
5-Methyl-2-(methylthiomethyl)-2-hexenal 1920 N No safety concern
Butyl -(methylthio)acrylate 1921 N No safety concern
Ethyl 3-(ethylthio)butyrate 1922 N No safety concern
Methional diethyl acetal 1940 N No safety concern
3-(Methylthio)propyl hexanoate 1941 N Additional data required tocomplete evaluation
Structural class III
1-(3-(Methylthio)-butyryl)-2,6,6-trimethylcyclohexene
1942 N No safety concern
Subgroup iii: Cyclic sulfides
Structural class II
2-Oxothiolane 1923 N No safety concern
Structural class III
(±)-cis- and trans-2-Pentyl-4-propyl-1,3-oxathiane
1943 N Additional data required tocomplete evaluation
2-Pentenyl-4-propyl-1,3-oxathiane(mixture of isomers)
1944 N Additional data required tocomplete evaluation
Subgroup iv: Simple thiols
Structural class I
530 ANNEX 4

L (contd)
Flavouring agent No. Specificationsa Conclusion based on currentestimated dietary exposure
Dodecanethiol 1924 N No safety concern
Subgroup v: Thiols with oxidized side-chains
Structural class I
2-Hydroxyethanethiol 1925 N No safety concern
4-Mercapto-4-methyl-2-hexanone 1926 N No safety concern
3-Mercapto-3-methylbutyl isovalerate 1927 N No safety concern
(±)-Ethyl 3-mercapto-2-methylbutanoate 1928 N No safety concern
3-Mercaptohexanal 1929 N No safety concern
3-Mercaptopropionic acid 1936 N No safety concern
2-Ethylhexyl 3-mercaptopropionate 1938 N No safety concern
Structural class III
3-(Methylthio)propyl mercaptoacetate 1914 N Additional data required tocomplete evaluation
Subgroup vii: Simple disulfides
Structural class I
Diisoamyl disulfide 1930 N No safety concern
Butyl propyl disulfide 1932 N No safety concern
di-sec-Butyl disulfide 1933 N No safety concern
Structural class III
Bis(2-methylphenyl) disulfide 1931 N Additional data required tocomplete evaluation
Methyl 2-methylphenyl disulfide 1935 N No safety concern
Subgroup ix: Trisulfides
Structural class I
Diisoamyl trisulfide 1934 N No safety concern
Subgroup xi: Thioesters
Structural class I
Methyl isobutanethioate 1937 N No safety concern
a N, new specifications.
ANNEX 4 531

FLAVOURING AGENTS CONSIDERED FOR SPECIFICATIONS ONLY
No. Flavouring agent Specificationsa
439 4-Carvomenthenol R
952 5,6,7,8-Tetrahydroquinoxaline R
a R, revised specifications.
CONTAMINANTS EVALUATED TOXICOLOGICALLY
Cadmium
Since cadmium was last considered by the Committee, there have been anumber of new epidemiological studies that have reported cadmium-relatedbiomarkers in urine following environmental exposure. The Committee noted that alarge meta-analysis of studies that measured the dose–response relationshipbetween the excretion of 2-microglobulin and cadmium in urine was available. Asthe apparent half-life of cadmium in human kidneys is about 15 years, steady statewould be achieved after 45–60 years of exposure. Therefore, data relating 2-microglobulin excretion in urine to cadmium excretion in urine for individuals whoare 50 years of age and older provided the most reliable basis on which to determinea critical concentration of cadmium in the urine. An analysis of the group mean datafrom individuals who were 50 years of age and older showed that the urinaryexcretion of less than 5.24 (confidence interval 4.94–5.57) μg of cadmium per gramcreatinine was not associated with an increased excretion of 2-microglobulin.Higher urinary cadmium levels were associated with a steep increase in 2-microglobulin excretion.
To determine a corresponding dietary exposure that would result in a urinarycadmium concentration at the breakpoint of 5.24 (confidence interval 4.94–5.57) μgof cadmium per gram creatinine, a one-compartment toxicokinetic model was used.The lower bound of the 5th population percentile dietary cadmium exposure thatequates to the breakpoint was estimated to be 0.8 μg/kg body weight per day or 25μg/kg body weight per month.
The Committee noted that the existing health-based guidance value forcadmium was expressed on a weekly basis (provisional tolerable weekly intake, orPTWI), but, owing to cadmium’s exceptionally long half-life, considered that amonthly value was more appropriate. The Committee therefore withdrew thePTWI of 7 µg/kg body weight.
In view of the long half-life of cadmium, daily ingestion in food has a small oreven a negligible effect on overall exposure. In order to assess long- or short-termrisks to health due to cadmium exposure, total or average intake should beassessed over months, and tolerable intake should be assessed over a period of atleast 1 month. To encourage this view, the Committee decided to express the
532 ANNEX 4

tolerable intake as a monthly value in the form of a provisional tolerable monthlyintake (PTMI). The Committee established a PTMI of 25 µg/kg body weight.
The estimates of exposure to cadmium through the diet for all age groups,including consumers with high exposure and subgroups with special dietary habits(e.g. vegetarians), examined by the Committee at this meeting are below the PTMI.
Lead
Exposure to lead is associated with a wide range of effects, including variousneurodevelopmental effects, mortality (mainly due to cardiovascular diseases),impaired renal function, hypertension, impaired fertility and adverse pregnancyoutcomes. For children, impaired neurodevelopment is generally associated withlower blood lead concentrations than the other effects, the weight of evidence isgreater for neurodevelopmental effects than for other health effects, and the resultsacross studies are more consistent than those for other effects. For adults, theadverse effect associated with lowest blood lead concentrations for which the weightof evidence is greatest and most consistent is a lead-associated increase in systolicblood pressure. Therefore, the Committee concluded that the effects onneurodevelopment and increase in systolic blood pressure provided the appropriatebases for dose–response analyses.
Based on the dose–response analyses, the Committee estimated that thepreviously established PTWI of 25 μg/kg body weight is associated with a decreaseof at least 3 intelligence quotient (IQ) points in children and an increase in systolicblood pressure of approximately 3 mmHg (0.4 kPa) in adults. These changes areimportant when viewed as a shift in the distribution of IQ or blood pressure within apopulation. The Committee therefore concluded that the PTWI could no longerbe considered health protective and withdrew it.
Because the dose–response analyses do not provide any indication of athreshold for the key effects of lead, the Committee concluded that it was notpossible to establish a new PTWI that would be considered to be health protective.The dose–response analyses conducted by the Committee should be used toidentify the magnitude of effect associated with identified levels of dietary leadexposure in different populations.
The Committee reaffirmed that because of the neurodevelopmental effects,fetuses, infants and children are the subgroups that are most sensitive to lead. Theestimated mean dietary exposures of children aged about 1–4 years range from0.03 to 9 μg/kg body weight per day. The health impact at the lower end of this range(0.03 μg/kg body weight per day) is considered negligible by the Committee,because it is below the exposure level of 0.3 μg/kg body weight per day calculatedto be associated with a population decrease of 0.5 IQ point. The higher end of theexposure range (9 μg/kg body weight per day) is higher than the level of 1.9 μg/kgbody weight per day calculated to be associated with a population decrease of 3 IQpoints, which is deemed by the Committee to be a concern. For adults, the meandietary lead exposure estimates range from 0.02 to 3.0 μg/kg body weight per day.The lower end of this range (0.02 μg/kg body weight per day) is considerably belowthe exposure level of 1.2 μg/kg body weight per day calculated by the Committee
ANNEX 4 533

to be associated with a population increase in systolic blood pressure of 1 mmHg(0.1 kPa). The Committee considered that any health risk that would be expectedto occur at this exposure level is negligible. At the higher end of the range (3.0 μg/kg body weight per day), a population increase of approximately 2 mmHg (0.3 kPa)in systolic blood pressure would be expected to occur. An increase of this magnitudehas been associated, in a large meta-analysis, with modest increases in the risksof ischaemic heart disease and cerebrovascular stroke. The Committee consideredthis to be of some concern, but less than that for the neurodevelopmental effectsobserved in children.
The Committee stressed that these estimates are based on dietary exposure(mainly food) and that other sources of exposure to lead also need to be considered.
The Committee concluded that, in populations with prolonged dietaryexposures to lead that are in the higher end of the ranges identified above,measures should be taken to identify major contributing sources and foods and, ifappropriate, to identify methods of reducing dietary exposure that arecommensurate with the level of risk reduction.
534 ANNEX 4

ANNEX 5
SUMMARY OF THE SAFETY EVALUATION OFSECONDARY COMPONENTS FOR FLAVOURING
AGENTS WITH MINIMUM ASSAY VALUES OF LESS THAN 95%
- 535 -

JEC
FA
No.
Fla
vour
ing
agen
tM
inim
um a
ssay
val
ueS
econ
dary
com
pone
nts
Com
men
ts o
n se
cond
ary
com
pone
nts
Alic
yclic
ket
ones
, sec
onda
ry a
lcoh
ols
and
rela
ted
este
rs
2053
3,3,
5-T
rimet
hylc
yclo
hexy
lac
etat
e90
6–7%
3,3
,5-
trim
ethy
lcyc
lohe
xano
l3,
3,5-
Trim
ethy
lcyc
lohe
xano
l (N
o. 1
099)
was
eval
uate
d by
the
Com
mitt
ee a
t its
fifty
-nin
thm
eetin
g (A
nnex
1, r
efer
ence
160
) an
d fo
und
tobe
of n
o sa
fety
con
cern
at e
stim
ated
die
tary
expo
sure
s as
a fl
avou
ring
agen
t.
2055
Cyc
lote
ne p
ropi
onat
e92
4–5%
cyc
lote
neC
yclo
tene
(N
o. 4
18)
was
eva
luat
ed b
y th
eC
omm
ittee
at i
ts fi
fty-f
ifth
mee
ting
(Ann
ex 1
,re
fere
nce
149)
and
was
con
clud
ed to
be
of n
osa
fety
con
cern
at e
stim
ated
die
tary
exp
osur
es a
sa
flavo
urin
g ag
ent.
Alic
yclic
prim
ary
alco
hols
, ald
ehyd
es, a
cids
and
rel
ated
est
ers
1898
Met
hyl d
ihyd
roja
smon
ate
859–
11%
met
hyl e
pi-
dihy
droj
asm
onat
eM
ethy
l epi
-dih
ydro
jasm
onat
e is
exp
ecte
d to
shar
e th
e sa
me
met
abol
ic fa
te a
s th
e pr
imar
ysu
bsta
nce,
i.e.
hyd
roly
sis
to th
e co
rres
pond
ing
acid
and
alc
ohol
, fol
low
ed b
y co
mpl
ete
met
abol
ism
in th
e fa
tty a
cid
path
way
or
tric
arbo
xylic
aci
d cy
cle.
It d
oes
not p
rese
nt a
safe
ty c
once
rn a
t cur
rent
est
imat
ed d
ieta
ryex
posu
res
to th
e fla
vour
ing
agen
t.
1901
Per
illal
dehy
depr
opyl
eneg
lyco
l ace
tal
913–
4% p
erill
alde
hyde
; 2–3
%pr
opyl
ene
glyc
olP
erill
alde
hyde
(No.
973
) and
pro
pyle
ne g
lyco
l are
met
abol
ites
of th
e pr
imar
y su
bsta
nce
and
are
cons
ider
ed n
ot to
pre
sent
a s
afet
y co
ncer
n at
curr
ent e
stim
ated
die
tary
exp
osur
es.
536 ANNEX 5

(con
td)
JEC
FA
No.
Fla
vour
ing
agen
tM
inim
um a
ssay
val
ueS
econ
dary
com
pone
nts
Com
men
ts o
n se
cond
ary
com
pone
nts
1902
(±)-
cis-
and
tran
s-1,
2-D
ihyd
rope
rilla
ldeh
yde
8010
–11%
tran
s-4-
isop
ropy
l-cy
cloh
exan
e-1-
carb
oxal
dehy
de; 4
–5%
cis-
4-is
opro
pyl-
cycl
ohex
ane-
1-ca
rbox
alde
hyde
; 1–2
% 4
-is
opro
peny
l-cyc
lohe
x-1-
enec
arbo
xald
ehyd
e
tran
s-4-
Isop
ropy
l-cyc
lohe
xane
-1-
carb
oxal
dehy
de, c
is-4
-isop
ropy
l-cy
cloh
exan
e-1-
carb
oxal
dehy
de a
nd 4
-is
opro
peny
l-cyc
lohe
x-1-
enec
arbo
xald
ehyd
ear
e ex
pect
ed to
sha
re th
e sa
me
met
abol
ic fa
teas
the
prim
ary
subs
tanc
e, i.
e. o
xida
tion
of th
eal
dehy
de to
the
carb
oxyl
ic a
cid,
follo
wed
by
gluc
uron
ic a
cid
conj
ugat
ion.
The
y do
not
pres
ent a
saf
ety
conc
ern
at c
urre
nt e
stim
ated
diet
ary
expo
sure
s to
the
flavo
urin
g ag
ent.
1906
1,3-
p-M
enth
adie
n-7-
al91
5–6%
cum
in a
ldeh
yde
Cum
in a
ldeh
yde
(No.
868
) w
as e
valu
ated
by
the
Com
mitt
ee a
t its
fifty
-sev
enth
mee
ting
(Ann
ex 1
, ref
eren
ce 1
54) a
nd w
as c
oncl
uded
tobe
of n
o sa
fety
con
cern
at e
stim
ated
die
tary
expo
sure
s to
the
flavo
urin
g ag
ent.
1908
(±)-
cis-
and
tran
s-2-
Met
hyl-2
-(4-
met
hyl-3
-pen
teny
l)cy
clop
ropa
neca
rbal
dehy
de
905–
10%
[2-m
ethy
l-2-(
4-m
ethy
lpen
t-3-
en-1
-yl)-
cycl
opro
pyl]m
etha
nol
[2-M
ethy
l-2-(
4-m
ethy
lpen
t-3-
en-1
-yl)-
cycl
opro
pyl]m
etha
nol i
s a
met
abol
ite o
f the
prim
ary
subs
tanc
e an
d is
exp
ecte
d to
sha
re th
esa
me
met
abol
ic fa
te, i
.e. o
xida
tion
to th
eca
rbox
ylic
aci
d, fo
llow
ed b
y gl
ucur
onic
aci
dco
njug
atio
n. It
doe
s no
t pre
sent
a s
afet
yco
ncer
n at
cur
rent
est
imat
ed d
ieta
ry e
xpos
ures
to th
e fla
vour
ing
agen
t.
ANNEX 5 537

(con
td)
JEC
FA
No.
Fla
vour
ing
agen
tM
inim
um a
ssay
val
ueS
econ
dary
com
pone
nts
Com
men
ts o
n se
cond
ary
com
pone
nts
Alip
hatic
acy
clic
and
alic
yclic
terp
enoi
d te
rtia
ry a
lcoh
ols
and
stru
ctur
ally
rel
ated
sub
stan
ces
2027
Car
yoph
ylle
ne a
lcoh
ol92
3–6%
dih
ydro
clov
en-9
-ol
Dih
ydro
clov
en-9
-ol i
s ex
pect
ed to
sha
re th
e sa
me
met
abol
ic fa
te a
s th
e pr
imar
y su
bsta
nce,
i.e.
form
atio
nof
the
gluc
uron
ic a
cid
conj
ugat
e an
d el
imin
atio
n in
the
urin
e. It
doe
s no
t pre
sent
a s
afet
y co
ncer
n at
cur
rent
estim
ated
die
tary
exp
osur
es to
the
flavo
urin
g ag
ent.
2031
-Bis
abol
ol93
1–2%
-bis
abol
ol-B
isab
olol
is e
xpec
ted
to s
hare
the
sam
e m
etab
olic
fate
as
the
prim
ary
subs
tanc
e, i.
e. fo
rmat
ion
of th
egl
ucur
onic
aci
d co
njug
ate
and
elim
inat
ion
in th
e ur
ine.
It do
es n
ot p
rese
nt a
saf
ety
conc
ern
at c
urre
ntes
timat
ed d
ieta
ry e
xpos
ures
to th
e fla
vour
ing
agen
t.
Alip
hatic
and
aro
mat
ic a
min
es a
nd a
mid
es
2007
(±)-
N-L
acto
yl ty
ram
ine
902–
3% la
ctic
aci
d; 2
–3%
eth
ylla
ctat
eLa
ctic
aci
d (N
o. 9
30)
and
ethy
l lac
tate
(N
o. 9
31)
wer
eev
alua
ted
by th
e C
omm
ittee
at i
ts fi
fty-s
even
th m
eetin
g(A
nnex
1, r
efer
ence
154
) an
d w
ere
conc
lude
d to
be
ofno
saf
ety
conc
ern
at e
stim
ated
die
tary
exp
osur
es a
sfla
vour
ing
agen
ts.
2009
N-p
-Ben
zene
acet
onitr
ilem
enth
anec
arbo
xam
ide
942–
5%N
-p-
benz
enea
ceto
nitr
ilem
enth
anec
arbo
xam
ide,
(1R
,3S
, 4S
); n
eo-is
omer
N-p
-Ben
zene
acet
onitr
ile m
enth
anec
arbo
xam
ide,
(1R
,3S
, 4S
) is
exp
ecte
d to
sha
re th
e sa
me
met
abol
ic fa
teas
the
prim
ary
subs
tanc
e, i.
e. o
xida
tion
follo
wed
by
elim
inat
ion.
It d
oes
not p
rese
nt a
saf
ety
conc
ern
atcu
rren
t est
imat
ed d
ieta
ry e
xpos
ures
to th
e fla
vour
ing
agen
t.
538 ANNEX 5

(con
td)
JEC
FA
No.
Fla
vour
ing
agen
tM
inim
um a
ssay
val
ueS
econ
dary
com
pone
nts
Com
men
ts o
n se
cond
ary
com
pone
nts
Alip
hatic
lact
ones
2002
4-H
ydro
xy-2
,3-
dim
ethy
l-2,4
-no
nadi
enoi
c ac
id
-la
cton
e
931–
2% 3
,4-d
imet
hyl 5
-ke
tobu
tano
ic a
cid
-lact
one
3,4-
Dim
ethy
l 5-k
etob
utan
oic
acid
-la
cton
e is
exp
ecte
dto
sha
re th
e sa
me
met
abol
ic fa
te a
s th
e pr
imar
ysu
bsta
nce,
i.e.
hyd
roly
sis,
follo
wed
by
com
plet
em
etab
olis
m in
the
fatty
aci
d pa
thw
ay o
r tr
icar
boxy
licac
id c
ycle
. It d
oes
not p
rese
nt a
saf
ety
conc
ern
atcu
rren
t est
imat
ed d
ieta
ry e
xpos
ures
to th
e fla
vour
ing
agen
t.
Alip
hatic
prim
ary
alco
hols
, ald
ehyd
es, c
arbo
xylic
aci
ds, a
ceta
ls a
nd e
ster
s co
ntai
ning
add
ition
al o
xyge
nate
d fu
nctio
nal g
roup
s
1948
Dod
ecyl
lact
ate
8810
% d
odec
anol
Dod
ecan
ol is
a m
etab
olite
of t
he p
rimar
y su
bsta
nce
and
is e
xpec
ted
to s
hare
the
sam
e m
etab
olic
fate
, i.e
.hy
drol
ysis
to th
e co
rres
pond
ing
acid
and
alc
ohol
, fol
low
edby
com
plet
e m
etab
olis
m in
the
fatty
aci
d pa
thw
ay o
rtr
icar
boxy
lic a
cid
cycl
e. It
doe
s no
t pre
sent
a s
afet
y co
ncer
nat
cur
rent
est
imat
ed d
ieta
ry e
xpos
ures
to th
e fla
vour
ing
agen
t.
1950
Hex
adec
yl la
ctat
e88
15%
1-h
exad
ecan
ol1-
Hex
adec
anol
(N
o. 1
14)
was
eva
luat
ed b
y th
e C
omm
ittee
at it
s fo
rty-
nint
h m
eetin
g (A
nnex
1, r
efer
ence
131
) an
d w
asco
nclu
ded
to b
e of
no
safe
ty c
once
rn a
t est
imat
ed d
ieta
ryex
posu
res
to th
e fla
vour
ing
agen
t.
1962
Eth
yl 5
-hy
drox
ydec
anoa
te56
40–4
2%
-dec
alac
tone
-Dec
alac
tone
(N
o. 2
32)
was
eva
luat
ed b
y th
e C
omm
ittee
at it
s fif
ty-f
ifth
mee
ting
(Ann
ex 1
, ref
eren
ce 1
49)
and
was
conc
lude
d to
be
of n
o sa
fety
con
cern
at e
stim
ated
die
tary
expo
sure
s to
the
flavo
urin
g ag
ent.
ANNEX 5 539

(con
td)
JEC
FA
No.
Fla
vour
ing
agen
tM
inim
um a
ssay
val
ueS
econ
dary
com
pone
nts
Com
men
ts o
n se
cond
ary
com
pone
nts
1974
cis-
3-H
exen
ylac
etoa
ceta
te93
2–3%
cis
-3-h
exen
olci
s-3-
Hex
enol
is a
met
abol
ite o
f the
prim
ary
sub-
stan
ce a
nd is
exp
ecte
d to
sha
re th
e sa
me
met
abol
ic fa
te,
i.e. h
ydro
lysi
s to
the
corr
espo
ndin
g ac
id a
nd a
lcoh
ol,
follo
wed
by
com
plet
e m
etab
olis
m in
the
fatty
aci
d pa
thw
ayor
tric
arbo
xylic
aci
d cy
cle.
It d
oes
not p
rese
nt a
saf
ety
conc
ern
at c
urre
nt e
stim
ated
die
tary
exp
osur
es to
the
flavo
urin
g ag
ent.
1979
Pro
pyle
negl
ycol
mon
obut
yrat
e88
6–10
% p
ropy
lene
glyc
oldi
buty
rate
Pro
pyle
negl
ycol
dib
utyr
ate
(No.
198
0) w
as e
valu
ated
at th
e cu
rren
t mee
ting
and
was
con
side
red
not t
o pr
esen
ta
safe
ty c
once
rn a
t cur
rent
est
imat
ed d
ieta
ry e
xpos
ures
toth
e fla
vour
ing
agen
t.
1987
Eth
yl 5
-hyd
roxy
octa
noat
e50
5–6%
eth
anol
; 17–
18%
1,5-
octa
nolid
e; 2
1–24
% 5
-hy
drox
ydec
anoi
c ac
id a
ndet
hyl-5
-hyd
roxy
octa
noat
ees
ter
Eth
anol
(N
o. 4
1) w
as e
valu
ated
by
the
Com
mitt
eeat
its
fort
y-si
xth
mee
ting
(Ann
ex 1
, ref
eren
ce 1
22)
and
was
con
clud
ed to
be
of n
o sa
fety
con
cern
at e
stim
ated
diet
ary
expo
sure
s to
the
flavo
urin
g ag
ent.
1,5-
Oct
anol
ide,
5-hy
drox
ydec
anoi
c ac
id a
nd e
thyl
-5-h
ydro
xyoc
tano
ate
este
r ar
e m
etab
olite
s of
the
prim
ary
subs
tanc
e an
dex
pect
ed to
sha
re th
e sa
me
met
abol
ic fa
te a
s th
e pr
imar
ysu
bsta
nce,
i.e.
hyd
roly
sis
to th
e co
rres
pond
ing
acid
and
alco
hol,
follo
wed
by
com
plet
e m
etab
olis
m in
the
fatty
aci
dpa
thw
ay o
r tr
icar
boxy
lic a
cid
cycl
e. T
hey
do n
ot p
rese
nt a
safe
ty c
once
rn a
t cur
rent
est
imat
ed d
ieta
ry e
xpos
ures
toth
e fla
vour
ing
agen
t.
540 ANNEX 5

(con
td)
JEC
FA
No.
Fla
vour
ing
agen
tM
inim
um a
ssay
val
ueS
econ
dary
com
pone
nts
Com
men
ts o
n se
cond
ary
com
pone
nts
1988
Mix
ture
of
Isop
ropy
liden
egly
cery
l 5-
hydr
oxyd
ecan
oate
and
-
Dec
alac
tone
(N
o. 2
32)
73T
he m
ixtu
re c
onta
ins
25%
isop
ropy
liden
egly
cery
l 5-
hydr
oxyd
ecan
oate
and
47–
49%
-dec
alac
tone
(N
o.23
2); o
ther
com
pone
nts
are
22–2
4% 2
,2-d
imet
hyl-1
,3-
diox
olan
e-4-
met
hano
l and
1–5%
2-p
ropy
l 5-
hydr
oxyd
ecan
oate
Isop
ropy
liden
egly
cery
l 5-h
ydro
xyde
cano
ate,
-
deca
lact
one
(No.
232
), 2
,2-d
imet
hyl-1
,3-d
ioxo
lane
-4-
met
hano
l and
2-p
ropy
l 5-h
ydro
xyde
cano
ate
are
expe
cted
to s
hare
the
sam
e m
etab
olic
fate
, i.e
. hyd
roly
sis
to th
e co
rres
pond
ing
acid
and
alc
ohol
, fol
low
ed b
yco
mpl
ete
met
abol
ism
in th
e fa
tty a
cid
path
way
or
tric
arbo
xylic
aci
d cy
cle.
The
y do
not
pre
sent
a s
afet
yco
ncer
n at
cur
rent
est
imat
ed d
ieta
ry e
xpos
ures
to th
efla
vour
ing
agen
t.
Alip
hatic
sec
onda
ry a
lcoh
ols,
ket
ones
and
rel
ated
est
ers
and
acet
als
2075
6-M
ethy
l-5-h
epte
n-2-
one
prop
ylen
egly
col a
ceta
l88
7–9%
6-m
ethy
l-6-
hept
en-2
-one
prop
ylen
egly
col a
ceta
l
6-M
ethy
l-6-h
epte
n-2-
one
prop
ylen
egly
col a
ceta
l is
expe
cted
to s
hare
the
sam
e m
etab
olic
fate
as
the
prim
ary
subs
tanc
e, i.
e. h
ydro
lysi
s to
the
corr
espo
ndin
g ke
tone
and
diol
, fol
low
ed b
y co
mpl
ete
met
abol
ism
in th
e fa
ttyac
id p
athw
ay o
r tr
icar
boxy
lic a
cid
cycl
e. It
doe
s no
tpr
esen
t a s
afet
y co
ncer
n at
cur
rent
est
imat
ed d
ieta
ryex
posu
res
to th
e fla
vour
ing
agen
t.
Aro
mat
ic s
ubst
itute
d se
cond
ary
alco
hols
, ket
ones
and
rel
ated
est
ers
2041
3-H
ydro
xy-4
-ph
enyl
buta
n-2-
one
933–
5% 4
-hyd
roxy
-4-
phen
ylbu
tan-
2-on
e4-
Hyd
roxy
-4-p
heny
lbut
an-2
-one
is e
xpec
ted
to s
hare
the
sam
e m
etab
olic
fate
as
the
prim
ary
subs
tanc
e, i.
e.re
duct
ion
of th
e ke
tone
to th
e co
rres
pond
ing
seco
ndar
yal
coho
l, fo
llow
ed b
y fo
rmat
ion
of th
e gl
ucur
onic
aci
dco
njug
ate
and
elim
inat
ion
in th
e ur
ine.
It d
oes
not p
rese
nta
safe
ty c
once
rn a
t cur
rent
est
imat
ed d
ieta
ry e
xpos
ures
to th
e fla
vour
ing
agen
t.
ANNEX 5 541

(con
td)
JEC
FA
No.
Fla
vour
ing
agen
tM
inim
um a
ssay
val
ueS
econ
dary
com
pone
nts
Com
men
ts o
n se
cond
ary
com
pone
nts
Phe
nol a
nd p
heno
l der
ivat
ives
2014
Sod
ium
3-m
etho
xy-4
-hy
drox
ycin
nam
ate
932–
5% v
anill
inA
n ac
cept
able
dai
ly in
take
(A
DI)
of 0
–10
mg/
kg b
ww
as e
stab
lishe
d fo
r va
nilli
n by
the
Com
mitt
ee a
t its
elev
enth
mee
ting
(Ann
ex, r
efer
ence
14)
. At t
he fi
fty-
seve
nth
mee
ting
of th
e C
omm
ittee
, whe
n va
nilli
n(N
o. 8
89)
was
eva
luat
ed u
sing
the
Pro
cedu
re,
vani
llin
was
con
clud
ed to
be
of n
o sa
fety
con
cern
at
estim
ated
die
tary
exp
osur
es to
the
flavo
urin
g ag
ent,
and
the
AD
I was
mai
ntai
ned
(Ann
ex 1
, ref
eren
ce15
4).
2023
Mag
nolo
l92
3–7%
hon
okio
l; 1–
2%eu
desm
olH
onok
iol a
nd e
udes
mol
are
exp
ecte
d to
sha
re th
esa
me
met
abol
ic fa
te a
s th
e pr
imar
y su
bsta
nce,
i.e.
form
atio
n of
the
gluc
uron
ic a
cid
conj
ugat
e an
del
imin
atio
n in
the
urin
e. T
hey
do n
ot p
rese
nt a
saf
ety
conc
ern
at c
urre
nt e
stim
ated
die
tary
exp
osur
es to
the
flavo
urin
g ag
ent.
Sim
ple
alip
hatic
and
aro
mat
ic s
ulfid
es a
nd th
iols
1915
Eth
yl 3
-(m
ethy
lthio
)-(2
Z)-
prop
enoa
te88
7–9%
eth
yl 3
-(m
ethy
lthio
)-(2
E)-
prop
enoa
te (
No.
1916
)
Eth
yl 3
-(m
ethy
lthio
)-(2
E)-
prop
enoa
te (
No.
191
6) is
expe
cted
to s
hare
the
sam
e m
etab
olic
fate
as
the
prim
ary
subs
tanc
e, i.
e. o
xida
tion
of th
e su
lfur
to th
eco
rres
pond
ing
sulfo
xide
or
sulfo
ne in
add
ition
toes
ter
hydr
olys
is to
the
corr
espo
ndin
g al
coho
l and
carb
oxyl
ic a
cid,
follo
wed
by
gluc
uron
ic a
cid
conj
ugat
ion.
It d
oes
not p
rese
nt a
saf
ety
conc
ern
atcu
rren
t est
imat
ed d
ieta
ry e
xpos
ures
to th
e fla
vour
ing
agen
t.
542 ANNEX 5

(con
td)
JEC
FA
No.
Fla
vour
ing
agen
tM
inim
um a
ssay
val
ueS
econ
dary
com
pone
nts
Com
men
ts o
n se
cond
ary
com
pone
nts
1916
Eth
yl 3
-(m
ethy
lthio
)-(2
E)-
prop
enoa
te81
14–1
6% e
thyl
3-
(met
hylth
io)-
(2Z
)-pr
open
oate
(N
o. 1
915)
Eth
yl 3
-(m
ethy
lthio
)-(2
Z)-
prop
enoa
te (
No.
191
5) is
expe
cted
to s
hare
the
sam
e m
etab
olic
fate
as
the
prim
ary
subs
tanc
e, i.
e. o
xida
tion
of th
e su
lfur
to th
eco
rres
pond
ing
sulfo
xide
or
sulfo
ne in
add
ition
to e
ster
hydr
olys
is to
the
corr
espo
ndin
g al
coho
l and
car
boxy
licac
id, f
ollo
wed
by
gluc
uron
ic a
cid
conj
ugat
ion.
It d
oes
not p
rese
nt a
saf
ety
conc
ern
at c
urre
nt e
stim
ated
diet
ary
expo
sure
s to
the
flavo
urin
g ag
ent.
1932
But
yl p
ropy
l dis
ulfid
e51
24–2
5% d
ipro
pyl d
isul
fide;
23–2
4% d
ibut
yl d
isul
fide
Dip
ropy
l dis
ulfid
e an
d di
buty
l dis
ulfid
e ar
e ex
pect
ed to
shar
e th
e sa
me
met
abol
ic fa
te a
s th
e pr
imar
ysu
bsta
nce,
i.e.
red
uctio
n of
the
disu
lfide
, fol
low
ed b
yfo
rmat
ion
of m
ixed
dis
ulfid
es w
ith g
luta
thio
ne a
ndcy
stei
ne. T
hey
do n
ot p
rese
nt a
saf
ety
conc
ern
atcu
rren
t est
imat
ed d
ieta
ry e
xpos
ures
to th
e fla
vour
ing
agen
t.
1944
2-P
ente
nyl-4
-pro
pyl-1
,3-
oxat
hian
e (m
ixtu
re o
fis
omer
s)
885–
8% 2
-[(2
E)-
pent
-2-e
n-1-
yl]-
4-pr
opyl
-1,3
-oxa
thia
ne;
2–3%
2-[
(1Z
)-pe
nt-1
-en-
1-yl
]-4-
prop
yl-1
,3-o
xath
iane
2-[(
2E)-
Pen
t-2-
en-1
-yl]-
4-pr
opyl
-1,3
-oxa
thia
ne a
nd 2
-[(
1Z)-
pent
-1-e
n-1-
yl]-
4-pr
opyl
-1,3
-oxa
thia
ne a
reex
pect
ed to
sha
re th
e sa
me
met
abol
ic fa
te a
s th
epr
imar
y su
bsta
nce,
i.e.
oxi
diza
tion
to th
e su
lfoxi
de a
ndsu
lfone
and
hyd
roly
sis
to th
e th
ioal
coho
l, w
hich
may
unde
rgo
furt
her
oxid
atio
n, a
lkyl
atio
n or
con
juga
tion.
The
y do
not
pre
sent
a s
afet
y co
ncer
n at
cur
rent
estim
ated
die
tary
exp
osur
es to
the
flavo
urin
g ag
ent.
ANNEX 5 543
