safety element - cityofsantamariaonline.org · prepared by the santa barbara county association of...
TRANSCRIPT

SAFETY ELEMENT of the
SANTA MARIA GENERAL PLAN
Adopted November 21, 1995
CITY OF SANTA MARIA GENERAL PLAN
SAFETY ELEMENT
City of Santa Maria 110 East Cook Street Santa Maria, CA 93454
Prepared by:
Community Development Department 110 South Pine Street, #101
Santa Maria, CA 93454 (80S) 925-0951
Project staff:
Marc P . Bierdzinski, AICP, Project Planner
William H. Orndorff, Director James W. Stern, Assistant Director
Adopted November 21, 1995 City Council Resolution No. 95-149

PREFACE
The Safety Element was last revised by the Santa Maria City Council on April 21, 1987. This document updates the Safety Element adopted in 1987 and provides new information, and develops new goals, policies, objectives and implementation programs.
The goals, policies, objectives and implementation programs in the Safety Element Update are based on the findings contained in the Background Information Report (SIR) . The SIR is included as the technical appendix to the Safety Element Update.
The previous Safety Element addressed safety hazards associated with Geology, Wildland/Urban Fires, Flooding and Emergency Services. The Safety Element Update addresses these hazards along with the following: Electromagnetic Fields, Oil Wells and Oil Sumps, Landfill Gas Migration, Safe Drinking Water Standards, Aircraft Safety, and Hazardous Materials.
The Safety Element Update fulfills the requirements of State Planning and Zoning Law (Government Code Section 65302 (g» which mandates that a local agency's general plan include a safety element.
i

TABLE OF CONTENTS
1. IHTRODUCTIOH
A.
B.
Introduction
Assumptions
I I • SAFETY I!:LEMEHT
A.
B.
c.
Introduction
Findings and Planning Considerations
1-
2.
3 .
4.
5.
6.
7.
B.
9.
10.
Geology/Seismology
Flooding/Dam Inundation
Wildland and Urban Fires
Electromagnetic Fields
Oil Wells and Oil Sumps
Landfill Gas Migration
Safe Drinking Water Levels
Aircraft Safety
Hazardous Materials
Emergency Services
Goals, Policies, Objectives, and Programs
ii
Page
S.l
S.l
S.2
S.2
S.2
S.B
S.10
S.lO
S.14
S.lS
S.16
S.17
5.21
5.23
5.30

Pigure No.
SE-l
SE-2
SE-3
SE-4
SE-S
SE-6
SE-7
Table No.
SE-l
SE-2
LIST OF FIGURES
Title/Deacription
Local Fault Map
Geologic Hazards Map
Planning Area Floodplains
PG&E Electrical Transmission Lines
Magnetic Fields
Airport Hazard Zones
Santa Maria Public Airport Safety Areas
LIST OF TABLES
Title/Description
Active and Potentially Active Faults -Central California Coast Area
URM Classifications
APPENDIX
Background Information Report
iii
Page
S.4
S . S
S.9
S . 12
S.13
S . 18
S.20
Page
S.3
S.7

I. INTRODUCTION
A. INTRODUCTION
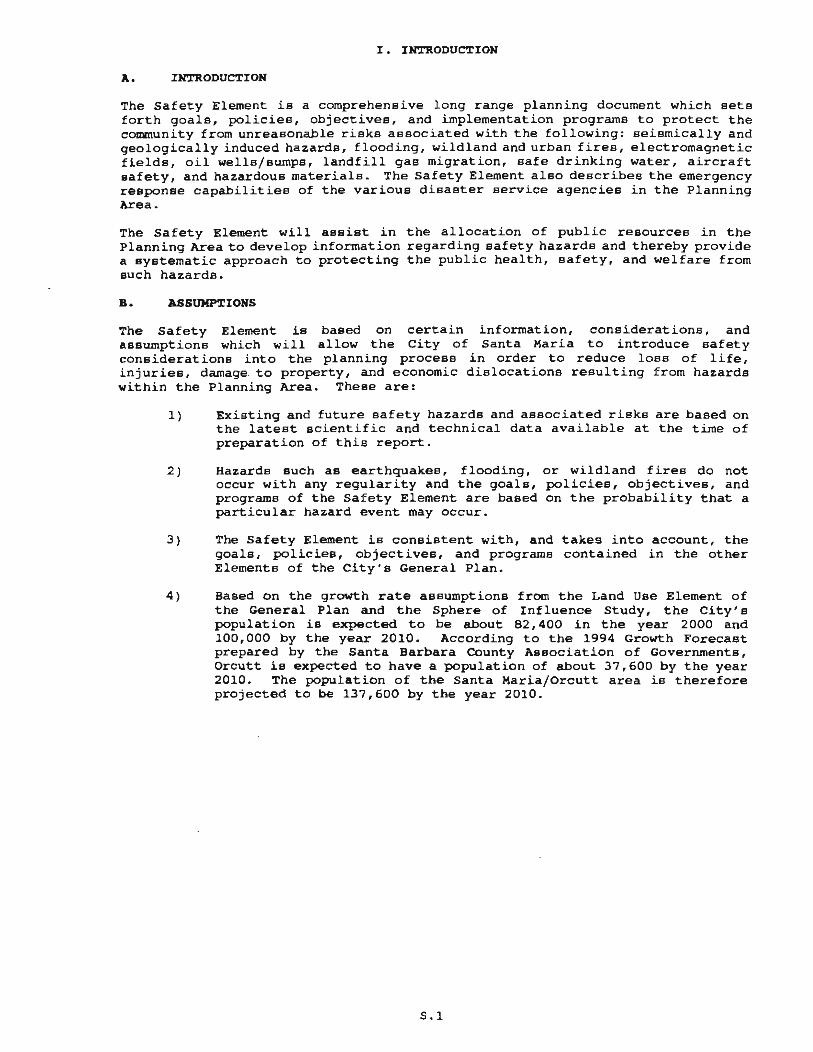
The Safety Element is a comprehensive long range planning document which sets forth goals, policies, objectives, and implementation programs to protect the community from unreasonable risks associated with the following : seismically and geologically induced hazards, flooding, wildland and urban fires, electromagnetic fields, oil wells/sumps, landfill gas migration, safe drinking water, aircraft safety, and hazardous materials . The Safety Element also describes the emergency response capabilities of the various disaster service agencies in the Planning Area .
The Safety Element will assist in the allocation of public resources in the Planning Area to develop information regarding safety hazards and thereby provide a systematic approach to protecting the public health, safety, and welfare from such hazards.
B. ASSUMPTIONS
The Safety Element is based on certain information, considerations, and assumptions which will allow .the City of Santa Maria to introduce safety considerations into the planning process in order to reduce loss of life, injuries, damage to property, and economic dislocations resulting from hazards within the Planning Area. These are:
I} Existing and future safety hazards and associated risks are based on the latest scientific and technical data available at the time of preparation of this report.
2} Hazards such as earthquakes, flooding, or wildland fires do not occur with any regularity and the goals, policies, Objectives, and programs of the Safety Element are based on the probability that a particular hazard event may occur.
3) The Safety Element is consistent with, and takes into account, the goals, policies, objectives, and programs contained in the other Elements of the City's General Plan.
4) Based on the growth rate assumptions from the Land Use Element of the General Plan and the Sphere of Influence Study, the City's population is expected to be about 82,400 in the year 2000 and 100,000 by the year 2010. According to the 1994 Growth Forecast prepared by the Santa Barbara county Association of Governments, Orcutt is expected to have a population of about 37,600 by the year 2010 . The population of the Santa Maria/Orcutt area is therefore projected to be 137,600 by the year 2010.
S . l

I I. SAFETY ELEMEIIT
A . INTRODUCTION
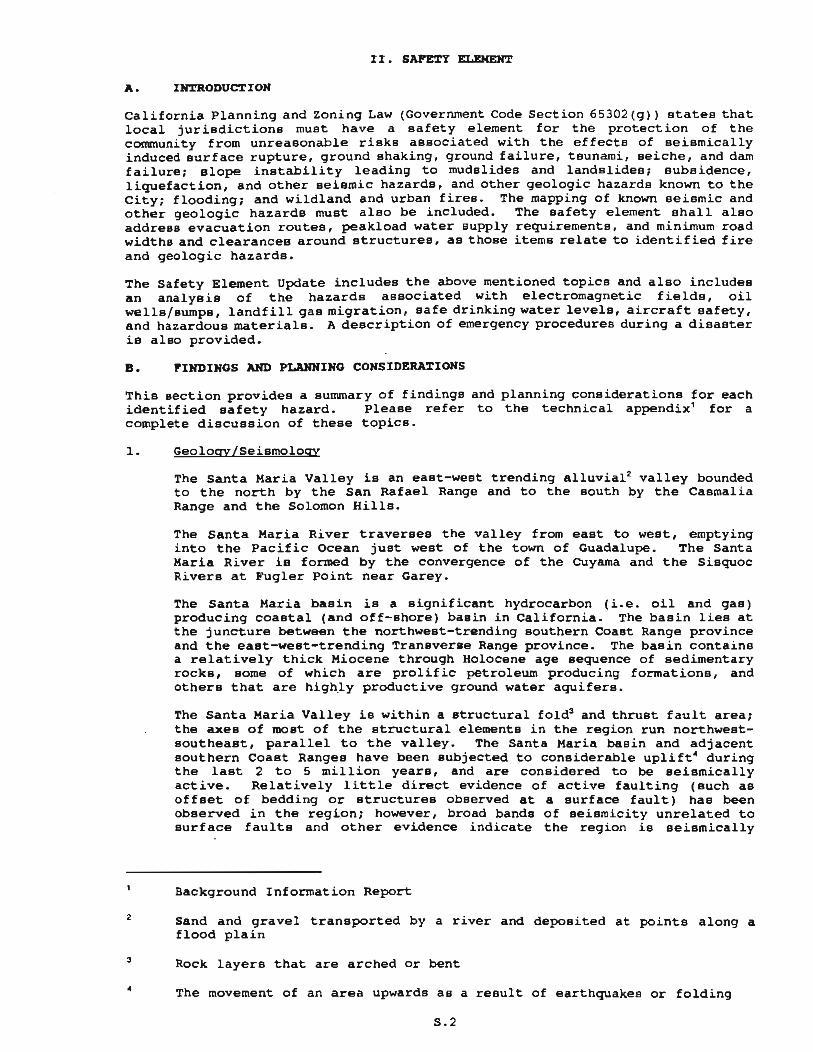
California Planning and Zoning Law (Government Code Section 65302 (g)) states that local jurisdictions must have a safety element for the protection of the community from unreasonable risks associated with the effects of seismically induced surface rupture, ground shaking, ground failure, tsunami , seiche, and dam failure; slope instability leading to mudslides and landslides; subsidence, liquefaction, and other seismic hazards, and other geologic hazards known to the City; flooding; and wildland and urban fires . The mapping of known seismic and other geologic hazards must also be included. The safety element shall also address evacuation routes, peakload water supply requirements, and minimum road widths and clearances around structures, as those items relate to identified fire and geologic hazards .
The Safety Element Update includes the above mentioned topics and also includes an analysis of the hazards associated with electromagnetic fields, oil wells/sumps, landfill gas migration, safe drinking water levels, aircraft safety, and hazardous materials. A description of emergency procedures during a disaster is also provided.
B. P"IHDINOS AND PLAHHINO CONSIDERATIONS
This Bection provides a summary of findings and planni ng considerations for each identified safety hazard. Please refer to the technical appendix' for a complete discuBsion of these top i cs.
1. Geology/Seismology
,
, ,
The Santa Maria Valley is an east-west trending alluvial' valley bounded to the north by the San Rafael Range and to the south by the Casmalia Range and the Solomon Hills.
The Santa Maria River traverses the valley from east to west, emptying into the Pacific Ocean just west of the town of Guadalupe. The Santa Maria River is formed by the convergence of the Cuyama and the Sisquoc Rivers at Fugler Point near Garey.
The Santa Maria basin is a significant hydrocarbon (i.e. oil and gas) producing coastal (and off-shore) basin in California . The basin lies at the juncture between the northwest-trending southern Coast Range province and the east-west-trending Transverse Range province. The basin contains a relatively thick Miocene through Holocene age sequence of sedimentary rocks, some of which are prolific petroleum producing formations , and others that are high.ly productive ground water aquifers .
The Santa Maria Valley is within a structural fold' and thrust fault area; the axes of most of the structural elements in the region run northwestsoutheast, parallel to the valley. The Santa Maria basin and adjacent southern Coast Ranges have been subjected to considerable uplift' during the last 2 to 5 million years, and are considered to be seismically active. Relatively little direct evidence of active faulting (such as offset of bedding or structures observed at a surface fault) has been observed in the region; however, broad bands of seismicity unrelated to surface faults and other evidence indicate the region is seismically
Background Information Report
Sand and gravel transported by a river and deposited at points along a flood plain
Rock layers that are arched or bent
The movement of an area upwards as a result of earthquakes or folding
S.2

5
• 7
•
active. Namson and Daviss interpret the data as indicative of a seismically active, basement-involved fold and thrust be1t6
, where the main seismic activity may be associated with "blind" thrust faults. 7 These are the type of faults that caused the Coalinga and Northridge earthquakes.
Several active, potentially active and inactive faults exist within the basin and region. An active fault is defined as a fault which is or has been active during the last 11,000 years. A potentially active fault is a fault that was active between 11,000 to 500,000 years ago. An inactive fault is a fault which has not moved in the last 500,000 years. Table SE-l lists the active and potentially active faults in the region.
rABLE SE-l ACTIVE AJID POTENTIALLY ACTIVE FAULTS
CEJITRAL CALIFORNIA COAST AREA (1)
'Diatance :froa , Fault City Liait. Statu.
San Andreas 40 miles northeast Active
Nacimiento-Rinconada 18 miles northeast Active
Hosgri 17 miles west Active
Santa Ynez (West) 29 miles south Active
Big Pine 43 miles southeast Potentially Active
Santa Maria Within City Limits Potentially Active
Santa Maria River 0.5 miles north Potentially Active
Bradley Canyon 5 miles east Potentially Active
Casmalia 5 miles south Potentially Active
Lion's Head 7 miles south Potentially Active
(1) Source: Namson and Davis (1990), PG&E (1988).
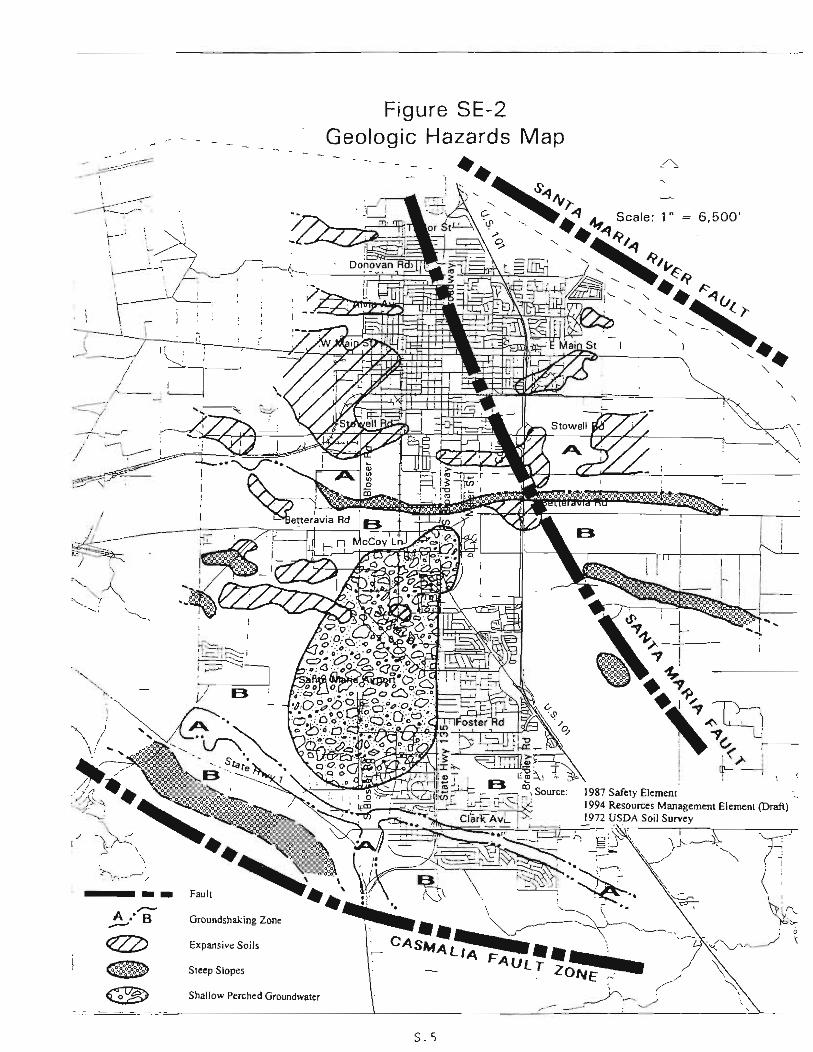
Within the Planning Area, faults generally trend northwest. The major faults include the Santa Karia Fault, the Santa Karia River Fault, and the Casmalia Fault (Figures SE-l and SE-2). None of these faults qualify for Earthquake Fault Zone status as identified by the State Geologist under the Alquist-Priolo Earthquake Fault Zones Act.
Groundshaking
Available geologic information indicates that the potential for strong ground shaking in coastal southern California is high. The potential for severe ground shaking would occur as a result of movement along one of the major California faults (e.g. San Andreas) and such movement could generate significant damage throughout the City. Hore recently, however, scientists theorize that unmapped "blind" thrust faults may have a greater potential for movement than major, known faults. santa Karia has a 40 percent chance of experiencing peak ground accelerations at least 20 percent of gravity. That is enough shaking to cause structural damage.'
Namson and Davis, 1990, Late Cenozoic Fold and Thrust Belt of the Southern Coast Ranges and Santa Maria Basin. California: AAPG Bulletin, v. 74, p. 467-492
Rocks layers which exhibit folding and thrust faulting
Faults that do not reach the surface
Southern California Earthquake Center, 1995
S.3
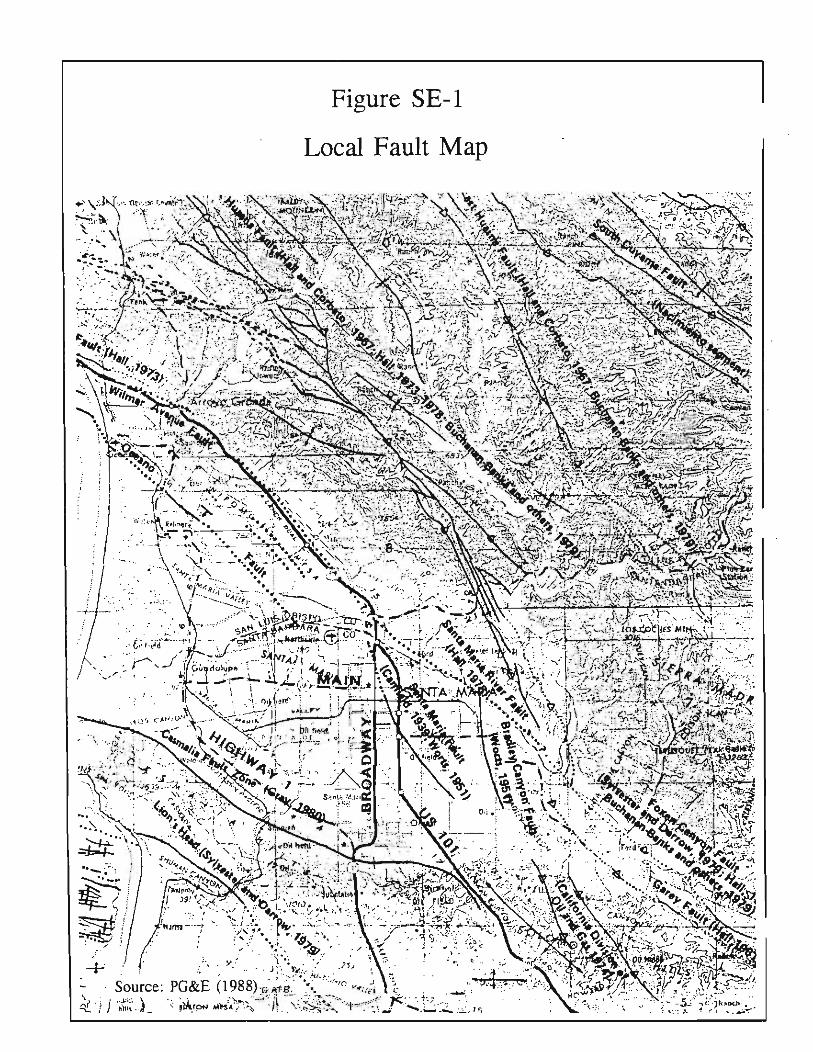
Figure SE-l
Local Fault Map
/
-I-' Source:
J '~ " J :..::.. . ' "

/I~ /'- LJ '
~/ -i --y' , - - -
/ ; "'<::
'~-' I
/
/ I
, . "r, '
'.'-,-,....-'/ -----A,'S ---
Fault
Groundshaking Zone
Expansive Soils
Steep S lopes
Shallow Perched Groundwater
S.,
.., of,
\
•• ~~~~ 1)---~~l
: .., c:. l-----i ; (", : ; t- ---1
1987 Safety Element . 1994 Resources M '-J 972 USDA S. anagement Element (Draft)
_ all

,
'0
" 12
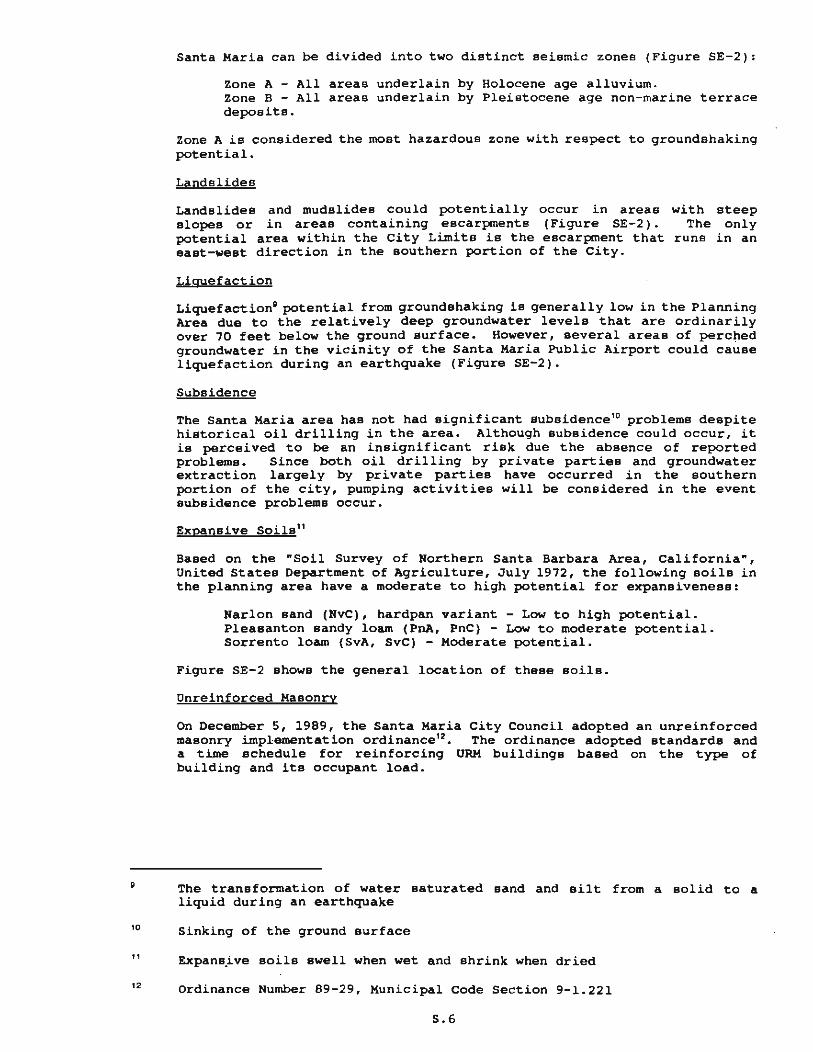
Santa Haria can be divided into two distinct seismic zones (Figure SE-2):
Zone A - All areas underlain by Holocene age alluvium. Zone B - All areas underlain by Pleistocene age non-marine terrace deposits .
Zone A is considered the most hazardous zone with respect to groundshaking potential.
Landslides
Landslides and mudslides could potentially occur in areas slopes or in areas containing escarpments (Figure SE-2). potential area within the City Limits is the escarpment that east-west direction in the southern portion of the City .
Liquefaction
with steep The only
runs in an
Liquefaction' potential from groundshaking is generally low in the Planning Area due to the relatively deep groundwater levels that are ordinarily over 10 feet below the ground surface. However, several areas of perc~ed groundwater in the vicinity of the Santa Maria Public Airport could cause liquefaction during an earthquake (Figure SE-2).
Subsidence
The Santa Haria area has not had significant subsidence'o problems despite historical oil drilling in the area. Although subsidence could occur, it is perceived to be an insignificant risk due the absence of reported problems . Since both oil drilling by private parties and groundwater extraction largely by private parties have occurred in the southern portion of the city, pumping activities will be considered in the event subsidence problems occur.
Expansive soi1s'1
Based on the wSoil Survey of Northern Santa Barbara Area, Californiaw, United States Department of Agriculture, July 1972, the following soils in the planning area have a moderate to high potential for expansiveness:
Narlon sand (NvC), hardpan variant - Low to high potential. Pleasanton Bandy loam (PnA, PnC) - Low to moderate potential . Sorrento loam (SvA, SvC) - Moderate potential.
Figure SE-2 shows the general location of these Boils.
Unrein forced Masonry
On December 5, 1989, the Santa Maria City Council adopted an unreinforced masonry implementation ordinance'2 • The ordinance adopted standards and a time schedule for reinforcing URK buildings based on the type of building and its occupant load.
The transformation of water saturated sand and silt from a solid to a liquid during an earthquake
Sinking of the ground surface
Expans.ive Boils awell when wet and shrink when dried
Ordinance Number 89-29, Municipal Code Section 9-1.221
S.6
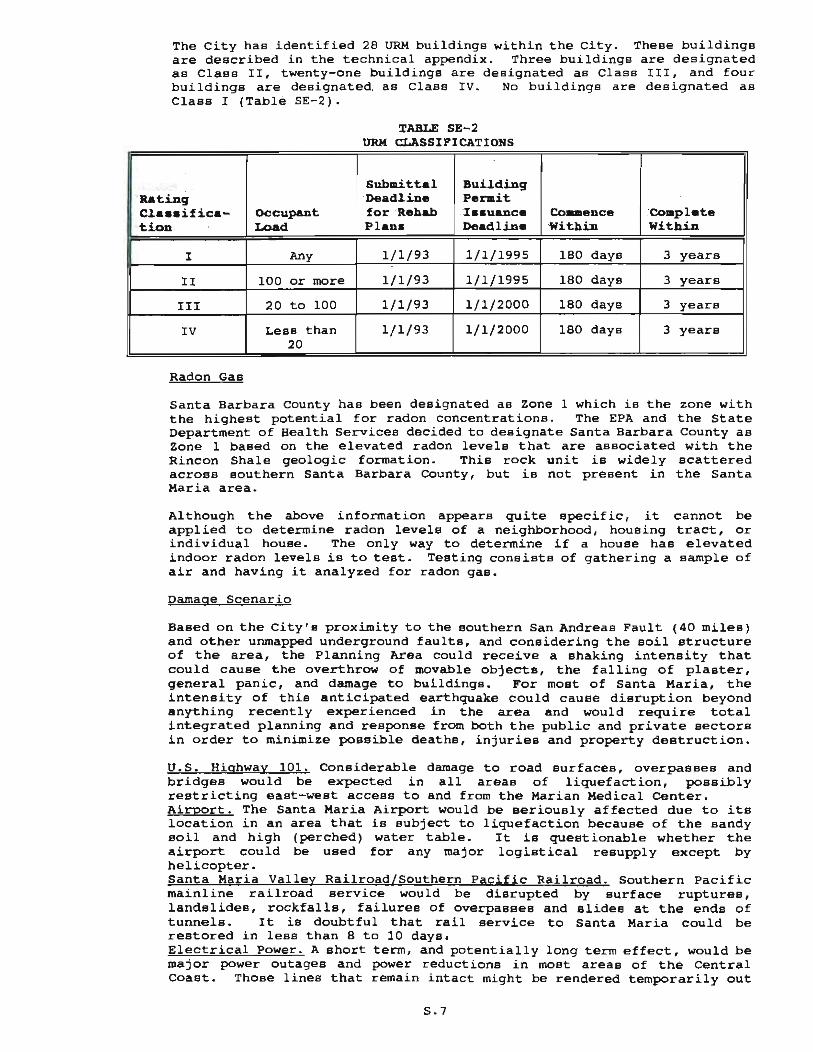
The City has identified 28 URM buildings within the City . These buildings are described in the technical appendix. Three buildings are designated as Class II, twenty-one buildings are designated as Class III, and four buildings are designated. as Class IV. No buildings are deSignated as Class I (Table SE-2).
TABLE SE-2 URN CLASSIFICATIONS
Subaittal Building Rating Deadline Perait CIa •• ific.- occupant for ._hab .I •• u&I1ce - Co_ance eo.plete tioD Load Plan. Deadline Within Within
I Any 1/1/93 1/1/1995 180 days 3 years
II 100 or more 1/1/93 1/1/1995 180 days 3 years
III 20 to 100 1/1/93 1/1/2000 180 days 3 years
IV Less than 1/1/93 1/1/2000 180 days 3 years 20
Radon Gas
Santa Barbara County has been designated as Zone 1 which is the zone with the highest potential for radon concentrations. The EPA and the State Department of Health Services decided to designate Santa Barbara County as Zone 1 based on the elevated radon levels that are associated with the Rincon Shale geologic formation. This rock unit is widely scattered across southern Santa Barbara County, but is not present in the Santa Karia area.
Although the above information appears quite specific, it cannot be applied to determine radon levels of a neighborhood, housing tract, or individual house. The only way to determine if a house has elevated indoor radon levels is to test. Testing consists of gathering a sample of air and having it analyzed for radon gas.
Damage Scenario
Based on the City's proximity to the southern San Andreas Fault (40 miles) and other unmapped underground faults, and considering the soil structure of the area, the Planning Area could receive a shaking intensity that could cause the overthrow of movable objects, the falling of plaster, general panic, and damage to buildings. For most of Santa Karia, the intensity of this anticipated earthquake could cause disruption beyond anything recently experienced in the area and would require total integrated planning and response from both the public and private sectors in order to minimize possible deaths, injuries and property destruction .
u.s. Highway 101. Considerable damage to road surfaces, overpasses and bridges would be expected in all areas of liquefaction, possibly restricting east-west access to and from the Marian Medical Center. Airport. The Santa Maria Airport would be seriously affected due to its location in an area that is subject to liquefaction because of the sandy lIoil and high (perched) water table . It is questionable whether the airport could be used for any major logistical resupply except by helicopter. Santa Maria Valley Railroad/Southern Pacific Railroad. Southern Pacific mainline railroad service would be disrupted by surface ruptures, landslides, rockfalls, failures of overpasses and slides at the ends of tunnels. It is doubtful that rail service to Santa Maria could be restored in less than 8 to 10 days. Electrical Power. A short term, and potentially long term effect, would be major power outages and power reductions in most areas of the Central Coast. Those lines that remain intact might be rendered temporarily out
5.7

of service after each aftershock . The major long-term impact would be on distant power sources, both due to the reduction in transmission capacities and the probable shortage of generator fuel. Transmission lines in santa Karia would stand a good chance of being one of the earlier facilities restored. Natural Gas . Major pipelines leading to the area as well as those in the area could be ruptured. It is uncertain how long the areas could be supported by underground storage. Petroleum Fuels. The processing of petroleum fuels in the area is uncertain. If this source of fuels became unavailable, extremely serious consequences could result due to the inability to resupply fuels by land transport. Telephone Systems. Any surviving telephone service would be overloaded by calls from both inside and outside the area . Radio Systems. Public safety radio systems would continue to function within the Planning .Area. Microwave channels would be disrupted. Commercial Broadcasters. Lack of emergency power would restrict the operation of some television and radio stations. The scarcity of fuels and the unavailability of resupply would limit the operational time of emergency generators. Water Supply and waste Disposal. A major earthquake would seriously disrupt the water distribution system . The Wastewater Treatment Plant would probably suffer some damage and could be inoperative. Lack of electrical power also would cause the plant to shut down. Collection lines throughout the area could be impaired causing significant contamination problems.
2. Flooding/Dam Inundation
Flooding hazards within the Planning Area consist of localized and widespread flooding due to storms, failure of the santa Karia Levee, and from dam inundation caused by the failure of Twitchell Dam. The potential for flooding and dam inundation comes from storm water that is collected in the 260 square mile Santa Maria Valley watershed that is located in both Santa Barbara and San Luis Obispo Counties. The Sisquoc River and Cuyama River watersheds combine to form the Santa Karia Valley watershed.
FlOOding
The flooding associated with the 100-year storm is of primary consideration. The 100-year flood determination is the accepted standard for flood protection by agencies involved in the assessment of flood risks. The Department of Housing and Urban Development (HUD), in their issuance of flood insurance as part of the Flood Protection Disaster Act of 1974, has adopted the 100-year flood level as the determinant of the floodplain area having a hazard potential requiring specific or protective measures . The City has also adopted the 100-year flood plain through its participation in the Flood Insurance Rate Program administered by the Federal Emergency Management Agency.
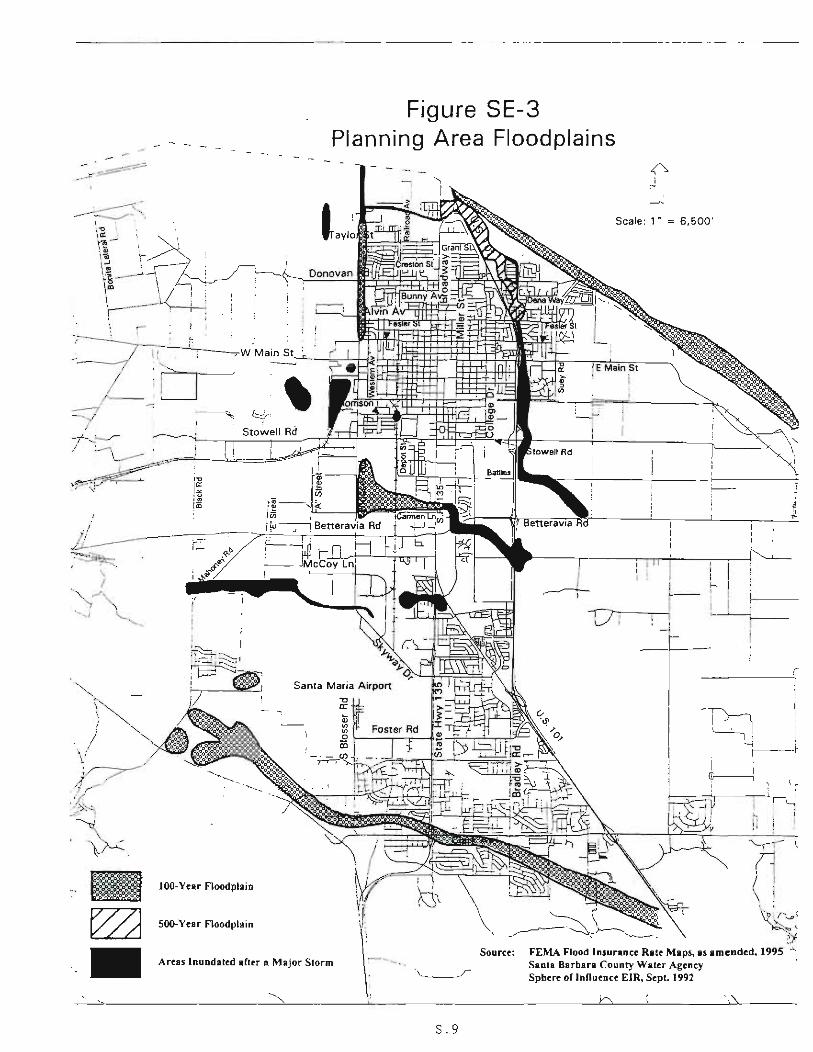
Flood prone areas in the Planning Area are noted in Figure SE-3. The 100-year flood plain is generally in the areas of the Santa Maria River and the Orcutt Creek. The Santa Maria River Levee, built by the U.S. Army Corp of Engineers, is designed to protect the City from the 100-year flood. The Flood Control District patrols the levee any time there is more than a few hundred cubic feet per second flowing in the river. Levee erosion has been experienced and if the levee was allowed to rupture, would create major flooding problems east of u.S. Highway 101. However, the levee does not prevent localized flooding from the various flood control facilities in the Planning Area. These local facilities include a series of storm drains, open channels, and retardation basins. Localized flooding cannot be accurately mapped as it depends on the magnitude and location of the causative storm.
S.B

.~. 100· Yur Floodplain
SOO·Ycar Floodplain
Figure SE-3 Planning Area Floodplains
t
Sourer::
Scale: 1· = 6,500'
_____ --'r
~1 --it-I ---'
"'--rT \
n ( I ~:
':f Areas Inundated after a Major Storm - -- FEMA Flood Insurance Ra!c Maps, as amended. 1995 ~
Santa Barbara County Water Agcncy ( Sphere of Influence EJR. Sept. 1992
S. 9
I. INTRODUCTION
A. INTRODUCTION
The Safety Element is a comprehensive long range planning document which sets forth goals, policies, objectives, and implementation programs to protect the community from unreasonable risks associated with the following : seismically and geologically induced hazards, flooding, wildland and urban fires, electromagnetic fields, oil wells/sumps, landfill gas migration, safe drinking water, aircraft safety, and hazardous materials . The Safety Element also describes the emergency response capabilities of the various disaster service agencies in the Planning Area .
The Safety Element will assist in the allocation of public resources in the Planning Area to develop information regarding safety hazards and thereby provide a systematic approach to protecting the public health, safety, and welfare from such hazards.
B. ASSUMPTIONS
The Safety Element is based on certain information, considerations, and assumptions which will allow .the City of Santa Maria to introduce safety considerations into the planning process in order to reduce loss of life, injuries, damage to property, and economic dislocations resulting from hazards within the Planning Area. These are:
I} Existing and future safety hazards and associated risks are based on the latest scientific and technical data available at the time of preparation of this report.
2} Hazards such as earthquakes, flooding, or wildland fires do not occur with any regularity and the goals, policies, Objectives, and programs of the Safety Element are based on the probability that a particular hazard event may occur.
3) The Safety Element is consistent with, and takes into account, the goals, policies, objectives, and programs contained in the other Elements of the City's General Plan.
4) Based on the growth rate assumptions from the Land Use Element of the General Plan and the Sphere of Influence Study, the City's population is expected to be about 82,400 in the year 2000 and 100,000 by the year 2010. According to the 1994 Growth Forecast prepared by the Santa Barbara county Association of Governments, Orcutt is expected to have a population of about 37,600 by the year 2010 . The population of the Santa Maria/Orcutt area is therefore projected to be 137,600 by the year 2010.
S . l
I I. SAFETY ELEMEIIT
A . INTRODUCTION
California Planning and Zoning Law (Government Code Section 65302 (g)) states that local jurisdictions must have a safety element for the protection of the community from unreasonable risks associated with the effects of seismically induced surface rupture, ground shaking, ground failure, tsunami , seiche, and dam failure; slope instability leading to mudslides and landslides; subsidence, liquefaction, and other seismic hazards, and other geologic hazards known to the City; flooding; and wildland and urban fires . The mapping of known seismic and other geologic hazards must also be included. The safety element shall also address evacuation routes, peakload water supply requirements, and minimum road widths and clearances around structures, as those items relate to identified fire and geologic hazards .
The Safety Element Update includes the above mentioned topics and also includes an analysis of the hazards associated with electromagnetic fields, oil wells/sumps, landfill gas migration, safe drinking water levels, aircraft safety, and hazardous materials. A description of emergency procedures during a disaster is also provided.
B. P"IHDINOS AND PLAHHINO CONSIDERATIONS
This Bection provides a summary of findings and planni ng considerations for each identified safety hazard. Please refer to the technical appendix' for a complete discuBsion of these top i cs.
1. Geology/Seismology
,
, ,
The Santa Maria Valley is an east-west trending alluvial' valley bounded to the north by the San Rafael Range and to the south by the Casmalia Range and the Solomon Hills.
The Santa Maria River traverses the valley from east to west, emptying into the Pacific Ocean just west of the town of Guadalupe. The Santa Maria River is formed by the convergence of the Cuyama and the Sisquoc Rivers at Fugler Point near Garey.
The Santa Maria basin is a significant hydrocarbon (i.e. oil and gas) producing coastal (and off-shore) basin in California . The basin lies at the juncture between the northwest-trending southern Coast Range province and the east-west-trending Transverse Range province. The basin contains a relatively thick Miocene through Holocene age sequence of sedimentary rocks, some of which are prolific petroleum producing formations , and others that are high.ly productive ground water aquifers .
The Santa Maria Valley is within a structural fold' and thrust fault area; the axes of most of the structural elements in the region run northwestsoutheast, parallel to the valley. The Santa Maria basin and adjacent southern Coast Ranges have been subjected to considerable uplift' during the last 2 to 5 million years, and are considered to be seismically active. Relatively little direct evidence of active faulting (such as offset of bedding or structures observed at a surface fault) has been observed in the region; however, broad bands of seismicity unrelated to surface faults and other evidence indicate the region is seismically
Background Information Report
Sand and gravel transported by a river and deposited at points along a flood plain
Rock layers that are arched or bent
The movement of an area upwards as a result of earthquakes or folding
S.2

5
• 7
•
active. Namson and Daviss interpret the data as indicative of a seismically active, basement-involved fold and thrust be1t6
, where the main seismic activity may be associated with "blind" thrust faults. 7 These are the type of faults that caused the Coalinga and Northridge earthquakes.
Several active, potentially active and inactive faults exist within the basin and region. An active fault is defined as a fault which is or has been active during the last 11,000 years. A potentially active fault is a fault that was active between 11,000 to 500,000 years ago. An inactive fault is a fault which has not moved in the last 500,000 years. Table SE-l lists the active and potentially active faults in the region.
rABLE SE-l ACTIVE AJID POTENTIALLY ACTIVE FAULTS
CEJITRAL CALIFORNIA COAST AREA (1)
'Diatance :froa , Fault City Liait. Statu.
San Andreas 40 miles northeast Active
Nacimiento-Rinconada 18 miles northeast Active
Hosgri 17 miles west Active
Santa Ynez (West) 29 miles south Active
Big Pine 43 miles southeast Potentially Active
Santa Maria Within City Limits Potentially Active
Santa Maria River 0.5 miles north Potentially Active
Bradley Canyon 5 miles east Potentially Active
Casmalia 5 miles south Potentially Active
Lion's Head 7 miles south Potentially Active
(1) Source: Namson and Davis (1990), PG&E (1988).
Within the Planning Area, faults generally trend northwest. The major faults include the Santa Karia Fault, the Santa Karia River Fault, and the Casmalia Fault (Figures SE-l and SE-2). None of these faults qualify for Earthquake Fault Zone status as identified by the State Geologist under the Alquist-Priolo Earthquake Fault Zones Act.
Groundshaking
Available geologic information indicates that the potential for strong ground shaking in coastal southern California is high. The potential for severe ground shaking would occur as a result of movement along one of the major California faults (e.g. San Andreas) and such movement could generate significant damage throughout the City. Hore recently, however, scientists theorize that unmapped "blind" thrust faults may have a greater potential for movement than major, known faults. santa Karia has a 40 percent chance of experiencing peak ground accelerations at least 20 percent of gravity. That is enough shaking to cause structural damage.'
Namson and Davis, 1990, Late Cenozoic Fold and Thrust Belt of the Southern Coast Ranges and Santa Maria Basin. California: AAPG Bulletin, v. 74, p. 467-492
Rocks layers which exhibit folding and thrust faulting
Faults that do not reach the surface
Southern California Earthquake Center, 1995
S.3

Figure SE-l
Local Fault Map
/
-I-' Source:
J '~ " J :..::.. . ' "
/I~ /'- LJ '
~/ -i --y' , - - -
/ ; "'<::
'~-' I
/
/ I
, . "r, '
'.'-,-,....-'/ -----A,'S ---
Fault
Groundshaking Zone
Expansive Soils
Steep S lopes
Shallow Perched Groundwater
S.,
.., of,
\
•• ~~~~ 1)---~~l
: .., c:. l-----i ; (", : ; t- ---1
1987 Safety Element . 1994 Resources M '-J 972 USDA S. anagement Element (Draft)
_ all
,
'0
" 12
Santa Haria can be divided into two distinct seismic zones (Figure SE-2):
Zone A - All areas underlain by Holocene age alluvium. Zone B - All areas underlain by Pleistocene age non-marine terrace deposits .
Zone A is considered the most hazardous zone with respect to groundshaking potential.
Landslides
Landslides and mudslides could potentially occur in areas slopes or in areas containing escarpments (Figure SE-2). potential area within the City Limits is the escarpment that east-west direction in the southern portion of the City .
Liquefaction
with steep The only
runs in an
Liquefaction' potential from groundshaking is generally low in the Planning Area due to the relatively deep groundwater levels that are ordinarily over 10 feet below the ground surface. However, several areas of perc~ed groundwater in the vicinity of the Santa Maria Public Airport could cause liquefaction during an earthquake (Figure SE-2).
Subsidence
The Santa Haria area has not had significant subsidence'o problems despite historical oil drilling in the area. Although subsidence could occur, it is perceived to be an insignificant risk due the absence of reported problems . Since both oil drilling by private parties and groundwater extraction largely by private parties have occurred in the southern portion of the city, pumping activities will be considered in the event subsidence problems occur.
Expansive soi1s'1
Based on the wSoil Survey of Northern Santa Barbara Area, Californiaw, United States Department of Agriculture, July 1972, the following soils in the planning area have a moderate to high potential for expansiveness:
Narlon sand (NvC), hardpan variant - Low to high potential. Pleasanton Bandy loam (PnA, PnC) - Low to moderate potential . Sorrento loam (SvA, SvC) - Moderate potential.
Figure SE-2 shows the general location of these Boils.
Unrein forced Masonry
On December 5, 1989, the Santa Maria City Council adopted an unreinforced masonry implementation ordinance'2 • The ordinance adopted standards and a time schedule for reinforcing URK buildings based on the type of building and its occupant load.
The transformation of water saturated sand and silt from a solid to a liquid during an earthquake
Sinking of the ground surface
Expans.ive Boils awell when wet and shrink when dried
Ordinance Number 89-29, Municipal Code Section 9-1.221
S.6

The City has identified 28 URM buildings within the City . These buildings are described in the technical appendix. Three buildings are designated as Class II, twenty-one buildings are designated as Class III, and four buildings are designated. as Class IV. No buildings are deSignated as Class I (Table SE-2).
TABLE SE-2 URN CLASSIFICATIONS
Subaittal Building Rating Deadline Perait CIa •• ific.- occupant for ._hab .I •• u&I1ce - Co_ance eo.plete tioD Load Plan. Deadline Within Within
I Any 1/1/93 1/1/1995 180 days 3 years
II 100 or more 1/1/93 1/1/1995 180 days 3 years
III 20 to 100 1/1/93 1/1/2000 180 days 3 years
IV Less than 1/1/93 1/1/2000 180 days 3 years 20
Radon Gas
Santa Barbara County has been designated as Zone 1 which is the zone with the highest potential for radon concentrations. The EPA and the State Department of Health Services decided to designate Santa Barbara County as Zone 1 based on the elevated radon levels that are associated with the Rincon Shale geologic formation. This rock unit is widely scattered across southern Santa Barbara County, but is not present in the Santa Karia area.
Although the above information appears quite specific, it cannot be applied to determine radon levels of a neighborhood, housing tract, or individual house. The only way to determine if a house has elevated indoor radon levels is to test. Testing consists of gathering a sample of air and having it analyzed for radon gas.
Damage Scenario
Based on the City's proximity to the southern San Andreas Fault (40 miles) and other unmapped underground faults, and considering the soil structure of the area, the Planning Area could receive a shaking intensity that could cause the overthrow of movable objects, the falling of plaster, general panic, and damage to buildings. For most of Santa Karia, the intensity of this anticipated earthquake could cause disruption beyond anything recently experienced in the area and would require total integrated planning and response from both the public and private sectors in order to minimize possible deaths, injuries and property destruction .
u.s. Highway 101. Considerable damage to road surfaces, overpasses and bridges would be expected in all areas of liquefaction, possibly restricting east-west access to and from the Marian Medical Center. Airport. The Santa Maria Airport would be seriously affected due to its location in an area that is subject to liquefaction because of the sandy lIoil and high (perched) water table . It is questionable whether the airport could be used for any major logistical resupply except by helicopter. Santa Maria Valley Railroad/Southern Pacific Railroad. Southern Pacific mainline railroad service would be disrupted by surface ruptures, landslides, rockfalls, failures of overpasses and slides at the ends of tunnels. It is doubtful that rail service to Santa Maria could be restored in less than 8 to 10 days. Electrical Power. A short term, and potentially long term effect, would be major power outages and power reductions in most areas of the Central Coast. Those lines that remain intact might be rendered temporarily out
5.7

of service after each aftershock . The major long-term impact would be on distant power sources, both due to the reduction in transmission capacities and the probable shortage of generator fuel. Transmission lines in santa Karia would stand a good chance of being one of the earlier facilities restored. Natural Gas . Major pipelines leading to the area as well as those in the area could be ruptured. It is uncertain how long the areas could be supported by underground storage. Petroleum Fuels. The processing of petroleum fuels in the area is uncertain. If this source of fuels became unavailable, extremely serious consequences could result due to the inability to resupply fuels by land transport. Telephone Systems. Any surviving telephone service would be overloaded by calls from both inside and outside the area . Radio Systems. Public safety radio systems would continue to function within the Planning .Area. Microwave channels would be disrupted. Commercial Broadcasters. Lack of emergency power would restrict the operation of some television and radio stations. The scarcity of fuels and the unavailability of resupply would limit the operational time of emergency generators. Water Supply and waste Disposal. A major earthquake would seriously disrupt the water distribution system . The Wastewater Treatment Plant would probably suffer some damage and could be inoperative. Lack of electrical power also would cause the plant to shut down. Collection lines throughout the area could be impaired causing significant contamination problems.
2. Flooding/Dam Inundation
Flooding hazards within the Planning Area consist of localized and widespread flooding due to storms, failure of the santa Karia Levee, and from dam inundation caused by the failure of Twitchell Dam. The potential for flooding and dam inundation comes from storm water that is collected in the 260 square mile Santa Maria Valley watershed that is located in both Santa Barbara and San Luis Obispo Counties. The Sisquoc River and Cuyama River watersheds combine to form the Santa Karia Valley watershed.
FlOOding
The flooding associated with the 100-year storm is of primary consideration. The 100-year flood determination is the accepted standard for flood protection by agencies involved in the assessment of flood risks. The Department of Housing and Urban Development (HUD), in their issuance of flood insurance as part of the Flood Protection Disaster Act of 1974, has adopted the 100-year flood level as the determinant of the floodplain area having a hazard potential requiring specific or protective measures . The City has also adopted the 100-year flood plain through its participation in the Flood Insurance Rate Program administered by the Federal Emergency Management Agency.
Flood prone areas in the Planning Area are noted in Figure SE-3. The 100-year flood plain is generally in the areas of the Santa Maria River and the Orcutt Creek. The Santa Maria River Levee, built by the U.S. Army Corp of Engineers, is designed to protect the City from the 100-year flood. The Flood Control District patrols the levee any time there is more than a few hundred cubic feet per second flowing in the river. Levee erosion has been experienced and if the levee was allowed to rupture, would create major flooding problems east of u.S. Highway 101. However, the levee does not prevent localized flooding from the various flood control facilities in the Planning Area. These local facilities include a series of storm drains, open channels, and retardation basins. Localized flooding cannot be accurately mapped as it depends on the magnitude and location of the causative storm.
S.B
.~. 100· Yur Floodplain
SOO·Ycar Floodplain
Figure SE-3 Planning Area Floodplains
t
Sourer::
Scale: 1· = 6,500'
_____ --'r
~1 --it-I ---'
"'--rT \
n ( I ~:
':f Areas Inundated after a Major Storm - -- FEMA Flood Insurance Ra!c Maps, as amended. 1995 ~
Santa Barbara County Water Agcncy ( Sphere of Influence EJR. Sept. 1992
S. 9

Dam Inundation
Twitchell Dam is the closest potential source of dam inundation in the Planning Area. However, Twitchell Dam is not used for perennial water storage. The dam was constructed by the Bureau of Reclamation in 1958, and is primarily used for groundwater recharge and flood control. It is an earthfill darn, 216 feet in height, with a storage capacity of over 240,000 acre-feet. If Twitchell Darn is filled to capacity and the darn and the Santa Maria Levee fail, a significant portion of the City would be inundated by flood waters.'3 However, the probability of total dam failure and levee failure is remote. In addition, the dam holds water only periodically and is not a reservoir.
3. Wildland and Urban Fires
Fires in undeveloped areas usually result from the ignition of grasses and brush material, and are often referred to as wildland fires. Wildland fires in the santa Maria Planning Area are characterized as limited grassland and brush fires due to the absence of extensive tracts of mountainous, brush covered terrain. Factors influencing wildland fires in the Planning area are climate, vegetation, slope and human proximity.
The most significant wildland fire hazards in the Planning Area are associated with the coastal sage scrub and grass covered slopes in the Casmalia and Solomon Hills to the south of the City. In this area, the factors of vegetation, slope, and human proximity interact to create the most significant relative level of risk.
The oak savannah hillsides to the east of U. S. 101 and north of Clark Avenue represent another wildland fire hazard area. The native vegetation which remains in this general location could ignite and create a localized hazard~ A fire in this vicinity would not be as vigorous as a similar outbreak in the Casmalia or Solomon Hills.
The Santa Maria Valley Oil Field represents another type of fire risk. The presence of flammable liquids and spark producing machinery create the possibility of fire initially fueled by residual petroleum that could spread to grasses and weeds growing near wells and pipelines.
The remaining areas of Santa Maria are generally protected from most aspects of grassland and brush fires. However, accumulating weeds along roadsides and in vacant lots make even urban locations potentially hazardous from a wildland fire standpoint. For these reasons, an enforceable weed abatement program is necessary to reduce these risks whenever structures are present.
The risk of urban fires is no greater than any other area. Fire codes and building setback restrictions are enforced along with the previously mentioned weed abatement program.
4. Electromagnetic Fields
!3
Electromagnetic energy occurs over a broad range of frequencies. The frequencies, or Hertz (Hz), within the planning area range from 60 Hz associated with power transmission and electrical appliances to 3 x 10'0 Hz associated with microwaves. In between these frequencies are EMFs generated by radio, television, and radar transmissions. In recent years, electric and magnetic fields (EMF) from these uses have come under scientific scrutiny regarding possible effects on human health.
EMF fields are found whenever electricity is used. This includes not only utility transmission and distribution lines, but also in the building wires in homes, offices and schools and in the appliances and machinery used in these locations. While concerns about EMF originally focused on
San Luis Obispo County Dam Failure Evacuation Plan, April 1991.
S.lO
electric fields, much of the recent research has focused on magnetic fields.
The medical and scientific communities have been unable to determine that EMF causes adverse health effects or to establish any standard or level of exposure that is known to be either safe or harmful. Some studies have suggested an association between magnetic fields and certain cancers, while others have not. Laboratory experLments have shown that magnetic fields can cause biologic changes in living cells, but scientists are not sure whether this poses a risk to human health.
Numerous reports were released in 1992, 1993, and 1994, regarding EMFs . None of these reports have concluded that EMFs cause adverse health effects nor did they feel standards were appropriate or reasonable at this time. However, these reports have not ruled out that EMFs could cause adverse health effects.
No national, international or state long term exposure health-based EMF standards or regulations have been developed. Both the State Department of Health Services (DHS) and the Environmental Protection Agency (EPA) have stated that standards are not recommended at this time.
On January 15, 1991, the California Public Utilities Commission (CPUC) opened an investigation to consider its role in mitigating health effects, if any, of EMFs from utility facilities and power lines. A working group of interested parties, called the California EMF Consensus Group, was created by the CPUC to advise it on this issue.
Based on the work of the Consensus Group, written testimony, and evidentiary hearings, the CPUC in November 1993, issued an interim decision (93-11-01) to address public concern about possible EMF health effects from electric utility facilities. Among the findings:
1) We find that the body of scientific evidence continues to evolve. However, it is recognized that public concern and scientific uncertainty remain regarding the potential health effects of EMF exposure.
2) We do not find it appropriate to adopt any specific numerical standard in association with EMF until we have a firm scientific basis for adopting any particular value.
Pacific, Gas and Electric (PG&E) is the local utility company that provides electrical power in the Planning Area. Since 1987, PG&E has had written company policies regarding EMF. PG&E has supported and funded medical, scientific and industry research on EMF for several years, and is continuing to do so.
Planning Area EMFs
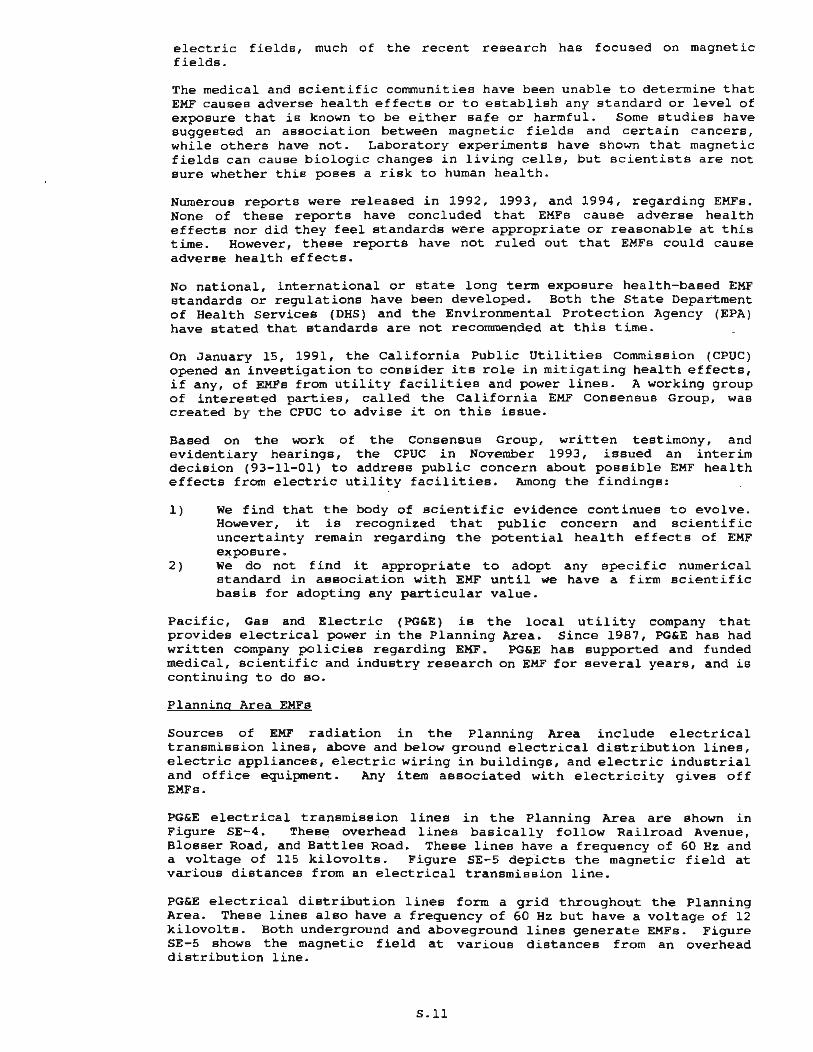
Sources of EMF radiation in the Planning Area include electrical transmission lines, above and below ground electrical distribution lines, electric appliances, electric wiring in buildings, and electric industrial and office equipment. Any item associated with electricity gives off EMFs .
PG&E electrical transmission lines in the Planning Area are shown in Figure 5E-4. Thes~ overhead lines basically follow Railroad Avenue, Blosser Road, and Battles Road. These lines have a frequency of 60 Hz and a voltage of 115 kilovolts. Figure SE-S depicts the magnetic field at various distances from an electrical transmission line.
PG&E electrical distribution lines form a grid throughout the Planning Area. These lines also have a frequency of 60 Hz but have a voltage of 12 kilovolts. Both underground and aboveground lines generate EKFs. Figure SE-5 shows the magnetic field at various distances from an overhead distribution line.
S.l1
-=--r = i
~ \ \ \ \
Idle
A Substation
000000 70-115 KY Transmission Line
Figure SE-4 PG&E Electrical
Transmission Lines
Stowell Rd
Betteravia
Scale : 1" = 6,500'
2: Source: PG&E
'-/
" \,
, , , ,
\

Figure SE-5
Magnetic Fields
Measured Magnetic Fields
Around Power Lines
Distribution Lines (21 kV and under)
-I-
<2-36mG
I ~ I
I >< I -<" ~
I I
~ 1'\,/\ V~
Note:
50 feet 100 feet
I I < 1 - 6 rnG
Transmission Lines (60 - 500 kV)
< 1 - 2 rnG
100 feet E.Jge of right-<lf-way from edge of RIW
I I <JO-90mG 1 - 22 mG
The tield strengths shown are tor typical PG&E syslemwide line loadings. Under peak load condilions, we calculate that the magnetic tields al the edge of the right-at-way for transmission lines would not exceed 150 mG.
S . 13
Source: PG&E

5. Oil Wells and Oil Sumps
Oil production was one of the founding industries of the Santa Maria Valley . Two oil fields are located in the Planning Area: the Santa Maria Valley Field, and the Orcutt Field. TheBe two fields contain over 1400 active and abandoned oil and injection wells. Generally, the oil producing area is located south of Stowell Road. .
The source for local oil regulations is the Santa Barbara County Petroleum Ordinance No. 2795 (adopted in 1976, as amended), Regulations for Drillino, Producing. Operating. and Abandoning Petroleum Wells. Chapter 11 of Title 9 of the City's Municipal Code adopts the County ordinance as the "petroleum ordinance" of the City of Santa Maria. Chapter 11 also amends certain portions of the County's ordinance to apply specifically to the City of Santa Maria. The City has contracted with the County so that the County Petroleum Engineer acts in that capacity for the City.
New facilities (wells, tanks, etc.) must follow applicable -regulations, including the Uniform Fire Code, and require permits from the County Petroleum Department and/or the California Division of Oil, Gas, and Geothermal Resources (CDOGGR). In addition, new facilities cannot be located within certain distances from roadways and existing buildings.
Abandonment of existing oil wells follow the applicable regulations of the County Petroleum Department and the CDOGGR.
In the event that the County Petroleum Department and/or the State Supervisor of Oil , Gas, and Geothermal Resources determines at any time that any well, or other operations covered by the ordinances, is endangering any fresh water body or strata, or that any oil field construction, improvement, or operation constitutes a safety hazard, or a substantial nuisance to the public, the County Petroleum Department or the State Supervisor of Oil, Gas, and Geothermal Resources shall have the right to compel the operator to make such modifications as may be required to correct such condition.
All oil field waste derived or resulting from, or connected with, the drilling or producing of any well, shall be discharged into a sump impervious to fluids. Such discharges shall be removed from the drill site to authorized locations upon completion of the drilling.
Prior to enactment of County Petroleum Ordinance No. 2795, oil wells and associated facilities and Bumps were not abandoned in accordance with current regulations. Improperly abandoned wells, improperly abandoned facilities, and abandoned oil sumps are all potential sources of safety hazards.
Prior to current abandonment procedures, oil wells were cut off below ground and capped. However, this procedure may not comply with the current abandonment standards. Improperly capped wells have the potential to leak methane gas which poses an explosion hazard, Section 3208.1 of the Public Resources Code authorizes the State Oil and Gas Supervisor to order the reabandonment of any previously abandoned well when construction of any structure over or near the well could result in a hazard. If the well is not reabandoned, sufficient clearance should be maintained between permanent structures and the well to allow future access.
The City's policy regarding abandoned oil wells depends on whether the well has been abandoned properly. If the well has been abandoned properly, or will be reabandoned, as determined by the CDOGGR, a ten .foot wide radius "no build" easement measured from the well head shall be recorded when the well is on residentially zoned property. For nonresidential property, the property owner has the choice of recording the 10 wide "no build" easement around the well, or installing a CDOGGR approved venting system over the well in which case a structure may be built over the well.
S.14

If the well will not be reabandoned, then a 10 foot wide radius "no build" easement is required to be recorded around the well for all properties, and the distance requirements of the CDOGGR must also be followed (see Figure 17 of the technical appendix) .
In many cases, associated oil well facilities like pipes, concrete slabs, and equipment were abandoned in place and covered over with soil. This has led to subsidence problems when structures are built over these sites. These areas, when discovered, are required to be removed and the soil recompacted.
Most oil wells had associated oil sump areas where waste fluids and oil were deposited. In the past, these oil sumps were buried and not removed. Placement of structures over these areas could force the oil and waste fluids to the surface and will also contaminate the soil.
As part of the discretionary review process, the City requires a Phase I Environmental Assessment (EA) for all properties that have an existing or abandoned oil well, or are known to have oil drilling operations as shown in the Resource Management Element of the General Plan.
However, if a clearance letter from the State Division of Oil, Gas, and Geothermal Resources and/or the State Regional Water Quality Control Board is provided, a Phase I EA will not be required unless evidence of further soil contamination is discovered.
The City requires that all oil sumps or contaminated soil be remediated in accordance with State and county procedures. The state Regional Water Quality Control Board has the ·primary responsibility for overseeing the remediation process.
6. Landfill Gas Migration
" IS
The City of Santa Maria owns and operates a sanitary landfill located in the northeast portion of the City. In addition, abandoned landfill areas are located underneath Preisker Park and around the Santa Maria Public Airport. A hazard associated with existing and abandoned landfills is underground methane gas migration.
Landfill gas (LFG) results from the anaerobic'· decomposition of organic materials" within a landfill. LFG is typically composed of 50 to 60 percent methane, 40 to 50 percent carbon dioxide and small percentages of other gases including nitrogen, propane, butane, ethane and chlorinated hydrocarbons and other organic gases.
The methane gas component of LFG can be explosive when concentrations reach a range of S to lS percent by volume in air and are confined in an enclosed space with sufficient oxygen to Bustain ignition. Ignition sources may include a spark from a standard light switch. In confined or semi-confined enclosures, methane and carbon dioxide may accumulate and create an asphyxiation hazard through oxygen displacement.
California Code of Regulations (CCR) under Title 14, Chapter 3, Article 7 apply to LFG production, containment, control, and utilization at Class III sanitary landfill sites. The CCR "Minimum Standards" are enforced by the California Integrated Waste Management Board (CIWKB) and the Local Enforcement Agency (LEA) . For the City of Santa Maria, the LEA is the Santa Barbara County Environmental Health Division.
Living and reproducing in the absence of atmospheric oxygen
In the case of a landfill, "organic materials" refers to food waste, garden clippings, and other waste containing carbon-based compounds
S.15
LFG subsurface migration can be controlled through the natural containment properties of surrounding soils, a low permeability liner and by an LFG recovery system.
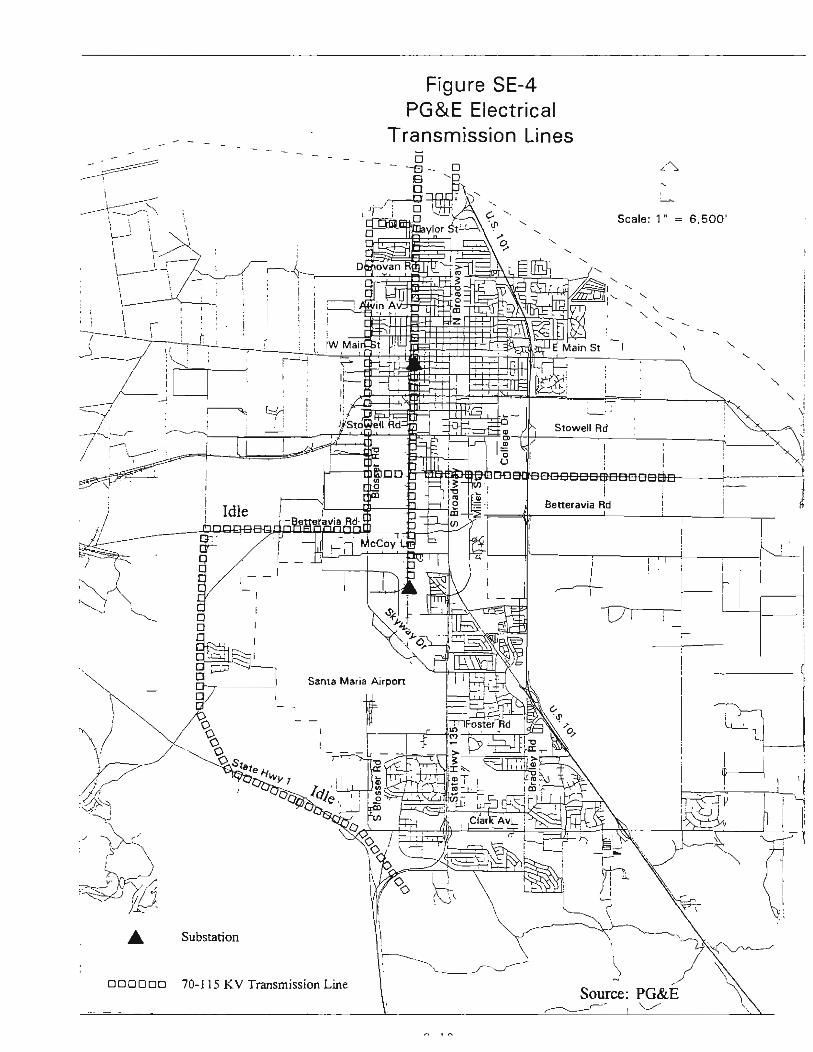
The Santa Maria Sani tary Landfill consists of an active and inactive area. T i nactive area has a low LFG generation potential since a low volume of refuse ". deposited here , the refuse was burned, and the burned refuse is very old . The highest potential for LFG migration occurs at the active portion of the landfill.
The santa Maria sanitary Landfill currently relies on natural Boil containment of LFG. As part of an Air Solid Waste Assessment Test' · (SWAT) conducted for the landfill, elevated levels of methane ranging from 9.1 to 40.7 percent parts per million by volume (ppbv) were detected in four out of 20 perimeter soil gas monitoring probes. Two of the probes were located adjacent to the Santa Maria River levee, where the gas poses no significant threat to health and safety. The other two probes were located near the southeastern boundary of the active portion of the landfill, near some existing farm structures.
A subsequent landfill gas study conducted in 1992 detected methane in 11 of the 33 sample locations on the active portion of the landfill. Methane concentrations at these sites ranged from 29 to 62 percent ppbv. Most of the higher methane concentrations were located in the current disposal area of the landfill. The highest LFG concentration on the landfill property was recorded near the southwestern boundary, which indicates that LFG mi gration may have occurred offsite. The city has assumed for investigation purposes that landfill gas has migrated across the facility boundary. The level and extent of this migration is being studied. The city is taking appropriate steps to protect the public health and safety and to comply with regulations governing landfills.
Potential safety impacts from LFG generation and migration include explosive hazards to on-site and off-site structures, toxic gas emissions, ground water contamination, and damage to vegetation.
Continued and expanded waste disposal operations at the Santa Karia SanitaLandfill will increase the amount of refuse placed in the landfill and t . subsequent volume of LFG that is produced. Any LFG that does manage to migrate from the existing landfill or future expansion areas has the potential to concentrate in structures on or near the landfill. If either on-site or off-site structures overlie the path of methane gas migration, a potential for methane accumulations beneath or withi n such structures may result in explosive concentration levels (between 5 and 15 percent by volume) . Such concentrations in combination with ignition sources (electrical outlets, space heaters) could result in a significant safety hazard .
The nearest off-site structure is a building located approximately 200 feet to the west of the active portion of the landfill. The nearest residences are located within a mobile home park and the Sierra Vista Estates project located approximately 200 feet to the southwest of the inactive portion of the landfill . The proximity of these structures to the landfill could result in potential gas migration impacts. However, the gas migration potential in this area of the inactive landfill is considered extremely low .
7 . Saf e Drinking Water Levels
,.
In 1974, the Federal Safe Drinking Water Act (Act) was passed to establish standards for public drinking water . In 1986, the Act was amended to further safegua.rd the sources and treatment of water. The Environmental Protection Agency (EPA) and the State Department of Health Services (SDHS) set quality standards which require water suppliers to monitor and treat public drinking water for potentially harmful contaminants .
Drinking water standards in California are placed in two categories: pr~ary and secondary. Safe levels are established for each contaminant in each categor~ Primary standards specifically relate to your health and are generali
Anthrosphere, Inc ., 1988
S.16

based on health effects which may occur if a person were to drink two liters 0 :
water each day for 70 years .
Secondary standards relate to aesthetic qualities of water, including taste odor, and color.
These standards, which are referred to as Maximum Contaminant Levels (NeLs), arl continually reviewed and lowered, as lower detection levels become possibl l through innovations in laboratory technology.
Drinking water is provided to the Planning Area by the City of Santa Maria an, the California-Cities Water company. The City of Santa Maria serves the majorit : of users within the City Limits along with areas outside the City Limits subjec1 to City Council approval through an OUtside Users Utility Agreement. Th, California-Cities Water company primarily serves the orcutt area and soml southern portions within the City Limits. The source of drinking water i l groundwater beneath the Planning Area . Both water purveyors have numerous weIl l drilled into the groundwater basin. Please refer to the Resources Managemen1 Element of the General Plan for a complete description of water supply an' groundwater resources.
The treatment of groundwater is currently minimal. Both the City and CaliforniaCities Water Company only disinfect the water. The drinking water supply of bot] water purveyors does not violate any water quality standard set by the State 0 :
California or the Environmental Protection Agency.
If overdrafting of the groundwater basin continues, additional treatment of Cit~ water may be needed because of increased total dissolved solid (TOS) levels iJ the groundwater . Additional treatment will also be needed when the State Wate: Project water becomes available. The additional treatment will occur at a wate: treatment plant to be built in San Luis Obispo county.
8. Aircraft Safety
The Santa Maria Public Airport is located within the southern portion of the Cit: of Santa Maria. The airport provides facilities for commuter airlines whicl serve Santa Maria with propeller driven aircraft. Four fixed base operator I exist that offer flight instruction, aircraft rental and repair, and refuelinl services. The airport is served by an Federal Aviation Administration (FAA control tower . In 1990, 178 general aviation aircraft were based at the airport
The airport has two runways: Runway 12-30 (primary runway); and Runway 2-21 (secondary runway). Runway 12-30 is used by air carrier aircraft and heav: general aviation aircraft. The precision instrument approach is to Runway 12 from the northwest . Runway 2-20 is primarily used by general aviation aircraf' and during cross wind conditions .
Hazard Zones
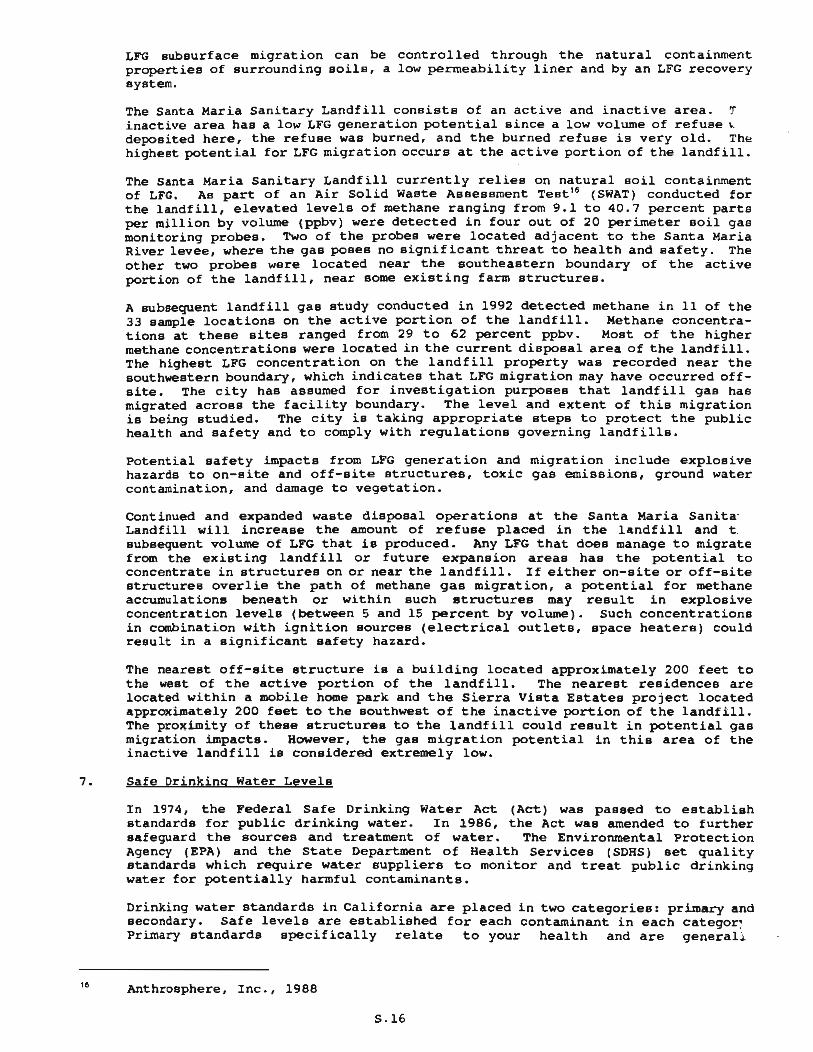
The Airport Area of Influence is divided into three areas of major concern height restrictions, safety, and noise. These concerns are grouped into threl hazard zones around an airport. Haz.ard Zone I deals with height restrictions an is also the boundary of the Airport Area of Influence. Hazard Zone II contain policies regarding safety as well as height. Policies regarding height, safety and noise apply in Hazard Zone III. These zones are defined in the followin· text, and are shown on Figure SE-6.
Hazard Zone I defines the airspace requirement of an airport. Height limitatio: of structures within this zone is defined by an Lroaginary conical surface an, horizontal plane extending out from the end of the runway. The outer margin 0 the horizontal surface 150 feet above the established airport elevation define the boundary of this zone.
S.l7
Figure SE-6 Airport Hazard Zones
I
~ \ \ ; , \ r--\ \ I- r-+-.
I ,
, : , I. i! !
Donovan
-r---L-)\,~' -,-J'~' c-Ll \) ~ , 1tf3' '! : - IW Main S~_ :-.J,__ I
, : : 0-----; .,.. . , I I· I 'r
"--- f , - - ; ,
-=::-i "" . -7' i
r~ . !
,_'
.... ,. , i , ,
, i , !
rm I
------____ - - - - H.azard Zone II Boundary
_ ... -_ .. ' - Hazard Zone III Boundary '--
, ,
Scale, '" = 6,500'
-'-
- ;-Stowell Ad
'-w---~~----'---------!c--~ ~
Beneravia Rd
_,...,~_ I. I ~
if'
\ " Source: Santa Barbara County Airport Land Use Plan, Oct 1993 -~
S , 1 R

17
II
"
Safety restrictions, as well as height restrictions, apply in Hazard Zone II. Hazard Zone II is divided into three safety areas which are based on degree of hazard. These safety areas are shown on Figure SE-7.
Safety Area 1 (Clear Zonel. This is the most restrictive area as it is subject to the greatest danger. Clear zones are fan-shaped areas just beyond each runway end that are to be kept clear of any nonessential objects. They provide an additional margin of safety for aircraft landing on or departing from the runway.
In order to comply with Safety Area 1 (clear zone) requirements and minimize conflicting land uses near the airport runways, the City has a Clear Zone zoning designation that is located at the ends of both airport runways (Figure SE-7).
Safety Area 2 (Airport Approach) . This area is an extension of the clear zone in which uses that do not result in the concentration of people or a particular fire hazard are generally allowed.
In order to comply with Safety Area 2 requirements, the City has developed the Airport Approach overlay designation (Figure SE-7). This overlay establishes regulations to minLmize the hazard to safe landing and take-off of aircraft by limiting the height of buildings and uses within these areas. Allowed land uses within this zone are described in the Land Use Element of the General Plan. These uses include airport services, light industrial, heavy commercial manufacturing, and lower density residential.
Safety Area 3 (Generall. This area encompasses the remainder of Hazard Zone II and is the least restrictive. This is the area in which airport traffic patterns occur (Figures SE-6 and SE-7).
Within Hazard Zone III, land uses will be influenced by aircra'ft noise as well as height restrictions and safety. The boundary of this zone is determined by using the California Airport Noise Standard which sets forth the boundary as the 65 dB Community Noise Equivalent Level (CNEL) contour. Generally, residential uses, schools, hospitals, institutional uses and other uses that support a large concentration of people are prohibited in this zone.
Aircraft Safety
Nationwide, approxLmately 50 percent of civilian aircraft accidents occur within airport boundaries. Approximately 15 percent occur outside airport boundaries but within one mile of airports. Of these near airport accidents, approximately 60 percent are concentrated within narrow strips of land at both ends of the runway. 17
Santa Barbara County has experienced no crashes involving public or scheduled air carriers in recent years. From 1960-1985, six forced landings have occurred at the Santa Maria Public Airport, all on airport property" (Figure SE-6). Information from the National Transportation Safety Board indicates that since 1985, only one nonfatal incident occurred on airport property (the exact location is not known). ,.
Airport Land Use Planning Handbook, Caltrans, December 1993
Draft EIR for the Santa Maria Research Park, Michael Brandman Associates, April 1990
Ibid
S.19
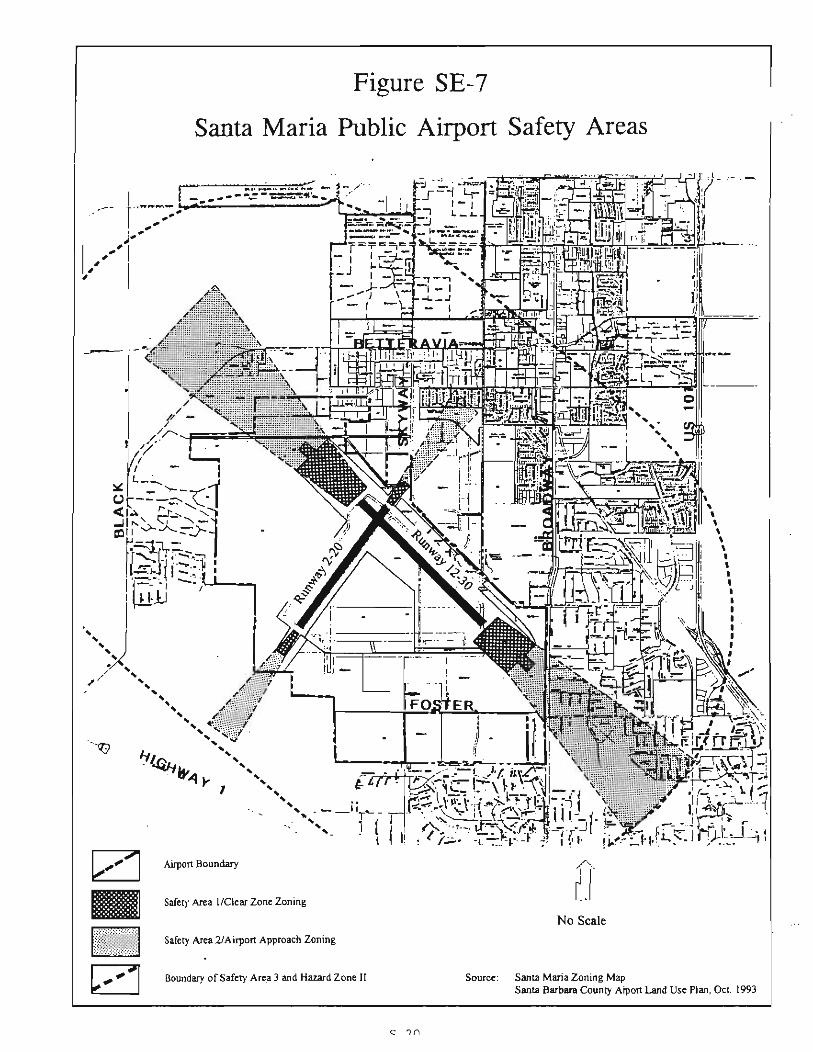
Figure SE-7
Santa Maria Public Airport Safety Areas
Airpon Boundary
Safety Area l /Clear Zone: Zoning
No Scale
Safety Area 2/Airport Approach Zoning
Boundary of Safety Area 3 and Hazard Zone II Source: Santa Maria Zoning Map Santa Barbara County Aiport Land Usc: Plan , Oct. 1993

The runway clear zones (Safety Area 1) are all within airport property and are free from obstructions. The airport approach overlay areas (Safety Area 2) are also considered safe. Operational flexibility, however, has been compromised by urban encroachment to the north, east, and south of the airport. Runway 12 is rarely used for takeoffs due to the need of departing aircraft to climb out over urbanized areas. Commercial carriers typically do not land in the opposite direction on the same runway to avoid final approaches over the same urbanized area. Thus, safety has been achieved through operational limits which do not allow the best use of airport facilities.
Any aircraft incident could potentially be disastrous, resulting in injury or deaths. As noted previously, the potential for an aircraft incident is higher during the approach or departure portion of a flight than while an aircraft is at cruising altitude. This is due to aircraft being closer to the ground and to potential obstructions, heavier concentration of other aircraft in the vicinity of airports, and additional pilot workload at these times.
Although it is impossible to predict precisely how many and where future incidents will occur, it can be assumed that approximately 65 percent of all aircraft accidents will occur within 1 mile of the airport as noted earlier. Of these accidents, a vast majority will occur on or within 200 feet of the runway or taxiway, along the primary approach and departure flight tracks, or beneath a traffic pattern. Nonetheless, the risk of incident at any particular location cannot be predicted with complete certainty.
9. Hazardous Materials
Hazardous materials are found throughout the Planning Area. Used for various purposes, these materials can become dangerous if spilled, inappropriately used or disposed, or otherwise exposed to the public or the environment improperly. Federal, state, and local laws require the proper use, transportation, treatment, and disposal of hazardous materials.
The use and storage of hazardous materials is primarily regulated by the Uniform Fire Code. Transport of hazardous materials and waste on public streets is primarily regulated by the California Vehicle Code and the Cityl s Municipal Code . Storage and disposal of hazardous wastes is primarily regulated by the santa Barbara County Environmental Health Services Division through their Hazardous Waste Generator Program as authorized by the State Health and Safety Code.
Hazardous materials are used by numerous businesses in the Planning Area. Typical businesses include, but are not limited to, hospitals , dry cleaners, auto repair facilities, exterminators, medical labs, photographic studies, and gas stations. On a smaller scale, single family residences also use and store hazardous materials (pesticides, fertilizers, drain cleaners, etc.).
Any business that stores hazardous materials in accordance with Article 80 of the Uniform Fire Code must provide either a haz.ardous materials inventory statement (HMIS) or a hazardous materials management plan (HKMP) to the Fire Chief of the City of Santa Maria and the County of santa Barbara. In addition, the City of Santa Haria Fire Department and the County of Santa Barbara Environmental Heal.th Services (EHS) require a Business Plan in accordance with State Regulations for businesses that store and use hazardous waste.
Santa Barbara County's Site Mitigation Program administered by the EHS is responsible for the supervision of cleanup at contaminated sites throughout the County, including sites within the City Limits. The objective of the program is to identify contaminated sites, and to find a permanent remedy that is technologically feasible and reliable that effectively reduces the danger of contamination, and that adequately
S.21
2 1
protects public health, welfare, and the environment. A large percentage of the contaminated sites within the County are discovered by hazardous materials specialists while overseeing the abandonment of underground storage tanks . Site mitigation activities are also initiated as a result of complaints, inspections, tank tightness tests, and emergency responses.
The Planning Area has approximately 27 active underground tank cleanup sites and 29 active site mitigation cleanup sites according to the EHS's -Listing of Underground Tank Cleanup Sites" and "Listing of Site Mitigation Cleanup Sites," both reports as of August 9, 1995.
Once a potential contaminated site has been discovered, an evaluation to determine the extent of contamination at the site is . conducted and information sufficient to identify the moat appropriate response are developed. A typical evaluation consists of six phases: initial investigation; site assessment and characterization; remedial action; evaluation; public notification; and remediation.
The santa Maria sanitary Landfill currently operates a household hazardous waste transfer and storage facility. This facility is open to the public two days per month. In addition to collecting household hazardous waste, the facility conducts random, solid waste load checks for hazardous materials.
The landfill does not service ha~ardous waste generated by commerc i al and industrial uses. Businesses must hire a hazardous waste transporter to dispose of their hazardous wastes. This waste is either transported to the Chemical Waste Management/Kettleman Hills facility (north), or to a transfer stat i on in Southern California, where it is Shipped out of state4
Hazardous materials transported into or through the Planning Area include such commodities as the hypergolic fuel trucked to Vandenberg Air Force Baae, anhydrous ammonia, gasoline, explosives, and aviation fue1 4 Natural gas liquids and liquid petroleum gases (e.g . propane, butane) are also transported through the Planning Area to Bakersfield, Los Angeles, and the Bay Area.
Hazardous materials that are radioactive, poisonous, or explosive are limited to using State Highway 101 through the Planning Area . ~ Within the City Limits, transport of any hazardous waste is prohibited on Donovan Road, Stowell Road, Main Street-State Highway 166, and Broadway-State Highway 135. 21 However, these streets may be used for the transport of hazardous waste subject to the following exceptions :
1) They provide reasonable access to fuel, repair, rest, or food facilities designed and intended to accommodate commercial vehicle parking when access ia consistent with safe vehicle operation and the facility is within one-half road mile of points of entry from a state or interstate highway being used.
2) Hazardou8 wastes which have a point of origin within the City Limits. Partially loaded waste vehicles may drive upon these streets when the vehicles have a destination within the City Limits.
Several steps are taken to ensure public safety when a hazardous materials spill occurs. If the spill is severe, or an ilIInediate threat to the public, City Fire Department personnel will respond to the situation. The City Fire Department responds to several hazardous spill calls each year .
California Vehicle Code and California Code of Regulations
Chapter 13 of Title 7 of the Santa Maria Municipal Code
5 .2 2
If contamination of a site is discovered during the City ' B review of a project, either during plancheck or inspection, the City will notify t he EHS. The City then requires a clearance letter from the EHS before permits will be issued or a project is finaled. The EHS is the lead agency involved and the City defers to them regarding hazardous material discoveries.
Hazardous Materials Emergencies
The increasing volume and variety of hazardous materials that are generated, stored or transported through the Planning Area have created potential threats to human health and the environment. Hazardous materials incidents differ from other emergency situations because of the unpredictable nature and the possibility of long range toxic effects. Incidents may occur at fixed facilities where the opportunity for the development of site-specific contingency plans is great. They may also occur at any place along any land, water or air transportation route and may occur in remote or treacherous areas, relatively inaccessible by ground transportation.
Although incidents may occur anywhere at any time, certain portions of the Planning Area are more likely to be the site of an accident involving hazardous materials.
u.s. Highway 101. u.s. Highway 101 is the primary truck route from Los Angeles to coastal central California. Materials shipped include rocket fuel, explosives, compressed and liquified gasses, petroleum products, agricultural chemicals, industrial chemicals and hazardous waste. Betteravia Road. Betteravia Road is the main link from u.s. Highway 101 to the western portion of the Planning Area, the Casmalia hazardous waste facility, and the area ' s agricultural industries. This route passes very few residential areas at this time but does traverse several blocks of commercial establishments and several miles of industrial and agricultural land uses. Railroads. The main north-south Southern Pacific line is located nine miles west of the City. The industrial core of the City is served by the Santa Maria valley Railroad which carries agricultural products out of the area . Some petroleum products are transported to the main line from the east side of town through a mixture of reSidential, industrial , and commercial land uses. Airport Industrial Zones. The airport area contains electronic component manufacturers, aircraft repair shops and specialized research facilities . Solvents, etching agents, stored fuel a~d radioactive material may be encountered.
10. Emergency Services
The City of Santa Haria's role and responsibilities in an emergency are described in Chapter 17 of Title 2 of the Municipal Code (Emergency Services) . Detailed procedures and tactics are provided in the Multihazard Functional Plan (Plan). as adopted by City Council Resolution No. 89-25 . This manual was revised by the City in October 1993 . The Plan conforms to the State's emergency preparedness plans and is an extension of those plans. The City has alao adopted the California Master Mutual Aid Agreement by Resolution No. 79-4845.
The City's emergency procedures will be activated under any of the following conditions:
1) On the order of the City's Director of Emergency Services, provided that the existence or threatened existence of a Local Emergency has been proclaimed in accordance with the City's Emergency Services Ordinance.
2) When the Governor has proclaimed a State of Emergency in an area that includes the City of Santa Maria.
3) By a presidential declaration of a National Emergency .
S .2 3

4) Automatically on receipt of an attack warning or the observation of a nuclear detonation.
For planning purposes, the State Office of Emergency Services (OES) has established three levels of emergency response to peacetime emergencies which are based on the severity of the situation and the availability of local resources (these levels do not directly correlate with the four classifications of nuclear power emergencies).
Leve 1 I. A minor to adequate and available.
moderate incident wherein local resources are A Local Emergency mayor may not be proclaimed.
Level II. A moderate to severe emergency wherein local resources are not adequate and mutual aid may be required on a regional or statewide basis. A Local Emergency will be proclaimed and a State of Emergency might be proclaimed.
Level III. A major disaster wherein resources in or near the impacted area are overwhelmed and extensive state and/or federal resources are required. A Local Emergency and a State Emergency will be proclaimed and a Presidential declaration of an Emergency or Kajor Disaster will be requested.
Local emergency operations in the City of Santa Maria will be managed in one of three modes, depending on the magnitude of the emergency: Decentralized Coordination and Direction; Centralized Coordination Decentralized Direction; and Centralized Coordination and Direction (Please see the technical appendix for a definition of these terms).
The standardized Emergency Management System (EMS) consists of the emergency management staffs of all local jurisdictions, Operational Areas (Countywide), OES Mutual Aid Regions (two or more counties) and State Government. Local jurisdictions would be responsible for directing and/or coordinating emergency operations, with the other levels being responsible for coordinating and/or providing support to the local jurisdictions.
Under the standardized Emergency Management System, the City' s Local Emergency Management Staff will be directed by the Emergency Services Director (City Manager), who will be responsive to the City Council. The Director will be supported by the Emergency Services Coordinator, section Chiefs and functional Operations Coordinators.
The Santa Maria Emergency Management Staff will have the overall responsibility for the following:
1) Organizing, staffing, and operating the EOC. 2) Operating communications and warning systems. 3) Providing information and guidance to the public. 4) Maintaining information on the status of resources, services, and
operations. 5) Directing overall operations. 6) Obtaining support for the jurisdiction, and providing support to
other jurisdictions as required. 7) Analyzing contamination and other hazards and recommending appropri
ate countermeasures. 8) Collecting, evaluating, and disseminating damage assessment and
other essential information. 9) Providing status and other reports to the Operational Area Emergency
Management Staff (if activated) or the OES Mutual Aid Regional Office.
Overall management and coordination of the City's response to emergency situations is handled by the Emergency Services Director. The City Manager acts as the Emergency Services Director under authority from the City council.
S.24

The Emergency Services Director is assisted in managing and coordinating emergency response efforts by the Emergency Services Coordinator. The Emergency Services Coordinator position is filled by the Administrative Analyst .
Incident Command System
Emergency procedures in the City of Santa Maria follow the Incident Command System (ICS). ICS is a management system des igned to appoint personnel to specific emergency operational activities .
Santa Maria's ICS Command Staff is made up of the following personnel:
Incident Commander (City Manager) Public Information Officer (City Librarian) Liaison Officer (City Clerk) Legal Officer (City Attorney)
Immediately under the Command Staff is the General Staff . This is made up of the following personnel:
Operations Section Chief (Police/Fire Chief) Planning Section Chief (Community Development Director) Logistics Section Chief (Recreation and Parks Director) Finance Section Chief (Finance Director)
The Incident Commander (IC) has overall management responsibility for the incident, including the development and implementation of strategic decisions and approving the ordering and releasing of resources. The Command Staff element is provided to support the IC in handling such matters as public inforxnation, safety, and interagency liaison. Under the direction of the IC, Command and General Staff are responsible for the activation and release of emergency resPonse personnel and providing for 24 hour staffing during emergency conditions. In incidents involving other agencies, a unified command element will evolve which will bring together multiple jurisdiction ICs to develop a common and consistent action plan to make the best use of all available resources.
General Staff
The Operations Section i8 headed by the Operations Section Chief (Police/Fire Chief) who is responsible for the management of all incident tactical activities.
The Planning Section is headed by the Planning Section Chief (Community Development Director) who is responsible for the collection, evaluation, dissemination and use of information about the development of the incident and status of resources.
The Logistics Section is headed by the Logistics Section Chief (Recreation and Parks Director) who is responsible for meeting the logistical needs of the Operations Section. This includes providing equipment and supplies , food and medical support to incident personnel, meeting communications requirements of the incident and, in conjunction with the American Red Cross, care and shelter operations.
The Finance Section is beaded by the Finance Section Chief (Finance Director) who is responsible for participation in development and implementation of the incident action plan. This section will be activated at an incident when required for purposes of maintaining records on personnel and equipment time, for obtaining supplies and equipment from and providing payments to vendors, and for determining cost considerations or various alternative strategies associated with incident planning.
S.25

Operational Coordinators
Reporting to the General Staff are variouB Operational Coordinators. Operations Coordinators have been established to handle specific activities that may have to be performed in the event of an emergency. Each Operations 90ordinator reports to a Section Chief of the General Staff unless otherwise noted.
Fire and Rescue. The local Fire and Rescue Coordinator, who is under the direction of the Operations Chief, will be responsible for all fire and rescue operations .
Law Enforcement and Traffic Control. The Santa Maria Police Division Chief is the Law Enforcement and Traffic Control Operations Officer under the direction of the Operations Section Chief.
Local pisaster Medical Coordinator. The Local Disaster Medical Coordinator is responsible for medical operations and assets .
Local Disaster Public Health Coordinator . A County Health Department representative acts as the Local Disaster Public Health Coordinator. This Coordinator is responsible for public health and safety operations.
Coroner . The County Coroner/Medical Examiner has the statutory responsibility and authority for dealing with deceased bod i es .
Logistics/Care and Shelter. The Logistics/Care and Shelter Coordinator reports to the LogistiCS Section Chief and has the responsibility for coordinating local government resources, requesting and responding to mutual aid forces, and providing support to the American Red Cross . The American Red Cross is the official local disaster relief agency .
~.ric&D Red eroa. - The American Red Cross, as mandated by Federal Law and reaffirmed in Public Law, provides disaster relief in peacetime.
Police/Movement. The Local Movement Coordinator, under the direction of the Operations Section Chief, will be responsible for coordinating the movement of persons from hazardous areas to lower risk areas.
Rescue . Both the fire and police departments bear responsibility for rescue operations under the direction of the Operations Section Chief .
Public Works/Construction/Engineering. as the Public Works Coordinator and operations.
The Director of Public Works acts is responsible for engineering
Finance/Resources and Support. The Resources and Support Coordinator, under the direction of the Finance Section Chief, will be assisted by the following Support Officers with the responsibilities as indicated.
Per.onn.l - Coordinates the allocation of personnel. TraDaportatioD Coordinates the allocation of transportation resources required to move equipment, people, and essential supplies Utiliti •• - Coordinates the continued operation of water, gas, and electric utilities and, as required, and redirection of services.
Fire HazMat Team/Radiological Protection. Coordinator or the Radiologi cal Officer is monitoring, decontamination, and radiological
Emergency Operating Center eEOC)
The Emergency Services responsible for preparing hazard assessments .
The primary EOC is in the publ ic safety classroom located at 314 West Cook Street. The alternate EOC is Santa Maria Fire Station #2 located at 416 West Carmen Lane. Operations activities are conducted from the respective Departments as outlined in pertinent Standard Operating Procedures (SOPs).
S.26
Logistics operates from its space within the Recreation and Parks Department building.
The EOC is activated under the following conditions under a request by the City Manager or the Police/Fire Chief:
1) An event with no warning creates widespread damage to buildings, utilities, and streets.
2) An incident in progress threatens the majority of the City. 3) An incident is in progress in Santa Maria and EOC activation is
requested by the IC at the field command post .
Each Department within the City also has Standard Operating Procedures (SOPs) that each Department will follow in the event of an emergency situation. These SOPs detail staffing requirements and locations where staff should report in the event of an emergency.
Specific Emergencies
Hazards that pose a threat to the Planning Area include earthquakes, landslides, hazardous material incidents, wildfires, flooding/dam failures, war emergencies, the Diablo Canyon Nuclear Power Plant, and transportation incidents (aircraft/motor vehicles). Santa Maria is not impacted by such hazards as volcanoes, avalanches, or tsunamis. Earthquake, landslide, hazardous material incidents, wildfires, and flooding/dam failures are described in previous sections of this report .
Nuclear War Emergencies. Current state and Federal guidance assumes that a nuclear attack on the United States would be preceded by a period of increasing international tension . This guidance also assumes that sufficient time would be available for protective actions to be taken such as the construction of shelters and the temporary relocation of residents of possible target areas.
A lesser threat that has a greater probability of occurrence comes from terrorist organizations. These organizations could transport a small nuclear device to any part of the United States and detonate the weapon at the time and place of their choosing with little or no warning.
The City of Santa Maria is a potential target area because the airport is capable of supporting military aircraft . Although the airport is located at the southwest edge of the City, the City is within the blast and thermal effects zone of an accurately placed 1 megaton weapon.
Vandenberg Air Force Base (VAFB), located 10 miles southwest of the City, is a potential target because of the launching facilities and the long runway at the base. Santa Maria would be in the blast and thermal zone for any air burst at VAFB. With a ground burst at VAFB, Santa Maria may be shielded to a degree by the mountains to the south of the City . An error in targeting could easily shift a burst directly over the City.
Because no blast shelters have been identified, the probability of an individual surviving a 1 megaton airburst over the City is low (90\ or more casualties). Among the survivors, thermal and blast injuries would be predominant and radiation injuries would be absent. Residual radiation should not be significant if the explosion occurs at the optimum altitude for maximum blast and thermal damage.
A low yield terrorist device would produce a zone of injuries or lethal radiation that would extend beyond its more limited blast and thermal effects zone. Burns and radiation injuries would be predominant if the device were placed at an elevated location . If it were detonated near ground level, the thermal and radiation effects would be restricted by the shielding properties of buildings. Residual radioactivity would remain at dangerous levele for an extended period of time at the explosion site .
S . 27
Diablo Canyon Nuclear Power Plant Emergencies. Emergency response action plans are not required for the subject hazard since all of Santa Barbara County is beyond the Diablo Canyon Emergency Planning Zone. However, given the basically north-south transportation grid within the areas involved, in the event of an emergency in San Luis Obispo county involving the Diablo Canyon facility, the santa Barbara County Operational Area would by default become a support/host area for evacuees. As a support/host area, a relocation center for school children has been designated at Allan Hancock College, and a reception center has been designated at the County Fairgrounds.
The federal government defines a lO-mile radius for the plume exposure pathway Emergency Planning Zone (EPZ) and a 50-mile radius limit for the Ingestion Pathway Zone (IPZ). The City is well beyond the lO-mile radius EPZ for plume exposure. However, the 50-mile radius IPZ does include the City's Planning Area. The principal exposure in the IPZ would be from ingestion of contaminated water or foods such as milk, fresh vegetables, or aquatic foodstuffs.
The State has defined two planning zones to facilitate emergency planning. The zones are the Basic Emergency Planning Zone (BEPZ) and the Public Education Zone (PEZ).
The BEPZ covers an area of about 15 miles to the north and east and 16 miles to the southeast of the plant . The BEPZ lies entirely within San Luis Obispo County.
The PEZ extends across the San Luis Obispo County boundary to include the santa Maria Planning Area. Residents living within this zone receive information on nuclear power plant emergency planning zones. Protective actions for the public in the PEZ are not necessary.
Because of the distance of the power plant from the Planning Area, protective actions during the plume phase are not anticipated to be necessary in Santa Barbara county. However, the Planning Area could be directly affected by protective actions taken in San Luis Obispo County as noted below.
Evacuation is a major countermeasure to prevent or reduce exposure or contamination of the general public. The Planning Area could be affected by a directed or non-directed evacuation of the public from San Luis Obispo COunty, if evacuees are recommended to leave the area southbound on U.S. Highway 101 or State Route 1. Evacuees will affect traffic flow and some will need temporary lodging and board. The area could also be affected if individuals and/or automobiles leaving areas near the plant are contaminated with radioactive materials following an atmospheric release.
The u.e of protective clothing to prevent contamination of the skin would not be necessary in the Planning Area in a routine emergency response. However, protective clothing would be used in the decontamination of personnel and equipment transported into the Planning Area.
As an ingestion pathway consideration, the State may recommend covering stored livestock feed to limit or avoid contamination from airborne radioactive materials. As an ingestion pathway consideration, the State haa the authority to prevent the sale, distribution, or consumption of contaminated water or foodstuffs. The Planning Area could be affected since the County lies within the Ingestion Pathway Zone.
Decontamination is the reduction or removal of radioactive material from a Rtructure, area, Object, or person. Decontamination may be required in the Planning Area for personnel and equipment that have been contaminated in areas close to the plant and transported into Santa Barbara County.
The predetermined evacuation routes leading from San Luis Obispo County into Santa Barbara County are U. S . Highway 101 and State Highway 1.
S.26
Transportation Emergencies4 Transportation emergencies, other than those involving hazardous materials, can cause great 10B8 of property or life4
The greatest loss of life can occur when commercial passenger carriers such as trains, airliners, or buses are involved . However, multiple vehicle automobile accidents also can result in a large number of injuries and fatalities . Mass casualty incidents quickly exhaust local resources and require mutual aid in order to transport and give emergency care to victims
Highway accidents can have an impact on the corrvnunity beyond those problems caused by the inunediate casualties. Commerce and personal business depends on functioning transportation routes. Restoration of traffic flow by bypassing the incident site should be accomplished as soon as feasible.
Santa Maria lies within a transportation corridor. u.s. Highway 101 carries a large volume of traffic every day of the year. This route is the primary route from Los Angles to coastal Central California. It carries truck freight , private cars and passenger buses.
The Santa Maria Public Airport can accommodate aircraft as large as a DC-10 in an emergency. The airport is used by scheduled airlines', private airplanes, and helicopters. In addition to the locally generated flights, through commercial and private air traffic passes over Santa Maria. Spacecraft using Edwards Air Force Base can fly over the area during ' landings, as well as military aircraft en route to Vandenberg Air Force Base.
other Emergencies . Although the Planning Area would not be impacted directly by volcanic eruptions or tsunamis, a request for mutual aid may occur, a disruption of the normal flow of goods or services may occur, or the City might be impacted by evacuees or the injured.
S.29
C. GOALS, POLICIES, OBJBCTIVES, lUID PROGRAMS
GOAL 1 - GEOLOGY/SEISMICITY
Minimize the community's risk from potential hazards associated with geologic or seismic activity.
POLICY 1
Maintain and enforce applicable building codes and other appropriate regulations to minimize the 1088 of life and damage to structures during an earthquake or other geologic disaster.
Objective 1.1.a - Geologic Hazards
Take the geologic constraints noted on Figure SE-2 into account during the development review process.
Objective 1.1.b - Uniform Building Code
Enforce the Uniform Building Code as it relates to seismic safety, including lateral forces, 80il constraints, slope stability, and grading.
Objective 1. I.e - Radon Gas
Recognize that the Planning Area does not contain rock units that are associated with significant radon gas generation, and that the City of Santa Karia will continue to monitor the radon gas is~ue as it relates to the Planning Area.
Objective I.l.d - Unreinforced Masonry Buildings
Require the rehabilitation of the 28 identified unrein forced masonry buildings in accordance with the adopted Unrein forced Masonry Ordinance by the dates outlined in the ordinance.
Obiective 1.1.e - Existing Mobile Homes
Support legislation to require earthquake strapping retrofits for existing mobile homes prior to sale or change in ownership.
Objective 1.1.f - New Mobile Homes
Require all new mobile homes to install earthquake strapping.
I.pl .. entatioD Progr ....
1. Continued adoption of the most recent editions of the Uniform Building Code, the Uniform Fire Code, the Uniform Housing Code, the Uniform Plumbing Code, the National Electrical Code, and the Hazardous Building Code.
2. Enforcement of the compliance schedule for unreinforced masonry buildings in accordance with the Unrein forced Masonry Ordinance (Section 9.1-221 of the Municipal Code).
3. Review geologic hazards and condition projects with appropriate mitigation measures through the land use and CEQA processes .
4. Review the location of critical facilities (i.e. schools, hospitals, public facilities, etc.) for conSistency with the policies and objectives of the Safety Element.
5. Continue to provide information to the public regarding earthquake preparedness.
6. Construct all new buildings in conformance with the earthquake regulations of the most recent edition of the Uniform Building Code.
S . 30

7 . Review and update the Safety Element as new geologic information becomes available.
8. Inspect critical public facilities (roads, bridges, utilities, etc . ) for structural integrity, and require correction as necessary (e.g. those owned and/or operated by the City, Caltrans, Santa Maria Valley Railroad, and Utility Companies) .
9. Provide emergency east-west access across U. S. 101 from Bradley Road to Nicholson Avenue in the event the bridges at Main Street, Jones Street, and Alvin Avenue are destroyed.
Accoaplishaents to Date.
1. Adoption of an Unreinforced Masonry Ordinance that contains a compliance Bchedule for rehabilitation.
2. Adoption of the most recent editions of the Uniform Building Code, the Uniform Fire Code, the Uniform Housing Code, the Uniform Plumbing Code, the National Electrical Code, and the Hazardous Building Code.
3 . Public education programs during earthquake preparedness month.
Anticipated Results.
1. The reduction in the number of deaths, injuries, and damage as a result of a seismic event .
2. The identification of all geologic hazards impacting the Planning Area.
GOAL 2 - FLOODING
Minimize the public's exposure to potential flooding and dam inundation hazards .
POLICY 2
Continue to participate in the National Flood Insurance Program and continue to consult with the Santa Barbara County Flood Control District with regard to land use planning in flood prone areas and near the Santa Karia River Levee .
Objective 2.1.a - Flooding
Require that all new structures located within the IOO-year flood plain comply with flood standards which require the finish floor elevation to be constructed a minimum of 2 feet above the IOO- year flood plain elevation.
Obiective 2.1.b - National Flood Insurance Program
Continue to participate in the National Flood Insurance Program as administered by the Federal Emergency Management Agency in order that City residents may seek disaster relief in the event of a major flood.
Obiective 2.1.c - Santa Maria River Levee
Require, where legal, feasible, and appropriate, a minimum 60-foot wide buffer area, measured from the toe of the Santa Maria River Levee, to provide access to the levee in the event that repairs are required, and coordinate the location of the buffer with the Santa Barbara County Flood Control and Water Conservation District and Water Agency.
Obiective 2.1.d - Agricultyral Runoff
Cooperate with and encourage the farming industry to address increased agricultural runoff as it affects urban areas .
5.31
Iapl"'DtatioD prograaa.
1. Review potential flooding hazards and condition pro j ects with appropriate mitigation measures through the land use and CEQA processes.
2. Participate in the National Flood Insurance Program in conjunction with the Federal Emergency Management Agency .
3 . Adopt the revised Drainage Report prepared by Penfield and Smith .
Acca.pli.~ent. to Data.
1 . Participation in the National Flood Insurance Program .
2. Developments adjacent to the Santa Maria River have dedicated 60 foot wide buffer zones next to the levee.
3. New developments in the 100-year flood plai n have complied wit h the requirement that finish floor elevations be at least 2 feet above the 100-year .flood plain elevation .
Anticipated Reaulta.
1. Protection of the public from haza rds associated with flooding.
2. Completion of city-wide storm drainage improvements .
GOAL 3 - WILDLAND/URBAJI FlUS
Provide the public with maximum protection from wildland and urban fire hazards.
POLICY 3
Discourage construction of habitable structures in areas susceptible to wildland fires and assure the availability of adequate fire fighting capabi lities.
Objective 3.1 . 8 - Fire Suppression
Achieve a 5 minute response capability to all areas within the City Limits and maintain adequate water storage standards for fire flow pressure requirements.
Objective 3.1.b - Weed Abatement Program
COntinue the weed abatement program to minimize the amount of ignitable material within the City Limits and support the efforts of the County of Santa Barbara to enforce a similar program outside of the City Limits .
Objective 3.1.c - Inspection Program
Maintain a fire inspection program to identify fire hazards in wildland areas and within and around buildings in urban areas .
Objective 3.1.d - Uniform F i re Code
Enforce the Uniform Fire Code as it relates to fire hazards, including hazardous activities involving fires, oil wells and oil pipelines, and the storage of explosive materials.
Objective 3.1.e - Wildland Fires
Ensure that habitable structures are not constructed in areas susceptible to wildland fire hazards .
Objective 3 . 1.f - Mutual Aid
Continue to . assist and be assisted by other jurisdictions and the State of California in the event of a major fir e through participation in the California Master Mutual Aid Agreement.
S.32

I.pl .. entation Progr ....
1. Enforce fire safety standards of the Uniform Fire Code and other State and Federal regulations.
2. continued adoption of the most recent edition of the Uniform Fire Code.
3. Continue the weed abatement program.
4. continue and maintain the annual fire safety inspections of public and private buildings, and inspections relating to wildland fire hazards.
5. Review potential fire safety hazards and condition projects with appropriate mitigation measures through the land use and CEQA processes.
6. Maintain mutual aid agreements with surrounding jurisdictions.
1. Continue to study the effectiveness of fire sprinkler systems in new homes in order to reduce service demands, maintain existing service levels, and increase public safety.
Accoapliahaents to Date.
1. An ongoing weed abatement program.
2. Adoption of the most recent edition of the Uniform Fire Code.
Anticipated Re.ult ••
1. Reduce the risk of death, injury, or property damage from wildland and urban fires.
GOAL , - ELECTROMAGNETIC I'II!LDS (EMF)
Increase the public's awareness of the potential health effects of EMFs.
POLICY ,
Continue to monitor research regarding EMFs and, if necessary, develop standards as to the safe and unsafe exposure level from EKFs based on standards set by the California Department of Health Services and the Federal Environmental Protection Agency.
Objective 4.1.a - Public Information Program
Continue to research the health effects of EMFs and direct inquiries from the public to the Pacific, Gas, and Electric Company, the State Department of Health Services (DHS) , and the Federal Environmental Protection Agency (EPA).
Objective 4.l.b - EMF Thresholds
Develop EMF threshold standards, such as setback or siting restrictions, based on health-based direction from the State Department of Health Services and the Federal Environmental Protection Agency, if such standards are adopted.
Objective 4.l.c - California Public Utilities Commission (CPUC)
Continue to support the CPUC in its "Prudent Avoidance" mandate to utility companies to consider EMFs in the design, planning, and construction of new, retrofitted, or upgraded facilities, and support the Pacific, Gas, and Electric Company (PG&E) in implementing the policies of the CPUC.
Objective 4.1.d - Setbacks
Encourage the siting of roadways, parking lots, and non-recreational open space next to 70-115 KV electrical transmission lines .
5.33
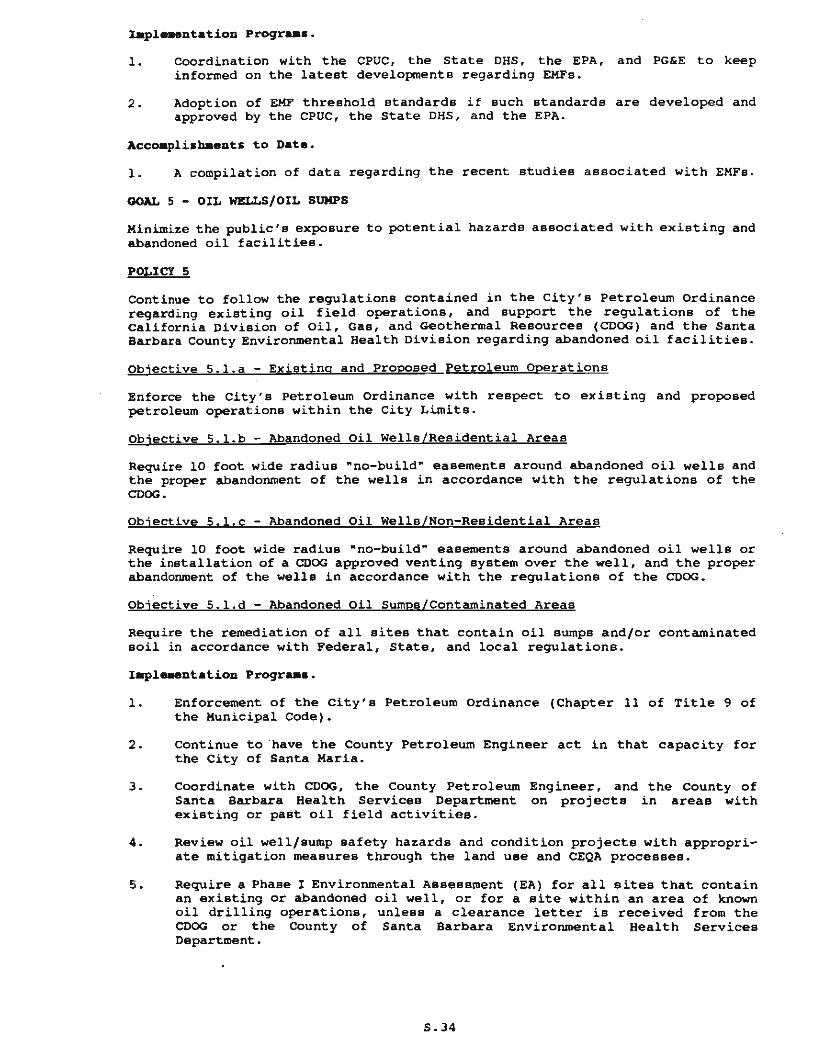
Iapl"'DtatioD Progr ....
1. Coordination with the CPUC , the State DHS, the EPA, and PG&E to keep informed on the latest developments regarding EKFs.
2. Adoption of EMF threshold standards if such standards are dev eloped and approved by the CPUC, the State DHS, and the EPA .
Acca.pliabaenta to D.t • •
1. A compilation of data regarding the recent studies associated with EMFs .
GOAL 5 - OIL WELLS/OIL SUMPS
Minimize the public's exposure to potential hazards associated with existing and abandoned oil facilities.
POLIcy 5
Continue to follow the regulations contained in the City's Petroleum Ordinance regarding existing oil field operations, and support the regulations of the California Division of Oil, Gas, and Geothermal Resources (COOG) and the Santa Barbara County Environmental Health Divis i on regarding abandoned oil facilities.
Obiective 5.1.a - Existing and Proposed Petroleum Operations
Enforce the City's Petroleum ordinance with respect to existing and proposed petroleum operations within the City Limits.
Objective S . l . b - Abandoned Oi l Wells/Res i dent i al Ar e a s
Require 10 foot wide radius "no-build" easements around abandoned oil wells and the proper abandonment of the wells in accordance with the regulations of the CDOG.
Objective S . l.c - Abandoned Oil Wells/Non-Resident i al Areas
Require 10 foot wide radius "no-build" easements around abandoned oil wells or the installation of a CDOG approved venting system over the well, and the proper abandonment of the wells in accordance with the regulations of the CDOG .
Objective S.l . d - Abandoned Oil Sumps/Contaminated Areas
Require the remediation of all sites that contain oil sumps and/or contaminated soil in accordance with Federal, State, and local regulations.
I.pl .. ent.tion Progr ... .
1 . Enforcement of the City ' s Petroleum Ordinance (Chapter 11 of Title 9 of the Municipal Code).
2. Continue to ·have the County Petroleum Engineer act in that capacity for the City of Santa Maria.
3. Coordinate with CDOG, the County Petroleum Santa Barbara Health Services Department existing or past oil field activities .
Engineer, and the County of on projects in areas with
4. Review oil well/sump safety hazards and condition projects with appropriate mitigation measures through the land use and CEQA processea.
5 . Require a Phase I Environmental Assessment (EA) for all sitea that contain an existing or abandoned oil well, or for a site within an area of known oil drilling operations , unless a clearance letter is received from the CDOG or the County of Santa Barbara Environmental Health Services Department.
5 . 34
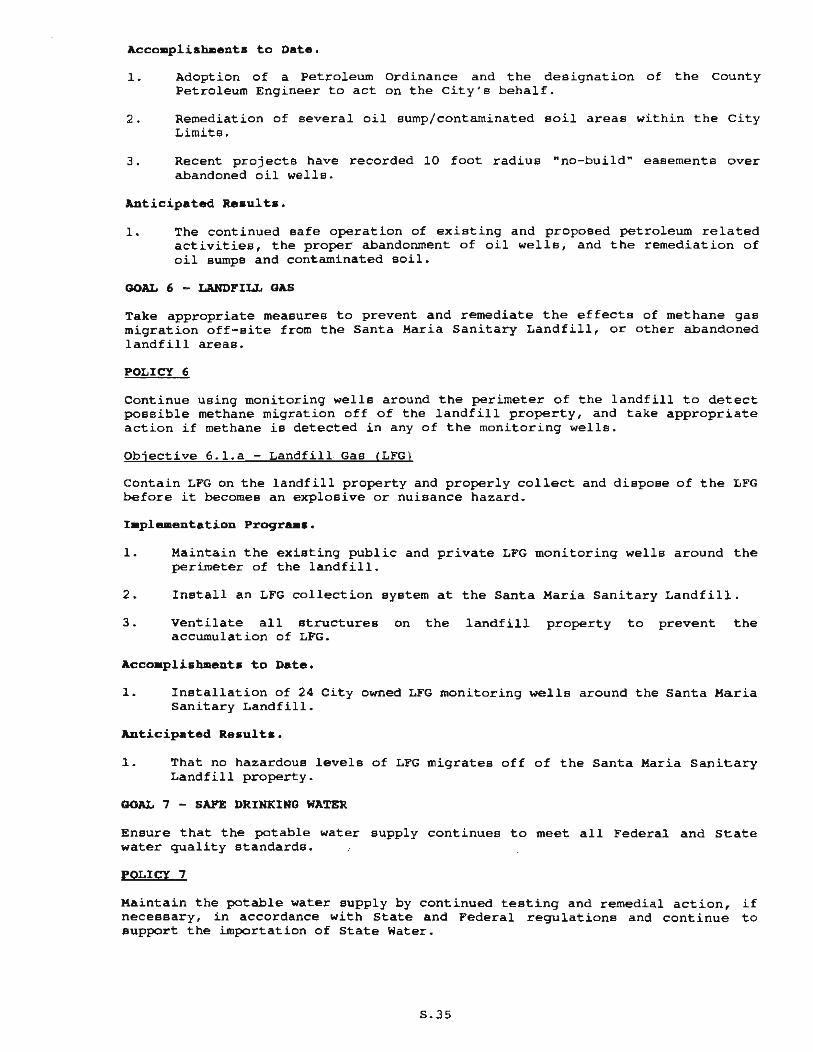
Accoapliab.ents to Date.
1. Adoption of a Petroleum Ordinance and the designation of the County Petroleum Engineer to act on the City's behalf.
2 . Remediation of several oil Bump/contaminated soil areas within the City Limits.
3. Recent projects have recorded 10 foot radius "no-build" easements over abandoned oil wells .
Anticipated Results.
1. The continued safe operation of existing and proposed petroleum related activities, the proper abandonment of oil wells, and the remediation of oil sumps and contaminated soil.
GOAL 6 - LANDP'ILL GAS
Take appropriate measures to prevent and remediate the effects of methane gas migration off-site from the Santa Maria Sanitary Landfill, or other abandoned landfill areas.
POLICY 6
Continue using monitoring wells around the perimeter of the landfill to detect possible methane migration off of the landfill property, and take appropriate action if methane is detected in any of the monitoring wells.
Objective 6.1.a - Landfill. Gas (LFG)
Contain LFG on the landfill property and properly collect and dispose of the LFG before it becomes an explosive or nuisance hazard.
IapIa-entatioD Progr ....
1. Maintain the existing public and private LFG monitoring wells around the perimeter of the landfill.
2. Install an LFG collection system at the Santa Haria Sanitary Landfill.
3. ventilate all structures on the landfill property to prevent the accumulation of LFG.
1. Installation of 24 City owned LFG monitoring wells around the Santa Karia Sanitary Landfill.
Anticipated Results.
1. That no hazardous levels of LFG migrates off of the Santa Karia Sanitary Landfill property.
GOAL 7 - SAFE DRINKING WATER
Ensure that the potable water supply continues to meet all Federal and State water quality standards.
POLICY 7
Maintain the potable water supply by continued testing and remedial action, if necessary, in accordance with State and Federal regulations and continue to support the importation of State water.
S . 35

Objective '.l.a - Drinking Water Standards
Monitor and treat, if necessary, public drinking water for potential harmful contaminants as determined by the Federal EPA and the State DHSa
Objective 'al.b- State Water
Support the importation of State Water to aid in supplying potable water to the public and improving the overall quality of the groundwater.
I.pI ... at.tioa Progr ....
Ia Continue testing of the drinking water supply in accordance with State and Federal standards.
2. Proper treatment of the drinking water supply, if necessary, to ensure that all monitored constituents remain below maximum contaminant levels.
3. Import State Water to improve overall water quality.
1. Drinking water that does not exceed Maximum Contaminant Levels.
1. Delivery of State Water.
2. Higher potable water quality.
3. Reduced water hardness.
GOAL 8 - AIRCRAPT SAFETY
Kinimize the risk of potential hazards associated with aircraft operations at the Santa Karia Public Airport .
POLley 8
Kaintain and enforce the Clear Zone and Airport Approach OVerlay zoning regulations and continue to consult with the Santa Maria Public Airport District (SKPAD) and the County of Santa Barbara Airport Land Use commission (ALUC) with regard to land use planning within the Airport Area of Influence.
Objective 8.1.a - Land Use
Continue to enforce the Clear Zone and Airport Approach OVerlay zoning regulations in the review of development projects.
Objective 8.1.b - Airport Area of Influence
Coordinate the review of development projects located in the Airport Area of Influence with the Santa Barbara County Airport Land Use Commission and the Santa Karia Public Airport District.
I.pI ... at.tioa Progr ....
1. Enforce the Clear Zone and Airport Approach OVerlay zoning designations.
2. Review developments in the Airport Area of Influence with respect to aircraft safety hazards and condition projects with appropriate mitigation measures through the land use and CEQA processes.
3. consult with the ALUC and SKPAD for projects within the Airport Area of Influence.
S.36

Accoapli.haents to Date.
1. Adoption of the Clear Zone and Airport Approach Overlay zoning designations.
Anticipated Re.ults.
1. Reduce the risk of aircraft accidents through proper land use planning in the Airport Area of Influence.
GOAL 9 - HAZARDOUS MATERIALS
KinLmize the community's risk from potential hazards associated with hazardous materials.
POLICY 9
Support the efforts of the City Fire Department, and coordinate efforts with the county of Santa Barbara Environmental Health Division and the California Highway Patrol, to require the proper use, transportation, treatment, and disposal of hazardous materials.
Objective 9.1.a - Hazardous Waste Storage
Require businesses that use and store hazardous materials to follow the regulations contained in the Uniform Fire Code and other appropriate State and Federal regulations .
Objective 9.1.b - Hazardous Waste Disposal
Comply with laws governing hazardous-waste management.
Objective 9.1.c - Hazardous Waste Transport
Plan for and provide a safe transport of hazardous materials and waste by designating safe truck routes that have limited or no exposure to ~esidential areas.
Objective 9.1.d Hazardous Waste Management
Continue to work with Santa Barbara County and the Southern California Hazardous waste Management Authority to identify and promote safe, effective, economical, and feasible methods for managing the hazardous waste generated in the Planning Area.
Objective 9.1.e - Business Retention
Encourage businesses and industries that do not produce or use Significant amounts of hazardous waste to locate in the Planning Area .
IapleaentatiDD Progr ....
1 . Support State and County regulations with respect to the transportatLon, use, storage, treatment and disposal of hazardous materials and wastes.
2. Enforce the hazardous material regulations of the Uniform Fire Code and other State and Federal regulations.
3 . Continued adoption of the most recent edition of the Uniform Fire Code.
4. Review developments with respect to hazardous materials and condition projects with appropriate mitigation measures through the land use and CEQA processes.
S.37
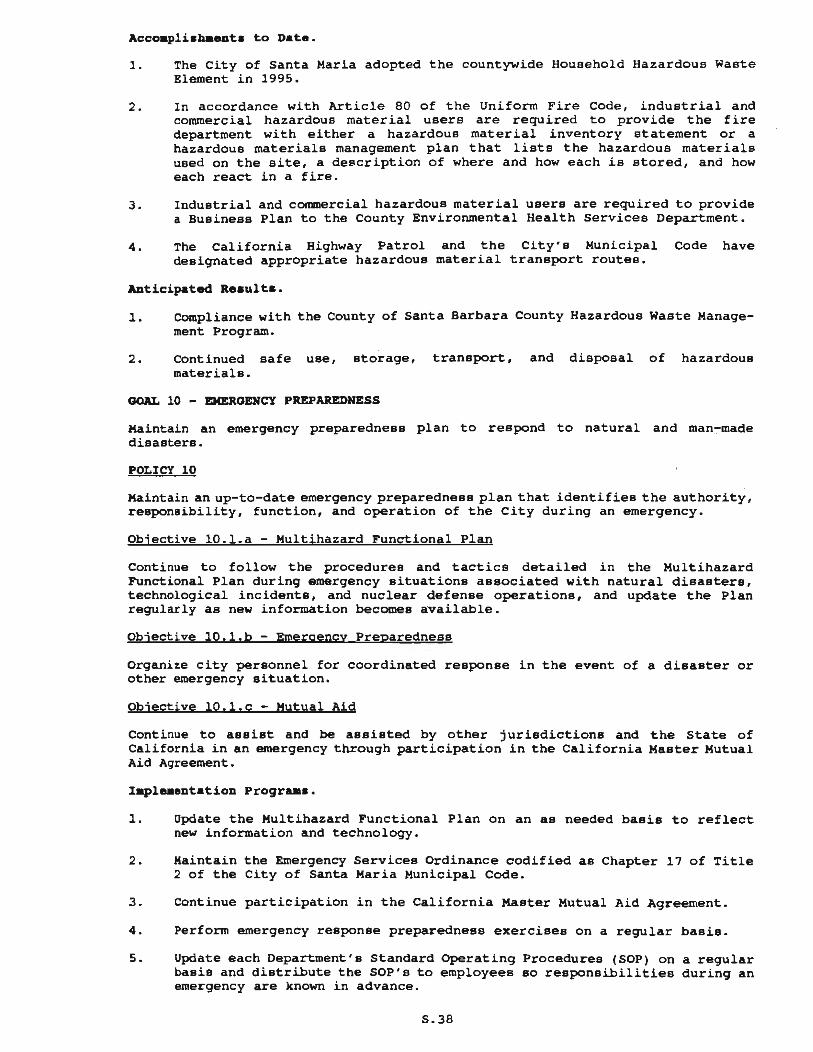
1. The City of Santa Maria adopted the countywide Household Hazardous Waste Element in 1995 .
2. In accordance with Article 80 of the Uniform Fire Code , industrial and commercial hazardous material users are required to provide the fire department with either a hazardous material inventory statement or a hazardous materials management plan that lists the hazardous materials used on the site, a description of where and how each is stored, and how each react in a fire.
3. Industrial and commercial hazardous material users are required to provide a Business Plan to the County Environmental Health Services Department.
4. The California Highway Patrol and the City's Municipal Code have designated appropriate hazardous material transport routes.
ADticipated R •• ult ••
1. compliance with the County of santa Barbara County Hazardous Waste Management Program.
2. Continued safe use , storage, transport, and disposal of hazardous materials.
GOAL 10 - EMERGI!:JICY PREPAREDJlESS
M.aintain an emergency preparedness plan to respond to natural and man~made disasters.
POLICY 10
Maintain an up-to-date emergency preparedness plan that identifies the authority, responsibility, function, and operation of the City during an emergency.
Object ive 10.1.a - Multihazard Functional Plan
Continue to follow the procedures and tactics detailed in the Multihazard Functional Plan during emergency situations associated with natural disasters, technological incidenta, and nuclear defense operations, and update the Plan regularly as new information becomes available.
Objective le.l.b - Emergency Preparedness
Organize city peraonnel for coordinated response in the event of a disaster or other emergency situation.
Objective 1Q,1 , c - Mutual Aid
Continue to assist and be assisted by other jurisdictions and the State of California in an emergency through participation in the California Master Mutual Aid Agreement.
I.pl".DtatioD Progr ....
1. Update the Multihazard Functional Plan on an as needed basis to reflect new information and technology .
2. Maintain the Emergency Services Ordinance codified as Chapter 17 of Title 2 of the City of Santa Maria Municipal Code.
3. Continue participation in the California Master Mutual Aid Agreement.
4 . Perform emergency response preparedness exercises on a regular basis.
5. Update each Department's Standard Operating Procedures (SOP) on a regular basis and distribute the SOP's to employees BO responsibilities during an emergency are known in advance.
S.38
6. Develop an information release program to familiarize the public with the Goals, Policies, and Objectives of the Safety Element. Special attention should be afforded to those groups particularly susceptible to seismic, flooding, fire and other hazards, including, but not limited to, school districts, agencies involved with the elderly, and agencies involved with the handicapped.
7. Review and update the Safety Element as new information becomes available.
8. Develop a program to strengthen the communication and understanding between agencies, both public and private, that must work together during an emergency.
9. Implement a Geographic Information System to keep track of the current statue of infrastructure systems within the Planning Area.
Accoapli.haent. to Date.
1 . Emergency preparedness plans and procedures that are current and up-todate.
2. A Master Mutual Aid Agreement between the City and the State of California and other local agencies.
Anticipated Results .
1. A coordinated emergency response effort between City departments, and between the City of Santa Maria and other agencies.
2. A reduction in deaths, injuries, and property damage as a result of a disaster.
A2k-Safety.Sum
S.39

RESOLUTION NO. 95- 149
RESOLUTION OF TRE CITY COUNCIL OF THE CITY OF SANTA KARIA REPEALING TRE EXISTING SAFETY ELEMENT OF THE GENERAL PLAN AND ADOPTING A COMPREHENSIVE UPDATE OF THE SAFETY ELEKENT, GP-9.(-03
WHEREAS, the Planning Commission of the city of Santa Maria held a regularly scheduled public hearing on October 18, 1995, for the purpose of considering the Safety Element Update, and adopted Resolution No. 2069 (Exhibit A) recommending the repeal of the existi::lg Safety Element and ae.option of the Safety Element Update; and
WHEREAS, On )1ove!!loe:::- 21 , 1995, the City council of the City of Santa Maria held a regularly scheduled public hearing for the purpose of considering a comprehensive update to the Safety Element of the Santa Maria General Plan, GP-9 4 -03; and
WHEREAS, notices of said public hearing were made at the time and in the manner required by law; and
WHEREAS, the Safety Element is one of seven Sta~e mandated general plan elements, and the State General Plan Guidelines recommend ~~at state-mandatee. general plan elements be revised every 4 to 5 years to incorporate new info~ation and to reflect changes in community needs and values; and
WHEREAS, the existing Safety Element was adopted in the mid-1970s wi~~ minor revisions through 1987, but has not had major revisions since its adoption in 1970; and
WHEREAS, it is the i ntent of the City of Santa Maria to repeal the existing and outdated Safety Element (1987) and replace said element with ~~e Safety Element Update; and
WHEREAS, the Safety Element Update sets forth goals, policies, objectives , and implementa~ion programs to protect the community from unreasonable risks associated with the fallowing: seismically and geologically induced hazards, flooding, wildland and urban fires, electromagnetic fields, oil wells/sumps, landfill gas migration, safe drinking water, aircraft safety, hazardous materials, and emergency procedures; and
WHEREAS, the Safety Element Update ' .. ill assist in the allocation of public resources in the Planning Area to develop information regarding safety hazards and thereby provide a systematic approach to protecting the public health, safety, and general welfare; and
WHEREAS, the City council reviewed and adopted an Initial Study/Negative Declaration (E-95-46) for the Safety Element Update prior to taking action on the Safety Element Update; and
WHEREAS, at the completion of said public hearing, the City Council duly considered all evidence presented at said public hearing;
NOW, THEREFORE, BE IT RESOLVED as follows:
1. The Santa Maria General Plan is hereby revised to replace the existing outdated Safety Element (1987) with the comprehensive Safety Element Update (Planning commission Draft, October 18, 1995), based on the following findings:
a. The Safety Element Update is consistent with, and takes into account, the goals, policies, objecti ves, and programs contained in the other elements of the City of Santa Maria General Plan.
b. Existing and future safety hazards and associated risks are based on the latest scientific and technical data available at the time of preparation of the element.
c. Hazards such as earthquakes, flooding, or wildland fires do not occur with any regularity and the goals, policies, objectives, and programs of the Safety Element Update are based on the probability that a particular hazard event may occur.
PASSED AND ADOPTED at a regular meeting of the City Council of the City of Santa Maria helc November 21. 1995.
ATTEST:
/s/JANET KALLAND City Clerk
File: H-l.13.2
/ S /ROGER G. BUNCH Mayor
APPROVED AS TO FORM
BY:~IrJ lATiaRi'f/
CONTENTS: __ ,
BY:'lJ:£U OEPARTMeNj HEAD
BY: 7ktv em AD~'''II<::Tc6Tnp

EXHIBIT A
RESOLUTION NO. 2069
RESOLUTION OF THE PLANNING COMMISSION OF THE CITY OF SANTA M;;RIA RECOJ<.MENDING THAT THE CITY COUNCIL ADOPT AN UPDATE TO THE SAFETY ELL~ENT OF THE SANTA M;;RIA GENERAL PLAN, GP-94-03
WHEREAS, on Octobe~ 18, 1995, the Planning commission of t he city of Sa~ta Maria held a ~egularly scheduled public hearing for the pu~pose of considering an update to the Safety Element of the Santa Maria General Plan, GP-94-03; and
WHEAErlS, said public hearing r .. ;as for the pu::-pose of formulati~g and forwa~ding recomme~dations to the City council of t he city of Santa Maria rega~ding project G?-94-03; a~d
WHEREAS, notices of said public hea~ing were made at the ~ime and in the manner ~equi~ed by law; and
WHEREAS, the State General Plan Guideli~es recommend that state-mandated gene~al plan elements be revised every four to five years to i~cor?orate new infor~ation and reflect Changes in cotr~unity needs and values; and
WHEREAS, the exis~i~g Safety Element was adopted in t~e mid-l970s with minor revisions th=ough 1987, but has not had majo~ =cvisior.s since its adoption i~ the 19705; and
WHEREAS, it is the intent of the Ci-=y cf Santa Ma=ia to ~epeal the existing and ou~dated Safety Elemen~ reformatted in 1957 and replace said element wit~ the Safety Element Update; and
"rlEREAS, the Safety Element Update sets forth goals, policies, objectives, and implementation programs to protect the coa~unity from unreasonable risks associated with the following: seismically and geologically ind~ced hazards, flooding, wildland anc urban fires, elect~omagnetic fields, oil wells/sumps, landfill gas. mig~ation, safe drinki~g wa~e~, aircraft safety, hazardous rr.ate~ials, and describes the e~e~gency response capabilities of the varlOUS disaster service agencies i~ the Planning Area; and
WHEREAS, the Safety Element Update will assist in the allocation of public resources in the Planning Area to develop information regarding safety hazards and the~eby provide a systematic approach to protecting the public health, safety, and welfare from such hazards.
WHEREAS, the Planning ccmmission ~eviewed and recommended to the City Council that implementation of the Safety Element Update will not create substantial adverse impacts on the environment, and recommend the filing of a Negative Declaration, E-95-46; and
WHEREAS, at the completion of sa~Q hearing, the City Planning commission duly considered al evidence presented at said hearing;
NOW, THEREFORE, BE IT RESOLVED by the Planning 'Commission of the City of Santa Maria that it is recommended that the City of Santa Maria City Council amend the Santa Maria General Plan by repealing the outdated Safety Element (1987), and adopting the Safety Element Update, including the changes contained in the Attachments A and B, incorporated by reference, based on the following finding:
1. The Safety Element Update is consistent with the goals and policies of the city of Santa Maria General Plan.
PASSED AND ADOPTED at a regular meeting of the Planning commission of the City of Santa Maria held October 18, 1995, by the following roll call vote:
AYES:
· NOES:
Al3SENT :
commissioners Larry Lavagnino,. Chuck :Oberdec}c, Bill Perry
None
commissioners Nancy Johnsen, Trent Benedetti
BILL P~~Y, Chai~an city Planning Commission
;/ JA..'!ES, W. STERN, Assistant Secretary
City Planning commission I .. \----------.
RESOLUTION NO. 95-148
A RESOLUTION OF THE CITY COUNCIL OF THE CITY OF SANTA KARIA FINDING NO DETRIMENTAL ENVIRONMENTAL IMPACT AND DIRECTING THE FILING OF A NEGATIVE DECLARATION OF ENVIRONMENTAL IMPACT FOR THE SAFETY ELEMENT UPDATE, GP-9.-03, E-95-.6
WHEREAS, the Planning commission of the city of Santa Maria held a regularly scheduled public hearing on October 18, 1995, for the purpose of considering the Safety Element Update, and adopted Resolution No. 2068 (Exhibit A) recommending the adoption of a negative declaration for the proposed project; ' and
WHEREAS, the City council of the City of Santa Maria held a regularly scheduled public hearing on Nove",ber 21 , 1995, for the purpose of considering the September 27, 1995 ' Initial Study/ Negative Declaration for the Safety Element Update; and
WHEREAS, notices of said public hearing were made at the time and in the manner required by law; and
WHEREAS, the provisions of the California Environmental Quality Act (CEQA) of 1970, Public Resources Code sections 21000 et. seq . , as amended, require, the evaluation of the environmental impacts of a project through an environmental impact report (EIR) or negative declaration; and
WHEREAS, the City council has reviewed and considered an initial environmental study (E-95-46) for the hereinafter described project; and '
WHEREAS, there appears to be no sUbstantial detrimental environmental impact from the proposed project; and
WHEREAS, at the completion of said public hearin g , the City Council duly considered all evidence presented at said hearing.
NOW, THEREFORE, BE IT RESOLVED as follows:
1-Santa Maria enviromnental
It is the finding of the City Council of the city of that there will be no substantial detrimental impact arising from the proposed project.
2. The City Clerk is hereby authorized and directed to file a negative declaration of environmental impact with the County Clerk.
PROJECT DESCRIPTION
Comprehensive update to the Safety Element of the Santa Maria General Plan.
PASSED AND ADOPTED at a regular meeting of the city Council of the City of Santa Maria held November 21, 1995.
{S {ROGER G. BUNCH Mayor
ATTEST:
IsfJANET KALLAND City Clerk
APPROVED AS TO FORM:
B't~ 4~$;,fl. ATTO .
File : H-1.13.2
.'
EXHIBIT A RESOLUTION NO. 2068
A RESOLUTION OF THE PLANNING COMMISSION OF THE CITY OF SANTA MARIA FINDING NO DETRIMENTAL ENVIRONMENTAL IMPACT AND RECOMMENDING THAT CITY COUNCIL DIRECT THE FILING OF A NEGATIVE DECLARATION OF ENVIRONMENTAL IMPACT FOR THE UPDATE OF THE SAFETY ELEMENT OF THE SANTA MARIA GENERAL PLAN, GP-94-03, E-95-46
WHEREAS, the Planning commission of the city of Santa Maria held a regularly scheduled public hearing on October 18, 1995, for the purpose of considering a negative declaratioIT, E-95-46, for the update of the Safety element of the Santa Maria General Plan; and
WHEREAS, notices of said public hearing were made at the time and in the manner required by law; and
WHEREAS, the provisions of the California Environmental Quality Act of 1970, Public Resources Code section 21000 - 21774, as amended, require the evaluation of the environmental impact report or a negative declaration for all projects; and
WHEREAS, the Planning Commission of the City of Santa Maria has reviewed and considered an Initial Study, E-95-46, for the comprehensive update to the Safety Element; and
WHEREAS, at the completion of said hearing, the Planning commission duly considered all evidence presented at said hearing, and has determined that no potentially significant environmental effects are associated with the project based on Initial Study, E-95 - 46.
NOW, THEREFORE, BE IT RESOLVED by the Planning commission of the City of Santa Maria that it is the recommendation to the City council of said City that the City Council authorize the filing of a negative declaration, E-95-46, with the County Clerk.
PASSED AND ADOPTED at a regular meeting of the Planning Commission of the City of Santa Maria held October 18, 1995, by the following roll call vote:
AYES:
NOES:
ABSENT:
commissioners Larry Lavagnino, Chuck Oberdeck, Bill Perry
None
commissioners Nancy Johnson, Trent Benedetti

ATTEST
//\~ / JAMES W. STERN, Assistant
( city Planning commission \~.
STATE OF CALIFO~~IA COUNTY OF SANTA BARBARA CITY OF SANTA MARIA
secretary
) ) ss. )
BILL PERRY, Chairman City Planning commission
I, JANET KALLAND, City Clerk of the City of Santa Maria and ex officio Clerk of the City Council DO HEREBY CERTIFY that the foregoing is a full, true and correct copy of Resolution No. 95-148 which was duly and regularly introduced and adopted by said city Council at a regular meeting held November 21, 1995 by the following vote :
AYES:
NOES:
ABSENT :
councilmembers Joe Centeno, Abel Maldonado, Bob Orach and Mayor Roger G. Bunch.
None.
councilmember Toru Miyoshi.
City Clerk the Cit and ex of ' cio Clerk
of Santa Maria f · the City Council

· ATTACHMENT C
CITY OF SANTA MARIA INITIAL ENVIRONMENTAL STUDY
NEGATIVE DECLARATION SEPTEMBER 27, 1995
UPDATE TO THE SAFETY ELEMENT OF THE SANTA MARIA GENERAL PLAN GP-94-03, E-95-46 FOR PLANNING COMMISSION MEETING OF OCTOBER 18, 1995
APPLICANT:
PROJECT DESCRIPTION:
LOCATION:
PROCEDURE:
ENVIRONMENTAL SETTING:
City of Santa Maria Community Development Department 110 South Pine Street, #101 Santa Maria, CA 93454
The proposed project is an update to the Safety Element of the Santa Maria General Plan that addresses hazards associated with geology, floodin~, wildland/urban fires, electromagnetic fields, oil wells and oil sumps, landfill gas migration, safe drinking water, aircraft safety, and hazardous materials.
Santa Maria Planning Area (Figure 1).
Planning Commission review of recommendations to the City Council regarding a Negati ve Declaration, the repealing of the existing Safety Element, and adoption of an updated Safety Element of the Santa Maria General Plan.
The Safety Element Update is a proj ect that encompasses the City's Planning Area (Figure 1) . The Planning Area includes the area within the City Limits, and areas surrounding the City Limits, including the Sphere of Influence and other areas that impact or are impacted by the City's planning efforts. Therefore, vacant, undeveloped properties, as well as currently developed properties, may be affected by the proposed project, These areas contain a wide variety of environmental characteristici. Please refer to the environmental setting sections of the Land Use Element Environmental Impact Report (EIR), the Sphere of Influence Boundary Expansion and Concurrent Annexation EIR, the Airport Specific Plan EIR, and the Orcutt Community Plan EIR for a detailed description of the environmental setting of the Planning Area. These documents are hereby incorporated by reference into this initial study and are available for review at the Community Development Department, 110 South Pine Street, #101, and at the City Public Library, 428 South Broadway.
UPDATE TO THE SAFETY ELEMENT OF THE SANTA MARIA GENERAL PLAN GP-94-03, E-95-46 INITIAL ENVIRONMENTAL STUDY -1- SEPTEMBER 27,1995 FOR PLANNING COMMISSION MEETING OF OCTOBER 18, 1995
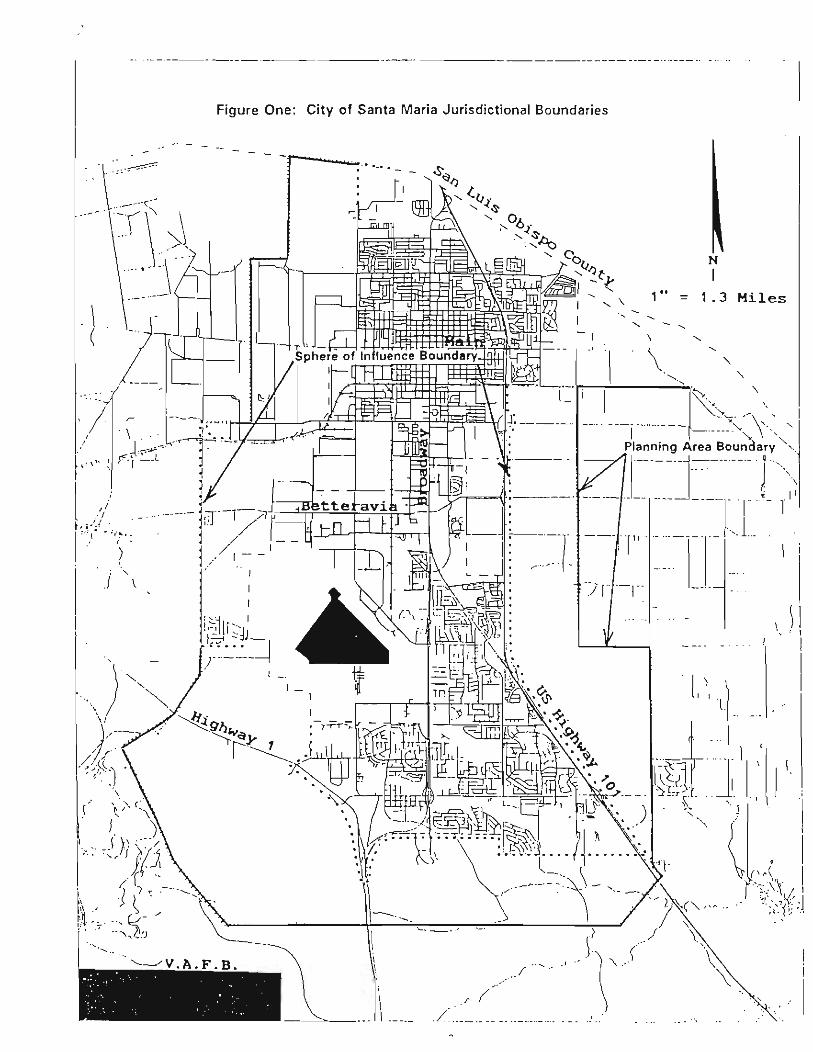
I" "
l t.
I"
_ . .. __ ._--- --_._ ._-- --- -- ---- - -------------_._ .. .. --_ .. _ ....
Figure One : City of Santa Maria Jurisdictional Boundaries
• 'r~ . . , . ) "
j "
1 1- -
f. __ _
-I
f - ...... r "
N 1
1" = 1 .3 Miles ,
, \ "' ,
"-"-
\
. /\\, I "--j ._._ .. _- - -- -- , .... ,'-"-
Plan~~n_~_J~--- -- - . J"< · __ 1.1.·· - .-- ---T r- ( ; r-.-----. 1-· 1.. .
'. ) !
/',. ... "
I I , I
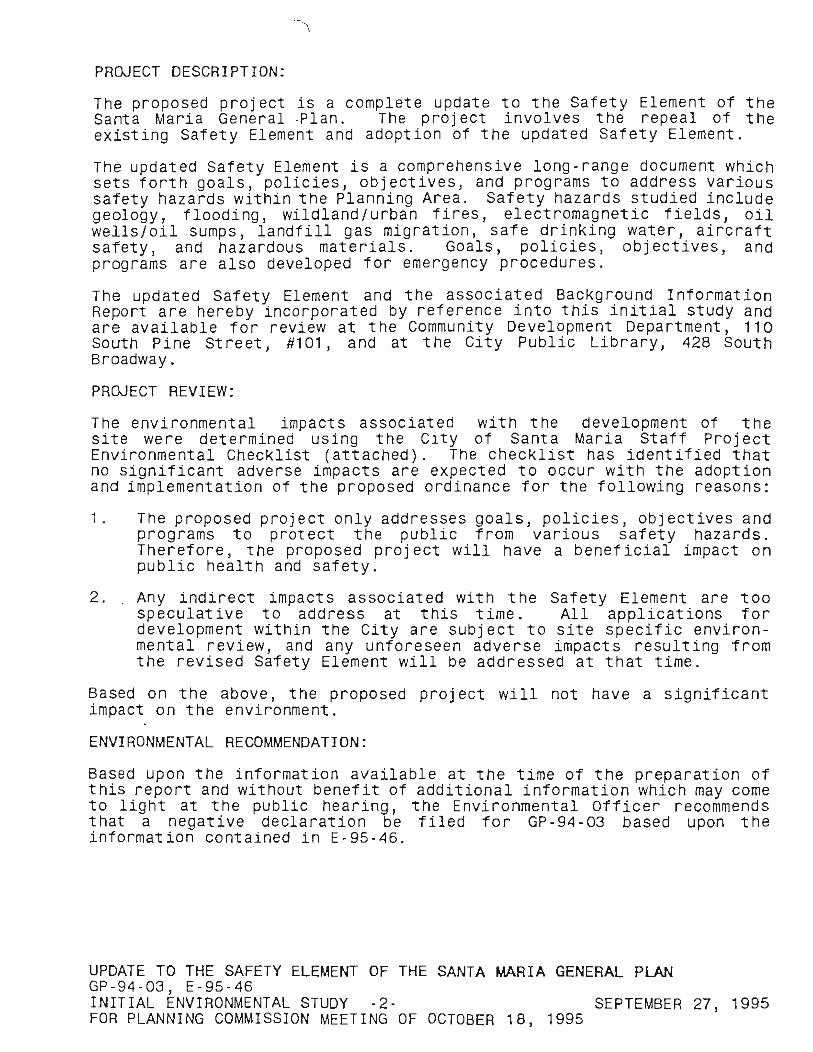
PROJECT DESCRIPTION :
The proposed project is a complete update to the Safety Element of the Santa Maria General ·Plan. The project involves the repeal of the existing Safety Element and adoption of the updated Safety Element.
The updated Safety Element is a comprehensive long-range document which sets forth goals, policies, objectives, and programs to address various safety hazards within the Planning Area . Safety hazards studied include geology, flooding, wildland/urban fires, electromagnetic fields, oil wells/oil sumps, landfill gas migration, safe drinking water, aircraft safety, and hazardous materials. Goals, policies, obj ectives, and programs are also developed for emergency procedures.
The updated Safety Element and the associated Background Information Report are hereby incorporated by reference into this initial study and are available for review at the Community Development Department, 110 South Pine Street, #101, and at the City Public Library, 428 South Broadway.
PROJECT REVI EW:
The environmental impacts associated with the development of the site were determined using the City of Santa Maria Staff Project Environmental Checklist (att ached) . The checklist has identified that no significant adverse impacts are expected to occur with the adoption and implementation of the proposed ordinance for the following reasons:
1. The proposed project only addresses goals, policies, objectives and programs to protect the public from various safety hazards . Therefore, the proposed project will have a beneficial impact on public health and safety.
2. Any indirect impacts associated with the Safety Element are too speculative to address at this time. All applications for development within the City are subject to site specific environmental review, and any unforeseen adverse impacts resulting from the revised Safety Element will be addressed at that time.
Based on the above, the proposed proj ect will not have a significant impact on the environment.
ENVIRONMENTAL RECOMMENDATION:
Based upon the information available at the time of the preparation of this report and without benefit of additional information which may come to light at t he public hearing, the Environmental Off icer recommends that a negative declaration be filed for GP-94-03 based upon the information contained in E-95-46.
UPDATE TO THE SAFETY ELEMENT OF THE SANTA MARIA GENERAL PLAN GP-94-03, E-95 -46 INITIAL ENVIRONMENTAL STUDY -2- SEPTEMBER 27, 1995 FOR PLANNING COMMISSION MEETING OF OCTOBER 18, 1995

PREPARED BY: City of Santa Maria Community Development Department 110 South Pine Street, #101 Santa Maria, CA 93454
Date
Environm~nta~ Officer Date \-'/ \ '-~
A2j-IESSafe
UPDATE TO THE SAFETY ELEMENT OF THE SANTA MARIA GENERAL PLAN GP-94-03, E-95-46 I NITIAL ENVIRONMENTAL STUDY -3 - SEPTEMBER 27, 1995 FOR PLANNING COMMISSION MEETING OF OCTOBER 18 , 1995

[
r
(
[
I r '
[
L
CITY OF SANTA MARIA GENERAL PLAN SAFETY ELEMENT UPDATE
ATTACHMENT A
FILE COpy
BACKGROUND INFORMATION REPORT
. CAUTION . HAZARDOUS
MATERIAL ' -. STORAGE
PLANNING COMMISSION DRAFT
OCTOBER 18, 1995

CITY OF SANTA MARIA GENERAL PLAN
SAFETY ELEMENT UPDATE
PLANNING COMMISSION DRAFT
BACKGROUND INFORMATION REPORT
City of Santa Maria Community Development Department
110 South Pine Street, #101 Santa Maria, CA 93454
(805) 925-0951
Project Staff:
Marc P. Bierdzinski, AlCP, Project Planner
William H. Orndorff, Director James W. Stern, Assistant Director
October 18, 1995

TABLE OF CONTENTS
INTRODUCTION . . . . . . . . . . . . . . . . . . . . . . . . . . . . . . . . . . . . . . . . . . . . . . . . . . . . .. 1
GEOLOGY/SEISMOLOGY . . . . . . . . . . . . . . . . . . . . . . . . . . . . . . . . . . . . . . . . . . . . . . . 3 REGIONAL GEOLOGY . . . . . . . . . . . . . . . . . . . . . . . . . . . . . . . . . . .. 3
Stratigraphy . . . . ............. . ... . ....... . .... . .. . . . ... 3 Structural Geology .. .... . . . ..... .... .... . .. .. . .. ...... . . 7
SEISMIC SETIING . . . . . . . . . . . . . . . . . . . . . . . . . . . . . . . . . . . . . . .. 7 Local SeIsmIcIty ............. . ........... .. .... . . . ...... 9 Alquist-Priolo Earthquake Fault Zones . . ... . ........ . ... .. .. 14
GEOLOGIC HAZARDS . . . ................... . . . .. .. .. . .. . 14 Earthquakes/Ground Shaking . . .. . ... ... . .. . ....... .. .... . 14 Landslides/Mudslides . . . . .... .. ......... . ....... . .. .. . . . 16 Liquefaction . . . . . . . . . . . . . . . . . . . . . . . . . . . . . . . . . . . . . . . . .. 16 Subsidence . . .... . .. . . .. ..... .... ...... . ..... . .. . . . . .. 19 Expansive Soils . . . . . . . . . . . . . . . . . . . . . . . . . . . . . . . . . . . . . . .. 19 Radon Gas . . . . . . . . . . . . . . . . . . . . . . . . . . . . . . . . . . . . . . . . . . . 19 Unreinforced Masonry ................... .. .... .. . . .. ... 22
GLOSSARY .. .. ... . ..... . ............ ... ........ . . . . . .. 23
FLOODING . . . . . . . . . . . . . . . . . . . . . . . . . . . . . . . . . . . . . . . . . . . . . . . . . . . . . . . .. 25 FLOODING ... ... ... ... .... . ... . ... . .. . .. .. . .... . .. . .. . 25 DAM INUNDATION . .. ....... . ....... . . .. .... .. . . .. . . . . . 25 WATERSHEDS . . . . . . . . . . . . . . . . . . . . . . . . . . . . . . . . . . . . . . . . . . 28
WILDLAND FIRES . . . . .............. . .... . ... . ... . ......... .... . ..... 29 CLIMATE ... . .. . ................... . .. . ....... . ... . . ... 29 VEGETATION ......... .. .. . .... . ........... . . .. ........ 29 SLOPE ........ .. ..... ... . . . .... .. . ....... .. ... . .. . .. .. 29 HUMAN PROXIMITY . . . . . . . ... .. . ... . .. . . ... . . . . . . . . . . .. 30 FIRE RISK ANALYSIS . ............ ... . . ... ... . ... . ... . ... 30
ELECTROMAGNETIC FIELDS . .. ... .......... . . .. ............. .. .. . . ... 31 HEAL TIl AND SAFETY ISSUES . . . .... . . ..... . .. .. . . .. ..... 32 CALIFORNIA PUBLIC UTILmES COMMISSION (CPUC) . ...... . 33 PACIFIC GAS AND ELECTRIC COMPANY (PG&E) . . .. . . . . . . . .. 34 PLANNING AREA SOURCES OF EMFs . .. ....... ... .. . . ..... 35
OIL WELLS AND OIL SUMPS . . . . . . . . . . . . . . . . . . . . . . . . . . . . . . . . . . . . . . . . . .. 40 EXISTING OPERATIONS . . . . . . . . . . . . . . . . . . . . . . . . . . . . . . . . .. 40
Permits ........ . .. . ....... . ... . .. .. ....... . ... . ..... 40 Well Spacing . . ..... ... . . .. .. . ......... . ... . .. . .... . .. 40 Storage Tanks . . . . . . . . . . . . . . . . . . . . . . . . . . . . . . . . . . . . . . . .. 41 Fire Prevention . . . . . . . . . . . . . . . . . . . . . . . . . . . . . . . . . . . . . . . . 41 Abandonment Procedures .. . ... ......... . .. . . . . . . . . . . . . .. 42 Hazardous Conditions . . . . . . . . . . . . . . . . . . . . . . . . . . . . . . . . . .. 42 Sumps ... .. ............... . .. .. . . ..... .. . . . ... . .. .. . 43
- i -
PREVIOUS OPERATIONS ............. . . .................. 43 Improperly Abandoned Wells ... .. ............ ......... . .. 43 Abandoned Facilities ................. . ....... . ......... 45 Oil Sumps/Contaminated Soil ............. . .... . . ....... . . 45
LANDFILL GAS MIGRATION ....... ....... ...................... . ...... 46 BACKGROUND ..... . ................................. . . 46 LFG CONTROL ... . ...... ....... .. ...................... 46 SANTA MARIA SANITARY LANDFILL SITE CONDmONS ...... 48 LFG SAFETY HAZARDS ............. ... .... .. ........... . 49
SAFE DRINKING WATER LEVELS . . . . . . . . . . . . . . . . . . . . . . . . . . . . . . . . . . . . . .. 51 PLANNING AREA WATER SOURCES .......... . ....... . .... 51
AIRCRAFT SAFETY . . . . . . . . . . . . . . . . . . . . . . . . . . . . . . . . . . . . . . . . . . . . . . . . . . . 54 SAFETY CONSIDERATIONS . . . . . . . . . . . . . . . . . . . . . . . . . . . . . .. 54
Hazard Zone I - Airport Height Restriction Area . . . . . . . . . . . . . .. 54 Hazard Zone II - Airport Safety Area ...................... . 54 Hazard Zone III - Airport Noise Area . . . . . . . . . . . . . . . . . . . . . .. 57
ACCIDENT POTENTIAL .. . . ........ .. .................... 59
HAZARDOUS MATERIALS ................................. . . ...... . ... 60 HAZARDOUS MATERIAL GENERATORS AND USERS .... .... . 61
Use and Storage . . . . . . . . . . . . . . . . . . . . . . . . . . . . . . . . . . . . . . . 61 Contaminated Sites . . . . . . . . . . . . . . . . . . . . . . . . . . . . . . . . . . . .. 62 Disposal . . . . . . . . . . . . . . . . . . . . . . . . . . . . . . . . . . . . . . . . . . . .. 63
TRANSPORTATION ROUTES. . . ... . . . . .. . .... . . . . . . . . .. . .. 64 LOCAL RESPONSmlLITIES . . . . . . . . . . . . . . . . . . . . . . . . . . . . . . .. 65
Hazardous Material Spills ........ . .......... ..... ... .. . . . 65 Contaminated Sites . . . . . . . . . . . . . . . . . . . . . . . . . . . . . . . . . . . .. 66
EMERGENCY SERVICES ........................................ . ..... 67 PURPOSE. . . . . . . . . . . . . . . . . . . . . . . . . . . . . . . . . . .... . . . . . . .. 67
Local Emergency Operations .......... ........ .. .. ...... . . Standardized Emergency Management System ........... .. ... .
LOCAL EMERGENCY MANAGEMENT SYSTEM ........... . .. . Santa Maria Emergency Management Organization ... ... . . . ... .
SPECIFIC EMERGENCIES ..... . .... .. . . .......... . ..... . . . Earthquake Emergencies ......... .. .. ... .... ..... ...... . . Hazardous Materials Emergencies ............ ... ..... ... .. . Flooding Emergencies . ...... . ... . ..... .. ............... . Dam Failure Emergencies ........................ .. .. . .. . Nuclear War Emergencies ............ . ......... .... ... . . . Diablo Canyon Nuclear Power Plant Emergencies ............ . . Transportation Emergencies ........... ... ............... . Other Emergencies ... ... .............. . ............ ... .
GLOSSARY OF SELECTED TERMS ..... . ..... .. . .......... .
-ii-
68 68 69 69 77 77 81 81 82 82 83 86 86 87

LIST OF FIGURES
Page Number FIGURE 1 - CITY OF SANTA MARIA JURISDICTIONAL BOUNDARIES 2
FIGURE 2 - GEOLOGIC TIME SCALE 4
FIGURE 3 - REGIONAL GEOLOGIC SETTING 5
FIGURE 4 - REGIONAL GEOLOGIC CROSS SECTION 6
FIGURE 5 - REGIONAL STRUcruRAL MAP 10
FIGURE 6 - REGIONAL FAULT MAP 11
FIGURE 7 - LOCAL FAULT MAP 12
FIGURE 8 - HISTORIC EARTHQUAKES 15
FIGURE 9 - EARTHQUAKE PROBABILITIES 17
FIGURE 10 - GEOLOGIC HAZARDS MAP 18
FIGURE 11 - EPA MAP OF RADON ZONES 21
FIGURE 12 - PLANNING AREA FLOODPLAINS 26
FIGURE 13 - WATERSHEDS 27
FIGURE 14 - PG&E ELECTRICAL TRANSMISSION LINES 36
FIGURE 15 - MAGNETIC FIELDS - TRANSMISSION LINES 37
FIGURE 16 - MAGNETIC FIELDS - DISTRIBUTION LINES 38
FIGURE 17 - ABANDONED OIL WELL CLEARANCES 44
FIGURE 18 - POTENTIAL LFG AREAS 47
FIGURE 19 - AIRPORT SAFETY AREAS 55
FIGURE 20 - AIRPORT HAZARD ZONES 56
FIGURE 21 - EMERGENCY ORGANIZATION CHART 71
FIGURE 22 - BUILDING SAFETY - EVALUATION PROCEDURE 80
-iii-

LIST OF TABLES
Page Number TABLE 1 - ACTIVE AND POTENTIALLY ACTIVE FAULTS 9
TABLE 2 - FAULT CHARACTERISTICS 13
TABLE 3 - HISTORIC EARTHQUAKES IN PLANNING AREA 14
TABLE 4 - URM CLASSIFICATIONS 23
TABLE 5 - EMFs FROM COMMON HOUSEHOLD APPLIANCES 39
TABLE 6 - SANTA MARIA ANNUAL WATER QUALITY REPORT 52
TABLE 7 - CAL-CITIES ANNUAL WATER QUALITY REPORT 53
TABLE 8 - AIRPORT LAND USE GUIDELINES 58
-iv -

LIST OF APPENDICES
APPENDIX A - GEOLOGICAL BmLIOGRAPHY
APPENDIX B - UNREINFORCED MASONRY BUILDINGS
APPENDIX C - GEOLOGICAL DIAGRAMS
APPENDIX D - HAZARDOUS MATERIALS MANAGEMENT PLANS
- v -

INTRODUCTION
The 1995 Safety Element Background Information Report contains information that will be used to update the Safety Element of the City of Santa Maria General Plan. The Safety Element was last updated in April of 1987.
This report is divided into ten main sections: Geology/Seismology, Flooding, Wildland Fires, Electromagnetic Fields, Oil Wells and Oil Sumps, Landfill Gas Migration, Safe Drinking Water Levels, Aircraft Safety, Hazardous Materials, and Emergency Procedures. Each section provides background information, examines existing conditions, and makes future projections (when applicable) that will be used to develop goals, objectives, policies, and implementation programs in the update to the Safety Element.
The geographical extent of this report and the Safety Element is the City designated Planning Area, Sphere of Influence, and City Limits. City Limits is defined as the jurisdictional boundary of the City of Santa Maria. Sphere of Influence is the land surrounding the City Limits, as determined by the Local Agency Formation Commission, which may ultimately be annexed into the City Limits. The Planning Area is defined as the City Limits, Sphere of Influence, and any land outside of these areas that have an impact on the planning of the City. Figure 1 depicts the City Limits, Sphere of Influence, and Planning Area boundaries.
-1-

Figure One: City of Santa Maria Jurisdictional Boundaries
I 1--
I I " I
- 2-
-I
,;" f'" II II I
N I
1" = 1.3 Miles
\
I Planning ,
-,--l
(' ',iJ
r--I , "'" I
~-~~~ ~
rl '. I

GEOLOGY/SEISMOLOGY
Numerous studies have described the geologic conditions of the Santa Maria basin, in part because of the long history of oil production from the region, and more recently as a result of geologic and seismic safety studies performed for the Diablo Canyon Nuclear Power Plant. A selected bibliography of geologic literature regarding the Santa Maria area is provided in Appendix A. The geological time scale is provided in Figure 2. Terms followed by an asterisk are defined in the Glossary Section of this Chapter.
REGIONAL GEOLOGY
The regional geologic setting of the Santa Maria Valley is shown on Figure 3. The regional geologic conditions and formations which underlie the Santa Maria Valley are best depicted in a cross-section oriented northeast to southwest, across the valley, as shown on Figure 4. The following is a summary of the regional geology as shown in Figures 3 and 4.
The Santa Maria Valley is an east-west trending alluvial" valley bounded to the north by the San Rafael Range and to the south by the Casmalia Range and the Solomon Hills (Figure 3). The Santa Maria Valley is characterized by a broad alluvial plain near the Pacific Ocean to the west which tapers gradually inland to the east. The alluvial plain is further defined by upland or mesa areas, foothills, and mountains.
The Santa Maria River traverses the valley from east to west, emptying into the Pacific Ocean just west of the town of Guadalupe. The Santa Maria River is formed by the convergence of the Cuyama and the Sisquoc Rivers at Fugler Point near Garey. The alluvial plain and mesa areas of the Santa Maria River Plain, including the Santa Maria River and part of the Sisquoc River, are historically referred to as the Santa Maria ground water basin (Hughes, 1977).
The Santa Maria basin is a significant hydrocarbon (i.e. oil and gas) producing coastal (and off-shore) basin in California. The basin lies at the juncture between the northwesttrending southern Coast Range province and the east-west-trending Transverse Range province. The basin contains a relatively thick Miocene! through Holocene2 age sequence of sedimentary rocks, some of which are prolific petroleum producing formations, and others that are highly productive ground water aquifers.
Stratigraphy
The rock units in the Santa Maria Valley can be divided according to their water-bearing properties into unconsolidated deposits and consolidated rocks; the latter are generally considered for water resource purposes as non-water-bearing rocks (not productive water sources). The unconsolidated deposits range in saturated thickness from 0 to more than 2,300 feet but average about 1,000 feet (Miller and Evenson, 1966). Most of the ground water extracted by wells in the basin is supplied from unconsolidated deposits. The
See Figure 2
2 See Figure 2
-3-
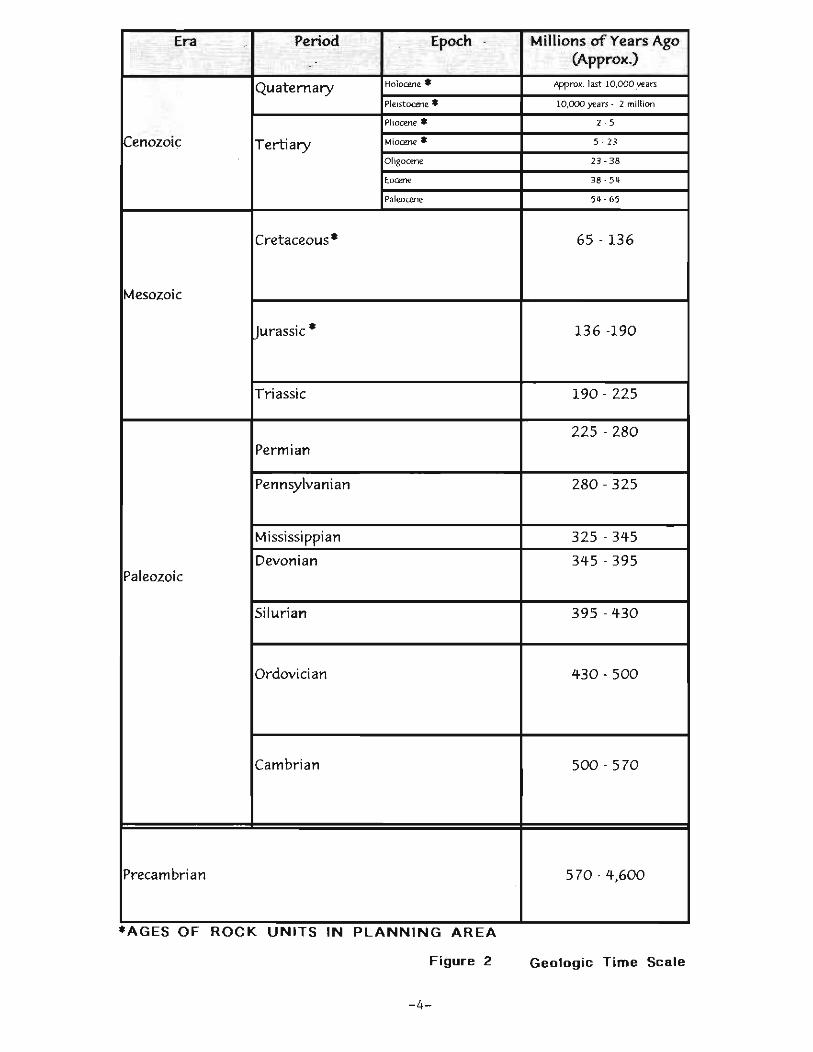
Era Period Epoch Millions of Years Ago (Approx.)
Quat ernary Holocene . Appro.\(, last 10,000 yean
Pleistocene • 10,000 years - 1 million
Pliocene • 2 - 5
~enozoic Tertiary t.1 iocene • 5 - 23
Oligocene 23 - 38
''''''''' 38 - 54
Paleocene 54 - 65
Cret aceous - 65 - 136
Mesozoic
Uurassic - 13 6 -190
Triassic 190 - 225
225 - 280 Permian
Pennsylvanian 280 - 325
Mississippian 325 - 345
Devonian 345 - 395 Paleozoic
Silurian 395 - 430
Ordovician 430 - 500
Cambri an 500 - 570
Preca m bri a n 5 70 - 4,600
-AGES OF ROCK UNITS IN PLANNING AREA
F igure 2 Geologic Time Scale
- 4-

Figure 3 Regional Geologic Setting
D
D .. : .. EJ·· ·· ',' . .
~ ~1
CJ··· .. .
Pacific Ocean
Explanation Q".UnI"ry . ... ..,,... PI , . ..... , ...... _. des-Y, ind .... 1UMba ...... ".c.; .11 ..... _ . .... P ... Rabl ... C ........ aDd lol.rt1eI f.,....b .....
U,pw Pl;o.. .... :. ""PIlI W, ..... ... n ... d __ 1e.
' MI.d .. the r ... n . PI . ..... 3 u" ..... . a .. 111 !MnlA ~lAf"I&nw f" nn""O .. I .
U,so-••••• "Ieli. loll .......... nne ,h ... ~u.. lo""'&' tbe .... "'.....,. .... Put 8oa1 r. ...... -.
N JcWI ..... l __ t 1111_ .nn. ......... ehalI_. 1 ... 1 ' .-114 ..u.a, .-. ... Ill" Oble .... " ~_ t~_ .... u.. ...... a.,.IAla, KiD C .....
t..<> ..... Nl_na •.• "t 0 11f'OO1 .... m . ...... 4o,..0Ita,. I ...... " .. the R1Dftln , V . ......... "' . ........ , Uld s.caw r . ..... too ... .
I-o ... r Mi.e... In d Oli,on" . .. o .... . ri .. a _,,,arec,,., ,t dlpelO" .• , , .. <1.4 .. Lha Si lDaU ... \..00", and s..,. (0 ..... _ .
u .. dlrr ..... 'lu. d r.: ...... UI Up",. J .. t ... le .... "-~.I.&.
f . ... =' . c. " A . .. ",b l.,. and C .. n fI ... ,_ O,ho"lilA \ .. nditT .... no.w-d N .... "';d •
2D km I
SOURCE : NAMSON AND DAVIS (1990)
-5-
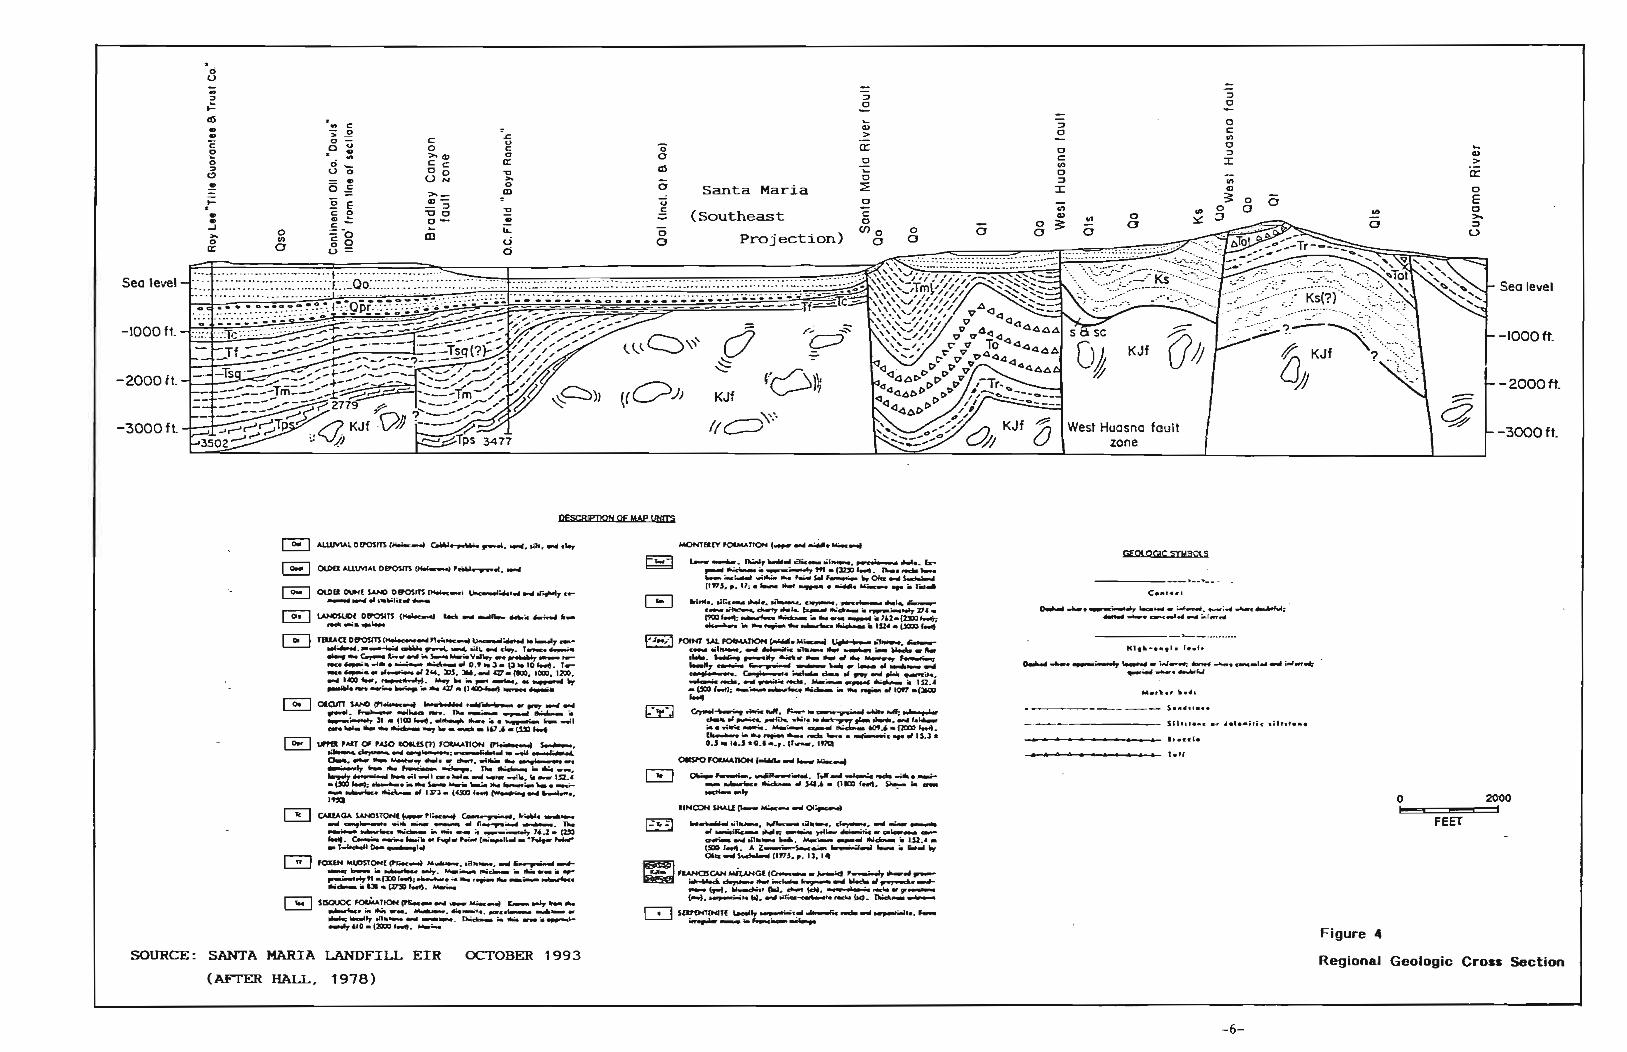
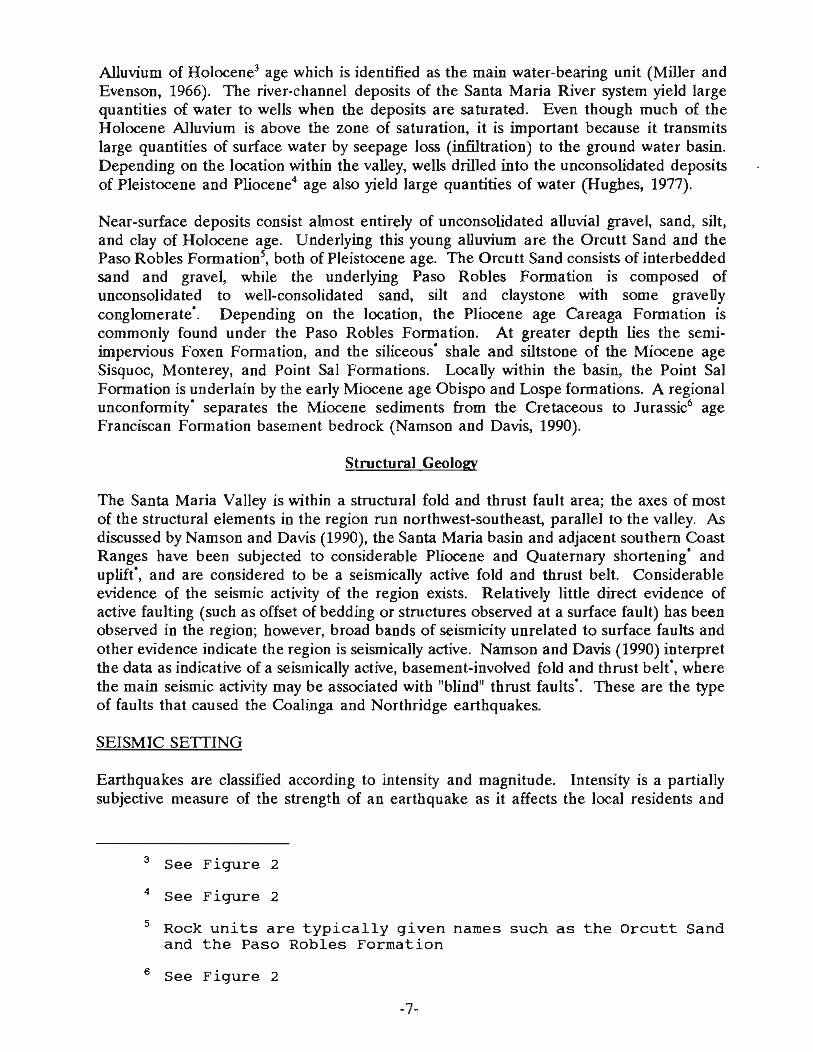
Alluvium of Holocene3 age which is identified as the main water-bearing unit (Miller and Evenson, 1966). The river-channel deposits of the Santa Maria River system yield large quantities of water to wells when the deposits are saturated. Even though much of the Holocene Alluvium is above the zone of saturation, it is important because it transmits large quantities of surface water by seepage loss (infiltration) to the ground water basin. Depending on the location within the valley, wells drilled into the unconsolidated deposits of Pleistocene and Pliocene' age also yield large quantities of water (Hughes, 1977).
Near-surface deposits consist almost entirely of unconsolidated alluvial gravel, sand, silt, and clay of Holocene age. Underlying this young alluvium are the Orcutt Sand and the Paso Robles FormationS, both of Pleistocene age. The Orcutt Sand consists of interbedded sand and gravel, while the underlying Paso Robles Formation is composed of unconsolidated to well-consolidated sand, silt and claystone with some gravelly conglomerate". Depending on the location, the Pliocene age Careaga Formation is commonly found under the Paso Robles Formation. At greater depth lies the semiimpervious Foxen Formation, and the siliceous" shale and siltstone of the Miocene age Sisquoc, Monterey, and Point Sal Formations. Locally within the basin, the Point Sal Formation is underlain by the early Miocene age Obispo and Lospe formations. A regional unconformity" separates the Miocene sediments from the Cretaceous to Jurassic6 age Franciscan Formation basement bedrock (Namson and Davis, 1990).
Structural Geology
The Santa Maria Valley is within a structural fold and thrust fault area; the axes of most of the structural elements in the region run northwest-southeast, parallel to the valley. As discussed by Namson and Davis (1990), the Santa Maria basin and adjacent southern Coast Ranges have been subjected to considerable Pliocene and Quaternary shortening" and uplift", and are considered to be a seismically active fold and thrust belt. Considerable evidence of the seismic activity of the region exists. Relatively little direct evidence of active faulting (such as offset of bedding or structures observed at a surface fault) has been observed in the region; however, broad bands of seismicity unrelated to surface faults and other evidence indicate the region is seismically active. Namson and Davis (1990) interpret the data as indicative of a seismically active, basement-involved fold and thrust belt", where the main seismic activity may be associated with "blind" thrust faults" . These are the type of faults that caused the Coalinga and Northridge earthquakes.
SEISMIC SEITING
Earthquakes are classified according to intensity and magnitude. Intensity is a partially subjective measure of the strength of an earthquake as it affects the local residents and
3 See Figure 2
4 See Figure 2
5 Rock units are typically given names such as the Orcutt Sand and the Paso Robles Formation
6 See Figure 2
-7-
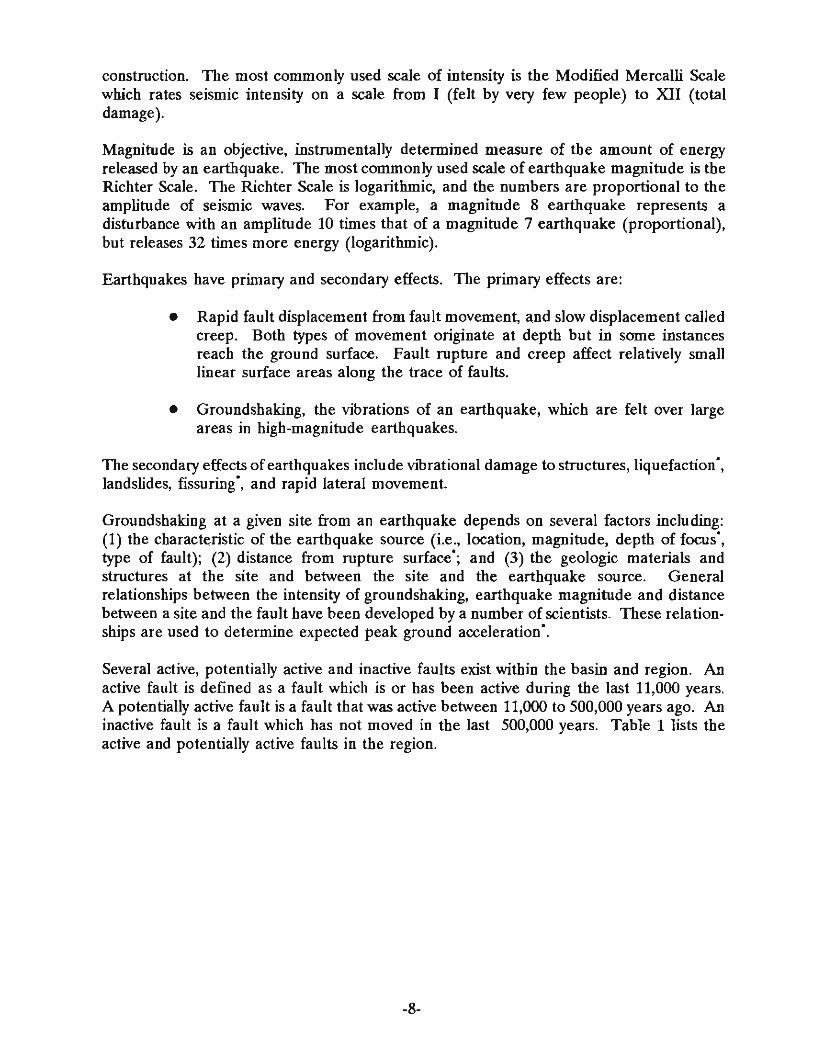
construction. The most commonly used scale of intensity is the Modified Mercalli Scale which rates seismic intensity on a scale from I (felt by very few people) to XII (total damage).
Magnitude is an objective, instrumentally determined measure of the amount of energy released by an earthquake. The most commonly used scale of earthquake magnitude is the Richter Scale. The Richter Scale is logarithmic, and the numbers are proportional to the amplitude of seismic waves. For example, a magnitude 8 earthquake represents a disturbance with an amplitude 10 times that of a magnitude 7 earthquake (proportional), but releases 32 times more energy (logarithmic).
Earthquakes have primary and secondary effects. The primary effects are:
• Rapid fault displacement from fault movement, and slow displacement called creep. Both types of movement originate at depth but in some instances reach the ground surface. Fault rupture and creep affect relatively small linear surface areas along the trace of faults.
• Groundshaking, the vibrations of an earthquake, which are felt over large areas in high-magnitude earthquakes.
The secondary effects of earthquakes include vibrational damage to structures, liquefaction', landslides, fissuring', and rapid lateral movement.
Groundshaking at a given site from an earthquake depends on several factors including: (1) the characteristic of the earthquake source (i.e., location, magnitude, depth of focus', type of fault); (2) distance from rupture surface'; and (3) the geologic materials and structures at the site and between the site and the earthquake source. General relationships between the intensity of ground shaking, earthquake magnitude and distance between a site and the fault have been developed by a number of scientists. These relationships are used to determine expected peak ground acceleration'.
Several active, potentially active and inactive faults exist within the basin and region. An active fault is defined as a fault which is or has been active during the last 11,000 years. A potentially active fault is a fault that was active between 11,000 to 500,000 years ago. An inactive fault is a fault which has not moved in the last 500,000 years. Table 1 lists the active and potentially active faults in the region.
-8-

TABLE 1 ACTIVE AND POTENTIALLY ACTIVE FAULTS
CENTRAL CALIFORNIA COAST AREA (1)
...... ]: Fault >' i< D~~~;nC. froa ) Liait. . ." .~ n( .> .. ~ ... " . .,..-••....
San Andreas 40 miles northeast Active
Nacimiento-Rinconada 18 miles northeast Active ., i 17 miles west Active
Santa Ynez (West) 29 miles south Active
Biq Pine 43 miles southeast ';~ly Active
~-- .. - Maria Within City "_'''a ., 'lly Active
Santa Maria River 0 . 5 miles north Potentially Active
"~,,., ~ .. 5 miles east Potentially Active
Casmalia 5 ",-- -~ , .. " " llly ~ .,
Lion's Head 7 miles south Potentially Active
(1) Source : Namson and Davis (1990), PG&E (1988).
Local Seismicity
The Santa Maria Valley is in an area bounded by two structurally dissimilar mountain ranges: the Coast Ranges to the north and east, and the Transverse ranges to the south. The Coast Ranges are characterized by northwest trending folds' and right-lateral faults'. The dominant fault system in the Coast Ranges is the San Andreas, which includes the San Andreas, Nacimiento-Ricondada, and Hosgri Faults (Figures 5 and 6).
The Transverse Ranges are characterized by east-west trending reverse' and left-lateral faults' and folds. The major faults in this region include the Santa Ynez and Big Pine Faults (Figures 5 and 6),
Within the Santa Maria Valley itself, the faults generally trend northwest. The major faults include the Santa Maria Fault, the Santa Maria River Fault, the Bradley Canyon Fault, the Casmalia Fault, and the Lion's Head Fault (Figure 7).
The Santa Maria River Fault appears to be a part of the Wilmar Avenue - Santa Maria River - Foxen Canyon Fault system. The Wilmar Avenue Fault, along with other similar faults located near the northern edge of the Santa Maria Basin, have been interpreted to have had late Quaternary activity based on disruptions in late Quaternary marine terraces (Lettis, et aI., 1990). Oil industry data indicates that this fault offsets the Pleistocene Age Orcutt Sand, The Santa Maria River Fault is inferred to be active, however, the actual location of the fault is unknown, and Holocene activity of this fault has not been clearly demonstrated. The inferred location is roughly parallel to the cliffs along the northern edge of the Santa Maria River. Hall (1978) has mapped the location of the Bradley Canyon Fault in the proximity of the eastern end of the future landfill area (Figure 7).
-9-

~ . ~ . ". • • • • • • • • •
• • • • • • • • • " . . • A' • • • 36
Santa Maria
34
N
I
'" V~ '" '" ... ~ "
" I) " '" " • • '" :
", "
S.nta
o I
• • • • • • • • • • • • • • • • • • • • • • • •
• • · • • • • • • • • • • • • • • • • • • • • • • • .' ' .... ,
, •••• In ,,' • .. ' • • • •
,., -'. " '.
•••• •••••••••• ", " . ' .
~~~----~ ~
80 km I
1200
-1 0-
• Lo. Ange' ••
SOURCE : NAMSON AND DAVIS (1990)
Figure 5
Regional Structural Map
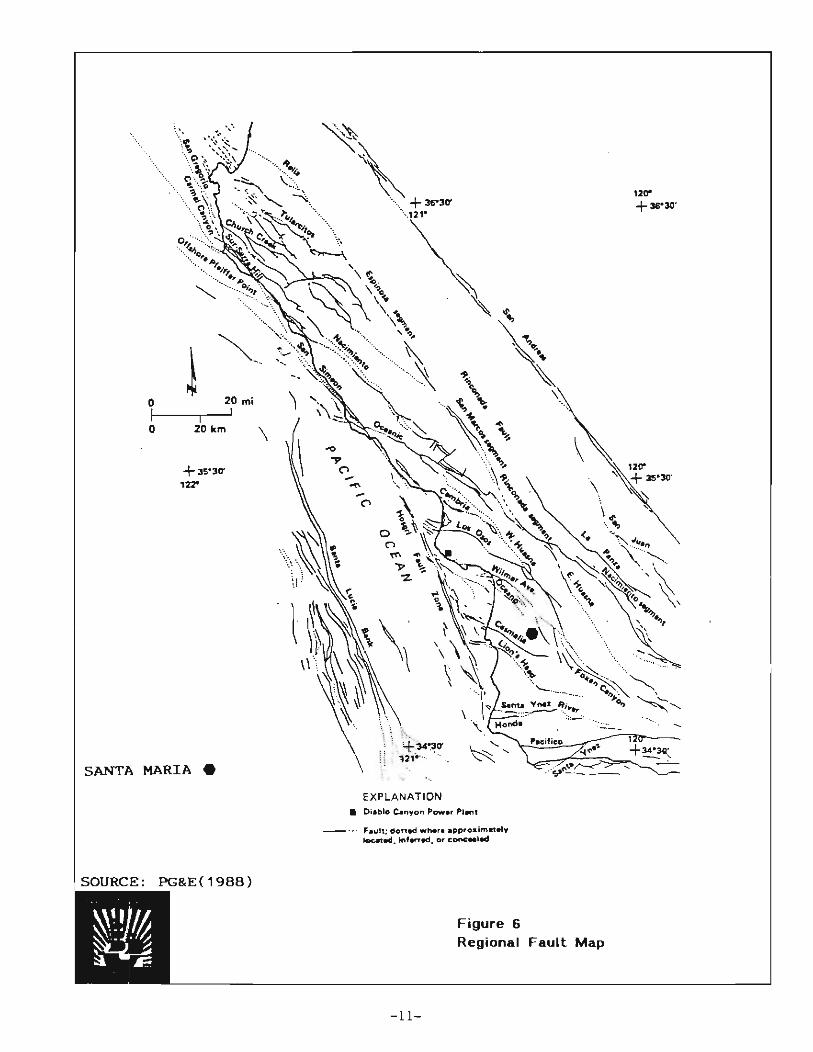
'~'.
\.
...•
! 20 mi 0
I i I
0 20 km \
+ 35'30'
'22'
\1
SANT A MARIA.
SOURCE : PG&E(1988)
~\-~ +36'30'
.... ~
C' -..... -C'
-11-
Figure 6 Regional
~; . ... .. ...::"- .
120' +36'30-
.......
-,,~-. -
+~o;.
Fault Map

N
I NO SCALE
Figure 7
Local Fault Map
SOURCE : PG&E
-1 2-

I
I
\
The inferred trace of the north-northwest trending Santa Maria Fault transects the City of Santa Maria (Figure 7). Based on publications by Canfield (1939), Worts (1951), and Manson (1985), the Santa Maria Fault is a concealed, partially inferred, high angle reverse fault·. Because the location of the fault is based primarily on oil well data, the precise location of the fault is undetermined. The Safety Element of the City of Santa Maria General Plan (1987) and the Seismic Safety and Safety Element of the Santa Barbara County Comprehensive Plan (1979) classify the Santa Maria Fault as inactive. Canfield (1939), Worts (1951), and Manson (1985) indicate that the Paso Robles Formation is the youngest strata offset by the Santa Maria Fault. Woodring and Bramlette (1950) and Worts (1951) designate the Paso Robles Formation as Plio-Pleistocene in age. Therefore, the Santa Maria Fault should be considered potentially active since it offsets rocks that are approximately 500,000 years in age.
Several major faults located outside the City Limits and immediate vicinity are capable of producing significant groundshaking in the Planning Area. These include the active Nacimiento, Big Pine, Santa Ynez and San Andreas faults. However, accelerations occurring in the Planning Area as a result of rupture along these faults are expected to be lower than those resulting from an event on the Casmalia-Orcutt-Little Pine Fault, or on a blind thrust fault as inferred by Namson and Davis (1990).
Nearby faults and their characteristics in the Planning Area from associated earthquakes are listed in Table 2.
TABLE 2 FAULT CHARACTERISTICS IN THE CENTRAL CALIFORNIA COAST AREA (1)
Kaxiaua Maxiaua Mile. Probable Credible
Fault I Away Earthquake (2) . Earthquake (3)
Black Mountain (4) 10 6.5 7.5
Casmalia-Orcutt-Little Pine 7 6.5 7.5
Hosgri 21 7.0 8.0
Los Alamos - Baseline-Lions 12 6.25 7.0
Los Oa08 14 5.5 7.0
Point San Luis (4 ) 3 6.5 7.5
Rinconada 25 6.75 7.5
San Andreas (Mojave 38 8.25 8.5 Segment)
Wilmar Ave.-Santa Maria < 1 - 5 4 . 5 6 . 5 River
(1) Source: Final EIR for the Santa Maria Regional Landfill Site Facility Permit, October 1993. (2) The Maximum Probable Earthquake is the maximum magnitude earthquake that is likely to occur during a lOO-year interval. (3) The Maximum Credible Earthquake is the maximum magnitude earthquake that could occur under the presently known geologic conditions. (4) Blind Thrust Fault inferred by Namson and Davis (1990) and, as such, surface locations are not identified.
-13-

The location of earthquakes of magnitude 5 and larger since 1812 in the region, including the Planning Area, is shown in Figure 8. Table 3 presents a summary of these earthquakes. The closest epicenter to the Planning Area was the magnitude 5 quake on November 18, 1927 which occurred near the City of Santa Maria on the east side of the valley (Event #13).
TABLE 3 EARTHQUAKES LOCATED WITHIN THE PLANNING AREA
WITH MAGNITUDE OF 5 AND LARGER, 1912-1988 (1)
.i ············· ; )(2» . ii nat. < . .....•....
I···· > M~;:;;;~ <c. "it. •• . .... . ..• •• ~:";~;;';' > .s ? •• 5 July 1902 5.5 Los Alamos
6 Dec. 12, 1902 5 . 0 Los .. hmna
8 Oct. 20, 1913 5 . 0+ A Grande
9 Jan. 11, 1915 5.2 Los Alamos
10 Dec. 1, 1916 5.0 Avila
11 Jul. 9 1917 5.0 T . ""nvon
12 Nov . 4, 1927 7.0 Offshore, w. of Pt . 110
13 Nov. 18 1927 5.0 "a .f-a Ma .; a
19 May 29, 1980 5.0 Oh , , w. of Point Sal
(1) Source: PG&E (1988) . (2) See Figure 8 for event locations . Only events near the Planning Area are included which accounts for the gaps in the numerical sequence .
Alquist-Priolo Earthquake Fault Zones
The Alquist-Priolo Earthquake Fault Zones Act, codified in Section 2621 et. seq. of the Public Resources Code, was enacted to assist cities and counties in their planning, zoning, and building code functions with respect to active fault traces. The Act requires the State Geologist to delineate special studies zones to encompass all potentially and recently active traces of the San Andreas, Calaveras, Hayward, and San Jacinto Faults, and such other faults, or segments thereof, as the State Geologist deems sufficiently active and well-defined as to constitute a potential hazard to structures from surface faulting or fault creep. Such special studies zones shall ordinarily be one-quarter mile or less in width, except in circumstances which may require the State Geologist to designate a wider zone.
As of the date of this report, the State Geologist has not identified any Earthquake Fault zones within the Planning Area.
GEOLOGIC HAZARDS
Earthquakes/Ground Shaking
Ground shaking or ground motion is caused by the release of accumulated energy during an earthquake. The energy is released in the form of seismic waves which travel outward in all directions from the earthquake center. The intensity of groundshaking at a particular
-14-

, L
35
Earthquake epicenter:
1812-Year of event 00 Event number
... SANTA MARIA
SOURCE: PG&E (1988)-
o
EXPLANATION
E vent location that is poorly constrained
Event location that is within 20 kilometers and generally within 10 kilometers
Historic earthquakes with fault rupture along San Andreas fault zone
Figure 8
1966 and earl ie, Par.l<fie'ttJ
earthquak'es .
\.aS7 FDrt Tejon eafthquake (Northern
part)
Magnitude
85.0 - 5.9 6.0 -6.9 7.0 -7.9
Historical Earthquakes Magnitude 5 and Larger 1812 - 1988
-15-

site is a function of several factors including maximum ground acceleration, magnitude of the earthquake, near surface amplification, distance from earthquake center, duration of strong shaking, and natural VIbration period.
Available geologic information indicates that the potential for strong ground shaking in coastal southern California is high. The potential for severe ground shaking would occur as a result of movement along one of the major California faults (e.g. San Andreas) and such movement could generate significant damage throughout the City. More recently, however, scientists theorize that unmapped blind thrust faults may have a greater potential for movement than major, known faults. Figure 9 shows the earthquake probability in the region over the next 30 years as a result of recent studies. Santa Maria has a 40 percent chance of experiencing peak ground accelerations at least 20 percent of gravity. That is enough shaking to cause structural damage. See the Emergency Services Section for a further discussion of earthquake emergencies and damage.
Santa Maria can be divided into two distinct seismic zones (Figure 10):
Zone A - All areas underlain by Holocene age alluvium. Zone B - All areas underlain by Pleistocene age non-marine terrace deposits.
Zone A is considered the most hazardous zone with respect to groundshaking potential.
Landslides/Mudslides
A landslide is the perceptible downslope movement of earth masses. It is a part of the continuous, natural process of the downhill movement of soil, rock, and rock debris. Included as common types of landslides are rockfalls, slumps, block glides, mudslides, and debris flows. Landslides or slope instability resulting in landslides may be caused by several natural factors including broken or weak bedrock, dip slopes', heavy rainfall, erosion, gravity, seismic activity, fire, and by human alteration of topography and water content in soil.
Landslides and mudslides could potentially occur in areas with steep slopes or in areas containing escarpments. Figure 10 shows these potential areas within the Planning Area.
Liquefaction
Liquefaction is the process by which relatively soft, watery sediments may liquefy (lose their solidity) during moderate to intense ground shaking caused by an earthquake. The potential for liquefaction to occur is greatest in areas with loose, granular, low-density soils, where the water table is within the upper 40 to 50 feet of the ground surface.
Liquefaction potential from groundshaking is generally low in the Planning Area due to the relatively deep groundwater levels that are ordinarily over 70 feet below the ground surface. However, several areas of perched groundwater in the vicinity of the Santa Maria Public Airport could cause liquefaction during an earthquake (Figure 10).
-16-

N
I
Ear'hquake probability, 1994·2024 ' A contour map of areas most likely to experience ground shaking in excess of O,2g , (20% of the force of gravity), which is enough to cause structural damage,
\. 10% - -,
' I Barstow 1 •
Source: Working Group on California Earthquake Probabililies , 1995 , Seismic hazards in soulhern California: probable earthquakes, 1994 to 2024: Bulletin of the Seismological Society of America, v. 85 , no. 2, p. 379-439 .
NEVADA
, "
\
10%
"
ASSOCIATEDPR£SS
NO SCALE Figure 9
Earthquake Probabilities
- 17-


Subsidence
Subsidence is the sinking of the ground surface caused by compression or collapse of earth materials. In addition to those forms that occur naturally, several types of subsidence caused by human activity have been identified in California. These are due to groundwater withdrawal, oil or gas withdrawal and hydroconsolidation·.
The Santa Maria area has not had significant subsidence problems despite historical oil drilling in the area. Although subsidence could occur, it is perceived to be insignificant due the absence of reported problems. Since both oil drilling by private parties and groundwater extraction largely by private parties have occurred in the southern portion of the city, pumping activities will be considered in the event subsidence problems occur.
Expansive Soils
Expansive soils are soils that are generally clayey, swell when wet, and shrink when dried. Wetting can occur naturally in a number of ways (absorption from air, rainfall, groundwater fluctuations, broken water or sewer lines).
When structures are placed on expansive soils, foundations may rise each wet season and fall with the succeeding dry season. Movements may vary under different parts of the structure with the result that foundations, walls, and ceilings crack, various structural portions of the building are distorted, and doors and windows are warped so that they do not function properly.
Based on the "Soil Survey of Northern Santa Barbara Area, California", United States Department of Agriculture, July 1972, the following soils in the planning area have a moderate to high potential for expansiveness:
Narlon sand (NvC), hardpan variant - Low to high potential.
Pleasanton sandy loam (PnA, PnC) - Low to moderate potential.
Sorrento loam (SvA, SvC) - Moderate potential.
Figure 10 shows the general location of these soils.
Radon Gas
Radon (Rn222) is a colorless, odorless, radioactive gas. It comes from the natural decay of uranium that is found in nearly all soils. It typically moves through the ground to the air above and into homes and buildings through cracks and openings in the foundation . Any home, school, or workplace may have a radon problem, regardless of whether it is new or old, well-sealed or drafty, or with or without a basement.
-19-
Sections 307 and 309 of the 1988 Indoor Radon Abatement Act (IRAA) direct the Environmental Protection Agency (EPA) to identify areas of the United States that have the potential to produce elevated levels of radon. The EPA Map of Radon Zones is a compilation of that work. The Map of Radon Zones, identifies, on a county by county basis, areas of the U.S. that have the highest potential for elevated radon levels (greater than 4 pCi/C). EPA's Map of Radon Zones assigns each county to one of three zones:
Zone 1 counties have a predicted average indoor screening level of greater than 4 pCi/L.
Zone 2 counties have a predicted average indoor screening level of between 2 pCi/L and 4 pCi/L.
Zone 3 counties have a predicted average indoor screening level of less than 2 pCi/L.
The specific document applicable to California counties is entitled "EPA's Map of Radon Zones, California", U.S. EPA, September 1993. Figure 11 is California's EPA Map of Radon Zones.
Because of the scale of the map presented in Figure 11 and because the smaUest units to present the indoor radon data are counties, some generalizations have been made in order to estimate the radon potential of each area. Variations in geology, soil characteristics, climatic factors, homeowner lifestyles, and other factors that influence radon concentrations can be quite large within any particular geologic area, so Figure 11 cannot be used to estimate or predict the indoor radon concentrations of individual homes or housing tracts. Within any area of a given geologic radon potential ranking, there are likely to be areas where the radon potential is higher or lower than that assigned to the county as a whole. Santa Barbara County has been designated as Zone 1 which is the zone with the highet potential for radon concentrations. EPA and the State Department of Health Services decided to designate Santa Barbara County as Zone 1 based on the elevated radon levels that are associated with the Rincon Shale geologic formation.
Santa Barbara County, along with Ventura County, were designated as Zone 1 because of fourteen readings of 4 pCi/L or greater that occurred during a State/EPA screening survey of indoor radon concentrations. Although no precise location information is available for measured homes in the State/EPA study, an independent study conducted in Santa Barbara County found that indoor radon screening readings ranging from 4 - 50 pCi/L occur in about three-fourths of the homes sited on the Rincon Shale in Santa Barbara County. This rock unit is widely scattered across southern Santa Barbara County and is likely responsible for the many elevated indoor readings in the State/EPA study. The Rincon Shale is not present in the Santa Maria area.
7 Picocuries per liter. A unit of measure of radioactivity.
-20-
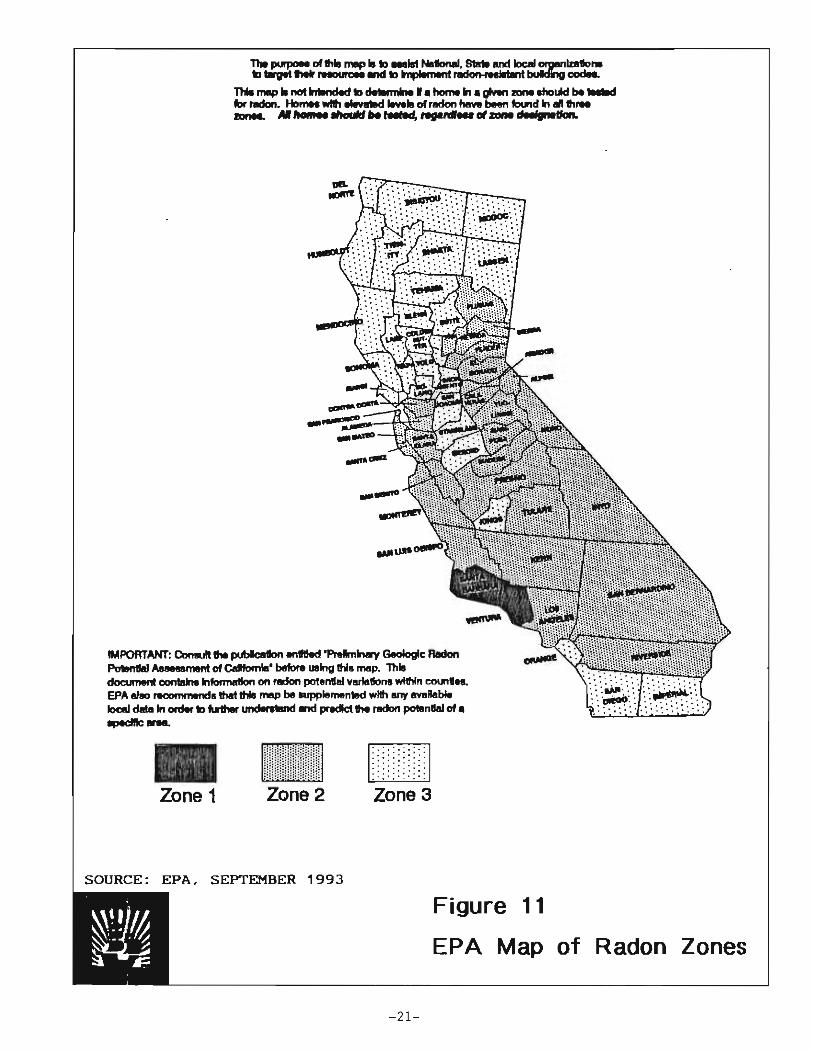
Tho ~ 01 ........ 10 to _lot NotonoI. _ ond _ ......... ., .. tolwgll __ 1IId to ., ... ,."t_bulding __
ThIo .... II Il0l.,100_ to ...... " ..... homo In. gMn -.. ""'lAd be IIIIod "" ...... ____ 01 ____ 1n0ll"_ __ ".,...,._IIe,..." ____ ............
IMPORTANT: ConIUft tho ".--• ...--.., GooIogIc Radon PoItntIoI_rnont 01 Calbnlo' before using 1hI. map. 11110 __ •• """ ...... on"'" pot ...... yorlo_ wtIhIn eoun .... EPA ..... 'ecGi ..... ,d.1hot IhIo mop be ouppIemonl8d wllh 1lIIY available IocIII data In onIor to IuI1I.- ...... "'of IIId procIc:t 1M ..... poIon'" 01. apedIIc ....
Zone 1 Zone 2 Zone 3
SOURCE : EPA , SEPTEMBER 1993
Figure 11
EPA Map of Radon Zones
-2 1-
Overall, the Southern Coast Range Province (of which Santa Maria is a part) has moderate geologic radon potential overall; however, much of the radon potential is associated with areas of elevated radioactivity inland from the coast, from Monterey Bay southward. Houses sited on radium-rich marine sedimentary rocks in this province, such as the Monterey Formation, are very likely to exceed 4 pCi/L.
Although the above information appears quite specific, it cannot be applied to determine radon levels of a neighborhood, housing tract, or individual house. The only way to determine if a house has elevated indoor radon levels is to test. Testing consists of gathering a sample of air and having it analyzed for radon gas.
Unreinforced Masonry
The risk to life in an earthquake comes primarily from the failure of certain existing buildings that are vulnerable to earthquake forces. Structural damage or collapse of these types of buildings could threaten human life and jeopardize the economy of the City. Unrein forced masonry (URM) buildings in particular have performed poorly in every damaging California earthquake and are considered the foremost threat to life. Although not every URM building will collapse in a significant earthquake, a large number of them will have some degree of life-threatening failure.
URM bearing wall buildings, no longer allowed by the Uniform Building Code, typically have four areas of weakness:
1. Masonry walls, lacking reinforcement, do not have resistance to earthquake shaking without degrading, sometimes leading to collapse. This situation becomes worse in time as the bricks and mortar deteriorate.
2. The practice of not structurally tying the walls to the roof and floors can allow excessive movements in the walls, which may lead to separation of the roof or floor diaphragms resulting in collapse of the roof, floors, and walls.
3. Ground floors with open fronts and little crosswise bracing may allow excessive movement and twisting motions, damaging the building.
4. Unbraced parapets may fall into the street or adjacent buildings.
Steel and concrete frame buildings with URM infill walls and buildings with walls or interior shafts of URM often pose a threat equal to that of URM bearing wall buildings. The unreinforced infill, not designed as part of the structural system, has little resistance to earthquake motion. As the masonry fails, it is likely to fall on those below. If infill walls collapse, there is a sudden change in the building'S stiffness and its ability to withstand continued shaking.
-22-

Recognizing the danger posed by the great number of potentially hazardous buildings in California, the State Legislature enacted the Unreinforced Masonry Building Law'!. This law requires every City to adopt an unreinforced masonry ordinance with a timetable for property owners to reinforce or demolish all identified URM buildings.
The above information was summarized from "Guidebook to Identify and Mitigate Seismic Hazards in Buildings", State of California, Seismic Safety Commission, December 1987.
On December 5, 1989, the Santa Maria City Council adopted an unreinforced masonry implementation ordinance (Ordinance Number 89-29 which added Section 9-1.221 to the Municipal Code). The ordinance adopted standards and a time schedule for reinforcing URM buildings based on the type of building and its occupant load. Table 4 presents a summary of the rating classifications and when improvements have to start and be completed.
TABLE 4 URM CLASSIFICATIONS
Ii .i(. .. . ...... Buiwu.cP • .:< I .. .. I i ·ii? ..... Sub.mttal Dead- .. it lutiaJKle • ••••
. .,., Ii. (or R~b.b D...u ... eo.-... eo ........ Wltbill Cla .. ir~tioll Ocwpaat Load Pia .. .....•. W.tIoiD i. ......
I Any 1/1/93 1/1/1 995 180 days 3 years
II 100 or more 1/1/93 1/1/1995 180 days 3 years
III 20 to 100 1/1/93 1/1/2000 180 days 3 years
IV Less than 20 1/1/93 1/1/2000 180 days 3 years
The City has identified 28 URM buildings within the City. These buildings are described in Appendix B. Three buildings are designated as Class II, twenty-one buildings are designated as Class III, and four buildings are designated as Class IV. No buildings are designated as Class I. All but approximately 8 property owners have complied with the January 1, 1993 date to submit rehabilitation plans for their URM building.
GLOSSARY
The following is a glossary of selected geologic terms as used in this Chapter.
Alluvial. Sand and gravel transported by a river and deposited at points along a flood plain.
Conglomerate. A type of sedimentary rock consisting of rounded rock fragments cemented together.
Depth of Focus. The point of origin of an earthquake.
Dip Slope. A topographic surface (i.e. side of a hill) which slopes in the same direction as the rock layers (see Appendix C).
8 Chapter 250, statutes of 1986; SB 547; Government Code section 8875 et seq.
-23-
Fault. Blind Thrust. Thrust faults that have not, as yet, shown up at the surface (see Appendix C).
Fault. Left-Lateral. A fault which exhibits horizontal movement such that the area on one side of the fault moves to the left relative to the area on the other side of the fault (see Appendix C).
Fault, Nonnal. A fault which exhibits vertical movement such that one side of the fault moves away from the other side (see Appendix C).
Fault, Right-Lateral. A fault which exhibits horizontal movement such that the area on one side of the fault moves to the right relative to the area on the other side of the fault (see Appendix C).
Fault, Thrust or Reverse. A fault which exhibits vertical movement such that one side of the fault moves toward the other side (see Appendix C). If the angle of the vertical movement is low, the fault is referred to as a thrust fault.
Fissure. Linear cracks or breaks in the earth's surface, often as a result of movement along a fault.
Fold. Rock layers that are arched or bent (see Appendix C).
Fold and Thrust Belt. An area in which rock layers exhibit folding and thrust faulting.
Ground Acceleration. A measure of how much the ground will move in an earthquake, usually measured in a percentage of the force of gravity (i.e. in an earthquake with a ground acceleration of 0.2g has an acceleration that is 20% the force of gravity).
Hydroconsolidation. Subsidence caused when weight is placed on soil that contains water.
Liquefaction. The transformation of water saturated sand and silt from a solid to a liquid during an earthquake.
Rupture Surface. The surface of a fault that moves during an earthquake.
Shortening. Compressive force in which land areas are pressed against one another, often resulting in folding and thrust faulting.
Siliceous. Rocks made up of minerals from the silica group (i.e. quartz).
Unconformity. Break in the geologic time sequence.
Uplift. The movement of an area upwards as result of earth processes (i.e. earthquakes, folding) .
-24-

FLOODING
Flooding hazards within the Planning Area consist of localized and widespread flooding due to storms, failure of the Santa Maria River levee system, and from dam inundation caused by the failure of Twitchell Dam.
FLOODING
A flood is defined as a temporary rise in water level that results in water overtopping its banks and inundating areas adjacent to the channel not normally covered with water. The flood plain is the relatively flat or lowland area adjoining the water source that is subject to periodic inundation by floodwater.
The flooding associated with the 1oo-year storm is of primary consideration. Such a storm has a statistical likelihood of occurring once in a hundred year span, or a one percent chance during any given year. The 100-year flood determination is the accepted standard for flood protection by agencies involved in the assessment of flood risks. The Department of Housing and Urban Development (HUD), in their issuance of flood insurance as part of the Flood Protection Disaster Act of 1974, has adopted the 1OO-year flood level as the determinant of the floodplain area having a hazard potential requiring specific or protective measures. The City has also adopted the 1oo-year flood plain through its participation in the Flood Insurance Rate Program through the Federal Emergency Management Agency.
Flood prone areas in the Planning Area are noted in Figure 12. The 1oo-year flood plain is generally in the areas of the Santa Maria River and the Orcutt Creek. The Santa Maria River Levee, built by the U.S. Army Corp of Engineers, is designed to protect the City from the lOO-year flood. However, the levee does not prevent localized flooding from the various flood control facilities in the Planning Area. Localized flooding cannot be accurately mapped as it depends on the magnitude and location of the causative storm.
DAM INUNDA nON
Dam inundation is the flooding of lands due to the failure or overtopping of a dam. Dam failures can result from a number of natural and man-made causes such as earthquakes, erosion of the face or foundation, improper siting, rapidly rising flood waters, and structural/design flaws.
Twitchell Dam is the closest potential source of dam inundation in the Planning Area. However, Twitchell Dam is not used for perennial water storage. The dam, shown in Figure 13, was constructed by the Bureau of Reclamation in 1958, and is primarily used for groundwater recharge and flood control. It is an earthfill dam, 216 feet in height, with a storage capacity of over 240,000 acre-feet. If Twitchell Dam is filled to capacity and the dam fails and the Santa Maria River Levee fails, a significant portion of the City would be inundated by flood waters. However, the probability of total dam failure and levee failure is remote. In addition, the dam holds water only periodically and is not a reservoir.
-25-


o
Poin, SII
Point Conception
Reservoir
Twitchell Dam
SISQUOC RIVER
WATERSHED
SANT .... BARBARA CHANNEL
SAIfTA YNEZ RIVER WATERSHED
Cib"Jllllr
Source: Sante 8.,b.,. County R •• ource Maneg.ment Oepwtment. County Wale, Agency. Or.1t ProR''''' Envi,onmentallmpaet A.port . Groundwater AesoUfcn Section, Conservation Eillment . Santa Barbara County Comprehen.iv. Plan. October 1991 .
EXPLANATION
Major Walatshed Boondaly
N
I 5 I.
Seale in,... Figure 13
Watersheds
- 27-

WATERSHEDS
The potential for flooding and dam inundation comes from storm water that is collected in the 260 square mile Santa Maria Valley watershed that is located in both Santa Barbara and San Luis Obispo Counties. The Sisquoc River and Cuyama River watersheds combine to form the Santa Maria Valley watershed (Figure 13).
Localized watersheds within the Planning Area consist of a series of storm drains, open channels, and retardation basins. Please refer to Figure RME-9 of the Resource Management Element for the location of these local facilities. The local storm drain facilities empty into the Santa Maria River.
-28-

• I
WILDLAND FIRES
Fires in undeveloped areas usually result from the ignition of grasses and brush material, and are often referred to as wildland fires. Wildland fires in the Santa Maria Planning Area are characterized as limited grassland and brush fires due to the absence of extensive tracts of mountainous, brush covered terrain. Factors influencing wildland fires in the Planning area are climate, vegetation, slope and human proximity .
CLIMATE
The Santa Maria Planning Area posses a moderately cool mediterranean climate characteristic of coastal central California. The average monthly temperatures are 68 degrees F maximum, 45 degrees F minimum, and 57 degrees F mean. The warmest month is typically September, with an average maximum of 74 degrees F, while the coldest month is December with an average minimum of 38 degrees F. Precipitation, essentially all in the form of rain, falls primarily from November through April. The average annual precipitation is 12.35 inches. However, even during summer, the moderating influence of moist on-shore marine air movement helps maintain a level of humidity in the area. Moist air decreases the fire hazard by maintaining high moisture content in the leaves and tissues of local vegetation.
VEGETATION
The vegetation of an area provides the fuel for brush and grass fires. This determines the potential for fire and the type of fire most likely to occur. The two major, naturally occurring vegetation communities in the planning area are oak savannah and coastal sage scrub. Coastal sage scrub ranks as one of the more flammable plant communities in California.
The oak savannah community also ranks as a potential flammable vegetation type. Fires in oak savannahs usually involve the grassland portion of the community, and, only in extreme cases, do resident oak trees ignite.
The coastal sage scrub and oak savannah only occur in the southern portion of the Planning Area in the Casmalia and Solomon Hills. The remainder of the study area has been disturbed, either through urbanization or cultivation.
SLOPE
The slope of an area relates to the presence of steep hillsides and canyons that can create potentially dangerous wind drafts during fire outbreaks. Slope may also limit the strategy that a fire protection agency can employ in combatting a fire since it will be more difficult to employ ground personnel and vehicles to the fire.
Slopes in the Planning Area are generally very shallow, ranging less than 10 percent. However, in the Casmalia and Solomon Hills to the south, slopes often approach 25 percent, and in certain areas approach 40 percent. Therefore, fire problems associated with steep slopes are localized in the hills to the south and west of the Orcutt area.
-29-
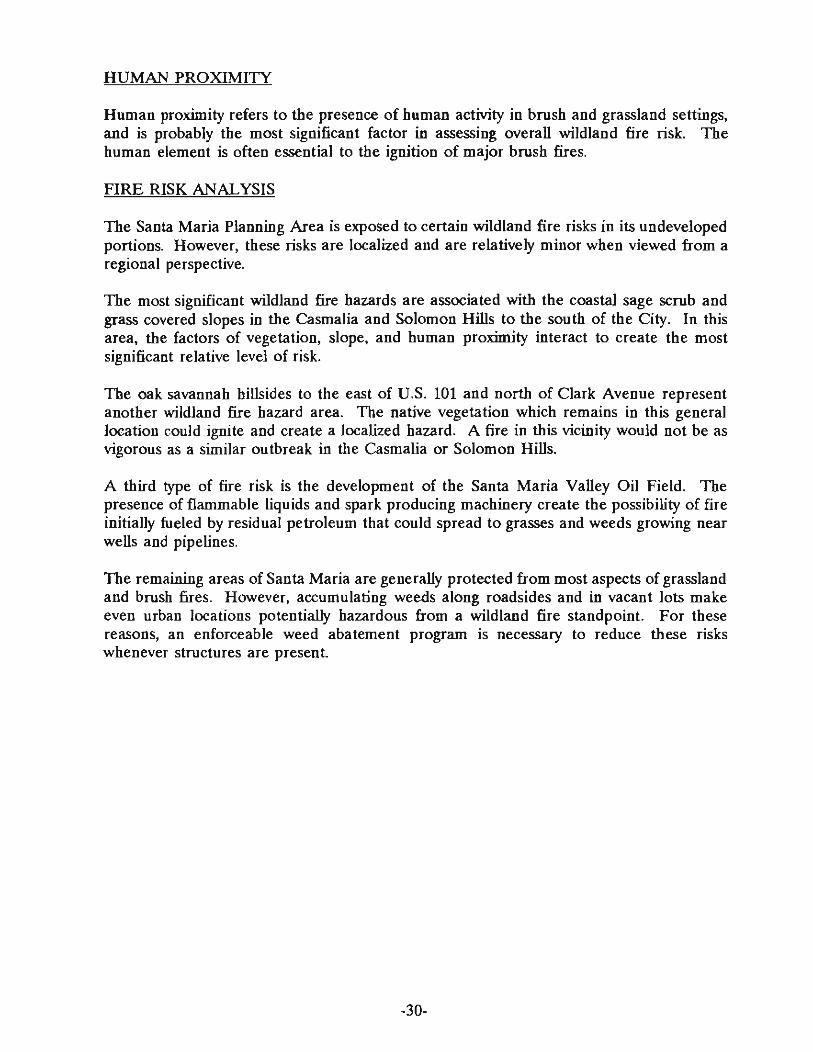
HUMAN PROXIMITY
Human proximity refers to the presence of human activity in brush and grassland settings, and is probably the most significant factor in assessing overaU wildland fire risk. The human element is often essential to the ignition of major brush fires.
FIRE RISK ANALYSIS
The Santa Maria Planning Area is exposed to certain wildland fire risks in its undeveloped portions. However, these risks are localized and are relatively minor when viewed from a regional perspective.
The most significant wildland fire hazards are associated with the coastal sage scrub and grass covered slopes in the Casmalia and Solomon HiUs to the south of the City. In this area, the factors of vegetation, slope, and human proximity interact to create the most significant relative level of risk.
The oak savannah hillsides to the east of U.S. 101 and north of Clark Avenue represent another wildland fire hazard area. The native vegetation which remains in this general location could ignite and create a localized hazard. A fire in this vicinity would not be as vigorous as a similar outbreak in the Casmalia or Solomon HiUs.
A third type of fire risk is the development of the Santa Maria VaUey Oil Field. The presence of flammable liquids and spark producing machinery create the possibility of fire initially fueled by residual petroleum that could spread to grasses and weeds growing near wells and pipelines.
The remaining areas of Santa Maria are generally protected from most aspects of grassland and brush fires. However, accumulating weeds along roadsides and in vacant lots make even urban locations potentially hazardous from a wildland fire standpoint. For these reasons, an enforceable weed abatement program is necessary to reduce these risks whenever structures are present.
-30-
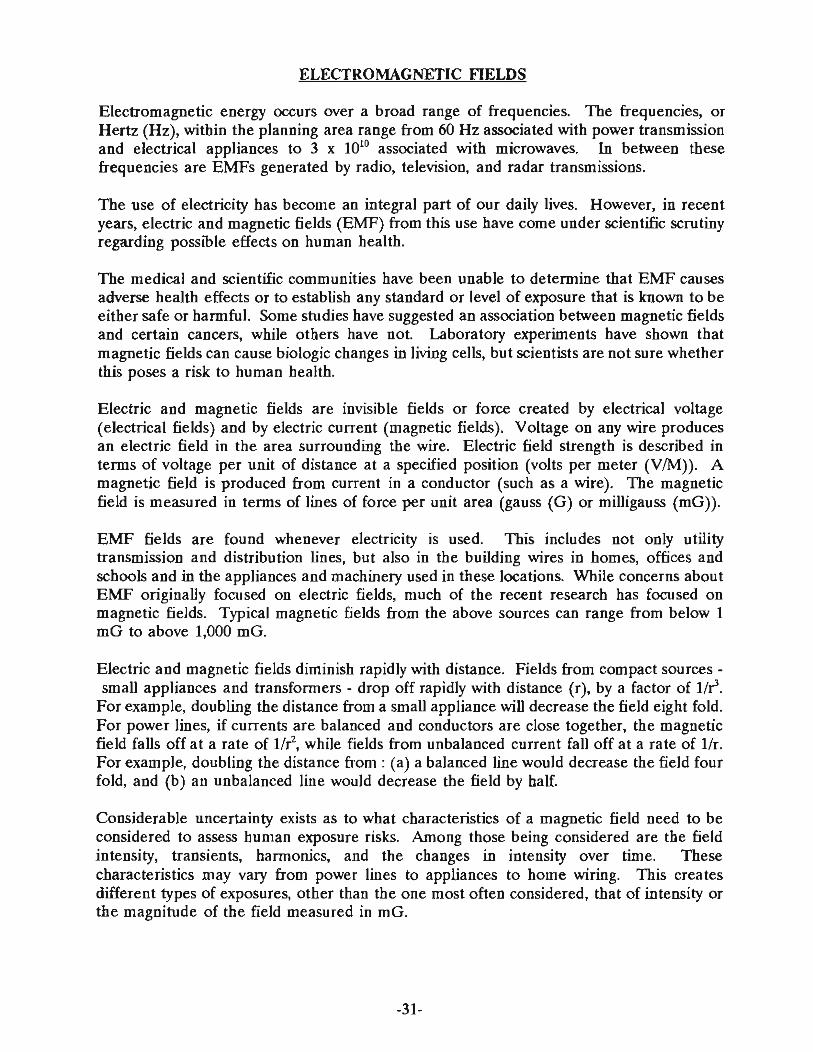
ELECTROMAGNETIC FIELDS
Electromagnetic energy occurs over a broad range of frequencies. The frequencies, or Hertz (Hz), within the planning area range from 60 Hz associated with power transmission and electrical appliances to 3 x 10¹⁰ associated with microwaves. In between these frequencies are EMFs generated by radio, television, and radar transmissions.
The use of electricity has become an integral part of our daily lives. However, in recent years, electric and magnetic fields (EMF) from this use have come under scientific scrutiny regarding possible effects on human health.
The medical and scientific communities have been unable to determine that EMF causes adverse health effects or to establish any standard or level of exposure that is known to be either safe or harmful. Some studies have suggested an association between magnetic fields and certain cancers, while others have not. Laboratory experiments have shown that magnetic fields can cause biologic changes in living cells, but scientists are not sure whether this poses a risk to human health.
Electric and magnetic fields are invisible fields or force created by electrical voltage (electrical fields) and by electric current (magnetic fields). Voltage on any wire produces an electric field in the area surrounding the wire. Electric field strength is described in terms of voltage per unit of distance at a specified position (volts per meter (V 1M». A magnetic field is produced from current in a conductor (such as a wire). The magnetic field is measured in terms of lines of force per unit area (gauss (G) or milligauss (mG».
EMF fields are found whenever electricity is used. This includes not only utility transmission and distribution lines, but also in the building wires in homes, offices and schools and in the appliances and machinery used in these locations. While concerns about EMF originally focused on electric fields, much of the recent research has focused on magnetic fields. Typical magnetic fields from the above sources can range from below 1 mG to above 1,000 mG.
Electric and magnetic fields diminish rapidly with distance. Fields from compact sources -small appliances and transformers - drop off rapidly with distance (r), by a factor of lIr.
For example, doubling the distance from a small appliance will decrease the field eight fold. For power lines, if currents are balanced and conductors are close together, the magnetic field falls off at a rate of 1/r2, while fields from unbalanced current fall off at a rate of 1/T. For example, doubling the distance from: (a) a balanced line would decrease the field four fold, and (b) an unbalanced line would decrease the field by half.
Considerable uncertainty exists as to what characteristics of a magnetic field need to be considered to assess human exposure risks. Among those being considered are the field intensity, transients, harmonics, and the changes in intensity over time. These characteristics may vary from power lines to appliances to home wiring. This creates different types of exposures, other than the one most often considered, that of intensity or the magnitude of the field measured in mG.
-31-
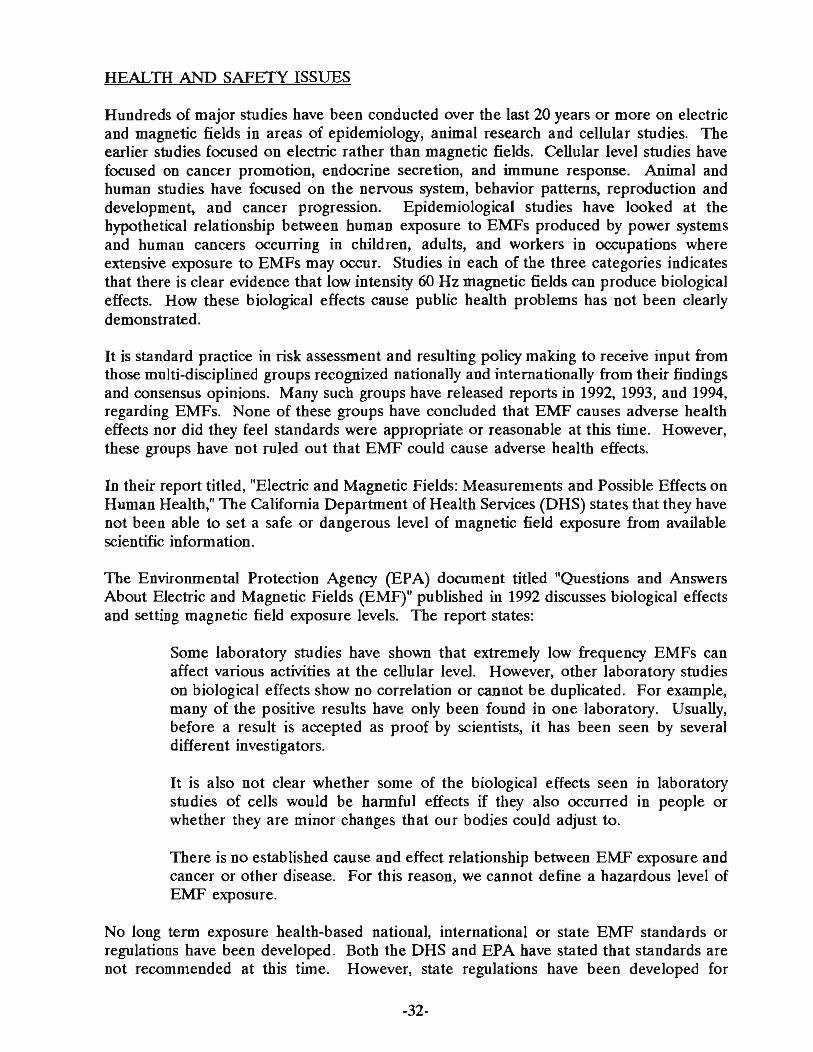
HEALTH AND SAFETY ISSUES
Hundreds of major studies have been conducted over the last 20 years or more on electric and magnetic fields in areas of epidemiology, animal research and cellular studies. The earlier studies focused on electric rather than magnetic fields. Cellular level studies have focused on cancer promotion, endocrine secretion, and immune response. Animal and human studies have focused on the nervous system, behavior patterns, reproduction and development, and cancer progression. Epidemiological studies have looked at the hypothetical relationship between human exposure to EMFs produced by power systems and human cancers occurring in children, adults, and workers in occupations where extensive exposure to EMFs may occur. Studies in each of the three categories indicates that there is clear evidence that low intensity 60 Hz magnetic fields can produce biological effects. How these biological effects cause public health problems has not been clearly demonstrated.
It is standard practice in risk assessment and resulting policy making to receive input from those multi-disciplined groups recognized nationally and internationally from their findings and consensus opinions. Many such groups have released reports in 1992, 1993, and 1994, regarding EMFs. None of these groups have concluded that EMF causes adverse health effects nor did they feel standards were appropriate or reasonable at this time. However, these groups have not ruled out that EMF could cause adverse health effects.
In their report titled, "Electric and Magnetic Fields: Measurements and Possible Effects on Human Health," The California Department of Health Services (DHS) states that they have not been able to set a safe or dangerous level of magnetic field exposure from available scientific information.
The Environmental Protection Agency (EPA) document titled "Questions and Answers About Electric and Magnetic Fields (EMF)" published in 1992 discusses biological effects and setting magnetic field exposure levels. The report states:
Some laboratory studies have shown that extremely low frequency EMFs can affect various activities at the cellular level. However, other laboratory studies on biological effects show no correlation or cannot be duplicated. For example, many of the positive results have only been found in one laboratory. Usually, before a result is accepted as proof by scientists, it has been seen by several different investigators.
It is also not clear whether some of the biological effects seen in laboratory studies of cells would be harmful effects if they also occurred In people or whether they are minor changes that our bodies could adjust to.
There is no established cause and effect relationship between EMF exposure and cancer or other disease. For this reason, we cannot define a hazardous level of EMF exposure.
No long term exposure health-based national, international or state EMF standards or regulations have been developed. Both the DHS and EPA have stated that standards are not recommended at this time. However, state regulations have been developed for
-32-

magnetic fields in New York and Florida at levels of 150 mG and 200 mG. These leveJs are based on limiting exposure from new facilities to no greater than existing facilities.
CALIFORNIA PUBLIC UTILITIES COMMISSION (CPUC)
On January 15, 1991, the CPUC opened an investigation to consider its role in mitigatin g health effects, if any, of EMFs from utility facilities and power lines.
A working group of interested parties, called the California EMF Consensus Group, was created by the CPUC to advise it on this issue. The Consensus Group was charged to (a) consider a balanced set of facts and concerns; (b) define near-term research objectives; and (c) develop interim policies and procedures to guide the electric utilities in educating their customers, reducing EMF, and responding to potential health concerns. The Group's fact finding process was open to the public, and its report incorporated concerns expressed by the public. Its recommendations were filed with the CPUC in March 1992.
Based on the work of the Consensus Group, written testimony, and evidentiary hearings, the CPUC in November 1993, issued an interim decision (93-11-01) to address public concern about possible EMF health effects from electric utility facilities. Among the findings:
We find that the body of scientific evidence continues to evolve. However, it is recognized that public concern and scientific uncertainty remain regarding the potential health effects of EMF exposure.
We do not find it appropriate to adopt any specific numerical standard in association with EMF until we have a firm scientific basis for adopting any particular value.
The interim decision specifically implements:
1. No-cost and low-cost steps to reduce EMF. In response to a situation of scientific uncertainty and public concern, the CPUC felt it appropriate for utilities to take no-cost and low-cost measures where feasible to reduce exposure from new or upgraded utility facilities. It directs that no-cost mitigation measures be undertaken, and that low-cost options shall be implemented through the project certification process through the CPUc. Four percent of total budgeted costs is the benchmark in developing EMF mitigation guidelines, and mitigation measures should achieve some noticeable reductions. The CPUC did not adopt specific reduction levels because scientific evidence is not sufficient upon which to base such numbers.
At the same time, the CPUC did not approve utility retrofits of existing facilities solely to reduce EMF levels. The CPUC will continue to monitor this issue and the question of existing facilities as the body of information develops. The CPUC reserves the right to alter the decision in keeping with new findings.
-33-

2. Workshops to develop EMF design guidelines. The order directs the CPUC Advisory and Compliance Division to chair public EMF design guidelines workshops to incorporate EMF mitigation options and share information. The utilities are directed to establish written guidelines which incorporate concepts and criteria such as siting new facilities in alternative locations, increasing rightof-way widths, altering line or tower geometry, using higher voltages to reduce current levels, and undergrounding.
3. Uniform residential and workplace EMF measurement programs. The major utilities already had implemented EMF measurement programs. However, the CPUC directed utilities to compare their EMF measurement policies and establish a standard policy. EMF measurement policies are to be filed with the CPUC and shared with customers. The CPUC recognized that utility facilities may not be a major contributor to EMF exposure given the numerous fields surrounding the grounding systems, electrical appliances, and electronic equipment. The CPUC confirmed the educational value of providing measurements beyond the point of the utility meter, including sources beyond the control of utilities (such as appliances and wiring).
4. Stakeholder and public involvement. The CPUC decision designated the State Department of Health Services (DHS) as the research and education program manager, and asked DHS to determine what stakeholder and public involvement will best meet its needs in developing research and education programs. Utilities are directed to fund DHS' stakeholder and public involvement activities, up to $100,000 over the four years of the research and education programs.
5. A $1,489,000 four year education program. The utilities should continue to work with DHS and incorporate EMF educational information developed by DHS into their EMF education programs. This includes yearly bill inserts subject to review by the CPUC's Public Advisor's Office.
6. A $5,600,000 four year non-experimental and administrative research program. DHS will develop and administer the four year research program specifically related to California electric utilities' facilities and power lines. Utilities are directed to fund this and the education programs.
PACIFIC GAS AND ELECTRIC COMPANY (PG&E)
PG&E is the local utility company that provides electrical power in the Planning Area. Since 1987, PG&E has had written company policies regarding EMF. PG&E has supported and funded medical, scientific and industry research on EMF for several years, and is continuing to do so.
PG&E has a systemwide group of EMF Coordinators who are prepared to respond to customers' inquiries with up-to-date information and provide home and workplace measurements. A package of information which includes material from the EPA, the DHS, and other groups is offered to customers.
-34-

The following are PG&E policies regarding EMF.
1. Establish procedures to explicitly consider EMF exposure in the design of planning for, and communications about, new and upgraded facilities.
2. Take reasonable steps to reduce EMF exposure in the design of new and upgraded facilities.
3. Encourage a multi-industry effort to share responsibility for effectively addressing public concern about EMF exposure, while increasing overall energy efficiency.
4. Work closely with employees and Union leadership to continue to review and implement EMF policies and procedures, and to provide employees with up-todate information.
5. Provide customers with up-to-date information on EMFs and conduct measurements on request.
6. Fund and actively participate in EMF research, and work closely with governmental officials to resolve EMF issues.
PLANNING AREA SOURCES OF EMFs
Sources of EMF radiation in the Planning Area include the following:
1. Electrical transmission lines. 2. Electrical distribution lines (both above and below ground). 3. Appliances. 4. Wiring in homes/offices. 5. Industrial/office equipment.
PG&E electrical transmission lines in the Planning Area are shown in Figure 14. These overhead lines basically follow Railroad Avenue, Blosser Road, and Battles Road. These lines have a frequency of 60 Hz and a voltage of 115 kilovolts. Figure 15 depicts the magnetic field at various distances from an electrical transmission line.
PG&E electrical distribution lines form a grid throughout the Planning Area. These lines also have a frequency of 60 Hz but have a voltage of 12 kilovolts. Both underground and aboveground lines generate EMFs. Figure 16 shows the magnetic field at various distances from an overhead distribution line.
Other sources of EMF include household appliances, electrical wiring, and industrial/office equipment. Any item associated with electricity gives off EMFs. The range of intensities for various household appliances is given in Table 5.
-35-
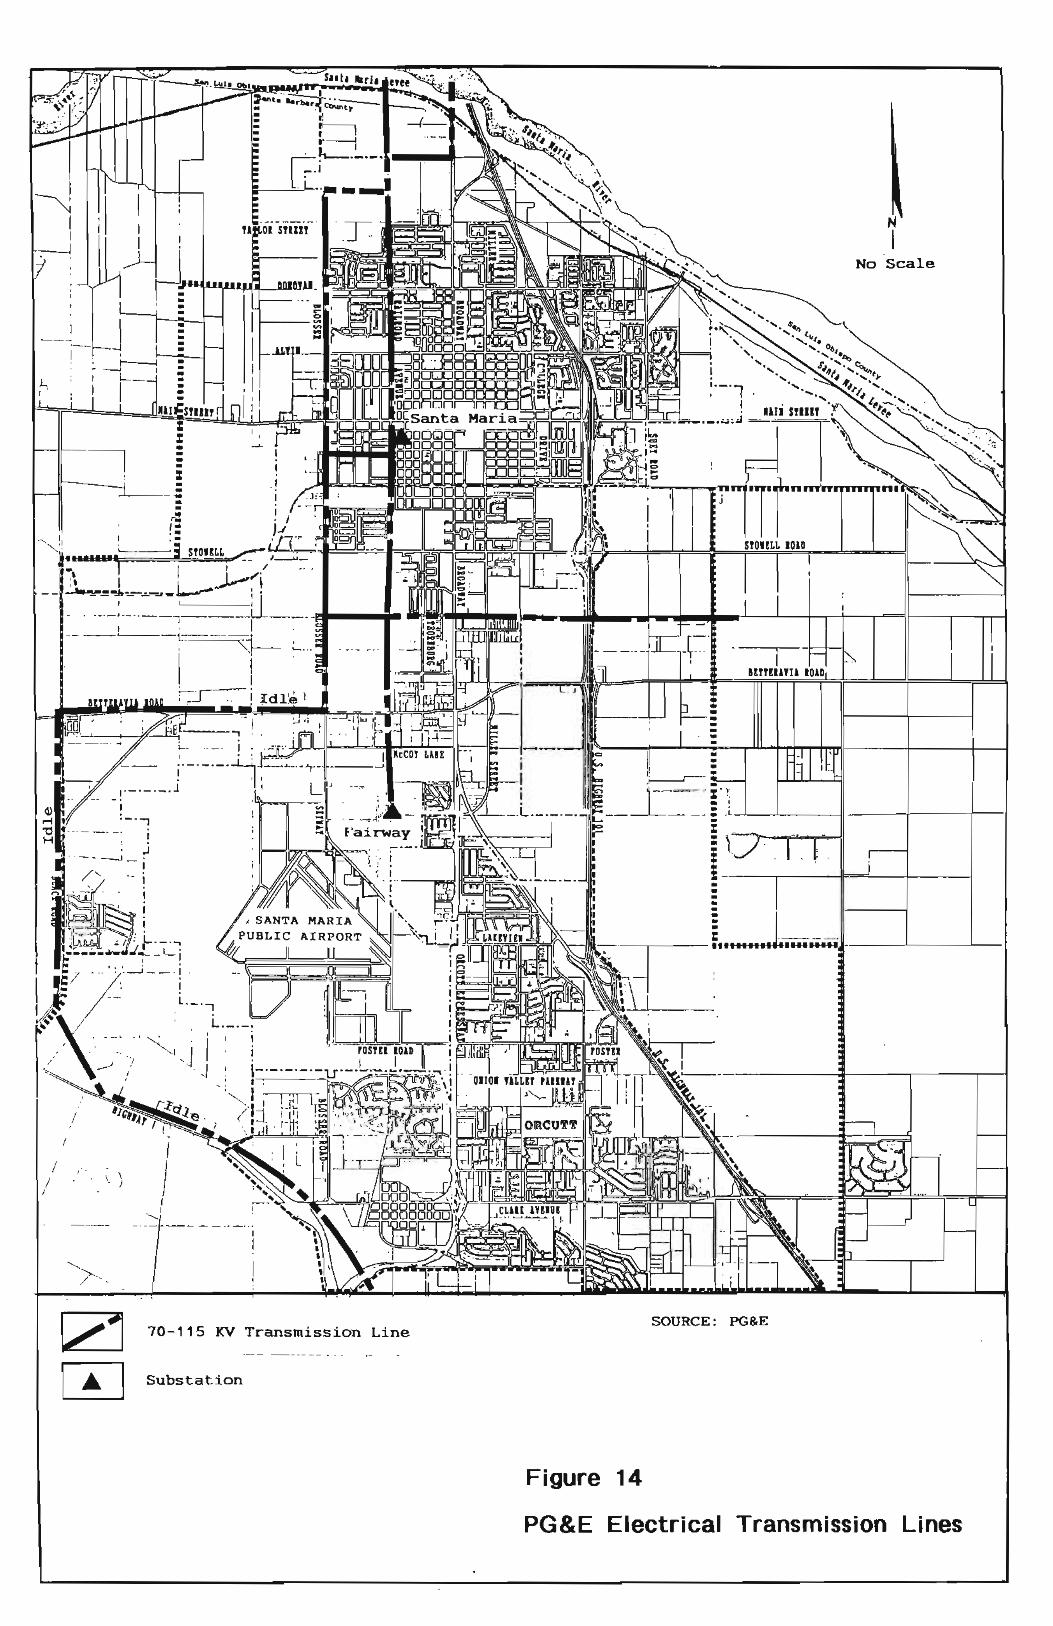
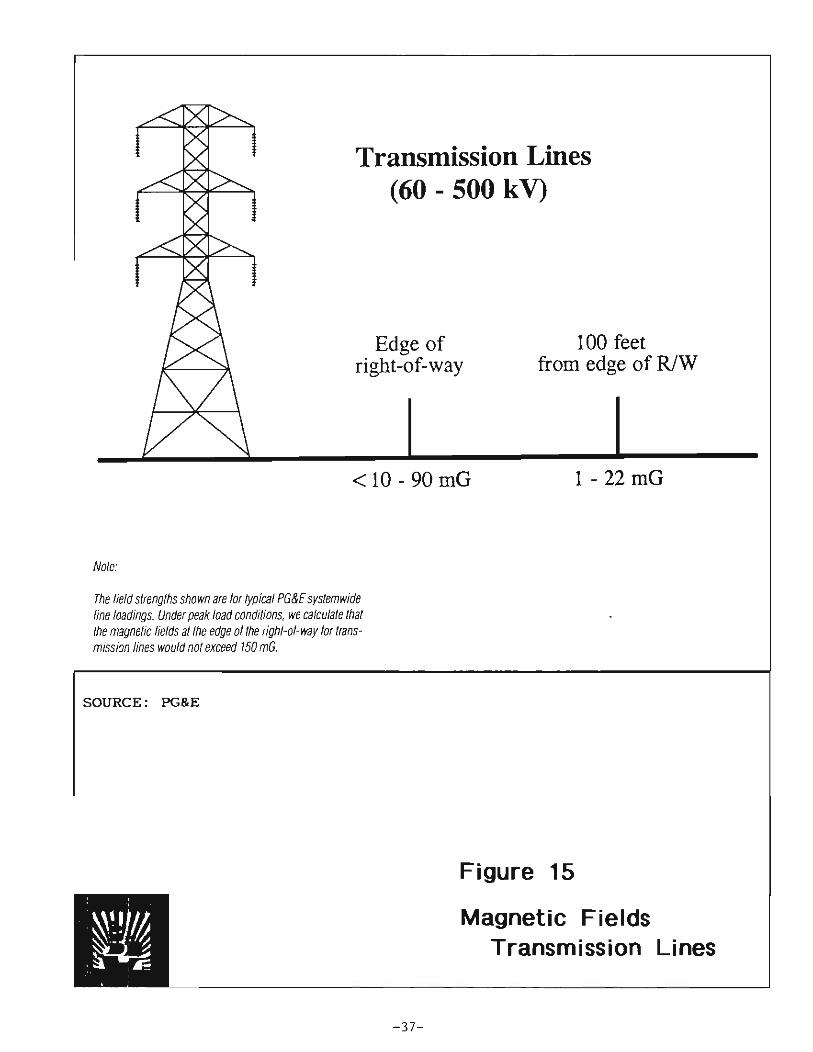
Note:
Transmission Lines (60 - 500 kV)
Edge of right-of-way
< 10 - 90 mG
100 feet from edge of R/W
1 - 22 mG
The fietd strengths shown are for typicat PG&E systemwide line loadings. Under peak load conditions. we calculate that the magnetic fields at the edge of the right-of-way for transmission lines would not exceed 150 mG.
SOURCE : PG&E
- 37-
Figure 15
Magnetic Fields Transmission Lines

Distribution Lines · (21 kV and under)
50 feet
< 2 - 36 mG < 1 - 6 mG
Note:
The fiefd strengths shown are for typicat PG&E systemwide fine loadings
SOURCE : PG&E
- 38-
100 feet
< 1 - 2 mG
Figure 16
Magnetic Fields Distribution Lines
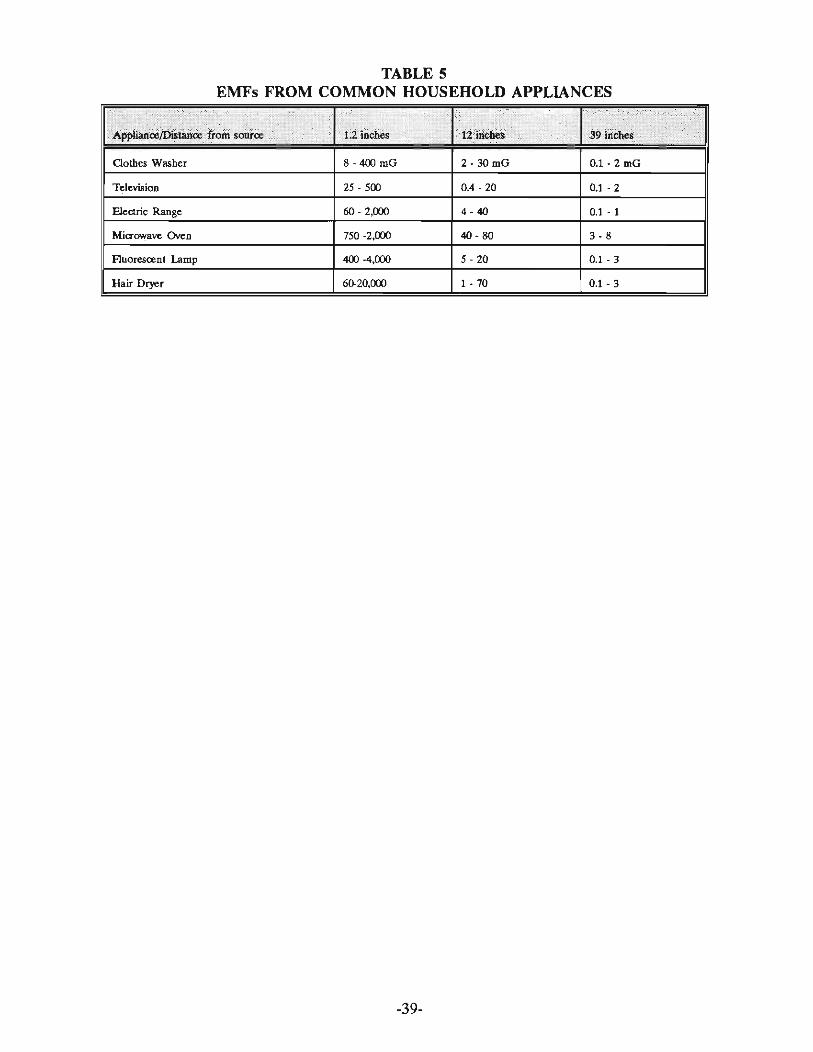
TABLE 5 EMFs FROM COMMON HOUSEHOLD APPLIANCES
~~ < i ·;2· ••.• · •• ·•·.· •• ··.··· •.•.• ·· .•• ·•·•·•·•· ..•.•.•• ·./ .•••••••••••• Ii i .... < .. i 11\): 11 i ·.···· .. ... \.\
dothes Washer 8-4OOmG 2 - 30 mG 0.1 - 2 mG
Television 25 - 500 0.4 - 20 0.1 - 2
EJectric Range 60 - 2,000 4 - 40 0.1 - I
Miaowave Oven 750 -2'000. 40-80 3 - 8
Fluorescent Lamp 400 -4,000 5 - 20 0.1 - 3
Hair Dryer 60-20,000 1-70 0.1 - 3
-39-

OIL WELLS AND OIL SUMPS
Oil production was one of the founding industries of the Santa Maria Valley. Two oil fields are located in the Planning Area: the Santa Maria Valley Field, and the Orcutt Field. These two fields contain over 1400 active and abandoned oil and injection wells. This section will describe the safety aspects of active and abandoned oil wells. Please refer to the Resources Management Element of the General Plan for a detailed description of oil production figures and resource potential. Figure RME-4 of the Resources Management Element shows the general area of oil operations within the Planning Area. Generally, the oil producing area is located south of Stowell Road.
EXISTING OPERATIONS
The source for local oil regulations is the Santa Barbara County Petroleum Ordinance No. 2795, Regulations for Drilling. Producing. Operating. and Abandoning Petroleum Wells. Chapter 11 of Title 9 of the City's Municipal Code adopts the County ordinance as the "petroleum ordinance" of the City of Santa Maria. Chapter 11 also amends certain portions of the County's ordinance to apply specifically to the City of Santa Maria. The City has contracted with the County so that the County Petroleum Engineer acts in that capacity for the City.
The primary intent of the County's and City's ordinances are intended to address particular problems in Santa Barbara County which do not apply generally throughout the State of California. Such problems include a very limited water supply for agricultural and domestic uses which must be protected at all costs from pollution by petroleum operations.
The following is a brief overview of the procedures required to drill and abandon oil wells.
Permits
A permit from the County Petroleum Department and/or the California Division of Oil, Gas, and Geothermal Resources must be obtained for drilling a new well or re-entering a well previously abandoned, prior to commencing said operation within the Planning Area.
Well Spacing
No well shall be located within the following distances from the centerline of any City street or any highway within the City as described in the Circulation Elemen t of the General Plan:
300 feet: freeways; 200 feet: expressways and arterial streets; 190 feet: collector street and industrial and commercial streets; 180 feet: residential streets, residential cul-de-sac and loop streets, boundary
streets, and frontage roads; 160 feet: split-level streets, hillside residential streets, and rural residential
streets.
-40-

No well shall be located within 200 feet of the nearest railroad track which carries passengers for hire.
No well shall be located within 200 feet of any building used for human occupancy, nor shall any such building be erected within 200 feet of any well not abandoned, except buildings incidental to the operation of the well. No well shall be drilled within 150 feet of the outer boundary line of the land included in the lease or unit.
No well shall be placed within 500 feet of any building used as a place of public assemblage, institution, or school, nor shall any such building be erected within 500 feet of any well not abandoned.
The County Petroleum Department may modify or suspend these provisions in whole or in part, if such provisions are rendered unnecessary or unreasonable by the then existing special features (such as topography, nature of the use, height, type of buildings, and the nature of the oil field development) or may impose additional safety requirements necessary under the circumstances.
None of the foregoing spacing requirements shall be applicable to any well commenced prior to the time when any street right-of-way, railroad track, or any other improvements, installations, or facilities listed hereinabove shall have been established or construction thereof commenced.
Storage Tanks
Tanks shall be constructed and maintained so as to prevent leakage. Impervious dikes or walls shall be constructed so as to prevent the escape of fluids from the immediate storage area and be of sufficient size to contain at least one and one-half times the capacity of the largest tank. Any new crude petroleum storage facilities shall not exceed 2,000 barrels per well unless approved by the City Council. Petroleum storage tanks shall be designed, constructed, installed, and maintained in accordance with the applicable provisions of the Uniform Fire Code.
Fire Prevention
The Uniform Fire Code applies to all aspects of oil well operations. This includes, but is not limited to, no smoking within 50 feet of any well, tank, or area where hydrocarbons are present, and no waste gas venting will be permitted. The County Petroleum Department will notify the Fire Department when an oil drilling permit has been filed.
A minimum of two fire extinguishers shall be maintained at all well locations where drilling, servicing or repair work is being conducted.
-41-

Abandonment Procedures
Ahandonment of oil wells shall include the following procedures:
1) All drilling and production equipment and all appurtenant equipment thereto, shall be removed from the drillsite.
2) The well casing shall be cut off at least 6 feet below the ground level. Nothing shall be placed in the excavation above the point of cutoff until the cutoff has been inspected by the County Petroleum Department and the California Division of Oil, Gas, and Geothermal Resources (CDOGGR).
3) Subsurface plugging and abandonment must be completed according to the requirements specified in Sections 1723 through 1723.8 of the California Code of Regulations.
4) The top 50 feet of the remaining well casing shall be filled with a cement plug. 5) A steel cap of not less than the same thickness as the well casing shall be welded
to the casing. 6) All cellars, rig comers, etc., shall be removed and aU excavations and depressions
shall be filled and packed with native earth. All oil, waste oil, refuse and waste material shall be removed from the drillsite and deposited in the appropriate manner.
Hazardous Conditions
In the event that the County Petroleum Department and/or the State Supervisor of Oil, Gas, and Geothermal Resources determines at any time that any well heretofore or hereafter drilled, or other operations covered by the ordinances, is endangering any fresh water body or strata, or that any oil field construction, improvement, or operation constitutes a safety hazard, or a substantial nuisance to the public, the County Petroleum Department and/or the State Supervisor of Oil, Gas, and Geothermal Resources shall have the right to compel the operator to make such modifications as may be required to correct such condition.
Equipment and appurtenances hazardous to life or limb shall either be attended 24 hours a day or enclosed, in all inhabited, urban, or common places of public use areas where there is a reasonable likelihood of potential danger to persons.
Perimeter enclosures shall conform to the enclosure requirements satisfactory to the County Petroleum Department. There shall be at least one gate which is of sufficient width to give access to fire vehicles. The gate shall be locked at aU times when the property is unattended and a key or combination shall be made available to the County Petroleum Department for emergency purposes.
-42-

Sumps
Rotary mud, drill cuttings, petroleum, and all oil field waste derived or resulting from, or connected with, the drilling or producing of any well, shall be discharged into a sump impervious to fluids. Such discharges shall be removed from the drillsite to authorized locations upon completion of the drilling, testing, or workover operations, or within 30 days, whichever occurs first. Tanks used as sumps shall be removed and unlined sumps shall be pumped out, their fluids disposed in a properly designated area, and properly backfilled within 30 days after completion of drilling operations. No unlined or unscreened skimming ponds, separation basins or storage reservoir for salt water, oil field waste, or oil field products will be permitted.
PREVIOUS OPERA nONS
Prior to enactment of County Petroleum Ordinance No. 2795, oil wells and associated facilities and sumps were not abandoned in accordance with current regulations. Improperly abandoned wells, improperly abandoned facilities, and abandoned oil sumps all are potential sources of safety hazards.
Improperly Abandoned Wells
Prior to current abandonment procedures, oil wells were cut off below ground and capped. However, this procedure was not to current abandonment standards. Improperly capped wells have the potential to leak methane gas which poses an explosion hazard.
Section 3208.1 of the Public Resources Code authorizes the State Oil and Gas Supervisor to order the reabandonment of any previously abandoned well when construction of any structure over or near the well could result in a hazard. If the well is not reabandoned, sufficient clearance should be maintained between permanent structures and the well to allow future access (Figure 17).
The City's policy regarding abandoned oil wells depends on whether the well has been abandoned properly. If the well has been abandoned properly, or will be reabandoned, as determined by the California Division of Oil, Gas, and Geothermal Resources (CDOGGR), a ten foot wide radius "no build" easement measured from the well head shall be recorded when the well is on residentially zoned property. For non-residential property, the property owner has the choice of recording the 10 foot wide radius "no build" easement around the well, or installing a CDOG CDOGGR approved venting system over the well in which case a structure may be built over the well.
If the well will not be reabandoned, then a 10 foot wide radius "no build" easement is required to be recorded around the well for all properties, and the distance requirements of the CDOGGR (Figure 17) must also be followed.
-43-

10 F'ttt
~ · -4It- ~.--------------------~.-10 rHI 50 r~~t
0"..,
SUFFICIENT CLEARANCE BETWEEN STRUCTURES AND WELLS
Sufficieut clearance shall be defined as being within 10 feet from the property line andlor structure, limited to any two adjacent sides ot the well aod within SO feet from the property line and/or structure on the third side of the well. The fourth side shaD always have open access.
SOURCE: CALIF. DIV . OF OIL. GAS & GEOTHERMAL RESOURCES
Figure 17
Abandoned Oil Well Clearances
-44-

Abandoned Facilities
In many cases, associated oil well facilities like pipes, concrete slabs, and equipment were abandoned in place and covered over with soil. This has led to subsidence problems when structures are built over these sites. These areas, when discovered, are required to be removed and the soil recompacted.
Oil Sumps/Contaminated Soli
Most oil wells had associated oil sump areas where waste fluids and oil were deposited. In the past, these oil sumps were buried and not removed. Placement of structures over these areas could force the oil and waste fluids to the surface and will also contaminate the soil.
As part of the discretionary review process, the City requires a Phase I Environmental Assessment (EA) for all properties that have the potential to contain an oil sump as defined as follows:
1. All sites that contain an existing or abandoned oil well. 2. All sites within the area of known oil drilling operations as shown in the
Resource Management Element of the General Plan.
However, if a clearance letter from the State Division of Oil, Gas, and Geothermal Resources and/or the State Regional Water Quality Control Board is provided, a Phase I EA will not be required unless evidence of further soil contamination is discovered.
In addition, all former service station sites and other sites that contained a use that could reasonably be expected to create a soil contamination problem are also required to submit a Phase I EA.
The Phase I EA shall contain, at minimum, a description of the study area, a past and present land use analysis, and the general field observations of the site to determine the level of contamination on the site.
If the Phase I EA indicates a presence of soil contamination or oil sumps, detailed soil testing shall be conducted and a report shall be prepared that identifies the extent of the contamination and the appropriate remediation techniques. The soils report shall be submitted prior to acceptance of applications as complete applications.
The City requires that all oil sumps or contaminated soil that is discovered be remediated in accordance with State and County procedures. The State Regional Water Quality Control Board has the primary responsibility for overseeing the remediation process.
-45-

LANDFILL GAS MIGRATION
The City of Santa Maria owns and operates a sanitary landfill located in the northeast portion of the City (Figure 18). In addition, abandoned landfill areas are located underneath Preisker Park and in the area of the airport (Figure 18). A hazard associated with existing and abandoned landfills is underground methane gas migration.
BACKGROUND
Landfill gas (LFG) results from the anaerobic9 decomposition of organic materials lO
within a landfill. LFG is typically composed of 50 to 60 percent methane, 40 to 50 percent carbon dioxide and small percentages of other gases including nitrogen, propane, butane, ethane and chlorinated hydrocarbons and other organic gases.
The methane gas component of LFG can be explosive when concentrations reach a range of 5 to 15 percent by volume in air and are confined in an enclosed space with sufficient oxygen to sustain ignition . Ignition sources may include a spark from a standard light switch. In confined or semi-confined enclosures, methane and carbon dioxide may accumulate and create an asphyxiation hazard through oxygen displacement. Methane gas also may cause asphyxiation of vegetation through oxygen starvation in the root zone. The methane component of LFG is about one-half as dense as natural soil air and will tend to migrate upward th rough a landfill to the surface. If the landfill surface has a low permeability cover, the gas will move to the edges of the filled area, where it will again migrate upward through more permeable soil.
California Code of Regulations (CCR) under Title 14, Chapter 3, Article 7 apply to LFG production, containment, control, and utilization at Class III sanitary landfill sites. The CCR "Minimum Standards" are enforced by the California Integrated Waste Management Board (CIWMB) and the Local Enforcement Agency (LEA). For the City of Santa Maria, the LEA is the Santa Barbara County Environmental Health Division.
LFG CONTROL
LFG subsurface migration can be controlled through the natural containment properties of surrounding soils, a low permeability liner and by an LFG recovery system. Natural containment of LFG within a landfill is dependent on the degree of permeability (ability to transmit liquids or gas) of the surrounding soil. Soils with low permeability (such as clay soils) will restrict the migration of LFG; however, the gas will tend to follow paths of least resistance such as cracks or seams of less permeable material. Gas contained by low permeability soil may escape through the landfill surface through cracks or slumps in the final landfill cover which can occur from fill subsidence. Soils with high permeability (such as sandy soils) will allow LFG to migrate away from the refuse that produced the gas and eventually into the atmosphere.
9
10
Living and reproducing in the absence of atmospheric oxygen
In the case of a landfill, "organic materials" refers to food waste, garden clippings, and other waste containing carbon-based compounds
-46-

- -~ "'-l''''''''ILU I LUI IL. = • ~ ---
Preisker ~ Park--~' __ ~~
N
I NO SCALE
1 1- -
1 ~ , . I I ,
- 47 -
II \\IIII I ,!" ,I; ;
Figure 18
Santa Maria Landfill
I 'r--
Potential LFG Areas

A low permeability liner acts similar to low permeability soil. Before refuse is placed in an area of the landfill, the liner is placed along the bottc ~ of the fill area. An LFG recovery system is required with the use of a low permeabiJ: liner since the landfill gas that is trapped by the liner has no place to go.
LFG recovery systems are designed to withdraw gases which accumulate within a landfill through a series of pipes drilled or placed within the filled areas. While an LFG recovery system can provide an effective control measure, all LFG generated within a landfill cannot be feasibly recovered. Typical ranges of LFG recovery is from 50 to 80 percent of the total LFG volume produced. The intercepted LFG can be used onsite for electricity generation, treated and sold, or flared.
The gas extracted from a landfill is normally saturated with moisture. During collection, the LFG undergoes a temperature decline as it moves through pipes near the ground surface. As the gas cools, the moisture condenses and accumulates in the bottom of collection header lines or in specially designed traps. This accumulated moisture is known as LFG condensate. Hundreds of gallons of condensate can be generated daily in the collection and processing of LFG. The quantity of condensate generated at a landfill site is a function of gas temperature, flow rates, and recovery system design and operation parameters. LFG condensate typically consists of water and trace organic compounds such as hydrocarbons and other pollutants. Therefore, condensate has the potential to be a hazardous material.
SANTA MARlA SANITARY LANDFILL SITE CONDmONS
The Santa Maria Sanitary Landfill consists of an active and inactive area (Figure 18). The inactive area has a low LFG generation potential since a low volume of refuse was deposited here. The refuse was also burned, and the burned refuse is very old. The highest potential for LFG migration occurs at the active portion of the landfill.
The Santa Maria Sanitary Landfill currently relies on natural soil containment of LFG. As part of an Air Solid Waste Assessment Test (SWAT, Anthrosphere, Inc., 1988) conducted for the landfill, elevated levels of methane ranging from 9.1 to 40.7 percent parts per million by volume (ppbv) were detected in four out of 20 perimeter soil gas monitoring probes. Two of the probes were located adjacent to the Santa Maria River levee, where the gas poses no significant threat to health and safety. The other two probes were located near the southeastern boundary of the active portion of the landfill, near some existing farm structures.
A subsequent landfill gas study conducted in 1992 detected methane in 11 of the 33 sample locations on the active portion of the landfill. Methane concentrations at these sites ranged from 29 to 62 percent ppbv. Most of the higher methane concentrations were located in the current disposal area of the landfill. Gas concentrations drop considerably as the sample locations move away from the disposal area towards the eastern portion of the landfill boundary. The highest concentration on the landfill property was recorded near the southwestern boundary, which indicates that LFG migration may have occurred offsite. The city has assumed for investigatory purposes that landfill gas has migrated across the facility boundary. The level and extent of this migration is being studied. The city is taking
-48-

appropriate steps to protect the public health and safety and to comply with regulations governing landfills.
LFG SAFETY HAZARDS
Potential safety impacts from LFG generation and migration at any landfill, including Santa Maria's, include:
• Explosive hazards to onsite and offsite structures • Toxic gas emissions • Ground water contamination • Damage to vegetation
Continued and expanded waste disposal operations at the Santa Maria Sanitary Landfill will increase the amount of refuse placed in the landfill and the subsequent volume of LFG that is produced. While waste disposal operations are occurring at the landfill and prior to the installation of low-permeability final cover material, it is unlikely that the potential for lateral migration of LFG from the existing landfill area would be increased from existing conditions, as most of the gas would likely vent through the relatively porous waste and daily cover material. Some subsurfacfo migration of LFG from the future expansion area may have the potential to occur; however, the volume of gas that may migrate laterally would be reduced by the proposed low permeability liner that would be installed in the proposed expansion area. Any gas that does manage to migrate from the existing landfill or future expansion areas has the potential to concentrate in structures on or near the landfill. If either onsite or offsite structures overlie the path of methane gas migration, a potential for methane accumulations beneath or within such structures may result in explosive concentration levels (between 5 and 15 percent by volume). Such concentrations in combination with ignition sources (electrical outlets, space heaters) could result in a significant safety hazard.
Structures located on the landfill property that would have the potential to trap methane gas and result in a health or explosion hazard include the scale house, the equipment operators trailer, the household hazardous waste collection facility, and any structures that may be built in conjunction with a future transfer station, material recovery facility (MRF) or compost facility. Human occupancy of the scale house, trailer, transfer station or MRF in conjunction with possible ignition sources make these structures susceptible to significant methane impacts. The nearest offsite structure is a building located approximately 200 feet to the west of the active portion of the landfill. The nearest residences are located within a mobile home park and the Sierra Vista Estates project located approximately 500 feet to the southwest of the inactive portion of the landfill. The proximity of these structures to the inactive portion of the landfill could result in potential gas migration impacts. However, the gas migration potential in this area of the inactive landfill is considered extremely low for the reasons noted previously.
Installation and operation of a methane recovery system may result in the production of condensate. If these fluids are nonhazardous, meet the requirements of Chapter 15 [Section 2511(e)] and are approved by the Regional Water Quality Control Board (RWQCB) and Local Enforcement Agency (LEA), they may be reapplied to the portion of the landfill provided with a leachate collection system. If the condensate is determined
-49-
to contain hazardous constituents, the management of this fluid by the reapplication to the landfill could result in significant air quality, health and water resource impacts.
After the Santa Maria Sanitary Landfill is closed, LFG would continue to be generated throughout most of the postclosure maintenance period, with production diminishing toward the end of the period. LFG migration into the atmosphere would be restricted by the landfill cover and the low permeability liner along the base and sidewalls of the future expansion area. The principal movement of LFG would, therefore, be through the sidewalls of the inactive and existing disposal areas that would not be lined, and along paths of least resistance such as settlement cracks and/or more permeable exposures of the site geology. Any gas accumulations in or beneath structures on or near the landfill could result in a significant safety risk. Potential safety impacts to any structures such as a transfer stationIMRF that may be located at the landfill after closure can be reduced to a less than significant level by providing adequate ventilation to prevent dangerous accumulation of LFG and the installation of an LFG collection system.
-50-

SAFE DRINKING WATER LEVELS
In 1974, the Federal Safe Drinking Water Act (Act) was passed to establish standards for public drinking water. In 1986, the Act was amended to further safeguard the sources and treatment of water. The Environmental Protection Agency (EPA) and the State Department of Health Services (SDHS) set quality standards which require water suppliers to monitor and treat public drinking water for potentially harmful contaminants.
Drinking water standards in California are placed in two categories: primary and secondary. Safe levels are established for each contaminant in each category. Primary standards specifically relate to your health and are generally based on health effects which may occur if a person were to drink two liters of water each day for 70 years.
Secondary standards relate to aesthetic qualities of water, including taste, odor, and color.
These standards, which are referred to as Maximum Contaminant Levels (MCLs), are continually reviewed and revised when appropriate.
PLANNING AREA WATER SOURCES
Drinking water is provided to the Planning Area by the City of Santa Maria and the California-Cities Water Company. The City of Santa Maria serves the majority of users within the City Limits along with areas outside the City Limits subject to City Council approval through an Outside Users Utility Agreement. The California-Cities Water Company primarily serves the Orcutt area and some southern portions within the City Limits. The source of drinking water is groundwater beneath the Planning Area. Both water purveyors have numerous wells drilled into the groundwater basin. Please refer to the Resources Management Element for a complete description of water supply and groundwater resources.
The treatment of groundwater is currently minimal. Both the City and California-Cities Water Company only disinfect the water. The drinking water supply of both water purveyors does not violate any water quality standard set by the State of California or the EPA. Table 6 presents the latest water quality report regarding the City's drinking water, and Table 7 presents the water quality report for the California-Cities Water Company.
If overdrafting of the groundwater basin continues, additional treatment of City water may be needed because of increased total dissolved solid (IDS) levels in the groundwater. Additional treatment will also be needed when the State Water Project water becomes available. The additional treatment will occur at a water treatment plant to be built in San Luis Obispo County.
-51-

PAIMARY ST ANOAAOS MandalOfY Heallh-RGla11ld Sbnda'ds ESbbllshGd by 1110 51.:1111 o r Calilornla OopanmenJ 01 H o.1l1h SIiMeIlI
MAXIMUM GAOUND WATER PAI\AIoIETER UNITS CONTAMINANT RANGE LEVEL
CLA.RITY TUibidily NTU , .. .10- .20
MICROBIOLOGICAL COhltllrn Bar;lDtia MPN % TaSIS posW ... " I~'~ <; 0.0".
PA % Satl1j.Jt1lS po5<h"" <; S.O 0 No. 0/ ACulll Violiltloos 0 0
ORGANIC CHEMICALS TOlal TI'IhaIomIIINI.nIII - 0.10 NI)...02 , ..... - 0.0002 NR ......... - 0.'" NR Molho.~chIof ml>" 0. ' NR TOIU:Iphen, ml>" 0.00$ NR 2 .• ·0 - 0. ' . ~:
f-!,.,$:!P SiIv ..... ---"""'-_. 0.D1
Air .... ""' --.------- - ."" "" NO
5b"tazon - 0.016 NR fIIInl ll .... """ 0.00 1 NO C81bon TllIIaChIoridIl ..., 0.0005 NO 1.2·O,O'OfTlOo3<hIOIop'opanII - 0.0002 NR 1 •• ·DichIOIotIanl_ - 0.00$ NO 1.2·DichIorDilLhana - 0.0005 NO 1. 1·Dk:!oIoIoulhyko!lll ."" 0.000 NO 1 .3·DICI~OIoprOPllrlO m", 0.000$ NO EUlylDenlll1lQ m",- O.li80 NO Elhyl_ Oibromod& m'" 0.00002 NO Molina,. m",- 0." NR MonoclllolobelUu .... "''''
0.'" NO """",,w - 0.01 NO 1.1.2.2-lIIlla.chlol'Dllth:\IIfI - 0.001 NO TllllilChlofOlithyl_ - 0.005 NO Tl"ooc08ncarD """ 0.01 NR 1.1, I·Tlk:hIOIDIIlh3nll - 0.2 NO l . l .2·Tfi(:hlo,oell\arlO m",- 0.032 NO TrichIofolithylullQ m"". 0.005 NO Vinyl Cnlolldll - 0.0005 NO Xylllf\8S - 1.150 NO C,s· ' .2·OochIoroellly\f!N - 0.006' NO T '1U\5· 1.2·Oicniofoelllylo .... - 0.0 1' NO I . 1·00cni00oull\ant ""'" '005· NO 1.2·DIchIoropropanu - 0.005' NO Tf lc."lo'olIUOlom~1/lafIe !F'eon 11 ) """ 0.15' NO 1.1,2·Trichlolo-l.2,2·T,irluoloeLtlanll (Floon 11 3) - 1.2' NO Carbo/Ulan - 0.0 18' NO Glypno:&.alil - 0.7' NO
"""' .... ml>" 0.0000 1' NO HeplaChlor _. _- m"". -- - -
0.00001 ' - NO HIIplaChlof IIpOU:III - 0.0000 1'-" NO 0i(2-i1 l/'1y1lellyl}ptl1hala1ll - 0.004' NO
INORGANIC CHEMICALS AI....".num - 0.01 0.005 N$lInic - 0.05 0.005 Ballum - '- 0.,·0.2
Cadr'"l.OIn - 0.0 1 0.001 Cnron.um - 0.05 0.005 F~~ """- 1 .• ·2 .4" 0.4· 1.0 l~:.tl - O.~~ .. • 0 .005 Mu,cury ",., 0.002 0.0002 Nillate ( liS N03) m'" <S. 3.5-22. 1 S.""",", m",- 0.01 0.005 Silwill - 0.05 0.00$
RADIDACTIVITY G,oss Alpha Ac:~ vily P""- " 5.5·5.\1 Cross So... AC~Ylly """- 50 NR Tritium P""- ".000 NR SlrONoum-90 P""- O NR RadIum 226 4. 228 combINKl P""- " NA
SECONDARY STANDARDS Aesthotic Stand:Vdr> E~tabljshed by lila S lale 01 Ca)ilornia Departmen1 01 Hullh SeIVicli$
C,b QUor. TtvO $hOld CloIorltlb CVj.o~'" f Q.J,r,.u!I Ag"nlS (MIJA$)
Mangtlll(l$e Sult:..L. Z'" TU1,~ o.%oI~u<J SoIKlS
ADDITIONAL CONSTITUENTS ANAL nED
pH HaulflOSS (CaCOl) SodIum Calcium Powsslum l.Ia\lllosium
""" 1..10." ."J"-rr"Jo'l n .~'l
n..;L
"""--m"t m,,,-
""" (mgfL.) I_I (n¢) (m~) (m,.tL)
Io'I,I ."-cT_' ...... fdIooo_ .... "V .... _ or _ ............ __ .. lI ....... · ___ LOIc-.. .. _1
"" ." ... --"""' ·....,_ ... _IPM·,..._I "'.\ ."""'c..-.. ... _ ·"-... __ ~l_· .... ___ od
.. f_ ... ~_ .... ""_ .... .
... i ......... ... l_ .. ~C._ .... "' .. " .. _ ..... F ....... _ • • o_ ... ........ ""' ..... _ ... , ... _ . .. _, .... . .. ___ ....... lJ_ .. _-....." ............ _c......
" ",. 10'"
" '" 0.05 500
5.0
"''''
NS NS NS NS NS NS
O""_al'_s.. • .,.....-.:IIIS [ .. " ...... ......... _00 "" ....... _ • ..., .. ____ .. __ _ 100 · ..... _ ..... _,_ ... I<$ · .... _d
- <;7 -
5 0
15.8 ·41 .1 " O .O~ .. 0 02 ""'. 1 <;0.03
216.3·4.3.0 <; 0.05
5~~ . 0·!I:J.4 .0
7.HI.O 376·638 .$.5·70.8 61 .3· 14~ .2
2.3·3.0 38.4·7 1.5

Table 7 CALIFORNIA cmes WATER
1993 Water Quality Information District: Santa Maria System: Orcut1 ALL WATER ANALYSES ARE PERFORMED BY STATE CERTIFIED LABS
MAXIMUM SURFACE WATER GROUNDWATER
PARAMETER UNITS CONTAMINANT RESULTS RESULTS LEVEL U)w_ AVEAAGE LOW .... H AVERAGE
Pri mary Stllndards - Mandatory health related standards
CLARITY Turbidity ftr&ated surfaces) NTU 0.5 NA NA NA NA Turbidity system) NTU 5.0 NA NA <0.10 -1.25 0.16
MICROBIOLOGICAL TotaICoIilonn ......
<40 Samples per month po,~"" 2 NA NA NA NA ,,40 Samples per month ."' po ....... 5% NA NA 0'%-0% 0%
No. Acute Violatiooslol 0 0 0
ORGANIC CHEMICALS T ota! T rihalomethanes 0. 10 NA NA NO NO Endrin ppm 0.0002 NA NA NO NO Urdane ppm 0.004 NA NA NO NO Melhoxyct¥or ppm 0.1 NA NA NO NO Toxaph6nO ppm 0.005 NA NA NO NO 2.4-0 ppm 0.1 NA NA NO NO 2.4,5-TP Silvex ppm 0.01 NA NA NO NO Alrazina ppm 0.003 NA NA NO NO
""""on ppm 0.0 18 NA NA NO NO Benzene ppm 0.01}\ NA NA NO NO Cerbon T etrac:hloride ppm 0.0005 NA NA NO NO 1.2-0ibtomo-3-ctvoropropane ppm 0.0002 NA NA NO NO 1.4-DichIotab6r\l.8l"I6 ppm 0.005 NA NA NO NO 1.2-DichlofoeUlane ppm 0.0005 NA NA NO NO 1,1 -1Act\k)roe1hykHl8 ppm 0.006 NA NA NO NO 1.3-DictlIoropropene ppm 0.0005 NA NA NO NO E1hylb8nZene ppm 0.600 NA NA NO NO
:::=Oibromide ppm 0.00(1)2 NA NA NO NO ppm 0.02 NA NA NO NO
MonochlOroOenZene ppm 0.030 NA NA NO NO
""""''''' ppm 0.01 NA NA NO NO 1.1,2,2-Tetrachloroetnane ppm 0.001 NA NA NO NO Tettad'lloroethy\8n8 ppm 0.005 NA NA NO NO Thiobencafb ppm 0.07 NA NA NO NO 1.1,1· T rictIIoroelhane ppm 0.200 NA NA NO NO l.l.2-Tric:t1Ioroelhane ppm 0.032 NA NA NO NO TricIlIofethy1e09 ppm 0.005 NA NA NO NO Vinyl Chlonde ""'" 0.0005 NA NA NO NO X)I1en8s ""'" 1.750 NA NA NO NO Cls-l ,2-Dichloroethylene ppm 0.006 NA NA NO NO T rans-l .2-DichIoroethyiene ppm 0.01 NA NA NO NO l , l -DictlIoroethane ppm 0.005 NA NA NO NO 1.2-Dict\Ioroelhana ppm 0.005 NA NA NO NO T rict¥orotluoromethane ""'" 0.15 NA NA NO NO (Freon 11)
1,1.2-TrichIoro-l,2,2- ppm 1.2 NA NA NO NO Trilluorethane (Freon 113)
"""""""" ppm 0.018 NA NA NO NO Glyphosale ppm 0.7 NA NA NO NO CI>1o<-' ppm 0.0001 NA NA NO NO
He.""""" ppm 0.00001 NA NA NO NO Heptachlor expoxide ppm 0.00001 NA NA NO NO 0i(2~thy\ll8xyl)phthalat8 ppm 0.004 NA NA NO NO
INORGANIC CHEMICAlS AI .......... - 1. NA NA <0.10 - <0.10 <0.10
Alsenic ppm 0.05 NA NA <0.01- <0.01 <0.01
Barium ppm 1. NA NA <0.10-<0.10 <0.10 caoo;un ppm 0.0 10 NA NA <0.001 - <0.001 <0.00 1
0V0mk.m ppm 0.05 NA NA <0.01 - <0.01 <0.01
Fluoride ppm 1.4-2.4"'1 NA NA 0.2-0.3 02
L,"" ppm 0.05 NA NA <0.005 - <0.005 <0.005 Mercury ppm 0.002 NA NA <0.001 - <0.001 <0.001 Nlltale (as N03) ppm '5. NA NA 3.1-41.5 11 .9
Seleniu-n ppm 0.01 NA NA <0.005 - <0.005 <0.005 Silver ppm 0.05 NA NA <0.01- <0.01 <0.01
RADIOACTIVITY Gross Alpha Activity pCi/l 15 NA NA 1.1 - 4.4 1 .• Gross Beta Activity pCiI\. 50 NA NA NA NA Triti...., pCi/l 20,000 NA NA NA NA Strontium-90 pCi/l • NA NA NA NA Radium 226 & 228 combined pCi/l 5 NA NA NA NA Uranium pCi/l 20 NA NA 2·3 2.5
Secondary Stllnd.rds Aesthetic stllndarda .stabllshed by the Stilt. of California D.O.H.S_
Colo< u,;~ 15 NA NA <3-<3 <3 Odor-Threshold Units 3 NA NA 1 ·2 1.5 Chloride ppm 500 NA NA 26.6-68.5 42.' eoppe, - 1.0 NA NA <0.05 - <0.05 <O.OS Foamng Agents(MBAS) ppm 0.5 NA NA <0.02 - <0.02 <0.02 ',on ppm 0.3 NA NA <0.1-<0.1 <0.1 _ .. - 0.05 NA NA <0.03 - <0.03 <0.03 sutale - 500 NA NA 147.8 - 288.0 224.9
"'" ppm 5.0 NA NA <0.05 - <0.05 <i).OS Total DissoNad Solids ppm 1000 NA NA 532.8-631.6 555.0
AddilioNlI Constituents
~rdn9SS (CaC03) Units NoSlaManl NA NA 7.7-7.9 7B ppm No Standard NA NA 2492-460.0 372.4
Sodium ppm NoStandard NA NA 41 .4- 119.8 53..7 Coldum ppm No Standard NA NA 72.1 -110.4 .... P ..... "'" ppm No Standard NA NA 1.8-4.1 2.3 Magn8sUn ppm No Standard NA NA 14.9·49.6 39.3
al Violation 01 TlI\a 22 C ., 15 SactIon64-426.1 b 3or4 . F ,hap!. ( )( ) (b) Iuortde SIBOOarG depencls on lan.perature.
PURCHAseD RESULTS - AVIERAGE
NA NA NA NA
NA NA
NA NA
NA NA NA NA NA NA NA NA NA NA NA NA NA NA NA NA NA NA NA NA NA NA NA NA NA NA
.NA NA NA NA NA NA NA NA NA NA NA NA NA NA NA NA NA NA NA NA NA NA NA NA NA NA NA NA NA NA NA NA NA NA NA NA NA NA NA NA NA NA
NA NA
NA NA NA NA NA NA NA NA NA NA NA NA
NA NA NA NA NA NA NA NA NA NA NA NA NA NA NA NA NA NA NA NA NA NA
NA NA NA NA NA NA NA NA NA NA NA NA
NA NA NA NA NA NA NA NA NA NA NA NA NA NA NA NA NA NA NA NA
NA NA NA NA NA NA NA NA NA NA NA . NA
In additiOn 10 the above constituents, wa have conducted monitoring 10149 additional orpanic chemicals lor which !he Calilornla Department 01 HeaJltI SetvlClil5 and USEPA have not yet sele 5tandard. All results were below delectlon lellels.
-53-

AIRCRAFr SAFETY
The Santa Maria Public Airport is located within the southern portion of the City of Santa Maria (Figure 19). The airport provides facilities for commuter airlines which selVe Santa Maria with propeller driven aircraft. Four fixed base operators exist that offer flight instruction, aircraft rental and repair, and refueling services. The airport is selVed by an Federal Aviation Administration (FAA) control tower. In 1990, 178 general aviation aircraft were based at the airport.
The airport has two runways (Figure 19): Runway 12-30 (primary runway); and Runway 2-20 (secondary runway). Runway 12-30 is used by air carrier aircraft and heavy general aviation aircraft. The precision instrument approach is to Runway 12, from the northwest. Runway 2-20 is primarily used by general aviation aircraft and during cross wind conditions.
SAFETY CONSIDERATIONS
The California Public Utilities Code specifies that Airport Land Use Commissions (ALUC) shall determine planning boundaries around each public and military airport within their jurisdiction. The encompassed area is referred to as the Airport Area of Influence. Santa Barbara County has an ALUC with Santa Barbara County Association of Governments serving as its staff.
The Airport Area of Influence is divided into three areas of major concern: height restrictions, safety, and noise. These concerns are grouped into three hazard zones around an airport. Hazard Zone I deals with height restrictions and is also the boundary of the Airport Area of Influence. Hazard Zone II contains policies regarding safety as well as height. Policies regarding height, safety, and noise apply in Hazard Zone III. These zones are defined in the following text, and are shown on Figure 20.
Hazard Zone I - Airoort Height Restriction Area
This zone defines the airspace requirement of an airport. Height limitation of structures within this zone is defined by an imaginary conical surface and horizontal plane extending out from the end of the runway. The outer margin of the horizontal surface 150 feet above the established airport elevation defines the boundary of this zone. Figure 20 depicts the limit of Zone I at the Santa Maria Public Airport.
Hazard Zone II - Airoort Safety Area
Safety restrictions, as well as height restrictions, apply in Hazard Zone II. The boundary of this zone is shown in Figure 20. Hazard Zone II is divided into three safety areas which are based on degree of hazard. These safety areas are shown on Figure 19.
Safety Area 1 (Clear Zone)
This is the most restrictive area as it is subject to the greatest danger. The Federal Aviation Administration (FAA) has set obstruction clearance standards for the protection of air navigation to ensure that neither the operating capability of the airport nor the usable runway length is adversely affected by obstructions in the surrounding airspace. Tall
-54-


structures within arrival or departure path areas could represent a collision hazard or result in distraction of the pilot's attention at take-off or landing. These standards are specified in Part 77 of the Federal Aviation Regulations.
Clear zones are fan-shaped areas just beyond each runway end that are to be kept clear of any nonessential objects. They provide an additional margin of safety for aircraft landing on or departing from the runway.
In order to comply with Safety Area 1 (clear zone) requirements and minimize conflicting land uses near the airport runways, the City has a Clear Zone zoning designation that is located at the ends of both airport runways (Figure 19). The intent of the Clear Zone designation is to ensure adequate property interest in favor of the airport near the ends of the runways. Permitted uses in this area are aeronautical facilities and related uses such as navigation aids and weather instruments. No use is allowed which would attract birds or preclude the use of the area as an emergency landing area.
Safety Area 2 (Airport Approach)
This area is an extension of the clear zone in which uses that do not result in the concentration of people or a particular fire hazard are generally allowed. Height restrictions in Safety Area 2 are more restrictive than in Safety Area 3.
In order to comply with Safety Area 2 requirements, the City has developed the Airport Approach overlay designation (Figure 19). This overlay establishes regulations to minimize the hazard to safe landing and take-off of aircraft by limiting the height of buildings and uses within these areas. Allowed land uses within this zone are descnbed in the Land Use Element of the General Plan. These uses include airport services, light industrial, heavy commercial manufacturing, and lower density residential.
Safety Area 3 (General)
This area encompasses the remainder of Hazard Zone II and is the least restrictive. This is the area in which airport traffic patterns occur (Figures 19 and 20). Portions of this area are frequently overflown and other areas are infrequently overflown.
Table 8 presents land use guidelines for the three Safety Areas of Hazard Zone II.
Hazard Zone III - Airport Noise Area
Within this zone, land uses will be influenced by aircraft noise as well as height restrictions and safety. The boundary of this zone is determined by using the California Airport Noise Standard which sets forth the boundary as the 65 dB Community Noise Equivalent Level (CNEL) contour. Figure 20 depicts the boundary of Hazard Area III.
-57-

IE
TABLE 8 LAND USE GUIDELINES FOR SAFETY COMPATIBILITY
(FROM AIRPORT LAND USE PLAN, OCTOBER 1993) ,
>~ B it.; ii ····· ··· ~.ii <;[ 1)0···· . 1 , ·~. l ' ·· ...•• · •.
Single Family No Yes' Yes
Multi-Family/Mobile Home No No' Yes'
Hotel/Motel No No' Yes'
Chemical/Petroleum Plant No No Yes~
Misc. No Yes' Yes'
Warehouse/non-nammables No' Y .. ' Yes
.~, No' Yes Yes
Auto Parking Lots No' Yes Yesc
Utilities Yese Yes Yes
Wholesale Trade!Building No' Yes· Yesc
General Retail No No' Yes'
Automotive No Yes· Yes'
Restaurants No No' Yes'
Public/Quasi-Public Uses No No Yes'
No No Yes·
Gol! r, Stables No Yesc,1 Yes..,1
(except Yes Yes Yes
Livestock J:'~ ,,;, No Yes Yes
Open SpacelWater Areas Yes Yes Yes
Single family residential is a compatible land use within Safety Area 2 only if the population density is less than two residences per acre within one mile of the runway end. Use not compatible in Safety Area 2 within one mile of the runway end. Use subject to ALUe review if more than one mile Crom the runway end. Uses subject to ALue review if they result in large concentrations of people underneath aircraft traffic patterns. Threshold for review of ~Iarge concentrations~ is on the order of25 people per acre for non-residential uses or more than four dwelling units per acre for residential uses. Intensive development in Safety Area 1 is prohibited. All specific development proposals must be reviewed by the ALUC to assure that temporary or permanent concentrations of people greater than 25 people per acre are avoided. that storage of hazardous materials will not ocrur. and that public safety agencies will be able to effectively provide emergency services to the site. No above ground transmission lines and no on or above ground gas or oil pipelines. Equestrian activity. including riding trails, is not compatible with areas overflown by low flying aircraft.
-58-
[
I I
Generally, residential uses, schools, hospitals, institutional uses and other uses that support a large concentration of people are prohibited in this zone.
ACCIDENT POTENTIALII
Approximately 50 percent of civilian aircraft accidents occur within airport boundaries. Approximately 15 percent occur outside airport boundaries but within one mile of airports. Of these near airport accidents, approximately 60 percent are concentrated within narrow strips of land at both ends of the runway.
Santa Barbara County has experienced no crashes involving public or scheduled air carriers in recent years. From 1960-1985, six forced landings have occurred at the Santa Maria Public Airport, all on airport property12 (Figure 20). Information from the National Transportation Safety Board indicates that since 1985, only one nonfatal incident occurred on airport property (the exact location is not known)Y
The runway clear zones (Safety Area 1) are all within airport property and have ideal freedom from obstruction. The airport approach overlay areas (Safety Area 2) are also considered as safe. Operational flexibility, however, has been compromised by urban encroachment to the north, east, and south of the airport. Runway 12 is rarely used for takeoffs due to the need of departing aircraft to climb out over urbanized areas. Commercial carriers do not land in the opposite direction on the same runway to avoid final approaches over the same urbanized area. Thus, safety has been achieved through operational limits which do not allow the best use of airport facilities.
Any aircraft incident could potentially be disastrous, resulting in injury or deaths. As noted previously, the potential for an aircraft incident is higher during the approach or departure portion of a flight than while an aircraft is at cruising altitude. This is due to aircraft being closer to the ground and to potential obstructions, heavier concentration of other aircraft in the vicinity of airports, and additional pilot workload at these times.
Although it is impossible to predict precisely how many and where future incidents will occur, it can be assumed that approximately 65 percent of all aircraft accidents will occur within 1 mile of the airport as noted earlier. Of these accidents, a vast majority will occur on or within 200 feet of the runway or taxiway, along the primary approach and departure flight tracks, or beneath a traffic pattern. Nonetheless, the risk of incident at any particular location cannot be predicted with complete certainty.
11
12
13
Information from the santa Barbara County Airport Master Plan, October 1993
Draft EIR for the Santa Maria Research Park, Michael Brandman Associates, April 1990
Ibid
-59-

HAZARDOUS MATERIALS
Hazardous materials are found throughout the Planning Area. Used for various purposes, these materials can become dangerous if spilled, inappropriately used or disposed, or otherwise exposed to the public or the environment improperly. Federal, state, and local laws require the proper use, transportation, treatment, and disposal of hazardous materials.
Hazardous materials are defined as follows:
Hazardous materials are those chemicals or substances which are physical hazards or health hazards as defined and classified in Article 80 of the Uniform Fire Code, whether in usable or waste condition; or as regulated by the Cal-OSHA director's list (Title 8 of the California Administrative Code (CAC), Sections 339, 5208-52-15, and 5219); Title 22 of the CAC, Section 66680 and 66685; the list of Environmental Protection Agency pollutants as listed in the 40 Code of Federal Regulations Section 401.15, as amended; or Class I, II, and ilIA liquids.
The following is a partial list of physical and health hazard categories as defined in Article 80 of the Uniform Fire Code:
Physical Hazards
1) Explosives and blasting agents (regulated in Article 77 of the Uniform Fire Code).
2) Compressed gases. 3) Flammable and combustible liquids (regulated in Article 79 of the Uniform
Fire Code). 4) Flammable solids. 5) Organic peroxides. 6) Oxidizers. 7) Pyrophoric materials. 8) Unstable (reactive) materials. 9) Water-reactive solids and liquids. 10) Cryogenic fluids.
Health Hazards
1) Highly toxic or toxic materials, including compressed gases. 2) Radioactive materials. 3) Corrosives. 4) Carcinogens, irritants, sensitizers.
The use and storage of hazardous materials is primarily regulated by the Uniform Fire Code. Transport of hazardous materials and waste on public streets is primarily regulated by the California Vehicle Code. Storage and disposal of hazardous wastes is primarily regulated by the Santa Barbara County Environmental Health Services Division through their Hazardous Waste Generator Program as authorized by the State Health and Safety Code.
-60-
I I
This Chapter identifies types of hazardous materials in the Planning Area, transportation routes, and the City's responsibilities. Please refer to the Resources Management Element for additional information regarding hazardous materials and wastes.
HAZARDOUS MATERIAL GENERATORS AND USERS
Use and Storage
Hazardous materials are used by numerous businesses in the Planning Area. Typical businesses include, but are not limited to, hospitals, auto repair facilities, exterminators, medical labs, photographic studies, and gas stations. On a smaller scale, single family residences also use and store hazardous materials (pesticides, fertilizers, drain cleaners, etc.).
Any business that stores hazardous materials in accordance with Article 80 of the Uniform Fire Code must provide hazardous materials inventory statements (HMIS) and hazardous materials management plans (HMMP) to the Fire Chief of the City of Santa Maria and the County of Santa Barbara. In addition, the of Santa Barbara County Environmental Health Services Division (EHS) and the Santa Maria Fire Department require a Business Plan in accordance with State Regulations for businesses that store and use hazardous waste.
Hazardous Materials Inventory Statements (HMIS)
A separate HMIS is required for each building, including appurtenant structures, and each exterior facility in which hazardous materials area stored.
The HMIS shall list by hazard class all hazardous materials stored, and shall include several items regarding the material including the hazard class, the common or trade name, the chemical name, major constituents and concentrations if a mixture, the waste category if a waste, the waste category, the maximum quantity stored at anyone time, the number of days the material was present on site during the past year, and the storage conditions related to the storage type, temperature, and pressure.
An amended HMIS is required within 30 days of the storage of any hazardous materials which changes or adds a hazard class or which is sufficient in quantity to cause an increase in the quantity which exceeds 5 percent for any hazard class.
Hazardous Materials Management Plans (HMMP)
Applications for a permit to store hazardous materials shall include an HMMP form (either standard or short) in accordance with Appendix II-E of the Uniform Fire Code and shall provide a narrative description of the operations and processes taking place at the facility.
Standard Form. The HMMP Standard Form includes the following information: general business data, a site plan, a floor plan, hazardous materials handling procedures, signage, monitoring program, employee training program, emergency response procedures, and record keeping procedures. A complete description of the standard form can be found in Appendix D.
-61-
Short Form. For a facility that qualifies as a minimal storage site, a short form HMMP may be filed. The short from includes general facility information, a simple site plan, a description of the material used on site, and the type of security precautions used. A description of what constitutes a minimal storage site can be found in Appendix D.
Business Plan
Businesses that use and store hazardous materials are also required to submit a business Plan. The Business Plan lists an inventory of the hazardous materials and wastes stored on site and the location where these materials are stored and handled. Businesses must also provide the names of people to contact if hazardous materials incidents occur at the business. Within the City Limits, the Business Plan is submitted to the City of Santa Maria Fire Department. Businesses within the Planning Area, but outside the City Limits, submit their business plans to the County of Santa Barbara or to the EHS.
Detailed procedures on Business Plans can be found in the Instructional Packet on Hazardous Materials Disclosure Business Plans prepared by the EHS (June 1995).
Contaminated Sites
Contaminated sites are those which have known soil, air, or water contamination due to chemical spills, leaking underground storage tanks, leaking pipes and drums, and abandoned disposal sites. The most common threat is to groundwater aquifers and from toxic emissions.
Santa Barbara County's Site Mitigation Program administered by the EHD is responsible for the supervision of cleanup at contaminated sites throughout the County, including sites within the City Limits. The objective of the program is to identify contaminated sites, and to find a permanent remedy that is technologically feasible and reliable, that effectively reduces the danger of contamination, and that adequately protects public health, welfare, and the environment. A large percentage of the contaminated sites within the County are discovered by hazardous materials specialists while overseeing the abandonment of underground storage tanks. Site mitigation activities are initiated as a result of complaints, inspections, tank tightness tests, and emergency responses.
The Planning Area has approximately 27 active underground tank cleanup sites and 29 active site mitigation cleanup sites according to the EHS's "Listing of Underground Tank Cleanup Sites" and Listing of Site Mitigation Cleanup Sites," both reports as of August 9, 1995.
Cleanup Procedures
Once a potential site of contamination has been discovered, an evaluation to determine the extent of contamination at the site is conducted and information sufficient to identify the most appropriate response are developed. A typical evaluation consists of six phases: Initial Investigation; Site Assessment and Characterization; Remedial Action; Evaluation; Public Notification; and Remediation.
-62-

Initial Investigation. The majority of discovered sites are as a result of routine inspections during underground tank removal. Other ways that sites are discovered are regular underground storage tanks inspections, hazardous waste generator inspections, complaints from the public, and emergency spill responses.
Site Assessment and Characterization. If the initial investigation reveals potential or actual contamination of a site, a site assessment is performed by the EHD. Data is collected to evaluate the source and nature of the hazardous substance and to determine if the responsible party can be identified. The extent of contamination is also determined. The data gathered is used to set priorities for the cleanup of the site.
Remedial Action . The data collected is analyzed and a remediation plan and alternatives for the cleanup are prepared. The scope of the report varies on which of the three types of remedial action is involved (initial remedia~ source control, or off-site). Typically, remedial investigations involve a sequence of activities such as visiting the site, defining the boundary conditions, preparing a site map, study of the waste, hydrogeologic conditions, groundwater, air quality, and preliminary identification of appropriate remedial technology.
The remedial investigation activities are taken into account for the preparation of a remedial action proposal. The proposal includes objectives, technologies, and methods for cleanup at the site, as well as non-cleanup alternatives.
Evaluation. An evaluation of proposed cleanup activities is performed. In selecting the remedial alternative, the balance between the need to protect public health, welfare and the environment and the availability of fund monies is considered.
Public Notification. Public notification of new contaminated sites is achieved using Proposition 65 public information procedures. A recording is made on a daily basis which provides reports for the public and media about newly discovered sites and emergency spill responses. The public may also obtain this information by contacting the EHD directly.
A Site Mitigation List is published monthly and provides information about contaminated sites, including location, nature of contamination, investigator, and status. This list is circulated to various State Agencies, the County of Santa Barbara, area cities, and the hazardous materials staff of EHD.
Remediation. Various methods exist for the cleanup of hazardous waste sites. These alternatives include: off-site treatment and disposal to an appropriate landfill, on-site treatment, and in-situ physical containment. Off-site disposal has been the most common method used. However, on-site treatment is becoming more common as technologies improve.
Disposal
The Santa Maria Sanitary Landfill currently operates a Household Hazardous Waste transfer and storage facility. This facility is open to the public two days per month. In addition to collecting household hazardous waste, the facility conducts random, solid waste load checks for hazardous materials.
-63-

The landfill does not service hazardous waste generated by commercial and industrial uses. Businesses must hire a hazardous waste transporter to dispose of their hazardous wastes. This waste is either transported to the Chemical Waste Management/Kettleman Hills facility (north), or to a transfer station in Southern California, where it is shipped out of state.
Storage and disposal procedures County-wide are discussed in detail in the Santa Barbara County Hazardous Waste Management Plan, November 1988.
TRANSPORTATION ROUTES
Hazardous materials transported into the Planning Area include such commodities as the hypergolic fuel trucked to Vandenberg Air Force Base, anhydrous ammonia, gasoline, explosives, and aviation fuel. Natural gas liquids and liquid petroleum gases (e.g. propane, butane) are also transported through the Planning Area to Bakersfield, Los Angeles, and the Bay Area.
Hazardous materials that are radioactive, poisonous, or explosive are limited to using State Highway 101 through the Planning Area". Within the City Limits, transport of any hazardous waste is prohibited on the following streets15
1) Donovan Road; 2) Stowell Road; 3) Main Street, State Highway 166; 4) Broadway, State Highway 135.
However, these streets may be used for the transport of hazardous waste subject to the following exceptions:
15
1) They provide reasonable access to fuel, repair, rest, or food facilities designed and intended to accommodate commercial vehicle parking when access is consistent with safe vehicle operation and the facility is within one-half road mile of points of entry from a state or interstate highway being used.
2) Hazardous wastes which have a point of origin within the City Limits. Partially loaded waste vehicles may drive upon these streets when the vehicles have a destination within the City Limits.
California Vehicle Code and California Code of Regulations
Chapter 13 of Title 7 of the Santa Maria Municipal Code
-64-
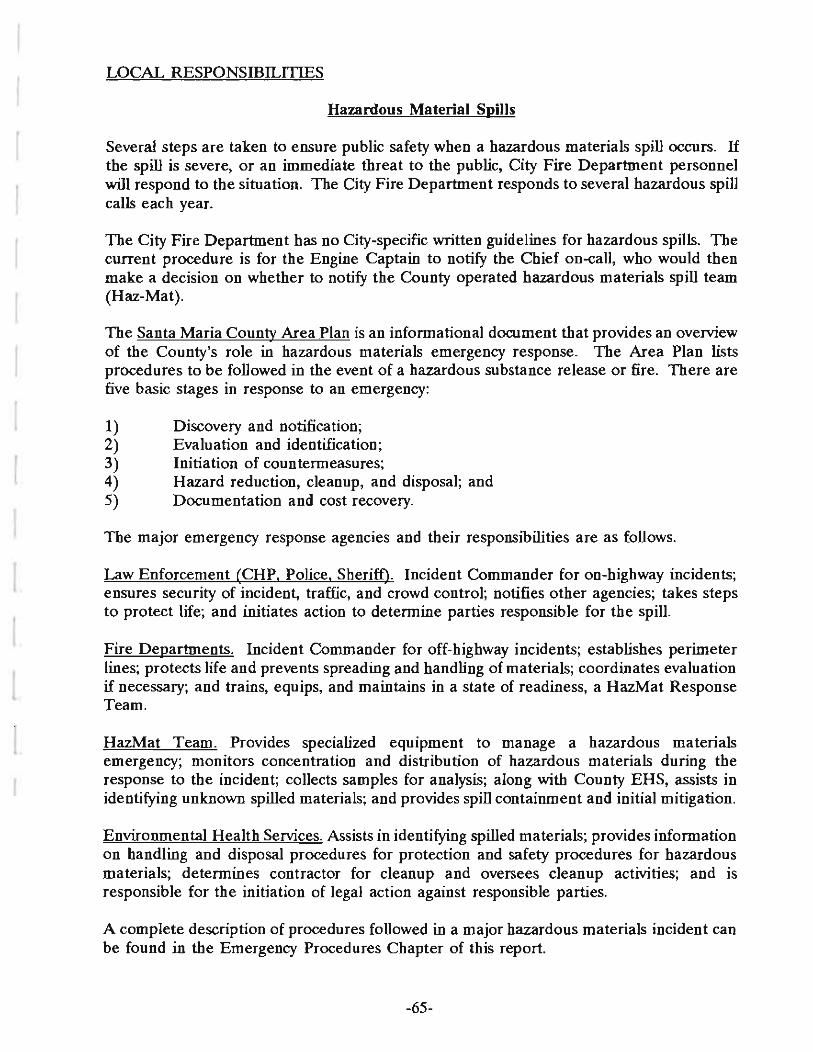
I I
LOCAL RESPONSIBILmES
Hazardous Material Spills
Several steps are taken to ensure public safety when a hazardous materials spill occurs. If the spill is severe, or an immediate threat to the public, City Fire Department personnel will respond to the situation. The City Fire Department responds to several hazardous spill calls each year.
The City Fire Department has no City-specific written guidelines for hazardous spills. The current procedure is for the Engine Captain to notify the Chief on-call, who would then make a decision on whether to notify the County operated hazardous materials spill team (Haz-Mat).
The Santa Maria County Area Plan is an informational document that provides an overview of the County's role in hazardous materials emergency response. The Area Plan lists procedures to be followed in the event of a hazardous substance release or fire. There are five basic stages in response to an emergency:
1) Discovery and notification; 2) Evaluation and identification; 3) Initiation of countermeasures; 4) Hazard reduction, cleanup, and disposal; and 5) Documentation and cost recovery.
The major emergency response agencies and their responsibilities are as follows.
Law Enforcement (CHP. Police. Sheriff). Incident Commander for on-highway incidents; ensures security of incident, traffic, and crowd control; notifies other agencies; takes steps to protect life; and initiates action to determine parties responsible for the spill.
Fire Departments. Incident Commander for off-highway incidents; establishes perimeter lines; protects life and prevents spreading and handling of materials; coordinates evaluation if necessary; and trains, equips, and maintains in a state of readiness, a HazMat Response Team.
HazMat Team. Provides specialized equipment to manage a hazardous materials emergency; monitors concentration and distribution of hazardous materials during the response to the incident; collects samples for analysis; along with County EHS, assists in identifying unknown spilled materials; and provides spill containment and initial mitigation.
Environmental Health Services. Assists in identifying spilled materials; provides information on handling and disposal procedures for protection and safety procedures for hazardous materials; determines contractor for cleanup and oversees cleanup activities; and is responsible for the initiation of legal action against responsible parties.
A complete description of procedures followed in a major hazardous materials incident can be found in the Emergency Procedures Chapter of this report.
-65-

Contaminated Sites
If contamination of a site is discovered during the City's review of a project, either during plancheck or inspection, the City wiD notify the EHD. The City then requires a clearance letter from the EHD before permits wiD be issued or a project is finaled. The EHD is the lead agency involved and the City defers to them regarding hazardous material discoveries.
-66-

L EMERGENCY SERVICES
The City of Santa Maria's role and responsibilities in an emergency are described in Chapter 17 of Title 2 of the Municipal Code (Emergency Services). Detailed procedures and tactics are provided in the Multihazard Functional Plan (Plan), as adopted by City Council Resolution No. 89-25. This manual was revised by the City in October 1993. The Plan conforms to the State's emergency preparedness plans and is an extension of those plans. The City has also adopted the California Master Mutual Aid Agreement by Resolution No. 79-4845. All of the above documents are available for review at the City Manager's Office and are summarized in the following sections.
PURPOSE
The City's emergency procedures address the City's response to extraordinary emergency situations associated with natural disasters, technological incidents, and nuclear defense operations. The procedures do not apply to normal day-to-day emergencies. Instead, the operational concepts focus on potential large-scale disasters such as earthquakes, floods, riots, etc. Such disasters pose major threats to life and property and can impact the wellbeing of large numbers of people. These general concepts are fully described in the "Basic Plan" section of the Multihazard Functional Plan.
The City's emergency procedures will be activated under any of the following conditions:
1) On the order of the City'S Director of Emergency Services, provided that the existence or threatened existence of a Local Emergency has been proclaimed in accordance with the City's Emergency Services Ordinance.
2) When the Governor has proclaimed a State of Emergency in an area that includes the City of Santa Maria.
3) By a presidential declaration of a National Emergency. 4) Automatically on receipt of an attack warning or on the observation of a nuclear
detonation.
For planning purposes, the State Office of Emergency Services (OES) has established three levels of emergency response to peacetime emergencies which are based on the severity of the situation and the availability of local resources (these levels do not directly correlate with the four classifications of nuclear power emergencies - see Specific Emergencies Section of this Chapter).
Level I -
Level 11-
A minor to moderate incident wherein local resources are adequate and available. A Local Emergency mayor may not be proclaimed.
A moderate to severe emergency wherein local resources are not adequate and mutual aid may be required on a regional or statewide basis. A Local Emergency will be proclaimed and a State of Emergency might be proclaimed.
-67-

Level III - A major disaster wherein resources in or near the impacted area are overwhelmed and extensive state and/or federal resources are required. A Local Emergency and a State Emergency wiU be proclaimed and a Presidential declaration of an Emergency or Major Disaster will be requested.
Local Emergency Operations
Local emergency operations in the City of Santa Maria wiU be managed in one of three modes, depending on the magnitude of the emergency: Decentralized Coordination and Direction; Centralized Coordination - Decentralized Direction; and Centralized Coordination and Direction.
Decentralized Coordination and Direction
This management mode is similar to day-to-day operations and would be used for those emergency situations for Level I response in which normal management procedures and local resources are adequate. Local public safety and emergency function coordinators provide necessary support. The emergency operating center (EOC) is not activated, and interagency coordination is accomplished via established telephone and radio communications systems and procedures at the incident and agency dispatch facilities.
Centralized Coordination - Decentralized Direction
This mode of operation is used for Level II response to emergencies which involve several departments or agencies from within the same jurisdiction, and/or agencies from more than one jurisdiction which require close coordination. In these situations, key management level personnel from the agencies/departments wiU collect in a central location to provide jurisdictional or multi-jurisdictional coordination for the emergency. In this mode, a coordination group should meet at the EOC or, if the EOC is not activated, meet at a 24 hour dispatch facility located in or immediately adjacent to the affected area.
Centralized Coordination and Direction
This mode of operation would be utilized following a Level III ("major") disaster which would render it impossible for a jurisdiction to effectively function in either of the previous two modes. In this situation, the EOC would be activated and aU coordination and direction activities would be accomplished from the EOC. All coordination of activities would originate from and go through the EOC.
Standardized Emergency Management System
Fully activated, the statewide Standardized Emergency Management System (SEMS) consists of the emergency management staffs of aU local jurisdictions, Operational Areas (Countywide), OES Mutual Aid Regions (two or more counties) and State Government. Local jurisdictions would be responsible for directing and/or coordinating emergency operations, with the other levels being responsible for coordinating and/or providing support to the local jurisdictions.
-68-

L
[
(
r
L
LOCAL EMERGENCY MANAGEMENT SYSTEM
Under the statewide Standardized Emergency Management System, the City's Local Emergency Management Staff will be directed by the Emergency Services Director (City Manager), who will be responsive to the City Council. The Director will be supported by the Emergency Services Coordinator, Section Chiefs and functional Operations Coordinators.
The Santa Maria Emergency Management Staff will have the overall responsibility for the following:
1) Organizing, staffing, and operating the EOC. 2) Operating communications and warning systems. 3) Providing information and guidance to the public. 4) Maintaining information on the status of resources, services, and operations. 5) Directing overall operations. 6) Obtaining support for the jurisdiction, and providing support to other
jurisdictions as required. 7) Analyzing contamination and other hazards and recommending appropriate
countermeasu res. 8) Collecting, evaluating, and disseminating damage assessment and other
essential information. 9) Providing status and other reports to the Operational Area Emergency
Management Staff (if activated) or the OES Mutual Aid Regional Office.
Santa Maria Emergency Management Organization
The City's Emergency Management Organization is outlined in Annex A of the Multihazard Functional Plan and is summarized in the following section.
Overall management and coordination of the City's response to emergency situations is handled by the Emergency Services Director. The City Manager acts as the Emergency Services Director under authority from the City Council.
The Emergency Services Director is assisted in managing and coordinating emergency response efforts by the Emergency Services Coordinator. The Emergency Services Coordinator position is filled by the Administrative Analyst.
Incident Command System
Emergency procedures in the City of Santa Maria follow the Incident Command System (ICS). ICS is a management system designed to appoint personnel to specific emergency operational activities. ICS, because of its standardized organizational structure and common organizational and operational terminology, provides a useful and flexible management system that is particularly adaptable to incidents involving multijurisdictional response. In the beginning, each position will initially be handled by the initial Incident Commander (usually the Police Watch Commander). As key personnel arrive at the Emergency Operating Center the positions required will be filled by the designated persons.
-69-

Santa Maria's ICS Command Staff is made up of the following personnel:
Incident Commander (City Manager) Public Information Officer (City Librarian) Liaison Officer (City Clerk) Legal Officer (City Attorney)
Immediately under the Command Staff is the General Staff. This is made up of the following personnel:
Operations Section Chief (Police/Fire Chief) Planning Section Chief (Community Development Director) Logistics Section Chief (Recreation and Parks Director) Finance Section Chief (Finance Director)
Figure 21 shows the above mentioned ICS hierarchy.
Reporting to the General Staff are various Operational Coordinators. Each function of the Command and General Staff and the Operational Coordinators is briefly described in the following sections.
Incident Commander (IC). The IC has overall management responsibility for the incident, including the development and implementation of strategic decisions and approving the ordering and releasing of resources.
The Command Staff element is provided to support the IC in handling such matters as public information, safety, and interagency liaison.
Under the direction of the IC, command and general staff are responsible for the activation and release of emergency response personnel and providing for 24 hour staffing during emergency conditions.
In incidents involving other agencies, a unified command element will evolve which will bring together multiple jurisdiction ICs to develop a common and consistent action plan to make the best use of all available resources.
Operations Section. This Section is headed by the Operations Section Chief (Police/Fire Chief) who is responsible for the management of all incident tactical activities. The Operations Chief directs the preparation of unit operational plans, requests or releases resources, makes expedient changes to the incident action plan as necessary and reports such to the Ie.
This section may be divided into branches such as fire, police, and public works. The branch directors, when activated, report to the Operations Section Chief. Branches may be further divided into divisions and smaller units. Staging areas for resources are also under the management of this section.
-70-
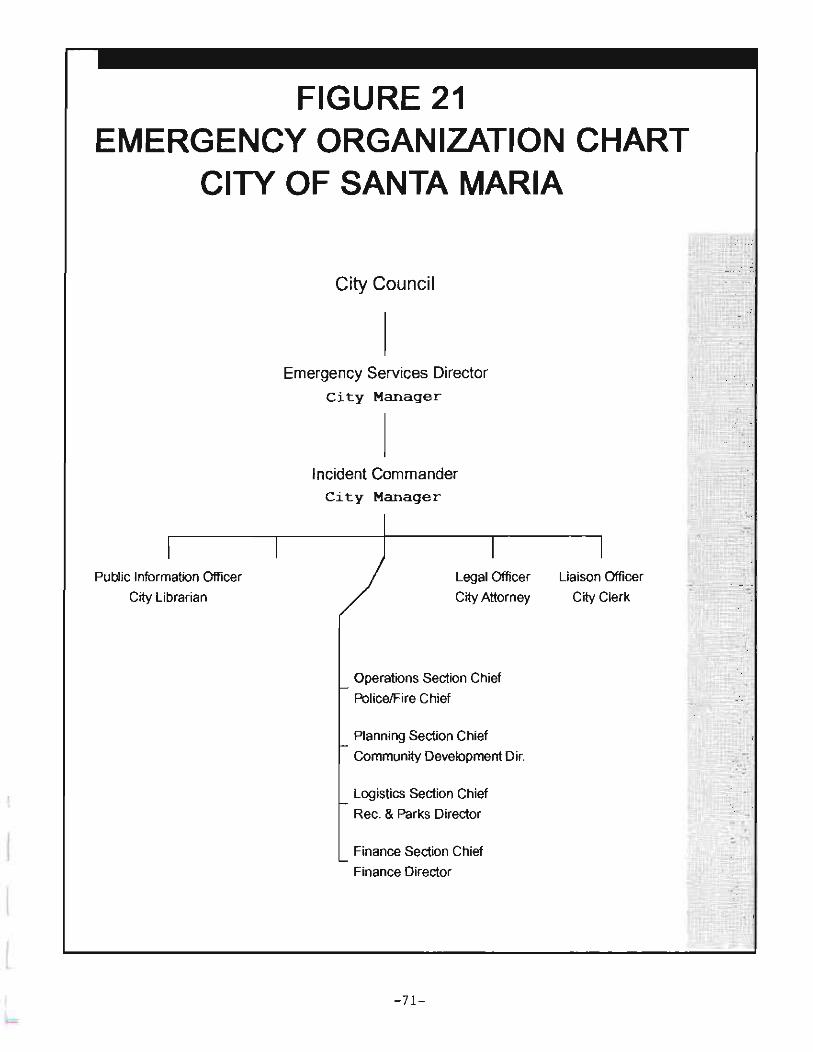
FIGURE 21 EMERGENCY ORGANIZATION CHART
CITY OF SANTA MARIA
Public Information Officer
City Librarian
City Council
Emergency Services Director
City Manager
Incident Commander City Manager
Legal Officer
City Attorney
Operations Section Chief
Police/Fire Chief
Planning Section Chief
Community Development Dir.
Logistics Section Chief
Rec. & Parks Director
Finance Section Chief
Finance Director
- 71-
Liaison Officer
City Clerk

Planning Section. This section is headed by the Planning Section Chief (Community Development Director) who is responsible for the collection, evaluation, dissemination and use of information about the development of the incident and status of resources. Information that is required to understand the current situation, to predict probable course of incident events, and develop alternatives for tactical action plans are also gathered. The section chief also conducts planning meetings and prepares the written incident action plan for incidents which require extended operations. The Planning Section Chief also ensures that information received from all sources is maintained in a significant events log for the duration of the emergency.
This section may be further divided into several divisions, depending on the needs of the incident.
Logistics Section. This Section is headed by the Logistics Section Chief (Recreation and Parks Director) who is responsible for meeting the logistical needs of the Operations Section. This includes providing equipment and supplies, food and medical support to incident personnel, meeting communications requirements of the incident and, in conjunction with the American Red Cross, care and shelter operations. This section also registers and coordinates the use of volunteers. The Logistics Section may be divided into branches and divisions as the situation dictates.
Finance Section. This Section is headed by the Finance Section Chief (Finance Director) who is responsible for participation in development and implementation of the incident action plan and activation and supervision of any branches and divisions within the Finance Section.
This section will be activated at an incident when required for purposes of maintaining records on personnel and equipment time, for obtaining supplies and equipment from and providing payments to vendors, and for determining cost considerations or various alternative strategies associated with incident planning.
Operations Coordinators. Operations Coordinators have been established to handle specific activities that may have to be performed in the event of an emergency. These Operations Coordinators are fully described in the Functional Annexes to the Multihazard Functional Plan. These annexes are described below. Each Operations Coordinator reports to a Section Chief of the General Staff unless otherwise noted.
Fire and Rescue (Annex B) - This annex addresses the general procedures for fire suppression and related rescue operations. In addition, it identifies the implementation procedures for mutual aid and other support depending on the magnitude of the occurrence.
During either peacetime or nuclear defense emergencies, fire and rescue operations in the City will be conducted by the City of Santa Maria Fire Department with mutual aid assistance as required.
The local Fire and Rescue Coordinator, who is under the direction of the Operations Chief, will be responsible for: the coordination of activities of personnel engaged in fire and rescue and other emergency operations; the
-72-

L
I r
I t I
maintenance of communications with field commands; the evaluation of status reports; making decisions regarding the commitment of resources; and determining the need for additional assistance.
Law Enforcement and Traffic Control (Annex C) - This annex descnbes general procedures for the maintenance of law and order and the preservation of life and property. It also provides guidelines for the functions of law enforcement and supporting agencies associated with the evacuation operations and the control of access to vacated areas or to hazardous or potentially hazardous areas. Also identified are the implementation procedures for mutual aid and other related support depending on the magnitude of occurrence.
The Santa Maria Police Division Chief is the Law Enforcement and Traffic Control Operations Officer. This Operations Coordinator is responsible for: the coordination of activities of law enforcement and traffic control personnel in and around the disaster area; the maintenance of communications with field commands; the evaluation of status reports; making decisions regarding the commitment of resources; and the determination of need for additional assistance.
Local Disaster Medical Coordinator (Annex D) - This annex describes the basic concepts, policies and procedures for providing disaster medical care to persons.
The Local Disaster Medical Coordinator is responsible for: the coordination of procurement and allocation of critical public and private medical and other resources for field operations; the activation and operation of casualty collection points; the transportation of casualties and medical resources; and the relocation of patients from damaged or untenable health care facilities.
Local Disaster Public Health Coordinator (Annex E) - This annex describes public health operations, assigns responsibilities, and provides suggested actions and responses to public health problems.
A County Health Department representative acts as the Local Disaster Public Health Coordinator. This Coordinator is responsible for: the coordination of public health measures and supports such measures accordingly; support of efforts in communicable disease prevention and control; and the coordination of activities to mitigate the effects of radiological and toxic chemical spills and/or emISSIons. This person works in conjunction with the County Agricultural Commissioner and the American Red Cross.
Coroner (Annex F) - This annex establishes policies and procedures for the collection, identification, and disposition of dead bodies.
The County Coroner/Medical Examiner has the statutory responsibility and authority for identifying dead persons and human tissue; determining and recording the cause, circumstances and manner of death; and disposing of unclaimed and/or indigent deceased persons.
-73-
Logistics/Care and Shelter (Annex G) - This annex describes the organizational and operational policies and procedures required to meet the food, clothing, and shelter needs of people on a mass care basis. It also cites authorities and specifies the public and private organizations responsible for providing mass care and welfare inquiry services.
The Logistics/Care and Shelter Coordinator reports to the Logistics Section Chief and has the responsibility for coordinating local government resources, requesting and responding to mutual aid forces, and providing support to the American Red Cross. This coordinator also coordinates the procurement and allocation of resources required to support mass care operations, to include the activation of appropriate lodging and feeding facilities and coordinates the activation and staffing of fallout shelters. The Logistics Section Chief should ensure that the City Manager has signed the proclamation designating the American Red Cross as the official local disaster relief agency.
American Red Cross - The American Red Cross, as mandated by Federal Law, provides disaster relief in peacetime. The major care and shelter responsibilities of the Red Cross in the emergency period are as follows:
a. Emergency lodging for disaster victims in public and private buildings. b. Food and clothing for persons in emergency mass care facilities. c. Food for disaster workers if normal commercial feeding facilities are not
available. d. Registration and inquiry service.
The American Red Cross acts cooperatively with state and local governments and other private relief organizations to provide emergency mass care to persons affected by disasters in peacetime.
PolicelMovement (Annex H) - This annex provides policies and procedures for the evacuation, dispersal, or evacuation of persons from threatened or hazardous areas to less threatened areas. It also describes the organization and responsibilities for conducting movement operations.
The Local Movement Coordinator, under the direction of the Operations Section Chief, will be responsible for coordinating the movement of persons from hazardous areas to lower risk areas. This Coordinator will be assisted by the Law Enforcement and Transportation Coordinators.
Movement operations will be conducted by the City of Santa Maria Police Department, the Public Works Department, Santa Maria Area Transit, private transportation providers, and mutual aid support as required. Procurement, regulation, and allocation of resources will be accomplished by the Transportation Coordinator.
-74-

Rescue (Annex I) - This annex descnbes the general policies and procedures and organizations and systems for the location of, provision of immediate care to, and safe removal of endangered, trapped, injured and/or 'solated persons. Both the fire and police departments bear responsibility fOT ~cue operations under the direction of the Rescue Coordinator.
Public Works/Construction/Engineering (Annex J) - This annex descnbes public works operations, assigns responsibilities, and establishes polices and procedures regarding the allocation of engineering resources (construction equipment, materials, etc.) required for emergency debris clearance, route recovery, fallout shelter construction, and other engineering operations.
The Director of Public Works acts as the Public Works Coordinator.
Finance!Resources and Support (Annex K) - This annex addresses policies and procedures for providing or coordinating the provision of services, equipment and supplies to support emergency operations. It describes the governmental organization responsible for providing resources and support (supply/procurement, personnel, transportation and utilities) and the elements of the private sector that nonnally provide commodities and services.
The Resources and Support Coordinator, under the direction of the Finance Section Chief, will be assisted by the following Support Officers with the responsibilities as indicated.
Personnel - Coordinates the allocation of personnel. Transportation - Coordinates the allocation of transportation resources required to move equipment, people, and essential supplies. Utilities - Coordinates the continued operation of water, gas, and electric utilities and, as required, any redirection of services.
Fire HazMat Team/Radiological Protection (Annex R) - This annex establishes the basic operational concepts, responsibilities, and techniques to support governmental efforts to save lives and minimize radiation exposure. These emergencies may involve material being transported, stored at a fixed facility, or a nuclear detonation. It describes a system which consists of radiation monitoring to detect, measure and report radiation intensities.
The City is responsible for the protection of its residents. When the disaster exceeds the response capability of local government, state and federal assistance is available through mutual aid and the Federal Radiological Emergency Response Plan, respectively.
The Emergency Services Coordinator or the Radiological Officer is responsible for preparing monitoring, decontamination, and radiological hazard assessments. For weapons incidents, they coordinate activities with state and federal response teams.
-75-
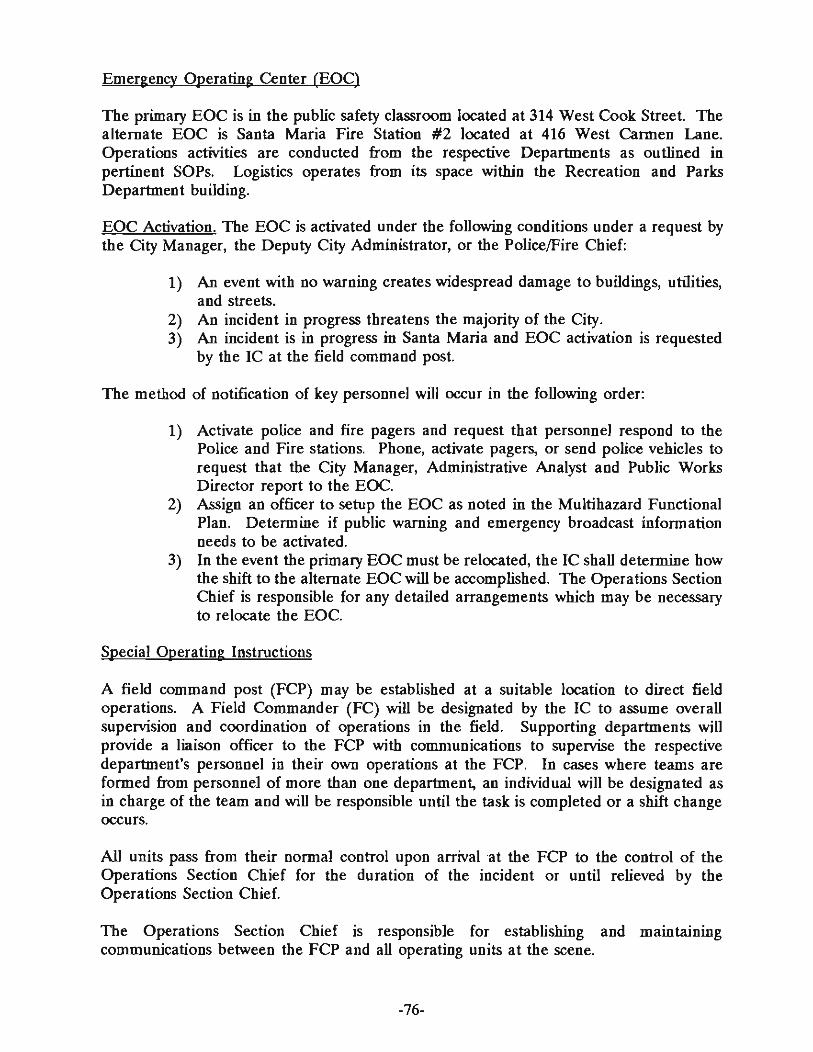
Emergency Operating Center (EOC)
The primary EOC is in the public safety classroom located at 314 West Cook Street. The alternate EOC is Santa Maria Fire Station #2 located at 416 West Carmen Lane. Operations activities are conducted from the respective Departments as outlined in pertinent SOPs. Logistics operates from its space within the Recreation and Parks Department building.
EOC Activation. The EOC is activated under the following conditions under a request by the City Manager, the Deputy City Administrator, or the Police/Fire Chief:
1) An event with no warning creates widespread damage to buildings, utilities, and streets.
2) An incident in progress threatens the majority of the City. 3) An incident is in progress in Santa Maria and EOC activation is requested
by the IC at the field command post.
The method of notification of key personnel will occur in the following order:
1) Activate police and fire pagers and request that personnel respond to the Police and Fire stations. Phone, activate pagers, or send police vehicles to request that the City Manager, Administrative Analyst and Public Works Director report to the EOC.
2) Assign an officer to setup the EOC as noted in the Multihazard Functional Plan. Determine if public warning and emergency broadcast information needs to be activated.
3) In the event the primary EOC must be relocated, the IC shall determine how the shift to the alternate EOC will be accomplished. The Operations Section Chief is responsible for any detailed arrangements which may be necessary to relocate the EOC.
Special Operating Instructions
A field command post (FCP) may be established at a suitable location to direct field operations. A Field Commander (FC) will be designated by the IC to assume overall supervision and coordination of operations in the field. Supporting departments will provide a liaison officer to the FCP with communications to supervise the respective department's personnel in their own operations at the FCP. In cases where teams are formed from personnel of more than one department, an individual will be designated as in charge of the team and will be responsible until the task is completed or a shift change occurs.
All units pass from their normal control upon arrival at the FCP to the control of the Operations Section Chief for the duration of the incident or until relieved by the Operations Section Chief.
The Operations Section Chief is responsible for establishing and maintaining communications between the FCP and all operating units at the scene.
-76-
• I
I
I !
By law, the authority for management of the scene of an on-highway hazardous materials incident lies with the law enforcement agency having primary traffic investigation authority on the highway where the incident occurs. By agreement, the Fire Department will manage and handle hazardous materials incident operations, with the law enforcement agency still maintaining scene management.
Standard Operating Procedures
Each Department within the City also has Standard Operating Procedures (SOPs) that each Department will follow in the event of an emergency situation. These SOPs detail staffing requirements and locations where staff should report in the event of an emergency.
SPECIFIC EMERGENCIES
Hazards that pose a threat to the Planning Area include earthquakes, hazardous materials incidents, flooding/dam failures, war emergencies, the Diablo Canyon Nuclear Power Plant, and transportation incidents (aircraft/motor vehicles). Santa Maria is not impacted by such hazards as volcanoes, wildfires, avalanches, landslides, or tsunamis.
Earthquake Emergencies
The general seismicity of the Santa Maria area is fully described in the Geology/Seismology Section of this report. Since the City is less than 40 miles from the southern San Andreas Fault and closer to unmapped underground faults, because of the soil structure of the area, plus the 40 percent probability that the Planning Area is projected to experience a major earthquake, some areas of Santa Maria could receive a shaking intensity that could cause the overthrow of movable objects, the falling of plaster, and general panic, and damage to buildings. For most of Santa Maria, however, the intensity of this anticipated earthquake could cause disruption beyond anything recently experienced in the area and would require total integrated planning and response from both the public and private sectors in order to minimize possible deaths, injuries and property destruction.
Casualties
Current studies predict the total number of deaths and hospitalized injuries only for the Los Angeles area. Extrapolation of these figures to Santa Maria would be scientifically unsound. However, some generalities might apply. The number of casualties would vary by the time of day, the smallest number occurring when people are in their homes and the largest number occurring when people are at or enroute to work or school. The ratio of hospitalized injuries to deaths may be 4:1. The ratio of non-hospitalized injuries to deaths may be 30:1.
Long-Term Homeless
In Santa Maria, some homes would be uninhabitable because of structural damage and utility outage. Some would have their homes destroyed; others would be driven from their homes because of structural damage, lack of water, lack of power, leaking gas, etc.
-77-

Damage to Vital Public Services. Systems. and Facilities
U.S. Highway 101. Considerable damage to road surfaces, overpasses and bridges would be expected in aU areas of liquefaction.
Aimort. The Santa Maria Airport would be seriously affected due to its location in an area that is subject to liquefaction because of the deep soil and high (perched) water table. It is questionable whether the airport could be used for any major logistical resupply except by helicopter.
Santa Maria VaUey Railroad/Southern Pacific Railroad. Southern Pacific mainline railroad service would be disrupted by surface ruptures, landslides, rockfaUs, failures of overpasses and slides at the ends of tunnels. It is doubtful that rail service to Santa Maria could be restored in less than 8 to 10 days.
Telephone Systems. Any surviving telephone service would be overloaded by calls from both inside and ou tside the area.
Radio Systems. Public safety radio systems would survive to varying extent and functions within the Planning Area. Microwave channels would be disrupted.
Commercial Broadcasters. Lack of emergency power would restrict the operation of some television and radio stations. The scarcity of fuels and the unavailability of resupply would limit the operational time of emergency generators.
Water Supply and Waste Disposal. A major earthquake would seriously disrupt the water distribution system. The Wastewater Treatment Plant would probably suffer some damage and could be inoperative. Lack of electrical power also would cause the plant to shu t down. CoUection lines throughout the area could be impaired causing significant contamination problems.
Electrical Power. A short term, and potentially long term effect, would be major power outages and power reductions in most areas of the Central Coast. Those lines that remain intact might be rendered temporarily out of service after each aftershock. The major longterm impact would be on distant power sources, both due to the reduction in transmission capacities and the probable shortage of generator fuel. Transmission lines in Santa Maria would stand a good chance of being one of the earlier facilities restored.
Natural Gas. Major pipelines leading to the area as well as those in the area could be ruptured. It is uncertain how long the areas could be supported by underground storage.
Petroleum Fuels. The processing of petroleum fuels in the area is uncertain. If this source of fuels became unavailable, extremely serious consequences could result due to the inability to resupply fuels by land transport.
-78-

L f
! f
I
Damal:e Assessment
In the event of a damaging earthquake, the Community Development Department will conduct a postearthquake safety evaluation of buildings within the City. These procedures have been developed for the State Office of Emergency Services and the State Office of Statewide Health Planning and Development by the Applied Technology Council (ATC).16 All City of Santa Maria Building Inspectors have been certified to conduct the rapid evaluation portion of the assessment. A brief overview of the procedures are provided below.
The goals of safety evaluation is to eventually post every building either "Inspected" (i.e. apparently safe) or "Unsafe." Buildings posted "Unsafe" will normally require repair or demolition.
There are three different building safety-evaluation procedures (Figure 22):
1) Rapid Evaluation. 2) Detailed Evaluation. 3) Engineering Evaluation.
Rapid Evaluation. This is normally the first level of evaluation and is designed to quickly designate the apparently safe and the obviously unsafe structures. Doubtful structures are designated for a more detailed visual examination, designated a Detailed Evaluation. The time frame for this assessment is approximately 10-20 minutes per building, and can be performed by building inspectors, civil/structural engineers, or architects.
Detailed Evaluation. This assessment consists of a thorough visual examination of a structure, inside and out, and is designed to result in a rating of all structures as either safe for use, potentially dangerous (limited entry), or unsafe. This review usually takes 1-4 hours per building and is performed by a structural engineer.
Enl:ineering Evaluation. This level of review is conducted by a structural engineering consultant retained by the building owner for any building posted as "limited entry" by the Detailed Evaluation.
In areas where slope failures or other ground movements threaten safety, the Detailed and Engineering Evaluations should be performed by a team including a geotechnical engineer or geologist.
16 ATC-20 report "Procedures for Postearthquake Safety Evaluation of Buildings"
-79-

Apparently OK
I Post
INSPECTED
Safe, but may need repairs
I
Post INSPECTED
Structure Identified For Evaluation
Questionable
I Post
LIMITED ENTRY
Detailed Evaluation
I Questionable
I I
Post LIMITED ENTRY
I
Obviously Unsafe
I Post
UNSAFE
Unsafe, must be repaired or remo ved
I
Post UNSAFE
Engineering Evaluation I (Owner must hire Consultan~
Unsafe, must be Safe, but needs repairs repaired or remov ed.
I I Post Post
INSPECTED UNSAFE
Figure 22
Building Safety-Evaluation Procedures
-80-

I L
f
I
I
L
Hazardous Materials Emergencies
The increasing volume and variety of hazardous materials that are generated, stored or transported through the Planning Area have created potential threats to human health and the environment. Hazardous materials incidents differ from other emergency situations because of their unpredictable nature and the possibility of long range toxic effects. Incidents may occur at fixed facilities where the opportunity for the development of sitespecific contingency plans is great. They may also occur at any place along any land, water or air transportation route and may occur in remote or treacherous areas, relatively inaccessible by ground transportation.
Although incidents may occur anywhere at any time, certain portions of the Planning Area are more likely to be the site of an accident involving hazardous materials.
U.S. Highway 101
U.S. Highway 101 is the primary truck route from Los Angeles to coastal Central California. Materials shipped include rocket fuel, explosives, compressed and liquified gasses, petroleum products, agricultural chemicals, industrial chemicals and hazardous waste.
Betteravia Road
Betteravia Road is the main link from U.S. Highway 101 to the western portion of the Planning Area, the Casmalia hazardous waste facility, and the area's agricultural industries. This route passes very few residential areas at this time but does traverse several blocks of commercial establishments and several miles of industrial and agricultural land uses.
Railroads
The main north-south Southern Pacific line is located nine miles west of the City. The industrial core of the City is served by the Santa Maria valley Railroad which carries agricultural products out of the area. Some petroleum products are transported to the main line from the east side of town through a mixture of residential, industrial, and commercial land uses.
Airport Industrial Zones
The airport area contains electronic component manufacturers, aircraft repair shops and specialized research facilities. Solvents, etching agents, stored fuel and radioactive material may be encountered.
Flooding Emergencies
Floods may be classified as either slow-rise floods or flash floods. The warning time preceding a slow-rise flood may extend for hours, days, or weeks. Flash floods may occur without warning or with only a few hours warning at most.
-81-
The Santa Maria River is basically a flood channel and remains dry most of the time. However, when undammed Sisquoc drainage is active, heavy flows could be experienced. The Cuyama Drainage is channeled by Twitchell Dam and can be controlled during heavy runoff times. The Santa Maria River is contained behind sand filled, rock-faced levees maintained by the Santa Barbara County Flood Control District and Water Agency. The District patrols the levee any time there is more than a few hundred feet per second flowing in the river. Levee erosion has been experienced and if the levee was allowed to rupture, would create major flooding problems east of U.S. Highway 101.
Localized flooding potential exists along portions of the Santa Maria levee. These problems can be considered short-term depending on the commitment to repairing the levee against poten tial failures.
Dam Failure Emergencies
Dam failures can result from a number of manmade or natural causes such as earthquakes, erosion of the face or foundation, rapidly rising flood waters, or structural/design flaws.
The only significant dam in the vicinity which could affect the Planning Area in the event of a collapse is Twitchell Dam. The dam, constructed by the Bureau of Reclamation in 1958, is primarily for groundwater recharge and flood control. It is an earthfill dam, 216 feet high, with a storage capacity of 240,000 acre-feet. The probability of a total failure of Twitchell Dam is remote since the dam only impounds water periodically and is not a reservoir. It is unlikely that a significant portion of the Planning Area will be inundated in the improbable event that Twitchell Dam fails when filled to capacity in an earthquake.
Nuciear War Emergencies
Current State and Federal guidance assumes that a nuclear attack on the United States would be preceded by a period of increasing international tension. This guidance also assumes that sufficient time would be available for protective actions to be taken such as the construction of shelters and the temporary relocation of residents of possible target areas.
A lesser threat that has a greater probability of occurrence comes from terrorist organizations. These organizations could transport a small nuclear device to any part of the United States and detonate the weapon at the time and place of their choosing with little or no warning.
The City of Santa Maria is a potential target area because the airport is capable of supporting military aircraft. Although the airport is located at the southwest edge of the City, the City is within the blast and thermal effects zone of an accurately placed 1 megaton weapon.
Vandenberg Air Force Base (V AFB), located 10 miles southwest of the City, is a potential target because of the launching facilities and the long runway at the base. Santa Maria would be in the blast and thermal zone for any air burst at V AFB. With a ground burst at V AFB, Santa Maria may be shielded to a degree by the mountains to the south of the City. An error in targeting could easily shift a burst directly over the City.
-82-
I
Because no blast shelters have been identified, the probability of an individual surviving a 1 megaton airburst over the City is low (90% or more casualties). Among the survivors, thermal and blast injuries would be predominant and radiation injuries would be absent. Residual radiation should not be significant if the explosion occurs at the optimum altitude for maximum blast and thermal damage.
A low yield terrorist device would produce a zone of injuries or lethal radiation that would extend beyond its more limited blast and thermal effects zone. Bums and radiation injuries would be predominant if the device were placed at an elevated location. If it were detonated near ground level, the thermal and radiation effects would be restricted by the shielding properties of buildings. Residual radioactivity would remain at dangerous levels for an extended period of time at the explosion site.
Diablo Canyon Nuclear Power Plant Emergencies
Emergency response action plans are not required for the subject hazard since all of Santa Barbara County is beyond the Diablo Canyon Emergency Planning Zone. However, given the basically north-south transportation grid within the areas involved, in the event of an emergency in San Luis Obispo County involving the Diablo Canyon facility, the Santa Barbara County Operational Area would by default become a support/host area fo r evacuees. As a support/host area, a relocation center for school children has been designated at Allan Hancock College, and a reception center has been designated at the County Fairgrounds.
Hazard Assessment
The Diablo Canyon Nuclear Power Plant, operated by the Pacific Gas and Electric Company, is located on the San Luis Obispo County coast approximately thirty miles northwest of Santa Maria. The plant consists of two operational nuclear power generating units. Each unit is a pressurized water-type reactor having an electric power generating capacity in excess of 1,000 megawatts.
The plant is designed to use slightly enriched uranium dioxide as a fuel. This fuel poses no major concern in its unirradiated form. However, after being in the core during operation of the reactor (fission process), the fuel becomes extremely radioactive from the fission by-products. These highly radioactive by-products, if released to the environment, are the main concern in a nuclear power plant accident.
Emergency Planning Zones
The Santa Barbara County Operational Area has adopted the official state emergency planning zones for Diablo Canyon. The emergency planning zones which are defined for the areas surrounding Diablo Canyon are described below.
-83-

Federal Emergency Planning Zones. The federal government defines a 10-mile radius for the plume exposure pathway Emergency Planning Zone (EPZ) and a 50-mile radius limit for the Ingestion Pathway Zone (IPZ). The City is well beyond the lO-mile radius EPZ for plume exposure. However, the 50-mile radius IPZ does include the City's Planning Area. The principal exposure in the IPZ would be from ingestion of contaminated water or foods such as milk, fresh vegetables, or aquatic foodstuffs.
State Emergency Planning Zones. The State has defined two planning zones to facilitate emergency planning. The zones are the Basic Emergency Planning Zone (BEPZ) and the Public Education Zone (PEZ).
The BEPZ covers an area of about 15 miles to the north and east and 18 miles to the southeast of the plant. The BEPZ lies entirely within San Luis Obispo County.
The PEZ extends across the San Luis Obispo County boundary to include the Santa Maria Planning Area. Residents living within this zone receive information on nuclear power plant emergency planning zones. Protective actions for the public in the PEZ are not necessary.
Protective Actions
Because of the distance of the power plant from the Planning Area, protective actions during the plume phase are not anticipated to be necessary in Santa Barbara County. However, the Planning Area could be directly affected by protective actions taken in San Luis Obispo County as noted below.
Evacuation. Evacuation is a major countermeasure to prevent or reduce exposure or contamination of the general public. The Planning Area could be affected by a directed or non-directed evacuation of the public from San Luis Obispo County. if evacuees are recommended to leave the area southbound on u.S. Highway 101 or State Route 1. Evacuees will affect traffic flow and some will need temporary lodging and board. The area could also be affected if individuals and/or automobiles leaving areas near the plant are contaminated with radioactive materials following an atmospheric release.
Protective Clothing. Protective clothing is worn to prevent contamination of the skin. The use of this clothing would not be necessary in the Planning Area in a routine emergency response. However, protective clothing would be used in the decontamination of personnel and equipment transported into the Planning Area.
Covering Stored Feed Supplies. As an ingestion pathway consideration, the State may recommend covering of stored livestock feed to limit or avoid contamination from airborne radioactive materials. The Planning Area could be affected since the County lies within the Ingestion Pathway Zone.
Interdiction. As an ingestion pathway consideration, the State has the authority to prevent the sale, distribution, or consumption of contaminated water or foodstuffs. The Planning Area could be affected since the County lies within the Ingestion Pathway Zone.
-84-
[
r
1
Decontamination. Decontamination is the reduction or removal of radioactive material from a structure, area, object, or person. Decontamination may be required in the Planning Area for personnel and equipment that have been contaminated in areas close to the plant and transported into Santa Barbara County.
Evacuation Routes
The predetermined evacuation routes leading from San Luis Obispo County into Santa Barbara County are U.S. Highway 101 and State Highway 1.
Classification of Emergencies
Federal guidelines group emergency conditions at nuclear power plants into four categories. These four categories cover the full spectrum of accidents that may occur at a plant. The categories from least to most severe are:
1) Unusual Event 2) Alert 3) Site Area Emergency 4) General Emergency
Unusual Event. These events are abnormal events that have occurred or are occurring which indicate a potential degradation of the level of safety of the plant, or which would attract significant public attention. The primary purpose of this notification is to apprise San Luis Obispo County officials of abnormal conditions at the facility which may create a significant public interest. Since the Unusual Events do not constitute emergency conditions in themselves, Santa Barbara County will not be notified at this emergency classification.
Alert. This classification is characterized by events which are occurring or have occurred that involve actual or potential substantial degradation of the level of plant safety.
An Alert classification requires that the plant and offsite emergency personnel be available to respond if the situation becomes more serious. Offsite agencies, including Santa Barbara County, will be notified of Alert classifications.
Site Area Emergency. This classification is characterized by events involving actual or likely major failures of plant safety systems.
Most events within the Site Area Emergency classification constitute actual or probable releases of radioactive material to the environment. Precautionary measures may be recommended by San Luis Obispo County.
A Site Area Emergency notification ensures that response centers are activated and staffed, monitoring teams are dispatched and personnel are available for protective measures, and to disseminate public information. Santa Barbara County will be notified of Site Area Emergency classifications.
-85-
General Emergency. This classification is characterized by events occurring or which have occurred which involve actual or imminent substantial core degradation or melting, with potential loss of containment integrity and subsequent release of substantial quantities of radioactive materials to the environment.
A General Emergency notification ensures that response centers are activated and staffed, monitoring teams are dispatched, predetermined protective measures are initiated, and to disseminate public information. Santa Barbara County will be notified of Site Area Emergency classifications.
Transportation Emergencies
Transportation emergencies, other than those involving hazardous materials, can cause great loss of property or life.
The greatest loss of life can occur when commercial passenger carriers such as trains, airliners, or buses are involved. However, multiple vehicle automobile accidents also can result in a large number of injuries and fatalities. Mass casualty incidents quickly exhaust local resources and require mutual aid in order to transport and give emergency care to victims
Highway accidents can have an impact on the community beyond those problems caused by the immediate casualties. Commerce and personal business depends on functioning transportation routes. Restoration of traffic flow by bypassing the incident site should be accomplished as soon as feasible.
Santa Maria lies within a transportation corridor. U.S. Highway 101 carries a large volume of traffic every day of the year. This route is the primary route from Los Angles to coastal Central California. It carries truck freight, private cars and passenger buses.
The Santa Maria Public Airport can accommodate aircraft as large as a DC-I0. The airport is used by scheduled airlines, private airplanes, and helicopters. In addition to the locally generated flights, through commercial and private air traffic passes over Santa Maria. Spacecraft using Edwards Air Force Base can fly over the area during landings, as well as military aircraft enroute to Vandenberg Air Force Base.
Other Emergencies
Although the Planning Area would not be impacted directly by volcanic eruptions, major wildfires, landslides, or tsunamis, a request for mutual aid may occur, a disruption of the normal flow of goods or services may occur, or the City might be impacted by evacuees or the injured.
-86-

{
GLOSSARY OF SELECTED TERMS
Direction and Control (Emergency Management)
The provision of overall operational control and/or coordination of emergency operations at each level of the Statewide Emergency Organization, whether it be the actual direction of field forces or the coordination of joint efforts of governmental and private agencies in supporting such operations.
Disaster (Local Definition)
The actual or threatened existence of emergency conditions which are, or are likely to be, beyond the control of services, personnel, equipment and facilities of the City of Santa Maria, requiring the combined forces of other political subdivisions to combat.
Emergency (I.ocal Definition)
The actual or threatened existence of conditions of emergency or extreme peril to the safety of persons and property within the City of Santa Maria caused by such conditions as air pollution, fire, flood, storm, epidemic, riot, earthquake, hazardous materials or conditions resulting from war or imminent threat of war.
Emergency (State Definition)
A disaster situation or condition of extreme peril to life and/or property, resulting from other than war or labor controversy, which is or is likely to be beyond local capability to control without assistance from other political entities.
Emergency (Federal Definition)
Any hurricane, tornado, storm, flood, high-water, wind-driven water, tsunami, earthquake, volcanic eruption, landslide, mud slide, snowstorm, drought, fire, explosion, or other catastrophe in any part of the United States which requires federal emergency assistance to supplement state and local efforts to save lives and protect public health and safety or to avert or lesson the threat of a major disaster.
Emergency Services (Local Definition)
The preparation for and carrying out of all emergency functions, other than functions for which military forces are primarily responsible, to prevent, minimize and repair injury and damage resulting from emergencies or disasters. It shall not include, nor does any provision of Chapter 17 of Title 2 of the Municipal Code apply, to any condition relating to a labor controversy.
-87-

Emergency Operating Center (EOC)
A facility used for the centralized direction and/or coordination of emergency operations. An effective EOC must provide adequate working space and be properly equipped to accommodate its staff, have a capability to communicate with field units and other EOCs, and provide protection commensurate with the projected risk at its location.
Emergency Period
A period which begins with the recognition of an existing, developing, or impending situation that poses a potential threat to a community. It includes the warning (where applicable) and impact phase and continues until immediate and ensuing effects of the disaster no longer constitute a hazard to life or threat to property.
Essential Facilities
Facilities that area essential for maintaining the health, safety, and overall well-being of the public following a disaster (e.g. hospitals, police and fire department buildings, utilities, etc.). This may also include buildings that have been designated for use as mass care facilities.
Evacuation
Moving to an area of less risk.
Hazard
Any source or danger or element of risk.
Hazard Area
A geographically identifiable area in which a specific hazard presents a potential threat to life and property.
Incident Command System (lCS)
A system designed for the on-scene management of emergencies resulting from fires and other natural or man-made emergencies. ICS can be used during serious multidisciplinary emergencies or for operations involving a single jurisdiction with single or multiagency involvement.
Mutual Aid Agreement
An agreement in which two or more parties agree to furnish resources and facilities and to render services to each and every other party of the agreement to prevent and respond to any type of disaster or emergency.
-88-
I I
Operational Area
An intermediate level of the State Emergency Services Organization, consisting of a county and all political subdivisions within the county.
Standard Operating Procedures (SOP)
A set of instructions having the force of a directive, covering those features or operations which lend themselves to a definite or standardized procedure without loss of effectiveness.
Reception Areas
An area which, through a hazard analysis and related preparedness planning, IS
predesignated to receive and care for persons displaced from a hazard area.
A2i-Update
-89-
CITY OF SANTA MARIA GENERAL PLAN SAFETY ELEMENT UPDATE
TECHNICAL BACKGROUND REPORT
APPENDIX A GEOLOGICAL BIBLIOGRAPHY

APPENDIX A BIBLIOGRAPHY
GEOLOGY OF SANTA MARIA AREA
Canfield, c.R., 1939, Subsurface Stratigraphy of Santa Maria Valley Oil Field and Adjacent Parts of Santa Maria Valley. California: AAPG Bulletin, v. 23, no. 1, p. 45-81.
Clark, Douglas G., 1993, Quaternary Tectonic Deformation and Seismic Hazard in the Casmalia Range. Coastal South-Central California: University of Nevada at Reno, Master's Thesis, 123 p.
Clark, Douglas G., Slemmons, D.B., Caskey, S.J., and dePolo, D.M., 1994, Seismotectonic Framework of Coastal Central California. in Alterman. I.B .. McMullen R.B .. Cluff. L.S .. and Slemmons. D.B .. editors. Seismotectonics of the Central California Coast Ranges: Geological Society of America, Special Paper 292, P. 9-30.
Dehlinger, P., and B.A. Bolt, 1987, Earthquakes and Associated Tectonics in a Part of Coastal Central California: Bulletin of the Seismological Society of America, v. 77, p. 2056-2073.
Dibblee, Thomas W., Jr., 1989, Geologic Map of the Casmalia and Orcutt Ouadrangles. Santa barbara County. California: Dibblee Foundation Map DF-24, scale 1:24,000.
Feigl, K.L., R.W. King, and T.H. Jordon, 1990, Geodetic Measurement of Tectonic Deformation in the Santa Maria Fold and Thrust Belt, California: Journal of Geophysical Research, v. 95, p. 2679-2699.
Hall, C.A., Jr., 1978, Geologic Map of Twitchell Dam. Parts of Santa Maria and Tepusquet Ouadrangles. Santa Barbara County. California: USGS Miscellaneous Field Studies Map MF-Sll (or MF-933), scale 1:24000.
Hart, E.W., 1994, Fault-Rupture Hazard Zones in California: California Division of Mines and Geology, Special Publication 42, 1994 revised edition, 34 p.
Heilbrunn-Tomson, J ., 1988, A Bibliography of the Santa Maria Province and Vicinity. South Central Coastal California: USGS Open File Report 88-509, 107 p.
Hughes, 1.L. and Freckieton, J.R., May 1976, Ground Water Data for the Santa Maria Valley. California: USGS Open-File Report, 444 p.
Hughes, J.L., July 1977, Evaulation of Ground Water Ouality in the Santa Maria Valley. California: USGS Water Resources Investigations 76-128, 72 p.
A-I

Jennings, C.W., 1959, Geologic Map oftbe Santa Maria Sbeet: California Division of Mines and Geology, scale 1 :250000.
Jennings, C.W., 1994, Fault Activity Map of California and Adjacent Areas: California Division of Mines and Geology, Geologic Data Map No. 6, scale 1:750,000.
Kieniewicz, P.M., and Luyendyk, B.P., 1986, A Gravity Model of tbe Basement Structure in the Santa Maria Basin. California: Geopbysics, v. 51, p. 1127-1140.
Krammes, K.F., and J.F. Curran, 1959, Correlation Section 12 Across Santa Maria Basin from Cretaceous Outcrop in Santa Ynez Mountains Northerly to Franciscan Outcrop North of Santa Maria River. California: AAPG, Pacific Section, scales 1:12000 and 1:48000.
Lettis, W.R., K.L. Hanson, K.I. Kelson, and J.R. Wesling, eds., 1990, Field Trip Guidebook. Neotectonics of Soutb-Central Coastal California: Friends of the Pleistocene Pacific Cell, 1990 Fall Field Trip.
Manson, M.W., 1985, Santa Maria Valley Faults. Santa Barbara and San Luis Obispo Counties. California: California Division of Mines and Geology Fault Evaluation Report, FER-168, 19 p.
McCulloch, D.S., 1987, Offsbore Geology of tbe Santa Maria Area. Central California (abs.): EOS, v. 68, no. 44, p. 1365.
Mclean, 1989, Distribution of Mesozoic Basement Rocks in Santa Maria Basin. California (abs.): AAPG Bulletin, v. 73, p. 545.
Miller, G.A. and Evenson, R.E., 1966, Utilization of Ground Water in tbe Santa Maria Valley. California: USGS Water-Supply Paper 1819-A, 24 p.
Namson, J., and T.L. Davis, 1990, Late Cenozoic Fold and Thrust Belt of the Soutbern Coast Ranges and Santa Maria Basin. California: AAPG Bulletin, v. 74, p. 467-492.
Pacific Gas and Electric Company, 1988, Diablo Canyon Power Plant Long Term Seismic Program Report: San Francisco, California, Pacific Gas and Electric Company.
Petersen, Mark D., and Wesnousky, S.G., 1994, Fault Slip Rates and Earthquake Histories for Active Faults in Soutbern California: Bulletin of the Seismological Society of America, V. 84, P. 1608 - 1649.
Silver, E.A., and W.R. Normark, eds., San Gregorio-Hosgri Fault Zone. California: California Division of Mines and Geology Special Report 137.
A-2
Sylvester, A.G., and Darrow, A.C., 1979, Structure and Neotectonics of the Western Santa Ynez Fault System in Southern California: Techtonophysics, v. 52, p. 389-406.
Testa, S.M., 1992, Hydrogeologic Characterization and Monitoring System Design of the Casmalia Resources Facility. in Pipkin. B.W .. and Proctor. R.J.. editors. Engineering Geology Practice in Southern California: Association of Engineering Geologists, Special Publication No. 4, p. 119-129.
Woodring, W.P., and M.N. Bramlette, 1950, Geology and Paleontology of the Santa Maria District. California: USGS Professional Paper 222, 185 p.
Working Group on California Earthquake Probabilities, 1995, Seismic Hazards in Southern California: Probable Earthquakes, 1994 to 2024: Bulletin of the Seismological Society of JUnerica, v. 85, no. 2, p. 379-439
Worts, G.F., Jr., 1951, Geology and Groundwater Resources of the Santa Maria Valley Area, California: USGS Water Supply Paper 1000, 165 p.
Compiled by: California Department of Conservation, Division of Mines and Geology, and City of Santa Maria Community Development Department.
A2j-Geo
A-3
CITY OF SANTA MARIA GENERAL PLAN SAFETY ELEMENT UPDATE
TECHNICAL BACKGROUND REPORT
APPENDIX B UNREINFORCED MASONRY BUILDINGS
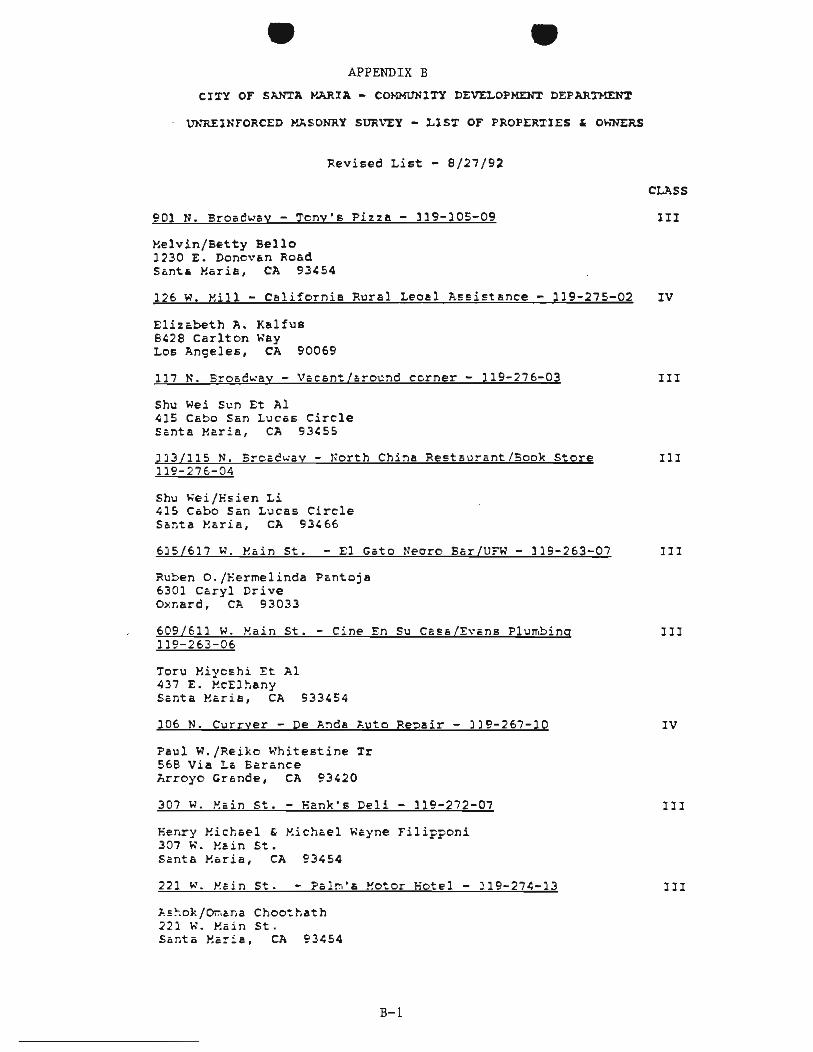
• • APPENDIX B
CITY OF SAN'XA !'ARIA - COMHVNIXY PEVELOPME:NT PEPAR=NT
Uh~INFORCEP !'~SONRY SUR\~Y - LIST OF PROPERTIES ~ Oh~RS
Revised List - 8/27/92
901 N. Broad~.y - Tony·. Pi.za - 119-105-09
Melvin/Betty Bello 1230 E. DonOV6n Road Sant. Maria, CA 93454
CLASS
III
126 W. Mill - California Rural Leo.l Assistance - 119-275-02 IV
Eliz6beth A. Kalfus 6428 Carlton Way Los Angeles, CA 90069
117 N. Broadway - V6cant/6rocnd ccrner - 119-276-03
Shu Wei Sun Et Al 415 Cabo San L~cas Circle S.nta Maria, CA 93455
113/115 N. Brc6d~ay - North China Re~t5ur6nt/Book Store l19-276-04
Shu Wei/Hsien Li 415 Cabo San Lucas Circle S.nta Maria, CA 93'66
III
III
615(617 W. Main St. - El Gato Neoro Sar(UFW - 119-263-07 III
Ruben O./Hermelinda Pantoja 6301 Caryl Drive Ox~ard, CA 93033
609/611 w. ~ain St. - Cine En Su C2~c/E'\·c.ns Plumbing 119-263-06
Toru Miycshi Et Al 437 E. McEl~any Santa ~aria, CA 933'54
106 N. Curryer - De ~nde ~uto Re?sir - )19-267-10
Poul W./Reiko Whitestine Tr 568 Via La Earance nrroyo Grande, CA 93'20
307 W. M.in St. - Hank·s Deli - 119-272-07
He~ry Michael & Michael Wayne Filipponi 307 W. Main St. Santa Maria, CA 93'54
221 w. ~cin St. - Palm's Motor Hotel - 119-27~-13
J..E~ok/Q:7, cr.a Choo~tjath 221 w. Y.ain St. Scnta Y.cria, CA 93'54
B-1
III
IV
III
III
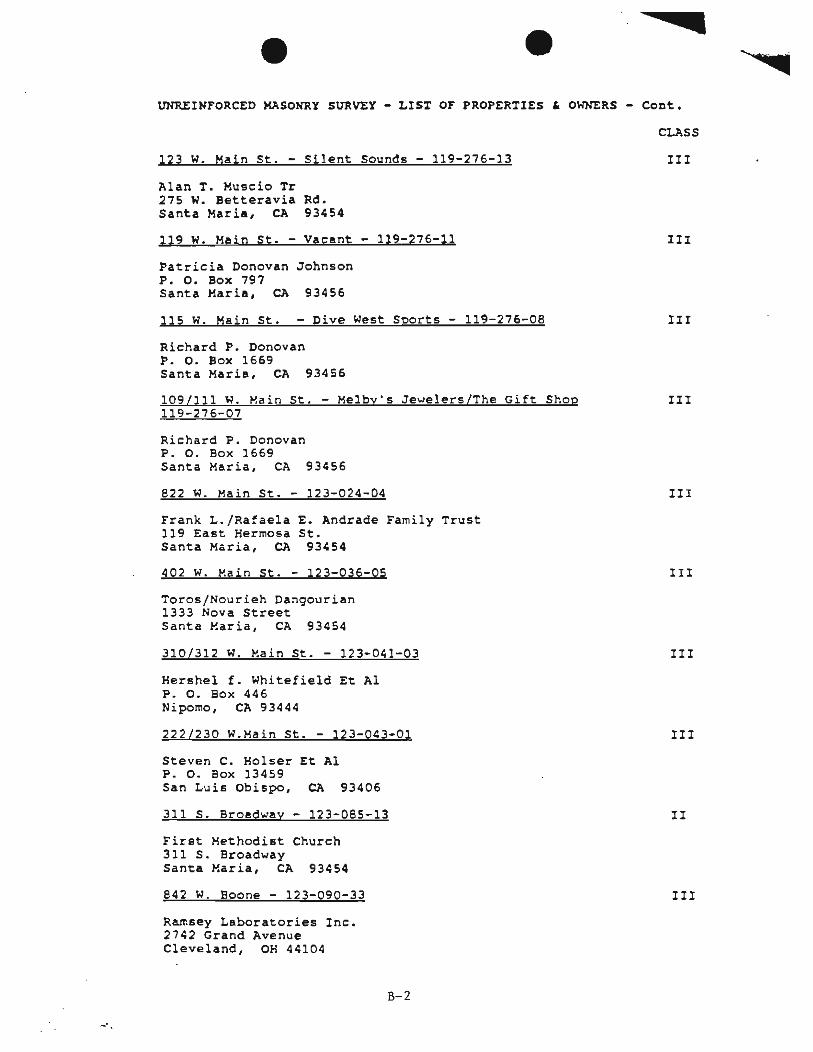
• • UNREINFORCED MASONRY SURVEY - LISX OF PROPERXIES • O~~RS - Cent.
123 W. Main St. - Silent Sounds - 119-276-13
Alan T. Muscie Tr 275 W. Betteravia Rd. Santa Maria, CA 93454
119 W. Main St. - Vacant - 119-276-11
Patrieia Donovan Johnson P . O. Box 797 Santa Maria, CA 93456
115 W. Main St. - Dive West Soorts - 119-276-08
Richard P. Donovan P . O. Box 1669 Santa Maria, CA 93456
109/111 W. Main St. - Melby's Jewelers/The Gi ft Shop 119-276-07
Richard P. Donovan P. O. Box 1669 Santa Maria, CA 93456
822 W. Main St. - 123-024-04
Frank L . /Ra!aela 119 East Hermosa Santa Maria, CA
E. Andrade St.
93454
402 W. Main St. - 123-036-05
Toros/Nourieh Dangourian 1333 Nova Street . Santa Maria, CA 93454
Family Trust
310/312 W. Main St. - 123-041-03
Hershel f . Whitefield Et Al P . O. Box 446 Nipomo, CA 93444
222/230 W.M.in St. - 123-043-01
Steven C. Holser Et Al P. O. Box 13459 San Luis Obispo, CA 93406
311 S. Broadway - 123-085-13
First Methodist Church 311 S. Broadway Santa Maria, CA 93454
842 W. Boone - 123-090-33
Ramsey Laboratories Inc. 2742 Grand Avenue Cleveland, OH 44104
B-2
CLASS
III
III
III
III
III
III
III
III
II
III
,

• • UNREINFORCED MASOh~Y SURVEY - LIST OF PROPERTIES ~ Oh~LRS - Cont.
745 W. Betteravia R~. - 117-330-15
Joe W. Gray Personal Trust P. O. Box B Santa Maria, CA 93456
3001306 N. Bro.~way - 121-191-13
Joseph Roemer Company P. O. Box 395 Santa Maria, CA 93456
105 E. Mill - 121-191-12
Glen A Roemer Tr Et Al P. O. Box 395 Santa Maria, CA 93454
117 E. Mill - 121-191-11
Glenn A Roemer Tr Et Al P. O. Box 395 Santa Maria, CA 93456
201 1205 1207 E . Ma in - 121-224-15
Kasayoshi Tomooka Isamu Tomooka Yoshito Tomooka
P.O. Box 5729 Santa Maria, CA 93456
211 E. Main - 121-224-14
Channing B./Jacque Feller 1030 W. Las Flores Way Santa Maria, CA 93454
2131215 E. Main - 121-224-13
Charles G./Dorothy M. Dorsey P. O. Box 2520 Orcutt, CA 93455
7081712 S. Broad~.y - pinette's Unlimited/Shaw's 125-181-17
Theo~ore E. ~ Irene Saladin Trustees 836 Melinda court Santa Maria, CA 93455
706 W. Main St. - 123-031-02
Toru Miyoshi 437 E. McElhaney Santa MAria, CA 93454
B-3
CT..ASS
IV
III
III
IV
II
III
III
II
III

! !
l
l
CITY OF SANTA MARIA GENERAL PLAN SAFETY ELEMENT UPDATE
TECHNICAL BACKGROUND REPORT
APPENDIX C GEOLOGICAL DIAGRAMS

APPENDIX C
DIAGRAMS OF
SELECTED GEOLOGICAL TERMS
LEGEND
GS = Ground Surface
I = Fault and Direction of Movement
= Rock Layers
C-l
I I
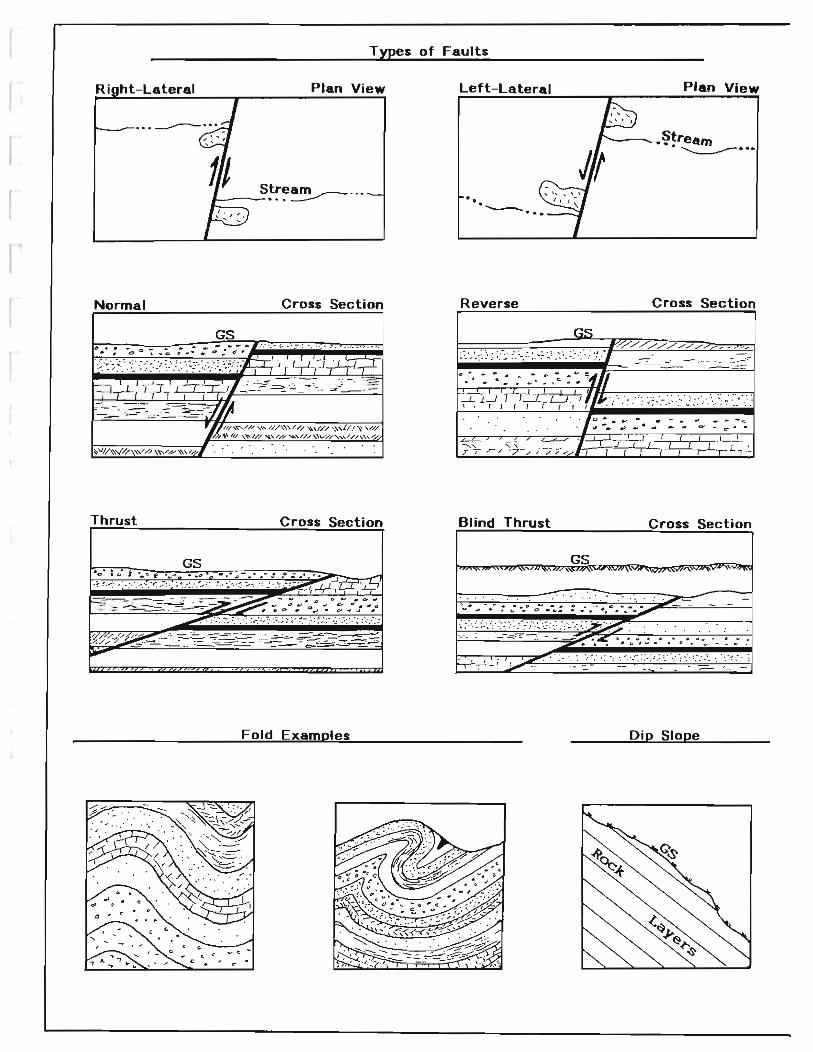
Types of Faults
Ri ht-Lateral Plan View
Normal Cross Section
GS ... .,.; -. " . ':-.
':"':', :.:':.:-: ~::.' ~ :).: ·::7:::" . .-'.' .. ';~'·if'-iITj ; I~-/:j . I
I-~~; r:,:r-;.LI,~4 __ = .:. - -
Thrust Cross Section
GS -.. .. -.. ~-.: .. •.. -.
Fold Examples
Lett-Lateral
.. . ---.. ...
Reverse
'. I.: ' .. : .: :.: :".: .. :.'
Blind Thrust
' .•• ~· .~4 .... .. . -.
Plan View
Cross Section
GS " ',:-"
J " ;.~ -. ~ .. ., _ . ..
Cross Section
GS
. . -'; ': -: ' : ;. '", ." , ::': .. : ': " ; . :::.' : : ".~ ' . .
Dip Slope
CITY OF SANTA MARIA GENERAL PLAN SAFETY ELEMENT UPDATE
TECHNICAL BACKGROUND REPORT
APPENDIX D HAZARDOUS MATERIALS
MANAGEMENT PLANS

r I
APPENDIX D
HAZARDOUS MATERIALS MANAGEMENT PLANS
APPENDIX I~E
3. HAZARDOUS MATERIALS MANAGEMENT PLANS HAZARDOUS MATERIALS MANAGEMENT PLAN (HMMP)
<a) Ctatra1. A pplicaliOfu for a pmnil10 SIO~ hazardous malerials shall include an HMMP standard fonn or shon (onn in accordance with this section and uwl providt. narrative description ollhc: operations and proccs~s ukin& place a' the facility. Sec Ficure No. A·II·E·I.
(b) Information RtqulrH. 1lw: haurdou5 materials management plan standard (orm shall inclulk 1M informalion detailed in this subsection.
I. General information , General infonnalion, inclltding busineu name and IIddrcu, emerGency contaCIS, business activit)', txlsincss owner or operator, S IC code, number of cmpJoycc~ and hours, Dunn and Bradstreet num~r. and signalure of owner, operator or designaled rcprc~ntalivc.
2. Gtntr.1 Sitf plan. A general ,il(' plan drawn at a legible: sc.le ..... hich shall include:, but no! be limited to , the local ion of buildings, uterior storage- facilities, ptnnlAne-nt acce-ss ways, evacualion routes, parl.:ing lou., internal roads, chemical toading areas. equipn1C'nt clean ing areas. stann and sanilary sewe r acces!o(s, tmer· Jency equipmenl and adj..cenl propcny uses. TIle ute-rior storage areas shall be identified ..... ith the huard class and Ute maKimum quantities pt. hulltd clan of hAurdous male-rials stored. When required by the- chid. infonnation regarding the Iocatioo of wells. flood plains, unhqua1:e- faulu.. surface- water bodielo and general land uses " 'ilhin I mik: of t~ facililY boundaries shall be included.
3. Bulldln& noor plan. A ~iJdin, Ooor plan drawn to a IC'gible scale whtch shall include. but not be limite-d 10, hanrdcws materials 5\oraEe areas within the building IUld shall indicate rooms., doorwlYs, corridors. exits and evacultton routes. Each hazardous materiah 5toraCe- facility shall be- identified by I map key which lim the indh' idu;d hazardous materi:IoI~, their huard Cl15S and quantilY pre~nl for each area.
4. Haurdous mate-rials handling. Informalion showing thai aClivitie-s in-volving the handling of hl.llldous materiab between 1M- storage veas and man· ufacluring processes on site art conducted in a manner to prc\lentlhc a.ccidcntal ~1c:1K or such materials.
5. Chemlc:al compatibllily and ICparatlon, Information showing procedures, controls, siins 01 othe. melhods uw:d loensure separation and procection of stored malerials from factors which could cause ICcidtntal ignition or reaction of i",il· able. reactive or incompatible materials in each alea.
6 . MonilOrin& pro&ram, lnfonnation including. but nol limited to, lhc: loca, tion.type. manufacturer 'l. specificllions. if applicable, and suitability of monitor·
.. "'~ method~ for each slorage- facility when required. 7. InspHtion and rKOrd Ir;"pinl. Sched",les and procedurel for inspectin&
monilorine equipment, sa(clY iAndnnc:reency cquipmcnt.1k ptnnin" wI! de· ...
D-l
1991 UNIFORM FIRE CODE
velop and follow a wrinen inspection procedu~ acceptable 10 the chief for inspect. in&!he (aeiliry (or malfunclions and deterioralion. OptralOl'S eTTOr. poor houw:· k.eeping practices and di,,"hargel which could be causing, or could letld to, unau· lhoriz.cd discharles of hazardous ma1Crills. "These inspections shall be II a fre· quency appropriale to the possible deterioralion of equipmenl and facilitie5 and 10
the probability o(human error, and of sufficient frequeoc)" to delecl problem~ prior 10 a discharce. An inspection check sheet sha ll be developtd 10 be used inconjunc· lion with routine inspeclions. The cheel; sheet shall provide for the dale, lime and local ion of iMptCI ion; note- problem" and dates and limes of corrccti \Ie actions l&k. en: and include Ute name of tnc impeclor and the- counteriiignature of the- deli,· naled wety rJW\aler for the facility.
8. Employrc Irainin&. A training program appropriate to the Iypes and quanti· l~s of materials stored or u~d shall be conducte-d 10 prepare employee-ito safely handle hazardous materials on a dail}" b.iloi~ and during emerge-ncies. The Iraining program shall include :
(il Instruction in safe storage and handling of hazardous malerials, includina maintenance of monitorinl ~cords.
(ii) Instruction in emergency procedu~s ror leali;s, spills,lires or eAplosions, inc ludinl ShUldo~'n of operations and encualion procedufC"s.
(iii) Record·keeping procedures for documentinglrainin, .i~·en to employees.
9. Emtrlenc~' rHpoAsc. A description offacilit)· emergency procedures. Also include equipment teslins and maintenance, and securit), s}' ~tems descriptions.
Ic) H~1\1P Short Form-(\tinimal SIOra&e Sile). A facility shall qualify as a minimal Storaie site if lhe quantity or each haurdous milterial stored in ont or more facilitit s in an aggregate- quantity for the- facil ity is 500pound~ or les. for 501· Mh. 55 gallons or less for liquid~, or 200("ubic feet or k ss.l 5tandilrd tempetalu~ and prenu~ t5TP) for compressed ,ues and does 001 ucetd Ihe- threshold plan· ninl! quantity aslisttd in40C.F.R .. Pan 355. The applicant ror a pcnnit (or a faeil· it)" which qualifies as a minimal storage si le- is aIJO~'ed 10 file the shon (ann HMMP. Such plan shall include the rollo ..... in~ components:
I. General flK" ilit)" information,
2. A simple li~ dra"' ing oflhe facilily sho ..... ing the location of storage facilities and indicating tht haurd class or class.es and physical state ofthc haz.ardou~ mate· rials being stored,
3. Informationdcscribing thattM hazardous materials will be stored and han· died in a sare manner and will be appropriate!)' contained, stpMaled and meni· tOled, and
4. Assurance Ihal5ecuril), prrc:auttoru have been taken. employees have been appropriately trai~d to handle the huardous malerials and react 10 emerlenc:y liluations. adequatc labeling and "',aming signs an posted, adequate emcrrency equipment is maint3inc:d, and Iht disposal of haurdou" malerials will be in an.ppropriale- manner,
41'