safety case for the disposal of spent nuclear fuel …avainsanat - keywords safety case, spent...
TRANSCRIPT
POSIVA OY
Olki luoto
FIN-27160 EURAJOKI, F INLAND
Phone (02) 8372 31 (nat. ) , (+358-2-) 8372 31 ( int. )
Fax (02) 8372 3809 (nat. ) , (+358-2-) 8372 3809 ( int. )
POSIVA 2012-04
Safety Case for the Disposal of Spent Nuclear Fuel at Olkiluoto
- Performance Assessment 2012
February 2012
Posiva Oy

POSIVA 2012-04
February 2013
POSIVA OY
Olki luoto
FI-27160 EURAJOKI, F INLAND
Phone (02) 8372 31 (nat. ) , (+358-2-) 8372 31 ( int. )
Fax (02) 8372 3809 (nat. ) , (+358-2-) 8372 3809 ( int. )
Posiva Oy
Safety Case for the Disposal of Spent Nuclear Fuel at Olkiluoto
- Performance Assessment 2012

ISBN 978-951-652-185-8ISSN 1239-3096
Tekijä(t) – Author(s)
Posiva Oy
Toimeksiantaja(t) – Commissioned by
Posiva Oy
Nimeke – Title
SAFETY CASE FOR THE DISPOSAL OF SPENT NUCLEAR FUEL AT OLKILUOTO – PERFORMANCE ASSESSMENT 2012
Tiivistelmä – Abstract
Performance Assessment is a key element of Posiva Oy’s Safety Case “TURVA-2012” report portfolio and has the objective of presenting an assessment of the fulfilment of the performance targets and target properties during the expected evolution of the repository system. The repository system is designed so that, for the most likely lines of evolution of the disposal system, each component of the engineered barrier system (EBS) meets its performance targets and the host rock meets its target properties. In this case, the copper canisters (with iron inserts) remain intact for the whole assessment time frame of one million years and no releases of radionuclides occur.
The performance assessment takes into account the expected thermal, hydraulic, mechanical and chemical (THMC) evolution of the repository system. Evolution is driven by external loads, mostly driven by climatic changes, as well as by internal loads, chiefly resulting from the excavation and the emplacement of spent nuclear fuel and the EBS. The performance assessment also evaluates the fulfilment of performance targets and target properties taking into account uncertainties giving rise to possible lines of evolution that deviate from the most likely line of evolution. Also incidental deviations that could lead to the reduction of one or more safety functions are taken into account. Unlikely lines of evolution, including the possibility of disruptive events, are also identified. The impact of the incidental deviations and unlikely lines of evolution on the barriers and their safety functions are assessed. Whenever the assessment shows that a particular line of evolution could lead to radionuclide releases, it is transferred to Formulation of Radionuclide Release Scenarios, together with its associated uncertainties.
The performance assessment considers four time windows: the period of excavation and operation up to closure, the post-closure period up to the next 10,000 years; the period beyond 10,000 years until the end of the first glacial cycle and the period covering repeated glacial cycles up to one million years.
The assessment shows that the properties of the EBS and host rock are expected to meet the performance targets and target properties for the whole assessment period. However, considering the loads to which the repository system may be subjected during the first glacial cycle, there remains the possibility that the following deviations will affect a limited number of canister positions: an undetected penetrating defect in a canister, higher groundwater flow rate and groundwater composition outside the target range and locally reduced density in the buffer and backfill due, in particular, to chemical erosion caused by possible dilute groundwater conditions during ice-sheet retreat. There is also a small probability of canister failure due to rock shear in the event of a large earthquake. Successive glacial cycles will impose similar loads as those considered during the first glacial cycle: the potential canister corrosion rates will increase for deposition holes that experience buffer erosion and the probability of failure of one or more canisters due to rock shear will increase.
Posiva-raportti – Posiva Report Posiva Oy Olkiluoto FI-27160 EURAJOKI, FINLAND Puh. 02-8372 (31) – Int. Tel. +358 2 8372 (31)
Raportin tunnus – Report code
POSIVA 2012-04
Julkaisuaika – Date
February 2013
Avainsanat - Keywords
Safety case, spent nuclear fuel repository, Olkiluoto, KBS-3V, performance assessment
ISBN
ISBN 978-951-652-185-8 ISSN
ISSN 1239-3096 Sivumäärä – Number of pages
520 Kieli – Language
English
Although quality measures are enacted to ensure, as far as possible, that all canisters leaving the encapsulation plant will conform to the performance requirements, it cannot be ruled out, based on current knowledge, that a few canisters will have an initial penetrating defect at the time ofemplacement. If there is no reduction in buffer density due e.g. to chemical erosion, or if this reduction is limited, no canister failures due to copper corrosion are expected within one million years, even in the least favourable canister locations, and even taking a pessimistic view of uncertainties in flow conditions and the diffusion of sulphide ions to the copper canister. If, however, buffer density loss is such that advective conditions arise between the canister surfaceand the rock, then some corrosion failures are possible. The calculated number of canister failures depends on the model assumptions made. With a reference set of assumptions, including apessimistic sulphide concentration of 3 mg/L in the groundwater, and using the modelled distribution of groundwater flow between deposition holes, no canister failures are calculated to occur within the first glacial cycle, and that around 4−5 failures may occur in the million year time frame. A few canister failures is estimated to occur during the first glacial cycle if more pessimistic assumptions are made concerning the canister wall thickness, the copper corrosionarea, fracture aperture, high flows and duration of dilute conditions during glaciations, and up to a few tens of failures may occur over one million years. The possibility of a large earthquake leading to canister failure due to secondary movements on fractures, especially at a time of ice-sheetretreat, cannot totally be excluded. It is estimated that few tens of canisters are in positions suchthat they could potentially fail in such an event. However, the average annual probability of an earthquake large enough to lead to canister failure is very low (in the order of 10-7), but the possibility of such an event cannot be neglected over a one million year time frame.
For these reasons, canister failure due to (i), an initial penetrating defect, (ii) corrosion inconjunction with chemical erosion of the buffer and (iii) rock shear in the event of a largeearthquake are propagated to Formulation of Radionuclide Release Scenarios and analysed inAssessment of Radionuclide Release Scenarios for the Repository System.

Tekijä(t) – Author(s)
Posiva Oy
Toimeksiantaja(t) – Commissioned by
Posiva Oy
Nimeke – Title
SAFETY CASE FOR THE DISPOSAL OF SPENT NUCLEAR FUEL AT OLKILUOTO – TOIMINTAKYKYANALYYSI
Tiivistelmä – Abstract
Performance Assessment on osa Posiva Oy:n TURVA-2012-turvallisuusperustelun raporttisalkkua, ja sen tarkoituksena on arvioida teknisten vapautumisteiden (EBS) toimintakykytavoitteiden ja kallion tavoiteominaisuuksien täyttymistä maanalaisen loppusijoitusjärjestelmän odotettavissa olevan kehityskulun aikana. Loppusijoitusjärjestelmä on suunniteltu niin, että kaikkein todennäköisimpien kehityskulkujen osalta teknisen vapautumisestejärjestelmän (EBS) jokainen komponentti täyttää toimintakykytavoitteensa ja kallioperä tavoiteominaisuutensa. Tällöin kupari-rautakapselit pysyvät ehjinä koko miljoonan vuoden tarkasteluajanjakson ajan, eikä radionuklidien vapautumista tapahdu.
Toimintakykyanalyysi tarkastelee maanalaisen loppusijoitusjärjestelmän termistä, hydraulista, mekaanista ja kemiallista kehityskulkua. Kehitykseen vaikuttavat ulkoiset kuormitukset, jotka ovat useimmiten seurausta ilmastonmuutoksista, sekä sisäiset kuormitukset, joita pääosin aiheuttavat louhinta sekä käytetyn ydinpolttoaineen ja EBS:n asentaminen. Toimintakykyanalyysi tarkastelee myös toimintakykytavoitteiden ja tavoiteominaisuuksien täyttymistä ottamalla huomioon todennäköisimpään kehityskulkuun liittyvät epävarmuudet sekä yhden tai useamman turvallisuustoiminnon heikkenemiseen mahdollisesti johtavat satunnaiset poikkeamat. Lisäksi tunnistetaan epätodennäköisiä kehityskulkuja, mukaan lukien pitkäaikaisturvallisuutta heikentävien tapahtumien mahdollisuus, sekä arvioidaan satunnaisten poikkeamien ja epätodennäköisten kehityskulkujen vaikutuksia vapautumisesteisiin ja niiden turvallisuustoimintoihin. Ne kehityskulut, jotka arvioinnin perusteella voivat johtaa radionuklidien vapautumiseen, sekä näihin kehityskulkuihin liittyvät epävarmuudet käsitellään edelleen raportissa Formulation of Radionuclide Release Scenarios.
Toimintakykyanalyysissa tarkastellaan neljää ajanjaksoa: louhinta- ja käyttövaihetta loppusijoitustilojen sulkemiseen asti, sulkemisen jälkeistä vaihetta ensimmäisen 10 000 vuoden ajan, ajanjaksoa 10 000 vuodesta ensimmäisen glasiaalisyklin päättymiseen asti sekä toistuvien glasiaalisyklien kattamaa ajanjaksoa miljoonaan vuoteen asti.
Arviointi osoittaa, että EBS:n ja kallioperän ominaisuudet todennäköisesti täyttävät toimintakykytavoitteet ja tavoiteominaisuudet koko tarkasteluajanjakson ajan. Kun otetaan huomioon ensimmäisen glasiaalisyklin aikana esiintyvät loppusijoitusjärjestelmään kohdistuvat kuormitukset, seuraavat poikkeamat voivat mahdollisesti vaikuttaa joihinkin kapselipaikkoihin: havaitsematta jäänyt kapselin seinämän lävistävä vika, pohjaveden suurempi virtaama ja pohjaveden tavoitearvoista poikkeava koostumus sekä puskurin ja täytön paikallisesti alentunut tiheys etenkin jäätikön perääntymisvaiheessa mahdollisesti esiintyvän laimean pohjaveden aiheuttaman kemiallisen eroosion seurauksena. On myös olemassa pieni kapselivaurion mahdollisuus suureen maanjäristykseen liittyvien kallioliikuntojen vuoksi. Useat peräkkäiset glasiaalisyklit kuormittavat loppusijoitusjärjestelmää samoin kuin ensimmäinenkin sykli: kapselin potentiaaliset korroosionopeudet kasvavat sijoitusrei’issä, joissa tapahtuu puskurin eroosiota, ja lisäksi kasvaa kallioliikuntojen aiheuttamien kapselivaurioiden todennäköisyys.
Posiva-raportti – Posiva Report Posiva Oy Olkiluoto FI-27160 EURAJOKI, FINLAND Puh. 02-8372 (31) – Int. Tel. +358 2 8372 (31)
Raportin tunnus – Report code
POSIVA 2012-04
Julkaisuaika – Date
Helmikuu 2013

Avainsanat - Keywords
Turvallisuusperustelu, käytetty ydinpolttoaine, Olkiluoto, KBS-3V, toimintakykyanalyysi
ISBN
ISBN 978-951-652-185-8 ISSN
ISSN 1239-3096 Sivumäärä – Number of pages
520 Kieli – Language
Englanti
Vaikka laadunhallintatoimin pyritään varmistamaan, että kaikki kapselointilaitokselta lähtevät kapselit ovat toimintakykyvaatimusten mukaisia, nykytietämyksen perusteella ei voida sulkea pois sitä mahdollisuutta, että muutamassa kapselissa on alun perin lävistävä vika. Jos puskurin tiheys ei merkittävästi alene esim. kemiallisen eroosion vuoksi, yhdenkään kapselin ei odoteta rikkoutuvan kuparin korroosion vuoksi miljoonan vuoden aikana edes kaikkein vähiten suotuisissa sijoitusrei’issä, vaikka käytetään pessimistisiä oletuksia virtausolosuhteista ja sulfidi-ionien diffuusiosta kuparikapselin pinnalle. Mikäli puskurin tiheyden aleneminen johtaa advektiivisiin olosuhteisiin puskurissa, korroosio voi aiheuttaa kapselin rikkoutumisen. Rikkoutuneiden kapseleiden arvioitu määrä riippuu tehdyistä mallioletuksista. Käyttäen referenssioletuksia, joihin sisältyy mm. pohjaveden pessimistinen sulfidipitoisuus 3 mg/l, ja käyttäen pohjaveden virtauksen mallinnettua jakautumaa eri sijoitusrei’issä, ensimmäisen glasiaalisyklin aikana ei ole odotettavissa yhtään kapselin rikkoutumista, ja miljoonan vuoden aikana noin 4−5 rikkoutunutta kapselia. Käytettäessä pessimistisempiä oletuksia kapselin seinämän paksuudesta, korroosion pinta-alasta, rakojen avaumasta, suurista virtaamista sekä jäätiköitymisen aikaisten laimeiden olosuhteiden kestosta, muutama kapseli rikkoutuu ensimmäisen glasiaalisyklin aikana ja enintään joitakin kymmeniä miljoonan vuoden aikana. Kapselivaurioihin johtavan suuren maanjäristyksen mahdollisuutta ei voida kokonaan sulkea pois, etenkään jäätikön perääntymisvaiheessa. Arvioiden mukaan joitakin kymmeniä kapseleita sijaitsee paikoissa, joissa ne voivat mahdollisesti rikkoutua tällaisen tapahtuman sattuessa. Vaikka kapseliin rikkoutumiseen johtavien suurten maanjäristysten keskimääräinen vuotuinen todennäköisyys on hyvin pieni (luokkaa 10-7), tällaisen tapahtuman mahdollisuutta ei voida jättää huomiotta miljoonan vuoden ajanjaksolla. Tämän vuoksi kapselin rikkoutuminen johtuen (1) alun perin lävistävästä viasta, (2) puskurinkemialliseen eroosioon liittyvästä korroosiosta ja (3) suuren maanjäristyksen aiheuttamastakalliosiirroksesta huomioidaan Formulation of Radionuclide Release Scenarios -raportissa ja käsitellään Assessment of Radionuclide Release Scenarios for the Repository System -raportissa.
1
TABLE OF CONTENTS
ABSTRACT
TIIVISTELMÄ
TABLE OF CONTENTS .................................................................................................. 1
ABBREVIATIONS AND DEFINITIONS .......................................................................... 7
FOREWORD ................................................................................................................ 13
1 INTRODUCTION ................................................................................................. 15 1.1 Background ................................................................................................ 15 1.2 The KBS-3 method ..................................................................................... 15 1.3 Posiva’s programme for developing a KBS-3 repository at Olkiluoto ......... 16 1.4 Regulatory context for the management of spent nuclear fuel ................... 18 1.5 Safety concept and safety functions .......................................................... 19 1.6 TURVA-2012 Safety Case portfolio ........................................................... 21 1.7 Quality assurance ...................................................................................... 26 1.8 Scope and structure of the present report .................................................. 28
2 PERFORMANCE REQUIREMENTS................................................................... 31 2.1 Performance targets and target properties ................................................ 32
2.1.1 Canister ........................................................................................ 33 2.1.2 Buffer ............................................................................................ 34 2.1.3 Deposition tunnel backfill and plugs ............................................. 36 2.1.4 Closure ......................................................................................... 39 2.1.5 Host rock ...................................................................................... 40
2.2 RSC, design requirements and specifications ........................................... 42 2.2.1 Rock Suitability Classification ....................................................... 42 2.2.2 Design requirements .................................................................... 43 2.2.3 Design specifications.................................................................... 43
3 INITIAL STATE .................................................................................................... 45 3.1 Site description ........................................................................................... 45 3.2 Underground openings ............................................................................... 74 3.3 Canister ...................................................................................................... 79 3.4 Buffer .......................................................................................................... 82 3.5 Backfill and plug ......................................................................................... 87
3.5.1 Deposition tunnel backfill.............................................................. 87 3.5.2 Deposition tunnel plug .................................................................. 92
3.6 Closure ....................................................................................................... 95
4 EVOLUTION FEPS AND REPOSITORY SYSTEM PERFORMANCE ............... 99 4.1 Climate evolution considered for the PA-report ......................................... 99 4.2 Evolution FEPs affecting host rock properties ......................................... 101 4.3 Evolution FEPs affecting buffer and backfill performance ........................ 102 4.4 Evolution FEPs affecting closure ............................................................. 103 4.5 Evolution FEPs affecting the canister ...................................................... 104 4.6 Methodology for assessing the repository performance .......................... 105
5 REPOSITORY SYSTEM PERFORMANCE − EXCAVATION AND OPERATIONAL PHASE .................................................................................... 107 5.1 Hydraulic and geochemical evolution of the geosphere ........................... 107
5.1.1 Overview and target properties potentially affected ................... 107 5.1.2 Groundwater flow ....................................................................... 108

2
5.1.3 Groundwater composition .......................................................... 120 5.1.4 Summary, uncertainties and issues that need propagation ....... 135
5.2 Thermal evolution of the near field ........................................................... 137 5.2.1 Overview and performance targets potentially affected ............. 137 5.2.2 Temperature evolution in the near field ...................................... 138 5.2.3 Summary, uncertainties and issues that need propagation ....... 139
5.3 Rock mechanics evolution in the near field .............................................. 140 5.3.1 Overview and performance targets potentially affected ............. 140 5.3.2 EDZ ............................................................................................ 140 5.3.3 Excavation induced rock damage .............................................. 141 5.3.4 Reactivation of fractures............................................................. 144 5.3.5 Summary, uncertainties and issues that need propagation ....... 144
5.4 Mechanical and hydraulic evolution of the buffer and backfill .................. 145 5.4.1 Overview and performance targets potentially affected ............. 145 5.4.2 Piping and erosion...................................................................... 147 5.4.3 Summary, uncertainties and issues that need propagation ....... 157
5.5 Geochemical evolution of the buffer and backfill ...................................... 158 5.5.1 Overview and performance targets potentially affected ............. 158 5.5.2 Oxygen depletion and changes in pH ........................................ 159 5.5.3 Formation of colloids .................................................................. 161 5.5.4 Effect of cementitious leachates on the near field ...................... 161 5.5.5 Leaching of other sealing materials - Silica sol .......................... 170 5.5.6 Summary, uncertainties and issues that need propagation ....... 171
5.6 Mechanical, hydraulic and geochemical evolution of closure .................. 172 5.6.1 Overview and performance targets potentially affected ............. 172 5.6.2 Evolution of closure backfill during operational period ............... 173 5.6.3 Evolution of the concrete components in the closure plugs
and the deposition tunnel plug during the operational period ..... 173 5.6.4 Summary, uncertainties and issues that need propagation ....... 177
5.7 Canister corrosion .................................................................................... 177 5.7.1 Overview and performance targets potentially affected ............. 177 5.7.2 Atmospheric corrosion before emplacement .............................. 178 5.7.3 Corrosion due to handling and emplacement ............................. 178 5.7.4 Stress corrosion cracking ........................................................... 178 5.7.5 Internal corrosion due to radiolysis of residual water ................. 179 5.7.6 External corrosion in unsaturated buffer .................................... 180 5.7.7 Aerobic corrosion in the deposition hole .................................... 181 5.7.8 Copper corrosion in highly saline groundwaters ........................ 182 5.7.9 Summary, uncertainties and issues that need propagation ....... 183 5.7.10 Mechanical impacts on canister ................................................. 183
5.8 Subcriticality ............................................................................................. 184 5.9 Summary .................................................................................................. 185
5.9.1 Summary of disposal system evolution ...................................... 185 5.9.2 “State” of components with regard to safety functions and
performance targets ................................................................... 189 5.9.3 Assessment whether all FEPs relevant during the
operational period and FEP interactions have been assessed .. 189
6 REPOSITORY SYSTEM PERFORMANCE − POST-CLOSURE EVOLUTION OVER THE NEXT ~10,000 YEARS ............................................ 191 6.1 Hydraulic and geochemical evolution of the geosphere ........................... 191
6.1.1 Overview and target properties potentially affected ................... 191 6.1.2 Groundwater flow ....................................................................... 192

3
6.1.3 Groundwater composition .......................................................... 200 6.1.4 Summary, uncertainties and issues that need propagation ....... 212
6.2 Thermal evolution of the near field ........................................................... 213 6.2.1 Overview and performance targets potentially affected ............. 213 6.2.2 Summary, uncertainties and issues that need propagation ....... 213
6.3 Mechanical evolution of the rock .............................................................. 214 6.3.1 Overview and performance targets potentially affected ............. 214 6.3.2 Thermally induced spalling ......................................................... 214 6.3.3 Reactivation of fractures............................................................. 214 6.3.4 Creep ......................................................................................... 214 6.3.5 Summary, uncertainties and issues that need propagation ....... 214
6.4 Mechanical and hydraulic evolution of the buffer and backfill .................. 215 6.4.1 Overview and performance targets potentially affected ............. 215 6.4.2 Saturation process ..................................................................... 215 6.4.3 Swelling and homogenisation..................................................... 222 6.4.4 Homogenisation of buffer and backfill ........................................ 227 6.4.5 Swelling of saturated buffer bentonite into saturated backfill ..... 240 6.4.6 Summary, uncertainties and issues that need propagation ....... 244
6.5 Geochemical evolution of the buffer ......................................................... 244 6.5.1 Overview and performance targets potentially affected ............. 244 6.5.2 Geochemical evolution of buffer at the expected range of
elevated temperatures................................................................ 245 6.5.3 Montmorillonite transformation ................................................... 248 6.5.4 Cementation induced during the thermal stage .......................... 252 6.5.5 Buffer porewater and cation exchanger chemistry after
saturation ................................................................................... 253 6.5.6 Microbial activity in the buffer ..................................................... 258 6.5.7 Sulphide fluxes to the buffer ....................................................... 260 6.5.8 Effect of cementitious leachates on the buffer ........................... 261 6.5.9 Summary, uncertainties and issues that need propagation ....... 262
6.6 Geochemical evolution of the backfill ....................................................... 263 6.6.1 Overview and performance targets potentially affected ............. 263 6.6.2 Backfill porewater chemistry after saturation .............................. 263 6.6.3 Production of sulphide and microbial activity in backfill .............. 265 6.6.4 Cement-clay interactions in the backfill ...................................... 270 6.6.5 Iron-clay interactions in the backfill ............................................ 270 6.6.6 Summary, uncertainties and issues that need propagation ....... 272
6.7 Mechanical, hydraulic and geochemical evolution of the closure components .............................................................................................. 273 6.7.1 Overview and performance targets potentially affected ............. 273 6.7.2 Evolution of the closure backfill material .................................... 273 6.7.3 Evolution of the closure plugs and the deposition tunnel
plugs ........................................................................................... 274 6.7.4 Summary, uncertainties and issues that need propagation ....... 275
6.8 Canister corrosion .................................................................................... 275 6.8.1 Overview and performance targets potentially affected ............. 275 6.8.2 Corrosion during buffer saturation .............................................. 276 6.8.3 Corrosion after buffer saturation – sulphide corrosion ............... 277 6.8.4 External canister corrosion due to radiolysis of buffer
porewater ................................................................................... 280 6.8.5 Summary, uncertainties and issues that need propagation ....... 280
6.9 Mechanical loading on canister ................................................................ 281

4
6.9.1 Overview and performance targets potentially affected ............. 281 6.9.2 Isostatic loads ............................................................................ 281 6.9.3 Uneven bentonite swelling pressure .......................................... 282 6.9.4 Load combination ....................................................................... 284 6.9.5 Assessment of rock shear load .................................................. 285 6.9.6 Summary, uncertainties and issues that need propagation ....... 285
6.10 Sub-criticality ............................................................................................ 285 6.11 Summary .................................................................................................. 285
6.11.1 Summary of system evolution .................................................... 285 6.11.2 “State” of components with regard to safety functions and
performance targets ................................................................... 289 6.11.3 Assessment whether all FEPs and FEP interactions have
been assessed ........................................................................... 290
7 REPOSITORY SYSTEM PERFORMANCE − LONG-TERM EVOLUTION ....... 291 7.1 Hydraulic and geochemical evolution of the geosphere ........................... 291
7.1.1 Overview and target properties potentially affected ................... 291 7.1.2 Groundwater flow ....................................................................... 292 7.1.3 Groundwater composition .......................................................... 299 7.1.4 Summary, uncertainties and issues that need propagation ....... 314
7.2 Rock mechanics ....................................................................................... 316 7.2.1 Overview and performance targets potentially affected ............. 316 7.2.2 Stresses during a glacial cycle ................................................... 316 7.2.3 Reactivation of fractures and effects on fracture
transmissivity .............................................................................. 319 7.2.4 Faulting and rock shear .............................................................. 319 7.2.5 Summary, uncertainties and issues that need propagation ....... 330
7.3 Freezing/thawing of buffer and backfill ..................................................... 330 7.3.1 Overview and performance targets potentially affected ............. 330 7.3.2 Effect of decreasing temperatures on buffer and backfill
performance ............................................................................... 331 7.3.3 Summary, uncertainties and issues that need propagation ....... 336
7.4 Geochemical evolution of the buffer and backfill ...................................... 336 7.4.1 Overview and performance targets potentially affected ............. 336 7.4.2 Evolution of porewater chemistry and salinity of the buffer ........ 337 7.4.3 Evolution of porewater chemistry of backfill ............................... 338 7.4.4 Effect of alkaline leachates on buffer and backfill ...................... 338 7.4.5 Long-term stability of montmorillonite ......................................... 338 7.4.6 Effect of canister corrosion on buffer .......................................... 341 7.4.7 Microbial processes and effects of organic materials ................. 342 7.4.8 Summary, uncertainties and issues that need propagation ....... 342
7.5 Chemical erosion of the buffer and backfill .............................................. 343 7.5.1 Overview and performance targets potentially affected ............. 343 7.5.2 Chemical erosion........................................................................ 343 7.5.3 Chemical erosion experiments ................................................... 346 7.5.4 Chemical erosion modelling ....................................................... 347 7.5.5 Development of advective conditions in the buffer ..................... 352 7.5.6 Data used for application of the model to the repository at
Olkiluoto ..................................................................................... 352 7.5.7 Model results for buffer and backfill erosion ............................... 356 7.5.8 Uncertainties .............................................................................. 361 7.5.9 Summary, uncertainties and issues that need propagation ....... 362
7.6 Evolution of the closure components ....................................................... 362
5
7.6.1 Overview and performance targets potentially affected ............. 362 7.6.2 Evolution of the cementitious components in the deposition
tunnel and closure plugs ............................................................ 363 7.6.3 Chemical erosion of closure backfill material ............................. 364 7.6.4 Freezing and thawing ................................................................. 364 7.6.5 Impact of partial losing of the closure ......................................... 365 7.6.6 Summary, uncertainties and issues that need propagation ....... 365
7.7 Canister corrosion .................................................................................... 366 7.7.1 Overview and performance targets potentially affected ............. 366 7.7.2 Corrosion of the canister surrounded by an intact buffer ........... 366 7.7.3 Canister corrosion in the case of a partially eroded buffer ......... 367 7.7.4 Summary, uncertainties and issues that need propagation ....... 371
7.8 Mechanical impacts on the canister ......................................................... 372 7.8.1 Overview and performance targets potentially affected ............. 372 7.8.2 Isostatic load .............................................................................. 372 7.8.3 Freezing ..................................................................................... 372 7.8.4 Rock shear ................................................................................. 372 7.8.5 Load combination ....................................................................... 374 7.8.6 Assessment of load definitions ................................................... 377 7.8.7 Summary, uncertainties and issues that need propagation ....... 378
7.9 Subcriticality ............................................................................................. 379 7.10 Summary .................................................................................................. 380
7.10.1 Summary of system evolution .................................................... 380 7.10.2 “State” of components with regard to safety functions and
performance targets ................................................................... 384 7.10.3 Assessment whether all FEPs relevant in long term and FEP
interactions have been assessed ............................................... 385
8 DISCUSSION ON THE EVOLUTION FOR REPEATED GLACIAL CYCLES ... 387 8.1 Buffer erosion due to dilute water conditions ........................................... 387 8.2 Considerations concerning canister corrosion ......................................... 387
8.2.1 Corrosion of the canister surrounded by an intact buffer ........... 387 8.2.2 Canister corrosion in the case of a partially eroded buffer ......... 389 8.2.3 Corrosion from additional potential processes ........................... 392
8.3 Rock shear movements ........................................................................... 393 8.4 Mechanical impact on the canister ........................................................... 394 8.5 Sub-criticality ............................................................................................ 394 8.6 Summary .................................................................................................. 395
9 FULFILMENT OF PERFORMANCE TARGETS AND TARGET PROPERTIES ................................................................................................... 397 9.1 Scope of chapter ...................................................................................... 397 9.2 Host rock .................................................................................................. 397
9.2.1 Summary of time-dependent loads that may affect the target properties ................................................................................... 397
9.2.2 Conditions that may lead to deviations from the target properties ................................................................................... 399
9.2.3 Uncertainties in the conditions that may lead to deviations in the fulfilment of target properties ................................................ 400
9.2.4 Feedback to scenario formulation and analysis ......................... 405 9.3 Closure ..................................................................................................... 405
9.3.1 Summary of time-dependent loads that may affect the performance targets ................................................................... 405
6
9.3.2 Conditions that may lead to deviations from the performance targets ........................................................................................ 406
9.3.3 Uncertainties that may lead to deviations in the fulfilment of performance targets ................................................................... 406
9.3.4 Feedback to scenario formulation and analysis ......................... 407 9.4 Buffer and backfill ..................................................................................... 407
9.4.1 Summary of time-dependent loads that may affect the performance targets ................................................................... 407
9.4.2 Conditions that may lead to deviations from the performance targets ........................................................................................ 410
9.4.3 Uncertainties that may lead to deviations in the fulfilment of performance targets ................................................................... 410
9.4.4 Feedback to scenario formulation and analysis ......................... 414 9.5 Canister .................................................................................................... 414
9.5.1 Summary of time-dependent loads that may affect the performance targets ................................................................... 414
9.5.2 Conditions that may lead to deviations from the performance targets ........................................................................................ 415
9.5.3 Uncertainties that may lead to deviations in the fulfilment of performance targets ................................................................... 416
9.5.4 Feedback to scenario formulation and analysis ......................... 418
10 CONCLUSIONS ................................................................................................ 419 10.1 Fulfilment of performance targets ............................................................ 419 10.2 Input to scenario formulation and analysis ............................................... 420 10.3 Limitations and uncertainties – need for further R&D .............................. 421
10.3.1 Rock ........................................................................................... 421 10.3.2 Closure ....................................................................................... 422 10.3.3 Buffer and backfill ....................................................................... 422 10.3.4 Canister ...................................................................................... 424
10.4 Statement of confidence .......................................................................... 424
REFERENCES ........................................................................................................... 427
APPENDICES ............................................................................................................. 463
APPENDIX A: SELECTED INFLOW CASES FOR BACKFILL AND BUFFER PERFORMANCE .............................................................................................. 463
APPENDIX B: MODEL USED FOR CORROSION FAILURE CALCULATIONS ........ 467
APPENDIX C: OXYGEN CONSUMPTION IN THE BACKFILL UNDER SATURATED AND UNSATURATED CONDITIONS - THE ROLE OF PYRITE ............................................................................................................. 477
APPENDIX D: SUMMARY OF THE MODELS USED FOR ANALYSING HYDROGEOLOGICAL AND HYDROGEOCHEMICAL EVOLUTION ............... 491

7
ABBREVIATIONS AND DEFINITIONS
3DEC A rock mechanics code, a three-dimensional numerical program based on distinct element method for discontinuum modelling.
AA Autotrophic Acetogens.
ANME ANaerobic MEthanotrophic archaea.
AOM Anaerobic Oxidation of Methane.
AP After Present.
Å-P-P Åland–Paldis–Pskov seismic belt.
BBM Barcelona Basic Model, a critical state model that reproduces the mechanical behaviour of unsaturated soils under different boundary conditions.
BFZ Brittle Fault Zone.
BP Before Present.
BU Burn-up.
BWR Boiling Water Reactor (Olkiluoto 1&2).
CCC Critical Coagulation Concentration.
CEC Cation Exchange Capacity.
CFM Colloid Formation and Migration (experiment in Grimsel URL).
CHAB Culturable Heterotrophic Aerobic Bacteria.
CODE BRIGHT COupled DEformation BRIne, Gas and Heat Transport, the finite element code used to model the thermo-hydraulic behaviour of clay.
COx Callovo-Oxfordian.
CSH Calcium Silicate Hydrate.
CuOF Oxygen Free, High Conductivity Copper.
DDL Diffuse Double Layer.
DFN Discrete Fracture Network (an approach used in groundwater flow modelling).
DIC Dissolved Inorganic Carbon.
DiP (Government) Decision-in-Principle.
Disposal facility All underground tunnels, shafts and deposition holes (including the repository) + above-ground buildings except the encapsulation plant. In this report, the above-ground parts are not discussed, as they are assumed to be

8
dismantled upon closure and thereby have no effect on the long-term safety.
Disposal system Repository system + surface environment.
DLVO Derjaguin, Landau, Verwey, Overbeek.
DNA DeoxyriboNucleic Acid.
DOC Dissolved Organic Carbon.
DP Dual Porosity groundwater modelling approach.
DZ-path Release path with exit from a deposition hole to the escavation damaged zone (EDZ) below the tunnel floor.
EBS Engineered Barrier System.
EBW Electron Beam Welding.
ECPM Equivalent Continuous Porous Medium.
EDZ Excavation Damaged Zone; section of the rock that is irreversibly damaged by the excavation of the tunnel.
Eh Redox potential.
FEP Feature, Event or Process (or as plural FEPs: Features, Events and Processes).
F-path Release path with exit from a deposition hole to a host-rock fracture intersecting the deposition hole.
FPI Full Perimeter Intersection, used to describe fracture extent in underground openings.
FSW Friction Stir Welding.
GD Government Decree.
gw Groundwater.
HZ Hydrogeological Zone. A site scale hydrogeological zone is a planar or nearly planar formation that through elevated transmissivities and frequency of interconnected fractures allows a continuous groundwater flow to concentrate within it over distances of several hundreds of metres.
IRB Iron-Reducing Bacteria.
K Hydraulic conductivity.
KBS (Kärnbränslesäkerhet). The method for deep geological disposal of spent nuclear fuel based on multiple barriers.
KBS-3H (Kärnbränslesäkerhet 3-Horisontell). Design alternative of the KBS-3 method in which several spent nuclear fuel canisters are emplaced horizontally in each deposition drift.
9
KBS-3V (Kärnbränslesäkerhet 3-Vertikal). The reference design alternative of the KBS-3 method, in which the spent nuclear fuel canisters are emplaced in individual vertical deposition holes.
KTM Finnish Ministry of Trade and Industry.
L/ILW Low and Intermediate Level (radioactive) Waste.
LASGIT LArge Scale Gas Injection Test.
LDF Layout Determining Feature.
LGC Last Glacial Cycle.
LIBD Laser-Induced Breakdown Detection.
LO1−2 Loviisa reactors 1 and 2.
masl Metres above sea level.
MPN Most Probable Number.
MRB Manganese-Reducing Bacteria.
MX-80 Commercial name of the reference buffer bentonite. A high grade sodium bentonite from Wyoming, U.S., with a montmorillonite content of 75−90 %.
NDT Non-Destructive Testing.
OL1−2 Olkiluoto 1 and 2 reactors.
OL3 Olkiluoto 3 reactor.
OL4 Olkiluoto 4 reactor to be constructed at Olkiluoto. Expected to be similar to OL3 in TURVA-2012 safety case.
OL-KR Olkiluoto (deep) drill hole.
OLSO Saline oxic reference water (synthetic water).
ONKALO Underground research facility constructed at Olkiluoto.
ONK-PH ONKALO (see ONKALO) pilot hole.
ONK-PVA ONKALO (see ONKALO) groundwater station.
OPA Opalinus Clay – a candidate host rock for the Swiss repository for long-lived wastes. It is a Mesozoic (180 Ma old) sediment, described as an indurated claystone, occurring in the Zürcher Weinland.
OPC Ordinary Portland Cement.
PA Performance Assessment.
PFL Posiva Flow Log. Device for quick and reliable characterisation of flow-yielding fractures and other structures in bedrock.
10
PHREEQC Reactive transport modelling code used for assessing the evolution of the groundwater chemistry.
POTTI Database at Posiva.
QA Quality Assurance.
QC Quality Coordinator.
Repository Deposition tunnels + deposition holes.
Repository system Spent nuclear fuel, canister, buffer, backfill (deposition tunnel backfill + deposition tunnel end plug), closure components and host rock. Excludes the surface environment.
RH Relative Humidity.
RN Radionuclide.
RSC Rock Suitability Classification system.
RTD Research, Technical Development and Design, see also TKS.
SAFCA The organisation of the TURVA-2012 safety case production process.
SCC Stress Corrosion Cracking.
SFQZ Southern Finland Quiet Zone.
SFR Sparsely Fractured Rock.
SI Saturation Index.
SKB Swedish Nuclear Waste Management Company.
SR Sulphate Resistant (cement).
SRB Sulphate-Reducing Bacteria.
SR-Can SR-Can safety assessment for a repository in Sweden.
SR-Site SR-Site safety assessment for a repository in Forsmark.
SS Solid Solution.
STUK Finnish Radiation and Nuclear Safety Authority.
SURE SUlphate REduction experiment (in ONKALO).
TDS Total Dissolved Solids.
TDZ-path Release path with exit from the deposition hole to the tunnel backfill above the deposition hole.
TEM Ministry of Employment and the Economy, previously Ministry of Trade and Industry (KTM).
THC Thermal, Hydrological, Chemical.
THM Thermal, Hydrological, Mechanical.
11
THMC Thermal-Hydrological-Mechanical-Chemical.
TKS Finnish equivalent for RTD (see RTD).
TOUGHREACT An integral finite difference code used in thermo-hydro-geochemical modelling.
TURVA-2012 Name of Posiva’s safety case 2012, TURVA means safety.
TVO Teollisuuden Voima Oyj. Owner of the Olkiluoto power plants and co-owner of Posiva Oy.
UCS Uniaxial Compressive Strength.
URL Underground Research Laboratory.
VAHA Requirements management system at Posiva.
VTT VTT Technical Research Centre of Finland.
VVER-440 Pressurised water reactor type at Loviisa.
YJH Finnish abbreviation for Nuclear Waste Management.
YVL STUK’s (see STUK) regulatory guide series for nuclear facilities.

12

13
FOREWORD
This report has been compiled and edited by Johan Andersson (Streamflow AB, Sweden), Margit Snellman, Pirjo Hellä, Nuria Marcos, Barbara Pastina and Annika Hagros (all Saanio & Riekkola Oy) and the other contributors in the Performance Assessment group; Paul Wersin (UniBern, Switzerland), Paul Smith (SAM Swizerland GmbH), Paula Keto, Tim Schatz and Xavier Pintado (all B+Tech), Heikki Raiko (VTT), Jarkko Kyllönen (Fortum Power and Heat Oy), Kari Koskinen, Petri Korkeakoski, Petteri Pitkänen (all Posiva Oy) and Heini Laine and Ursula Sievänen (both Saanio & Riekkola Oy).
The work was co-ordinated by the Performance Assessment group and supervised by the SAFCA project group consisting of Ari Ikonen and Marja Vuorio (Posiva Oy), Pirjo Hellä, Thomas Hjerpe, Heini Laine, Nuria Marcos, Barbara Pastina and Margit Snellman (all Saanio & Riekkola Oy), and Paul Smith (SAM Switzerland GmbH).
The report was reviewed at different stages by Juhani Vira and Lasse Koskinen (both Posiva Oy), as well as the various report contributors mentioned above.
The final report review was carried out by the following individuals: Mike Thorne (Mike Thorne and Associates Limited, UK), Ivars Neretnieks (KTH, Sweden), Mark Jensen (NWMO, Canada) and Jan-Olof Selroos and Allan Hedin (both SKB, Sweden). Their comments on the report are appreciated.

14

15
1 INTRODUCTION
1.1 Background
On assignment by its owners, Fortum Power and Heat Oy and Teollisuuden Voima Oyj, Posiva Oy will manage the disposal of spent nuclear fuel from the Loviisa and Olkiluoto nuclear power plants. At Loviisa, two pressurised water reactors (VVER-440) are in operation; at Olkiluoto, two boiling water reactors are operating and one pressurised water reactor is under construction. Plans exist also for a fourth nuclear power unit at Olkiluoto. At both sites there are facilities available for interim storage of the spent nuclear fuel before disposal.
In 2001, the Parliament of Finland endorsed a Decision-in-Principle (DiP) whereby the spent nuclear fuel generated during the operational lives of the operating Loviisa and Olkiluoto reactors will be disposed in a geological repository at Olkiluoto. This first DiP allowed for the disposal of a maximum amount of spent nuclear fuel corresponding to 6500 tonnes of uranium (tU) initially loaded into the reactors. Subsequently, additional DiPs were issued in 2002 and 2010 allowing extension of the repository (up to 9000 tU) to also accommodate spent nuclear fuel from the operations of the OL3 reactor and the planned OL4 reactor. OL4 spent nuclear fuel is handled in the TURVA-2012 safety case assuming it to be similar to OL3 spent nuclear fuel.
1.2 The KBS-3 method
The 2001 DiP states that disposal of spent nuclear fuel shall take place in a geological repository at the Olkiluoto site, developed according to the KBS-3 method. In the KBS-3 method, spent nuclear fuel encapsulated in water-tight and gas-tight sealed copper canisters with a mechanical-load-bearing insert is emplaced deep underground in a geological repository constructed in the bedrock. According to the DiP, the repository shall be located at minimum depth of 400 m. In Posiva’s current repository design, the repository is constructed on a single level and the floor of the deposition tunnels is at a depth of 400−450 m in the Olkiluoto bedrock.
Posiva’s reference design in the construction license application is based on vertical emplacement of the spent nuclear fuel canisters (KBS-3V; Figure 1-1). Currently, an alternative horizontal emplacement design (KBS-3H) is being jointly developed by the Swedish Nuclear Fuel and Waste Management Company (SKB) and Posiva.
The KBS-3V design is based on a multi-barrier principle in which copper-iron canisters containing spent nuclear fuel are emplaced vertically in individual deposition holes bored in the floors of the deposition tunnels (see inset in Figure 1-1). The canisters are to be surrounded by a swelling clay buffer material that separates them from the bedrock. The deposition tunnels and the central tunnels and the other underground openings are to be backfilled with materials of low permeability.

16
Figure 1-1. Schematic illustration of the KBS-3V design.
1.3 Posiva’s programme for developing a KBS-3 repository at Olkiluoto
The Olkiluoto site, located on the coast of south-western Finland (Figure 1-2), has been investigated for over 25 years. During the past few years, key activities in the programme have been related to:
completion of the investigations for site confirmation at Olkiluoto both through analyses of data from surface-drilled characterisation holes and surveys, and studies carried out in the ONKALO underground research facility,
the design of the required surface and sub-surface disposal facilities,
the development of the selected disposal technology to the level required for the construction license application, and
demonstration of the long-term safety of the disposal of spent nuclear fuel including the preparation of a safety case (Section 1.6) presented as a portfolio of reports, including the present report.
Posiva’s RTD (research, development and technical design) phase for the years 2010−2012 was introduced in the TKS-2009 report (Posiva 2009a), which also provides insight into developments from previous RTD phases. In 2012, a new RTD programme (YJH-2012, Posiva 2012b) for 2013−2015 has been published. In Figure 1-2, a general timeline of Posiva’s programme is presented.

17
Figure 1-1. Olkiluoto Island is situated on the coast of the Baltic Sea in south-western Finland. Photograph by Helifoto Oy.
Figure 1-2. Overall schedule for nuclear waste management relating to the Loviisa and Olkiluoto reactors until 2020. The target is to begin disposal of spent nuclear fuel around 2020.
18
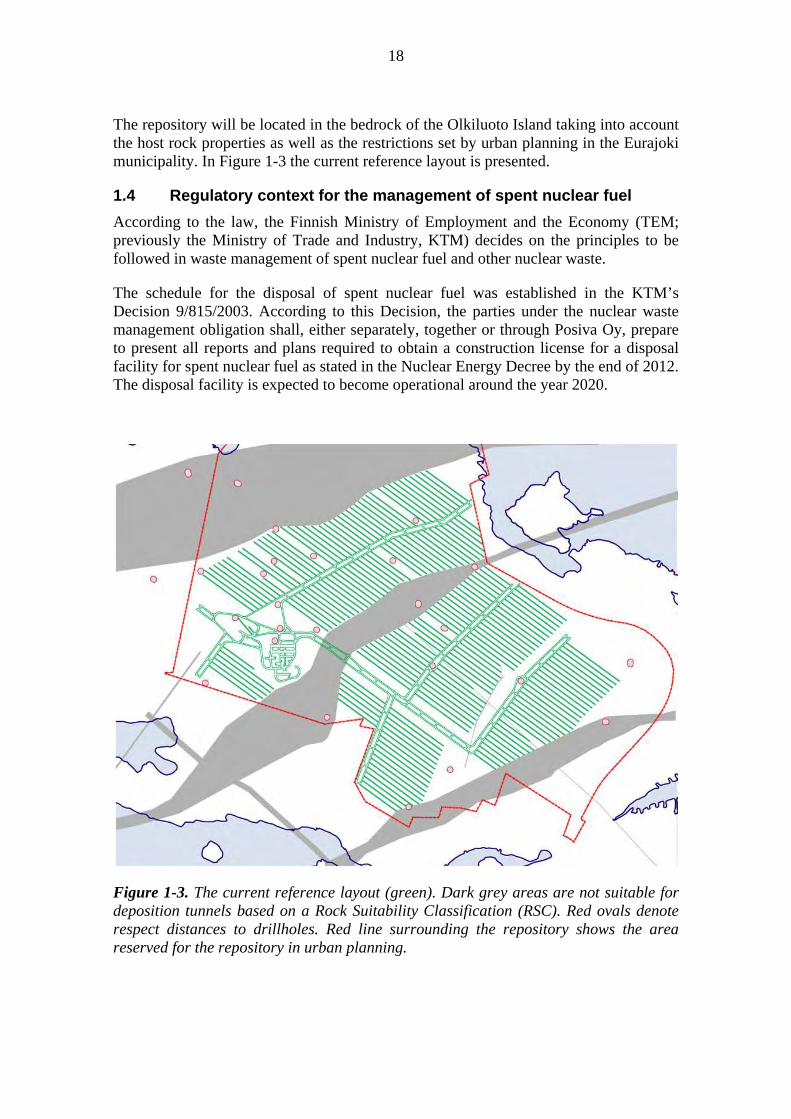
The repository will be located in the bedrock of the Olkiluoto Island taking into account the host rock properties as well as the restrictions set by urban planning in the Eurajoki municipality. In Figure 1-3 the current reference layout is presented.
1.4 Regulatory context for the management of spent nuclear fuel
According to the law, the Finnish Ministry of Employment and the Economy (TEM; previously the Ministry of Trade and Industry, KTM) decides on the principles to be followed in waste management of spent nuclear fuel and other nuclear waste.
The schedule for the disposal of spent nuclear fuel was established in the KTM’s Decision 9/815/2003. According to this Decision, the parties under the nuclear waste management obligation shall, either separately, together or through Posiva Oy, prepare to present all reports and plans required to obtain a construction license for a disposal facility for spent nuclear fuel as stated in the Nuclear Energy Decree by the end of 2012. The disposal facility is expected to become operational around the year 2020.
Figure 1-3. The current reference layout (green). Dark grey areas are not suitable for deposition tunnels based on a Rock Suitability Classification (RSC). Red ovals denote respect distances to drillholes. Red line surrounding the repository shows the area reserved for the repository in urban planning.
19
The legislation concerning nuclear energy was updated in 2008. As part of the legislative reform, a number of the relevant Government Decisions were replaced with Government Decrees (GD). The Decrees entered into force on 1st December 2008. The Government Decision (478/1999) regarding the safety of disposal of spent nuclear fuel, which particularly applied to the disposal facility, was replaced by the Government Decree 736/2008, issued 27 November 2008.
Currently, the valid Regulatory Guides pertaining to nuclear waste management are Guides YVL 8.1−8.5; additionally, a number of other YVL Guides may be applied in part to nuclear waste management. The Radiation and Nuclear Safety Authority (STUK) is in the process of updating its YVL Guides to comply with the new legislation. According to the current drafts, the Guides pertaining to the disposal of spent nuclear fuel will belong to the YVL-D series consisting of a total of five Guides. Guide YVL D.1 will deal with nuclear non-proliferation control, D.2 with the transport of nuclear material and nuclear waste, D.3 with the processing, storage and encapsulation of spent nuclear fuel, D.4 with nuclear waste management and decommissioning activities and D.5 with the disposal of nuclear waste. The latest draft of the Guide YVL D.5 (Draft 4, 17.3.2011 in Finnish only) was consulted for the preparation of the TURVA-2012 safety case (see Section 1.6).
1.5 Safety concept and safety functions
The long-term safety principles of Posiva’s planned repository system are described at Level 2 of the VAHA (VAHA is Posiva’s requirement management system) as follows.
1. The spent nuclear fuel elements are disposed of in a repository located deep in the Olkiluoto bedrock. The release of radionuclides is prevented with a multi-barrier disposal system consisting of a system of engineered barriers (EBS) and host rock such that the system effectively isolates the radionuclides from the living environment.
2. The engineered barrier system consists of:
a) canisters to contain the radionuclides for as long as they could cause significant harm to the environment;
b) buffer between the canisters and the host rock to protect the canisters as long as containment of radionuclides is needed;
c) deposition tunnel backfill and plugs to keep the buffer in place and help restore the natural conditions in the host rock;
d) the closure, i.e. the backfill and sealing structures to decouple the repository from the surface environment.
3. The host rock and depth of the repository are selected in such a way as to make it possible for the EBS to fulfil the functions of containment and isolation described above.
4. Should any of the canisters start to leak, the repository system as a whole will hinder or retard releases of radionuclides to the biosphere to the level required by the long-term safety criteria.
20
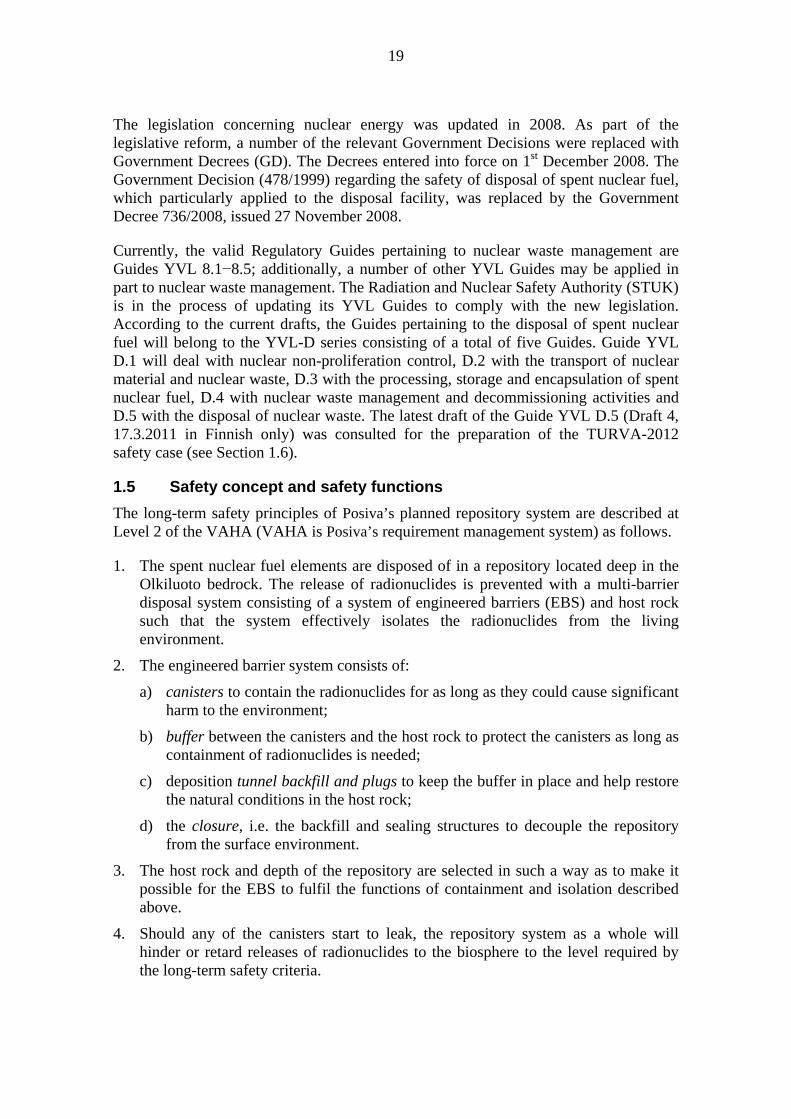
The safety concept, as depicted in Figure 1-5, is a conceptual description of how these principles are applied together to achieve safe disposal of spent nuclear fuel in the conditions of the Olkiluoto site. Due to the long-term hazard of the spent nuclear fuel, it has to be isolated from the surface environment over a long period of time. The KBS-3 method provides long-term isolation and containment of spent nuclear fuel by a system of multiple barriers, both engineered and natural, and by ensuring a sufficient depth of disposal (the key safety features of the system in Figure 1-5). All of these barriers have their roles in establishing the required long-term safety of the repository system. These roles constitute the safety functions of the barriers (see Table 1-1). The surface environment is not given any safety functions; instead it is considered as the object of the protection provided by the repository system.
Most radionuclides in the spent nuclear fuel are embedded in a ceramic matrix (UO2) that itself is resistant to dissolution in the expected repository conditions. The slow release of radionuclides from the spent nuclear fuel matrix is part of Posiva’s safety concept. Moreover, the near-field conditions should contribute to maintaining the low solubility of the matrix.
Implementation of the KBS-3 method entails the introduction of a number of closure components because of engineering, operational safety or long-term safety needs. Long-term safety needs arise, for example, because implementation involves the construction
Figure 1-5. Outline of the safety concept for a KBS-3 type repository for spent nuclear fuel in a crystalline bedrock (adapted from Posiva 2003a). Orange pillars and blocks indicate the primary safety features and properties of the disposal system. Green pillars and blocks indicate the secondary safety features that may become important in the event of a radionuclide release from a canister.
Retention and retardation of radionuclides
Slo
w t
ran
spo
rt in
th
e g
eo
sp
here
Slo
w r
eleas
e f
rom
th
e
sp
en
t fu
el m
atr
ix
Slo
w d
iffu
siv
e
tran
spo
rt in
th
e b
uff
er
SUFFICIENT DEPTH
FA
VO
UR
AB
LE
NE
AR
-FIE
LD
C
ON
DIT
ION
S F
OR
TH
E
CA
NIS
TE
R
PR
OV
EN
TE
CH
NIC
AL
QU
AL
ITY
O
F T
HE
EB
S
SAFE DISPOSAL
LONG-TERM ISOLATION AND CONTAINMENT
FAVOURABLE, PREDICTABLE BEDROCK AND GROUNDWATER CONDITIONS
WELL-CHARACTERISED MATERIAL PROPERTIES
ROBUST SYSTEM DESIGN
21
of a system of underground openings, including the access tunnel and shafts, that would significantly perturb the safety functions of the host rock unless backfilled and sealed at closure of the disposal facility. These closure components with long-term safety functions include:
backfill of underground openings, including the central tunnels, access tunnel, shafts, and other excavations, and
drillhole plugs, mechanical plugs, long-term hydraulic plugs at different depths and plugs near the surface.
The safety functions of the EBS components and host rock are summarised in Table 1-1. In the TURVA-2012 safety case documentation, the spent nuclear fuel, EBS and the host rock are jointly termed the repository system, whereas the term disposal system is used when the repository system and the surface environment are both considered (see Figure 1-6).
1.6 TURVA-2012 Safety Case portfolio
A safety case for a geological disposal facility documents the scientific and technical understanding of the disposal system, including the safety barriers and safety functions that these are expected to provide, results of a quantitative safety assessment, the process of systematically analysing the ability of the repository system to maintain its safety functions and to meet long-term safety requirements, and provides a compilation of evidence and arguments that complement and support the reliability of the results of the quantitative analyses.
As stated in Guide YVL D.5, A01: Compliance with the requirements concerning long-term radiation safety, and the suitability of the disposal method and disposal site, shall be proven through a safety case that must analyze both expected evolution scenarios and unlikely events impairing long-term safety. The safety case comprises a numerical analysis based on experimental studies and complementary considerations insofar as quantitative analyses are not feasible or involve considerable uncertainties (GD 736/2008).
The TURVA-2012 safety case for the disposal of spent nuclear fuel at Olkiluoto is compiled in a portfolio of main reports with supporting documents (Figure 1-7). In this report, all TURVA-2012 portfolio reports are referenced using the report title (as below) in italics. The full titles and report numbers are listed at the beginning of the reference list.
The main reports and supporting documents of the TURVA-2012 portfolio are briefly described in the following.
22
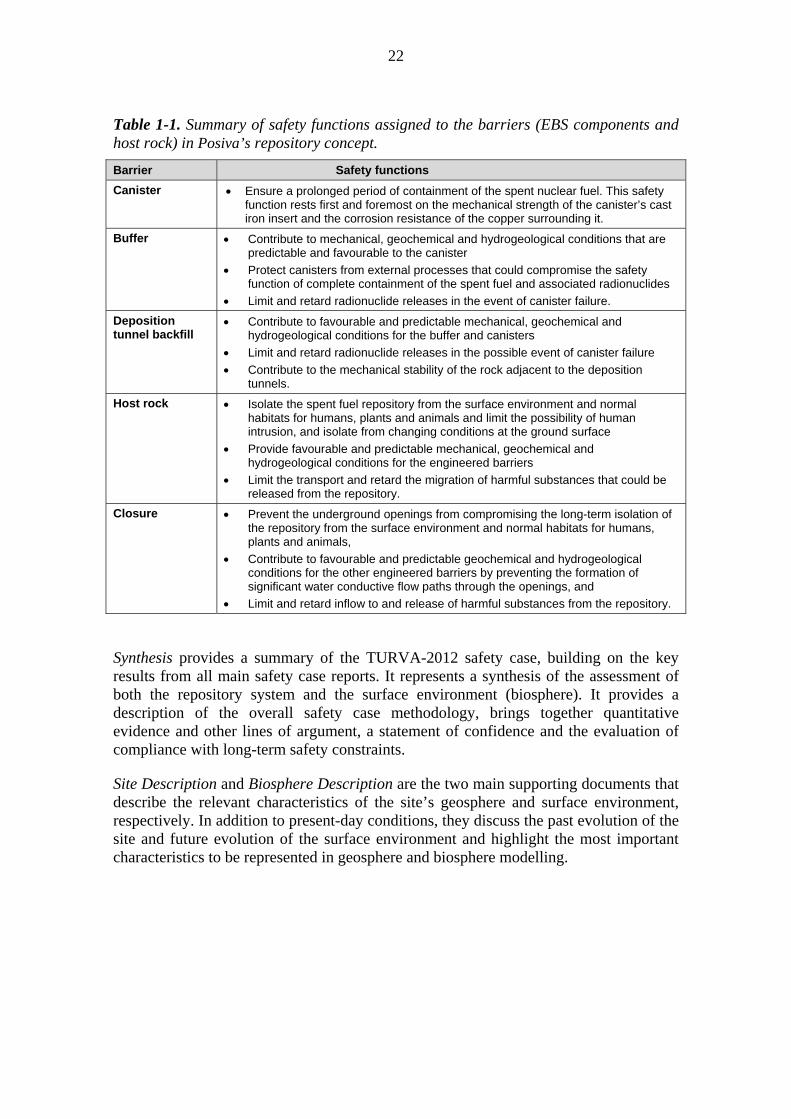
Table 1-1. Summary of safety functions assigned to the barriers (EBS components and host rock) in Posiva’s repository concept.
Barrier Safety functions
Canister Ensure a prolonged period of containment of the spent nuclear fuel. This safety function rests first and foremost on the mechanical strength of the canister’s cast iron insert and the corrosion resistance of the copper surrounding it.
Buffer Contribute to mechanical, geochemical and hydrogeological conditions that are predictable and favourable to the canister
Protect canisters from external processes that could compromise the safety function of complete containment of the spent fuel and associated radionuclides
Limit and retard radionuclide releases in the event of canister failure.
Deposition tunnel backfill
Contribute to favourable and predictable mechanical, geochemical and hydrogeological conditions for the buffer and canisters
Limit and retard radionuclide releases in the possible event of canister failure
Contribute to the mechanical stability of the rock adjacent to the deposition tunnels.
Host rock Isolate the spent fuel repository from the surface environment and normal habitats for humans, plants and animals and limit the possibility of human intrusion, and isolate from changing conditions at the ground surface
Provide favourable and predictable mechanical, geochemical and hydrogeological conditions for the engineered barriers
Limit the transport and retard the migration of harmful substances that could be released from the repository.
Closure Prevent the underground openings from compromising the long-term isolation of the repository from the surface environment and normal habitats for humans, plants and animals,
Contribute to favourable and predictable geochemical and hydrogeological conditions for the other engineered barriers by preventing the formation of significant water conductive flow paths through the openings, and
Limit and retard inflow to and release of harmful substances from the repository.
Synthesis provides a summary of the TURVA-2012 safety case, building on the key results from all main safety case reports. It represents a synthesis of the assessment of both the repository system and the surface environment (biosphere). It provides a description of the overall safety case methodology, brings together quantitative evidence and other lines of argument, a statement of confidence and the evaluation of compliance with long-term safety constraints.
Site Description and Biosphere Description are the two main supporting documents that describe the relevant characteristics of the site’s geosphere and surface environment, respectively. In addition to present-day conditions, they discuss the past evolution of the site and future evolution of the surface environment and highlight the most important characteristics to be represented in geosphere and biosphere modelling.

23
Figure 1-6. The components of the disposal system.
Description of the Disposal System summarises the initial state of the repository system components (spent nuclear fuel, EBS and host rock) and of the surface environment. The descriptions of the engineered barriers and underground openings are based on the Production Line reports, whereas the descriptions of the host rock and the surface environment are based on Site Description and Biosphere Description, respectively. The initial state of the spent nuclear fuel is also presented. The report provides the main characteristics of the components of the disposal system to be used as input to the safety assessment.
Features, Events and Processes identifies and describes the various features, events and processes (FEPs) that need to be taken into account when assessing the long-term safety of the Olkiluoto spent nuclear fuel repository, thus feeding into the performance assessment, the formulation of radionuclide release scenarios, the assessment of the scenarios for the repository system and the biosphere (see below).
In the review of the pre-licensing documentation, STUK emphasises the importance of defining performance targets and target properties, giving the reasoning behind them, and providing an assessment of how they are fulfilled by the repository system. Details on the reasoning and rationale behind the definition of the performance targets for the EBS components and target properties of the host rock are specified in Design Basis. The report is supported by the Production Line reports (for the canister, buffer, backfill, closure and underground openings), which present the detailed design specifications for the repository components, combined with a description of their production and initial state.

24
Figure 1-7. TURVA-2012 safety case portfolio including report names (coloured boxes) and brief descriptions of the contents (white boxes). Disposal system = repository system + surface environment.
Main reports
Main supporting documents
Biosphere Assessment: Modelling reports
Description of the models and detailed modelling of surface environment
Assessment of Radionuclide Release Scenarios for the
Repository SystemBiosphere Assessment
Summary of the initial state of the repository system and present state of the surface environment
Features, Events and ProcessesGeneral description of features, events and processes affecting the disposal system
Performance AssessmentAnalysis of the performance of the repository system and evaluation of the fulfillment of performance
targets and target properties
Formulation of Radionuclide Release Scenarios
TURVA-2012
SynthesisDescription of the overall methodology of analysis, bringing together all the lines of arguments for safety, and the statement of confidence and the evaluation of compliance with long-term safety
constraints
Design Basis Performance targets and target properties for the repository system
Production LinesDesign, production and initial state of the EBS and the underground openings
Description of the Disposal System
Site Description
Description of climate evolution and definition of release scenarios
Models and data used in the performance assessment and in the analysis of the
radionuclide release scenarios
Analysis of releases and calculation of doses and activity fluxes.
Complementary ConsiderationsSupporting evidence incl. natural and anthropogenic analogues
Data used in the biosphere assessment and summary of models
Biosphere DescriptionUnderstanding of the present state and past
evolution of the host rock
Understanding of the present state and evolution of the surface environment
Models and Data for the Repository System
Biosphere Data Basis

25
Performance Assessment replaces the previous reports dealing with the expected, evolution of a spent nuclear fuel repository (Crawford & Wilmot 1998, Pastina & Hellä 2006), in which the EBS and geosphere uphold their safety functions with no releases of radionuclides for at least 10,000 years and even after 100,000 years. The fulfilment of the performance targets and target properties during the expected evolution of the repository system is evaluated in Performance Assessment. Performance Assessment covers the performance of the system for the entire assessment time frame of one million years with a special focus on the containment safety function of the canister and isolating safety function of other EBS components and the geosphere in the first 10,000 years (as required by YVL D.5). The main focus of the report is the expected evolution and performance, but it is also shown that there are some plausible conditions, and some unlikely events and processes, that could lead to reduction of one or more safety functions and, potentially, give rise to radionuclide releases. Thus, Performance Assessment presents the expected evolution of the repository in which the majority of the canisters in the repository provide complete containment of radionuclides throughout the assessment time frame.
The performance assessment identifies uncertainties in the initial state of the barriers and/or in the evolution of the repository system that could lead to radionuclide releases. These deviations from the desired initial state or expected evolution are propagated to Formulation of Radionuclide Release Scenarios, which defines the scenarios and the calculation cases for both the repository system and the surface environment. The aim of Formulation of Radionuclide Release Scenarios is to systematically define a set of scenarios that encompass the important combinations of initial conditions, expected evolution and disruptive events.
In past assessments by Posiva, the case of a canister with an initial defect has been assessed as a case to test the performance of the other engineered barriers and host rock. While this is not necessarily the most likely feature that could lead to release of radionuclides, it is the reference case in Formulation of Radionuclide Release Scenarios that also complies with the GD 736/2008. Thus, in TURVA-2012, the base scenario addresses the most likely lines of evolution and takes into account the incidental possibility of one or a few canisters with initial undetected penetrating defects. The classification of scenarios emphasises that incidental deviations that may lead to radionuclide release (e.g. an initial defect of a canister) have low probability. The design aim for the repository and expected outcome is that the majority of the canisters in the repository will provide complete containment of radionuclides throughout the assessment time frame (as shown in Performance Assessment) and there will be no releases of radionuclides from the canisters for at least several hundreds of thousands of years. The assumption that no more than a few canisters have initial penetrating defects is based on expert judgement concerning the canister welding method (electron beam welding − EBW) and non-destructive testing (NDT) capabilities. With continued testing it seems practicable in the future to show that the probability of more than one initially defective canister in the repository is less than one per cent. At the moment, therefore, the number of defective canisters is assumed to be one canister out of 4500 in the reference case realisation of the base scenario.
26
The analyses of the releases and calculated activity fluxes and doses are presented in Assessment of Radionuclide Release Scenarios for the Repository System and in Biosphere Assessment.
Models and Data for the Repository System summarises the models and the data used in the performance assessment and the analysis of radionuclide release scenarios for the repository system. As to the surface environment, the data used in the biosphere assessment are summarised in Biosphere Data Basis, and the models are discussed in Terrain and Ecosystems Development Modelling, Surface and Near-Surface Hydrological Modelling, Biosphere Radionuclide Transport and Dose Assessment and Dose Assessment for Plants and Animals.
Complementary Considerations supports the safety case by presenting complementary evidence for the safety of nuclear waste disposal in crystalline bedrock according to the KBS-3 method. In particular, it provides evidence for the reliable performance and longevity of the engineered barrier materials, and suitability of the Olkiluoto site to provide the necessary conditions for long-term safety, focusing on qualitative supporting arguments.
The TURVA-2012 safety case portfolio is based on the safety case plan published in 2008 (Posiva 2008), which updates an earlier plan published in 2005 (Vieno & Ikonen 2005). In the updated safety case plan, further details are provided on quality assurance and control procedures and their documentation, as well as on the consistent handling of different types of uncertainties. Since 2008, the safety case plan has been iterated based on the feedback received from the authorities, and the contents of the safety case portfolio TURVA-2012 are now as presented in Figure 1-7.
1.7 Quality assurance
The quality assurance (QA) procedures for the TURVA-2012 safety case (see Figure 1-7) have been carried out following Posiva’s quality management system, which complies with the ISO 9001:2008 standard and considers relevant regulatory requirements. Even though the quality assurance is based on management according to the standard ISO 9001:2008, a graded approach proposed for nuclear facilities is adopted, i.e. the primary emphasis is on the quality control of the safety case, particularly those activities that have a direct bearing on long-term safety, whereas standard quality measures are applied in the supporting work. This means, in practice, that the main safety case reports are subject to stricter quality demands than general research activities. The input from Posiva’s own RTD activities and other research also fulfil the ISO 9001 quality standards.
The general quality guidelines of Posiva are also applied; the composition and quality management of portfolio reports and the recruitment of expert reviewers are controlled according to the respective guidelines. In addition, special attention is paid to the management of the processes that are applied to produce the safety case and its foundations, which is the basis for the whole safety case process and organisation of the work. The purpose of this enhanced process control is to provide full traceability and transparency of the data, assumptions, models, calculations and results. The safety case production process is a part of Posiva’s RTD process and is linked to Posiva’s
27
Production lines, Facility design and other main processes. The main customer is the Strategy process and the Licensing sub-process. The aim of the safety case production process is to produce the long-term safety documentation for the construction license application. The safety case production process is owned by the research manager of Posiva’s Long-term Safety Unit in Posiva’s Research Department.
The overall plan, main goals and constraints for the safety case production process are presented in the Safety Case Plan (Posiva 2008). The details of how the Safety Case Plan 2008 is being implemented are described in the SAFCA project plan. The organisation of the TURVA-2012 safety case production process is referred to as SAFCA. The work is managed and coordinated by a SAFCA project group and supervised by a steering group.
The safety case production process is divided into four main sub-processes: Conceptualisation and Methodology, Data Handling and Modelling, Safety Assessment, and Evaluation of Compliance and Confidence.
The Data Handling and Modelling sub-process constitutes the central linkage between Posiva’s main technical and scientific activities and the production of the safety case. It is a clearinghouse activity between the supply of, and demand for, quality-assured data for the safety case. Data are produced by Posiva’s planning, design and development processes for the EBS (Engineered Barrier System), by the site characterisation process for the geoscientific data and through the biosphere description of the Olkiluoto area.
A SAFCA quality co-ordinator (QC) has been designated for the activities related to the quality assurance measures applied to the production of the safety case contents. The QC is responsible for checking that the instructions and guidelines are followed and improvements are made in the process as deemed useful or necessary. The QC is also responsible for the coordination of the external expert reviews, maintenance of schedules, review and approval of the products, and the management of the expert elicitation process. The QC also leads the quality review of models and data used in the Data Handling and Modelling sub-process. Regular auditing of the safety case production process is done as part of Posiva’s internal audit programme.
Data sources and quality aspects of the sources are documented according to a specific guideline. Individual data and databases are approved through a clearance procedure supervised by the SAFCA Quality Co-ordinator. In line with the ISO 9001 standard the process owner checks and approves the data and the QC checks and approves the procedure. Data used may also be approved using other Posiva databases such as VAHA or POTTI and the respective approval processes. A clearance procedure has been applied to all key data used in the performance assessment (i.e. showing compliance with performance targets and target properties), and in the safety assessment (i.e. radionuclide transport analyses and dose calculations).
The control and supervision of the safety case products (i.e. main portfolio reports) has been done in two steps, first an internal review by safety case experts and subject-matter experts within Posiva’s RTD programme and then the second step by external expert reviewers. A group of external experts covering the essential areas of knowledge and expertise needed in safety case production has been set up. The review process is based
28
on review templates, which record each review comment and how it has been addressed. Upon completion, this template is checked and approved according to the quality guidelines of Posiva.
The expert elicitation process has been applied to specific cases when the understanding or data basis is conflicting and consensus is needed for the selection of key data (e.g. future climate scenarios, solubility and sorption data). This expert elicitation process has been initiated, recruited, documented and managed by the SAFCA Quality Co-ordinator.
QA issues are discussed further in Synthesis. Quality assurance and quality control measures related to the production and operation of the repository are discussed in detail in production line reports (Canister, Buffer, Backfill, Closure and Underground Openings Production Line).
1.8 Scope and structure of the present report
The role of this report in Posiva’s safety case portfolio in and the relation to Design Basis, Production Lines, Description of the Disposal System, Features, Events and Processes, Formulation of Radionuclide Release Scenarios and Assessment of Radionuclide Release Scenarios for the Repository system and Models and Data for the Repository System is shown in Figure 1-7.
Performance Assessment aims at presenting the evidence to support the view that the performance requirements will be met in the spent nuclear fuel repository to be constructed at Olkiluoto, Finland. Performance Assessment presents the analysis of the performance of the repository system under the most likely line of evolution and evaluates the fulfilment of performance targets and target properties taking into account uncertainties giving rise to possible lines of evolution that deviate from the most likely line of evolution. In addition, the consequences of some less likely lines of evolution that might lead to short circuiting of barriers are analysed.
The structure of the present report is the following:
The performance requirements (VAHA Level 3 and Level 4) are presented in Chapter 2 (performance targets and design requirements for the EBS components, and target properties for the host rock).
The initial state for the repository system as it has been defined in Description of the Disposal System (including deviations and uncertainties) is presented in Chapter 3.
The checking of performance targets and target properties (VAHA L3/L4) against evolution-related features, events and processes (FEPs) to ensure that the relevant FEPs that may pose a threat to the performance of the barriers have been identified is presented in Chapter 4 along with the overarching climate evolution FEP. Chapter 4 also includes a description of the methodology for assessing the repository system performance considering all relevant FEPs.
The performance of the repository system and analyses of the response of the barriers to the FEPs (listed in Chapter 4) with respect to the upholding of the

29
performance targets/target properties are presented in Chapters 5 to 8. This is done by following the most likely line of evolution of the repository system first during the excavation and operational period (Chapter 5), then until 10,000 years after closure (Chapter 6) and finally the long-term evolution beyond 10,000 years up to the end of the next glaciation (Chapter 7). Evolution during repeated glacial cycles is discussed in Chapter 8. In Chapters 5 to 8, the discussion is based on existing data and knowledge available in published reports and literature. Whenever possible, quantitative arguments (e.g. scoping calculations) are used, e.g. to demonstrate safety margins and robustness of design. Each period is summarised by a discussion of the state of the barriers with respect to the performance targets and target properties at the end of the period and uncertainties are highlighted.
Chapter 9 assesses the fulfilment of performance targets and target properties listed in Chapter 2. This assessment includes a summary of all time-dependent and space-dependent loads on the rock, closure, backfill, buffer and canister that may affect the performance targets and target properties, based on the findings from Chapters 5−8, and identification of conditions that may lead to deviations from the performance targets and target properties and an estimation of the effects of the various loads on the fulfilment of the performance targets during different periods of repository evolution.
Chapter 10 concludes with a statement confirming the fulfilment of performance targets/target properties; uncertainties that may endanger the fulfilment of the performance targets/target properties are identified, thus providing input to the formulation of release scenarios and to the identification of needs for further R&D. Finally, a statement of confidence is presented.

30
31
2 PERFORMANCE REQUIREMENTS
The requirements on safety of final disposal of spent nuclear fuel are dictated by the Government Decree on the safety of disposal of nuclear waste 736/2008. According to Section 4, “Disposal of nuclear waste shall be planned so that radiation impacts arising as a consequence of expected evolution scenarios will not exceed the constraints given.”
Posiva’s safety concept is based on long-term isolation and containment, which is achieved through robust engineered barrier system design and favourable geological conditions at the repository site, as discussed in Section 1.5 and outlined in Figure 1-5.
Government Decree 736/2008, Chapter 4 states that “The long-term safety of disposal shall be based on safety functions achieved through mutually complementary barriers so that a deficiency of an individual safety function or a predictable geological change will not jeopardise the long-term safety.
Safety functions shall effectively prevent releases of disposed radioactive materials into the bedrock for a certain period, the length of which depends on the duration of the radioactivity in waste. For short-lived waste, this period shall be at least several hundreds of years, and for long-lived waste, at least several thousands of years.”
The requirement to have mutually complementary barriers is achieved in the KBS-3 method by using multiple barriers which support each other’s safety functions. The safety functions assigned to the barriers of Posiva’s repository concept are presented in Table 1-1.
Performance targets and the target properties are requirements that describe properties and functions that a barrier shall fulfill. The definition of the performance targets for the safety functions of the engineered barriers and the target properties for the safety functions of the host rock requires the identification of the different loads and interactions that may act on the repository system at the time of canister emplacement and in the long term. To achieve this, the potential future conditions have to be described as alternative lines of evolution, and their likelihoods estimated based on present-day understanding and the findings of earlier assessments. All the lines of evolution and expected loads that are judged reasonably likely to occur (based on this understanding and previous findings) are taken into account and, hence, included in the design basis. Thus, by definition, when the performance targets and target properties are met and the future follows the reasonably likely lines of evolution (design basis scenarios), the safety functions are fulfilled.
For the rock barrier, the target properties set the starting point for the definition of the Rock Suitability Classification system (RSC) developed by Posiva. The classification system includes both the current rock suitability criteria as well as the procedure for the suitability classification during the construction of the repository. The RSC is used to identify suitable rock volumes for repository panels and to assess the suitability of deposition tunnels for locating deposition holes and to accept deposition holes for disposal.
32
Target properties are, therefore, requirements set on the quality of the host rock that govern the possible locations of deposition tunnels and holes. These target properties are set out in Posiva’s requirements management system VAHA in level 3, along with the performance targets for the engineered barrier system.
Design Basis covers all requirements presented in levels 1−4 of Posiva’s requirements management system, VAHA. It describes the legal and regulatory requirements that guide repository research, design and development. It also introduces the safety principles, safety concept and the safety functions assigned to each barrier and the performance targets (or target properties for host rock) specified for these safety functions. From the performance targets and target properties (VAHA level 3) the design requirements are derived (VAHA level 4). Then, design specifications are worked out such that the fulfilment of these requirements can be verified at implementation (VAHA level 5). The design specifications (VAHA level 5) are presented in the Production Line reports. The argument for (justification of) the requirements that are set is a key issue in Design Basis. The performance targets and target properties are briefly summarised in the following section. The evaluation of whether the system, as designed and built according to the design requirements and specifications will met these requirements for the barriers for an envelope of future conditions that includes all reasonably likely lines of evolution is the goal of this report.
This report focuses on the evaluation of the performance targets and target properties presented in Section 2.1 using the designs presented in the design reports and the production line reports for each component.
The design basis and definition of performance targets and target properties are developed iteratively between performance assessment, formulation and assessment of radionuclide release scenarios and presentation of the safety case. Available scientific understanding, including the results from earlier assessments, is used in the definition of the performance targets, target properties for the host rock, design requirements and criteria for rock classification. These will be updated as scientific understanding is further developed, taking into account the results of the performance assessment and the assessment of radionuclide release scenarios of the current safety case.
2.1 Performance targets and target properties
Performance targets and target properties are properties of the EBS components and host rock, respectively, derived from the safety functions, which aim to ensure that the disposal of spent nuclear fuel can be implemented safely. The actual performance targets for the disposal system are defined in relation to such properties as can be derived from measurable or otherwise observable or derivable properties − for instance, with the aid of modelling. The role of the performance targets has also been defined by STUK:
“Targets based on high quality scientific knowledge and expert judgement shall be specified for the performance of each safety function. In doing so, the potential changes and events affecting the disposal conditions during each assessment period shall be taken into account. In an assessment period extending up to several thousands of years, one can assume that the bedrock of the site remains in its current state, taking however

33
account of the changes due to predictable processes, such as land uplift and those due to excavations and disposed waste”. (STUK-YVL D.5, paragraph 408).
2.1.1 Canister
Based on the safety function of the canister presented in Table 1-1, the following performance targets have been set (Table 2-1).
Table 2-1. Performance targets for the canister, main rationale and the related design requirements. The performance targets are discussed in more detail in Design Basis. Reference to Posiva’s requirement management data base (VAHA) is also given when appropriate (L3 = Level 3, L4 = Level 4).
ID Performance target
Main rationale Related design requirements
L3-CAN-4 L3-CAN-5
The canister shall initially be intact when leaving the encapsulation plant for disposal except for incidental deviations. In the expected repository conditions the canister shall remain intact for hundreds of thousands of years except for incidental deviations.
The safety function of the canister is containment. The performance of the welding method and NDT should be such that containment is ensured at the initial state and for as long as possible. After a period of a few hundreds of thousands of years, the radiological hazard of spent nuclear fuel will be similar to the one posed by the uranium it was originally made of.
The canister is composed of a leak-tight copper shell and of a load-bearing nodular cast iron insert. (L4-CAN-2) The copper overpack shall provide the corrosion resistance required in the postulated repository conditions. (L4-CAN-5) The iron insert shall provide the mechanical strength required. (L4-CAN-7)
L3-CAN-7
The canister shall withstand corrosion in the expected repository conditions.
Corrosion is a potential mode of canister failure.
The copper overpack shall provide the corrosion resistance required in the postulated repository conditions. (L4-CAN-5). The design, manufacturing and any further processing and handling of the canister shall aim at limiting the risk of stress corrosion cracking in repository conditions. (L4-CAN-23)
L3-CAN-9
The canister shall withstand the expected mechanical loads in the repository.
Mechanical loading is a potential cause of canister failure.
The iron insert shall provide the mechanical strength required. (L4-CAN-7) The canister copper overpack shall be designed to withstand the plastic deformation and creep caused by any postulated mechanical or thermal load. (L4-CAN-28) The canister insert shall be designed to bear the hydrostatic pressure from groundwater and from swelling of bentonite. (L4-CAN-35) The canister insert shall be designed to bear the hydrostatic load caused by glaciation. (L4-CAN-36) The canister insert shall be designed to bear unevenly distributed swelling loads. (L4-CAN-37) The canister insert shall be designed to bear the loads

34
ID Performance target
Main rationale Related design requirements
from the postulated rock shear displacements in the deposition hole. (L4-CAN-38)
L3-CAN-11
The canister shall not impair the safety functions of other barriers.
Spent nuclear fuel emits heat and radiation that are potentially detrimental to the other barriers if the canister does not provide adequate shielding. Furthermore, the canister itself will inevitably undergo some chemical changes over time, the products of which should not be detrimental to the other barriers.
The heat generation inside the canister shall be limited in such a way that the performance of the other barriers is not impaired. (L4-CAN-14) The fuel elements for encapsulation shall be selected in a pre-planned, controlled and documented way to meet the decay heat limit set for each canister type. (L4-CAN-15) The canister materials shall have a sufficiently high thermal conductivity such that the heat from the spent nuclear fuel is effectively dissipated. (L4-CAN-17) The shielding provided by the canister shall limit the dose rate to minimise radiolysis of water outside the canister. (L4-CAN-11) The fuel elements for encapsulation shall be selected in a pre-planned, controlled and documented way to limit the radiation dose on the canister surface. (L4-CAN-43)
L3-CAN-14
The canister shall be subcritical in all postulated operational and repository conditions including intrusion of water through a damaged canister wall.
If criticality is reached, a large amount of energy is generated causing damage to the canister and other barriers and widespread release of radionuclides.
To ensure subcriticality, the properties (e.g. enrichment, burnup) of the fuel inside the canisters, as well as the internal geometry of the insert, shall be known precisely enough to provide a high degree of confidence in criticality safety. (L4-CAN-9) The insert geometry and acceptance criteria for soundness shall be set so that sub-criticality is guaranteed. (L4-CAN-33)
L3-CAN-16
The canisters shall be stored, transferred and emplaced in such a way that the copper shell is not damaged.
If the canister is damaged, the containment is endangered.
The design, manufacturing and any further processing and handling of the canister shall aim at limiting the risk of stress corrosion cracking in repository conditions. (L4-CAN-23) Dent marks and scratches on the copper surface shall be minimised during canister handling and transport. (L4-CAN-26)
L3-CAN-18
The design of the canister shall facilitate the retrievability of spent fuel assemblies from the repository.
As required in DiP 2000 and 2010. (M 3/2010 vp, 6.5.2010)
Not to be discussed in the PA.
2.1.2 Buffer
Based on the safety functions of the buffer presented in Table 1-1, the following performance targets have been set (Table 2-2).
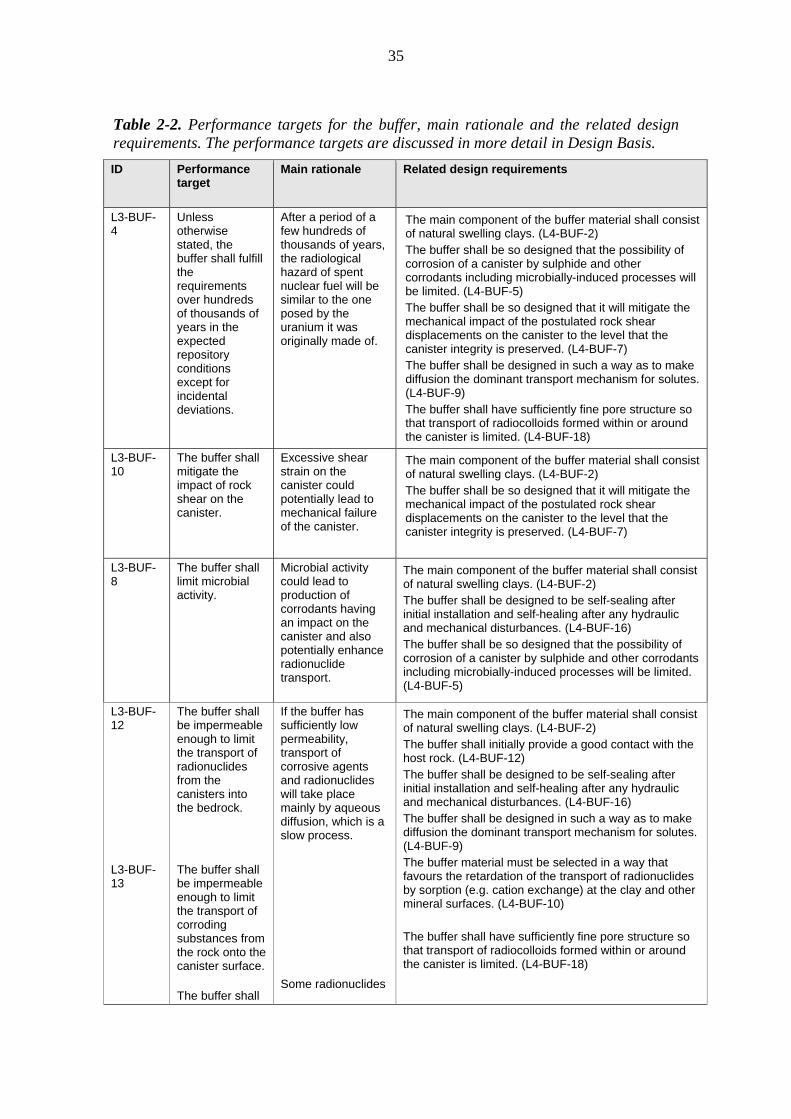
35
Table 2-2. Performance targets for the buffer, main rationale and the related design requirements. The performance targets are discussed in more detail in Design Basis.
ID Performance target
Main rationale Related design requirements
L3-BUF-4
Unless otherwise stated, the buffer shall fulfill the requirements over hundreds of thousands of years in the expected repository conditions except for incidental deviations.
After a period of a few hundreds of thousands of years, the radiological hazard of spent nuclear fuel will be similar to the one posed by the uranium it was originally made of.
The main component of the buffer material shall consist of natural swelling clays. (L4-BUF-2) The buffer shall be so designed that the possibility of corrosion of a canister by sulphide and other corrodants including microbially-induced processes will be limited. (L4-BUF-5) The buffer shall be so designed that it will mitigate the mechanical impact of the postulated rock shear displacements on the canister to the level that the canister integrity is preserved. (L4-BUF-7) The buffer shall be designed in such a way as to make diffusion the dominant transport mechanism for solutes. (L4-BUF-9) The buffer shall have sufficiently fine pore structure so that transport of radiocolloids formed within or around the canister is limited. (L4-BUF-18)
L3-BUF-10
The buffer shall mitigate the impact of rock shear on the canister.
Excessive shear strain on the canister could potentially lead to mechanical failure of the canister.
The main component of the buffer material shall consist of natural swelling clays. (L4-BUF-2) The buffer shall be so designed that it will mitigate the mechanical impact of the postulated rock shear displacements on the canister to the level that the canister integrity is preserved. (L4-BUF-7)
L3-BUF-8
The buffer shall limit microbial activity.
Microbial activity could lead to production of corrodants having an impact on the canister and also potentially enhance radionuclide transport.
The main component of the buffer material shall consist of natural swelling clays. (L4-BUF-2) The buffer shall be designed to be self-sealing after initial installation and self-healing after any hydraulic and mechanical disturbances. (L4-BUF-16) The buffer shall be so designed that the possibility of corrosion of a canister by sulphide and other corrodants including microbially-induced processes will be limited. (L4-BUF-5)
L3-BUF-12
The buffer shall be impermeable enough to limit the transport of radionuclides from the canisters into the bedrock.
If the buffer has sufficiently low permeability, transport of corrosive agents and radionuclides will take place mainly by aqueous diffusion, which is a slow process.
Some radionuclides
The main component of the buffer material shall consist of natural swelling clays. (L4-BUF-2) The buffer shall initially provide a good contact with the host rock. (L4-BUF-12) The buffer shall be designed to be self-sealing after initial installation and self-healing after any hydraulic and mechanical disturbances. (L4-BUF-16) The buffer shall be designed in such a way as to make diffusion the dominant transport mechanism for solutes. (L4-BUF-9) The buffer material must be selected in a way that favours the retardation of the transport of radionuclides by sorption (e.g. cation exchange) at the clay and other mineral surfaces. (L4-BUF-10) The buffer shall have sufficiently fine pore structure so that transport of radiocolloids formed within or around the canister is limited. (L4-BUF-18)
L3-BUF-13
The buffer shall be impermeable enough to limit the transport of corroding substances from the rock onto the canister surface.
The buffer shall

36
ID Performance target
Main rationale Related design requirements
L3-BUF-14
limit the transport of radiocolloids to the rock.
are precipitated within and around the failed canister, and colloid filtration ensures that these precipitates remain confined inside the buffer.
L3-BUF-16
The buffer shall provide support to the deposition hole walls to mitigate potential effects of rock damage.
Rock damage could otherwise increase the rate of transfer of corrosive agents from the rock to the buffer and of RNs from the buffer to the rock.
The main component of the buffer material shall consist of natural swelling clays. (L4-BUF-2) The buffer shall initially provide a good contact with the host rock. (L4-BUF-12)
L3-BUF-17
The buffer shall be able to keep the canister in the correct position (to prevent sinking and tilting).
Sinking or tilting could reduce the thickness of the buffer between the canister and the rock, reducing the capacity of the buffer to perform its safety functions.
The main component of the buffer material shall consist of natural swelling clays. (L4-BUF-2) The buffer shall be designed to be self-sealing after initial installation and self-healing after any hydraulic and mechanical disturbances. (L4-BUF-16)
L3-BUF-6
The buffer shall transfer the heat from the canister efficiently enough to keep the buffer temperature < 100oC.
Maintaining the temperature below this upper limit prevents mineral transformation of the buffer.
The gap between the canister and buffer and buffer blocks and rock should be made as narrow as possible without compromising the future performance of the buffer. (L4-BUF-21) The buffer shall initially provide a good contact with the host rock (L4-BUF-12).
L3-BUF-19
The buffer shall allow gases to pass through it without causing damage to the repository system.
Limited gas pressurisation reduces the likelihood of damage to the canister, backfill and rock.
The buffer shall be designed to be self-sealing after initial installation and self-healing after any hydraulic and mechanical disturbances. (L4-BUF-16)
L3-BUF-21
The amount of substances in the buffer that could adversely affect the canister, backfill or rock shall be limited.
Limited amount of harmful substances reduces the likelihood of canister corrosion as well as possible detrimental effects on the safety functions of the backfill and rock.
The buffer material shall be selected so as to limit the contents of harmful substances (organics, oxidising compounds, sulphur and nitrogen compounds) and microbial activity. (L4-BUF-19)
2.1.3 Deposition tunnel backfill and plugs
Based on the safety functions of deposition tunnel backfill and plugs presented in Table 1-1, the following performance targets have been set (Table 2-3).

37
Table 2-3. Performance targets for the deposition tunnel backfill and plugs, main rationale and the related design requirements. The targets are discussed in more detail in Design Basis.
ID Performance target
Main rationale Related design requirements
L3-BAC-5
Unless otherwise stated, the backfill and plugs shall fulfill the performance targets over hundreds of thousands of years in the expected repository conditions except for incidental deviations.
After a period of a few hundreds of thousands of years, the radiological hazard of spent nuclear fuel will be similar to the one posed by the uranium it was originally made of.
The main component of the backfill material shall consist of natural swelling clays. The plugs shall consist of materials that have a good hydraulic isolation capacity and that will not undergo large volume changes in the long term. (L4-BAC-2) The backfill shall be so designed that its hydraulic conductivity over the whole cross-section of the backfilled tunnel will be ≤ 1·10-10 m/s after full saturation. (L4-BAC-5) The plug shall be designed to withstand the sum of the swelling pressure of the backfill and the hydrostatic pressure of the groundwater at the repository depth. (L4-BAC-13) The plugs shall be designed to maintain their hydraulic isolation capacity at least as long as the central tunnels are open. (L4-BAC-6) In the initial state the backfill shall have a good contact with the host rock. (L4-BAC-29) To keep the buffer in place, the design of the backfill has to take into account, on the one hand, the compressibility and structural stiffness of the backfill, and, on the other hand, the buffer swelling pressure and the friction of buffer against the deposition hole walls. (L4-BAC-30) Backfill and plug materials shall be selected so as to limit the contents of harmful substances (organics, oxidising compounds, sulphur and nitrogen compounds) and microbial activity. (L4-BAC-18) The plugs must be designed to maintain a backfilling function even after their hydraulic isolation capacity has been lost. (L4-BAC-14) The backfill shall be designed to be self-sealing after initial installation and self-healing after any hydraulic or mechanical disturbances. (L4-BAC-28)
L3-BAC-8
The backfill shall limit advective flow along the deposition tunnels.
Flowpaths formed could otherwise provide transport routes that could damage the barriers, and transport paths for radionuclides released in the event of canister failure. Transport of corrosive agents and radionuclides will be limited by slow water movement.
The backfill shall be designed to be self-sealing after initial installation and self-healing after any hydraulic or mechanical disturbances. (L4-BAC-28)

38
ID Performance target
Main rationale Related design requirements
L3-BAC-9
The plugs shall isolate the deposition tunnels hydraulically during the operational phase of the repository.
Lack of isolation could lead to erosion and extrusion of backfill having an impact on the fulfilment of the performance of the backfill and potentially also buffer and may further lead to increased rates of transfer of corrosive agents to the canister and of RNs from the canister.
The plugs shall be designed to withstand the sum of the swelling pressure of the backfill and the hydrostatic pressure of the groundwater at the repository depth. (L4-BAC-13) The plugs shall be designed to maintain their hydraulic isolation capacity at least as long as the central tunnels are open. (L4-BAC-6). The plugs must be designed to maintain a backfilling function even after their hydraulic isolation capacity has been lost. (L4-BAC-14)
L3-BAC-13
The chemical composition of the backfill and plugs shall not jeopardise the performance of the buffer, canister or bedrock.
Backfill and plug materials shall be selected so as to limit the contents of harmful substances (organics, oxidising compounds, sulphur and nitrogen compounds) and microbial activity. (L4-BAC-18)
L3-BAC-16
The backfill shall keep the buffer in place.
Buffer extrusion into the deposition tunnel could otherwise endanger the fulfilment of the performance of the buffer.
To keep the buffer in place, the design of the backfill has to take into account, on the one hand, the compressibility and structural stiffness of the backfill, and, on the other hand, the buffer swelling pressure and the friction of buffer against the deposition hole walls. (L4-BAC-30)
L3-BAC-17
The backfill shall contribute to the mechanical stability of the deposition tunnels.
Rock damage could otherwise increase the rate of transfer of corrosive agents from the rock to the buffer and of RNs from the buffer to the rock.
In the initial state the backfill shall have a good contact with the host rock. (L4-BAC-29)
L3-BAC-18
The plugs shall keep the backfill in place during the operational phase.
Extrusion of backfill into the central tunnel could otherwise endanger the fulfilment of the EBS performance.
The plug shall be designed to withstand the sum of the swelling pressure of the backfill and the hydrostatic pressure of the groundwater at the repository depth. (L4-BAC-13) The plugs must be designed to maintain a backfilling function even after their hydraulic isolation capacity has been lost. (L4-BAC-14)
L3-BAC-19
The backfill shall contribute to prevent uplifting of the canister in the deposition hole.
Uplift would be accompanied by a reduction in buffer density, with potential detrimental effects on the buffer safety functions.
To keep the buffer in place, the design of the backfill has to take into account, on the one hand, the compressibility and structural stiffness of the backfill, and, on the other hand, the buffer swelling pressure and the friction of buffer against the deposition hole walls. (L4-BAC-30)

39
2.1.4 Closure
The closure system includes backfill of underground openings other than the deposition tunnels and various plugs and seals of shafts and tunnels, excluding the deposition tunnels.
Based on the safety functions for closure presented in Table 1-1, the following performance targets have been set (Table 2-4).
Table 2-4. Performance targets for the closure, main rationale and the related design requirements. The targets are discussed in more detail in Design Basis.
ID Performance target
Main rationale Related design requirements
L3-CLO-13
Unless otherwise stated, the closure materials and structures shall fulfill the performance targets over hundreds of thousands of years in the expected repository conditions except for incidental deviations.
After a period of a few hundreds of thousands of years, the radiological hazard of spent nuclear fuel will be similar to the one posed by the uranium it was originally made of.
The ground surface of the disposal area shall be landscaped to resemble its natural surroundings. (L4-CLO-6) Structures and materials that considerably obstruct unintentional intrusion shall be utilized in the closure of the uppermost parts of the facility and investigation holes extending to the ground surface. (L4-CLO-7) Structures and materials of the closure components shall be selected in such a way that the isolation functions of closure can be provided despite possible loadings related to glacial cycles, such as permafrost or changing groundwater chemical conditions. (L4-CLO-8) Rock materials shall be used increasingly as backfill when moving from the disposal depth up to the ground surface due to the increasing risk of clay erosion. (L4-CLO-9) Closure as a whole shall be so designed that the hydraulic connections from the disposal depth to the surface environment through the closed tunnels, shafts, and investigation holes are not better than through existing natural fractures and fracture zones. (L4-CLO-10) The closure as a whole shall be so designed that short-cuts from the deposition tunnels/deposition holes to existing significant groundwater flowpaths are prevented. (L4-CLO-12) The closure components shall keep the backfill and plugs of the deposition tunnels in place. (L4-CLO-21) The amount of chemical species harmful for canister/buffer/deposition tunnel backfill/host rock in closure components shall be limited. (L4-CLO-22)
L3-CLO-5
Closure shall complete the isolation of the spent nuclear fuel by reducing the likelihood of unintentional human intrusion through the closed volumes.
Unintentional human intrusion could otherwise lead to exposure of humans and the environment to radioactive substances.
Structures and materials of the closure components shall be selected in such a way that the isolation functions of closure can be provided despite possible loadings related to glacial cycles, such as permafrost or changing groundwater chemical conditions. (L4-CLO-8) The ground surface of the disposal area shall be landscaped to resemble its natural surroundings. (L4-CLO-6) Structures and materials that considerably obstruct unintentional intrusion shall be utilized in the closure of the uppermost parts of the facility and investigation holes extending to the ground surface. (L4-CLO-7)
L3-CLO- Closure shall Restoring of the Sections in the underground openings intersected by
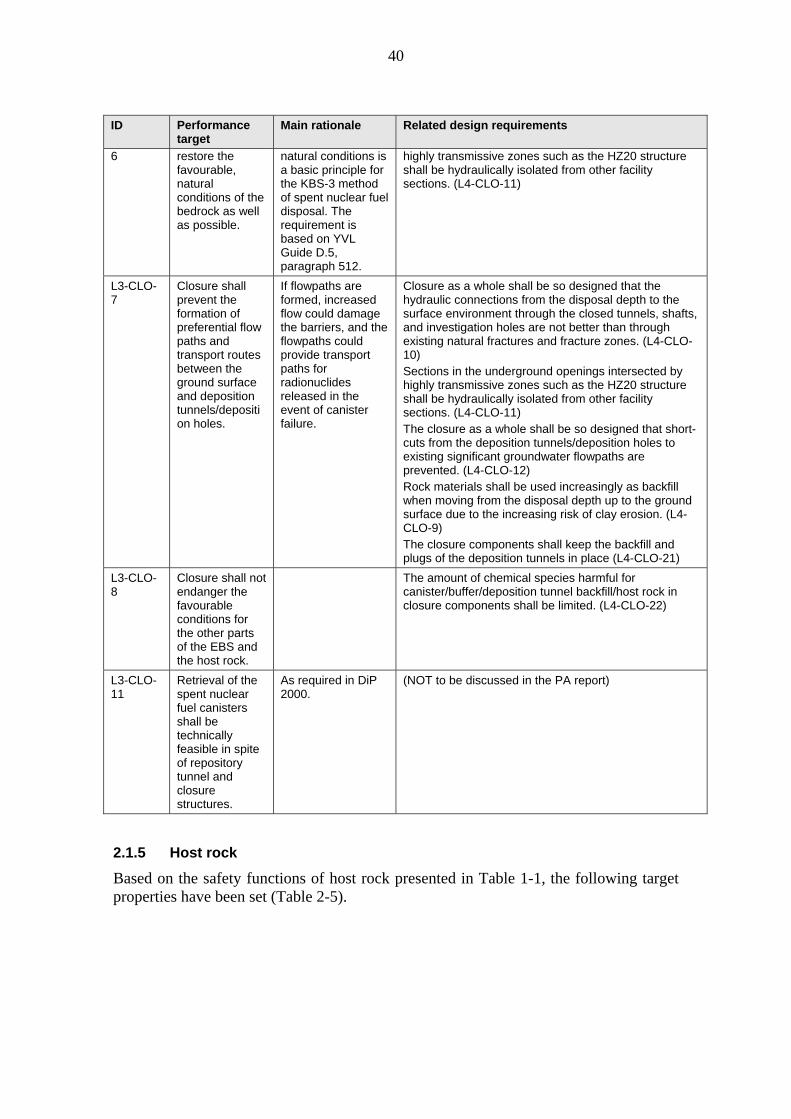
40
ID Performance target
Main rationale Related design requirements
6 restore the favourable, natural conditions of the bedrock as well as possible.
natural conditions is a basic principle for the KBS-3 method of spent nuclear fuel disposal. The requirement is based on YVL Guide D.5, paragraph 512.
highly transmissive zones such as the HZ20 structure shall be hydraulically isolated from other facility sections. (L4-CLO-11)
L3-CLO-7
Closure shall prevent the formation of preferential flow paths and transport routes between the ground surface and deposition tunnels/deposition holes.
If flowpaths are formed, increased flow could damage the barriers, and the flowpaths could provide transport paths for radionuclides released in the event of canister failure.
Closure as a whole shall be so designed that the hydraulic connections from the disposal depth to the surface environment through the closed tunnels, shafts, and investigation holes are not better than through existing natural fractures and fracture zones. (L4-CLO-10) Sections in the underground openings intersected by highly transmissive zones such as the HZ20 structure shall be hydraulically isolated from other facility sections. (L4-CLO-11) The closure as a whole shall be so designed that short-cuts from the deposition tunnels/deposition holes to existing significant groundwater flowpaths are prevented. (L4-CLO-12) Rock materials shall be used increasingly as backfill when moving from the disposal depth up to the ground surface due to the increasing risk of clay erosion. (L4-CLO-9) The closure components shall keep the backfill and plugs of the deposition tunnels in place (L4-CLO-21)
L3-CLO-8
Closure shall not endanger the favourable conditions for the other parts of the EBS and the host rock.
The amount of chemical species harmful for canister/buffer/deposition tunnel backfill/host rock in closure components shall be limited. (L4-CLO-22)
L3-CLO-11
Retrieval of the spent nuclear fuel canisters shall be technically feasible in spite of repository tunnel and closure structures.
As required in DiP 2000.
(NOT to be discussed in the PA report)
2.1.5 Host rock
Based on the safety functions of host rock presented in Table 1-1, the following target properties have been set (Table 2-5).
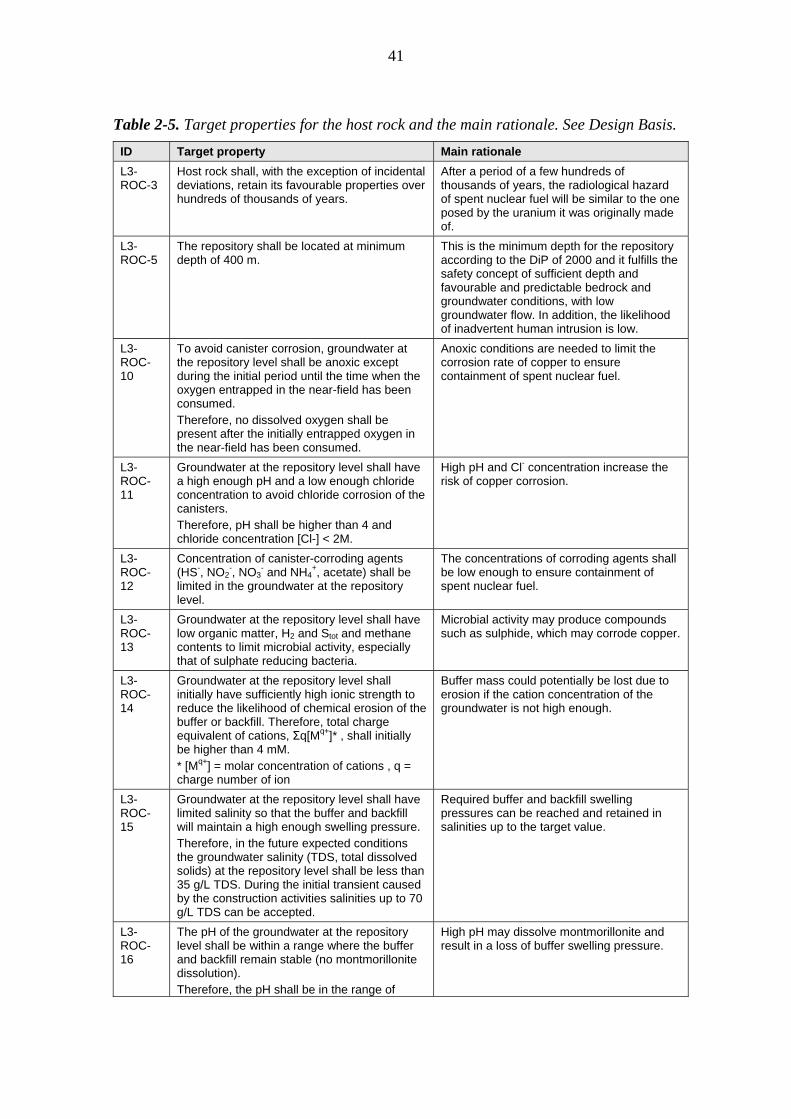
41
Table 2-5. Target properties for the host rock and the main rationale. See Design Basis.
ID Target property Main rationale
L3-ROC-3
Host rock shall, with the exception of incidental deviations, retain its favourable properties over hundreds of thousands of years.
After a period of a few hundreds of thousands of years, the radiological hazard of spent nuclear fuel will be similar to the one posed by the uranium it was originally made of.
L3-ROC-5
The repository shall be located at minimum depth of 400 m.
This is the minimum depth for the repository according to the DiP of 2000 and it fulfills the safety concept of sufficient depth and favourable and predictable bedrock and groundwater conditions, with low groundwater flow. In addition, the likelihood of inadvertent human intrusion is low.
L3-ROC-10
To avoid canister corrosion, groundwater at the repository level shall be anoxic except during the initial period until the time when the oxygen entrapped in the near-field has been consumed. Therefore, no dissolved oxygen shall be present after the initially entrapped oxygen in the near-field has been consumed.
Anoxic conditions are needed to limit the corrosion rate of copper to ensure containment of spent nuclear fuel.
L3-ROC-11
Groundwater at the repository level shall have a high enough pH and a low enough chloride concentration to avoid chloride corrosion of the canisters. Therefore, pH shall be higher than 4 and chloride concentration [Cl-] < 2M.
High pH and Cl- concentration increase the risk of copper corrosion.
L3-ROC-12
Concentration of canister-corroding agents (HS-, NO2
-, NO3- and NH4
+, acetate) shall be limited in the groundwater at the repository level.
The concentrations of corroding agents shall be low enough to ensure containment of spent nuclear fuel.
L3-ROC-13
Groundwater at the repository level shall have low organic matter, H2 and Stot and methane contents to limit microbial activity, especially that of sulphate reducing bacteria.
Microbial activity may produce compounds such as sulphide, which may corrode copper.
L3-ROC-14
Groundwater at the repository level shall initially have sufficiently high ionic strength to reduce the likelihood of chemical erosion of the buffer or backfill. Therefore, total charge equivalent of cations, Σq[Mq+]* , shall initially be higher than 4 mM. * [Mq+] = molar concentration of cations , q = charge number of ion
Buffer mass could potentially be lost due to erosion if the cation concentration of the groundwater is not high enough.
L3-ROC-15
Groundwater at the repository level shall have limited salinity so that the buffer and backfill will maintain a high enough swelling pressure. Therefore, in the future expected conditions the groundwater salinity (TDS, total dissolved solids) at the repository level shall be less than 35 g/L TDS. During the initial transient caused by the construction activities salinities up to 70 g/L TDS can be accepted.
Required buffer and backfill swelling pressures can be reached and retained in salinities up to the target value.
L3-ROC-16
The pH of the groundwater at the repository level shall be within a range where the buffer and backfill remain stable (no montmorillonite dissolution). Therefore, the pH shall be in the range of
High pH may dissolve montmorillonite and result in a loss of buffer swelling pressure.

42
ID Target property Main rationale
5−10, but initially a higher pH (up to 11) is allowed locally. The acceptable level also depends on silica and calcium concentrations.
L3-ROC-17
Concentration of solutes that can have a detrimental effect on the stability of buffer and backfill (K+, Fetot) shall be limited in the groundwater at the repository level.
High concentration of K+ causes illitisation and Fetot causes chloritisation of buffer and backfill.
L3-ROC-29
Groundwater conditions shall be reducing in order to have a stable fuel matrix and low solubility of the radionuclides.
The solubility of the fuel matrix, and thus also the release of radionuclides, as well as the solubilities of many radionuclides, are low under reducing groundwater conditions.
L3-ROC-31
In the vicinity of the deposition holes, natural groundwater shall have a low colloid and organic content to limit radionuclide transport.
Colloidal transport and complexation with organic materials potentially enhance transport of radionuclides.
L3-ROC-19
Under saturated conditions the groundwater flow in any fracture in the vicinity of a deposition hole shall be low to limit mass transfer to and from EBS. Therefore, the flow rate in such a fracture shall be in the order of one litre of flow per one metre of intercepting fracture width in a year (L/(m*year)) at the most. In case of more than one fracture, the sum of flow rates is applied.
Low groundwater flow is needed to limit erosion of buffer and limit the mass transfer from the fracture to the canister and from the buffer to the fracture e.g. in case of release of radionuclides.
L3-ROC-20
Flow conditions in the host rock shall contribute to high transport resistance. Therefore, migration paths in the vicinity of the deposition hole, shall have a transport resistance (WL/Q) higher than 10,000 years/m for most of the deposition holes and at least a few thousand years/m.
High transport resistance delays the transport of possible radionuclide releases and limits their effects on the biosphere.
L3-ROC-21
Inflow of groundwater to deposition tunnels shall be limited to ensure the performance of the backfill.
Sufficiently low groundwater flow is needed to avoid the possibility that the backfill will be eroded to the extent that its safety functions are compromised.
L3-ROC-33
The properties of the host rock shall be favourable for matrix diffusion and sorption.
Matrix diffusion and sorption both delay and spread the migration of any radionuclides released in the event of canister failure.
L3-ROC-23
The location of the deposition holes shall be selected so as to minimise the likelihood of rock shear movements large enough to break the canister. Therefore, the likelihood of a shear displacement exceeding 5 cm shall be low.
Shear movements may damage the canisters; therefore structures that could potentially undergo such movements are avoided as far as possible.
L3-ROC-30
To ascertain the data for sorption parameters, the pH shall be in the range of 6−10 after the initial period when a higher pH of up to 11 is allowed.
Sorption of radionuclides depends both on the pH and on the ionic strength of the groundwater, and on the redox conditions. The behaviour of the important nuclides are known for the expected pH range.
2.2 RSC, design requirements and specifications
2.2.1 Rock Suitability Classification
Posiva has developed a rock classification system, Rock Suitability Classification (RSC), to define suitable volumes for repository design and construction (McEwen et al. 2013). This system includes criteria for defining volumes of rock suitable for the

43
repository panels, the assessment of whether deposition tunnels or tunnel sections are suitable for locating deposition holes, and the acceptance of a deposition hole for disposal, based on the rock properties. The aim is to avoid features of the host rock that may be detrimental to the favourable conditions for the repository either at the initial state or in the long term. The target properties presented in the previous section outline the conditions that are considered to be favourable. The criteria developed for use in the classification process need to be based on observable and measurable properties of the host rock. These RSC criteria constrain the rock properties around the repository. Based on further interpretation, modelling and general understanding of the site properties, it is shown that the target properties for the host rock (see Section 2.1.5) can be fulfilled if appropriate RSC criteria are applied.
Classification of the host rock by applying the RSC criteria (McEwen et al. 2013) is carried out at different scales, including repository, panel, tunnel, and deposition hole scales, and applied at different stages of the investigation and excavation work. Classification at the repository scale aims to define the rock volumes to be used for repository layout planning. Consequently, so-called layout determining features (LDFs) and their respect volumes that are to be avoided when locating deposition tunnels and holes are defined. Bedrock structures defined as LDFs are either large fault zones potentially mechanically unstable in the current or future stress field, or they are main groundwater flow routes important for transport of solutes and chemical stability at the site. Classification at the panel scale aims to define suitable areas for the tunnels within a certain panel and to assess the degree of utilisation1 of the panel area for the detailed design of the panel. The classification is carried out based on the more detailed data on deformation zones and hydraulically conductive zones that will become available during the construction of central tunnels for the specific panel. The tunnel scale classification aims at defining suitable tunnel sections for the deposition holes, so that the LDFs and smaller, local deformation zones and their respect volumes, large fractures and high inflow to the deposition holes are avoided. At the deposition hole scale, the fulfilment of the rock suitability criteria is checked as part of the acceptance procedure for each deposition hole. RSC criteria are also discussed in Design Basis along with other design requirements and specifications.
2.2.2 Design requirements
Design requirements are more detailed requirements derived from performance targets and target properties, which are found in VAHA level 4. The design requirements of each EBS component and underground openings are discussed in Design Basis.
2.2.3 Design specifications
Design specifications are the detailed quantitative requirements which have been derived from the more general design requirements. They are defined so that the safety functions and performance targets are initially achieved and will be upheld in the expected conditions during the time window for which the spent nuclear fuel presents a significant hazard. Design specifications form level 5 in VAHA. The design
1 The degree of utilisation is determined by the number of suitable deposition holes with respect to the theoretical maximum number and is related to whether the volume of rock is being used in an economical and effective manner.

44
specifications are discussed in the Production Line reports for each component and also presented in Description of the Disposal System.

45
3 INITIAL STATE
A schematic presentation of the disposal facility to be constructed at Olkiluoto is given in Figure 1-1. The repository depth will be around 400 to 450 m, which is the depth range for the deposition tunnel floor according to Saanio et al. (2013). This depth has been considered to fulfil requirement 412 in YVL D.5, draft 17.3.2011 (Design Basis). In the context of this report and the whole TURVA-2012 safety case, it is anticipated that 9000 tU will be disposed of in the Olkiluoto disposal facility corresponding to 4500 canisters. It is expected that disposal will commence around 2020 (Figure 1-3).
In this chapter, the initial state for each repository system component: host rock, canister, buffer, deposition tunnel backfill, deposition tunnel plug and closure is given. The initial state serves as a starting point for the analysis of the operational period presented in Chapter 5.
The initial state of the host rock refers to the “natural state” of the host rock and the baseline conditions before the ONKALO and repository excavation, against which the changes caused by the construction, operation and closure of the disposal facility can be evaluated. The definition of the initial state of an engineered component is in general (see component specific definitions in Description of the Disposal System and below) “the state it has when the direct control over that specific part of the system ceases and only limited information can be made available on the subsequent development of conditions in that part of the system or its near field”. The operations at the site will last up to ~100 years, meaning that the initial states of the different components are not achieved at the same time. The stepwise-approach in the operation means that excavation and disposal activities are carried out at the same time and that some of the panels consisting of several deposition tunnels will have been closed before others have been excavated. A preliminary schedule for the operational period is given in Saanio et al. (2013).
The initial state of the repository system is described in detail in Description of the Disposal System and in production line reports for each of the components (Canister, Buffer, Backfill, Closure and Underground Openings Production Line reports), where attention has been given to showing that the design conforms to the requirements (presented in Chapter 2 and Design Basis). The initial state of the underground openings and the host rock properties in the vicinity of the deposition holes are constrained by the Rock Suitability Classification (RSC) (see Section 2.2.1). The target properties for the host rock (see Section 2.1.5) are fulfilled at the initial state when suitable RSC criteria are applied. In the context of this Performance Assessment, the initial state is given based on the content in the documents mentioned above, but, as the performance assessment started prior to the latest developments in the design, the input data for some analyses differ from the initial state presented in Description of the Disposal System. These differences are mentioned and their significance, if any, is discussed in this report when necessary as well as in Models and Data for the Repository System.
3.1 Site description
The description of the Olkiluoto site is presented in Site Description and the present state of the surface environment in Biosphere Description. The initial state of the site

46
and the present state of the surface environment have been summarised in Description of the Disposal System. As noted in Section 1.5, the surface environment has neither safety functions nor performance requirements. However, knowledge of the surface geology, hydrogeology and hydrogeochemistry are of importance in the understanding of the groundwater flow and its composition at the Olkiluoto site.
Geology
The repository is to be excavated on Olkiluoto Island in south-western Finland (see Figure 1-2). The crystalline bedrock of Finland is a part of the Precambrian Fennoscandian Shield which, in south-western Finland, consists mainly of Early Palaeoproterozoic metamorphic and igneous rocks, belonging to the Svecofennian Domain. This domain developed between 1930 Ma and 1800 Ma ago, either during one long Svecofennian orogeny, or during several, separate orogenies. The rocks of Olkiluoto can be divided into two major classes (Aaltonen et al. 2010, see also Figure 3-1). The first are supracrustal high-grade metamorphic rocks including various migmatitic gneisses, tonalitic-granodioritic-granitic gneisses, mica gneisses, quartz gneisses, and mafic gneisses, and the second are igneous rocks including pegmatitic granites and diabase dykes. The metamorphic supracrustal rocks have been subjected to polyphase ductile deformation producing thrust-related folding, shearing, strong migmatisation and pervasive foliation. The most important rock-forming minerals in the Olkiluoto rocks are quartz, potassium feldspar, plagioclase, biotite (± other micas) and hornblende (± other amphiboles).
The overburden at Olkiluoto, with average thickness of 2–5 m and with varying stratigraphy, is from the Quaternary. The land surface shows relatively flat topography, smoothing out the height variability in the bedrock. The surface system (including the overburden and the surface hydrogeology and hydrogeochemistry) is described in detail in Biosphere Description.
The bedrock at Olkiluoto has been subjected to extensive hydrothermal alteration processes, which are estimated to have taken place at temperatures from slightly over 300 °C down to 50 °C (Gehör et al. 2002). Based on the grade of alteration, two different types of hydrothermal alteration can be distinguished: a fracture-controlled type and a pervasive (or disseminated) type. The fracture-controlled alteration indicates that hydrothermal fluids have passed through the rock along planar features, with the alteration being restricted to incipient fractures or narrow zones adjacent to them. The pervasive alteration indicates the strongest type of alteration − it occurs as spots or is finely disseminated throughout the rock and in the fracture fillings. The main hydrothermal alteration minerals in the Olkiluoto bedrock are illite, kaolinite, sulphides and calcite. The overall trend of alteration at Olkiluoto is the replacement of framework silicates by sheet silicates. Typically, the episodic alteration at Olkiluoto has increased the concentrations of CO2 and Ca of the whole rock composition, and the altered rocks at Olkiluoto have undergone K-metasomatism; K gain and Na+Ca loss.
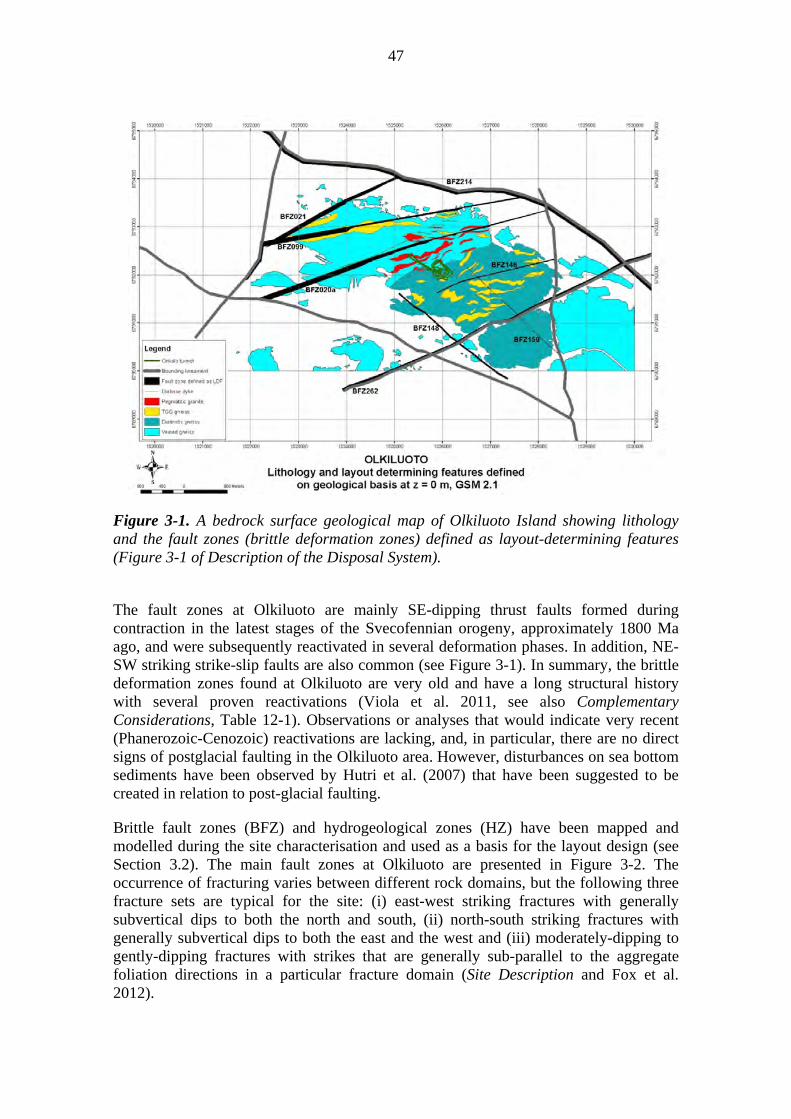
47
Figure 3-1. A bedrock surface geological map of Olkiluoto Island showing lithology and the fault zones (brittle deformation zones) defined as layout-determining features (Figure 3-1 of Description of the Disposal System).
The fault zones at Olkiluoto are mainly SE-dipping thrust faults formed during contraction in the latest stages of the Svecofennian orogeny, approximately 1800 Ma ago, and were subsequently reactivated in several deformation phases. In addition, NE-SW striking strike-slip faults are also common (see Figure 3-1). In summary, the brittle deformation zones found at Olkiluoto are very old and have a long structural history with several proven reactivations (Viola et al. 2011, see also Complementary Considerations, Table 12-1). Observations or analyses that would indicate very recent (Phanerozoic-Cenozoic) reactivations are lacking, and, in particular, there are no direct signs of postglacial faulting in the Olkiluoto area. However, disturbances on sea bottom sediments have been observed by Hutri et al. (2007) that have been suggested to be created in relation to post-glacial faulting.
Brittle fault zones (BFZ) and hydrogeological zones (HZ) have been mapped and modelled during the site characterisation and used as a basis for the layout design (see Section 3.2). The main fault zones at Olkiluoto are presented in Figure 3-2. The occurrence of fracturing varies between different rock domains, but the following three fracture sets are typical for the site: (i) east-west striking fractures with generally subvertical dips to both the north and south, (ii) north-south striking fractures with generally subvertical dips to both the east and the west and (iii) moderately-dipping to gently-dipping fractures with strikes that are generally sub-parallel to the aggregate foliation directions in a particular fracture domain (Site Description and Fox et al. 2012).
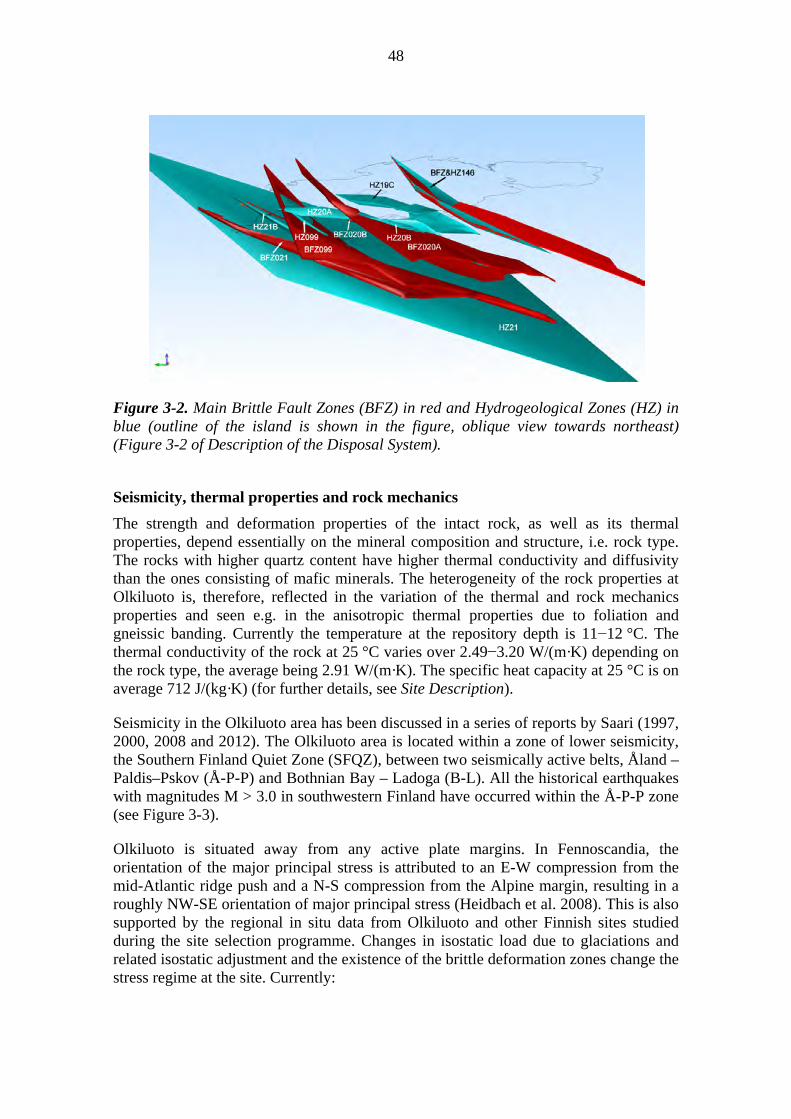
48
Figure 3-2. Main Brittle Fault Zones (BFZ) in red and Hydrogeological Zones (HZ) in blue (outline of the island is shown in the figure, oblique view towards northeast) (Figure 3-2 of Description of the Disposal System).
Seismicity, thermal properties and rock mechanics
The strength and deformation properties of the intact rock, as well as its thermal properties, depend essentially on the mineral composition and structure, i.e. rock type. The rocks with higher quartz content have higher thermal conductivity and diffusivity than the ones consisting of mafic minerals. The heterogeneity of the rock properties at Olkiluoto is, therefore, reflected in the variation of the thermal and rock mechanics properties and seen e.g. in the anisotropic thermal properties due to foliation and gneissic banding. Currently the temperature at the repository depth is 11−12 °C. The thermal conductivity of the rock at 25 °C varies over 2.49−3.20 W/(m·K) depending on the rock type, the average being 2.91 W/(m·K). The specific heat capacity at 25 °C is on average 712 J/(kg·K) (for further details, see Site Description).
Seismicity in the Olkiluoto area has been discussed in a series of reports by Saari (1997, 2000, 2008 and 2012). The Olkiluoto area is located within a zone of lower seismicity, the Southern Finland Quiet Zone (SFQZ), between two seismically active belts, Åland – Paldis–Pskov (Å-P-P) and Bothnian Bay – Ladoga (B-L). All the historical earthquakes with magnitudes M > 3.0 in southwestern Finland have occurred within the Å-P-P zone (see Figure 3-3).
Olkiluoto is situated away from any active plate margins. In Fennoscandia, the orientation of the major principal stress is attributed to an E-W compression from the mid-Atlantic ridge push and a N-S compression from the Alpine margin, resulting in a roughly NW-SE orientation of major principal stress (Heidbach et al. 2008). This is also supported by the regional in situ data from Olkiluoto and other Finnish sites studied during the site selection programme. Changes in isostatic load due to glaciations and related isostatic adjustment and the existence of the brittle deformation zones change the stress regime at the site. Currently:
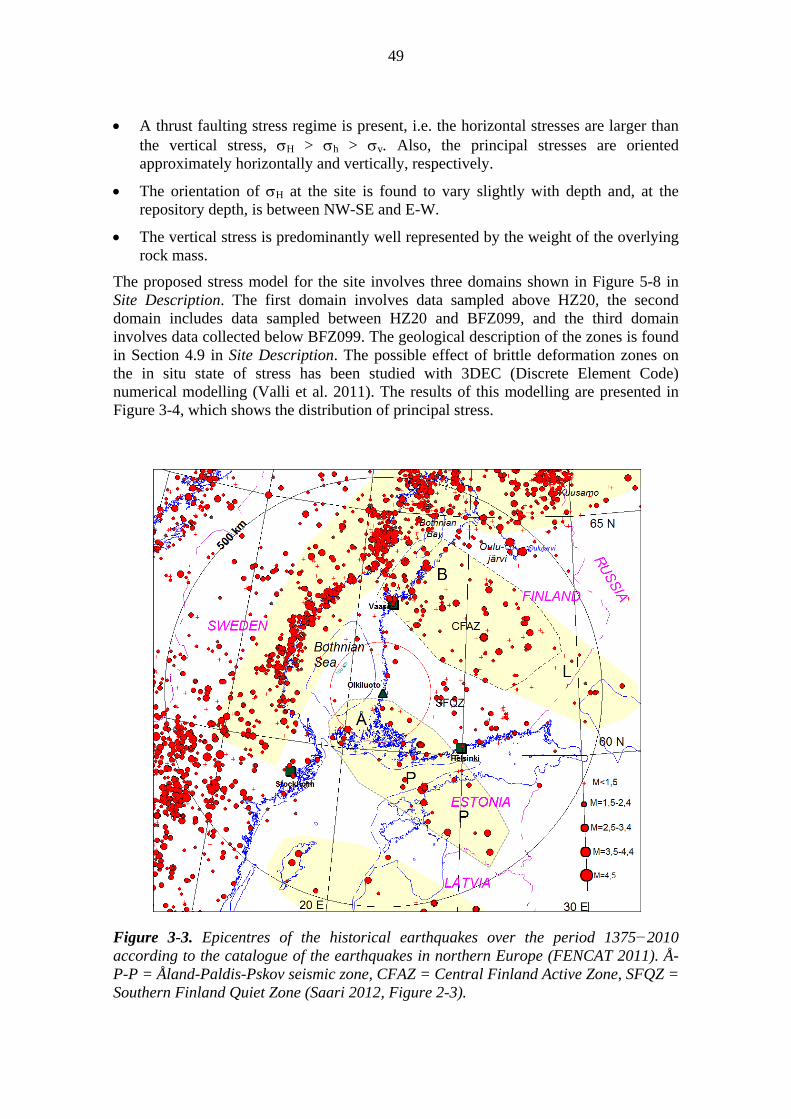
49
A thrust faulting stress regime is present, i.e. the horizontal stresses are larger than the vertical stress, H > h > v. Also, the principal stresses are oriented approximately horizontally and vertically, respectively.
The orientation of H at the site is found to vary slightly with depth and, at the repository depth, is between NW-SE and E-W.
The vertical stress is predominantly well represented by the weight of the overlying rock mass.
The proposed stress model for the site involves three domains shown in Figure 5-8 in Site Description. The first domain involves data sampled above HZ20, the second domain includes data sampled between HZ20 and BFZ099, and the third domain involves data collected below BFZ099. The geological description of the zones is found in Section 4.9 in Site Description. The possible effect of brittle deformation zones on the in situ state of stress has been studied with 3DEC (Discrete Element Code) numerical modelling (Valli et al. 2011). The results of this modelling are presented in Figure 3-4, which shows the distribution of principal stress.
Figure 3-3. Epicentres of the historical earthquakes over the period 1375−2010 according to the catalogue of the earthquakes in northern Europe (FENCAT 2011). Å-P-P = Åland-Paldis-Pskov seismic zone, CFAZ = Central Finland Active Zone, SFQZ = Southern Finland Quiet Zone (Saari 2012, Figure 2-3).
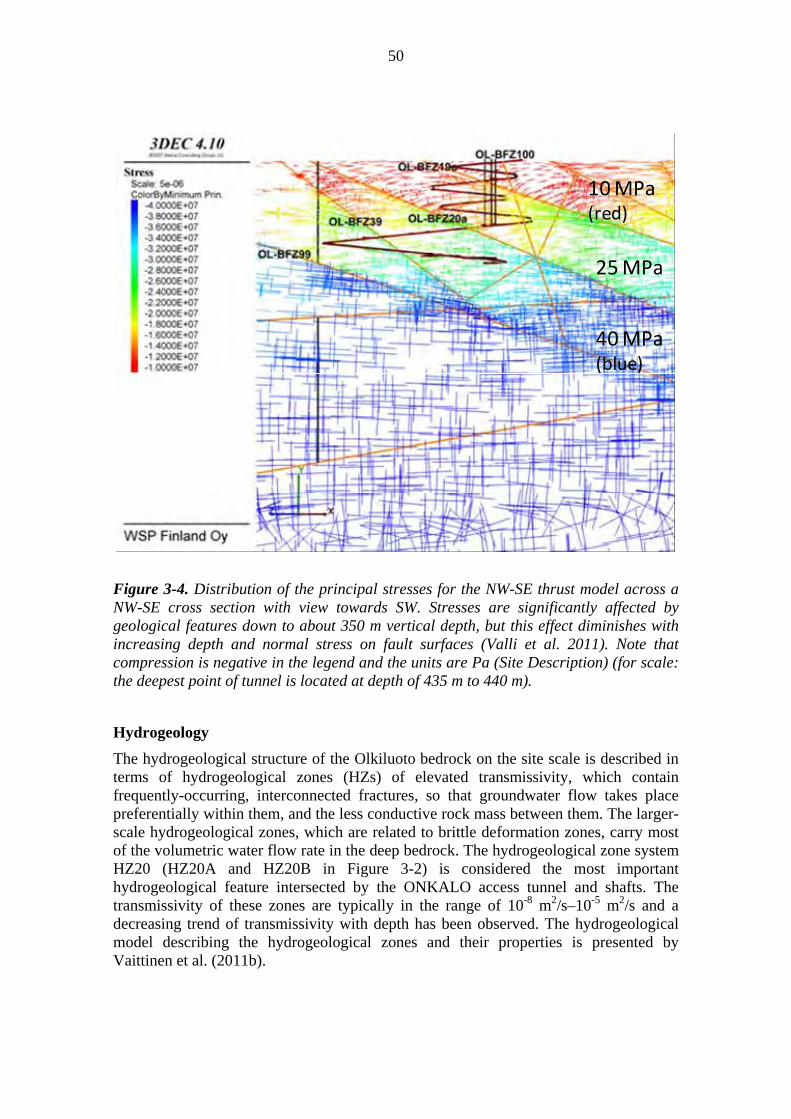
50
Figure 3-4. Distribution of the principal stresses for the NW-SE thrust model across a NW-SE cross section with view towards SW. Stresses are significantly affected by geological features down to about 350 m vertical depth, but this effect diminishes with increasing depth and normal stress on fault surfaces (Valli et al. 2011). Note that compression is negative in the legend and the units are Pa (Site Description) (for scale: the deepest point of tunnel is located at depth of 435 m to 440 m).
Hydrogeology
The hydrogeological structure of the Olkiluoto bedrock on the site scale is described in terms of hydrogeological zones (HZs) of elevated transmissivity, which contain frequently-occurring, interconnected fractures, so that groundwater flow takes place preferentially within them, and the less conductive rock mass between them. The larger-scale hydrogeological zones, which are related to brittle deformation zones, carry most of the volumetric water flow rate in the deep bedrock. The hydrogeological zone system HZ20 (HZ20A and HZ20B in Figure 3-2) is considered the most important hydrogeological feature intersected by the ONKALO access tunnel and shafts. The transmissivity of these zones are typically in the range of 10-8 m2/s–10-5 m2/s and a decreasing trend of transmissivity with depth has been observed. The hydrogeological model describing the hydrogeological zones and their properties is presented by Vaittinen et al. (2011b).
10 MPa(red)
25MPa
40 MPa(blue)
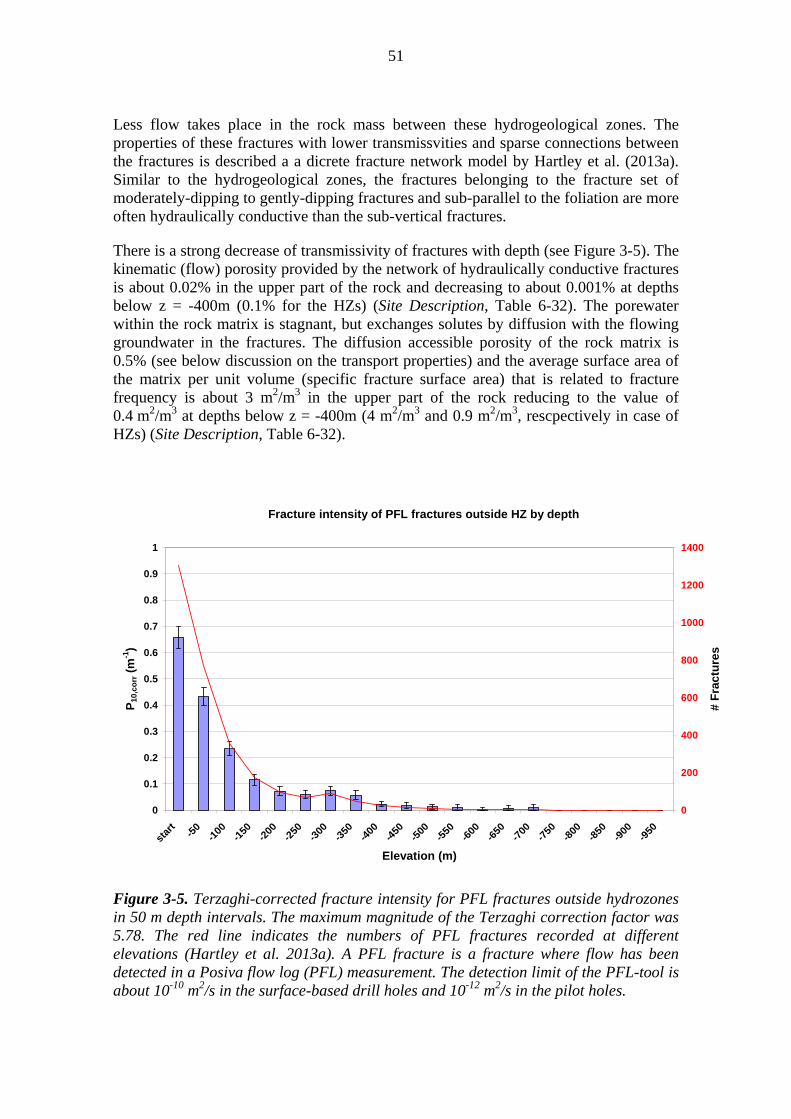
51
Less flow takes place in the rock mass between these hydrogeological zones. The properties of these fractures with lower transmissvities and sparse connections between the fractures is described a a dicrete fracture network model by Hartley et al. (2013a). Similar to the hydrogeological zones, the fractures belonging to the fracture set of moderately-dipping to gently-dipping fractures and sub-parallel to the foliation are more often hydraulically conductive than the sub-vertical fractures.
There is a strong decrease of transmissivity of fractures with depth (see Figure 3-5). The kinematic (flow) porosity provided by the network of hydraulically conductive fractures is about 0.02% in the upper part of the rock and decreasing to about 0.001% at depths below z = -400m (0.1% for the HZs) (Site Description, Table 6-32). The porewater within the rock matrix is stagnant, but exchanges solutes by diffusion with the flowing groundwater in the fractures. The diffusion accessible porosity of the rock matrix is 0.5% (see below discussion on the transport properties) and the average surface area of the matrix per unit volume (specific fracture surface area) that is related to fracture frequency is about 3 m2/m3 in the upper part of the rock reducing to the value of 0.4 m2/m3 at depths below z = -400m (4 m2/m3 and 0.9 m2/m3, rescpectively in case of HZs) (Site Description, Table 6-32).
Figure 3-5. Terzaghi-corrected fracture intensity for PFL fractures outside hydrozones in 50 m depth intervals. The maximum magnitude of the Terzaghi correction factor was 5.78. The red line indicates the numbers of PFL fractures recorded at different elevations (Hartley et al. 2013a). A PFL fracture is a fracture where flow has been detected in a Posiva flow log (PFL) measurement. The detection limit of the PFL-tool is about 10-10 m2/s in the surface-based drill holes and 10-12 m2/s in the pilot holes.
Fracture intensity of PFL fractures outside HZ by depth
0
0.1
0.2
0.3
0.4
0.5
0.6
0.7
0.8
0.9
1
star
t-5
0-1
00-1
50-2
00-2
50-3
00-3
50-4
00-4
50-5
00-5
50-6
00-6
50-7
00-7
50-8
00-8
50-9
00-9
50
Elevation (m)
P10
,co
rr (
m-1
)
0
200
400
600
800
1000
1200
1400
# F
rac
ture
s
52
Under natural conditions, groundwater flow at Olkiluoto occurs mainly as a response to freshwater infiltration dependent on the topography, although salinity (density) variation driven flow also takes place to a lesser extent. Crustal uplift has affected (and will continue to affect) the hydrogeological conditions at Olkiluoto, which is reflected also in the hydrogeochemistry (see below). Recharge to groundwater circulation in the bedrock at Olkiluoto is estimated to be equal to c. 1% (c. 5 mm/a) of the annual precipitation (Karvonen 2010, Site Description, Section 6.4). Recharge takes place mainly from the area of the island and discharge locations are in the straits north and south of the island.
Groundwater composition
The groundwater composition reflects the hydrogeological history of the Olkiluoto area, specifically:
the slow interaction between the fracture groundwater, porewater in rock matrix and the rock minerals over millions of years, and
the effects of periods of glaciation and associated infiltration of fresh meltwater, submersion below sea-level and the influence of marine water, and finally the emergence of the island and meteoric infiltration.
Currently, the groundwater composition over the depth range 0–1000 m at Olkiluoto is characterised by a significant range in salinity and dissolved gases and forms a relatively layered system. However, groundwater types overlap each other at certain depths (see Table 3-1, Figure 3-6, Figure 3-7, Figure 3-8 and Site Description, Chapter 7). Fresh waters (with total dissolved solids (TDS) <1 g/L) rich in dissolved carbonate are found at shallow depths, in the uppermost tens of metres. Brackish groundwater, with salinity up to 10 g/L dominates at depths between 30 m and about 400 m. Sulphate-rich waters are particularly common in the depth layer 100−300 m, whereas brackish chloride water, poor in sulphate, dominates at depths of 300−400 m. Saline groundwaters (salinity >10 g/L) dominate at still greater depths. The highest salinity in groundwater samples observed so far is 84 g/L at a depth of 850 m. However, monitoring of electrical conductivity in drillhole water indicates over 100 g/L salinities below 900 m depth in the drillhole OL-KR1 (Pöllänen & Rouhiainen 2005, Appendix 1.9, Site Description). At the initial state, salinity at the repository level is slightly above 10 g/L (see Table 3-1 and Figure 3-6).
The variation of TDS, Cl, dissolved inorganic carbon (DIC) and K with depth and groundwater type are shown in Figure 3-6 and those of SO4, CH4, Fe2+ and HS- in Figure 3-7. The contents of nitrites, nitrates, ammonium and acetates are low in the groundwater at Olkiluoto and introduction of these during the construction phase is restricted. Sodium and calcium are the dominant cations in all groundwaters and they show similar trends to TDS and Cl, whereas potassium and magnesium follow SO4 in the upper part of the bedrock (Site Description, Figure 7-8). All major ions, Na, Ca, K, Mg, Cl, SO4 and HCO3 (as DIC in Figure 3-6), have reasonably coherent trends with depth in brackish Cl type and saline groundwaters. However, at shallower depths, in HCO3- and SO4-rich groundwater types, ionic compositions clearly deviate from the deep trends. These data indicate that there is a hydrogeochemical discontinuum between deep and shallow groundwater types and the interface between the shallow and deep aquifers is at approximately 300 m depth. The origin of the deep groundwaters is

53
different from the groundwater types present at shallower depths and there has been limited interaction between the deep and shallow aquifers. At shallow depths, above the interface, earlier groundwater types have been replaced by younger infiltration, which has mainly caused the observed concentration changes at this interface, rather than chemical reactions with sinks and sources of elements.
The hydrogeochemical conditions and their variation in the bedrock are the result of reactions and progressive mixing between various initial water types, which represent some of the major events at the site before the Quaternary and during the Quaternary glacial cycles, over the last approximately two million years. The five initial waters that govern the current groundwater compositions by mixing have been recognised to be, from oldest to youngest, (i) ancient brine (possibly Palaeozoic), which is mainly diluted by (ii) pre-Weichselian meteoric water, (iii) glacial meltwater from the Weichselian glaciation (116–10 ka ago), (iv) Littorina seawater, and (v) current meteoric water (Table 3-1, Site Description, Section 7.3.9 and 11.4.1). Present-day Baltic seawater, which is basically diluted Littorina seawater, is also recognised at shallow depths.
The dilution of deep saline groundwater is probably an event that occurred earlier than the last glaciation. The original brine end-member seems to have been mixed with pre-Weichselian meteoric water during earlier Quaternary glacial cycles. Brackish Cl-type groundwaters represent the end-product of this dilution. The more shallow groundwaters, in the depth range down to 300 m, have been affected by infiltrating waters of glacial, marine and meteoric origin during the alternating periods of glaciations and interglacials. However, features only from the latest Weichselian glaciation and postglacial period are observed, indicating the dynamic hydrogeological characteristic of this upper bedrock compared to the deeper one.
The matrix porewaters are rather different from those of fracture groundwater as they are exchanged more slowly. In particular, porewaters have partly similar salinity and partly lower salinity compared with nearby fracture groundwater. In the upper part of the bedrock (0−150 m), however, compositions suggest similar origin and strong interaction between these two groundwater deposits. At deeper levels (> 150 m), the matrix porewater is less saline and increasingly enriched in δ18O which has been interpreted to represent long-term dilute water conditions in fractures during a warm climate, referring probably to the preglacial Tertiary period (Site Description, Section 7.3.9). Another explanation for the salinity differences between matrix pores and fractures may be anion exclusion, which may limit the void sizes accessible to anions in matrix pores, due to electrostatic forces. Thus, anion concentrations in the accessible matrix pore volume may be closer to the fracture water concentrations than those obtained in measurements applying a water saturation method and considering the total connective porosity (Site Description, Section 11.4.1).
In summary, the results suggest that, after deep brine formation, potentially during the Palaeozoic, dilute groundwater replaced saline groundwater in the bedrock. Later, during the Quaternary, brine started to rise in the bedrock, for example due to a regional hydraulic gradient, resulting from repeated glacial cycles and sea level changes in the Baltic Basin. However, if anion exclusion is taken into account, it is also possible that there is equilibrium between the salinities in matrix pores and in fractures, and that the

54
hypothesis of the Tertiary displacement of saline groundwater deep in the Olkiluoto bedrock is unnecessary to explain the observed results.
Table 3-1. Groundwater types and their origin at Olkiluoto (in the water-conductive fracture system, baseline conditions), observed depth range, total dissolved solids (TDS), redox conditions and pH (according to Site Description, Ch. 7).
Groundwater types; dominant origin and mixing evidence in groundwater samples
Depth range (z), masl
TDS g/L
Redox conditions
pH
Fresh HCO3; Meteoric infiltration
+10 – -40 <1 Oxic to Anoxic
5.2–8.1
Brackish HCO3;
Mixing of meteoric infiltration with Littorina2 Sea derived SO4-rich brackish groundwater
0 – -130 1−3 Sulphidic 7.6–8.1
Brackish SO4; Littorina seawater and glacial meltwater mixed with ancient meteoric water - saline groundwater mixture
-60 – -300 4−9 Sulphidic 7.1–8.1
Brackish Cl; Pre-Weichselian meteoric water - saline groundwater mixture with minor Littorina seawater component
-100 – -400 2−10 Sulphidic to Methanic
7.3–8.8
Saline Na-Ca-Cl; Pre-Weichselian meteoric water - saline groundwater mixture
-320 – -480 10−18 Methanic 7.3–8.2
Saline Ca-Na-Cl; Pre-Weichselian saline groundwater -meteoric water mixture
-410 – -570 18−30 Methanic 7.6–8.4
Highly saline Ca-Na-Cl; Pre-Weichselian brine3 - meteoric water mixture
below -570 >30 Methanic 7.0–8.1
2 During the end of the Weichselian glaciation, the Baltic Sea developed to its current state via alternating lacustrine and marine stages that were Baltic Ice Lake (until 11,590 years before present (BP)), Yoldia Sea (11,590–10,800 BP), Ancylus Ice Lake (10,800–9000 BP), Mastogloia Sea (9000–8000 BP), Littorina Sea (8000–3000 BP) and Baltic Sea (3000 BP–present). Olkiluoto was free of ice cover around 11,000 BP and emerged from Baltic Sea around 3000 BP (Eronen et al. 1995). 3 TDS in brine water is more than 100 g/L.

55
Figure 3-6. a) TDS, b) Cl-, c) dissolved inorganic carbon (DIC), and d) K+ concentrations as a function of depth at Olkiluoto (Site Description).
pH and redox conditions
Water-rock interactions and chemical reactions, such as carbon and sulphur cycling and silicate reactions, buffer the pH and redox conditions and stabilise the groundwater chemistry (see Table 3-1 and Figure 3-7). In addition, weathering processes, both in the overburden and in the shallow bedrock, during infiltration play a major role in determining the shallow groundwater composition. In Figure 3-7, the baseline

56
groundwater conditions at Olkiluoto are illustrated, including indications of the main water-rock interactions and chemical reactions. The dissolution of calcite and silicates neutralises pH in groundwater over short flow paths and they form a significant buffer against acid intrusion into the bedrock. The tendency to attain calcite equilibrium at an early stage of groundwater infiltration indicates that calcite controls pH and buffers it to slightly alkaline conditions. The general occurrence of calcite in fractures without any significant dissolution structures, even at shallow depths, and the age of these calcites (Sahlstedt et al. 2009, 2013a, b, Site Description) prove that not even significant
Figure 3-7. Illustrative hydrogeochemical site model of baseline groundwater conditions with the main water-rock interactions at Olkiluoto. Colours indicate different water types and the gradations between them. The hydrogeologically most significant zones are represented. Blue arrows represent flow directions and diffusion (double ended) in low transmissive fractures. Text boxes contain the main sources and sinks affecting pH and redox conditions. Chemical reactions are most active in the infiltration zone at shallow depths, and at the interface between Na-Cl-SO4 and Na-Cl groundwater types. Note that the illustration depicts hydrogeochemical conditions in a variably conductive fracture system. However, according to Br and Cl measurements in matrix pore waters, the distribution of water types is similar in pore spaces, although salinity reaches 10 g/L in matrix pore water first at 600 m depth, compared with generally around 400 m in fracture groundwaters (Site Description).

57
environmental and hydrogeological changes during glacial cycles in the past were able to destabilise hydrogeochemical conditions and the buffering capacity of calcite infills, and thus the alkaline conditions are also likely to persist in the future. At the initial state at the repository depth, the groundwater pH is close to neutral (slightly alkaline) (Table 3-1).
Redox conditions at Olkiluoto are anoxic except locally in shallow infiltrating groundwater. The relatively high contents of dissolved ferrous iron (Fe2+) and observable sulphide (HS-) and CH4 are clear indicators of anaerobic conditions even at shallow depth (Figure 3-8). Scarce observations of iron oxyhydroxides on fracture surfaces at depths in excess of ten metres in the bedrock and the lack of corroded pyrites support the assumption of long-term reducing conditions in the deep groundwater, see Table 3-1. Instead, pyrite and other iron sulphides are common in water-conducting fractures throughout the investigated depth range (down to 1000 m), indicating a strong lithological buffer against oxic waters over geological time scales (Sahlstedt et al. 2009, 2013a, b). Two natural metastable interfaces are present (Figure 3-7). The upper is located mostly in the overburden, where the conditions change from oxic to anoxic. The lower is located at a depth of approximately 250–350 m. In this zone, sulphate-rich groundwater is mixed with methane-rich (including also other short-chain hydrocarbons) brackish-Cl - saline groundwater to give rise, at least locally, to exceptionally high levels of dissolved sulphide as a microbially mediated reaction product (Figure 3-8 and Figure 3-7). The content of ferrous iron tends to be lowest between 200 to 400 m depth (Figure 3-8), mainly in brackish Cl groundwaters, where the dissolved sulphide contents reach their maximum values. At this lower interface, between sulphidic and methanic redox environments (corresponding to brackish SO4- and brackish Cl-types), the instability of SO4 and CH4 in a common system has been considered to result in the formation of dissolved sulphide and carbonate as reaction products in microbial processes. The distribution of SO4
2-, HS- and CH4 (Figure 3-8) at Olkiluoto suggests the microbial use of CH4 in SO4 reduction (see the following sections), although the details of the mechanism are still unclear. However, the change from SO4 dominance to CH4 dominance at this interface is mostly due to replacement of CH4-rich groundwater by younger SO4-rich groundwater.
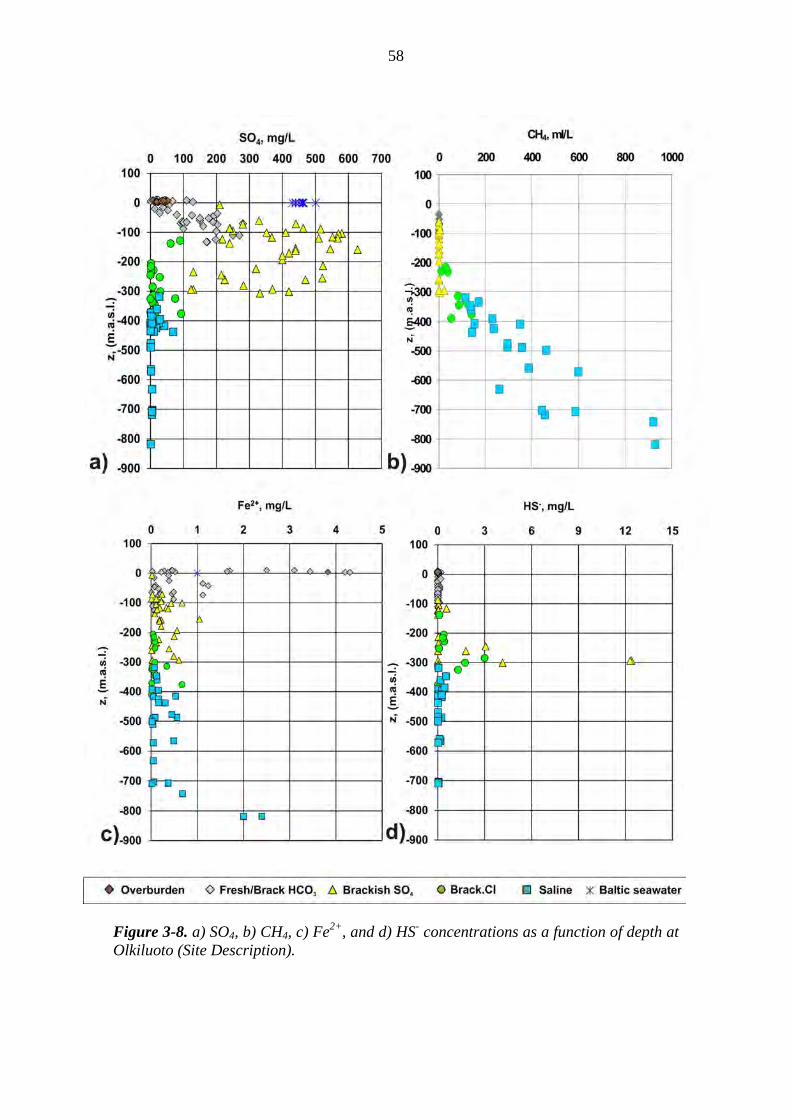
58
Figure 3-8. a) SO4, b) CH4, c) Fe2+, and d) HS- concentrations as a function of depth at Olkiluoto (Site Description).
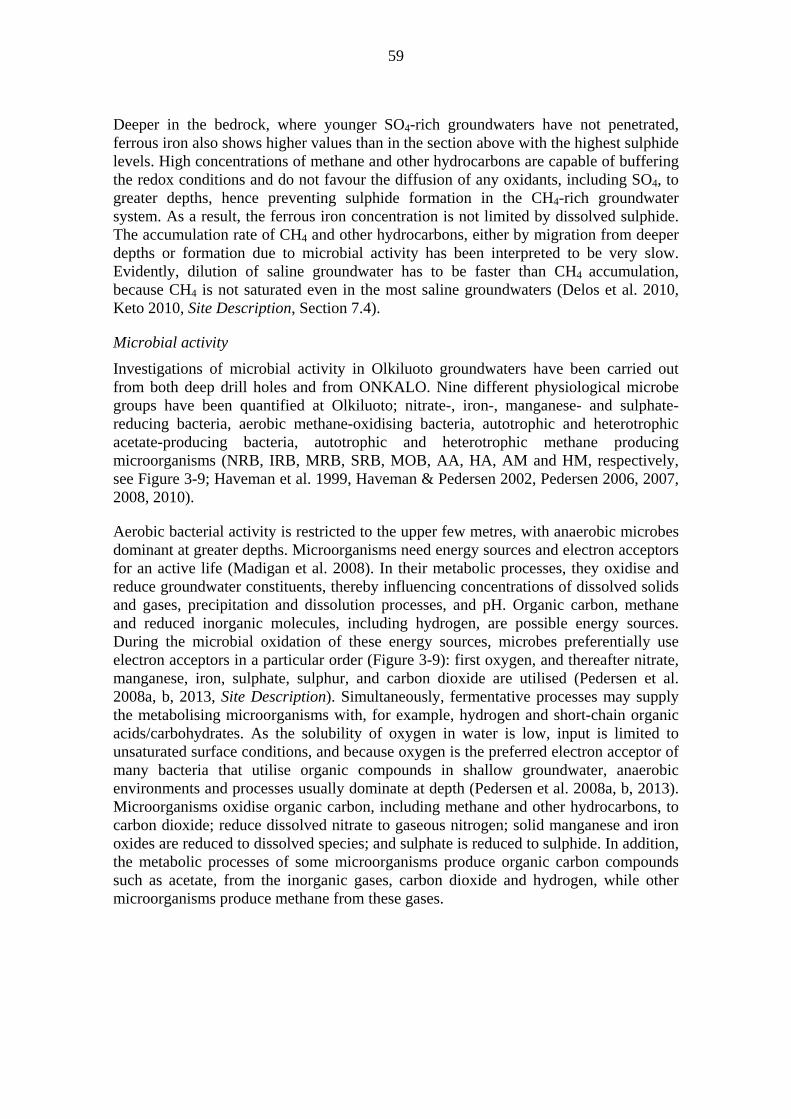
59
Deeper in the bedrock, where younger SO4-rich groundwaters have not penetrated, ferrous iron also shows higher values than in the section above with the highest sulphide levels. High concentrations of methane and other hydrocarbons are capable of buffering the redox conditions and do not favour the diffusion of any oxidants, including SO4, to greater depths, hence preventing sulphide formation in the CH4-rich groundwater system. As a result, the ferrous iron concentration is not limited by dissolved sulphide. The accumulation rate of CH4 and other hydrocarbons, either by migration from deeper depths or formation due to microbial activity has been interpreted to be very slow. Evidently, dilution of saline groundwater has to be faster than CH4 accumulation, because CH4 is not saturated even in the most saline groundwaters (Delos et al. 2010, Keto 2010, Site Description, Section 7.4).
Microbial activity
Investigations of microbial activity in Olkiluoto groundwaters have been carried out from both deep drill holes and from ONKALO. Nine different physiological microbe groups have been quantified at Olkiluoto; nitrate-, iron-, manganese- and sulphate-reducing bacteria, aerobic methane-oxidising bacteria, autotrophic and heterotrophic acetate-producing bacteria, autotrophic and heterotrophic methane producing microorganisms (NRB, IRB, MRB, SRB, MOB, AA, HA, AM and HM, respectively, see Figure 3-9; Haveman et al. 1999, Haveman & Pedersen 2002, Pedersen 2006, 2007, 2008, 2010).
Aerobic bacterial activity is restricted to the upper few metres, with anaerobic microbes dominant at greater depths. Microorganisms need energy sources and electron acceptors for an active life (Madigan et al. 2008). In their metabolic processes, they oxidise and reduce groundwater constituents, thereby influencing concentrations of dissolved solids and gases, precipitation and dissolution processes, and pH. Organic carbon, methane and reduced inorganic molecules, including hydrogen, are possible energy sources. During the microbial oxidation of these energy sources, microbes preferentially use electron acceptors in a particular order (Figure 3-9): first oxygen, and thereafter nitrate, manganese, iron, sulphate, sulphur, and carbon dioxide are utilised (Pedersen et al. 2008a, b, 2013, Site Description). Simultaneously, fermentative processes may supply the metabolising microorganisms with, for example, hydrogen and short-chain organic acids/carbohydrates. As the solubility of oxygen in water is low, input is limited to unsaturated surface conditions, and because oxygen is the preferred electron acceptor of many bacteria that utilise organic compounds in shallow groundwater, anaerobic environments and processes usually dominate at depth (Pedersen et al. 2008a, b, 2013). Microorganisms oxidise organic carbon, including methane and other hydrocarbons, to carbon dioxide; reduce dissolved nitrate to gaseous nitrogen; solid manganese and iron oxides are reduced to dissolved species; and sulphate is reduced to sulphide. In addition, the metabolic processes of some microorganisms produce organic carbon compounds such as acetate, from the inorganic gases, carbon dioxide and hydrogen, while other microorganisms produce methane from these gases.

60
Figure 3-9. Possible pathways for the flow of carbon in the groundwater, backfill and buffer environments. Organic carbon is converted by respiration (aerobic bacteria in the upper oval) to carbon dioxide with oxygen if present, or else fermentation and anaerobic respiration (bacteria in other green and red ovals) occurs with an array of different electron acceptors. Autotrophic processes (blue ovals) generate methane and acetate from carbon dioxide and hydrogen (Pedersen et al. 2013, Site Description).
Generally, the microbiological observations (Figure 3-10) correlate well with redox conditions (Table 3-1, Figure 3-7 and Figure 3-8). Oxygen is only found in the very shallow oxic groundwater layer. The post-oxic (anoxic) layer is dominated by ferrous iron in the sequential model and this is also where IRB and MRB flourish. These two groups of microorganisms reduce solid ferric iron and manganese (IV) oxides to dissolved ferrous iron and manganese (II). There is a very good agreement for sulphate and sulphide between the hydrogeochemical and microbiological sequential depth models. The understanding based on data available for Posiva (2009b) had suggested that ANME (anaerobic methane-oxidising bacteria; Boetius et al. 2000) may be active at the interface between the SO4-rich groundwater and the CH4-rich groundwater, reducing sulphate to sulphide with methane as oxidant. More recently, however, (Site Description) the more dominant role of other DOC (dissolved organic carbon, e.g. ethane, propane etc., Kniemeyer et al. 2007), and/or hydrogen as sources of energy for microbial SRB has been recognised (see section below). Deeper in the system, methane dominates and the data on microbiology are very limited. Therefore, the microbiology model becomes hypothetical in the methanic zone.
MonomersH
ydro
lysi
s
Hydrolysis
CO2
CH4
2H2 + CO2
Acetate
H2 + CO2
O2 H2O
NO3 N2
Mn4+ Mn2+
Fe3+ Fe2+
SO42 S2
S0 S2
Sulphate-reducing bacteria
Sulphur-reducing bacteria
Methanogens
Acetogenic bacteria
Manganese-reducingbacteria
Denitrifyingbacteria
Aerobic bacteria
Iron-reducing bacteria
Organic polymers
Oligo- and monomers
Organic acids, alcohols
Syntrophic bacteria
Acetate
Fermentative bacteria
CO2
CO2
CO2
CO2
CO2
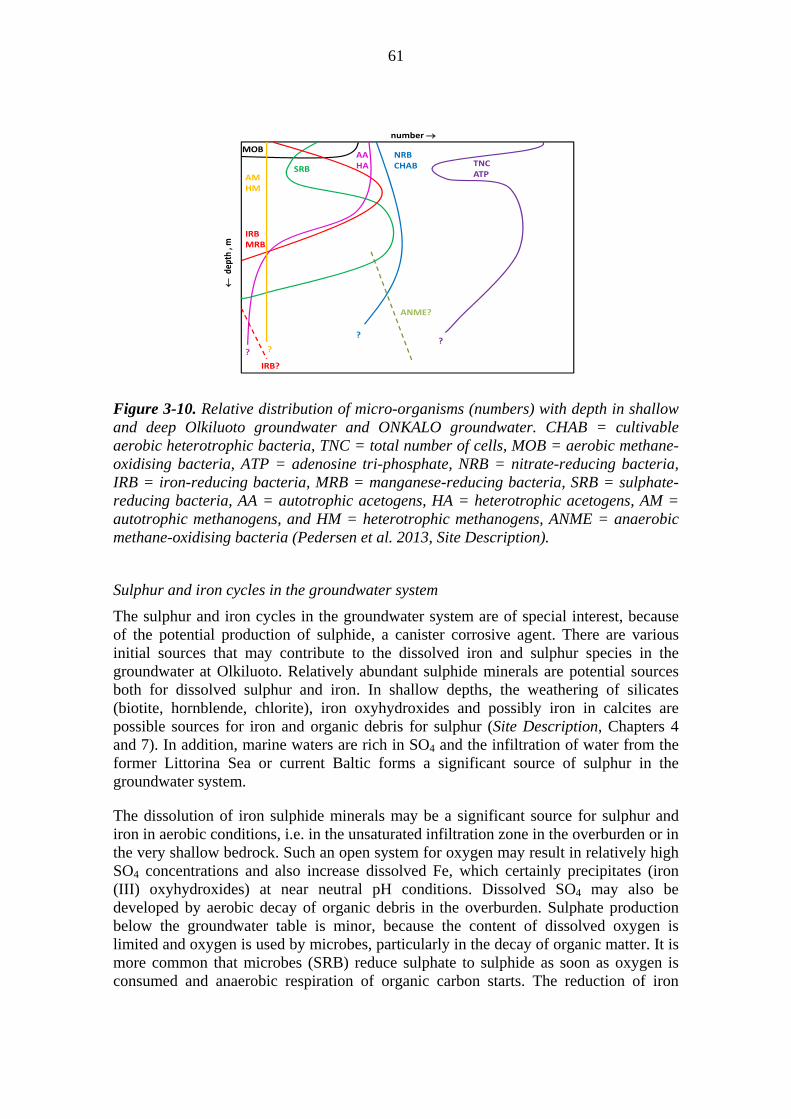
61
Figure 3-10. Relative distribution of micro-organisms (numbers) with depth in shallow and deep Olkiluoto groundwater and ONKALO groundwater. CHAB = cultivable aerobic heterotrophic bacteria, TNC = total number of cells, MOB = aerobic methane-oxidising bacteria, ATP = adenosine tri-phosphate, NRB = nitrate-reducing bacteria, IRB = iron-reducing bacteria, MRB = manganese-reducing bacteria, SRB = sulphate-reducing bacteria, AA = autotrophic acetogens, HA = heterotrophic acetogens, AM = autotrophic methanogens, and HM = heterotrophic methanogens, ANME = anaerobic methane-oxidising bacteria (Pedersen et al. 2013, Site Description).
Sulphur and iron cycles in the groundwater system
The sulphur and iron cycles in the groundwater system are of special interest, because of the potential production of sulphide, a canister corrosive agent. There are various initial sources that may contribute to the dissolved iron and sulphur species in the groundwater at Olkiluoto. Relatively abundant sulphide minerals are potential sources both for dissolved sulphur and iron. In shallow depths, the weathering of silicates (biotite, hornblende, chlorite), iron oxyhydroxides and possibly iron in calcites are possible sources for iron and organic debris for sulphur (Site Description, Chapters 4 and 7). In addition, marine waters are rich in SO4 and the infiltration of water from the former Littorina Sea or current Baltic forms a significant source of sulphur in the groundwater system.
The dissolution of iron sulphide minerals may be a significant source for sulphur and iron in aerobic conditions, i.e. in the unsaturated infiltration zone in the overburden or in the very shallow bedrock. Such an open system for oxygen may result in relatively high SO4 concentrations and also increase dissolved Fe, which certainly precipitates (iron (III) oxyhydroxides) at near neutral pH conditions. Dissolved SO4 may also be developed by aerobic decay of organic debris in the overburden. Sulphate production below the groundwater table is minor, because the content of dissolved oxygen is limited and oxygen is used by microbes, particularly in the decay of organic matter. It is more common that microbes (SRB) reduce sulphate to sulphide as soon as oxygen is consumed and anaerobic respiration of organic carbon starts. The reduction of iron
MOB
TNC ATP
SRB
IRBMRB
??
NRB CHAB
AAHA
ANME?
number
de
pth, m
AMHM
??
IRB?

62
oxyhydroxides by anaerobic, microbial (IRB) organic carbon oxidation is also a potential process operating under near-surface conditions and a probable source for dissolved iron.
Ancient hydrothermal sulphidisation has produced most of the sulphide minerals in the bedrock. Pyrite is also a common infilling mineral in water conductive fractures, where it alternates with low temperature calcite as a latest precipitate. This shows that, rather recently (geologically), pyrite has precipitated from circulating groundwaters due to microbial sulphate reduction (Sahlstedt et al. 2010, Site Description, Section 7.3).
Microbial processes and organics involved in sulphide production
Microbiological sulphide production depends on several different controlling parameters, such as availability of energy (organic compounds or hydrogen) and sulphate, and the presence of viable SRB.
High concentrations of dissolved organic carbon (DOC) in HCO3-rich groundwaters are the most probable energy source for all microbial processes under near surface groundwater conditions (Figure 3-11). Brackish SO4-rich groundwaters exhibit mainly low DOC and dissolved sulphide contents (Figure 3-8). Low DOC content in these samples suggests that microbial redox processes are very limited, which supports the significance of a high SO4 content in acting as an internal buffer against increasing/in-diffusing DOC from shallow depths in stabilising brackish SO4 type groundwaters, i.e. the predominance of SO4 ensures a short life time of DOC due to microbial activity. Similarly, high DOC contents (other than hydrocarbon gases) are not expected to be found in brackish Cl and saline groundwaters, due to the potential microbial activity of methanogens. Also, recent data collected from drillholes in ONKALO down to depths below 300 m systematically show low DOC values (max. few mg/L or below detection limit) and generally indicate low DOC in deep groundwaters, as is expected (Site Description, Section 7.4).
With the exception of shallow groundwater, the highest number of SRB, also supported by DNA activity, has been observed over the depth interval of 200 to 400 m (Figure 3-12). This is where brackish sulphate groundwater may mix with methane-rich, brackish or saline Na-Ca-Cl groundwater and where a peak in sulphide concentration is observed (Figure 3-8), and it can be concluded that sulphate reduction activity is potentially significant in this depth interval at Olkiluoto. Microbial populations of different functional groups are also more abundant and diverse in groundwater that contain both methane and sulphate, but are low or below detection in many of the samples with low concentrations of either methane or sulphate (Pedersen et al. 2013, Site Description Section 7.4.2).
The interface between SO4-rich to CH4-rich groundwaters, at a depth of approximately 250–350 m, forms a metastable system, if waters are mixed, because sulphate and methane represent different thermodynamic redox states. A consortia of microbes (methanogens and SRB) may activate the equilibration between these components (Boetius et al. 2000), which may result in anaerobic oxidation of methane (AOM) with

63
Figure 3-11. Measured dissolved organic carbon (DOC) contents with depth at Olkiluoto. Estimated DOC level without hydrocarbon gases in deep groundwaters, indicated by black line, is mostly based on ONKALO data. Few of these samples taken below 300 m depth are actually below the detection limit (indicated by thin circles). For further information see Site Description, Section 7.4.
simultaneous reduction of sulphate. Hydrogen, which represents a still lower redox state than CH4, may activate microbial reactions if it migrates from great depths into the system or if it is formed due to corrosion of metals such as rock bolts.
Many of the groundwater samples from this interface have moderate SO4 and CH4 concentrations, but do not show any systematic elevated sulphide concentrations. In reality, only a few samples with higher sulphide concentrations have been found in the groundwaters at Olkiluoto. Isotopic indications of AOM in carbonate in groundwater (DIC) or in fracture calcites are very rare (not pervasive) and represent very low mass transfer in the AOM process in the long term, although it is possible in minor amounts. Isotopic and chemical monitoring results suggest that AOM is not favoured in microbial SO4 reduction in samples with elevated HS-. Instead, it is suggested that there is some other energy source available in CH4-rich groundwater, which activates SO4 reduction

64
when SO4-rich groundwater is mixed with CH4-rich groundwater (Site Description, Section 7.4.5 and 11.4.3). For example, many SRB species are known to use short-chain hydrocarbons such as ethane, propane and butane (Kniemeyer et al. 2007). These gases are also enriched in CH4-rich groundwaters, but total concentration of the short-chain hydrocarbons is only a few percent, at most, of the CH4 content. This would explain the limited extent of sulphide production compared with the concentrations of SO4 and CH4 in mixtures of sulphidic and methanic water samples.
The first results from the SUlphate REduction experiment (SURE, first ONKALO lab tests) suggest that methane alone is not a sufficient energy source in sulphate reduction (Pedersen et al. 2013). The data indicated that methane was a source of electrons and energy for metabolic activity, possibly in combination with acetate formation and sulphate reduction, but clear evidence of such an AOM process was not obtained. Instead, IRB were evidently activated and dissolved iron increased by CH4 addition. The future SURE experiments in ONKALO are expected to give detailed information on SO4 reduction, the energy sources used and potential AOM controlling factors.
Figure 3-12. The distribution of sulphate-reducing bacteria (SRB) versus depth in Olkiluoto groundwater samples. Data obtained with cultivation (SRB cells): 1997−1999, green diamonds; 2005–2007, black circles; 2008, red squares; 2009, blue triangles, ONKALO, brown plus signs. Data obtained during 2007−2010 with DNA methodology (dsrB copies), black stars (Site Description, Pedersen et al. 2013). Note; activity below 500 m, the two samples with higher levels of SRB are due to artificial mixing of SO4 rich and CH4 rich groundwater in sampling sections (Penttinen et al. 2011, Pitkänen et al. 2009).
0 1 2 3 4 510Log(SRB/dsrB) (cells/copies mL-1)
0
100
200
300
400
500
600
700
800
900
De
pth
(m)
> 4.2
> 4.2

65
Dissolved iron and sulphide in the groundwater
Ferrous iron content is relatively high in groundwaters with a significant marine component, i.e. in brackish HCO3 and SO4 groundwaters (Table 3-1, Figure 3-8). SRB lose competition for the DOC to MRB and IRB in HCO3-rich groundwaters (Figure 3-11) and DOC is generally very low in the brackish SO4 type groundwaters. Thus, microbial sulphide production remains minor and ferrous iron does not have a strict solubility limit in these groundwater types.
Sulphide and the number of SRB are enriched in places at the interface between SO4-rich groundwater and CH4-rich groundwater (Figure 3-8 and 3-11, Pedersen et al. 2013, Site Description). Correspondingly, iron contents tend to decrease at this interface.
Generally, sulphide concentrations in groundwaters are clearly below 1 mg/L (94 % in baseline database, 115 samples, Site Description, Section 7.2.1) and mostly below 0.1 mg/L (78%). There is evidence that the presence of elevated concentrations of dissolved sulphides (> 1 mg/L) is due to occasional transient conditions caused by mixing between SO4- and CH4-rich groundwaters due to drilling and other field investigations Under natural conditions, however, mixing is limited and thus the microbial processes mediating SO4 reduction would be minor. Typically, these high values of sulphide are associated with sampling sections with some degree of hydrologic perturbations. Most of them are outflow sections in open drillholes, where different type of drillhole water from other depths has been mixed with original fracture groundwater. For example, an anomalously high sulphide concentration (12.4 mg/L) has been observed in the first sample from the intersection of HZ001 in OL-KR13 (Figure 3-13). Mixing of SO4-rich groundwater, due to open drillhole conditions, with CH4-rich groundwater has been considered to be the reason for active microbial SO4 reduction in this sampling section (Wersin et al. 2013c, Site Description, Section 7.5).
According to the monitoring results, sulphide concentrations decrease from the initial, anomalously high values once groundwater conditions stabilise. The decrease may be due to one or more of several possible reasons: i) iron sulphide precipitation with simultaneous change to less soluble phases, ii) draining of energy source for microbial SO4 reduction, iii) dilution of sulphide concentration due to mixing of waters. It is possible that sampling instruments provide a source of iron for iron sulphide precipitation, although the continuing supply of iron from the rock is thought to be the most important reason for decreasing sulphide concentrations. The delay of high sulphide concentrations is probably due to a temporarily reduced availability of iron for iron sulphide precipitation; however, sulphide concentrations are still evidently controlled by iron sulphide phases. Nevertheless, more drillhole data and experimental results (SURE) are needed to support this interpretation
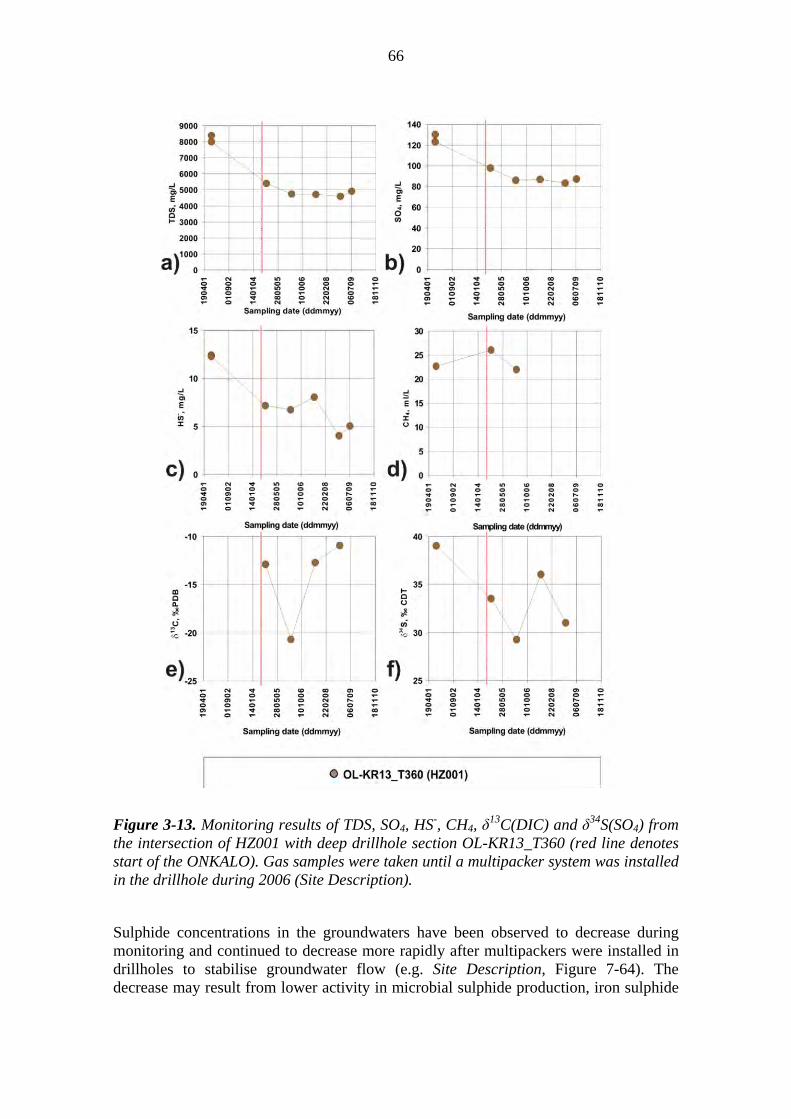
66
Figure 3-13. Monitoring results of TDS, SO4, HS-, CH4, δ13C(DIC) and δ34S(SO4) from
the intersection of HZ001 with deep drillhole section OL-KR13_T360 (red line denotes start of the ONKALO). Gas samples were taken until a multipacker system was installed in the drillhole during 2006 (Site Description).
Sulphide concentrations in the groundwaters have been observed to decrease during monitoring and continued to decrease more rapidly after multipackers were installed in drillholes to stabilise groundwater flow (e.g. Site Description, Figure 7-64). The decrease may result from lower activity in microbial sulphide production, iron sulphide
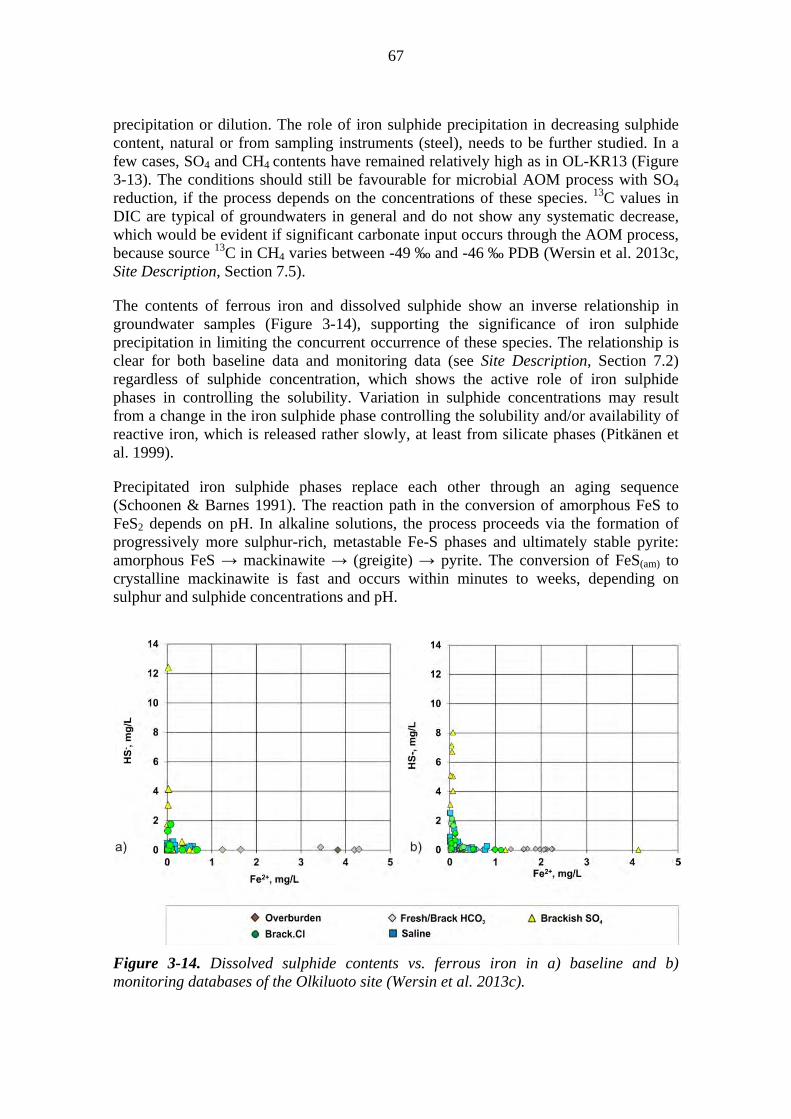
67
precipitation or dilution. The role of iron sulphide precipitation in decreasing sulphide content, natural or from sampling instruments (steel), needs to be further studied. In a few cases, SO4 and CH4 contents have remained relatively high as in OL-KR13 (Figure 3-13). The conditions should still be favourable for microbial AOM process with SO4 reduction, if the process depends on the concentrations of these species. 13C values in DIC are typical of groundwaters in general and do not show any systematic decrease, which would be evident if significant carbonate input occurs through the AOM process, because source 13C in CH4 varies between -49 ‰ and -46 ‰ PDB (Wersin et al. 2013c, Site Description, Section 7.5).
The contents of ferrous iron and dissolved sulphide show an inverse relationship in groundwater samples (Figure 3-14), supporting the significance of iron sulphide precipitation in limiting the concurrent occurrence of these species. The relationship is clear for both baseline data and monitoring data (see Site Description, Section 7.2) regardless of sulphide concentration, which shows the active role of iron sulphide phases in controlling the solubility. Variation in sulphide concentrations may result from a change in the iron sulphide phase controlling the solubility and/or availability of reactive iron, which is released rather slowly, at least from silicate phases (Pitkänen et al. 1999).
Precipitated iron sulphide phases replace each other through an aging sequence (Schoonen & Barnes 1991). The reaction path in the conversion of amorphous FeS to FeS2 depends on pH. In alkaline solutions, the process proceeds via the formation of progressively more sulphur-rich, metastable Fe-S phases and ultimately stable pyrite: amorphous FeS → mackinawite → (greigite) → pyrite. The conversion of FeS(am) to crystalline mackinawite is fast and occurs within minutes to weeks, depending on sulphur and sulphide concentrations and pH.
Figure 3-14. Dissolved sulphide contents vs. ferrous iron in a) baseline and b) monitoring databases of the Olkiluoto site (Wersin et al. 2013c).

68
Greigite is not formed under very reducing conditions, and pyrite, once formed, will grow slowly from solution (Wersin et al. 2013c).
Figure 3-15 shows calculated saturation indices for iron sulphide phases and siderite versus dissolved sulphide concentrations. The saturation index (SI) of a mineral describes the thermodynamic state of a solid phase in relation to solution composition. SI is zero if a phase is in thermodynamic equilibrium with water, i.e. an equal rate of dissolution and precipitation of a particular mineral. SI is greater than zero for over-saturation, and less than zero for under-saturation, indicating precipitation and dissolution, respectively. Slow reaction rates, as for mackinawite conversion to pyrite, tend to result in long-term oversaturation of pyrite before equilibrium between pyrite and water is reached.
Groundwaters are undersaturated with respect to the Fe(II)-carbonate siderite, which indicates that siderite does not control iron cycle in groundwater. Groundwaters are strongly oversaturated with respect to pyrite. Hence, precipitation of pyrite seems to be kinetically hindered under these in-situ groundwater conditions and does not control iron or sulphide concentrations.
Figure 3-15. Calculated saturation indices (SI) of Fe sulphides: FeS(am) and mackinawite, pyrite and siderite (FeCO3) versus dissolved sulphide concentrations in groundwater samples from a) baseline and b) monitoring databases. Black vertical line indicates SI = 0. Colours and shapes of symbols indicate calculated mineral and groundwater type of a groundwater sample, respectively (Wersin et al. 2013c).
69
Pyrite seems to approach equilibrium (SI=0) as the dissolved sulphide concentration decreases to the detection limit level (varied 0.01−0.02 mg/L), which indicates that pyrite may be the solubility control for sulphide and iron in steady-state conditions in the long term. At sulphide concentrations between the detection limit and 0.1 mg/L, mackinawite seems to be the major solubility control, though there is also a tendency towards an increased stability of pyrite (dynamic equilibrium). Equilibrium varies between mackinawite and amorphous FeS at sulphide concentrations above 0.1 mg/L. This may result from the time needed for of mackinawite to reach equilibrium, which means it cannot respond quickly enough to rapid biogeochemical dynamics of the system to produce dissolved sulphide. Saturation indices calculated from both baseline and monitoring databases show a rather uniform picture against the HS- content (Figure 3-15). In particular, the tendency of FeS(am) to reach equilibrium supports the interpretation that elevated sulphide concentrations (> 0.5 mg/L) are related to relative short transients, which may be caused by disturbances in sampled sections. In a steady-state system, the trend of solubility control should be towards more stable FeS phases, i.e. mackinawite and pyrite (Wersin et al. 2013c).
The limited availability of iron, due to its slow release rate from the silicate phases, is probably a significant reason for elevated concentrations of sulphide and for a delay in near equilibrium state of FeS(am). The monitoring results indicate that sulphide concentrations decrease from anomalously high values once the groundwater conditions stabilise. The recovery towards the less artificially disturbed conditions thus seems to be quite rapid, within years to tens of years. Equilibrium shifts from metastable amorphous iron sulphide phases towards stable crystalline pyrite with time (Schoonen & Barnes 1991), which essentially decreases the solubility of sulphide (Wersin et al. 2013c).
Finally, hydrogeochemical monitoring results and thermodynamic considerations indicate that the high dissolved sulphide concentrations (> 1 mg/L) occasionally observed in groundwater samples at Olkiluoto are artefacts due to hydrogeochemical changes, which are caused by transient conditions during investigations. However, future studies are needed to clarify the evolution of dissolved sulphide and the role of iron in this cycle.
Colloids
Colloids4 have the potential to enhance the migration of radionuclides away from a deep repository owing to their ability to transport sorbed radionuclides, potentially more rapidly than these radionuclides would be transported in solution (especially if colloids are excluded from rock matrix pores). For colloids to play a significant role, they must be present, stable in the groundwater both chemically (with respect to dissolution) and colloidally (with respect to aggregation and sedimentation processes), and mobile over significant distances through the groundwater system. Colloids are present in the natural groundwater and will also be introduced during repository construction. Colloid formation may be induced during excavation and operation by physical and chemical processes, including mixing of groundwater types of different salinities during tunnel drainage, formation of new fractures and an EDZ around tunnel walls and degradation
4 Colloids can be defined as nanoscopic solids (nanoparticles) of inorganic or organic nature in the size range from ~1 nm to ~1 µm (upper size limit depending on their density) that remain suspended in water (Honeyman 1999).
70
processes mediated by microbes, which themselves may also act as colloids. Release of colloids from minerals may be enhanced during excavation.
Colloids in granitic groundwaters are small mineral particles of generally inorganic Al, Fe, Si compounds (iron (oxy)hydroxides formed from oxidation processes, clays from fracture fillings and silica minerals), or detached humic substances in the size range of 1 nm to 1 µm that can remain suspended in water. The colloids are expected to be short-lived in the moderately saline environment due to aggregation, as well as sedimentation, recrystallisation and rock surface attachment. Moreover, biodegradation of larger organic molecules will further reduce the mass of organic colloids. In deep groundwaters, colloid populations are generally low, and decrease with an increase in groundwater ionic strength (Figure 3-16) (Degueldre et al. 1996). Although a wide range of colloid populations have been reported in the literature for deep groundwaters (Complementary Considerations, Table 9-3), most values almost certainly reflect sampling artefacts. Generally, measured deep groundwater colloid populations range across seven orders of magnitude (typically from 10-5 to >100 mg/L, and there is no straightforward distinction in concentrations between rock types (Complementary Considerations). Artefact-free sampling (see Complementary Considerations, Table 9-3) from Laxemar by careful colloid sampling and sequential ultrafiltration, mass calculation and LIBD (Laser-Induced Breakdown Detection), gave a colloid concentration in the range of 2·10-3−12·10-3 mg/L. A few proven artefact-free data exist, so the values are still statistically weak.
Data available from Olkiluoto are summarised in Table 3-2. Samples for inorganic and organic colloids have been collected from the deep borehole OL-KR1 at 613−618 m and from the ONKALO groundwater stations with different sampling and analytical methods. The measured total concentration of colloids range from 1·10-3−2·10-1 mg/L reflects the above-mentioned problems with getting artefact- free samples.
With mobile equipment for LIBD (Hauser et al. 2002), detailed information on the inorganic nanoparticle concentrations has been obtained in drillholes at Olkiluoto. The data show that inorganic nanoparticle concentrations are limited in advective transport dominated far-field environments (crystalline rock and rock salt overburden) mostly to concentrations < 1 mg/L and strongly depend on the ionic strength of the groundwater. Colloid composition analysis by SEM-EDX mainly revealed aluminosilicates and Si-phases.
Most samples have been analysed for inorganic colloids, and only one deep borehole sample so far for organic colloids (humic and fulvic acids). The organic fraction in the deep borehole OL-KR1 at Olkiluoto at a depth of 613−618 m was analysed for humic and fulvic acids and showed a very low content of humic acids in the water, , about 1·10-4 mg/L (Laaksoharju et al. 1993). Sampling from the groundwater station ONK-PVA3 (at a depth of about 85 m) showed a content of humic and fulvic substances in the water in the order of 3 mg/l (Mäkelä & Manninen 2007).
Although colloid populations have not been monitored at the repository depth at Olkiluoto, but will be done within the next years, they are likely to be lower than those of the samples taken so far down to 100 m depth at ONKALO, given the higher salinity
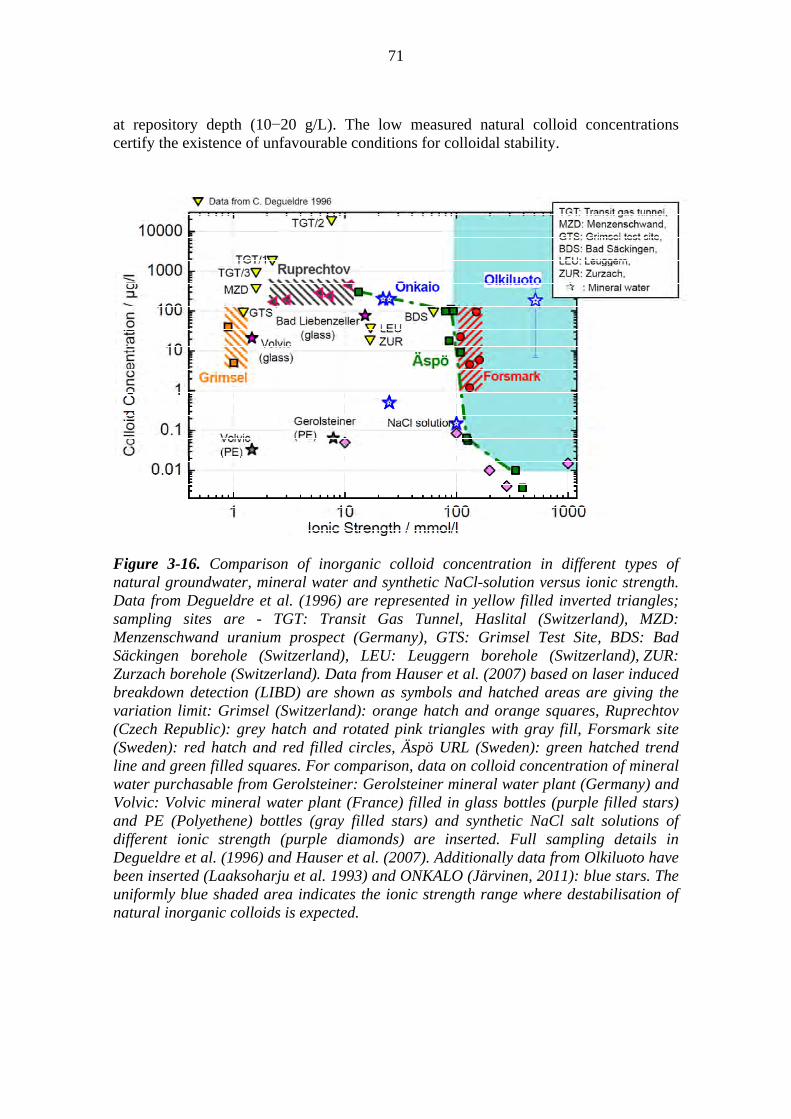
71
at repository depth (10−20 g/L). The low measured natural colloid concentrations certify the existence of unfavourable conditions for colloidal stability.
Figure 3-16. Comparison of inorganic colloid concentration in different types of natural groundwater, mineral water and synthetic NaCl-solution versus ionic strength. Data from Degueldre et al. (1996) are represented in yellow filled inverted triangles; sampling sites are - TGT: Transit Gas Tunnel, Haslital (Switzerland), MZD: Menzenschwand uranium prospect (Germany), GTS: Grimsel Test Site, BDS: Bad Säckingen borehole (Switzerland), LEU: Leuggern borehole (Switzerland), ZUR: Zurzach borehole (Switzerland). Data from Hauser et al. (2007) based on laser induced breakdown detection (LIBD) are shown as symbols and hatched areas are giving the variation limit: Grimsel (Switzerland): orange hatch and orange squares, Ruprechtov (Czech Republic): grey hatch and rotated pink triangles with gray fill, Forsmark site (Sweden): red hatch and red filled circles, Äspö URL (Sweden): green hatched trend line and green filled squares. For comparison, data on colloid concentration of mineral water purchasable from Gerolsteiner: Gerolsteiner mineral water plant (Germany) and Volvic: Volvic mineral water plant (France) filled in glass bottles (purple filled stars) and PE (Polyethene) bottles (gray filled stars) and synthetic NaCl salt solutions of different ionic strength (purple diamonds) are inserted. Full sampling details in Degueldre et al. (1996) and Hauser et al. (2007). Additionally data from Olkiluoto have been inserted (Laaksoharju et al. 1993) and ONKALO (Järvinen, 2011): blue stars. The uniformly blue shaded area indicates the ionic strength range where destabilisation of natural inorganic colloids is expected.
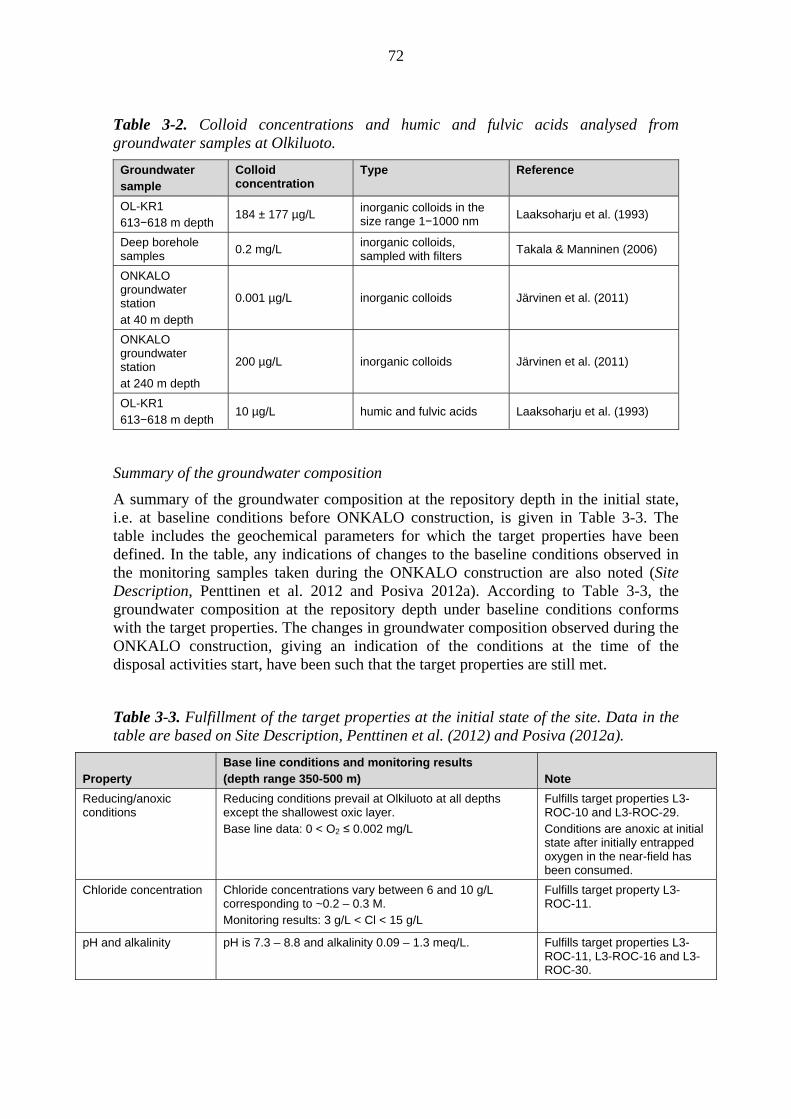
72
Table 3-2. Colloid concentrations and humic and fulvic acids analysed from groundwater samples at Olkiluoto.
Groundwater sample
Colloid concentration
Type Reference
OL-KR1 613−618 m depth
184 ± 177 µg/L inorganic colloids in the size range 1−1000 nm
Laaksoharju et al. (1993)
Deep borehole samples
0.2 mg/L inorganic colloids, sampled with filters
Takala & Manninen (2006)
ONKALO groundwater station at 40 m depth
0.001 µg/L inorganic colloids Järvinen et al. (2011)
ONKALO groundwater station at 240 m depth
200 µg/L inorganic colloids Järvinen et al. (2011)
OL-KR1 613−618 m depth
10 µg/L humic and fulvic acids Laaksoharju et al. (1993)
Summary of the groundwater composition
A summary of the groundwater composition at the repository depth in the initial state, i.e. at baseline conditions before ONKALO construction, is given in Table 3-3. The table includes the geochemical parameters for which the target properties have been defined. In the table, any indications of changes to the baseline conditions observed in the monitoring samples taken during the ONKALO construction are also noted (Site Description, Penttinen et al. 2012 and Posiva 2012a). According to Table 3-3, the groundwater composition at the repository depth under baseline conditions conforms with the target properties. The changes in groundwater composition observed during the ONKALO construction, giving an indication of the conditions at the time of the disposal activities start, have been such that the target properties are still met.
Table 3-3. Fulfillment of the target properties at the initial state of the site. Data in the table are based on Site Description, Penttinen et al. (2012) and Posiva (2012a).
Property Base line conditions and monitoring results (depth range 350-500 m) Note
Reducing/anoxic conditions
Reducing conditions prevail at Olkiluoto at all depths except the shallowest oxic layer. Base line data: 0 < O2 ≤ 0.002 mg/L
Fulfills target properties L3-ROC-10 and L3-ROC-29. Conditions are anoxic at initial state after initially entrapped oxygen in the near-field has been consumed.
Chloride concentration
Chloride concentrations vary between 6 and 10 g/L corresponding to ~0.2 – 0.3 M. Monitoring results: 3 g/L < Cl < 15 g/L
Fulfills target property L3-ROC-11.
pH and alkalinity pH is 7.3 – 8.8 and alkalinity 0.09 – 1.3 meq/L. Fulfills target properties L3-ROC-11, L3-ROC-16 and L3-ROC-30.
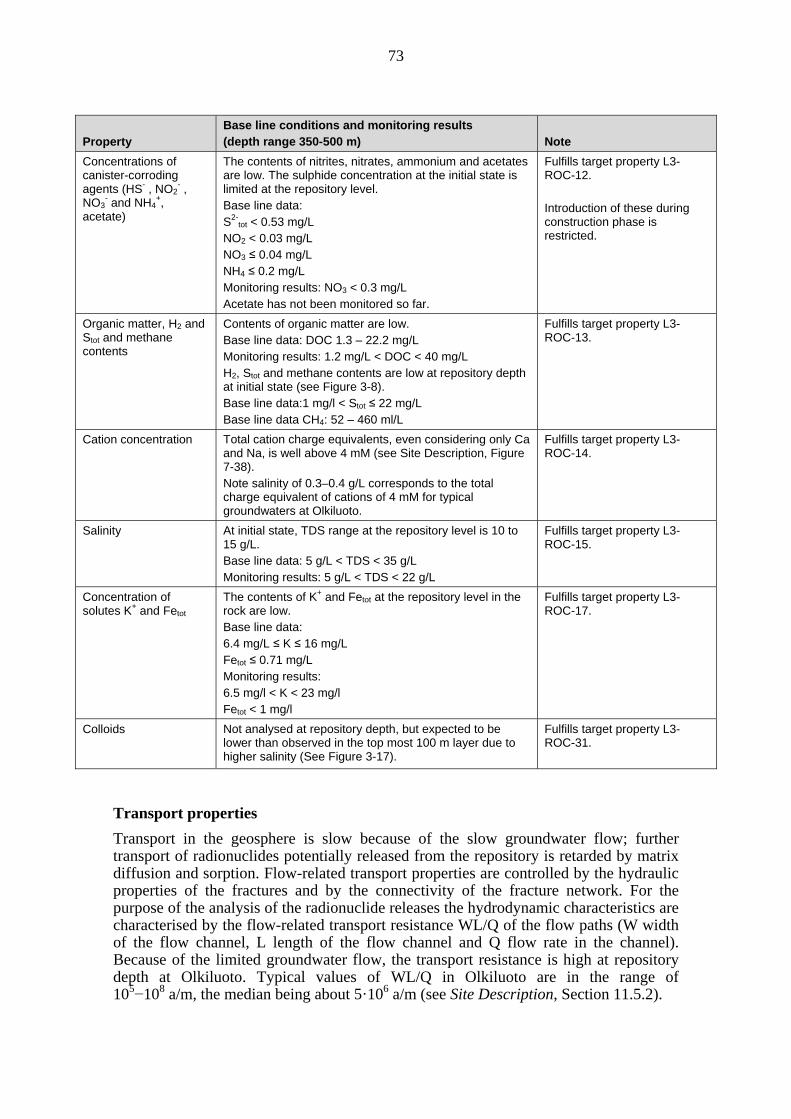
73
Property Base line conditions and monitoring results (depth range 350-500 m) Note
Concentrations of canister-corroding agents (HS- , NO2
- , NO3
- and NH4+,
acetate)
The contents of nitrites, nitrates, ammonium and acetates are low. The sulphide concentration at the initial state is limited at the repository level. Base line data: S2-
tot < 0.53 mg/L NO2 < 0.03 mg/L NO3 ≤ 0.04 mg/L NH4 ≤ 0.2 mg/L Monitoring results: NO3 < 0.3 mg/L Acetate has not been monitored so far.
Fulfills target property L3-ROC-12. Introduction of these during construction phase is restricted.
Organic matter, H2 and Stot and methane contents
Contents of organic matter are low. Base line data: DOC 1.3 – 22.2 mg/L Monitoring results: 1.2 mg/L < DOC < 40 mg/L H2, Stot and methane contents are low at repository depth at initial state (see Figure 3-8). Base line data:1 mg/l < Stot ≤ 22 mg/L Base line data CH4: 52 – 460 ml/L
Fulfills target property L3-ROC-13.
Cation concentration Total cation charge equivalents, even considering only Ca and Na, is well above 4 mM (see Site Description, Figure 7-38). Note salinity of 0.3–0.4 g/L corresponds to the total charge equivalent of cations of 4 mM for typical groundwaters at Olkiluoto.
Fulfills target property L3-ROC-14.
Salinity
At initial state, TDS range at the repository level is 10 to 15 g/L. Base line data: 5 g/L < TDS < 35 g/L Monitoring results: 5 g/L < TDS < 22 g/L
Fulfills target property L3-ROC-15.
Concentration of solutes K+ and Fetot
The contents of K+ and Fetot at the repository level in the rock are low. Base line data: 6.4 mg/L ≤ K ≤ 16 mg/L Fetot ≤ 0.71 mg/L Monitoring results: 6.5 mg/l < K < 23 mg/l Fetot < 1 mg/l
Fulfills target property L3-ROC-17.
Colloids Not analysed at repository depth, but expected to be lower than observed in the top most 100 m layer due to higher salinity (See Figure 3-17).
Fulfills target property L3-ROC-31.
Transport properties
Transport in the geosphere is slow because of the slow groundwater flow; further transport of radionuclides potentially released from the repository is retarded by matrix diffusion and sorption. Flow-related transport properties are controlled by the hydraulic properties of the fractures and by the connectivity of the fracture network. For the purpose of the analysis of the radionuclide releases the hydrodynamic characteristics are characterised by the flow-related transport resistance WL/Q of the flow paths (W width of the flow channel, L length of the flow channel and Q flow rate in the channel). Because of the limited groundwater flow, the transport resistance is high at repository depth at Olkiluoto. Typical values of WL/Q in Olkiluoto are in the range of 105−108 a/m, the median being about 5·106 a/m (see Site Description, Section 11.5.2).

74
Matrix diffusion is dependent on the properties (porosity and diffusivity) of the rock matrix adjacent to the migration path. Typical fracture coating minerals at Olkiluoto are clays, sulphides and calcites. It has been observed that there is a notable variation of the microstructure, porosity and mineralogy adjacent to fractures forming typical migration paths in the vicinity of the deposition holes (Site Description, Chapter 8). Therefore, for the purpose of the radionuclide release and transport analysis, the fractures are divided to four different transport classes with different fracture coating and and alteration properties adjacent to fractures; i) fractures dominated by calcite; ii), fractures dominated by hydrothermal clays; iii) slickensided fractures and iv) other fractures (for details see Site Description, Chapter 8). The porosity of the altered rock adjacent to the fractures can be as high as about 5%, or in some cases even more, but typically the porosity of the unaltered rock is around 0.5% or less (Site Description, Chapter 8). The effective diffusivity is typically in the order of 10-14–10-13 m2/s, but is higher, for example, in the clay and calcite coatings of the fractures and in the thin layer of altered rock which frequently occurrs adjacent to fractures (see Posiva 2012, Chapter 8).
Sorption of the radionuclides on the mineral surfaces of the rock matrix and on the fracture coatings takes place mainly by cation exchange or by surface complexation. In crystalline rocks, the preference for sorption on mica and clay minerals is due to the high cation exchange capacity (CEC) and high surface area of these minerals compared to the low CEC and low surface area of the feldspar minerals and quartz. Mica and clay minerals are abundant in Olkiluoto rocks. The chemical composition of the groundwater also affects the speciation of the radionuclides. Sorption properties for the intact rock at Olkiluoto, for groundwater compositions relevant to radionuclide transport analyses, based on extensive experimental data complemented by literature data is presented in Hakanen et al. (2013).
3.2 Underground openings
The layout of the underground openings is primarily constrained by the layout determining features (LDFs), which are large lineaments, significant brittle fault zones (BFZ) or hydrogeological zones (HZ) (see Figure 3-17 and Pere et al. 2013). Several layout adaptations of the repository have been produced (Saanio et al. 2013). One layout adaptation for a repository hosting 9000 tU of spent nuclear fuel has been selected for the TURVA-2012 safety case (Figure 3-17), whereas part of the modelling has been based on a repository for 5500 tU spent nuclear fuel (see Figure 3-18 and Kirkkomäki 2009). The layouts used as input to the safety case should be considered to be examples. The layout will be adjusted taking into account the detailed information gained during
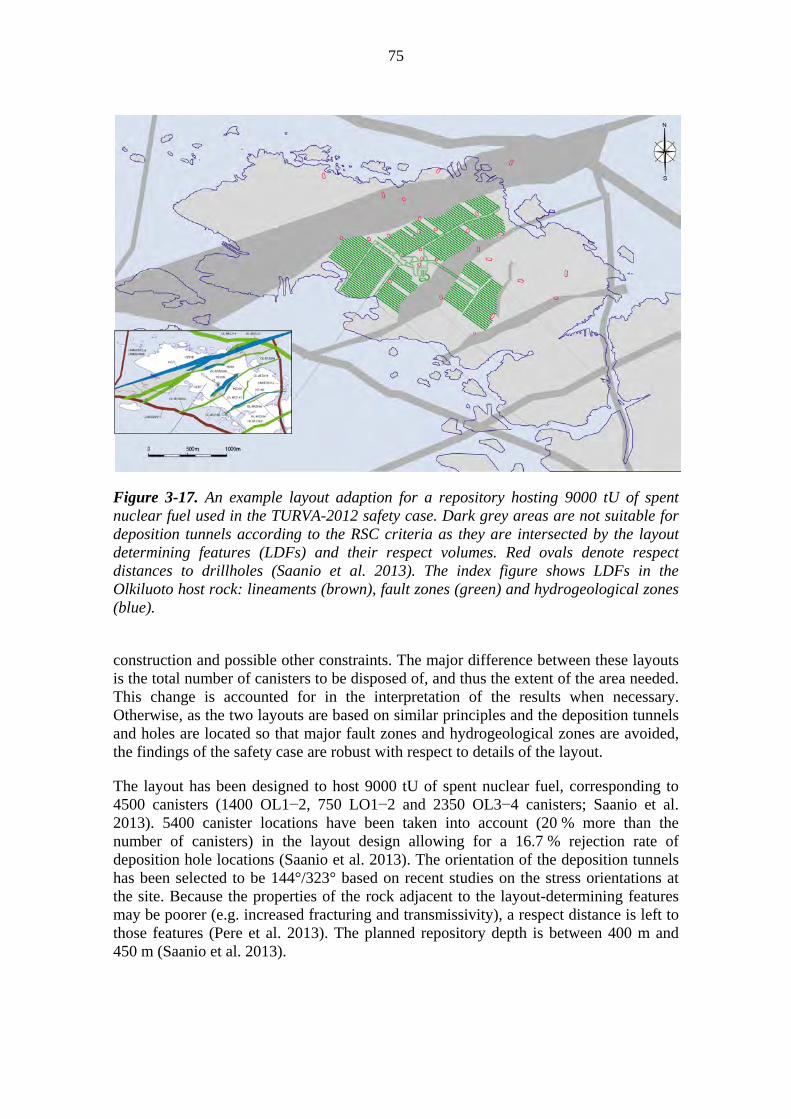
75
Figure 3-17. An example layout adaption for a repository hosting 9000 tU of spent nuclear fuel used in the TURVA-2012 safety case. Dark grey areas are not suitable for deposition tunnels according to the RSC criteria as they are intersected by the layout determining features (LDFs) and their respect volumes. Red ovals denote respect distances to drillholes (Saanio et al. 2013). The index figure shows LDFs in the Olkiluoto host rock: lineaments (brown), fault zones (green) and hydrogeological zones (blue).
construction and possible other constraints. The major difference between these layouts is the total number of canisters to be disposed of, and thus the extent of the area needed. This change is accounted for in the interpretation of the results when necessary. Otherwise, as the two layouts are based on similar principles and the deposition tunnels and holes are located so that major fault zones and hydrogeological zones are avoided, the findings of the safety case are robust with respect to details of the layout.
The layout has been designed to host 9000 tU of spent nuclear fuel, corresponding to 4500 canisters (1400 OL1−2, 750 LO1−2 and 2350 OL3−4 canisters; Saanio et al. 2013). 5400 canister locations have been taken into account (20 % more than the number of canisters) in the layout design allowing for a 16.7 % rejection rate of deposition hole locations (Saanio et al. 2013). The orientation of the deposition tunnels has been selected to be 144°/323° based on recent studies on the stress orientations at the site. Because the properties of the rock adjacent to the layout-determining features may be poorer (e.g. increased fracturing and transmissivity), a respect distance is left to those features (Pere et al. 2013). The planned repository depth is between 400 m and 450 m (Saanio et al. 2013).
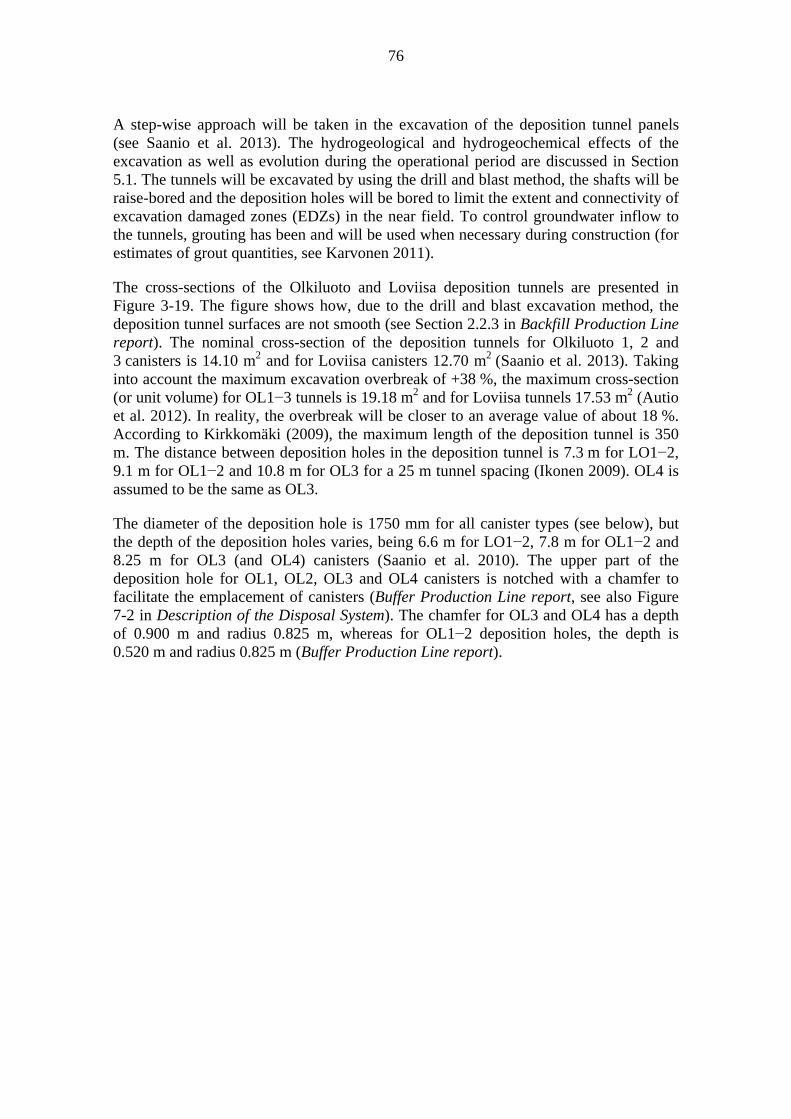
76
A step-wise approach will be taken in the excavation of the deposition tunnel panels (see Saanio et al. 2013). The hydrogeological and hydrogeochemical effects of the excavation as well as evolution during the operational period are discussed in Section 5.1. The tunnels will be excavated by using the drill and blast method, the shafts will be raise-bored and the deposition holes will be bored to limit the extent and connectivity of excavation damaged zones (EDZs) in the near field. To control groundwater inflow to the tunnels, grouting has been and will be used when necessary during construction (for estimates of grout quantities, see Karvonen 2011).
The cross-sections of the Olkiluoto and Loviisa deposition tunnels are presented in Figure 3-19. The figure shows how, due to the drill and blast excavation method, the deposition tunnel surfaces are not smooth (see Section 2.2.3 in Backfill Production Line report). The nominal cross-section of the deposition tunnels for Olkiluoto 1, 2 and 3 canisters is 14.10 m2 and for Loviisa canisters 12.70 m2 (Saanio et al. 2013). Taking into account the maximum excavation overbreak of +38 %, the maximum cross-section (or unit volume) for OL1−3 tunnels is 19.18 m2 and for Loviisa tunnels 17.53 m2 (Autio et al. 2012). In reality, the overbreak will be closer to an average value of about 18 %. According to Kirkkomäki (2009), the maximum length of the deposition tunnel is 350 m. The distance between deposition holes in the deposition tunnel is 7.3 m for LO1−2, 9.1 m for OL1−2 and 10.8 m for OL3 for a 25 m tunnel spacing (Ikonen 2009). OL4 is assumed to be the same as OL3.
The diameter of the deposition hole is 1750 mm for all canister types (see below), but the depth of the deposition holes varies, being 6.6 m for LO1−2, 7.8 m for OL1−2 and 8.25 m for OL3 (and OL4) canisters (Saanio et al. 2010). The upper part of the deposition hole for OL1, OL2, OL3 and OL4 canisters is notched with a chamfer to facilitate the emplacement of canisters (Buffer Production Line report, see also Figure 7-2 in Description of the Disposal System). The chamfer for OL3 and OL4 has a depth of 0.900 m and radius 0.825 m, whereas for OL1−2 deposition holes, the depth is 0.520 m and radius 0.825 m (Buffer Production Line report).

77
Figure 3-18. An example layout adaption for a repository hosting 5500 tU of spent nuclear fuel (Kirkkomäki 2009) used in some of the analyses discussed in this report.
Figure 3-19. Theoretical cross-sections for Olkiluoto and Loviisa deposition tunnels and deposition holes (left) and the deposition tunnel wall surface close up (right) (Saanio et al. 2010). OL4 is assumed to correspond to OL3.

78
Due to excavation, an EDZ may form around the tunnel periphery primarily below the tunnel, but according to Mustonen et al. (2010), it should not form a continuous zone i.e. it is not a possible transport path (see Section 5.1.3 for further considerations).
The deposition tunnels will be excavated and the deposition holes will be bored in rock volumes and in locations that have been classified as suitable according to the Rock Suitability Classification (RSC). In addition, the excavated rooms should meet the requirements set on the quality of the excavation or boring, concerning e.g. overbreak and straightness, so that the target properties for the host rock and the performance target for the EBS can be fulfilled.
The expected groundwater inflow to underground openings, to deposition tunnels and to deposition holes is described in Section 5.1.2, based on Hartley et al. (2013b, c). In addition, Appendix A presents inflow data based mainly on work by Hartley et al. (2010) used in the buffer and backfill design and performance assessment. This data set was used, as the revised estimates by Hartley et al. (2013b, c) were not available at the time when the analyses were started. The inflow conditions depend also on the results of grouting and on the RSC criteria applied to the deposition tunnels. Based on the current RSC criteria set for deposition tunnels (McEwen et al. 2013), the maximum local (fracture-related) inflow to a deposition tunnel is 0.25 L/min. No total inflow limitation has been set for the whole tunnel. The grouting criterion is 0.2 L/min, so whenever higher leakages are observed in a probe hole, pre-grouting before excavation of that section will be made. If necessary, post-grouting after excavation can also be performed. If the inflow from a single fracture is still >0.25 L/min after grouting, the RSC-criterion is not fulfilled, in which case the deposition tunnel is abandoned and backfilled. The maximum inflow allowed to a deposition hole is 0.1 L/min. No grouting is allowed in deposition holes. Also, deposition holes intersected by grout-filled fractures will be not be used. If deposition holes have to be abandoned, they will be filled with buffer material. The dimensions of the deposition tunnels and holes are presented on the previous pages of this section.
During the construction of ONKALO, foreign materials such as grouts, concrete and bolts has been introduced into the facility. Some of the materials used during the operational period are to be removed but some will inevitably remain. The amounts of foreign materials that will be left in the repository have been estimated in Karvonen (2011). These estimates are to be updated periodically and the use of foreign materials is monitored continuously by Posiva’s monitoring programme (Posiva 2003a). The usage of materials is limited in respect to harmful substances (i.e. ordinary grouts and concretes at depth, see Closure Production Line report and Dixon et al. 2012). Karvonen (2011) is based on the 2009 layout presented in Figure 3-18, as well as on the older design presented in Saanio et al. (2010). This affects mostly the estimated total quantities of the foreign materials as well as the estimates on the cementitious materials related to the deposition tunnel plug design, as this has subsequently been changed (see Section 3.5).
The largest quantity of any introduced foreign material is cement, which is introduced into the facility during construction to control the groundwater inflow into excavated facilities by grouting, to support the rock by shotcreting and as cementitious grout in
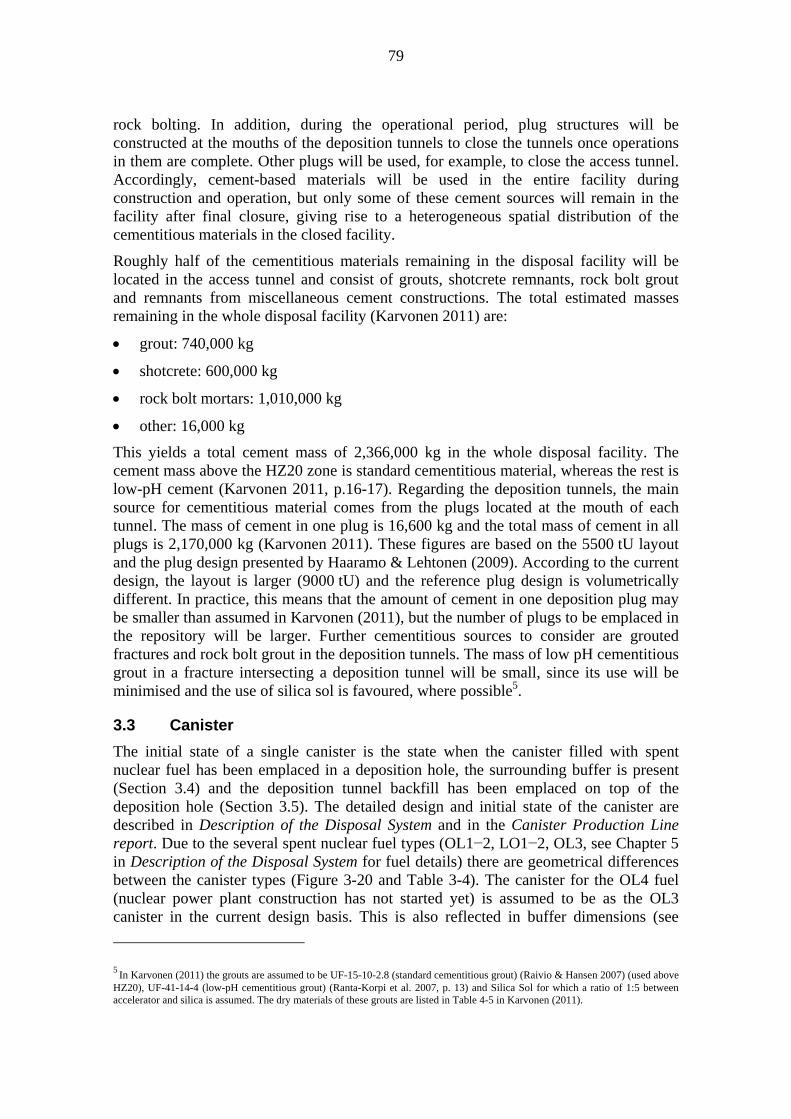
79
rock bolting. In addition, during the operational period, plug structures will be constructed at the mouths of the deposition tunnels to close the tunnels once operations in them are complete. Other plugs will be used, for example, to close the access tunnel. Accordingly, cement-based materials will be used in the entire facility during construction and operation, but only some of these cement sources will remain in the facility after final closure, giving rise to a heterogeneous spatial distribution of the cementitious materials in the closed facility.
Roughly half of the cementitious materials remaining in the disposal facility will be located in the access tunnel and consist of grouts, shotcrete remnants, rock bolt grout and remnants from miscellaneous cement constructions. The total estimated masses remaining in the whole disposal facility (Karvonen 2011) are:
grout: 740,000 kg
shotcrete: 600,000 kg
rock bolt mortars: 1,010,000 kg
other: 16,000 kg
This yields a total cement mass of 2,366,000 kg in the whole disposal facility. The cement mass above the HZ20 zone is standard cementitious material, whereas the rest is low-pH cement (Karvonen 2011, p.16-17). Regarding the deposition tunnels, the main source for cementitious material comes from the plugs located at the mouth of each tunnel. The mass of cement in one plug is 16,600 kg and the total mass of cement in all plugs is 2,170,000 kg (Karvonen 2011). These figures are based on the 5500 tU layout and the plug design presented by Haaramo & Lehtonen (2009). According to the current design, the layout is larger (9000 tU) and the reference plug design is volumetrically different. In practice, this means that the amount of cement in one deposition plug may be smaller than assumed in Karvonen (2011), but the number of plugs to be emplaced in the repository will be larger. Further cementitious sources to consider are grouted fractures and rock bolt grout in the deposition tunnels. The mass of low pH cementitious grout in a fracture intersecting a deposition tunnel will be small, since its use will be minimised and the use of silica sol is favoured, where possible5.
3.3 Canister
The initial state of a single canister is the state when the canister filled with spent nuclear fuel has been emplaced in a deposition hole, the surrounding buffer is present (Section 3.4) and the deposition tunnel backfill has been emplaced on top of the deposition hole (Section 3.5). The detailed design and initial state of the canister are described in Description of the Disposal System and in the Canister Production Line report. Due to the several spent nuclear fuel types (OL1−2, LO1−2, OL3, see Chapter 5 in Description of the Disposal System for fuel details) there are geometrical differences between the canister types (Figure 3-20 and Table 3-4). The canister for the OL4 fuel (nuclear power plant construction has not started yet) is assumed to be as the OL3 canister in the current design basis. This is also reflected in buffer dimensions (see
5 In Karvonen (2011) the grouts are assumed to be UF-15-10-2.8 (standard cementitious grout) (Raivio & Hansen 2007) (used above HZ20), UF-41-14-4 (low-pH cementitious grout) (Ranta-Korpi et al. 2007, p. 13) and Silica Sol for which a ratio of 1:5 between accelerator and silica is assumed. The dry materials of these grouts are listed in Table 4-5 in Karvonen (2011).

80
Section 3.4 below) and deposition tunnel backfill dimensions (see Section 3.5 below) (see Figure 3-19 for deposition tunnel and deposition hole dimensions). Spent nuclear fuel properties are taken into account in the canister design (see Design Basis and Canister Production Line). Heat produced by the spent nuclear fuel and its effects on the near-field temperatures are discussed further in Sections 5.1.2 and 5.2.2.
The canister is composed of a cast iron insert and a copper overpack (Figure 3-20). The material for the copper overpack is phosphorus alloyed oxygen-free copper with the following requirements: O <5 ppm, P 30−100 ppm, H <0.6 ppm, S <8 ppm. Creep testing of Cu-OF (oxygen free copper) doped with 30 to 120 ppm phosphorus has shown higher creep strength and much better creep ductility than copper without phosphorus according to Andersson-Östling & Sandström (2009, Section 12). The cast iron material composition of the insert is specified only with respect to an upper limit on the content of copper to avoid the risk of radiation embrittlement. The content of copper shall therefore not exceed 0.05 %. During the development of the casting process for the nodular cast iron inserts, the standard requirements in EN 1563 grade EN-GJS-400-15U have been used regarding mechanical properties (Raiko et al. 2010).
Dose rates from the canister, canister temperatures, presence and composition of water and gas in the canister, the type and probability of initial penetrating defects as well as the residual welding stresses at the initial state are presented in Chapter 6 of Description of the Disposal System.
Figure 3-20. A) Disposal canister for the spent nuclear fuel from the LO1−2, OL1−2 and OL3 reactors (from left to right). All versions of the canister have the same outer diameter. B) OL1−2 canister components, from the left: copper cylinder, iron insert, steel lid and copper lid (Raiko et al. 2010). The OL4 canister is assumed to be similar to the OL3 canister. Dimensions are given in Table 3-4.
A B

81
Table 3-4. Main dimensions and masses of canisters for different types of spent nuclear fuel (Canister Production Line report). Spent nuclear fuel from the OL4 reactor is assumed similar to OL3 fuel.
LO1−2
OL1−2
OL3
Outer diameter (m) 1.05 1.05 1.05
Height with flat bottom end * (mm) 3552 4752 5223
Thickness of copper cylinder, nominal, (mm) 49 49 49
Thickness of copper lid and bottom, nominal, (mm) 50 50 50
Thickness of iron insert bottom **, nominal, (mm) 70 60 85
Number of fuel assemblies 12 12 4
Amount of spent nuclear fuel (tU) 1.4 2.2 2.1
Void space with fuel assemblies (m3) 0.61 0.95 0.67
Heat output limit (W)*** 1370 1700 1830
Mass of fuel assemblies (ton) 2.6 3.6 3.2
Mass of iron (ton) 8.6 10.6 15.8
Mass of steel (ton) 2.0 3.0 2.1
Mass of copper * (ton) 5.6 7.3 8.0
Total area of canister outside surface * (m2) 13.67 17.63 19.18
Total outer volume of canister * (m3) 3.03 4.07 4.46
*) The bottom of the canister overpack can be either manufactured as part of the body (values in the table) or welded to the cylindrical body. If the welded bottom lid alternative is used, then the total length increases +75 mm, the total canister volume +0.024 m3 and the copper mass and the total canister mass +0.21 ton (Canister Production Line report).
**) The total bottom thickness is the sum of cast iron thickness and the steel cassette bottom plate thickness.
***) The heat output is the main criterion driving the selection of fuel assemblies to be encapsulated in a specific canister. Once the heat output criterion is met, this limits also the burn-up of the fuel that can be disposed in a canister, since high burn-up fuel produces more heat than lower burn-up fuel. The heat output limit also affects the age of the fuel to be disposed. The cooling period prior to disposal is between 30 and 50 years, depending on the fuel type and burn-up. The canister design is based on a 20-year minimum cooling period.
The design and manufacturing of the canister must satisfy the performance target “the canister shall initially be intact when leaving the encapsulation plant for disposal except for incidental deviations” (L3-CAN-4), and also that, in the expected repository conditions, the canister shall remain intact for hundreds of thousands of years except for incidental deviations (L3-CAN-5). Therefore, the canister is designed, manufactured, tested and acceptance criteria are set to meet these performance targets. The design of the canister is described in Raiko (2012), along with the acceptance criteria for welds (Section 11.6 of Raiko 2012). The master requirement for canister acceptance is the minimum intact copper thickness requirement of 35 mm in 100 % and 40 mm in 99 %
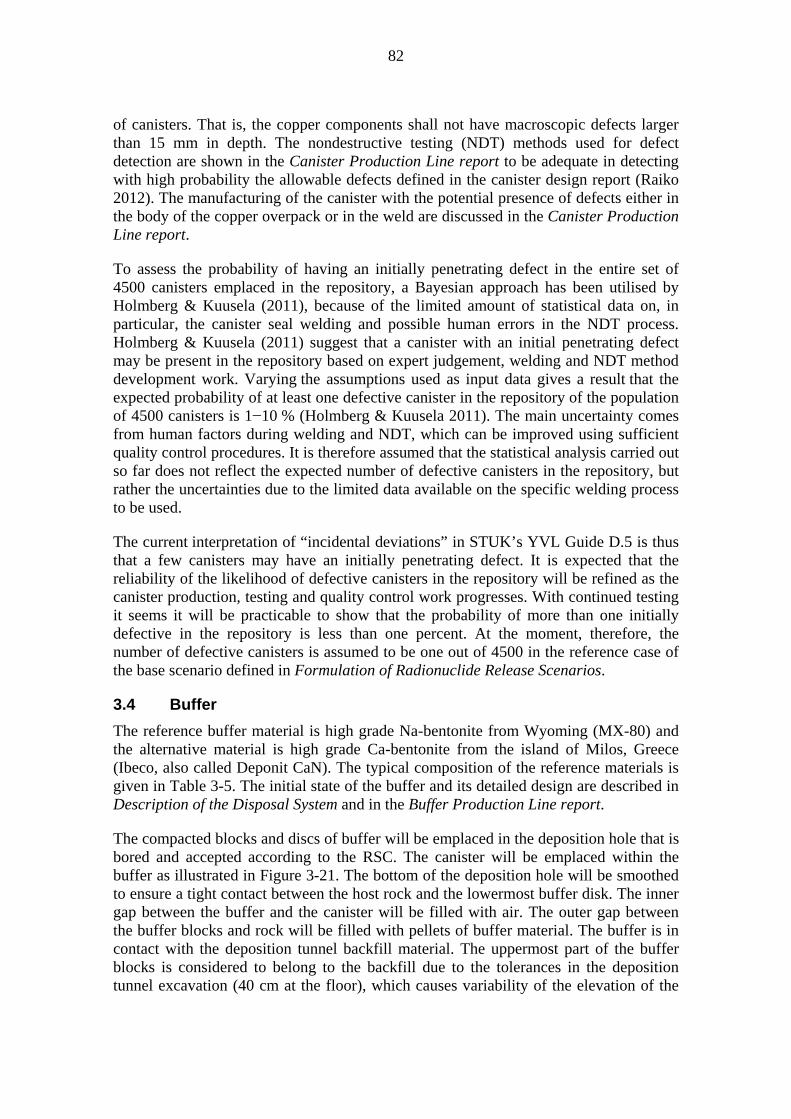
82
of canisters. That is, the copper components shall not have macroscopic defects larger than 15 mm in depth. The nondestructive testing (NDT) methods used for defect detection are shown in the Canister Production Line report to be adequate in detecting with high probability the allowable defects defined in the canister design report (Raiko 2012). The manufacturing of the canister with the potential presence of defects either in the body of the copper overpack or in the weld are discussed in the Canister Production Line report.
To assess the probability of having an initially penetrating defect in the entire set of 4500 canisters emplaced in the repository, a Bayesian approach has been utilised by Holmberg & Kuusela (2011), because of the limited amount of statistical data on, in particular, the canister seal welding and possible human errors in the NDT process. Holmberg & Kuusela (2011) suggest that a canister with an initial penetrating defect may be present in the repository based on expert judgement, welding and NDT method development work. Varying the assumptions used as input data gives a result that the expected probability of at least one defective canister in the repository of the population of 4500 canisters is 1−10 % (Holmberg & Kuusela 2011). The main uncertainty comes from human factors during welding and NDT, which can be improved using sufficient quality control procedures. It is therefore assumed that the statistical analysis carried out so far does not reflect the expected number of defective canisters in the repository, but rather the uncertainties due to the limited data available on the specific welding process to be used.
The current interpretation of “incidental deviations” in STUK’s YVL Guide D.5 is thus that a few canisters may have an initially penetrating defect. It is expected that the reliability of the likelihood of defective canisters in the repository will be refined as the canister production, testing and quality control work progresses. With continued testing it seems it will be practicable to show that the probability of more than one initially defective in the repository is less than one percent. At the moment, therefore, the number of defective canisters is assumed to be one out of 4500 in the reference case of the base scenario defined in Formulation of Radionuclide Release Scenarios.
3.4 Buffer
The reference buffer material is high grade Na-bentonite from Wyoming (MX-80) and the alternative material is high grade Ca-bentonite from the island of Milos, Greece (Ibeco, also called Deponit CaN). The typical composition of the reference materials is given in Table 3-5. The initial state of the buffer and its detailed design are described in Description of the Disposal System and in the Buffer Production Line report.
The compacted blocks and discs of buffer will be emplaced in the deposition hole that is bored and accepted according to the RSC. The canister will be emplaced within the buffer as illustrated in Figure 3-21. The bottom of the deposition hole will be smoothed to ensure a tight contact between the host rock and the lowermost buffer disk. The inner gap between the buffer and the canister will be filled with air. The outer gap between the buffer blocks and rock will be filled with pellets of buffer material. The buffer is in contact with the deposition tunnel backfill material. The uppermost part of the buffer blocks is considered to belong to the backfill due to the tolerances in the deposition tunnel excavation (40 cm at the floor), which causes variability of the elevation of the
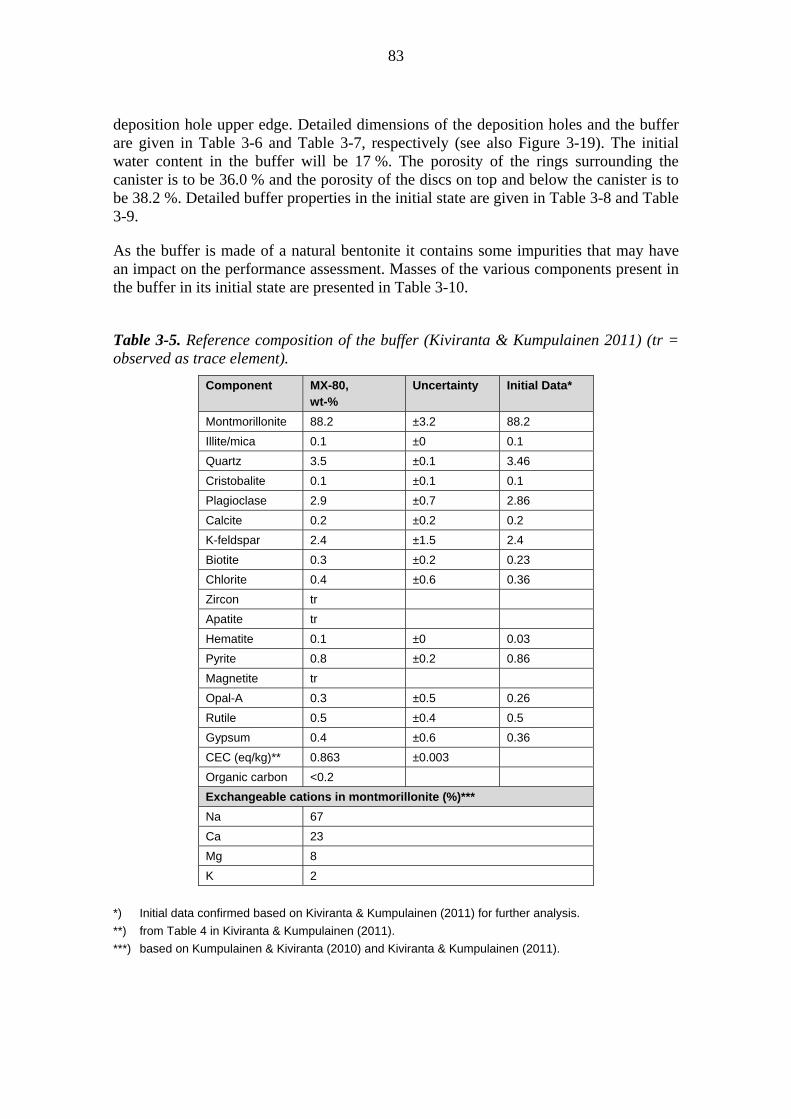
83
deposition hole upper edge. Detailed dimensions of the deposition holes and the buffer are given in Table 3-6 and Table 3-7, respectively (see also Figure 3-19). The initial water content in the buffer will be 17 %. The porosity of the rings surrounding the canister is to be 36.0 % and the porosity of the discs on top and below the canister is to be 38.2 %. Detailed buffer properties in the initial state are given in Table 3-8 and Table 3-9.
As the buffer is made of a natural bentonite it contains some impurities that may have an impact on the performance assessment. Masses of the various components present in the buffer in its initial state are presented in Table 3-10.
Table 3-5. Reference composition of the buffer (Kiviranta & Kumpulainen 2011) (tr = observed as trace element).
Component MX-80, wt-%
Uncertainty Initial Data*
Montmorillonite 88.2 ±3.2 88.2
Illite/mica 0.1 ±0 0.1
Quartz 3.5 ±0.1 3.46
Cristobalite 0.1 ±0.1 0.1
Plagioclase 2.9 ±0.7 2.86
Calcite 0.2 ±0.2 0.2
K-feldspar 2.4 ±1.5 2.4
Biotite 0.3 ±0.2 0.23
Chlorite 0.4 ±0.6 0.36
Zircon tr
Apatite tr
Hematite 0.1 ±0 0.03
Pyrite 0.8 ±0.2 0.86
Magnetite tr
Opal-A 0.3 ±0.5 0.26
Rutile 0.5 ±0.4 0.5
Gypsum 0.4 ±0.6 0.36
CEC (eq/kg)** 0.863 ±0.003
Organic carbon <0.2
Exchangeable cations in montmorillonite (%)***
Na 67
Ca 23
Mg 8
K 2
*) Initial data confirmed based on Kiviranta & Kumpulainen (2011) for further analysis.
**) from Table 4 in Kiviranta & Kumpulainen (2011).
***) based on Kumpulainen & Kiviranta (2010) and Kiviranta & Kumpulainen (2011).

84
a b
Figure 3-21. a) Buffer as emplaced in the deposition hole. The buffer designs (three designs depending on the spent nuclear fuel). In addition to ring blocks and disk blocks there is also a canister chasing filler block on top of the canisters. b) The chamfer in an OL3 deposition hole will be filled with a customised buffer block (chamfer block) (Buffer Production Line). For dimensions see text and esp. Table 3-7.
Table 3-6. Dimensions of the deposition hole (Buffer Production Line).
Design parameter Design value Allowable deviation
Qualification
Hole dimensions
Diameter of the hole, mm 1750 -5/+50 mm Measurement
Height of the deposition hole (measurements from the theoretical excavation line)
LO1&2 7.00 m OL1&2 8.205 m OL3 8.674 m
-0 m +0.05 m
Measurement
Gap properties
Outer gap width 50 mm ±25 mm Measurement
Inner gap width 10 mm ± 5 mm Based on nominal canister diameter (1050 mm) and hole diameter in ring blocks (1070±5 mm).
LO1−2
OL1−2 OL3
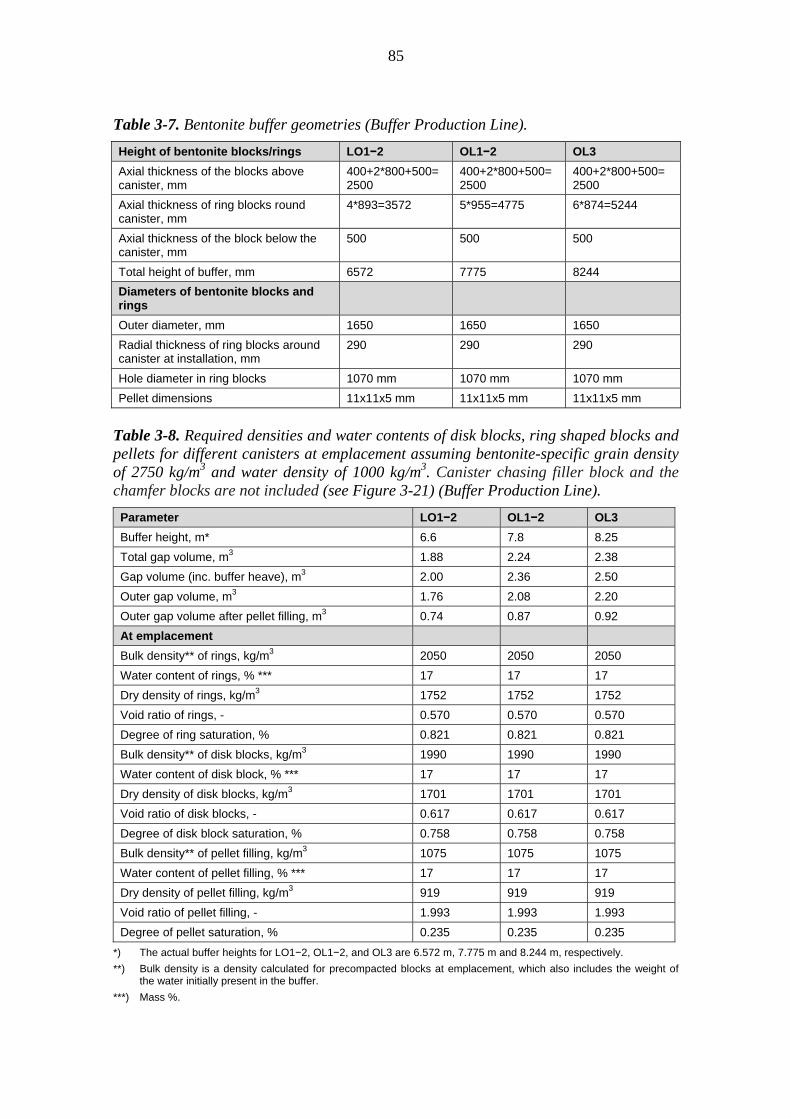
85
Table 3-7. Bentonite buffer geometries (Buffer Production Line).
Height of bentonite blocks/rings LO1−2 OL1−2 OL3
Axial thickness of the blocks above canister, mm
400+2*800+500= 2500
400+2*800+500= 2500
400+2*800+500= 2500
Axial thickness of ring blocks round canister, mm
4*893=3572 5*955=4775 6*874=5244
Axial thickness of the block below the canister, mm
500 500 500
Total height of buffer, mm 6572 7775 8244
Diameters of bentonite blocks and rings
Outer diameter, mm 1650 1650 1650
Radial thickness of ring blocks around canister at installation, mm
290 290 290
Hole diameter in ring blocks 1070 mm 1070 mm 1070 mm
Pellet dimensions 11x11x5 mm 11x11x5 mm 11x11x5 mm
Table 3-8. Required densities and water contents of disk blocks, ring shaped blocks and pellets for different canisters at emplacement assuming bentonite-specific grain density of 2750 kg/m3 and water density of 1000 kg/m3. Canister chasing filler block and the chamfer blocks are not included (see Figure 3-21) (Buffer Production Line).
Parameter LO1−2 OL1−2 OL3
Buffer height, m* 6.6 7.8 8.25
Total gap volume, m3 1.88 2.24 2.38
Gap volume (inc. buffer heave), m3 2.00 2.36 2.50
Outer gap volume, m3 1.76 2.08 2.20
Outer gap volume after pellet filling, m3 0.74 0.87 0.92
At emplacement
Bulk density** of rings, kg/m3 2050 2050 2050
Water content of rings, % *** 17 17 17
Dry density of rings, kg/m3 1752 1752 1752
Void ratio of rings, - 0.570 0.570 0.570
Degree of ring saturation, % 0.821 0.821 0.821
Bulk density** of disk blocks, kg/m3 1990 1990 1990
Water content of disk block, % *** 17 17 17
Dry density of disk blocks, kg/m3 1701 1701 1701
Void ratio of disk blocks, - 0.617 0.617 0.617
Degree of disk block saturation, % 0.758 0.758 0.758
Bulk density** of pellet filling, kg/m3 1075 1075 1075
Water content of pellet filling, % *** 17 17 17
Dry density of pellet filling, kg/m3 919 919 919
Void ratio of pellet filling, - 1.993 1.993 1.993
Degree of pellet saturation, % 0.235 0.235 0.235
*) The actual buffer heights for LO1−2, OL1−2, and OL3 are 6.572 m, 7.775 m and 8.244 m, respectively.
**) Bulk density is a density calculated for precompacted blocks at emplacement, which also includes the weight of the water initially present in the buffer.
***) Mass %.
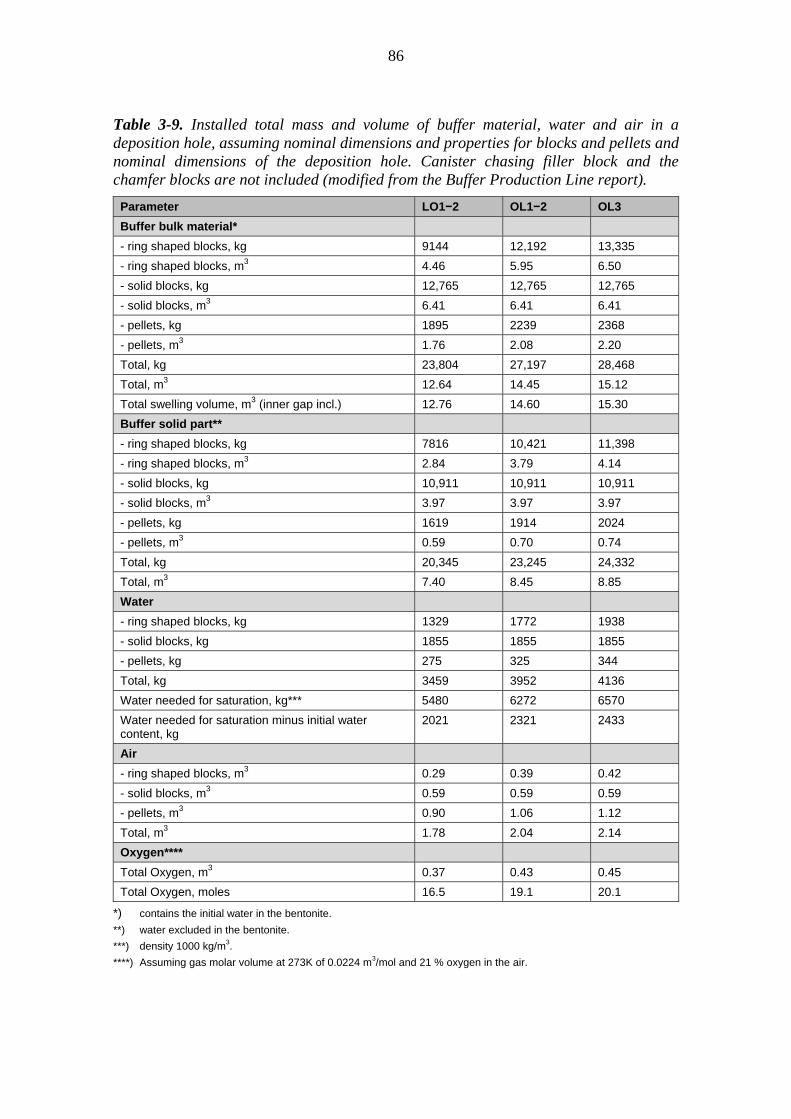
86
Table 3-9. Installed total mass and volume of buffer material, water and air in a deposition hole, assuming nominal dimensions and properties for blocks and pellets and nominal dimensions of the deposition hole. Canister chasing filler block and the chamfer blocks are not included (modified from the Buffer Production Line report).
Parameter LO1−2 OL1−2 OL3
Buffer bulk material*
- ring shaped blocks, kg 9144 12,192 13,335
- ring shaped blocks, m3 4.46 5.95 6.50
- solid blocks, kg 12,765 12,765 12,765
- solid blocks, m3 6.41 6.41 6.41
- pellets, kg 1895 2239 2368
- pellets, m3 1.76 2.08 2.20
Total, kg 23,804 27,197 28,468
Total, m3 12.64 14.45 15.12
Total swelling volume, m3 (inner gap incl.) 12.76 14.60 15.30
Buffer solid part**
- ring shaped blocks, kg 7816 10,421 11,398
- ring shaped blocks, m3 2.84 3.79 4.14
- solid blocks, kg 10,911 10,911 10,911
- solid blocks, m3 3.97 3.97 3.97
- pellets, kg 1619 1914 2024
- pellets, m3 0.59 0.70 0.74
Total, kg 20,345 23,245 24,332
Total, m3 7.40 8.45 8.85
Water
- ring shaped blocks, kg 1329 1772 1938
- solid blocks, kg 1855 1855 1855
- pellets, kg 275 325 344
Total, kg 3459 3952 4136
Water needed for saturation, kg*** 5480 6272 6570
Water needed for saturation minus initial water content, kg
2021 2321 2433
Air
- ring shaped blocks, m3 0.29 0.39 0.42
- solid blocks, m3 0.59 0.59 0.59
- pellets, m3 0.90 1.06 1.12
Total, m3 1.78 2.04 2.14
Oxygen****
Total Oxygen, m3 0.37 0.43 0.45
Total Oxygen, moles 16.5 19.1 20.1
*) contains the initial water in the bentonite.
**) water excluded in the bentonite.
***) density 1000 kg/m3.
****) Assuming gas molar volume at 273K of 0.0224 m3/mol and 21 % oxygen in the air.
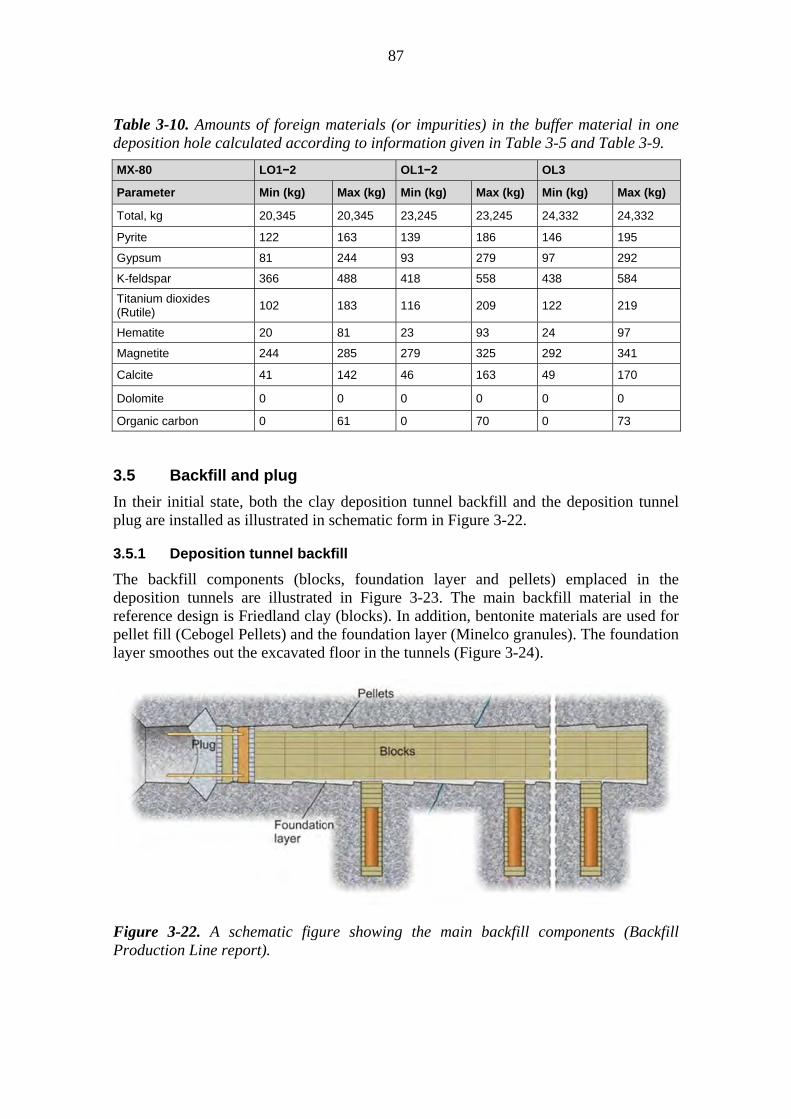
87
Table 3-10. Amounts of foreign materials (or impurities) in the buffer material in one deposition hole calculated according to information given in Table 3-5 and Table 3-9.
MX-80 LO1−2 OL1−2 OL3
Parameter Min (kg) Max (kg) Min (kg) Max (kg) Min (kg) Max (kg)
Total, kg 20,345 20,345 23,245 23,245 24,332 24,332
Pyrite 122 163 139 186 146 195
Gypsum 81 244 93 279 97 292
K-feldspar 366 488 418 558 438 584
Titanium dioxides (Rutile)
102 183 116 209 122 219
Hematite 20 81 23 93 24 97
Magnetite 244 285 279 325 292 341
Calcite 41 142 46 163 49 170
Dolomite 0 0 0 0 0 0
Organic carbon 0 61 0 70 0 73
3.5 Backfill and plug
In their initial state, both the clay deposition tunnel backfill and the deposition tunnel plug are installed as illustrated in schematic form in Figure 3-22.
3.5.1 Deposition tunnel backfill
The backfill components (blocks, foundation layer and pellets) emplaced in the deposition tunnels are illustrated in Figure 3-23. The main backfill material in the reference design is Friedland clay (blocks). In addition, bentonite materials are used for pellet fill (Cebogel Pellets) and the foundation layer (Minelco granules). The foundation layer smoothes out the excavated floor in the tunnels (Figure 3-24).
Figure 3-22. A schematic figure showing the main backfill components (Backfill Production Line report).

88
Figure 3-23. A schematic figure showing the main backfill components: foundation layer, backfill blocks and pellets. The tunnel size is for spent nuclear fuel from the Olkiluoto nuclear power plants. The inner black dotted line shows the theoretical excavation profile and the outer, the maximum possible cross-section of the tunnel assuming tolerances of 400 mm for the floor and 300 mm for the walls/roof. In reality, the rock surface will be located between these two lines (an example is shown in the figure) (Backfill Production Line report).
Figure 3-24. Design of the foundation layer (Backfill Production Line report).
Backfill materials and their compositions at the initial state are given in detail in Tables 3-11 to 3-13.
The backfill has been designed taking into account the tolerances in excavation (see Figure 3-23 and Figure 3-24). Prior to saturation, the average degree of saturation (ratio of volume of water to volume of voids) is 54 % for the backfill. The rest of the void volume is filled with air (46 %). Table 3-14 presents detailed properties of the deposition tunnel backfill at the initial state for the tunnel type OL1−3.
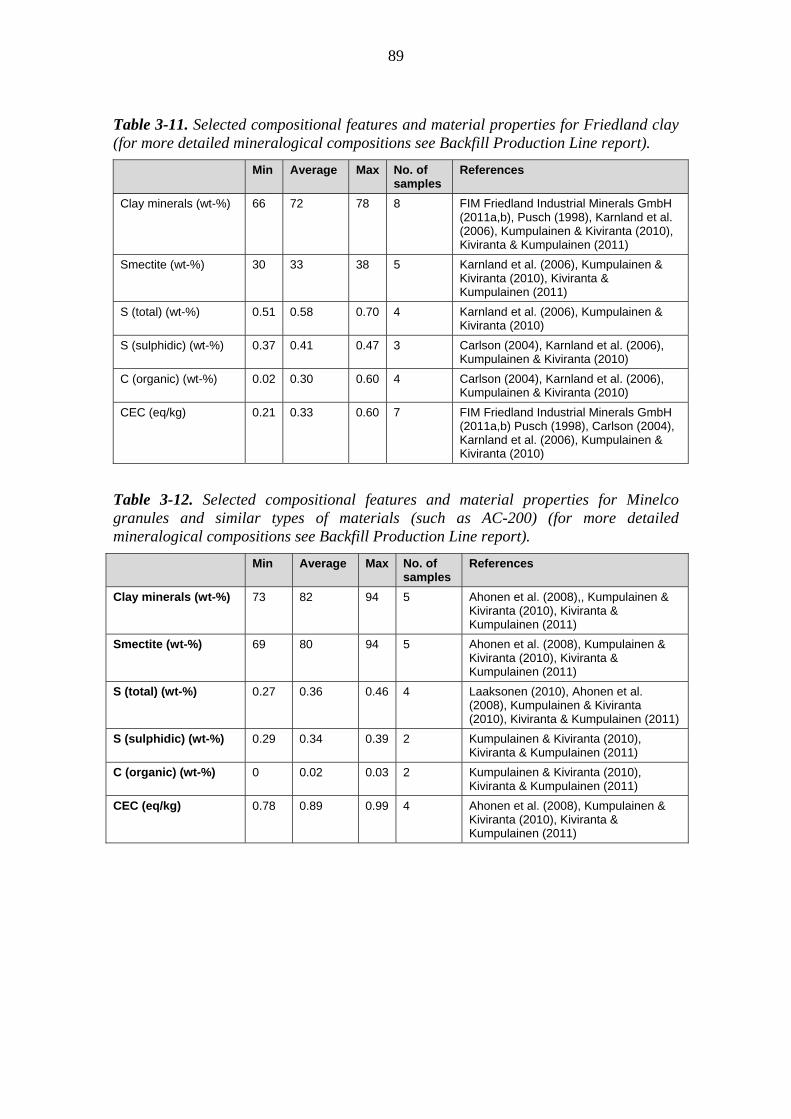
89
Table 3-11. Selected compositional features and material properties for Friedland clay (for more detailed mineralogical compositions see Backfill Production Line report).
Min Average Max No. of samples
References
Clay minerals (wt-%) 66 72 78 8 FIM Friedland Industrial Minerals GmbH (2011a,b), Pusch (1998), Karnland et al. (2006), Kumpulainen & Kiviranta (2010), Kiviranta & Kumpulainen (2011)
Smectite (wt-%) 30 33 38 5 Karnland et al. (2006), Kumpulainen & Kiviranta (2010), Kiviranta & Kumpulainen (2011)
S (total) (wt-%) 0.51 0.58 0.70 4 Karnland et al. (2006), Kumpulainen & Kiviranta (2010)
S (sulphidic) (wt-%) 0.37 0.41 0.47 3 Carlson (2004), Karnland et al. (2006), Kumpulainen & Kiviranta (2010)
C (organic) (wt-%) 0.02 0.30 0.60 4 Carlson (2004), Karnland et al. (2006), Kumpulainen & Kiviranta (2010)
CEC (eq/kg) 0.21 0.33 0.60 7 FIM Friedland Industrial Minerals GmbH (2011a,b) Pusch (1998), Carlson (2004), Karnland et al. (2006), Kumpulainen & Kiviranta (2010)
Table 3-12. Selected compositional features and material properties for Minelco granules and similar types of materials (such as AC-200) (for more detailed mineralogical compositions see Backfill Production Line report).
Min Average Max No. of samples
References
Clay minerals (wt-%) 73 82 94 5 Ahonen et al. (2008),, Kumpulainen & Kiviranta (2010), Kiviranta & Kumpulainen (2011)
Smectite (wt-%) 69 80 94 5 Ahonen et al. (2008), Kumpulainen & Kiviranta (2010), Kiviranta & Kumpulainen (2011)
S (total) (wt-%) 0.27 0.36 0.46 4 Laaksonen (2010), Ahonen et al. (2008), Kumpulainen & Kiviranta (2010), Kiviranta & Kumpulainen (2011)
S (sulphidic) (wt-%) 0.29 0.34 0.39 2 Kumpulainen & Kiviranta (2010), Kiviranta & Kumpulainen (2011)
C (organic) (wt-%) 0 0.02 0.03 2 Kumpulainen & Kiviranta (2010), Kiviranta & Kumpulainen (2011)
CEC (eq/kg) 0.78 0.89 0.99 4 Ahonen et al. (2008), Kumpulainen & Kiviranta (2010), Kiviranta & Kumpulainen (2011)
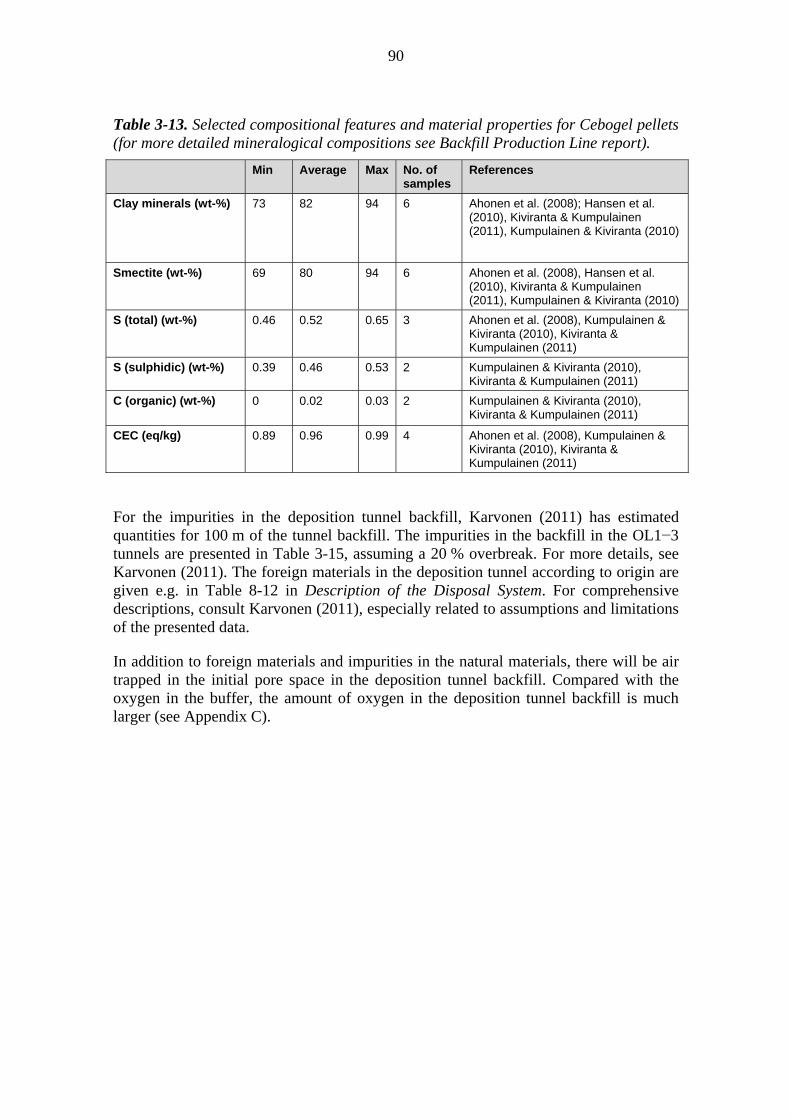
90
Table 3-13. Selected compositional features and material properties for Cebogel pellets (for more detailed mineralogical compositions see Backfill Production Line report).
Min Average Max No. of samples
References
Clay minerals (wt-%) 73 82 94 6 Ahonen et al. (2008); Hansen et al. (2010), Kiviranta & Kumpulainen (2011), Kumpulainen & Kiviranta (2010)
Smectite (wt-%) 69 80 94 6 Ahonen et al. (2008), Hansen et al. (2010), Kiviranta & Kumpulainen (2011), Kumpulainen & Kiviranta (2010)
S (total) (wt-%) 0.46 0.52 0.65 3 Ahonen et al. (2008), Kumpulainen & Kiviranta (2010), Kiviranta & Kumpulainen (2011)
S (sulphidic) (wt-%) 0.39 0.46 0.53 2 Kumpulainen & Kiviranta (2010), Kiviranta & Kumpulainen (2011)
C (organic) (wt-%) 0 0.02 0.03 2 Kumpulainen & Kiviranta (2010), Kiviranta & Kumpulainen (2011)
CEC (eq/kg) 0.89 0.96 0.99 4 Ahonen et al. (2008), Kumpulainen & Kiviranta (2010), Kiviranta & Kumpulainen (2011)
For the impurities in the deposition tunnel backfill, Karvonen (2011) has estimated quantities for 100 m of the tunnel backfill. The impurities in the backfill in the OL1−3 tunnels are presented in Table 3-15, assuming a 20 % overbreak. For more details, see Karvonen (2011). The foreign materials in the deposition tunnel according to origin are given e.g. in Table 8-12 in Description of the Disposal System. For comprehensive descriptions, consult Karvonen (2011), especially related to assumptions and limitations of the presented data.
In addition to foreign materials and impurities in the natural materials, there will be air trapped in the initial pore space in the deposition tunnel backfill. Compared with the oxygen in the buffer, the amount of oxygen in the deposition tunnel backfill is much larger (see Appendix C).

91
Table 3-14. Volumes and masses of backfill component for one tunnel metre and for a 300-m long deposition tunnel for the OL1−3 case (Autio et al. 2012). See the Backfill Production Line report for the LO1−2 deposition tunnel type.
Excavation tolerances Max Average Min
Roof and walls (mm) 300 150 0
Floor (mm) 400 200 0
Cross-sectional areas from the design
Theoretical tunnel cross-section* m2 14.10 14.10 14.10
Realised cross-section with tolerances m2 19.18 16.64 14.10
Overbreak-% (%) 36.00 18.00 0.00
Volumes per one tunnel metre
Blocks (with gaps) m3 12.32 12.32 12.32
Blocks (without gaps) m3 12.11 12.11 12.11
Gaps between the blocks (1.7 % of the total block volume) m3 0.21 0.21 0.21
Foundation bed m3 2.26 1.39 0.53
Pellets m3 4.60 2.93 1.26
Total volume of all backfill components m3 19.18 16.64 14.10
Block filling degrees
Block filling degree from theoretical/nominal tunnel volume % 85.89
Block filling degree from realised tunnel volume % 63.15 72.79 85.89
Initial dry densities
Blocks kg/m3 2030 2030 2030
Pellets kg/m3 1000 1000 1000
Foundation layer kg/m3 1250 1250 1250
Total masses per 1 m
Blocks kg 24,584 24,584 24,584
Pellets kg 4596 2926 1255
Foundation layer kg 2825 1741 656
Total mass of all backfill components kg 32,005 29,251 26,496
Total masses per 300 m
Blocks tons 7375 7375 7375
Pellets tons 1379 878 377
Foundation layer tons 848 522 197
Total masses of all components tons 9602 8775 7949
Average dry density after saturation and homogenisation kg/m3 1669 1758 1879
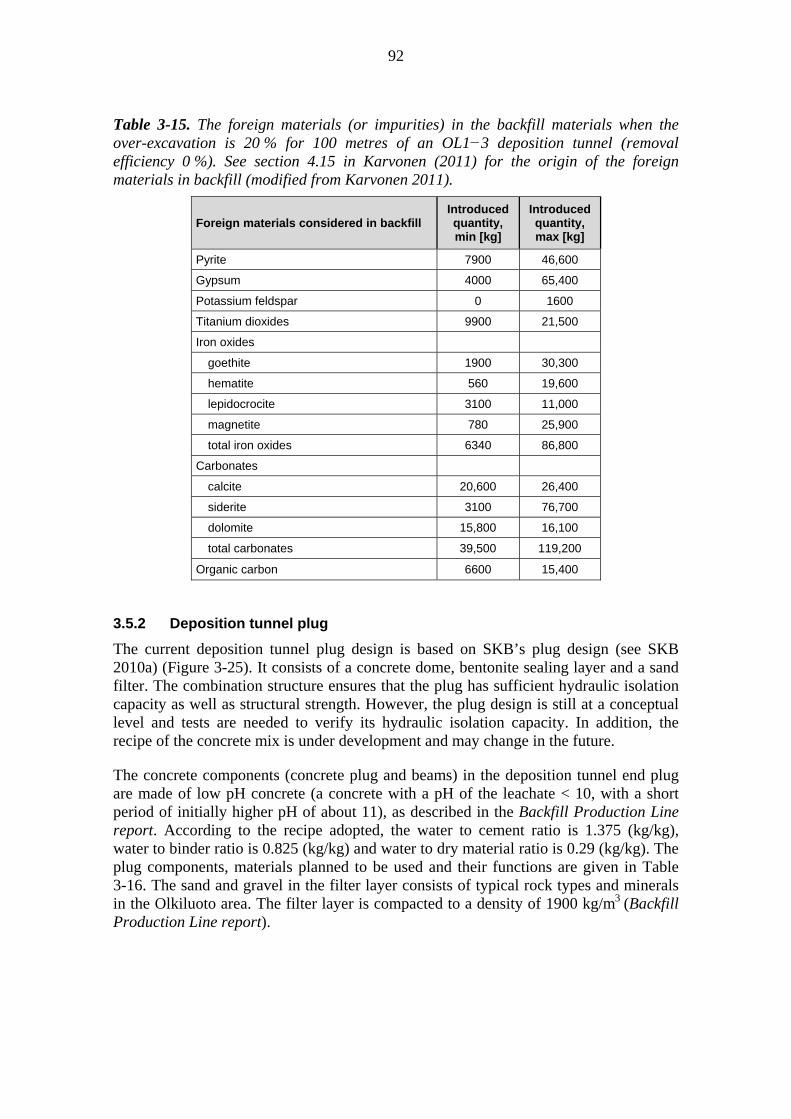
92
Table 3-15. The foreign materials (or impurities) in the backfill materials when the over-excavation is 20 % for 100 metres of an OL1−3 deposition tunnel (removal efficiency 0 %). See section 4.15 in Karvonen (2011) for the origin of the foreign materials in backfill (modified from Karvonen 2011).
Foreign materials considered in backfill Introduced quantity, min [kg]
Introduced quantity, max [kg]
Pyrite 7900 46,600
Gypsum 4000 65,400
Potassium feldspar 0 1600
Titanium dioxides 9900 21,500
Iron oxides
goethite 1900 30,300
hematite 560 19,600
lepidocrocite 3100 11,000
magnetite 780 25,900
total iron oxides 6340 86,800
Carbonates
calcite 20,600 26,400
siderite 3100 76,700
dolomite 15,800 16,100
total carbonates 39,500 119,200
Organic carbon 6600 15,400
3.5.2 Deposition tunnel plug
The current deposition tunnel plug design is based on SKB’s plug design (see SKB 2010a) (Figure 3-25). It consists of a concrete dome, bentonite sealing layer and a sand filter. The combination structure ensures that the plug has sufficient hydraulic isolation capacity as well as structural strength. However, the plug design is still at a conceptual level and tests are needed to verify its hydraulic isolation capacity. In addition, the recipe of the concrete mix is under development and may change in the future.
The concrete components (concrete plug and beams) in the deposition tunnel end plug are made of low pH concrete (a concrete with a pH of the leachate < 10, with a short period of initially higher pH of about 11), as described in the Backfill Production Line report. According to the recipe adopted, the water to cement ratio is 1.375 (kg/kg), water to binder ratio is 0.825 (kg/kg) and water to dry material ratio is 0.29 (kg/kg). The plug components, materials planned to be used and their functions are given in Table 3-16. The sand and gravel in the filter layer consists of typical rock types and minerals in the Olkiluoto area. The filter layer is compacted to a density of 1900 kg/m3 (Backfill Production Line report).

93
Figure 3-25. Illustration of the reference design of the deposition tunnel end plug. Top view (top), side view (middle) and front view (down). In the two upmost figures, the deposition tunnel is on the left (Backfill Production Line report).
Swelling pressure
Concrete beams
Filter layer Watertight seal
Swelling pressure
Concrete beams
Filter layer Watertight seal
4400
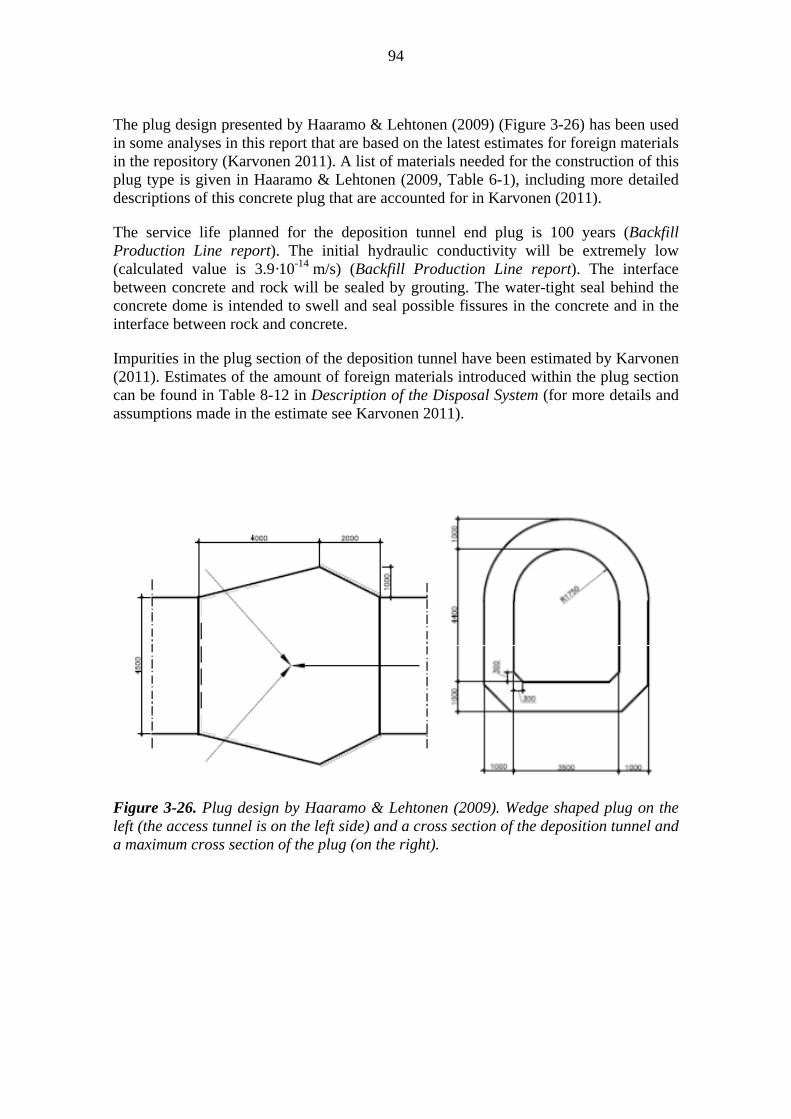
94
The plug design presented by Haaramo & Lehtonen (2009) (Figure 3-26) has been used in some analyses in this report that are based on the latest estimates for foreign materials in the repository (Karvonen 2011). A list of materials needed for the construction of this plug type is given in Haaramo & Lehtonen (2009, Table 6-1), including more detailed descriptions of this concrete plug that are accounted for in Karvonen (2011).
The service life planned for the deposition tunnel end plug is 100 years (Backfill Production Line report). The initial hydraulic conductivity will be extremely low (calculated value is 3.9·10-14 m/s) (Backfill Production Line report). The interface between concrete and rock will be sealed by grouting. The water-tight seal behind the concrete dome is intended to swell and seal possible fissures in the concrete and in the interface between rock and concrete.
Impurities in the plug section of the deposition tunnel have been estimated by Karvonen (2011). Estimates of the amount of foreign materials introduced within the plug section can be found in Table 8-12 in Description of the Disposal System (for more details and assumptions made in the estimate see Karvonen 2011).
Figure 3-26. Plug design by Haaramo & Lehtonen (2009). Wedge shaped plug on the left (the access tunnel is on the left side) and a cross section of the deposition tunnel and a maximum cross section of the plug (on the right).
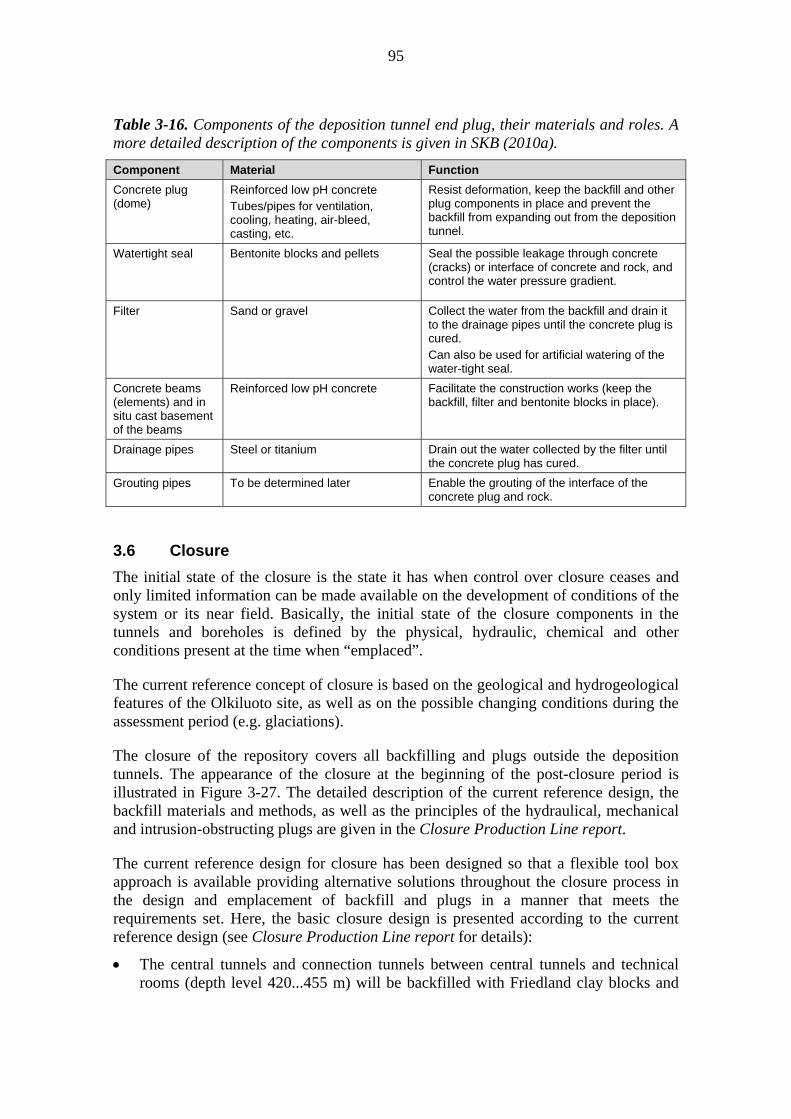
95
Table 3-16. Components of the deposition tunnel end plug, their materials and roles. A more detailed description of the components is given in SKB (2010a).
Component Material Function
Concrete plug (dome)
Reinforced low pH concrete Tubes/pipes for ventilation, cooling, heating, air-bleed, casting, etc.
Resist deformation, keep the backfill and other plug components in place and prevent the backfill from expanding out from the deposition tunnel.
Watertight seal Bentonite blocks and pellets Seal the possible leakage through concrete (cracks) or interface of concrete and rock, and control the water pressure gradient.
Filter Sand or gravel Collect the water from the backfill and drain it to the drainage pipes until the concrete plug is cured. Can also be used for artificial watering of the water-tight seal.
Concrete beams (elements) and in situ cast basement of the beams
Reinforced low pH concrete Facilitate the construction works (keep the backfill, filter and bentonite blocks in place).
Drainage pipes Steel or titanium Drain out the water collected by the filter until the concrete plug has cured.
Grouting pipes To be determined later Enable the grouting of the interface of the concrete plug and rock.
3.6 Closure
The initial state of the closure is the state it has when control over closure ceases and only limited information can be made available on the development of conditions of the system or its near field. Basically, the initial state of the closure components in the tunnels and boreholes is defined by the physical, hydraulic, chemical and other conditions present at the time when “emplaced”.
The current reference concept of closure is based on the geological and hydrogeological features of the Olkiluoto site, as well as on the possible changing conditions during the assessment period (e.g. glaciations).
The closure of the repository covers all backfilling and plugs outside the deposition tunnels. The appearance of the closure at the beginning of the post-closure period is illustrated in Figure 3-27. The detailed description of the current reference design, the backfill materials and methods, as well as the principles of the hydraulical, mechanical and intrusion-obstructing plugs are given in the Closure Production Line report.
The current reference design for closure has been designed so that a flexible tool box approach is available providing alternative solutions throughout the closure process in the design and emplacement of backfill and plugs in a manner that meets the requirements set. Here, the basic closure design is presented according to the current reference design (see Closure Production Line report for details):
The central tunnels and connection tunnels between central tunnels and technical rooms (depth level 420...455 m) will be backfilled with Friedland clay blocks and
96
bentonite pellets, and mechanical plugs may be used if needed to support the installed backfill. Hydraulic plugs are used in places where the backfill material changes. The concrete in the plugs will be of the low pH type.
The technical rooms and the lowest parts of the shafts will be backfilled with crushed rock. In shafts, above the crushed rock layer, Friedland clay blocks and bentonite pellets will be used. Hydraulic plugs are planned to be used to isolate the lowest part of the shafts from the structure HZ20 (for structures see Figures 3-1 and 3-2). The concrete in the plugs will be of the low pH type.
The access tunnel below the structure HZ20 will be backfilled with in situ compacted clay-aggregate mixture. Hydraulic plugs are planned to be used to isolate this access tunnel section from the structure HZ20. Mechanical plugs (Figure 3-28a) may be used if needed to support the installed backfill. The concrete in the plugs will be of the low pH type.
The structure HZ20 (in the access tunnel and shafts) is to be isolated from the rock below and above it by having hydraulic plugs (Figure 3-28b) on both sides of the structure. Between these plugs, the tunnel/shafts are to be backfilled with in situ compacted crushed rock. Below HZ20 the concrete will be low pH type.
Above HZ20 the access tunnel and the shafts will be backfilled with in situ compacted clay-aggregate mixtures up to the depth level 200 m. Mechanical plugs may be used in the access tunnel if needed to support the installed backfill.
Above the 200 m level up to the intrusion obstructing plugs (Figure 3-27 and Figure 3-28c) the access tunnel and the shafts will be backfilled with in situ compacted crushed rock.
Structure HZ19 is isolated from the bedrock below it by having hydraulic plugs in the access tunnel and the shafts.
The closure of the disposal facility is completed by installing intrusion obstructing plugs at the mouth of the access tunnel and the shafts. Their vertical extension is 25−30 m from the surface.
Eventually, there will be several types of backfills in the disposal facility when closed. The initial state for closure is described in Description of the Disposal System.

97
Fig
ure
3-2
7. C
urre
nt r
efer
ence
des
ign
for
clos
ure
show
ing
the
acce
ss t
unne
l (1
) an
d sh
afts
(2)
, tec
hnic
al r
oom
s at
the
rep
osit
ory
leve
l (3
) an
d th
e ce
ntra
l tu
nnel
s (4
) le
adin
g fr
om t
he t
echn
ical
roo
ms
to d
epos
itio
n tu
nnel
s, l
ocat
ion
of t
he L
/IL
W r
epos
itor
y is
als
o sh
own
(5)
(Clo
sure
Pro
duct
ion
Lin
e re
port
).
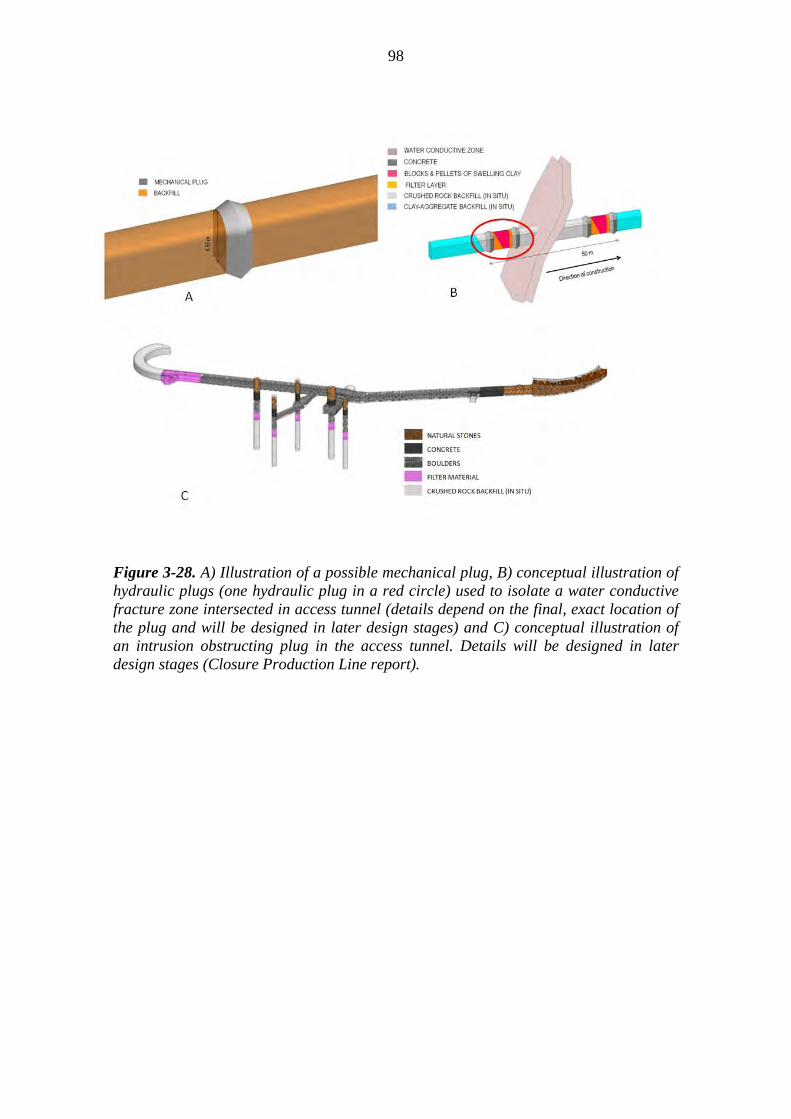
98
Figure 3-28. A) Illustration of a possible mechanical plug, B) conceptual illustration of hydraulic plugs (one hydraulic plug in a red circle) used to isolate a water conductive fracture zone intersected in access tunnel (details depend on the final, exact location of the plug and will be designed in later design stages) and C) conceptual illustration of an intrusion obstructing plug in the access tunnel. Details will be designed in later design stages (Closure Production Line report).
99
4 EVOLUTION FEPS AND REPOSITORY SYSTEM PERFORMANCE
In this chapter, the performance targets and target properties listed in Chapter 2 (VAHA L3) are checked against evolution-related FEPs of the EBS and geosphere to ensure that the relevant processes that may pose a threat to the performance of the barriers have been identified. As part of this, the overarching FEP climate evolution considered for the PA is presented. The FEPs listed below are taken into account in the analysis of the performance of the repository system in Chapters 5 to 8 of this report.
4.1 Climate evolution considered for the PA-report
As stated in Chapter 4 of Formulation of Radionuclide Release Scenarios, the climate evolution envelopes the evolution of the whole disposal system (repository system and surface environment) and thus influences performance over the whole time that the system needs to keep the spent nuclear fuel contained and isolated. The details of the climate evolution, as an overarching evolution FEP, are outside the scope of this report. However, climate evolution needs to be considered because of its influence on groundwater flow and composition. This influence is exerted through the boundary conditions given by the surface and near-surface groundwater flows, which are in turn controlled by temperature and precipitation in the surface environment. It must be noted that, especially in the long term, climate evolution also influences rock mechanics through the advance and retreat of ice sheets. For these reasons, the following climatic time windows need to be taken into account6:
1. From the start of repository construction after the year 2012 up to 50 ka after present (AP), temperate conditions (i.e. boreal climate) are considered (see Ch. 4 in Formulation of Radionuclide Release Scenarios). It must be noted that no major changes in groundwater flow are expected from 10 ka to 50 ka AP, as crustal uplift decreases notably after about 10 ka AP (e.g. Vuorela et al. 2009) and no major changes from present climatic conditions are expected.
2. The onset of the first cold period is expected at about 50 ka AP with temperature and precipitation changes leading first to permafrost development and later to ice-sheet growth and advance. The occurrence and duration of permafrost and/or ice-sheet periods in the future is acknowledged to be uncertain and the time windows presented are illustrative and based on the occurrence of events during the last glacial cycle (LGC), the Weichselian, for which proxy data exist with more reliability than for previous glacial cycles (see Ch. 4 in Formulation of Radionuclide Release Scenarios). The first time window for permafrost is thus between 50 and 60 ka AP, with a second permafrost time window between about 73 and 81 ka AP before the onset of an ice sheet after 92 ka AP. This ice sheet lasts until about 106 ka AP, followed by a third permafrost time window from 106 ka to 113 ka AP and then by a second fluctuating ice-sheet that at most will last from 113 to 132 ka AP. A fourth permafrost time window will occur between 132 and 141 ka AP, ending with the onset of an ice sheet that will last up to about 156 ka AP. These time windows and their corresponding climate types are summarised in Table 4-1. Figure 4-1 presents a schematic illustration of the time
6 Note that the future climatic evolution scenario considering the (up to one million years) continuation of temperate conditions is not treated within this report due to the lack of meaningful events for long-term safety (no permafrost or ice sheets or meltwater).
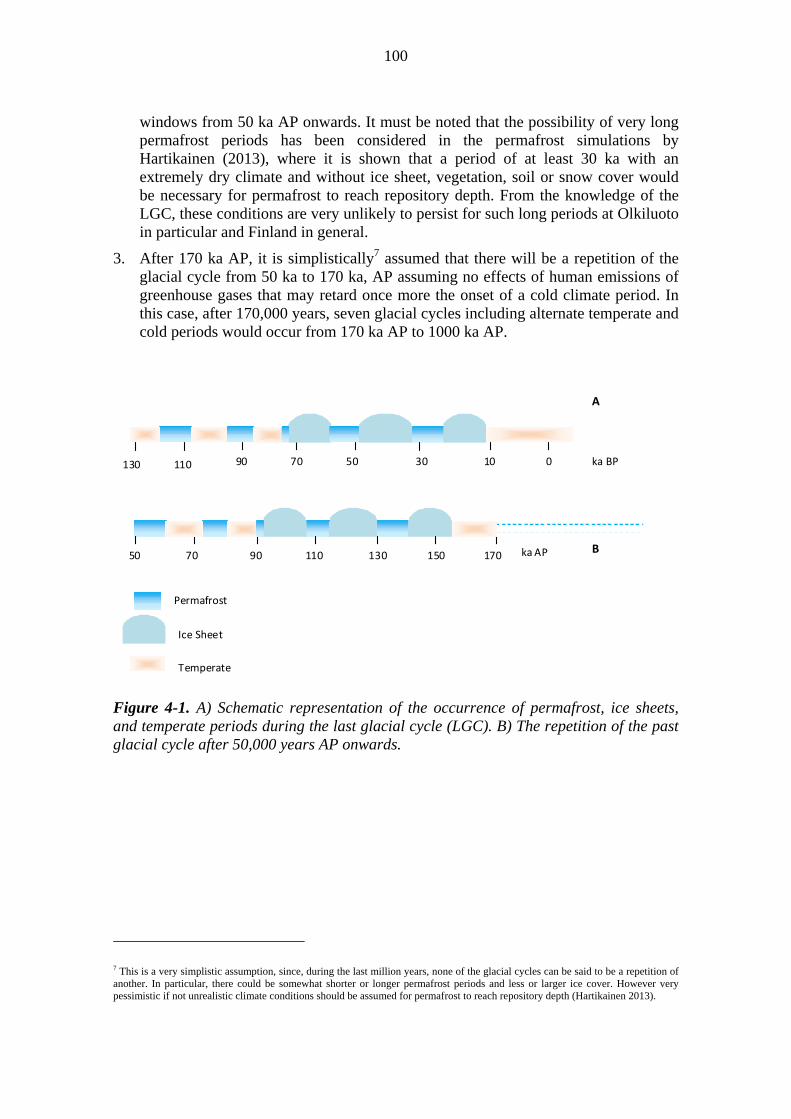
100
windows from 50 ka AP onwards. It must be noted that the possibility of very long permafrost periods has been considered in the permafrost simulations by Hartikainen (2013), where it is shown that a period of at least 30 ka with an extremely dry climate and without ice sheet, vegetation, soil or snow cover would be necessary for permafrost to reach repository depth. From the knowledge of the LGC, these conditions are very unlikely to persist for such long periods at Olkiluoto in particular and Finland in general.
3. After 170 ka AP, it is simplistically7 assumed that there will be a repetition of the glacial cycle from 50 ka to 170 ka, AP assuming no effects of human emissions of greenhouse gases that may retard once more the onset of a cold climate period. In this case, after 170,000 years, seven glacial cycles including alternate temperate and cold periods would occur from 170 ka AP to 1000 ka AP.
Figure 4-1. A) Schematic representation of the occurrence of permafrost, ice sheets, and temperate periods during the last glacial cycle (LGC). B) The repetition of the past glacial cycle after 50,000 years AP onwards.
7 This is a very simplistic assumption, since, during the last million years, none of the glacial cycles can be said to be a repetition of another. In particular, there could be somewhat shorter or longer permafrost periods and less or larger ice cover. However very pessimistic if not unrealistic climate conditions should be assumed for permafrost to reach repository depth (Hartikainen 2013).
50 70 90 110 130 150 170
Permafrost
Ice Sheet
Temperate
ka AP
130 110 090 70 50 30 10 ka BP
A
B

101
Table 4-1. Climate types and corresponding time windows after present (AP).
Time window (ka AP) →
From year 2012 up to 50 ka AP
50–60
60–73
73–81
81–92
92–106
106–113
113–132
131–141
141–156
Climate type ↓
TEMPERATE (T); climate like today’s (i.e. one corresponding to the boreal zone)
T T T
COLD/Permafrost (P) P P P P
COLD/Ice Sheet (IS) IS IS* IS * Fluctuating ice sheet
It must be noted that permafrost formation (FEP 10.2.3, see Features, Events and Processes) is considered as an external FEP that may affect groundwater flow and composition. The occurrence of permafrost is judged plausible only after 50 ka AP (see above); the possibility of permafrost formation has been taken into account primarily in the selection of the depth of the repository to ensure that permafrost does not reach the repository and secondarily in the selection of the materials to be used in the repository system (see Section 7.3).
4.2 Evolution FEPs affecting host rock properties
The evolving host rock conditions envelope the engineered barrier system (EBS) performance. This is because the host rock is to provide favourable and predictable conditions for the EBS, so that it can fulfil its functions of containment and isolation, and in case of radionuclide releases, its functions of limiting and retarding their transport.
The initial state of the underground openings and the host rock properties in the vicinity of the deposition holes are constrained by the RSC criteria (see Section 2.2.1). The aim is to provide favourable and predictable conditions for the EBS by locating the deposition tunnels at a suitable depth and away from the layout-determining features and further, by discarding deposition hole positions that are intersected by large fractures and/or where the inflow is high. Also, host rock properties contributing to radionuclide retention in the repository system are preferred.
Taking the initial state into account, the FEPs that may affect groundwater flow and composition (and thus other migration FEPs related to most target properties under L3-ROC) during the lifetime of the repository after the first canister emplacement are (see Features, Events and Processes):
8.2.18 Heat transfer; taking into account that the period of significant heat generation by spent nuclear fuel coincides approximately with the first temperate
8 Numbers are FEP numbers in Features, Events and Processes.
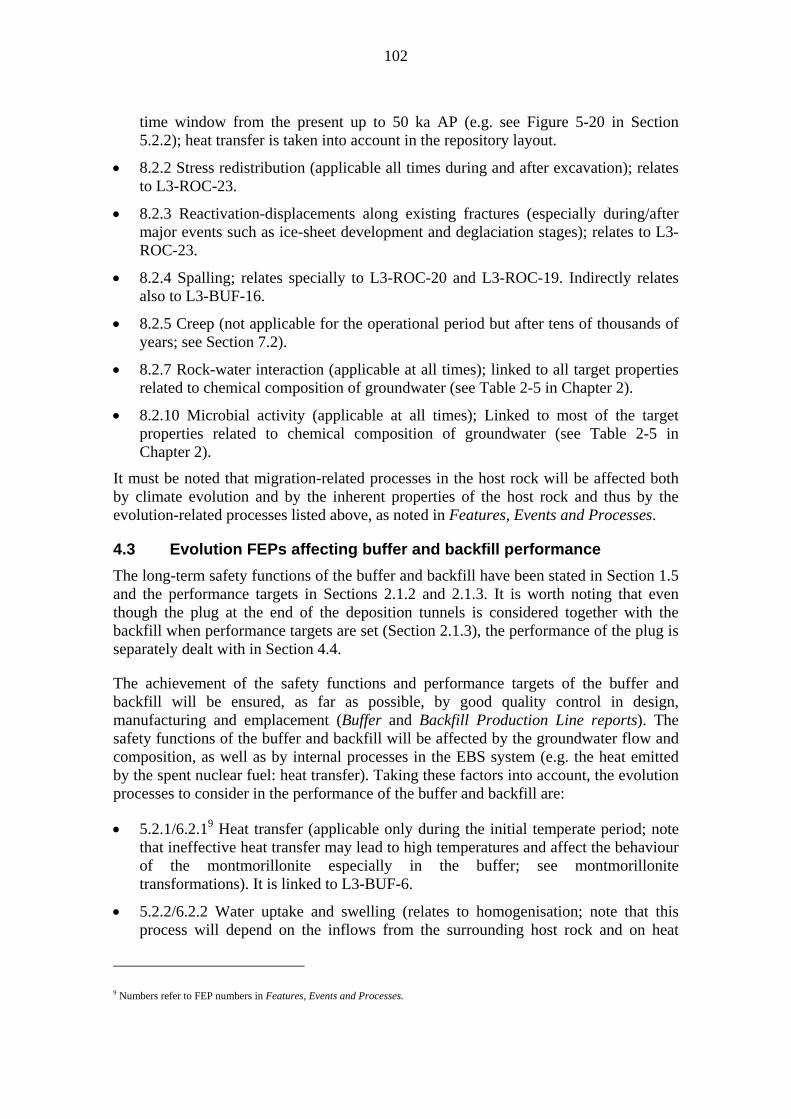
102
time window from the present up to 50 ka AP (e.g. see Figure 5-20 in Section 5.2.2); heat transfer is taken into account in the repository layout.
8.2.2 Stress redistribution (applicable all times during and after excavation); relates to L3-ROC-23.
8.2.3 Reactivation-displacements along existing fractures (especially during/after major events such as ice-sheet development and deglaciation stages); relates to L3-ROC-23.
8.2.4 Spalling; relates specially to L3-ROC-20 and L3-ROC-19. Indirectly relates also to L3-BUF-16.
8.2.5 Creep (not applicable for the operational period but after tens of thousands of years; see Section 7.2).
8.2.7 Rock-water interaction (applicable at all times); linked to all target properties related to chemical composition of groundwater (see Table 2-5 in Chapter 2).
8.2.10 Microbial activity (applicable at all times); Linked to most of the target properties related to chemical composition of groundwater (see Table 2-5 in Chapter 2).
It must be noted that migration-related processes in the host rock will be affected both by climate evolution and by the inherent properties of the host rock and thus by the evolution-related processes listed above, as noted in Features, Events and Processes.
4.3 Evolution FEPs affecting buffer and backfill performance
The long-term safety functions of the buffer and backfill have been stated in Section 1.5 and the performance targets in Sections 2.1.2 and 2.1.3. It is worth noting that even though the plug at the end of the deposition tunnels is considered together with the backfill when performance targets are set (Section 2.1.3), the performance of the plug is separately dealt with in Section 4.4.
The achievement of the safety functions and performance targets of the buffer and backfill will be ensured, as far as possible, by good quality control in design, manufacturing and emplacement (Buffer and Backfill Production Line reports). The safety functions of the buffer and backfill will be affected by the groundwater flow and composition, as well as by internal processes in the EBS system (e.g. the heat emitted by the spent nuclear fuel: heat transfer). Taking these factors into account, the evolution processes to consider in the performance of the buffer and backfill are:
5.2.1/6.2.19 Heat transfer (applicable only during the initial temperate period; note that ineffective heat transfer may lead to high temperatures and affect the behaviour of the montmorillonite especially in the buffer; see montmorillonite transformations). It is linked to L3-BUF-6.
5.2.2/6.2.2 Water uptake and swelling (relates to homogenisation; note that this process will depend on the inflows from the surrounding host rock and on heat
9 Numbers refer to FEP numbers in Features, Events and Processes.
103
transfer). Relates to L3-BUF-4, L4-BUF-2, L4-BUF-9, L4-BUF-16, and L3-BAC-5, L4-BAC-2, L4-BAC-30, L4-BAC-28.
5.2.3/6.2.3 Piping and erosion (the proper selection of the position of deposition holes and tunnels will limit the extent of piping and erosion). Relates to the same requirements as above.
5.2.4/6.2.4 Chemical erosion (applicable only if very dilute groundwater reaches repository depth; see geochemical evolution of groundwater in Ch. 5 to 8); relates to all requirements in L3 (level 3) and L4 (level 4) for buffer and backfill.
5.2.5 Radiolysis of porewater does not need to be dealt with in the performance assessment of the buffer or backfill because of minor influence; see the reasoning in the Process Report 2007 (Miller & Marcos 2007) and in Features, Events and Processes.
5.2.6/6.2.5 Montmorillonite transformation. Relates to L3-BUF-4, L4-BUF-2. L4-BUF-9, L4-BUF-16, and L3-BAC-5, L4-BAC-2, L4-BAC-30, L4-BAC-28.
5.2.7/6.2.6 Alteration of accessory minerals. Relates to L3-BUF-21, L4-BUF-19, and L3-BAC-13, L4-BAC-18.
5.2.8/6.2.7 Microbial activity. Relates to L3-BUF-4, L3-BUF-21, L4-BUF-5, L4-BUF-19, and L3-BAC-5, L3-BAC-13, L4-BAC-18.
5.2.9/6.2.8 Freezing and thawing. Freezing and thawing of buffer and backfill, even if they were to occur, do not pose a threat to the long-term performance of the buffer and backfill (see below, and Schatz & Martikainen 2010).
Freezing and thawing are not expected to affect the buffer or backfill as climatic conditions leading to permafrost at repository depth are not expected (Hartikainen 2013). Nonetheless this process is taken into account in the selection of the materials used; the performance of the buffer and backfill materials under freezing-thawing conditions has been reported by Schatz & Martikainen (2010) with the conclusion that freeze-thaw cycles do not substantially degrade the buffer and backfill material properties.
It must be noted that migration-related processes for the buffer and backfill will be affected by the evolution-related processes for the host rock listed above, as noted in Features, Events and Processes.
4.4 Evolution FEPs affecting closure
The closure components include backfill and plugs (see Closure Production Line) in access and central tunnels, connection tunnels between central tunnels and technical rooms, technical rooms, shafts, and investigation holes. The backfill materials identified for closure are swelling clay (Friedland clay bocks and bentonite pellets), mixtures of swelling clay and aggregate, and rock materials such as till, sand/gravel, and crushed rock. The plug materials are standard and low pH concretes, swelling clay in hydraulic plugs, boulders and cobbles in intrusion-obstructing plugs and rock bars in the surface plugs of investigation holes.
104
The long-term safety functions (see Section 1.5) and the performance targets for closure have been stated in Section 2.1.4. Even though the plugs at the end of the deposition tunnels are discussed in conjunction with the deposition tunnel backfill in Section 2.1.3, the FEPs related to the plugs are dealt with in this section.
The achievement of the safety functions and performance targets of closure will be ensured as far as possible by good quality control in design, selection of materials, manufacturing of components and emplacement (Closure Production Line). The safety functions of closure will be mostly affected by the groundwater flow and composition and by changes in rock stresses after excavation. Taking these factors into account, the evolution FEPs affecting the swelling clay or mixtures of swelling clay and rock material are the same as for the buffer and backfill in Section 4.3. They are thus not repeated or dealt with here, with the exception of freezing and thawing, which is a relevant process for the components in the upper parts of the disposal system (see Section 7.3). The remaining FEPs that thus may affect closure and its components are:
7.2.1 Chemical degradation (applicable at all times after emplacement); relates mainly to L3-CLO-13, L4-CLO-8, and L4-CLO-10. Also to L3-CLO-5, L3-CLO-7 and L3-CLO-8.
7.2.2 Physical degradation (applicable at all times after emplacement); relates to the same requirements as above.
7.2.3 Freezing and thawing (applicable to time windows and depths where permafrost is expected; for a few metres below the surface, annual freezing and thawing cycles take place at all times after emplacement); relates especially to L3-CLO-13, and L4-CLO-8.
4.5 Evolution FEPs affecting the canister
The canister has the key safety function of ensuring a prolonged period of complete containment of the spent nuclear fuel. The achievement of this safety function and of the performance targets that it implies (L3-CAN-4 and L4-CAN-5) has been and is being ensured as far as possible through the appropriate selection of materials to be used in the manufacture of the canisters (metallic copper to prevent corrosion, cast iron to provide mechanical strength) and by following quality control procedures in design, manufacture of components, and emplacement (see Canister Production Line report).
The safety function of the canister in the long term will be mostly affected by the performance of the buffer surrounding it, which, at any time, depends on the evolution of groundwater flow and composition (see previous sections). The interaction between the buffer and backfill will also influence the buffer performance in the long term, and thus the canister-related evolution FEPs:
4.2.1 Radiation attenuation (applicable at all times after the emplacement of fuel into the canister, the sealing and the emplacement of the canister). It will affect the heat transfer and the thermal expansion of the canister (and thus, also deformation); relates to L3-CAN-11, L4-CAN-14.

105
4.2.2 Heat transfer (applicable at all times); it will affect the performance of the bentonite, the stability of the rock walls in the deposition hole and to some extent the groundwater flow; relates to L3-CAN-11, L4-CAN-14, L4-CAN-17.
4.2.3 Deformation (applicable at all times); relates to L3-CAN-4, L4-CAN-7, L4-CAN-28, L4-CAN-35.
4.2.4 Thermal expansion of the canister; relates to L4-CAN-17; it has been taken into account in canister design (see Section 6.2 in Raiko et al. 2010).
4.2.5 Corrosion of the copper overpack; relates to L3-CAN-4, L3-CAN-7, L4-CAN-5 and L4-CAN-23 (see Table 2-1).
4.2.6 Corrosion of the cast iron insert (considering this FEP implies that the safety function of containment has already been lost, this topic is not discussed further here, instead see Formulation of Radionuclide Release Scenarios).
4.2.7 Stress corrosion cracking; relates to L3-CAN-4, L3-CAN-7, L4-CAN-5 and L4-CAN-23 (see Table 2-1).
4.6 Methodology for assessing the repository performance
The assessment is divided into three time windows, from excavation and operation until the end of the closure stage (Chapter 5), the next 10,000 years (Chapter 6), and the long-term evolution after 10,000 years until the end of the next glaciation (Chapter 7). In Chapter 8, there is a discussion on the expected evolution beyond the end of the next glaciation, and the impact of repeated glacial cycles.
For each time window, the assessment is structured around the different evolutionary processes that potentially can affect the performance targets, as identified in this Chapter 4. For each group of processes, potential loads or other factors that may affect the performance targets are first identified and their evolution described. This is followed by an assessment of the impacts of these FEPs (also called in the context of this report processes, potential loads, other factors) on the performance targets. Uncertainties in relation to the fulfilment of the performance targets are identified, but are dealt with in detail in Formulation of Radionuclide Release Scenarios and in Assessment of Radionuclide Release Scenarios for the Repository System.
Chapters 5 to 7 describe the expected thermal, hydrological, mechanical and geochemical evolution of the repository system, focusing on how this evolution will affect the performance targets and target properties listed in Section 2.1. The occurrence of less likely or unlikely disturbing events (e.g. rock shear) is also taken into account.

106
107
5 REPOSITORY SYSTEM PERFORMANCE − EXCAVATION AND OPERATIONAL PHASE
The excavation and operational period of the underground disposal facility may potentially affect repository performance, since the changes in the thermal, mechanical, hydrological and chemical conditions induced by the excavation and operational activities may affect the engineered barriers and the host rock. The duration of this period can be assumed to be one hundred years, depending on the progress of the excavation/operational activities and the total number of canisters to be disposed.
5.1 Hydraulic and geochemical evolution of the geosphere
5.1.1 Overview and target properties potentially affected
Under natural conditions, groundwater flow is limited and favourable groundwater conditions prevail at repository depth at Olkiluoto (Chapter 3 and Site Description). The excavation, operation and closure of the repository may, however, affect the groundwater flow and groundwater chemistry in the following ways:
Inflow to open repository rooms, which may result in i) drawdown of the groundwater table, ii) potential upconing of saline waters, iii) recharge of surface and sea waters and iv) mixing of the shallow and deep groundwaters.
The (air) ventilated tunnels, which will experience partial evaporation at the tunnel walls, will contribute to geochemical changes in the groundwater. These processes will influence groundwater salinity and redox conditions at repository level including some oxygenation of groundwaters very near to the repository, which upon emplacement of the EBS will saturate the clay-rich backfill and buffer.
Foreign materials introduced during construction, some of which are unfavourable for the performance of EBS and can reduce retardation of the radionuclides. Cement-based materials, used during construction in grouting or for rock bolts, may leach and potentially increase the pH of the groundwater. Other materials which may be potentially harmful for the performance of the EBS and the retardation of radionuclides comprise, e.g., iron, sulphate, ammonium, nitrites, nitrates and organics.
In addition, the heat generated by the spent nuclear fuel will increase the temperatures in the host rock, which has an effect on groundwater flow and chemical processes. The thermal effects are discussed in Section 5.2.
The following parameters of the groundwater composition considered in the target properties (see Table 2-5) are affected by the naturally ongoing dilution of the groundwater due to infiltration of surface waters and by the disturbance caused by repository excavation, operation and closure:
redox conditions and oxygen content
pH
chloride content
HS-, NO2-, NO3
- and NH4+, acetate
108
organic matter, H2 and Stot and methane contents
ionic strength (total charge equivalent of cations, Σq[Mq+])
salinity (TDS)
K+, Fetot
colloid content.
Of these, the target properties affected by the presence of the EBS and foreign materials introduced into the repository and, by processes occurring in the near field are discussed in relation to the geochemical evolution of the near field (Section 5.5). Relevant issues are:
redox changes due to the presence of oxygen in the repository system and corrosion of iron-bearing materials,
microbial processes related to the degradation of organic materials,
colloid formation,
processes contributing to an increase in pH due to cement leachates and
introduction of nitrites, nitrates, ammonium and acetates (see Section 3.1) as well as potassium.
Although the target properties concerning groundwater flow and solute transport relate to post-closure saturated conditions, there are requirements on limited groundwater flow to the deposition holes and deposition tunnels during the operational phase to ensure that the installation of the buffer and backfill results in their proper performance both in the early period and in the long term. The inflows to open deposition tunnels and deposition holes and the flow rates during this period are also indications of the flow rates and transport resistances under saturated conditions.
5.1.2 Groundwater flow
During the operational period, the deep groundwater circulation is governed by the head differences between the open tunnels and the surrounding water conducting fractures. These pressure differences lead to an inflow of groundwater into the tunnels. The inflow rate evolves with time, and depends on whether water-conductive features intersect the tunnel. The open tunnels draw water from all directions, fresh water from above and saline water from below the tunnels, especially along the most water-conductive zones intersecting the tunnels. The inflow and thereby its consequences need to be limited by grouting. In ONKALO, grouting has been used to limit the inflow from the more conductive upper parts of the rock and at greater depth, from transmissive zones and fractures.
The estimated inflows to the entire underground disposal facility and to specific parts of it are based on analytical calculations using the transmissivity of fractures measured in the pilot holes drilled ahead of the tunnel excavation in ONKALO, observed inflows to ONKALO so far and groundwater flow modelling. A number of inflow estimates for the disposal facility have been made including an assessment of grouting efficiency and
109
its impact on the inflow, drawdown and salinity evolution (e.g. Vieno et al. 2003, Pastina & Hellä 2006, Ahokas et al. 2006, Löfman & Poteri 2008 and Posiva 2009b). The discussion in this report is based on the most recent estimates of the inflow using ECPM (Equivalent Continuous Porous Medium) and DP (Dual Porosity) approaches (Löfman et al. 2010 and Löfman & Karvonen 2012) and the DFN (Discrete Fracture Network) approach (Hartley et al. 2010, 2013a, b). For a summary of the modelling studies, see Appendix D.
Drawdown of the water table has been monitored and inflow to the ONKALO tunnels has continuously been measured since the beginning of its construction in 2004. According to Vaittinen et al. (2011a), the changes observed in the groundwater level are not necessarily caused by the construction of ONKALO. However, weak indications of a decrease in groundwater level have been observed. Sustained changes, i.e. a decrease in pressure heads near ONKALO, vary between 10 and 12 m within the HZ20 system and between 1 and 2 m within the HZ19 system. As a consequence of the excavation through the HZ056 zone close to the repository depth, a sustained drawdown of over 20 m occurred (see Vaittinen et al. 2011a).
The measured total inflow to the already excavated part of ONKALO is around 30 L/min (until chainage10 4570 m at the end of year 2010, Vaittinen et al. 2011a, Sections 3.1 and 3.4.1, see also Figure 5-1 A). The leakage into ONKALO below the hydrogeological zones belonging to the HZ20-system (see Figure 3-2) has been measured between chainages 3356–3941 m (585 m length, Vaittinen et al. 2011a, Section 3.4.1). This section is not only located below the hydrogeological zone HZ20, but it is not intersected by any site-scale hydrogeological zones and grouting has been applied only in short sections (Vaittinen et al. 2010, Figure 3-1). Thus, this section has conditions similar to the deposition tunnels. The total inflow to this section is in the order of a few decilitres/min at the most (Vaittinen et al. 2011a, Section 3.4.1). Based on the information on inflow to ONKALO, the inflow to a 250 m to 300 m long deposition tunnel would be in the order of 0.5 L/min or even less.
Mapping of the water leakages to ONKALO has been carried out to chainage 4555 m (Vaittinen et al. 2011a, Section 3.2). The results of the mapping show that there are typically several leaking points along a 20 to 40 m long tunnel section (Vaittinen et al. 2011a, Section 3.4.1 and Appendix 7). Between such sections with several leakages there are sections from a few tens of metres up to over 200 m with only sporadic, isolated leakages. These data thus indicate that the leakages are often concentrated and there are long sections with no leakages. Rather than being even over the whole tunnel perimeter, the leakages seem to be localised on occasions even occurring as highly localised spots. This can sometimes be related to the presence of rock bolts, especially on the tunnel roof. The distribution of the flow along the tunnel has an impact on the performance of the buffer and backfill as discussed in Section 5.4.
The total inflow to the disposal facility has been estimated by Löfman & Karvonen (2012). In this work, three model variants based on different layouts and hydrogeological models are considered (for description of the model variants see
10 Chainage is the distance in metres from the entrance along the access tunnel.
110
Appendix D). In the modelling, it has been assumed that the repository is being built in stages and that the tunnels of a specific panel are open for the time needed for their operation (each panel is open for 8−16 years) whereas the access routes remain open throughout the whole operational period.
According to modelling results (Figure 5-1), the inflow to ONKALO before the disposal starts is approximately 55 L/min in total and the inflow to repository panels open at a specific time is about 2−15 L/min, depending on the model variant applied. For a short period, even larger inflows occur in model variants 2011SH and 2011HE, which consider the larger layout and central tunnels that will pass through the HZ20-system. During the operational period, the flow rates are approximately two orders of magnitude higher than before repository construction, when the flow rate to the reference volume is 30 to 80 m3/a (0.06−0.15 L/min, see Figure 5-2). The reference volume includes the main part of the repository and roughly 50 m above and below the deposition tunnels. It has an area of 1.5 km2 and volume of 0.15 m3 (for details, see Appendix D).
During the operational period, the repository draws water from all directions so that the flow below the repository turns upward in contrast to the mainly downward flow in the natural state. The upward flow is further enhanced by the heat produced by the spent nuclear fuel as discussed in Section 6.1.2.

111
A)
B)
Figure 5-1. Inflow to the open tunnels during construction and operation A) before estimated start of disposal activities and B) during the whole excavation, operation and closure stage (Löfman & Karvonen 2012). Total inflow, inflow from the hydrogeological zones HZ19 and HZ20 and sparsely fractured rock (SFR) excluding hydrogeological zones (HZ) is shown. Disposal operation starts at t = 16 years. 2009SH refers to a model variant with layout for 5500 tU and the hydrogeological model described in the previous site description (Posiva 2009b) with semi-homogeneous (SH) hydraulic properties of the hydrogeological zones (HZ) and sparsely fractured rock (SFR) i.e. for most of the HZs homogeneous properties are used, whereas the SFR is divided into the depth intervals, in which either depth-dependent or homogeneous values are used. 2011SH refers to a model with layout for 9000 tU and the hydrogeological model according to Site Description with the hydraulic properties of HZs and SFR described as in 2009SH and 2011HE refers to a model with layout for 9000 tU and the hydrogeological model according to Site Description with the heterogeneous (HE) hydraulic properties of HZs and SFR.
Central tunnels to the eastern panels intersect HZ20

112
Figure 5-2. Flow rate into and out of the reference volume containing the repository (Löfman & Karvonen 2012); 2009SH refers to a model variant with layout for 5500 tU and the hydrogeological model described in the previous site description (Posiva 2009b) with semi-homogeneous (SH) hydraulic properties of the hydrogeological zones (HZ) and sparsely fractured rock (SFR) i.e. for most of the HZs homogeneous properties are used, whereas the SFR is divided into the depth intervals, in which either depth-dependent or homogeneous values are used. 2011SH refers to a model with layout for 9000 tU and the hydrogeological model according to Site Description with the hydraulic properties of HZs and SFR described as in 2009SH and 2011HE refers to a model with layout for 9000 tU and the hydrogeological model according to Site Description with the heterogeneous (HE) hydraulic properties of HZs and SFR.
Inflows to deposition holes have been estimated using the DFN models by Hartley et al. (2010, 2013c). The results from Hartley et al. (2010) were used to define inflow cases for analysing the buffer and backfill performance (see Section 5.4); these cases are presented in Appendix A. It is noted that the updated hydrogeological model (Hartley et al. 2013a) differs from the previous model version (Hartley et al. 2009) in that more information has become available on fractures with low transmissivity. These data have become available from the pilot hole tests in ONKALO close to repository depth. As a result of the increased intensity of the low transmissive fractures, there is also an increase in the number of deposition holes and sections of tunnels with some inflow. The proportion of deposition holes and tunnel sections with high flow (i.e. above 0.1 L/min) has reduced slightly.
The distribution of inflow into the deposition holes based on Hartley et al. (2013b) is shown in Figure 5-3. As discussed by Hartley et al. (2013b, Section 7.2.2), the number of deposition holes intersected by conductive fractures is sensitive to transmissivity or
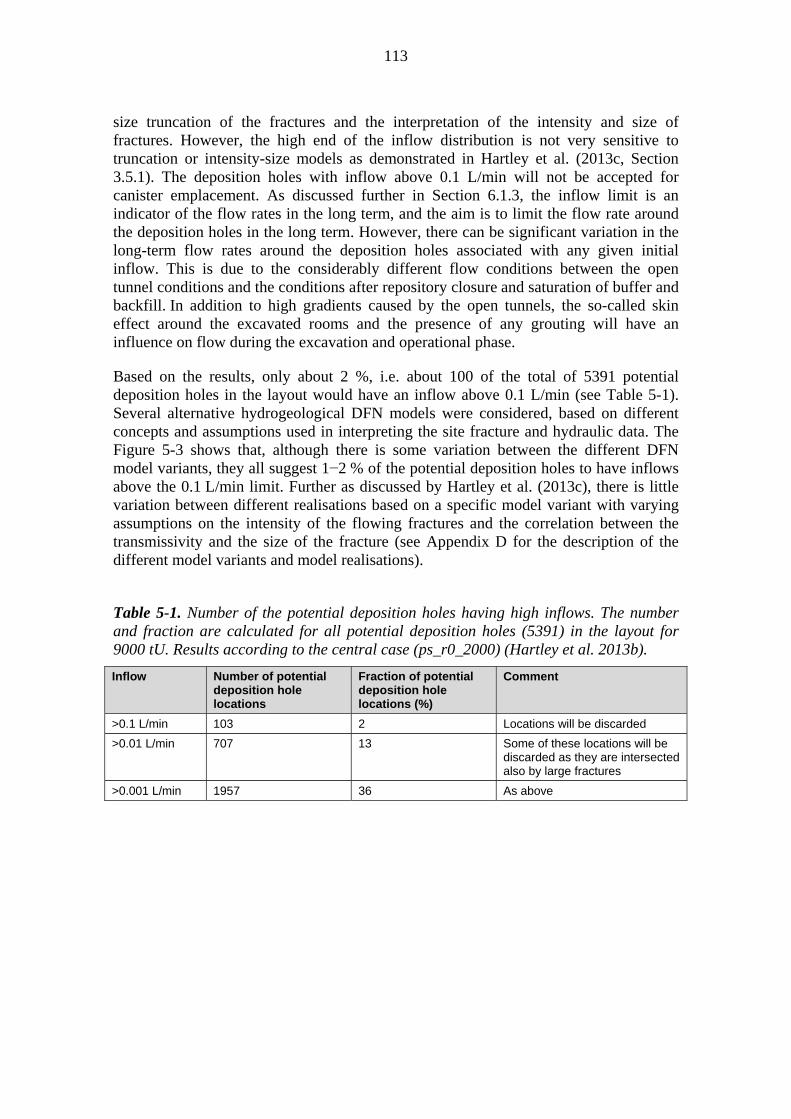
113
size truncation of the fractures and the interpretation of the intensity and size of fractures. However, the high end of the inflow distribution is not very sensitive to truncation or intensity-size models as demonstrated in Hartley et al. (2013c, Section 3.5.1). The deposition holes with inflow above 0.1 L/min will not be accepted for canister emplacement. As discussed further in Section 6.1.3, the inflow limit is an indicator of the flow rates in the long term, and the aim is to limit the flow rate around the deposition holes in the long term. However, there can be significant variation in the long-term flow rates around the deposition holes associated with any given initial inflow. This is due to the considerably different flow conditions between the open tunnel conditions and the conditions after repository closure and saturation of buffer and backfill. In addition to high gradients caused by the open tunnels, the so-called skin effect around the excavated rooms and the presence of any grouting will have an influence on flow during the excavation and operational phase.
Based on the results, only about 2 %, i.e. about 100 of the total of 5391 potential deposition holes in the layout would have an inflow above 0.1 L/min (see Table 5-1). Several alternative hydrogeological DFN models were considered, based on different concepts and assumptions used in interpreting the site fracture and hydraulic data. The Figure 5-3 shows that, although there is some variation between the different DFN model variants, they all suggest 1−2 % of the potential deposition holes to have inflows above the 0.1 L/min limit. Further as discussed by Hartley et al. (2013c), there is little variation between different realisations based on a specific model variant with varying assumptions on the intensity of the flowing fractures and the correlation between the transmissivity and the size of the fracture (see Appendix D for the description of the different model variants and model realisations).
Table 5-1. Number of the potential deposition holes having high inflows. The number and fraction are calculated for all potential deposition holes (5391) in the layout for 9000 tU. Results according to the central case (ps_r0_2000) (Hartley et al. 2013b).
Inflow Number of potential deposition hole locations
Fraction of potential deposition hole locations (%)
Comment
>0.1 L/min 103 2 Locations will be discarded
>0.01 L/min 707 13 Some of these locations will be discarded as they are intersected also by large fractures
>0.001 L/min 1957 36 As above
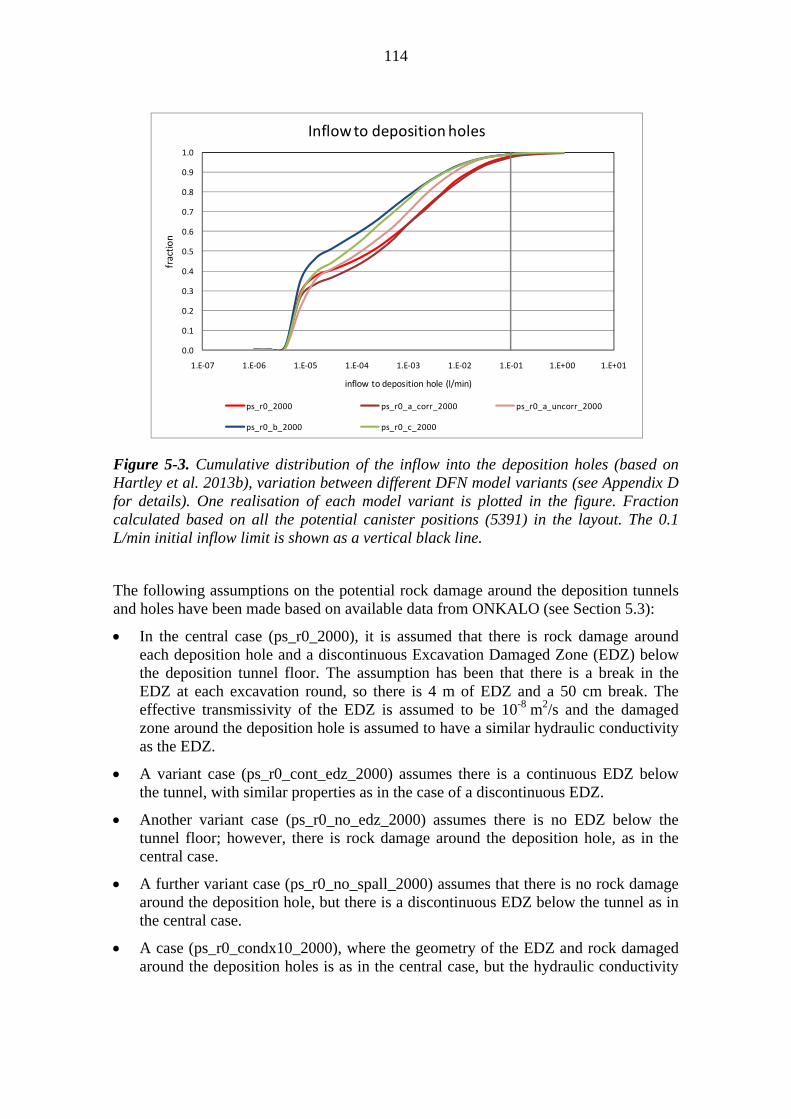
114
Figure 5-3. Cumulative distribution of the inflow into the deposition holes (based on Hartley et al. 2013b), variation between different DFN model variants (see Appendix D for details). One realisation of each model variant is plotted in the figure. Fraction calculated based on all the potential canister positions (5391) in the layout. The 0.1 L/min initial inflow limit is shown as a vertical black line.
The following assumptions on the potential rock damage around the deposition tunnels and holes have been made based on available data from ONKALO (see Section 5.3):
In the central case (ps_r0_2000), it is assumed that there is rock damage around each deposition hole and a discontinuous Excavation Damaged Zone (EDZ) below the deposition tunnel floor. The assumption has been that there is a break in the EDZ at each excavation round, so there is 4 m of EDZ and a 50 cm break. The effective transmissivity of the EDZ is assumed to be 10-8 m2/s and the damaged zone around the deposition hole is assumed to have a similar hydraulic conductivity as the EDZ.
A variant case (ps_r0_cont_edz_2000) assumes there is a continuous EDZ below the tunnel, with similar properties as in the case of a discontinuous EDZ.
Another variant case (ps_r0_no_edz_2000) assumes there is no EDZ below the tunnel floor; however, there is rock damage around the deposition hole, as in the central case.
A further variant case (ps_r0_no_spall_2000) assumes that there is no rock damage around the deposition hole, but there is a discontinuous EDZ below the tunnel as in the central case.
A case (ps_r0_condx10_2000), where the geometry of the EDZ and rock damaged around the deposition holes is as in the central case, but the hydraulic conductivity
0.0
0.1
0.2
0.3
0.4
0.5
0.6
0.7
0.8
0.9
1.0
1.E‐07 1.E‐06 1.E‐05 1.E‐04 1.E‐03 1.E‐02 1.E‐01 1.E+00 1.E+01
fraction
inflow to deposition hole (l/min)
Inflow to deposition holes
ps_r0_2000 ps_r0_a_corr_2000 ps_r0_a_uncorr_2000
ps_r0_b_2000 ps_r0_c_2000
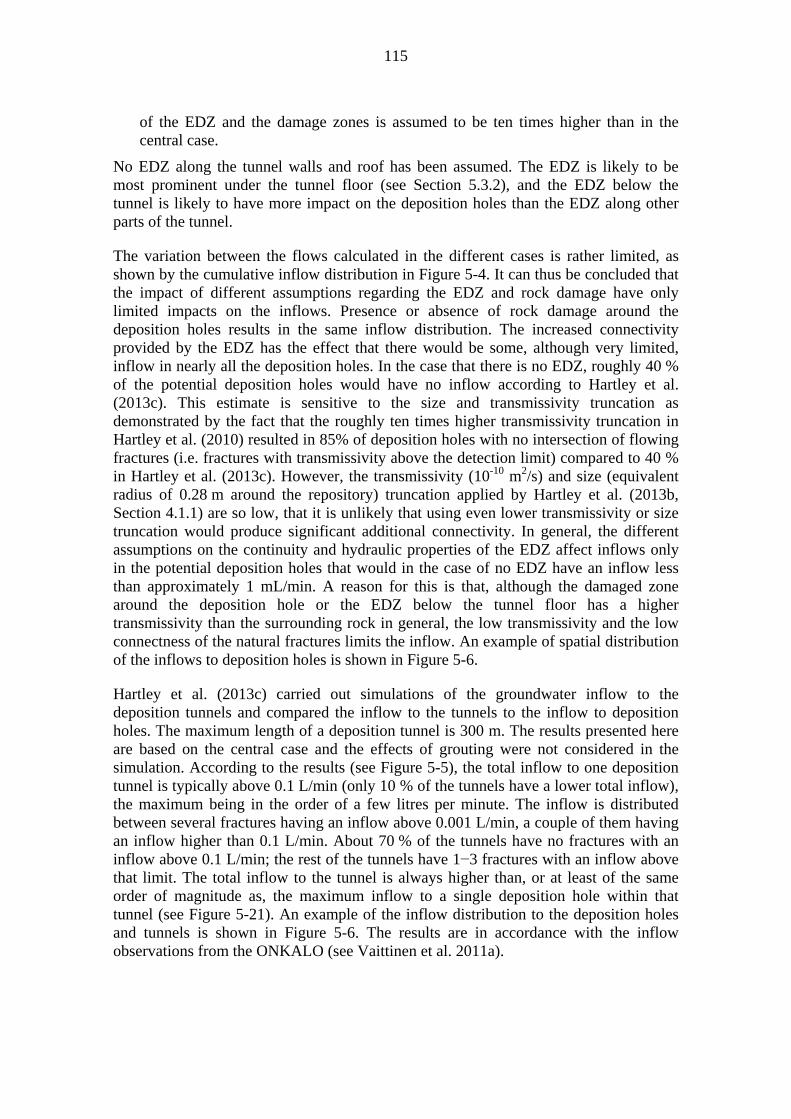
115
of the EDZ and the damage zones is assumed to be ten times higher than in the central case.
No EDZ along the tunnel walls and roof has been assumed. The EDZ is likely to be most prominent under the tunnel floor (see Section 5.3.2), and the EDZ below the tunnel is likely to have more impact on the deposition holes than the EDZ along other parts of the tunnel.
The variation between the flows calculated in the different cases is rather limited, as shown by the cumulative inflow distribution in Figure 5-4. It can thus be concluded that the impact of different assumptions regarding the EDZ and rock damage have only limited impacts on the inflows. Presence or absence of rock damage around the deposition holes results in the same inflow distribution. The increased connectivity provided by the EDZ has the effect that there would be some, although very limited, inflow in nearly all the deposition holes. In the case that there is no EDZ, roughly 40 % of the potential deposition holes would have no inflow according to Hartley et al. (2013c). This estimate is sensitive to the size and transmissivity truncation as demonstrated by the fact that the roughly ten times higher transmissivity truncation in Hartley et al. (2010) resulted in 85% of deposition holes with no intersection of flowing fractures (i.e. fractures with transmissivity above the detection limit) compared to 40 % in Hartley et al. (2013c). However, the transmissivity (10-10 m2/s) and size (equivalent radius of 0.28 m around the repository) truncation applied by Hartley et al. (2013b, Section 4.1.1) are so low, that it is unlikely that using even lower transmissivity or size truncation would produce significant additional connectivity. In general, the different assumptions on the continuity and hydraulic properties of the EDZ affect inflows only in the potential deposition holes that would in the case of no EDZ have an inflow less than approximately 1 mL/min. A reason for this is that, although the damaged zone around the deposition hole or the EDZ below the tunnel floor has a higher transmissivity than the surrounding rock in general, the low transmissivity and the low connectness of the natural fractures limits the inflow. An example of spatial distribution of the inflows to deposition holes is shown in Figure 5-6.
Hartley et al. (2013c) carried out simulations of the groundwater inflow to the deposition tunnels and compared the inflow to the tunnels to the inflow to deposition holes. The maximum length of a deposition tunnel is 300 m. The results presented here are based on the central case and the effects of grouting were not considered in the simulation. According to the results (see Figure 5-5), the total inflow to one deposition tunnel is typically above 0.1 L/min (only 10 % of the tunnels have a lower total inflow), the maximum being in the order of a few litres per minute. The inflow is distributed between several fractures having an inflow above 0.001 L/min, a couple of them having an inflow higher than 0.1 L/min. About 70 % of the tunnels have no fractures with an inflow above 0.1 L/min; the rest of the tunnels have 1−3 fractures with an inflow above that limit. The total inflow to the tunnel is always higher than, or at least of the same order of magnitude as, the maximum inflow to a single deposition hole within that tunnel (see Figure 5-21). An example of the inflow distribution to the deposition holes and tunnels is shown in Figure 5-6. The results are in accordance with the inflow observations from the ONKALO (see Vaittinen et al. 2011a).
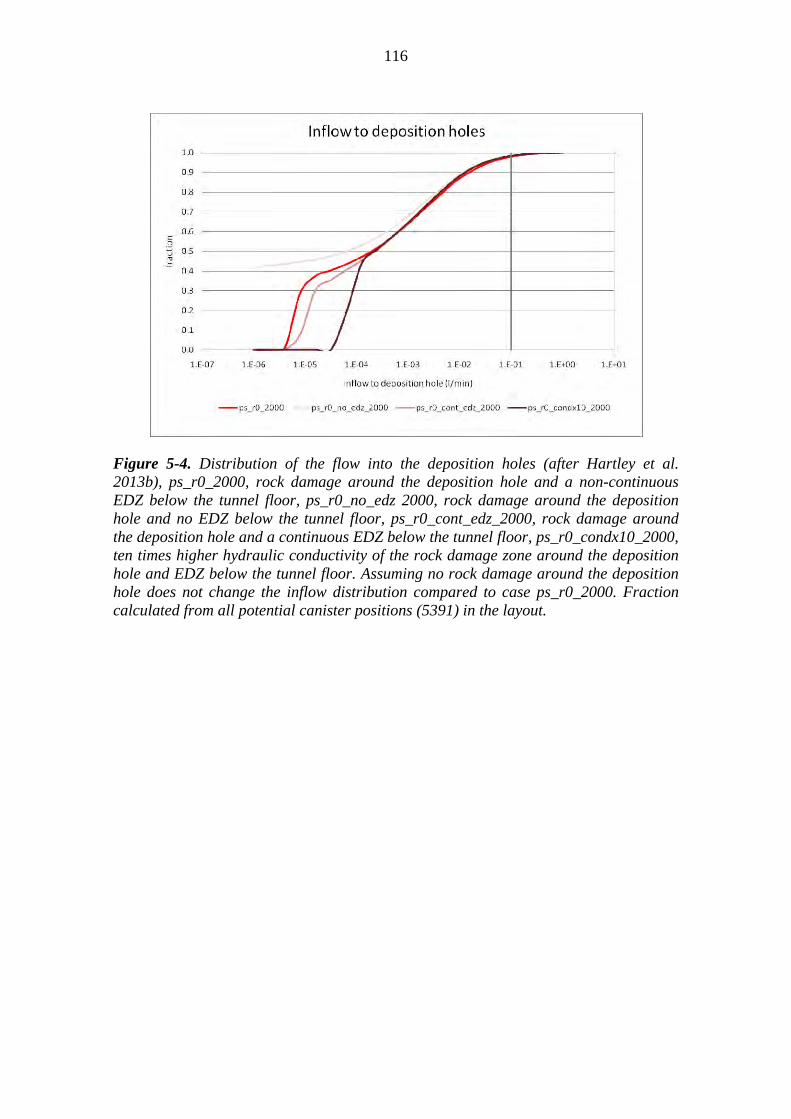
116
Figure 5-4. Distribution of the flow into the deposition holes (after Hartley et al. 2013b), ps_r0_2000, rock damage around the deposition hole and a non-continuous EDZ below the tunnel floor, ps_r0_no_edz 2000, rock damage around the deposition hole and no EDZ below the tunnel floor, ps_r0_cont_edz_2000, rock damage around the deposition hole and a continuous EDZ below the tunnel floor, ps_r0_condx10_2000, ten times higher hydraulic conductivity of the rock damage zone around the deposition hole and EDZ below the tunnel floor. Assuming no rock damage around the deposition hole does not change the inflow distribution compared to case ps_r0_2000. Fraction calculated from all potential canister positions (5391) in the layout.

117
a)
b)
Figure 5-5. Complementary cumulative distribution (as histogram representation) of (a) the total flow into the deposition tunnels and (b) the proportion of tunnels having a certain number of inflow points for various inflow limits. Inflow through EDZ fractures included (Hartley et al. 2013c).
CCDF of total inflow to deposition tunnels
100% 100% 99% 98%
90%
65%
17%
3.7%0.53%
0%
10%
20%
30%
40%
50%
60%
70%
80%
90%
100%
Q ≥
1.0
E-3
Q ≥
1.0E
-2.5
Q ≥
1.0
E-2
Q ≥
1.0E
-1.5
Q ≥
1.0
E-1
Q ≥
1.0E
-0.5
Q ≥
1.0
E0
Q ≥
1.0
E0.
5
Q ≥
1.0
E1
Inflow range [Log L/min]
Per
cen
tag
e o
f d
ep
osi
tio
n t
un
nel
s
Percentage of tunnels with a number of inflow points for various inflow limits
100%
99%
99%
99%
98%
98%
87%
60%
33%
7.4%
1.1%
0.5%
98%
93%
89%
79%
67%
54%
12%
1.1%
68%
34%
10%
3.7%
0.5%
0.5%6.
3%
1.6%
0%
10%
20%
30%
40%
50%
60%
70%
80%
90%
100%
>0
>1
>2
>3
>4
>5
>10
>15
>20
>30
>40
>50
Number of inflow points
Per
cen
tag
e o
f tu
nn
els
Q ≥1.0E-3 [L/min]
Q ≥1.0E-2 [L/min]
Q ≥1.0E-1 [L/min]
Q ≥1.0E0 [L/min]
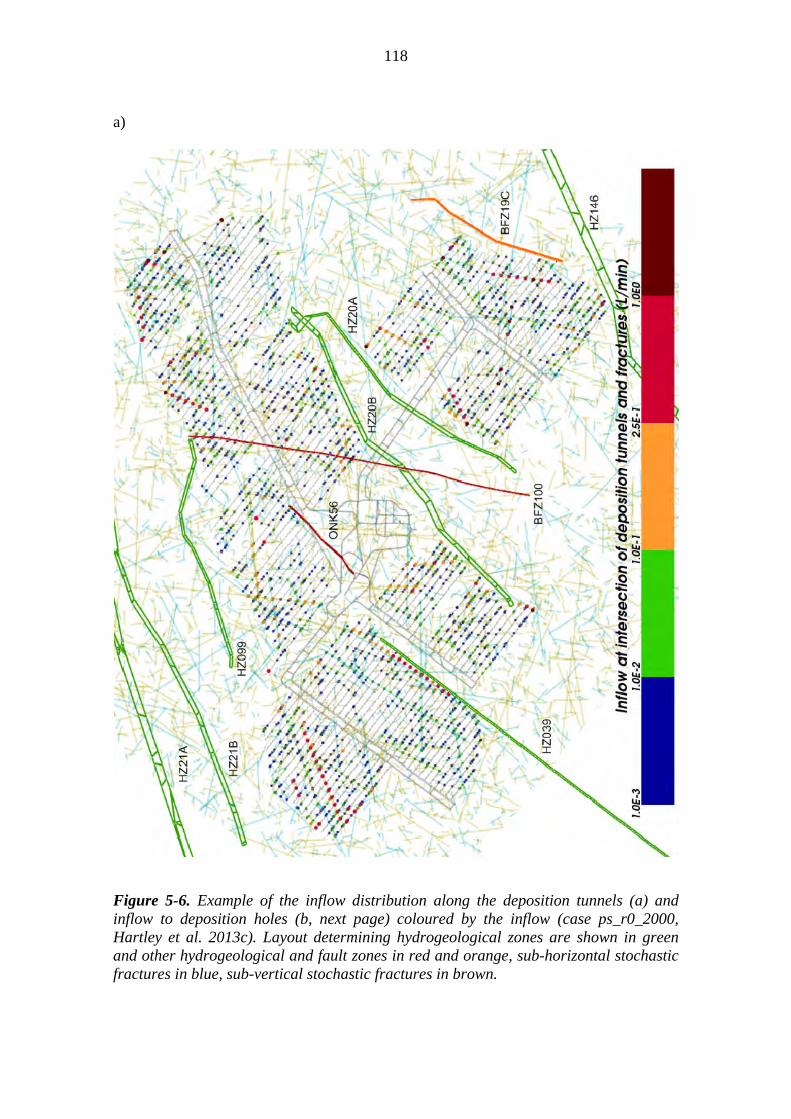
118
a)
Figure 5-6. Example of the inflow distribution along the deposition tunnels (a) and inflow to deposition holes (b, next page) coloured by the inflow (case ps_r0_2000, Hartley et al. 2013c). Layout determining hydrogeological zones are shown in green and other hydrogeological and fault zones in red and orange, sub-horizontal stochastic fractures in blue, sub-vertical stochastic fractures in brown.

119
b)
Figure 5-6 cont. Example of the inflow distribution along the deposition tunnels (a, previous page) and inflow to deposition holes (b) coloured by the inflow (case ps_r0_2000, Hartley et al. 2013c). Layout determining hydrogeological zones are shown in green and other hydrogeological and fault zones in red and orange, sub-horizontal stochastic fractures in blue, sub-vertical stochastic fractures in brown.

120
5.1.3 Groundwater composition
This section discusses the impacts of repository construction and operation on the groundwater chemistry. The discussion is based on the data available from the monitoring during ONKALO construction, on observations from ONKALO and on modelling studies. Several numerical studies have been carried out to estimate the impacts of repository construction on the groundwater flow and salinity at the Olkiluoto site as well as their long-term evolution (see e.g. Vieno et al. 2003, Pastina & Hellä 2006, Ahokas et al. 2006, Löfman & Poteri 2008 and Posiva 2009b, Löfman et al. 2010). The discussion in this section is based on the modelling of groundwater flow and solute transport by Löfman & Karvonen (2012) and on modelling of the hydrogeochemical evolution using reactive transport modelling approach (Trinchero et al. 2013); see also Appendix D for a description of the models. Two different models are applied to address different aspects of groundwater flow, solute transport and hydrogeochemistry, since this cannot all be handled with a single model. Both of these models consider the mixing of the infiltrating waters with the initial waters. Löfman & Karvonen (2012) apply a dual porosity model, which takes into account diffusive mass exchange between the fractures and rock matrix. This interaction is omitted in the single porosity model applied by Trinchero et al. (2013) for the operational period. On the other hand the reactive transport model takes into account the main geochemical reactions with the rock and minerals along the streamlines. The streamlines are defined based on groundwater flow modelling results by Löfman & Karvonen (2012) using particle tracking methods. Trinchero et al. (2013) discuss, in addition to salinity, the evolution of groundwater composition in general including pH and redox conditions, and the work has been extended to address sulphide evolution in more detail (Wersin et al. 2013c).
Groundwater salinity
The baseline salinity field is presented in Chapter 3. Changes in groundwater salinity are possible as a result of the disturbances due to the construction and operation of the ONKALO and the disposal facility. There is atmospheric pressure in the open tunnels, which is much lower than the hydrostatic pressure at the repository depth (approximately 4 MPa). The pressure drop makes the groundwater to flow towards the open tunnels. Salinity of the groundwater changes as a result of mixing of different types of groundwaters. Salinity may decrease because of dilution due to infiltration of surface and sea water or it may increase due to upconing of the deep saline water. It is expected that the construction of the disposal facility will not affect the highly saline waters more than a few hundreds of metres below the repository.
Monitoring of the groundwater salinity changes due to the impact of ONKALO construction has been ongoing since the construction began in 2004, preceded by the baseline characterisation (Posiva 2003b). ONKALO reached the repository depth at the end of 2009. The salinity in the baseline samples and in monitoring samples showing the impact of ONKALO construction is shown in Figure 5-7. Many of the observed changes in salinity, especially during the first years after the start of ONKALO construction, have been interpreted as the recovery of the salinity levels after the dilution (see Löfman et al. 2010, p. 107). Along with the continued high hydraulic gradients caused by ONKALO, salinity is observed to decrease within and above the HZ19 system (< 150 m) due to infiltration of shallow groundwater, whereas a slight

121
increase in salinity has been observed in a few samples taken from the major hydrogeological zone HZ20B (Site Description, Section 7.5). The most pronounced dilutions observed in the monitoring data (> 200 m depth) result from open drillhole flow of shallow fresh groundwater into the deeper fracture zones. This drawdown has frequently been caused by hydraulic connection of fractures to ONKALO and it is tried to be blocked with permanent multi packer systems in the drillholes. The zones are shown in Figure 3-2. Salinity has remained stable in deeper parts of the rock (Site Description, Section 7.5, see also Figure 5-7).
The salinity in the reference volume covering the repository and the depth range -370 m...-470 m, i.e. some tens of metres above and below the repository has been modelled by Löfman & Karvonen (2012). Given that the lowest parts of the shafts reach depth of 460 m and considering the variation in the depth of the actual deposition tunnels and deposition holes and the resolution of the site scale model, a larger depth range extending below the planned repository depth is used to estimate the salinity variation in the repository volume. The average salinity in the reference volume remains practically unchanged or slightly decreases from the initial value of 12 g/L during the operational period (see Figure 5-9), although locally both higher and lower values occur. All model variants give consistent results on the average salinity. However, the maximum and minimum salinity vary significantly between the different model variants. The maximum salinity (TDS) in the reference volume occurs at the bottom of the reference volume (depth of 470 m) around the shafts because in that area the access tunnel and shafts remain open longest and thus the hydraulic disturbance is greatest.
Figure 5-7. The variation of salinity (TDS) found in (a) the baseline samples and (b) the monitoring samples taken after the start of ONKALO construction with depth and according to the groundwater type.
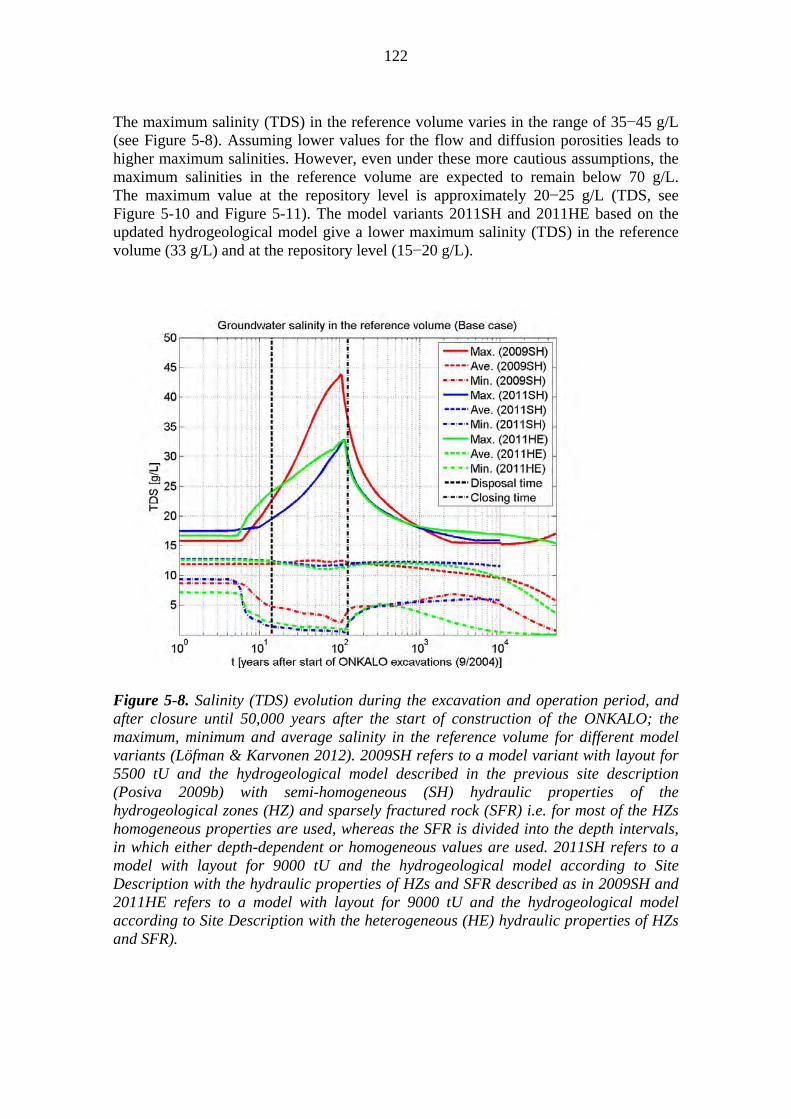
122
The maximum salinity (TDS) in the reference volume varies in the range of 35−45 g/L (see Figure 5-8). Assuming lower values for the flow and diffusion porosities leads to higher maximum salinities. However, even under these more cautious assumptions, the maximum salinities in the reference volume are expected to remain below 70 g/L. The maximum value at the repository level is approximately 20−25 g/L (TDS, see Figure 5-10 and Figure 5-11). The model variants 2011SH and 2011HE based on the updated hydrogeological model give a lower maximum salinity (TDS) in the reference volume (33 g/L) and at the repository level (15−20 g/L).
Figure 5-8. Salinity (TDS) evolution during the excavation and operation period, and after closure until 50,000 years after the start of construction of the ONKALO; the maximum, minimum and average salinity in the reference volume for different model variants (Löfman & Karvonen 2012). 2009SH refers to a model variant with layout for 5500 tU and the hydrogeological model described in the previous site description (Posiva 2009b) with semi-homogeneous (SH) hydraulic properties of the hydrogeological zones (HZ) and sparsely fractured rock (SFR) i.e. for most of the HZs homogeneous properties are used, whereas the SFR is divided into the depth intervals, in which either depth-dependent or homogeneous values are used. 2011SH refers to a model with layout for 9000 tU and the hydrogeological model according to Site Description with the hydraulic properties of HZs and SFR described as in 2009SH and 2011HE refers to a model with layout for 9000 tU and the hydrogeological model according to Site Description with the heterogeneous (HE) hydraulic properties of HZs and SFR).

123
Time 0 years after the start of disposal
90 years after the start of disposal
Model variant 2009SH
layout for 5500 tU and the hydrogeological model 2009 with semi-homogeneous (SH) hydraulic properties of the hydrogeological zones (HZ) and sparsely fractured rock (SFR)
Model variant 2011SH layout for 9000 tU and the hydrogeological model 2011 with semi-homogeneous (SH) hydraulic
properties of the hydrogeological zones (HZ) and sparsely fractured rock (SFR)
Model variant 2011HE layout for 9000 tU and the hydrogeological model 2011 with the heterogeneous (HE) hydraulic
properties of the hydrogeological zones (HZ) and sparsely fractured rock (SFR)
Figure 5-9. Distribution of salinity (TDS) at the repository level (Z = -410 m) at the start the disposal operations and 90 years later for the different model variants (see text for the details of the model variants; Löfman & Karvonen 2012).
124
The minimum salinity in the reference volume decreases during the whole of the excavation period with a clear drop after the excavation of ONKALO when the shafts pass through the hydrogeological zone system HZ20 about five years after the start of ONKALO excavations (Figure 5-8). The minimum salinity occurs on top of the reference volume and is related to hydrogeological zone HZ20B which connects the surface and tunnel and thus provides a direct route for fresh water infiltration. At the same time, the maximum salinity starts to increase due to upconing. The minimum salinity occurs towards the end of the operational period. The minimum salinity (TDS) in the reference volume during the operational period is mainly above 0.5 g/L, see Figure 5-8. However, one of the model variants (model variant 2011SH, see Appendix D) gives a salinity value as low as 0.3 g/L towards the end of the operational period. This value is of the same order of magnitude as the salinity (0.3–0.4 g/L) that corresponds to a total charge equivalent of cations of 4 mmol/L for typical groundwaters at Olkiluoto (L3-ROC-14). If the cation concentration is lower than this, chemical erosion of buffer and backfill is considered possible. At the repository level, the salinity remains above 1 g/L (TDS), see Figure 5-9. It is noted that the infiltrating water is assigned zero salinity in these models and no chemical reactions are included in the model, so that the results are likely to be underestimates.
According to Trinchero et al. (2013), in general, the inflow into open repository rooms originates from the island, mainly from above the repository, but some flow paths originate from the sea area close to the surface intersection of the main deformation zones. The travel times for the recharge paths originating from the island are typically in the range of a few tens to a few hundreds of years, although some very fast paths with travel times of less than 10 years and some very slow paths with travel times in the order of thousands of years exist. The travel times for the paths originating from the sea area are in the order of thousands of years. Some of the path lines are relatively direct connections between the surface and the repository (similar to findings by Hartley et al. 2013b for post-closure conditions), whereas others reach significantly greater depths than the repository level before entering the repository.
As the repository is partially affected by fast flow paths from the surface, groundwaters get diluted by the infiltration of meteoric water. In the model by Trinchero et al. (2013), the meteoric water is equilibrated with Fe(OH)3(am) and calcite and the resulting altered meteoric water has a total charge equivalent of cations of 6.9 mmol/L (based on concentrations of Na, K, Ca and Mg in Trinchero et al. 2013, Table 4-2). Upconing of saline water takes place in other parts of the repository. Therefore, there is a relatively large variation of salinity in the deposition tunnels. The median salinity (TDS) at the repository level after 90 years of repository operations is about 15 g/L with 90 % of the values being in the range 1–30 g/L. Locally, there are a few values above 35 g/L. Such high values occur only during the operational period. Chloride concentration remains well below the value of 2 M that is considered as an upper limit in the target properties. The results by Trinchero et al. (2013) are in agreement with the results by Löfman & Karvonen (2012). The slight differences are thought to be related to the different modelling approaches used.
Both modelling studies discussed above as well as the observations from the site indicate that the changes, if any, in the groundwater salinity are mainly towards waters with slightly lower salinity at the repository level during the operational period. Some
125
of the more conductive zones can, however, provide routes for saline water upconing. Upconing at lower rates is also possible within the sparsely fractured rock through hydraulically conductive fractures, as the tunnels draw water from all directions (see e.g. Figure 5-10). The changes in salinity are most notable in areas where there are open tunnels and the tunnels are intersected by hydrogeological zones or large water-bearing fractures (see Figures 5-9 and 5-10). The results, especially minimum and maximum salinity, are sensitive to the properties of, and connections between the hydraulically conductive zones and their connections to the underground openings. This can be seen as a variation of the results of the different model variants that consider different layouts, hydrogeological models and model parameters (see Figures 5-9 and 5-10). For example, according to model variant 2009SH, the zone HZ20B has a connection to deep saline water through zone HZ004 and upconing occurs, whereas according to model variants 2011SH and 2011HE, this zone is connected to the surface through zone HZ20A and dilution along this zone and around it takes place. However, the major changes in salinity and variation in the results of different model variants are related to the hydrogeological zones and the ONKALO area. The results of the different model variants are more consistent within the rock volume containing deposition tunnels, where the major hydrogeological zones and brittle deformation zones providing the main routes for both dilution and upconing are avoided. In this volume, the salinity changes are also constrained by the more limited inflow and shorter time period with open tunnels compared with ONKALO. Inflow to ONKALO is 55 to 60 L/min, whereas the inflow to the open tunnels at the repository level (deposition tunnels and central tunnels) is in the order of 5−15 L/min (see Figure 5-1). A panel consisting of several deposition tunnels remains open for ten to fifteen years while ONKALO stays open for the entire operational period, about a hundred years. The groundwater flow modelling results are in accordance with the analytical calculations presented in Löfman et al. (2010, Chapter 6).
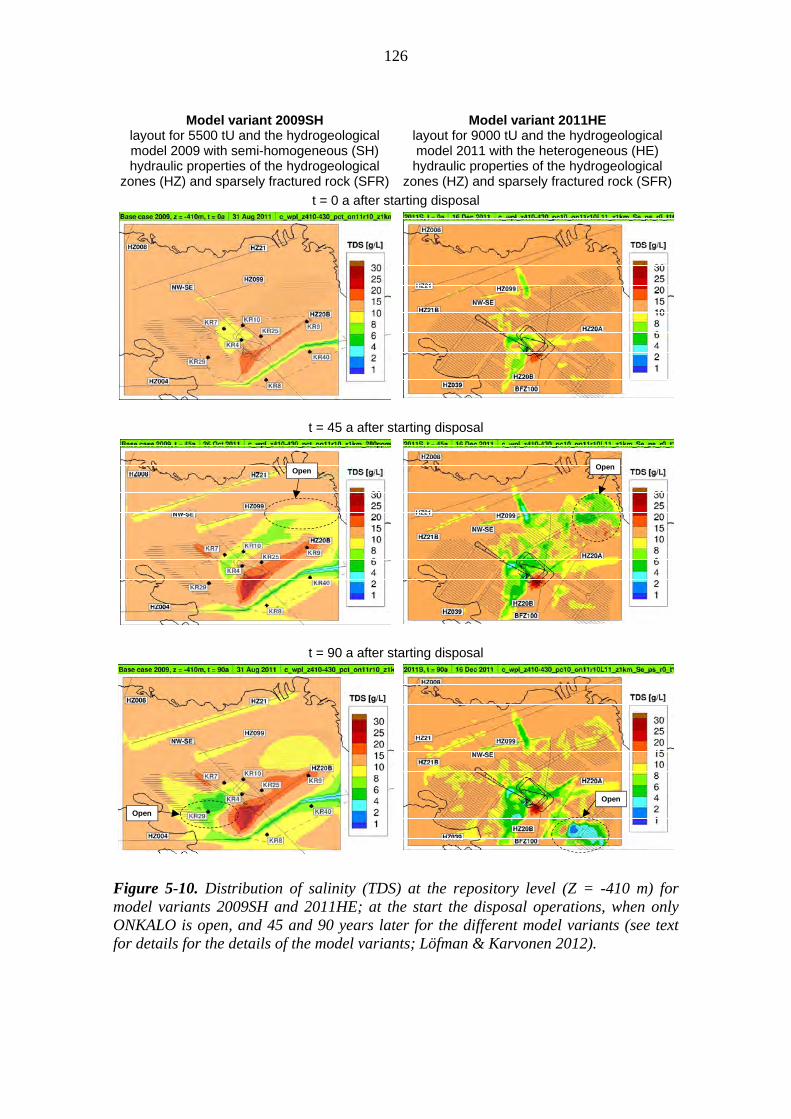
126
Model variant 2009SH layout for 5500 tU and the hydrogeological model 2009 with semi-homogeneous (SH) hydraulic properties of the hydrogeological
zones (HZ) and sparsely fractured rock (SFR)
Model variant 2011HE layout for 9000 tU and the hydrogeological model 2011 with the heterogeneous (HE) hydraulic properties of the hydrogeological
zones (HZ) and sparsely fractured rock (SFR)
t = 0 a after starting disposal
t = 45 a after starting disposal
t = 90 a after starting disposal
Figure 5-10. Distribution of salinity (TDS) at the repository level (Z = -410 m) for model variants 2009SH and 2011HE; at the start the disposal operations, when only ONKALO is open, and 45 and 90 years later for the different model variants (see text for details for the details of the model variants; Löfman & Karvonen 2012).
Open Open
Open
Open

127
According to Trinchero et al. (2013), the total charge equivalent concentration of cations in groundwater is controlled and limited by carbonate precipitation/dissolution and cation exchange reactions. The total charge equivalent concentration of cations (taking into account Na, K, Mg and Ca) varies between 0.01 and 1 mol/L (mean value 0.14 mol/L) and is thus above the target value of 4 mmol/L. This is expected given the composition of the infiltrating water and that the reactions with fracture minerals are taken into account.
pH and redox conditions
The infiltrating meteoric waters are dilute, slightly acidic and contain dissolved oxygen. As discussed in Section 3.1, water-rock interactions, chemical reactions (such as carbon and sulphur cycling and silicate reactions) and weathering processes induced by dissolved gases (CO2 and O2) in the overburden and shallow bedrock are important for the consumption of oxygen, neutralising the pH of the infiltrating waters and increasing their solute concentration. In this section, the consumption of oxygen and evolving pH of the infiltrating groundwater are discussed, whereas the oxygen present in the tunnels and affecting the near-field rock and the effects of higher pH values arising from cement leachates are discussed in detail in Section 5.5.4.
Oxygen is consumed mainly by aerobic oxidation of organic carbon, including methane and other hydrocarbons in the overburden and shallow groundwaters (see Pitkänen et al. 2004, Luukkonen et al. 2004 and Site Description). The remaining oxygen in infiltrating water is consumed in the oxidation of sulphide minerals, ferrous iron in silicates, and dissolved methane in the near-surface weathered zone (Pitkänen et al. 1999, 2004). In the Olkiluoto bedrock as well as in the seabed sediments, ferrous sulphides such as pyrite and ferromonosulphide (pyrrhotite) are the most effective electron donors for dissolved oxygen as both elements of these minerals can be oxidised (Luukkonen et al. 2004). These reactions are typically mediated by microbes.
Calcites and silicates are dissolved during the weathering process. Calcite is considered to be the main mineral buffer against low pH, although silicates also contribute. According to the results of reactive transport modelling by Trinchero et al. (2013), the pH of the groundwater (neglecting the effects of the cement leachates) at repository level is on average 7.8, and varies between 7.3 and 9; these results are in accordance with the observations at the site (see Table 3-1) and within the range of target properties. Also, the calculated Eh values, despite the relatively high variability, show that reducing conditions are attained.
An infiltration test close to ONKALO has been running since late 2008. The objective of this study is to investigate potential changes in the pH and redox conditions and in the buffering capacity of the rock as well as hydrogeochemical processes related to the infiltration of meteoric waters (Pitkänen et al. 2008b, Aalto et al. 2011, Käpyaho et al. 2012). Calcite dissolution relative to the initial mineral concentration has been modelled by adjusting the mixing ratios using a Conservative Binary Mixing Model and carrying out a reactive mixing analysis based on a Reactive Binary Mixing Model (Trinchero et al. 2012). The first results after the two years monitoring period suggest that only a limited amount of calcite has been dissolved; the fraction of calcite that has been used up is less than 0.1 ‰ and calcite dissolution has been spatially limited. Further, as
128
discussed in Site Description (Section 7.6), no signs of oxygen penetration have been observed in fracture coatings at depths greater than about a few metres.
The consumption of oxygen in infiltrating water along a fracture has been assessed using a 2D model (Trinchero et al. 2013, Section 7.2). The principal minerals that contribute the most to the reducing capacity of the rock in the absence of organic material are iron-bearing minerals. In the work by Trinchero et al. (2013), chlorite, biotite and pyrite have been considered. The conceptual model used by Trinchero et al. (2013) is shown in Figure 5-11 and is similar to that developed by Sidborn et al. (2010). The fractured media are described by a dual porosity approach and the dominant transport processes are advection along the fracture and diffusion into the matrix. Groundwater velocity in the streamline used in the model was 3.1·10-2 m/year. Oxygen consumption occurs both in the fracture-filling materials and in the matrix. Two cases are considered; oxygen consumption 1) only by fracture minerals (calcite and pyrite) and 2) also by reactive minerals in the rock matrix (chlorite and biotite). As the aim of the model was to assess oxygen consumption in the first metres of the fracture, the initial groundwater composition was assumed to be brackish carbonate-rich water, both for the fracture and for the matrix. The infiltrating water was assumed to be altered meteoric groundwater similar to that used in the modelling of hydrogeochemical evolution (see Appendix D). The time frame considered in the model was 1 year.
According to the results, pyrite (i.e. the iron-bearing mineral present in the fracture filling materials) acts as a barrier to oxygen intrusion. This is evident from the profiles of oxygen concentration (Figure 5-12) and pyrite consumption (Figure 5-13) along the fracture and at different simulation times. Oxygen is actively consumed over short distances. The maximum oxygen concentration in a fracture is reached within a few days. This value (i.e. 1.9·10-4 mol/L) is lower than the initial oxygen concentration in the infiltrating water (3.2·10-4 mol/L) as a consequence of the buffering effect of pyrite. Oxygen profiles reach steady state after 50 days and the maximum penetration depth of oxygen is approximately 0.5 m. As oxygen is buffered by pyrite, there is continuous depletion of this mineral which results in a concentration that decreases with the distance from the infiltration point and extends to the same depth as oxygen penetration (i.e. 0.5 m). The maximum amount of pyrite depletion at the end of the simulation time is about 5·10-5 mol/L. Thus, pyrite consumption is limited in space. Even at the entrance boundary, the amount of mineral depletion is very limited compared with the total available amount of pyrite (i.e. 1.17 mol/L, based on Andersson et al. 2007, Table 9-26). The pattern of calcite dissolution is similar to that of pyrite. The maximum calcite depletion is 0.2 % at the end of the simulated period and is limited to the beginning of the flow paths. According to the results, oxygen consumption occurs mainly in the fracture-filling minerals. However, the matrix provides additional buffering capacity.

129
Figure 5-11. Parallel fracture approximation used for the evaluation of the oxygen ingress along a fracture. As indicated by the red dashed rectangle, only half of the fracture-matrix system has been modelled (Trinchero et al. 2013, Figure 7-5).
Figure 5-12. Profiles of oxygen concentration along the fracture zone and at different simulation times (Trinchero et al. 2013, Figure 7-9).
Fracture2A
Filling material
Reducingmatrix
Boundarywater
Oxidised matrix
O2 O2
ox
ox
O2
Matrix2Ly
Lx
0.0E+00
5.0E-05
1.0E-04
1.5E-04
2.0E-04
0 0.1 0.2 0.3 0.4 0.5 0.6 0.7 0.8 0.9 1
O2
con
cen
trat
ion
(m
ol/
L)
Distance along fracture (m)
1 day
10 days
25 days
50 days
100 days
250 days
365 days
Fracture total length 15 m
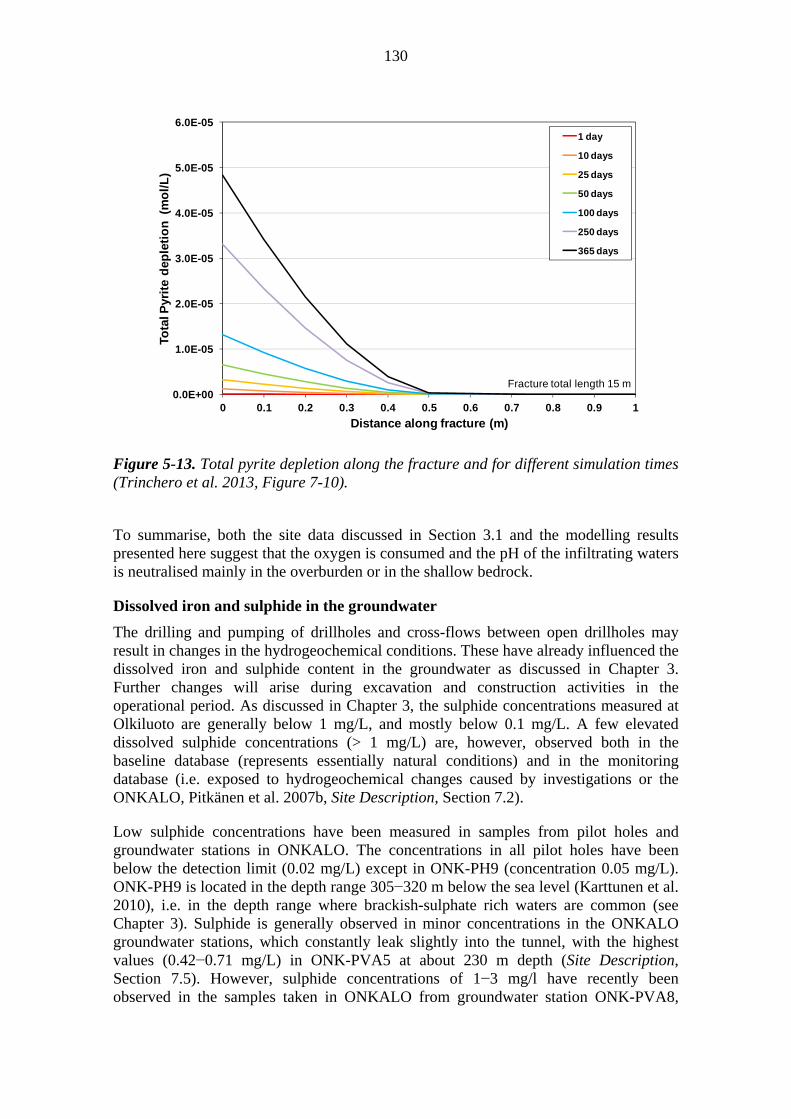
130
Figure 5-13. Total pyrite depletion along the fracture and for different simulation times (Trinchero et al. 2013, Figure 7-10).
To summarise, both the site data discussed in Section 3.1 and the modelling results presented here suggest that the oxygen is consumed and the pH of the infiltrating waters is neutralised mainly in the overburden or in the shallow bedrock.
Dissolved iron and sulphide in the groundwater
The drilling and pumping of drillholes and cross-flows between open drillholes may result in changes in the hydrogeochemical conditions. These have already influenced the dissolved iron and sulphide content in the groundwater as discussed in Chapter 3. Further changes will arise during excavation and construction activities in the operational period. As discussed in Chapter 3, the sulphide concentrations measured at Olkiluoto are generally below 1 mg/L, and mostly below 0.1 mg/L. A few elevated dissolved sulphide concentrations (> 1 mg/L) are, however, observed both in the baseline database (represents essentially natural conditions) and in the monitoring database (i.e. exposed to hydrogeochemical changes caused by investigations or the ONKALO, Pitkänen et al. 2007b, Site Description, Section 7.2).
Low sulphide concentrations have been measured in samples from pilot holes and groundwater stations in ONKALO. The concentrations in all pilot holes have been below the detection limit (0.02 mg/L) except in ONK-PH9 (concentration 0.05 mg/L). ONK-PH9 is located in the depth range 305−320 m below the sea level (Karttunen et al. 2010), i.e. in the depth range where brackish-sulphate rich waters are common (see Chapter 3). Sulphide is generally observed in minor concentrations in the ONKALO groundwater stations, which constantly leak slightly into the tunnel, with the highest values (0.42−0.71 mg/L) in ONK-PVA5 at about 230 m depth (Site Description, Section 7.5). However, sulphide concentrations of 1−3 mg/l have recently been observed in the samples taken in ONKALO from groundwater station ONK-PVA8,
0.0E+00
1.0E-05
2.0E-05
3.0E-05
4.0E-05
5.0E-05
6.0E-05
0 0.1 0.2 0.3 0.4 0.5 0.6 0.7 0.8 0.9 1
Tota
l Pyr
ite
dep
leti
on
(m
ol/
L)
Distance along fracture (m)
1 day
10 days
25 days
50 days
100 days
250 days
365 days
Fracture total length 15 m

131
which is located at depth of 280 m, at the intersection of ONKALO and BFZ100 and close to major hydrogeological zone HZ20A (for location of the zones, see Figure 3-2).
As discussed in Chapter 3, higher levels of sulphide typically observed at the interface between SO4-rich and CH4-rich groundwaters are associated with hydrological perturbations due to construction activities and tend to decrease after hydrogeological stabilisation due to permanent plugging of drillholes. The high concentrations of sulphide may also sometimes be caused by the slow rate at which iron is released from the rock to precipitate sulphide. Slower crystallisation kinetics of mackinawite compared with the precipitation of FeS(am) also slightly slows the rate at which sulphide return to more typical levels in groundwater (see Chapter 3). The observations from monitoring the drillholes indicate that the level of sulphide will normalise to the baseline conditions in the course of the operational period.
Modelling of sulphide evolution in the geosphere during the operational period
The hydrogeochemical evolution at Olkiluoto and the evolution of dissolved sulphur species in the geosphere is based on the reactive transport modelling discussed by Trinchero et al. (2013) and Wersin et al. (2013c) (see also Appendix D for a summary of the modelling approach). As previously mentioned, abundant sulphide minerals are potential sources of both dissolved sulphur and iron. Pyrite is the most frequently observed iron sulphide mineral at Olkiluoto. Additional sources of iron are iron oxyhydroxides, biotite, hornblende, and chlorite in the shallow weathering zone. Important sulphur sources are ancient Littorina seawater in the bedrock and organic debris in soil (see discussions in Chapter 3).
In the modelling, the initial waters (i.e. reference waters) used in reactive transport simulations have been equilibrated with either pyrite or amorphous iron sulphide (FeS(am)) controlling the sulphide concentrations. Thus calculations do not include microbial SO4 reduction as a source for dissolved sulphide. The influence of microbial activity is discussed separately through the sulphide results of hydrogeochemical monitoring and the calculated saturation indices of iron sulphide phases (see Section 3.1). In reactive transport simulations the solubility of FeS(am) is calculated with two different equilibrium constants due to variation between databases. The larger value (logK = -2.95) from Davison et al. (1999) is currently preferred and the lower one (logK = -3.92) is from the original PHREEQC database (Parkhurst & Appelo 1999), which corresponds relatively well to those constants presented for mackinawite in different sources (Wersin et. al 2013c). In addition to the presence of iron sulphide phases, Fe concentration is influenced by the Fe concentration in the reference groundwaters used in modelling the hydrogeochemical evolution during the operational period. The composition of the reference groundwaters is based on representative samples from the site (see Appendix D).
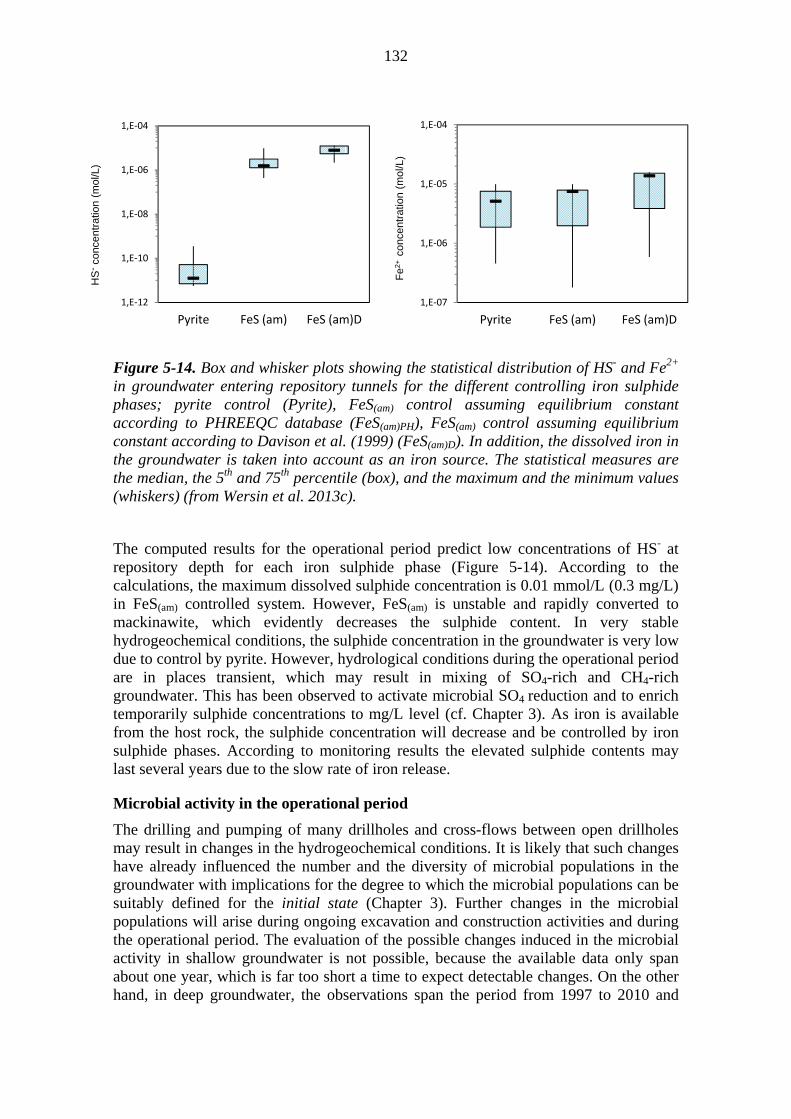
132
Figure 5-14. Box and whisker plots showing the statistical distribution of HS- and Fe2+ in groundwater entering repository tunnels for the different controlling iron sulphide phases; pyrite control (Pyrite), FeS(am) control assuming equilibrium constant according to PHREEQC database (FeS(am)PH), FeS(am) control assuming equilibrium constant according to Davison et al. (1999) (FeS(am)D). In addition, the dissolved iron in the groundwater is taken into account as an iron source. The statistical measures are the median, the 5th and 75th percentile (box), and the maximum and the minimum values (whiskers) (from Wersin et al. 2013c).
The computed results for the operational period predict low concentrations of HS- at repository depth for each iron sulphide phase (Figure 5-14). According to the calculations, the maximum dissolved sulphide concentration is 0.01 mmol/L (0.3 mg/L) in FeS(am) controlled system. However, FeS(am) is unstable and rapidly converted to mackinawite, which evidently decreases the sulphide content. In very stable hydrogeochemical conditions, the sulphide concentration in the groundwater is very low due to control by pyrite. However, hydrological conditions during the operational period are in places transient, which may result in mixing of SO4-rich and CH4-rich groundwater. This has been observed to activate microbial SO4 reduction and to enrich temporarily sulphide concentrations to mg/L level (cf. Chapter 3). As iron is available from the host rock, the sulphide concentration will decrease and be controlled by iron sulphide phases. According to monitoring results the elevated sulphide contents may last several years due to the slow rate of iron release.
Microbial activity in the operational period
The drilling and pumping of many drillholes and cross-flows between open drillholes may result in changes in the hydrogeochemical conditions. It is likely that such changes have already influenced the number and the diversity of microbial populations in the groundwater with implications for the degree to which the microbial populations can be suitably defined for the initial state (Chapter 3). Further changes in the microbial populations will arise during ongoing excavation and construction activities and during the operational period. The evaluation of the possible changes induced in the microbial activity in shallow groundwater is not possible, because the available data only span about one year, which is far too short a time to expect detectable changes. On the other hand, in deep groundwater, the observations span the period from 1997 to 2010 and
1,E‐12
1,E‐10
1,E‐08
1,E‐06
1,E‐04
Pyrite FeS (am) FeS (am)D
HS
-co
ncen
trat
ion
(mol
/L)
1,E‐07
1,E‐06
1,E‐05
1,E‐04
Pyrite FeS (am) FeS (am)D
Fe2
+ c
once
ntra
tion
(mol
/L)
133
variations in microbial numbers have been observed. The MPN (Most Probable Number) analyses of SRB suggest that the cultivable numbers of SRB have decreased significantly in the 200 to 400 m depth interval since the beginning of the site investigations in 1997. Microbiological analyses of groundwater samples are probably very sensitive to even small disturbances, e.g. slight mixing of waters caused by pumping and installing sampling equipment. These may occasionally activate and increase the number of bacteria (note pumping takes place several weeks before the final sampling). Consequently, the steady-state conditions of the populations in deep stagnant Olkiluoto groundwater may have been disturbed by the site investigations, which also may be the case during further excavation activities (Site Description, Section 7.4.2).
The main electron acceptor in the near field during this stage is molecular oxygen. This will be consumed by aerobic microbes via degradation of natural organic matter and organic material from anthropogenic sources, methane, other hydrocarbons and sulphides. This in turn will lead to an increase in low molecular weight organic acids (e.g. acetate), dissolved CO2 and sulphate in the groundwater. Obviously, the availability of nutrients is a main driver for biodegradation. Sources of nutrients include degradable organic materials, humic and fulvic acids in the host rock, and introduced structural and stray materials, concrete and grout admixtures (superplasticisers), diesel oil residues, hydraulic and lubricating oils, degreasing agents and detergents, paints, urine, miscellaneous human waste, impurities in ventilation air, microbial biofilms and the organic matter in the buffer and backfill.
During the excavation and operational periods, there may be steep chemical and redox gradients at the interfaces between the EBS and the rock, which can be exploited by microorganisms. The distribution, activity and extent of microbial processes will be patchy and heterogeneous. Biological iron oxidising activity commonly results in biological iron oxides (BIOS) that accumulate as dense mats (Ferris et al. 1999, Anderson & Pedersen 2003). If sulphide is present in the groundwater, sulphur oxidising bacteria can generate white mats with elemental sulphur (Anderson et al. 2006). Iron and sulphide mats occur in ONKALO at positions where groundwater intrudes to the tunnel. Dense, slimy biofilms have been observed at different positions in the ONKALO tunnel (Pedersen et al. 2013). They have been described in detail, but the sources of energy and carbon for these biofilms have not been confirmed. It could be either methane or some other source of organic carbon in the groundwater or a combination of both. The build-up of these biological iron and sulphur mats and the slimy biofilms may become a significant part of the organic content in the backfill system, unless they are removed before installation of the EBS. However, they will re-appear as long as there is an inflow to the backfill and oxygen is present. In other words, these mats and biofilms will contribute to the removal of oxygen from the backfill and to the build-up of an organic material inventory. Once oxygen has been consumed, anaerobic respiration will commence and microbial redox processes will develop.
Upon depletion of O2, iron(III) and sulphate will be the predominant electron acceptors fuelling bacterial activity in the groundwater and generating Fe(II) and hydrogen sulphide, thus partially reversing the redox reaction sequence. There will be carbohydrates available for IRB that can utilise and reduce available ferric iron to

134
ferrous iron and for SRB that utilise sulphate in groundwater and reduce it to sulphide, with further precipitation of iron sulphide and/or pyrite:
CH2O + 4Fe(OH)3 + 8H+ 4Fe2+ + CO2 + 11H2O (5-1)
CH2O + 0.5SO42- + H+ 0.5H2S + CO2 + H2O (5-2)
Fe2+ + H2S FeS + 2H+ (5-3)
Fe2+ + 2H2S FeS2 + 2H+ + H2 (5-4)
In addition, once anaerobic conditions are established, anaerobic corrosion of iron in rock bolts and steel in reinforced concrete plugs will generate hydrogen that can be readily used by SRB to produce sulphide:
SO42- + 4H2 + H+ HS- + 4H2O (5-5)
The extent and timing of these microbially-induced processes depend on the complex interplay of microbial, geochemical and transport processes as well as spatial constraints.
Introduced cementitious colloids during construction
During this stage, colloids may be formed as a consequence of high chemical gradients. At the same time, processes that may contribute to the elimination of colloids could be microbial decomposition of organics, and the re-crystallisation and deposition of amorphous materials. Even though variable pH, salinity (TDS) and cation concentrations are likely during this period, all the target properties defined to avoid colloidal dispersion are fulfilled across this range of variation.
Cementitious colloids may be formed from cementitious materials introduced into the rock, such as grout, rock bolts and plugs. Colloids may start to form as early as during the construction and operational period, due to degradation of the cement at the cement/rock interface or along with high pH leachate produced by the leaching of cementitious materials. Colloids may also be formed during the degradation of Silica Sol (colloidal silica), which may be used to seal fractures of small size (0.05 mm or less).
Cementitious colloids are unlikely to be stable due to the high ionic strength of the leachates and the groundwater itself. The concentrations of colloids observed in cement degradation tests by Hölttä & Hakanen (2008) were generally low, and decreased with increasing salinity. The authors (Hölttä & Hakanen 2008, Hölttä et al. 2009) indicate that colloids formed by cement degradation are stable towards aggregation in alkaline leachates, but stability decreases when the Ca concentration in the groundwater is higher than in the leachate (which would likely be the case for the saline water at Olkiluoto).
The main mass of colloidal materials will be introduced by emplacement of clays in the buffer and backfill (see Section 5.5.3).
135
5.1.4 Summary, uncertainties and issues that need propagation
Groundwater flow at Olkiluoto takes place mainly through a network of fractures and deformation zones, within which internal channelling of the flow is likely. Thus, there is significant local variation in flow conditions and possibly also in salinity and groundwater composition around the deposition hole locations. Another characteristic feature affecting groundwater flow at Olkiluoto is the large variation in salinity as a function of depth, making it necessary to take density effects into account. Various modelling tools have therefore been applied, an ECPM (Equivalent Continuous Porous Medium) and DP (Dual Porosity) model by Löfman & Karvonen (2012), a model that can account for density variation and thermal effects, and a DFN (Discrete Fracture Network) model capable of modelling flow at a detailed scale (Hartley et al. 2013a).
In the modelling, a simplified construction schedule has been assumed, so that all the approximately 20 tunnels in one panel are assumed to be open at the same time and are also closed at the same time. Full saturation is assumed to take place instantly at the closure of the tunnels. Because the number of alternative sinks into which groundwater can flow is higher, the assumption that all tunnels are simultaneously open is likely to reduce the inflows that the model produces compared with the case where the number of open tunnels at the same time is less. A subsequent analysis by Hartley et al. (2013c) has been carried out to study the effects of the construction schedule on the inflow. According to the results, the opening of the new tunnels tends to decrease the inflows to existing open deposition tunnels and deposition holes, but this effect is seen only in the immediate vicinity of the new excavations. The reduction is typically about 10 % but a reduction of about 50 % may also occur in tunnels that have relatively small inflows. The results suggest that in the order of 50 % more inflows above the 0.1 L/min limit would be obtained if inflows to deposition holes were calculated assuming the tunnels and holes to be progressively excavated, tunnel by tunnel compared with calculations with the whole repository open.
There is a partial correlation between the initial inflow rate to a deposition hole and the subsequent post-closure flow rate around the hole, and hence limitation of the post-closure flow rate (and also maximisation of geosphere transport path resistance) is an objective for setting the 0.1 L/min inflow limit. Nevertheless, even if all the deposition holes with inflow over the given limit, 0.1 L/min, are discarded, it cannot be excluded that a few deposition holes will be associated with a higher post-closure flow rate or a lower transport resistance than the target values, see further discussion in Section 6.1.2.
There are uncertainties related to the extent and properties of the rock damage created by the excavation and later by the heat produced by the spent nuclear fuel. Different assumptions as to the EDZ and rock damage around the deposition tunnel and holes have been made and their impact on the groundwater flow studied. The presence of an EDZ affects inflows below 1 mL/min and means that, in practice, all deposition holes have some, although in many cases very limited, inflow compared with 40 % of deposition holes with no inflow when there is no EDZ present.
Uncertainties in the understanding of groundwater flow also affect the understanding of the geochemical conditions. The modelling results show that the main factors affecting salinity changes are the connections between the hydrogeological zones and the open tunnels. The modelling results are sensitive to the parameters affecting salt transport,

136
that is, flow and diffusion porosity and dispersivity. Compared with the drawdown caused by the presence of the open tunnels, thermal effects are minor. Although the thermal buoyancy has an effect on the flow directions, enhancing upward flow, and slightly also on the magnitude of the flow rates, it is not strong enough to affect the upconing during the operational phase (Löfman & Karvonen 2012, Section 5.3.1 and Löfman et al. 2010, Figure 5-17 and 5-20). The effects of the increased temperature on flow are discussed further in Section 6.1.2.
From the available modelling results, it can be concluded that any local increase in salinity at around repository level will remain rather moderate during the operational period. Based on the different modelling results, the maximum salinities will remain below 70 g/L, but locally salinities over 35 g/L are possible within some tens of metres below the repository level and, according to hydrogeochemical modelling, even at the repository depth. Most of the modelling results suggest that the lowest salinities during the operational period will be at least a few grams per litre in most parts of the repository. However, the possibility of salinities close to 0.3–0.4 g/L, which corresponds roughly to the minimum acceptable total charge concentration of 4 mM, cannot totally be excluded. However, such low salinities are obtained only when the reactions in the overburden or water-rock interaction are not taken into account. This issue will be further studied during the next research period (2013−2015). The lowest and highest salinities are related to the main hydrogeological zones and the ONKALO facility and not necessarily to the repository panels themselves. Moreover, the disturbed conditions of either low or extremely low salinities are likely to last a limited time; in the order of tens of years. In summary, in spite of the rather large variations in flow conditions during the excavation and operational period, the groundwater composition with respect to salinity, chloride content and total charge concentration of the cations will remain within the target range except for a few canister positions, where the transient characteristic of salinity change will have limited significance for buffer erosion.
Oxygen in the infiltrating groundwater is consumed mainly in the overburden, and the abundant iron-bearing minerals in the rock provide a strong buffer against oxygen. According to observations and geochemical modelling, pyrite in fractures is able to consume oxygen rapidly and it will not intrude further than a few decimetres along fractures. The pH under natural conditions is expected to be in the range of 7 to 9, thus well within the range defined by the target properties.
The sulphide concentration for the main water types in the natural state is well below 1 mg/L, ranging from less than 0.02 to 0.56 mg/L, with median values being 0.02−0.04 mg/L in different groundwater types. A trend can be observed of solubility control from amorphous iron sulphides towards pyrite with very low solubility at steady state conditions. It has been observed that site characterisation activities and ONKALO construction have caused artificially disturbed transient conditions due to mixing of different groundwater types and anomalous sulphide levels have been measured (max. 12 mg/L) at a depth of around 300 m for the brackish SO4 water type mixed with brackish Cl type groundwater. According to the monitoring results, sulphide concentrations decrease from the initial, anomalously high values once groundwater conditions stabilise. Iron sulphide precipitation is capable of limiting sulphide concentrations to tolerable levels in the long term. The recovery towards less artificially
137
disturbed conditions thus seems to be quite rapid, within years to tens of years, based on the observations from monitoring of the drillholes. Although groundwater data clearly indicate values of sulphide concentration well below 1 mg/L, a pessimistic upper value of 3 mg/L, which is an order of magnitude higher than predicted (Figure 5-15) is adopted for corrosion calculations, which accounts for the possibility of solubility control by the more soluble amorphous iron sulphide in combination with kinetically constrained availability of iron and the uncertainties related to the microbial activity and availability of nutrients and energy sources for microbes (see Chapter 3 and Wersin et al. 2013c).
The Olkiluoto groundwater has a naturally low colloid content due to its high ionic strength. Colloids may be formed by cement degradation. However, the groundwater at the repository depth in general has such a high ionic strength (salinity) that colloids are assumed to be short-lived.
5.2 Thermal evolution of the near field
5.2.1 Overview and performance targets potentially affected
Radiogenic heat production occurs within the spent nuclear fuel and heat is transferred to the buffer through the copper canister. The buffer transfers the heat to the backfill and the rock. Efficient heat transport through the buffer is essential for the performance of the repository system, since it directly affects the temperature of the canister surface and in the buffer. One performance target (Table 2-2) is directly affected by the thermal evolution:
Buffer temperature shall remain sufficiently low, in order to prevent thermally-induced mineral transformation. To ensure this, the buffer temperature shall be < 100 °C (L3-BUF-6).
The efficiency of heat transport through the rock plays an important role in dissipating the heat from the buffer. Taking into account the thermal properties of the host rock and the heat generation of the waste canisters, the minimum spacing between deposition tunnels and deposition holes has been defined so that no high temperatures that could cause damage to the EBS will be reached (Ikonen 2009). The backfill is less important than the buffer in heat dissipation.
Within the initially unsaturated buffer, heat will be transferred by conduction through the water-filled pore spaces and voids and, to a lesser extent, by radiation through any remaining air-filled voids. Due to the very low permeability of the bentonite and the narrow gap geometries (see Table 3-6 for dimensions), the contribution to heat transfer from convection can typically be ignored.
The gap between the copper canister and the buffer will have a high heat resistance due to the low emissivity of the copper surface and the associated low radiant heat transfer. In contrast, the heat resistance will be lower for the gap between the buffer and the rock because it will be filled with pellets and conductive heat transport will be the main mechanism for heat flow.
Water uptake by bentonite and the development of swelling pressure will serve to dissipate the canister heat, increase the thermal conductivity and eliminate the gaps and
138
joints around the buffer, causing heat transfer to take place only by conduction through the water-saturated bentonite. The availability of water is therefore relevant to the heat transfer process in the buffer. The thermal conductivity of the rock depends on the temperature and not on the degree of saturation because the porosity is small. During the initial post-emplacement period (days), heat transfer through the buffer will be largely independent of its heat capacity. This parameter is more important in the rock and will play a role over a longer period of time because of the large mass of material that will increase its temperature.
5.2.2 Temperature evolution in the near field
The temperature evolution at the canister surface and at the deposition hole wall is shown in Figure 5-15 assuming different degrees of saturation of the buffer (Ikonen & Raiko 2013). According to Figure 5-15, the maximum temperature at the canister surface is over 90 °C assuming a dry buffer and it is achieved within about 20 years after emplacement. In case of a saturated buffer, the maximum temperature is at most about 75 °C. The maximum temperature in the rock at the deposition hole wall is reached within about 40 years and it is about 65 °C. At the end of the operational phase (after 100 years), the canister surface temperature is 70 °C and the temperature in the rock is 60 °C. The results shown in Figure 5-15 are for a canister located in the central part of the repository, thus showing the maximum temperatures that will be reached, since the contribution from surrounding canisters is maximised.
Ikonen (2009, Appendix A) compared numerical and analytical solutions for the temperature at the canister surface and at the deposition hole wall and showed that they are in good agreement. Ikonen (2009, Appendix B) carried out a number of sensitivity cases to study the effect of various parameters on the maximum temperature of the canister, on the heat transfer reduction coefficient (i.e. the rate at which heat transfer is reduced) and change of maximum rock temperature. The parameters varied included copper emissivity, gap width, conductivity of the bentonite and rock. The report shows that the variation of the parameters has negligible effect on the results.
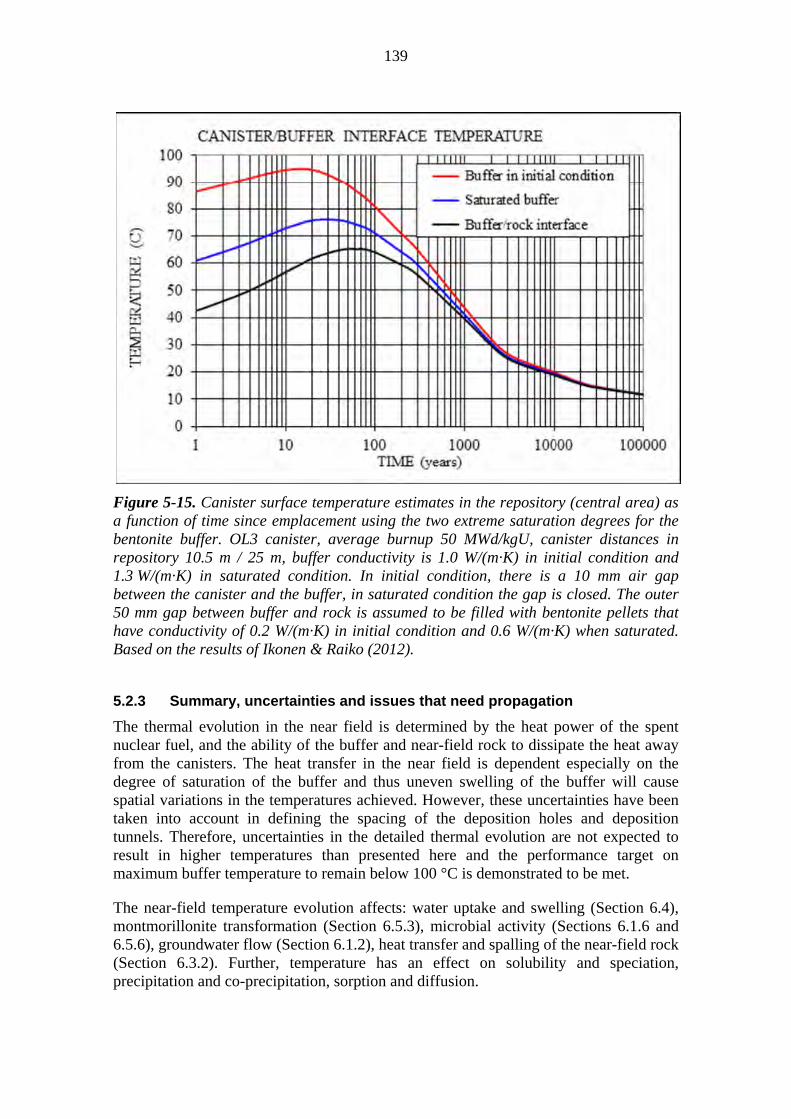
139
Figure 5-15. Canister surface temperature estimates in the repository (central area) as a function of time since emplacement using the two extreme saturation degrees for the bentonite buffer. OL3 canister, average burnup 50 MWd/kgU, canister distances in repository 10.5 m / 25 m, buffer conductivity is 1.0 W/(m·K) in initial condition and 1.3 W/(m·K) in saturated condition. In initial condition, there is a 10 mm air gap between the canister and the buffer, in saturated condition the gap is closed. The outer 50 mm gap between buffer and rock is assumed to be filled with bentonite pellets that have conductivity of 0.2 W/(m·K) in initial condition and 0.6 W/(m·K) when saturated. Based on the results of Ikonen & Raiko (2012).
5.2.3 Summary, uncertainties and issues that need propagation
The thermal evolution in the near field is determined by the heat power of the spent nuclear fuel, and the ability of the buffer and near-field rock to dissipate the heat away from the canisters. The heat transfer in the near field is dependent especially on the degree of saturation of the buffer and thus uneven swelling of the buffer will cause spatial variations in the temperatures achieved. However, these uncertainties have been taken into account in defining the spacing of the deposition holes and deposition tunnels. Therefore, uncertainties in the detailed thermal evolution are not expected to result in higher temperatures than presented here and the performance target on maximum buffer temperature to remain below 100 °C is demonstrated to be met.
The near-field temperature evolution affects: water uptake and swelling (Section 6.4), montmorillonite transformation (Section 6.5.3), microbial activity (Sections 6.1.6 and 6.5.6), groundwater flow (Section 6.1.2), heat transfer and spalling of the near-field rock (Section 6.3.2). Further, temperature has an effect on solubility and speciation, precipitation and co-precipitation, sorption and diffusion.
140
5.3 Rock mechanics evolution in the near field
5.3.1 Overview and performance targets potentially affected
The excavation of the repository rooms and the thermal load generated by the spent nuclear fuel will change the stress conditions around the repository and may cause rock damage. The following processes are therefore discussed:
Formation and properties of the EDZ
Mechanically and thermally induced rock damage including spalling
Reactivation of fractures.
Rock damage is a risk for operational safety, but also for long-term safety as the damage may change the hydraulic properties of the near-field rock and thereby affect compliance with the target properties concerning limited groundwater flow and high transport resistance in the vicinity of the deposition holes.
Excavation-induced microearthquakes are not considered to be a risk for the ONKALO or for repository construction because of their low magnitude, limited slips and source of radius (see e.g. Saari & Malm 2012).
5.3.2 EDZ
According to current understanding based on tests in ONKALO (Mustonen et al. 2010, Section 6.6), an Excavation Damaged Zone (EDZ) is formed during excavation when using the drill and blast method. The seismic and radar measurements indicate that blast-induced fracturing does not form a continuous, connected network over larger distances along the tunnel. Instead, the EDZ appears as patches of reduced rock quality, increased fracturing and to some extent increased porosity. The EDZ seems to be associated especially with the end of excavation rounds due to higher charges used there. Induced fracturing occurs sometimes also in connection with the presence of natural fractures. The extent of the EDZ ranges from 0 to 15−70 cm and a typical maximum depth is 30 cm. The EDZ is best developed below the tunnel floor. According to hydraulic tests (water loss measurements), there is a possibility of the existence of excavation-induced fractures with low transmissivity in the range T = 10-12–10-8 m2/s (Mustonen et al. 2010, p. 94 and Fig. 5-13). There is however uncertainty as to the hydraulic properties of the EDZ and further studies on its hydraulic properties are planned to confirm the hydraulic properties of the EDZ (Mustonen et al. 2010, p. 170, Posiva 2012b, Section 6.4.4.1).
The impacts of the presence of the EDZ on groundwater flow have been studied as part of the groundwater flow modelling by Hartley et al. (2013b). There are also earlier studies by Mellanen et al. (2008) and Hartley et al. (2010), which both conclude that the impact of the EDZ on groundwater flow is rather limited. Based on the findings in Mustonen et al. (2010) the following cases have been considered in the groundwater flow modelling by Hartley et al. (2013b) to study the impact of EDZ below the tunnel floor; for a summary of the results see Sections 5.1.2 and 6.1.2:
Discontinuous EDZ (reference case) with a 4 m section of EDZ, 0.5 m with no EDZ. Depth of the EDZ is assumed to be 400 mm, and transmissivity 10-8 m2/s and
141
porosity 1 %. The porosity value is based on the results presented in Siitari-Kauppi et al. (2010).
Continuous EDZ with the same thickness and hydraulic properties of the EDZ as in the reference case.
No EDZ.
The first case is considered to be the most realistic one based on the observations from the ONKALO. The two last cases are non-physical bounding cases, as EDZ indeed develops but its continuity with respect to hydraulic properties has not been observed.
5.3.3 Excavation induced rock damage
Spalling and other type of rock damage can be both excavation or thermally induced. Locally, stress-induced rock damage has been observed in the ONKALO at repository depth (e.g. at the bottom of a shaft, depth 430 m) indicating that rock damage is possible at 60−70 MPa stresses. A specific experiment in ONKALO (POSE, Posiva’s Olkiluoto Spalling Experiment) to study both mechanically and thermally induced spalling at the deposition hole scale is currently ongoing. Three test holes have been bored, two of them close to each other. The pillar between the two near-by holes has been heated. Rock damage in the test holes has been monitored both after excavation and during and after heating. The results from the two test holes are currently being analysed. The third test hole will also be heated during year 2012. In the following the predictions of the experiment and first findings are discussed.
The occurrence of spalling can be predicted from the stress/strength relationship, but the experience from ONKALO has shown that both parameters vary significantly, and other factors like fracturing and foliation can have an additional effect (Posiva 2009b, Section 5.2.8). Estimates of potential spalling have been presented by Hakala et al. (2008) and Site Description (Section 9.2) based on generic and Olkiluoto specific statistical methods. Two types of spalling predictions of the POSE experiment have been made; one based on fracture mechanics (Siren 2011) and the other on traditional continuum thermomechanics (Site Description, Section 9.2). A significant uncertainty in the estimates is that the spalling strength of the Olkiluoto rock is not well established and its determination is one of the aims of the POSE experiment. In addition, laboratory-scale rock strength tests on the rock samples from the ONKALO and the drill holes in Olkiluoto Island have been made. According to these tests, there is high variability in the strength of the rock and it may vary spatially, however, at the repository depth, no significant spatial variability has been observed (Site Description, Section 5.2.2). In the POSE predictions, the spalling strength has been assumed to be 57 % of the Uniaxial Compressive Strength (UCS) based on experiments from the Äspö HRL in Sweden and the URL in Canada (Martin & Christianson 2008) (Site Description, Section 5.2.5).
According to Hakala et al. (2008), excavation-induced spalling is locally possible both in the deposition holes and tunnels. It was found that with the maximum thermal stresses, stress failures will occur. The extent of spalling in the deposition tunnels can be effectively mitigated by orienting the tunnels along the maximum principal horizontal stress. Further, the confining pressure provided by the tunnel backfill and buffer mitigates spalling provided it is developed early enough.
142
The prediction by Siren (2011) is made using the fracture mechanics code Fracod2D, which is based on the Displacement Discontinuity Method (DDM). In the model, fracture initiation occurs when two principal stresses reach a critical value. More specifically, the tensile and shear stresses and strengths are used to determine the initiation of a new fracture. Only macrofracture growth is considered, the microcrack formation is neglected. The fracture propagation is determined by using fracture toughness parameters. Mainly anisotropic models simulating the behaviour of migmatitic gneiss, but also isotropic models simulating the pegmatitic granite were used. The anisotropic models have lower strength parameters in the anisotropy direction. The results show that spalling occurs in almost every model studied. In the models with the anisotropy direction across the pillar between the two POSE holes, only crevices are formed. With the current stress state, fracture and rock properties, fracture growth starts when the rock strength is less than 63 MPa in the anisotropy direction and 73 MPa in the perpendicular direction.
A continuum mechanics prediction for the POSE experiment performed with the 3DEC code (Site Description, Section 9.2) also shows spalling on the pillar walls between the two holes bored from the tunnel floor. These holes have dimensions close to those of the deposition holes but are located only 0.9 m from each other, i.e. much closer than the actual deposition holes will be. The maximum depth of spalling was predicted to be 80 mm after drilling the second hole. The maximum principal stress in the rock pillar between the holes is around 75−80 MPa. In the 3DEC analyses, the effects of the heating were also studied: after two weeks heating in the pillar area, the stresses were increased to the level of 130 MPa. At such high stresses, spalling is estimated to occur.
First results of the POSE test are presented in Site Description (Section 9.2), see also Figure 5-16. The only excavation induced damage that was observed was two sub-vertical fractures (1 and 2 in Figure 5-16) that were formed on the wall of hole ONK-EH1 (Figure 5-16) and one sub-vertical fracture (3 in Figure 5-16) on the wall of hole ONK-EH2 after drilling had been completed. The drilling of the two holes did not induce any spalling on the pillar side walls. Around the two holes and between the holes, there is a complex state of stress caused by concentrations of the far-field stresses. In particular, there is a zone of increased shear stress at the boundaries of the holes. Thus, the most likely fracturing to occur is a vertical fracture at a location where there is a weak zone. The observed vertical fracture (3 in Figure 5-16) is located in a mica layer, which typically indicates a low strength. The two fractures in hole ONK-EH1 (1 and 2 in Figure 5-16) did not propagate further during the drilling of hole ONK-EH2; also, microseismic monitoring did not record any events during the drilling. These observations initially indicate that the spalling strength may be higher than anticipated, or that the stress state may be different from that estimated, or that the effect is due to a combination of both of these.
In the following phase of POSE, the rock in the pillar area between the holes was heated to increase the stresses, in order to induce spalling. The damage to the rock did not start until the stress magnitudes exceeded the crack initiation value measured in laboratory samples. However, once initiated the damage appears to be controlled by mica bands, rock type contacts and foliation and not by the borehole stress concentration. According to the observations from the experiment, spalling, i.e. occurrence of loose rock pieces, takes place only to some extent, but other types of rock damage have been more
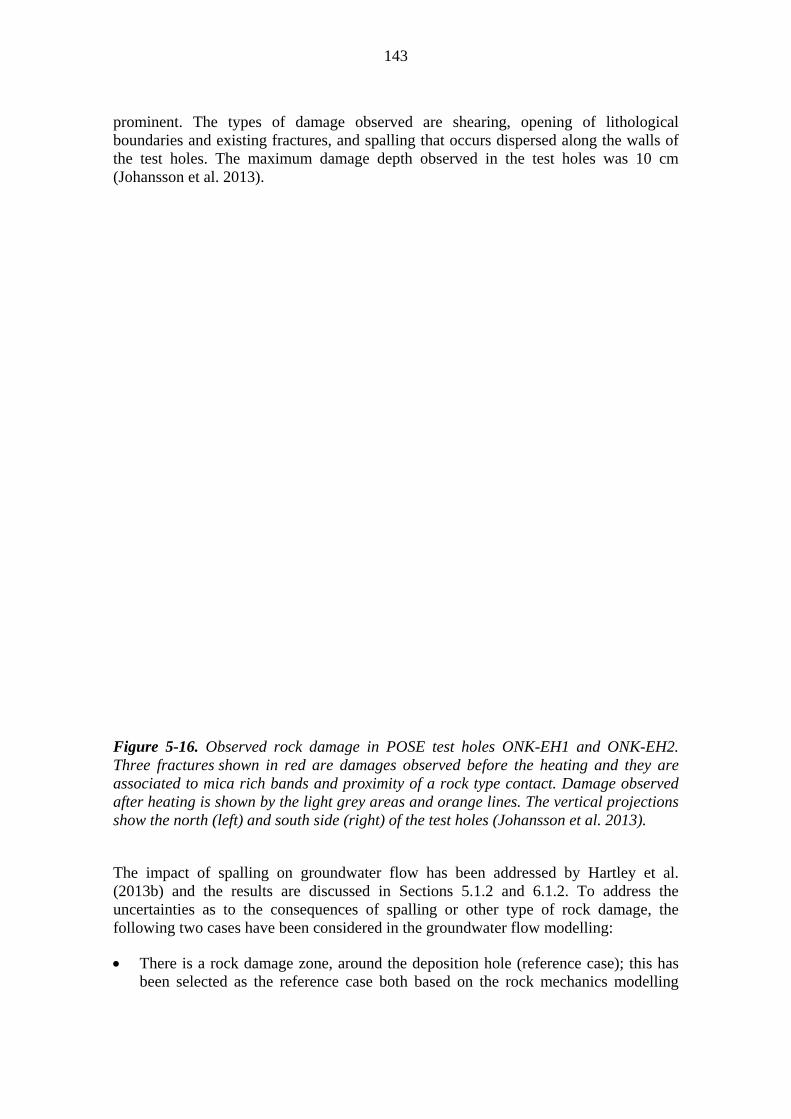
143
prominent. The types of damage observed are shearing, opening of lithological boundaries and existing fractures, and spalling that occurs dispersed along the walls of the test holes. The maximum damage depth observed in the test holes was 10 cm (Johansson et al. 2013).
Figure 5-16. Observed rock damage in POSE test holes ONK-EH1 and ONK-EH2. Three fractures shown in red are damages observed before the heating and they are associated to mica rich bands and proximity of a rock type contact. Damage observed after heating is shown by the light grey areas and orange lines. The vertical projections show the north (left) and south side (right) of the test holes (Johansson et al. 2013).
The impact of spalling on groundwater flow has been addressed by Hartley et al. (2013b) and the results are discussed in Sections 5.1.2 and 6.1.2. To address the uncertainties as to the consequences of spalling or other type of rock damage, the following two cases have been considered in the groundwater flow modelling:
There is a rock damage zone, around the deposition hole (reference case); this has been selected as the reference case both based on the rock mechanics modelling
144
studies and observations in the POSE experiment showing that some kind of rock damage is likely to take place. Further, as a large number of deposition holes are expected to have very limited inflow, the swelling pressure due to the buffer will develop rather slowly and rock damage may take place before the buffer gives enough support to the rock (see also Section 6.4). Rock damage is modelled to reach 10 cm depth and the damaged zone is assumed to have the same hydraulic conductivity as the EDZ. The porosity is set to 0.02 (see Neretnieks et al. 2010).
No rock damage around the deposition hole.
5.3.4 Reactivation of fractures
Stresses are redistributed due to the excavation and thermal load imposed by the spent nuclear fuel. The changed stress situation can cause reactivation and dilation of existing fractures. The shear displacements are expected to be insignificant (Hökmark et al. 2010). The results by Hökmark et al. (2010) are for Forsmark and Laxemar in Sweden, but are considered to be relevant also for conditions at Olkiluoto. Reactivation of the fractures can change their hydraulic properties or the flow and transport properties in the interface between the excavated surface and the rock. The changes in the hydraulic properties of the fractures due to reactivation are discussed by Hökmark et al. (2010). A conclusion of the study is that the changes are limited to the vicinity of the excavated rooms and even though there are changes in the hydraulic properties they are minor, especially when compared with changes caused by the formation of EDZ and spalling. Therefore, the potential impact of the reactivation of the fractures on groundwater flow is captured in the assessment by assuming EDZ and rock damage around deposition holes.
5.3.5 Summary, uncertainties and issues that need propagation
Excavation and the thermal load caused by the decay heat from the spent nuclear fuel will cause damage to the near-field rock. An EDZ, although unlikely to be continuous, will be formed especially below the tunnel floor. Rock damage is not directly considered in the target properties, but rock damage around the excavated rooms may have an impact on the hydraulic properties of the rock. Due to the uncertainties related to the properties of the rock damage zone, a number of cases considering varying geometrical and hydraulic properties of the damage zone have been considered in the groundwater flow modelling (see Sections 5.1.2, 6.1.2 and 7.1.2).
Although there is a good understanding of the processes affecting the mechanical state of the rock in general, there are still uncertainties related to the elastic and rock strength parameters of the rock at Olkiluoto and especially concerning the in-situ stress state, which needs to be studied further. The heterogeneity of the rock leads to spatial variations in rock properties, which complicates the assessment of rock damage. A specific experiment to study the rock properties and rock damage (POSE) caused by excavation and heating is currently ongoing and first observations are available, however a thorough analysis of the results is still underway. To address the uncertainties as to the existence of spalling or other type of rock damage, two cases to address the spalling have been applied in the groundwater flow modelling: i) rock damage zone around each deposition hole (reference case), with 10 cm depth and
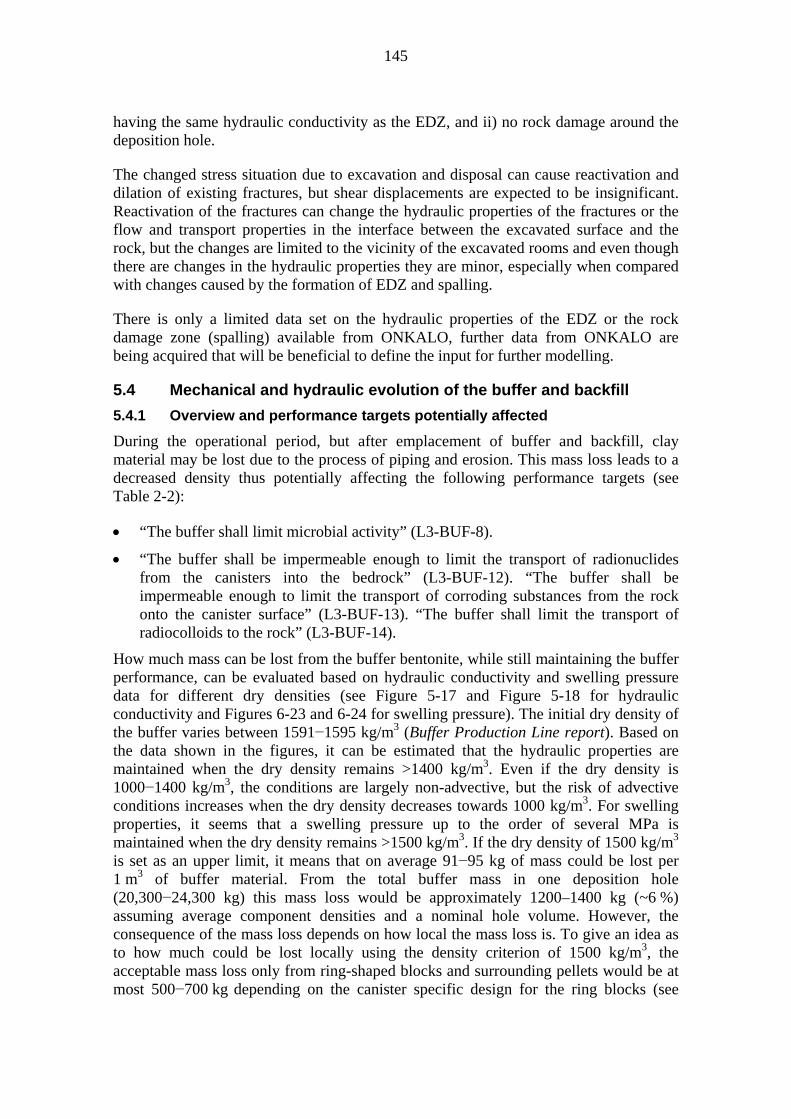
145
having the same hydraulic conductivity as the EDZ, and ii) no rock damage around the deposition hole.
The changed stress situation due to excavation and disposal can cause reactivation and dilation of existing fractures, but shear displacements are expected to be insignificant. Reactivation of the fractures can change the hydraulic properties of the fractures or the flow and transport properties in the interface between the excavated surface and the rock, but the changes are limited to the vicinity of the excavated rooms and even though there are changes in the hydraulic properties they are minor, especially when compared with changes caused by the formation of EDZ and spalling.
There is only a limited data set on the hydraulic properties of the EDZ or the rock damage zone (spalling) available from ONKALO, further data from ONKALO are being acquired that will be beneficial to define the input for further modelling.
5.4 Mechanical and hydraulic evolution of the buffer and backfill
5.4.1 Overview and performance targets potentially affected
During the operational period, but after emplacement of buffer and backfill, clay material may be lost due to the process of piping and erosion. This mass loss leads to a decreased density thus potentially affecting the following performance targets (see Table 2-2):
“The buffer shall limit microbial activity” (L3-BUF-8).
“The buffer shall be impermeable enough to limit the transport of radionuclides from the canisters into the bedrock” (L3-BUF-12). “The buffer shall be impermeable enough to limit the transport of corroding substances from the rock onto the canister surface” (L3-BUF-13). “The buffer shall limit the transport of radiocolloids to the rock” (L3-BUF-14).
How much mass can be lost from the buffer bentonite, while still maintaining the buffer performance, can be evaluated based on hydraulic conductivity and swelling pressure data for different dry densities (see Figure 5-17 and Figure 5-18 for hydraulic conductivity and Figures 6-23 and 6-24 for swelling pressure). The initial dry density of the buffer varies between 1591−1595 kg/m3 (Buffer Production Line report). Based on the data shown in the figures, it can be estimated that the hydraulic properties are maintained when the dry density remains >1400 kg/m3. Even if the dry density is 1000−1400 kg/m3, the conditions are largely non-advective, but the risk of advective conditions increases when the dry density decreases towards 1000 kg/m3. For swelling properties, it seems that a swelling pressure up to the order of several MPa is maintained when the dry density remains >1500 kg/m3. If the dry density of 1500 kg/m3 is set as an upper limit, it means that on average 91−95 kg of mass could be lost per 1 m3 of buffer material. From the total buffer mass in one deposition hole (20,300−24,300 kg) this mass loss would be approximately 1200–1400 kg (~6 %) assuming average component densities and a nominal hole volume. However, the consequence of the mass loss depends on how local the mass loss is. To give an idea as to how much could be lost locally using the density criterion of 1500 kg/m3, the acceptable mass loss only from ring-shaped blocks and surrounding pellets would be at most 500−700 kg depending on the canister specific design for the ring blocks (see
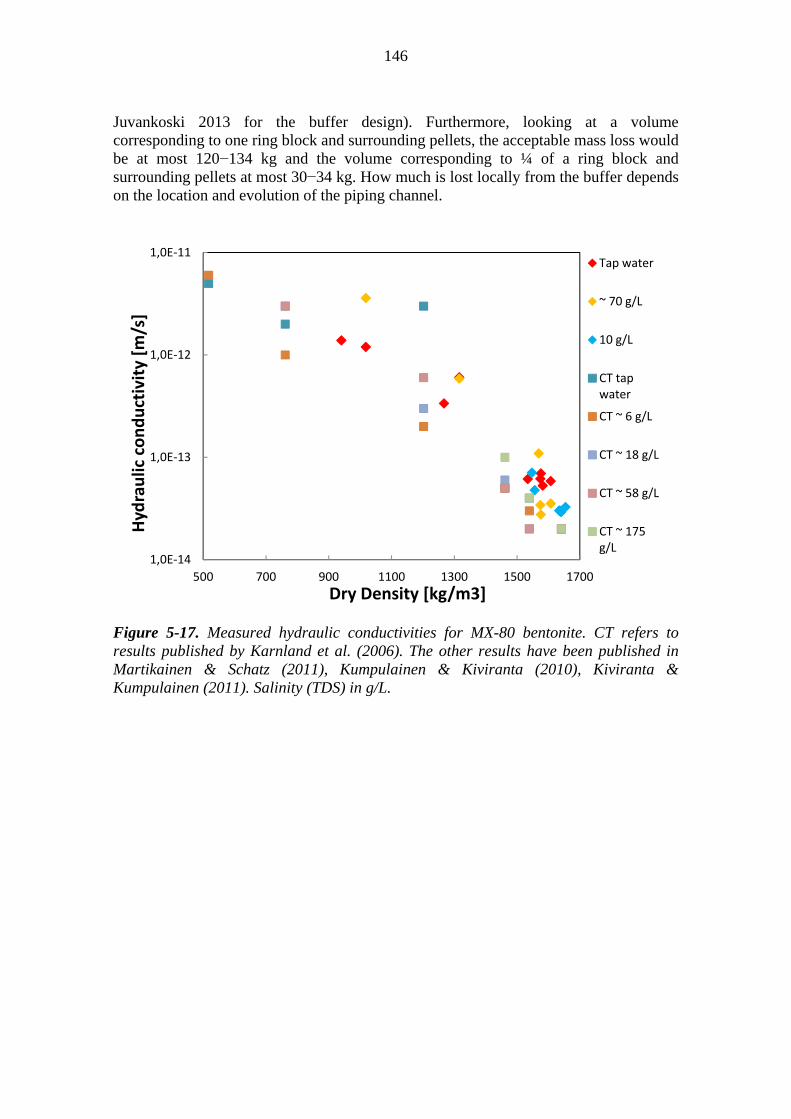
146
Juvankoski 2013 for the buffer design). Furthermore, looking at a volume corresponding to one ring block and surrounding pellets, the acceptable mass loss would be at most 120−134 kg and the volume corresponding to ¼ of a ring block and surrounding pellets at most 30−34 kg. How much is lost locally from the buffer depends on the location and evolution of the piping channel.
Figure 5-17. Measured hydraulic conductivities for MX-80 bentonite. CT refers to results published by Karnland et al. (2006). The other results have been published in Martikainen & Schatz (2011), Kumpulainen & Kiviranta (2010), Kiviranta & Kumpulainen (2011). Salinity (TDS) in g/L.
1,0E‐14
1,0E‐13
1,0E‐12
1,0E‐11
500 700 900 1100 1300 1500 1700
Hydraulic conductivity [m
/s]
Dry Density [kg/m3]
Tap water
~ 70 g/L
10 g/L
CT tap water
CT ~ 6 g/L
CT ~ 18 g/L
CT ~ 58 g/L
CT ~ 175 g/L
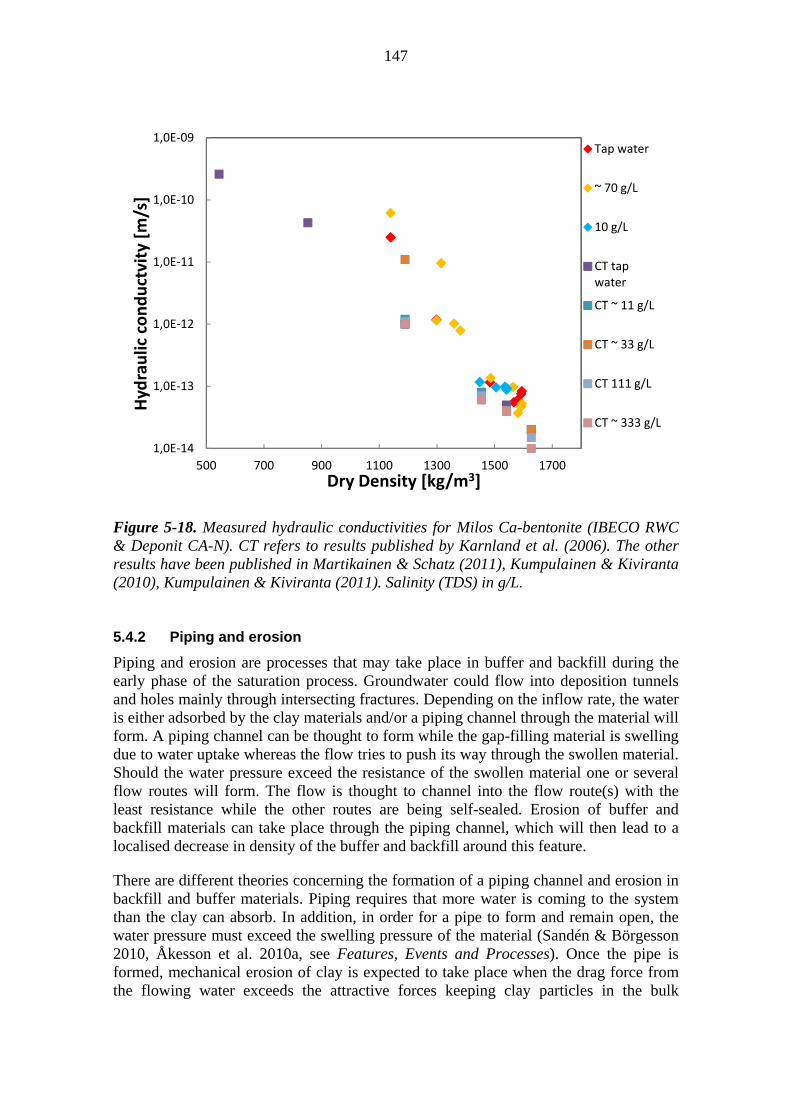
147
Figure 5-18. Measured hydraulic conductivities for Milos Ca-bentonite (IBECO RWC & Deponit CA-N). CT refers to results published by Karnland et al. (2006). The other results have been published in Martikainen & Schatz (2011), Kumpulainen & Kiviranta (2010), Kumpulainen & Kiviranta (2011). Salinity (TDS) in g/L.
5.4.2 Piping and erosion
Piping and erosion are processes that may take place in buffer and backfill during the early phase of the saturation process. Groundwater could flow into deposition tunnels and holes mainly through intersecting fractures. Depending on the inflow rate, the water is either adsorbed by the clay materials and/or a piping channel through the material will form. A piping channel can be thought to form while the gap-filling material is swelling due to water uptake whereas the flow tries to push its way through the swollen material. Should the water pressure exceed the resistance of the swollen material one or several flow routes will form. The flow is thought to channel into the flow route(s) with the least resistance while the other routes are being self-sealed. Erosion of buffer and backfill materials can take place through the piping channel, which will then lead to a localised decrease in density of the buffer and backfill around this feature.
There are different theories concerning the formation of a piping channel and erosion in backfill and buffer materials. Piping requires that more water is coming to the system than the clay can absorb. In addition, in order for a pipe to form and remain open, the water pressure must exceed the swelling pressure of the material (Sandén & Börgesson 2010, Åkesson et al. 2010a, see Features, Events and Processes). Once the pipe is formed, mechanical erosion of clay is expected to take place when the drag force from the flowing water exceeds the attractive forces keeping clay particles in the bulk
1,0E‐14
1,0E‐13
1,0E‐12
1,0E‐11
1,0E‐10
1,0E‐09
500 700 900 1100 1300 1500 1700
Hydraulic conductvity [m/s]
Dry Density [kg/m3]
Tap water
~ 70 g/L
10 g/L
CT tap water
CT ~ 11 g/L
CT ~ 33 g/L
CT 111 g/L
CT ~ 333 g/L

148
structure (Sandén & Börgesson 2010, Åkesson et al. 2010a, Features, Events and Processes). In addition, a downstream location is needed to accommodate the flow. According to Sane et al. (2013), erosion of bentonite is affected by swelling and gel formation at the clay/water interface. Along with an increasing amount of water in the clay structure, the forces keeping the clay particles together weaken and it is then easier for the shear force due to water flow to start transporting the particles downstream of the flow.
Laboratory-scale test data for mechanical erosion of buffer and backfill materials have been presented in Börgesson & Sandén (2006), Sandén et al. 2008, Sandén & Börgesson (2010), Åkesson et al. (2010a), in Features, Events and Processes and in Sane et al. (2013) and Pintado et al. (2013a). In addition, field test data and observations on erosion of backfill blocks and pellets are presented in Dixon et al. (2008a, b, 2011) and in Riikonen (2009). Based on these tests there are several factors that may affect piping and erosion of buffer and backfill materials, such as water inflow rate, water salinity, degree of saturation of the clay, geometrical constraints and settlement by gravity (see Features, Events and Processes). In addition, a tendency for the erosion to decrease with time has been observed in most of the tests. This effect may be due to swelling of bentonite, consequent sealing of the piping holes and/or limitations of the test setup.
Erosive flow is expected to stop when the connected open volume in the deposition tunnel and holes is filled with water and the deposition tunnel plug will stabilise the hydraulic gradient in the deposition tunnel (SKB 2011). In addition, after closure of the repository, the water pressure gradients will even out in the whole repository. It is expected that sealing of piping channels will eventually occur with continued saturation and swelling of the buffer and backfill materials. This process is discussed further in the context of homogenisation after mass loss, see the section below.
Mass loss estimates in deposition holes
Buffer erosion from a deposition hole requires that a fracture (or fractures) intersects the hole and has a sufficient inflow rate as to lead to the formation of a piping channel and erosion. It is likely that such pipes will form in the pellet-filled gap as this is the region with the lowest resistance to flowing water. If piping channels through the pellet-filled gap to the deposition tunnel are formed, erosive flow may lead to subsequent buffer mass loss at least within the pellet-filled gap. Once a channel is formed and water flows in it, the pores in the clay receive by exchange some of the water flowing in a channel nearby. While swelling, the clay turns more to a gel-like material and makes its way to the channel that can accommodate swelling material. The water flowing in the channel transports some of the solid clay material to any downstream location available. There might be several mechanisms by which clay particles detach from the initially larger solid clay body (like a single pellet or a compacted block) and becomes a part of the clay-water suspension flowing in the channel. The mechanisms relevant to repository performance are not known in detail at the moment. However, it is evident that if water is not flowing, it will not transport clay particles.
Measurements have been performed in repository relevant conditions to determine the rate at which clay particles are transported out of the system in suspension by a certain
149
volumetric flow rate. Clay erosion potentially depends on the clay’s water uptake rate, clay swelling rate, flow rate of the water flowing in the channel (i.e. groundwater), chemical composition of the groundwater, and characteristics of the clay-water interfacial area. Since these dependencies are not known in detail, the erosion of clay material is described on a purely empirical basis. Essentially, the eroded clay mass that is transported away by the water flowing through a channel or a system of channels in a specified time interval is expressed as
ms = cs × Qw × t
where
ms = accumulated mass of eroded bentonite (g)
cs = solids concentration (of eroding mass in the effluent (g/L))
Qw = volumetric flow rate of eroding water (L/min)
t = duration of the assessment period (min).
Number of holes affected by piping and erosion
Based on the data presented in Figure 5-4 in Section 5.1.2, the proportion of canister positions with an inflow ≥0.1 L/min into open excavations is 2 % and these locations will be rejected according to the RSC. The proportion of canister positions with an inflow close to 0.01 L/min into open excavations is 12 % and with an inflow ≥0.001 L/min is 35 %. Even some of these locations may be rejected if affected by large fractures.
Therefore it is assumed that at most 1/3 of the canister positions are such that some piping-related erosion cannot be ruled out in the buffer based on the current understanding. This is the same as assuming that inflows <0.001 L/min are either absorbed by the clay or, if a piping channel was formed, it would close before significant erosion took place in the buffer. However, these assumptions remain to be verified with test systems that can produce a pressure up to the expected hydrostatic pressure at repository depth of 4 MPa.
Accumulated volume of eroding water
The potentially accumulated volume of eroding water can be calculated based on the total open volume in the buffer and backfill pellet fill (see details of the design in Section 3.4 and 3.5.1) and in the gaps between the backfill blocks. The rationale for this is that this volume represents the water volume available for erosion. The void volume within blocks and individual pellets is excluded from the open volume calculations because when water enters these voids it leads to saturation and swelling of the clay, which is a counterforce to erosion. The pellet and gap related void volume is ~620 m3 assuming a tunnel length of 350 m for a theoretical cross-section of 14 m2 (OL1−3) with an average over-break of +18 %. If some plug leakage is taken into account (for example +20 %, see e.g. Sane et al. 2013), the maximum accumulated volume of eroding water in a tunnel, is estimated to be ~740 m3. It should be noted that this approach does not take into account any swelling in the buffer or backfill materials.
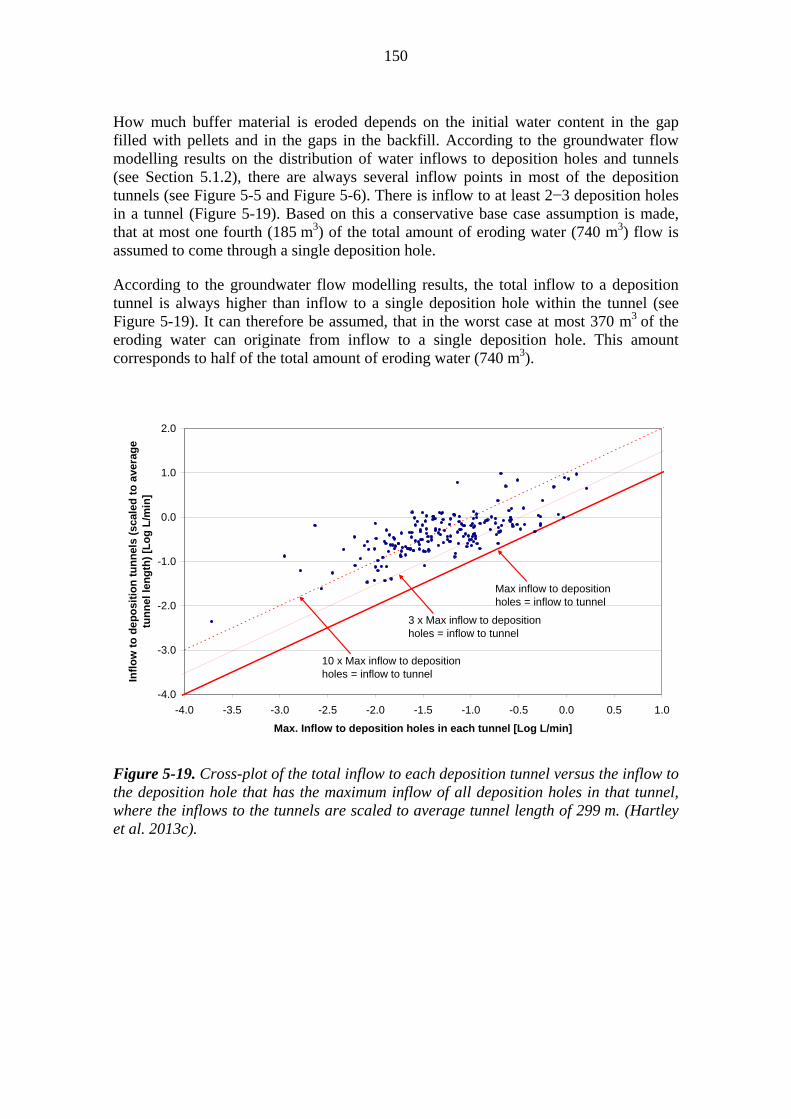
150
How much buffer material is eroded depends on the initial water content in the gap filled with pellets and in the gaps in the backfill. According to the groundwater flow modelling results on the distribution of water inflows to deposition holes and tunnels (see Section 5.1.2), there are always several inflow points in most of the deposition tunnels (see Figure 5-5 and Figure 5-6). There is inflow to at least 2−3 deposition holes in a tunnel (Figure 5-19). Based on this a conservative base case assumption is made, that at most one fourth (185 m3) of the total amount of eroding water (740 m3) flow is assumed to come through a single deposition hole.
According to the groundwater flow modelling results, the total inflow to a deposition tunnel is always higher than inflow to a single deposition hole within the tunnel (see Figure 5-19). It can therefore be assumed, that in the worst case at most 370 m3 of the eroding water can originate from inflow to a single deposition hole. This amount corresponds to half of the total amount of eroding water (740 m3).
Figure 5-19. Cross-plot of the total inflow to each deposition tunnel versus the inflow to the deposition hole that has the maximum inflow of all deposition holes in that tunnel, where the inflows to the tunnels are scaled to average tunnel length of 299 m. (Hartley et al. 2013c).
-4.0
-3.0
-2.0
-1.0
0.0
1.0
2.0
-4.0 -3.5 -3.0 -2.5 -2.0 -1.5 -1.0 -0.5 0.0 0.5 1.0
Max. Inflow to deposition holes in each tunnel [Log L/min]
Infl
ow
to
de
po
siti
on
tu
nn
els
(sca
led
to
ave
rag
e tu
nn
el l
eng
th)
[Lo
g L
/min
]
Max inflow to deposition holes = inflow to tunnel
10 x Max inflow to deposition holes = inflow to tunnel
3 x Max inflow to deposition holes = inflow to tunnel

151
Solid content of the effluent
The erosion rate (mass-liquid rate) cs, can be estimated based on experimental data. The general conclusions from erosion tests performed by Posiva (Sane et al. 2013 and Pintado et al. 2013a) and by SKB (Börgesson & Sandén 2006) on buffer and backfill materials are that the erosion rate depends on the salinity of the water and the material properties (e.g. density and degree of saturation). In addition, a clear tendency for the erosion rate to decrease with time has been observed in many of the tests. The peak concentrations measured from the discharged water in some of the first small-scale tests performed by Posiva were quite high, up to 120 g/L (Sane et al. 2013). However, in the further small-scale tests with test conditions and initial buffer material properties corresponding better to the conditions in a KBS-3V repository, the peak concentrations were only up to 25 g/L (Sane et al. 2013). In addition, in larger-scale tests (transparent cell tests with diameter 350 mm and height 800 mm), the peak concentrations remained below 30 g/L (Pintado et al. 2013a). An example of erosion rates measured in transparent cell tests (by Pintado et al. 2013a) with saline water (35 g/L) is shown in Figure 5-20. As can be seen from the figure, the peak concentrations were up to 18 g/L and in the steady state <4 g/L.
The eroded mass loss should be estimated based on long-term erosion rates that take into account both the peak concentrations at the beginning of the test and the steady state concentrations. The total mass that erodes during an experiment can be estimated by numerical integration of the measured erosion rate (g/L) vs. the accumulated water flow (l). The numerical integration is performed by linearly interpolating between measurement points. Dividing the total eroded mass by the total elapsed time of the experiment provides an upper limit for the long-term average erosion rate, since erosion rates are reliably observed to decrease with time. Applying this method of estimating the long-term averages to the preliminary results from the transparent cell tests by Pintado et al. (2013a), the average erosion concentrations were <4 g/L with a water salinity of 35 g/L (TDS) and <1 g/L for a water salinity of 10 g/L (TDS). The latter value corresponds to the observations from the LASGIT (Large Scale Gas Injection Test) field tests by SKB, where the erosion rate was ~1 g/L for an inflow rate of 0.1 L/min (Börgesson & Sandén 2006). Taking into account the current salinity levels in ONKALO (see Section 5.1.3), the 1 g/L concentration of eroding mass, cs, is the most likely case and is considered as the base case. However, to address uncertainties, variant cases with the mass loss described by cs values of 2, 4 and 10 g/L are also calculated.

152
Figure 5-20. Erosion rate of a transparent cell erosion test. Test set-up: three stacked 35 cm diameter compressed bentonite blocks inside an acrylic sample cell through which an erosive solution flowed at a flow rate of ~0.9 L/min (salt concentration 35 g/L), Pintado et al. (2013a).
The results for the total mass loss in kg are plotted in Figure 5-21a for the chosen cs
(solids concentration of eroding mass) and Vw (amount of eroding water) values. In the base case with water volume (Vw) of 185 m3 from a single deposition hole and a cs value of 1 g/L, the total mass loss from the buffer is 185 kg. Even in the extreme case of ½ of the total amount of eroding water from a single deposition hole, the erosion would remain below 400 kg. Considering other cs values for the variant cases, the corresponding mass losses are 2, 4 and 10 times larger.
The effect of the mass loss on the buffer dry density is presented in Figure 5-21b. In the base case the effect of mass loss (185 kg) on the buffer bulk density is insignificant (for example 1592 → 1579 kg/m3 in OL1−2 case). Considering also the variant cases, the dry density of the buffer remains in the majority of the cases > 1500 kg/m3. With the highest considered solids concentration of 10 g/L, the amount of water passing through the buffer would need to be ~130 m3 before the dry density would drop below 1500 kg/m3. Even the combination of worst cases (Vw of 370 m3 and cs of 10 g/L), the buffer bulk dry density would fall only to 1340 kg/m3. This would mean a significant drop in swelling pressure, but the hydraulic conditions would still remain largely non-advective.
These results are independent of the number of piping channels, since the erosion depends only on two factors: amount of water and erosion rate.
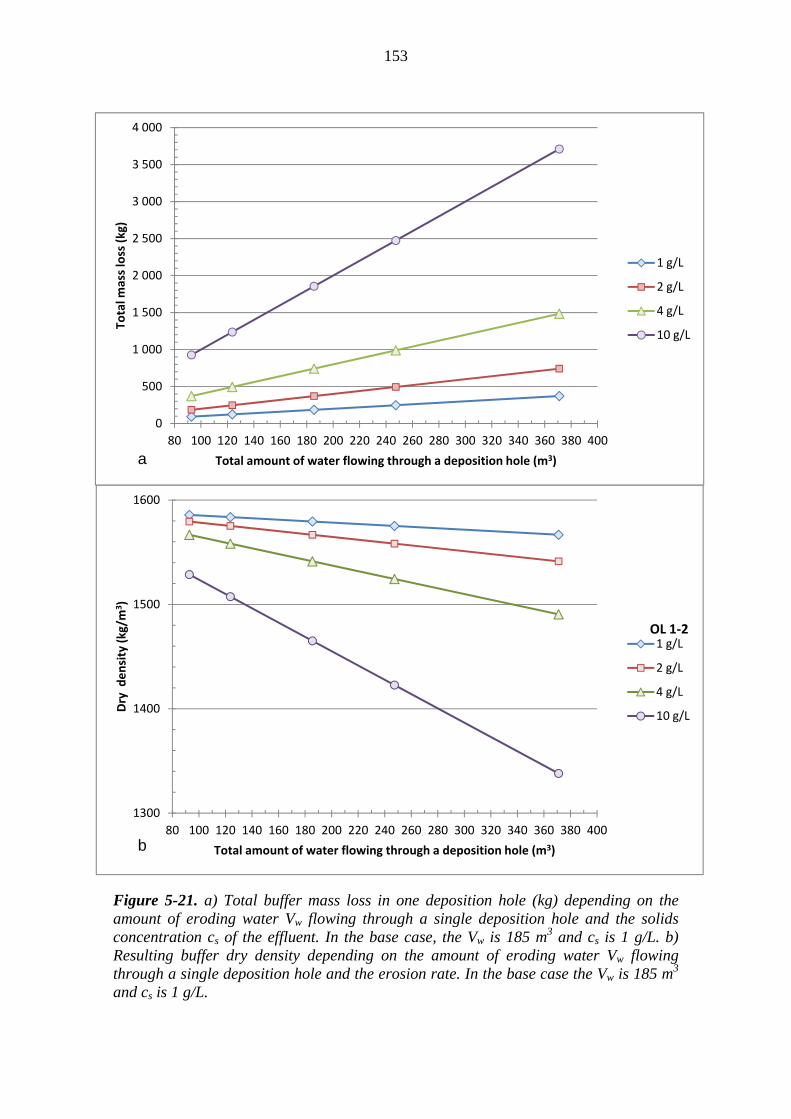
153
Figure 5-21. a) Total buffer mass loss in one deposition hole (kg) depending on the amount of eroding water Vw flowing through a single deposition hole and the solids concentration cs of the effluent. In the base case, the Vw is 185 m3 and cs is 1 g/L. b) Resulting buffer dry density depending on the amount of eroding water Vw flowing through a single deposition hole and the erosion rate. In the base case the Vw is 185 m3 and cs is 1 g/L.
0
500
1 000
1 500
2 000
2 500
3 000
3 500
4 000
80 100 120 140 160 180 200 220 240 260 280 300 320 340 360 380 400
Total m
ass loss (kg)
Total amount of water flowing through a deposition hole (m3)
1 g/L
2 g/L
4 g/L
10 g/L
1300
1400
1500
1600
80 100 120 140 160 180 200 220 240 260 280 300 320 340 360 380 400
Dry density (kg/m
3)
Total amount of water flowing through a deposition hole (m3)
OL 1‐21 g/L
2 g/L
4 g/L
10 g/L
a
b

154
Comparison to results presented in SR-Site
Another way to assess the mass loss is to use the correlation based on laboratory-scale erosion tests for buffer and backfill materials by Börgesson & Sandén (2006), Sandén et al. (2008) and Sandén & Börgesson (2010). One outcome of these tests is that the cumulative mass loss scales with the cumulative volume flow of water. Based on the results, saturation-induced swelling at larger cumulative volume flow of water seems to cause an exponential decay in the erosion rate, but no conclusions could be drawn on the dependency of cumulative mass loss on the distance between the water inlet and outlet, length of the flow channel, size of the flow channel or characteristics of pellets. Figure 5-22 shows that the measured erosion falls within a discrete range of fitting lines with a constant exponential factor of α = 0.65, whereas in the case of constant erosion α would be 1. This approach takes into account the decrease in erosion with time and accumulated water inflow and the mass loss is calculated according to the following expression (Åkesson et al. 2010a).
Figure 5-22. Erosion test results for tests performed in the vertical direction (Sandén & Börgesson 2010). MX-80 and Cebogel QSE are commercial names for bentonite pellets. Inst. Technique refers to the test set-up used.

155
ms = β × (mw)α , where
ms = accumulated mass of eroded bentonite (g)
mw = accumulated mass of eroding water (g)
β = parameter defined by the level of erosion at a certain accumulated water flow
α = parameter defined by the inclination of the straight line relation on a log-log plot.
According to Åkesson et al. (2010a) the parameter α is not very much affected by the test material or conditions and is 0.65. The parameter β depends on material type, salt content, water ratio, geometry, and grain-size distribution of the pellet filling. In tests made in horizontal direction, the parameter β varies from 0.02 to 2.0 and in vertical direction from 0.02 to 0.2 (Åkesson et al. 2010a, Sandén & Börgesson 2010). Because the erosion in deposition holes would take place in a vertical direction, the latter values are used for assessing the maximum loss from a deposition hole.
The two approaches presented in this section are compared in Figure 5-23. Considering the Vw of 185 m3, the mass loss using the approach used in SR-Site is from 4.7 kg up to 47 kg (for β 0.02−0.2). This estimate is roughly four times less than for the other method that considers only parameters cs and Vw. The main reason is how the time-effect is taken into account in the calculations. Based on Figure 5-23 it can be seen that, in the ranges of accumulated water flows tested (i.e. up to roughly 1 m3), both equations estimate the accumulated mass of eroded material to be in the same order of magnitude. Test results do though fit better with the mathematical expression given in the second equation than with the more heuristic first one. In the ranges of accumulated water flows not accessed experimentally (i.e. up to several hundreds of m3) the mass loss estimates obtained differ by more than an order of magnitude. Based on this, the lack of time-effect in the formula (ms = cs × Vw) may produce overly conservative results. If the time-effect is taken into account, the results should be corrected with an exponential factor n:
ms = cs × Vwn.
It can be estimated that the value of the factor n may be somewhere between 0.65−1. To increase reliability and accuracy in the fitting of the exponential factor, long-term experiments at a larger scale will be set up in the next research period 2013−2015.
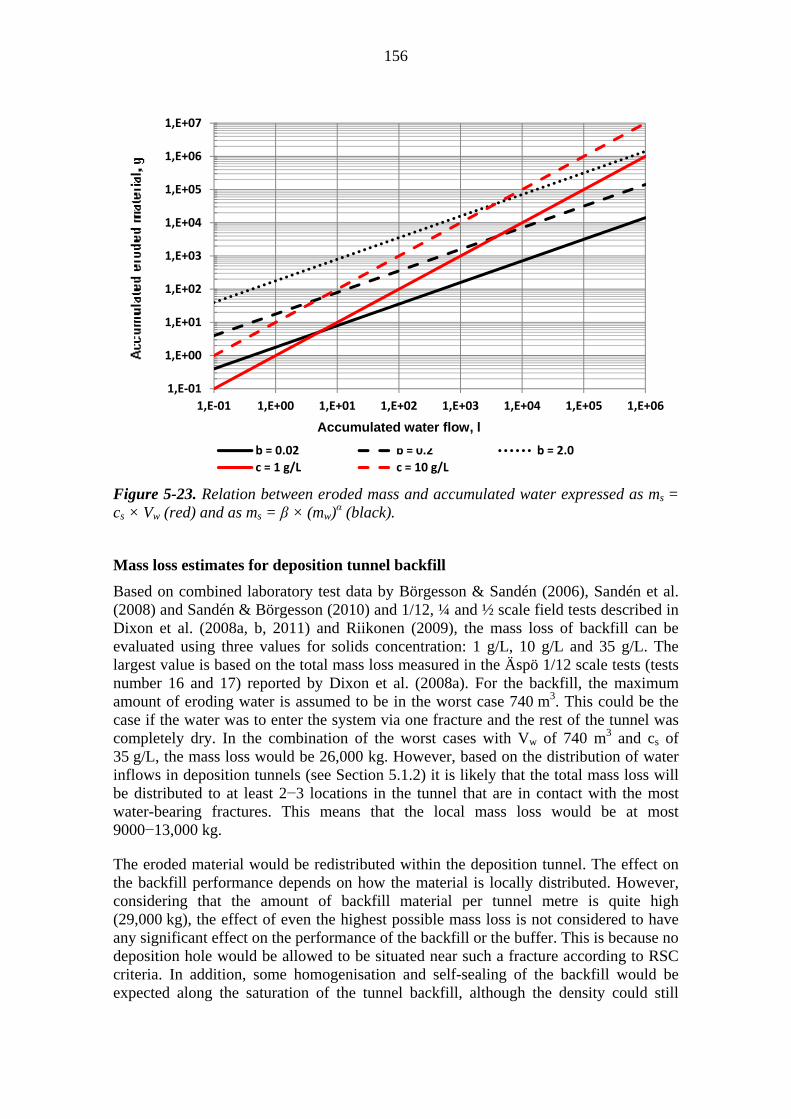
156
Figure 5-23. Relation between eroded mass and accumulated water expressed as ms = cs × Vw (red) and as ms = β × (mw)α (black).
Mass loss estimates for deposition tunnel backfill
Based on combined laboratory test data by Börgesson & Sandén (2006), Sandén et al. (2008) and Sandén & Börgesson (2010) and 1/12, ¼ and ½ scale field tests described in Dixon et al. (2008a, b, 2011) and Riikonen (2009), the mass loss of backfill can be evaluated using three values for solids concentration: 1 g/L, 10 g/L and 35 g/L. The largest value is based on the total mass loss measured in the Äspö 1/12 scale tests (tests number 16 and 17) reported by Dixon et al. (2008a). For the backfill, the maximum amount of eroding water is assumed to be in the worst case 740 m3. This could be the case if the water was to enter the system via one fracture and the rest of the tunnel was completely dry. In the combination of the worst cases with Vw of 740 m3 and cs of 35 g/L, the mass loss would be 26,000 kg. However, based on the distribution of water inflows in deposition tunnels (see Section 5.1.2) it is likely that the total mass loss will be distributed to at least 2−3 locations in the tunnel that are in contact with the most water-bearing fractures. This means that the local mass loss would be at most 9000−13,000 kg.
The eroded material would be redistributed within the deposition tunnel. The effect on the backfill performance depends on how the material is locally distributed. However, considering that the amount of backfill material per tunnel metre is quite high (29,000 kg), the effect of even the highest possible mass loss is not considered to have any significant effect on the performance of the backfill or the buffer. This is because no deposition hole would be allowed to be situated near such a fracture according to RSC criteria. In addition, some homogenisation and self-sealing of the backfill would be expected along the saturation of the tunnel backfill, although the density could still
1,E‐01
1,E+00
1,E+01
1,E+02
1,E+03
1,E+04
1,E+05
1,E+06
1,E+07
1,E‐01 1,E+00 1,E+01 1,E+02 1,E+03 1,E+04 1,E+05 1,E+06
b = 0.02 b = 0.2 b = 2.0
c = 1 g/L c = 10 g/L
Accumulated water flow, l

157
remain lower locally in the section with the highest mass loss. If the total mass loss is calculated over a longer tunnel section (say, 10 m which is the average distance between deposition holes), the mass loss of backfill is less than 10 % in bulk terms. Should there be a 10 % drop in the bulk dry density (from the average density of 1760 kg/m3 to 1580 kg/m3) the hydraulic conductivity remains < 110-10 m/s (see Figure 6-26), thus still meeting the performance targets of the backfill. Thus this mass loss can be considered negligible.
Uncertainties
So far, the mass loss estimations are based on laboratory experimental data. There is a need to verify the long-term erosion rates with further tests to increase statistical reliability and develop and verify theoretical models. The larger scale tests (Dixon et al. 2008a, b, 2011, Riikonen 2009) have shown that other processes not seen in the smaller scale tests can have an effect on the system behaviour, e.g. collapse of the open backfill front due to wetting and gravity. Therefore, further larger scale tests have been planned for the research period 2013−2015.
A simplified approach is used to estimate buffer and backfill mass loss. Water will simultaneously start wetting the buffer and backfill materials as well as filling the empty voids in the pellet system. Thus the amount of erosive water would be smaller, as the swelling bentonite will fill some of the void spaces that were used to estimate the potential volume of erosive water. Nonetheless, the processes and conditions in which piping and erosion cease will be studied during the next research period 2013−2015.
Early saturation of backfill block and pellet system has been studied at Äspö (Sweden) and in Riihimäki (Finland) up to half tunnel scale (Dixon et al. 2008a, b, 2011, Riikonen 2009). However, the erosion has not been recorded consistently in these tests and the observations apply better to the conditions during installation of the backfill than to the steady state after the sealing of the tunnels.
5.4.3 Summary, uncertainties and issues that need propagation
Piping and erosion of the buffer and backfill material will imply that some buffer and backfill will be lost.
Based on the inflow data for potential canister positions, roughly 1/3 of the positions are such that some buffer mass loss by piping and erosion is expected, without however endangering the safety functions of the buffer.
In the base case, ¼ (Vw = 185 m3) of the total amount (740 m3) of eroding water is assumed to come through a single deposition hole, and solids concentration in the eroding water (cs) is assumed to be 1 g/L. With these assumptions, the buffer mass loss is 185 kg. This mass loss is not assumed to have a significant effect on the buffer properties. Even in the variant cases with cs up to 4 g/L and Vw up to 370 m3, the average buffer dry density remains at such a level that no drastic changes are expected in the hydraulic conductivity or the swelling pressure of the buffer. However, the consequences depend also on how local the mass loss is. Based on experimental observations, the mass loss is expected to take place around a piping
158
channel. More information is needed on this issue as well as on the homogenisation after the mass loss.
For the backfill, at most 13,000 kg would be locally lost by piping and erosion, but the eroded material would be redistributed within the deposition tunnel. The effect on the backfill performance depends on how the mass loss would be distributed in the backfill. For example, if all of the 13,000 kg were lost from a tunnel section of 1 m, the mass loss would have a significant effect on the backfill density at this location. Such an event could perhaps be possible in the vicinity of a fracture with a high enough inflow to transport all this mass further down in the tunnel. It can be reasoned that this type of erosion would still not be detrimental to the performance of the EBS, since no deposition holes would be allowed to be situated near such a fracture. In addition, some homogenisation and sealing of this cavity would be expected along with the saturation of the tunnel backfill, although the density could still remain lower at this section. In case the total mass loss is calculated over a longer tunnel section (>10 m, corresponding to the average distance between deposition holes), the effect of the mass loss on backfill performance is considered negligible.
The mass loss estimations for piping erosion are based on experimental data and the way of estimating the mass loss is a simplified approach. The processes and conditions in which piping and erosion cease will be studied during the next research period 2013−2015.
In conclusion, the buffer and backfill will maintain their performance targets even considering the process of piping and erosion. The remaining uncertainties relating to a situation with loss of buffer in a deposition hole are addressed in the formulation of radionuclide release scenarios.
5.5 Geochemical evolution of the buffer and backfill
5.5.1 Overview and performance targets potentially affected
Drainage of groundwater to the open tunnels will influence the geochemical composition of the groundwater, as outlined in Section 5.1, although major inflows will be controlled during construction and operation to limit disturbances to the flow and geochemical conditions in the rock. The geochemical changes will strongly depend on local flow conditions that may induce inflow of more dilute and less reducing waters from shallower levels. Also, at some locations upconing of more saline waters may occur. Salinity changes therefore have the potential to affect the swelling pressures and hydraulic conductivities of buffer and backfill in the case of very high salinities or, in the case of very low ones, favour colloidal erosion of the emplaced clay materials.
Introduction of molecular oxygen into the repository system may oxidise Fe(II)-bearing minerals and thus potentially weaken the reducing capacity of the rock around the tunnels and also of the EBS after emplacement. The redox conditions and the chemical composition of the groundwater, in particular pH, pCO2, sulphate and sulphide, will also be affected by mixing of more dilute groundwater into the repository system and by microbial processes as a result of degradation of organic stray materials, organic additives (e.g. superplasticisers) from cement structures, humic substances (remobilised by the physical and geochemical disturbances) and organic matter in the backfill. In

159
addition, alkaline leachates from the grouting of fractures, the grout stabilising the rock bolts and from the deposition tunnel plugs will locally increase the pH in the groundwater. Corrosion of rock bolts and other iron materials and precipitation of corrosion products and salts will also influence the redox geochemistry.
In the following, the relevant processes to consider are described for the excavation and operational period during and after EBS emplacement. In this section, only short-term processes after EBS emplacement are evaluated, such as for example oxygen consumption in the near-field. Longer term geochemical processes as result of the heating and slow diffusional exchange with the groundwater are treated in the post-closure evolution sections (Sections 6.5 and 6.6).
5.5.2 Oxygen depletion and changes in pH
From a long-term safety viewpoint, changes in O2, pH and sulphide are of potential concern because they can enhance canister corrosion. The impact of microbes with regard to O2 is beneficial because aerobic biodegradation quickly consumes O2 in the tunnel environment and the surrounding rock (Puigdomenech et al. 2001). The production of CO2 and increase in pCO2 affects pH which however is buffered by CaCO3 dissolution. Moreover, alkaline leachates from cementitious materials locally may add to the alkalinity of the groundwater. The main concern arises from the sulphide generated from microbially-induced sulphate reduction.
The main mass of oxygen will be introduced as residual air in the partially saturated buffer and backfill. The amount of O2 in the buffer is about 16−20 moles per deposition hole depending on the canister type (see Table 3-7). According to the estimates in Table C.3-1 of Appendix C, there are 37.8 mol of O2 per metre of backfill. Assuming that the distance between deposition holes (9 m) is the section of backfill that can be attributed to each canister, the backfill amount of O2 is 340.2 moles. Therefore, the total amount of O2 per canister is about 360 moles, most of which is in the backfill. From a mass balance perspective, the O2 mass in the backfill potentially could corrode several mm of the canister assuming that all of O2 inventory in the backfill diffuses to the canister lid (Appendix C). However, as described previously (e.g. Wersin et al. 1994, 2003, Grandia et al. 2006), most of the molecular O2 will react with reducing minerals, such as pyrite and siderite in the buffer and backfill. Moreover, part of it will diffuse out into the rock where it will be consumed by microbial processes. Aerobic microbial degradation might also occur in the backfill during saturation, which would enhance the rate of O2 consumption, but there is considerable uncertainty with regard to microbial activity in this material.
The consumption rate of oxygen by pyrite oxidation in the backfill has been assessed by bounding calculations (Appendix C) using well-established weathering rates in the literature. The rate of oxidation depends on O2 concentrations, pH, pyrite surface area and moisture content. Under saturated conditions, the time for O2 consumption, based on the rate expressed of Williamson & Rimstidt (1994) and pyrite surface areas of 0.12−1.2 m2/g, is very rapid (0.2−2 days) which is consistent with the calculations of Grandia et al. (2006). The fast reaction rate of O2 with pyrite is supported by a number of other reported experimental data.

160
It should be noted that considerably lower oxidation rates have been derived for pyrite coated with ferric hydroxide (Nicholson et al. 1988, 1990) using a “shrinking core” model, which was also applied in the early assessment of Wersin et al. (1994). This model assumption is not realistic for the near-field environment, as also discussed by Puigdomenech et al. (1999), and hence the proposed oxidation rates of Wersin et al. (1994) yield excessively long time scales for O2 depletion.
Under non-saturated conditions, there are fewer reliable data available for pyrite oxidation. Generally speaking, reported rates tend to be higher because of the higher availability of O2 in the gaseous phase and the resulting larger concentration gradients (e.g. Morin 1993). But because of this fact, reported rate data often reflect mixed rates including both O2 transport and chemical oxidation. On the basis of experimental data of Welch et al. (1990), Xu et al. (2000) propose that the (chemical) pyrite oxidation rate reaches a maximum rate at a water saturation of 0.4 and shows a linear decrease at lower and higher moisture contents.
The data of Jerz & Rimstidt (2004) indicated an initial reaction rate slightly faster than that in water, but a slowing down of the reaction with time, which was explained by the build up of a secondary Fe(II) sulphate surface layer. Due to this slowing down effect, this derived rate expression yields a rather slow oxidation rate compared with other reported rates (e.g. Morth & Smith 1966). Applying the rate expression proposed by Jerz & Rimstidt (2004) for the backfill results in a time frame of about 3 years for the lower assumed pyrite surface area and a factor of 100 times less (about 10 days) for the high surface area case (see Appendix C).
The bounding calculations described here are based on experiments carried out at room temperature. The backfill will experience slightly higher temperatures (max. 50 °C) during the first few hundreds to thousands of years after emplacement. The diffusive flux will be somewhat enhanced concomitantly with pyrite oxidation rates. Thus, it is expected that the overall effect on copper corrosion will be small.
Contrary to the backfill, pyrite contents in the buffer are low and variable, depending on the processing and storage procedures prior to emplacement which may oxidise part of the pyrite. If no pyrite at all is present in the buffer and if it is assumed that all O2 is consumed by the canister surface for a non-saturated case, then the depletion is estimated to be in the range of about 6−60 years for (oxic) copper corrosion rates of 5−0.5 m/a. The overall corrosion depth from O2 in the buffer can be estimated around to be about 30−300 microns. Since the amount of initial oxygen in the buffer is also small (about 20 moles/canister), the O2 contribution from the buffer to copper corrosion is negligible (Appendix C). Biodegradation processes will increase the rate of O2 consumption. The influence of biodegradation processes on pH and pCO2 is difficult to predict and has not been assessed in quantitative terms. However, from the limited amounts of organic materials and the pH buffering provided by the calcite in the system, no significant changes in the pH are expected. After EBS emplacement, reducing conditions in the near field will be established once the residual O2 in the fractures close to the deposition tunnel and deposition holes and, more importantly, in the pores of the buffer and backfill has been depleted by abiotic and microbial processes, as outlined above. The time scales for oxygen depletion after EBS emplacement will be short, maximum a few years. The effect of previously formed precipitates in the backfill and

161
in the EDZ of the near-field rock, such as ferric oxyhydroxide, calcite and perhaps some gypsum on the geochemical evolution is minor, given their limited mass.
In summary, the disturbance induced during the excavation and operational period is expected to have only a limited effect on the geochemistry of the near field after EBS emplacement. Oxygen in the buffer and in the backfill will be quickly (a few years at most) depleted via biodegradation processes or pyrite oxidation (mostly in the backfill).
5.5.3 Formation of colloids
The main mass of colloidal materials will be introduced by emplacement of the clays in the buffer and backfill. Similarly to the natural groundwater colloids and cementitious colloids, the introduced colloids arising through degradation of EBS materials are expected to be present at only low concentrations in the high ionic strength groundwaters during the operational phase.
Thus, chemically-induced colloid generation during the very initial post-closure period when swelling of the smectite will start will be very limited.
The generation of colloids during the intrusion of dilute glacial meltwaters due to chemical erosion of the buffer and backfill materials is discussed in Section 7.5.2.
The evolution of the population of introduced colloids, especially those associated with the degradation of repository materials, and their mobility and stability under changing groundwater conditions is not yet well defined. E.g., for colloids generated at the bentonite buffer/host rock interface, little is known, and the natural analogue data and laboratory results are somewhat contradictory (Alexander et al. 2011). Little of relevance exists from URL studies to date – although in the Äspö Colloid Project, bentonite colloids were shown to be unstable in the high ionic strength deep Äspö and Olkiluoto groundwaters (Laaksoharju & Wold 2005) and so the concentrations were also as low as those in the natural groundwater. Bentonite colloids in low ionic strength groundwaters are currently being addressed in the CFM (Colloid Formation and Migration) project in Grimsel (see www.grimsel.com).
The few relevant examples of the potential impact on radionuclide transport associated with colloids indicate that the retardation of colloids (and associated radionuclides) appears to be efficient – but, it must be emphasised, there is currently little mechanistic understanding of the processes (straining/sieving, attachment to fracture faces etc.) involved (see Alexander et al. 2011 for a detailed discussion).
5.5.4 Effect of cementitious leachates on the near field
The overall effects of cementitious leachates on the repository system can be conceptualised in terms of the following processes: release of cement leachates into porewater of cementitious material and the entrainment of the cementitious materials’ porewater by groundwater, transport of cement leachates and their interaction with rock minerals, and potentially harmful interaction of the leachates with clays in the buffer and backfill.
In ONKALO, standard cement has been used above the HZ20 fracture zone which is located approximately at a depth of 300 m. Beneath this feature, low-pH grout has been

162
systematically used except for rock bolt grout. Assuming that the grout will gradually degrade and release alkaline leachates, the buffer/backfill interaction with alkaline leachates will be determined to a large extent by the ability of groundwater flow to transport the alkaline leachate plume through the fracture network to the disposal rooms. The flux of alkaline waters that might reach the EBS and interact with the clays is affected by the complexity of the hydraulic and chemical system and the uncertainties related to the precipitation kinetics and the nature of the newly formed phases.
No cementitious materials are allowed in the deposition hole. Cementitious materials are however, used in the deposition tunnels, such as in the end plug, rock bolts and grouting of fractures, and thus leachates from these may locally affect the backfill.
Leaching of cementitious materials
The leaching of cementitious materials depend on several factors related, on the one hand, to the cementitious material, such as the intrinsic porosity and the permeability of the cementitious material, its composition and utilised grouting technique, and, on the other hand, on groundwater composition (salinity and pH) and flow. Slow but continuous leaching is an unavoidable process once groundwater is in contact with cementitious materials.
To avoid significant disturbance to natural groundwater pH conditions, and hence to the EBS, low-pH cementitious materials giving alkaline leachates of pH < 11 or silica sol (colloidal silica) are utilised near the disposal depth. Also, pumping of the groundwater flowing into the open excavations carrying the most aggressive alkaline leachates produced during the early stages of grout leaching (Figure 5-24) limits any disturbance caused by cement.
There is a general agreement that the leaching takes place in a staged degradation process as illustrated in Figure 5-24. For low-pH cementitious materials, chemical evolution is somewhat different, as the first stage does not occur and the second stage (leaching of Ca-hydroxide) is very limited. The reason for that is the absence or very small content of portlandite (i.e. the addition of silica fume leads to the formation of CSH (calcium silicate hydrate) phases with a lower Ca/Si ratio than in ordinary Portland cement (OPC) or standard cement paste). Therefore, the expected evolution for the degradation of the low pH cement starts at some point at the end of the second stage de-picted above, with initial pH values around 12 and decreasing as degradation proceeds.
Leachate pH values for various cementitious grouts in Olkiluoto groundwater simulants in batch tests in the laboratory have been reported in Arenius et al. (2008, p. 85-86), and the evolution of low-pH and standard grouts in a fracture has been simulated by reactive transport modelling (Soler 2010, 2011). The results of the evolution of porewater pH at the grout-groundwater interface based on the reactive transport modelling are shown in Figure 5-25 for a standard and low-pH grouts distinguished by different Si/Ca ratios. The modelling results suggest that the alkaline leachates will be both spatially and temporally limited. They are qualitatively supported by the leaching tests (Arenius et al. 2008, p. 85-86), and the monitoring of boreholes in ONKALO. The early dissolution of alkalis has been observed at ONKALO in some of the monitoring boreholes drilled into grouted areas during at least three years, although the pH gradually decreases towards

163
the value observed in other boreholes not affected by grouting (pH ~8) (Arenius et al. 2008, p. 63-65). Other monitoring boreholes showed pH reaching natural groundwater pH levels relatively fast, even though a large amount of cement is present in the surroundings of these holes (Arenius et al. 2008). This suggests that the zone affected by the alkaline leachates remains limited in the sparsely fractured Olkiluoto bedrock.
Figure 5-24. Estimation of pH evolution of ordinary cement pore fluid (from Cau Dit Coumes et al. 2006). Time is logarithmic scale. CSH: calcium silicate hydrate.
Figure 5-25. Predicted evolution of pH at grout-water interface for standard and low pH grouts used in ONKALO (Soler 2011). The groundwater salinity in these simulations was approx. TDS = 10.5 g/L and the temperature 25 °C. The thick black vertical line is at 219 days representing the end pH in the leaching tests with strandrad grout and low-pH grout (discussed in Arenius et al. 2008).
0,0001 0.001 0.01 0.1 1 10 1009
9.5
10
10.5
11
11.5
12
12.5
time [a]
pH
Groundwater-cement interface
standard grout
low-pH grout

164
When cementitious materials used in ONKALO are in contact with groundwater alkalis (Na+, Ca2+ and K+), Si, SO4
2- and OH- are leached (Cau Dit Coumes 2006, Arenius 2008, Appendix 1, p. 222-231, and Lehikoinen 2009, Appendix 2, p. 32-34). In addition, there are indications that Mg2+ and Cl- from groundwater are taken up by the cement and a small amount of Cl- may be released later on (Arenius 2008, Appendix 1, p. 225-233). The release of Na+ and K+ takes place at a very early stage. With respect to the natural Olkiluoto groundwater concentrations, only K+ displays a considerable increase in relative terms (from 50 % to 100 % increase, which still means a low concentration of K+ as the concentration of K+ is very low in the Olkiluoto groundwaters (see Chapter 3). For Na+ the relative change is in the order of 1 %, for Ca2+, the increase is in the order of 15 % for standard cement and <1 % for low-pH materials (see Penttinen et al. 2011 and Lehikoinen 2009). Thus none of these have any large impact on the total alkali concentration of the natural groundwater in the host rock.
In terms of Si, standard cement binds added silica in such a way that the releases remain slow, i.e. the increase of Si in groundwater due to cement leaching remain in the range of 0.5−2 % whereas for low-pH cement masses the increase is about 10 % (Arenius et al. 2008, Appendix 1).
The most important increase is in the OH- concentration with respect to the prevailing groundwater conditions. The increases are 2−4 orders of magnitude and these increases are a priori noteworthy regarding clay stability.
The release of OH- during the operational period is differentiated from other periods by a pH clearly above 10. This is the case particularly for cementitious masses with only a little added silica used above the HZ20 and these conditions last the whole operational period. According to the simulations regarding low-pH masses with added silica, pH will drop below 10 within the first few decades at the latest.
Transport of leachates in the rock
Soler (2010) included the hydration and simultaneous leaching of the grout through diffusive exchange between the porewater in the grout and the flowing water in the fracture. Based on the modelling the precipitation of CSH, and in some cases also ettringite, is responsible for this fast sealing of porosity. This is caused by the mixing by diffusion of a high-pH Ca-rich solution from the grout and a Si-rich solution from the rock (plagioclase dissolution). Moreover, he concluded that the formation of alkaline leachates is extremely limited when low-pH grout is used. Even when using a grout with a lower silica fume content (i.e. “standard grout”), the extent and magnitude of the alkaline leachates are rather minor. These results are in a qualitative agreement with monitoring at ONKALO. Also if Mg is present, precipitation of brucite (Mg(OH)2) occurs at the grout-fracture interface (Soler 2011). In the longer term, the results show a gradually decaying pH tail (pH greater than that of Olkiluoto groundwater), which is controlled by the precipitation of calcite at the grout-fracture interface. The duration of this low-pH tail correlates inversely with the carbonate content of the inflowing groundwater.

165
Hydrogeology of the operational period is characterised by relatively high gradients towards excavations and migration of solutes over short distances. Some of the leachates migrating into the excavations will be removed from the repository system. Transport of leachates to deposition holes and tunnels from excavations above the HZ20 system is mostly constrained by this hydraulic feature.
Note that the composition of cement leachates evolves with time due to the alteration of cement, and the reactions between the fracture minerals and the alkaline leachates, which, in particular for the sources far away from the repository, will contribute to the consumption of OH- ions. Leachate dilution and clogging of the fracture also occur.
Regardless of the advances in the analyses, the induced porosity changes along the flow path of the leachates in the rock matrix remain largely uncertain in the repository service-life time scales. The uncertainties identified in the modelling are related to the precipitation kinetics and the nature of the newly formed phases.
Interactions between cement leachates and clay/montmorillonite
During the operational period, as indicated, the pH can stay above 10, mostly at the interface between cementitious materials and groundwater. This is the case particularly for standard cement used above HZ20 and these conditions persist during the whole operational period. The materials used at the repository level and in the deposition tunnel will however be low pH cement with a pH that is expected to drop rapidly below 10 within the first few decades. Since there will be no cement in direct contact with the buffer, the reaction process will be attenuated by (i) the leaching rate of OH- from the cementitious materials and (ii) the mixing with groundwater and dispersive migration in the fracture network.
Buffering processes will occur if high-pH fluids contact clays in the buffer or backfill. Thus, montmorillonite will dissolve as the tetrahedral silica in the montmorillonite structure becomes available for dissociation reactions and non-swelling minerals will re-precipitate. This may have adverse consequences for the performance of the clay barriers, thus decreasing the swelling pressure and increasing hydraulic conductivity. The extent of this process depends on a number of factors, such as saturation state of the clay, temperature, ionic strength, type of accessory minerals and ion exchange reactions, but the key parameter is pH. Thus, as indicated from laboratory studies, below pH = 10, montmorillonite dissolution is very slow, whereas it becomes significant above pH values of 12 (e.g. Cama et al. 2000, Huertas et al. 2001, Rozalén et al. 2009a, Marty et al. 2011). At these pH values, however, precipitation of new phases, such as zeolites and CSH phases is enhanced, which may lead to clogging and thus to a slowing down of montmorillonite dissolution. Moreover, the nature of the cations (K in particular) that interact with the clay can also modify the permeability and the diffusion coefficients of the clay (Guyonnet et al. 2005 and Melkior et al. 2009).
There has been extensive laboratory and modelling work and long-term URL experiments on interactions between compacted clay and high pH fluids over the last 10 years (e.g. Gaucher & Blanc 2006 and references therein, Gaboreau et al. 2011, Techer et al. 2012, Lehikoinen 2009, Savage et al. 2007). Most of these have been focused on high pH (hyperalkaline) fluids released from ordinary Portland cement. In general, the

166
results indicate the formation of a limited zone of alteration (often termed “skin effect”) in the context of bentonite barriers. This is qualitatively supported by natural analogue studies of bentonite deposits in contact with hyperalkaline springs, which suggest only slight and localised mineralogical changes to the clay (Alexander & Milodowski 2011 and Savage 2011). Although there is general consensus with regard to process understanding, there remains a lack of detailed knowledge of the reaction mechanisms and of the underlying thermodynamic and kinetic data. This is even more the case for the less alkaline conditions (pH 10−11) that are more relevant for the near field, since considerably fewer data are available. In spite of these shortcomings, reactive transport modelling can be used to quantify the interaction between cement leachates and bentonite, although a simpler, mass balance approach is adopted below for the present performance assessment.
The mass balance approach is summarised as follows:
define limited volumes of buffer or backfill that, even if substantially degraded due to interaction with cement leachates, can be argued not to significantly impair the safety functions of these barriers;
calculate the maximum amounts of cementitious leachate required for complete dissolution of the montmorillonite in these limited volumes;
calculate the actual amounts of cementitious leachate derived from repository materials that could reach these volumes;
if the amounts of cementitious leachates that could reach these volumes is much less than these amounts required for complete dissolution of the montmorillonite, then cementitious leachates can be argued to have no conceivable impact on the performance of the buffer and backfill (even if the actual volumes affected by the leachates differ from those assumed in this analysis).
The limited volumes of degraded buffer or backfill considered in the analysis are illustrated in Figure 5-26. The cementitious leachates would most likely come into contact with the buffer and backfill via fractures in the host rock, and then diffuse from the fractures into the buffer and backfill materials. In the case of the buffer, a single horizontal fracture is considered that intersects the deposition hole and, in the case of the backfill, a single vertical fracture is considered that intersects the deposition tunnel. Thus, in each case, the volumes assumed to be degraded are ring-shaped and extend around the peripheries of the hole and tunnel.

167
Figure 5-26. Illustrations of the volumes of a) buffer and b) backfill in deposition hole and tunnel assumed to be potentially affected by cement leachate-bentonite interaction, defined for a mass balance approach.
In reality, instead of the ring-shaped buffer volume illustrated in Figure 5-26, which extends into the buffer for equal distances in all directions, the damaged zone that is likely to surround the deposition hole might cause the degraded region to spread out more in the vertical direction, reducing the thickness of the degraded region for a given amount of high-pH leachate. Thus, the ring shape is conservative, in that it maximises the thickness of the degraded region. A similar argument applies to the backfill, where the EDZ below the tunnel could cause the degraded region to spread out more horizontally.
In the case of the buffer, the degraded volume is assumed to extend 3 cm into the buffer from the line of intersection of the deposition hole with the horizontal fracture. The degraded volume thus extends across slightly less than 10 % of the buffer thickness. If the degradation of the buffer in the volume causes a significant increase in hydraulic conductivity, this could have some effect on groundwater flow around the deposition hole and on solute transport across the buffer. Note, however, that the damaged rock zone that surrounds the deposition hole will also perturb groundwater flow. If the hydraulic conductivity of the damaged zone is high (as assumed in many of the groundwater flow modelling analyses), the additional perturbation caused by a narrow ring of degraded buffer material is likely to be small. Regarding solute transport Assessment of Radionuclide Release Scenarios for the Repository System, Section 12.1.2 (Figure 12-3 in particular), examines radionuclide release and transport from a defective canister in the case where 10 % of the buffer thickness is degraded (and treated as a well-mixed volume) and compares it with a Reference Case where there is no buffer degradation. Peak near-field releases are practically the same for all calculated radionuclides.
In the case of the backfill, the degraded volume is assumed to extend 6 cm into the backfill from the line of intersection of the deposition tunnel with the vertical fracture. Similar arguments to those used for the buffer can be used to show that the degraded backfill volume will have a negligible impact on groundwater flow, on solute transport along the deposition tunnel and on solute transfer between the backfill and the host rock. Furthermore, as demonstrated in Section 9.6.6 of Assessment of Radionuclide
a) b)

168
Release Scenarios for the Repository System, the radionuclide transport path from a failed canister to the rock via the deposition tunnel backfill (the TDZ-path) tends to contribute far less to overall near field radionuclide release than a direct path from the failed canister through the buffer to the rock (the F-path) or through the buffer to the deposition tunnel EDZ (the DZ-path). Thus, a ring of degraded backfill some distance from the deposition hole will not have a significant effect on overall near-field release rates from a failed canister.
Having defined limited volumes of buffer or backfill that, even if substantially degraded due to interaction with cement leachates, will not significantly impair the safety functions of these barriers, mass balance arguments are used to calculate the maximum amount of degradation to which these limited volumes could in fact be subjected. The montmorillonite masses for these volumes are listed in Table 5-2. The amount of OH-, nOH,defect required to dissolve a mass of montmorillonite corresponding to each volume is given by:
montmo
shapemontmoBM
m =n ,
OH,shape
where mmontmo,shape is montmorillonite mass (kg) in a volume of a given shape, Mmontmo is the molecular weight of montmorillonite (367 g/mol) and B is the stoichiometric factor of the montmorillonite dissolution reaction. For the buffer, mmontmo is determined assuming a grain density of 2750 kg/m3 and a porosity of 0.42 and a montmorillonite volume fraction of 75 %. The corresponding bulk values for tunnel backfill are a dry density of 1705 kg/m3 and a montmorillonite volume fraction of 48.6 %.
The stoichiometric factor is obtained as follows. Savage & Benbow (2007) summarise the behaviour of low-pH cements and their effects on bentonite stability. These authors propose that the montmorillonite transformation process occurs in line with the aqueous silica speciation dependency on pH. For the pH range 10−13, the overall reaction proposed is:
Na.33Mg.33Al1.67Si4O10(OH)2 + 4.68OH- + 2H2O
0.33Na+ + 0.33Mg2+ + 1.67Al(OH)4- + 4HSiO3
- (5-6)
Table 5-2. Mass of montmorillonite in the assumed degraded volumes (shapes) and the amount of OH- required for dissolving the corresponding montmorillonite mass.
Buffer Backfillring shape ring shape
m montmo,defect [g] 9 298 43 193
n OH, defect [mol] 119 551

169
Thus, 4.68 mol of OH- are required to consume 1 mol of montmorillonite; this is the stoichiometric factor (at pH<10, montmorillonite degradation is assumed negligible due to the low solubility of silicate minerals, see e.g. Savage & Benbow 2007). It should be noted that the reaction stoichiometry is complicated by the precipitation of neoformed minerals and possible side reactions, which are not accounted for in the preset analysis.
It is estimated that 790−850 t of medium-pH cement mass will remain in the facilities above HZ20, potentially releasing 7.3106−8.3106 mol of OH- as cementitious leachate. For the facilities below HZ20, the corresponding figures are 600−1730 t of low-pH cement and 3.4106−1.0107 mol of OH-. For a single deposition tunnel, it is estimated that there would be around 30 t of low-pH cement, potentially releasing 170103 mol of OH- (Karvonen 2011, p. 13-17 and Tables 5-1, 6-1, 7-1, 8-2 and 8-18).
A quantitative assessment of how much of this cementitious leachate could potentially interact with volumes of buffer and backfill of the type illustrated in Figure 5-26 is presented in detail in Koskinen (2013). Since the migration of a pH-plume takes more time than the release of cement leachates and OH- especially, the presented “OH- entering a deposition tunnel or a deposition hole through an ungrouted fracture” may not occur in full extent during the operational period but continues thereafter. Based on using realistic assumptions11 the most significant sources of cement leachates are the grouts in the access tunnel and shafts12. In particular,
roughly 50 % of the OH- ions entering either a deposition hole or a deposition tunnel through an ungrouted fracture originate from grouts, shotcrete and rock bolt grouts in the access tunnel and shafts below HZ20,
20−30 % is from the grouts, shotcrete and rock bolt grouts in the access tunnel and shafts above the HZ20, and
the remaining roughly 20−30 % is from grouts and rock bolt grouts in deposition tunnels.
The total amount of OH- ions potentially entering a deposition hole through an ungrouted fracture is estimated to be 0.2 mol. For a deposition tunnel, the corresponding amount is 0.3 mol.
Based on more pessimistic assumptions reflecting uncertainties in the hydraulic properties of the sparsely fractured rock that is left ungrouted:
roughly 50 % of the OH- ions potentially entering a fracture intersecting a deposition hole originates from grouts, shotcrete and rock bolt grouts below the HZ20,
11 These assumptions concern a number of cementitious sources, fracture openings at these locations, fracture transmissivities at the same locations, radius of excavated openings, mass of cement in a single source, unevenness of the penetration of the cementitious material into a fracture intersecting the source, and pH of the cement leachate and its temporal evolution.
12 The amounts of OH- referred to here are obtained from the total amounts of cementitious materials, taking into account the impacts of 1) evolution of pH in the cementitious material - groundwater interface, 2) entrainment of the cementitious leachate with groundwater, and 3) migration of the entrained leachate in the fracture network towards a deposition hole or a tunnel section intersected by an ungrouted water conducting fracture.

170
approx. 20 % of cementitious materials in deposition tunnel is from grouts and shotcrete below the HZ20,
approx. 15 % (20 % for tunnels) is from grouts and rock bolt grouts in the access tunnel and shafts above the HZ20, and
the remaining 15 % (10 % for tunnels) is from the shotcrete above the HZ20 and other cementitious structures in the repository.
The total amount of OH- ions potentially entering a deposition hole through an ungrouted fracture is estimated to be 3.9 mol. For a deposition tunnel, the corresponding amount is 5.4 mol.
For both realistic and pessimistic assumptions, the grouts above HZ20, considered as a single group of sources, supply more than an order of magnitude more OH- ions to the groundwater than all other sources put together. However, the subhorizontal fracture zones above the repository, especially HZ20, are highly effective at dispersing all the cement leachates entering them. The key consequence of this dispersion is dilution of the relatively high pH leachate to values of pH < 10. Thus, although the amount of OH- released from cements giving rise to pH>10 is lower below the HZ20 than above it, this is counterbalanced by the considerably lower dispersion that the leachate below HZ20 undergoes.
Referring to Table 5-2, the amounts of OH- ions potentially entering a deposition hole or deposition tunnel through ungrouted are less by more than an order of magnitude than these amounts required for complete dissolution of the montmorillonite in the degraded volumes of buffer and depicted in Figure 5-26, even for the more pessimistic assumptions, and hence it is concluded that the cementitious leachates will have no impact on the performance of the buffer and backfill.
5.5.5 Leaching of other sealing materials - Silica sol
It is expected that some fractures will need to be grouted at the disposal depth and colloidal silica, which is being tested and developed, is presumed to be the best option for very small fracture apertures. The grout material compositions for different mixes considered have been reported in Arenius et al. (2008, p. 49).
The potential impact of colloidal silica on bentonite has also been recently discussed, e.g. in FUD (2010), where it is noted that during the normal construction process, it should not be possible for the sealant to come into contact with bentonite or other buffer/deposition materials. An unforeseen leak of ungelled silica sol could, however, adversely affect the bentonite barrier. Under normal conditions, the silica sol particles gel irreversibly with each other by colloidal aggregation. In the event of contact with bentonite, there is a risk that the same process will occur with the montmorillonite.
In order to estimate the effects of silica sol on bentonite at a qualitative level, investigations of the sealant and different mixtures of silica sol and bentonite have been performed by Holmboe (2011). The preliminary conclusion is that silica sol can aggregate mainly after dehydration (or at low water contents), as well as at high ionic strengths, whereby larger aggregates are formed. However, comparable quantities (by

171
weight) of silica sol and bentonite are required for significant effects on the bentonite as a bulk material. Also, it should be pointed out that natural bentonite may contain significant amounts of amorphous silica besides quartz and cristobalite. Moreover, from a thermodynamic viewpoint, high silica activities stabilise montmorillonite relative to other clay minerals (see Section 7.4.5). Still, there are uncertainties with respect to how colloids of silica sol and bentonite will aggregate under different conditions.
5.5.6 Summary, uncertainties and issues that need propagation
The assessment presented in this section shows that all performance targets listed in the introduction will be upheld during the operational period of the repository. More specifically:
Biodegradation processes will increase the rate of O2 consumption, thus limiting the impact of this potential canister corroding agent. No significant lowering of pH with respect to natural conditions is expected. The largest potential impact is the production of sulphide, mainly in the backfill, which contains the largest pool of organic material.
Both for saturated and non-saturated conditions, the consumption of O2 in the backfill and buffer will be relatively rapid (in the order of a few days to a few years), based on its reaction with pyrite accessory minerals. The disturbances induced redox processes during the excavation and operational phase are expected to have only a limited effect on the geochemistry of the near field after EBS emplacement.
Natural colloid concentrations are low and the colloids are not expected to be stable in the high ionic strength groundwaters present at repository depth. Also the introduced colloids arising through, e.g., the degradation of EBS materials, are expected to be present only in low concentrations in the high ionic strength groundwaters.
The effects of the possible high pH leachates on buffer and backfill performance during the construction and operational period will be negligible due to the limited flux of alkaline leachates into the deposition tunnels resulting in limited mineralogical changes in buffer and backfill. This also holds for the effects of the degradation of deposition tunnel end plugs.
There are uncertainties:
The geochemical conditions of the near field are strongly influenced by those in the surrounding host rock. Therefore, uncertainties recognised in Section 5.1, namely such related to variations in flow and resulting geochemical conditions also apply to the near field.
Uncertainties in groundwater salinities are not expected to be of concern for the performance of the buffer and the backfill. The same statement holds for uncertainties in redox conditions affected by the ingress of molecular oxygen, the microbial degradation of organic materials and methane, although these have not been assessed in a rigorous fashion.
The extent of the effect of cementitious leachates on the buffer and backfill is uncertain. The largest effect on the buffer’s performance is during the saturation via

172
advective flux of high pH water influenced by degradation of grout materials. However, even under pessimistic assumptions, the flux of alkaline leachates reaching the clay barriers is limited.
Also the understanding of the aggregation of colloids of silica sol and bentonite is still uncertain. Other issues regard the long-term silica sol durability and the uncertainty about silica colloid release and whether these colloids could affect radionuclide transport. There is little relevant information yet available upon which to base any statements about the long-term behaviour of the silica sol.
The amount of colloids introduced through, e.g., the degradation of EBS materials is expected to be low in the high ionic strength groundwaters, but the evolution of the population of colloids associated with the degradation of repository materials, including their mobility and stability under changing groundwater conditions is not well defined.
The main pool of O2 potentially affecting canister corrosion is in the backfill. This corrodant will however be consumed rather rapidly both abiotically, via oxidation with pyrite in the backfill, as well as microbially regarding the oxygen that dissipates into the rock. Hence, the O2 fluxes reaching the canister will be negligible.
Despite these uncertainties, the chemically related performance targets for the buffer and the backfill or other performance targets affected by the chemical evolution of the buffer and backfill will be met during the operational period.
5.6 Mechanical, hydraulic and geochemical evolution of closure
5.6.1 Overview and performance targets potentially affected
In the closure of the disposal facility, three types of plugs are needed: mechanical plugs, hydraulic plugs and intrusion-obstructing plugs (Closure Production Line report, see also Chapter 3 in this report). Mechanical plugs are meant for local support of installed backfill, if needed, with a service life of a few years up to a maximum ~100 years. Hydraulic plugs, which are multi-component structures, are needed to restore and maintain the natural conditions and their service life is hundreds of thousands of years. The service life of the intrusion-obstructing plug is also hundreds of thousands of years.
The backfill in the context of closure refers to the materials utilised to backfill investigation holes and excavated rock openings other than the deposition tunnels. For consistency and simplicity, the evolution of the clay component(s) of hydraulic plug(s) (see Section 3.6) is treated here. The other identified materials are 1) swelling clay, 2) mixture of swelling clay and aggregate rock, and 3) rock material of varying sizes: gravel, boulders, cobbles and crushed rock.
As stated in Table 2-4, the performance targets of closure are to:
Isolate the repository (L3-CLO-5)
Obstruct human intrusion (L3-CLO-5)
Restore natural conditions in the host rock (L3-CLO-6)

173
Maintain favourable conditions for the EBS (L3-CLO-8)
Prevent formation of preferential flow paths (L3-CLO-7)
Allow retrievability (L3-CLO-11).
5.6.2 Evolution of closure backfill during operational period
During the operational period, which for the closure backfill starts at about year 2070 and ends at about year 2120, the closed parts of the disposal facility close to the repository depth are expected nearly to recover from the hydraulic disturbances due to excavation. The emplacement of closure backfill in the central tunnels that have been already isolated from the deposition tunnels by the deposition tunnel plugs will further ensure that the deposition tunnel backfill stays in place, and that the average hydraulic conductivity at repository depth, once recovered, remains favourable for the performance of the repository.
The emplacement of the closure backfill in other underground openings than the central tunnels will follow quality control measures to restore to as great a degree as possible the hydraulic and mechanical conditions and to avoid the formation of water flow shortcuts from the repository level to the surface and vice versa.
During the excavation and operational period, the chemical evolution of the closure components at repository depth (i.e. in central tunnels) will be similar to that of the already installed backfill in the deposition tunnels. During this period, due to the relatively slow recovery of the hydraulic and mechanical conditions, no major chemical interactions of closure components with groundwater are expected.
At this stage, there are no major uncertainties in the performance of the closure backfill if quality control measures are strictly followed. The possibility of the closure as forming preferential pathways has been taken into account in groundwater flow calculations (Hartley et al. 2013b).
5.6.3 Evolution of the concrete components in the closure plugs and the deposition tunnel plug during the operational period
The deposition tunnel plug finalises the backfill of a deposition tunnel, and its role is to keep the backfill in place until the central tunnels are closed and saturated (service life is ~ 100 years). The reference design of the plug is presented in the Backfill Production Line report (see also Chapter 3).
Concrete in plugs below the HZ20 zone (Figure 3-24 and Figure 3-25 in Chapter 3) are low pH concretes, and above it standard concretes can be used. The compositions and the initial state of the concretes are given in the Backfill Production Line report and Closure Production Line report.
General about concrete durability
Concrete durability is restricted by the structural and environmental loading that it is exposed to. The environmental loading can deteriorate concrete through several mechanisms. Chemical loads (Table 5-3) are based on detrimental chemical reactions

174
Table 5-3. Chemical loads on concrete in the expected environmental conditions.
Chemical loads (concentration limits still to be set)
Cause of deterioration
Mg2+ CSH is consumed while non-binding and expansive brucite (Mg(OH)2) is produced.
SO42- Formation of expansive ettringite causing cracking if aluminate is available.
Formation of gypsum by decomposing portlandite (Ca(OH)2). At longer exposure, gypsum formation through a decalcification process that deteriorates CSH. Gypsum formed in a slow process is a very weak binder, far weaker than plaster casting. When CSH is consumed, gypsum dissolves to water with time leaving only a SiO2 gel, which is the product of the decalcification process.
NH4+ CSH is consumed and soluble compounds produced.
HCO3- Thaumasite (Ca3Si(OH)6(SO4)(CO3) * 12H2O) is formed in combination with
sulphate exposure. Its formation decomposes CSH. The reaction can be fast in the presence of finely divided CaCO3. Dissolution of Ca compounds such as CSH and Ca(OH)2 until a CaCO3 equilibrium is reached. Portlandite Ca(OH)2 consumption is not harmful to strength.
Low pH Dissolution of portlandite, CSH and CaCO3 at low pH.
with the reaction products of cement, namely calcium silicate hydrate (CSH) and/or calcium hydroxide. The detrimental reaction products are either soluble, expansive or have lower binding capacity than the normal reaction product of cement. Detrimental reactions with aggregate are unlikely with Finnish aggregates.
Structural loadings are caused by groundwater pressure differences, loads from the swelling pressure of the backfill materials and loads due to the mechanical behaviour of the rock. Structural maximum loads that the concretes are subjected to during the first 100−200 years are a maximum load of less than 10 MPa for the deposition tunnel plug (groundwater pressure + maximum swelling pressure of the deposition tunnel backfill) and 0.1−7 MPa for any concrete component in any other plug. It is assumed that the concrete mixes will not provide protection against steel corrosion, and thus steel that can resist corrosion in the surrounding solution should be selected.
The plugs are not exposed to freeze-thaw loads to any appreciable extent during the short term of up to a maximum of 100–200 years. Only the concrete components in the intrusion obstructing plugs could be subjected to annual freeze-thaw cycles − however, the concrete in these plugs is located below the typical frost depth (100–150 cm; Venäläinen et al. 2001) in Finland. Thermal spalling of concrete alone is not likely to take place within the temperature limits given (< 60 ºC) as long as the temperature changes are not sudden.
Evolution of standard concretes above HZ20 during the first 100−200 years after installation
Practical and experimental experience on standard concretes beyond 50 years is very limited. The chemical attack of concrete in the Olkiluoto disposal facility remains within the classified limits. The concrete mixes for each class shall be designed according to the guidelines given in the Code “by 50” (Finnish Concrete Association
175
2004). It is possible to design standard concretes that give a design service life of 100−200 years in the repository conditions.
Expected mechanical loads in the disposal facility (around 5 MPa due to the hydrostatic pressure and the swelling pressure of the closure backfill) are such that the plugs can withstand them for the required lifetime. The designed thicknesses are mechanically strong enough, furthermore by thickening the structures the durability of them can be prolonged – the service life is proportional to the square of the structure thickness and the design service life can be easily extended beyond 50 years by thickening the structure.
Evolution of low pH self compacting concrete below HZ20 during the first 100−200 years after installation
The low pH self compacting concrete (SCC) mix design of SKB (Backfill and Closure Production Line reports) published by Vogt et al. (2009) is a highly exceptional concrete mix. Compared with the customary normal design practices for durable concretes, the mix has a very low binder content, extremely large limestone filler content and extremely high water to binder ratio. The concrete mix falls outside of what could be considered “normal concrete” and especially “durable concrete”. Therefore it also falls outside existing experience, experimental work and modelling of concrete durability. The durability tests for the mix have not been made yet (Vogt et al. 2009).
Vogt et al. (2009) have tested the properties of the concrete mix. The strength development is slow, but reached high values with time. The compressive strength of the mix is extremely high considering the high water to binder ratio and indicates that the structure composed of limestone particles and hydration products is very homogenous and dense, in fact far denser than could be expected from the high water to binder ratio. The dense structure (verified by optical microscopy and SEM) improves durability against chemical attacks beyond what could be expected from the mix design alone.
The CSH content of the low pH concrete mix has been minimised and the limestone (impure calcium carbonate) content maximised. Regarding the durability of calcium carbonate against chemical attack, it is known that:
Calcium carbonate is stable or its dissolution is extremely slow down to pH 6.5.
Calcium carbonate is not attacked by sulphates at normal or low pH concrete pH.
Calcium carbonate is dissolved at low pH. The Ca2+ ions produced precipitate in the presence of SO4
2- ions as gypsum.
Calcium carbonate is dissolved by aggressive CO2 which increases the Ca2+ content of the solution. When equilibrium is reached, the attack by aggressive CO2 ends. The dissolution of calcium carbonate does not prevent the deteriorating reaction between aggressive CO2 and CSH, but calcium carbonate takes part in the reaction and is sacrificed along with CSH until calcium carbonate equilibrium has been reached.
176
Use of limestone instead of siliceous aggregate substantially increases the service life against bacterial attack (Taylor 1997, p. 383).
Related to the concrete durability, the main risks considered are a) thaumasite formation, which damages CSH, and b) low pH induced dissolution.
Thaumasite attack has been studied extensively in Norway due to severe concrete deterioration in the Oslo area (Hagelia & Sibbick 2009). With use of highly active pozzolanas (e.g. silica fume), the deterioration was greatly reduced. The formation of thaumasite under low pH conditions is not well known. E.g. Jallad et al. (2003) have studied thaumasite stability at different pHs and concluded that thaumasite is not stable at pH 11 and below. This indicates that thaumasite is not formed in low pH concrete conditions.
According to Taylor (1997), regarding thaumasite formation, “A prior formation of ettringite seems to be needed, probably as a nucleating agent; this would explain the need for a source of Al2O3.” (Taylor 1997, p. 373). Therefore the measures taken to avoid ettringite formation limit also thaumasite formation (sulphate resistant (SR) OPC and silica fume).
The sulphate concentration in the repository is not very high and therefore sulphate attack is not severe, but it is advisable to use sulphate resistant OPC in all mixes to improve durability. Durability is further improved by the use of silica fume, which lowers the portlandite content (improves durability against ettringite formation). Portlandite may actually protect CSH against Mg2+ by being preferentially attacked by Mg2+ (Taylor 1997, p. 372).
Use of limestone instead of siliceous aggregate has greatly increased the service life against bacterial attack (Taylor 1997, p. 383). The mix is designed to be sulphate attack resistant and it is more resistant to low pH than traditional concrete.
The reduced pH of the surrounding solution is able to dissolve calcium silicate hydrate (CSH). However, the CSH produced in the presence of silica fume has a lower Ca/Si value indicating an improved low pH resistance. The large amount of limestone would buffer the solution pH to a higher value and increase the solution [Ca2+] concentration thus protecting CSH.
The mix does not protect steel in reinforced concrete either from chloride or normal corrosion. This is because the silica fume/cement ratio is as high as 0.67, the water to cement ratio is high and the water to binder ratio is high. A steel material that can resist corrosion in the surrounding solution should be selected.
Mechanical loads are such that the plugs can withstand them until the concrete is degradated. The service life is proportional to the square of the structure thickness and the design service life can be easily extended by thickening the structure.
Conclusions / concrete structures
Standard sulphate resistant Portland cement + silica fume concretes (intended for use above HZ20) – when designed according to the norms, standards and existing knowhow to cope with the prevailing environmental loads – will be durable during the operational period. The risks can be compensated by, for example, material selection, mix design, thickness of concrete / steel protective layer and optimisation of the form of the

177
structure and careful design, placement and maintenance of the structures, so that the durability of concretes can be extended up to hundreds (or even thousands) of years. The studied low pH concrete (intended for use below HZ20) is a highly exceptional concrete mix; it is carefully designed regarding mixing, placement and structural behaviour. Even though there is no practical experience on the longer term durability of this type of concrete, the mix is considered to be appropriate given its chemical composition and performance in the expected repository conditions. The main risks identified concerning the operational period, i.e. shorter-term evolution, are thaumasite formation and low-pH-induced dissolution. Deposition tunnel plugs and hydraulic plugs include filter layers and clay interiors. As long as the concrete structures around clay interiors withstand the environmental loads (chemical and structural) adequately, the clay interiors are affected by cement leachants but they are not free to move through concrete structures. Minor amounts of swelling clay material can penetrate into the fissures of concrete or pass through penetrating fractures in the concrete structures. In this case, this is one functional target of swelling clay interior; it serves as a sealing material.
5.6.4 Summary, uncertainties and issues that need propagation
As demonstrated in the above subsections, the closure and the closure material are expected to meet all their performance targets, as stated in Table 2-4, during the operational period.
There is a relatively short time lapse (30−50 years) between the start of the emplacement of the first closure components (by 2070) and the finalisation of closure (by 2100−2120) and thus the end of the operational period. The mechanical plugs are designed to withstand degradation for about 100 years and thus there should not be major uncertainties in their behaviour whenever quality assurance measures are followed.
5.7 Canister corrosion
5.7.1 Overview and performance targets potentially affected
The performance target affected by canister corrosion is: “The canister shall withstand corrosion in the expected repository conditions” (L3-CAN-7). The design nominal wall thickness of the copper overpack is 49 mm based on the anticipated corrosion load during disposal system evolution.
Different corrosion loads have been considered for this time frame:
Atmospheric corrosion before emplacement
Corrosion due to handling and operational factors
Stress corrosion cracking
Internal corrosion due to radiolysis of residual water
External corrosion in an unsaturated buffer
Aerobic corrosion in the deposition holes.
178
5.7.2 Atmospheric corrosion before emplacement
Already during the interim storage prior to emplacement (estimated to be a couple of months at most), the canister will have been subjected to atmospheric corrosion and have acquired a thin protective surface layer of corrosion products from oxidation by air, most likely of copper oxide (CuO) with cuprous oxide (cuprite Cu2O) closest to the metal surface, as well as copper hydroxide and/or copper hydroxides containing other ions (King et al. 2012, Section 4.1.2). Such a layer will result in a decrease in the corrosion rate with time. The atmospheric corrosion effect is negligible in spite of the elevated temperature in the storage facility, conservatively estimated to be about 60−70 °C but more likely to be about 40 °C due to ventilation (Nieminen 2012). A layer of copper oxide with a thickness of a few tens to a few hundreds of nanometres will form on the canister surface. Even if the storage time were extended up to 2 years, the total corrosion attack would be less that 1 micrometre.
5.7.3 Corrosion due to handling and emplacement
After the canister has been welded, the copper surface will be machined to remove any discontinuities. During machining, iron particles from the machining equipment can become embedded in the copper surface and might cause galvanic corrosion. This issue was considered and it was concluded that iron particles would temporarily protect the canister surface from galvanic corrosion (Gubner & Andersson 2007).
During canister handling and emplacement, the canister surface could be damaged causing surface discontinuities (such as crack-like features, dents or pits). A study was performed to determine whether surface discontinuities might affect the corrosion behaviour of the canister (King 2004). It was concluded that such features would not influence the localised corrosion behaviour since the initiation of pits occurs on a microscopic, rather than a macroscopic scale (King et al. 2012, Section 5.2.7). Scratches and other defects in the surface oxide layer caused by handling would rapidly oxidise when exposed to the repository environment until the protective oxide layer had reformed.
Hard impacts during handling may cause plastic deformation of the copper (a.k.a. cold working). Based on a number of studies of the effect of impacts of various loads on the deformation of the copper overpack, a 1.1 mm indentation is the maximum tolerable displacement that would not affect the mechanical properties of the canister (Raiko et al. 2010). Furthermore, cold-worked material might preferentially dissolve, but this localised dissolution would stop once the deformed material had corroded away. Cold-worked material is more susceptible to stress corrosion cracking. For example, samples with 20 % cold work in nitrite solution were found to be (albeit slightly) more susceptible to stress corrosion cracking than annealed material (King et al. 2012, Section 6.1.2.2). However, susceptibility of the material is only one of a number of pre-requisite factors for SCC and without a suitable environment cold-worked material will not undergo cracking.
5.7.4 Stress corrosion cracking
The possibility of stress corrosion cracking of copper canisters in a deep geologic repository in the Fennoscandian Shield was reviewed by King & Newman (2010). The results of various experimental studies in ammonia-, acetate-, and nitrite-containing
179
environments are summarised in King et al. (2012, Section 6.1), and an approach to predicting the period of susceptibility to SCC has also been developed (King et al. 2012, Section 6.2.2.1, King & Kolář 2004, 2005, Maak & King 2005). It is apparent that, during the early aerobic phase in the evolution of the repository environment, the period of susceptibility to SCC is short and it is highly unlikely that the required conditions of potential, interfacial pH, and SCC-inducing species will be present simultaneously (King & Newman 2010).
SCC can be enhanced by residual stresses caused during welding of the canister lid. Residual stress levels have been measured for both friction-stir welds (FSW) (Raiko et al. 2010) and electron-beam welds (EBW) (Gripenberg 2009). For FSW, the residual stresses on the outer surface tend to be compressive with values up to 60 MPa, with smaller compressive (and, in some cases, slightly tensile) stresses on the inside of the canister. Tensile stresses are found mid-wall. In contrast, EBW tend to exhibit tensile residual stresses up to 70 MPa, balanced by compressive stresses in the adjacent base metal (Gripenberg 2009). Further studies and method development to decrease them are ongoing. They are deemed not to affect the performance of the canister at this stage because not all the conditions for SCC are fulfilled at any time during the canister evolution even in presence of such residual stresses (King & Newman 2010, p. 39). In particular, provided provisions are made to avoid contamination by residues from blasting operations, the environmental conditions that support SCC will not be present during this period.
Under aerobic conditions (i.e. in the presence of dissolved O2 or Cu(II)), the bulk environmental conditions under which SCC has been observed correspond to the equilibrium potential and pH for Cu2O/CuO formation (King et al. 2012, Section 6.2.2.1). The reasons for this apparent correlation need to be understood. Korzhavyi & Johansson (2011) performed a literature review on the properties of copper(I) oxides and the initial processes involved in copper oxidation. This study focused on the structure of adsorbed oxygen, copper, hydroxyl, water on the copper surfaces in order to better understand copper oxidation and the SCC mechanisms. Johansson & Brink (2012) performed another literature review on the mechanism and energetic of surface reactions at the copper-water interface which sheds additional light on surface reactions and the proposed mechanism of copper corrosion in anoxic water (see Section 8.2.3).
5.7.5 Internal corrosion due to radiolysis of residual water
Fuel assemblies will be dried by a combination of vacuum and heat prior to encapsulation, and the air contained in the canister cavity will be purged with argon before the copper canister is sealed (Raiko 2012). Nonetheless, if the drying process is incomplete, some residual water may be contained inside a sealed copper canister, for example cooling pool water may be present inside a damaged fuel pin due to incomplete vacuum drying. The high initial temperature due to radiogenic heat will mean that any air and water within the canister will be in the form of humid air or vapour. As a consequence, it is pessimistically assumed that the atmosphere in the canisters after encapsulation will be composed of humid air (maximum 10 %) and argon gas (minimum 90 %).

180
This humid air will be subjected to the intense radiation field inside the canister from the spent nuclear fuel, causing radiolysis and the generation of small quantities of nitrogen oxide species (e.g. nitric acid) and even smaller quantities of hydrogen gas (H2), oxygen gas (O2) and hydrogen peroxide (H2O2). These radiolysis products will then combine to form nitric or nitrous acid (Features, Events and Processes, Section 3.2.5). Continued radiolysis in an atmosphere containing hydrogen and nitrogen compounds can generate ammonia. If this ammonia can reach the gap between the cast iron insert and copper outer overpack, then conditions for SCC of copper may be present. However, SCC of copper by ammonia requires the presence of an oxidant; oxidants are likely to be consumed by corrosion of the insert before reaching the insert-copper overpack gap.
The most aggressive corrosive agent formed by radiolysis of residual water is nitric acid. To limit the amount of nitric acid that could be formed, the fuel assemblies are vacuum dried before encapsulation and the atmosphere inside the canister is changed from air to argon (Canister Production Line report). This process will limit the amount of water that is introduced in the canister with the fuel to the water that may be trapped in leaking fuel rods. To estimate the maximum amount of nitric acid that could be formed, it is pessimistically assumed that in a BWR canister there could be 12 leaking fuel rods each containing the equivalent volume of void space (50 cm3) in water. This corresponds to a residual water content of 600 g per canister. Using this assumption on the amount of residual water, the radiolytic acid production yield has been estimated to be between 160 and 450 g per canister depending on the conceptual model, data and assumptions applied (Features, Events and Processes, Section 3.2.5).
Such an amount of nitric acid would corrode the metallic parts of the fuel assembly, possibly the inner part of the insert and possibly reach the inner surface of the copper overpack. However, because of the massive amount of iron in the insert, it is expected that if any nitric acid is formed it will react with the insert rather than with the internal surface of the copper overpack. Therefore, no corrosion depth due to nitric acid formation is taken into account for the performance assessment.
Furthermore, assuming 600 g of water in each canister is pessimistic because the number of leaking fuel rods, according to the operational experience in nuclear power plants, is much lower. No leaking of fuel rods has occurred so far after the fuel has been stored in the cooling pool. Therefore, it is not expected to have more leaking fuel rods than those that have leaked during reactor operation. Finally, it has not yet been decided whether leaking fuel rods will be disposed along with intact fuel assemblies or will be disposed of in special canisters.
5.7.6 External corrosion in unsaturated buffer
During this phase, the canisters are surrounded by the buffer that is slowly being dried out as moisture is driven away by the thermal gradient. The canister outer surface is expected to reach a temperature close to 100 °C shortly after emplacement (see Section 5.2.2). The drying of the buffer is balanced by re-saturation by incoming groundwater at some indeterminate rate (which may also be affected by the need to pump incoming groundwater out of the open repository). King et al. (2012) reviewed the mechanisms of corrosion under unsaturated conditions. As the buffer saturates, salt contaminants on the

181
surface of the canister will deliquesce at a critical temperature and relative humidity determined by the nature of the salt. Local separation of anodic and cathodic sites is possible following this initial wetting, if O2 is still present. These conditions would lead to localised or, at least, uneven corrosion. Localised corrosion is discussed in Chapter 6.
Copper corrodes in O2 containing Cl- solutions and under atmospheric conditions providing the relative humidity (RH) is above that required to form a thin surface water film (approximately 50 to 70 % RH) (King et al. 2012, Section 5). The relative humidity in the repository is expected to be high. At the Äspö laboratory, the relative humidity is about 80 % and the humidity in the repository should be similar. The buffer and backfill are not saturated with water during installation. About 40 % of the total amount of water in the buffer must be provided by the host rock. This wetting process, leading to the final water saturated conditions around the waste canisters, the form of its progress, and its duration will influence the form and the extent of the corrosion during this period in the canister service life.
As the relative humidity continues to increase, however, the surface will progressively wet more uniformly, until the entire surface is wetted and corrosion becomes uniform. Some localisation of the attack was observed by Pusch (2008) while studying the effect of copper on unsaturated bentonite, as predicted theoretically. In the repository, the localised attack will cease as both the degree of saturation increases and the O2 concentration decreases.
Radiolysis of moist air surrounding the canister (before buffer saturation) is discussed in King et al. (2012, Section 7.2). The corrosion rates in the presence of gamma-radiation are not higher than what one would expect for corrosion of copper in un-irradiated moist air indicating that the influence of radiation will be negligible even at dose rates higher than the maximum surface dose rate for the canister. Furthermore, in unsaturated bentonite the amount of energy absorbed by the bentonite porewater would be lower than in the case of saturated bentonite because the part of the void space is occupied by air; therefore the amount of radiolysis products formed (which depends on the absorbed dose) would be smaller than in saturated bentonite.
5.7.7 Aerobic corrosion in the deposition hole
Once the canister has been emplaced in the deposition hole, aerobic corrosion takes place due to the air trapped in the buffer and in the backfill. The amount of residual air is finite, since it is assumed that once the deposition tunnel has been backfilled and plugged, there are no more possible sources of air to the canisters. Therefore, the maximum amount of corrosion due to aerobic corrosion of residual air can be calculated using a mass balance approach. This approach is pessimistic because it assumes that all the oxygen reacts with the canister whereas there are accessory minerals in the backfill and in the buffer and microbial organisms that will also consume oxygen (see Section 5.5.2 and Appendix C).
The main pool of molecular oxygen after emplacement of the EBS is located in the backfill, as shown in Appendix C. According to the estimates in Table C.3-1 of Appendix C, there are 37.8 mol of O2 per metre of backfill. Assuming that the distance between deposition holes (9 m) is the section of backfill that can be attributed to each

182
canister, the total amount of O2 is 340.2 moles. In contrast, there are only approximately 20 mol of O2 in the buffer in the deposition hole (Table 3-7). This amount of oxygen coming from the backfill is assumed to corrode only the lid of the canister. This is conservative because it restricts the surface of copper exposed to O2 which will not be limited to the lid only but will diffuse to the top part of the canister as well. The corrosion depth if only the lid is considered is calculated in Appendix C to be 11.2 mm or 22.4 % of the lid thickness (Table C.4-1).
From a mass balance viewpoint, this oxygen amount is sufficient to corrode a significant fraction of the canister lid. However, the O2 will react with Fe(II) minerals present in the backfill and presumably also with organic carbon via microbial degradation.
Oxygen will also react with pyrite, a prominent accessory mineral in the backfill, both under saturated and unsaturated conditions, as discussed in Section 5.5.2 and in Appendix C. Literature data generally indicate more rapid oxidation rates under unsaturated conditions than under saturated ones. However, as indicated from the experimental study of Jerz & Rimstidt (2004), the rates decrease in moist air below those noted for saturated conditions due to the build up of a surface film. At intermediate moisture contents, rates are enhanced (see Appendix C, Figure C.2-1). At low moisture contents, rates become limited by the low water supply. For near-field conditions, intermediate and high moisture contents are relevant.
Bounding calculations on the basis of pyrite oxidation rates indicate rapid oxygen consumption by the pyrite in the backfill, both under unsaturated and saturated conditions, in the range of days to about 3 years. An important uncertainty is the reactive surface area of pyrite therefore pessimistic estimates are used. The amount of copper corroded during this short time frame is small and a maximum corrosion depth of 30 microns is estimated (Appendix C, Section C.4). The calculations neglect the possible contribution of other oxidation processes, such as siderite oxidation and organic matter degradation, which may further reduce the O2 flux to the canister.
The bounding calculations are based on experiments carried out at room temperature. The diffusive flux of O2 to the canister will be somewhat enhanced concomitantly with the various oxygen consumption rates. The effect of higher temperatures has not been quantitatively assessed since it is expected that the overall effect on copper corrosion will be negligible. In summary, the corrosion depth from the aerobic corrosion after canister emplacement will have a negligible impact on the canister lifetime.
5.7.8 Copper corrosion in highly saline groundwaters
During excavation and operation there could be a rise in groundwater salinity due to the disturbances caused by the construction and operation of the repository (see Section 5.1). At a sufficiently high Cl- concentration and in acidic conditions, copper could become thermodynamically unstable in water (King et al. 2012, Section 5.2.2). The pH conditions in the near field are neutral or slightly basic, low pH conditions are not expected as discussed in Section 5.5.2. King et al. (2012) summarised the various attempts that have been made to measure the corrosion rate of copper under strictly anoxic conditions. Great care was taken to exclude O2 from the system, although some
183
corrosion due to residual O2 was inevitably observed during the experiments. Once the trace levels of O2 had been consumed, however, there was no evidence for continued corrosion (King et al. 2012, Section 5.2.2). There is no evidence, therefore, that copper corrodes in concentrated Cl- solutions at neutral pH, consistent with thermodynamic predictions. Corrosion under alkaline and high salinity conditions are discussed in Section 6.8.
5.7.9 Summary, uncertainties and issues that need propagation
During this phase, corrosion depth from the atmospheric and initially entrapped oxygen is expected to be less than a few hundred micrometres, and will thus have a negligible impact on the minimum copper coverage of the canisters. Corrosion would occur under unsaturated conditions with the possibility of non-uniform wetting due to the deliquescence of isolated salt particles on the surface. Radiolysis of moist air surrounding the canisters may cause some corrosion but negligible compared with the corrosion from residual oxygen. These conditions would lead to localised or, at least, uneven corrosion. Localised corrosion is discussed in Chapter 6.
There is some uncertainty in the detailed salinity distribution around the repository during construction and operation (see Section 5.1.3). However, the salinity will remain in the range that would not significantly affect the performance of the repository during this period or when considering its future evolution.
5.7.10 Mechanical impacts on canister
Mechanical impacts on the canister during the operational period can happen during the handling and transfer of the canisters or in case of incidents/accidents. The lifting equipment and the shoulder in the copper lid collar and the whole of copper overpack shall be dimensioned for the gravity load of the loaded canister weight multiplied by the dynamic factor for lifting loads and the required safety factor. During the encapsulation process, the canister is supported from the bottom lid until the point where the canister is transferred from the encapsulation line trolley cradle onto the automatic guided crawler. At that time and when the canister is loaded into the canister installation vehicle and installed into the deposition hole, the canister is gripped and lifted from the lifting collar in the copper lid. In these three cases, all the canister weight is hinged on the copper lid collar only.
The leading design principle in canister handling accidents is as follows. The disposal canister is not designed to maintain its long-term properties after a major handling or transport incident or accident in the operational period. If such an accident happens, the canister will be returned for examination and assessment to the encapsulation plant, opened and unloaded, and the fuel will be re-encapsulated into an intact canister, if needed. The canister design principles are described in Rossi et al. (2009) and Saanio et al. (2010).
A final control point for surface damage has been established at the point when the canister is lowered into the deposition hole, see more details in Section 6.6.1 of the Canister Production Line report.

184
Other mechanical impacts on the canister during the early evolution are assessed in Section 6.9.
5.8 Subcriticality
The performance target considering subcriticality is “The canister shall be subcritical in all postulated operational and repository conditions including intrusion of water through a damaged canister wall” (L3-CAN-14).
To ensure subcriticality, the properties (e.g., enrichment, burnup) of the fuel inside the canisters, as well as the internal geometry of the insert, shall be known precisely enough to provide a high degree of confidence in criticality safety (L4-CAN-9). The insert geometry and acceptance criteria for soundness shall be set so that sub-criticality is guaranteed (L4-CAN-33).
Criticality safety analyses are performed for transportation and encapsulation purposes to ensure, with a high margin of safety, that the canister will be in a sub-critical state at emplacement time. Preliminary criticality safety analyses of the Finnish disposal canisters have been reported in Anttila (1999) and later in Anttila (2005). According to the international standards and regulation guides, a canister used for the final disposal of nuclear fuel must be subcritical also under very unfavourable conditions, for instance, when:
the fuel in the canister is in the most reactive credible configuration,
the moderation by water is at its optimum, and
the neutron reflection on all sides is as effective as credibly possible.
In an earlier study (Anttila 1999), it was proved that a version of the VVER canister loaded with twelve similar fresh VVER-440 assemblies with the initial enrichment of 4.2 % fulfils the criticality safety criteria. An earlier design of the BWR canister loaded with twelve fresh BWR assemblies of the so-called ATRIUM 10x10-9Q type with an initial enrichment of 3.8 % and without burnable absorbers has also been proved to meet the safety criteria. However, in these calculations the impact of various uncertainties were not assessed thoroughly enough. In the criticality calculations it was assumed that the canisters were filled with water and that the fuel was fresh (i.e. the decrease in reactivity due to the burnup of the fuel was not taken into account).
The main emphasis in the most recent study (Anttila 2005) was on the OL3 canister. It was shown that this canister type fulfils the criticality safety criteria only if the so-called “burnup credit” principle is applied. The fuel assemblies to be loaded in an OL3 canister should have been irradiated at least to a burnup of 20 MWd/kgU, if the initial enrichment is about 4 %.
If burnup credit cannot be used to reach the requisite criticality safety, there are alternative ways to fulfil the criticality criterion. For example, fuel with higher reactivity can be blended in the same canister with fuel with lower reactivity or fewer spent nuclear fuel assemblies can be inserted in a single canister for disposal. In addition, the reactivity of the canister configuration can be lowered by filling some of the void inside the canister with some stable material (such as quartz sand or lead shot) so that the

185
amount of possible moderator (intruded water) can be minimised. The criticality safety analyses will be updated to include validation of the calculation system and the impact of various uncertainties. Criticality during the excavation and operation of the repository is very unlikely because the fuel is expected to be in the same geometrical configuration as in the initial state. The results of criticality safety analyses carried out for operational safety purposes can be applied to this time frame because, for these analyses, the canister is cautiously assumed to be filled with water.
5.9 Summary
5.9.1 Summary of disposal system evolution
Hydraulic and geochemical evolution of geosphere
Groundwater flow at Olkiluoto takes place mainly through a network of fractures and deformation zones, within which internal channelling of the flow is likely. Thus, there is significant local variation of the flow conditions and possibly also of salinity and groundwater composition near the deposition holes. Another characteristic feature affecting groundwater flow at Olkiluoto is the large variation in salinity, making it necessary to take density effects into account (see Section 5.1.2, 5.1.3 and Appendix D).
The correlation between the inflow and post-closure flow rate to a deposition hole is not one to one. Thus it is possible that even if all the deposition holes with inflow over the given limit, 0.1 L/min, are discarded, it cannot be excluded that a few deposition holes will be affected by a higher post-closure flow rate or associated with a lower transport resistance than the target values.
There are minor uncertainties related to the extent and properties of the rock damage created by the construction and later by the heat produced by the spent nuclear fuel. Different assumptions on the EDZ and spalling around the deposition tunnel and holes have been made and their impact on the groundwater flow tested. The potential presence of an EDZ affects inflows below 0.1 mL/min and means that in practice all deposition holes have some, although in many cases limited, inflow compared with 40 % of deposition holes with no inflow when there is no EDZ present.
From the available modelling results, it can be concluded that the increase in salinity at repository levels will remain rather moderate during the operational period. Thus, even under pessimistic assumptions, the maximum salinities are expected to remain below 70 g/L in the reference volume and salinities over 35 g/L are not expected at repository depth. However, salinities over 35 g/L occur locally within some tens of metres below the repository level. Most of the modelling results suggest that the lowest salinities during the operational period will be at least a few grams per litre in most parts of the repository. However, the possibility of salinities close to 0.3–0.4 g/L, which corresponds roughly to the limiting total charge concentration of 4 mM for repository groundwater, cannot totally be excluded. However the lowest and highest salinities are related to the main hydrogeological zones and the ONKALO facility and not necessarily to the repository panels themselves. Moreover, the disturbed conditions of either low or extremely low salinities are likely to last a limited time in the order of a few tens of years. In summary, in spite of the rather large variations in the flow conditions during
186
the excavation and operational period, the groundwater composition with respect to salinity, chloride content and total charge concentration of cations will remain within the target value ranges except for a few canister positions.
Oxygen in the infiltrating groundwater is consumed mainly in the overburden, and abundant iron-bearing minerals in rock provide a strong buffer against oxygen. According to assessment, pyrite in fractures is able to consume oxygen rapidly and oxygen is not expected to intrude further than a few decimetres along fractures. The pH in the natural groundwater is expected to be in the range of 7 to 9 and thus well within the range defined by target properties.
The Olkiluoto groundwater has a naturally low colloid content. Colloids may be formed by cement degradation. However, as the groundwater at the repository depth in general has such a high ionic strength (salinity), the potential for colloid formation (or persistence) is expected to be limited.
The sulphide level for the main water types in the natural state is well below 1 mg/L, ranging from less than 0.02 to 0.56 mg/L, and median values are 0.02−0.04 mg/L. It has been observed that site characterisation activities and ONKALO construction have caused artificially disturbed transient conditions due to mixing of different groundwater types and anomalous sulphide levels have been measured (max. 12 mg/L) at a depth of around 300 m for the brackish SO4 water type mixed with brackish Cl type groundwater. The high concentrations of sulphide are probably due to a delay in the availability of iron; however, sulphide concentrations are still evidently controlled by iron sulphide phases. According to monitoring results, sulphide levels decrease from the anomalously high values once the groundwater conditions stabilise. Although the groundwater data clearly indicate sulphide values below 1 mg/L, a pessimistic upper value of 3 mg/L is adopted, which accounts for the possible solubility control by the more soluble amorphous iron sulphide in combination with the kinetically constrained availability of iron and uncertainties related to microbial activity and availability of nutrients and energy sources.
Thermal evolution
Radiogenic heat production occurs within the spent nuclear fuel and heat is transferred to the buffer through the copper canister. The buffer transfers the heat to the backfill and the rock. During the operational process, the canisters will fill the repository and heat the buffer, backfill and rock. During the operational phase, the maximum temperature at the buffer-rock interface for unsaturated buffer is expected to be 65 °C, for saturated buffer it is expected to be 75 °C and at the canister surface it is expected to be over 90 °C (see Figure 5-15). Thus temperatures will remain within the acceptable ranges.
Rock mechanics evolution in the near field
Excavation and thermal load caused by the decay heat from the spent nuclear fuel will cause damage to the near-field rock. An excavation damaged zone, although likely not continuous, is formed especially below the tunnel floor. Although rock damage is not directly considered in the target properties, rock damage around the excavated rooms may have an impact on the hydraulic properties of the rock. Due to the uncertainties related to the properties of the rock damage, a number of cases considering varying
187
geometrical and hydraulic properties of the damage zone have been considered in the groundwater flow modelling.
Although there is a good understanding of the processes affecting the mechanical state of the rock in general, there are still uncertainties related to the elastic and rock strength parameters of the rock at Olkiluoto and especially concerning the in-situ stress state, which need further study. The heterogeneity of the rock leads to spatial variations in rock properties, which complicates the assessment of rock damage. To cope with the uncertainties as to the existence of spalling or other type of rock damage, two cases to address the spalling have been applied in the groundwater flow modelling: i) rock damage zone around the deposition hole and ii) no rock damage around the deposition hole.
Reactivation of the fractures can change the hydraulic properties of the fractures, but the changes in the hydraulic properties are minor, especially when compared with changes caused by the formation of the EDZ and spalling.
Mechanical and hydraulic evolution of buffer and backfill
Before saturation, piping and erosion of the buffer and backfill material will imply that some buffer and backfill material will be lost. Based on the inflow data for potential canister positions, roughly 1/3 of the positions are such that some buffer mass loss by piping and erosion is expected. In a basic case, considering the maximum inflow criterion of 0.1 L/min in a deposition hole, the estimated mass loss is at most 185 kg, but there are variant cases with larger losses, but even then the average buffer dry density remains such that no drastic changes are expected in the hydraulic conductivity or the swelling pressure of the buffer. However, the consequences also depend on how local the mass loss is.
For the backfill, 13,000 kg at most would be locally lost by piping and erosion, but the eroded material would be redistributed within the deposition tunnel. The effect on the backfill performance depends on how the mass loss would be distributed in the backfill. For example, if all of the 13,000 kg were lost from a tunnel section of 1 m, the mass loss would have significant effect on the backfill density at this location. Such an event could perhaps be possible in the vicinity of a fracture with a high enough inflow to transport all this mass further down in the tunnel. However, it can be reasoned that this type of erosion would still not be detrimental to the performance of the EBS system, since no deposition holes would be allowed to be situated near such a fracture. In conclusion, the buffer and backfill will maintain their performance targets even considering the process of piping and erosion. The remaining uncertainties of a situation with a significant loss of buffer in a deposition hole are considered in the formulation of release scenarios.
Geochemical evolution of buffer and backfill
Biodegradation processes will increase the rate of O2 consumption, thus limiting the impact of this potential canister-corroding agent. No significant lowering of pH with respect to natural conditions is expected. The largest potential impact is the production of sulphide, mainly in the backfill which contains the largest organic pool. However, the impact is limited during the short operational period as assessed in Section 6.6.

188
Both for saturated and non-saturated conditions, the consumption of O2 in the backfill and buffer will be relatively rapid (in the order of a few days to a few years), based on its reaction with pyrite accessory minerals. The disturbance-induced redox processes during the excavation and operational period are expected to have only a limited effect on the geochemistry of the near field after EBS emplacement.
Similarly to natural colloids, introduced colloids through e.g. the degradation of EBS materials, are expected to be scarce in the high ionic strength groundwaters present at repository depth. However, the evolution of the population of introduced colloids, especially those associated with the degradation of repository materials, and their mobility and stability under changing groundwater conditions is not well defined.
The effects of possible high pH leachates on buffer and backfill performance during the construction and operational period will be negligible due to the limited flux of alkaline leachates into the deposition tunnels resulting in insignificant mineralogical changes in buffer and backfill.
Mechanical, hydraulic and geochemical evolution of closure
There is a relatively short time (30−50 years) between the start of emplacement of the first closure components (by 2070) and the finalisation of the closure (by 2100−2120) and thus of the operational period. The mechanical function of the plugs is designed to last for about 100 years and thus there should not be major uncertainties in their behaviour during the operational period, provided that appropriate quality assurance measures are followed.
Canister corrosion
The canister will be covered by a thin layer of corrosion products, and a few canisters (up to 4−5 out of 4500 canisters, see Section 3.3) may have a penetrating defect, and there will be residual stresses on the surface of the canister that are difficult to quantify.
The corrosion depth from the atmospheric and initially entrapped oxygen is expected to be less than a few hundred micrometres, and will thus have a negligible impact on the minimum copper coverage of the canisters (even taking into account incidental deviations).
Mechanical impacts on the canister
The impact from potential canister handling accidents is not a concern, since if such accidents happen, the canister will be returned to the encapsulation plant for examination and assessment, opened and unloaded, and the fuel will be re-encapsulated into an intact canister, if needed. To control the canister surface condition, a final control point for surface damage will be established where the canister is lowered into the deposition hole, see more details in Section 6.6.1 of Canister Production Line report.
Subcriticality
Criticality safety analyses are performed for transportation and encapsulation purposes to ensure, with a high margin of safety, that the canister will be in a sub-critical state at
189
emplacement time. Criticality during the early evolution of the repository is very unlikely because the fuel is expected to be in the same geometrical configuration as in the initial state and because the criticality safety analyses cautiously assume that the canister is filled with water, which is clearly not the case during the operational period.
5.9.2 “State” of components with regard to safety functions and performance targets
As demonstrated in this section, all repository barriers will conform to the performance targets at the end of the operational period with the following incidental deviations:
It is possible that even if all the deposition holes with inflow over the given limit, 0.1 L/min, are discarded, it cannot be excluded that a few deposition holes will experience a higher post-closure flow rate or a lower transport resistance than the target values.
For a few canister positions, the groundwater composition with respect to salinity, chloride content and total charge concentration of the cations may for a short time be outside the target values, but these potential deviations are expected to disappear shortly after the closure of the repository and are not judged to be detrimental to the backfill, buffer or canister.
Although the groundwater data clearly indicate sulphide concentrations below 1 mg/L a pessimistic upper value of 3 mg/L is recommended to be used in the further analysis. This value accounts for the possible solubility control by the more soluble amorphous iron sulphide in combination with the kinetically constrained availability of iron and uncertainties related to microbial activity and availability of energy sources and nutrients for microbes.
All canisters are intact leaving the encapsulation plant, although the occurrence of welding defects and NDT mishaps cannot be excluded. Based on the limited amount of data available, the number of canisters that may have a penetrating defect can be up to 4−5 out of 4500 (see Section 3.3), although this number is likely to decrease as the canister development work progresses.
From the corrosion point of view, no incidental deviations are expected during this phase.
5.9.3 Assessment whether all FEPs relevant during the operational period and
FEP interactions have been assessed
All the relevant evolution FEPs during the operational period have been taken into account in assessing the performance of the repository system i.e. groundwater flow and advective transport, heat transfer, stress redistribution, spalling, rock-water interaction; piping and erosion, montmorillonite transformation, alteration of accessory minerals; chemical and physical degradation of closure materials; corrosion of the copper overpack, and stress corrosion cracking.

190

191
6 REPOSITORY SYSTEM PERFORMANCE − POST-CLOSURE EVOLUTION OVER THE NEXT ~10,000 YEARS
The climate during the post-closure evolution over the next ~10,000 years is essentially expected to remain as today, i.e. a temperate climate in the boreal zone in which Finland is situated (see Ch. 4). Crustal uplift will continue in southern Finland, but at a gradually lower rate. Also groundwater flow and groundwater chemistry will recover from the disturbances caused by the excavation. Thereafter, groundwater flow is governed by the hydraulic gradients caused by the topography and salinity field. The main impact on the groundwater composition will be due to continued infiltration of meteoric waters. The main processes ongoing in the repository during this stage will be water uptake, saturation, swelling and homogenisation of the swelling clays in the buffer, backfill and closure and the gradual decline of the residual heat in the spent nuclear fuel.
6.1 Hydraulic and geochemical evolution of the geosphere
6.1.1 Overview and target properties potentially affected
After repository closure, the site will recover from the disturbances caused by repository construction, operation and closure. Flow rates and infiltration will reduce as the drawdown caused by the repository decreases and saturation of buffer and backfill occurs. The heat generated by the spent nuclear fuel in the canister, most pronounced during the first thousands of years after emplacement, will also impact the flow around the deposition holes and reaction rates of chemical processes. Impacts of the repository tunnels and effects of the rock damage caused by mechanically and thermally induced stress changes are taken into account in assessing groundwater flow after closure of the disposal facility.
During the remaining part of the temperate period, the hydrogeological evolution is driven by the shoreline displacement. After a few thousand years, there are no sea areas around the present Olkiluoto Island, rather there are lakes and rivers at the sites of the current straits north and south of Olkiluoto (Haapanen et al. 2010). As a consequence, the hydraulic gradient increases during the first few thousands of years after repository closure, but remains relatively stable after that.
The mixing of different groundwater types caused by groundwater flow reduces as the flows decrease after closure of the repository. During the following 10,000 years, dilution of groundwaters due to infiltration of meteoric waters continues and the groundwater flow, although at slower rate compared to the excavation and operational phase, causes further, although reduced, mixing of groundwaters. Solute transport is retarded by diffusive mass transfer between the groundwater in fractures and the rock matrix. Water-rock interaction processes buffer the pH and redox conditions and stabilise groundwater composition. Microbial reactions (esp. oxygen consuming and sulphate reducing reactions) also affect groundwater composition. At least locally, an increase of pH due to cementitious leachates from grouting, grout for rock bolts and cement-based materials used in closure is possible; the impact of cement leachates is discussed in Section 6.5.8.

192
The target properties (see Table 2-5) of interest concern groundwater flow rate and transport resistance of the migration routes in the vicinity of the deposition holes and groundwater composition, especially redox conditions and oxygen, chloride, sulphide and methane contents, ionic strength (total charge equivalent of cations), salinity (TDS), iron content as well as colloid and organic content.
Of these, the properties affected by the presence of the EBS and foreign materials introduced in the repository and processes occurring in the near field are discussed in connection with the geochemical evolution of the near field (Sections 6.5 and 6.6). These issues are redox changes due to the presence of oxygen in the repository system and corrosion of the iron-bearing materials, microbial processes related to degradation of organic materials, colloid formation and processes contributing to an increase of pH due to cement leachates.
6.1.2 Groundwater flow
Groundwater flow during the temperate period has been assessed by Löfman & Karvonen (2012) and Hartley et al. (2013b) using the models discussed in Appendix D. The modelling by Löfman & Karvonen (2012) covers the whole temperate period lasting until 50,000 years after present whereas the DFN-based modelling by Hartley et al. (2013b) concentrates on the time period until 10,000 years after present.
The flow rate through the reference volume (having an area of 1.5 km2 and volume of 0.15 m3, for the exact location, see Appendix D) has been estimated by Löfman & Karvonen (2012). According to the modelling results (see Figure 5-2), the flow rate to the reference volume after closure reduces significantly due to the reduced gradients, roughly by two orders of magnitude, compared with flow rates during the operational period. It has been assumed in the model that the backfilled tunnels are saturated at closure. The flow rates recover back to natural conditions before the excavations started only at shallow depths, but in the deeper parts of the rock, including the repository depth, they remain slightly higher than before the excavation of ONKALO and the repository started (see Figure 5-2, Figure 6-1). Specifically, the flow rates in the HZs remain elevated relative to the natural state (Löfman & Karvonen 2012, Figure 5-9). The higher flow rates are related to the changed salinity field, which recovers slowly from the disturbances caused by the excavation and affects the flow field for hundreds of years (see Figure 5-8). As a result of the continuing crustal uplift, higher gradients develop for a while close to the shoreline. After 1000−2000 years, the shoreline has retreated far enough so that further changes in the shoreline do not affect the flow rates in the repository volume. Depending on the model variant, the flow rate into and out of the reference volume at 1000 years is roughly 20 % to 100 % higher than before the operational period; the flow rate at 1000 years varies from 40 m3/a to slightly above 100 m3/a compared with 30 to 80 m3/a before operational period (see Figure 5-2). Similar results are obtained by Hartley et al. (2013b, Figure 6-24; see also Figure 6-2 below): the initial flow rates for the F-paths increase slightly, about 10−20 % during the first few thousand years after closure and remain stable after that. The disturbance caused by the open tunnels is not modelled by Hartley et al. (2013b). The flow direction recovers to the natural state and is mainly downwards.
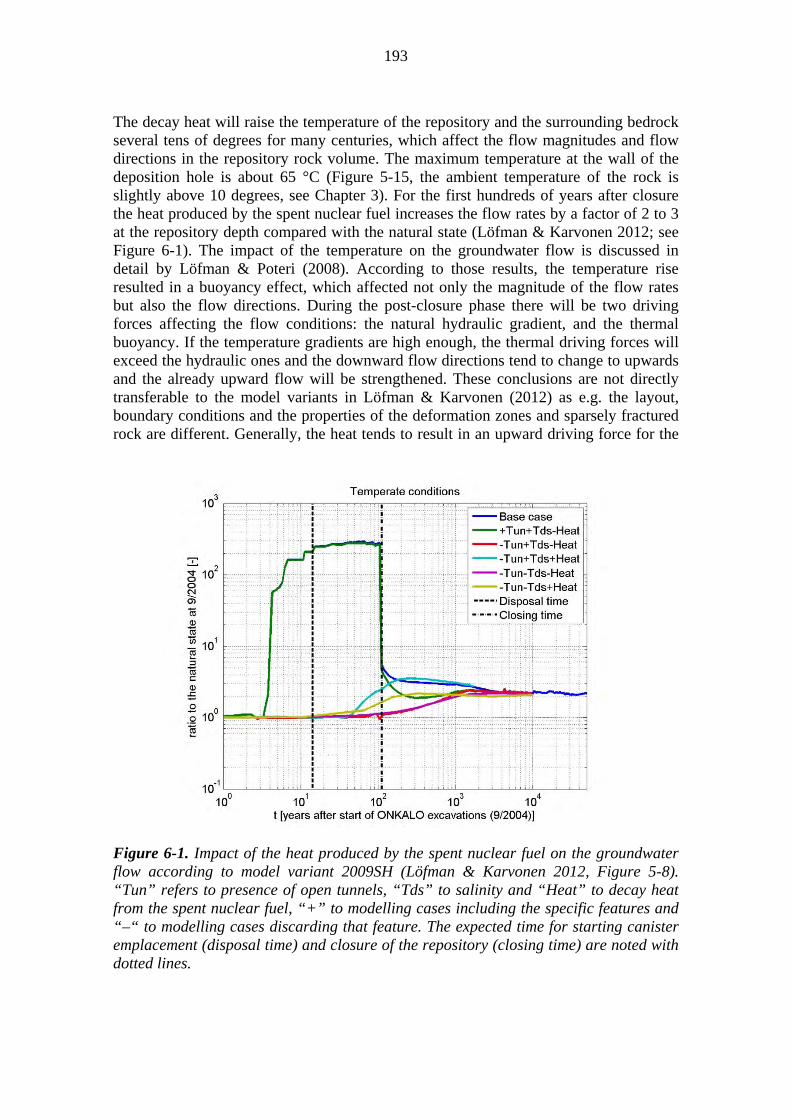
193
The decay heat will raise the temperature of the repository and the surrounding bedrock several tens of degrees for many centuries, which affect the flow magnitudes and flow directions in the repository rock volume. The maximum temperature at the wall of the deposition hole is about 65 °C (Figure 5-15, the ambient temperature of the rock is slightly above 10 degrees, see Chapter 3). For the first hundreds of years after closure the heat produced by the spent nuclear fuel increases the flow rates by a factor of 2 to 3 at the repository depth compared with the natural state (Löfman & Karvonen 2012; see Figure 6-1). The impact of the temperature on the groundwater flow is discussed in detail by Löfman & Poteri (2008). According to those results, the temperature rise resulted in a buoyancy effect, which affected not only the magnitude of the flow rates but also the flow directions. During the post-closure phase there will be two driving forces affecting the flow conditions: the natural hydraulic gradient, and the thermal buoyancy. If the temperature gradients are high enough, the thermal driving forces will exceed the hydraulic ones and the downward flow directions tend to change to upwards and the already upward flow will be strengthened. These conclusions are not directly transferable to the model variants in Löfman & Karvonen (2012) as e.g. the layout, boundary conditions and the properties of the deformation zones and sparsely fractured rock are different. Generally, the heat tends to result in an upward driving force for the
Figure 6-1. Impact of the heat produced by the spent nuclear fuel on the groundwater flow according to model variant 2009SH (Löfman & Karvonen 2012, Figure 5-8). “Tun” refers to presence of open tunnels, “Tds” to salinity and “Heat” to decay heat from the spent nuclear fuel, “+” to modelling cases including the specific features and “–“ to modelling cases discarding that feature. The expected time for starting canister emplacement (disposal time) and closure of the repository (closing time) are noted with dotted lines.
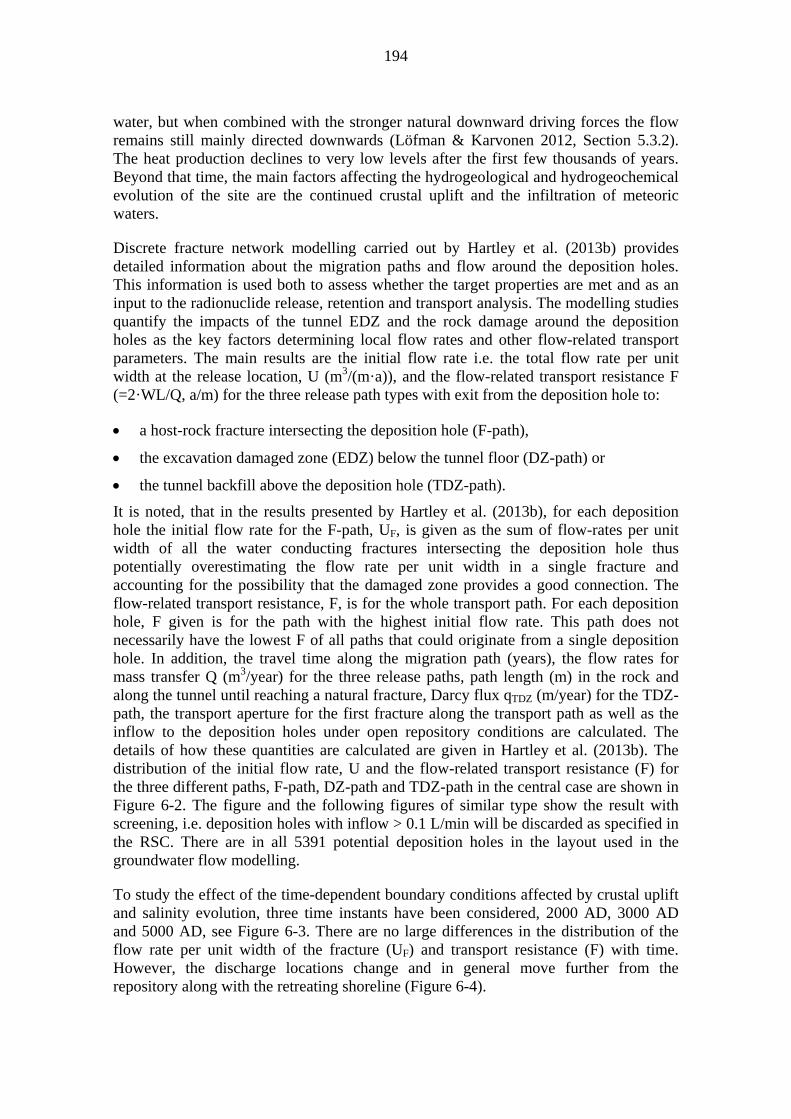
194
water, but when combined with the stronger natural downward driving forces the flow remains still mainly directed downwards (Löfman & Karvonen 2012, Section 5.3.2). The heat production declines to very low levels after the first few thousands of years. Beyond that time, the main factors affecting the hydrogeological and hydrogeochemical evolution of the site are the continued crustal uplift and the infiltration of meteoric waters.
Discrete fracture network modelling carried out by Hartley et al. (2013b) provides detailed information about the migration paths and flow around the deposition holes. This information is used both to assess whether the target properties are met and as an input to the radionuclide release, retention and transport analysis. The modelling studies quantify the impacts of the tunnel EDZ and the rock damage around the deposition holes as the key factors determining local flow rates and other flow-related transport parameters. The main results are the initial flow rate i.e. the total flow rate per unit width at the release location, U (m3/(m·a)), and the flow-related transport resistance F (=2·WL/Q, a/m) for the three release path types with exit from the deposition hole to:
a host-rock fracture intersecting the deposition hole (F-path),
the excavation damaged zone (EDZ) below the tunnel floor (DZ-path) or
the tunnel backfill above the deposition hole (TDZ-path).
It is noted, that in the results presented by Hartley et al. (2013b), for each deposition hole the initial flow rate for the F-path, UF, is given as the sum of flow-rates per unit width of all the water conducting fractures intersecting the deposition hole thus potentially overestimating the flow rate per unit width in a single fracture and accounting for the possibility that the damaged zone provides a good connection. The flow-related transport resistance, F, is for the whole transport path. For each deposition hole, F given is for the path with the highest initial flow rate. This path does not necessarily have the lowest F of all paths that could originate from a single deposition hole. In addition, the travel time along the migration path (years), the flow rates for mass transfer Q (m3/year) for the three release paths, path length (m) in the rock and along the tunnel until reaching a natural fracture, Darcy flux qTDZ (m/year) for the TDZ-path, the transport aperture for the first fracture along the transport path as well as the inflow to the deposition holes under open repository conditions are calculated. The details of how these quantities are calculated are given in Hartley et al. (2013b). The distribution of the initial flow rate, U and the flow-related transport resistance (F) for the three different paths, F-path, DZ-path and TDZ-path in the central case are shown in Figure 6-2. The figure and the following figures of similar type show the result with screening, i.e. deposition holes with inflow > 0.1 L/min will be discarded as specified in the RSC. There are in all 5391 potential deposition holes in the layout used in the groundwater flow modelling.
To study the effect of the time-dependent boundary conditions affected by crustal uplift and salinity evolution, three time instants have been considered, 2000 AD, 3000 AD and 5000 AD, see Figure 6-3. There are no large differences in the distribution of the flow rate per unit width of the fracture (UF) and transport resistance (F) with time. However, the discharge locations change and in general move further from the repository along with the retreating shoreline (Figure 6-4).

195
a)
b)
Figure 6-2. Distribution of the flow rate per unit width U (a) and flow-related transport resistance F (=2·WL/Q, b) for the F, DZ and TDZ release paths (noted as QF, ODZ and QTDZ in figure), for the central case model at 2000 AD (Hartley et al. 2013b, Figures 6-16 and 6-17). Inflow screening is applied i.e. deposition holes with inflow > 0.1 l/min are discarded.
0.0
0.1
0.2
0.3
0.4
0.5
0.6
0.7
0.8
0.9
1.0
-6-5-4-3-2-10
log10(U)[m3/m,a]
fra
cti
on
Number of particles released fromgeosphereQF 4091
QDZ 4820
QTDZ 4922
0.0
0.1
0.2
0.3
0.4
0.5
0.6
0.7
0.8
0.9
1.0
2 3 4 5 6 7 8 9 10 11 12
log10(Fr)[a/m]
frac
tio
n
Number of particles released from geosphere
QF 4091
QDZ 4820
QTDZ 4922
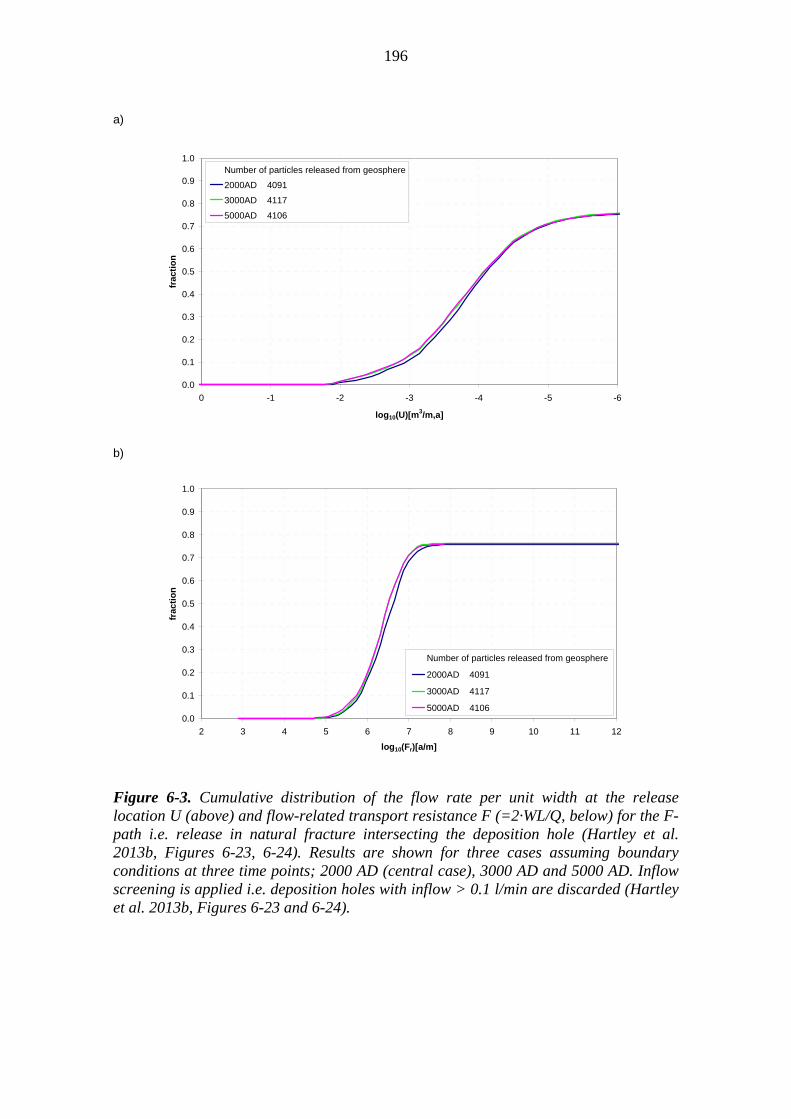
196
a)
b)
Figure 6-3. Cumulative distribution of the flow rate per unit width at the release location U (above) and flow-related transport resistance F (=2·WL/Q, below) for the F- path i.e. release in natural fracture intersecting the deposition hole (Hartley et al. 2013b, Figures 6-23, 6-24). Results are shown for three cases assuming boundary conditions at three time points; 2000 AD (central case), 3000 AD and 5000 AD. Inflow screening is applied i.e. deposition holes with inflow > 0.1 l/min are discarded (Hartley et al. 2013b, Figures 6-23 and 6-24).
0.0
0.1
0.2
0.3
0.4
0.5
0.6
0.7
0.8
0.9
1.0
-6-5-4-3-2-10
log10(U)[m3/m,a]
fra
ctio
nNumber of particles released from geosphere
2000AD 4091
3000AD 4117
5000AD 4106
0.0
0.1
0.2
0.3
0.4
0.5
0.6
0.7
0.8
0.9
1.0
2 3 4 5 6 7 8 9 10 11 12
log10(Fr)[a/m]
frac
tio
n
Number of particles released from geosphere
2000AD 4091
3000AD 4117
5000AD 4106
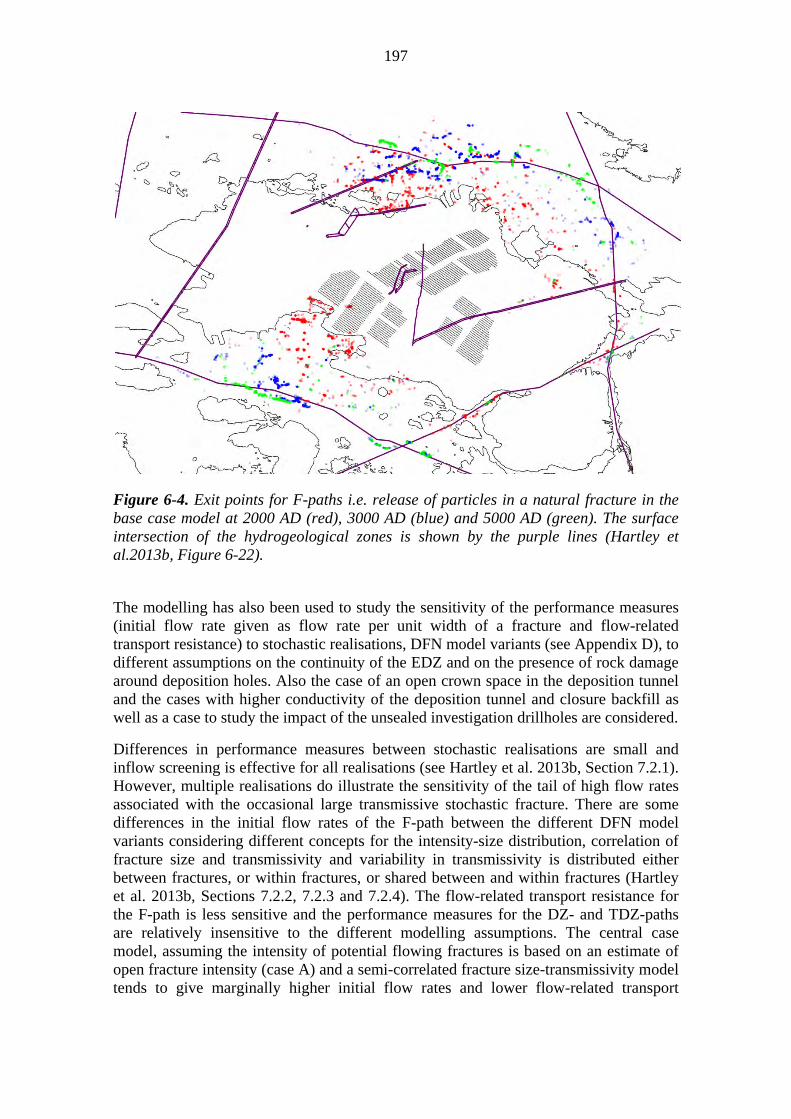
197
Figure 6-4. Exit points for F-paths i.e. release of particles in a natural fracture in the base case model at 2000 AD (red), 3000 AD (blue) and 5000 AD (green). The surface intersection of the hydrogeological zones is shown by the purple lines (Hartley et al.2013b, Figure 6-22).
The modelling has also been used to study the sensitivity of the performance measures (initial flow rate given as flow rate per unit width of a fracture and flow-related transport resistance) to stochastic realisations, DFN model variants (see Appendix D), to different assumptions on the continuity of the EDZ and on the presence of rock damage around deposition holes. Also the case of an open crown space in the deposition tunnel and the cases with higher conductivity of the deposition tunnel and closure backfill as well as a case to study the impact of the unsealed investigation drillholes are considered.
Differences in performance measures between stochastic realisations are small and inflow screening is effective for all realisations (see Hartley et al. 2013b, Section 7.2.1). However, multiple realisations do illustrate the sensitivity of the tail of high flow rates associated with the occasional large transmissive stochastic fracture. There are some differences in the initial flow rates of the F-path between the different DFN model variants considering different concepts for the intensity-size distribution, correlation of fracture size and transmissivity and variability in transmissivity is distributed either between fractures, or within fractures, or shared between and within fractures (Hartley et al. 2013b, Sections 7.2.2, 7.2.3 and 7.2.4). The flow-related transport resistance for the F-path is less sensitive and the performance measures for the DZ- and TDZ-paths are relatively insensitive to the different modelling assumptions. The central case model, assuming the intensity of potential flowing fractures is based on an estimate of open fracture intensity (case A) and a semi-correlated fracture size-transmissivity model tends to give marginally higher initial flow rates and lower flow-related transport

198
resistances than the other model variants. Although, assuming no correlation between fracture size and transmissivity gives a narrower distribution of initial flow rates, with higher median, the maximum initial flow-rates are similar to the central case. Overall, the different model variants give relatively consistent results, which can be attributed to the calibration of the models against the measured PFL flow data. Hartley et al. (2013b, Section 7.3) also compared the results of a DFN model and an ECPM model based on upscaled properties of a DFN model. Findings of this comparison show that the ECPM representation confirms the results obtained with the DFN representation. The DFN model is slightly more conservative in terms of resulting in a slightly broader distribution of initial flow rate, U, and flow-related transport resistance, F, and marginally lower minimum values of F and as higher maximum values of U, since the DFN realisations better resolve the heterogeneity of the system compared to the averaging involving in the ECPM approach.
The connectivity and the flow around the fractures are increased by the presence of the EDZ and rock damage around the deposition hole. The impact of the different assumptions on the continuity of the EDZ and on the presence of the rock damage around the deposition holes and EDZ on the performance measures is shown in Figure 6-5 based on Hartley et al. (2013b, Section 7.1.1). The effect of the increased connectivity is limited to the deposition holes that are not intersected by flowing fractures at all or are intersected by fractures with low initial flow rate (less than 10-4 m3/(m·a)) and high transport resistance (higher than 500,000 years/m). Thus this increase in connectivity does not affect the fulfilment of the target property. There is no great difference between the cases assuming either a discontinuous or continuous EDZ, except for the initial flow rate in the DZ-path. This is because the gaps between the EDZ (0.5 m) are short compared to the deposition hole diameter (1.75 m) and the connectivity provided by the rock damage around the deposition hole. Assuming the presence of a crown space i.e. a highly conductive zone in the top of the tunnel, increases the initial flow rate for the TDZ-path, but hardly affects other performance measures.
Three variants considered the effects of more conductive tunnel backfill, EDZ and rock damage (Hartley et al. 2013b, Section 7.1.2). These had relatively minor effects on flow in fractures around the repository. A more conductive EDZ had the most apparent effect, though still small. Even assuming a ten times higher conductivity for the damage zone and the EDZ, the initial flow rate and the flow-related transport resistance for the F- and TDZ-paths are not significantly affected (see Figure 6-6), whereas the initial flow rate in the EDZ-path increases roughly by a factor of ten. Increasing the conductivity of backfill even by two orders of magnitude in the shafts, ramps and main tunnels had little effects on performance measures. The changes in performance measures, U and F, are limited, since the supply of water is choked by the sparsely fractured rock.
Hartley et al. (2013b, Section 7.5) considered also a variant of the central case with the investigation drillholes included with very high conductivity to examine whether this could affect performance measures. There is little change because although the drillholes are very conductive, they only have a small cross-sectional area compared to natural features such as hydrozones, and the repository layout avoids direct connections

199
between deposition holes and drillholes. However, substantial local increases in the flow-rates could take place if such connections are not avoided.
Figure 6-5. Cumulative distribution of the initial flow rate, U (left), and flow-related transport resistance, F (=2·WL/Q) (right), for particles reaching the model top boundary, with RSC inflow screening applied. Results are shown for the three release path types: release in natural fracture (F-path, top), in EDZ (DZ-path, middle) or in tunnel backfill above the tunnel (TDZ-path, bottom) (Hartley et al. 2013b, Figures 7-1 and 7-2). Results represent different assumptions on the continuity of EDZ and on the presence of rock damage around deposition holes, as well as case assuming that top part of the backfill has high conductivity (presence of a crown space). In the Base Case, a discontinuous EDZ and rock damage around the deposition hole are assumed. (Note: for the DZ-path there is no CDF for the No EDZ case).
0.0
0.1
0.2
0.3
0.4
0.5
0.6
0.7
0.8
0.9
1.0
-6-5-4-3-2-10
log10(U)[m3/m,a]
frac
tio
n
Base Case
No EDZ
Continuous EDZ
No Spalling
Crown Spacing
0.0
0.1
0.2
0.3
0.4
0.5
0.6
0.7
0.8
0.9
1.0
2 3 4 5 6 7 8 9 10 11 12
log10(Fr)[a/m]
frac
tio
n
Base Case
No EDZ
Continuous EDZ
No Spalling
Crown Spacing
0.0
0.1
0.2
0.3
0.4
0.5
0.6
0.7
0.8
0.9
1.0
-6-5-4-3-2-10
log10(U)[m3/m,a]
frac
tio
n
Base Case
Continuous EDZ
No Spalling
Crown Spacing
0.0
0.1
0.2
0.3
0.4
0.5
0.6
0.7
0.8
0.9
1.0
2 3 4 5 6 7 8 9 10 11 12
log10(Fr)[a/m]
frac
tio
n
Base Case
Continuous EDZ
No Spalling
Crown Spacing
0.0
0.1
0.2
0.3
0.4
0.5
0.6
0.7
0.8
0.9
1.0
-6-5-4-3-2-10
log10(U)[m3/m,a]
frac
tio
n
Base Case
No EDZ
Continuous EDZ
No Spalling
Crown Spacing
0.0
0.1
0.2
0.3
0.4
0.5
0.6
0.7
0.8
0.9
1.0
2 3 4 5 6 7 8 9 10 11 12
log10(Fr)[a/m]
frac
tio
n
Base Case
No EDZ
Continuous EDZ
No Spalling
Crown Spacing

200
Figure 6-6. Cumulative distribution of the initial flow rate, U (left), and flow-related transport resistance, F (=2·WL/Q) (right), for particles reaching the model top boundary, with RSC inflow screening applied. Results are shown for the three release path types: release in natural fracture (F-path, top), in EDZ (DZ-path, middle) or in tunnel backfill above the tunnel (TDZ-path, bottom) (Hartley et al. 2013b, Figures 7-4 and 7-5). Results represent different assumptions on the conductivity of the EDZ, the backfill in the deposition tunnels and other tunnels.
6.1.3 Groundwater composition
This Section addresses the evolution of the groundwater composition, which has been assessed by groundwater flow and solute transport modelling (Löfman & Karvonen 2012 and Hartley et al. 2013b) and by reactive transport modelling (Trinchero et al. 2013), see also Appendix D for a summary of the models. Different models are applied
0.0
0.1
0.2
0.3
0.4
0.5
0.6
0.7
0.8
0.9
1.0
-6-5-4-3-2-10
log10(U)[m3/m,a]
fra
ctio
n
Base Case
EDZ & Spalling (Tx10)
All Tunnels (Tx10)
Main Tunnels (Tx100)
0.0
0.1
0.2
0.3
0.4
0.5
0.6
0.7
0.8
0.9
1.0
2 3 4 5 6 7 8 9 10 11 12
log10(Fr)[a/m]
frac
tio
n
Base Case
EDZ & Spalling (Tx10)
All Tunnels (Tx10)
Main Tunnels (Tx100)
0.0
0.1
0.2
0.3
0.4
0.5
0.6
0.7
0.8
0.9
1.0
-6-5-4-3-2-10
log10(U)[m3/m,a]
fra
ctio
n
Base Case
EDZ & Spalling (Tx10)
All Tunnels (Tx10)
Main Tunnels (Tx100)0.0
0.1
0.2
0.3
0.4
0.5
0.6
0.7
0.8
0.9
1.0
2 3 4 5 6 7 8 9 10 11 12
log10(Fr)[a/m]
fra
ctio
n
Base Case
EDZ & Spalling (Tx10)
All Tunnels (Tx10)
Main Tunnels (Tx100)
0.0
0.1
0.2
0.3
0.4
0.5
0.6
0.7
0.8
0.9
1.0
-6-5-4-3-2-10
log10(U)[m3/m,a]
fra
ctio
n
Base Case
EDZ & Spalling (Tx10)
All Tunnels (Tx10)
Main Tunnels (Tx100)
0.0
0.1
0.2
0.3
0.4
0.5
0.6
0.7
0.8
0.9
1.0
2 3 4 5 6 7 8 9 10 11 12
log10(Fr)[a/m]
frac
tio
n
Base Case
EDZ & Spalling (Tx10)
All Tunnels (Tx10)
Main Tunnels (Tx100)

201
to address different aspects of groundwater flow, solute transport and hydrogeochemistry that cannot all be handled with a single model. The modelling by Löfman & Karvonen (2012) and Hartley et al. (2013b) address the changes in salinity, whereas Trinchero et al. (2013) present a more comprehensive discussion on the evolution of groundwater composition. The study by Trinchero et al. (2013) has been extended by Wersin et al. (2013c) to discuss sulphide evolution in more detail. All of these models consider the diffusive mass exchange between the fractures and rock matrix. The mixing of the infiltrating waters with the initial waters modelled as hydrodynamic dispersion is considered by Löfman & Karvonen (2012) and by Trinchero et al. (2013), the latter takes into account the main geochemical reactions. The models by Hartley et al. (2013b) and Trinchero et al. (2013) consider changes in the groundwater composition along one-dimensional streamlines based on the groundwater flow modelling results by Hartley et al. (2013b, discrete fracture network model) and Löfman & Karvonen (2012, equivalent porous medium model), respectively. Löfman & Karvonen (2012), on the other hand, calculate the salinity distribution in the entire modelling volume.
Groundwater salinity
The salinity evolution has been estimated based on the modelling by Löfman & Karvonen (2012) and Trinchero et al. (2013). The results by Hartley et al. (2013b), equivalent to model variant 2011HE applied by Löfman & Karvonen (2012) focussing on potential dilution are also referred to but discussed in more detail in Section 7.1.1.
The salinity evolution is shown in Figure 5-8 and Figure 6-7 based on the two model variants, 2009SH and 2011HE considered in the modelling by Löfman & Karvonen (2012). All the three model variants resulted in a more or less similar behaviour of the salinity field. Following the reduced flow in the repository volume and the recovery of the downward flow direction, the salinity field recovers from the disturbance caused by the repository excavation. The recovery of the salinity field is slower than that of the flow field. The changes in salinity are faster within and close to the hydrogeological zones compared with sparsely fractured rock, as can be seen from Figure 6-7. In the model variant with heterogeneous properties of the sparsely fractured rock (2011HE), there is more variation in salinity at repository depth and, specifically, areas with low salinity develop with time. The maximum salinities reach the level prevailing before the construction within a few thousand years, whereas the minimum salinity in the reference volume rises close to, but does not quite reach the level prevailing before construction within a few hundred years. There is a slowly decreasing trend of the average salinity due to dilution by infiltrating fresh waters. For the same reason, the minimum salinity in the reference volume starts to decrease after about one thousand to a few thousand years depending on the model.

202
Model variant 2009SH layout for 5500 tU and the hydrogeological model
2009 with semi-homogeneous (SH) hydraulic properties of the hydrogeological zones (HZ) and
sparsely fractured rock (SFR)
Model variant 2011HE layout for 9000 tU and the hydrogeological model
2011 with the heterogeneous (HE) hydraulic properties of the hydrogeological zones (HZ) and
sparsely fractured rock (SFR)
t = 1000 years
t = 10,000 years
Figure 6-7. Distribution of the salinity at the repository level (Z = -410 m) at 1000 and at 10,000 years after the start of the disposal operations for the model variants 2009SH and 2011HE (Löfman & Karvonen 2012).
According to the results assuming base case properties of transport parameters, the salinity (TDS) in the reference volume is in the range of about 5 g/L to 20 g/L in the time period of 1000–10,000 years. The average salinity reduces from about 12 g/l to about 10 g/L during the 10,000 years period. However, the model variant 2011HE, based on heterogeneous properties of the hydrogeological zones and sparsely fractured rock, gives a minimum salinity of about 0.7 g/L within 10,000 years. Assuming either more pessimistic values for flow and diffusion porosity, or heterogeneous properties for the sparsely fractured rock, results in lower minimum salinity at repository depth (Löfman & Karvonen 2012, Appendix G and Figure 6-7 above).
Hartley et al. (2013b, Appendix K) have estimated the fraction of deposition holes that may be affected by dilute conditions (TDS <0.4 g/L equivalent to 4 mM cations) by assessing dilution along recharge paths (for description of the model, see Appendix D). According to their model, about twenty deposition holes may experience dilute

203
conditions during the first 10,000 years after repository closure. These results are discussed in more detail in Section 7.1.3.
The models applied by Löfman & Karvonen (2012) and Hartley et al. (2013b) consider mass transfer between the flowing water in fractures and the rock matrix by diffusion. However, water-rock interactions are not taken into account. Therefore also reactive transport simulations that enable to take into account such processes were applied to study the salinity evolution and evolution of the groundwater composition in general (see Appendix D, for the modelling approach and Trinchero et al. (2013) for details). The computed values for chloride (0.1–0.2 mol/L) and TDS (7–10 g/L) are shown in Figure 6-8 and are within the limits set by the target ranges and in line with the results by Löfman & Karvonen (2012). There is a constant decrease in salinity as a consequence of the infiltration processes that occur at the surface. Nonetheless, the decrease of salinity is very slow being counterbalanced by the release of dissolved solids from the matrix pore water. The charge concentration of cations shows a similar, slowly decreasing trend as the salinity in general, and the values remain above 0.1 mol/L over the 10,000 year time period (see Figure 6-9).
All the modelling results show a slight decline in the salinity during the 10,000 years period. All the models give similar results about the range of salinity, and the average salinity is predicted to remain at about 10 g/L. The models assuming heterogeneous properties of the hydrogeological zones and the sparsely fractured rock show more spatial variability in the salinity, related to hydrogeological zones and large stochastic fractures with lower salinities with a minimum of about 1 g/L.
Figure 6-8. Box-and-whisker plots showing the statistical distribution of Cl- concentration (mol/L) and TDS (g/L) values at the repository depth for the operational and temperate periods. The statistical measures are the median, the 10th and 90th percentile (box), and the maximum and the minimum values (“whiskers”) (Trinchero et al. 2013, Figure 5-2).
10-3
10-2
10-1
100
Cl- (
mol
/L)
1
10
100
TD
S (
g/L
)
TemperatePeriod TemperatePeriod
Op.
Period
Op.
Period
200y 500y 700y 1 ky 2 ky 5 ky 7 ky 10 ky

204
Figure 6-9. Box-and-whisker plots showing the statistical distribution of ∑q[Mq+](mol/L) values at the repository depth for the operational and temperate periods. The statistical measures are the median, the 10th and 90th percentile (box), and the maximum and the minimum values (“whiskers”) (Trinchero et al. 2013). The target property is defined as ∑q[Mq+](mol/L) > 4 mmol/L.
pH and redox conditions
As discussed in Section 3.1, pH is mainly controlled by dissolution/precipitation of calcite and the redox conditions by Fe sulphide minerals. These assumptions form the basis for the conceptual models implemented by Trinchero et al. (2013) used to asses the evolution of the pH, redox conditions and buffering capacity of the rock with time (see Appendix D, for the summary of the modelling approach).
The computed pH values by Trinchero et al. (2013) are quite constant around 7.5 and the Eh values remain in the range of anoxic conditions. In the Base Case, pyrite is assumed to be present in the fracture-coating minerals. In the Variant Case, the presence of amorphous iron sulphide (FeS(am)) in the fracture coating minerals is assumed. The average Eh values of the Variant Case are slightly lower than those computed for the Base Case (around -190 mV for the latter and -250 mV for the former). The distribution of pH and Eh values over time is shown in Figure 6-10. Consumption of oxygen in infiltrating water is discussed in Section 5.1.3.
To evaluate the buffering capacity at the Olkiluoto site, a detailed study of the mass balance of calcite and pyrite/FeS(am) as well as an analysis of key geochemical parameters (pH and Eh) has been carried out along a representative streamline and over the time window to 10,000 years AP (Trinchero et al. 2013). A summary of the pH and Eh values and the amount of calcite and pyrite precipitating along the transport path is shown in Figure 6-12). The main changes in pH occur at the interface between the brackish carbonate rich and brackish sulphate rich water, where pH decreases along with calcite precipitation. Similarly to pH and calcite, changes in the redox potential and pyrite precipitation take place due to their mutual interdependence. The changes are most pronounced at the above mentioned interfaces between different water types.
10-2
10-1
100
Na
+ K
+ 2
*(C
a+M
g) (
mol
/L)
200y 500y 700y 1 ky 2 ky 5 ky 7 ky 10 kyOp. Period
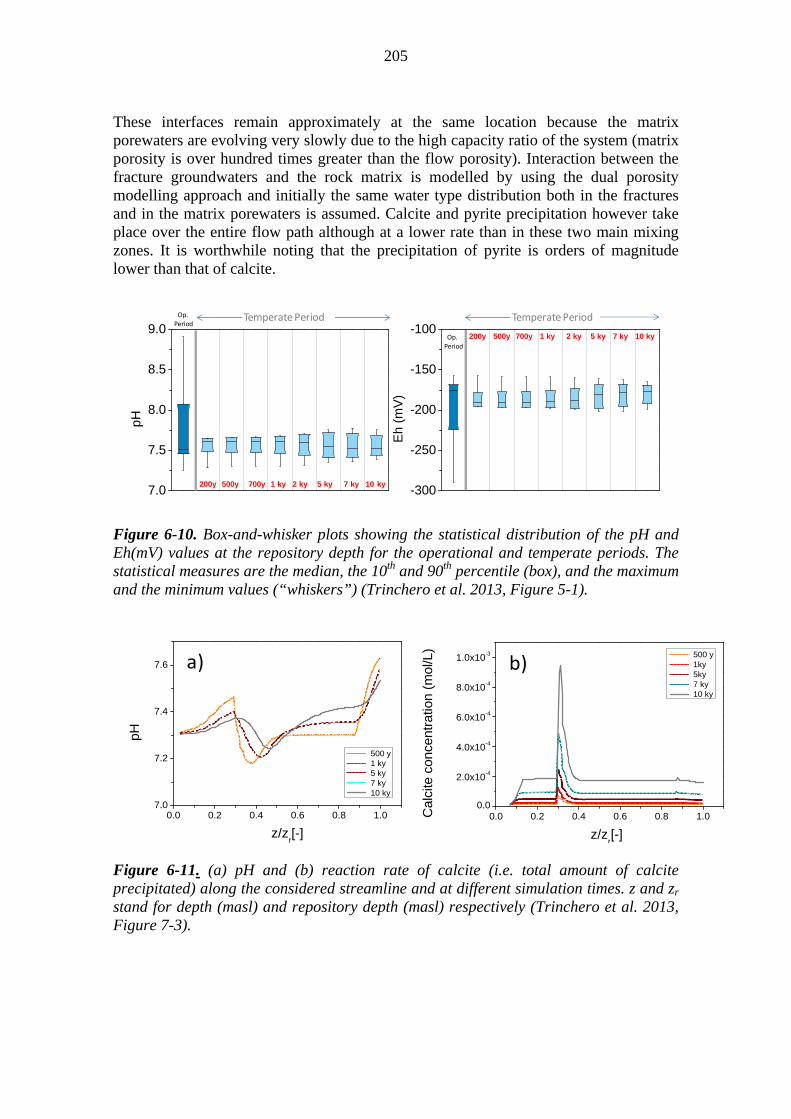
205
These interfaces remain approximately at the same location because the matrix porewaters are evolving very slowly due to the high capacity ratio of the system (matrix porosity is over hundred times greater than the flow porosity). Interaction between the fracture groundwaters and the rock matrix is modelled by using the dual porosity modelling approach and initially the same water type distribution both in the fractures and in the matrix porewaters is assumed. Calcite and pyrite precipitation however take place over the entire flow path although at a lower rate than in these two main mixing zones. It is worthwhile noting that the precipitation of pyrite is orders of magnitude lower than that of calcite.
Figure 6-10. Box-and-whisker plots showing the statistical distribution of the pH and Eh(mV) values at the repository depth for the operational and temperate periods. The statistical measures are the median, the 10th and 90th percentile (box), and the maximum and the minimum values (“whiskers”) (Trinchero et al. 2013, Figure 5-1).
Figure 6-11. (a) pH and (b) reaction rate of calcite (i.e. total amount of calcite precipitated) along the considered streamline and at different simulation times. z and zr stand for depth (masl) and repository depth (masl) respectively (Trinchero et al. 2013, Figure 7-3).
0.0 0.2 0.4 0.6 0.8 1.07.0
7.2
7.4
7.6
pH
z/zr[-]
500 y 1 ky 5 ky 7 ky 10 ky
0.0 0.2 0.4 0.6 0.8 1.00.0
2.0x10⁻⁴
4.0x10⁻⁴
6.0x10⁻⁴
8.0x10⁻⁴
1.0x10⁻³
Calc
ite c
once
ntr
atio
n (
mol/L
)
z/zr[-]
500 y 1ky 5ky 7 ky 10 ky
a) b)
7.0
7.5
8.0
8.5
9.0
pH
-300
-250
-200
-150
-100
Eh
(mV
)
TemperatePeriod TemperatePeriodOp. Period
Op.
Period
200y 500y 700y 1 ky 2 ky 5 ky 7 ky 10 ky
200y 500y 700y 1 ky 2 ky 5 ky 7 ky 10 ky

206
Figure 6-12. (a) Eh(mV) and (b) reaction rate of pyrite (i.e. total amount of pyrite precipitated) along the considered streamline and at different simulation times. z and zr stand for depth (masl) and repository depth (masl) respectively (Trinchero et al. 2013, Figure 7-4).
Dissolved iron and sulphide in the groundwater
According to the discussions in Section 3.1, the sulphide level in the natural state is well below 1 mg/L, and solubility control changes from amorphous iron sulphides with a moderate solubility towards pyrite with a very low solubility at steady state conditions (Figure 3-16). Amorphous iron sulphide and mackinawite are transformed to more stable pyrite with time, as indicated by experimental data and observations in sedimentary systems (e.g. Schoonen & Barnes 1991, Wersin et al. 2013c). Nonetheless a pessimistic value of 3 mg/L has been adopted for corrosion calculation later on in this report, which accounts for the solubility control by the more soluble amorphous iron sulphide in combination with kinetically constrained availability of iron and the uncertainties related to microbial activity and availability of energy sources and nutrients.
The long-term evolution of dissolved sulphide and iron is assessed with reactive transport modelling approach by Trinchero et al. (2013), Wersin et al. (2013c) (for a summary of the modelling approach, see Appendix D). Similarly to the operational period, sulphide and iron concentrations are equilibrated with pyrite or amorphous iron sulphide (two different solubility constants were used). Three different sources of ferrous iron have been considered: i) Fe2+ concentrations, ii) an additional source of iron provided by the kinetic dissolution of chlorite and alternatively iii) an additional Fe input due to the dissolution of Fe bearing calcite, a solid solution with 0.1 wt-% Fe.
As expected, assuming FeS(am) to be in equilibrium with the groundwater results in 4−5 orders of magnitude higher HS- concentrations, than in the case assuming pyrite equilibrium (Figure 6-13). Dissolved sulphide concentrations computed for FeS(am) cases are in the range of HS- concentrations measured in natural groundwaters at Olkiluoto (Pitkänen et al. 2007a, b, 2008a, 2009, Site Description, Chapter 7.4). The predicted sulphide concentrations are about 0.3 mg/L in the case of amorphous FeS
0.0 0.2 0.4 0.6 0.8 1.0-200
-190
-180
-170
-160
-150
E
h (
mV
)
z/zr[-]
500 y 1 ky 5 ky 7 ky 10 ky
0.0 0.2 0.4 0.6 0.8 1.00.0
5.0x10⁻¹²
1.0x10⁻¹¹
1.5x10⁻¹¹ 500 k 1 ky 5 ky 7 ky 10 ky
Pyr
ite c
on
cen
trat
ion
(m
ol/L
)
z/zr[-]
a) b)
207
(FeS(am)D based on a solubility constant by Davison et al. (1999) in Figure 6-12a). Solubility will halve as mackinawite reaches equilibrium, which is approximately indicated by sulphide concentrations calculated with FeS(am).
Chlorite, as an additional source of iron, results in an increase in the computed Fe2+ concentrations and a consequent decrease in HS- concentration in groundwaters at repository depth by almost one order of magnitude (Figure 6-12). Instead, the dissolution of Fe-bearing calcite is insignificant according to the calculations. The minor dissolution of calcite and release of Fe does not change much the final concentrations of Fe2+ and HS- at the repository depth compared to the cases without any mineral iron sources.
The modelling results indicate only a slight change in the long-term evolution of HS- and Fe2+ concentrations during the temperate period (Figure 6-12 and Figure 6-13a, b). This is a consequence of the presence of the brackish SO4 water, which progressively reaches deeper depths and affects more positions of the repository. However, the progressively larger signature of brackish SO4 water during the temperate period does not, according to these simulations, have any significant effect on the HS- concentration at repository depth.
In general, the most “pessimistic” approaches in these calculations are those assuming no additional sources of Fe2+ in the rock. Calculations do not include microbial SO4 reduction as a sulphide source, which may occasionally be activated by mixing of different groundwater types and significantly increase sulphide concentrations on a higher level than predicted by iron sulphide equilibrium (cf. Section 3.1). However, chlorite is a very common fracture mineral in Olkiluoto bedrock and forms potential buffering capacity to control sulphide concentrations. Iron gradually released from fracture infillings may precipitate and decrease elevated sulphide concentrations. Calculation results of amorphous FeS(am) as a controlling phase with and without chlorite suggest that kinetic dissolution of chlorite is able to decrease abrupt elevations of dissolved sulphide clearly within few years (Figure 6-14, Wersin et al. 2013c). The calculation results support the continuing supply of iron from the rock leading to iron sulphide precipitation and decrease of elevated sulphide concentrations observed in groundwater monitoring data at Olkiluoto.

208
a)
Figure 6-13 (a). Box-and-whisker plots showing the statistical distribution of HS- and Fe2+ in groundwater entering repository tunnels for the variant cases assuming equilibrium of a) FeS(am) and b) pyrite with additional Fe sources chlorite (Chl) and Fe-bearing calcite solid solution (SS) during temperate period at 1000 and 10,000 years. FeS(am)D represents equilibrium values calculated based on a solubility constant by Davison et al. (1999). Other results (FeS(am)) are based on a solubility constant in PHREEQC database, which represents relatively well values presented for mackinawite (Wersin et al. 2013c). The statistical measures are the median, the 5th and 95th percentile (box), and the maximum and the minimum values (whiskers) (from Wersin et al. 2013c).
1.E‐07
1.E‐06
1.E‐05
1.E‐04
FeS (am) FeS (am)D Chl+FeS (am)
SS+FeS (am)
HS
- co
nce
ntra
tion
(mol
/L)
1ky1.E‐06
1.E‐05
1.E‐04
FeS (am) FeS (am)D Chl+FeS (am)
SS+FeS (am)
Fe2
+ co
nce
ntra
tion
(mol
/L)
1ky
1.E‐07
1.E‐06
1.E‐05
1.E‐04
FeS (am) FeS (am)D Chl+FeS (am)
SS+FeS (am)
HS
- co
nce
ntra
tion
(mol
/L)
10ky1.E‐06
1.E‐05
1.E‐04
FeS (am) FeS (am)D Chl+FeS (am)
SS+FeS (am)
Fe2
+ co
nce
ntra
tion
(mol
/L)
10ky

209
b)
Figure 6-13 (b). Box-and-whisker plots showing the statistical distribution of HS- and Fe2+ in groundwater entering repository tunnels for the variant cases assuming equilibrium of a) FeS(am) and b) pyrite with additional Fe sources chlorite (Chl) and Fe-bearing calcite solid solution (SS) during temparate period at 1000 and 10,000 years. FeS(am)D represents equilibrium values calculated based on a solubility constant by Davison et al. (1999). Other results (FeS(am)) are based on a solubility constant in PHREEQC database, which represents relatively well values presented for mackinawite (Wersin et al. 2013c). The statistical measures are the median, the 5th and 95th percentile (box), and the maximum and the minimum values (whiskers) (from Wersin et al. 2013c).
1.E‐12
1.E‐11
1.E‐10
Pyrite Chl+Pyrite SS+Pyrite
HS
- co
nce
ntra
tion
(mol
/L)
1ky1.E‐06
1.E‐05
1.E‐04
1.E‐03
Pyrite Chl+Pyrite SS+Pyrite
Fe2
+ co
nce
ntra
tion
(mol
/L)
1ky
1.E‐12
1.E‐11
1.E‐10
Pyrite Chl+Pyrite SS+Pyrite
HS
- co
ncen
trat
ion (m
ol/L
)
10ky1.E‐06
1.E‐05
1.E‐04
1.E‐03
Pyrite Chl+Pyrite SS+Pyrite
Fe2
+ co
nce
ntra
tion
(mol
/L)
10ky
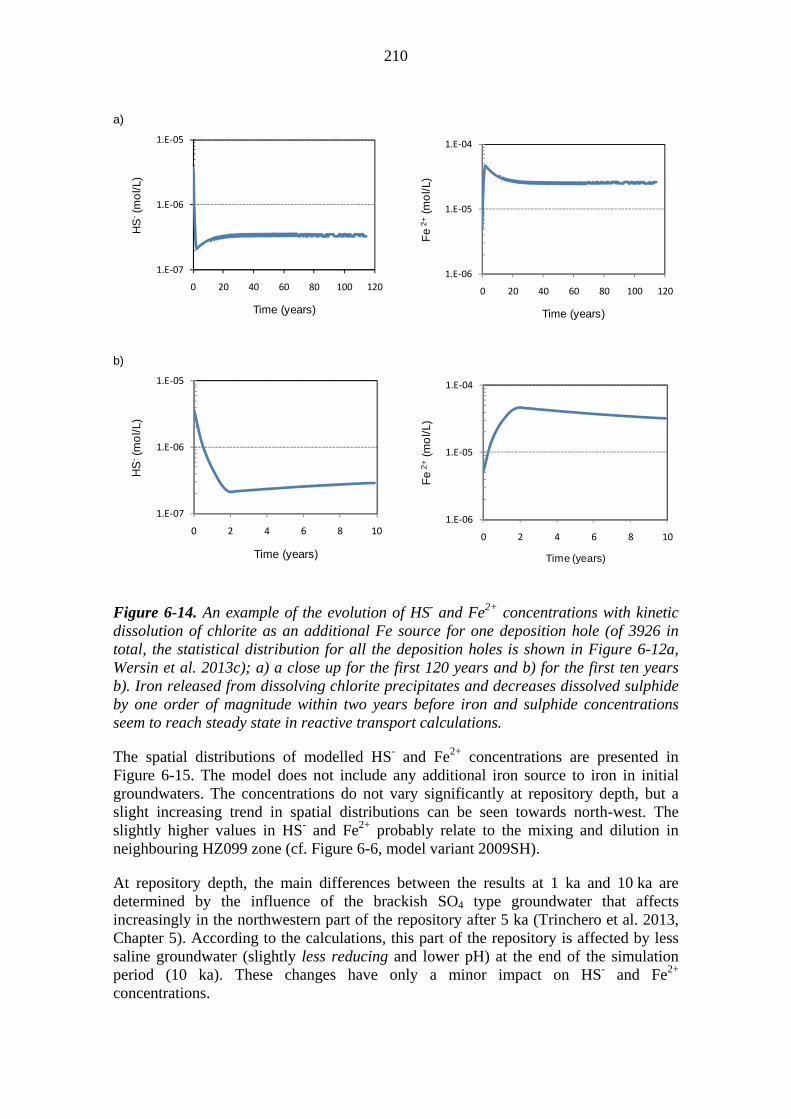
210
a)
b)
Figure 6-14. An example of the evolution of HS- and Fe2+ concentrations with kinetic dissolution of chlorite as an additional Fe source for one deposition hole (of 3926 in total, the statistical distribution for all the deposition holes is shown in Figure 6-12a, Wersin et al. 2013c); a) a close up for the first 120 years and b) for the first ten years b). Iron released from dissolving chlorite precipitates and decreases dissolved sulphide by one order of magnitude within two years before iron and sulphide concentrations seem to reach steady state in reactive transport calculations.
The spatial distributions of modelled HS- and Fe2+ concentrations are presented in Figure 6-15. The model does not include any additional iron source to iron in initial groundwaters. The concentrations do not vary significantly at repository depth, but a slight increasing trend in spatial distributions can be seen towards north-west. The slightly higher values in HS- and Fe2+ probably relate to the mixing and dilution in neighbouring HZ099 zone (cf. Figure 6-6, model variant 2009SH).
At repository depth, the main differences between the results at 1 ka and 10 ka are determined by the influence of the brackish SO4 type groundwater that affects increasingly in the northwestern part of the repository after 5 ka (Trinchero et al. 2013, Chapter 5). According to the calculations, this part of the repository is affected by less saline groundwater (slightly less reducing and lower pH) at the end of the simulation period (10 ka). These changes have only a minor impact on HS- and Fe2+ concentrations.
1.E‐07
1.E‐06
1.E‐05
0 20 40 60 80 100 120
HS
-(m
ol/L
)
Time (years)
1.E‐06
1.E‐05
1.E‐04
0 20 40 60 80 100 120
Fe
2+
(mo
l/L)
Time (years)
1.E‐07
1.E‐06
1.E‐05
0 2 4 6 8 10
HS
-(m
ol/L
)
Time (years)
1.E‐06
1.E‐05
1.E‐04
0 2 4 6 8 10
Fe
2+(m
ol/L
)
Time (years)
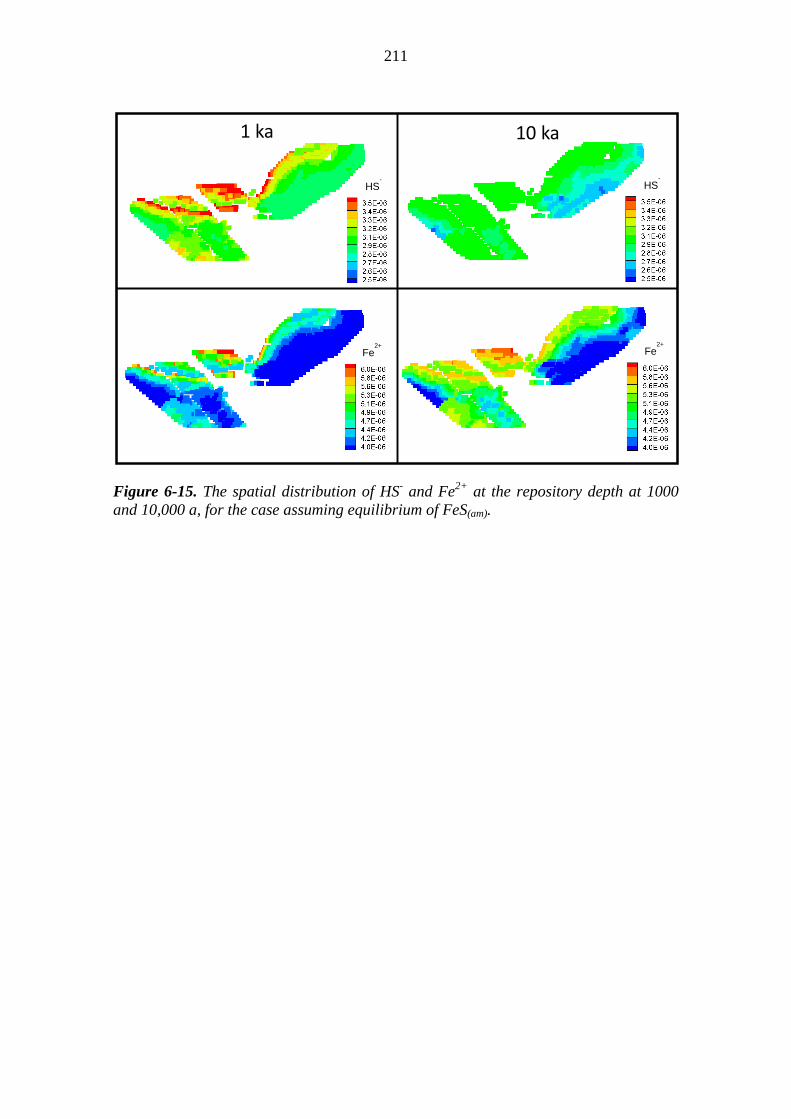
211
Figure 6-15. The spatial distribution of HS- and Fe2+ at the repository depth at 1000 and 10,000 a, for the case assuming equilibrium of FeS(am).
1 ka 10 ka
HS-
HS-
Fe2+
Fe2+
212
6.1.4 Summary, uncertainties and issues that need propagation
After closure of the disposal facility, the site will recover from the disturbances caused by repository construction, operation and closure. Flow rates will reduce as the drawdown caused by the repository decreases and saturation of buffer and backfill occurs. The heat generated by the spent nuclear fuel canister, most pronounced during the first thousands of years after emplacement, will also have an impact on the flow around the deposition holes and reaction rates of chemical processes. The impact of the repository tunnels and the effect of the rock damage caused by mechanical and thermally induced stress changes have been taken into account in assessing the groundwater flow over the post closure period. During this period the main factors affecting the hydrogeological and hydrogeochemical evolution of the site are the continued crustal uplift and infiltration of meteoric waters. The recovery of the flow field after closure is relatively rapid whereas the salinity field recovers more slowly. For the first hundreds of years the heat produced by the spent nuclear fuel increases the flow rates at repository depth by a factor of 2 to 3 compared with the natural state. Generally the heat tends to result in an upward driving force for the water, but when combined with the stronger natural downward driving forces the flow remains still mainly directed downwards.
The main conclusion from the modelling studying the impacts of the excavation damaged zone and the potential rock damage around the deposition holes on the groundwater flow is that the connectivity is indeed increased, but the effect of the increased connectivity is limited to the deposition holes that are not intersected by flowing fractures at all or are intersected by fractures with low flow rates per unit width (less than 10-4 m3/(m·a)) and high transport resistance (higher than 500,000 years/m) and the fraction of deposition holes having values outside these limits is not increased. Thus the target properties concerning flow rates in the natural fractures and the transport resistances in the vicinity of the deposition holes are not violated. There is a lack of data on the hydraulic properties of the excavation damaged zone and the rock damage zone around the deposition holes and this uncertainty has been addressed by using a number of conservative assumptions for those properties, i.e. a high transmissivity and connectivity.
As the disturbances caused by repository construction cease, also the groundwater composition stabilises and the variation seen during the operational period is diminished meaning that the few local values that were out of the range defined by target properties vanish.
The pH remains close to 7.5 and anoxic conditions prevail. During this time frame, as a result of the infiltration of meteoric water at a slow, but constant rate, there is a reducing trend of salinity, chloride and total charge concentration of cations. These values are however expected to stay within the limits set by the target values. There are modelling results that indicate the possibility of a few canister positions experiencing dilute conditions immediately after closure. This result is however considered to be due to simplified and pessimistic model assumptions and does not reflect the overall understanding of the likely future hydrogeochemical evolution of the site. The possibility for the dilute water conditions during different periods of the glacial cycle is discussed in detail in Section 7.1.3. All the modelling results show that the estimation of
213
the salinity evolution and the groundwater evolution in general is sensitive to the parameters affecting salt transport: flow and diffusion porosity and dispersivity and the buffering effect of the matrix. Therefore an understanding of the interaction between the fracture water and matrix pore waters will be further developed in the next research period 2013−2015.
The sulphide concentrations in the groundwaters after the post-closure period up to 10,000 years are expected to recover towards the steady state conditions and it is expected that the initially controlling amorphous iron sulphide phases will successively evolve towards more crystalline phases with a lower solubility. As described in Section 6.1.3, the sulphide concentrations decrease from anomalously high values once the groundwater conditions stabilise, and the recovery towards less disturbed conditions seems to be quite rapid, within years to tens of years, based on the observations from monitoring the drillholes. In addition, the results of reactive transport calculations indicate that iron available from fracture minerals, i.e. chlorite, is able to buffer sulphide concentration on low level in a kinetically controlled process within few years. Although the groundwater data and calculations clearly indicate sulphide concentrations values below 1 mg/L, a pessimistic upper bound of 3 mg/L is adopted, which accounts for the possible solubility control by the more soluble amorphous iron sulphide in combination with the kinetically constrained availability of iron and the uncertainties related to the microbial activity and availability of energy sources and nutrients.
6.2 Thermal evolution of the near field
6.2.1 Overview and performance targets potentially affected
After repository closure, temperatures will continuously decrease with time. This decrease is related to a decrease in the heat generation by the spent nuclear fuel due to radioactive decay. One performance target (Table 2-2) is directly affected by the thermal evolution:
The buffer shall transfer the heat from the canister efficiently enough to keep the buffer temperature < 100 °C (L3-BUF-6).
The processes affecting the thermal evolution are discussed in Section 5.2.2. In addition, a number of other processes affecting repository evolution are either directly or indirectly temperature dependent, e.g. water uptake and swelling (Section 6.4), montmorillonite transformation (Section 6.5.3), microbial activity (Sections 5.1.3, 5.5.2, and 6.5.6), groundwater flow (Section 6.1.2), and spalling of the near-field rock (Section 5.3.3). Although the maximum temperatures in the near field are reached during the operational phase, these processes are affected by the temperature that remains relatively high for thousands of years (see Figure 5-15).
6.2.2 Summary, uncertainties and issues that need propagation
During the first 10,000 years after repository closure, temperatures in the near field will decrease from those expected during the operational phase, as a result of the reduced heat production by the canister due to radioactive decay and as the heat is dissipated through the rock towards the surface. There are uncertainties in the detailed temperature distribution in the near field, but they are not expected to affect the estimated maximum temperatures. Therefore, as the buffer temperature is expected to remain below 100 °C

214
(L3-BUF-6) during the operational phase, there is no reason to assume this requirement would not be fulfilled after the operational phase.
At the end of the operational phase (after 100 years), the canister surface temperature is 70 to 80°C depending on the saturation of the buffer and the maximum temperature in the rock is about 65 °C (Figure 5-15). After 10,000 years, the temperature at the canister surface and at the rock wall for deposition holes in the central area i.e. surrounded by several canisters is similar and is expected to be about 20 C (see Section 5.2.2), i.e. about 10 C higher than in the initial state.
The elevated temperatures occurring during the first thousands of years are taken into account in assessing water uptake and swelling (Section 6.4), montmorillonite transformation (Section 6.5.3), microbial activity (Sections 5.5.2 and 6.5.6), groundwater flow (Section 6.1.2), and spalling of the near-field rock (Section 5.3.3).
6.3 Mechanical evolution of the rock
6.3.1 Overview and performance targets potentially affected
After the excavation and operational period and the repository closure, the rock stresses in the near field are affected by the swelling of the buffer and backfill and by the thermal load from the spent nuclear fuel heat generation. Related to the stress changes, there is a risk of reactivation of fractures and rock damage, most notably for thermally induced damage, which may change the hydraulic properties of the near-field rock and thereby affect the target properties concerning the limited groundwater flow and high transport resistance in the vicinity of the deposition holes. These processes and their impact on the groundwater flow are discussed in Sections 5.1.2 and 6.1.2. Over time the thermal load decreases and stable conditions are reached.
6.3.2 Thermally induced spalling
Thermally induced spalling is discussed in Section 5.3.3.
6.3.3 Reactivation of fractures
Reactivation of fractures is discussed in Section 5.3.4, and the potential reactivation due to earthquakes is discussed in Section 7.2.4.
6.3.4 Creep
Creep is discussed in Section 7.2.
6.3.5 Summary, uncertainties and issues that need propagation
No target properties are directly violated due to mechanical evolution after closure. The impact of potential rock damage due to the thermal load on groundwater flow is discussed in Sections 5.1.2 and 6.1.2.
Although there is a good understanding of the processes affecting the mechanical state of the rock in general, there are still uncertainties related to the elastic and rock strength parameters of the rock at Olkiluoto and especially concerning the in-situ stress state that need further study. The spatial heterogeneity of the rock leads to variations of rock properties which complicates the assessment of rock damage.
215
6.4 Mechanical and hydraulic evolution of the buffer and backfill
6.4.1 Overview and performance targets potentially affected
Along with inflow of groundwater into the tunnels and the deposition holes, saturation and swelling of the buffer and backfill will commence. Initial differences in density and swelling pressure may be evened out by homogenisation. Potentially the following performance targets of the buffer (Table 2-2) and the backfill (Table 2-3) may be affected:
The buffer shall be designed in such a way as to make diffusion the dominant transport mechanism for solutes (L4-BUF-9; see also L3-BUF-12, L3-BUF-13 and L3-BUF14).
The buffer shall limit microbial activity (L3-BUF-8; see also L4-BUF-2, L4-BUF-16 and L4-BUF-5).
The buffer shall initially provide a good contact with the host rock (L4-BUF-12).
The backfill shall limit advective flow along the deposition tunnels (L3-BAC-8, see also L4-BAC-28).
The backfill shall be so designed that its hydraulic conductivity over the whole cross-section of the backfilled tunnel will be ≤ 1·10-10 m/s after full saturation (L4-BAC-5).
The backfill shall keep the buffer in place (L3-BAC-16). To keep the buffer in place, the design of the backfill has to take into account, on the one hand, the compressibility and structural stiffness of the backfill and, on the other hand, the buffer swelling pressure and the friction of buffer against the deposition hole walls (L4-BAC-30).
The fulfilment of these targets during the first 10,000 years is assessed in the following.
6.4.2 Saturation process
The fractured crystalline rock mass is a complex system where the water flows mainly in fractures and fracture zones having a wide range of sizes. In deposition tunnels, local-scale fault zones having extension of a few hundred metres and fractures extending from a few tens of centimetres to several tens of metres or even about a hundred metres can be present. The buffer and backfill saturation processes take place at a scale of a few metres and it is also necessary to take the thermal and the mechanical processes into account (Pintado & Rautioaho 2013, Olivella et al. 2013).
The thermo-hydraulic behaviour of clay is modelled using the finite element code CODE BRIGHT that was initially developed for non-isothermal multiphase flow of brine and gas through porous deformable saline media (Olivella et al. 1994, 1996). In the modelling presented here, the thermal and water flow capacities of the code have been considered. The mechanical behaviour of soils in a coupled form is neglected although it would be possible by the code. In CODE BRIGHT, equations for mass balance were established following the compositional approach. That is, mass balance is performed for water and air instead of using solid, liquid and gas phases. The equation for balance of energy is established for the medium as a whole. The aim of the analysis is to solve the unknowns (temperature T and liquid pressure, Pl) for the thermo-

216
hydraulic analysis and Pl for the hydraulic analysis from water mass and energy balance equations. Therefore, the dependent variables have to be related to the unknowns by means of equilibrium restrictions and constitutive equations. For example, the degree of saturation will be computed using a retention curve, depending on temperature and liquid pressure. Gas pressure will be assumed constant in these analyses.
For the analysis of the buffer and backfill saturation, a set of cases presenting inflow to open tunnels and deposition holes has been defined based on the results of inflow monitoring in ONKALO and groundwater flow modelling (see Appendix A). A selection of these cases is used as an input to the assessment of the saturation process discussed here. To simulate the saturation process, the following cases were considered:
A) Assuming water is provided by the three fractures, but no water is provided from the rock mass between the fractures (i.e. hydraulic conductivity of the rock mass is zero)
The inflow for the fractures was defined to present typical, but also exceptionally dry or wet conditions are defined:
Wet tunnel. The total inflow is 5 L/min in the operational phase.
Typical tunnel. The total inflow is 0.5 L/min in the operational phase.
“Dry” tunnel. The total inflow is 0.01 L/min in the operational phase.
B) Assuming water is provided from the fractures and the rock mass between the fractures (i.e. hydraulic conductivity of the rock mass is higher than zero, k = 1.52·10-12 m/s).
The geometry of the conceptual model for the cases A and B are presented in Figure 6-16, where there is a backfilled tunnel with a length of 300 m from the inner plug face and 27.35 m from the inner plug face to the centre axis of the first deposition hole. The distance between the deposition holes is 11 m.
The hydrostatic water pressure is fixed at a boundary considered far enough from the backfill tunnel to make its exact location unimportant and the fracture transmissivities are calibrated maintaining a constant flow with the tunnel open.
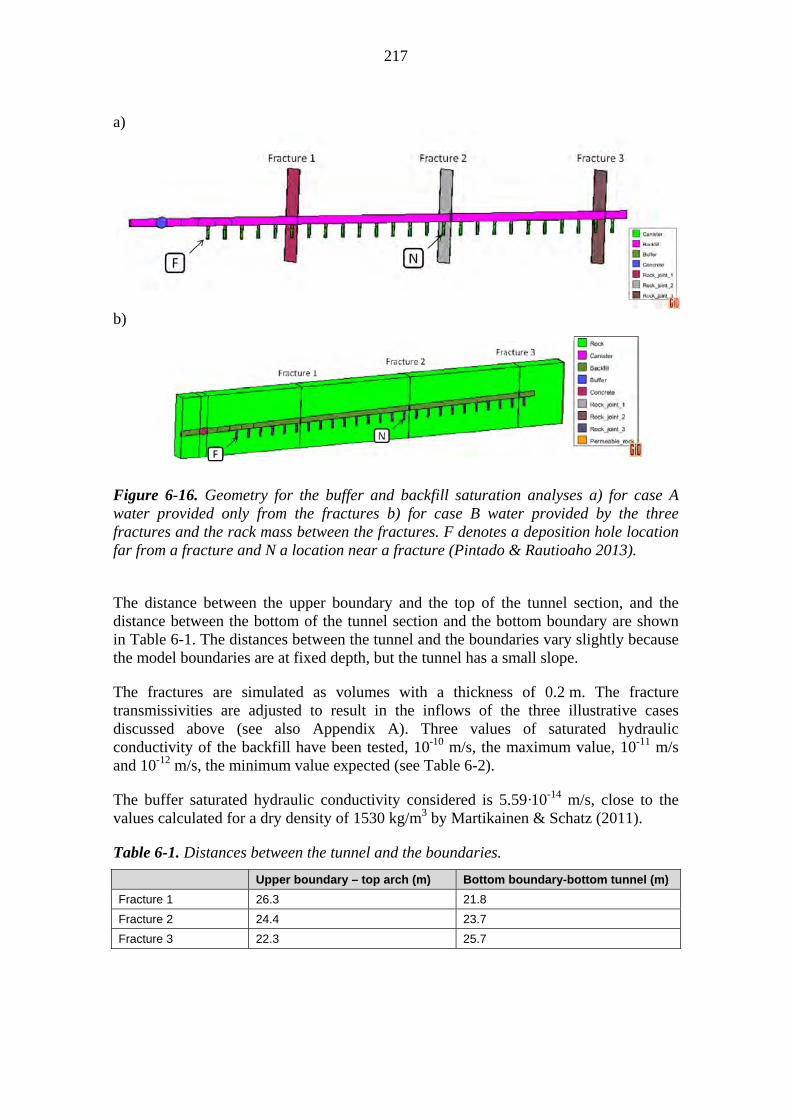
217
a)
b)
Figure 6-16. Geometry for the buffer and backfill saturation analyses a) for case A water provided only from the fractures b) for case B water provided by the three fractures and the rack mass between the fractures. F denotes a deposition hole location far from a fracture and N a location near a fracture (Pintado & Rautioaho 2013).
The distance between the upper boundary and the top of the tunnel section, and the distance between the bottom of the tunnel section and the bottom boundary are shown in Table 6-1. The distances between the tunnel and the boundaries vary slightly because the model boundaries are at fixed depth, but the tunnel has a small slope.
The fractures are simulated as volumes with a thickness of 0.2 m. The fracture transmissivities are adjusted to result in the inflows of the three illustrative cases discussed above (see also Appendix A). Three values of saturated hydraulic conductivity of the backfill have been tested, 10-10 m/s, the maximum value, 10-11 m/s and 10-12 m/s, the minimum value expected (see Table 6-2).
The buffer saturated hydraulic conductivity considered is 5.59·10-14 m/s, close to the values calculated for a dry density of 1530 kg/m3 by Martikainen & Schatz (2011).
Table 6-1. Distances between the tunnel and the boundaries.
Upper boundary – top arch (m) Bottom boundary-bottom tunnel (m)
Fracture 1 26.3 21.8
Fracture 2 24.4 23.7
Fracture 3 22.3 25.7

218
The hydraulic parameters that remain constant during the calculations are listed in Table 6-3 and the initial conditions are presented in Table 6-5.
The resulting saturation times at locations N and F (see Figure 5-44) for the different cases and inflow conditions are presented in the following figures (Figures 6-17 to Figure 6-19, all in Pintado & Rautioaho 2013).
The buffer saturated hydraulic conductivity considered is 5.59·10-14 m/s, close to the values calculated for a dry density of 1530 kg/m3 by Martikainen & Schatz (2011).
The hydraulic parameters that remain constant during the calculations are listed in Table 6-3 and the initial conditions are presented in Table 6-4.
Table 6-2. Hydraulic parameters in terms of fracture transmissivities and backfill hydraulic conductivities.
Fracture 1 (m2/s) Fracture 2 (m2/s) Fracture 3 (m2/s) Backfill (m/s)
Case 1 1.28·10-8 2.34·10-7 1.3·10-8 1·10-10
Case 2 1.28·10-8 2.34·10-7 1.3·10-8 1·10-11
Case 3 1.28·10-8 2.34·10-7 1.3·10-8 1·10-12
Case 4 1.28·10-9 2.34·10-8 1.3·10-9 1·10-10
Case 5 1.28·10-9 2.34·10-8 1.3·10-9 1·10-11
Case 6 1.28·10-9 2.34·10-8 1.3·10-9 1·10-12
Case 7 2.56·10-11 4.68·10-10 2.6·10-11 1·10-10
Case 8 2.56·10-11 4.68·10-10 2.6·10-11 1·10-11
Case 9 2.56·10-11 4.68·10-10 2.6·10-11 1·10-12
Table 6-3. Fixed hydraulic parameters: Van Genuchten law parameter (air entry value) (P0), Van Genuchten law parameter (shape function) and power of relative hydraulic conductivity law (N).
P0 (MPa) N
Buffer 31.25 0.5 3
Backfill 1.5 0.3 3
Fractures 1.5 0.3 3
Concrete 1.5 0.3 3
Table 6-4. Initial conditions: Liquid pressure and porosity (
Liquid pressure (MPa)
Buffer -41 0.438
Backfill -40.2 0.4602
Fractures Hydrostatic 0.02
Concrete -40.2 0.02

219
Figure 6-17. Degree of buffer saturation as a function of time assuming water inflow (5 L/min) to a backfilled unsaturated tunnel and different backfill hydraulic conductivities presented in Table 5-10. C1 refers to Case 1, F denotes a deposition hole location far from a fracture and N a location near a fracture (see Figure 6-16).
Figure 6-18. Degree of buffer saturation as a function of time assuming water inflow (0.5 L/min) to a backfilled unsaturated tunnel and for different backfill hydraulic conductivities presented in Table 5-10. C1 refers to Case 1, F denotes a deposition hole location far from a fracture and N a location near a fracture (see Figure 6-16).

220
Figure 6-19. Degree of buffer saturation as a function of time assuming water inflow (0.01 L/min) to a backfilled unsaturated tunnel and for different backfill hydraulic conductivities presented in Table 5-10. C1 refers to Case 1, F denotes a deposition hole location far from a fracture and N a location near a fracture (see Figure 6-16).
It is clear that the backfill hydraulic conductivity limits the rate at which saturation occurs more than the water supply from the illustrative fractures considered. For “dry” tunnels with an inflow of 0.01 L/min and the mean backfill hydraulic conductivity, saturation of the buffer is reached in less than 6000 years.
Simulations assuming water is provided from the rock mass between the fractures (i.e. hydraulic conductivity of the rock mass is higher than zero)
Although the hydraulic conductivity of the rock mass between fractures and fracture zones is small, it could help the saturation process because the distance for the groundwater to migrate into clay pores from the adjacent rock is considerably smaller than that for the groundwater flowing from fractures intersecting the tunnel. The radius of the deposition hole is only 0.875 m, whereas the distance from flowing fractures intersecting the tunnel (as considered in the model) to deposition holes can be more than 100 m.
Since the hydraulic conductivity of the rock mass between the fractures lumps the effects of a range of variable size fractures with low transmissivity into one parameter, its value at a deposition tunnel scale is ambiguous. To illustrate the effect of even a small supply of water from the rock outside the modelled fractures, case 5 in Table 6-2 has been re-assessed. The fracture properties were kept the same, the backfill hydraulic conductivity was set as 10-11 m/s, the operational tunnel water inflows as 0.5 L/min and

221
the saturated hydraulic conductivity of the rock mass between the fractures as 10-13 m/s (case C5_1), 10-14 m/s (case C5_2) and 10-15 m/s (case C5_3).
The results displayed in Figure 6-20 show that the rock mass between the fractures contributes to the saturation process even if it has a low hydraulic conductivity (one order of magnitude less than the buffer). It is noted that since defining the input for this analysis, the DFN model has been updated (Hartley et al. 2013a) based on a more representative data set on low conductivity fractures (see discussion in Section 5.1.2). According to those results, even though the total inflow is as in the inflow cases considered here, the inflow is likely distributed over a larger number of fractures along the tunnel. As a consequence, the saturation process will be faster as the distances between the deposition holes and inflow locations are decreased.
Based on the case study presented above, the saturation time for the buffer depends strongly on the hydraulic conductivity of the backfill and the hydraulic properties prevailing in the deposition hole, especially the distance from fractures and the hydraulic conductivity of the “intact” rock. In most studied cases, the saturation time of the buffer varies roughly from 100 years up to 6000 years.
Figure 6-20. Degree of buffer saturation as a function of time assuming water inflow (0.5 L/min) to a backfilled unsaturated tunnel and also inflow from the rock mass between fractures (Pintado & Rautioaho 2013).
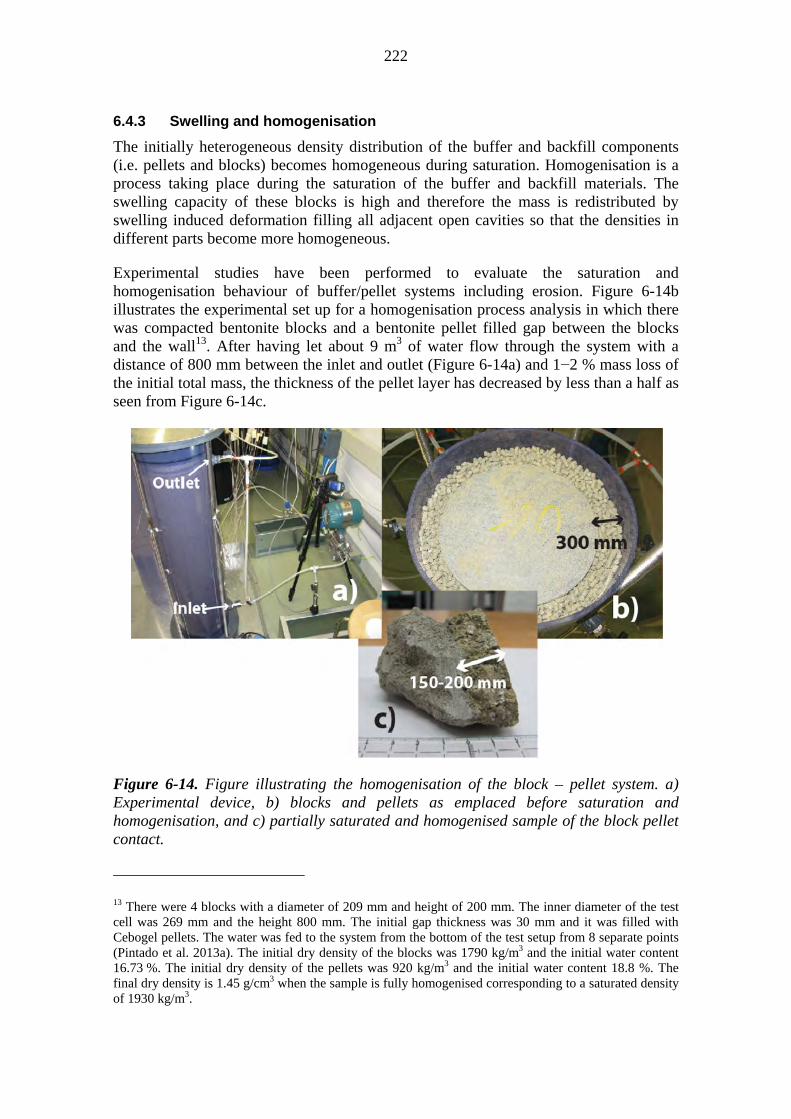
222
6.4.3 Swelling and homogenisation
The initially heterogeneous density distribution of the buffer and backfill components (i.e. pellets and blocks) becomes homogeneous during saturation. Homogenisation is a process taking place during the saturation of the buffer and backfill materials. The swelling capacity of these blocks is high and therefore the mass is redistributed by swelling induced deformation filling all adjacent open cavities so that the densities in different parts become more homogeneous.
Experimental studies have been performed to evaluate the saturation and homogenisation behaviour of buffer/pellet systems including erosion. Figure 6-14b illustrates the experimental set up for a homogenisation process analysis in which there was compacted bentonite blocks and a bentonite pellet filled gap between the blocks and the wall13. After having let about 9 m3 of water flow through the system with a distance of 800 mm between the inlet and outlet (Figure 6-14a) and 1−2 % mass loss of the initial total mass, the thickness of the pellet layer has decreased by less than a half as seen from Figure 6-14c.
Figure 6-14. Figure illustrating the homogenisation of the block – pellet system. a) Experimental device, b) blocks and pellets as emplaced before saturation and homogenisation, and c) partially saturated and homogenised sample of the block pellet contact.
13 There were 4 blocks with a diameter of 209 mm and height of 200 mm. The inner diameter of the test cell was 269 mm and the height 800 mm. The initial gap thickness was 30 mm and it was filled with Cebogel pellets. The water was fed to the system from the bottom of the test setup from 8 separate points (Pintado et al. 2013a). The initial dry density of the blocks was 1790 kg/m3 and the initial water content 16.73 %. The initial dry density of the pellets was 920 kg/m3 and the initial water content 18.8 %. The final dry density is 1.45 g/cm3 when the sample is fully homogenised corresponding to a saturated density of 1930 kg/m3.
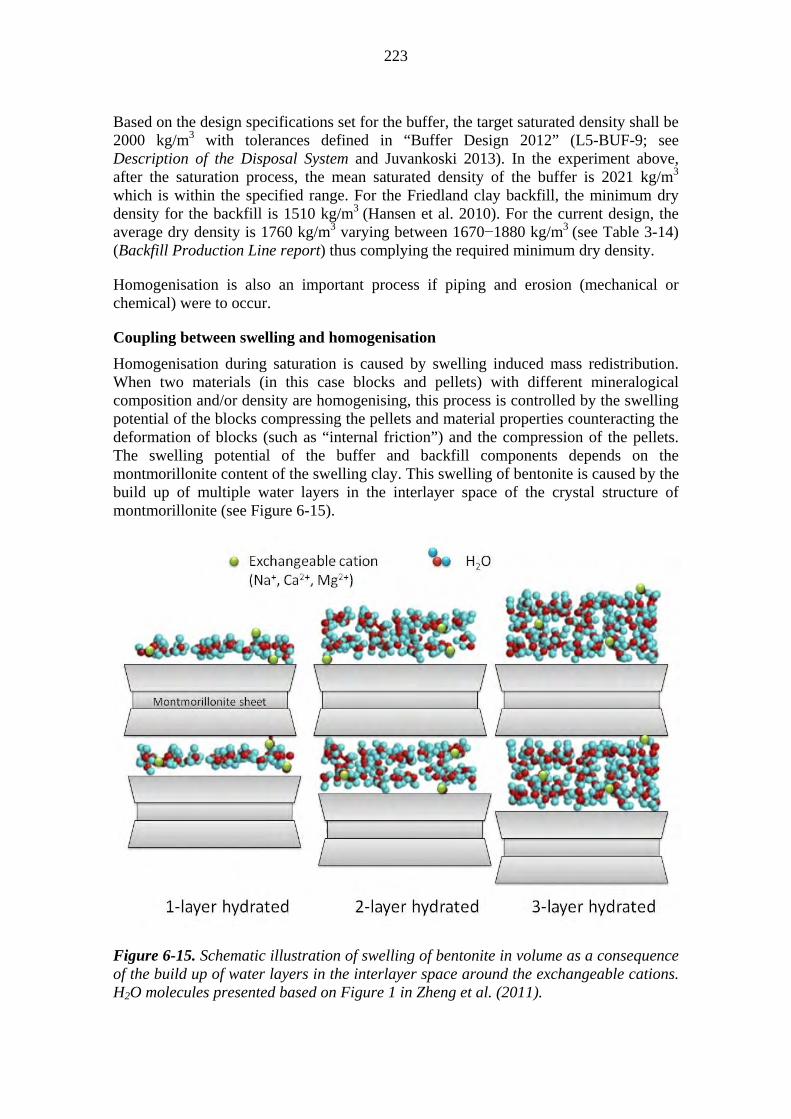
223
Based on the design specifications set for the buffer, the target saturated density shall be 2000 kg/m3 with tolerances defined in “Buffer Design 2012” (L5-BUF-9; see Description of the Disposal System and Juvankoski 2013). In the experiment above, after the saturation process, the mean saturated density of the buffer is 2021 kg/m3 which is within the specified range. For the Friedland clay backfill, the minimum dry density for the backfill is 1510 kg/m3 (Hansen et al. 2010). For the current design, the average dry density is 1760 kg/m3 varying between 1670−1880 kg/m3 (see Table 3-14) (Backfill Production Line report) thus complying the required minimum dry density.
Homogenisation is also an important process if piping and erosion (mechanical or chemical) were to occur.
Coupling between swelling and homogenisation
Homogenisation during saturation is caused by swelling induced mass redistribution. When two materials (in this case blocks and pellets) with different mineralogical composition and/or density are homogenising, this process is controlled by the swelling potential of the blocks compressing the pellets and material properties counteracting the deformation of blocks (such as “internal friction”) and the compression of the pellets. The swelling potential of the buffer and backfill components depends on the montmorillonite content of the swelling clay. This swelling of bentonite is caused by the build up of multiple water layers in the interlayer space of the crystal structure of montmorillonite (see Figure 6-15).
Figure 6-15. Schematic illustration of swelling of bentonite in volume as a consequence of the build up of water layers in the interlayer space around the exchangeable cations. H2O molecules presented based on Figure 1 in Zheng et al. (2011).

224
The type of cations in the interlayer space has an effect on the microstructure of the clay and consequently its swelling potential (Pusch 1994). Due to this difference in the microstructure, the bentonites with Na+ as the main interlayer cation tend to swell in volume more than bentonites with Ca2+ as the main interlayer cation.
The swelling pressure reflects the swelling potential of the clay. In general, the swelling of clay depends on the montmorillonite content, density of the sample, type of the interlayer cation, degree of saturation and salinity (or ionic strength) of the percolating water (Features, Events and Processes, 5.2.2). The swelling pressure is directly related to density and hydraulic conductivity. The swelling pressures measured for the buffer bentonite (MX-80 Na-bentonite and Milos Ca-bentonite IBECO RWC & Deponit CA-N) are shown in Figures 6-23 and Figure 6-17 as a function of the density of the sample.
Figure 6-16. Measured swelling pressures for MX-80 as a function of dry density and groundwater salinity (TDS). CT refers to results published by Karnland et al. (2006). The other results have been published in Martikainen & Schatz (2011), Schatz & Martikainen (2013), Kumpulainen & Kiviranta (2011).
10
100
1000
10000
500 700 900 1100 1300 1500 1700
Swelling Pressure [kPa]
Dry Density [kg/m3]
Tap water
~ 70 g/L
10 g/L
0.12 g/L
CT tap water
CT ~6 g/L
CT ~ 18 g/L
CT ~58 g/L
CT ~ 175 g/L

225
Figure 6-17. Measured swelling pressures for Milos Ca-bentonite (IBECO RWC & Deponit CA-N) as a function of dry density and groundwater salinity (TDS). CT refers to results published by Karnland et al. (2006). The other results have been published in Martikainen & Schatz (2011), Schatz & Martikainen (2013), Kumpulainen & Kiviranta (2011).
The hydraulic conductivities of the buffer materials were presented in Figure 5-17. The swelling pressure of the main backfill material Friedland clay is presented in Figure 6-18 and the corresponding graph for hydraulic conductivity is presented in Figure 6-19.
10
100
1000
10000
500 700 900 1100 1300 1500 1700
Swelling Pressure [kPa]
Dry Density [kg/m3]
Tap water
~ 70 g/L
10 g/L
CT tap water
CT ~ 11 g/L
CT ~ 33 g/L
CT ~ 111 g/L
CT ~ 333 g/L
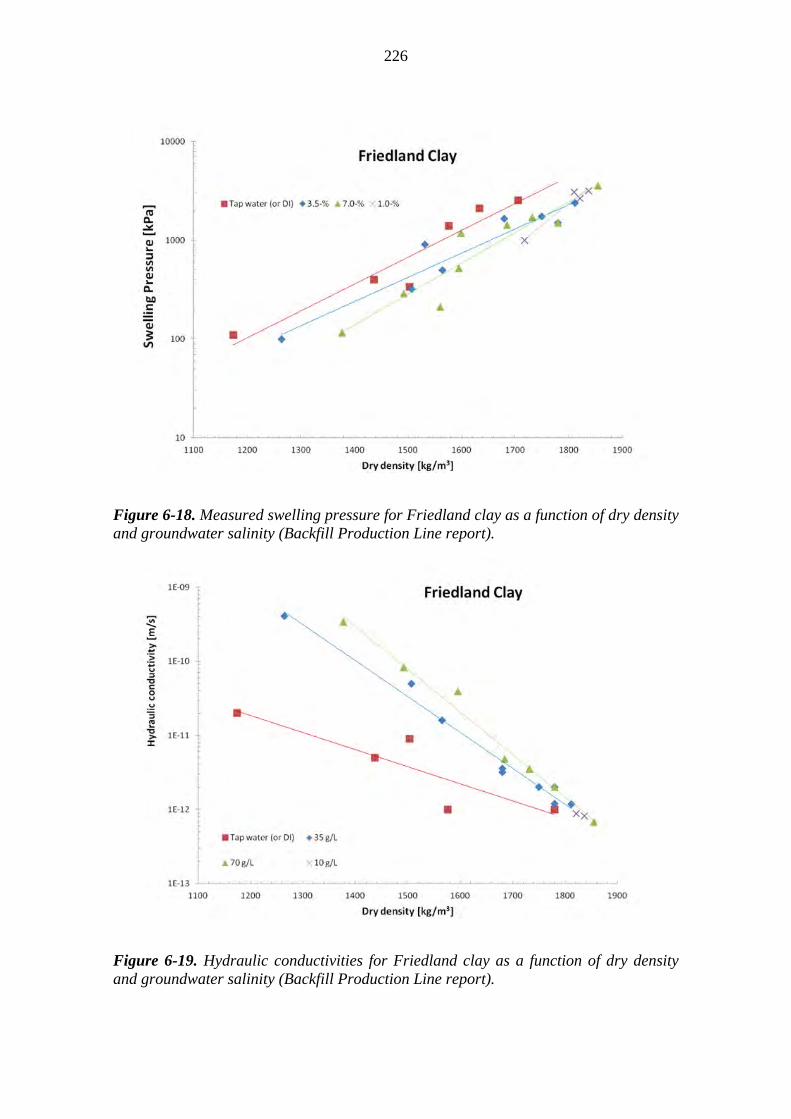
226
Figure 6-18. Measured swelling pressure for Friedland clay as a function of dry density and groundwater salinity (Backfill Production Line report).
Figure 6-19. Hydraulic conductivities for Friedland clay as a function of dry density and groundwater salinity (Backfill Production Line report).
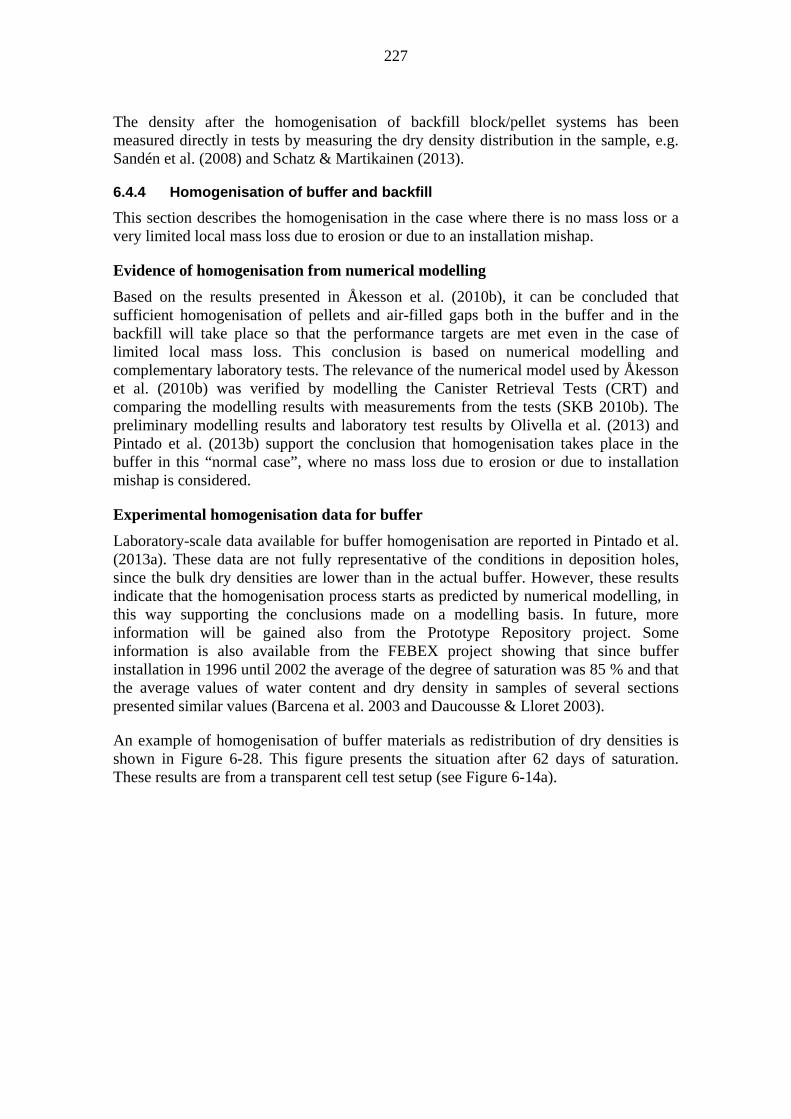
227
The density after the homogenisation of backfill block/pellet systems has been measured directly in tests by measuring the dry density distribution in the sample, e.g. Sandén et al. (2008) and Schatz & Martikainen (2013).
6.4.4 Homogenisation of buffer and backfill
This section describes the homogenisation in the case where there is no mass loss or a very limited local mass loss due to erosion or due to an installation mishap.
Evidence of homogenisation from numerical modelling
Based on the results presented in Åkesson et al. (2010b), it can be concluded that sufficient homogenisation of pellets and air-filled gaps both in the buffer and in the backfill will take place so that the performance targets are met even in the case of limited local mass loss. This conclusion is based on numerical modelling and complementary laboratory tests. The relevance of the numerical model used by Åkesson et al. (2010b) was verified by modelling the Canister Retrieval Tests (CRT) and comparing the modelling results with measurements from the tests (SKB 2010b). The preliminary modelling results and laboratory test results by Olivella et al. (2013) and Pintado et al. (2013b) support the conclusion that homogenisation takes place in the buffer in this “normal case”, where no mass loss due to erosion or due to installation mishap is considered.
Experimental homogenisation data for buffer
Laboratory-scale data available for buffer homogenisation are reported in Pintado et al. (2013a). These data are not fully representative of the conditions in deposition holes, since the bulk dry densities are lower than in the actual buffer. However, these results indicate that the homogenisation process starts as predicted by numerical modelling, in this way supporting the conclusions made on a modelling basis. In future, more information will be gained also from the Prototype Repository project. Some information is also available from the FEBEX project showing that since buffer installation in 1996 until 2002 the average of the degree of saturation was 85 % and that the average values of water content and dry density in samples of several sections presented similar values (Barcena et al. 2003 and Daucousse & Lloret 2003).
An example of homogenisation of buffer materials as redistribution of dry densities is shown in Figure 6-28. This figure presents the situation after 62 days of saturation. These results are from a transparent cell test setup (see Figure 6-14a).

228
Figure 6-20. Sampling after the test (Pintado et al. 2013a).
Figure 6-21. Dry density distribution after the test (Pintado et al. 2013a).
Generation of a flow path or paths was observed during the tests and water was collected from the top of the test setup. A general observation was that water moved at the cell/sample contact and was usually directed to a single pathway. In addition, self-sealing of the flow paths was observed during and after the test. After terminating the tests, several samples were collected for further investigations (Figure 6-27). Based on the results, it is evident that homogenisation had started in the system, since the density
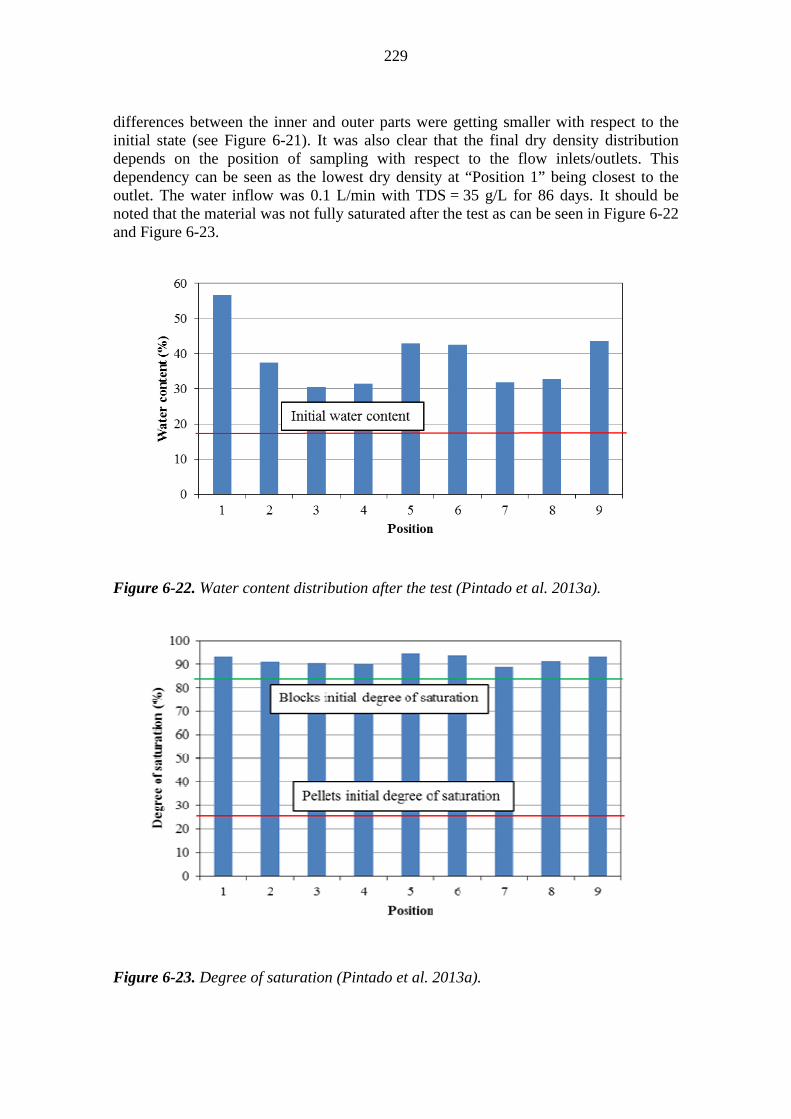
229
differences between the inner and outer parts were getting smaller with respect to the initial state (see Figure 6-21). It was also clear that the final dry density distribution depends on the position of sampling with respect to the flow inlets/outlets. This dependency can be seen as the lowest dry density at “Position 1” being closest to the outlet. The water inflow was 0.1 L/min with TDS = 35 g/L for 86 days. It should be noted that the material was not fully saturated after the test as can be seen in Figure 6-22 and Figure 6-23.
Figure 6-22. Water content distribution after the test (Pintado et al. 2013a).
Figure 6-23. Degree of saturation (Pintado et al. 2013a).
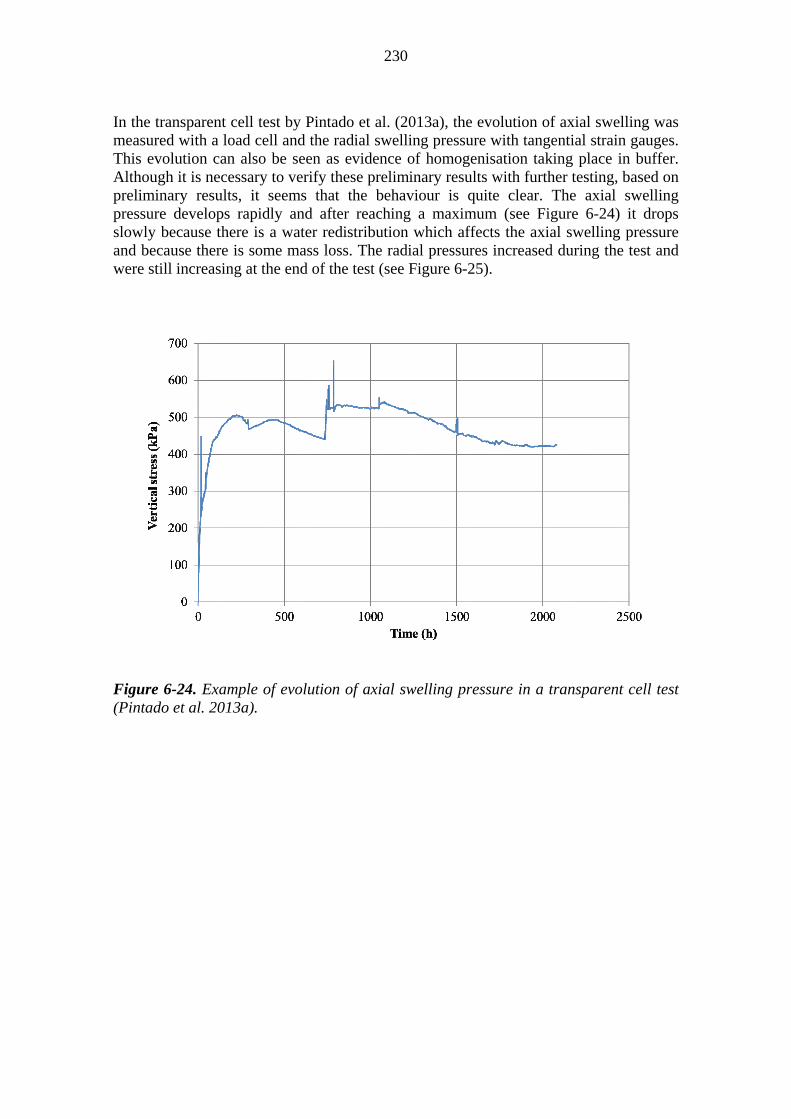
230
In the transparent cell test by Pintado et al. (2013a), the evolution of axial swelling was measured with a load cell and the radial swelling pressure with tangential strain gauges. This evolution can also be seen as evidence of homogenisation taking place in buffer. Although it is necessary to verify these preliminary results with further testing, based on preliminary results, it seems that the behaviour is quite clear. The axial swelling pressure develops rapidly and after reaching a maximum (see Figure 6-24) it drops slowly because there is a water redistribution which affects the axial swelling pressure and because there is some mass loss. The radial pressures increased during the test and were still increasing at the end of the test (see Figure 6-25).
Figure 6-24. Example of evolution of axial swelling pressure in a transparent cell test (Pintado et al. 2013a).
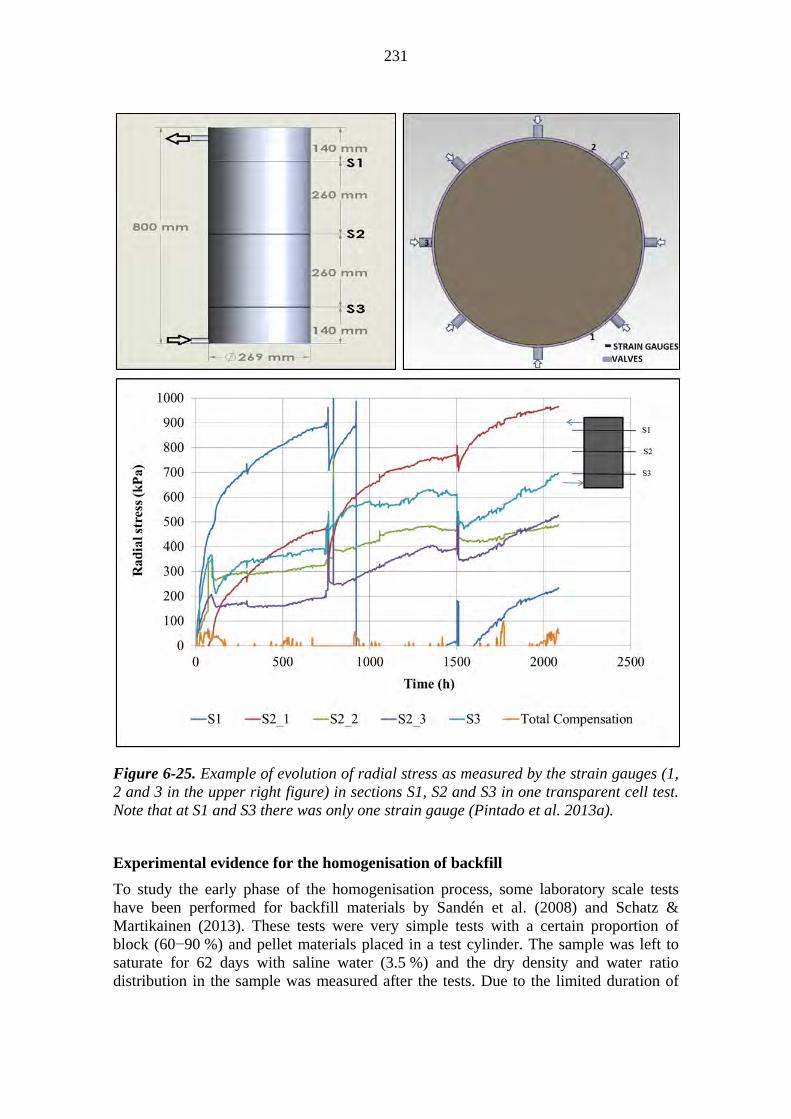
231
Figure 6-25. Example of evolution of radial stress as measured by the strain gauges (1, 2 and 3 in the upper right figure) in sections S1, S2 and S3 in one transparent cell test. Note that at S1 and S3 there was only one strain gauge (Pintado et al. 2013a).
Experimental evidence for the homogenisation of backfill
To study the early phase of the homogenisation process, some laboratory scale tests have been performed for backfill materials by Sandén et al. (2008) and Schatz & Martikainen (2013). These tests were very simple tests with a certain proportion of block (60−90 %) and pellet materials placed in a test cylinder. The sample was left to saturate for 62 days with saline water (3.5 %) and the dry density and water ratio distribution in the sample was measured after the tests. Due to the limited duration of

232
the tests, it can be stated that the test describes only the very early evolution of the homogenisation process. However, based on the results for Friedland clay (Figure 6-26), the block material is able to compress the pellet material with an initial dry density ~1100 kg/m3 to a dry density state of >1200 kg/m3, where it should have a sufficiently low hydraulic conductivity and high enough swelling pressure to comply with requirements. As seen in Figure 6-26, although the system has not homogenised with respect to dry density within this test period, it has started to homogenise with respect to hydraulic and swelling properties. It can be stated that this test method can be used for comparing different materials and to study the very early evolution of the homogenisation process. However, the homogenisation process for backfill (also after a piping/erosion scenario) needs to be studied further focusing more consistently on the homogenisation process itself and the results should be used in theoretical modelling of the process.
Homogenisation and self-sealing of piping channels
Numerical modelling techniques and methods based on elementary physical theories have been developed by Posiva to simulate homogenisation after piping and erosion of buffer bentonite (see e.g. Punkkinen et al. 2010). However, the exact physical process remains unknown and therefore the theoretical approach is being further developed.
Figure 6-26. Dry density distribution of a Friedland clay block–Cebogel pellet system after a saturation period of ~60 days. The block filling degrees tested were 60 and 70 %. The average block-filling degree (volume of blocks from the total volume of the tunnel) is 73 % (varies from 63−86 %) (Schatz & Martikainen 2013).

233
Some preliminary data on homogenisation after piping and erosion of buffer bentonite are available from the transparent cell tests by Pintado et al. (2013a) (an example of the test was described earlier in this section). It was observed that piping channels are formed at the clay–test cell contact, but they all sealed at some point of the test indicating the self-sealing potential of the material. Position 1 in Figure 6-21 indicates partial pipe homogenisation in partially saturated conditions, whereas the numerical modelling of Åkesson et al. (2010b) shows that sufficient homogenisation will take place in the expected mass loss cases. An example of a piping channel is shown in Figure 6-27.
Figure 6-27. Example of a typical piping channel observed in transparent cell tests. Pintado et al. (2013a).

234
A set of self-sealing tests have been performed for backfill materials by Sandén et al. (2008) and by Schatz & Martikainen (2013). In these tests, a hole of 5 mm was drilled in a pre-saturated sample. The hydraulic conductivity of the sample was measured both before and after drilling of the hole. It should be noted that this test is an indicative test that shows whether the material has any self-sealing ability within these specific test conditions and over this test duration (full saturation is not reached within this test period of 60 days). An example of the results indicating homogenisation is presented in Figure 6-28.
Considering the maximum possible mass loss, some finite element calculations were performed in SR-Site (SKB 2011) with the assumption that 41 kg was eroded from the buffer in the base case. In a sensitivity analysis, the mass loss was varied from 15 to 240 kg (SKB 2011, p. 307-309). The main conclusion from these analyses were that the consequence depends on the geometry of the mass loss (half torus or half sphere) and in the worst case studied, the requirement for minimum swelling pressure of the buffer (>1 MPa) was violated in 1/3 of the buffer (SKB 2011, p. 307). However, the conditions still remained non-advective because the hydraulic conductivity remains low enough at the associated dry densities (SKB 2011, p. 307-309).
Figure 6-28. Self-sealing result for Friedland clay sample with initial dry density of 1750 kg/m3 (corresponding to the average dry density of the backfill) in salinity of 7 % (Schatz & Martikainen 2013).

235
The mass loss determined for the Olkiluoto case by mechanical erosion of the buffer (see Section 5.4) is 185 kg for the base case and the range is from less than 100 kg up to 4000 kg per deposition hole. It is likely that in the cases with up to a few hundred kilograms mass loss, the system will be able to homogenise in time. In the worst case, system homogenisation after a loss of as much as 4000 kg has greater uncertainty, also depending on the geometry of the mass loss, although the remaining average dry density (1340 kg/m3) should still be able to provide some swelling pressure (some hundred kPa up to 1 MPa) and consequent homogenisation. Further studies and modelling to fully understand the homogenisation process of the buffer and backfill material, especially after piping/erosion are planned for the next research period 2013−2015.
Expansion of buffer into backfill
Due to the higher swelling pressure of the buffer compared to the swelling pressure of the backfill, it is probable that there will be vertical displacement at the buffer/backfill interface meaning that the buffer volume will increase and correspondingly the density of the buffer will decrease. How much the density decreases will depend on the saturation state and swelling pressure of the buffer and backfill. This process is linked to the backfill requirements: “The backfill shall keep the buffer in place” (L3-BAC-16) and “to keep the buffer in place, the design of the backfill has to take into account, on the one hand, the compressibility and structural stiffness of the backfill, and, on the other hand, the buffer swelling pressure and the friction of buffer against the deposition hole walls” (L4-BAC-30) (see Section 2.1.3).
This process has been studied, assuming static thermal and hydraulic conditions, using finite element numerical analysis by Börgesson & Hernelind (2009) for the Swedish case and by Korkiala-Tanttu (2009) and Leoni (2013) for the Finnish case. The criterion used in these analyses was that the saturated density of the buffer at the canister level should remain higher than 1950 kg/m3. Based on the results described in Börgesson & Hernelind (2009), the largest displacement takes place in a theoretical case where the buffer is fully saturated and the backfill is still in an unsaturated state providing no swelling pressure. This case was further studied by Leoni (2013) considering the Finnish deposition tunnel and backfill geometry and materials. The modelling tool used by Leoni (2013) was Plaxis 2D and 3D and the tool used by Börgesson & Hernelind (2009) was ABAQUS. In both cases, the assumed initial swelling pressure from the buffer was 7 MPa, but a sensitivity analysis was done also assuming a swelling pressure of 15 MPa by Leoni (2013).
The tunnel and backfill/buffer geometry considered for the reference case by Leoni (2013) is presented in Figure 6-29. The block layout used is the one presented in the previous design report by Hansen et al. (2010). The geometry of the tunnel is based on the OL1−3 tunnel with a theoretical cross-sectional area of 14 m2. In the reference case, the over-excavation assumed was 20 %, but it was varied up to 35 % (corresponding to the maximum tolerances in the demonstration tunnels). In addition, the maximum thickness considered for the foundation layer was 550 mm. The material parameters used for the foundation bed, blocks and pellets are described in detail in Leoni (2013). In most cases, Linear Elasticity was used for the backfill blocks and the Hardening Soil model for the foundation bed and pellets. In the most relevant 3D modelling cases, the

236
buffer was modelled as poroelastic material to obtain more realistic modelling of the swelling behaviour than with linear elasticity.
In those cases that are considered as the most realistic (cases 3D04_II and 3D04_III in Leoni 2013), the displacement takes place mainly in the upmost part of the buffer (see Figure 6-30) and the density at the canister level is affected very little. The displacements remain practically the same even if a swelling pressure of 15 MPa is assumed for the buffer instead of 7 MPa (see Figure 6-31 and Figure 6-32).
Figure 6-29. The geometry considered in the reference case (3D04_II). This geometry corresponds to the OL1−3 tunnel size with over-excavation of 20 % (Leoni 2013).
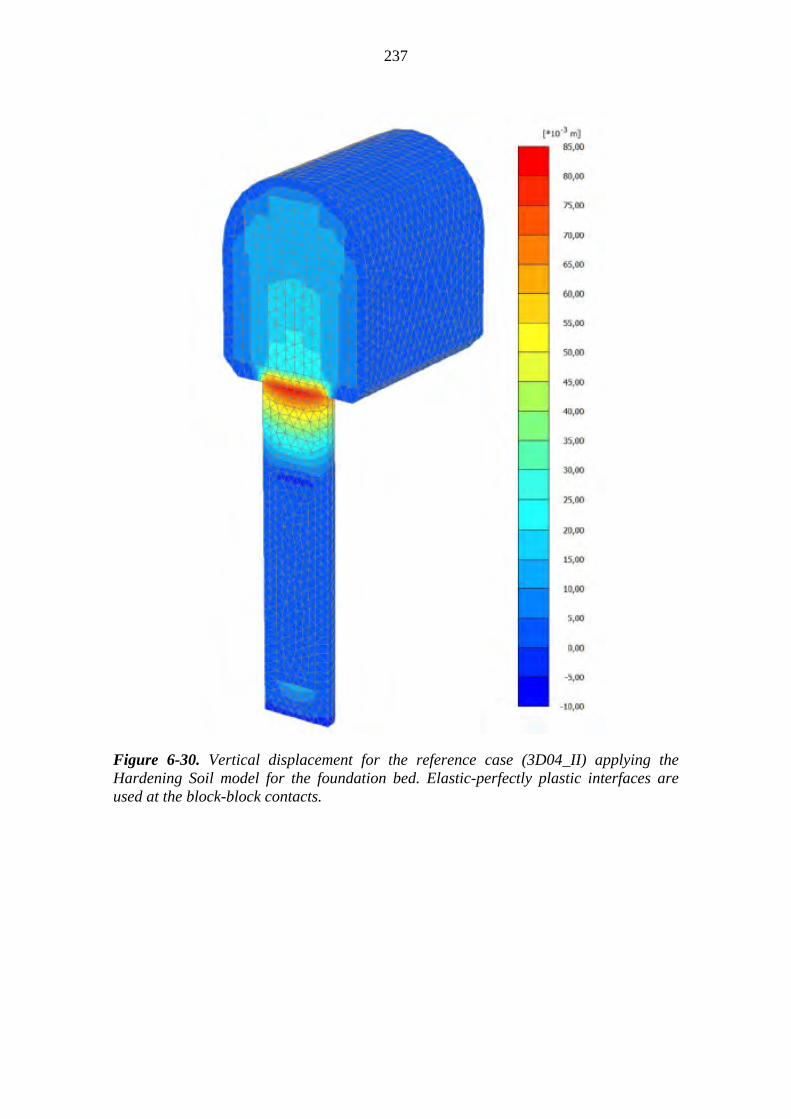
237
Figure 6-30. Vertical displacement for the reference case (3D04_II) applying the Hardening Soil model for the foundation bed. Elastic-perfectly plastic interfaces are used at the block-block contacts.

238
Figure 6-31. The effect of the upward swelling of the buffer to the deposition tunnels is shown for the reference case (3D04_II) as displacement (volumetric strain v,) and resulting density distribution (, kg/m3) in the buffer (Leoni 2013). In this case, the initial swelling pressure from the buffer is 7 MPa.
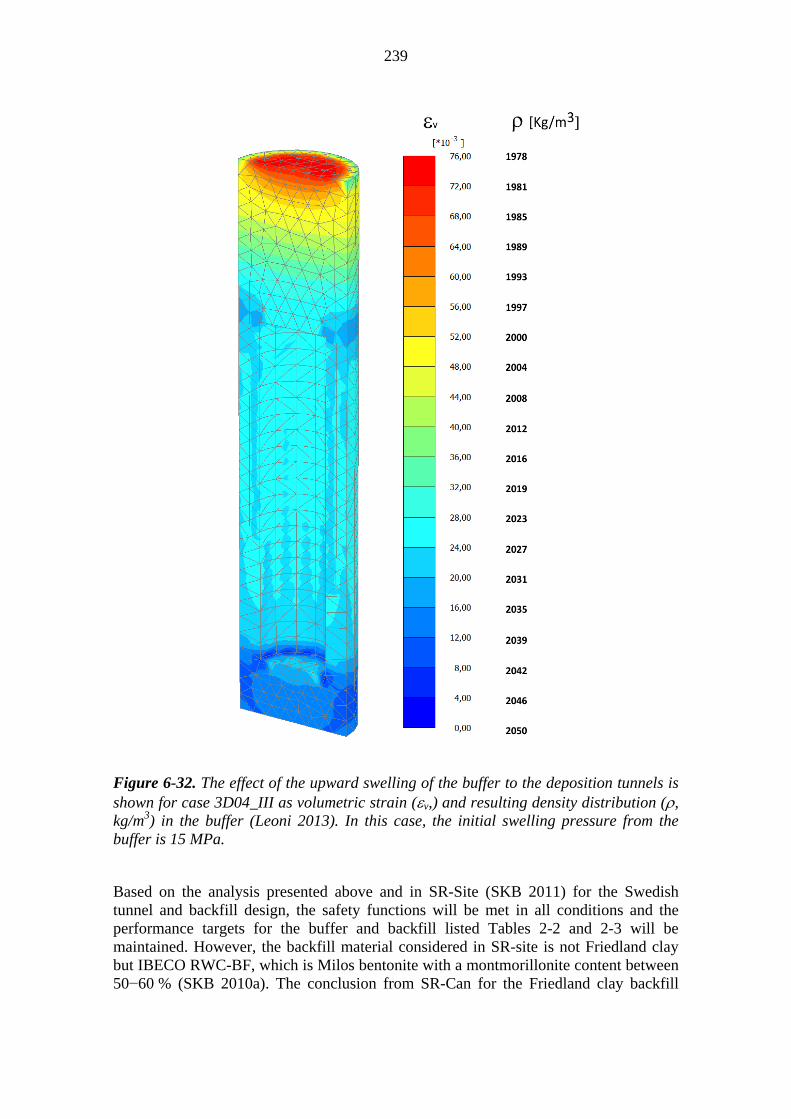
239
Figure 6-32. The effect of the upward swelling of the buffer to the deposition tunnels is shown for case 3D04_III as volumetric strain (v,) and resulting density distribution (, kg/m3) in the buffer (Leoni 2013). In this case, the initial swelling pressure from the buffer is 15 MPa.
Based on the analysis presented above and in SR-Site (SKB 2011) for the Swedish tunnel and backfill design, the safety functions will be met in all conditions and the performance targets for the buffer and backfill listed Tables 2-2 and 2-3 will be maintained. However, the backfill material considered in SR-site is not Friedland clay but IBECO RWC-BF, which is Milos bentonite with a montmorillonite content between 50−60 % (SKB 2010a). The conclusion from SR-Can for the Friedland clay backfill

240
was that the dry density of the backfill should be >1535 kg/m3 in order to maintain the buffer saturated density > 1950 kg/m3 (SKB 2006). Considering even the theoretical minimum dry density provided by the backfill design (1610 kg/m3), the current design has sufficient margin to fulfil this density requirement.
The main uncertainties linked to this process are related to:
Used material parameters. Studies are ongoing to check the parameters of the foundation layer.
Friction between buffer and rock in all saturation stages.
Effect of thickness of the foundation layer. The 2D modelling results by Leoni (2013) were not able to verify the effect and a 3D study is needed.
Effect of block masonry structure on the rigidity of the structure.
Mechanical properties of the interfaces (block-block, block-rock etc.).
The saturated backfill–saturated buffer case has not yet been modelled for the Finnish geometry. The information will be gained as a by-product of the THM model (see below).
6.4.5 Swelling of saturated buffer bentonite into saturated backfill
A preliminary analysis of coupled Thermo-Hydro-Mechanical (THM) processes has been done with the aim to study the evolution of buffer heave during the saturation process of both backfill and buffer. However, due to a lack of information on material parameters in the partially saturated state, the results presented in this section apply only for the situation when both the buffer and the backfill are in a fully saturated state. In addition, some of the material parameters used need to be confirmed with further laboratory tests. Therefore the results presented in this section should be considered as preliminary.
CODE_BRIGHT (see Section 6.4.2) has been used for numerical modelling. The original objective of the THM modelling was to study the following aspects: Time required reaching full saturation, maximum temperature reached in canister, and the stress- deformations in the buffer and backfill. The results allow a study of the buffer-backfill interface as well.
The modelling has been done under axisymmetric conditions (see Figure 6-40). The Barcelona Basic Model (BBM) has been used for modelling the buffer and backfill. The Barcelona Basic model is a Cam-Clay type effective stress model for the behaviour of unsaturated clay-type soils developed at the Technical University of Catalonia (UPC) (Alonso et al. 1990). The parameters of the buffer have been calculated from oedometer tests done particularly for this purpose. The parameters used were further compared with the ones for MX-80 bentonite (Kristensson & Åkesson 2008). The backfill parameters have also been checked from some oedometer tests (Johannesson et al. 2008). The basic assumption in these modelling cases was that the swelling pressure of the buffer is 10 times larger than the swelling pressure of backfill because of the larger content of montmorillonite in the buffer than in the backfill. The mesh in this case is 2-D with axisymmetry and is presented in Figure 6-33. Some flow into the deposition holes was assumed (corresponding to case 2 in Appendix A), with the rock around the

241
deposition holes represented as a continuum with hydraulic conductivity of 1.0·10-10 m/s. The hydraulic properties of the buffer and bentonite are the same as those for analysis of the saturation process (Section 6.4.2). The main purpose of the THM modelling was to investigate the evolution of the mechanical variables (stresses and displacements) when the buffer becomes saturated. For this reason, these preliminary analyses are focused in the situation in saturated state and leave the saturation process analysis in TH analysis. More accurate THM transient state analysis are presented in Olivella et al. (2013).
Figure 6-33. Axisymmetric domain, mesh and components considered.

242
A preliminary result considering the maximum buffer heave is presented in Figure 6-34 and Figure 6-35.
Figure 6-34. Figure on the left shows vertical displacements for the entire geometry assuming 10 times higher swelling pressure for buffer than for backfill. Figure on the right shows vertical displacements at the buffer-backfill contact (indicated by the arrow).
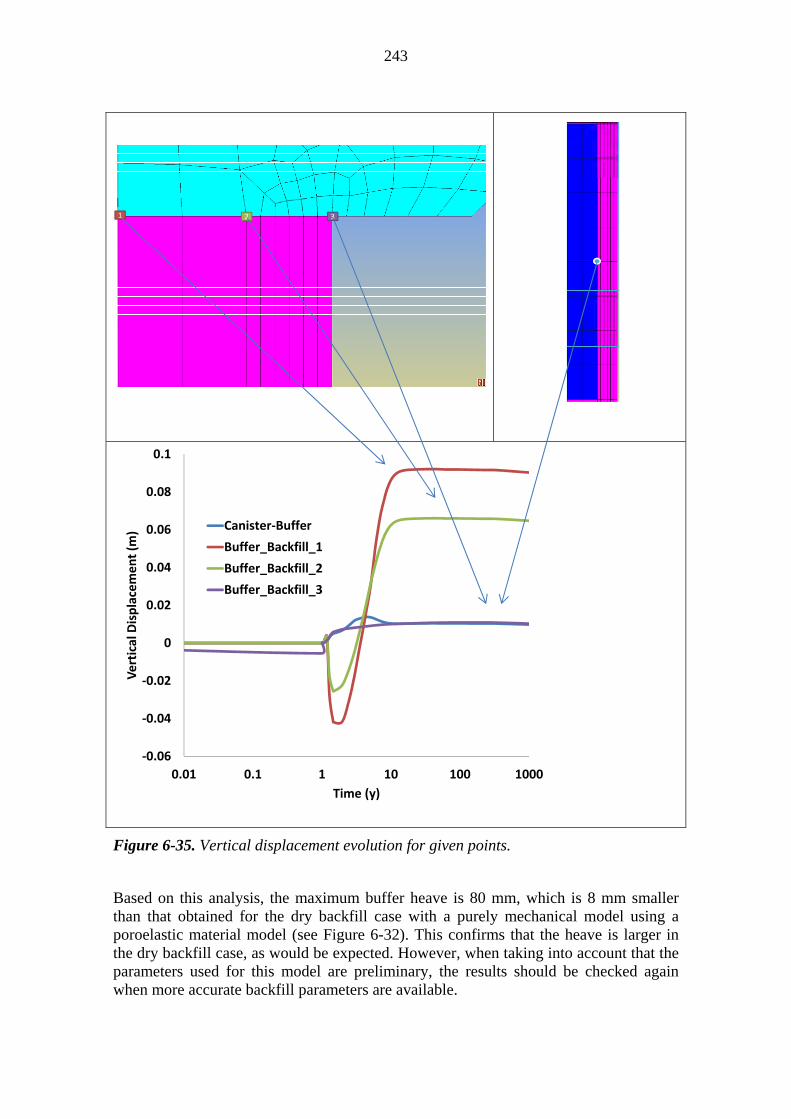
243
Figure 6-35. Vertical displacement evolution for given points.
Based on this analysis, the maximum buffer heave is 80 mm, which is 8 mm smaller than that obtained for the dry backfill case with a purely mechanical model using a poroelastic material model (see Figure 6-32). This confirms that the heave is larger in the dry backfill case, as would be expected. However, when taking into account that the parameters used for this model are preliminary, the results should be checked again when more accurate backfill parameters are available.
‐0.06
‐0.04
‐0.02
0
0.02
0.04
0.06
0.08
0.1
0.01 0.1 1 10 100 1000
Vertical Displacement (m
)
Time (y)
Canister‐Buffer
Buffer_Backfill_1
Buffer_Backfill_2
Buffer_Backfill_3
1 2 3

244
The main uncertainties associated with the buffer heave and swelling and homogenisation processes studied with the THM model are linked to:
Material parameters for backfill. The buffer parameters are well defined because there are many tests for MX-80. There is a lack of information about the MX-80 pellets although the influence of this material is not expected to be important from the swelling and homogenisation process point of view. For defining the backfill parameters, some tests on Friedland clay are ongoing.
The homogenisation process in backfill requires taking into account the presence of pellets and the foundation layer.
The friction at the rock-buffer and rock-backfill interfaces is not considered in these calculations.
The interfaces between blocks are not considered.
6.4.6 Summary, uncertainties and issues that need propagation
The time to reach full saturation in the buffer ranges between a few tens of years to several thousands of years depending on the local hydraulic conditions in the tunnel and deposition hole. The saturation times would be shorter should the very low conductivity fractures or microcracks in between the few large water-conducting fractures in the rock be taken into account. However according to current understanding, groundwater inflow to tunnel takes place predominantly through fractures.
The swelling pressure eventually reached in the buffer will be high enough to meet the buffer performance targets.
Homogenisation as a process is not completely understood and the development of numerical models will be continued. However, experiments such as the transparent cell tests by Pintado et al. (2013a) show that homogenisation takes place in the buffer-pellet-rock interface. Homogenisation has also been shown to take place in the backfill. Further tests are ongoing and information will be gained also from dismantling of the Prototype Repository. In addition, the development of the THM modelling of homogenisation and homogenisation after mass loss is ongoing both by Posiva and SKB.
Based on the results obtained so far, the buffer heave remains at an acceptable level and the performance targets for the buffer and backfill listed in Tables 2-2 and 2-3, respectively, will be maintained even taking into account the process of expansion of the buffer into the backfill.
6.5 Geochemical evolution of the buffer
6.5.1 Overview and performance targets potentially affected
The performance targets for the buffer (see Table 2-2) concern its mechanical properties, its ability to limit microbial activity, its low permeability, its heat conductivity and whether it contains substances that could adversely affect the canister, backfill or rock. Most of these relate to the properties of the buffer when it is fully saturated and has reached its maximum swelling pressure and its impermeable microporous structure.
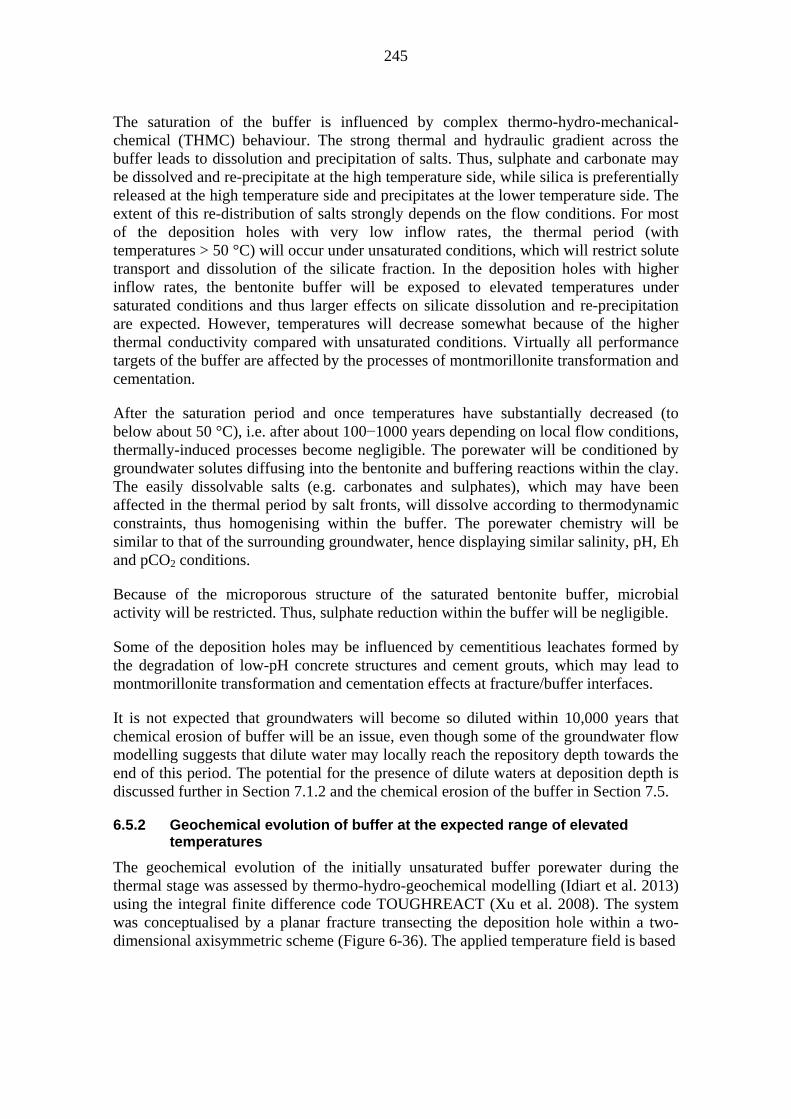
245
The saturation of the buffer is influenced by complex thermo-hydro-mechanical-chemical (THMC) behaviour. The strong thermal and hydraulic gradient across the buffer leads to dissolution and precipitation of salts. Thus, sulphate and carbonate may be dissolved and re-precipitate at the high temperature side, while silica is preferentially released at the high temperature side and precipitates at the lower temperature side. The extent of this re-distribution of salts strongly depends on the flow conditions. For most of the deposition holes with very low inflow rates, the thermal period (with temperatures > 50 °C) will occur under unsaturated conditions, which will restrict solute transport and dissolution of the silicate fraction. In the deposition holes with higher inflow rates, the bentonite buffer will be exposed to elevated temperatures under saturated conditions and thus larger effects on silicate dissolution and re-precipitation are expected. However, temperatures will decrease somewhat because of the higher thermal conductivity compared with unsaturated conditions. Virtually all performance targets of the buffer are affected by the processes of montmorillonite transformation and cementation.
After the saturation period and once temperatures have substantially decreased (to below about 50 °C), i.e. after about 100−1000 years depending on local flow conditions, thermally-induced processes become negligible. The porewater will be conditioned by groundwater solutes diffusing into the bentonite and buffering reactions within the clay. The easily dissolvable salts (e.g. carbonates and sulphates), which may have been affected in the thermal period by salt fronts, will dissolve according to thermodynamic constraints, thus homogenising within the buffer. The porewater chemistry will be similar to that of the surrounding groundwater, hence displaying similar salinity, pH, Eh and pCO2 conditions.
Because of the microporous structure of the saturated bentonite buffer, microbial activity will be restricted. Thus, sulphate reduction within the buffer will be negligible.
Some of the deposition holes may be influenced by cementitious leachates formed by the degradation of low-pH concrete structures and cement grouts, which may lead to montmorillonite transformation and cementation effects at fracture/buffer interfaces.
It is not expected that groundwaters will become so diluted within 10,000 years that chemical erosion of buffer will be an issue, even though some of the groundwater flow modelling suggests that dilute water may locally reach the repository depth towards the end of this period. The potential for the presence of dilute waters at deposition depth is discussed further in Section 7.1.2 and the chemical erosion of the buffer in Section 7.5.
6.5.2 Geochemical evolution of buffer at the expected range of elevated temperatures
The geochemical evolution of the initially unsaturated buffer porewater during the thermal stage was assessed by thermo-hydro-geochemical modelling (Idiart et al. 2013) using the integral finite difference code TOUGHREACT (Xu et al. 2008). The system was conceptualised by a planar fracture transecting the deposition hole within a two-dimensional axisymmetric scheme (Figure 6-36). The applied temperature field is based

246
Figure 6-36. Conceptualisation of 2D axisymmetric reactive transport (THC) model for simulating geochemical evolution of buffer porewater during thermal period (modified after Arcos et al. 2006).
on that calculated by Ikonen (2009). The applied thermodynamic database is EQ3/6 developed for the Yucca Mountain Project (Wolery et al. 2004), which includes temperature dependent logK data. In addition to mineral reactions, cation exchange and surface complexation were accounted for in the geochemical model. MX-80 bentonite was assumed as buffer material and dissolution and precipitation reactions of reactive accessory minerals were included in the model. Different cases were defined with the focus to test the effect of different saturation times, the presence or non-presence of pellets for the gap between the buffer and the rock and the composition of the groundwater in the fracture.
The results generally indicate that changes in porewater chemistry that occur during the thermal period (with temperatures > 50 °C) are small. Examples of the results of simulations obtained for the inner side and the outer side are illustrated for selected parameters in Figure 6-37. This shows minor differences between “hot” and “cold” parts of the buffer resulting from the thermal gradient. Thus, some redistribution of salts is predicted, with some anhydrite (< 2 %) and SiO2 (< 1 %) forming at the hot and cold side, respectively. The changes are minor and have only a negligible effect on porosity.
Because of effective buffering of the system, the changes in other constituents, such as pH (not shown) and cation exchanger composition are small. The main change at the exchanger is the slight increase of the Ca component at the expense of Na. According to the modelling results, this change is limited to the vicinity of the fracture–buffer interface (see Figure 6-36). The exchange reaction is driven by gypsum dissolution/precipitation within the buffer and the concentration gradient of Ca and Na between the buffer porewater and the surrounding groundwater. The simulated increase remains within a few percent. After longer time periods, i.e. once the thermal and chemical gradients become small, the model predicts exchange compositions close to the initial ones.

247
Figure 6-37. Selected results from the THC model showing evolution of some porewater parameters; upper: results at the canister/buffer boundary; lower: results at the buffer/rock boundary (Idiart et al. 2013).

248
6.5.3 Montmorillonite transformation
The bentonite’s major mineral component, montmorillonite, provides the advantageous physical properties of the buffer. At increased temperatures, montmorillonite may be destabilised and transformed to alteration products. There are different potential montmorillonite transformation processes, as discussed in the FEP report (Features, Events and Processes) and compiled for example in Karnland & Birgersson (2006) and SKB (2010b). In this section, the discussion is focused on the process of illitisation. Other thermally-induced processes, such as for example chloritisation or octahedral charge elimination by fixation of small cations have been shown to be limited to temperatures beyond those expected for the near field (e.g. Karnland & Birgersson 2006, Wersin et al. 2007b).
Illitisation can be schematically described by the following reaction:
montmorillonite + K+ (+ Al3+) → illite + SiO2 + (Ca2+, Na+) (6-1)
The illitisation process is kinetically controlled and strongly depends on temperature. It principally involves two aspects: (1) an increase in layer charge and (2) the availability of potassium. It is also influenced by the activities of silica, aluminium, exchangeable cations and H+ in the porewater. By this process, silica is released and precipitates as SiO2, which may lead to cementation effects (see the section on cementation below).
There are two types of studies that are used to constrain possible mechanisms and rates of smectite-to-illite conversion: (1) hydrothermal experiments, mostly of batch-type at temperatures of 200−450 °C, and (2) natural analogues, such as diagenetic studies on borehole samples from sedimentary basins.
Figure 6-38. Percent illite in illite/smectite mixed layers as a function of temperature from different sedimentary basins. From Karnland & Birgersson (2006) modified from Srodon & Eberl (1984).

249
An example of a natural analogue is given in Figure 6-44 where illitisation vs. temperature (calibrated for depth) curves for different sedimentary basins is reproduced. It can be seen that the spread is quite significant reflecting likely differences in chemical conditions, different burial histories, and differences in the details of the transformation mechanisms. Such data and similar data from contact aureoles of magmatic dykes in clay-rich rocks have been used by Pytte (1982) and Pytte & Reynolds (1989) to derive a rate law for the smectite-to-illite transformation based on such natural analogues. At least two approaches may be envisaged to estimate the degree of illitisation during the thermal stage (the time period when buffer temperature is above 50 °C):
4. Use of a kinetic rate equation assuming the expected potassium concentration but with no restriction on potassium supply and neglecting unsaturated conditions for some of this time period.
5. Use of mass transfer constraints to examine the maximum degree of illitisation allowed by the limited supply of potassium from internal and external sources, independent of any constraints on smectite-to-illite conversion rates and saturation history.
For approach (1), the input parameters are the following:
[K+] = 11 mg/L or 60 mg/L for which the higher end represents an external K-source. e.g. alkaline leachate (0.3 or 1.5 mmol/L)
time interval: 700 years for the canister/buffer interface
maximum temperature: 90 °C.
It is obvious from Figure 6-39 that the Pytte and Huang models (Huang et al. 1993) would predict near-to-zero-conversion, but some conversion would be predicted by the Cuadros & Linares models (Cuadros & Linares 1996). The latter estimate could be further refined in terms of different temperature segments that would result in reduced degrees of conversion.

250
Figure 6-39. Comparison of kinetic rate equations for the conversion of smectite to illite evaluated at 100 °C and at two different K+ concentrations, abridged from Karnland & Birgersson (2006).
In Figure 6-46, calculations for the two Cuadros & Linares models are shown for 0.3 mmol/L and 1.5 mmol/L of K+ and evaluated at temperatures from 50 to 90 ºC. Model B predicts larger degrees of conversion compared with model A.
The estimates that yield 12 % of illitisation at the canister/buffer location and 9 % at the buffer/rock location assume (1) saturated conditions at all times, (2) maximum potassium concentration, (3) a conservative temperature approximation. Moreover, they are based on the models by Cuadros & Linares (1996), which are thought to very much overpredict illitisation (as discussed below, see also Karnland & Birgersson 2006). The models that are thought to be more realistic (e.g. Huang et al. 1993) do not predict any illitisation at all during the thermal period at these conditions.
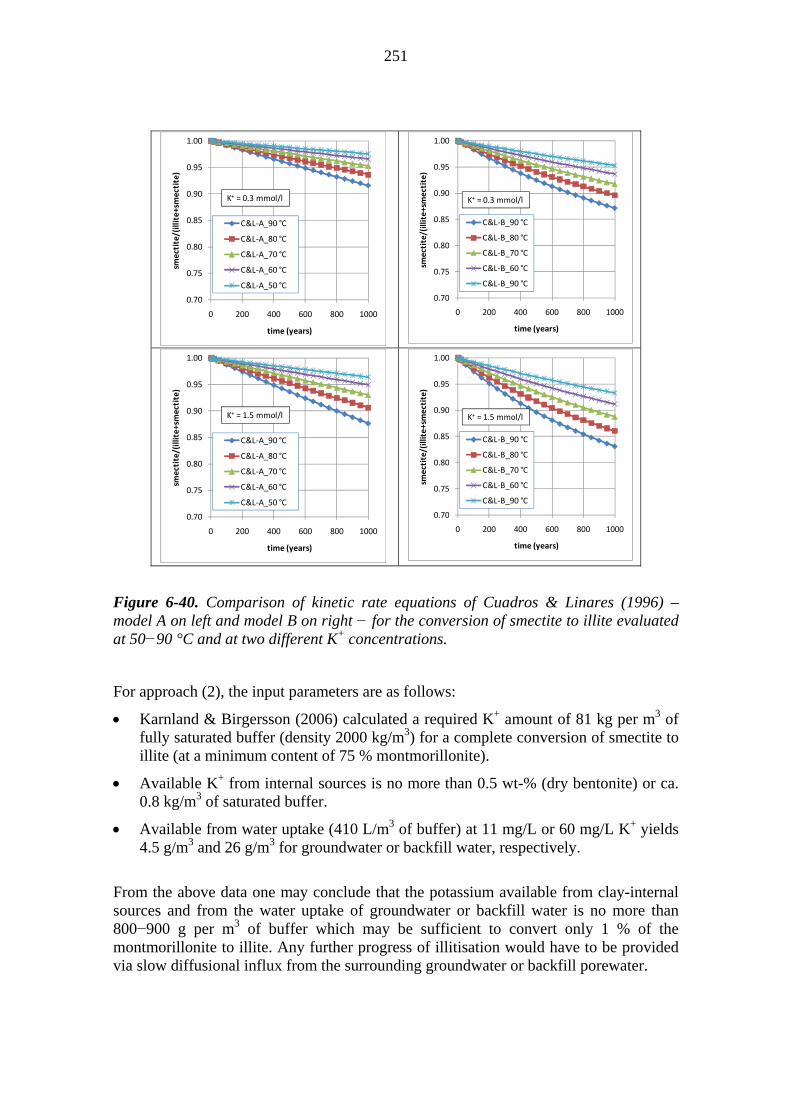
251
Figure 6-40. Comparison of kinetic rate equations of Cuadros & Linares (1996) – model A on left and model B on right − for the conversion of smectite to illite evaluated at 50−90 °C and at two different K+ concentrations.
For approach (2), the input parameters are as follows:
Karnland & Birgersson (2006) calculated a required K+ amount of 81 kg per m3 of fully saturated buffer (density 2000 kg/m3) for a complete conversion of smectite to illite (at a minimum content of 75 % montmorillonite).
Available K+ from internal sources is no more than 0.5 wt-% (dry bentonite) or ca. 0.8 kg/m3 of saturated buffer.
Available from water uptake (410 L/m3 of buffer) at 11 mg/L or 60 mg/L K+ yields 4.5 g/m3 and 26 g/m3 for groundwater or backfill water, respectively.
From the above data one may conclude that the potassium available from clay-internal sources and from the water uptake of groundwater or backfill water is no more than 800−900 g per m3 of buffer which may be sufficient to convert only 1 % of the montmorillonite to illite. Any further progress of illitisation would have to be provided via slow diffusional influx from the surrounding groundwater or backfill porewater.
0.70
0.75
0.80
0.85
0.90
0.95
1.00
0 200 400 600 800 1000
smectite/(illite+smectite)
time (years)
C&L‐A_90 °C
C&L‐A_80 °C
C&L‐A_70 °C
C&L‐A_60 °C
C&L‐A_50 °C
K+ = 0.3 mmol/l
0.70
0.75
0.80
0.85
0.90
0.95
1.00
0 200 400 600 800 1000
smectite/(illite+sm
ectite)
time (years)
C&L‐B_90 °C
C&L‐B_80 °C
C&L‐B_70 °C
C&L‐B_60 °C
C&L‐B_90 °C
K+ = 0.3 mmol/l
0.70
0.75
0.80
0.85
0.90
0.95
1.00
0 200 400 600 800 1000
smectite/(illite+smectite)
time (years)
C&L‐A_90 °C
C&L‐A_80 °C
C&L‐A_70 °C
C&L‐A_60 °C
C&L‐A_50 °C
K+ = 1.5 mmol/l
0.70
0.75
0.80
0.85
0.90
0.95
1.00
0 200 400 600 800 1000
smectite/(illite+sm
ectite)
time (years)
C&L‐B_90 °C
C&L‐B_80 °C
C&L‐B_70 °C
C&L‐B_60 °C
C&L‐B_90 °C
K+ = 1.5 mmol/l
252
In summary, the preferred published kinetic reaction rates predict no or only a very small degree of illitisation during the thermal pulse (see Section 6.2). Based on mass balance, only a very small amount of illitisation is possible, even if saturation proceeds very rapidly. Natural analogues suggest that smectite-to-illite conversion rates at relevant repository conditions are indeed slow − fairly comparable to those predicted by the Huang model derived from hydrothermal experiments.
It is, therefore, concluded that the issue of hydrothermally-induced illitisation during the thermal pulse has no significant detrimental effects on the buffer performance.
There are uncertainties that are conceptual in nature, related to environmental conditions and to parameter values − neither of them can be rigorously quantified. The kinetic rate equations are certainly not more accurate than an order of magnitude in terms of time involved. The uncertainties in temperature dependence, and those related to potassium concentration per se are much smaller.
6.5.4 Cementation induced during the thermal stage
As outlined above, during the thermal stage, the higher temperatures and temperature gradient across the buffer will lead to a redistribution of salts and silicates, thus involving dissolution and re-precipitation of accessory minerals, such as gypsum/anhydrite, carbonates and silica. Moreover, illitisation is accompanied by Si release and precipitation of SiO2 at the colder parts. Precipitated silica will form in the pore spaces and may cement together the montmorillonite flakes, causing a loss of plasticity, which may affect bulk properties swelling pressure and hydraulic conductivity and hence the performance of the buffer. Observations from the natural analogue site at Kinekulle, Sweden support this type of process (Pusch et al. 1998), although it should be noted that the bentonite beds were probably exposed to higher temperatures for considerably longer time frames than will be experienced by the buffer. The amount of silica precipitated from dissolution-precipitation processes of accessory minerals will be small (1 % volume fraction), as indicated from reactive transport modelling (Idiart et al. 2013). Also, SiO2 formed from montmorillonite transformation will be negligible, as shown by bounding calculations in the previous section. This result is supported by other work, such as for example the preliminary modelling study of Arthur & Zhou (2005) and the results from the LOT experiment at Äspö (Karnland et al. 2009).
Other potential cementing agents produced during the thermal stage are gypsum/anhydrite and calcite. As indicated from the modelling exercise of Idiart et al. (2013) and also by other studies, such as for example the LOT experiment (Karnland et al. 2009), the amounts produced are small and will have a very minor effect on the buffer’s bulk properties. Moreover, these minerals, which show rather rapid dissolution/precipitation kinetics, will redistribute in the buffer once the thermal pulse has declined.
Cementation effects may occur also by interaction with high pH leachates as discussed below.
253
6.5.5 Buffer porewater and cation exchanger chemistry after saturation
After saturation, diffusive exchange processes between the buffer porewater and the surrounding groundwater will occur. The temperatures will be lower, albeit variable because of the different saturation times depending on local flow conditions, and slowly approach those of the unaffected rock. Salts formed during the saturation stage, such as gypsum and calcite will be redistributed in the buffer by dissolution, solute diffusion and re-precipitation according to their solubilities.
The porewater composition will be constrained both by diffusion of solutes from the groundwater, reactions between cations and the clay interface and dissolution and precipitation of accessory minerals (gypsum, calcite, SiO2). The solubility of the main mineral montmorillonite is very low in the expected neutral to slightly alkaline pH range and thus its dissolution will have a minor effect on solute chemistry. The porewater chemistry and its evolution can be modelled by coupled diffusion-reaction modelling (e.g. Sena et al. 2010), accounting for the evolving groundwater composition. Considering the long time scales of interest, the porewater composition can also be approximated by assuming diffusive equilibration and chemical equilibrium between the groundwater and the clay. This has been done in a thermodynamic model for bentonite (Wersin et al. 2013a), which is based on the microstructure, the electrochemical properties of the clay and the anion exclusion concept (Tournassat & Appelo 2011). Three different water types (interlayer, diffusive double layer and “free” water) are considered (cf. Figure 6-41), whose distribution is dependent on the compaction degree, salinity and geometry of the clay particles. In this model, geochemical reactions occur within the external (free and DDL − diffuse double layer) porosity, but cations may be exchanged in the anion-free interlayer.
The porewater and exchanger compositions for MX-80 bentonite were calculated for in situ geochemical conditions including present-day and the expected more dilute brackish water groundwater types evolving during the temperate period. In Table 6-5,

254
Figure 6-41. Model representation of water-filled porosity structure of bentonite (from Wersin et al. 2004).
the model results for these porewaters are presented. The main processes regulating the porewater chemistry are cation exchange and protonation/deprotonation surface reactions as well as dissolution of accessory gypsum and calcite. Because of the higher Ca/Na and Mg/Na ratios and the pCO2 in the “fresher” groundwater, the exchange of Na+ for Ca2+ and Mg2+ as well as calcite dissolution occurs:
2NaX + CaCO3(s) +CO2(g) +H2O CaX2 + 2Na+ + 2HCO3- (6-2)
The calcite dissolution/precipitation (coupled with cation exchange) and protonation/deprotonation surface reactions provide effective pH buffering in the bentonite (Wersin 2003). An additional Ca source is gypsum initially present in the buffer, which however is assumed to be completely leached at later stages because of the much lower sulphate concentrations in the groundwater. This is reflected in the lower sulphate concentrations in the bentonite porewater for the more dilute conditions (Table 6-5). The redox conditions in the buffer are assumed to be controlled by those in the surrounding groundwater (by sulphate/sulphide equilibrium), given the relatively low reducing capacity and restriction of microbial activity in the compacted buffer. Thus, sulphide levels in the porewater are in the same range as those of the surrounding groundwater. An exception is the porewater in equilibrium with the glacial melt water. For this case, the redox conditions are assumed to be constrained by the Fe(III)/Fe(II) redox couple and thus Eh is above that of the sulphate/sulphide equilibrium.
There is conceptual uncertainty in the bentonite porewater model which arises from the lack of knowledge of its microstructure and its electrochemical properties. This is reflected in the different distribution of bound and “free” porewater proposed by
external water
+
+
+
+
+
clayparticle
DDL
DDL
-
- -
-
-
-
-+
+
+
++
+
+
+
+
+++ +++ +++
+++
+++ +++ +++
+++
+
+
+
+
++
+
+
+
+
+
+
+
+
+
-
-
- + + -
1 23
12
3
interlayer water with exchanged cations
diffuse double layer with excess positive charge
charge balanced external porewater
1 nm
255
different model conceptualisations (Tournassat & Appelo 2011, Birgersson & Karnland 2009). The influence of strongly varying fractions of interlayer water and other model parameters on the porewater composition has been tested (Wersin et al. 2004, 2013a). The results indicate that the fraction of interlayer water is the most relevant parameter affecting the results, mainly with regard to ionic strength. However, in terms of the site-specific uncertainty in groundwater composition, the conceptual uncertainty in the model is not significant, i.e. the expected variability and uncertainty related to groundwater compositions are larger than those related to the bentonite model. Moreover, this uncertainty has no direct consequences on the performance targets of the buffer.
As noted previously, some exchange of Na+ for Ca2+ and, to a minor extent for Mg2+, in the clay during the temperate period is expected. This results mainly from the Na/Ca ratio in the groundwater which evolves to a more dilute and more Ca-HCO3 dominant type. Using the equilibrium reference water approach (Wersin et al. 2013a), an increase in the Ca component from to 13 to about 50 % is predicted for a buffer in contact with a brackish-type groundwater (Table 6-5). The results from a 3D reactive transport modelling exercise using the PHAST code (Idiart et al. 2013) indicate a similar behaviour of the exchanger. Depending primarily on the hydraulic boundary conditions, the Ca fraction is predicted to reach 37–55 %. Higher values were achieved when water exchange with the backfill – containing a pool of gypsum – than from a transecting fracture was assumed. An example of the simulated evolution of Na and Ca on the exchanger, as calculated from reactive transport modelling, is given in Figure 6-49.
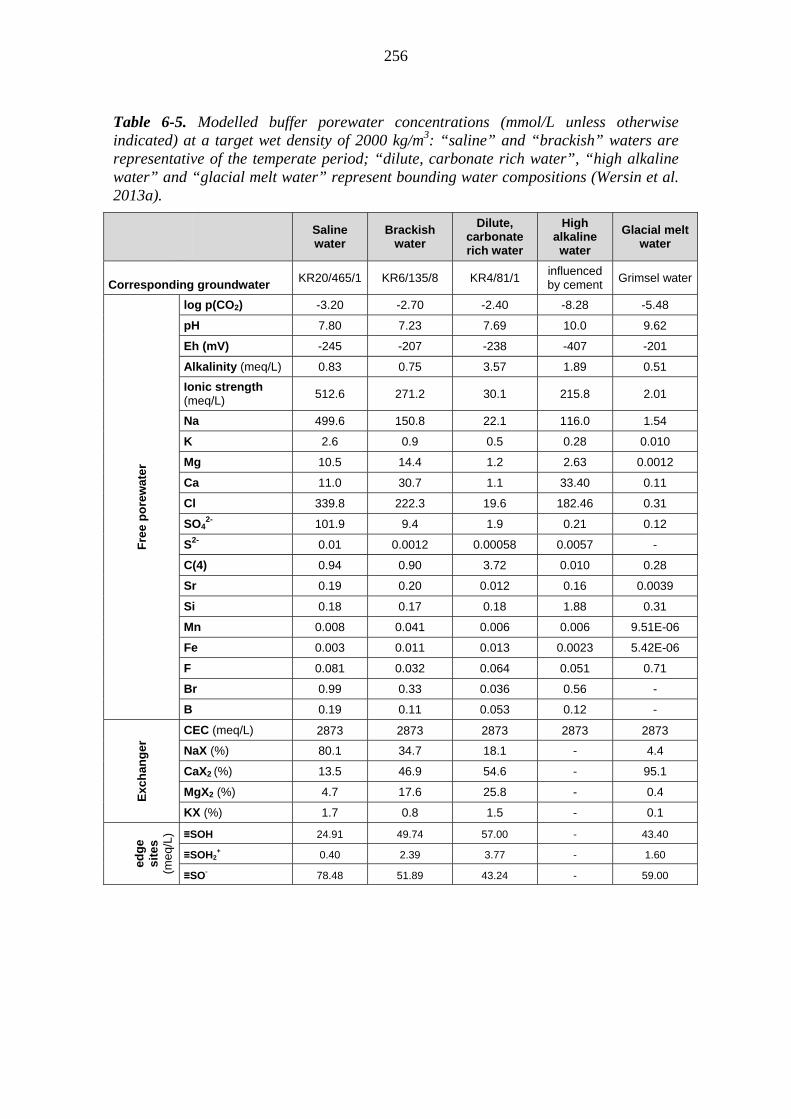
256
Table 6-5. Modelled buffer porewater concentrations (mmol/L unless otherwise indicated) at a target wet density of 2000 kg/m3: “saline” and “brackish” waters are representative of the temperate period; “dilute, carbonate rich water”, “high alkaline water” and “glacial melt water” represent bounding water compositions (Wersin et al. 2013a).
Saline water
Brackish water
Dilute, carbonate rich water
High alkaline water
Glacial melt water
Corresponding groundwater KR20/465/1 KR6/135/8 KR4/81/1
influenced by cement
Grimsel water
Fre
e p
ore
wat
er
log p(CO2) -3.20 -2.70 -2.40 -8.28 -5.48
pH 7.80 7.23 7.69 10.0 9.62
Eh (mV) -245 -207 -238 -407 -201
Alkalinity (meq/L) 0.83 0.75 3.57 1.89 0.51
Ionic strength (meq/L)
512.6 271.2 30.1 215.8 2.01
Na 499.6 150.8 22.1 116.0 1.54
K 2.6 0.9 0.5 0.28 0.010
Mg 10.5 14.4 1.2 2.63 0.0012
Ca 11.0 30.7 1.1 33.40 0.11
Cl 339.8 222.3 19.6 182.46 0.31
SO42- 101.9 9.4 1.9 0.21 0.12
S2- 0.01 0.0012 0.00058 0.0057 -
C(4) 0.94 0.90 3.72 0.010 0.28
Sr 0.19 0.20 0.012 0.16 0.0039
Si 0.18 0.17 0.18 1.88 0.31
Mn 0.008 0.041 0.006 0.006 9.51E-06
Fe 0.003 0.011 0.013 0.0023 5.42E-06
F 0.081 0.032 0.064 0.051 0.71
Br 0.99 0.33 0.036 0.56 -
B 0.19 0.11 0.053 0.12 -
Exc
han
ger
CEC (meq/L) 2873 2873 2873 2873 2873
NaX (%) 80.1 34.7 18.1 - 4.4
CaX2 (%) 13.5 46.9 54.6 - 95.1
MgX2 (%) 4.7 17.6 25.8 - 0.4
KX (%) 1.7 0.8 1.5 - 0.1
edg
e si
tes
(m
eq/L
) ≡SOH 24.91 49.74 57.00 - 43.40
≡SOH2+ 0.40 2.39 3.77 - 1.60
≡SO- 78.48 51.89 43.24 - 59.00

257
Note that in all calculations Na-rich MX-80 bentonite was taken as the buffer material. If the emplaced buffer is a more Ca-rich bentonite (e.g. high-grade Milos bentonite) then less exchange between Na and Ca can be expected. In the long run, the exchanger composition will evolve similarly for MX-80 and more Ca-rich buffer materials.
Figure 6-42. Schematic representation of backfill and buffer at a deposition tunnel and hole respectively (upper figure). Simulated evolution of exchange composition NaX and CaX2 at the buffer/backfill interface for saturated conditions Case 2 represents a case in which water exchange occurs via backfill (lower figure, Idiart et al. 2013).
35.0
40.0
45.0
50.0
55.0
60.0
37.0
39.0
41.0
43.0
45.0
47.0
49.0
51.0
53.0
55.0
57.0
1 10 100 1000 10000 100000
NaX
Exch
ang
er (%)C
aX2
Exc
han
ger
(%
)
Time (years)
Stage II: Case 2 (Temporal evolution)
Ca Exchanger: point b Na Exchanger: point b
In buffer/backfill interfaceIn buffer/backfill interface

258
6.5.6 Microbial activity in the buffer
The buffer will start to take up water after installation during the saturation stage, which may last roughly from a hundred years up to 5000 years. Different possible sources of microorganisms in or on the materials are: 1) aerobic microorganisms that grow in mats and biofilms during the operational period (see discussion in Section 5.1.3), 2) anaerobic microbes coming with the saturating groundwater (see Sections 3.1 and 5.1.3) and 3) aerobic and anaerobic microorganisms that are ubiquitous in clays (bentonite).
The swelling of the clay will introduce groundwater microbes into the clay to a depth that is dependent on the initial gap on both sides of the buffer against the rock and the canister, and the microbes indigenous to the bentonite will be present in the entire bentonite buffer (Masurat et al. 2010a, Svensson & Sandén 2011).
Data from ongoing research and published data suggest the following parameters to be important: 1) the amount of free water needed for active microbial life, as reflected by water activity and moisture content measurements, 2) the temperature, where increasing temperature will decrease the viability of microorganisms present, and 3) the swelling pressure and the pore size of the buffer, which will exert an increasing constraint on the space for living cells with increasing buffer density (King et al. 2012). Also low nutrient availability helps in mitigating the microbial activity inside the buffer.
The presence of microorganisms in commercial bentonite has been investigated in the so-called Alternative Buffer Experiment (ABM) at the Äspö HRL (Eng et al. 2007). The analysis of different clays showed significant diversity and numbers of microorganisms (Table 5-12) including anaerobic sulphate- and iron-reducing bacteria (SRB, IRB), autotrophic acetogens and aerobic bacteria in most of the clays. The presence of SRB in MX-80 has been demonstrated via cultivation previously (Masurat et al. 2010a). Molecular analysis of DNA confirmed the presence of indigenous SRB in all four commercial clays.
Table 6-6. Quantitative analyses of culturable heterotrophic aerobic bacteria (CHAB), sulphate-reducing bacteria (SRB), autotrophic acetogens (AA) and iron-reducing bacteria (IRB) in the four of the alternative buffer materials tested (data from Svensson & Sandén 2011).
Material CHAB per g MPN SRB per g MPN AA per g MPN IRB per g
MILOS/Deponit CA-N 1000 ± 570a 9 (4−44)b <10 77 (32−207)b
Friedland 1750 ± 880 68 (26−198) 35 (13−106)b 6900 (2590−22800)
Ibeco Seal M-90 5830 ± 4860 61 (23−178) 63 (24−183) 7920 (2970−26200)
MX-80 6600 ± 1620 <10 9 (5−46) 263 (105−895) a ± standard deviation, b lower and upper 95 % confidence interval
259
The presence of IRB in all 11 tested brands of commercial bentonite (Svensson & Sandén 2011) implies that a risk of microbial destabilisation of montmorillonite due to iron reduction should be considered. It has been readily demonstrated that this process can occur with ferruginous nontronite-type clays (Kostka et al. 2002, Kim et al. 2002). It is not known to what extent a similar process can proceed with the type of clays to be used in buffer and backfill. Research has shown that IRB can develop extra-cellular nanowires for the transfer of electrons from the cells to ferric iron (Reguera et al. 2005). It is recognised that iron-reducing bacteria (IRB), especially Shewanella putrefaciens, are able to speed smectite (especially nontronite) transformation to illite, and thus threaten the long-term stability of the buffer and backfill. Nonetheless, the most abundant smectite in the buffer is montmorillonite, which either lacks or contains meaningless quantities of structural Fe(III) these bacteria are able to reduce (e.g. Zhang et al. 2007).
An absolute requirement for microbial activity is the availability of liquid water. During the saturation stage, the buffer will take all water and leave little free water for microbial activity; however successions of different microbial populations and activities can develop if free water becomes available. Such a succession has been followed in the Prototype repository at the Äspö HRL for a period of more than 5 years (Pedersen et al. 2004, Eriksson & Lindström 2008, Lydmark 2011). It was found that the proportion of oxygen in gas extracted from the backfill decreased over time from that in air (20.8 %) to a range of 0.6–4 %. Large numbers of methanotrophic bacteria were detected together with other aerobic bacteria and it was suggested that a part of the reduction of oxygen could be a result of aerobic methane oxidation with oxygen and organic carbon in backfill and groundwater.
The heat from the spent nuclear fuel will introduce a stress on microbial populations. Many microorganisms can survive and be active at high temperatures, but to be active they need to have access to energy that can sustain metabolic processes for repair of unavoidable heat damage in the cells.
Published data suggest that microorganisms will not be viable in the buffer under repository conditions relevant for the KBS-3 concept. The exact physiological constraints on microbial activity are not exactly known. The suppression of microbial activity has been explained either by the mechanical restrictions due to the forces from the swelling clay or by the effect of low water activity (Masurat & Pedersen 2004, Pedersen et al. 2000a, b, Stroes-Gascoyne et al. 2006, 2007a, b). Experimental data on survival and activity of microbes in bentonite suggest that the number of cultivable microbes will decrease rapidly during swelling and heating and that very few viable cells will be present at full swelling pressure of the buffer and surviving spores will be inactive (Motamedi et al. 1996, Stroes-Gascoyne et al. 1997, Pedersen et al. 2000a, b, Masurat et al. 2010b). Sulphate-reducing activity will also approach a very slow rate when full swelling pressure is achieved and the only survivors will be microbes that have formed spores. Although spores generally are very resistant to hostile environmental conditions, eventually they die off (Motamedi et al. 1996, Stroes-Gascoyne et al. 1997, Pedersen et al. 2000a, b, Masurat et al. 2010b). The experiments indicated a decrease in the number of viable spores at full swelling pressure so that a slow but significant death rate of spores would eventually lead to the complete eradication of life in the buffer. It has not yet been clarified whether this will occur in
260
the lifetime of a radioactive repository. The sulphate concentration is substantially increased in bentonite porewater when compared to the content in the contacting solutions, both saline and fresh. This has been observed in experiments (Muurinen & Lehikoinen 1999) and is also indicated by modelling (Bruno et al. 1999, Wersin et al. 2013a) and results from the dissolution of gypsum (or anhydrite). Microbes are not expected to be significantly active in saturated bentonite and consequently sulphate is not expected to be extensively converted to sulphide by microbial processes (see discussion above).
In summary, the investigations performed suggest low activity and low survival of microorganisms in the buffer (Motamedi et al. 1996, Stroes-Gascoyne et al. 1997, Pedersen et al. 2000a, b, Masurat et al. 2010b), and consequently sulphate is not expected to be extensively converted to sulphide by microbial processes in the buffer.
6.5.7 Sulphide fluxes to the buffer
Sulphide may be produced from sulphate through SRB activity in zones with a larger porosity (e.g. at the interface between the buffer and a damaged zone or a transecting fracture). Such a case has been considered in a bounding assessment, using both an analytical shrinking core model and a linear 1D reactive transport model in which a zero-concentration boundary at the rock/buffer interface for buffer-derived sulphate was assumed (Wersin et al. 2013c). Both models predict relatively fast depletion of the gypsum pool in the buffer, in the range of a few hundred years, owing to the large sulphate concentration difference between the buffer and the adjacent “SRB zone”. The generated sulphide potentially could diffuse into the buffer and thus affect canister corrosion. This diffusive flux depends not only on sulphate reduction rates, the availability of Fe(II) and the effectiveness of iron sulphide precipitation, but also on the hydraulic conditions around the deposition tunnels. As indicated from the results of the discrete fracture network model (Hartley et al. 2013b, c), most of the deposition holes display rather “tight” conditions, thus, most generated sulphide flux would diffuse into the buffer rather than be transported away through the rock (Wersin et al. 2013c). This flux is attenuated by immobilisation of sulphide by iron via iron sulphide precipitation and presumably by the low availability of organic carbon and other electron donors. The largest pool of organic material in the repository at closure is the organic material in the clay in buffer and backfill. The character of this material is not known in detail but it probably consists to a large extent of humic and fulvic acids (SKB 2011, Section 10.2.4). Organic carbon content in the buffer is at most 0.28 %, representing about 75−94 kg of organic matter in one deposition hole depending on the canister type (Karvonen 2011). Humic and fulvic acids in the buffer and in the backfill are assumed to be “very closely attached to the clay” and not available for microbial consumption. Therefore, organic materials can be neglected in the estimate of available energy sources for bacterial activity. A limit has been set on the maximum allowed total sulphur content of 1 weight-% in the buffer and for sulphide the limit is 0.5 weight-% (L5-BUF-10, see Description of the Disposal System). The sulphate pool in the buffer in the reference material MX-80 is limited to about 1.3 weight-% and corresponds to about 1 % of corrodable copper if all sulphate is reduced to sulphide (Wersin et al. 2013c). The sulphide pool in the buffer, which is made up by pyrite, is low, at most about 0.6 weight-%. Furthermore, the release of sulphide by pyrite is insignificant because of its very low solubility under the expected geochemical conditions.

261
The sulphide content in bentonite porewater is foreseen to remain at the levels of the diffusing groundwater (which may include also a contribution from some microbial activity at the buffer/rock interface, discussed in the preceding section). Sulphide, which diffuses from the groundwater into bentonite, may be precipitated by leaching iron compounds in the clay, as proposed by Luukkonen et al. (2005). This is supported by the experiments by Muurinen (2001), who observed that MX-80 consumed about 6 mg of sulphide per gram of bentonite. The reaction type could not be identified in more detail, however. Precipitation of sulphide in the buffer would delay and limit its transport to the surface of the copper canister.
6.5.8 Effect of cementitious leachates on the buffer
As discussed in Section 5.5.4, cementitious materials such as grout, rock bolt grout, and plug concrete, having the potential to increase the groundwater pH and affect the performance of the buffer and backfill, will remain in the facility after closure. Since there will be no cement in direct contact with the buffer, the reaction process will be attenuated by (i) the leaching rate of OH- from the cementitious materials and (ii) the mixing with groundwater and dispersive migration in the fracture network.
The key parameter in the long term is also the pH or the amount of OH- ions that gets in contact with the buffer or backfill. The average pH of the cementitious leachates has likely decreased as compared to the operational period and thus the amount of OH- ions, which is the most detrimental, decrease to a lower level. During this period, OH- ions are being leached only from the locations in which ordinary Portland cementitious masses have been used. This is because the leachate pH of low-pH cementitious masses has been assessed to drop to pH < 10 even in the conservative case during the first 100 years after emplacement.The calculations by Soler (2011) indicate a pH drop to below 9.5 for the low-pH cement mass leachate and a drop to below pH 10.5 for the standard cement mass after about 100 years.
The composition of cement leachates evolves with time due to the alteration of the cement, and the reactions between the fracture minerals and the alkaline leachates, which, in particular for the sources far away from the repository, will contribute to the consumption of OH- ions. Leachate dilution and clogging of the fracture also occur.
Uncertainties are due to the induced porosity changes along the flow path of the leachates in the rock matrix. The uncertainties identified in the modelling (Soler 2010, 2011) are related to the precipitation kinetics and the nature of the newly formed phases.
The bounding analysis presented in Koskinen (2013) (see also section 5.5.4) shows that also for the whole temperate period the leachates generated from overlying cement structures from the access tunnel have a limited impact on the buffer and backfill.
The leachates from the low-pH deposition tunnel plugs will primarily affect the backfill and the closure material in the central tunnels. This is because the location of the plug is pessimistically assumed to be intersected by a set of fractures corresponding to one full perimeter hydraulically active fracture with transport properties similar to ungrouted fractures elsewhere in the repository (i.e. T = 110-9 m2/s). For this reason the effects of the plugs at deposition tunnels are practically local and the migration of leachates along the (potential) fracture(s) intersecting it is negligible.
262
In summary, it is expected that the leachates from the cementitious structures will not jeopardise the buffer’s performance during the temperate period and in the longer term.
6.5.9 Summary, uncertainties and issues that need propagation
The complex thermo-hydro-mechanical-chemical evolution during the thermal period (with temperatures > 50 °C) will lead to geochemical changes in the buffer, but these will have limited impact on the fulfilment of the performance targets. After saturation and development of the full swelling capacity, the changes will be much more moderate and constrained by diffusive processes. In particular:
The increased temperatures in the buffer will induce no or only minor montmorillonite transformation (max 1 %) and very limited masses of newly cementing material (< 2 vol. % of total).
The porewater chemistry will be controlled by that of the surrounding groundwater and by buffering reactions within the buffer. The resulting salinity and the variables pH and Eh will remain within target ranges (L3-ROC-10, L3-ROC-11, L3-ROC-15, L3-ROC-16) defined for the rock (see Section 6.1).
The impact of cementitious leachates on montmorillonite transformation and porewater chemistry towards the end of the temperate period will be very small.
The production of sulphide via microbial processes in the buffer will be restricted by the low water activity, the small pore size and, during the thermal stage, by the elevated temperatures. However, sulphide may be produced from sulphate diffusing out of the buffer to the groundwater being metabolised by SRB activity in adjacent zones with a larger porosity (e.g. damaged zone or a transecting fracture). The overall impact on the canister however is small because of the limited sulphate pool in the buffer.
The following are the main uncertainties.
The geochemical conditions of the buffer are strongly influenced by those in the surrounding host rock. Therefore, uncertainties recognised in Section 6.1 related to variations in flow and resulting geochemical conditions, also apply to the near field. In particular, this holds for the conditions during the saturation stage. The variations in inflow rates to deposition holes have been accounted for in the THC modelling exercise, in which a large range of conditions has been considered.
The uncertainties related to thermal effects on montmorillonite transformation and on cementation have been assessed by simplified bounding analyses. The derived maximum extent of montmorillonite transformation and the impact of high pH cement leachates will be further considered in the next research programme 2013−2015.
It has been stated that the activity of the spores in the fully compacted, saturated bentonite buffer with high density will slowly decrease and finally cease in the long term, however, there are uncertainties in the time span over which this would occur. If the bentonite becomes sterile, it will most probably not be re-infected, unless it is eroded or experiences some montmorillonite transformation process (e.g. illitisation). The theoretical pore size of the fully compacted buffer is only 0.1−1 %

263
of the size of the average-sized bacteria, meaning that no new microbes can enter into a buffer that retains its designed properties.
There is uncertainty in the production of sulphide under unsaturated conditions, which is difficult to bound, however the prerequisite for the microbes is a high enough water activity, and therefore as long as this is restricted, the production of sulphide in the buffer will likely be restricted. Under saturated conditions, at a high enough swelling pressure (density), sulphide production will be highly restricted. Regardless of the small likelihood of sulphide production occurring in the buffer, corrosion by sulphide is propagated to the formulation of release scenarios.
6.6 Geochemical evolution of the backfill
6.6.1 Overview and performance targets potentially affected
The thermal effects acting on the backfill geochemistry will be much smaller than those on the buffer because of the lower temperatures to which the backfill is exposed. Thus, thermally-induced mineral alteration and cementation can be neglected. Otherwise, the geochemical evolution during saturation will be similar to that of the buffer owing to the similar mineralogical compositions of the two clay-based barriers.
There are, however, differences between the backfill and the buffer that need to be considered from a safety viewpoint. This includes the larger mass, the slightly lower montmorillonite content (but slightly higher “average” density), the larger sulphate and organic matter pools of the backfill and its direct contact to the cementitious plug structure. Moreover, for the backfill there is a higher uncertainty with regard to homogenisation during saturation and the consequent possibility of microbial activity and sulphate reduction close to the tunnel walls and floor.
The interaction of the cement plug, and possibly to some extent also the grout used for rock bolts, with the backfill potentially affects virtually all performance targets for the backfill (Chapter 2). The large sulphate pool and the potential sulphate reduction process may generate sulphide fluxes diffusing through the buffer and contributing to canister corrosion (see Section 8.2.1).
6.6.2 Backfill porewater chemistry after saturation
After saturation, the backfill porewater will experience very similar diffusive and geochemical processes to the buffer because of the similar mineralogical properties. The Friedland clay foreseen in the reference concept has a somewhat lower montmorillonite content, but this is largely compensated by the higher emplacement dry density (1720 vs. 1570 kg/m3, see Section 3.5.1). The same modelling concept as for the buffer has been adopted for the derivation of the backfill porewater (Wersin et al. 2013b), but the different inventory of reactive accessory minerals has been accounted for (based on a reference backfill average composition that takes into account the volumes of different components in the backfill). Selected results for the reference backfill composition in contact with saline and brackish groundwaters are shown in Table 6-7. In addition, the porewaters in equilibrium with the bounding waters, influenced by the shallow dilute carbonate-rich water and by cementitious leachates are also shown. Note that these porewaters all contain relatively high sulphate levels (about 20−30 mmol/L) because of equilibrium with gypsum, which occurs in significant amounts in the backfill. As

264
indicated by geochemical modelling (Wersin et al. 2013c), the gypsum pool is predicted to persist for long time scales. This is because of a slow exchange rate between the backfill porewater and the surrounding groundwater. The cation exchange composition will evolve similarly to that of the buffer, thus showing some exchange of Ca2+ and Mg2+ for Na+ as a result of the dissolution of gypsum and the decreasing Na/Ca ratio in the surrounding groundwater during the temperate period.
Table 6-7. Compositions of backfill porewaters.
Saline water
Brackish water
Dilute, carbonate rich
water
Glacial melt
High alkaline water
Corresponding groundwater KR20/465/1 KR6/135/8 KR4/81/1 Grimsel gw
influenced by cement
Fre
e p
ore
wat
er
log p(CO2) -3.47 -2.70 -2.40 -5.48 -8.28
pH 7.60 7.21 7.28 8.75 10.00
Eh (mV) -234 -201 -201 -297 -394
Alkalinity (meq/L) 0.23 0.73 1.53 0.08 3.40
Ionic strength (meq/L) 362.06 245.08 86.44 46.58 350.52
Na 204.43 110.24 29.36 5.93 252.94
K 3.27 0.67 0.62 0.04 0.38
Mg 26.52 16.04 6.77 0.06 5.09
Ca 36.45 35.35 13.48 14.50 37.64
Cl 288.17 176.01 12.63 0.22 288.05
SO42- 22.27 18.50 28.15 17.28 20.64
S-2 tot 0.0056 0.0006 0.0003 - 0.0056
CO3 tot 0.364 0.865 1.686 0.044 0.014
Sr 0.170 0.167 0.025 0.106 0.256
Si 0.175 0.173 0.179 0.204 3.323
Mn 0.007 0.033 0.005 0.000 0.010
Fe 0.020 0.018 0.007 0.008 0.042
F 0.069 0.025 0.040 0.470 0.080
Br 0.868 0.265 0.023 0.000 0.886
B 0.164 0.089 0.038 0.000 0.188
Exc
han
ger
CEC (meq/L) 2.12 2.12 2.12 2.12 2.12
NaX (eq.%) 50.7 35.1 17.6 4.3 64.0
CaX2 (eq.%) 29.4 46.8 55.7 95.3 32.2
MgX2 (eq.%) 16.7 17.2 25.2 0.4 3.4
KX (eq.%) 3.2 0.8 1.5 0.1 0.4
edg
e si
tes
(m
eq/L
) ≡SOH 26.2 39.9 44.4 0.2 17.7
≡SOH2+ 0.6 1.9 2.8 0.0 0.2
≡SO- 56.1 41.1 35.7 81.9 65.0
265
6.6.3 Production of sulphide and microbial activity in backfill
Backfill and plug materials shall be selected so as to limit the contents of harmful substances (organics, oxidising compounds and sulphur and nitrogen compounds) and microbial activity (L4-BAC-18). Also it is specified in the design specifications that the organics content in the backfill shall be lower than 1 wt-% (L5-BAC-24, see Description of the Disposal System) and that the total sulphur content shall be less than 1 wt-%, with sulphides making, at most, half of this (L5-BAC-25, see Description of the Disposal System).
Research has been focused on microbial activity in the buffer material and very little is known about microbial processes in the backfill material. However, mostly the same discussions as given above for the buffer are valid, in particular the theoretical background and bounding conditions for microbial activity, which clearly points to a possibility for a “larger activity” in the backfill.
The most important variables that control microbial activity and that differ between the buffer and the backfill in the post-closure period are the lower temperature and lower swelling pressure (lower density) in the backfill and its material composition and the higher amount of organic material (152 kg/m of deposition tunnel, that is about 1520 kg/canister section (10 m) (Karvonen 2011)). While a high temperature is expected to significantly hamper microbial survival in the buffer, the very moderate increase in temperature in the backfill will not influence microbial survival. The backfill will have somewhat lower swelling pressure and transport processes may be concentrated at the backfill-rock interface contact areas being these the areas enabling microbial activity. As can be seen from Table 6-7, Friedland clay has more indigenous, cultivable microorganisms than MX-80. The present knowledge and data from buffer research suggest that microbial activity increases with a decreasing swelling pressure and increasing water activity. The relation between swelling pressure and density is exponential, which infers that small changes in density will have large effects on the survival and activity of microbes. Conclusive prediction of microbial activity and the possibility for sulphate reduction to sulphide in the backfill is very difficult, because of the lack of experimental data. Therefore the approach here has been by bounding analyses to evaluate the availability of the sulphate pool for the production of sulphide, estimating the production rate of sulphide and assessing the sulphide fluxes to the canister by estimating the maximum dissolved sulphide concentrations at the backfill/buffer interface.
Microbial sulphide production rates will be limited by transport of sulphate and sources of energy such as methane from groundwater, hydrogen from corroding materials (e.g. rock bolts) and organic carbon in backfill and groundwater. Sulphate from the dissolution of gypsum will add to the pool of sulphate. Except for sulphate and the organic carbon in the backfill material, the other energy sources will come from the outside; the rock matrix and groundwater and cement as a sulphate source (in plugs and rock bolts). Microorganisms generally respond rapidly to improved growth conditions. Therefore, it seems likely that most of the sulphide production would occur in the border area between the backfill and rock. Pools of organic carbon as energy source and sulphate are present in the backfill. Various energy sources in the groundwater can also be transported to this border area. One has also to take into account that the amount of
266
organics is much lower in the materials at the contact between the backfill and rock (in the granules and pellets the content of organics is 0.02 weight-percent, whereas the content is 0.27 weight-percent in Friedland clay). This will reduce the amount of organics available for microbial processes. Also the slow process of diffusion of sulphide and the presence of iron in the buffer and backfill or due to the corroding iron from steel (in rock bolts) will probably reduce the amount of sulphide that can reach the canisters, as discussed in Section 6.5.7.
The backfill contains a significant amount of sulphate in the form of gypsum (2 wt-%). This sulphate will persist for considerable time scales, as indicated by geochemical modelling using the concept of water exchange cycles (Wersin et al. 2013c). In this concept, the porewater volume is successively exchanged with groundwater, which after each step equilibrates with the backfill minerals according to the thermodynamic bentonite model. The underlying assumption is that uniform solute concentrations via diffusive mixing within the backfill occur. Figure 6-43 shows the results for gypsum depletion for backfill equilibrated with brackish groundwater. This indicates that, depending on model assumptions, 38 or 90 water exchange cycles are required to deplete gypsum in the backfill for a unit tunnel length (associated with one canister position). The time scale corresponding to one exchange cycle has been estimated by two different conceptualisations (Wersin et al. 2013c): in the first one, water exchange is dominated by advective flow in the fractures intersecting the tunnel. The flow rates therein, taken from the DFN model data by Hartley et al. (2013b), yielded durations of water exchange cycles in the range of thousands to tens of thousands of year, with a mean value of 13,600 years. In the second conceptualisation, water exchange is dominated by diffusion between the backfill porewater and groundwater. For this case, considerably longer water exchange cycles were calculated, with a mean value of 212,000 years. Applying these estimates to gypsum depletion rates shows that the time scales for gypsum depletion are in the range of 500,000 years or more. Thus, it can be concluded that the sulphate pool in the backfill will persist for very long times in the case that microbial sulphate reduction in the backfill is restricted.

267
Figure 6-43. Evolution of gypsum concentration as a function of number of water exchange cycles. Shown for model which assumes total porosity (including interlayer water; in dark blue) and only external porosity (excluding interlayer water; in pink) available for water exchange.
A further part of the modelling exercise, described in detail in Wersin et al. (2013c), consisted in estimating rates of sulphide production based on a bounding analysis. The conceptualised geochemical system is depicted by the sketch in Figure 6-44. In this concept, an outer layer of the backfill with a low density, in which fast (instantaneous) microbial sulphate reduction occurs, is assumed. In a first step, the sulphide flux was estimated from the diffusive flux of sulphate through the non-altered backfill which is constrained by equilibrium using an analytical shrinking core-type model. The sulphide fluxes obtained showed initial values of about 0.01 mmol/(cm2·a) and about a factor of ten lower ones after 5000 years. These ranges are well above (by factors of 100−1000) those observed in compacted bentonite (Masurat et al. 2010a, b) and in fact are in the same range as those observed in marine sediments, such as in the Black Sea (Canfield 1989). The second step involved the estimate of backfill produced sulphide flux per canister section to the buffer based on the concept of water exchange cycles and the flow data from the DFN model (Hartley et al. 2013b). Using the mean time for a water exchange of 13,600 years (see above), the rate of loss of sulphide to the rock can be estimated. This can be compared to the rate of sulphide diffusive loss into the backfill in the deposition tunnel, which is estimated from an assumed constant sulphide concentration in the backfill and a linear decrease of sulphide from the backfill/buffer boundary to zero at the level of the top of the canister, where all sulphide is consumed by corrosion. Under these premises, about 5 % of the sulphide flux produced diffuses from the backfill/deposition tunnel through the buffer while 95 % is lost to the rock. A more pessimistic water exchange time of 32,500 years routes 13 % of the flux of total produced sulphide at the backfill/rock boundary to the deposition hole. This simple
0.0
0.1
0.2
0.3
0.4
0.5
0.6
0 10 20 30 40 50 60 70 80 90 100
number of water exchange cycles
CaSO4(mM)
total porosity
external porosity
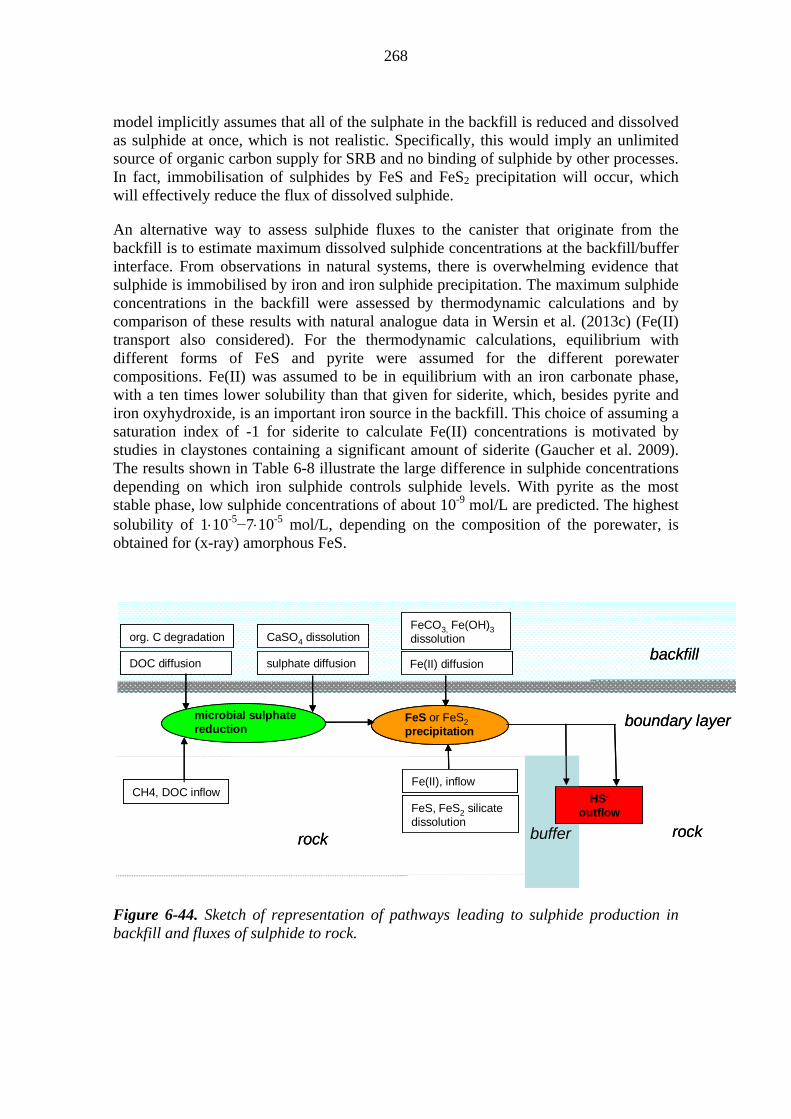
268
model implicitly assumes that all of the sulphate in the backfill is reduced and dissolved as sulphide at once, which is not realistic. Specifically, this would imply an unlimited source of organic carbon supply for SRB and no binding of sulphide by other processes. In fact, immobilisation of sulphides by FeS and FeS2 precipitation will occur, which will effectively reduce the flux of dissolved sulphide.
An alternative way to assess sulphide fluxes to the canister that originate from the backfill is to estimate maximum dissolved sulphide concentrations at the backfill/buffer interface. From observations in natural systems, there is overwhelming evidence that sulphide is immobilised by iron and iron sulphide precipitation. The maximum sulphide concentrations in the backfill were assessed by thermodynamic calculations and by comparison of these results with natural analogue data in Wersin et al. (2013c) (Fe(II) transport also considered). For the thermodynamic calculations, equilibrium with different forms of FeS and pyrite were assumed for the different porewater compositions. Fe(II) was assumed to be in equilibrium with an iron carbonate phase, with a ten times lower solubility than that given for siderite, which, besides pyrite and iron oxyhydroxide, is an important iron source in the backfill. This choice of assuming a saturation index of -1 for siderite to calculate Fe(II) concentrations is motivated by studies in claystones containing a significant amount of siderite (Gaucher et al. 2009). The results shown in Table 6-8 illustrate the large difference in sulphide concentrations depending on which iron sulphide controls sulphide levels. With pyrite as the most stable phase, low sulphide concentrations of about 10-9 mol/L are predicted. The highest solubility of 110-5−710-5 mol/L, depending on the composition of the porewater, is obtained for (x-ray) amorphous FeS.
Figure 6-44. Sketch of representation of pathways leading to sulphide production in backfill and fluxes of sulphide to rock.
org. C degradation
DOC diffusion
microbial sulphate reduction
CaSO4 dissolution
sulphate diffusion
FeCO3, Fe(OH)3 dissolution
Fe(II) diffusion
FeS or FeS2precipitation
CH4, DOC inflowFeS, FeS2 silicate dissolution
Fe(II), inflow
HS-
outflow
rockbufferrock
boundary layer
backfillorg. C degradation
DOC diffusion
microbial sulphate reduction
CaSO4 dissolution
sulphate diffusion
FeCO3, Fe(OH)3 dissolution
Fe(II) diffusion
FeS or FeS2precipitationFeS or FeS2precipitation
CH4, DOC inflowFeS, FeS2 silicate dissolution
Fe(II), inflow
HS-
outflow
rockbufferrock
boundary layer
backfill
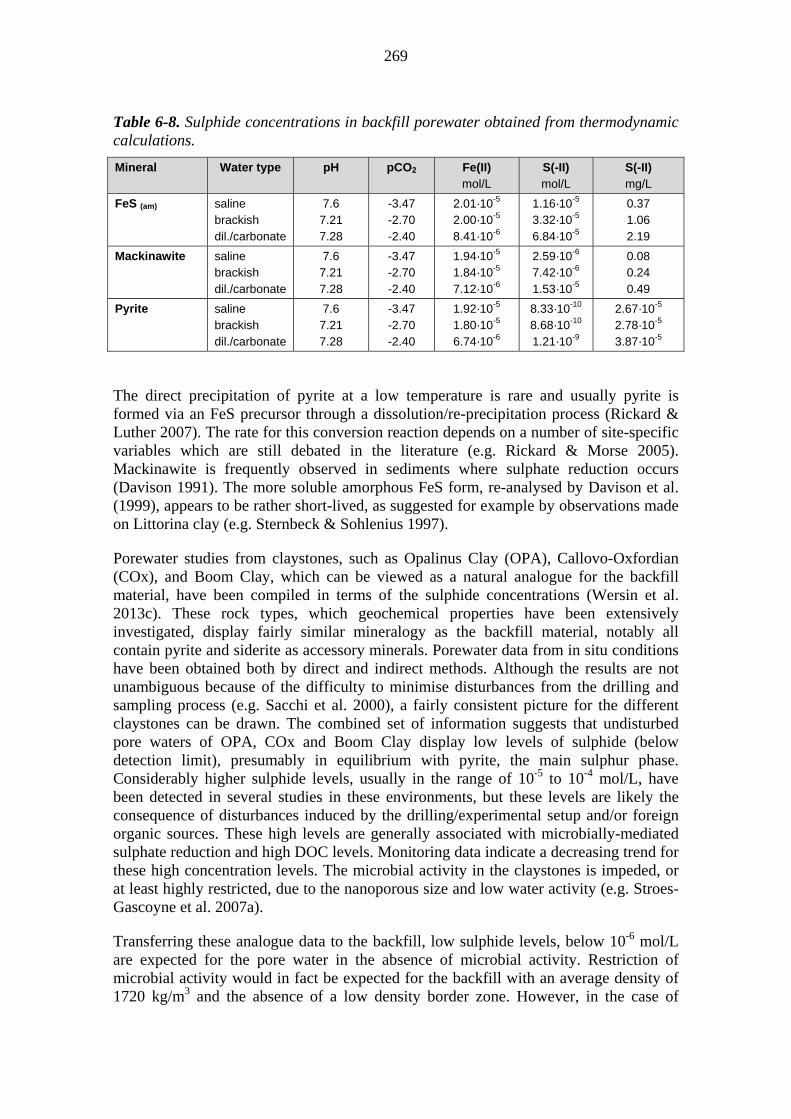
269
Table 6-8. Sulphide concentrations in backfill porewater obtained from thermodynamic calculations.
Mineral Water type pH pCO2 Fe(II) mol/L
S(-II) mol/L
S(-II) mg/L
FeS (am) saline brackish dil./carbonate
7.6 7.21 7.28
-3.47 -2.70 -2.40
2.01·10-5
2.00·10-5
8.41·10-6
1.16·10-5
3.32·10-5
6.84·10-5
0.37 1.06 2.19
Mackinawite saline brackish dil./carbonate
7.6 7.21 7.28
-3.47 -2.70 -2.40
1.94·10-5
1.84·10-5
7.12·10-6
2.59·10-6
7.42·10-6
1.53·10-5
0.08 0.24 0.49
Pyrite saline brackish dil./carbonate
7.6 7.21 7.28
-3.47 -2.70 -2.40
1.92·10-5
1.80·10-5
6.74·10-6
8.33·10-10
8.68·10-10
1.21·10-9
2.67·10-5
2.78·10-5
3.87·10-5
The direct precipitation of pyrite at a low temperature is rare and usually pyrite is formed via an FeS precursor through a dissolution/re-precipitation process (Rickard & Luther 2007). The rate for this conversion reaction depends on a number of site-specific variables which are still debated in the literature (e.g. Rickard & Morse 2005). Mackinawite is frequently observed in sediments where sulphate reduction occurs (Davison 1991). The more soluble amorphous FeS form, re-analysed by Davison et al. (1999), appears to be rather short-lived, as suggested for example by observations made on Littorina clay (e.g. Sternbeck & Sohlenius 1997).
Porewater studies from claystones, such as Opalinus Clay (OPA), Callovo-Oxfordian (COx), and Boom Clay, which can be viewed as a natural analogue for the backfill material, have been compiled in terms of the sulphide concentrations (Wersin et al. 2013c). These rock types, which geochemical properties have been extensively investigated, display fairly similar mineralogy as the backfill material, notably all contain pyrite and siderite as accessory minerals. Porewater data from in situ conditions have been obtained both by direct and indirect methods. Although the results are not unambiguous because of the difficulty to minimise disturbances from the drilling and sampling process (e.g. Sacchi et al. 2000), a fairly consistent picture for the different claystones can be drawn. The combined set of information suggests that undisturbed pore waters of OPA, COx and Boom Clay display low levels of sulphide (below detection limit), presumably in equilibrium with pyrite, the main sulphur phase. Considerably higher sulphide levels, usually in the range of 10-5 to 10-4 mol/L, have been detected in several studies in these environments, but these levels are likely the consequence of disturbances induced by the drilling/experimental setup and/or foreign organic sources. These high levels are generally associated with microbially-mediated sulphate reduction and high DOC levels. Monitoring data indicate a decreasing trend for these high concentration levels. The microbial activity in the claystones is impeded, or at least highly restricted, due to the nanoporous size and low water activity (e.g. Stroes-Gascoyne et al. 2007a).
Transferring these analogue data to the backfill, low sulphide levels, below 10-6 mol/L are expected for the pore water in the absence of microbial activity. Restriction of microbial activity would in fact be expected for the backfill with an average density of 1720 kg/m3 and the absence of a low density border zone. However, in the case of

270
insufficient homogenisation and areas of lower density (for example in the backfill/rock interface), sulphide may be produced by sulphate-reducing bacteria. For the long time perspectives considered, the sulphide formed is not expected to rise above the sulphide levels calculated for mackinawite equilibrium (0.23−0.64 mg/L). Higher sulphide porewater concentrations are improbable, but cannot be completely ruled out, occurring during short periods as a result of intense SRB activity. It should be noted that there is sufficient reactive Fe(II) in the backfill available from carbonate minerals or iron oxyhydroxides available to bind the sulphide generated by sulphate reduction, and also that as long as the transport in the buffer is diffusion-dominated, the transport of sulphide from the backfill to the canister surface will be limited.
In addition to the above geochemical modelling, an additional mass-balance modelling exercise similar to the study on groundwater-buffer interaction (see Section 6.5) was performed aiming at an evaluation of the temporal evolution of HS- and Fe2+ concentrations at the backfill/buffer interface along the glacial cycle (Wersin et al. 2013c). The evolution of the concentrations through the backfill has been calculated and the resulting concentrations at the backfill/buffer interface have been modelled by a 1D reactive transport model. With similar boundary considerations, that is for the case of iron determined by the measured iron in the groundwater and the solubility restricted by mackinawite, similar sulphide levels were obtained as the modelling results presented in Table 6-8.
6.6.4 Cement-clay interactions in the backfill
SKB has performed reactive transport simulations to investigate the influence of the degradation of low-pH concrete utilised in the deposition tunnel plug on the backfill (Grandia et al. 2010). The work predicts that the dissolution of CSH phases produces a high-pH (pH > 11) plume which penetrates about 6 cm into the deposition tunnel backfill, and the main geochemical process in the backfill-concrete interface is the loss of porosity due to ettringite precipitation. This suggests a limited effect on backfill performance by the plug concrete degradation and the same applies to the rock bolt grout possibly utilised in the tunnels as well. Furthermore, the total amount of cement in the grout will be only a fraction of that utilised in the plug.
6.6.5 Iron-clay interactions in the backfill
For the construction of the disposal facility, a large amount of iron materials including support and anchor bolts, steel fibres in shotcrete, steel mesh, reinforced concrete, drainage pipes and dusts/fragments from metal works are present (Karvonen 2011). It is assumed that 95 % of shotcrete and the steel fibres in it will be removed (Karvonen 2011, p. 15), reinforced concrete will be used in the plugs at the mouths of deposition tunnels, and the drainage pipes only occasionally. However, the remaining mass is considerable. Thus, the total inventory of remaining steel in the disposal facility has been estimated to be 4500 tons (Karvonen 2011, Table 5-1).
The steel will corrode in contact with the groundwater and oxidised iron(III) and iron(II) corrosion products will form, depending on redox conditions. Under anaerobic conditions, corrosion will generate hydrogen, Fe(II) and hydroxyl ions. The latter two species will react with water to form mixed Fe(III)/Fe(II) oxides, such as magnetite or green rust. Depending on the solution conditions and microbial activity, also other
271
corrosion products, e.g. siderite and iron sulphides may form from the corrosion process. The solubility of all these formed iron phases is low and the expected dissolved Fe(II) concentrations in contact with the steel components are in the same range as those in the (unaffected) groundwater. Also, the pH conditions will not be significantly altered by the corrosion process because of the formation of iron oxides and the buffering reactions in the fractures. Support for low iron levels in groundwater affected by construction activities is provided by the monitoring programme which indicates that iron concentrations at depths of 400 m are in the micromolar range (Penttinen et al. 2011).
Clay materials in contact with zero-valent iron are reactive and may affect the corrosion process. Thus, the clay may act as a sink for corroded iron. This has been shown in several laboratory tests (e.g. Kumpulainen et al. 2010, Carlson et al. 2006, Milodowski et al. 2009). The details of these interactions are still not resolved, but there are indications that the properties of swelling clays may be affected by reduction of structural iron (Lantenois et al. 2005) or cementation may occur by precipitation of iron oxyhydroxides (e.g. Kumpulainen et al. 2010). Moreover, transformation of montmorillonite to a non-swelling iron-rich phyllosilicate, such as berthierine cannot be excluded, although this process should be very slow at low temperatures, i.e. below 100 °C (e.g. Mosser-Ruck et al. 2010, Wilson et al. 2006a, b).
From these considerations, the only potentially relevant interactions for the clay arise from the steel materials in direct contact with the backfill. These are principally the rock bolts and to a minor extent the remaining steel mesh and metal debris (Karvonen 2011) with a total mass of 69 kg per tunnel-m. This mass is small compared to the mass of montmorillonite (13,800 kg per tunnel-m), whose mass fraction for the reference backfill is 48.2 %. Thus, from a mass balance perspective, the iron contacting the backfill can only convert a small quantity of the swelling clay. Assuming transformation of montmorillonite to berthierine, 1.75 moles of Fe are required to transform 1 mol of montmorillonite (Wersin et al. 2007a). With this reaction, the mass of iron can convert a maximum of 1.4 % of the montmorillonite mass in the backfill. This calculation neglects the fact that the iron mass contacting the backfill is much smaller since only a small fraction of the rock bolts will be in the contact zone of the backfill. Hence most of the corroded iron will be present as iron corrosion products and only a small fraction as zero-valent iron that has the potential to react with the clay.
The corrosion of the iron components around the deposition tunnels also generates hydrogen which serves as a potential reductant for sulphate. With a mass of 69 kg of iron per tunnel-m, and an assumed conversion to magnetite, this leads to a maximum amount of 1650 mol hydrogen per tunnel-m. This amount has the potential to reduce about 13 % of the total sulphate pool in the backfill (Wersin et al. 2013c) and therefore needs to be considered in the analysis of sulphide production in the backfill.
No steel materials are in contact with the buffer. Thus, the impact of corrosion of steel materials on the buffer is expected to be negligible.
272
Sulphide produced from SRB acting on iron/steel corrosion
Anaerobic corrosion of rock bolts and other iron components remaining in the repository gives hydrogen gas that could give rise to sulphide via acetogens and sulphate-reducing bacteria, as described in SKB (2011, Section 10.2.5). SKB estimated that the maximum amount of sulphide produced is 353 moles sulphide per canister, based on a mass balance from the amounts of steel in Table 2-15 of Hallbeck (2010). The sulphide is assumed to be directly available for corrosion and no account is taken of hydrogen gas diffusion to the groundwater or the reaction of sulphide with the corroded iron, forming iron(II)sulphide. For illustration purposes, these maximum values of possibly produced sulphide can be converted to corrosion depths, assuming evenly spread corrosion all around the canister and neglecting all transport processes. The mass balance equivalent of 350 moles sulphide per canister corresponds to a corrosion depth of 300 μm (ibid.).
6.6.6 Summary, uncertainties and issues that need propagation
The evolution of porewater chemistry in the backfill will be similar to that in the buffer, but much less affected by temperature during the thermal stage (when temperatures in the buffer > 50 °C). Thus, thermally-induced changes with regard to montmorillonite alteration and cementation will be negligible. The resulting salinity and the variables pH, pCO2 and Eh will remain within acceptable ranges. With regard to disturbances, it can be deduced that:
The deposition tunnel end plugs will react with the clay in the backfill which will lead to a limited altered zone (< 10 cm) adjacent to the cement structures. The impact of rock bolt grout on backfill is insignificant given its small mass. Thus the degradation of cement materials contacting the backfill will not be of relevance for the fulfilment of the performance targets of the backfill during the temperate period and also afterwards.
The corrosion of iron from construction materials will have an insignificant impact on the fulfilment of the performance targets of the backfill, but the generated hydrogen needs to be considered as a potential reductant of sulphate.
The large sulphate pool in the backfill is a potential source for microbial sulphide production. In view of the large uncertainties related to backfill homogenisation and microbial activity in the boundary areas, the sulphide fluxes that may affect the canister can only be assessed by a bounding analysis (see Section 6.8.3). Under the pessimistic assumption that all of the sulphate pool will eventually be reduced to sulphide, the main processes attenuating the sulphide flux to the canister are the precipitation of iron sulphide and the advective loss to the rock mass.
The large organic pool in the backfill, mainly consisting of humic and fulvic acids is assumed to be “very closely attached to the clay” and not available for microbial consumption. Therefore organic materials can be neglected in the estimate of available energy sources for bacterial activity.
Uncertainties in porewater composition mainly arise from those in the groundwater composition, thus indirectly from uncertainty in flow conditions. The diffusive-limited solute transport, the effective pH buffering and the restriction of microbial activity − at least in most of the material − will keep key variables, such as pH, pCO2, Eh and
273
sulphide levels, within reasonable bounds. The main uncertainty lies in the possibility of microbial activity close to the tunnel walls. In the case of good homogenisation, the high swelling pressure (high density) and small pore size will effectively restrict microbial activity and adverse conditions will be similar to those in the (intact) buffer. If, however, low density areas should persist, then significant sulphate reduction cannot be ruled out and thus needs to be considered in the canister corrosion analysis (Section 6.8). A related uncertainty concerns the sulphide concentrations in case of SRB activity in the backfill. Based on combined thermodynamic and natural analogue data, concentrations are not expected to rise beyond 0.5 mg/L (1.5·10-5 mol/L), i.e. they are being controlled by mackinawite equilibrium, but higher “transient” concentrations up to 2 mg/L, being controlled by amorphous Fe(S), cannot be ruled out completely.
6.7 Mechanical, hydraulic and geochemical evolution of the closure components
6.7.1 Overview and performance targets potentially affected
After saturation, the only potential threat to the performance targets of the closure components listed in Table 2-4 would be the degradation of the closure backfill material or the closure plugs to:
an extent that the repository access tunnel or shafts would form preferential pathways for groundwater flow to and from the repository that are more significant than the already existing fractures and hydrogeological zones, or
be so extreme that it would no longer be able to keep the deposition tunnel backfill and plugs in place.
The potential for such degradation is assessed in the following.
6.7.2 Evolution of the closure backfill material
As noted in Section 3.6, the closure backfill materials and design will vary according to the depth and position they are needed at. Thus, for the central tunnels at repository depth, the backfill materials and configuration will be similar to those of the backfill in the deposition tunnels, although the starting time for the recovery of the flow conditions at this depth for closure components will be later than for most of the deposition tunnels.
The evolution of the backfill in the central tunnels will depend mostly on the flow conditions, which will be slightly affected by the temperature (see e.g. Löfman & Poteri 2008). Piping and erosion will, at this stage, be of no significance, especially if already during the operational period it is avoided with suitable material selection and technical solutions. The interaction between the backfill material and the cementitious plugs will be similar to that of deposition tunnel backfill (see Section 6.6.4).
The technical rooms and the lowest part of the shafts below HZ20 (at about 300 m depth) that are backfilled with crushed rock material of appropriate size to avoid settlement (and thus mechanical instability) will be even less affected by temperature changes due to the heat emitted by the spent nuclear fuel than the backfill at repository depth. No natural processes (NOTE: Human intrusion is not considered a natural
274
process) have been identified that could damage this kind of backfill material and its safety function during the temperate period after closure.
The access tunnel and shafts below 200 m depth will be backfilled with in situ compacted bentonite-aggregate mixture (with HZ20 being isolated by hydraulic plugs), the evolution of which during the temperate period will again depend mostly on the hydrological conditions. As this material contains swelling clay, the mixture will be formulated so that swelling will allow for possible voids, gaps and joints to be filled and to develop and maintain a contact pressure between the access tunnel rock and the backfill.
Above 200 m depth, the access tunnel and shafts will be backfilled with in situ compacted crushed rock to avoid settlement and thus mechanical instability (with HZ19 being isolated by hydraulic plugs). Again, no natural processes (NOTE: Human intrusion is not considered a natural process) have been identified that could damage this kind of backfill material and its safety function during the temperate period if adequate quality assurance measures are adopted and followed.
The impact of decreased performance of the deposition tunnel and closure backfill has been studied by Hartley et al. (2013b). The simulations included a few cases where the hydraulic conductivity of the tunnels was higher than the reference assumptions. These modelling cases included one with 10 times higher conductivity of all the tunnels and one where the reference assumptions were used for the deposition tunnels, but the hydraulic conductivity of the other tunnels was one hundred times higher. The reference hydraulic conductivity for the buffer was 10-12 m/s and for the backfill in deposition tunnels 10-10 m/s. For the backfill of the other tunnels, the hydraulic conductivity was varied with depth and according to the backfill materials in different parts of the disposal facility. The hydraulic conductivity values used were
From ground surface to appr. 200 m: 10-7 m/s
From the depth of 200 m to the zone HZ20 (just about 300 m depth): 10-8 m/s
From the zone HZ20 to repository depth and in the access tunnel and shafts of the disposal facility that are below the HZ20-system: 10-9 m/s.
According to the results presented in Hartley et al. (2013b), the high conductivity of the backfill in tunnels other than the deposition tunnels had a limited effect on the target properties of the host rock.
6.7.3 Evolution of the closure plugs and the deposition tunnel plugs
Kari (2009) modelled the durability of concrete for low- and intermediate-level waste repositories, which are required to be serviceable for at least 500 years after closure. In that work, a numerical model (FEM) was developed, since conventional methods were regarded as insufficient to describe the deterioration of the concrete structures in question. In the new model, the relevant deterioration mechanisms for the estimation of the degradation of concrete in LILW-repositories were included. The mechanisms studied were: the aerial carbonation of concrete, moisture ingress, chloride penetration, and corrosion of concrete caused by the intrusion of sulphate and magnesium, as well as the leaching of cement paste compounds into groundwater.
275
Based on the modelling work, Kari (2009) reached the conclusion that the interaction of deterioration mechanisms is an important factor in estimating the durability of reinforced concrete structures over hundreds of years. Results indicated that using silica fume (or slag) as a cement replacement with low water to binder ratio (max 0.35) improves the durability. The carbonation depth did not exceed 40 mm and the recommended reinforcement depth might be approximately 50 mm or more. The concrete containing silica fume had the best resistance to chloride ingress. Blast furnace slag cement based mixes had the best resistance to sulphate-based degradation; silica fume addition gave nearly as good results as those for slag-based mixes. Instead, sulphate based degradation was the highest with ordinary cement mixes. The shape of structures should be taken into account when designing a durable concrete structure.
As time goes on, after the closure of the repository the binder CSH will start to dissolve and by the end of the time span (10,000 years after closure) it should be considered to be dissolved. Gypsum is more stable, but it is feasible to assume that it will dissolve also during the next 10,000 years. What is left is the sand and rock structure (a sand cake). It will not keep its original shape but will fall down at an inclination of about 60 degrees, if there is space to fall. This will weaken the contact at the top interface to the excavated tunnel.
The volume that is theoretically able to penetrate into rock fractures is very small compared to the volume of remaining aggregate. Hydraulic plugs include filter layers and clayish interiors. As the cement paste degrades, filter layers hinder material displacement and the swelling clay may replace cement if some material is “lost”. Swelling clay material can penetrate into the former concrete component (aggregate layer). In this case this is one functional target of swelling clay interior. In contrast, in the intrusion-obstructing plugs, the concrete structure does not play any important role; the intrusion is obstructed by having large boulders that are difficult to move and at the same time difficult to drill through.
6.7.4 Summary, uncertainties and issues that need propagation
There are no major uncertainties in the evolution of the closure components during the temperate period. If it is assumed that the concrete components in hydraulic plugs will degrade, no preferential paths will be formed as the aggregate component remains, filter layers hinders material displacement, swelling clay acts as a patching material and materials will settle by gravitation. Hydraulically the most conductive sections are backfilled with aggregate which is not prone to erosion. Transport through closure components will still be dominated by diffusion.
6.8 Canister corrosion
6.8.1 Overview and performance targets potentially affected
During this period the conditions are the most aggressive from the point of view of canister corrosion and its safety function of containment. Several loads will act simultaneously on the copper overpack: radiation, high temperatures, swelling pressure from the buffer, high salinity, potentially aggressive agents (such as ammonia, nitrates, nitrites) although their concentration is expected to be small and their transport to the canister surface will be inhibited by the compacted bentonite, potentially high pH conditions from the presence of cementitious materials in the repository and, when
276
conditions have become anaerobic, corrosion from sulphide ions, which will continue throughout the assessment period. These different loads on the canister have been defined and the canister has been designed to withstand them. This section addresses the performance of the copper overpack against corrosion during this period.
The corrosion mechanisms and copper corrosion depths are discussed for the periods during and after buffer saturation.
6.8.2 Corrosion during buffer saturation
The water content in bentonite around the canister will gradually increase and will most probably result in an uneven swelling of the buffer. As a consequence of this, the gap between the canister and the buffer may close in some areas while it remains open in others. This will allow localised corrosion on sites where bentonite first contacts the canister. The bentonite porewater will contain trapped oxygen dissolved in the pores and the concentration of Cl- ions will increase approaching the concentration of the infiltrating groundwater. It is to be expected that the electrochemical reduction of oxygen will be faster at sites where there is a good supply of oxygen, an electrolyte is present, and where there is a short distance to a site where electrochemical corrosion of copper can take place. Locally increased corrosion rates may therefore be expected at three-phase boundaries; copper/moist bentonite/air. Nonetheless, by the time of full saturation of the bentonite, the whole canister surface will have been exposed to this condition at some point and this will have resulted in slightly uneven corrosion. Preliminary results on under-deposit corrosion as a result of different rates of access of O2 to the canister surface suggest that the degree of localisation of the attack due to this phenomenon is small (King et al. 2012, Section 5.3.1).
The results of corrosion tests carried out in the laboratory and in underground research facilities under simulated repository conditions suggest that canisters will not undergo classical pitting, but rather a form of under-deposit corrosion in which there is no permanent separation of anodic and cathodic sites. The mechanistic Cu pitting studies indicate that an oxidant (either O2 or Cu(II)) is a pre-requisite for pit propagation. Since the near-field environment in the repository will evolve from initially oxidising to ultimately reducing, this implies that pitting will only be possible (if at all) in the early stages of the repository life. The method of prediction currently used is to assume a certain degree of roughness (50 micrometres), which is then added to the predicted depth of general corrosion. In addition, the high Cl- content of the Olkiluoto groundwater will tend to promote general dissolution over localised corrosion, but not until the bentonite porewater has equilibrated with the groundwater (King et al. 2012, Section 6.1.2.1).
The possibility of enhanced susceptibility to localised corrosion because of passivation of the copper canister by alkaline pore waters resulting from the use of cementitious materials in the repository (see Table 6-5) was investigated by King (2002). It was found that increased pH actually renders the surface less susceptible to localised corrosion because the difference between the pitting or repassivation potential and corrosion potential increases with increasing pH (Section 7.7). Therefore, in the unlikely event that high pH leachates of cementitious materials should reach the canister surface, there will be no detrimental impact on canister performance.

277
Before complete saturation, more microbial activity is expected and saturation times can last up to several thousand years. It is expected that few, if any, deposition holes will lose sufficient buffer material to establish advective conditions in the early temperate period (Section 6.4).
In summary, there appears to be a sound understanding of the mechanisms of copper corrosion in unsaturated bentonite, which is supported by the limited available evidence. Because of the limited amount of O2 in the repository, any initial localisation of attack will be limited. It is now apparent that copper exposed to disposal environments undergoes “uneven general corrosion” or surface roughening, rather than pitting corrosion (King et al. 2012, Section 5.3). The corrosion allowance for surface roughening is typically < 100 micrometres (King et al. 2012, Section 5.3).
6.8.3 Corrosion after buffer saturation – sulphide corrosion
Once O2 is consumed, sulphide ions (in the form of HS-) are the main remaining corroding agents for copper. The corrosion of copper by sulphide will proceed with the formation of copper sulphide and molecular hydrogen (from the reduction of the protons in HS- or H2O).
2 Cu + HS− + H+ → Cu2S + H2 (6-3)
The copper corrosion model assumes that the final product is Cu2S which implies that 1 mol of S corrodes 2 moles of Cu. In reality, copper could also form CuS or react with other polysulphur species (polysulphides, polythisulphates and polythionates) which are present under anoxic conditions, albeit in very low concentrations (MacDonald & Sharifi-Asl 2011). The copper corrosion model used to calculate the number of failed canister as a function of sulphide transport through the buffer is described in Appendix B. The results are presented in Chapter 7 and Chapter 8.
A mixed-potential model has been developed by King et al. (2012, Section 5.2.3) to predict the evolution of the corrosion potential as the initially trapped O2 is consumed and as HS– from various sources begins to dominate the corrosion behaviour. The model accounts for the various electrochemical, mass transport, redox, precipitation, and sorption reactions of importance for the corrosion of copper in compacted bentonite with sulphide-containing chloride pore waters (King 2007).
The groundwater, the buffer and the backfill are the main sources of sulphides. Sulphide in groundwater originates from the dissolution of sulphide minerals from the rock into the flowing water in a fracture or from sulphate-reducing bacteria (SRB) in the groundwater-rock system. The current levels of sulphide in groundwater are below 1 mg/L and pessimistically are assumed to be 3 mg/L for the purpose of corrosion calculations (see Section 5.1.8).
The rate-determining step in the overall corrosion reaction is the supply of sulphide to the canister surface because of the high mass-transfer resistance of highly compacted bentonite. Recent electrochemical studies provide support for this assumption and allow the conditions under which the assumed mechanism remains valid to be estimated. Chen et al. (2011a, b) report a transition from rate control by diffusion of Cu+ (or CuCl2
-) through a porous film to rate control by the diffusion of HS- through solution once the

278
initial sulphide concentration of 5·10-5 mol/L had been depleted in the experiment. Let us assume that this transition in mechanism occurred after a 10-fold depletion of sulphide, corresponding to a bulk concentration of 5·10-6 mol/L (0.2 mg/L). For the same range of bulk solution mass-transfer coefficient assumed above, the transition to solution transport control would be expected to occur for a HS- flux of 5·10-12 to 5·10-13 mol/(cm2·s). For 10 cm of highly compacted bentonite (diffusion velocity D/ ~10-8 cm/s), this threshold flux corresponds to a groundwater sulphide concentration of 0.05−0.5 mol/L (1.65−16.5 g/L). Since the groundwater sulphide concentration is 2−4 orders of magnitude below this range, the corrosion rate of the canister will be controlled by the rate of diffusion of HS- through the bentonite.
This threshold sulphide flux can also be used to estimate the extent to which the mass-transfer resistance of the bentonite must be reduced (for example, by buffer erosion) for the corrosion rate to be determined by a process other than sulphide diffusion. If we assume a groundwater HS- concentration of, say, 5·10-5 mol/L (2 mg/L), the threshold flux of 5·10-12 to 5·10-13 mol/(cm2·s) corresponds to a range of mass-transfer coefficients of 10-4−10-5 cm/s. For a diffusion path length of 10 cm, this range of D/ corresponds in turn to a range of HS- diffusivity of 10-3−10-4 cm2/s. This range of diffusivity is 1 to 2 orders of magnitude higher than in bulk solution, suggesting that for this groundwater sulphide concentration, the corrosion rate would be sulphide-transported limited even if the bentonite was completely eroded (on the assumption that transport is by diffusion only and that there is no advection).
To assess the extent of copper corrosion in the presence of sulphide in the groundwater, the distribution of flow in the deposition holes given by the DFN model is taken into account. For the calculations, the buffer is considered intact or partly eroded. The results of the sulphide corrosion model are shown in Section 7.7.2 (for the first glacial cycle) and in Section 8.2 (for repeated cycles up to 1 Ma). The calculations show that the corrosion is not fast enough to breach the copper shell within the first glacial cycle even in the deposition holes experiencing relatively high flows. This implies that no failures are expected during the next 10,000 a even in case of advective conditions in the buffer.
Pyrite as a source of sulphide both in the buffer and in the backfill is discussed in Sections 6.5.7 and 6.6.3. The sulphide pool in the buffer, which is made up of pyrite is at most about 0.6 weight-%. The direct release of sulphide by pyrite is insignificant because of its very low solubility under the expected geochemical conditions.
The large sulphate pool in the backfill is a potential source for sulphide production through SRB. In view of the large uncertainties related to backfill homogenisation and microbial activity in the boundary areas, the sulphide fluxes that may affect the canister can only be assessed by bounding analysis. Under the pessimistic assumption that all of the sulphate pool will eventually be reduced to sulphide, the main processes attenuating the sulphide flux to the canister are the precipitation of iron sulphide and the advective loss to the rock mass. Low sulphide levels, below 10-6 mol/L are expected for the backfill pore water in the absence of microbial activity. However, in the case of insufficient homogenisation (for example in the interface area with the rock), sulphate reduction via SRB might be possible, which could lead to higher sulphide levels. In the long term, the sulphide concentration is not expected to rise beyond the levels calculated for mackinawite equilibrium (0.23−0.64 mg/L). As discussed in Section 6.6.3, sulphide

279
solubility is controlled by mackinawite, the more soluble amorphous iron sulphide form, in combination with the kinetically constrained availability of iron.
Furthermore, during the first 10,000 years, it is expected that no large areas with lower bentonite density will be found in the buffer and in the backfill as design density criteria are applied and expected to be maintained during this phase (Section 6.4.3). Therefore, microbial activity is also expected to be restricted during this period.
In the buffer, sulphate is not expected to be extensively converted to sulphide by microbial processes (Section 6.5.6). Based on a pessimistic SKB estimate, the total corrosion depth due to microbial activity in the buffer and backfill is about 3 mm in 106 years (SKB 2010c, Section 5.3.2, King et al. 2012, Section 3.2.5). This result can be applied to Posiva’s case because of the similarities between the conditions and the materials involved. In the case of the backfill, the production rates can actually be higher than those in the buffer because of the lower density but, in that case, sulphide has to migrate through the buffer before it reaches the canister surface. Migration of sulphide from the backfill to the canister is discussed in Section 8.2.1.
Organic carbon, CH4 or H2 from the corrosion of steel components (e.g. rock bolts) in the repository could be considered energy sources for microbes. Most of the organic carbon in the buffer and backfill is assumed to be insoluble, in the form of humic and fulvic acids. Sulphide produced by biofilms formed on the rock surfaces, assuming that no cleaning is undertaken before repository closure, is neglected based on the limited amount of sulphides that could be produced, as argued in SKB (2010c, Section 5.3.2). The effect of H2 and CH4 on microbial activity is still under investigation. Although there are uncertainties as to the fraction of organic matter that could be used by sulphate-reducing bacteria, or the use of hydrogen or methane energy sources, the corrosion due to sulphide produced by microbial activity is considered to have a negligible impact on the copper thickness especially in the first 10,000 years because the density of the buffer remains within the performance target.
The issue of whether SCC is possible during the long-term anaerobic period has been raised by Taniguchi & Kawasaki (2008), who presented evidence for the SCC of copper in sulphide solutions above a concentration of ~5·10–3 mol/L (0.16 g/L). This is an extremely high sulphide concentration compared with the groundwater sulphide levels at Olkiluoto, which are below 1 mg/L (Section 5.1.8). King & Newman (2010) reviewed the mechanistic evidence for SCC under anaerobic conditions and concluded that of the four mechanisms proposed for the cracking of copper, three (the slip-dissolution, tarnish-rupture, and film-induced cleavage mechanisms) will not be operative in the presence of sulphide, either because insufficient HS- will enter the crack (provided the supply of sulphide to the canister surface is transport limited) or because (in the case of film-induced cleavage) copper sulphide films will be insufficiently adherent to support crack initiation. In the case of the surface mobility model, King & Newman (2010) argue that the crack propagation rate expression has been incorrectly formulated and, in its corrected version, would predict vanishingly small crack growth rates (amounting to < 1 micrometre in 106 years). Based on the evidence available to date, it appears that there is no well-founded stress corrosion cracking (SCC) mechanism in anoxic and reducing conditions that would result in stress corrosion cracking during the long-term evolution of the canister. Recent attempts at replicating

280
the results of Taniguchi & Kawasaki (2008) have been unsuccessful, with no evidence of cracking over a range of different environmental conditions in the presence of sulphide (Huang et al. 2012). Arilahti et al. (2010) reported rapid grain boundary transport of sulphide under similar conditions. Further investigations for resolving if SCC could happen in anoxic sulphide containing conditions are ongoing within the framework of the Finnish research programme on nuclear waste management (KYT).
6.8.4 External canister corrosion due to radiolysis of buffer porewater
Corrosion by moist air around the canister due to gamma (and partly by neutron) radiolysis is discussed in King et al. (2012, Section 7.2). The corrosion rates in the presence of gamma-radiation are not higher than what one would expect for corrosion of copper in un-irradiated moist air indicating that the influence of radiation will be negligible even at dose rates higher than the maximum surface dose rate for the canister.
The outer surface of the canister can be corroded by radiolysis of external water or water vapour. The only radiation type that is capable of penetrating through the canister wall is gamma radiation (and a small fraction of neutrons). Gamma radiation is mostly due to Cs-137 and Sr-90, which have a half-life of about 30 years. Therefore, radiolysis of external water is relevant only for the first 300 years after disposal.
The amounts of oxidising products (e.g. H2O2) that are capable of corroding copper depend on the amount of air and water around the canister and the dose rate from the canister. The amounts of air and water around the canister depend on the temperature around the canister. Near the surface, the temperature is close to 100 °C and the water will likely be trapped in the pores of bentonite.
The maximum dose rate from the canister is set by design to be 1 Gy/h. The actual dose rate on the different canister surfaces has been calculated based on the BWR fuel with a burn-up (BU) of 60 MWd/kgU and a cooling time of only 20 years. The dose rate (also including neutrons) is much lower (about a factor 3) than the maximum level (Raiko et al. 2010, based on Ranta-aho 2008).
Using the maximum dose rate and the maximum amount of water and air in the canister’s surroundings, the maximum amount of corrosion from oxidising radiolysis products have been estimated by SKB. According to SKB’s estimates, the maximum possible amounts of oxidised copper after about 300 years, and assuming that oxidants present in a 5 mm layer surrounding the canister reach and react with the copper surface, would give a corrosion depth of 14 μm (SKB 2010c, Section 5.1.2).
Corrosion experiments done in the presence of radiation (and high temperature in some cases) show that there is no evidence for enhanced corrosion rates caused by gamma-radiation except, possibly, at high dose rates (> 100 Gy/h). At dose rates in the range of 10–100 Gy/h, the experimental data seem to indicate a slightly lower corrosion rate in the presence of radiation (King et al. 2012, Chapter 7).
6.8.5 Summary, uncertainties and issues that need propagation
Corrosion prior to buffer saturation is expected to lead to a surface roughening of the canister (<100 micrometres) because of the uneven swelling of the buffer, possible non-

281
uniform wetting of the surface, and the simultaneous presence of residual oxygen and chloride ions. After buffer saturation and homogenisation of the swelling pressure around the canister, the main corrosion process is general corrosion by sulphide ions. Sulphide can come from groundwater or can be generated within the buffer and the backfill. The concentration of sulphide in the backfill is not expected to rise beyond the levels calculated for mackinawite equilibrium. There are some uncertainties concerning the microbial production of sulphide from sulphate ions in the buffer and in the backfill. However, the design density of the buffer and the backfill is expected to be maintained during this time frame and therefore microbial activity is expected to be negligible. Conservative assumptions lead to corrosion depth estimates over 1 Ma of about 3 mm; therefore the corrosion depth in the first 10,000 years will be negligible, in spite of the uncertainties.
Corrosion from radiolysis of buffer porewater around the canister during the early evolution of the repository is negligible because of the limits on the radiation dose at the canister surface.
In summary, the main corrosion agents during the unsaturated stage are chloride ions and residual oxygen and in the saturated stage are sulphide ions. The corrosion depth is negligible during the first 10,000 years and will be estimated at the end of the first glacial cycle in Section 7.7.2. No uncertainties need to be propagated from this time frame.
6.9 Mechanical loading on canister
6.9.1 Overview and performance targets potentially affected
As stated in Table 2-1, the canister shall initially be intact except for incidental deviations when leaving the encapsulation plant for disposal (L3-CAN-4). In the expected repository conditions the canister shall remain intact for hundreds of thousands of years except for incidental deviations (L3-CAN-5). The canister shall withstand the expected mechanical loads in the repository (L3-CAN-9). More specifically, the canister shall have sufficient mechanical strength to ensure minimal probability of isostatic collapse for isostatic pressures of up to 45 MPa, it shall withstand the expected dynamic mechanical loads and it shall have sufficient mechanical strength to ensure rupture limit > maximum shear stress on the canister, corresponding to a 5 cm displacement in any direction across the deposition hole. In the analysis the shear velocity has been assumed to be 1 m/s (Raiko et al. 2010).
6.9.2 Isostatic loads
Isostatic pressure loads are well defined and the existence of loads is postulated for all canisters. The maximum values of pressure are pessimistic. From the other parts of the EBS, only the swelling properties of the bentonite buffer contribute to the loads. That is why it is important that the specification of buffer properties is made and controlled against the definitions used in the canister strength analyses.
External mechanical loads come from the natural environment and from the behaviour of the surrounding bentonite buffer. The nominal depth of the Olkiluoto reference repository is 420 m. Thus, the maximum groundwater hydrostatic pressure is 4.1 MPa. The maximum postulated ice sheet thickness is 2–2.5 km during glaciation in the

282
Olkiluoto area, according to Pimenoff et al. (2011), but no glaciations are expected during the next 10,000 years. After that, when there is a potential for glaciation, the isostatic load may increase. This is assessed in Section 7.8.2.
The bentonite buffer swells, when the bentonite becomes water-saturated. The wetting of the bentonite buffer is expected to take place gradually after the deposition tunnel backfilling and closing within some months, and up to thousands of years depending on the water leakage rate into the tunnel and deposition holes. The bentonite swelling pressure is strongly dependent on the initial dry density of the buffer. The salinity of the absorbed water also affects swelling. Initially, the specified density for the saturated buffer is 1950−2050 kg/m3 (Design Basis, Section 5.5). Furthermore, there are no processes that would lead to increased buffer density over time, see Section 6.4. This leads to a swelling pressure of 2−10 MPa, respectively, according to Raiko et al. (2010, Section 2.2). The maximum swelling pressure of bentonite depends both on the density and the mineralogical composition of the bentonite.
In the long term, the chemical contents of the Na-bentonite may change. The Na-ion may be changed to a Ca-ion. Ca-bentonite has a remarkably higher swelling pressure than the Na-bentonite, up to 15 MPa in the high density region, e.g. at a montmorillonite content of 0.83 and a saturated density of 2050 kg/m3 (Karnland 2010, p. 27).
6.9.3 Uneven bentonite swelling pressure
The uneven swelling pressure of the bentonite buffer depends on the stochastic character of the inflow water running into the deposition hole, the initial variation of the bentonite properties and the geometric inaccuracies of the deposition hole or the initial shape or position of the bentonite buffer. There are many parameters to consider and the assessment of the enveloping load cases is made in Raiko et al. (2010, Section 2.2).
The bentonite swelling pressure can be somewhat unevenly distributed, especially during the water uptake in the early evolution. Uneven swelling is related to unevenly distributed water supply, and to variations in the deposition hole dimensions and in the density of the bentonite, although they are constrained by design specifications. The bentonite buffer applies a load on the canister (swelling pressure) and supports the canister inside the deposition hole. Bentonite has the same swelling properties at the locations of the postulated load points and at the location of the postulated support points where reaction forces balance the load system. Thus, the maximum pressure acting on the canister surface is limited to the sum of hydrostatic pressure and the swelling pressure. Furthermore, the vectorial sum of loads and supporting reaction forces has to be statically in balance. These mechanical constraints lead to the following type of unevenly distributed load scheme for the canister, see Figure 6-45. The derivation of the determining load cases during the bentonite buffer wetting phase and during the saturated period are given in Raiko et al. (2010, Section 2.2). The stress effects due to the maximum load cases are also assessed in the same report. This type of load has its main effect through bending or otherwise distorting the insert within the canister. The fractions of L are selected so that the force balance and the external moment balance are valid for the canister and the pressure load levels (10 MPa and 0 MPa) are selected so that the maximum available difference in pressure are generated to induce the maximum bending moment. The maximum tensional stress in the insert is
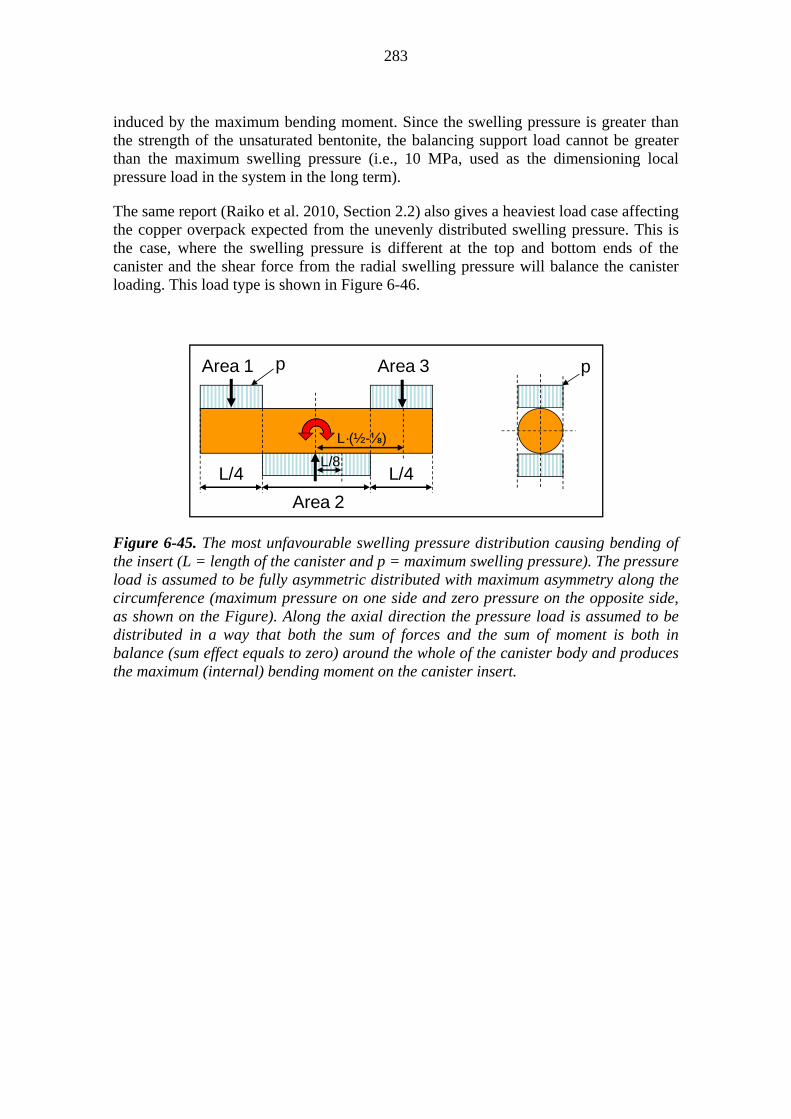
283
induced by the maximum bending moment. Since the swelling pressure is greater than the strength of the unsaturated bentonite, the balancing support load cannot be greater than the maximum swelling pressure (i.e., 10 MPa, used as the dimensioning local pressure load in the system in the long term).
The same report (Raiko et al. 2010, Section 2.2) also gives a heaviest load case affecting the copper overpack expected from the unevenly distributed swelling pressure. This is the case, where the swelling pressure is different at the top and bottom ends of the canister and the shear force from the radial swelling pressure will balance the canister loading. This load type is shown in Figure 6-46.
Figure 6-45. The most unfavourable swelling pressure distribution causing bending of the insert (L = length of the canister and p = maximum swelling pressure). The pressure load is assumed to be fully asymmetric distributed with maximum asymmetry along the circumference (maximum pressure on one side and zero pressure on the opposite side, as shown on the Figure). Along the axial direction the pressure load is assumed to be distributed in a way that both the sum of forces and the sum of moment is both in balance (sum effect equals to zero) around the whole of the canister body and produces the maximum (internal) bending moment on the canister insert.
Area 1 Area 3
Area 2
L/4
p
L/4
p
L·(½-⅛)
L/8

284
Figure 6-46. The most unfavourable swelling pressure distribution causing shear of the copper overpack.
6.9.4 Load combination
The mechanical loads described above (and in Section 5.7.10) can be grouped as follows (Raiko 2012). The typical time of occurrence is noted at the end of each type of load category.
6. Isostatic or asymmetric swelling pressure loads due to incomplete, non-uniform or uneven water saturation in Na-bentonite (effective local swelling pressure ~7.8 MPa) coupled with high temperatures (possible time of occurrence: 0−100 a)
7. Asymmetric loads in saturated Ca-transformed-bentonite due to manufacturing tolerances for the deposition hole and for buffer density (swelling pressure difference ~7.8 MPa) (100 a − ice sheet development)
8. Groundwater pressure at the depth of repository (4.1 MPa) (100 a − ice sheet development)
9. Lifting loads (canister weight plus dynamic extra loads at the time of handling and emplacement, see Section 5.7.10).
After deposition in the repository, the copper canisters for spent nuclear fuel will gradually be exposed to a temperature close to 90−100 °C. However, the canister is not loaded mechanically at such a high temperature. The external pressure from the surrounding bentonite and the groundwater will increase gradually and the canister temperature will decrease by about 10−15 °C when the bentonite has swollen so much that it makes a solid contact with the canister surface and the hydrostatic pressure of the groundwater can start to act. However, it can take hundreds of years until the pressure load against the canister starts. In such a case, the canister temperature has passed the
1 =2550 kPa
2 = 573 kPa
MPa
m
MPa

285
maximum and the temperature is much lower, when the external load starts to act on the overpack. The maximum temperature with mechanical loads is about +75 oC, if the saturation takes place within 20 to 30 years, but will be about 65 oC at 100 years or 55 oC at 200 years or 45 oC, if the buffer saturation and pressurisation on the near field of canister is delayed until 500 years from disposal. The expected canister surface temperature can be read from Figure 5-15. Figure 5-15 is according to Figure 28 of the canister design report (Raiko 2012). The temperature of the canister copper overpack will stay above room temperature for about 7000 years after deposition, and after that the temperature will slowly go down to the natural temperature of the Olkiluoto bedrock (10−11 °C) within a few thousand years.
Within this period, the gap between the canister overpack and the insert is closed, due to the external pressure load of groundwater hydrostatic pressure and the buffer swelling pressure. After the closing of the gap, further deformation of the overpack is not possible and thus creep is also stopped. This means that in the very long term creep will not go on due to an increasing pressure load.
6.9.5 Assessment of rock shear load
The bentonite material model used in the rock shear analysis is described in Börgesson et al. (2010). Rock shear is a probabilistic character load. The higher the assumed amplitude is, the lower is the probability. The design rock shear case, 5 cm amplitude, is defined so that the probability of shears focusing on existing canister locations and exceeding this magnitude is so low that they can be accepted (see discussion in Section 7.2.4).
6.9.6 Summary, uncertainties and issues that need propagation
During the first 10,000 years after disposal, the canister will remain intact, i.e. meet all its performance targets, for all conceivable loads (e.g. lifting loads in operation, isostatic and uneven swelling pressure and groundwater pressure) that could occur during this period.
6.10 Sub-criticality
In the first 10,000 years, the canister is expected to be intact and therefore the initial configuration of the fuel rods is also expected to be maintained. For the initially penetrated canister(s) (incidental deviation), the canister insert will be partially corroded and the effect of insert corrosion on criticality is discussed in Chapter 7.
6.11 Summary
6.11.1 Summary of system evolution
Hydraulic and geochemical evolution of geosphere
After closure of the disposal facility, the site will recover from the disturbances caused by the repository construction, operation and closure. Flow rates will decrease as the drawdown caused by the repository decreases and saturation of buffer and backfill occurs.
The heat produced by the spent nuclear fuel increases flow rates compared with the natural state and the upward flow around the deposition holes is enhanced. As the heat
286
production decreases to very low levels after the first thousands of years, the flow is again dominantly downwards as in the natural state. Beyond that time the main factors affecting the hydrogeological and hydrogeochemical evolution of the site are continued crustal uplift and the infiltration of meteoric waters. The recovery of the flow field after closure is relatively rapid, whereas the salinity field recovers more slowly.
The main conclusion from the modelling of cases studying the impacts of the excavation damaged zone and the potential rock damage around the deposition holes on the groundwater flow is that the connectivity is indeed increased, but the effect of the increased connectivity is limited to the deposition holes that are not intersected by flowing fractures at all or are intersected by fractures with low flow rates per unit width (less than 10-4 m3/(m·a)) and high transport resistance (higher than 500,000 years/m) and the fraction of deposition holes having values outside these limits is not increased. Thus, the target properties concerning flow rates in natural fractures and the transport resistance in the vicinity of the deposition holes are not violated.
As the disturbances caused by repository construction cease, the groundwater composition will stabilise. At repository depth, the pH remains close to 7.5 and reducing conditions prevail. During this time period, as a result of the infiltration of meteoric water at a slow, nearly constant rate, there is a decreasing trend in salinity, chloride and total charge equivalent of cations. These values are, however expected to stay within the limits of the target ranges. There are groundwater flow and transport modelling results that indicate the possibility of a few canister positions experiencing dilute conditions immediately after closure. This result is however considered to be due to simplified and pessimistic model assumptions than to reflect the understanding of the hydrogeochemical evolution of the site.
The sulphide concentrations in the groundwaters after the post-closure period up to 10,000 years are expected to recover towards the steady state conditions, and it is expected that the initially controlling amorphous iron sulphide phases will successively evolve towards more crystalline phases with a lower solubility. Although the groundwater data clearly indicate concentrations below 1 mg/L, a pessimistic upper bound of 3 mg/L is adopted for use in subsequent analyses of canister corrosion, which accounts for the possible solubility control by the more soluble amorphous iron sulphide in combination with the kinetically constrained availability of iron.
Thermal evolution of near field
The ability of the buffer to transfer decay heat from the canister to the rock will remain sufficient to ensure the requirement of the maximum buffer temperature of 100 ºC is respected regardless of the presence of air-filled gaps and uncertainties in the mineralogical composition of the buffer. The better the buffer can transfer the decay heat from the canister to the host rock, the lower the canister temperature will remain.
Mechanical evolution of rock
After the excavation and operational period and closure of the disposal facility, the rock stresses in the near field will be affected by the swelling of the buffer and backfill and by the thermal load from the spent nuclear fuel. There is a possibility of reactivation of fractures and rock damage, most notably thermally induced spalling, which may change
287
the hydraulic properties of the near-field rock and thereby affect the target properties concerning limited groundwater flow and high transport resistance in the vicinity of the deposition holes. These factors are discussed above. Over time the thermal load will decrease and stable conditions will be reached. No performance targets are directly violated due to the mechanical evolution after closure.
Mechanical and hydraulic evolution of the buffer and backfill
Once a deposition tunnel is backfilled and plugged, groundwater will flow into the tunnel and the deposition holes and saturation and swelling of the buffer and backfill will commence. Initial differences in the density and swelling pressure may also be evened out by homogenisation, although some heterogeneity will remain.
The time to reach full saturation in the buffer ranges between a few tens of years to several thousands of years depending on the local hydraulic conditions in the tunnel and deposition hole.
Homogenisation as a process is not completely understood and the development of numerical models will be continued. However, experiments and numerical assessments (THM-modelling) show that homogenisation takes place in the buffer-pellet-rock interface. Homogenisation has also been shown to take place in the backfill.
Based on the results presented in the previous sections it seems that buffer heave will remain at an acceptable level and the performance targets for the buffer and backfill will be maintained even considering the process of expansion of buffer into backfill.
Geochemical evolution of the buffer
The complex thermo-hydro-mechanical-chemical evolution during the thermal period will lead to geochemical changes in the buffer, but these will have limited impact on the performance targets. After saturation and development of the full swelling capacity, the changes will be much more moderate and constrained by diffusive processes. In particular:
The increased temperatures in the buffer will induce no or only minor montmorillonite transformation (max. 1 %) and very limited masses of newly cementing material (< 2 vol.-% of total).
The porewater chemistry will be controlled by that of the surrounding groundwater and by buffering reactions within the buffer. The resulting salinity and the variables pH and Eh will remain within target ranges (L3-ROC-10, L3-ROC-11, L3-ROC-15, L3-ROC-16) defined for the rock.
The impact of cementitious leachates on montmorillonite transformation and porewater chemistry during the temperate period will be very small.
Initially, the production of sulphide via microbial processes in the buffer will be restricted by the low water content. After saturation, microbial activity will be restricted by the high buffer density.
At some deposition holes, the buffer could be potentially affected by dilute waters and chemical erosion for a short period of time during the operational period and
288
soon after closure, according to the results of groundwater flow modelling (Section 6.1.2), although this is not supported by the hydrogeochemical understanding of the site. This case is assessed together with cases suggesting dilute conditions and buffer erosion during a glacial cycle in Sections 7.1.3 and 7.5.2.
Geochemical evolution of the backfill
The evolution of porewater chemistry in the backfill will be similar to that in the buffer, but will be much less affected by the heat from the spent nuclear fuel. Thus, any montmorillonite alteration and cementation due to thermally-induced changes will be negligible. The resulting salinity and the variables pH, pCO2 and Eh will remain within acceptable ranges. With regard to disturbances, it can be concluded that:
The degradation of cement materials in the deposition tunnel end plug contacting the backfill will not affect the fulfilment of the performance targets of the backfill during the temperate period or afterwards. Disturbances due to leachates from cementitious materials will diminish in general and also locally due to the lower concentrations of the alkaline species in the leachates.
The corrosion of iron from construction materials will have an insignificant impact on the performance targets of the backfill.
The large sulphate pool in the backfill is a potential source for microbial sulphide production. In view of the large uncertainties related to backfill homogenisation and microbial activity in the boundary areas, the sulphide fluxes that may affect the canister can only be assessed by a bounding analysis. In the case of insufficient homogenisation and areas of lower density (for example in the interface area with the rock), sulphide may be produced by sulphate-reducing bacteria. For the long time perspectives considered, the sulphide formed is not expected to rise above the levels calculated for mackinawite equilibrium (0.23−0.64 mg/L). For any sulphide formed and even for the very pessimistic assumption that all of the sulphate will eventually be reduced to sulphide, the main processes attenuating the sulphide flux to the canister are slow diffusion transport, the precipitation of iron sulphide and the advective loss to the rock mass.
In the case of good homogenisation, the high swelling pressure (high density) and small pore size will effectively restrict microbial activity and the conditions in the backfill will be similar to those in the (intact) buffer. If, however, low density areas should persist, then significant sulphate reduction cannot be ruled out, and thus it is considered in the canister corrosion analysis.
Mechanical, hydraulic and geochemical evolution of the closure
There are no major uncertainties in the evolution of the closure components during the first 10,000 years after closure. Even if it is assumed that the hydraulic plugs will become degraded, and some of the materials such as clays, aggregates, and mixtures of these eroded or suffer settlement, this is expected to have a limited effect and no continuous preferential paths are expected to be formed. Therefore, at depth, transport through closure components is assumed to be dominated by diffusion during the first 10,000 years.
289
Canister corrosion
Sulphide is the main copper corrosion agent after all oxygen has been consumed. Microbially produced sulphide in the buffer is negligible in this period; sulphide supply from the backfill is limited by the precipitation of iron sulphide and losses to the rock mass, hence, the main source of sulphide is expected to be groundwater. Quantitative corrosion calculations coupled with groundwater flow modelling have been carried out in Section 7.7. These calculations also take into account the possibility of early buffer erosion due to low salinity, as mentioned above. Microbially produced sulphide in the buffer or in the backfill is considered negligible during this phase. The calculations show that total corrosion depth will be negligible during the first 10,000 years. The initially intact canisters will remain intact for all conceivable loads that could occur during the first 10,000 years (see below) and thus the spent nuclear fuel will remain contained within the canister.
Mechanical loading on canister
During the temperate period, the canister(s) will remain intact, i.e. meet all its performance targets, for all conceivable loads (e.g. isostatic and uneven swelling pressure and groundwater pressure) that could occur during this period.
Sub-criticality
No criticality event is expected during this period since the canisters are expected to be intact. For the incidental deviations of initially penetrated canisters, see Chapter 7.
6.11.2 “State” of components with regard to safety functions and performance targets
During the temperate period after repository closure, the state of all components will still conform to the target properties and performance targets. There are some possibilities for incidental deviations, although none of these are expected. These incidental deviations are described below.
As found for the operational period, it cannot be excluded that a few deposition holes might experience a higher post-closure flow rate or a lower transport resistance than the target values.
Immediately after closure, modelling results indicate the possibility that a few canister positions may experience dilute conditions such that chemical erosion of the buffer could be possible. This result is considered to be due to simplified and pessimistic model assumptions and does not reflect the overall understanding of the likely future hydrogeochemical evolution of the site.
Homogenisation of the buffer and backfill should ensure a sufficiently high density to restrict microbial activity; the conditions in the backfill will be similar to those in the buffer. If, however, low-density areas should persist in the backfill, then sulphate reduction cannot be ruled out, and this is considered in the canister corrosion analysis (see Section 8.2).
Of the above incidental deviations, none gives any possibility for release of radionuclides on its own. Even combining the pessimistic assumption on sulphide (3 mg/L) in groundwater, microbial reduction of sulphate to sulphide in the localised

290
parts of the backfill, and chemical erosion of the buffer in a few canister positions, the calculated corrosion depth is not enough to lead to canister failure in the 10,000 year time window.
The case of a canister with an initial penetrating defect can be further affected by some of the above incidental deviations. These combinations are carried forward to be considered in the formulation of scenarios and assessment of radionuclide releases.
6.11.3 Assessment whether all FEPs and FEP interactions have been assessed
All the relevant evolution FEPs during the temperate period have been taken into account in assessing the performance of the repository system (i.e. heat transfer, stress redistribution, spalling, rock-water interaction; water uptake and swelling, montmorillonite transformation, alteration of accessory minerals; chemical and physical degradation; deformation, corrosion of the copper overpack, stress corrosion cracking); one of the most important migration-related FEPs (Features, Events and Processes), groundwater flow (and advective transport), is accounted for through all the assessment as it is coupled to heat transfer and rock-water interactions and thus to the evolution of the whole repository system.
291
7 REPOSITORY SYSTEM PERFORMANCE − LONG-TERM EVOLUTION
In the long term, i.e. over the next hundred thousand years or so, major climatic events being part of future glacial cycles, including permafrost, glaciations, and associated sea-level changes, are expected to occur. These changes may affect, on the one hand, the isostatic load, rock stresses and groundwater flow and composition, which in turn affect the performance of the closure, backfill, buffer and canister as assessed in the sections below. Furthermore, these climatic-driven changes also affect the mechanical and thermal evolution of the EBS and host rock as assessed below. This chapter discusses the evolution of the repository system from 10,000 years after closure up to the end of the next glacial cycle.
7.1 Hydraulic and geochemical evolution of the geosphere
7.1.1 Overview and target properties potentially affected
A glacial cycle consists of periods with temperate climate, permafrost, ice sheets and periods when the site is submerged. The evolution during the first 10,000 years of the temperate period has been discussed in Section 6.1. This section discusses the continuation of the temperate period until 50,000 years AP and the following permafrost and glacial periods. During permafrost, groundwater flow is reduced as a consequence of very low hydraulic gradients, although pressure differences between frozen and unfrozen areas do exist. The hydraulic pressure may be increased by the presence of an ice sheet. However if the ice sheet is cold-based or there is permafrost below the ice-sheet, the groundwater flow is inhibited. Also the gradually increasing isostatic pressure in connection of the ice sheet growth may compress or close fractures may further reduce flow. In the case of a warm-based ice sheet, flow rates increase. Especially at the ice margin, hydraulic gradients can be high due to the high pressure under the ice and lower pressure in front of the ice margin. Consequently flow rates at the site are increased and will have an effect on transport paths and groundwater composition. Changes in groundwater composition are possible as a result of infiltration of meteoric water during the temperate period, infiltration oxygen-rich, glacial melt waters, upconing of saline waters during ice-sheet retreat and infiltration of seawater with varying salinity during a submerged period.
The target properties of interest concern the groundwater flow rate and transport resistance of the migration paths in the vicinity of the deposition holes and the groundwater composition, especially redox conditions and oxygen content, chloride content, sulphide content, methane content, ionic strength (total charge equivalent of cations), salinity (TDS), iron content and colloid and organic content.
Of these, the properties of the rock affected by the presence of the EBS and foreign materials introduced in the repository and processes occurring in the near field are discussed in connection with the geochemical evolution of the near field (Section 7.4). These issues are microbial processes related to the degradation of organic materials, colloid formation and the increase of pH due to cement leachates.

292
7.1.2 Groundwater flow
Groundwater flow during the temperate period after 10,000 years AP until the onset of permafrost at 50,000 years AP is mainly driven by the topography-induced natural hydraulic gradients. Crustal uplift and dilution of groundwater due to ongoing fresh water infiltration will also continue to affect the groundwater flow. The gradual development of permafrost decreases hydraulic conductivity and fresh water infiltration, resulting in changes in groundwater circulation not only at shallow depths but also deeper in the planned repository rock volume. During glaciation the pressure of the ice sheet (its profile, retreating rate and direction, NNW in the Olkiluoto case), is the major driving force to the groundwater flow. If the ice sheet is cold-based or if there is permafrost beneath the ice sheet, then infiltration of glacial melt water will be very limited. If the ice sheet is warm-based, as is expected during ice-sheet retreat, infiltration of surface waters through fracturing in the ice layer and melting waters forming below the ice sheet may infiltrate into deep bedrock because of the hydraulic gradients due to variation of hydraulic head between areas below the ice sheet and areas with no ice cover. The hydraulic gradients are expected to be at the highest in the vicinity of the margin. At the time of the retreat of an ice sheet and after it, Olkiluoto is assumed to be sub-merged as it was at the end of the Weichselian.
Groundwater flow and salinity evolution during the continuation of the temperate period until 50,000 years AP, under permafrost conditions, and during glaciation have been modelled by Löfman & Karvonen (2012) and Hartley et al. (2013b), see Appendix D for a summary of the modelling assumptions. The modelling has not been carried out in a continuous fashion throughout a glacial cycle. Rather, selected time windows from the reference climate evolution (see Section 4.1) have been used to represent permafrost and ice-sheet conditions. The glacial simulations in these studies have focused on the retreating ice sheet conditions as there is evidence of permafrost and cold-based ice sheet conditions during the advance of an ice sheet (see Chapter 4 and Appendix 2 in Formulation of Radionuclide Release Scenarios). Therefore, it is assumed that, during ice-sheet advance, the flow is inhibited due, on the one hand, to the possible permafrost conditions preceding the onset of an ice sheet and, on the other hand, to the gradually increasing isostatic pressure, which may compress or close fractures, in particular the subhorizontal ones, which are most common at the Olkiluoto site. During the continued temperate climate from 10,000 years until 50,000 years, there is a slight increase in groundwater flow rates in the upper part of the bedrock down to approximately 300 m depth. This increase is related to the increase in hydraulic heads due to the changes in the surface environment. Following the retreat of the shoreline, peatlands develop in the low-lying areas (see Löfman & Karvonen 2012) and the hydraulic head in these areas may increase. The difference in hydraulic head between the area above the repository and the discharge areas around the present island shoreline changes from 12 m (10,000 years) to 14 m (50,000 years) (Löfman & Karvonen 2012, Section 2.3). The flow rates at repository depth are, however, not significantly affected (see Figure 5-2).
The groundwater flow modelling under permafrost conditions by Löfman & Karvonen (2012) assumed a permafrost time window lasting about 10,000 years (see Ch. 4 in this report and in Formulation of Radionuclide Release Scenarios). Two representative periods of the last glacial cycle (Figure 7-1) have been modelled; during period 1, the permafrost reached a depth of approximately 80 m, and, during period 2, permafrost reached around 300 metres depth. The permafrost development used in the models is
293
based on the results of permafrost simulations by Hartikainen (2013). At the beginning of the permafrost periods, the initial and boundary conditions for pressure and salinity were taken from the corresponding temperate period results at 10,000 years AP, due to the better reliability of the data and models for this time compared with a prolonged temperate period. It has been assumed that taliks, unfrozen area below the ice sheet, may form in the current sea areas north, northwest and southwest of Olkiluoto Island (see Figure 7-2 and Haapanen et al. 2010). According to the results of Löfman & Karvonen (2012), the groundwater flow rate to the reference volume containing the repository reduces to about one fifth of that during the temperate climate (i.e. from about 50−100 m3/year to ten to a few tens of cubic metres per year, see Figure 7-1).
Groundwater flow and salinity evolution modelling during the retreat of an ice sheet has covered four cases with the ice margin located at Olkiluoto or close to it; three cases considered an immobile ice sheet boundary staying at three different locations at Olkiluoto for 1000 years and a case with a mobile ice sheet retreating at a rate of 200 m/year (Löfman & Karvonen 2012) (see Figure 7-2). It is assumed that the site is submerged and the top boundary condition for the model is defined as the pressure exerted by the sea level height and the ice sheet thickness. This means that the presence of the ice sheet constitutes an infinite source of meltwater with a hydraulic head at the base of the ice sheet equal to 90 % (due to the ice density) of the ice sheet thickness. All the meltwater infiltrates into the bedrock below the ice sheet and discharges outside the ice margin. This approach provides a conservative upper limit for the meltwater infiltration to be used in numerical modelling. The salinity at the initial state for the simulations of the ice-sheet retreat period has been the one at the end of the permafrost period 1 with taliks. The infiltrating water is assumed to have zero salinity.
The presence of the ice sheet increases the hydraulic gradients, which evolve with time as the ice margin moves across the site. During ice-sheet retreat, the flow rates through the repository volume depend on the location of the ice margin with respect to the repository (see Figure 7-3). If the repository is still below the ice sheet although close to the ice margin, the flow rates are significantly increased (to appr. 200–700 m3/a) compared with the situation at the end of the temperate climate phase (appr. 50−100 m3/a) or with the natural state before ONKALO construction (appr. 30–80 m3/a) (see Figure 5-1) i.e. the flow rates are increased by a factor of 4 to 714. In the subsequent analyses (see e.g. Sections 7.4, 7.5 and 7.7), it has been cautiously assumed that the flow rates are ten times higher during the ice-sheet retreat period than during the corresponding temperate time window (see also Figure 7-4). As the ice passes the site, the flow rates reduce as the distance to ice margin increases. During the submerged period, when the ice margin is not in the vicinity of the site, flow rates at repository depth are even lower than during the temperate period, as the only driving force is density variation. The location of the ice margin (Figure 7-2) affects significantly the flow directions in the repository rock volume. The main flow direction is from northwest to southeast, which is determined by the imposed ice sheet profile and its direction. At shallow depths water flows horizontally to southeast until discharging to the sea outside the ice margin. The flow direction in the SFR of the repository area is mainly upwards, which is strengthened more and more by the approaching and crossing
14 Löfman & Karvonen (2012) report the increase to be three to five-fold using a slightly different rounding of the flow rates.
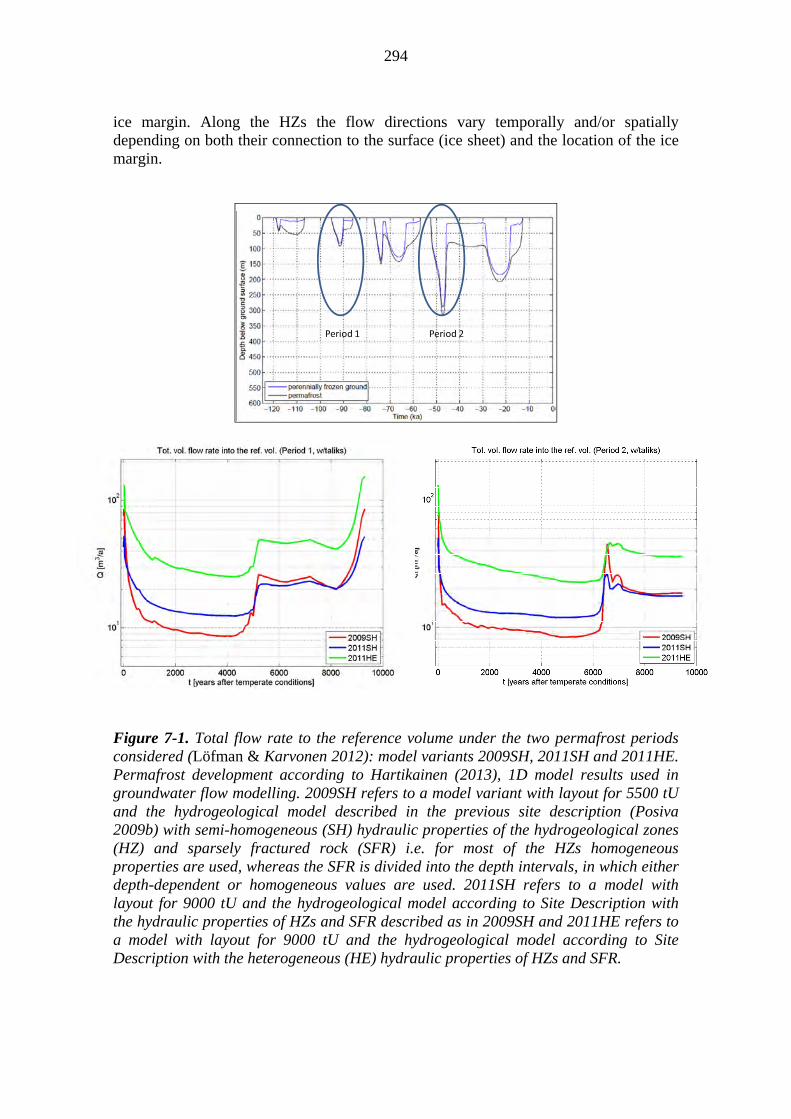
294
ice margin. Along the HZs the flow directions vary temporally and/or spatially depending on both their connection to the surface (ice sheet) and the location of the ice margin.
Figure 7-1. Total flow rate to the reference volume under the two permafrost periods considered (Löfman & Karvonen 2012): model variants 2009SH, 2011SH and 2011HE. Permafrost development according to Hartikainen (2013), 1D model results used in groundwater flow modelling. 2009SH refers to a model variant with layout for 5500 tU and the hydrogeological model described in the previous site description (Posiva 2009b) with semi-homogeneous (SH) hydraulic properties of the hydrogeological zones (HZ) and sparsely fractured rock (SFR) i.e. for most of the HZs homogeneous properties are used, whereas the SFR is divided into the depth intervals, in which either depth-dependent or homogeneous values are used. 2011SH refers to a model with layout for 9000 tU and the hydrogeological model according to Site Description with the hydraulic properties of HZs and SFR described as in 2009SH and 2011HE refers to a model with layout for 9000 tU and the hydrogeological model according to Site Description with the heterogeneous (HE) hydraulic properties of HZs and SFR.
Period 1 Period 2

295
Figure 7-2. Assumption on the location of the ice sheet margin and the hypothetical taliks at the Olkiluoto site (Löfman & Karvonen 2012). The taliks were considered only in some of the permafrost simulations. Immobile ice margin locations are marked with numbers corresponding to different modelling cases. The three taliks are marked with blue dashed lines.
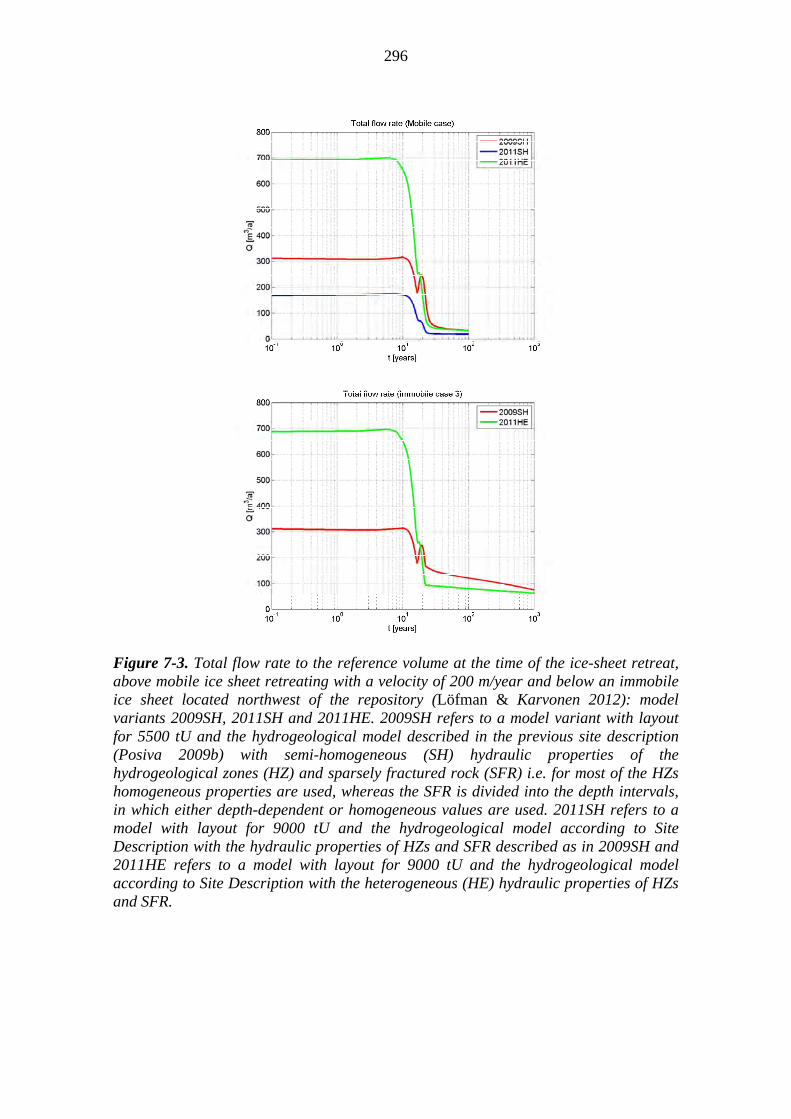
296
Figure 7-3. Total flow rate to the reference volume at the time of the ice-sheet retreat, above mobile ice sheet retreating with a velocity of 200 m/year and below an immobile ice sheet located northwest of the repository (Löfman & Karvonen 2012): model variants 2009SH, 2011SH and 2011HE. 2009SH refers to a model variant with layout for 5500 tU and the hydrogeological model described in the previous site description (Posiva 2009b) with semi-homogeneous (SH) hydraulic properties of the hydrogeological zones (HZ) and sparsely fractured rock (SFR) i.e. for most of the HZs homogeneous properties are used, whereas the SFR is divided into the depth intervals, in which either depth-dependent or homogeneous values are used. 2011SH refers to a model with layout for 9000 tU and the hydrogeological model according to Site Description with the hydraulic properties of HZs and SFR described as in 2009SH and 2011HE refers to a model with layout for 9000 tU and the hydrogeological model according to Site Description with the heterogeneous (HE) hydraulic properties of HZs and SFR.
297
Hartley et al. (2013b) calculated the total flow rate per unit width at the release location and flow-related transport resistance F (=2·WL/Q) for the three release path types (F-path, DZ-path and TDZ-path with exit from the deposition hole to a host-rock fracture intersecting the deposition hole, to the EDZ below the tunnel floor or to the tunnel backfill above the deposition hole, see Section 6.1.2) for selected cases based on the work by Löfman & Karvonen (2012):
Mobile ice sheet passing the site, considering the flow field at two time instants: 10 years (repository still under the ice sheet, ice margin south-east of the repository) and 100 years (repository not below the ice sheet, ice margin about 20 km north-west of the site) after the ice sheet is located at the initial location (Figure 7-2) and
Immobile ice sheet located over the site at location 3 (see Figure 7-2), i.e. when the repository is no longer under the ice sheet.
The resulting cumulative distribution of the total flow rate per unit width at the release location (UF) and flow-related transport resistance (F =2·WL/Q) for the three release path types (F-path, DZ-path and TDZ-path) are shown in Figure 7-4. For reference, the same distributions for the central case assuming boundary conditions for the year 2000 AD are shown. As can be seen from Figure 7-4, the result for the cases when the repository is no longer under the ice sheet (immobile ice sheet, case 3, 100 years and mobile ice sheet 100 years), the transport resistance distribution is not affected. During the high flow conditions when the repository is still under the ice sheet (mobile ice sheet 10 years), there is a significant increase of potential deposition hole locations having transport resistances in the range of 3·104 to 106 a/m, but transport resistance below 104 a/m remain exceptional. The results are similar for the initial flow rate of the F-paths (UF); once the ice sheet has moved away from the site. The flow rates are, in general, similar to, or even lower than, the central case. On the other hand, when the repository is still below the ice sheet but close to the ice margin, the flow rates increase. Still only slightly over 20 % of the potential deposition hole locations would experience a flow rate (UF) higher than 10-3 m3/(m·a). The results for the other flow paths, DZ- and TDZ-paths show similar beahviour.
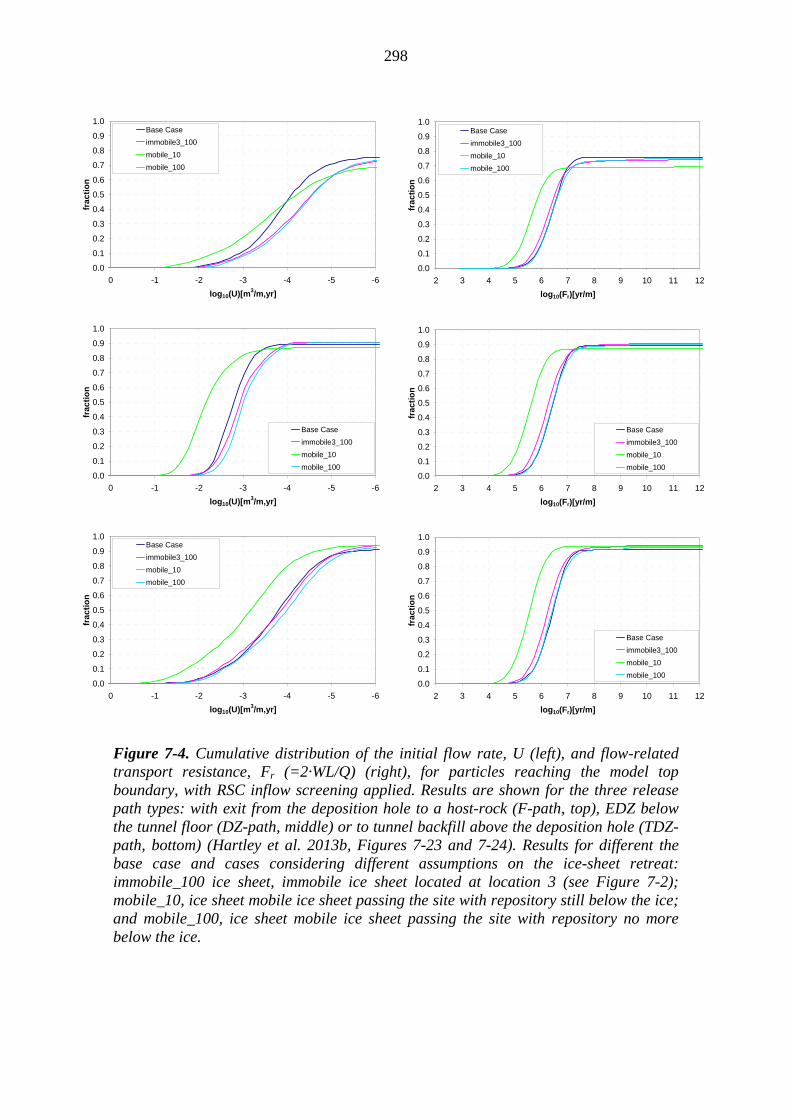
298
Figure 7-4. Cumulative distribution of the initial flow rate, U (left), and flow-related transport resistance, Fr (=2·WL/Q) (right), for particles reaching the model top boundary, with RSC inflow screening applied. Results are shown for the three release path types: with exit from the deposition hole to a host-rock (F-path, top), EDZ below the tunnel floor (DZ-path, middle) or to tunnel backfill above the deposition hole (TDZ-path, bottom) (Hartley et al. 2013b, Figures 7-23 and 7-24). Results for different the base case and cases considering different assumptions on the ice-sheet retreat: immobile_100 ice sheet, immobile ice sheet located at location 3 (see Figure 7-2); mobile_10, ice sheet mobile ice sheet passing the site with repository still below the ice; and mobile_100, ice sheet mobile ice sheet passing the site with repository no more below the ice.
0.0
0.1
0.2
0.3
0.4
0.5
0.6
0.7
0.8
0.9
1.0
-6-5-4-3-2-10
log10(U)[m3/m,yr]
frac
tio
n
Base Case
immobile3_100
mobile_10
mobile_100
0.0
0.1
0.2
0.3
0.4
0.5
0.6
0.7
0.8
0.9
1.0
2 3 4 5 6 7 8 9 10 11 12
log10(Fr)[yr/m]
frac
tio
n
Base Case
immobile3_100
mobile_10
mobile_100
0.0
0.1
0.2
0.3
0.4
0.5
0.6
0.7
0.8
0.9
1.0
-6-5-4-3-2-10
log10(U)[m3/m,yr]
frac
tio
n
Base Case
immobile3_100
mobile_10
mobile_1000.0
0.1
0.2
0.3
0.4
0.5
0.6
0.7
0.8
0.9
1.0
2 3 4 5 6 7 8 9 10 11 12
log10(Fr)[yr/m]
frac
tio
n
Base Case
immobile3_100
mobile_10
mobile_100
0.0
0.1
0.2
0.3
0.4
0.5
0.6
0.7
0.8
0.9
1.0
-6-5-4-3-2-10
log10(U)[m3/m,yr]
frac
tio
n
Base Case
immobile3_100
mobile_10
mobile_100
0.0
0.1
0.2
0.3
0.4
0.5
0.6
0.7
0.8
0.9
1.0
2 3 4 5 6 7 8 9 10 11 12
log10(Fr)[yr/m]
frac
tio
n
Base Case
immobile3_100
mobile_10
mobile_100

299
7.1.3 Groundwater composition
During the continuation of the temperate period from 10,000 years to the onset of permafrost estimated to take place at 50,000 years AP, infiltration of meteoric waters will continue to dilute the groundwater. Under permafrost conditions, the hydraulic conductivity of the frozen rock decreases significantly and infiltration is basically non-existent. Changes in groundwater composition are, therefore, also reduced. However, increased groundwater flow and infiltration of glacial meltwater and sea water in connection with ice-sheet retreat, when the ice sheet is assumed to be warm-based, also affect groundwater composition, especially in the upper part of the bedrock.
Salinity evolution during the continuation of the temperate period, permafrost, and retreat of the ice sheet has been estimated based on the modelling by Löfman & Karvonen (2012) and Hartley et al. (2013b). Trinchero et al. (2013) consider, in addition to salinity, chemical reactions (for description of the models, see Appendix D). Different models are applied to address different aspects of groundwater flow, solute transport and hydrogeochemistry that cannot all be handled with a single model. The modelling by Löfman & Karvonen (2012) and Hartley et al. (2013b) address the changes in salinity, whereas Trinchero et al. (2013) present a more comprehensive discussion on the evolution of groundwater composition. The model by Löfman & Karvonen (2012) models the salinity distribution in the entire modelling volume as a result of mixing of the initial groundwaters and infiltrating waters and taking into account the exchange of solute particles between the water-bearing fractures and surrounding porous rock matrix. Advection and dispersion are the dominant processes within the water-bearing fractures, whereas in the matrix, solutes are transported only by diffusion. The models by Hartley et al. (2013b) and Trinchero et al. (2013) consider changes in the groundwater composition along one-dimensional streamlines based on the groundwater flow modelling results by Hartley et al. (2013b, discrete fracture network model) and Löfman & Karvonen (2012, equivalent porous medium model), respectively. The streamlines present a selected time instant of the model. In the model by Hartley et al. (2013b) advection along the path and diffusive matrix exchange with the surrounding matrix are considered. The model by Trinchero et al. (2013) takes into account dispersion and advection along the streamline, the mass transfer with the surrounding rock matrix between the mobile and the main geochemical reactions.
Groundwater salinity
According to the results of Löfman & Karvonen (2012), although the average salinity remains in the range of 5−10 g/L in all model variants, the continued infiltration of meteoric water during the continuation of the temperate period leads to increased variation in the distribution of the salinity and in a lower minimum salinity at repository depth (see Figure 5-8 and Figure 6-7). The model variants differ from each other in terms of the assumed repository layout and the hydrogeological structural model and its properties. Assuming homogeneous properties of the sparsely fractured rock and base case transport parameter values, model variant 2009SH, the salinity (TDS) is estimated to vary between about 1 g/L and about 15 g/L. The minimum and maximum values are clearly related to hydrogeological zones. After about 40,000 years AP, salinities below 1 g/L are possible. Assuming either more pessimistic values for flow, diffusion porosity, or heterogeneous properties for the sparsely fractured rock, results in lower salinities (Löfman & Karvonen 2012, Appendix G, see also Figure 7-5 below). Assuming

300
heterogeneous properties of the hydrogeological zones and sparsely fractured rock, model variant 2011HE, gives a minimum salinity of 0.01 g/L towards 50,000 years. It is estimated that there will be dilute water (<0.4 g/L) at repository depth after about 25,000 years AP, and, at 50,000 years AP, about 2 % of the nodes (from a total of ~ 9000 nodes) representing the deposition tunnels in the finite element mesh have a salinity < 0.4 g/L. Dilution is also controlled by the hydrogeological zones in this model, but, in addition, the stochastic features with higher transmissivity allow flow paths for meteoric water within the sparsely fractured rock. As a result of the significantly reduced groundwater flow during the permafrost period (see Löfman & Karvonen 2012), the salinity levels during the permafrost period remain at the level prevailing before the onset of the permafrost (see Figure 5-8 and Figure 6-7).
The time evolution of the minimum, average and maximum salinity applying model variant 2009SH (see Appendix D) during the retreat of the ice sheet is presented in Figure 7-6 based on Löfman & Karvonen (2012). The salinity distribution at repository depth is shown in Figure 7-7. As discussed in Section 7.1.2 and Appendix D, the ice sheet in the flow model constitutes an infinite source of meltwater with a hydraulic head at the base of the ice sheet equal to 90 % (due to the ice density) of the ice sheet thickness and it provides a conservative upper limit for the melt water infiltration for the purpose of the numerical modelling. In the case of the mobile ice sheet, there is no major change in the salinity at the repository level as the ice margin moves quite fast over Olkiluoto Island. In the case of the immobile ice sheet, there is a slight increase of a few grams per litre in the average salinity in the reference volume during a period of 1000 years. However, if the ice margin stays at the site, the maximum salinity in the reference volume rises to about 30 g/L and the minimum salinity also decreases to a few grams per litre during a period of 1000 years. The salinity increase is possible when the ice sheet located upstream of the site is pushing deep saline water upwards through the repository towards the ice margin. The results are sensitive to assumptions regarding the location of the ice margin and the related boundary conditions. Assuming smaller values of flow and diffusion porosities, infiltration of surface waters is more prominent. Model variant 2009HE assuming heterogeneous properties, shows larger variation of the salinity values and mainly dilution, but not the presence of highly saline waters.

301
Model variant 2009SH layout for 5500 tU and the hydrogeological model
2009 with semi-homogeneous (SH) hydraulic properties of the hydrogeological zones (HZ) and
sparsely fractured rock (SFR)
Model variant 2011HE layout for 9000 tU and the hydrogeological model
2011 with the heterogeneous (HE) hydraulic properties of the hydrogeological zones (HZ) and
sparsely fractured rock (SFR)
t = 10,000 years
t = 50,000 years
Figure 7-5. Distribution of the salinity at the repository level (Z = -410 m) at 10,000 and 50,000 years after the start of the disposal operations (Löfman & Karvonen 2012).
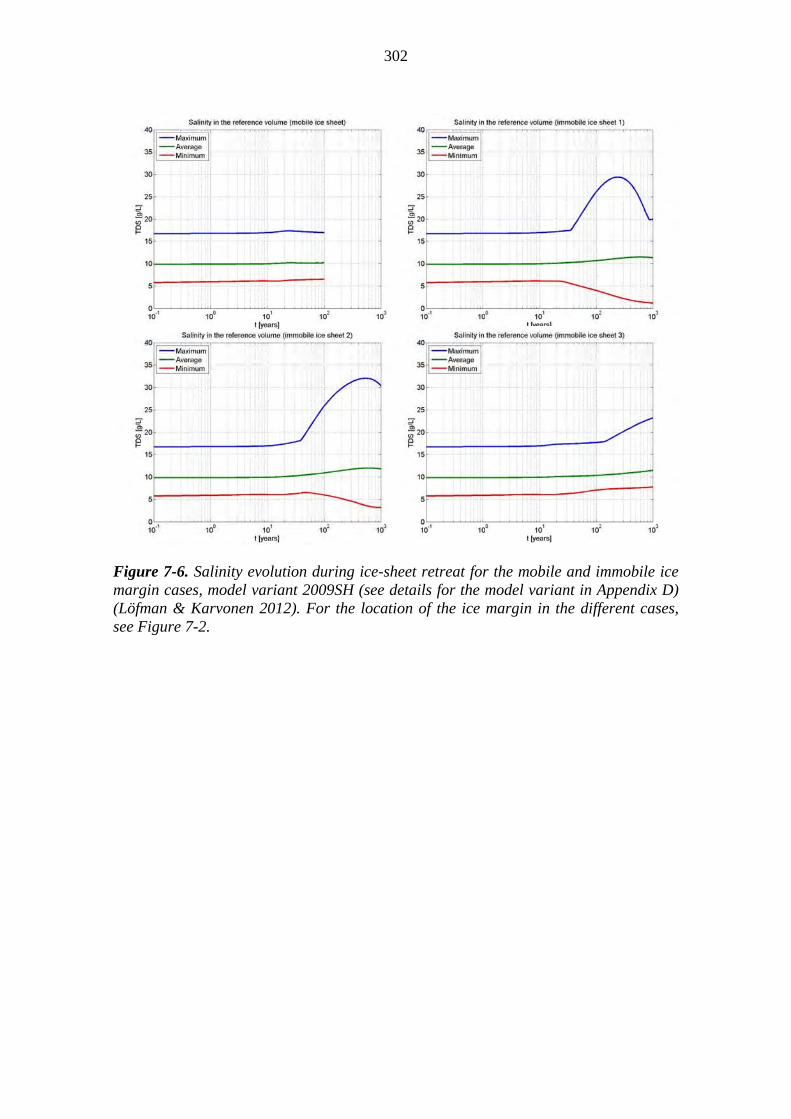
302
Figure 7-6. Salinity evolution during ice-sheet retreat for the mobile and immobile ice margin cases, model variant 2009SH (see details for the model variant in Appendix D) (Löfman & Karvonen 2012). For the location of the ice margin in the different cases, see Figure 7-2.

303
Model variant 2009SH layout for 5500 tU and the hydrogeological model
2009 with semi-homogeneous (SH) hydraulic properties of the hydrogeological zones (HZ) and
sparsely fractured rock (SFR)
Model variant 2011HE layout for 9000 tU and the hydrogeological model
2011 with the heterogeneous (HE) hydraulic properties of the hydrogeological zones (HZ) and
sparsely fractured rock (SFR)
Temperate period, t = 10,000 years
Immobile ice sheet case 3, t = 100 years
Mobile ice sheet, t = 100 years
Figure 7-7. Salinity at repository depth during ice-sheet retreat (Löfman & Karvonen 2012). For the location of the ice margin in the different cases, see Figure 7-2. The salinity distribution at 10,000 years AP used as input for the permafrost modelling is given as reference.
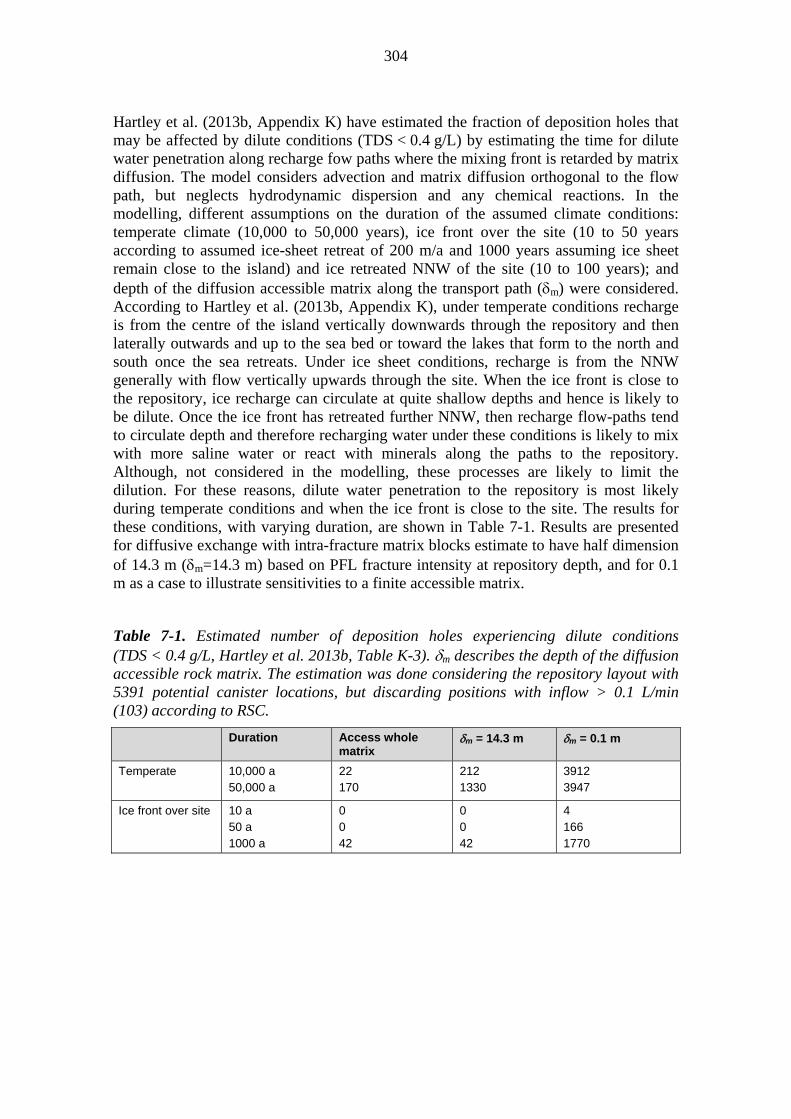
304
Hartley et al. (2013b, Appendix K) have estimated the fraction of deposition holes that may be affected by dilute conditions (TDS < 0.4 g/L) by estimating the time for dilute water penetration along recharge fow paths where the mixing front is retarded by matrix diffusion. The model considers advection and matrix diffusion orthogonal to the flow path, but neglects hydrodynamic dispersion and any chemical reactions. In the modelling, different assumptions on the duration of the assumed climate conditions: temperate climate (10,000 to 50,000 years), ice front over the site (10 to 50 years according to assumed ice-sheet retreat of 200 m/a and 1000 years assuming ice sheet remain close to the island) and ice retreated NNW of the site (10 to 100 years); and depth of the diffusion accessible matrix along the transport path (m) were considered. According to Hartley et al. (2013b, Appendix K), under temperate conditions recharge is from the centre of the island vertically downwards through the repository and then laterally outwards and up to the sea bed or toward the lakes that form to the north and south once the sea retreats. Under ice sheet conditions, recharge is from the NNW generally with flow vertically upwards through the site. When the ice front is close to the repository, ice recharge can circulate at quite shallow depths and hence is likely to be dilute. Once the ice front has retreated further NNW, then recharge flow-paths tend to circulate depth and therefore recharging water under these conditions is likely to mix with more saline water or react with minerals along the paths to the repository. Although, not considered in the modelling, these processes are likely to limit the dilution. For these reasons, dilute water penetration to the repository is most likely during temperate conditions and when the ice front is close to the site. The results for these conditions, with varying duration, are shown in Table 7-1. Results are presented for diffusive exchange with intra-fracture matrix blocks estimate to have half dimension of 14.3 m (m=14.3 m) based on PFL fracture intensity at repository depth, and for 0.1 m as a case to illustrate sensitivities to a finite accessible matrix.
Table 7-1. Estimated number of deposition holes experiencing dilute conditions (TDS < 0.4 g/L, Hartley et al. 2013b, Table K-3). m describes the depth of the diffusion accessible rock matrix. The estimation was done considering the repository layout with 5391 potential canister locations, but discarding positions with inflow > 0.1 L/min (103) according to RSC.
Duration Access whole matrix
m = 14.3 m m = 0.1 m
Temperate 10,000 a 50,000 a
22 170
212 1330
3912 3947
Ice front over site 10 a 50 a 1000 a
0 0 42
0 0 42
4 166 1770
305
Hartley et al. (2013b) also compare the results of the dilution along the 1D flow path with the regional scale 3D simulations and conclude that i) t salinity predicted by the solute transport along the 1D flow path is in general lower than the salinity obtained from the 3D simulations, ii) lateral mixing tends to retard the flushing by meteoric water relative to that predicted by considering advection and rock matrix diffusion along the flow paths and iii) as under temperate conditions there is time for significant diffusive exchange with the rock matrix, effectively an infinite matrix can be assumed, which is also supported by the simulations of palaeohydrogeology and the high surface area for diffusive exchange when also fractures with lower conductivity are taken into account (see Hartley et al. 2013a). Other values considered for m are 14.3 m, based on the approximate half spacing of hydraulically conductive fractures (PFL-fractures, i.e. fractures with measured conductivity with T>10-9 m2/s, Hartley et al. 2013a, Table 10-3) and 0.1 m corresponding to a sensitivity case with high advective flow and short time with the matrix.
Overall the results by Hartley et al. (2013b) suggest that few deposition holes are likely to experience dilute conditions (TDS < 0.4 g/l) during either the temperate or glacial conditions. For the temperate period, the number of deposition holes with dilute conditions is only 22 within 10,000 years and 170 within 50,000 years assuming that the entire matrix is accessible for the diffusion as considered to be the most realistic case based on the discussion above (see Table 7-1 and red line in Figure 7-8a). For the glacial case, assuming the depth of accessible rock matrix of 0.1 m, the number of deposition holes experiencing dilute conditions varies from few deposition holes to over thousand as the duration of the dilute conditions increases from 10 years to 1000 years (see Table 7-1, Figure 7-8b). Hartley et al. (2013b) also note that the RSC inflow criteria is effective in removing some of the locations with most potential for dilute conditions.
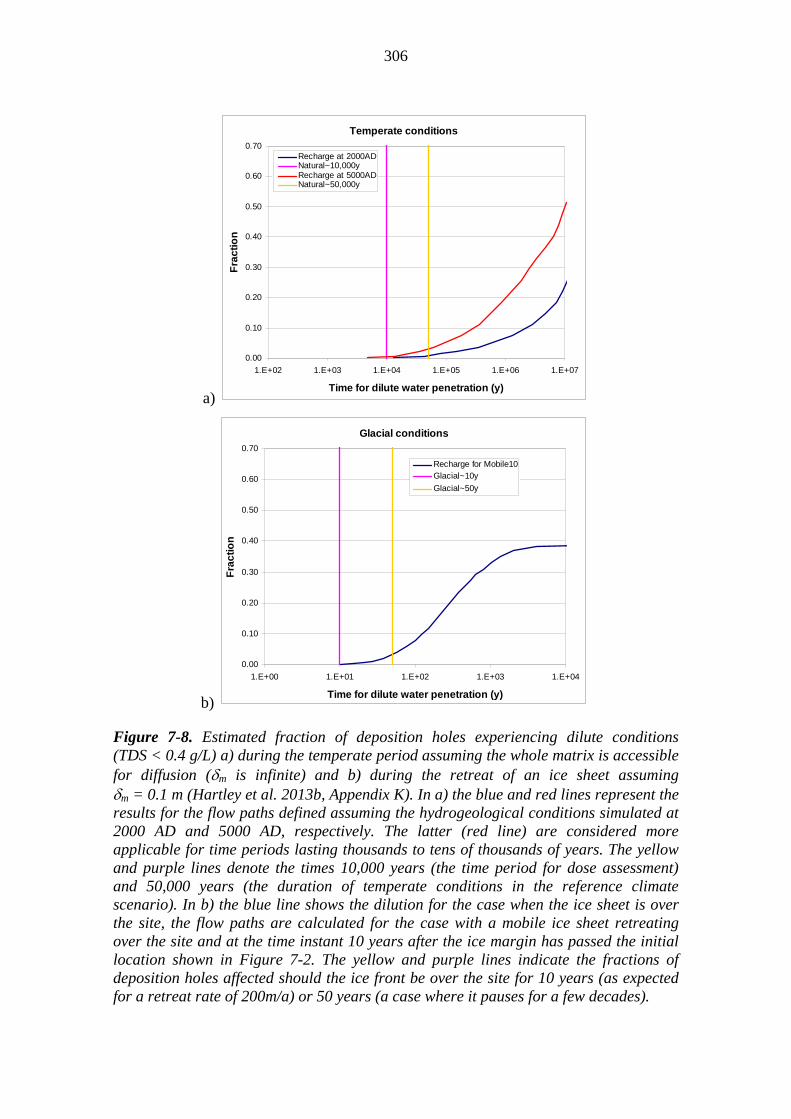
306
a)
b)
Figure 7-8. Estimated fraction of deposition holes experiencing dilute conditions (TDS < 0.4 g/L) a) during the temperate period assuming the whole matrix is accessible for diffusion (m is infinite) and b) during the retreat of an ice sheet assuming m = 0.1 m (Hartley et al. 2013b, Appendix K). In a) the blue and red lines represent the results for the flow paths defined assuming the hydrogeological conditions simulated at 2000 AD and 5000 AD, respectively. The latter (red line) are considered more applicable for time periods lasting thousands to tens of thousands of years. The yellow and purple lines denote the times 10,000 years (the time period for dose assessment) and 50,000 years (the duration of temperate conditions in the reference climate scenario). In b) the blue line shows the dilution for the case when the ice sheet is over the site, the flow paths are calculated for the case with a mobile ice sheet retreating over the site and at the time instant 10 years after the ice margin has passed the initial location shown in Figure 7-2. The yellow and purple lines indicate the fractions of deposition holes affected should the ice front be over the site for 10 years (as expected for a retreat rate of 200m/a) or 50 years (a case where it pauses for a few decades).
Temperate conditions
0.00
0.10
0.20
0.30
0.40
0.50
0.60
0.70
1.E+02 1.E+03 1.E+04 1.E+05 1.E+06 1.E+07
Time for dilute water penetration (y)
Fra
cti
on
Recharge at 2000ADNatural~10,000yRecharge at 5000ADNatural~50,000y
Glacial conditions
0.00
0.10
0.20
0.30
0.40
0.50
0.60
0.70
1.E+00 1.E+01 1.E+02 1.E+03 1.E+04
Time for dilute water penetration (y)
Fra
cti
on
Recharge for Mobile10Glacial~10y
Glacial~50y
307
Trinchero et al. (2013) assessed the groundwater evolution during ice-sheet retreat by means of reactive transport modelling. The transport paths in their analysis were based on the results by Löfman & Karvonen (2012) using model variant 2009SH, immobile ice sheet located over site at location 3 (see above). The particle tracks are calculated for the time of 100 years after the ice margin has stopped at a given location. The groundwater flow model by Löfman & Karvonen (2012) is of limited size and the analysis of the streamlines, upon which the reactive transport models are based, shows that the particle tracking results are affected by boundary effects. The modelling does not include the period of temperate climate from 10,000 AP until 50,000 AP, nor does it include permafrost periods. However, during a permafrost period, the flow rates are so low that no major changes in the groundwater composition are expected. However, geochemical processes are likely to modify the composition of the waters also during the permafrost period, these effects are thus not considered. For the simulations considering the ice-sheet retreat, the initial composition of the waters is those obtained by the temperate period simulations for 10,000 AP. The modelling has covered two cases of an immobile ice sheet (ice margin at the locations 2 and 3 in Figure 7-2).
Another uncertainty is associated with the definition of the initial state of the system (e.g. composition of the fracture and matrix porewater at the beginning of the melting period simulations), Hence, in an attempt to cope with the uncertainty in the initial composition of the fracture waters and pore waters and uncertainties in the interaction between these waters, Trinchero et al. (2013) considered two simulation cases; a single porosity model modelling mixing of the older water and new water and omitting the contribution of the matrix, and a dual porosity model accounting for the solute exchange with the matrix porewaters. While in the former simulation case the underlying assumption leads to a relatively fast arrival of glacial water at repository depth, in the latter the very slow velocity of the infiltration emphasises the buffering role of the rock matrix. Assuming low diffusion porosity in the groundwater flow model, or no matrix diffusion as in the single porosity model, leads to unrealistic dilution of the groundwaters (see e.g. Löfman et al. 2009). The model can be used to scope the effects of the increased flow and reduced matrix diffusion during the ice-sheet retreat.
The composition of the infiltrating glacial meltwater is according to glacial meltwater (Weichselian) in Pastina & Hellä (2010, Table 6-7) and it has a pH of 5.8. It is noted however, that glacial waters are equilibrated with calcite in the first cell of the model, i.e. near the ground surface. As a consequence, the pH of the glacial water rises up to pH 9. This value is in agreement with measurements of melting glacial water (Grimsel water, Pastina & Hellä 2010, Table 6-7).
As a result of omitting the interaction with the rock matrix, the results of the single porosity model showed that glacial water has an impact on the evolution of the groundwater composition at repository depth. More specifically, in some positions of the repository (1 % of the total number of potential deposition holes in the layout after 1000 years and 22 % after 2000 years of infiltration of dilute glacial melt water), salinity (TDS) is below 0.4 g/L and correspondingly the charge concentration of cations is less than 4 mM. On the other hand, the results of the dual porosity model show that there is only a slight change of the chloride concentration, salinity (TDS) and total charge concentration of the cations compared with the values at 10,000 AP. The general observation from the results is that in the simulations applying dual porosity, the

308
variability of the results is very limited and the temporal changes are smoothed, as expected, whereas in the simulations assuming single porosity, the variability is larger and some of the target properties are not fulfilled. This is directly related to the role of the diffusional mass exchange between the groundwater in fractures and in rock matrix, which buffers dilution caused by the infiltrating glacial melt water. For all the computed cases, the key geochemical properties (i.e. pH, Eh, Cl, TDS, sum of cations, and sulphur and iron species, see also next Sections) are within the limits established by the target properties.
Potential for dilute groundwater conditions
Dilution of saline waters at depth is possible by either direct intrusion of glacial meltwaters in connection with glaciation, by mixing of the saline waters with groundwaters containing a glacial component or with infiltrating meteoric waters during temperate climate. The ionic strength of the infiltrating dilute water will increase due to water-rock interactions and by mixing (Site Description, Chapter 7). Similar processes will affect the geochemical evolution in the future as in the past with the exception of the disturbance caused by the repository which will increase the groundwater flow during the excavation and operational period and thereby mixing of the different groundwater types. The disturbance will be limited after saturation of the buffer and backfill, which is expected to be completed within hundreds to a few thousands of years. This Section presents a summary of the modelling results above and discusses them in relation to the hydrogeochemical understanding of the site and presents conclusions concerning the potential for dilute groundwater conditions.
According to groundwater flow modelling results discussed above, based on the results of Löfman & Karvonen (2012) and Hartley et al. (2013b), the salinity evolution during the glacial cycle shows the following general features:
During the temperate period up to 50,000 years AP, the salinity down to and even below the repository level decreases; at repository depth on average from slightly over 10 g/L to around 5 g/L with a possibility that there are groundwaters with a low salinity below 0.4 g/L at repository depth for a limited time during the operational period and for a longer period after about ten thousand to a few tens of thousands of years after repository closure. The low salinities are related to highly conductive hydrogeological zones and fractures and during the operational period also to the proximity of open repository tunnels.
During the permafrost period, the salinity remains nearly constant, although both a slight increase and a decrease compared to the salinity levels at the end of the temperate period takes place depending on the modelling case (see above).
During the retreat of the ice sheet, the average salinity shows a slight increase of a few grams/litre in general, but depending on the location of the ice margin with respect to the repository, the duration of the ice margin at the site and the model variant, the maximum salinity tends to increase, whereas the minimum salinity tends to decrease, with the minimum salinities being in the order of 1 g/L (Löfman & Karvonen 2012 and Hartley et al. 2013b).

309
The modelling by Löfman & Karvonen (2012) considers, in addition to groundwater flow driven by head differences, density dependent flow and the mass transfer between the water-bearing fractures and porous matrix blocks by molecular diffusion. The modelling by Hartley et al. (2013b) takes into account advection and diffusion along the recharge path, which are defined by calculating steady state flow in the fracture network for density-driven flow at a fixed time point i.e. changes in the salinity field with time are not taken into account. In both models the infiltrating water has zero salinity and no reactions with the overburden or bedrock are taken into account. The groundwater flow models present the ongoing dilution due to the infiltration of meteoric water in accordance with the understanding of the hydrogeological evolution of the site. However, compared with current hydrogeochemical understanding based on observation at the site, the groundwater flow modelling results seem to overestimate dilution caused by the meteoric water and glacial melt water at deeper parts of the rock including repository depth. The reason for this is likely the simplified modelling assumptions discussed above. The results of the reactive transport modelling by Trinchero et al. (2013) indicate that the chemical reactions changing the composition of the infiltrating water and especially the interaction with the rock matrix can reduce the dilution significantly.
Based on the groundwater chemistry at the site, the impact of the glacial melt waters during the last glacial cycle seems to be limited to depths above 300 m (see Site Description, Chapter 7). If any deeper penetration of glacial melt water or dilute meteoric water has taken place during the Quaternary, it must have been of such short duration that no traces of it are observed. The observed variation in salinity at depths below 300 m is rather related to mixing processes occurring either naturally over a long time span or induced only recently by the site characterisation and construction activities. The groundwater is saline or brackish at depths below 300 m. The dilution of highly saline deep groundwater (brine) near 1000 m depth to brackish groundwater at the 300 m depth is related to an older event than glacial meltwater during the last glaciation and may for example be the sum of several events of fresh water infiltration, glacial meltwater as well as meteoric recharge during earlier Quaternary glacial cycles or even during the Neogene (see discussion in the Site Description, Chapter 7). Hydrogeological variations during former glacial periods have not been able to develop sufficiently high gradients to dilute the saline groundwater volume to fresh water.
The understanding of the dilute water circulation at the Olkiluoto site is based mainly on palaeohydrogeological evidence (Site Description, Section 7.3). Matrix pore waters evidently suggest long-term dilute water circulation in the deep fracture system (beneath 150 m depth), however, the stable isotope signature of the matrix pore waters indicates dilute groundwater from fundamentally warmer climate conditions than today or even during the Quaternary. It is also possible that the observed apparent disequilibrium in salinity between matrix and fracture groundwater at Olkiluoto results from the limited accessibility of anions to the volume of nanometre scale pore voids contrary to water molecules. The pore volume used in the calculation of the Cl-concentration in matrix pore waters is measured by the water-loss method. Observations and interpretations from matrix porosity, groundwaters in fractures and matrix pores, and modelling of diffusion indicated at least 105 to 106 years interaction between matrix and fracture waters in the deep bedrock below 300 m. Consequently, saline conditions in the fracture

310
system at a greater depth must have persisted for extremely long times. Dissolution of traces of calcite or pyrite crystals from fracture surfaces are observed only in the topmost part of the rock, at a depth of a few metres to about ten metres. This also suggests that dilute aggressive waters have not penetrated deep into the rock; otherwise, signs of dilute water influence would be visible even in a case of short-term infiltration. Moreover, whereas at present the groundwater composition in zones of high transmissivity differs from that in low transmissivity zones in the brackish layer, there is no salinity variation between fractures with different transmissivity deeper in the saline groundwater layer.
During glaciation, sub-glacial meltwater is produced mainly in warm-based regions below the ice sheet where there is no permafrost. The infiltration rate is heterogeneous due to the variability in the thickness and properties of the sediment layer at the ice sheet−bedrock interface and takes place mainly through fractures and deformation zones. During permafrost periods and at the times when the ice sheet is cold-based, infiltration is very limited or even inhibited and groundwater flow is, in general, significantly reduced because of the low hydraulic gradients and low hydraulic conductivities. Thus, hydrogeochemically unchanged glacial meltwater can intrude in the bedrock only in case of a warm-based ice sheet or during the retreat of an ice sheet. Near the ice margin, high hydraulic gradients are possible and meltwater from the ice sheet may penetrate the upper part of the host rock and possibly to repository depth through high flow rate channels, which are scarce at Olkiluoto and avoided by the repository layout. On the other hand, also upconing of deep saline water during ice sheet development and retreat is possible.
It is known that after the last glacial maximum, the Fennoscandian ice sheet stopped (for 1000 years at most) while retreating, at several locations, giving rise to the Salpausselkä ice-marginal formations. None of these stops was at the Olkiluoto site, but for groundwater modelling purposes it is assumed that the next ice sheet(s) stops on the top of the Olkiluoto Island for 1000 years and that permafrost does not occur during any of the three ice-sheet retreats. Taking into account that meltwater at the top of the margin of the ice sheet is generated only during the summer season, this gives an average of 250 years of infiltration per ice-sheet retreat, that is 750 years in total, but a rounded estimate of 1000 years is used in further modelling because of uncertainties in the duration of the ice margin at the site. Basal melt water generated at the base of the ice sheet could contribute all year round. However the amount and consequences of the water thus generated is insignificant when comparing to the surface water that, in summer, drains to the bottom of the ice sheet (e.g. Zwally et al. 2002).
As a conclusion, emphasising the hydrogeochemical understanding of the site and taking into account the pessimistic assumptions in the groundwater flow modelling results, it is expected that the salinity at the repository level will remain above a few grams per litre during the temperate period. The infiltrating meteoric water will undergo reactions with the overburden and bedrock as well as mix with groundwater with higher ionic strength (see e.g. discussion in Site Description, Ch. 7 concerning the past site evolution and observations during the ONKALO construction). Thus, according to the hydrogeochemical understanding of the site, dilute conditions are not likely to be reached during the temperate period.

311
However, as there are uncertainties related to the models and data used to describe the long-term evolution of the site and as groundwater flow modelling suggests that at least locally the salinities can be in the order of, or even below 0.4 g/L, indicating that the ionic strength of the water is so low that chemical erosion of the buffer is possible, the potential for the occurrence of dilute groundwaters is taken into account according to the assumptions presented in Table 7-2, the reference corresponding to the expected evolution according to the current site understanding and a variant defined as a sensitivity case. The same assumptions apply to the subsequent glacial cycles repeating after year 170,000 AP and each lasting for 120,000 years.
Table 7-2. Potential conditions when dilute water may be present at repository depth; duration of such time periods during the reference glacial cycle and estimated proportion of canisters experiencing dilute conditions. Dilute groundwater is groundwater with TDS < 0.4 g/L.
Potential conditions when dilute water may be present at repository depth
Duration of the dilute conditions during the reference glacial cycle
Estimated fraction of canisters experiencing dilute conditions
Ice-sheet retreat (reference)
1000 years During retreat of the ice sheets, three ice sheets during one glacial cycle, assuming that ice margin stops for 1000 years during retreat of each of the three ice sheets and assuming melt water penetration is possible only during summer i.e. an average of 250 years of infiltration per ice-sheet retreat, that is 750 years in total, but a rounded estimate of 1000 years is used because of uncertainties in the duration of the ice margin at the site.
18 % (24 % including EDZ) Based on the fraction at 250 a, i.e. the estimated duration of the dilute conditions during retreat of one ice sheet. See Fig. K-10 in Hartley et al. (2013b)
Ice-sheet retreat (variant)
3000 years During retreat of the ice sheets, three ice sheets during one glacial cycle, assuming that ice margin stops for 1000 years during retreat of each of the three ice sheets and assuming melt water penetration is possible all that time as basal melt water generated at the base of the ice sheet could contribute all year round.
33 % (40 % including EDZ) Based on the fraction at 1000 a, i.e. the estimated duration of the dilute conditions during retreat of one ice sheet. See Fig. K-10 in Hartley et al. (2013b)
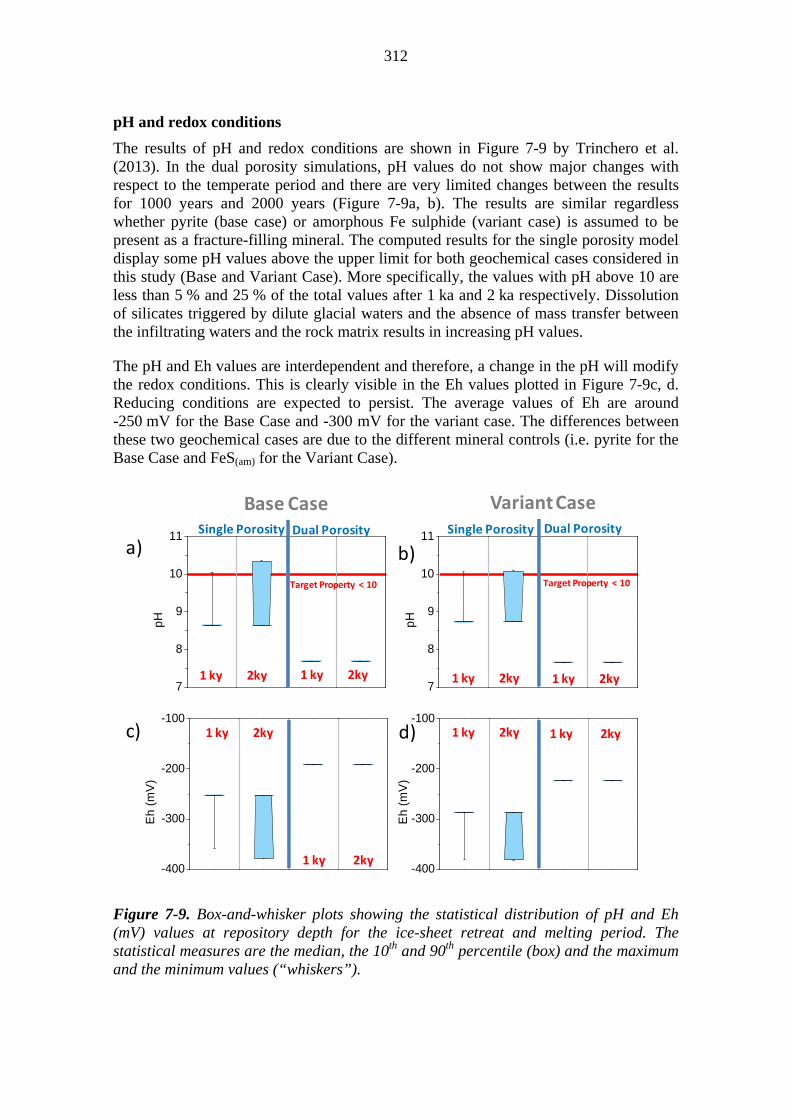
312
pH and redox conditions
The results of pH and redox conditions are shown in Figure 7-9 by Trinchero et al. (2013). In the dual porosity simulations, pH values do not show major changes with respect to the temperate period and there are very limited changes between the results for 1000 years and 2000 years (Figure 7-9a, b). The results are similar regardless whether pyrite (base case) or amorphous Fe sulphide (variant case) is assumed to be present as a fracture-filling mineral. The computed results for the single porosity model display some pH values above the upper limit for both geochemical cases considered in this study (Base and Variant Case). More specifically, the values with pH above 10 are less than 5 % and 25 % of the total values after 1 ka and 2 ka respectively. Dissolution of silicates triggered by dilute glacial waters and the absence of mass transfer between the infiltrating waters and the rock matrix results in increasing pH values.
The pH and Eh values are interdependent and therefore, a change in the pH will modify the redox conditions. This is clearly visible in the Eh values plotted in Figure 7-9c, d. Reducing conditions are expected to persist. The average values of Eh are around -250 mV for the Base Case and -300 mV for the variant case. The differences between these two geochemical cases are due to the different mineral controls (i.e. pyrite for the Base Case and FeS(am) for the Variant Case).
Figure 7-9. Box-and-whisker plots showing the statistical distribution of pH and Eh (mV) values at repository depth for the ice-sheet retreat and melting period. The statistical measures are the median, the 10th and 90th percentile (box) and the maximum and the minimum values (“whiskers”).
7
8
9
10
11
pH
-400
-300
-200
-100
Eh
(m
V)
7
8
9
10
11
pH
-400
-300
-200
-100
Eh
(m
V)
Base Case VariantCase
a) b)
c) d)
1 ky 2ky 1 ky 2ky 1 ky 2ky 1 ky 2ky
1 ky 2ky
1 ky 2ky
1 ky 2ky 1 ky 2ky
Single Porosity Dual Porosity Single Porosity Dual Porosity
Target Property < 10 Target Property < 10

313
As discussed in Chapter 3 and Section 5.1.3, there is strong evidence from the site that the glacial waters have circulated only in upper parts of the rock, down to approximately 300 m depth and that reducing conditions have prevailed for long times except for the topmost part of the rock.
Modelling of oxygen consumption, carried out by Trinchero et al. (2013) and described in Section 5.1, included also a case where the infiltrating groundwater had the composition of glacial melt water. The results were similar to the ones for the temperate period; oxygen will be consumed relatively rapidly and within a short distance of a few decimetres from the inlet of infiltrating water, by pyrite oxidation.
Dissolved iron and sulphide in the groundwater
The sulphide concentrations in steady state conditions are expected to be controlled by the more crystalline iron sulphide phases, such as pyrite.
In the hydrochemical evolution modelling, the chemical evolution of iron and sulphur species is postulated to be controlled by the same processes described for the temperate period. Assuming equilibrium conditions with pyrite or FeS(am), the concentrations of Fe2+ and HS- will be mutually dependent. Consequently, the solubility of these minerals controls the maximum concentration of these species in the groundwater. The modelling of the hydrochemical evolution for the glacial period has been carried out using both the single porosity and dual porosity models (Trinchero et al. 2013, see also Appendix D). Although unrealistic for the Olkiluoto conditions as matrix interaction is neglected, the results of the single porosity model have been applied to give bounds for the groundwater composition.
Compared to dual porosity simulation, there is a progressively larger signature of glacial water at repository depth in the single porosity simulations (see Figure 7-10). A considerable decrease in Fe2+ concentrations is also developed. Fe2+ concentrations are slightly higher if amorphous Fe sulphide is assumed in equilibrium with waters instead of pyrite. If pyrite is assumed to be the controlling sulphide mineral, the increase of pH will trigger an increase in the HS- concentration (Trinchero et al. 2013, Figure 6-6i, j, see also Figure 7-10 below). This increase takes place once the evolved glacial water reaches repository depth. Yet, the computed ranges of HS- concentration as a consequence of this process are very low (~3·10-11 to 4·10-10 M) and similar to those shown in Figure 6-13b. If FeS(am) is assumed under equilibrium conditions, HS- concentrations will be less than 3·10-7 M (Figure 7-10). Nevertheless, the single porosity model results show that high pH conditions will promote a decrease in the HS- concentrations (see Figure 6-14 in Section 6.1.3).
The computed results for the dual porosity models are very similar to those for the temperate period (cf. Section 6.1.3), with the only difference of being remarkably homogeneous. This homogeneity is the result of the mutual interplay of the buffering effect of the matrix which provides a fairly constant release of “old water” and thus buffers the changes triggered by the infiltration of glacial water and the very low groundwater flow velocities after the ice margin is no longer situated above the repository (Figure 7-2).

314
Figure 7-10. Box-and-whisker plots showing the statistical distribution of HS- and Fe2+ for the case assuming FeS(am) equilibrium during the ice-sheet retreat and melting phase, assuming that the ice front stops at the location of the repository for 1 ka or 2 ka. The statistical measures are the median, the 10th and 90th percentile (box) and the maximum and the minimum values (“whiskers”) (Trinchero et al. 2013, Figure 6-5 h and 6-6 j).
Microbial processes
The microbiological activity is expected to be low, the input of organic carbon with the recharging groundwater is expected to be low and the organic source for microbial activity will thus be low, because photosynthetic production of organic carbon will decrease. Measured values of DOC in several glacier ice samples show values ranging from 0.06 to 46.6 ppb (5·10–6 to 3.9·10–3 mM; Barker et al. 2006).
Colloid formation
During the ice-sheet retreat melting period, the generation of inorganic colloids is expected to be promoted by low ionic strengths and low concentrations of cations. The inflow of organic matter from the surface can be assumed negligible and the input of organic colloids (e.g. fulvic or humic acids) to the groundwaters should be lower than in the temperate period. There is a potential for higher inorganic colloid concentrations in groundwaters during this period, especially during periods with high groundwater velocities. If dual porosity models are assumed, the computed pH, salinity and cation concentrations will be very similar to those reported for the temperate period (see Section 6.1.3). In contrast, using a single porosity model diluted waters are predicted to infiltrate through the more conductive large fracture zones without any buffering effect of the matrix. In this case, high pH waters (around 9) in the fracture may trigger in-situ colloid generation.
Dilute groundwater, in association with the chemical erosion of the buffer and the formation of colloids is discussed in Section 7.6.
7.1.4 Summary, uncertainties and issues that need propagation
The long-term hydrogeological and hydrogeochemical evolution is affected by the future climate evolution. According to the climate evolution (Section 4.1), the temperate
10-7
10-6
10-5
HS
- (m
ol/L
)
1 ka 2 ka 1 ka 2 ka
Single Porosity Dual Porosity
10-8
10-7
10-6
10-5
Fe
2+ (
mol
/L)
1 ka 2 ka 1 ka 2 ka
Single Porosity Dual Porosity

315
period is estimated to last until 50,000 AP, followed by permafrost and ice sheet periods. Continuous time-dependent modelling of the groundwater flow and hydrogeochemical evolution for all periods is not computationally achievable, and thus modelling has been done for the time windows representing the temperate period (time period lasting until either 10,000 AP or 50,000 AP), permafrost, and ice-sheet retreat periods. During the permafrost period, the flow rates through the reference volume are reduced significantly to about one fifth of those during the temperate phase. On the other hand, during the retreat of the ice sheet, flow rates increase by a factor of 4 to 7compared with the corresponding flow rates at the end of the temperate period. For the sub-sequent analysis it has been conservatively selected to use ten times higher flows than during the temperate period are possible. There are no modelling studies considering specifically the ice-sheet growth phase.
Concerning groundwater flow, the target properties are expected to be fulfilled over the considered time window. The fraction of the canister positions intersected by a fracture with an initial flow rate above 1 L/(m·a) remains low (about 10 % of all the potential canister positions with no inflow criteria applied) during the temperate period. There is an increase of up to 20 % during an ice-sheet retreat, when the site is located close to the ice margin. During the permafrost period, the groundwater flow is reduced. During the high flow conditions related to the ice-sheet retreat, and when the repository is still under the ice sheet (mobile ice sheet 10 years), there is a significant increase in potential deposition hole locations having a transport resistance in the range of 3·104 to 106 a/m, but a transport resistance below 104 a/m remains exceptional. The duration of the high flow conditions are relatively short as the ice margin can be expected to pass the site relatively fast (200 m/year, Löfman & Karvonen 2012). These higher flow rates and lower transport resistances are considered in scenario analysis.
During the continued temperate period, the infiltration of meteoric water at a slow, nearly constant rate results in a decreasing trend in salinity. The modelling results show that, towards the end of this period, a few percent of the canister positions may experience dilute conditions. These results are obtained by groundwater flow modelling assuming that the infiltrating groundwater has zero salinity. Dilute conditions may also be experienced during ice-sheet retreat, but the estimate of the number of such positions is strongly dependent on the possible duration of the melt water intrusion and especially on the modelling concept of the interaction between the fracture water and rock matrix. On the other hand, no hydrogeochemical indicator (groundwater, pore water, fracture mineralogy) supports that dilute glacial meltwater has reached repository depth. Nonetheless the potential occurrence of dilute groundwater conditions as a consequence of relatively fast flow paths from the surface, carrying fresh water or melt water, should be taken into account. As concluded already in Section 6.1.3, developing an understanding of the interaction of the fracture water and matrix pore waters is important. Also, effects of the channelled flow on salinity evolution in local scale is an issue needing development, although first steps towards this direction are presented in Hartley et al. (2013c).
Similarly to the salinity results, also other key geochemical properties (i.e. pH, Eh, Cl, sulphur and iron species, sum of cations) are expected to stay within the limits established by the target properties during ice-sheet retreat and melting. However, the results are strongly dependent on the modelling assumption as to the interaction
316
between fracture water and the rock matrix. Oxygen is expected to be consumed within short distances along the flow path and thus not to reach the repository level. This is supported by the presence of pyrite in fractures fairly close to the surface even in fracture zones. The groundwater flow modelling based on the DFN approach and also the reactive transport modelling, which both study the flow paths, are affected by boundary effects related to the small size of the site-specific model. This will be taken into account in the next research period 2013−2018 (Posiva 2012b), where a larger-scale model to study groundwater flow during glaciations and hydrogeochemical reactive transport modelling for the prolonged temperate period from 10,000 years to 50,000 years to study the effects of e.g. the continued infiltration of meteoric water on the groundwater composition will be set up.
7.2 Rock mechanics
7.2.1 Overview and performance targets potentially affected
The rock mechanics processes expected to take place in the long term are stress redistribution and reactivation of fault zones and existing fractures. The processes are most pronounced in connection with glacial periods. Although Olkiluoto is located in a seismically stable environment, the risk of a large earthquake increases with time and specifically, increased seismic activity and faulting can be related to the end of glacial conditions. If glacially induced reactivation of the fault zones and fractures takes place, the hydraulic properties of the fractures may change. Thus, the target properties concerning the low likelihood of shear movements with potential to break the canister (L3-ROC-23) as well as the target properties concerning groundwater flow and transport properties (L3-ROC-19, L3-ROC-20) may be affected. If the target properties of the host rock are violated, the performance of the buffer and canister is also affected.
After 10,000 years the temperature in the near-field rock has reached ambient levels and also the effect of the crustal uplift on the stress state at repository depth decreases (e.g. Vuorela et al. 2009). As discussed in Features, Events and Processes (Section 8.2.5), rock creep will occur continuously at a slow rate, but its effects are considered to be insignificant for repository evolution compared to more rapid stress re-adjustment and reactivation or displacement of pre-existing faults.
7.2.2 Stresses during a glacial cycle
The onset of an ice sheet will affect the stresses in the underlying bedrock due to the weight of the ice load and flexural response of the Earth’s lithosphere. Below the ice sheet, the crust is depressed and the flexure will induce horizontal stresses of the same magnitude as the vertical stress due to the weight of the ice. On the other hand, in the areas outside the ice margin, a fore-bulge is developed and the horizontal stresses are reduced. After the relatively rapid retreat of the ice sheet, the lithosphere will experience isostatic rebound which is a slow process. During a few thousands of years after ice-sheet retreat, isostatic rebound takes place at a higher rate, but continues at a slower rate for a few tens of thousands of years (see e.g. Eronen et al. 1995, Påsse 1996 and Vuorela et al. 2009). The horizontal stresses reduce slowly along with the isostatic rebound, but the vertical stresses reduce directly as response to the ice-sheet retreat. Consequently, increased stress anisotropy develops especially at shallow depths.

317
In addition to the glacially induced stress redistribution, pore pressure is increased below an ice sheet. The increased pore pressure, in combination with the increased stresses, may cause rock to fail by the end of glacial conditions, thereby causing disturbances ranging from increased permeability to large earthquakes, such as those associated with the end-glacial faults in northern Fennoscandia (e.g. Kuivamäki et al. 1998, Hutri et al. 2007, Lagerbäck 1979).
Stress distribution at Olkiluoto during glaciation has been modelled by Valli et al. (2011). The modelling study focused on interaction of the in situ stress state and the fault zones, i.e. how the fault zones affect the stress magnitudes and orientations. The modelling cases included also a simulation of a simplified glacial cycle, where a glacial load was represented by adding +30 MPa to each stress component and realised by compressing the model from all sides except the bottom. A stress increase of 30 MPa is in accordance with the results by Lund & Schmidt (2011, Figures 29 and 39; see also Figure 7-11 below) assuming a 3 km thick ice sheet at the site. Retreat of the ice sheet was simulated by removing the vertical load in the same amount of time as it was applied, whilst horizontal loading was removed in twice that time corresponding to a +15 MPa increase in the horizontal stress at the time when the vertical load is completely removed. According to Valli et al. (2011), at the time when the ice load is removed, the stress orientations at shallow depths down to about 300 m depth are scattered and magnitudes of the stress components (H, h and v) are nearly equal. On the other hand, deeper in the rock, below 300 m depth, the stress magnitudes and orientations at the time of ice load removal were similar to the situation before loading and followed the regional trend, H being about 10 MPa higher than the other components. The modelling result indicates that the ice load affects the local stress field only at shallow depths. The result, however, is dependent on the duration of the ice loading (Valli et al. 2011).
Lund & Schmidt (2011) present a thorough discussion and modelling of stress evolution and fault stability at Olkiluoto during the Weichselian glaciation. They applied three dimensional ice and earth models to calculate the glacial isostatic adjustment (GIA), i.e. the response of the earth to an ice load, examining both stresses and displacements. Lund & Schmidt (2011) applied the Fennoscandian ice sheet model by Näslund (2006). Several different earth models, including both horizontally stratified models and models with laterally varying lithosphere thickness, were applied (for details, see Lund & Schmidt 2011, Chapter 4). The resulting rebound velocities and displacements were compared with GPS observations, tide-gauge observations and relative sea level data. It was found that there is a reasonable fit between the modelling results and the data.
The modelling results by Lund & Schmidt (2011) show that the temporal stress evolution at 500 m depth at Olkiluoto is determined by the ice-sheet evolution whereas the magnitude of the induced stresses depends on the earth model. Further, the induced horizontal stresses at Olkiluoto have a magnitude similar to the vertical stress from the ice load, or smaller. The glacially induced stresses resulting from a selected set of earth models applied by Lund & Schmidt (2011) are shown in Figure 7-11. According to Figure 7-11, the stress field is normal (v (SV in Figure) is the highest stress component) during the build of the glaciation, a strike-slip stress state (H > v > h) is present for short time periods at the peak of the glaciation or shortly thereafter, whereas a reverse

318
stress field (v is the lowest stress component) is present at the end of glaciation and for a considerable time after glaciation. The current stress field at Olkiluoto is thrust faulting (H > h > v, Site Description, Chapter 5).
In the fault stability analyses, Lund & Schmidt (2011, Chapter 8) used three different synthetic background stress fields: a reverse, a strike-slip and a stress field constructed from the local stress measurements at Olkiluoto. The results of the fault stability analysis (see Lund & Schmidt 2011, Table 6) show that assuming a strike-slip background stress field there are stable fault conditions at 9.5 km depth unless there is high induced pore pressure. At 500 m depth, a number of sub-vertical faults striking NW-SE have reduced stability. Assuming a reverse state of stress, at the 9.5 km depth, Olkiluoto would experience reduced fault stability at the end of glaciation. At 500 m depth, a larger number of sub-horizontal faults striking NE-SW have reduced stability.
Figure 7-11. Temporal evolution of the glacially induced stress field at 500 m depth at Olkiluoto during glaciation. Maximum horizontal (SH in red), minimum horizontal (Sh in green) and vertical (Sv in blue) stress (based on Lund & Schmidt 2011, Figures 29 and 30). Results of the following earth models are shown: homogeneous viscosity structure (P24), two viscosity layers with different characteristics (M14, M118) and laterally varying lithosphere thickness (L11).

319
Assuming a stress field based on the local stress field, the result for the 9.5 km depth are similar to assuming a strike-slip stress field and at 500 m similar to the reverse background stress field.
The main factors influencing the modelling results by Lund & Schmidt (2011) are the viscosity of the mantle affecting the rebound velocities and predicted displacements, the assumed background stress field and glacially induced excess pore pressure significantly affecting fault stability and the ice model affecting the induced stresses, stress magnitudes and their duration. Accumulation of strain during glaciation is not considered in the model. However, as Olkiluoto was located within the ice sheet margin, stress magnitudes were mostly determined by the thickness and duration of the ice sheet. It is noted that the ice-sheet thickness in the model by Näslund (2006) applied by Lund & Schmidt (2011) is thicker and has a shorter duration compared with e.g. Lambeck et al. (1998) and Pimenoff et al. (2011), the latter of which is used as a basis for the reference climate evolution description. Thus, the maximum stress magnitudes will not be underestimated using the Näslund (2006) model results compared with the results of other models mentioned.
7.2.3 Reactivation of fractures and effects on fracture transmissivity
The substantial changes in the stress field due to glaciation may cause reactivation of pre-existing fractures and fault zones. Fracture reactivation may change the hydraulic properties of the fractures. A considerable increase in fracture transmissivity has been observed in laboratory-scale experiments after shear displacements of more than a couple of millimetres, although this increase is very sensitive to normal load variations (Hökmark et al. 2010, Section 3.5.2). However, based on the assessment by Hökmark et al. (2010) of the effect of different stress states and pore pressures on fracture transmissivity, the potential transmissivity increase is very moderate especially in relation to the uncertainties in the hydraulic properties and flow modelling.
The modelling by Hökmark et al. (2010) is based on the assumed glacial cycle and rock properties defined for the Forsmark site. However, the conclusion from their study is applicable also to Olkiluoto, as the glacially induced stress and assumed porewater pressures are of similar magnitude (maximum glacially induced pore pressure was slightly over 25 MPa (Hökmark et al. 2010); residual pore water pressure at repository depth at Olkiluoto is estimated to be less than 20 MPa, see Figure 5-18 in Pastina & Hellä 2006). Also, the properties of the fractures and faults are relatively similar at both sites.
7.2.4 Faulting and rock shear
Shear displacements in fractures intersecting a deposition hole and a canister is considered to be one of the canister failure modes. The behaviour of the canister-buffer system in the case of shear load has been studied by Raiko et al. (2010, see also Section 7.8.4). The results of this analysis show that, the canister-buffer system, designed according to the current reference design is able to withstand a shear displacement up to 5 cm. Shear velocities over 1 m/s have not been considered in the simulations.
Shear displacements large enough to damage the canister are possible only in large fractures and in fault zones, and such displacements can occur only in connection with

320
large earthquakes. Olkiluoto is located in the Fennoscandian Shield away from active plate margins and is currently seismically quiet. The lack of observations of large post-glacial faults in the Olkiluoto area and in southern Finland in general (Paulamäki & Kuivamäki 2006, Ojala et al. 2004, Hutri et al. 2007) as well as the results by Lund & Schmidt (2011) all indicate that end-glacial faulting at Olkiluoto seems unlikely. However, according to the references listed above, the possibility of large earthquakes especially at the time of ice-sheet retreat cannot totally be excluded. Post-glacial faults have been observed in intra-plate areas, e.g. northern Fennoscandia, and for example Hutri (2007) reports indications of displacements of glaciotectonic origin in the Baltic Sea areas based on observations in the acoustic-seismic profiles in the sea areas close to Olkiluoto.
Deposition holes will not be positioned in the fault zones or their influence zones, and large fractures are allowed to intersect only the top part of the deposition hole so that the large fracture does not intersect the canister. Large fractures in this context mean fractures that are large enough to be capable of undergoing shear movements over 5 cm. The risk for canister failure due to rock shear can thus be further reduced. For this purpose, specific Rock Suitability Classification (RSC, McEwen et al. 2013) criteria to be applied in accepting deposition holes have been developed. However, as the fracture extent is in practice very difficult to determine, there remains a possibility that some deposition holes will be intersected by fractures on which damaging shear movements may take place, despite applying the RSC criteria.
This section discusses future seismicity and potential for large earthquakes at the Olkiluoto site; modelling results giving estimates of the induced shear displacement in fractures caused by (post-glacial) seismic events in the nearby fault zones, and the remaining potential for canister failures after applying the RSC criteria.
Future seismicity in the Olkiluoto area
The magnitude-frequency distribution of future earthquakes is predicted based on historical data of earthquakes in Finland (see Chapter 3). Saari (2012, Section 2.2) uses the Gutenberg-Richter (1944) equation to estimate the number of earthquakes (N) with magnitude >M:
LogN = a – b · M
The parameters a and b are defined on the basis of available data for each of the distinct seismic areas (see Figure 3-3). The Earthquake frequency for Olkiluoto is scaled from the results for the Å-P-P zone and the SFQZ zone by assuming that 1/3 of the seismicity is related to the former and 2/3 to the latter zone. The resulting earthquake frequency for the Olkiluoto area is shown in Figure 7-12. According to the results, the number of earthquakes with a magnitude M > 5 per square km per year (N) is 1.2·10-8, thus the expected number of earthquakes per square kilometre is 1.2·10-4 within 10,000 years, 6.0·10-4 within 50,000 years and 1.2·10-3 within 100,000 years (Saari 2012, Tables 2-2 and 2-4). The estimated frequency is well in line with previous studies (Bödvarsson et al. 2006, La Pointe et al. 1999, Hora & Jensen 2005, Fenton et al. 2006, Saari 2000).
Saari (2000, p. 38) conclude with reference to fault plane solutions (Slunga 1991, Saari & Slunga 1996, Uski et al. 2003, 2006), that the Fennoscandian earthquakes relate to
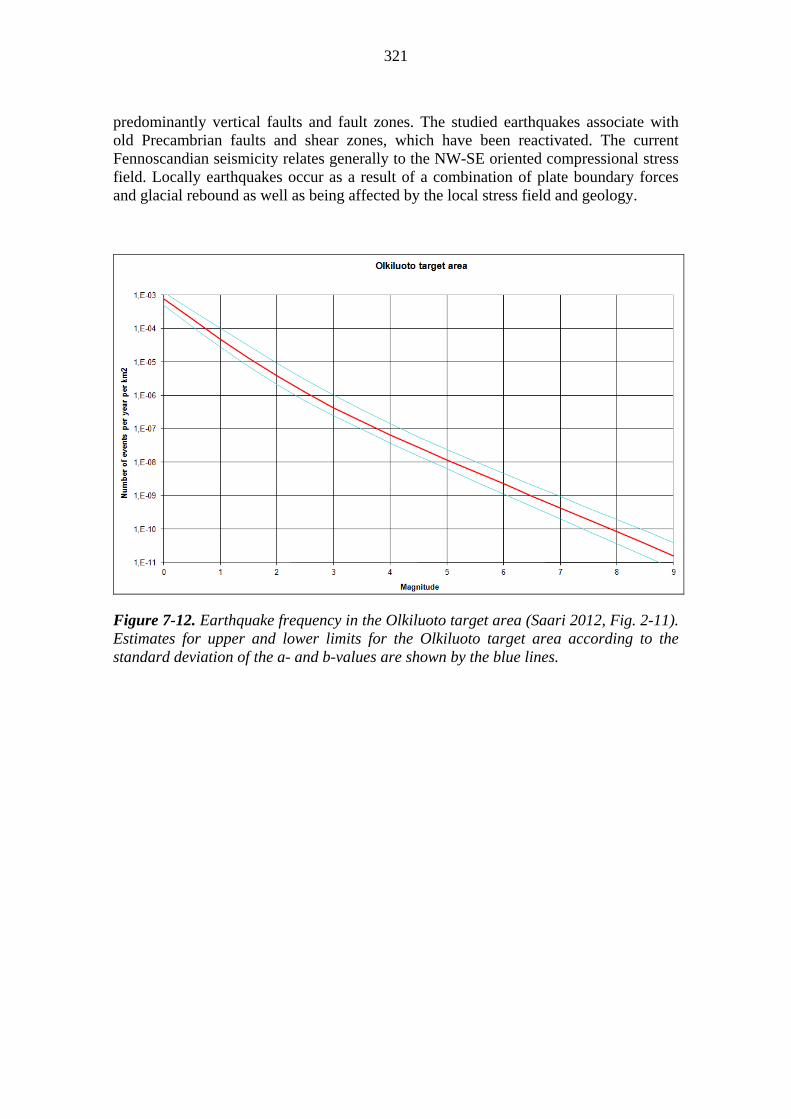
321
predominantly vertical faults and fault zones. The studied earthquakes associate with old Precambrian faults and shear zones, which have been reactivated. The current Fennoscandian seismicity relates generally to the NW-SE oriented compressional stress field. Locally earthquakes occur as a result of a combination of plate boundary forces and glacial rebound as well as being affected by the local stress field and geology.
Figure 7-12. Earthquake frequency in the Olkiluoto target area (Saari 2012, Fig. 2-11). Estimates for upper and lower limits for the Olkiluoto target area according to the standard deviation of the a- and b-values are shown by the blue lines.

322
The historical data used to determine the earthquake frequency–magnitude relations do not contain any observations related to events at the time or relatively soon after deglaciation. However, based on the existing postglacial faults mainly in northern Fennoscandia, the following observations can be made: the postglacial faults are reverse faults requiring a compressional tectonic environment for activation, they are located in old reactivated fracture zones, and the maximum magnitudes have been estimated to be from 5.3 to 7.5 (Kuivamäki et al. 1998). The faults, mainly oriented NNE-SSW, were generated in an environment of a rather uniform NW-SE oriented compressional stress field, which indicates that the seismicity at that time, as also at present, relates strongly to the North Atlantic ridge push and that the impact of post-glacial rebound has had less impact than the plate tectonics. After the Weichselian ice-sheet retreated, the period with increased seismic activity occurred immediately after deglaciation 10,000–8000 BP (see e.g. Hutri 2007), after which seismic activity decreased close to the current level (Saari 2012, p. 25).
Saari (2000, Section 3.3) discusses also the maximum magnitude of the expected earthquakes based on the cumulative strain release curve (Ahjos et al. 1984). The Finnish bedrock seems to be able to release strain with earthquakes less than M = 5. However, because the period of recorded seismicity is much shorter than the forecasting period up to 100,000 years, the possibility of larger earthquakes cannot be definitely excluded. According to Fenton et al. (2006), the upper bound magnitude in stable continental regions could be M = 7 ± 0.2. The accumulated unreleased strains in the target area result in an estimate of maximum magnitude: ML = 7.9 (100,000 years), ML = 7.5 (50,000 years) and ML = 7.1 (10,000 years). In practice, a single earthquake does not release all the strains accumulated inside the target area. The assumption that 80 % of accumulated strain is released in one earthquake would yield about 0.1–0.2 magnitude unit smaller estimates.
Saari (2012, Section 4.1) discusses the relationship between the magnitude and fault size based on the work by Wells & Coppersmith (1994) and Leonard (2010). In stable continental regions, rupture lengths of earthquakes of magnitude M > 5.0 and M > 7.0 are longer than 2.5–3.0 km and 40 km, respectively. It is reasonable to assume that the area where the released strain is accumulated is comparable to the fault length. The brittle deformation zone model for the Olkiluoto site (Site Description) is suitable to assess the fault zones that can host events with magnitudes M > 5, but not events with magnitudes M > 6 (fault length > 10 km). The number of faults with potential to host magnitude M > 7 earthquakes is estimated to be 15 %−60 % of the lineaments found in the lineament interpretations by Kuivamäki (2000) and Paananen & Kuivamäki (2007). The closest of those lineaments are NW-SE oriented lineaments 15 km NE and 20 km SW from Olkiluoto. The latter lineament can be associated with the 1926 earthquake (M = 3.1) in Uusikaupunki. Otherwise, seismicity can be associated with some over 40 km long lineaments. It is likely that future seismicity would also be related to those faults. The resulting estimates of the number of earthquakes with magnitudes above ML > 5 and ML > 7 within a 5 km radius of Olkiluoto as well as the probability for a single fault zone to host an earthquake above the given magnitude are shown in Table 7-3 (Saari 2012, Table 4-7).
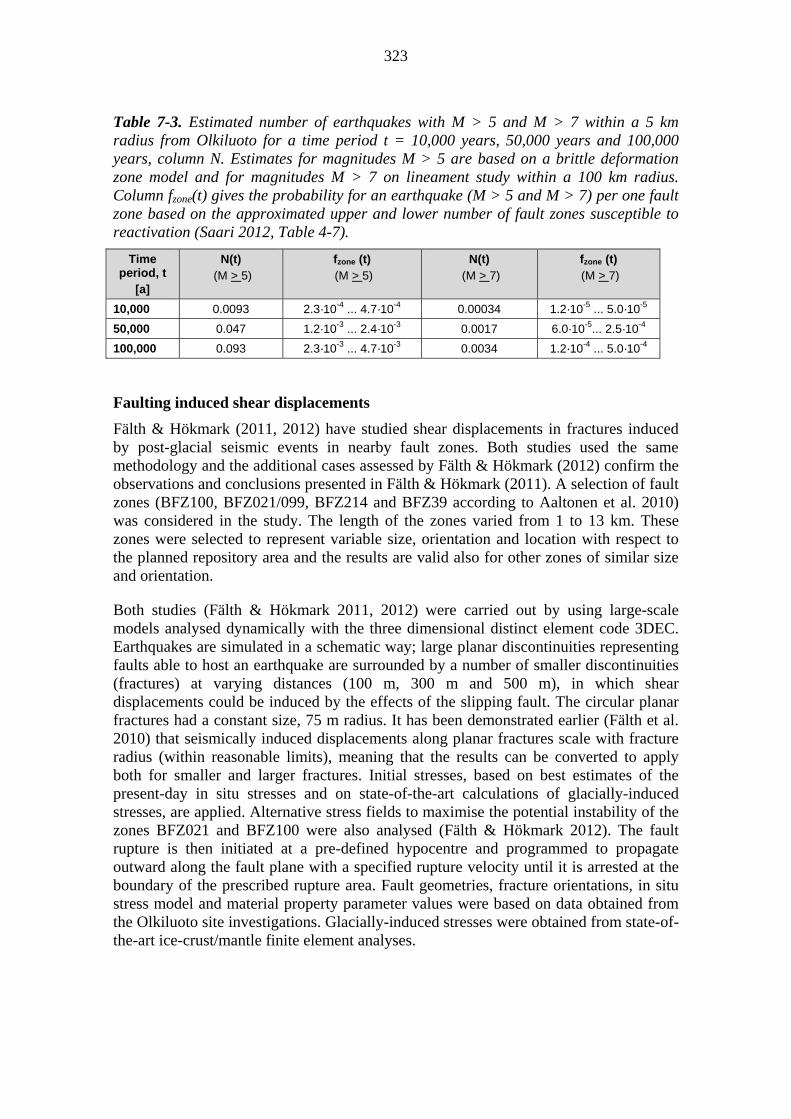
323
Table 7-3. Estimated number of earthquakes with M > 5 and M > 7 within a 5 km radius from Olkiluoto for a time period t = 10,000 years, 50,000 years and 100,000 years, column N. Estimates for magnitudes M > 5 are based on a brittle deformation zone model and for magnitudes M > 7 on lineament study within a 100 km radius. Column fzone(t) gives the probability for an earthquake (M > 5 and M > 7) per one fault zone based on the approximated upper and lower number of fault zones susceptible to reactivation (Saari 2012, Table 4-7).
Time period, t
[a]
N(t) (M > 5)
fzone (t) (M > 5)
N(t) (M > 7)
fzone (t) (M > 7)
10,000 0.0093 2.3·10-4 ... 4.7·10-4 0.00034 1.2·10-5 ... 5.0·10-5
50,000 0.047 1.2·10-3 ... 2.4·10-3 0.0017 6.0·10-5... 2.5·10-4
100,000 0.093 2.3·10-3 ... 4.7·10-3 0.0034 1.2·10-4 ... 5.0·10-4
Faulting induced shear displacements
Fälth & Hökmark (2011, 2012) have studied shear displacements in fractures induced by post-glacial seismic events in nearby fault zones. Both studies used the same methodology and the additional cases assessed by Fälth & Hökmark (2012) confirm the observations and conclusions presented in Fälth & Hökmark (2011). A selection of fault zones (BFZ100, BFZ021/099, BFZ214 and BFZ39 according to Aaltonen et al. 2010) was considered in the study. The length of the zones varied from 1 to 13 km. These zones were selected to represent variable size, orientation and location with respect to the planned repository area and the results are valid also for other zones of similar size and orientation.
Both studies (Fälth & Hökmark 2011, 2012) were carried out by using large-scale models analysed dynamically with the three dimensional distinct element code 3DEC. Earthquakes are simulated in a schematic way; large planar discontinuities representing faults able to host an earthquake are surrounded by a number of smaller discontinuities (fractures) at varying distances (100 m, 300 m and 500 m), in which shear displacements could be induced by the effects of the slipping fault. The circular planar fractures had a constant size, 75 m radius. It has been demonstrated earlier (Fälth et al. 2010) that seismically induced displacements along planar fractures scale with fracture radius (within reasonable limits), meaning that the results can be converted to apply both for smaller and larger fractures. Initial stresses, based on best estimates of the present-day in situ stresses and on state-of-the-art calculations of glacially-induced stresses, are applied. Alternative stress fields to maximise the potential instability of the zones BFZ021 and BFZ100 were also analysed (Fälth & Hökmark 2012). The fault rupture is then initiated at a pre-defined hypocentre and programmed to propagate outward along the fault plane with a specified rupture velocity until it is arrested at the boundary of the prescribed rupture area. Fault geometries, fracture orientations, in situ stress model and material property parameter values were based on data obtained from the Olkiluoto site investigations. Glacially-induced stresses were obtained from state-of-the-art ice-crust/mantle finite element analyses.
324
The synthetic 3DEC earthquakes have relatively small rupture areas compared to real crustal earthquakes with corresponding moment magnitudes, which means that, given their moment magnitudes, their average fault displacements are relatively large. Their moment magnitudes are in the range Mw 3.9–5.9 and their peak fault slip velocities range approximately between 0.3 m/s and 3.5 m/s. The highest of these slip velocities can be regarded relatively high compared to velocities found in real seismic events. Considering that the fault slip velocity has been shown to be correlated with the induced fracture shear displacements, this suggests that the simulated stress impact on the target fractures is realistic-conservative.
Two values of the fracture shear stiffness were tested (the lower denoted “Posiva 1” and the higher “Posiva 2”). The values differ by one order of magnitude and correspond to the lower and upper bounds in the shear stiffness range given in Site Description (Chapter 5). The results suggest that the Posiva 1 value gives exaggerated, mainly elastic, fracture shear displacements, and the results of the Posiva 2 models are judged to be more relevant.
Given the assumptions of planar fracture geometry, fracture properties being uniform over the entire fracture area, and assuming fracture shear stiffness equal to the estimated upper bound of the site data (Posiva 2009b), the following observations were made:
The fracture displacements depend on the fault-fracture distance. However, the majority of the fractures move too little for it to be meaningful to attempt to establish regular distance-displacement relations.
Gently-dipping fractures tend to displace more than steeply-dipping ones. This is caused by higher shear loads with corresponding lower stability in gently-dipping fractures.
No fractures located at least 100 m from the primary fault move more than 30 mm, even with the pessimistic assumptions on the fracture shear stiffness. Typically the displacements are less than 5 mm.
A number of fractures move in normal and strike-slip modes rather than reverse mode, which would be expected from the prevailing stress field at repository depth. Normal-type fracture shear displacements indicate displacements that are mainly elastic and that take place in response to the stress relaxation caused by the fault slip.
The highest shear velocity is about 130 mm/s and does not exceed 260 mm/s even in cases assuming a low friction angle.
The overall conclusion of the studies by Fälth & Hökmark (2011, 2012) is that seismically induced fracture shear displacements would be very modest at the Olkiluoto site and, for 75 m radius fractures that do not intersect the potential fault, exceed about 5 mm only by way of exception even at fault distances as small as 100 m. Both the fault slips and shear displacement in fractures for Olkiluoto are less than the ones obtained in a similar study by Fälth et al. (2010) for Forsmark. The reason for the difference is the use of site-specific data in the Olkiluoto study whereas the Forsmark study applied a more general and conservative worst case approach. Fälth & Hökmark (2011) conclude that using site-specific data gives more realistic upper bound estimates of the potential seismic effects.

325
Potential for the canister failures by shear load
The potential of the canister failure by shear displacement depends on the likelihood of the damaging earthquakes and on whether the fractures intersecting the deposition holes can undergo shear movements that could break the canister. Based on the discussion above, the probability for the large earthquakes in the Olkiluoto area has been shown to be limited. The potential for canister failure can be further limited by accepting only such deposition holes that meet the specific Rock Suitability Criteria (RSC, McEwen et al. 2013).
According to the RSC, the canisters will be placed away from the fault zones where larger shear movements in the order of a metre may take place (see e.g. Fälth & Hökmark 2011, Table 3-1). The fault zones which according to current understanding are defined as layout determining features (LDFs) due to their potential to host damaging earthquakes have been defined by Pere et al. (2013) and they are shown in Figure 7-13. Also the influence zones of the fault zones are avoided. The influence zone of a fault zone is the volume around a fault zone which is affected by the existence of the fault and is therefore considered as a mechanically weak and/or transmissive part of the host rock (see Pere et al. 2013). Specifically, the influence zone includes the damage zone, which encompasses the volume of rock containing all fault-associated deformation structures. Further, intersection of extensive fractures with deposition holes, where they would also intersect the canisters, is avoided. To ensure this, the deposition holes need to meet the following criteria (McEwen et al. 2013, Section 5.2.3):
(1) Fractures with extent larger than the limiting extent shall not intersect the canister.
(2) If the fracture extent is unknown, the Full Perimeter Intersection (FPI) criterion shall be applied: a fracture traceable over a full deposition tunnel perimeter shall not intersect the canister.
(3) If a fracture intersects the entire deposition hole at the potential location of the canister in it and has such an orientation that it is not possible to observe its continuation in a tunnel or other deposition holes, the deposition hole shall be discarded.
The extent of a fracture is defined as the diameter of a circular fracture that has the same area as the fracture in question. The limiting extent is set equal to 150 m.

326
Figure 7-13. Fault zones and bounding lineaments defined as layout determining features, i.e. fault zones with a length > 3 km and a potential to host an earthquake with M > 5, in Olkiluoto island (z = 420 m) (modified from Pere et al. 2013, Figure 5-1).
However, even if these avoidance criteria are applied, there still remains a possibility that some of the large fractures may not have been detected. The number of such deposition holes is discussed below based on the DFN-modelling by Hartley et al. (2013b, c). In the following analysis, the limiting dimension of 75 m fracture radius was assumed based on the analysis by Fälth & Hökmark (2011, 2012) discussed above. It is noted that fracture growth is possible in repeated seismic events, but is not taken into account and following the assumption of no fracture propagation, the displacement in fractures is assumed to be more prominent in central parts of the fractures and zero at the tip area (e.g. Muraoka & Kamata 1983, Walsh & Watterson 1989, Kim & Sandersson 2005, Barnett et al. 1987, Marrett & Allmendinger 1990, Dawers et al. 1993). Fracture growth by repeated reactivation has been shown to be limited by Cowie & Scholz (1992). They propose that a fracture may, for each seismic event, grow in the range of 0.2–2.5 percent of its size as an upper estimate, pessimistically assuming that the entire fracture surface also constitutes the faulting surface.
In the DFN models (Hartley et al. 2013b, c) a deposition hole is identified as intersected by an FPI fracture, if the fracture intersects the tunnel (the four planes representing the tunnel wall) and the deposition hole (at least one of the four pillars representing the deposition hole wall). The total number of potential deposition hole locations in the layout was 5391. Hartley et al. (2013b) considered both cases where the deposition holes have fixed locations, i.e. no optimisation with respect to intersection with an FPI fracture is made and cases where the deposition hole locations are adjusted based on the FPI intersections. These two assumptions lead to different degree of utilisation, which is determined by the number of suitable deposition holes with respect to the theoretical maximum number in the layout (5391 in this case). Adjustment of the deposition hole locations increases the degree of utilisation from about 53% to about 61% compared with the case assuming fixed deposition hole locations and considering all FPI fractures;

327
considering only FPI-fractures with fracture radius > 75 m, there is only marginal difference in the degree of utilisation of these two cases, the degree of utilisation being about 83% (Hartley et al. 2013c, Table 5-8). Hartley et al. (201b, c) analysed the properties of the fractures intersecting the deposition holes including fracture size. In the analysis, the location of the deposition holes was fixed and not adjusted according to the fractures. According to the results, about 20 % of the potential deposition holes are intersected by a fracture with a radius > 75 m (Hartley et al. 2013c, Table 5-8). Using the FPI criterion, a majority of these positions can be detected, however some large fractures intersecting deposition holes may not be detected by the FPI criterion e.g. because they are sub-horizontal and therefore do not intersect the deposition tunnel and thus pose a risk for the canister integrity in case of a large earthquake. On the other hand, the results show also that a significant part of the FPI-fractures actually have relatively limited size (about 40 % have radius less than 25 m and only about 15 % have radius higher than 75 m, Hartley et al. 2013c, Figure 5-1). Thus applying other constraints on the fracture size in addition to the FPI-criterion, such as continuity of the fracture to the nearby deposition holes or tunnels or geophysical data, which are considered in part 1 of the criterion, is essential for the efficient use of the large fracture criterion.
It is, however, not likely that all the large fractures that intersect a deposition hole and remain undetected, will undergo shear movements above the threshold value, e.g. due to the distance to the primary earthquake hosting fault or the orientation of the fracture with respect to the fault (see Fälth et al. 2010, Fälth & Hökmark 2011, 2012).
Even if shear occurs in a fracture, the shear along the fracture surface varies and specifically shear displacement at the fracture tip area is zero (see discussion above). Fälth et al. (2010, Section 7.2) propose a way to estimate the percentage of fractures with radius r that slip more than the threshold. Munier (2010, Section 6.3, see also Eshelby 1957) presents formulas that can be used to estimate the part of the fracture area where shear movements of critical size may take place. Two cases are proposed, either assuming deterministically (Munier 2010, Eq. 28) or probabilistically varying slip along a fracture (Munier 2010, Eq. 30). These two cases are illustrated in Figure 7-14. These formulas are based on the assumption of a linearly elastic medium and infinitely thin, circular, planar disks representing fractures.
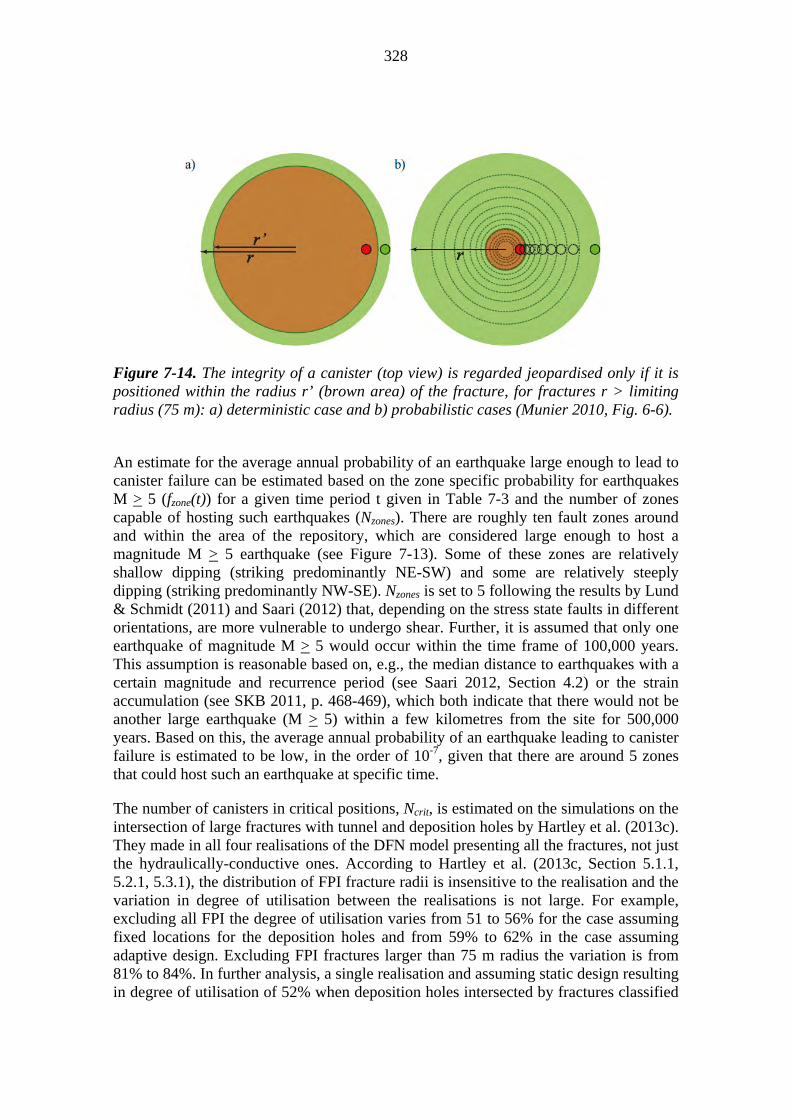
328
Figure 7-14. The integrity of a canister (top view) is regarded jeopardised only if it is positioned within the radius r’ (brown area) of the fracture, for fractures r > limiting radius (75 m): a) deterministic case and b) probabilistic cases (Munier 2010, Fig. 6-6).
An estimate for the average annual probability of an earthquake large enough to lead to canister failure can be estimated based on the zone specific probability for earthquakes M > 5 (fzone(t)) for a given time period t given in Table 7-3 and the number of zones capable of hosting such earthquakes (Nzones). There are roughly ten fault zones around and within the area of the repository, which are considered large enough to host a magnitude M > 5 earthquake (see Figure 7-13). Some of these zones are relatively shallow dipping (striking predominantly NE-SW) and some are relatively steeply dipping (striking predominantly NW-SE). Nzones is set to 5 following the results by Lund & Schmidt (2011) and Saari (2012) that, depending on the stress state faults in different orientations, are more vulnerable to undergo shear. Further, it is assumed that only one earthquake of magnitude M > 5 would occur within the time frame of 100,000 years. This assumption is reasonable based on, e.g., the median distance to earthquakes with a certain magnitude and recurrence period (see Saari 2012, Section 4.2) or the strain accumulation (see SKB 2011, p. 468-469), which both indicate that there would not be another large earthquake (M > 5) within a few kilometres from the site for 500,000 years. Based on this, the average annual probability of an earthquake leading to canister failure is estimated to be low, in the order of 10-7, given that there are around 5 zones that could host such an earthquake at specific time.
The number of canisters in critical positions, Ncrit, is estimated on the simulations on the intersection of large fractures with tunnel and deposition holes by Hartley et al. (2013c). They made in all four realisations of the DFN model presenting all the fractures, not just the hydraulically-conductive ones. According to Hartley et al. (2013c, Section 5.1.1, 5.2.1, 5.3.1), the distribution of FPI fracture radii is insensitive to the realisation and the variation in degree of utilisation between the realisations is not large. For example, excluding all FPI the degree of utilisation varies from 51 to 56% for the case assuming fixed locations for the deposition holes and from 59% to 62% in the case assuming adaptive design. Excluding FPI fractures larger than 75 m radius the variation is from 81% to 84%. In further analysis, a single realisation and assuming static design resulting in degree of utilisation of 52% when deposition holes intersected by fractures classified

329
as FPIs or deformation zones are excluded. In addition to the FPI-criterion, a modified criterion was considered i.e. a deposition hole is discarded if intersected by a fracture that in addition to being an FPI also intersects at least four deposition holes, or alternatively the fracture intersects at least six deposition holes. Using this modified criterion, the degree of utilisation is 72%.
Following from the discussion above, a deposition holes is considered to be in a critical position, if it is intersected by a large facture with radius higher than 75 m that is not detected by the FPI- or the modified criterion. Further, the intersection of the deposition hole needs to be located in the central part of the fracture where detrimental shear movements can take place. The deposition hole is considered to be in a critical position, if it is within a critical radius rcrit from the centre of the fracture (calculated according to Munier 2010, Eq 30), the probability of a deposition hole i to be within this area, Acrit, is calculated as pi = Acrit/A = rcrit
2/ri2, where ri is the radius of the largest fracture
intersecting the specific deposition hole and only fractures with ri > rmin = 75 m are considered. Ncrit is obtained as a sum of pi over all the deposition holes. Finally, the Ncrit is scaled for a repository to host 4500 canisters taking into account the degree of utilisation.
Based on these calculations the results for the case applying the FPI criteria are:
The degree of utilisation 52% means that the nominal number of deposition holes should be 8625 in a repository hosting 4500 canisters.
3 % i.e. 263 deposition holes are intersected by an undetected large fracture.
0.4% of deposition holes are in critical position, so the Ncrit = 35.
For the case applying the modified criteria, the results are following:
The degree of utilisation 72% means that the nominal number of deposition holes should be 6250 in a repository hosting 4500 canisters.
6 % i.e. 356 deposition holes are intersected by an undetected large fracture.
1.2% of deposition holes are in critical position, so the Ncrit = 78.
These estimates are pessimistic in the sense that the distance to the earthquake hosting zone is not accounted for; on the other hand some of the deposition holes may be relatively close to the fault zones, although outside the respect distances to the layout determining features. The sensitivity of the Ncrit on the number of realisations is acknowledged and further work in this respect has been planned. On the other hand, because of the low average annual probability of an earthquake leading to canister failure, in the order of 10-7, during the first glacial cycle, the probability of occurrence of such an earthquake is low. The risk for a canister failure is further reduced by locating the deposition holes away from large deformation zones and avoiding large fracture intersections in deposition holes.
330
7.2.5 Summary, uncertainties and issues that need propagation
There is a low likelihood of shear displacements exceeding 5 cm even in connection with ice-sheet retreat. This conclusion is primarily based on the location of Olkiluoto in a seismically stable environment. Locating the deposition holes away from large fault zones and avoiding large fracture intersections in deposition holes will further decrease the likelihood of shear movements.
The long time frames considered with respect to the available data lead to uncertain estimates of seismic activity. It is known that future seismicity, also in the context of post-glacial faulting, is related to existing faults and the extent of faulting is related to fault size. However, uncertainties are related to observations of the size of fault zones and fractures. Other properties of the faults and fractures, such as shear strength and undulation also affect the resulting displacements. In particular, as the faults and fractures in the modelling by Fälth & Hökmark (2011, 2012) assume perfectly planar geometry and very low residual strength, it is likely that both the earthquake magnitudes and shear displacements are overestimated. Therefore, developing the characterisation methods to be able to limit the fracture sizes and assessing also other fracture properties, in addition to size as indicators of fractures with the potential for faulting, would help in reducing the conservatism in the current large fracture criterion concerning only fracture size. Concerning modelling, the development needs are related to considering the impact of non-planarity and varying properties of the faults and fractures and representation of the earthquakes, so that impacts at smaller distances from ruptures can be studied. The modelling by Fälth & Hökmark (2011, 2012) does not consider fractures closer than 100 m to the primary fault hosting an earthquake. Fälth & Hökmark (2011, 2012) note that the models applied do not account for potential effects of asperities that locally may give high stress drops or for irregularities or splays that may cause larger displacements in fractures located close by.
Due to the uncertainties, the following is addressed as part of the disturbance scenarios in Formulation of Radionuclide Release scenarios:
An earthquake during the prolonged temperate period within 10,000−50,000 years,
An earthquake at the time of ice-sheet retreat and
Temporarily and locally increased flow rates and reduced transport resistances of the migration paths due to earthquakes.
7.3 Freezing/thawing of buffer and backfill
7.3.1 Overview and performance targets potentially affected
In the normal, expected evolution of the disposal system, the possibility of freeze/thaw cycles affecting the materials that form the buffer and backfill is not considered to be a threat for their long-term performance as part of the EBS for two main reasons:
1. permafrost will not reach repository depth (Hartikainen 2006, 2013),
2. should the freezing front reach repository depth, the materials, and design selected for the buffer and backfill withstand the freeze/thaw cycles without sustaining any permanent damage to their safety functions (see Schatz & Martikainen 2010, 2013, and text below).

331
7.3.2 Effect of decreasing temperatures on buffer and backfill performance
An influence due to decreasing temperature on the buffer and backfill swelling pressure can be anticipated as this property is dependent on external conditions (Birgersson et al. 2010). Specifically, swelling pressure is a direct measurement of the difference in the chemical potential between water in the clay material and water external to the clay system. As such, a phase transition, i.e., freezing, in the external water would be expected to affect swelling pressure (Birgersson et al. 2010).
A theoretical description of the temperature dependence of swelling pressure was derived as follows:
0, ,s s
clay
s wP w T P w T T
v w
where Ps(w,T0) is the swelling pressure at a reference temperature of 0 C, s is the difference in partial molar entropy between clay water and external water, vclay is the partial molar volume of clay water, and T is the temperature difference between the measurement and reference temperatures (Birgersson et al. 2010). The equation is valid for both positive (temperatures above zero) and negative values (temperatures below zero) of T, provided appropriate values of s(w) are used. In the case of temperatures below zero, when external water is expected to be frozen, s(w) corresponds to the difference in molar entropy between clay water and ice. In the case of temperatures above zero, when external water is expected to be unfrozen, s(w) corresponds to the difference in molar entropy between clay water and liquid bulk water.
As indicated by the equation above, the slope of the swelling pressure versus temperature curve is directly proportional to the entropy difference between the water in the clay and in the external phase. The molar entropy difference between clay water and liquid bulk water at room temperature for both calcium and sodium bentonites at water ratios between 0.25 and 0.35 is a small, negative number (Kahr et al. 1990). By contrast, the approximate difference in molar entropy between liquid bulk water and ice at 0 °C is a large, positive number (Atkins & de Paula 2002). Estimated slopes on the swelling pressure versus temperature curve are -0.03 and 1.19 MPa/°C relative to liquid water and ice reference states, respectively (Birgersson et al. 2010).
Another interesting aspect of the equation is its indication of a temperature below 0 °C where swelling pressure is completely lost. This “critical temperature” depends only on the swelling pressure at 0 °C (Birgersson et al. 2010). At temperatures lower than the critical temperature, ice forms in the material. As such, the critical temperature can be used to provide an estimate of the freezing point of the material.
When ice forms in the freezing soil itself, there is a corresponding increase in volume and/or pressure depending on the particular confining stresses at hand and the permeability of the material to water migration (Smith & Onysko 1990).
The variation of the equilibrium pressure with temperature for any two phases of a given substance can be expressed by the Clapeyron equation (Henry 2000):

332
where S and V are the changes in entropy and volume, respectively, for the transfer of a specified quantity, e.g., 1 mole, of the substance from phase a to phase b. The molar entropy change is equal to the molar latent heat of the phase change divided by thermodynamic temperature, and hence the equation can be rewritten as:
For a change in state from a solid to a liquid, the latent heat of fusion (Lf) can be substituted for the transferred heat energy:
Considering the question of how much pressure is needed to melt ice at a temperature below 0 °C, with Lf = 333.88 J/g and V = -0.0906 cm3/g (specific volume of water minus that of ice). The equation predicts a very large increase in pressure for small changes in temperature below 0 °C, i.e., -13.49 MPa/°C. This value represents the pressure limit for the phase transition at equilibrium, i.e., the pressure required to melt ice at a temperature below its freezing point for a system subjected to equal pressure changes on the ice and water phases. These boundary conditions are applicable to a hydraulically-closed, frozen repository. The inverse of the last equation describes the change in melting temperature with pressure for the same system (-0.074 °C/MPa).
This situation described might apply to clay materials. When the porous medium is composed of large grains and the unfrozen film is thin, the radius of curvature at the ice/water interface is so small compared to the film thickness that it is closely approximated as a flat surface with equal liquid and ice pressures (Black 1995).
Based on the discussion above, three regions of pressure/temperature behaviour for swelling clay materials in contact with an aqueous external phase can be considered: 1) temperatures above the freezing point of the external aqueous phase, 2) temperatures below the freezing point of the external aqueous phase, and 3) temperatures below the freezing point of water in the clay. This behaviour is displayed graphically in Figure 7-15.
Recent numerical simulations of ground temperature at selected depths at Olkiluoto based on the LGC-scenario from 50–40 ka BP indicate a maximum penetration depth of freezing temperatures to between 275–300 m (Hartikainen 2013). A plot of these minimum temperatures from the surface to a depth of 500 m is displayed in Figure 7-16.
Numerous experiments have demonstrated that the melting temperatures of materials are depressed in porous media (Dash et al. 2006).
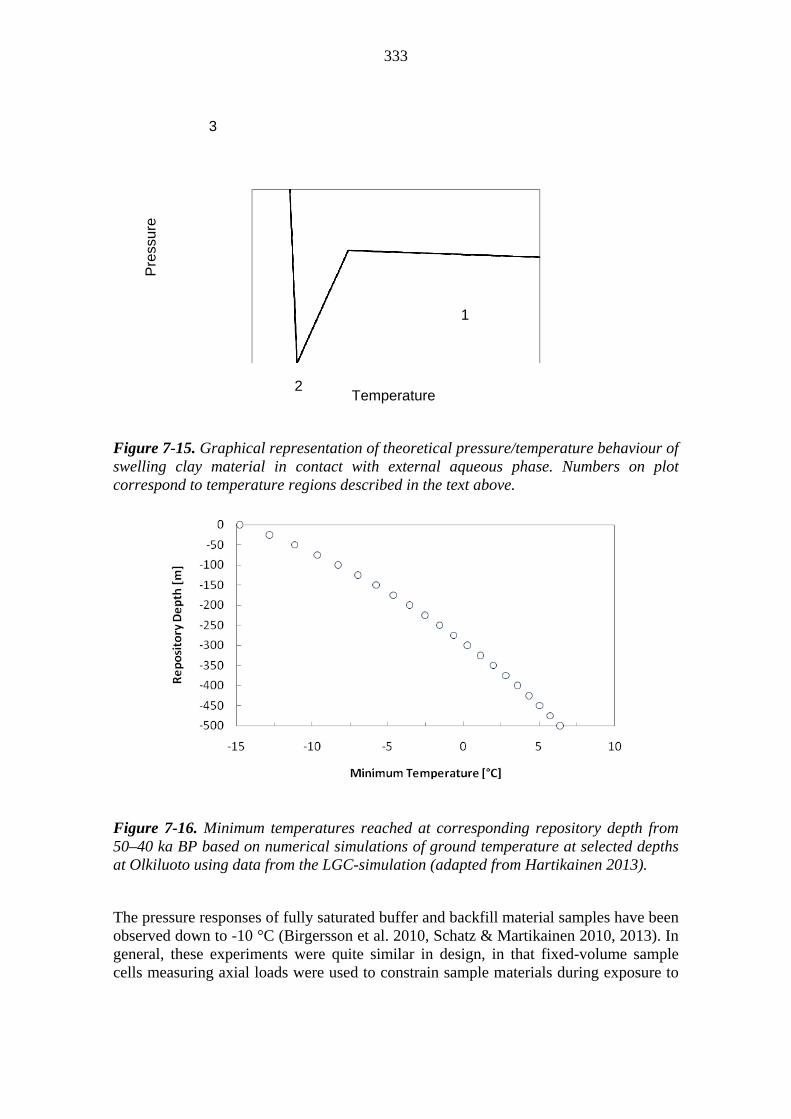
333
Figure 7-15. Graphical representation of theoretical pressure/temperature behaviour of swelling clay material in contact with external aqueous phase. Numbers on plot correspond to temperature regions described in the text above.
Figure 7-16. Minimum temperatures reached at corresponding repository depth from 50–40 ka BP based on numerical simulations of ground temperature at selected depths at Olkiluoto using data from the LGC-simulation (adapted from Hartikainen 2013).
The pressure responses of fully saturated buffer and backfill material samples have been observed down to -10 °C (Birgersson et al. 2010, Schatz & Martikainen 2010, 2013). In general, these experiments were quite similar in design, in that fixed-volume sample cells measuring axial loads were used to constrain sample materials during exposure to
3
2
1
Pre
ssur
e
Temperature

334
freezing temperatures. A set of representative results are provided in Figure 7-17 to Figure 7-20.
Figure 7-17. Measured pressure response of saturated MX-80 and Deponit CA-N buffer samples and a Milos backfill material sample during a freezing and thawing exposure programme (Birgersson et al. 2010).
Figure 7-18. Measured pressure response of fully saturated MX-80 bentonite (dry density = 1.470 g/cm3) during a freezing and thawing exposure programme (Schatz & Martikainen 2010).
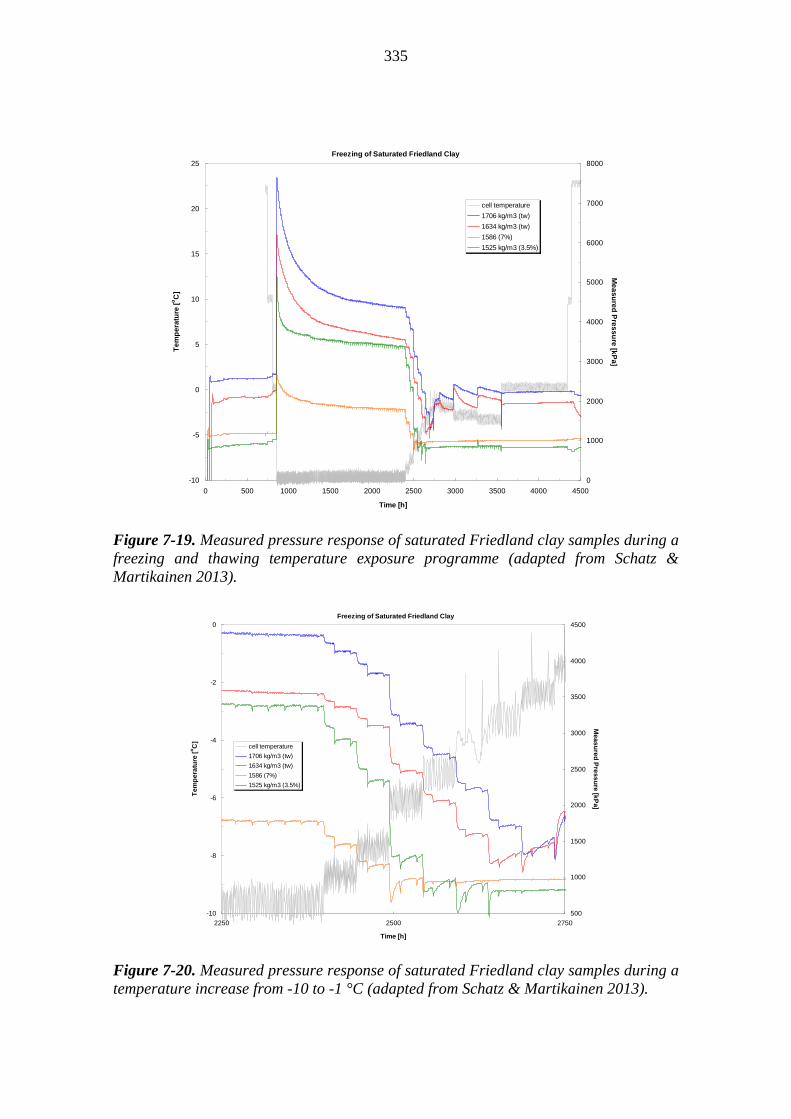
335
Freezing of Saturated Friedland Clay
-10
-5
0
5
10
15
20
25
0 500 1000 1500 2000 2500 3000 3500 4000 4500
Time [h]
Te
mp
era
ture
[oC
]
0
1000
2000
3000
4000
5000
6000
7000
8000
Me
as
ure
d P
res
su
re [k
Pa
]
cell temperature
1706 kg/m3 (tw)
1634 kg/m3 (tw)
1586 (7%)
1525 kg/m3 (3.5%)
Figure 7-19. Measured pressure response of saturated Friedland clay samples during a freezing and thawing temperature exposure programme (adapted from Schatz & Martikainen 2013).
Freezing of Saturated Friedland Clay
-10
-8
-6
-4
-2
0
2250 2500 2750
Time [h]
Tem
pe
ratu
re [
oC
]
500
1000
1500
2000
2500
3000
3500
4000
4500
Me
asu
red
Pre
ssu
re [k
Pa]
cell temperature
1706 kg/m3 (tw)
1634 kg/m3 (tw)
1586 (7%)
1525 kg/m3 (3.5%)
Figure 7-20. Measured pressure response of saturated Friedland clay samples during a temperature increase from -10 to -1 °C (adapted from Schatz & Martikainen 2013).
336
The behaviour observed in Figure 7-17 to Figure 7-20 is rather consistent with the theoretical expectations depicted in Figure 7-15. In particular, the swelling pressure responses above material freezing points are quite well represented by theoretical expectations. Although exposure to freezing temperatures below material freezing points results in the development of significant internal pressures, which are attributed to the formation of ice in these materials, the observed pressure increases fall substantially below the pressure limit described by Equation 4. It cannot be excluded that experimental conditions affected measured system responses.
Both buffer and backfill material swelling pressures were observed to nearly fully recover after freezing and thawing exposure, including repeated freezing and thawing cycles. Similarly, both buffer and backfill material hydraulic conductivities were not observed to be significantly affected by freezing and thawing exposure, including repeated freezing and thawing cycles. Therefore, any effects on swelling pressure or hydraulic conductivity due to freezing (at least to -10 °C) can be considered to be completely reversible upon thawing.
7.3.3 Summary, uncertainties and issues that need propagation
In conclusion, the potential for freezing of the buffer or the deposition tunnel backfill is not an issue that would jeopardise the performance of these barriers since:
1. permafrost will not reach repository depth (Hartikainen 2006, 2013),
2. should the freezing front reach repository depth, the materials and design selected for the buffer and backfill withstand freeze/thaw cycles without damage to their safety functions.
7.4 Geochemical evolution of the buffer and backfill
7.4.1 Overview and performance targets potentially affected
During the long-term evolution (beyond 10,000 years) and largely after the temperate period, climate-driven events will affect groundwater composition and thus also the conditions in the buffer and backfill. In general, changes in groundwater composition and salinity will be moderate with no effects on the performance of the clay barriers. During ice-sheet melt and retreat, short periods of infiltration of dilute meltwater may occur which are of concern because of favouring “chemical” erosion of the buffer and backfill, and thus affecting all performance targets.
Degradation of cement components will continue, but their impact on the buffer and backfill will gradually decrease because of the less aggressive leachates produced. Sulphide production in the backfill is still an issue to consider. In the case of extensive erosion in some of the deposition holes, microbially-induced sulphide production and diffusion or advection through the buffer to the canister cannot be ruled out.
The long-term stability and longevity of montmorillonite under Olkiluoto-type conditions might be affected by slow kinetic transformation processes, but this is at odds with geological observations.

337
7.4.2 Evolution of porewater chemistry and salinity of the buffer
The buffer porewater salinity will follow, with some delay, that of the surrounding groundwater (Section 7.1.3). During permafrost, the changes in salinity are rather small (Löfman & Karvonen 2012) with some possible salinity increase. During the subsequent ice-sheet retreat and melting, salinity conditions will become more variable and may display a TDS concentration from a few to about 30 g/L at repository level.
The penetration of dilute waters at repository level below the target value of 4 mM for total cation charge equivalents (TDS about 0.4 g/L) would be limited to a few deposition holes and to specific conditions, including a warm-based stationary ice sheet front located above the repository area, which induces high hydraulic gradients. If such conditions were to occur, the duration thereof would be rather short, at most a few thousand years.
At these long timescales, the more soluble accessory minerals, such as gypsum, may have been completely leached out of the buffer, but the less soluble ones, such as calcite will likely still be present. This is supported by reactive transport modelling (e.g. Arcos et al. 2006, Sena et al. 2010, Wersin et al. 2013c). The composition of dilute waters at repository level is uncertain. The very dilute groundwaters, as present at the alpine Grimsel Test Site may be regarded as a bounding case. The calculated porewater and cation exchanger composition for a buffer surrounded by such Grimsel-type water is shown in Table 6-5. The porewater pH will be similar, thus rather alkaline (a pH of 9.6 has been calculated from modelling), but within the acceptable range (L3-ROC-16). Due to the preferential uptake of divalent cations under dilute conditions (Appelo & Postma 2005), the exchanger is enriched in calcium. Thus, a high Ca equivalent fraction of 95 % is calculated for a buffer in equilibrium with Grimsel-type water (Table 6-5). The salinity of such a Grimsel-type porewater is below 4 mM total cation charge equivalents and thus below the target value (L3-ROC-14). It should be noted that this water represents a bounding case and that such dilute groundwater is unlikely to reach repository levels.
Redox conditions of the more dilute waters are expected to be less reducing because of lower levels and fluxes of dissolved organic carbon. The presence of dissolved oxygen however is highly unlikely (Trinchero et al. 2013). As long as salinity is high enough, the microbial activity will remain as restricted as in the previous time periods. Under dilute conditions, and if there is partial buffer loss due to erosion processes, microbial activity may increase. However, because of the less reducing conditions, iron-reducing conditions rather than sulphate-reducing conditions are more likely.
Under extreme conditions favourable to chemical erosion, buffering reactions in the buffer will still take place when the clay particles have partly been washed out. Thus, the chemical porewater composition will not be very different from that of the compacted case, unless high microbial activity was to occur. In that circumstance, higher pCO2 and lower pH might develop in deposition holes. But even for such cases, the porewater composition will be buffered by the solutes of the inflowing groundwater.
At the end of glaciation, more saline and less variable conditions will be gradually re-established. Porewater chemistry will be in the compositional range predicted for the

338
temperate period. Thus, the general geochemical evolution of the porewaters predicted for the first glacial cycle is regarded as representative for subsequent glacial cycles.
7.4.3 Evolution of porewater chemistry of backfill
The backfill porewater composition will evolve in a way analogous to the buffer during the next glaciation. Because of its larger volume, the imprint of the groundwater will be generally slower and thus diffusive mixing will occur at a slower rate. The simulated porewater composition surrounded by a Grimsel-type groundwater is shown in Table 6-7. The pH is buffered to somewhat less alkaline values because of the presence of gypsum. According to geochemical modelling of the backfill (Section 7.1), this mineral phase is likely to persist for timescales >105 years in case of no or limited sulphate reduction. Redox conditions may also be less reducing in the backfill and affected by those of the surrounding groundwater, but this depends on the extent of microbial activity in the backfill and at the backfill-rock interface. If substantial sulphate reduction were to occur (as described in Section 6.6.3), which would imply continued availability of organic matter besides low swelling pressures, the backfill would be more reducing than the surrounding groundwater.
Similarly to the buffer, under extreme conditions favourable for chemical erosion, buffering reactions in the backfill will still take place when the clay particles have partly been washed out. Thus, the chemical porewater composition will be not very different from that of the compacted case.
At the end of glaciation, more saline conditions will be gradually re-established. Porewater chemistry will be in the compositional range predicted for the temperate period. Thus, the general geochemical evolution of the porewaters predicted for the 1st glacial cycle is regarded to be representative for subsequent glacial cycles.
Sulphide levels in the backfill porewater will depend on the extent of sulphate reduction and is expected to be in the range described in Section 6.6.3 for most of the long-term evolution period, but is expected to decrease towards the end of the first glacial cycle due to a depletion of the sulphate pool in the backfill, and is expected to stay well below the conservatively estimated maximum sulphide level (3 mg/L).
7.4.4 Effect of alkaline leachates on buffer and backfill
In the long term after 10,000 years the leachate from both standard and low-pH cements are expected to be clearly below 10 and thus no detrimental impacts on clay components is expected.
7.4.5 Long-term stability of montmorillonite
The long-term stability of montmorillonite in the buffer and backfill at low temperatures is of potential concern because of the long time this mineral should perform. From a thermodynamic viewpoint, montmorillonite stability under Olkiluoto-type conditions, and in more general terms in low temperate environments, is uncertain, mainly because of the lack of reliable thermodynamic data (e.g. Arthur & Zhou 2005, Savage et al. 2010). Early work (e.g. Garrels & Christ 1965) indicates the strong dependency of silica activity and pH on montmorillonite stability. The underlying thermodynamic data of Aagard & Helgeson (1983) and Garrels (1984) suggest that high silica activity is

339
required to stabilise montmorillonite relative to illite, which is the stable phase in equilibrium with quartz (Figure 7-21). Precipitation of quartz may destabilise montmorillonite in favour of illite according to Abercrombie et al. (1994). Based on sediment porewaters from the Ocean Deep Sea Drilling Program, these authors suggest that there is a threshold temperature for quartz in the range of 40−60 °C. Thus, at higher temperatures, montmorillonite would be destabilised in favour of illite, if there is sufficient potassium (Figure 7-22).
There are a number of experimental studies which show the pH dependence of montmorillonite dissolution at different temperatures below 100 °C. The compilation of Huertas et al. (2005) and Rozalén et al. (2008, 2009a, b) indicates low dissolution rates between pH 4−10 and temperatures of 25 °C. At pH values beyond 10, an increase in
Figure 7-21. Silicate mineral stabilities as a function of Si and K+/H+ activity at 25 °C (Aagard & Helgeson 1983).
Figure 7-22. Silica activities for porewaters from the Ocean Drilling Program sites 794 and 795 and saturation curves for amorphous silica, smectite-to-illite reaction and quartz (Abercrombie et al. 1994).
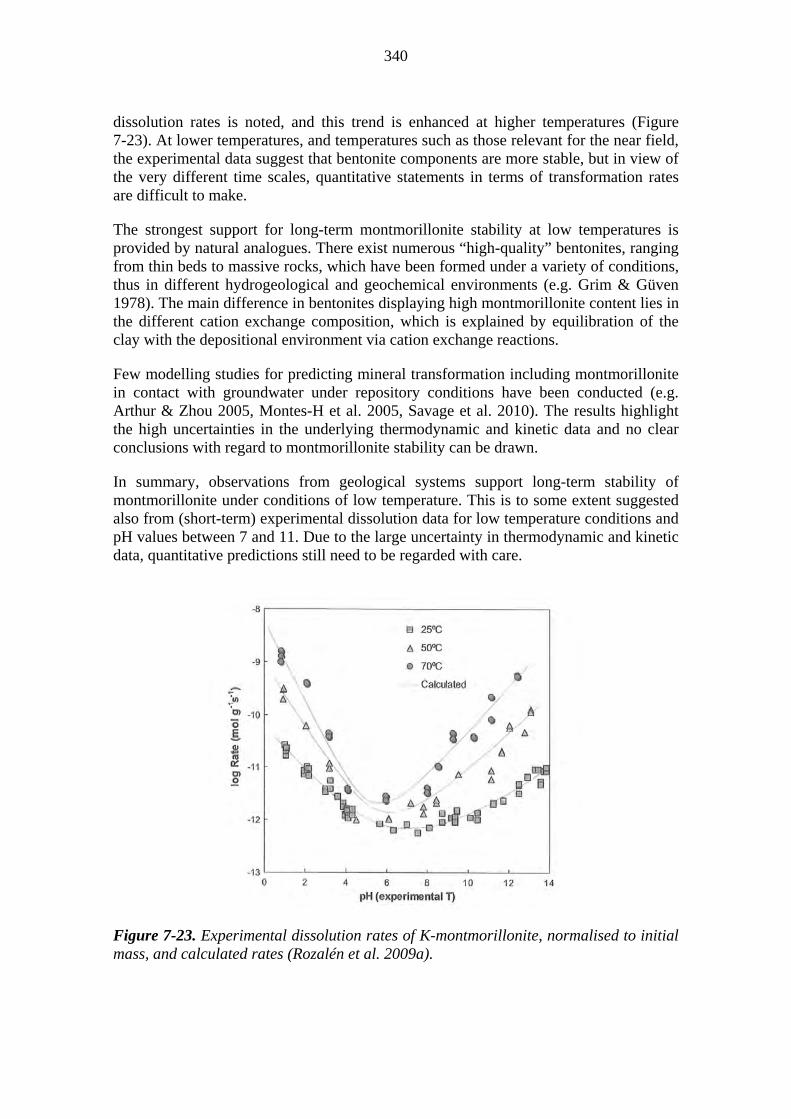
340
dissolution rates is noted, and this trend is enhanced at higher temperatures (Figure 7-23). At lower temperatures, and temperatures such as those relevant for the near field, the experimental data suggest that bentonite components are more stable, but in view of the very different time scales, quantitative statements in terms of transformation rates are difficult to make.
The strongest support for long-term montmorillonite stability at low temperatures is provided by natural analogues. There exist numerous “high-quality” bentonites, ranging from thin beds to massive rocks, which have been formed under a variety of conditions, thus in different hydrogeological and geochemical environments (e.g. Grim & Güven 1978). The main difference in bentonites displaying high montmorillonite content lies in the different cation exchange composition, which is explained by equilibration of the clay with the depositional environment via cation exchange reactions.
Few modelling studies for predicting mineral transformation including montmorillonite in contact with groundwater under repository conditions have been conducted (e.g. Arthur & Zhou 2005, Montes-H et al. 2005, Savage et al. 2010). The results highlight the high uncertainties in the underlying thermodynamic and kinetic data and no clear conclusions with regard to montmorillonite stability can be drawn.
In summary, observations from geological systems support long-term stability of montmorillonite under conditions of low temperature. This is to some extent suggested also from (short-term) experimental dissolution data for low temperature conditions and pH values between 7 and 11. Due to the large uncertainty in thermodynamic and kinetic data, quantitative predictions still need to be regarded with care.
Figure 7-23. Experimental dissolution rates of K-montmorillonite, normalised to initial mass, and calculated rates (Rozalén et al. 2009a).

341
7.4.6 Effect of canister corrosion on buffer
Corrosion of the canister leads to a release of Cu ions, which may react with the bentonite buffer, besides forming corrosion products. This process is far more extensive under oxic conditions, where released Cu(II) reacts strongly with the clay surfaces by cation exchange, surface sorption, polymerisation and surface precipitation (Morton et al. 2001, Strawn et al. 2004). Support for this interaction between the copper canister and bentonite is provided by data from the LOT A2 experiment at the Äspö HRL, where a heated copper tube was contacted with compacted MX-80 bentonite for a period of five years. The clay in the contact area of 2 cm showed significant loading with copper, but rapidly decreased to background levels beyond this area (Karnland et al. 2009). A similar type of steep Cu profile in the clay was observed in small-scale laboratory experiments where compacted MX-80 emplaced in Cu vessels was contacted with NaCl solutions for eight years (Kumpulainen et al. 2010). In both studies, the conditions that led to this behaviour of Cu were interpreted to arise from corrosion with molecular oxygen that was initially present in the experimental systems.
Under anoxic conditions, the situation is different. The corrosion rates are much lower and controlled by the flux of sulphide and the formation of an insoluble copper sulphide layer (Section 6.8.3). Thus the amounts of Cu, present as Cu(I) released to solution are very low. In contrast to Cu(II), the interaction of Cu(I) with the clay is expected to be rather weak, as indicated from unpublished diffusion data (King et al. 1992, King & Wersin 2013). As illustrated in Figure 7-24, the copper profiles in compacted bentonite differ considerably depending whether Cu(II) or Cu(I) is the main oxidation state. In the latter case, where anionic species (e.g. CuCl2
-) predominate, copper concentrations in the clay are much lower, but extend farther into the clay. This is because of the weak affinity of Cu(I) for clay surfaces.
In summary, during the initial oxic stage, interaction between corrosion-released Cu(II) and the clay will occur and some copper will be transferred to the bentonite buffer. Once conditions become reducing, the flux of released copper will become much less, while an insoluble copper sulphide will slowly build up at the canister surface.
The properties of the buffer will not be affected by copper corrosion, even for the innermost parts that will contain some copper from the initial oxic corrosion period. This is indicated from the results from the LOT A2 experiment, which showed no effect of copper loading on swelling pressures or hydraulic conductivities (Karnland et al.
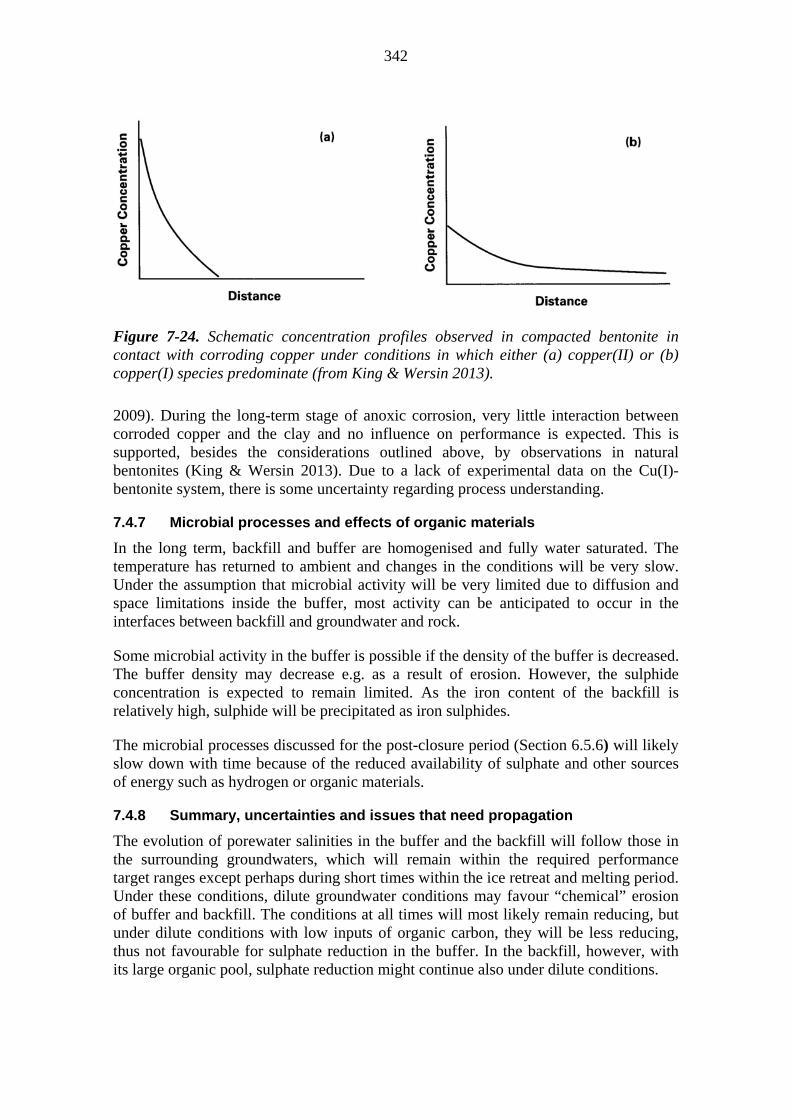
342
Figure 7-24. Schematic concentration profiles observed in compacted bentonite in contact with corroding copper under conditions in which either (a) copper(II) or (b) copper(I) species predominate (from King & Wersin 2013).
2009). During the long-term stage of anoxic corrosion, very little interaction between corroded copper and the clay and no influence on performance is expected. This is supported, besides the considerations outlined above, by observations in natural bentonites (King & Wersin 2013). Due to a lack of experimental data on the Cu(I)-bentonite system, there is some uncertainty regarding process understanding.
7.4.7 Microbial processes and effects of organic materials
In the long term, backfill and buffer are homogenised and fully water saturated. The temperature has returned to ambient and changes in the conditions will be very slow. Under the assumption that microbial activity will be very limited due to diffusion and space limitations inside the buffer, most activity can be anticipated to occur in the interfaces between backfill and groundwater and rock.
Some microbial activity in the buffer is possible if the density of the buffer is decreased. The buffer density may decrease e.g. as a result of erosion. However, the sulphide concentration is expected to remain limited. As the iron content of the backfill is relatively high, sulphide will be precipitated as iron sulphides.
The microbial processes discussed for the post-closure period (Section 6.5.6) will likely slow down with time because of the reduced availability of sulphate and other sources of energy such as hydrogen or organic materials.
7.4.8 Summary, uncertainties and issues that need propagation
The evolution of porewater salinities in the buffer and the backfill will follow those in the surrounding groundwaters, which will remain within the required performance target ranges except perhaps during short times within the ice retreat and melting period. Under these conditions, dilute groundwater conditions may favour “chemical” erosion of buffer and backfill. The conditions at all times will most likely remain reducing, but under dilute conditions with low inputs of organic carbon, they will be less reducing, thus not favourable for sulphate reduction in the buffer. In the backfill, however, with its large organic pool, sulphate reduction might continue also under dilute conditions.

343
Ongoing degradation of cementitious materials will gradually release less aggressive leachates and the effects on the clays in the near field will generally be very limited.
The persistence and longevity of montmorillonite is difficult to assess because of a lack of theoretical and experimental knowledge. Thermodynamic data suggest that montmorillonite is not stable under Olkiluoto-type conditions, but kinetic and especially observations from natural systems indicate long-term persistence of montmorillonite at low temperatures over a large range of geochemical conditions.
Copper corrosion is not expected to affect the performance targets of the buffer, as is indicated from experimental and geological observations.
The main uncertainties include:
The ionic strengths of groundwaters affected by intrusion of melt waters, which need to be accounted for in the analysis of “chemical” erosion;
Sulphide production in the backfill, which might last for long periods;
Extent of the impact of cementitious leachates on the buffer;
Process understanding of montmorillonite stability under low temperature and somewhat alkaline conditions (pH 7−10) in view of a lack of thermodynamic and kinetic data;
Interactions of Cu(I) with bentonite, especially with regard to potential redox processes.
7.5 Chemical erosion of the buffer and backfill
7.5.1 Overview and performance targets potentially affected
Bentonite can absorb water and, in an unconfined state, swell to several times its original volume. In principle, in a KBS-type repository, the volumes of the deposition holes and the mass of bentonite minerals that they contain are fixed, which leads to the development of suitable swelling pressure. However, the possibility of transmissive fractures intersecting deposition holes implies that volume-constrained conditions may not be ubiquitous and the possibility of some loss of bentonite minerals by erosion in flowing water must be considered. This would in turn affect the performance targets on buffer permeability (L3-BUF-12, L3-BUF-13 and L3-BUF-14), see Table 2-2.
7.5.2 Chemical erosion
Transmissive fractures intersecting the deposition holes (or deposition tunnels) may provide pathways for the continued, localised free swelling of the bentonite buffer (or backfill) until equilibrium, or in the case of erosion, steady-state is reached. If an erosion mechanism is operative under such circumstances, the extruded buffer material continues to expand into a fracture, i.e., lose density, until it begins to flow in a gel state with the moving groundwater, clay particles are removed from the extruded front due to shear forces of flowing groundwater, and/or it disperses as a colloidal sol which is transported away.

344
Bentonite consists primarily of the clay mineral montmorillonite, which lends to the material its substantial swelling ability when in contact with aqueous solutions (Karnland et al. 2006). Montmorillonite is also present in the backfill material (Friedland clay). The free swelling behaviour of bentonite is strongly dependent on the nature of the exchangeable cations and the chemistry of the external aqueous phase (Birgersson et al. 2009). For montmorillonite dominated by small, monovalent cations (Na+, K+), the swelling at low ionic strength can be sufficient to effectively form a colloidal sol; for montmorillonite dominated by multivalent cations (Ca2+, Mg2+), the swelling is restricted to a maximum mean interlayer space of a few nanometres (Birgersson et al. 2009). Ultimately, the dominant exchangeable cations in montmorillonite will be determined by chemical equilibrium between the buffer material and the prevailing groundwater. Both the Olkiluoto groundwater composition at emplacement (in terms of cation character) at repository depth and that at greater depth, as well as the calcium inventory in the bentonite material itself due to accessory mineral content, i.e. calcite (CaCO3) and gypsum (CaSO4•2H2O), are expected to favour the cation exchange of montmorillonite towards a Ca-dominant composition (Laine & Karttunen 2010).
Groundwater composition will vary locally and with time, and future periods in which the ionic strength of the groundwater at repository depth is lower than at present cannot be excluded, as discussed in Section 7.1. Equilibration of the buffer (or backfill) with low ionic strength groundwater will allow for more expanded systems that will be less stable against erosion in flowing groundwater. The evolution of groundwater composition, diluted by glacial meltwater, at repository depth is difficult to predict, and, therefore, the implications of potential penetration of any dilute water to repository depth for the buffer performance must be assessed.
The lowest concentration of electrolyte at which a soil colloidal suspension becomes unstable and begins to undergo perikinetic flocculation is called the critical coagulation concentration (CCC) (Sposito 2008). The value of the CCC will, in general, depend on the nature of the participating colloids and the composition of the aqueous solution in which they are suspended [ibid]. This measure of colloid stability is often used to estimate the potential of a given groundwater to carry a significant amount of colloids (Wold 2010).
The coagulation of lyophobic (relatively insoluble) colloids upon addition of an indifferent (not chemically interacting) electrolyte can be explained by the fundamental Derjaguin-Landau-Verwey-Overbeek (DLVO) theory of colloid stability, which assumes that the stability of an aqueous colloidal system is controlled by the balance between repulsive electrostatic forces and attractive van der Waals forces (Hiemenz & Rajagopalan 1997). However, CCC calculations made explicitly on the basis of the DLVO theory for montmorillonite colloids can show poor agreement with experimental observations (Missana & Adell 2000), and, with respect to soil colloids at least, it seems that the theoretical relationship is more indicative than exact (Arthur 2011).
Experimentally observed CCC values in the range between 0.01 to 0.1 M Na+ and 0.0001 to 0.001 M Ca2+ have been reported for sodium and calcium montmorillonite, respectively (García-García et al. 2007). Although it can be expected that purely monovalent or divalent systems will not be encountered in the repository environment,
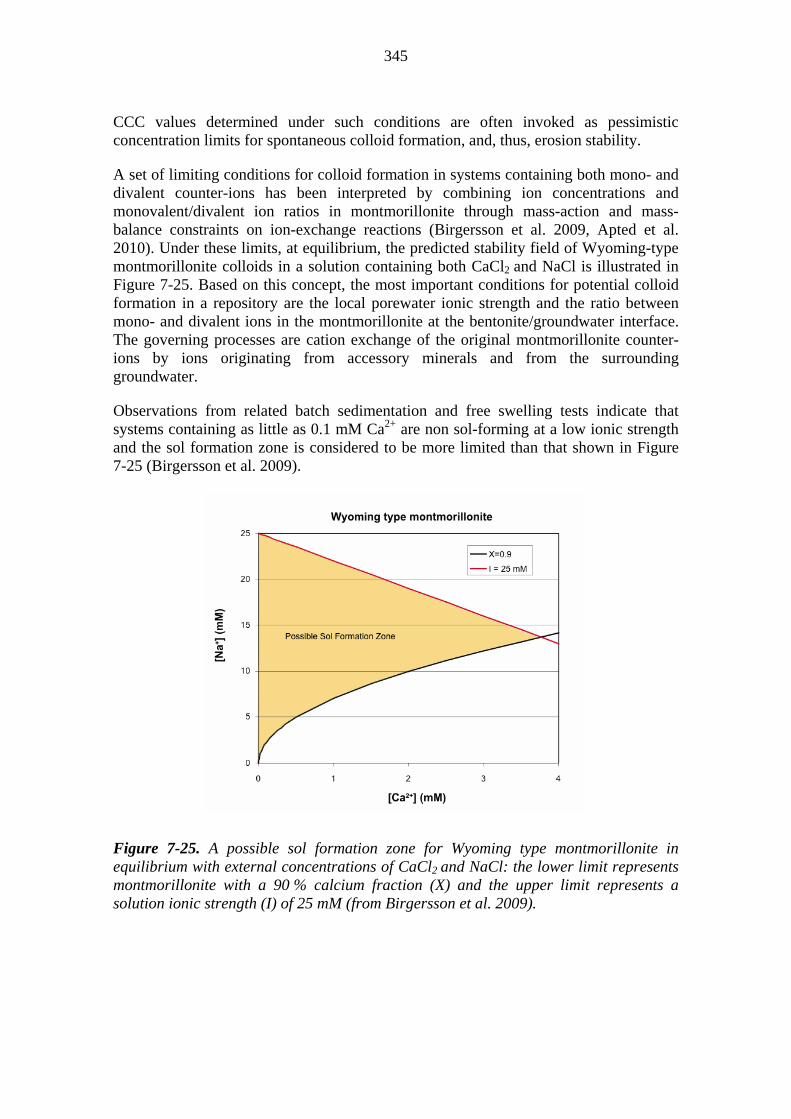
345
CCC values determined under such conditions are often invoked as pessimistic concentration limits for spontaneous colloid formation, and, thus, erosion stability.
A set of limiting conditions for colloid formation in systems containing both mono- and divalent counter-ions has been interpreted by combining ion concentrations and monovalent/divalent ion ratios in montmorillonite through mass-action and mass-balance constraints on ion-exchange reactions (Birgersson et al. 2009, Apted et al. 2010). Under these limits, at equilibrium, the predicted stability field of Wyoming-type montmorillonite colloids in a solution containing both CaCl2 and NaCl is illustrated in Figure 7-25. Based on this concept, the most important conditions for potential colloid formation in a repository are the local porewater ionic strength and the ratio between mono- and divalent ions in the montmorillonite at the bentonite/groundwater interface. The governing processes are cation exchange of the original montmorillonite counter-ions by ions originating from accessory minerals and from the surrounding groundwater.
Observations from related batch sedimentation and free swelling tests indicate that systems containing as little as 0.1 mM Ca2+ are non sol-forming at a low ionic strength and the sol formation zone is considered to be more limited than that shown in Figure 7-25 (Birgersson et al. 2009).
Figure 7-25. A possible sol formation zone for Wyoming type montmorillonite in equilibrium with external concentrations of CaCl2 and NaCl: the lower limit represents montmorillonite with a 90 % calcium fraction (X) and the upper limit represents a solution ionic strength (I) of 25 mM (from Birgersson et al. 2009).
346
7.5.3 Chemical erosion experiments
Birgersson et al. (2009) performed a series of “erosion tests” using modified swelling pressure cells. In these tests, compacted samples (montmorillonite and bentonite) were separated from a flow channel by a porous frit. As the material saturated and swelled through the frit, it was exposed to flowing solution and to potential erosion. The penetration and loss of various swelling clay materials against various solution compositions through frits of varying pore size and length was analysed primarily by swelling pressure measurements. Systems with constant, stable swelling pressures were considered to be non-eroding.
The main results from the erosion tests are as follows:
Against deionised water, sodium montmorillonite is readily lost through pore sizes as small as 2 m, whereas calcium montmorillonite is not lost through pore sizes as large as 100 m.
The loss of sodium montmorillonite, through a pore size of 10 m, could be stopped by increasing the solution concentration to 20 mM NaCl.
The loss of mixed calcium/sodium montmorillonites, through a pore size of 10 m, could be stopped by a concentration of 4 mM NaCl.
Based on these experiments, groundwater with cation content larger than 4 mM is considered sufficient to prevent colloidal sol formation (SKB 2011).
In order to simulate the potential extrusion/erosion behaviour of bentonite buffer material at a transmissive fracture interface, Schatz et al. (2013) performed a series of small-scale, flow-through, artificial fracture experiments in which swelling clay material could extrude/erode into a well-defined system (see Figure 7-26). The fracture dimensions were 24 cm (length) × 24 cm (width) × 1 mm (aperture) and the compacted sample dimensions were 2 cm (height) × 2 cm (diameter). Extrusion/erosion effects were analysed against solution chemistry (salt concentration and composition), material composition (sodium montmorillonite and admixtures with calcium montmorillonite), and flow velocity.
Clear distinctions were observed between those tests for which erosive mass loss was observed and those for which it was not. Specifically, no erosion was observed for sodium montmorillonite against solution compositions from 10 g/L to 0.5 g/L NaCl. As described above, most reports in the literature indicate that a concentration of 0.5 g/L NaCl (8.6 mM) is below, in some cases well below, the (experimentally observed) CCC for the colloidal sodium montmorillonite/sodium chloride system. It was also the case that no erosion was observed for 50/50 calcium/sodium montmorillonite against 0.5 g/L NaCl. Based on the results of the flow-through, artificial fracture tests, stability against erosion was observed down to a dilute concentration range between 8 to 4 mM NaCl for both sodium and 50/50 calcium/sodium montmorillonite. These limits compare favourably to the erosion stability limits observed by Birgersson et al. (2009) in the case of the latter material but less so for the former.
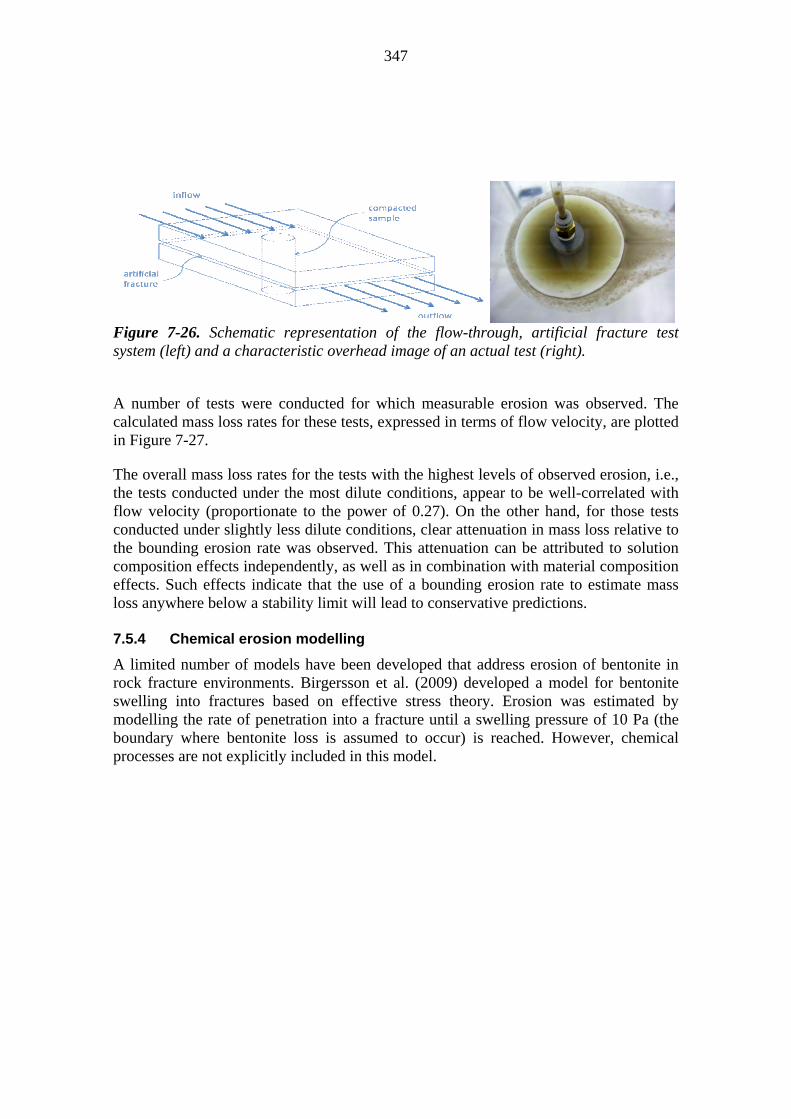
347
Figure 7-26. Schematic representation of the flow-through, artificial fracture test system (left) and a characteristic overhead image of an actual test (right).
A number of tests were conducted for which measurable erosion was observed. The calculated mass loss rates for these tests, expressed in terms of flow velocity, are plotted in Figure 7-27.
The overall mass loss rates for the tests with the highest levels of observed erosion, i.e., the tests conducted under the most dilute conditions, appear to be well-correlated with flow velocity (proportionate to the power of 0.27). On the other hand, for those tests conducted under slightly less dilute conditions, clear attenuation in mass loss relative to the bounding erosion rate was observed. This attenuation can be attributed to solution composition effects independently, as well as in combination with material composition effects. Such effects indicate that the use of a bounding erosion rate to estimate mass loss anywhere below a stability limit will lead to conservative predictions. 7.5.4 Chemical erosion modelling
A limited number of models have been developed that address erosion of bentonite in rock fracture environments. Birgersson et al. (2009) developed a model for bentonite swelling into fractures based on effective stress theory. Erosion was estimated by modelling the rate of penetration into a fracture until a swelling pressure of 10 Pa (the boundary where bentonite loss is assumed to occur) is reached. However, chemical processes are not explicitly included in this model.

348
Figure 7-27. Experimentally observed mass loss rates from artificial fracture tests expressed in terms of flow velocity. Filled data points are reflective of tests conducted with sodium montmorillonite and unfilled data points are reflective of tests conducted with 50/50 calcium/sodium montmorillonite. Data points are labelled with corresponding test solution composition; GGWS represents a Grimsel groundwater simulant relative to Na+ and Ca2+ concentrations only (0.68 and 0.14 mM, respectively) and DI represents deionised water (Schatz et al. 2013).
A model was employed previously in SR-Can that quantitatively addresses the role of chemistry in colloid generation and the resulting erosion (Liu & Neretnieks 2006). More recently, a model for predicting the rate of erosion of the bentonite buffer in low ionic strength water has been developed by KTH, Sweden, on behalf of SKB. The model is described in Moreno et al. (2010), and represents a further development of the model used in SR-Can, addressing the details of chemical and surface chemical processes in more depth. It is this latest model that is used in the present performance assessment regarding chemical erosion.
The model considers a single, parallel-walled fracture intersecting the deposition hole, with its plane normal to the deposition hole axis. A fixed montmorillonite volume fraction is assumed along the line where the fracture intersects the deposition hole, and a specified, constant flow rate is assumed in the fracture. In the present analysis, this flow rate is based on the results of discrete fracture network (DFN) flow modelling. In order to evaluate the steady-state rate at which bentonite enters the fracture and is eroded by flowing water therein, three inter-dependent submodels are applied:
1. Transport of sodium ions in montmorillonite pore water. Transport of sodium ions in montmorillonite pore water is described by the advection-diffusion equation, but

349
with a diffusion coefficient that is an assumed function15 of the montmorillonite volume fraction.
2. Expansion of montmorillonite in the fracture. Expansion of montmorillonite in the fracture is described using a dynamic force balance model, which takes into account gravitational and buoyant forces, frictional forces, thermal motion, van der Waals forces and electrostatic forces, the latter being dependent on the local composition of the bentonite pore water. This submodel is described in detail in Liu et al. (2009a, b).
3. Flow of montmorillonite gel and sol and of water. Flow of a bentonite gel and sol in water is described by a modified version of the Darcy equation, in which the local transmissivity of the fracture is assumed inversely proportional to the viscosity of the fluid (bentonite gel/sol in water) therein. An empirical relationship between fluid viscosity and montmorillonite volume fraction is also assumed.
The governing equations of the model can be solved numerically. The results of a number of parameter sensitivity analyses are reported in Moreno et al. (2010). The calculated steady-state erosion rate is shown in Figure 7-28 for different water velocities, v [m/a], in the fracture. In this case, the KBS-3 deposition hole radius and buffer montmorillonite volume fraction are assumed. The total monovalent cation concentration is 10 mM in the buffer and 0.1 mM in the groundwater. The fracture transport aperture, 2b [m], is 10-3 m. The figure also shows a power-law fit to these results, which was used by SKB in SR-Site to model buffer erosion under low ionic strength conditions. It is this fitted relationship that is used to estimate buffer erosion in the present analysis.
15 According to Section 2.4 of Moreno et al. (2010), numerical tests with different relationships have shown that for erosion modelling purposes, the results are not very sensitive to the assumed diffusion coefficient.

350
Figure 7-28. Montmorillonite release rates from the buffer to a fracture with an aperture of 1 mm for different water velocities. Results from Table 5-1 of Moreno et al. (2010), with power-law fit added, with 2b being the fracture aperture and v being the water velocity in the fracture.
Similar modelling of the erosion of deposition tunnel backfill requires the larger cross sectional area of the tunnel and also the lower montmorillonite content of the backfill material to be taken into account. Moreno et al. (2010) considered a range of hole diameters, 0.5, 1.75, and 5.0 m, the largest of which is relevant to the deposition tunnels. Based on their results, the rate of mass loss increased by nearly a factor of two upon increasing the diameter of the interface from 1.75 m (deposition hole cross section) to 5 m (deposition tunnel cross section). They did not, however, investigate the impact of lower montmorillonite content. The model is non-linear, so the impact cannot simply be determined by the scaling of results. Additional calculations using the same model and taking into account both the larger cross sectional area of the deposition tunnel compared with the deposition hole and the lower montmorillonite content of the tunnel backfill compared with the buffer have been performed (Schatz et al. 2013). The corresponding results are shown in Figure 7-29.

351
Figure 7-29. Montmorillonite release rates from the backfill to fractures with an aperture of 1 mm for different water velocities. The best-fit relationship for the buffer is also shown.
The erosion model includes a number of simplifying assumptions that are discussed in Moreno et al. (2010). In particular, the model assumes that there are no other larger non-smectite particles that would be left behind to gradually build up a bed of particles that could act as a filter, slowing down or even straining further smectite penetration into the fracture. Moreno et al. conclude that the results could be highly pessimistic because bentonites contain tens percent of accessory minerals. The Swedish Radiation Safety Authority (SSM) has questioned the assertion that the results are pessimistic. They point out that potential deficiencies and limitations in the DLVO theory raise questions regarding the validity of the assertion that the erosion model is conservative because it considers only pure sodium-montmorillonite colloids in simple NaCl solutions (Apted et al. 2010). On the other hand, a simple CCC calculation based on the DLVO theory yields a value on the order of 1 M for sodium montmorillonite in a 1:1 electrolyte (Birgersson et al. 2009), which implies a level of colloid stability one to two orders of magnitude larger than that observed experimentally (see above). In any case, the model represents the current state-of-the-art in chemical erosion modelling.
Chemical erosion of buffer or backfill material will only occur when sufficiently low ionic strength conditions are encountered. Groundwater flow modelling has been carried out to study the distribution of water flow in the Olkiluoto host rock for temperate climatic conditions and also how this will vary in response to major climate change. Significantly enhanced water flow, and hence greater erosion, could occur with ice-sheet retreat if the ice sheet comes to a temporary halt in the vicinity of the repository.
352
7.5.5 Development of advective conditions in the buffer
Loss of buffer and/or backfill mass by chemical erosion will lead to a reduction in buffer density and, if sufficiently extensive, could lead to advective conditions being established in the buffer between the canister and the surrounding rock. Loss of buffer mass directly affects buffer density, while loss of backfill mass above the deposition hole could lead to the buffer swelling into the deposition tunnel, thereby reducing its density in the deposition hole. Advective conditions adjacent to the canister would lead to increased transfer of corrosive agents to the canister surface from the surroundings and, if the canister subsequently fails, to a reduced radionuclide retention capacity of the buffer (increased advective transport rates of dissolved radionuclides; loss of colloid filtration function). Furthermore, the eroding buffer could also provide a source of colloids, leading to colloid-facilitated radionuclide transport in the geosphere.
In the present performance assessment, advective conditions are pessimistically assumed to prevail in the buffer after 1200 kg of material is lost by erosion. The corresponding figure for the backfill is 220,000 kg. These are the criteria used in SR-Site, as discussed in Section 10.3.9 (SKB 2011). The value for the buffer is also within the 1200−1400 kg acceptable mass loss range defined in Section 5.4.
7.5.6 Data used for application of the model to the repository at Olkiluoto
In order to apply the chemical erosion model to the repository at Olkiluoto, the following additional data are used:
the evolution of groundwater velocity with time in fractures intersecting the deposition holes and tunnels;
the transport apertures of these fractures; and
the periods during which low-ionic strength conditions can be expected to prevail around each deposition hole.
Evolution of groundwater velocity
Steady-state groundwater flow rates in the fracture network at Olkiluoto have been modelled for the years 2000 AD, 3000 AD and 5000 AD. A number of model variants have also been considered to address uncertainties. For this analysis, the results of a variant case (ps_r0_no_spalling_2000, see Section 5.1.2) with no rock damage around the deposition holes are used instead of the central case. In the central case, and most of the variant cases as well, the flow at 2000 AD further accounts for the assumption of a zone of damaged rock around the deposition holes (see Section 5.1.2). As discussed in Section 5.3.3, changing stress conditions around the repository may cause rock damage, which may affect the hydraulic properties of the near-field rock. However, it is likely that the buffer would swell to some extent into damaged rock features at contact interfaces, thereby reducing or eliminating the effects of rock damage on fracture flow around the holes. Note that the erosion model indicates a penetration of the gel/water interface of between 0.5 to 34.6 m for water velocities of 315 m/a and 0.1 m/a, respectively (see Table 5-1 in Moreno et al. 2010), i.e. much further than the expected damage assuming these are spatially limited cracks, unconnected to active flow features.

353
It is expected that major climatic events being part of the climate evolution, i.e. alternating permafrost, glacial and temperate periods, may occur and affect groundwater flow and composition. The climate evolution relevant to repository performance is described in Section 4.1. Transient periods of elevated groundwater flow may occur, principally in connection with ice-sheet retreat. When permafrost or ice sheets are present, flow is expected to be suppressed (see Section 7.1.2), but this effect is conservatively neglected for chemical erosion assessment. Based on equivalent porous medium modelling of groundwater flow influenced by ice-sheet retreat, flow rates are assumed to be increased by a factor of 10 during periods of ice-sheet retreat (see Section 7.1.2).
Fracture transport aperture
A common approach for assigning a value to the fracture transport aperture has been to calculate it from the hydraulic aperture by multiplying the hydraulic aperture with a constant factor, e.g., a factor of 5−20 (Gelhar 1987). The geosphere fracture apertures used to model buffer and backfill erosion are set to reference values that are a factor of 10 larger than the hydraulic fracture aperture (the hydraulic aperture being 0.0117 T, where T is the fracture transmissivity, in m2/s). This assumption is based on an analysis of the fracture volume aperture by Hjerne et al. (2009) and shown in Figure 7-30. Hjerne et al. (2009) analysed a large set of cross-hole tracer tests performed using conservative tracers. The result of their analysis is a best fit model for the relation between the interpreted fracture transport aperture and the corresponding fracture transmissivity. In-situ tracer tests need to be performed along flow paths that are well enough connected, so that reasonably high tracer recovery in the monitoring borehole of the test is attained. Therefore, most of the fractures that Hjerne et al. (2009) considered in their analysis are much more transmissive than the fractures that will provide major part of the transport resistance along a typical release path. The relationship between measured hydraulic and interpreted volume apertures is also quite scattered (cf. Figure 7-30). Therefore, an alternative assumption, a value that is a factor of 40 larger than the hydraulic fracture aperture, is also considered in the context of canister corrosion in conjunction with buffer erosion in Section 7.7.3.

354
Figure 7-30. Relation between fracture transmissivity and volume aperture. Based on digitised data from Hjerne et al. (2009, Figure 6-1).
Occurrence of dilute conditions
There is a possibility that low ionic strength groundwater may be present at repository depth at an early point in the repository lifetime for a short term during the operational period (see Section 5.1.3). Under such conditions, the buffer and backfill will still contain soluble accessory minerals, and, furthermore, will not likely be fully saturated. The presence of gypsum (CaSO4•2H2O) in particular will ensure an elevated calcium pore water concentration as well as an elevated calcium concentration at the gel/water interface (SKB 2011). Artificial fracture experiments indicate that, at similar flow velocities and groundwater composition (Grimsel simulant), the rate of mass loss for as-received MX-80 bentonite is slower by more than an order of magnitude than for sodium montmorillonite (Schatz et al. 2013). Alternatively, even assuming the erosion model mass loss rate, only 0.1 to 27.8 kg of buffer mass would be lost from a given deposition hole into an intersecting fracture for flow velocities from 5.1·10-4 to 270 m/a (minimum and maximum velocities from groundwater flow modelling central case), respectively, over the 100 year period. Such limited losses would not be expected to compromise performance.
Dilute conditions may also occur later during temperate climate conditions as a result of meteoric water penetrating to repository depth. This process has been simulated using DFN flow modelling and the results indicate that around 3−4 % of deposition holes could be affected after 40,000 years, although there are a number of uncertainties in this modelling (see Chapter 5).
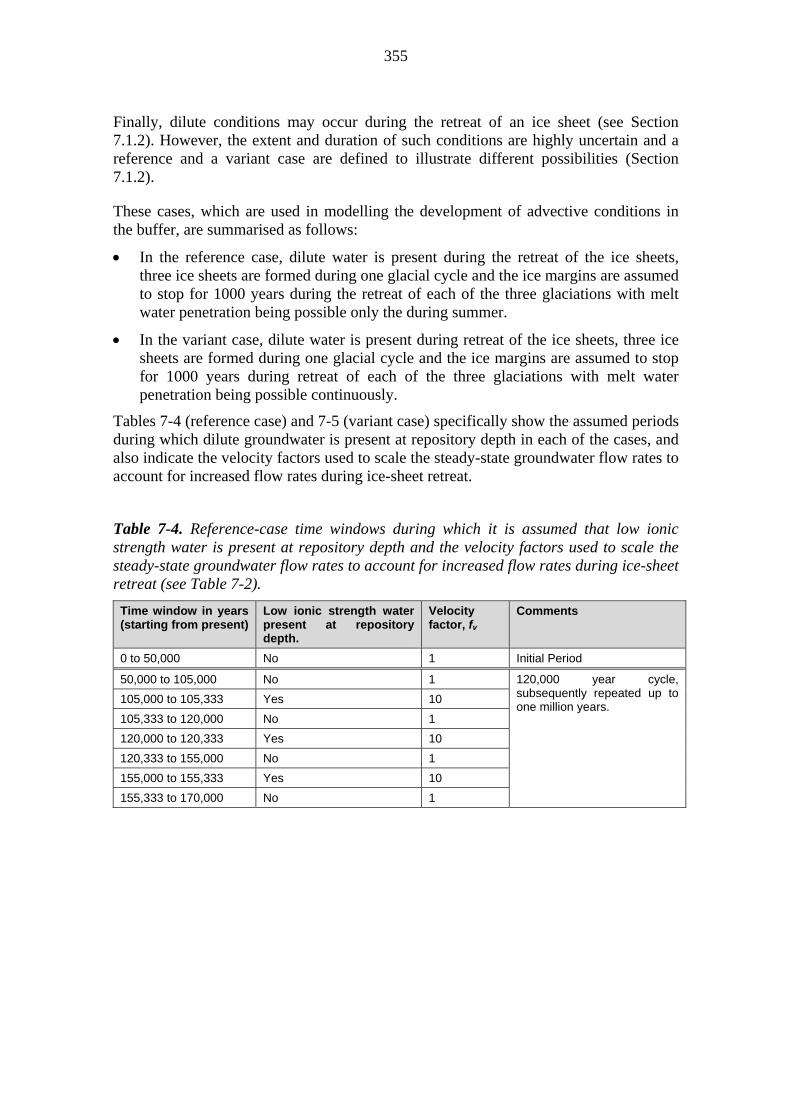
355
Finally, dilute conditions may occur during the retreat of an ice sheet (see Section 7.1.2). However, the extent and duration of such conditions are highly uncertain and a reference and a variant case are defined to illustrate different possibilities (Section 7.1.2).
These cases, which are used in modelling the development of advective conditions in the buffer, are summarised as follows:
In the reference case, dilute water is present during the retreat of the ice sheets, three ice sheets are formed during one glacial cycle and the ice margins are assumed to stop for 1000 years during the retreat of each of the three glaciations with melt water penetration being possible only the during summer.
In the variant case, dilute water is present during retreat of the ice sheets, three ice sheets are formed during one glacial cycle and the ice margins are assumed to stop for 1000 years during retreat of each of the three glaciations with melt water penetration being possible continuously.
Tables 7-4 (reference case) and 7-5 (variant case) specifically show the assumed periods during which dilute groundwater is present at repository depth in each of the cases, and also indicate the velocity factors used to scale the steady-state groundwater flow rates to account for increased flow rates during ice-sheet retreat.
Table 7-4. Reference-case time windows during which it is assumed that low ionic strength water is present at repository depth and the velocity factors used to scale the steady-state groundwater flow rates to account for increased flow rates during ice-sheet retreat (see Table 7-2).
Time window in years (starting from present)
Low ionic strength water present at repository depth.
Velocity factor, fv
Comments
0 to 50,000 No 1 Initial Period
50,000 to 105,000 No 1 120,000 year cycle, subsequently repeated up to one million years.
105,000 to 105,333 Yes 10
105,333 to 120,000 No 1
120,000 to 120,333 Yes 10
120,333 to 155,000 No 1
155,000 to 155,333 Yes 10
155,333 to 170,000 No 1

356
Table 7-5. Time windows in the variant case during which it is assumed that low ionic strength water is present at repository depth and the velocity factors used to scale the steady-state groundwater flow rates to account for increased flow rates during ice-sheet retreat (see Table 7-2).
Time window in years (starting from present)
Low ionic strength water present at repository depth.
Velocity factor, fv
Comments
0 to 50,000 No 1 Initial Period
50,000 to 105,000 No 1 120,000 year cycle, subsequently repeated up to one million years.
105,000 to 106,000 Yes 10
106,000 to 120,000 No 1
120,000 to 121,000 Yes 10
121,000 to 155,000 No 1
155,000 to 156,000 Yes 10
156,000 to 170,000 No 1
7.5.7 Model results for buffer and backfill erosion
The rate of buffer mass loss varies between deposition holes, due to the spatial variability of groundwater flow. In the reference case, only one deposition hole position out of the 5391 potential positions considered experiences advective conditions due to buffer erosion during the first glacial cycle. Figure 7-31 shows histograms of the numbers of deposition holes experiencing given amounts of buffer and backfill material erosion through the entire assessment period (1 Ma). The latter is assessed from fractures intersecting the deposition tunnel downstream of a particular deposition hole. Generally, the amounts can be seen to fall well short of the 1200 kg and 220,000 kg threshold values for buffer and backfill erosion, respectively, needed before advective conditions are established. Results are shown with and without the exclusion of deposition hole locations based on the 0.1 litres per minute initial inflow RSC criterion.
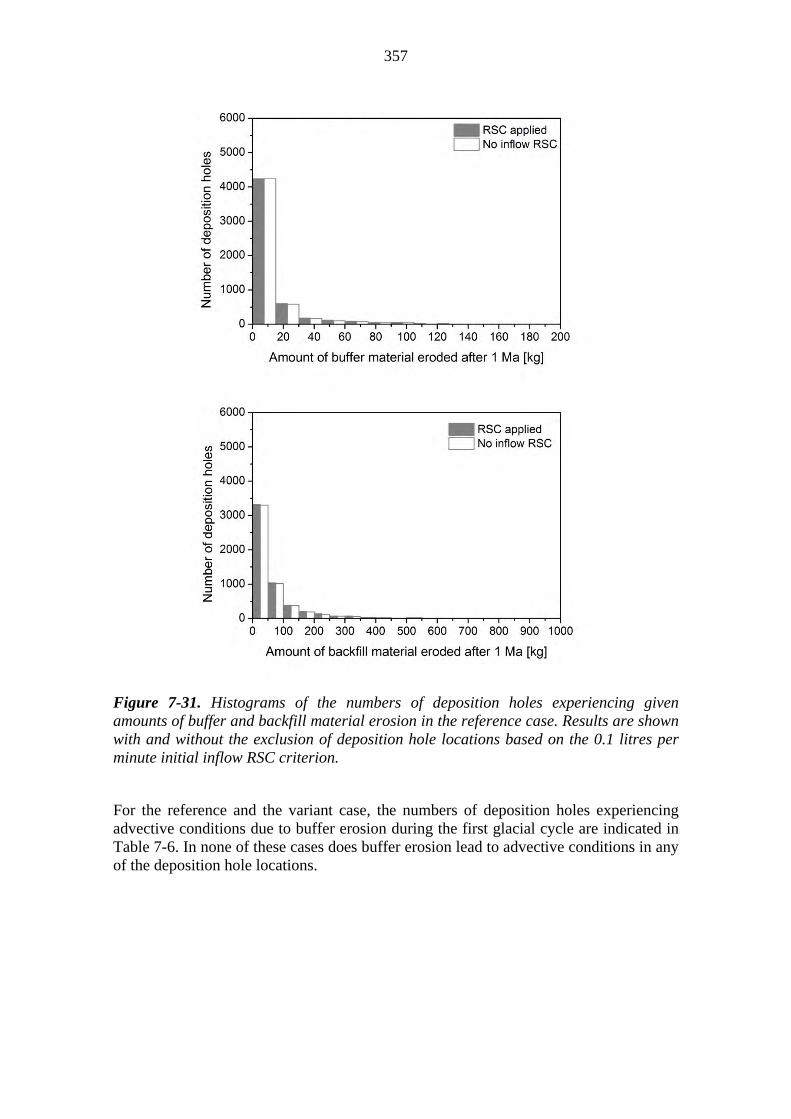
357
Figure 7-31. Histograms of the numbers of deposition holes experiencing given amounts of buffer and backfill material erosion in the reference case. Results are shown with and without the exclusion of deposition hole locations based on the 0.1 litres per minute initial inflow RSC criterion.
For the reference and the variant case, the numbers of deposition holes experiencing advective conditions due to buffer erosion during the first glacial cycle are indicated in Table 7-6. In none of these cases does buffer erosion lead to advective conditions in any of the deposition hole locations.

358
Table 7-6. Number of deposition holes experiencing advective conditions due to buffer erosion during the first glacial cycle for the reference and a variant case.
Case RSC applied No inflow RSC
Reference 1 1
Variant 3 13
Figure 7-32 shows histograms of the numbers of deposition holes experiencing given amounts of buffer and backfill material erosion in the variant case. Even in the variant case, the amount of buffer and backfill lost in the first glacial cycle is well below the threshold values.
Figure 7-32. Histograms of the numbers of deposition holes experiencing given amounts of buffer and backfill material erosion in the variant case. Results are shown with and without the exclusion of deposition-hole locations based on the 0.1 litres per minute initial inflow RSC.
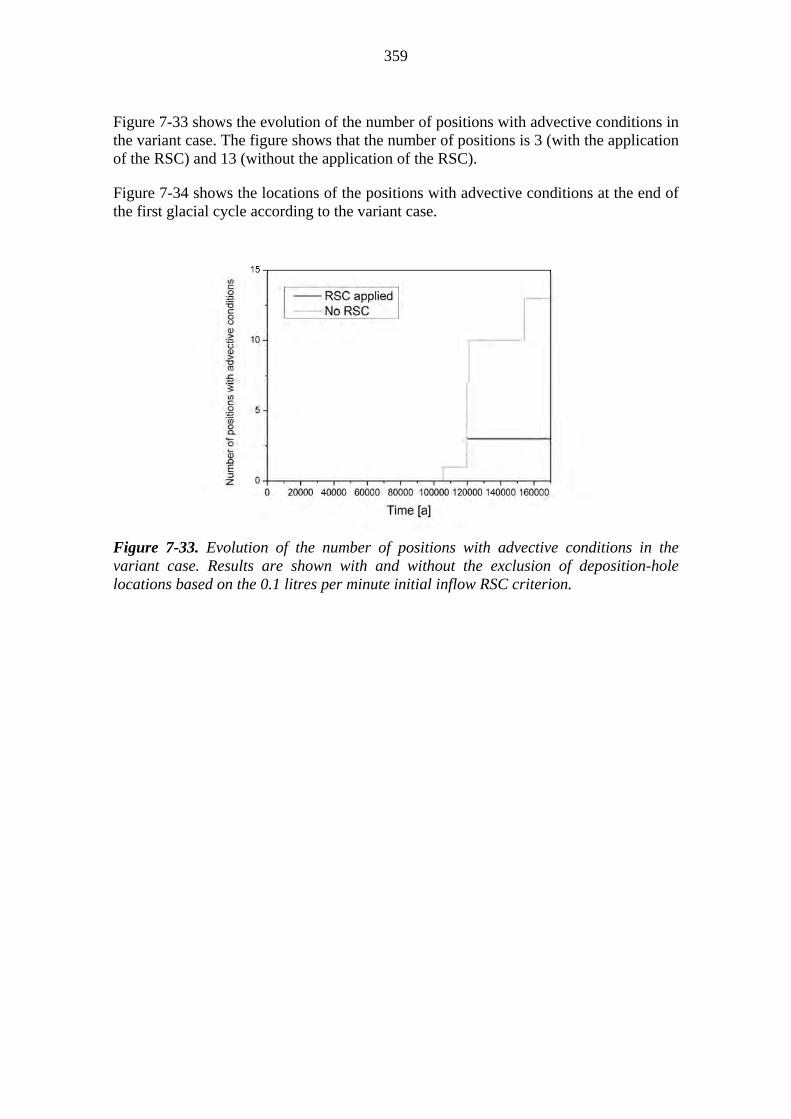
359
Figure 7-33 shows the evolution of the number of positions with advective conditions in the variant case. The figure shows that the number of positions is 3 (with the application of the RSC) and 13 (without the application of the RSC).
Figure 7-34 shows the locations of the positions with advective conditions at the end of the first glacial cycle according to the variant case.
Figure 7-33. Evolution of the number of positions with advective conditions in the variant case. Results are shown with and without the exclusion of deposition-hole locations based on the 0.1 litres per minute initial inflow RSC criterion.

360
Figure 7-34. Locations of positions (in red) with advective conditions at the end of the first glacial cycle in the variant case with the application of the RSC (upper figure) and without the application of RSC (lower figure).

361
7.5.8 Uncertainties
As described above, the assessment of the possible effect of chemical erosion on buffer mass loss relies heavily upon several theoretical constructs: climate evolution, flow modelling, and erosion modelling. Uncertainties with regard to the first two aspects are described elsewhere in this report (see Sections 4.1 and 7.1.2). Furthermore, Appendix 2 of Formulation of Radionuclide Release Scenarios presents arguments that suggest that penetration of low ionic strength water to repository depth will not occur, and so there will be no chemical erosion in the deposition holes.
The erosion calculations are based on only a single realisation of the DFN groundwater flow model. Had flow-related parameters been based on another groundwater flow modelling case, advective conditions would most likely have arisen in different deposition holes, with somewhat different flow-related parameter values, and the number of holes affected and timings of occurrence of these conditions would also have differed from those calculated here. Nevertheless, the similarity of distributions of near-field flow-related parameter values observed in different DFN realisations (Section 4.4 of Assessment of Radionuclide Release Scenarios for the Repository System) indicates at least that the number of holes affected and timings of occurrence of these conditions would have been broadly similar.
Gradual loss in buffer density and swelling pressure within the buffer where the fracture intersects the deposition hole is not taken into account when calculating the rate of erosion using the erosion model, due, in part, to uncertainties in the degree to which the bulk of the buffer homogenises in response to the erosive loss of material to a fracture. This is likely to lead to an over-estimate of the erosion rate.
The erosion model itself is rather nonlinear (input parameters vary over several orders of magnitude) and complex (represents a fully-coupled transport model of montmorillonite sol), and consequently there are significant uncertainties in the results of the calculations.
Specifically, the erosion model assumes that the eroding bentonite consists entirely of sodium montmorillonite and that it interacts only with monovalent electrolyte systems. Insofar as the experimental evidence (see above) indicates that, in the presence of nonzero electrolyte concentrations, montmorillonite containing equivalent calcium/sodium exchangeable cation fractions erodes at lower rates than pure sodium montmorillonite, and further that the assumption of pure sodium montmorillonite represents an unrealistic evolutionary endpoint, the model may be overpredicting erosive mass loss.
Additionally, the erosion model assumes that the total monovalent cation concentration is 10 mM in the buffer pore water and 0.1 mM in the groundwater. However, a sensitivity analysis showed that increasing the pore water concentration to 100 mM and the groundwater concentration to 10 mM, yielding a 12.5 mM concentration at the gel/water interface, only results in a ~15 % decrease in mass loss (Moreno et al. 2010). By contrast, artificial fracture experiments conducted on sodium montmorillonite against 8.6 mM NaCl were found to be completely nonerosive (Schatz et al. 2013). The model’s over estimation of erosion stability (in terms of electrolyte concentration) may
362
be a direct result of limitations in the DLVO theory or, possibly, other unaccounted for factors affecting coagulation kinetics (Hiemenz & Rajagopalan 1997).
There is some conjecture that, due to montmorillonite erosion, accessory mineral particles in bentonite materials will “build-up” and form a “filter cake”, which may limit the loss of clay mass (Neretnieks et al. 2009). Experimental results indicate that montmorillonite mass loss can be slowed or possibly stopped due to filtration effects (Birgersson et al. 2009) and that added, inert minerals will form into an extended layer at the solid/liquid interface in an intersecting, transmissive fracture environment (Schatz et al. 2013). However no experimental or analogue results are available indicating that a naturally-formed filter cake would actually limit erosion.
Another, important point, which has scarcely been examined, is the interaction between eroding material and fracture surfaces with regard to filtration or attachment effects leading to possible fracture clogging or sealing. Such effects, if present, are also expected to slow mass loss.
7.5.9 Summary, uncertainties and issues that need propagation
The analyses presented in this section show that chemical erosion due to the potential occurrence of dilute groundwater cannot be neglected. For reference assumptions concerning groundwater flow and evolution of groundwater composition, only one deposition hole is calculated to experience advective conditions after the first glacial cycle. However, considering uncertainties, the analysis suggests that during the first glacial cycle, this erosion could result in advective conditions in a few canister positions (3 canister positions in the variant case calculation).
Without the application of RSC, the number of positions with advective conditions after the first glacial cycle may increase slightly (to 13 in the variant case). These findings need to be considered in the assessment of canister corrosion, since advective conditions in the buffer may enhance the corrosion, see Section 7.7.
The number of deposition holes that may experience advective conditions depends on a number of uncertain factors including:
Whether sufficiently dilute conditions are attained and for how long;
Groundwater flow distribution;
Model for chemical erosion;
Threshold values for buffer and backfill loss before advective conditions are attained.
These aspects are considered in Assessment of Radionuclide Release Scenarios for the Repository System.
7.6 Evolution of the closure components
7.6.1 Overview and performance targets potentially affected
As stated in Chapter 2, Table 2-4, closure shall:
363
Complete the isolation of the spent nuclear fuel by reducing the likelihood of unintentional human intrusion through the closed volumes (L3-CLO-5);
Restore the natural conditions of the bedrock and not endanger the favourable conditions for the other parts of the EBS and the host rock (L3-CLO-6, L3-CLO-8);
Prevent the formation of preferential flow paths and transport routes between the ground surface and deposition tunnels/deposition holes (L3-CLO-7).
The backfill in the central tunnels will be, after 10,000 years, completely saturated and keep its safety functions regardless of the consequences of climate evolution (see Ch. 4 above) since:
1. permafrost will not reach repository depth (Hartikainen 2006, 2013),
2. should the freezing front reach repository depth, the materials, and design selected for the closure backfill at repository depth will withstand the freeze/thaw cycles without damage to their safety functions (Schatz & Martikainen 2013),
3. possible dilute/fresh waters from the surface or from the base of a possible warm-based ice sheet will not reach repository depth without reacting with the rock mass and the materials above repository depth.
However, the upper parts of the closure will be exposed to more dilute waters and to lower temperatures. Degradation of the closure backfill material due to chemical erosion or freeze and thaw may potentially affect all the performance targets of closure components. These issues are dealt with below.
7.6.2 Evolution of the cementitious components in the deposition tunnel and closure plugs
After 10,000 years, the binder CSH in the plugs should be considered to be dissolved. Gypsum is more stable, but it is safe to assume that it is dissolved also. (See also the evolution of closure components up to 10,000 years, Chapter 6).
What is left is the sand and rock structure (a sand cake). It will not keep its original shape but will fall down at an inclination of about 60 degrees if there is space to fall. This will weaken the contact at the top interface to the excavated tunnel. During the estimated earthquakes associated with glacial periods, the sand cakes, especially the ones near the surface, will be shaken and vibrated and the deformation will continue, which may open passages at the top interface. To ensure contact at the top interface, the overall structure could be designed so that there is extra crushed material at the top of the structure. This will fall down during vibrations and seal the opening (gravitational sealing).
The very high water pressure values during the expected glaciations are not the actual hydraulic pressure differences that the plug structures should withstand, but the slowly developing pressure exerted by the build-up of ice sheets during glaciations. The ice-sheet development process is slow. During the build-up of the pressure, some water will penetrate through the plug (or the rock) reducing the actual hydraulic pressure difference over the concrete components of the plugs to close to 0 MPa. The remaining question is if the “sand and rock structure” is able to fulfil the performance requirements (backfill swelling pressure of 0−2 MPa, vibrations during glacial periods). The
364
“gravitational sealing” may provide a solid solution. The chemical loads are unimportant in the long term, since only the rock-based aggregate is left and it is not considered sensitive to chemical loads.
Hydraulic plugs include concrete with filter layers and clayish interiors. As the cement paste is degraded, filter layers hinder material displacement and the swelling clay will replace cement if some material is “lost”. Swelling clay material penetrates into the spaces between aggregate materials. This is one functional target of the swelling clay interior. In the intrusion obstructing plugs, concrete structures do not play any role; the penetration is obstructed by having large boulders that are difficult to move and at the same time difficult to drill through.
7.6.3 Chemical erosion of closure backfill material
The content of swelling clay in the closure backfill materials will be much less than that of the bentonite buffer. Chemical erosion experiments have been done with pure montmorillonite alone as well as with bentonite (Schatz et al. 2013) showing that bentonite, with its accessories, is less prone to erosion than pure montmorillonite. This means that as the closure backfill will be a mix of clay with a low smectite content and aggregate, this mix will be less sensitive to chemical erosion. Furthermore, there will be a much larger mass of backfill in the access tunnel compared to the mass in a deposition hole. On the other hand, the flow rates may be higher in the access tunnel and the cross-sectional area of interaction will be larger. This means that it cannot be excluded that parts of the backfill in the access tunnel will lose their swelling clay components over the long time scale considered. However, this is not judged to jeopardise the overall safety function of the closure backfill in particular, nor that of the closure as a whole, because of the overall limited use of clay components.
7.6.4 Freezing and thawing
The technical rooms and the lowest part of the shafts below HZ20 that are backfilled with crushed rock material, if submitted to freeze/thaw cycles as a consequence of permafrost, will not suffer major changes of volume that could damage the safety functions of the backfilled material itself or the surrounding tunnels or shaft walls. Frost heave, if developed, will be of minor consequence if the crushed rock material is selected appropriately (e.g. Chapter 7 in Nurmikolu 2005 and references therein). The access tunnel and shafts between depths of 200 and 300 m backfilled with in situ compacted bentonite-aggregate mixture may, in the far future, be subject to freeze/thaw cycles, but as shown in Schatz & Martikainen (2013), this will have no major implications for the performance of the material (see Section 7.3).
In general, the swelling pressure of the backfill will be much lower than that found in the buffer, and correspondingly, it can be expected that the freezing temperature of the backfill will be higher than that of the buffer (see Section 7.3). Laboratory studies on the effect of freezing and thawing exposure on compacted Friedland clay and bentonite/ballast mixtures indicate freezing temperatures of between -3 to -2 °C for Friedland clay, saturated with dilute solution, at dry densities between 1630 and 1700 kg/m3 and freezing temperatures between -1 and 0 °C for 40/60 and 30/70 bentonite/ballast mixtures, saturated with dilute solution, at dry densities between 1470 and 1640 kg/m3 (Schatz & Martikainen 2013). Furthermore, swelling pressures and
365
hydraulic conductivities were found to be essentially recovered after freezing and thawing exposure for Friedland clay samples. However there was evidence of a negative recovery trend for bentonite/ballast mixtures with both increasing ballast volume and/or decreasing mixture density. It must be noted that if Friedland clay and bentonite/ballast mixtures were saturated with brackish water (instead of the dilute one used in the experiments), then the freezing temperatures would be expected to be lower than the ones that have been measured.
The material filling the access tunnel and shafts above 200 m depth is in situ compacted crushed rock, which, due to its nearest position to the surface, may be subject, not only to permafrost (freeze/thaw cycles of the order of thousands of years), but the uppermost part close to the surface will also be subject to annual freezing and thawing cycles. Again, if frost heave develops, it will be of minor consequence if the crushed rock material is selected appropriately (e.g. Chapter 7 in Nurmikolu 2005 and references therein).
In the very long term, glacial erosion may have an effect on the materials in the upper part of the disposal facility, but it must be taken into account that there will be very large intrusion obstructing plugs (see Section 3.1.3) at the mouth of the access tunnel and shafts and that the erosion rate, even during glacial cycles, is very slow (e.g. Okko 1964; see Complementary Considerations, Section 7.5 for further discussion).
7.6.5 Impact of partial losing of the closure
As discussed in Section 6.1.2, even if performance of the closure backfill is reduced in terms of locally increased hydraulic conductivity, the impact on the on the target properties flow rates under post closure conditions and flow-related transport resistance is minor.
7.6.6 Summary, uncertainties and issues that need propagation
As shown above, the backfill in the central tunnels will, after 10,000 years, be completely saturated and keep its safety functions regardless of the consequences of climate evolution. For the upper parts of the closure the following is concluded:
It cannot be excluded that parts of the access tunnel will lose its swelling clay components due to chemical erosion over the long time scale considered. However, this is not judged to jeopardise the overall safety function of the closure backfill in particular, nor that of the closure components as a whole because of the overall limited use of clay components.
Degradation of closure plugs is uncertain, but even if it is pessimistically assumed to have happened in the period of 100,000 years, gravitational sealing will ensure low permeability through the access tunnel and other spaces filled with closure materials.
Freezing/thawing of the closure materials would not impair the closure performance targets. The access tunnel and shafts between depths of 200 and 300 m backfilled with in situ compacted swelling clay-aggregate mixture may, in the far future, be subject to freeze/thaw cycles, but this will have no major implications for the performance of the material. The material filling the access tunnel and shafts above 200 m depth is in situ compacted crushed rock. If frost heave develops, it will be of

366
minor consequence if the crushed rock material is selected appropriately. Glacial erosion may have an effect on the materials in the upper part of the disposal facility, but the erosion rate, even during glacial cycles is so slow that it would take several millions of years to erode the upper plugs and the material underneath.
7.7 Canister corrosion
7.7.1 Overview and performance targets potentially affected
The performance target potentially affected is the corrosion resistance of the canister (L3-CAN-7), as in the previous assessment periods. During the long-term evolution, the conditions near the canister are expected to remain anoxic indefinitely. There are no traces of O2 penetration at repository depth that might be due to the penetration of oxidising glacial meltwater from previous glaciations (Section 7.1.3). Therefore no corrosion due to O2 is expected in this time frame. The temperature of the canister is very similar to that of the natural bedrock in this long time frame. The radiation from the canister surface has also greatly decreased. The bentonite around the canister has reached the swelling pressure and the swelling pressure should be homogeneous around the canister. Long-term corrosion calculations have been carried out using the results from the DFN model and sulphide concentrations specific to the Olkiluoto site.
The corrosion loads considered in this phase are the following:
Corrosion from sulphide
Intact buffer
Eroded buffer.
7.7.2 Corrosion of the canister surrounded by an intact buffer
In the case of an intact buffer, taking into account the flow conditions in the most unfavourably located deposition hole and a nominal copper thickness of 49 mm, a sulphide concentration in groundwater of more than 4 g/L (around 3 g/L for a reduced shell thickness of 3.5 cm) is required to fully corrode the copper shell after 170 ka (the time period corresponding to the end of the first glacial cycle taking into account the onset at 50 ka, see Table 7-4. This concentration is more than 3 orders of magnitude higher than expected sulphide concentrations (less than 1 mg/L) or the pessimistic sulphide concentration used in corrosion calculations (3 mg/L) (see Section 6.1.5). The overall corrosion depth is negligible during the first glacial cycle since the calculations show that over 1 million years the corrosion depth is only a few hundred micrometres for the most unfavourable flow conditions (see Section 8.2.1). The overall corrosion depth will not exceed a few tenths of a mm during the first glacial cycle, taking into account the corrosion depths from the previous phases as well. Thus, no canister failures are expected if the buffer is intact after the end of the first glacial cycle. The distribution of corrosion depths in all deposition holes taking into account the flow distribution given by the DFN model is described in the discussion of repeated glacial cycles (Section 8.2).
There is no well founded stress corrosion cracking (SCC) mechanism in anoxic conditions that would result in stress corrosion cracking during the long-term evolution of the canister. In particular, there is no clear evidence of sulphide-induced SCC

367
because the interfacial sulphide concentration will be close to zero due to mass transport limitations (King & Newman 2010). Investigations for resolving if SCC could happen in anoxic sulphide-containing conditions are ongoing within the framework of the Finnish research programme on nuclear waste management (KYT).
7.7.3 Canister corrosion in the case of a partially eroded buffer
Appendix B describes how canister corrosion is modelled following the onset of advective conditions in the buffer due to chemical erosion. In this section, the corrosion model is applied in conjunction with the model of chemical erosion described in Section 7.5, which provides, as output, the time when advective conditions are established in a given deposition hole.
In order to apply the corrosion model to the repository at Olkiluoto, the following site-specific data are needed:
The evolution of groundwater velocity with time in fractures intersecting the deposition holes and tunnels;
The transport apertures of these fractures;
The sulphide concentration in the groundwater.
Evolution of groundwater velocity with time in fractures intersecting the deposition holes and tunnels
For the evolution of groundwater velocity the reference and variant case that are applied are the same as when modelling chemical erosion (see Tables 7-4 and 7-5). Other conditions and parameters needed to calculate the number of canisters that may be affected by corrosion as a consequence of buffer erosion are reported in Table 7-7 below.
For the reference and variant case, the numbers of deposition holes experiencing advective conditions due to buffer erosion during the first glacial cycle are shown in Table 7-6 of Section 7.5.7. In the reference case, only one deposition hole position out of the 5391 potential positions considered experiences advective conditions due to buffer erosion during the first glacial cycle. In none of these cases does backfill erosion lead to advective conditions in any of the deposition hole locations. In the variant case, up to 13 positions experience advective conditions if the RSC criteria are not applied. These positions do not lead immediately to canister failure because the corrosion rate of copper is still constrained by the limited rate of supply of sulphide from the surrounding rock through the partly eroded buffer to the canister surface. Based on the coupled DFN flow/buffer erosion/canister failure calculations, the calculations show that the delay between the establishment of advective conditions and canister failure is highly dependent on local flow conditions, but is in the order of a few tens of thousands of years for the least favourably located deposition holes and can be as high as a hundred thousand years for the most favourably located deposition holes (see Section 7.5 and Appendix B).

368
The transport apertures of the fractures
As in the modelling of chemical erosion, the reference assumption is that the transport aperture is a factor of 10 larger than the hydraulic aperture, with a variant case of 40 times the hydraulic aperture.
The sulphide concentration in the groundwater
Multiple calculations are carried out to illustrate the effects of a range of sulphide concentrations. In each calculation, the sulphide concentration is assumed to be the same at all times and for all deposition holes.
Corrosion area
The approach to be used for the modelling of the corrosion area on the canister surface once advective conditions are established must be selected. Section B.3 of Appendix B describes a reference approach and a pessimistic approach. Both are considered in the results below. Also, no hydraulically significant rock damage around the deposition holes is assumed (the erosion model predicts that fractures due to rock damage would be filled with bentonite, see Section 7.5.4).
Table 7-7. Parameter values used in the reference and variant corrosion calculations considering buffer erosion.
Parameter Assumption (Reference) Variant Assumption
RSC inflow limit [0.1 litres/min] Both applied and not applied in the figures
--
Canister radius [m] 0.525 --
Deposition hole radius [m] (Table 3-3)
0.875 --
Canister thickness [m] 0.049 0.035
Copper density [kg/m3] 8900 --
Atomic weight of sulphide [g/mol] 33 --
Atomic weight of copper [g/mol] 64 --
Number of moles of copper corroded per mole of sulphide
2 --
Buffer mass loss threshold to attain advection [kg]
1200 --
Backfill mass loss threshold to attain advection [kg]
22,000 --
Aperture factor between transport aperture and hydraulic aperture
10 40
Effective diffusion coefficient in bentonite [m2/s] (anions, incl. sulphide)
7.80·10-12 --
Diffusion coefficient in free water [m2/s]
1·10-9 --
Sulphide concentration in groundwater [mg/L]
3 --
Corrosion area model [m2] 0.58 (Eq. B.3-5) 0.13 (Eq. B.3-6)
Aperture factor 10 40

369
Duration of dilute conditions per glacial cycle [a]
Dilute water is present during the retreat of the ice sheets, three ice sheets are formed during one glacial cycle and the ice margins are assumed to stop for 1000 years during the retreat of each of the three glaciations with melt water penetration being possible only during summer (see Table 7-4).
In variant 1, dilute water is present during retreat of the ice sheets, three ice sheets are formed during one glacial cycle and the ice margins are assumed to stop for 1000 years during retreat of each of the three glaciations with melt water penetration being possible continuously (Table 7-5).
Calculation results
Figure 7-35 shows the individual effects of fracture aperture and corrosion area uncertainties (for both the nominal copper wall thickness of 49 mm and the minimum required thickness of 35 mm) in the case of a partially eroded buffer. The sulphide concentration range shown in the figure includes the range of expected and pessimistic sulphide concentrations at the site.
Figure 7-35. Number of canister failures after 170 ka as a function of sulphide concentration in groundwater for the nominal canister thickness (49 mm, solid lines) and for the minimum required canister thickness (35 mm, dashed lines). The reference assumptions, alternative fracture aperture and pessimistic corrosion area assumptions are described in Table 7-7. The expected range of sulphide concentration is noted by the grey area and the maximum sulphide concentration by dashed black line.

370
In the reference case, during the period covering the first glacial cycle (170 ka) and considering a pessimistic sulphide concentration of 3 mg/L, no canister failures are expected in the case of buffer erosion. One failure is predicted if a pessimistic corrosion area is assumed and 1−3 canister failures are expected if a 4 times higher fracture aperture is considered (i.e. a fracture aperture factor of 40, compared with a factor of 10 in the reference case).
Figure 7-36 shows the effect of uncertainties in the evolution of groundwater flow and composition (ionic strength) in fractures intersecting the deposition holes and tunnels (the evolution of flow conditions and ionic strength in the reference and variant case is described in Table 7-4 and 7-5. The figure shows that, in the reference case, canister corrosion failure only occurs with extremely high sulphide concentrations (a factor of 3 higher than the pessimistic estimate of 3 mg/L). In the variant case, if the groundwater sulphide concentration is higher than about 1 mg/L and less than about 20 mg/L, only about 1−3 canister failures are calculated, even considering a reduced canister thickness of 35 mm. It is expected that, in most of the deposition holes, the groundwater sulphide
Figure 7-36. Number of canister failures after 170 ka as a function of sulphide concentration in groundwater, calculated for different flow and buffer erosion assumptions (see text). The number of canister failures is given for the nominal canister thickness (49 mm, solid lines) and for the minimum required canister thickness (35 mm, dashed lines). The expected range of sulphide concentration is noted by the grey area and the maximum sulphide concentration by dashed black line.
371
concentration will be below 1 mg/L (see Section 6.1.3). Therefore, most of the canisters would be intact throughout the first few glacial cycles even in the case of buffer erosion and considering various uncertainties in the flow and duration of dilute conditions.
Microbially induced sulphide production due to buffer erosion could enhance sulphide production and general corrosion of the canister. However, the availability of nutrients and energy sources for microbial activity is unclear.
Section 7.5.7 shows that the chemical erosion of the backfill never gives rise to sufficient extrusion of the buffer into the deposition tunnels to induce advective conditions. The importance for overall safety of the failed canisters due to the combined effect of an eroded buffer and sulphide corrosion is evaluated Chapter 10 of the Assessment of Radionuclide Release Scenarios.
7.7.4 Summary, uncertainties and issues that need propagation
In summary, during the long-term evolution, no canister failures are expected if the buffer performs as designed, even considering pessimistic sulphide concentrations. The overall corrosion depth will not exceed a few tenths of a mm during the first glacial cycle, taking into account the corrosion depths from the previous phases as well.
Assuming buffer erosion, no canister failures are expected in the reference conditions (with a pessimistic sulphide concentration of 3 mg/L). A few failed canisters (a maximum of 3 in the calculations presented here) might occur in the first glacial cycle using more pessimistic assumptions.
As noted in Section 7.5.8 in the context of buffer erosion, the buffer erosion/canister corrosion calculations are based on only a single realisation of the DFN groundwater flow model. Had flow-related parameters been based on another groundwater flow modelling case, canister failure would most likely have occurred in different deposition holes, with somewhat different flow-related parameter values, and the number and timings of failures would also have differed from those calculated here. Nevertheless, the similarity of distributions of near-field flow-related parameter values observed in different DFN realisations (Section 4.4 of Assessment of Radionuclide Release Scenarios for the Repository System) indicates the number and timings of canister failures and the consequent near-field release rates would have been broadly similar. The number and timings of canister failures in the calculations presented here should therefore be regarded as a reasonable illustration, but are not to be interpreted as a precise prediction. In addition to the uncertainties related to the chemical erosion of the buffer discussed in Section 7.5.7, as well as the time at which advective condition could arise in the buffer and hence the resulting amount of subsequent corrosion, the main uncertainty concerning canister corrosion is the additional flow of sulphide from the buffer and backfill due to microbial activity if the density decreases due to erosion. The application of RSC criteria greatly mitigates the possibility of emplacing a canister in a position with high flows.
The issues propagated to the formulation of release scenarios are the number and location of failed canisters as well as an indication of the timing of failure.
372
7.8 Mechanical impacts on the canister
7.8.1 Overview and performance targets potentially affected
As stated in Chapter 2, the canister shall initially be intact except for incidental deviations when leaving the encapsulation plant for disposal (L3-CAN-4). In the expected repository conditions, the canister shall remain intact for hundreds of thousands of years except for incidental deviations (L3-CAN-5). The canister shall withstand the expected mechanical loads in the repository (L3-CAN-9). More specifically, the canister shall have sufficient mechanical strength to ensure minimal probability of isostatic collapse for isostatic pressures of up to 45 MPa, it shall withstand the expected dynamic mechanical loads and it shall have sufficient mechanical strength to ensure rupture limit > maximum shear stress on the canister, corresponding to a 5 cm displacement in any direction in the deposition hole.
7.8.2 Isostatic load
A 2–2.5 km thick ice sheet may create a contribution of about 20–25 MPa to the groundwater pressure, if the effect of ice layer is conservatively added to the hydrostatic pressure. In summary, the maximum summed isostatic pressure load at the Olkiluoto site is 39–44 MPa.
7.8.3 Freezing
For canister design assessment purposes, permafrost is assumed to extend down to the repository level, though it has been shown that permafrost will not reach repository depth (Hartikainen 2013). The lowest temperature is assumed to be -5 °C. The freezing of bentonite and the water in it may lead to a swelling pressure load of freezing on the canister, however causing no damage (Raiko et al. 2010).
7.8.4 Rock shear
The integrity of the canister can be threatened by shear-type rock movements, if the shear plane intersects the canister location in the deposition hole and the shear amplitude is large enough. If the bentonite buffer (assumed to have been transformed to Ca-bentonite) around the canister is 350 mm thick, the canister is expected to withstand a rock shear of 5 cm with a velocity of 1 m/s according to Raiko et al. (2010). The bentonite material properties and swelling pressure are described in Börgesson et al. (2010). The risk caused by even larger rock movements, which, for example, may occur during the retreat and melting phase of an ice sheet, is minimised, but not completely eliminated, to an allowable level by locating the disposal galleries beyond justified respect distances from major fracture zones in the bedrock and by locating the deposition holes in such a way that they are not intersected by fractures with the potential to undergo damaging shear movements, see Section 7.2.
For the shear load case, the stresses and strains in the canister are high, depending on the shear amplitude, shear angle and the intersection point. For the canister design, the dimensioning shear load case for the insert was shown to be perpendicular to the canister’s main axis at about ¾ of its length whereas the dimensioning load case for the copper overpack is 22.5º to the main axis (Hernelind 2010).

373
The design case of the 5 cm rock shear leads to equivalent plastic strains typically between 5 % and 23 %, predominantly in locations of geometrical discontinuities (or even at geometric singularities). This observation applies directly to the short-term analysis and roughly the same results also apply to the creep analysis. This means that creep has no important role in the rock shear case and that the plastic and creep elongation in copper are so high that the copper overpack will manage the deformation. The insert also may experience a slight plastic deformation due to the shear load, but the effective stress remains below the ultimate tensile stress even in and around geometric discontinuities; thus no damage to the insert is expected (Raiko 2012).
If the external pressure load and the ambient temperature are high enough, a plastic deformation will take place in the copper overpack and the gap between the canister and the insert will gradually be closed. Initially, creep starts in the locations where the existing stresses are higher due to geometric concentrations in structural discontinuities or due to residual stresses. Both of these are typical secondary stresses and the peak stresses are relaxed first. When the gap is later closed due to plastic or creep deformation, the deformation and strain cannot grow further and the remaining stresses continue to relax until they reach equilibrium without causing additional strain. The creep analyses are usually made with the most conservative assumption as to both temperature and load, in other words values of T = 75 oC and p = 15 MPa are used. If one or the other of them is lower, then the creep is consequently much slower. The size of the gaps between the insert and the overpack rules the maximum amount of plastic or creep deformation and strain; thus the creeping time is an irrelevant parameter in damage analysis.
During the loading phase, the stresses in the canisters will be so low that the secondary creep rate is negligible. Not until a pressure of about 15 MPa has been reached, is the secondary creep of importance. However, the strain on loading and the primary creep can still be significant (Andersson-Östling & Sandström 2009).
Several creep analyses for canister construction have been recently published. The creeping time until the overpack contacts the canister insert may vary many orders of magnitude depending on the assumed temperature, load level and creep model. However, the maximum creep strain is always close to a constant number that only depends on the geometric shapes of the components and the sizes of gaps in the structure. One of the latest analyses of the structural creeping of the canister is discussed in Sandström & Jin (2009). The analysis assumed a temperature of 75 °C and a 15 MPa external pressure load. The result was that the insert-canister gap is closed in 10 years and that the highest creep strain was 10.6 % in a geometric concentration of a rounding in the copper lid fillet, see Figure 7-37. The creep strain in primary stress areas like in the cylinder wall without geometric concentrations was < 0.5 %.
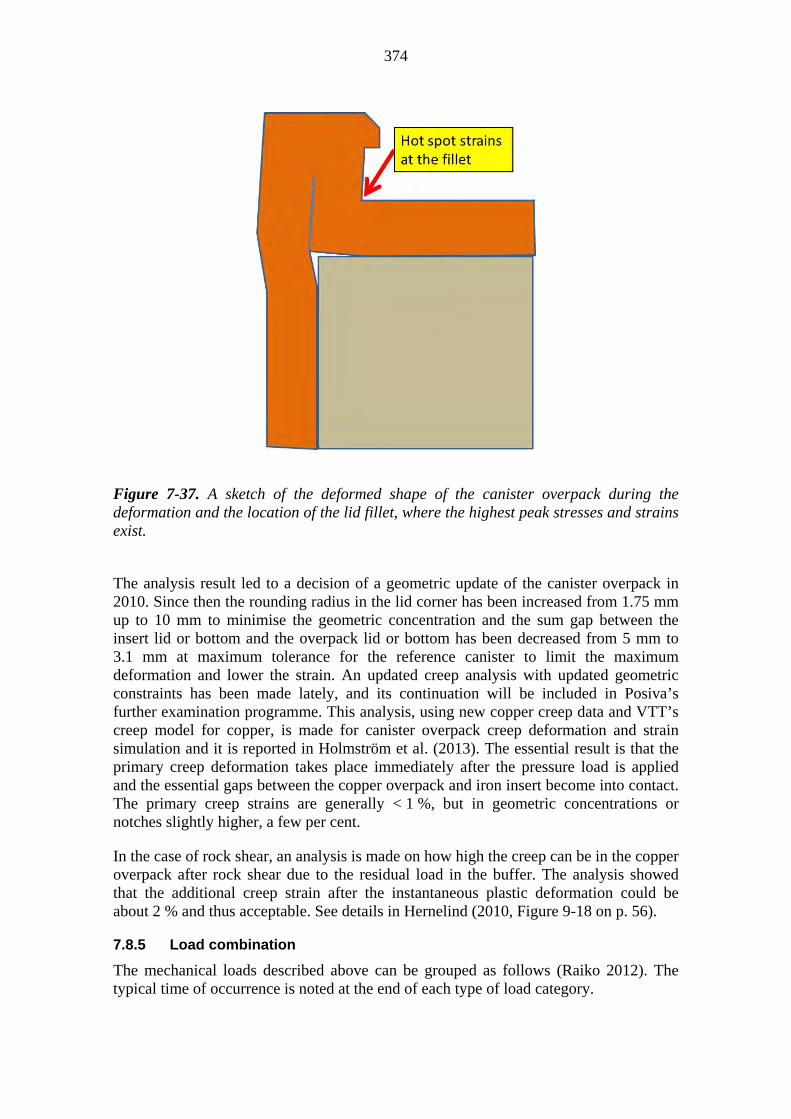
374
Figure 7-37. A sketch of the deformed shape of the canister overpack during the deformation and the location of the lid fillet, where the highest peak stresses and strains exist.
The analysis result led to a decision of a geometric update of the canister overpack in 2010. Since then the rounding radius in the lid corner has been increased from 1.75 mm up to 10 mm to minimise the geometric concentration and the sum gap between the insert lid or bottom and the overpack lid or bottom has been decreased from 5 mm to 3.1 mm at maximum tolerance for the reference canister to limit the maximum deformation and lower the strain. An updated creep analysis with updated geometric constraints has been made lately, and its continuation will be included in Posiva’s further examination programme. This analysis, using new copper creep data and VTT’s creep model for copper, is made for canister overpack creep deformation and strain simulation and it is reported in Holmström et al. (2013). The essential result is that the primary creep deformation takes place immediately after the pressure load is applied and the essential gaps between the copper overpack and iron insert become into contact. The primary creep strains are generally < 1 %, but in geometric concentrations or notches slightly higher, a few per cent.
In the case of rock shear, an analysis is made on how high the creep can be in the copper overpack after rock shear due to the residual load in the buffer. The analysis showed that the additional creep strain after the instantaneous plastic deformation could be about 2 % and thus acceptable. See details in Hernelind (2010, Figure 9-18 on p. 56).
7.8.5 Load combination
The mechanical loads described above can be grouped as follows (Raiko 2012). The typical time of occurrence is noted at the end of each type of load category.
375
1. Asymmetric loads in saturated Ca-transformed-bentonite due to manufacturing tolerances of deposition hole and of buffer density (swelling pressure difference ~7.8 MPa) (100 a−glaciation).
2. Groundwater pressure at the depth of the repository (4.1 MPa) (100 a−glaciation).
3. Glacial pressure from a 2 km thick ice sheet (20 MPa) (glaciation period).
4. Shear load due to rock displacement (5 cm, v = 1 m/s) (permafrost and glaciation period or later).
5. Combination of 1 + 2 (100 a−glaciation).
6. Combination of 1 + 3 (glaciation period).
7. Combination of 2 + 4 (before or after glaciation period).
8. Combination of 3 + 4 (glaciation period).
9. Freezing of bentonite buffer at the lowest temperature studied of -5oC (glaciation period).
The temperature of the canister copper overpack will, due to the residual heat generated from the spent nuclear fuel, stay above repository temperature for about 7000 years after deposition and then the temperature will slowly decrease to the natural temperature of the Olkiluoto bedrock (10−11 °C) within a few thousand years. Around glaciation, before or after, the canister temperature may decrease to close to 0 °C, if the cold period is long enough and there is no protecting ice or snow cover on the ground. As a design assessment exercise, the repository level temperature is assumed to go down to -5 °C. More details of the temperature evolution of the canister are given in Pastina & Hellä (2006, Chapter 6.1).
Glaciation and permafrost cannot stress the canister simultaneously, thus the approximate assessment is made only by showing that the permafrost load alone is not close to the collapse load. The appearance and combination of various basic load cases and respective temperature ranges are described in Table 7-8.

376
Tab
le 7
-8.
The
can
iste
r lo
ads
extr
acte
d fr
om p
ostu
late
d re
posi
tory
evo
luti
on.
Loa
ds t
hat
may
act
sim
ulta
neou
sly
shal
l be
com
bine
d.
Col
oure
d bo
xes
corr
espo
nd to
the
poss
ible
per
iods
for
appe
aran
ce o
f the
load
cas
e (1
…5)
in q
uest
ion
(Rai
ko 2
012)
.
Rep
osi
tory
evo
luti
on
ph
ase
The
ref
eren
ce c
limat
e ev
olut
ion
is r
efer
ence
d in
th
e te
xt in
th
is S
ectio
n
Wat
er s
atu
rati
on
0
– 10
0 a
T
emp
erat
e
100
a –
50 k
a
Per
maf
rost
Gla
ciat
ion
Su
bse
qu
ent
per
maf
rost
an
d
gla
ciat
ion
p
erio
ds
Can
iste
r te
mpe
ratu
re (
°C)
(EB
W-s
eale
d)
< 1
40/1
00 (
Fe/
Cu)
10
0/7
0 >
T >
15
15 >
T >
0*
*D
istu
rban
ce, -
5o
15 >
T >
0
15
> T
> 0
Lo
ad #
) D
efo
rmat
ion
rat
e
1) A
sym
met
ric l
oads
du
e to
une
ven
w
ater
sat
urat
ion
and
impe
rfe
ctio
ns
in
dep
ositi
on
ho
le
geo
met
ry.
No
si
mul
tane
ous
hyd
rost
atic
pre
ssur
e.
Une
ven
wat
er s
atur
atio
n ef
fect
s w
ill
deca
y la
ter
and
be
re
plac
ed
by
perm
ane
nt lo
ads
2)
and
3)
actin
g in
sa
tura
ted
cond
ition
s.
Inse
rt
Sta
tic
Wat
er s
atur
atio
n ef
fect
s ar
e as
sum
ed
to
reac
h
thei
r m
axim
um.
Loa
d 1)
ca
n
crea
te
ben
din
g lo
ads
Co
pp
er
ove
rpac
kC
ree
p or
sta
tic
Loa
d 1)
ca
n
crea
te
com
pres
sive
load
s
2)
Per
ma
nent
as
ymm
etric
lo
ads
du
e to
un
eve
n be
nton
ite
den
sity
an
d im
perf
ectio
ns
in
dep
ositi
on
ho
le g
eom
etry
. 3)
G
roun
dw
ater
h
ydro
stat
ic
pres
sure
+ e
ven
isos
tatic
sw
elli
ng
pr
essu
re o
f be
nton
ite.
Inse
rt
Sta
tic
B
end
ing
lo
ads
from
lo
ad
2)
and
co
mpr
essi
ve
isos
tatic
lo
ads
from
loa
d 3)
Loa
ds
2)
and
3)
ar
e e
xpec
ted
to
ac
t th
roug
hout
the
an
aly
sis
peri
od
Co
pp
er
ove
rpac
kC
ree
p or
sta
tic
U
neve
n pr
essu
re l
oads
fr
om
loa
d 2)
an
d
isos
tatic
lo
ads
from
lo
ad
3)
Loa
ds
2)
and
3)
ar
e e
xpec
ted
to
ac
t th
roug
hout
the
an
aly
sis
peri
od
4) G
laci
al p
ress
ure
(ad
ditio
nal
iso
-st
atic
pr
essu
re,
only
du
ring
a
gl
acia
tion)
.
Inse
rt
Sta
tic
Lo
ad
4)
will
ca
use
add
ition
al
isos
tatic
pr
essu
re
on
inse
rt
Per
maf
rost
an
d
glac
ial
cond
ition
s w
ill r
eap
pear
Co
pp
er
ove
rpac
kC
ree
p or
sta
tic
Lo
ad
4)
will
ca
use
add
ition
al
isos
tatic
pr
essu
re
on
shel
l
5) A
she
ar d
ispl
acem
ent
exc
eed
ing
5
cm a
t sh
ear
velo
city
hig
her
tha
n
1 m
/s
in
frac
ture
s in
ters
ectin
g a
ca
nist
er.
Inse
rt
Sho
rt-t
erm
forc
ed
disp
lace
men
t
Lo
ad
5)
is
of
mos
t co
ncer
n in
en
d-gl
acia
l pe
riods
Co
pp
er o
verp
ack
S
hort
-ter
m fo
rced
di
spla
cem
ent

377
7.8.6 Assessment of load definitions
Isostatic pressure loads are well defined and the existence of loads is postulated for all canisters. The maximum values of pressure are conservative over-estimates. The only thing from other engineered barriers that can have an effect on loads is the properties of the bentonite buffer. That is why it is important that the specification of buffer properties is made and controlled against the definitions used in the canister strength analyses. The bentonite material model used in the rock shear analysis is described in Börgesson et al. (2010).
Rock shear is a probabilistic load. The higher the assumed amplitude, the lower is the probability. The design rock shear case, 5 cm amplitude and 1 m/s velocity, is defined so that the probability of shears exceeding this are so low that they can be accepted. The results of the rock shear analysis in Hernelind (2010) show that the risk for material damage in canister overpack is increasingly developed with larger rock shear than 5 cm. With a shear amplitude of 10 cm, all the 5 cm copper shell thickness is strongly plasticised and material damage (penetration) is probable, see Figure 9-3 in Hernelind (2010).
The mechanical strength of the canister has been studied (Raiko 2012, Raiko et al. 2010). The loading processes are adopted from Design Basis and some of them, especially the uneven bentonite swelling cases, are further developed in Börgesson & Hernelind (2009). The canister geometry is described in detail including the manufacturing tolerances of the dimensions. The canister material properties are summarised and the broadly based materials testing programmes and model developments are referenced. In addition to the reference canister design, the canister variants and some alternative manufacturing routes are also assessed.
The combinations of various load cases are analysed and the conservative combinations are defined. The probabilities of occurrence of various load cases and combinations are also assessed for setting reasonable safety margins. The safety margins are used according to the ASME Pressure Vessel Code (ASME Section III 2008) principles for safety class 1 components.
The design basis load cases are analysed with 2D- or global 3D-finite-element models including large-deformation and non-linear material modelling and, in some cases, also creep. The integrity assessments are partly made from the stress and strain results obtained using global models and partly from fracture resistance analyses using the sub-modelling technique. The sub-model analyses utilise the deformations from the global analyses as constraints on the sub-model boundaries and more detailed finite-element meshes are defined with defects included in the models together with elastic-plastic material models. The J-integral is used as the fracture parameter for the postulated defects. The allowable defect sizes are determined using the measured fracture resistance curves of the insert iron as a reference with respective safety factors according to the ASME Pressure Vessel Code (ASME Section XI 2008) requirements.
The asymmetric loads that may exist due to the uneven wetting process during the first decades and due to density or geometry variations of the bentonite buffer, later under

378
saturated conditions were shown to cause lower straining than the dimensioning load case (Andersson-Östling & Sandström 2009).
Based on the BWR canister analyses, the following conclusions can be drawn. The 45 MPa isostatic pressure load case (that exceeds by 15 % the design pressure of 39 MPa at the Olkiluoto site) shows very robust and clear results in that the risk for global collapse is vanishingly small (10-50) according to Raiko et al. (2010, Section 6.1.2). Further, the copper overpack will remain intact after such expected events despite the need to take a number of worst case events into account. In addition to postulated loads, also a disturbance scenario of freezing of bentonite buffer down to -5 °C during permafrost has been analysed and shown not to be critical for the mechanical strength of a canister.
For the shear load case, the stresses and strains in the canister are high, depending on the shear amplitude, shear angle and the intersection point. The canister dimensioning shear load case for the insert is shown to be perpendicular to the canister’s main axis at about ¾ of its length, whereas the design dimensioning case for the copper overpack is an angle of 22.5° to the main axis. These dimensioning loads are shown to be cautious.
The damage tolerance analyses (Dillström & Bolinder 2010, Dillström et al. 2010) for the different load cases lead to a number of requirements on the inspection of the insert, where the most rigorous requirements are derived from the shear load case. The inspection requirements from the 45 MPa isostatic pressure case are however more modest. The rock shear case is the design basis case for the insert. The allowable fault sizes are determined according to code practises for nuclear power components. For the copper overpack, it is important to avoid even smaller impact damage or other cold work in the regions of the bottom and lid in order not to jeopardise the creep ductility, this most likely needs to be confirmed by appropriate inspections. The lifting safety puts very modest requirements on the inspection of the lifting flange.
The resulting allowable crack sizes from damage tolerance analyses are set as acceptance criteria for the quality control programme of canister manufacture and sealing. This will validate the initial condition of the canister so that it is capable of withstanding the postulated loads and load combinations with a high probability through the specified time frame.
By using both established methods, and some newly developed analysis methods (e.g. for creep), it is shown that the reference BWR canister can withstand all given load cases in the design basis with moderate safety factors. The canister has also been shown to have a good tolerance against material defects (Raiko et al. 2010, Section 8.3.3). The creep of iron at relevant temperatures can be ignored for the reasons given in Martinsson et al. (2010).
7.8.7 Summary, uncertainties and issues that need propagation
For the time after the first 10,000 years after disposal, it is very likely that the canister will remain intact, i.e. meet all its performance targets, for all conceivable loads. The only potential exception from this would be in the case of a rock shear displacement in excess of 5 cm. Even though the canister may withstand even larger loads than a 5 cm displacement, it is assumed that the canister would fail if this were to happen.
379
There is some uncertainty in the evolution of the bentonite mechanical properties used in the rock shear calculations. To overcome such uncertainty, a large conservatism in bentonite modelling was applied by conservatively using the maximum density of the bentonite, 2050 kg/m3 in all rock shear analyses, which is a much more severe assumption than the expected 2000 kg/m3 density. Namely, the stiffness or shear strength of bentonite increased with the swelling pressure, and the strength of bentonite corresponds with the maximum load transferred from the rock to the canister. Long-term copper creep does not occur during this time frame because the gap between the canister overpack and the insert is already closed due to the external pressure loads.
7.9 Subcriticality
In the long term, changes in the initial state geometry are to be taken into account to assess the criticality status. In the case of a breached canister and water penetration, the formation of magnetite due to iron corrosion will decrease the water content because of the increase in the volume of corrosion products. If magnetite is formed, hydrogen is released. This hydrogen will redistribute within or be lost from the canister. Magnetite and hydrogen formation could increase or decrease neutron moderation and so increase or decrease reactivity. Furthermore, corrosion of the insert will modify the spatial distribution of the fuel rods, in some cases increasing their distance (hence decreasing the criticality potential) and in some cases approaching them, which could lead to an increase in criticality potential because there is increased interaction between the fuel rods. Furthermore, the stable and long-lived nuclides (neutron absorbers) that are taken into account when the burn-up credit is applied may dissolve and diffuse out of the canister faster than the neutron-generating nuclides, which would further increase the reactivity. The distribution of fissile material, neutron absorbers, hydrogen, magnetite, water and void spaces has to be more thoroughly assessed to determine whether there is potential for a criticality event in the case of insert corrosion.
At the end of e.g. a glaciation post-glacial earthquakes may trigger rock shear to cause canister failure. In this case, the potential for out-of-canister criticality events caused by the transport (e.g. by diffusion) and reaccumulation (e.g. by precipitation) of radionuclides in the buffer, backfill or geosphere have also been assessed (SKB 2010c, Section 2.1.3). It was concluded that the criticality due to uranium outside the canister would require dissolution and transport of uranium under oxidising conditions and subsequent deposition of uranium under reducing conditions. There is no credible mechanism to achieve both oxidising and reducing conditions in the near-field of the repository in the long term. Out-of-canister criticality due to plutonium was also shown to be improbable due to the lack of any mechanism to mobilise and transport plutonium away from the fuel and then accumulate it in a critical configuration. For these reasons, all out-of-canister criticality events are considered to have a vanishingly small probability, although the initial assumptions are being verified. Nonetheless, the issue of long-term criticality is still under investigation, but for the time being it is not forwarded to the formulation of release scenarios.
380
7.10 Summary
7.10.1 Summary of system evolution
In the long term, i.e. over the next 100,000 years, it is expected that major climatic events being part of the expected climate evolution, including permafrost, glaciations and sea-level changes, may occur. These changes may affect the host rock conditions, for example groundwater flow and composition, which in turn affect the performance of the closure, backfill, buffer and canister as is assessed in the subsections below.
Hydraulic and geochemical evolution of geosphere
The long-term hydrogeological and hydrogeochemical evolution is affected by the assumptions on the future climate evolution. According to the climate evolution specified in Chapter 4, a temperate period is assumed to last for 50,000 years, followed by a cold period with permafrost and glaciations alternating.
During the continued temperate climate up to 50,000 years AP, there is a slight increase in the groundwater flow rates in the upper part of the bedrock, due to surface environment changes. The flow rates at repository depth are not significantly affected. Under permafrost conditions, the hydraulic conductivity in the rock is reduced by several orders of magnitude and the infiltration is very low. During ice-sheet retreat, the flow rates through the repository volume and the flow direction depend on the location of the ice margin with respect to the repository. While the repository is still below the ice sheet but the ice margin is close, the flow rates are significantly increased (by a factor of 4 to 7) and directed downwards. As the ice passes the site, the main flow direction is upwards and flow rates reduce as the distance to the ice margin increases.
Concerning groundwater flow, the target properties are expected to be fulfilled over the considered time frame. The fraction of the canister positions intersected by a fracture with an initial flow rate above 10-3 m3/(m·a) remains low (about 10 % of all the potential canister positions with no inflow criteria applied) during the temperate period. There is an increase to 20 % of canister positions during an ice-sheet retreat when the ice margin is located close to the site. During the permafrost period, the groundwater flow is reduced. During the high flow conditions related to ice-sheet retreat, when the repository is still under the ice sheet (mobile ice sheet 10 years), there is a significant increase in potential deposition hole locations having a transport resistance in the range of 3·104 to 106 a/m, but transport resistances below 104 a/m remain exceptional.
During the continued temperate period, the infiltration of meteoric water at a slow, nearly constant rate results in a decreasing trend in salinity. The modelling results show that towards the end of this period, a few percent of the canister positions may experience dilute conditions. Dilute conditions may also be experienced during ice-sheet retreat, but the estimate of the number of such positions is strongly dependent on the possible duration of the melt water intrusion and especially on the modelling concept of the interaction between the fracture water and the rock matrix. On the other hand, site evidence supports that dilute meltwater has not reached repository depth. However, related to these uncertainties, as part of the scenario development, cases where deposition hole locations are assumed to experience dilute conditions are studied.
381
Similarly to the salinity results, also other key geochemical properties (i.e. pH, Eh, Cl, sum of cations and sulphur and iron species) are expected to stay within the limits established for the target properties during ice-sheet retreat and melting phase. Oxygen is expected to be consumed within short distances along the flow path and thus not to reach the repository level.
Rock mechanics
The possibility of a large earthquake leading to canister failure due to secondary movements on fractures, especially at a time of ice-sheet retreat, cannot totally be excluded. It is estimated that few tens of canisters are in positions such that they could potentially fail in such an event. This estimation is pessimistic in the sense that the distance to the earthquake hosting zone is not accounted for, on the other hand some of the deposition holes may be relatively close to the deformation zones. The average annual probability of the an earthquake leading to a canister failure is estimated to be low, in the order of 10-7, given that there are around 5 zones that could host such an earthquake. Therefore, during the first glacial cycle, the probability of occurrence of such an earthquake is low. Locating the deposition holes away from large deformation zones and avoiding large fracture intersections in deposition holes will further decrease the likelihood of damaging shear movements.
Freezing/thawing of buffer and backfill
The potential for freezing of the buffer or the deposition tunnel backfill is not an issue that would jeopardise the performance of these barriers, since permafrost will not reach repository depth (Hartikainen 2006, 2013), and even if the freezing front were to reach repository depth, the materials, and design selected for the buffer and backfill would withstand freeze/thaw cycles without damage to their safety functions.
The stability of clay materials against freeze-thaw cycles also implies that the performance targets would uphold also for more extreme and less likely climate evolutions.
Geochemical evolution of buffer and backfill
The evolution of porewater salinities in the buffer and backfill will follow those in the surrounding groundwaters, which will remain within the required performance target ranges except perhaps during short times within the ice retreat and melting period. Under these conditions, dilute groundwater conditions may favour “chemical” erosion of buffer and backfill. The conditions at all times will most likely remain reducing, but under dilute conditions with low inputs of organic carbon, they will be less reducing, thus not favourable for sulphate reduction in the buffer. In the backfill, however, with its large organic pool, sulphate reduction might continue also under dilute conditions.
Ongoing degradation of cementitious materials will gradually release less aggressive leachates, whose effects on the clays in the near field will generally be very limited. Changing hydraulic conditions and freezing induced by glaciation effects however may locally increase the release of cement leachates.
From a thermodynamic viewpoint, the persistence and longevity of montmorillonite, and in low temperate environments, is uncertain, mainly because of the lack of reliable
382
thermodynamic and experimental data. However, slow kinetics and especially observations from natural systems indicate long-term persistence of montmorillonite at low temperatures over a large range of geochemical conditions.
Copper corrosion is not expected to affect the performance targets of the buffer, as is indicated from experimental and geological observations.
Chemical erosion of buffer and backfill
Although there are arguments that suggest that penetration of low ionic strength water to repository depth will probably not occur, the occurrence of dilute conditions at repository depth and the consequent possibility of chemical erosion of the buffer and backfill have been considered. With a reference set of assumptions concerning groundwater flow and the evolution of groundwater composition (ionic strength), only one deposition hole is calculated to experience advective conditions after the first glacial cycle. However, considering the uncertainties, the analysis suggests that, during the first glacial cycle, chemical erosion could result in advective conditions in a small number of canister positions. 3 canister positions are calculated to experience advective conditions after the first glacial cycle based on the more pessimistic, variant case presented here, assuming the application of RSC criteria. Without the application of RSC, the number of positions calculated to experience advective conditions after the first glacial cycle increases slightly in the variant case (up to 13 positions), but remains the same (one position) in the case of the reference assumptions.
The numbers of deposition holes that may experience advective conditions depend on a number of uncertain factors including:
Whether sufficiently dilute conditions are attained and for how long;
Groundwater flow distribution;
Model for chemical erosion;
Threshold values for buffer and backfill loss before advective conditions are attained.
The potential consequences of the establishment of advective conditions for canister corrosion are also considered, as summarised below.
Evolution of the closure components
As shown above, the backfill in the central tunnels will, after 10,000 years, be completely saturated and keep its safety functions regardless of the consequences of climate evolution. For the upper parts of the closure, it is concluded that:
It cannot be excluded that the backfill in parts of the access tunnel will lose its swelling clay components due to chemical erosion over the large time scale considered. However, this is not judged to jeopardise the overall safety function of the closure backfill in particular and of the closure components, as a whole.
Degradation of closure plugs is uncertain, but can be pessimistically assumed to have happened over the assessment period of 100,000 years. However, gravitational
383
sealing will ensure low permeability through the access tunnel and other spaces filled with closure materials.
Freezing/thawing of the closure components would not impair their performance relative to the closure performance targets. The access tunnel and shafts between depths of 200 and 300 m backfilled with in situ compacted swelling clay-aggregate mixture may, in the far future, be subject to freeze/thaw cycles, but this will have no major implications for the performance of the material. The material filling the access tunnel and shafts above 200 m depth is in situ compacted crushed rock. If frost heave develops, it will be of minor consequence, if the crushed rock material is selected appropriately. Glacial erosion may have an effect on materials in the upper part of the disposal facility, but the erosion rate, even during glacial cycles is so slow that it would take several millions of years to erode the upper plugs and the material underneath.
Canister corrosion
During the long-term evolution, no canister failures are expected, if the buffer performs as designed, even with high sulphide concentrations. The overall corrosion depth will not exceed a few tenths of mm during the first glacial cycle.
Even if infiltration of dilute groundwater leads to chemical erosion of the buffer and to the eventual establishment of advective conditions in less favourably located deposition holes, no canister failures are likely to occur within the first glacial cycle. This conclusion is based on a reference set of assumptions and the cautious assumption of 3 mg/L of sulphide in groundwater. A few canister failures (up to three in the calculations presented here), may, however, occur if more pessimistic assumptions are made concerning the canister wall thickness, the copper corrosion area, fracture aperture, high flows and duration of dilute conditions during glaciations. The actual number of failed canister depends strongly on the assumptions made about the evolution of groundwater flow and ionic strength and about the relationship between fracture apertures and transmissivity, and is also affected by the uncertainties inherent in buffer erosion modelling.
The possibility of canister failure due to corrosion following chemical erosion of the buffer, and the consequent release of radionuclides, is considered in Formulation of Radionuclide Release Scenarios.
Mechanical impacts on the canister
During the first glacial cycle, it is very likely that the canister will remain intact, i.e. meet all its performance targets, for all conceivable mechanical loads. The only potential exception from this would be if a rock shear in excess of 5 cm were to occur. Even though the canister may withstand even larger loads than 5 cm shear, it is assumed that the canister fails if such a load were to happen. No copper creep is expected during this time frame because there is no gap between the copper overpack and the insert (i.e. the copper overpack cannot be further deformed).

384
Subcriticality
After canister failure, the probability of criticality is under investigation in the case of insert corrosion; in the case of canister breach due to rock shear, the likelihood of redistributing the fissile material in a critical configuration is assumed negligible. For the time being criticality is not forwarded to the formulation of release scenarios.
7.10.2 “State” of components with regard to safety functions and performance targets
After the first glacial cycle, i.e. more than 100,000 years after repository closure, the state of most components will still conform to the performance targets. However, there are some incidental deviations:
The groundwater flow related target properties are expected to be fulfilled over the considered time frame for most deposition holes. The fraction of the canister positions with a flow rate above 10-3 m3/(m·a) remains low (about 10 % of all the potential canister positions with no inflow criteria applied) during the temperate period. There is an increase to 20 % during ice-sheet retreat, when the ice margin is located close to the site. During the permafrost period, the groundwater flow is reduced. During the high flow conditions related to the ice-sheet retreat, when the repository is still under the ice sheet (mobile ice sheet 10 years), there is a significant increase in potential deposition hole locations having a transport resistance in the range of 3·104 to 106 a/m, but transport resistances below 104 a/m remain exceptional.
During the continued temperate period, the infiltration of meteoric water at a slow, nearly constant rate results in a decreasing trend in salinity. The modelling results show that towards the end of this period, a few percent of the canister positions may experience dilute conditions. Dilute conditions may also be experienced during ice-sheet retreat, but the estimate of the number of such positions is strongly dependent on the possible duration of the melt water intrusion and especially on the modelling concept of the interaction between the fracture water and the rock matrix.
Although the groundwater data clearly indicate sulphide values below 1 mg/L, a pessimistic upper bound of 3 mg/L is adopted for corrosion calculations, which accounts for the possible solubility control by the more soluble amorphous iron sulphide in combination with the kinetically constrained availability of iron and the uncertainties related to microbial activity and availability of nutrients and energy sources.
The possibility of a large earthquake leading to canister failure due to secondary movements on fractures, especially at a time of ice-sheet retreat, cannot totally be excluded. It is estimated that few tens of canisters are in positions such that they could potentially fail in such an event. The average annual probability of the an earthquake leading to a canister failure is estimated to be low, in the order of 10-7, given that there are around 5 zones that could host such an earthquake. Therefore, during the first glacial cycle, the probability of occurrence of such an earthquake is low.
Chemical erosion due to the potential occurrence of dilute groundwater cannot be neglected. The analysis suggests that for the reference case, only one deposition

385
hole position out of the 5391 potential positions considered will experience advective conditions due to buffer erosion during the first glacial cycle. Using more pessimistic variant assumptions, this erosion could result in advective conditions in up to around 3 canister positions. Without the application of RSC, the number of positions with advective conditions after the first glacial cycle would increase slightly, with a calculated maximum number of 13. It is also shown that the backfill never reaches the mass loss threshold to induce advective conditions in the buffer.
During the first glacial cycle, in the reference case there is no canister failure due to corrosion because the concentration of groundwater sulphide needed to corrode the canister wall is more than a factor of 3 higher than the pessimistic estimate of groundwater sulphide (3 mg/L, see above). It is expected that, in most of the deposition holes, the groundwater sulphide concentration will be no more than about 1 mg/L (see above) and therefore most of the canisters would be intact throughout the first few glacial cycles even in the case of buffer erosion and considering various uncertainties in the flow and duration of dilute conditions. If the groundwater sulphide concentration is higher than 1 mg/L, variant 1 predicts about 1−3 canister failures over the first glacial cycle.
7.10.3 Assessment whether all FEPs relevant in long term and FEP interactions
have been assessed
All the relevant evolution FEPs during the long-term evolution up to the end of the next glacial cycle have been taken into account in assessing the performance of the repository system (i.e., stress redistribution, rock-water interaction, reactivation-displacements along existing fractures (i.e. rock shear); montmorillonite transformation, alteration of accessory minerals, chemical and physical degradation, freezing and thawing of the buffer, backfill, and closure components, chemical erosion; corrosion of the copper overpack; deformation); one of the most important migration-related FEP (Features, Events and Processes), groundwater flow and advective transport is accounted for through all the assessment as it is coupled to heat transfer and rock-water interactions and thus to the evolution of the whole repository system. Note that the consequences of permafrost formation are taken into account, and that permafrost formation and related modelling are dealt with in Hartikainen (2013).

386
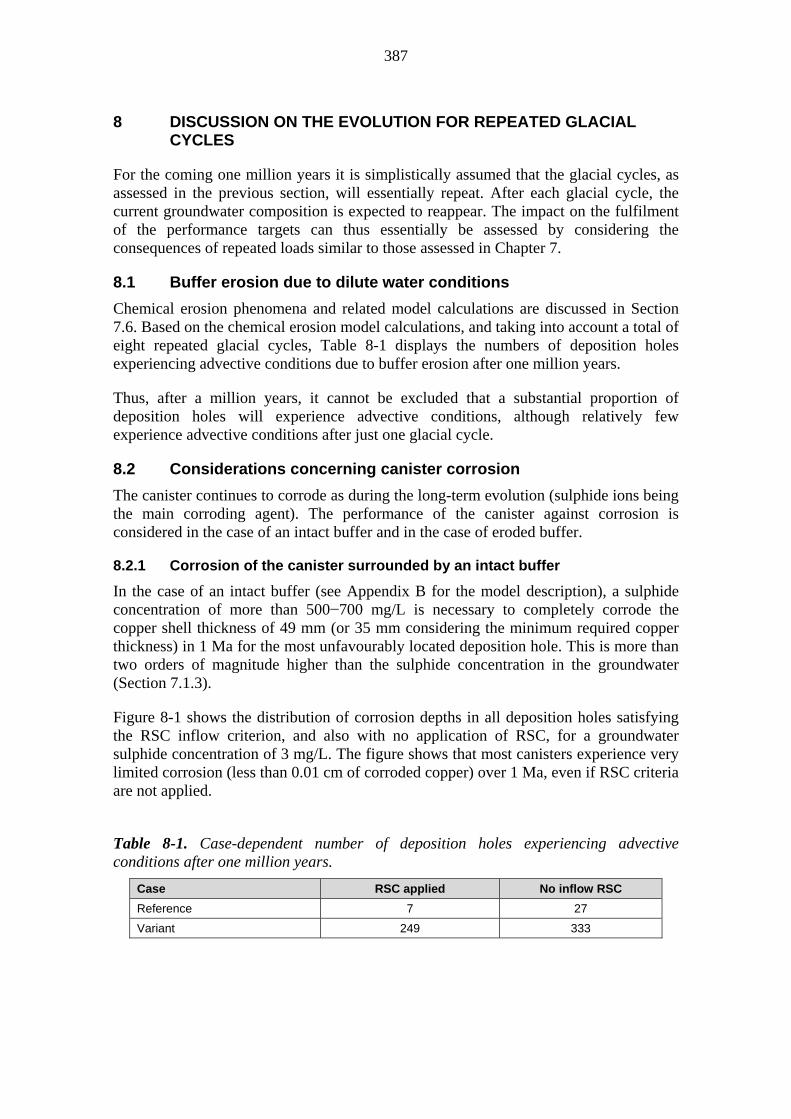
387
8 DISCUSSION ON THE EVOLUTION FOR REPEATED GLACIAL CYCLES
For the coming one million years it is simplistically assumed that the glacial cycles, as assessed in the previous section, will essentially repeat. After each glacial cycle, the current groundwater composition is expected to reappear. The impact on the fulfilment of the performance targets can thus essentially be assessed by considering the consequences of repeated loads similar to those assessed in Chapter 7.
8.1 Buffer erosion due to dilute water conditions
Chemical erosion phenomena and related model calculations are discussed in Section 7.6. Based on the chemical erosion model calculations, and taking into account a total of eight repeated glacial cycles, Table 8-1 displays the numbers of deposition holes experiencing advective conditions due to buffer erosion after one million years.
Thus, after a million years, it cannot be excluded that a substantial proportion of deposition holes will experience advective conditions, although relatively few experience advective conditions after just one glacial cycle.
8.2 Considerations concerning canister corrosion
The canister continues to corrode as during the long-term evolution (sulphide ions being the main corroding agent). The performance of the canister against corrosion is considered in the case of an intact buffer and in the case of eroded buffer.
8.2.1 Corrosion of the canister surrounded by an intact buffer
In the case of an intact buffer (see Appendix B for the model description), a sulphide concentration of more than 500−700 mg/L is necessary to completely corrode the copper shell thickness of 49 mm (or 35 mm considering the minimum required copper thickness) in 1 Ma for the most unfavourably located deposition hole. This is more than two orders of magnitude higher than the sulphide concentration in the groundwater (Section 7.1.3).
Figure 8-1 shows the distribution of corrosion depths in all deposition holes satisfying the RSC inflow criterion, and also with no application of RSC, for a groundwater sulphide concentration of 3 mg/L. The figure shows that most canisters experience very limited corrosion (less than 0.01 cm of corroded copper) over 1 Ma, even if RSC criteria are not applied.
Table 8-1. Case-dependent number of deposition holes experiencing advective conditions after one million years.
Case RSC applied No inflow RSC
Reference 7 27
Variant 249 333
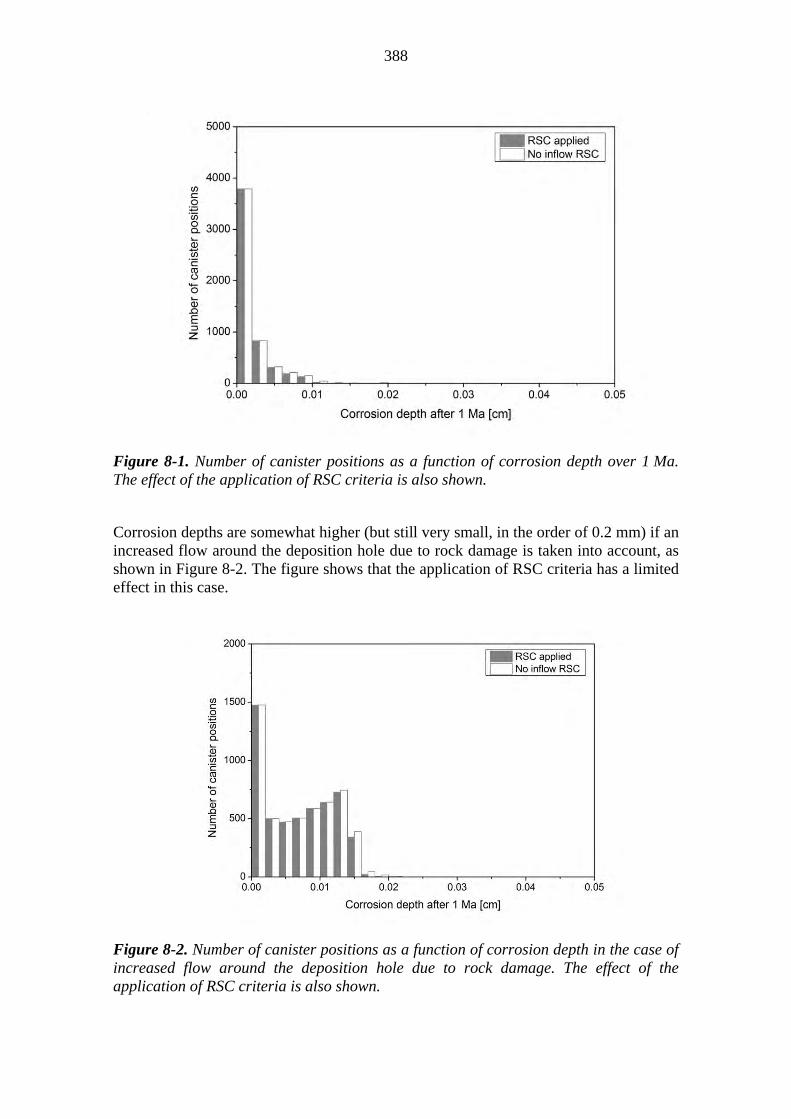
388
Figure 8-1. Number of canister positions as a function of corrosion depth over 1 Ma. The effect of the application of RSC criteria is also shown.
Corrosion depths are somewhat higher (but still very small, in the order of 0.2 mm) if an increased flow around the deposition hole due to rock damage is taken into account, as shown in Figure 8-2. The figure shows that the application of RSC criteria has a limited effect in this case.
Figure 8-2. Number of canister positions as a function of corrosion depth in the case of increased flow around the deposition hole due to rock damage. The effect of the application of RSC criteria is also shown.

389
Figure 8-3. Number of canister positions as a function of corrosion depth in the case of downward diffusion of sulphide from the deposition tunnel. The effect of the application of RSC criteria is also shown along with the limiting corrosion depth for high groundwater flow in the deposition tunnel (vertical dashed line). The assumed groundwater sulphide concentration is 3 mg/L.
Figure 8-3 shows the corrosion depth distribution assuming downward diffusion of sulphide from the deposition tunnel, again with a 3 mg/L sulphide concentration assumed.
In Figure 8-3, the limited flow of water in the tunnel above each hole is taken into account (as explained in Appendix B). The limiting corrosion depth in the case of a very high flow in the tunnel (such that there is 3 mg/L sulphide at the buffer/backfill interface) is also shown and it is about 0.35 mm, which is negligible compared with the thickness of the copper wall (pessimistically assumed to be 35 mm).
In summary, if the buffer remains intact, no canister failures are expected within 1 Ma even in the most unfavourable canister locations and even in case of increased flow due to rock damage or due to downward diffusion of sulphide from the backfill.
8.2.2 Canister corrosion in the case of a partially eroded buffer
Figure 8-4 shows the number of failed canisters as a function of sulphide concentration. The figure shows that if the reference assumptions are used for fracture aperture, buffer mass loss threshold being 1200 kg, 4 canister failures are expected over 1 Ma if the sulphide concentration is higher than 0.1 mg/L (see Figure 8-4, bottom). Considering the minimum canister thickness of 35 mm only increases the number of canister failures to 5 over the assessment period.
The upper part of the figure shows that if the variant assumptions concerning the flow and buffer erosion, as defined in Table 7-5, are considered, the number of canister

390
failures increases remarkably from 150 to over 200 failures over 1 Ma, depending on the canister thickness (35 mm vs. 49 mm) or flow and duration of dilution conditions assumptions.
The upper figure also shows that these variant assumptions on flow and buffer erosion have an impact if the sulphide concentration in groundwater is above 1 mg/L, which is clearly above the expected steady-state concentration in the groundwater (Section 6.1.3).
There is also uncertainty concerning corrosion due to sulphide produced by sulphate reducing bacteria in the buffer and backfill, in particular at the time of ice-sheet retreat and melting. Considering the various sources of uncertainties (e.g. availability of nutrients and energy sources to the SRB), SKB estimated that the corrosion depth from microbial activity would be less than 3 mm in 1 Ma, pessimistically assuming the organic material in the backfill is in a form available for SRB (SKB 2010c, Section 5.3.2).
Given the high uncertainties over this long time period, the effects of groundwater flow coupled with buffer erosion and potential sources of microbial sulphide production ultimately leading to canister failure are considered in the formulation of release scenarios.
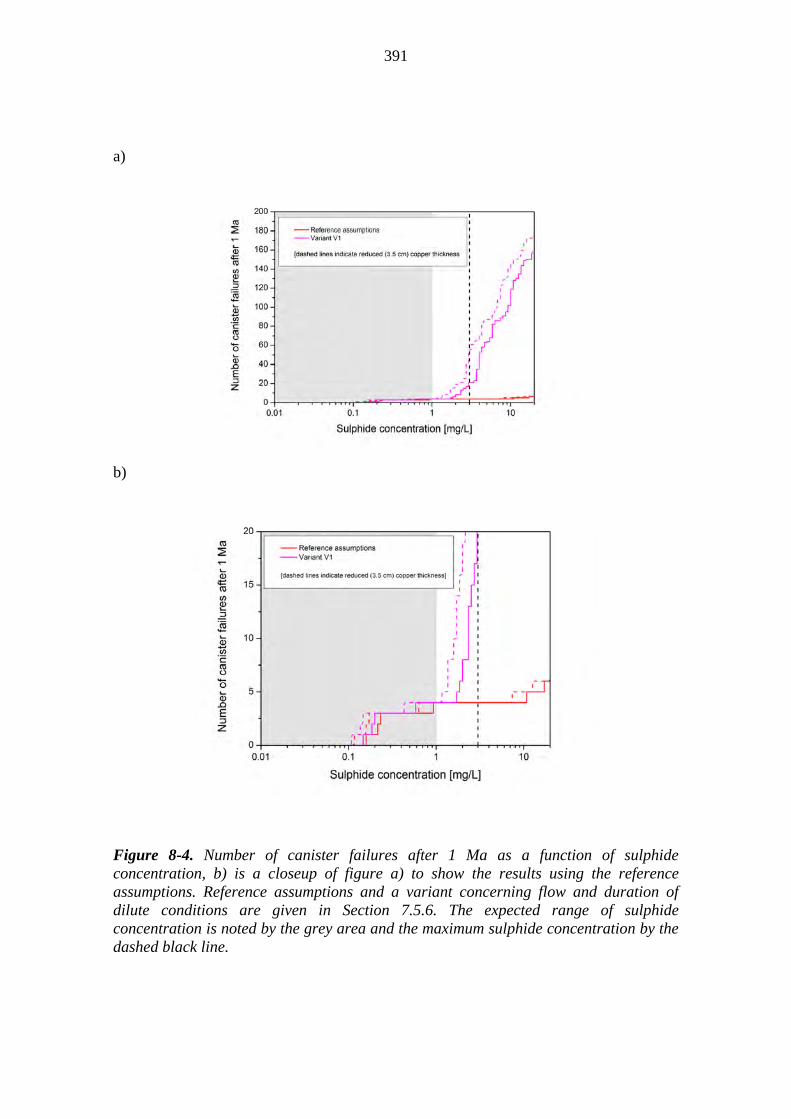
391
a)
b)
Figure 8-4. Number of canister failures after 1 Ma as a function of sulphide concentration, b) is a closeup of figure a) to show the results using the reference assumptions. Reference assumptions and a variant concerning flow and duration of dilute conditions are given in Section 7.5.6. The expected range of sulphide concentration is noted by the grey area and the maximum sulphide concentration by the dashed black line.

392
8.2.3 Corrosion from additional potential processes
The same corrosion processes as considered in the earlier periods will continue, if the chemical conditions near the canister allow for it.
Recently, Hultquist and co-workers have published several papers suggesting the generation of hydrogen due to the corrosion of copper in water (Hultquist et al. 2008, Szakálos et al. 2007). These researchers suggest that a previously unknown copper hydroxy-compound is formed when copper corrodes in pure water in the absence of O2. As a consequence, it is suggested that copper corrodes with the evolution of H2, with an equilibrium H2 partial pressure of approximately 0.001 atm at 70−80 C. King (2010) carried out a critical review of the literature and concluded that the scientific evidence for this mechanism is still weak and that, even if it were to happen, it would be a self-limiting process because the repository can be considered an almost completely closed system in which hydrogen is able to build up and suppress corrosion (King 2010, Section 3.6). The corrosion rate would then be determined by the rate of diffusion of H2 away from the container.
Bojinov et al. (2010) carried out electrochemical measurements and used a kinetic model to interpret the results. The authors argue that in anoxic and neutral conditions the copper surface is partly covered by adsorbed intermediate species. They propose that hydrogen evolution is catalysed by a CuOH intermediate formed both by chemical interaction of Cu with adsorbed OH and reduction of Cu(II) containing species. The authors concluded that most part of the CuOH intermediate has been produced by reduction of Cu(II) species and that the CuOH compound catalyses H2 production by decomposing water without being directly involved with the corrosion of copper. King & Lilja (2011) critically reviewed the evidence for and against the claim that water oxidises copper, and discussed the implications for canister lifetimes even if the proposed mechanism is correct. SKB (2010c), using a mass balance approach, estimated that, even if copper corrosion by water were to happen, the corrosion depth would be 1.7 micrometres over 1 Ma, based on the maximum amount of hydrogen that can be trapped in the vicinity of the canister in unsaturated buffer. The corrosion depth that SKB estimated using mass transport limited by diffusion was 3.1 mm for the deposition holes with the highest flow rates (SKB 2010c, Section 5.4).
MacDonald & Sharifi-Asl (2011) demonstrated that copper is thermodynamically unstable only in pure anoxic water with very low concentrations of Cu+ and very low partial pressures of hydrogen gas (10-14 atm). The H2 partial pressure in the normal atmosphere is higher than this value as well as the partial pressure of dissolved hydrogen gas in the groundwater at Olkiluoto, and corrosion of steel components in the repository will result in a H2 partial pressure >10-14 atm in the repository. Further work is ongoing to determine whether H2 is able to migrate away from the copper surface and hence affect the thermodynamic equilibria.
Becker & Hermansson (2011) carr//ied out experimental studies of copper corrosion in pure anoxic water in order to reproduce Hultquist’s and Szakálos’ results. Hydrogen formation was observed in their conditions, although the mechanism is not yet explained. The total amount of hydrogen detected after the test is lower than what
393
would be possible with respect to the copper amounts found in the test solutions after the experiments. The same observation was made in previous experiments mentioned above. In addition, in this work, the test solutions were shown to contain unexpected amounts of metals, which might be related to the observation of hydrogen. A similar experiment on copper corrosion in pure anoxic conditions is ongoing at VTT but the results have not yet been reported. As acknowledged by both research groups, the main challenge of these experiments is to eliminate all traces of O2 and other impurities that could explain the formation of hydrogen. Johansson & Brink (2012) performed a literature review on the mechanism and energetic of surface reactions at the copper-water interface which sheds additional light on surface reactions and the proposed mechanism of copper corrosion in anoxic water. They concluded that the H2 detected by Hultquist et al. (2008) is likely to originate from surface oxidation and passivation reactions in which the H2O molecule is cleaved and H2 forms until the surface is passivated. The reactivity of copper oxide films against water remains to be investigated. The current state of the knowledge about copper corrosion in anoxic water is that, even if it is thermodynamically possible, no conclusions about the copper behaviour in repository conditions can be drawn. The rate of corrosion will be affected by the thermodynamic driving force associated with hydrogen gas formation and hydrogen mobility in the near field but this has not yet been addressed (Becker & Hermansson 2011). Both Posiva and SKB are actively engaged in ongoing research and development on the topic to interpret the experimental results reported in the literature. In summary, no known process gives a corrosion depth larger than a few mm over one million years. As SKB noted, the corrosion depths from the different processes should not simply be summed, as their combination requires a far more detailed chemical analysis (as well as statistical analysis regarding the flow and sulphide distributions), but, even if they are cautiously added, the sum is still less than 5 mm even after 1 Ma (SKB 2010c, Chapter 6). 8.3 Rock shear movements
During subsequent glacial cycles, the loading and unloading caused by the building-up and retreat of the ice sheet is expected to cause similar changes to the stress field as during the first glacial cycle. Consequently, there will be periods when some faults, depending on the stress field, may become unstable and especially the possibility for post-glacial faulting in connection with deglaciation cannot be ruled out (see Section 7.2).
Fälth et al. (2010, Appendix C) have studied the effects of multiple earthquakes on induced fracture slip. The studied cases have included multiple earthquakes on one individual fault as well as earthquakes on different faults. The repeated earthquakes are assumed to take place either during the same period of instability or different periods of instability (however, during a single glacial cycle). In the simulations, the fractures have been 200 m to 600 m away from the primary faults. Based on the modelling results, Fälth et al. (2010, p. 167) conclude that multiple earthquakes will not increase the
394
fracture probability to slip more than 5 cm compared to the probability of such a displacement in one single earthquake. The main reason for this observation is that, in the modelling, a single large earthquake releases as much energy as theoretically possible and thus partitioning the energy release between earthquakes of smaller magnitude will not increase the maximum induced shear displacement in the fractures. On the contrary, Fälth et al. (2010, p. 167) conclude that:
Fractures that slipped in the first earthquake will be relatively more stable when the next earthquake occurs;
It is unlikely that the same individual fracture will be subject to the largest possible slip twice unless the earthquakes are identical with the same hypocentre location;
It is unlikely that the two slip vectors are exactly parallel.
Further, in the case in which there is a long period of time between rock shear events, the buffer will have time to homogenise and the buffer-canister system may be considered as effectively undisturbed at the time of the second earthquake. It is estimated that the stress relaxation due to a single earthquake is in the order of several MPa (see Fälth et al. 2010, p. 163) and as the tectonic strain rate is low to compensate for the loss of stored strain energy, it will take about 500,000 years before a second earthquake is possible within 1−2 km from the site (see Section 7.2 and SKB 2011, p. 469). Therefore, it can be estimated that for several (approximately four) glacial cycles, the expected canister failure rate due to rock shear is of a similar order of magnitude as during the first glacial cycle (see Section 7.2). Even after that, due to the low probability of large earthquakes and as fracture propagation is limited (see discussion in Section 7.2), the same sub-set of fractures is likely to be reactivated, keeping the canister failure rate low.
8.4 Mechanical impact on the canister
Concerning the periodic isostatic pressure load from ice sheet formation during repeated glacial cycles, this load does not have the potential to cause additional canister creep. This is because the gap between the canister overpack and the insert is closed and the insert prevents any further deformation of the copper overpack.
8.5 Sub-criticality
The reactivity of the spent nuclear fuel is almost constant throughout the 1 Ma assessment period from a criticality point of view due to the very long half life of U-235 (7·108 years). It is however expected that the fuel will remain subcritical throughout the 1 Ma time period because of the low likelihood of dynamic events (e.g. rock shear) that could modify the geometry of the fissile material in such a way that criticality could increase. In the case of canister breach and water penetration, the effect of insert corrosion on criticality is currently being analysed. The consequences of a potential long-term criticality event are also under investigation. Even in the case of a criticality event that concerns only one canister, the consequences would likely be a series of cyclic events, much like the cyclic criticality events in Oklo with limited consequences and limited transport of radionuclides in the near field (Oversby 1996, 1998).
395
8.6 Summary
For the coming one million years, it is assumed that glacial cycles, will essentially repeat 8 times. During the temperate period of each glacial cycle, the current groundwater composition is expected to reappear. The impact on the fulfilment of the performance targets can thus essentially be assessed by considering the consequences of repeated loads similar to those assessed in the previous section.
Also in the one million year perspective, the components mostly still meet their performance targets. The incidental deviations are essentially the same as after the first glacial cycle, i.e.:
The groundwater flow target properties are expected to be fulfilled over one million years for most deposition holes. As described in Chapter 7, during a glacial cycle low flow rates during temperate periods are followed by very low flows during permafrost periods and when the site is covered by a cold-based ice sheet. During ice-sheet growth the flow is reduced due to the gradually increasing isostatic pressure as ice sheet may compress or close fractures. Higher flow rates may occur in connection with a warm-based ice sheet, especially high gradients can develop when the ice margin is located near the site. A period of submerged conditions is likely to follow the ice-sheet retreat. As result of the crustal uplift, similar conditions with the topographic gradients and density variation as the main drivers for the groundwater flow as today will develop. The pattern of evolution of the flow conditions is expected to repeat at each glacial cycle because changes in hydraulic gradients with time are assumed to similar.
During each temperate period of a glacial cycle, the infiltration of meteoric water at a slow, nearly constant rate results in a decreasing trend in salinity. According to the modelling results, after a few tens of thousands of years of temperate conditions some of the canister positions may experience dilute conditions. Dilute conditions may also be experienced during the ice-sheet retreat, but the estimate of the number of such positions depends strongly on the possible duration of the melt water intrusion and especially on the modelling concept of the interaction between the fracture water and the rock matrix. At the end of each glaciation, is assumed that the groundwater salinity gradually returns to that at the beginning of the previous glacial cycle due to, e.g. mixing of groundwaters and surface waters.
Although the groundwater data clearly indicate sulphide values of below 1 mg/L, a pessimistic upper limit of 3 mg/L is adopted throughout the assessment period of 1 million years, which accounts for the possible solubility control by the more soluble amorphous iron sulphide in combination with the kinetically constrained availability of iron and the uncertainties related to microbial activity and the availability of nutrients and energy sources for microbes.
It can be estimated that for several (approximately four) glacial cycles, the expected canister failure rate due to rock shear is of a similar order of magnitude as during the first glacial cycle (see Section 7.2). Even after that, due to the low probability of large earthquakes and as fracture propagation is limited (see discussion in Section 7.2), the same sub-set of fractures is likely to be reactivated, keeping the canister failure rate low.

396
However, with regard to chemical erosion of the buffer and subsequently enhanced canister corrosion, more deposition holes are affected after 1 million years:
While for reference assumptions on the evolution of groundwater flow, less than 10 deposition holes might experience advective conditions after 1 million years, the number of potentially affected holes may by much larger. It cannot be excluded that a substantial proportion of deposition holes will experience advective conditions.
Concerning the number of failed canister due to corrosion over 1 million years:
If the buffer remains intact, no canister failures are expected within 1 Ma even in the most unfavourable canister locations and even in the case of increased flow due to rock damage or due to downward diffusion of sulphide from the backfill. In the presence of buffer erosion, only up to 6 canisters are expected to fail due to corrosion in the reference case (3 mg/L sulphide in groundwater and 1200 kg of buffer mass loss as threshold for advective conditions). If pessimistic assumptions concerning flow, fracture aperture and duration of dilute periods are used, the number of canister failures increases considerably up to 150 canisters (if a nominal wall thickness is used) or slightly over 200 failures (if a pessimistic copper thickness of 35 mm is used).
Concerning the mechanical state of the canisters after 1 million years:
It can be estimated that for the next four glacial cycles, the expected canister failure rate due to rock shear is of a similar order of magnitude as during the first glacial cycle (see Section 7.2). Even after that, due to the low probability of large earthquakes and as fracture propagation is limited the same sub-set of fractures is likely to be reactivated, keeping the canister failure rate low. Copper creep is not possible in the long term because the copper overpack rests on the insert, which prevents any further deformation.
Concerning subcriticality after one million years:
It is expected that the fuel will remain subcritical throughout the assessment period because of corrosion of the insert or the low likelihood of dynamic events (e.g. rock shear) that could modify the geometry of the fissile material in such a way that criticality could increase. Nonetheless, work is ongoing in defining a long-term criticality scenario that can add quantitative support for this assumption. The consequences of a potential long-term criticality event are also under investigation.
397
9 FULFILMENT OF PERFORMANCE TARGETS AND TARGET PROPERTIES
9.1 Scope of chapter
This chapter assesses the fulfilment of requirements in terms of the performance targets and target properties for the engineered barriers and host rock as identified in Chapter 2.
This assessment includes 1) a summary of the evolution of each of the components of the disposal facility taking into account the time-dependent and space-dependent loads (or FEPs) and the interactions between them. The evolution takes into account the time- and space-dependent FEPs that may affect the performance targets and target properties (Chapters 5 to 8); 2) an identification of the conditions that may lead to deviations from the performance targets and target properties and 3) an identification of the uncertainties in the conditions that may lead to deviations from the fulfilment of the performance targets and target properties during different periods of repository evolution.
9.2 Host rock
9.2.1 Summary of time-dependent loads that may affect the target properties
As stated in Chapter 2, the target properties that apply to the rock concern:
Groundwater flow: Under saturated conditions the groundwater flow in any fracture in the vicinity of a deposition hole shall be low to limit mass transfer to and from EBS. Therefore, the flow rate in such a fracture shall be in the order of one litre of flow per one metre of intercepting fracture width in a year (L/(m*year)) at the most. In case of more than one fracture, the sum of flow rates is applied (L3-ROC-19). Flow conditions in the host rock shall contribute to high transport resistance. Therefore, migration paths in the vicinity of the deposition hole, shall have a transport resistance (WL/Q) higher than 10,000 years/m for most of the deposition holes and at least a few thousand years/m (L3-ROC-20). Inflow of groundwater to deposition tunnels shall be limited to ensure the performance of the backfill (L3-ROC-21).
Groundwater composition at the repository level: No dissolved oxygen shall be present after the initially entrapped oxygen in the near field has been consumed (L3-ROC-10). The pH shall be higher than 4 and chloride concentration [Cl-] < 2 M (L3-ROC-11). Concentrations of canister-corroding agents (HS-, NO2
-, NO3- and
NH4+, acetate) shall be limited in the groundwater at the repository level (L3-ROC-
12). Groundwater at the repository level shall have low organic matter, H2 and Stot and methane contents to limit microbial activity, especially that of sulphate reducing bacteria (L3-ROC-13). The total charge equivalent of cations shall initially be higher than 4 mM (L3-ROC-14). In the future expected conditions the groundwater salinity (TDS, total dissolved solids) at the repository level shall be less than 35 g/L TDS. During the initial transient caused by the construction activities salinities up to 70 g/L TDS can be accepted (L3-ROC-15). The pH shall be in the range of 5−10, but initially a higher pH (up to 11) is allowed locally. The acceptable level also depends on silica and calcium concentrations (L3-ROC-16). Concentration of solutes that can have a detrimental effect on the stability of buffer and backfill (K+, Fetot) shall be limited in the groundwater at the repository level
398
(L3-ROC-17). Groundwater conditions shall be reducing in order to have a stable fuel matrix and low solubility of the radionuclides (L3-ROC-29). In the vicinity of the deposition holes, natural groundwater shall have a low colloid and organic content to limit radionuclide transport (L3-ROC-31).
Migration properties: The properties of the host rock shall be favourable for matrix diffusion and sorption (L3-ROC-33).
Mechanical stability: The location of the deposition holes shall be selected so as to minimise the likelihood of rock shear movements large enough to break the canister. Therefore, the likelihood of a shear displacement exceeding 5 cm shall be low (L3-ROC-23).
For the several hundreds of thousands of years when these target properties apply and as shown in Sections 5.1, 5.3, 6.1, 6.3, 7.1 and 7.2, the rock and the groundwater will be successively subject to the impact from the repository construction, operation and closure, the residual heat from the spent nuclear fuel, the hydrogeological evolution driven by crustal uplift (and hence by past climatic evolution), and the hydrogeological, hydrogeochemical and mechanical impacts driven by climatic evolution during repeated glacial cycles.
The rock will be subject to the following hydrogeological impacts:
After repository closure, the site will recover from the disturbances caused by the repository construction, operation and closure. The flow rates will reduce from those during the operational phase as the disturbance caused by the open repository decreases.
The heat generated by the spent nuclear fuel, which is most pronounced during the first thousands of years after emplacement, will also impact the flow around the deposition holes and reaction rates of chemical processes.
During the remaining part of the temperate period, the hydrogeological evolution is driven by crustal uplift.
For future glacial cycles, consisting of periods with temperate climate, permafrost, glaciations, and when the site is submerged, there will be more profound impacts on the flow. During permafrost conditions, groundwater flow is reduced as a consequence of very low hydraulic gradients, although pressure differences between frozen and unfrozen areas do exist. The hydraulic pressure is increased and redistributed by the presence of an ice sheet. Especially at the ice margin, hydraulic gradients can be high due to the high pressure under the ice and lower pressure in front of the ice margin.
Changes in groundwater flow will also cause changes to the groundwater composition, including:
Dilution due to infiltration of meteoric waters;
Increase of pH due to leachates from the grouting and cement-based materials used in construction and closure;
Mixing of groundwaters, rock-water interaction processes and microbial activity (especially consuming oxygen and reducing sulphate to sulphide)

399
Increased flow rates at the site in connection with the development and retreat of ice sheets will have an effect on the transport paths and the groundwater composition as well. Changes in groundwater composition are possible as a result of infiltration of glacial melt waters, upconing of saline waters and mixing of groundwaters as a result of higher flows, and infiltration of seawater with varying salinity during a post-glacial, submerged period.
The following rock mechanics impacts can be expected:
The excavation of the repository rooms and the thermal load generated by the spent nuclear fuel will change the stress conditions in the rock around the repository and may cause rock damage, by the potential formation of an EDZ, by thermally induced rock damage including spalling and by reactivation of fractures.
Over longer times, the reactivation of fractures in the rock is possible due to the downwarping and upwarping caused by the development and retreat of ice sheets. It is after the retreat of an ice sheet that the probability of an earthquake is larger due to a readjustment of the fractures.
Mechanical impact of ice load; during the development of an ice sheet, crustal downwarp is expected and large deformation zones, especially subvertical faults striking NW-SE may become unstable. On the other hand, during the retreat of an ice sheet, crustal upwarping is possible and subhorizontal faults striking NE-SW may become unstable. The selection of an adequate rock volume for the siting of the repository avoiding major deformation zones contributes to the mechanical stability of the selected rock volume, as possible differential movements during down- and upwarping will likely not affect canister positions.
All these loads are assessed in Chapters 5 to 8, demonstrating that host rock conditions, although evolving, will essentially remain stable over the assessment period. However, mainly due to the fact that groundwater flow takes place in a few discrete fractures there may be a few positions in the repository where less favourable conditions may develop.
9.2.2 Conditions that may lead to deviations from the target properties
As demonstrated in Chapters 5 to 8, during the normal or expected evolution, the target properties will hold, there being only a few future events and processes that may contribute to deviation from the initially favourable hydraulic conditions of the site:
Mechanical impacts such as formation of an EDZ, spalling and fracture reactivation that may create additional flow paths (see Section 5.3).
Increased hydraulic gradients, e.g. during a glacial cycle, that temporarily will increase flow rates (see Section 7.1).
Conditions that may affect the initially favourable groundwater composition include:
Drawdown of the groundwater table along with infiltration of meteoric waters, upconing of saline waters, and mixing of different water types during the operational period; infiltration of fresh, low salinity water due to crustal uplift in the first tens of thousands of years; infiltration of glacial melt waters during ice sheet periods.

400
The sulphide level in the natural state is well below 1 mg/L (Table 9-1). It has been observed that site characterisation activities and the ONKALO construction have caused mixing of groundwater and anomalous sulphide levels have been measured (maximum 12 mg/L) at a depth of around 300 m (Table 9-2). According to monitoring results, microbial sulphide production decreases once the groundwater conditions stabilise. Unforeseen microbial activity in combination with the kinetically constrained availability of iron may in the future produce increased sulphide levels above 1 mg/L (see Table 9-3).
Introduction of molecular oxygen into the repository system soon after canister emplacement may oxidise Fe(II)-bearing minerals and thus potentially weaken the reducing capacity of a few millimetres of the rock around the tunnels.
The redox conditions and the chemical composition of the groundwater, in particular pH, pCO2, sulphate and sulphide, will also be affected by mixing of more dilute groundwater into the repository system and by microbial degradation of organic stray materials in the repository. In addition, cementitious leachates from the grouting of fractures, the grout stabilising the rock bolts and from the deposition tunnel plugs will locally increase pH in the groundwater. Corrosion of rock bolts and other iron materials and precipitation of corrosion products and salts will also influence the redox geochemistry (see Sections 6.1.3 and 7.1.3).
In addition to changes of the flow and groundwater composition, the assessment in Chapter 5 has not revealed any process that would change the buffering capacity of the rock and thereby change the favourable properties of the host rock with regard to matrix diffusion and sorption during the assessment period.
The only possibility for a deviation from the target property on rock shear would be the combined occurrence of a large enough earthquake and that the applied method of selecting mechanically acceptable deposition holes would not discover a fracture that has a future potential for large shear, see Section 7.2.4.
9.2.3 Uncertainties in the conditions that may lead to deviations in the fulfilment of target properties
Generally, the requirements in terms of the target properties for most of the rock volume surrounding the deposition holes and deposition tunnel as listed in Table 2-5, will be fulfilled during the assessment period. However local variations in flow conditions and groundwater composition are possible. A more detailed evaluation is provided in the following.
Groundwater flow
As shown in Section 5.1, the correlation between the inflow and post-closure flow rate is not one to one. Thus, it is possible that even if all the deposition holes with inflow over the given limit, 0.1 L/min, were discarded, it cannot be excluded that a few deposition holes would experience higher flow rates under saturated conditions than assumed by the target properties.
Also during the first glacial cycle the groundwater flow target properties are expected to be fulfilled over the considered time frame for most deposition holes. The fraction of the canister positions with a flow rate above 10-3 m3/(m·a) remains low (about 10 % of
401
all the potential canister positions with no inflow criteria applied) during the temperate period. The modelling results show an increase to 20 % during the ice-sheet retreat if the ice-sheet margin is located close to the repository. During the permafrost period, the groundwater flow is reduced. During high flow conditions related to ice-sheet retreat, when the repository is still under the ice sheet, there is a significant increase in potential deposition hole locations having a transport resistance in the range of 3·104 to 106 a/m, but transport resistances below 104 a/m remain exceptional.
There are uncertainties related to the extent and properties of the rock damage zone created by the construction and later by the heat produced by the spent nuclear fuel. Different assumptions on the properties of the EDZ and spalling around the deposition tunnel and holes and have been made, see Sections 6.1 and 6.3, and their impact on the groundwater flow tested. The presence of an EDZ affects inflows below 0.1 mL/min and means that all deposition holes have some, although in many cases limited inflow compared to 40 % of deposition holes with no inflow when there is no EDZ present.
Groundwater composition at the repository level
Most geochemical properties (i.e. pH, Eh, Cl, sum of cations and sulphur and iron species) are expected to stay within the limits established by the target properties during the entire assessment period. Oxygen in the infiltrating water is expected to be consumed within short distances along the flow path and thus will not reach the repository level.
Salinity
From the available modelling results it can be concluded that the increase in salinity at repository levels will remain rather moderate during the operational period. Thus, even under pessimistic assumptions, maximum salinities are expected to remain below 70 g/L and salinities over 35 g/L are not expected at repository depth, but occur locally within some tens of metres below the repository level. Most of the modelling results suggest that the lowest salinities during the operational period will be at least a few grams per litre in most parts of the repository. However, the possibility of salinities close to 0.3–0.4 g/L which corresponds roughly to a total charge equivalent of cations of 4 mM cannot totally be excluded even if of short duration. For a few canister positions and for a limited time, the target properties related to the groundwater composition, salinity, chloride content and total charge concentration of the cations, may be violated. These potential deviations will disappear shortly after closure of the repository and, due to their short duration, are not judged to be detrimental to the backfill, buffer or canister.
During the continued temperate period, the infiltration of meteoric water at a slow, nearly constant rate results in a decreasing trend in salinity. The modelling results show that after about ten thousand to a few tens of thousands of years, a few percent of the canister positions may experience such dilute conditions that chemical erosion of the buffer is possible. Dilute conditions may also be experienced during ice-sheet retreat, but the estimate of the number of such positions is strongly dependent on the possible duration of the melt water intrusion and especially on the conceptual model and modelling assumptions on the interaction between the fracture water and rock matrix. These suggestions as to the potential for dilute conditions are, however, considered to
402
be caused by the simplified model assumptions rather than to reflect the understanding of the hydrogeochemical evolution of the site.
Since there are uncertainties related to the models and data used to describe the long-term evolution of the site and as groundwater flow modelling suggests that at least locally the total charge equivalent of cations can be in the order of, or even below 4 mM, i.e. so low that chemical erosion of the buffer is possible, the potential for the occurrence of dilute groundwaters is taken into account according to the assumptions presented in Tables 7-4 and 7-5. The reference case assumes that dilute conditions are possible only during deglaciation, whereas a variant case assumes longer periods with dilute conditions in connection of the deglaciation as well as the potential for dilute conditions during ice-sheet growth and after tens of thousands of years of temperate climate. The same assumptions apply to the first glacial cycle and subsequent glacial cycles repeating from the year 170,000 AP and each lasting for 120,000 years.
Summary of expected sulphide levels in the Olkiluoto groundwater
Based on the discussions in Sections 5.1.3, 6.1.3 and 7.1.3 by considering the iron and sulphur sinks and sources in rock and fractures, the measured sulphide and iron concentrations in groundwater, results of solubility calculations of iron sulphide phases, microbial processes and modelling of the sulphide concentrations for different time spans, the expected sulphide concentrations in the Olkiluoto groundwater are as presented in Table 9-3.
The dissolved sulphur species vary between the water types. The sulphide concentration for the main water types in the natural state is clearly below 1 mg/L, ranging from less than 0.02 to 0.56 mg/L, and with median values of 0.02−0.04 mg/L (Table 9-1). A trend can be observed of solubility control by amorphous iron sulphides towards pyrite with very low solubility at steady state conditions. It has been observed that site characterisation activities and ONKALO construction have caused artificially disturbed transient conditions due to mixing of different groundwater types and anomalous sulphide levels have been measured (maximum 12 mg/L) at a depth of around 300 m for the brackish SO4 water type mixed with brackish Cl-type groundwater (the concentrations of sulphide for the artificially disturbed waters are presented in Table 9-2). The high concentrations of sulphide are probably due to a delay in the availability of iron; however, sulphide concentrations are still evidently controlled by iron sulphide phases. According to monitoring results, sulphide concentrations decrease from the anomalously high values once the groundwater conditions stabilise. This may be explained by the continuing supply of iron from the rock leading to iron sulphide precipitation, but more experimental and monitoring data are needed to support the significance of this process. The recovery towards less artificially disturbed conditions seems to be quite rapid, within years to tens of years, based on the observations from monitoring of the drillholes as well as supported by reactive transport calculations with kinetic dissolution of chlorite as an iron source to precipitate sulphide. Although the groundwater data predominantly indicate sulphide concentrations below 1 mg/L, a pessimistic upper bound of 3 mg/L is adopted for the operational period, which accounts for the possible solubility control by the more soluble amorphous iron sulphide in combination with the kinetically constrained availability of iron and the uncertainties
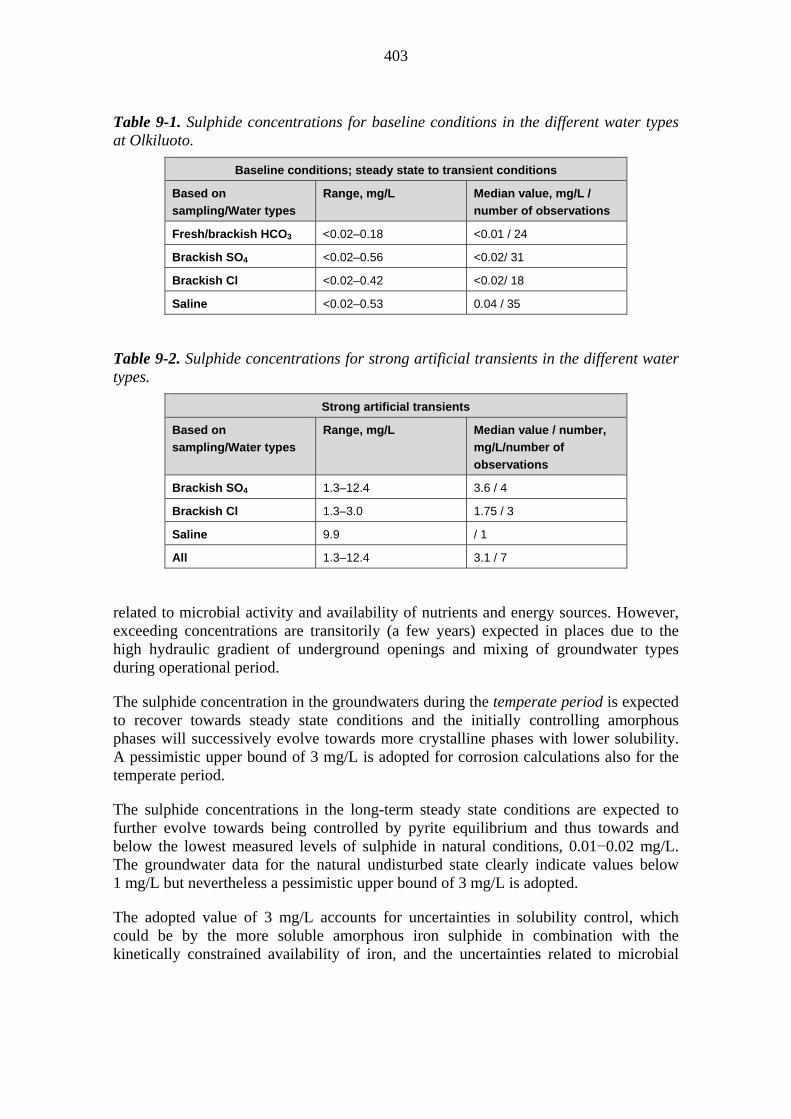
403
Table 9-1. Sulphide concentrations for baseline conditions in the different water types at Olkiluoto.
Baseline conditions; steady state to transient conditions
Based on
sampling/Water types
Range, mg/L Median value, mg/L /
number of observations
Fresh/brackish HCO3 <0.02–0.18 <0.01 / 24
Brackish SO4 <0.02–0.56 <0.02/ 31
Brackish Cl <0.02–0.42 <0.02/ 18
Saline <0.02–0.53 0.04 / 35
Table 9-2. Sulphide concentrations for strong artificial transients in the different water types.
Strong artificial transients
Based on
sampling/Water types
Range, mg/L Median value / number,
mg/L/number of
observations
Brackish SO4 1.3–12.4 3.6 / 4
Brackish Cl 1.3–3.0 1.75 / 3
Saline 9.9 / 1
All 1.3–12.4 3.1 / 7
related to microbial activity and availability of nutrients and energy sources. However, exceeding concentrations are transitorily (a few years) expected in places due to the high hydraulic gradient of underground openings and mixing of groundwater types during operational period.
The sulphide concentration in the groundwaters during the temperate period is expected to recover towards steady state conditions and the initially controlling amorphous phases will successively evolve towards more crystalline phases with lower solubility. A pessimistic upper bound of 3 mg/L is adopted for corrosion calculations also for the temperate period.
The sulphide concentrations in the long-term steady state conditions are expected to further evolve towards being controlled by pyrite equilibrium and thus towards and below the lowest measured levels of sulphide in natural conditions, 0.01−0.02 mg/L. The groundwater data for the natural undisturbed state clearly indicate values below 1 mg/L but nevertheless a pessimistic upper bound of 3 mg/L is adopted.
The adopted value of 3 mg/L accounts for uncertainties in solubility control, which could be by the more soluble amorphous iron sulphide in combination with the kinetically constrained availability of iron, and the uncertainties related to microbial
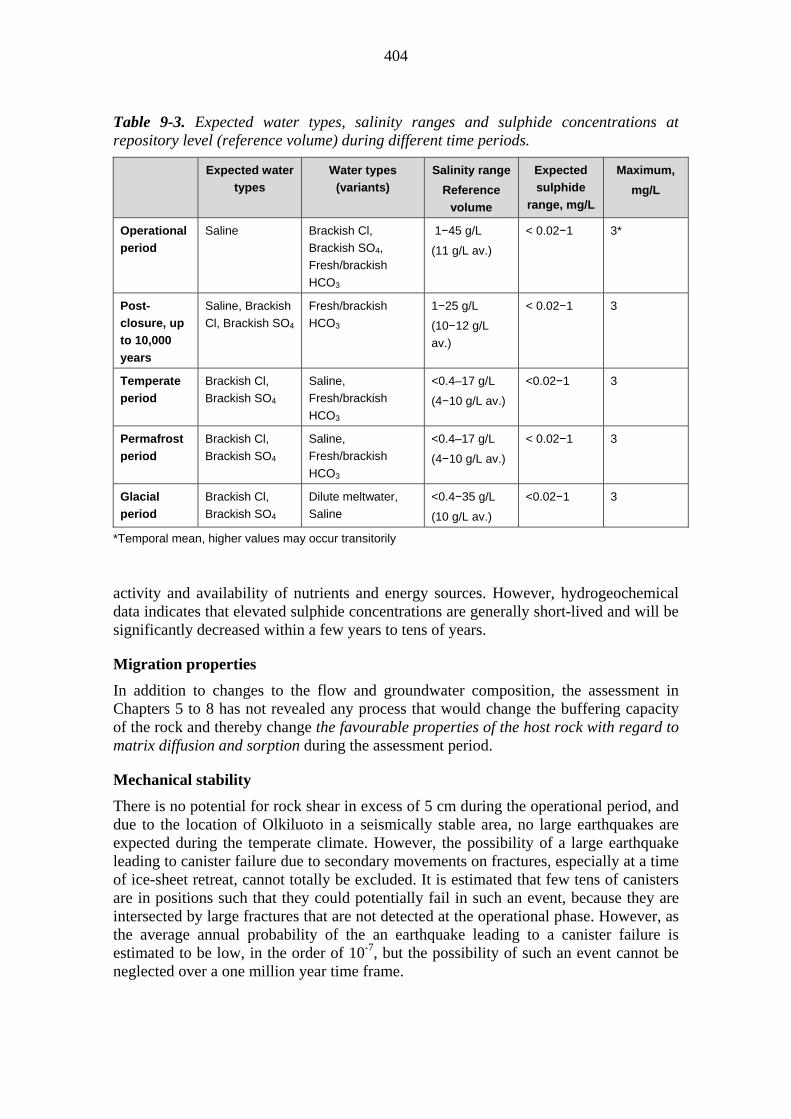
404
Table 9-3. Expected water types, salinity ranges and sulphide concentrations at repository level (reference volume) during different time periods.
Expected water
types
Water types
(variants)
Salinity range
Reference
volume
Expected
sulphide
range, mg/L
Maximum,
mg/L
Operational
period
Saline Brackish Cl,
Brackish SO4,
Fresh/brackish
HCO3
1−45 g/L
(11 g/L av.)
< 0.02−1
3*
Post-
closure, up
to 10,000
years
Saline, Brackish
Cl, Brackish SO4
Fresh/brackish
HCO3
1−25 g/L
(10−12 g/L
av.)
< 0.02−1 3
Temperate
period
Brackish Cl,
Brackish SO4
Saline,
Fresh/brackish
HCO3
<0.4–17 g/L
(4−10 g/L av.)
<0.02−1 3
Permafrost
period
Brackish Cl,
Brackish SO4
Saline,
Fresh/brackish
HCO3
<0.4–17 g/L
(4−10 g/L av.)
< 0.02−1 3
Glacial
period
Brackish Cl,
Brackish SO4
Dilute meltwater,
Saline
<0.4−35 g/L
(10 g/L av.)
<0.02−1 3
*Temporal mean, higher values may occur transitorily
activity and availability of nutrients and energy sources. However, hydrogeochemical data indicates that elevated sulphide concentrations are generally short-lived and will be significantly decreased within a few years to tens of years.
Migration properties
In addition to changes to the flow and groundwater composition, the assessment in Chapters 5 to 8 has not revealed any process that would change the buffering capacity of the rock and thereby change the favourable properties of the host rock with regard to matrix diffusion and sorption during the assessment period.
Mechanical stability
There is no potential for rock shear in excess of 5 cm during the operational period, and due to the location of Olkiluoto in a seismically stable area, no large earthquakes are expected during the temperate climate. However, the possibility of a large earthquake leading to canister failure due to secondary movements on fractures, especially at a time of ice-sheet retreat, cannot totally be excluded. It is estimated that few tens of canisters are in positions such that they could potentially fail in such an event, because they are intersected by large fractures that are not detected at the operational phase. However, as the average annual probability of the an earthquake leading to a canister failure is estimated to be low, in the order of 10-7, but the possibility of such an event cannot be neglected over a one million year time frame.

405
9.2.4 Feedback to scenario formulation and analysis
The following feedback is given to the formulation and analysis of release scenarios:
During the high flow conditions related to an ice-sheet retreat, when the repository is still under the ice sheet (mobile ice sheet 10 years), there is a significant increase in potential deposition hole locations having a transport resistance in the range of 3·104 to 106 a/m, but transport resistances below 104 a/m remain exceptional.
The occurrence of dilute groundwater conditions as a consequence of relatively fast flow paths from the surface, carrying fresh water or melt water, should be taken into account.
Uncertainty in the future evolution of sulphide concentrations is addressed by using the upper bound of 3 mg/L.
Due to the uncertainties related to the frequency and impacts of earthquakes, the following topics are addressed as part of scenario development: i) earthquakes during the prolonged temperate period within the time window of 10,000−50,000 years, ii) earthquakes at the time of ice-sheet retreat and locally increased flow rates and reduced transport resistances of the migration paths.
9.3 Closure
9.3.1 Summary of time-dependent loads that may affect the performance targets
As stated in Chapter 2, the following performance targets apply to closure:
Closure shall complete the isolation of the spent nuclear fuel by reducing the likelihood of unintentional human intrusion through the closed volumes (L3-CLO-5);
Closure shall restore the favourable, natural conditions of the bedrock as well as possible (L3-CLO-6);
Closure shall prevent the formation of preferential flow paths and transport routes between the ground surface and deposition tunnels/deposition holes (L3-CLO-7);
Closure shall not endanger the favourable conditions for the other parts of the EBS and the host rock (L3-CLO-8);
Retrieval of the spent nuclear fuel canisters shall be technically feasible in spite of repository tunnel and closure structures (L3-CLO-11).
As stated in Chapters 5 to 8, piping and erosion could affect the clayish material in the closure backfill at early stages, and chemical erosion could be a problem later only if the material was not appropriately chosen. The degradation of cementitious plugs may affect the closure components after hundreds of years. After tens of thousands of years, the near-surface components of closure will experience permafrost, but the materials have been selected to withstand freezing and thawing cycles. Nonetheless the consequences of these processes in terms of partially failing to comply with the performance targets are taken into account in groundwater flow calculations by considering cases with increased hydraulic conductivity for the backfilled tunnels.

406
After saturation, the only potential threat to the closure performance targets that would disturb the closure backfill material or the closure plugs would be their degradation to:
an extent that the repository access tunnel or shafts would form preferential pathways for groundwater flow to and from the repository that are more significant than the already existing fractures and hydrogeological zones, or
be so extreme that the closure material and plugs would no longer be able to keep deposition tunnel backfill and plugs in place.
9.3.2 Conditions that may lead to deviations from the performance targets
Isolation
Human intrusion (inadvertent) is the only way that could lead to a complete loss of the isolation function of the closure (and other) components.
Restore the favourable, natural conditions of the bedrock as well as possible
Given that the closure components are installed as prescribed in Section 3.6, it will be tight enough to ensure to restore the favourable, natural conditions of the bedrock as well as possible.
Prevent the formation of preferential flow paths and transport routes
Substantial loss of closure backfill material or degradation of closure plugs will locally imply that the initially low hydraulic conductivity will increase. However, such local impacts would only result in increased flow within or enhanced transport to and from the repository panels if the losses are such that they overwhelm the already existing pathways provided by hydrogeological zones and fractures, which is not feasible at all.
Endanger the favourable conditions for other EBS components
The composition of the closure material, see Section 3.6, will be such to ensure that it will not significantly add the inventory of materials that could potentially be detrimental to the stability of the other EBS components.
9.3.3 Uncertainties that may lead to deviations in the fulfilment of performance targets
Generally, the requirements in terms of the performance targets for closure, as listed in Table 2-4, will be fulfilled during the assessment period. A more detailed evaluation is provided in the following.
Degradation of mechanical and other closure plugs is not expected to occur during the operational period.
There are no major uncertainties in the evolution of the closure components during 10,000 years after closure. Even if it is assumed that the hydraulic plugs will become degraded, no preferential paths will be formed as the materials will settle by gravitation. Transport through closure components will still be dominated by diffusion.
407
Degradation of closure plugs is uncertain, but can be pessimistically assumed to have happened within a period of 100,000 years. However, gravitational settlement of the plug materials will ensure low permeability through the access tunnel and other spaces filled with closure materials.
As shown in Section 6.4, the backfill in the central tunnels will, after 10,000 years, be completely saturated and keep its safety functions regardless of the consequences of climate evolution. For the upper parts of the closure it cannot be excluded that the backfill in parts of the access tunnel will lose its clay components due to chemical erosion over the long time scales considered. However, this is not judged to jeopardise the overall safety function of the closure backfill in particular or of the closure as a whole.
Freezing/thawing of the closure components would not adversely impact on compliance with the closure performance targets. The access tunnel and shafts between the depths of 200 and 300 m backfilled with in situ compacted swelling clay-aggregate mixture may, in the far future, be subject to freeze/thaw cycles, but this will have no major implications for the performance of the material. The material filling the access tunnel and shafts above 200 m depth is in situ compacted crushed rock. If frost heave develops, it will be of minor consequence, if the crushed rock material is selected appropriately. Glacial erosion may have an effect on materials in the uppermost part of the disposal facility, but the erosion rate, even during glacial cycles is so slow that it would take several millions of years to erode the upper closure components.
9.3.4 Feedback to scenario formulation and analysis
While complete loss of backfill function can be excluded, the potential for flow paths through closure components is taken into account in the DFN modelling used for evaluation of the evolution of the disposal system and as a basis in the Assessment of Radionuclide Release Scenarios for the Repository System.
9.4 Buffer and backfill
While there are distinct and somewhat different performance targets for the backfill and the buffer, the impacts from external loads are similar as well as the processes that may impair the function of the properties of these two barriers (see also Section 4.3). For these reasons, the backfill and buffer are discussed jointly in this section.
9.4.1 Summary of time-dependent loads that may affect the performance targets
As stated in Chapter 2, the following performance targets apply to the buffer:
Mitigate the impact of rock shear on the canister (L3-BUF-10);
Limit microbial activity (L3-BUF-8);
Be impermeable enough to limit the transport of radionuclides from the canisters into the bedrock (L3-BUF-12);
Be impermeable enough to limit the transport of corroding substances from the rock onto the canister surface (L3-BUF-13);

408
Limit the transport of radiocolloids to the rock (L3-BUF-14);
Provide support to the deposition hole walls to mitigate potential effects of rock damage (L3-BUF-16);
Be able to keep the canister in the correct position (to prevent sinking and tilting) (L3-BUF-17);
Transfer the heat from the canister efficiently enough to keep the buffer temperature < 100 °C (L3-BUF-6);
Allow gases to pass through it without causing damage to the repository system (L3-BUF-19).
Also, the amount of substances in the buffer that could adversely affect the canister, backfill or rock shall be limited (L3-BUF-21).
As stated in Chapter 2, the following performance targets apply to the backfill:
The backfill shall limit advective flow along the deposition tunnels (L3-BAC-8);
The plugs shall isolate the deposition tunnels hydraulically during the operational phase of the repository (L3-BAC-9);
The chemical composition of the backfill and plugs shall not jeopardise the performance of the buffer, canister or bedrock (L3-BAC-13);
The backfill shall keep the buffer in place (L3-BAC-16);
The backfill shall contribute to the mechanical stability of the deposition tunnels (L3-BAC-17);
The plugs shall keep the backfill in place during the operational phase (L3-BAC-18);
The backfill shall contribute to prevent uplifting of the canister in the deposition hole (L3-BAC-19).
For the several hundreds of thousands of years when these performance targets apply and as shown in Sections 5.4., 6.4. and 7.3., the evolution of the buffer and the backfill will be successively subject to the following mechanical and hydraulic processes.
During the operational phase, clay material from the buffer and backfill may be lost due to the processes of piping and erosion.
Along with groundwater flowing into the deposition tunnels and the deposition holes, saturation and swelling of the buffer and backfill will commence. Initial differences in density and swelling pressure may be evened out by homogenisation.
In theory, the possibility of freeze/thaw cycles affecting the materials that form the buffer and backfill could be a threat to their long-term performance, but permafrost will only reach repository depth if very unlikely conditions are assumed, and the materials have been selected to withstand freeze-thaw cycles without major alteration.
409
As demonstrated in Sections 5.5., 6.5., 6.6. and 7.4., the evolution of buffer and backfill may be subject to the following chemical processes during the assessment period.
Salinity changes in the groundwater during the operational, temperate and glacial periods. High salinities may affect the properties of the bentonite, and at very low salinity, chemical erosion may occur.
The saturation of the buffer is influenced by complex thermo-hydro-mechanical-chemical (THMC) considerations. The initially strong thermal and hydraulic gradient across the buffer leads to dissolution and precipitation of salts. The extent of this re-distribution of salts depends on the temperature distribution and flow conditions. For most of the deposition holes with very low inflow rates, the thermal period will occur under unsaturated conditions which will restrict solute transport and dissolution of silica. In the deposition holes with higher inflow rates, the bentonite buffer will be exposed to elevated temperatures under saturated conditions and thus larger effects on silica dissolution and re-precipitation are expected. However, temperatures are decreased somewhat compared with unsaturated conditions. Virtually all performance targets of the buffer are affected by the processes of montmorillonite transformation and cementation. The thermal effects on the backfill geochemistry will be much smaller than those for the buffer because of the lower exposed temperatures. Thus, thermally induced mineral alteration and cementation can be omitted from consideration for the backfill.
After the saturation period and once temperatures have substantially decreased (to below about 50 °C), i.e. after about 100−1000 years depending on local flow conditions, thermally induced processes become negligibly modified relative to ambient conditions. The porewater will be conditioned by groundwater solutes diffusing into the clay. The porewater chemistry will be similar to that of the surrounding groundwater, thus displaying similar salinity, pH, Eh and pCO2 conditions.
Because of the microporous structure of the saturated undisturbed high-density bentonite buffer, microbial activity will be limited. Thus, sulphate reduction within the buffer will be negligible.
Some of the deposition holes may be influenced by cementitious leachates formed by the degradation of low-pH concrete structures and cement grouts which may lead to montmorillonite transformation and cementation effects at fracture/buffer interfaces.
The interaction of the deposition tunnel concrete end plug with the backfill potentially affects virtually all performance targets of the backfill. The large sulphate pool in the concrete and backfill and possible sulphate reduction process may generate sulphide fluxes diffusing through the backfill towards the buffer and contributing to canister corrosion.
Climate-driven processes will affect the groundwater flow and composition which will also affect the conditions in the buffer and backfill. In general, changes in groundwater composition and salinity will be moderate and not affect the performance of the clay barriers, with the main exception being the potential for dilute groundwaters, as already discussed.
410
9.4.2 Conditions that may lead to deviations from the performance targets
Primarily, the conformity with the performance targets relies on the assurance of proper initial conditions regarding buffer/backfill mass and composition of the buffer/backfill material. Summarising, there are mainly two processes that could lead to deviations from the performance targets in future evolution.
Loss of bentonite material
Most of the buffer and backfill performance targets are sensitive to the loss of bentonite material. A high bentonite density limits microbial activity, ensures low permeability, prevents migration of radio-colloids to the rock, provides support to the deposition hole walls and helps to keep the canister in correct position (to prevent sinking and tilting). The following processes may lead to loss of bentonite mass:
Inflow to deposition holes and tunnels leading to piping and erosion after emplacement and until swelling of the buffer and the backfill;
Chemical erosion due to dilute groundwaters in combination with relatively high groundwater flows around the buffer and/or the backfill;
Buffer expansion into the backfill if backfill mass is lost, e.g. due to chemical erosion.
Alteration
Another way of affecting the buffer or backfill performance targets is by alteration of the clay material. Such alteration may be due to:
Freeze/thaw cycles affecting the materials that form the buffer and backfill;
The complex thermo-hydro-mechanical-chemical (THMC) behaviour during saturation and the dissolution and precipitation of salts;
Influences by cementitious leachates formed by the degradation of low-pH concrete structures and cement grouts, which may lead to montmorillonite transformation and cementation effects at fracture/buffer interfaces.
The large sulphate pool in the backfill (and cementitious materials) and possible sulphate reduction processes that may generate sulphide fluxes diffusing through the buffer and contributing to canister corrosion.
It must be noted that both the loss of bentonite material and its chemical alteration are driven by groundwater flow and chemistry, which are dependent on the characteristics of the site and on climate evolution.
9.4.3 Uncertainties that may lead to deviations in the fulfilment of performance targets
The requirements in terms of performance targets for the buffer and backfill, as listed in Tables 2-2 and 2-3, will be fulfilled for most of the assessment period and for most of the deposition tunnels and deposition holes. Deviation, in terms of loss of buffer material may occur in some deposition holes after very long times due to potential ingress of dilute groundwater. A more detailed evaluation is provided in the following.
411
Potential for loss of buffer and backfill material
Before saturation, piping and erosion of the buffer and backfill material will imply that some buffer and backfill will be lost. Based on the inflow data for potential canister positions, roughly 1/3 of the positions are such that some buffer mass loss by piping and erosion in the buffer is expected. In a base case, taking into account the expected distribution of the inflows between deposition tunnels and holes and the expected solid content of the effluent, the estimated mass loss of buffer is at most 185 kg per deposition hole, but there are variant cases with larger losses, but even then the average buffer dry density remains at such a level that no drastic changes are expected in the hydraulic conductivity or the swelling pressure of the buffer. However, the consequences depend also on how local the mass loss is.
For the backfill, at most 13,000 kg per deposition tunnel would be locally lost by piping and erosion, but the eroded material would be redistributed within the deposition tunnel. The effect on the backfill performance depends on how the mass loss would be distributed in the backfill. For example, if all of the 13,000 kg would be lost from a tunnel length of 1 m, the mass loss would have a significant effect on the backfill density at this location. Such an event could perhaps be possible in the vicinity of a fracture with a high enough inflow to transport all this mass further down in the tunnel. However, it can be reasoned that this type of erosion would still not be detrimental to the performance of the EBS system, since no deposition holes would be allowed to be situated near such a fracture. In conclusion, the buffer and backfill will maintain their performance targets even considering the process of piping and erosion.
Chemical erosion due to the potential occurrence of dilute groundwater cannot be neglected, see Sections 7.5. and 8.1. While for reference assumptions on the evolution of groundwater flow less than 10 deposition holes might experience advective conditions after one million years, the number of potentially affected holes may be much larger. It cannot be excluded that a substantial proportion of deposition holes will experience advective conditions, although relatively few will experience advective conditions after just one glacial cycle. For reference assumptions on groundwater flow and evolution of groundwater composition, only one deposition hole may experience advective conditions after the first glacial cycle. However, considering the uncertainties, the analysis suggests that during the first glacial cycle, this erosion could result in advective conditions in about 3 positions if applying the RSC. Without the application of RSC, the number of positions with advective conditions after the first glacial cycle would increase slightly, with a maximum number of around 13. However, during repeated glacial cycles, a substantial proportion of deposition holes can experience advective conditions even with the application of the RSC.
Buffer and backfill alteration
Section 5.5.6 concludes that all performance targets potentially affected by buffer and backfill transformation due to chemical and microbial processes will be upheld during the operational period of the repository. The effects of the possible high pH leachates on buffer and backfill performance during the construction and operational period will be negligible due to the limited flux of alkaline leachates into the deposition tunnels and deposition holes resulting in insignificant mineralogical changes in buffer and backfill.

412
This conclusion also holds for effects of the degradation of the deposition tunnel end plugs.
The complex thermo-hydro-mechanical-chemical evolution soon after emplacement and when the heat transfer from the canister is still high, will lead to localised geochemical changes in the buffer, these having limited impact on the performance targets. After saturation and development of the full swelling capacity, the changes will be much more moderate and constrained by diffusive processes.
The evolution of porewater chemistry in the backfill will be similar to that in the buffer, but be much less affected by temperature. Thus, thermally-induced changes with regard to montmorillonite alteration and cementation will be negligible. The resulting salinity and the variables pH, pCO2 and Eh will remain within acceptable ranges. With regard to disturbances, it can be deduced that:
The degradation of cement materials in the deposition tunnel end plug contacting the backfill will not be of relevance for the fulfilment of the performance targets of the backfill during the temperate period and also afterwards;
The corrosion of iron from construction materials will have an insignificant impact on the performance targets of the backfill;
The large sulphate pool in the backfill is a potential source for microbial sulphide production. In view of the large uncertainties related to backfill homogenisation and microbial activity in the boundary areas, the sulphide fluxes that may affect the canister can only be assessed by a bounding analysis.
For the glacial period, the evolution of porewater salinities in buffer and backfill will follow, with a certain delay, those in the surrounding groundwaters, which will remain within the required performance target except perhaps during short times during the ice melting period. Under these conditions, dilute groundwater conditions may favour “chemical” erosion of buffer and backfill. The conditions at all times will remain reducing, but under dilute conditions with low input of organic carbon, they will be less reducing, thus not favourable for sulphate reduction in the buffer. In the backfill, however, with its large organic pool, sulphate reduction might continue also under dilute conditions, whenever suitable microbial activity occurs.
Ongoing degradation of cementitious materials will gradually release less aggressive leachates, whose effects on the clays in the near field will generally be very limited. The persistence and longevity of montmorillonite under natural groundwater conditions is difficult to assess quantitatively because of a lack of theoretical and experimental knowledge. Nonetheless, observations from natural systems indicate long-term persistence of montmorillonite at low temperatures over a large range of geochemical conditions.
Copper corrosion is not expected to affect the performance targets of the buffer, as is indicated from experimental and geological observations.
413
Substances that could adversely affect the canister
The basic mean to ensure that the performance targets related to the amount of substances in the buffer or backfill that could adversely affect the canister, backfill or rock are limited, is to control the initial material composition. However, even when these amounts are kept within the required limits, there is the potential for minor amounts of chemicals that could affect mainly the canister as a result of the chemical and microbial evolution of the buffer and backfill. The following have been found.
The main pool of O2 potentially affecting canister corrosion is in the backfill. This corrodant will however be consumed rather rapidly both abiotically, via oxidation with pyrite in the backfill, as well as microbially for the oxygen that dissipates into the rock. Hence, the O2 fluxes reaching the canister will be negligible. No significant lowering of pH with respect to natural conditions is expected.
The largest potential impact is the production of sulphide, mainly in the backfill, which contains the largest organic pool. The disturbance-induced redox processes during the excavation and operational period are expected to have only a limited effect on the geochemistry of the near field after EBS emplacement.
Natural colloid concentrations are low and the colloids are not expected to be stable in the high ionic strength groundwaters present at the repository depth.
The production of sulphide via microbial processes in the undisturbed buffer will be restricted by the low water activity, the small pore size and, during the thermal stage, by the elevated temperatures. After saturation, further restriction by the high density and small pore size will occur.
In case of homogenisation of the backfill, the high density and low pore size will effectively restrict microbial activity and adverse conditions will be similar to those in the (intact) buffer. If, however, low density areas should persist, then significant sulphate reduction cannot be ruled out, and this needs to be considered in the canister corrosion analysis. The expected range of sulphide concentrations at the backfill/rock and backfill/buffer interfaces is 3·10-5 to 0.5 mg/L (Table 9-3). A slightly lower range is expected during the glacial period due to the decrease in the sulphate pool for microbial reduction. The limit for the upper range is based on the solubility constrained by mackinawite. Higher sulphide porewater concentrations are improbable, but locally cannot completely be ruled out as occurring during short periods as a result of local intense SRB activity. It should be noted that there is sufficient reactive Fe(II) in the backfill available from carbonate minerals or iron oxyhydroxides to bind the sulphide generated by sulphate reduction. Also that as long as the transport in the buffer is diffusion-dominated the transport of sulphide from the backfill to the canister surface will be limited. In order to account for the uncertainties as to possible solubility control by the more soluble amorphous iron sulphide and the uncertainties related to microbial activity, a pessimistic upper bound concentration of 3 mg/L for dissolved sulphide is adopted for corrosion calculations.

414
Freezing/thawing
As concluded in Section 7.3.3, the potential for freezing of the buffer or the deposition tunnel backfill is not an issue that would jeopardise the performance of these barriers, since permafrost is not expected to reach repository depth and even if the freezing front should reach repository depth, the materials and design selected for the buffer and backfill will withstand the freeze/thaw cycles without damage to their safety functions.
9.4.4 Feedback to scenario formulation and analysis
The following uncertainties that may give rise to deviations from the performance targets are considered in scenario formulation and analysis.
The geochemical conditions of the buffer are strongly influenced by those in the surrounding host rock. Therefore, uncertainties recognised in Sections 5.1, 6.1 and 7.1, namely related to variations in flow and resulting geochemical conditions, also apply to the near field. In particular, this holds for the conditions during the saturation stage. The variations in inflow rates to deposition holes have been accounted in the THC modelling exercise (6.4.) in which a large range of conditions has been considered.
The uncertain factors affecting the number of deposition holes that may experience advective conditions due to chemical erosion need to be considered. These include whether sufficiently dilute conditions are attained, the groundwater flow distribution, model for chemical erosion and the threshold values for buffer and backfill loss before advective conditions are attained.
The large sulphate pool in the backfill is a potential source for microbial sulphide production and, in view of the large uncertainties the sulphide fluxes that may affect the canister, can only be assessed by a bounding analysis.
9.5 Canister
9.5.1 Summary of time-dependent loads that may affect the performance targets
As stated in Chapter 2, the following performance targets apply to the canister:
The canister shall initially be intact when leaving the encapsulation plant for disposal except for incidental deviations (L3-CAN-4);
In the expected repository conditions the canister shall remain intact for hundreds of thousands of years except for incidental deviations (L3-CAN-5);
The canister shall withstand corrosion in the expected repository conditions (L3-CAN-7);
The canister shall withstand the expected mechanical loads in the repository (L3-CAN-9);
The canister shall not impair the safety functions of other barriers (L3-CAN-11);
The canister shall be subcritical in all postulated operational and repository conditions including intrusion of water through a damaged canister wall (L3-CAN-14).

415
For the several hundreds of thousands of years when these performance targets apply, the canister will be subject to mechanical and corrosive loads. As shown and assessed in Sections 6.9 and 7.8, the following mechanical loads apply during the assessment period:
Asymmetric loads due to uneven water saturation and imperfections in the deposition hole geometry;
Permanent asymmetric loads due to uneven bentonite density and imperfections in the deposition hole geometry;
Groundwater hydrostatic pressure combined with an even isostatic swelling pressure of bentonite;
Glacial pressure (additional isostatic pressure, only during ice-sheet periods);
Shear load due to rock displacement.
As shown in Sections 6.8 and 7.7, the following corrosive loads apply:
During the operational period and during buffer saturation the following loads need to be considered: atmospheric corrosion before emplacement, corrosion due to handling and operational factors, stress corrosion cracking, internal corrosion due to radiolysis of residual water, external corrosion due to radiolysis of moist air and aerobic corrosion in the deposition holes.
During the temperate period after buffer saturation, several loads will act simultaneously on the copper overpack including a high level of radiation, high temperatures, swelling pressure from the buffer, variable salinity, potentially aggressive agents (such as ammonia, nitrates, nitrites), potentially high pH leachates from the presence of cementitious materials in the repository and, when conditions have become anaerobic, corrosion from sulphide ions which will continue throughout the assessment period.
For the entire assessment time including the glacial periods, corrosion from sulphide is possible. Sulphide may be provided both from the groundwater in the rock, see Section 9.2.3 and from the buffer and backfill, see Section 9.4.3. As concluded in Section 9.4.3, the majority of the canisters will remain intact except for a few (about 4-5 canisters under reference assumptions) failures due to buffer erosion.
Penetration of O2 from glacial meltwater is not realistic, see Section 9.2.3, and therefore corrosion due to oxygen during the long-term evolution does not need to be considered.
9.5.2 Conditions that may lead to deviations from the performance targets
Initial state
Based on the discussion in Section 3.3, the canisters will be initially tight when they leave the encapsulation plant, except for incidental deviations in at most 4−5 canisters based on the current knowledge about the manufacturing and testing process. The
416
estimate of the number of canisters with an initial penetrating defect (incidental deviation) is expected to decrease as strict quality control measures are set on canister manufacturing and testing.
Mechanical loads
As concluded in Sections 6.9 and 7.9 it is very likely that the canister will remain intact, i.e. meet all its performance targets, for all conceivable mechanical loads. The only potential exception from this would be if rock shear in excess of 5 cm were to occur. Even though the canister may withstand even larger loads than 5 cm shear, it must be assumed that the canister integrity is broken if this was to happen.
Corrosion loads
Sulphide, either in groundwater or from other sources may pose a threat to the long-term durability of the copper in the canister overpack. Sulphide production due to microbial activity in the long-term evolution is uncertain. Highly pessimistic assumptions concerning flow and the duration of dilute conditions may also lead to an increased number of canister failures if they are combined with subsequent microbial activity and kinetically constrained availability of iron, able to produce high concentration of sulphide in groundwater.
9.5.3 Uncertainties that may lead to deviations in the fulfilment of performance targets
The requirements in terms of the performance targets for the canister, as listed in Table 2-1, will be fulfilled for most of the canisters during the assessment period. However, for some canisters, the protective copper overpack may be penetrated either due to shearing of the rock in connection with large earthquakes or due to corrosion by sulphide in deposition holes that have also lost so much buffer mass that advective conditions must be assumed. A more detailed evaluation is provided in the following.
Impact from mechanical loads
During the first tens of thousands of years after disposal the canister will remain intact, i.e. meet all its performance targets, for all conceivable loads (e.g. lifting loads in operation, isostatic and uneven swelling pressure and groundwater pressure) that could occur during this period. The impact from potential canister handling accidents is not a concern since if such an accident happens, the canister will be returned to the encapsulation plant for examination and assessment, opened and unloaded, and the fuel will be re-encapsulated into an intact canister, if necessary.
Also for the time after the first tens of thousands of years after disposal, it is very likely that the canister will remain intact, i.e. meet all its performance targets, for all conceivable loads. The canister is designed to withstand at least 5 cm shear, but there is a low likelihood for shear displacements on fractures to exceed 5 cm in the context of ice-sheet retreat. It is estimated that few tens of canisters are in positions such that they could potentially fail in such an event. However, as the average annual probability of the an earthquake leading to a canister failure is estimated to be low, in the order of 10-7, but the possibility of such an event cannot be neglected over a one million year time frame.

417
Impact from corrosion loads
Several uncertainties are identified when considering the different chemical aspects of the evolution of the repository during the operational period:
There is a large degree of uncertainty in the detailed salinity distribution around the repository. However, the salinity will not become so high or so low in combination with a low pH, as to affect the performance of the repository during this period or when considering its future evolution.
The canister in the initial state will be covered by a thin layer of corrosion products (less than 500 micrometres thick), at most 4−5 canisters (of 4500) may have a penetrating defect, and there are residual stresses on the surface of the canister which are difficult to quantify.
Despite these uncertainties, the corrosion depth from the atmospheric and initially entrapped oxygen is expected to be less than 500 μm, and will thus have a negligible impact on the minimum copper coverage of the canisters (even taking into account incidental deviations).
If the buffer is intact, the total corrosion depth from corrosion is only a few mm over one million years. Several processes give corrosion depths less than 100 μm, and no processes give corrosion depths larger than a few mm. The corrosion depths from the different processes should not simply be summed up as their combination requires a far more detailed chemical analysis (as well as a statistical analysis regarding the flow and sulphide distributions), but, even if they are cautiously added, the sum is still less than 5 mm (SKB 2010c).
The main uncertainties concern the possibility of microbially mediated sulphate reduction and kinetically constrained availability of iron. If microbial activity and sulphide production is centred in the buffer and backfill, then there is enough iron to limit sulphide levels. The application of RSC greatly mitigates the possibility of emplacing a canister in a position with high flows, which are then a risk for buffer erosion. There are also some uncertainties regarding the possibility of residual stresses affecting SCC and clarification needs concerning the possibility of copper corrosion in pure water under anaerobic conditions. These uncertainties are addressed in the next RTD programme (see Sections 5.7.4 and 7.7.4).
Subcriticality
To ensure subcriticality, the properties (e.g., enrichment, burnup) of the fuel inside the canisters, as well as the internal geometry of the insert, shall be known precisely enough to provide a high degree of confidence in criticality safety (L4-CAN-9). The insert geometry and acceptance criteria for soundness shall be set so that sub-criticality is guaranteed (L4-CAN-33).
As discussed in Section 5.8, an earlier study (Anttila 1999) proved that a version of the VVER canister loaded with twelve similar fresh VVER-440 assemblies with the initial enrichment of 4.2 % fulfils the criticality safety criteria. An earlier design of the BWR canister loaded with twelve fresh BWR assemblies of the so-called ATRIUM 10x10-9Q type with the initial enrichment of 3.8 % and without burnable absorbers has also been
418
proved to meet the safety criteria. However, in these calculations the impacts of various uncertainties were not assessed thoroughly. The main emphasis in the most recent study (Anttila 2005) was on the OL3 canister. It was shown that this canister type fulfils the criticality safety criteria only if the burnup credit principle is applied.
Complementary studies concerning criticality safety will be carried out for the operational license application. Some validation of the calculation system will be performed and the impact of various uncertainties will be assessed. Long-term criticality aspects will also be discussed.
As discussed in Section 7.9, out-of-canister criticality events caused by the transport (e.g. by diffusion) and reaccumulation (e.g. by precipitation) of radionuclides in the buffer, backfill or geosphere have also been assessed and are considered to have a vanishingly small probability, although the initial assumptions are being verified.
9.5.4 Feedback to scenario formulation and analysis
The analysis shows that the potential for canister failure due to shear displacements in excess of 5 cm needs to be considered in the formulation of release scenarios. Since such a case would be caused by rock shear, the correlation with the flow conditions in the shearing fracture needs also to be considered in the analysis of scenarios.
As already concluded in Section 9.4.4, the number and locations of deposition holes where there may be a buffer loss leading to advective conditions are uncertain, as are the associated times of buffer loss. Furthermore, also future sulphide levels are uncertain, see Section 9.2.4. Both these sets of uncertainties affect the potential number of future canister failures and are considered in the formulation and analysis of release scenarios.
The issue of long-term criticality is still under investigation and is not currently propagated to the formulation of release scenarios.
419
10 CONCLUSIONS
10.1 Fulfilment of performance targets
The assessment presented in Chapter 6, and especially in Sections 9.2.3, 9.3.3, 9.4.3 and 9.5.3, demonstrates that for the expected evolution of the site and the repository, all requirements in terms of performance targets and target properties for the rock, the closure, the backfill, the buffer and the canister will be met during the assessment period, with the following exceptions:
It is possible that even if all the deposition holes with inflow over the given limit, 0.1 L/min, are discarded, a few deposition holes will be affected after closure with a higher flow or with lower transport resistance than the target values.
The fraction of canister positions with a flow rate above 10-3 m3/(m·a) will remain low (about 10 % of all the potential canister positions with no inflow criteria applied) during the temperate period. There may be an increase up to 20 % of canister positions during an ice-sheet retreat, if the ice margin is located close to the site. During permafrost periods, the groundwater flow is reduced. During the high flow conditions related to the ice-sheet retreat, when the repository is still under the ice sheet (mobile ice sheet 10 years, see Section 7.1.2), there is a significant potential to increase the deposition hole locations having a transport resistance in the range of 3·104 to 106 a/m, but transport resistances below 104 a/m remain exceptional.
For a few canister positions and for a limited time, the target properties related to the groundwater composition, salinity, chloride content and total charge concentration of cations, may be violated. These potential deviations will disappear soon after the closure of the repository and thus, will not be detrimental to the backfill, buffer or canister.
There are modelling results that indicate the possibility, towards the end of the temperate period, of a few percent of the canister positions experiencing such dilute conditions that chemical erosion of the buffer is possible. This result is however considered to be more a consequence of the simplified model assumptions adopted than to reflect the understanding of the hydrogeochemical evolution of the site. Dilute conditions may also be experienced during ice-sheet retreat, but the estimate of the number of such positions is strongly dependent on the possible duration of the melt water intrusion and especially on the modelling concept of the interaction between the fracture water and rock matrix.
Although most of groundwater chemistry data clearly indicate sulphide values below 1 mg/L, a pessimistic upper bound of 3 mg/L is adopted for corrosion calculations, which accounts for the possible solubility control by the more soluble amorphous iron sulphide in combination with the kinetically constrained availability of iron and the uncertainties related to microbial activity and availability of nutrients and energy sources.
In the case of full homogenisation of the buffer, the high density and small pore size will effectively restrict microbial activity, and sulphide diffusion in the buffer from groundwater passing through a fracture or through the backfill will be slow enough not to damage the canister during hundreds of thousands of years. If, however, low

420
density areas should persist, then significant sulphate reduction cannot be ruled out in the backfill or in the buffer. This will affect the timing of significant corrosion and the number of canisters that may be affected.
Chemical erosion due to the potential occurrence of dilute groundwater cannot be neglected. Although for reference assumptions on the evolution of groundwater flow, less than 10 deposition holes might experience sufficient erosion to give rise to advective conditions after one million years, uncertainties are such that the number of potentially affected holes may be much larger. For reference assumptions on groundwater flow and the evolution of groundwater composition, only one deposition hole is calculated to experience advective conditions after the first glacial cycle. However, considering the uncertainties, the analysis suggests that during the first glacial cycle, this erosion could result in advective conditions in anything up to around 3 canister positions if applying the Rock Suitability Classification (RSC) criteria. Without the application of RSC criteria, the number of positions with advective conditions after the first glacial cycle would increase slightly, with a maximum number of about 13.
While future large earthquakes are unlikely, they cannot fully be excluded during the assessment period. If an earthquake of M ≥ 5 were to occur, this might imply that fractures intersecting a few deposition holes would shear more than 5 cm, even if careful criteria are applied to avoid such fractures. It is estimated that few tens of canisters are in positions such that they could potentially fail in such an event. However, as the average annual probability of the an earthquake leading to a canister failure is estimated to be low, in the order of 10-7, but the possibility of such an event cannot be neglected over a one million year time frame.
The combined effect of these deviations is to affect the functions of a limited number of deposition holes and canisters.
10.2 Input to scenario formulation and analysis
There are a few lines of evolution of the site and repository system where it is possible that several deposition holes and canisters will deviate from the performance targets. Such lines of evolution resulting in deviations from the performance targets need to be considered as a part of the formulation of radionuclide release scenarios. The analyses presented in this report allow the following feedback to be provided.
During the high-flow conditions related to the ice-sheet retreat, when the repository is still under the ice sheet (mobile ice sheet 10 years), there is a significant increase in potential deposition hole locations having lower transport resistance than expected.
Related to the uncertainties in predicting occurrence of dilute groundwater, it is possible that the potential deposition hole locations having lower transport resistance will also experience dilute conditions, which has been taken into account in corrosion calculations.
The uncertainty in the future evolution of sulphide levels has been considered in corrosion calculations.

421
Due to the uncertainties related to the frequency and impacts of earthquakes, the following cases are addressed as part of the scenario development: i) earthquake during the prolonged temperate period within a time window of 10,000−50,000 years, ii) earthquake at the time of ice-sheet retreat and locally increased flow rates and reduced transport resistances of the migration paths.
The uncertain number of deposition holes that may experience advective conditions due to chemical erosion need to be considered.
The flow conditions in the shearing fracture is considered in the scenario analysis.
The issue of long-term criticality is still under investigation and, for the time being, long-term criticality is not part of the formulation of release scenarios.
10.3 Limitations and uncertainties – need for further R&D
While the impact of uncertainties in process and site understanding can be bounded by assumptions made in Formulation of Radionuclide Release Scenarios and in Assessment of Radionuclide Release Scenarios for the Repository System, further research and development are justified. The following feedback is made based on the assessments made in the report for the purpose of the RTD programme 2013−2015.
10.3.1 Rock
Modelling groundwater flow during glaciation using a larger model than site-scale model will be useful as it will be hydrogeochemical modelling for the prolonged temperate period from 10,000 years to 50,000 years to see the effects of e.g. the continued infiltration of meteoric water on the groundwater composition.
Further efforts to understand the processes governing sulphide concentrations in the groundwater will be attempted.
All the modelling results show that the estimation of the salinity evolution and the groundwater evolution in general is sensitive to the parameters affecting salt transport; flow and diffusion porosity and dispersivity and the buffering effect of the matrix. Therefore a better understanding of the interactions of the fracture water and matrix pore waters will be developed.
Although there is a good understanding of the processes affecting the mechanical state of the rock in general, there are still uncertainties related to the elastic and rock strength parameters of the rock at Olkiluoto as well as concerning the in-situ stress state, which needs further study. The heterogeneity of the rock leads to spatial variations of rock properties, which challenge the assessment of rock damage. Currently a limited data set is available on the hydraulic properties of the EDZ or the rock damage zone (spalling); further data from experiments ongoing at ONKALO will be beneficial as an input to modelling.
The long time frames considered with respect to the available data lead to uncertain estimates of seismic activity. Therefore development of characterisation methods to be able to set bounds on the maximum size of the fractures and assess also other fracture properties in addition to size as indicators of fractures with the potential for faulting will

422
help in reducing the conservatism in the current large fracture (FPI) criterion. Concerning modelling, the development needs are related to considering the impact of non-planarity and varying properties of the faults and fractures, and representation of these, so that impacts at smaller distances to ruptures can be studied. Fälth & Hökmark (2011) note that the models applied do not account for potential effects of asperities that locally may give high stress drops or for irregularities or splays that may cause larger displacements in fractures located close by. Also further sensitivity studies on the number of deposition holes intersected by large fractures that escape detection are needed.
10.3.2 Closure
Although the closure of the disposal facility is not foreseen to start before the year 2070, it should be useful to begin characterisation of various backfill materials, which will withstand the possible physical and chemical processes that will affect them. Also, it would be meaningful to test the construction, installation, and functioning of mechanical and hydraulic plugs even if not at full scale, although this may not be an immediate priority in the next few years.
10.3.3 Buffer and backfill
Piping and erosion
Studies of the process of piping and erosion of the buffer and backfill material imply that some buffer and backfill material will be lost. Current assessments are based on empirical data and further investigations aiming at narrowing the conditions under which piping erosion may occur will be undertaken during 2013−2015.
Mass loss discussed in Section 5.4.2 is planned to be studied by using large scale, as so far the mass loss estimates are based on laboratory experimental data.
Homogenisation
Buffer and backfill homogenisation as a process is not completely understood and development of numerical models will continue. However, experiments such as transparent cell tests by Pintado et al. (2013a) show that, in practice, homogenisation takes place at the buffer-pellet-rock interface. Homogenisation has also been shown to take place in the backfill. Further tests are ongoing and information will also be gained from the dismantling of the Prototype Repository at Äspö. In addition, the development of the T-H-M modelling of homogenisation after mass loss is ongoing both by Posiva and SKB.
Buffer and backfill geochemistry
The geochemical conditions of the buffer and backfill are strongly influenced by those in the surrounding host rock. Therefore, uncertainties related to variations in flow and resulting geochemical conditions also apply to the near field. In particular, this holds for the conditions during the saturation stage.
Uncertainties in groundwater salinities are not expected to be of concern for the performance of buffer and backfill. The same statement holds for uncertainties in redox conditions affected by the ingress of molecular oxygen, the microbial degradation of
423
organic materials and methane, although these have not been assessed in a rigorous fashion.
The mechanisms for activity and survival of microbes in bentonite for backfill and buffer materials are not fully understood. A related uncertainty concerns the range of sulphide concentrations that might arise in the case of SRB activity in the backfill. It has been stated that the viability of the spores in the fully compacted, saturated bentonite buffer with high density will slowly decrease and finally cease in the long term, but there are uncertainties in the time span over which this would occur. A large water/bentonite ratio may stimulate dormant microbes to an active life. If the bentonite becomes sterile, it will most probably not be re-infected, unless it is affected by erosion. The sum of stress factors, radiation, heat, low water availability and a high mechanical pressure results in death of the microbes. However, the exact mechanisms for the observed disappearance of viability of micro-organisms remain to be clarified.
There are uncertainties related to the release of cementitious leachates to deposition holes and tunnels. The largest effect on the buffer’s performance may be during saturation due to an advective flux of high pH water influenced by the degradation of grout materials. However, even under pessimistic assumptions on the release of cementitious leachates, the flux of cementitious leachates reaching the clay barriers seems to be insignificant.
The uncertainties related to thermal effects on montmorillonite transformation have been assessed by simplified bounding analyses. It has been found that cementation in bentonite will not occur or will be limited, if the temperature at the canister-buffer interface stays well below 100 oC. Experimental work is ongoing to increase understanding of thermally-induced montmorillonite transformation.
Also the understanding of the aggregation of colloids of silica sol and bentonite is still uncertain. Other issues relate to long-term silica sol durability and uncertainties about silica colloid release, and whether these colloids could affect radionuclide transport. There is little relevant information yet available upon which to base any statements about the long-term behaviour of the silica sol. The amount of colloids introduced through e.g. degradation of EBS materials is expected to be low in the high ionic strength groundwaters, but the evolution of the population of colloids associated with the degradation of repository materials, including their mobility and stability under changing groundwater conditions will be studied.
Chemical erosion
The assessment of the possible effect of chemical erosion on buffer mass loss relies heavily upon several theoretical modelling assumptions related to the climate scenario with the duration of ice sheets and related flow modelling, and erosion modelling. The erosion model itself is rather nonlinear (input parameters vary over several orders of magnitude) and complex (representing a fully-coupled transport model of montmorillonite sol), and, as a result, numerical errors in the calculations may be significant.
Specifically, the erosion model assumes that the eroding bentonite consists entirely of sodium montmorillonite and that it interacts only with monovalent electrolyte systems.

424
Insofar as the experimental evidence (see above in Section 7.6) indicates that, in the presence of nonzero electrolyte concentrations, montmorillonite containing equivalent calcium/sodium exchangeable cation fractions erodes at lower rates than pure sodium montmorillonite. Pure sodium montmorillonite represents an unrealistic initial assumption, so the model may be over-predicting erosive mass loss.
There is some conjecture that, due to montmorillonite erosion, accessory mineral particles in bentonite materials will “build-up” and form a “filter cake” which may limit the loss of clay mass (Neretnieks et al. 2009). Experimental results indicate that montmorillonite mass loss can be slowed or possibly stopped due to filtration effects (Birgersson et al. 2009) and that added, inert minerals will form into an extended layer at the solid/liquid interface in an intersecting, transmissive fracture environment (Schatz & Kanerva 2012). However no experimental or analogue results are available indicating that a naturally-formed filter cake would actually limit erosion.
Another, important point, that will be further examined, is the interaction between eroding material and fracture surfaces with regard to filtration or attachment effects leading to possible fracture clogging or sealing. Such effects, if present, might be expected to slow mass loss as well.
10.3.4 Canister
Research on different copper corrosion mechanisms continues even if impacts of processes are bounded. Posiva follows the developments of SCC studies within the framework of the Finnish research programme on nuclear waste management (KYT). Copper corrosion in pure water under anoxic conditions is currently being studied at VTT to better understand (or discard) the mechanism recently proposed.
Complementary studies concerning criticality safety will be carried out for the operational license application. Some validation of the calculation system will be performed and the impact of various uncertainties will be assessed. Long-term criticality aspects will also be discussed.
10.4 Statement of confidence
In making a statement of confidence, as to say that the performance targets and target properties will hold for most of the assessment time, and for most of the canisters containing the spent nuclear fuel to be isolated, we must be sure that:
1. the consideration of future evolution lines (i.e. scenarios) has been thorough and sufficient, meaning that the FEPs considered important for the evolution of the repository and the site have been taken into account;
2. the observations, models, experiments, and scientific background on which the statement is based are up to date;
3. there is a willingness and intent to answer any and all “did you think of this” questions in the context of evolution (i.e. through the formulation of scenarios).
This report started by introducing the stakeholders and regulatory framework for spent nuclear fuel disposal at the Olkiluoto site. The safety functions and corresponding targets and target properties are also given, the bases of which are more thoroughly

425
explained in Design Basis (see Chapters 1 and 2). The initial state, with the features and properties of each of the disposal facility components, has been summarised in Chapter 3 and more thoroughly in Description of the Disposal System. The most important FEPs for the evolution of the repository system (and disposal facility) are then taken into account and linked to the performance targets and target properties in Chapter 4 (for details see Features, Events and Processes). In this same Chapter, it is emphasised that climate evolution is the overarching FEP covering disposal system evolution, and also that migration-related FEPs are taken into account coupled to evolution-related FEPs in describing and analysing the evolution of the repository system.
The description and analysis of the future evolution(s) thus starts from the geosphere or the host rock, in which evolution of the groundwater flow and groundwater chemistry play a major role in the evaluation that during its evolution, the target properties for the groundwater defined as favourable for long-term containment and isolation hold with only a few exceptions given by the uncertainty in future sulphide concentrations and the extent to which dilute groundwater may reach the repository depth. The possible formation of high pH leachates may also pose a threat, but it is assessed to be localised and not to affect large areas in the repository system. The target property concerning the rock shear movements is also satisfied because the likelihood of canister damage as a result of earthquake-induced shear displacements is low. In addition to changes in the flow and groundwater composition, the assessment in Chapter 5 has not revealed any process that would change the buffering capacity of the rock and thereby change the favourable properties of the host rock with regard to matrix diffusion and sorption during the assessment period.
The evolution of the geosphere is taken into account in describing and analysing the evolution of the buffer, the backfill, and the canister, which − if designed and emplaced carefully − should, during nearly the whole assessment time, fulfil the assigned performance targets. The uncertainties found in the evolution of the geosphere are propagated to the buffer, backfill, and canister. As an example, it is noted that if dilute waters reach repository depth, a few deposition holes would be affected resulting in the buffer having a density outside the margins of the required range. If the buffer is then not protecting the canister, subsequent corrosion by sulphide is the most likely process to violate the safety function of containment.
Rock shear (i.e. reactivations or displacements along existing fractures) that could be triggered most probably by a postglacial earthquake has been dealt with as part of the host-rock evolution and in connection also with the buffer and canister properties.
Summarising, the FEPs considered important for the evolution of the repository and the site have been taken into account individually and in connection with each other.
The observations, models, experiments, and scientific background on which the statement is based on are up to date, since the very latest information on the site, and the most relevant research publications have been used.
The main uncertainties identified in the present report are carried to the formulation of radionuclide release scenarios and to the RTD programme, in case they have a significant impact on long-term safety. Questions may arise that Posiva have not

426
thought of, or thought of but considered not relevant, and there is a preparedness to deal with this, if not immediately, through forthcoming RTD programmes.
427
REFERENCES
TURVA-2012 Portfolio MAIN reports:
Assessment of Radionuclide Release Scenarios for the Repository System Safety case for the disposal of spent nuclear fuel at Olkiluoto - Assessment of Radionuclide Release Scenarios for the Repository System 2012. Eurajoki, Finland: Posiva Oy. POSIVA 2012-09. ISBN 978-951-652-190-2.
Biosphere Assessment Safety case for the disposal of spent nuclear fuel at Olkiluoto - Biosphere Assessment BSA-2012. Eurajoki, Finland: Posiva Oy. POSIVA 2012-10. ISBN 978-951-652-191-9.
Biosphere Data Basis Safety case for the disposal of spent nuclear fuel at Olkiluoto - Data Basis for the Biosphere Assessment BSA-2012. Eurajoki, Finland: Posiva Oy. POSIVA 2012-28. ISBN 978-951-652-209-1.
Biosphere Radionuclide Transport and Dose Assessment Modelling Safety case for the disposal of spent nuclear fuel at Olkiluoto - Radionuclide transport and dose assessment for humans in the biosphere assessment BSA-2012. Eurajoki, Finland: Posiva Oy. POSIVA 2012-31. ISBN 978-951-652-212-1.
Complementary Considerations Safety case for the disposal of spent nuclear fuel at Olkiluoto - Complementary Considerations 2012. Eurajoki, Finland: Posiva Oy. POSIVA 2012-11. ISBN 978-951-652-192-6.
Description of the Disposal System Safety case for the disposal of spent nuclear fuel at Olkiluoto - Description of the Disposal System 2012. Eurajoki, Finland: Posiva Oy. POSIVA 2012-05. ISBN 978-951-652-186-5.
Design Basis Safety case for the disposal of spent nuclear fuel at Olkiluoto - Design Basis 2012. Eurajoki, Finland: Posiva Oy. POSIVA 2012-03. ISBN 978-951-652-184-1.
Dose Assessment for Plants and Animals Safety case for the disposal of spent nuclear fuel at Olkiluoto - Dose assessment for plants and animals in the biosphere assessment BSA-2012. Eurajoki, Finland: Posiva Oy. POSIVA 2012-32. ISBN 978-951-652-213-8.
Features, Events and Processes Safety case for the disposal of spent nuclear fuel at Olkiluoto - Features, Events and Processes 2012. Eurajoki, Finland: Posiva Oy. POSIVA 2012-07. ISBN 978-951-652-188-9.

428
Formulation of Radionuclide Release Scenarios Safety case for the disposal of spent nuclear fuel at Olkiluoto - Formulation of Radionuclide Release Scenarios 2012. Eurajoki, Finland: Posiva Oy. POSIVA 2012-08. ISBN 978-951-652-189-6.
Models and Data for the Repository System Safety case for the disposal of spent nuclear fuel at Olkiluoto - Models and Data for the Repository System 2012. Eurajoki, Finland: Posiva Oy. POSIVA 2013-01.
Surface and Near-Surface Hydrological Modelling Safety case for the disposal of spent nuclear fuel at Olkiluoto - Surface and near-surface hydrological modelling in the biosphere assessment BSA-2012. Eurajoki, Finland: Posiva Oy. POSIVA 2012-30. ISBN 978-951-652-211-4.
Synthesis Safety case for the disposal of spent nuclear fuel at Olkiluoto – Synthesis 2012. Eurajoki, Finland: Posiva Oy. POSIVA 2012-12. ISBN 978-951-652-193-3.
Terrain and Ecosystem Development Modelling Safety case for the disposal of spent nuclear fuel at Olkiluoto - Terrain and ecosystems development modelling in the biosphere assessment BSA-2012. Eurajoki, Finland: Posiva Oy. POSIVA 2012-29. ISBN 978-951-652-210-7.
TURVA-2012 Portfolio SUPPORTING reports:
Backfill Production Line report Backfill Production Line 2012 - Design, production and initial state of the deposition tunnel backfill and plug. Eurajoki, Finland: Posiva Oy. POSIVA 2012-18. ISBN 978-951-652-199-5.
Biosphere Description Olkiluoto Biosphere Description 2012. Eurajoki, Finland: Posiva Oy. POSIVA 2012-06. ISBN 978-951-652-187-2.
Buffer Production Line report Buffer Production Line 2012 - Design, production and initial state of the buffer. Eurajoki, Finland: Posiva Oy. POSIVA 2012-17. ISBN 978-951-652-198-8.
Canister Production Line report Canister Production Line 2012 - Design, production and initial state of the canister. Eurajoki, Finland: Posiva Oy. POSIVA 2012-16. ISBN 978-951-652-197-1.
Closure Production Line report Closure Production Line 2012 - Design, production and initial state of closure. Eurajoki, Finland: Posiva Oy. POSIVA 2012-19. ISBN 978-951-652-200-8.
Site Description Olkiluoto Site Description 2011. Eurajoki, Finland: Posiva Oy. POSIVA 2011-02. ISBN 978-951-652-179-7.

429
Underground Openings Production Line report Underground Openings Production Line 2012 - Design, production and initial state of the underground openings. Eurajoki, Finland: Posiva Oy. POSIVA 2012-22. ISBN 978-951-652-203-9.
Other references:
Aagard, P. & Helgeson, H. C. 1983. Activity/composition relations among silicates and aqueous solutions: II. Chemical and thermodynamic consequences of ideal mixing of atoms on homological sites in montmorillonites, illite and mixed-layer clays. Clays and Clay Minerals. Vol. 31, p. 207-217. ISSN 00098604.
Aalto, P. (ed.), Helin, J., Lindgren, S., Pitkänen, P., Ylä-Mella, M., Ahokas, H., Heikkinen, E., Klockars, J., Lahdenperä, A.-M., Korkealaakso, J., Lamminmäki, T., Pedersen, K. & Karvonen, T. 2011. Baseline report for Infiltration Experiment. Eurajoki, Finland: Posiva Oy. Working Report 2011-25. 152 p.
Aaltonen, I. (ed.), Lahti, M., Engström, J., Mattila, J., Paananen, M., Paulamäki, S., Gehör, S., Kärki, A., Ahokas, T., Torvela, T. & Front, K. 2010. Geological model of the Olkiluoto site - version 2.0. Eurajoki, Finland: Posiva Oy. Working Report 2010-70. 580 p.
Abercrombie, H.J., Hutcheon, I.E., Bloch, J.D. & De Caritat, P. 1994. Silica activity and the smectite-illite reaction. Geology. Vol. 22, no. 6, p. 539-542.
Ahjos, T., Saari, J., Penttilä, E. & Korhonen, H. 1984. Earthquakes and seismic hazard in Finland. Engineering Geology. Vol. 20, p. 1-12.
Ahokas, H., Hellä, P., Ahokas, T., Hansen, J., Koskinen, K., Lehtinen, A., Koskinen, L., Löfman, J., Mészaros, F., Partamies, S., Pitkänen, P., Sievänen, U., Marcos, N., Snellman, M. & Vieno, T. 2006. Control of water inflow and use of cement in ONKALO after penetration of fracture zone R19. Olkiluoto, Finland: Posiva Oy. Working Report 2006-45. 160 p.
Ahonen, L., Korkeakoski, P., Tiljander, M., Kivikoski, H. & Laaksonen, R. 2008. Quality assurance of the bentonite material. Eurajoki, Finland: Posiva Oy. Working Report 2008-33. 122 p.
Åkesson, M., Kristensson, O., Börgesson, L., Dueck, A. & Hernelind, J. 2010a. THM modelling of buffer, backfill and other system components. Critical processes and scenarios. Stockholm, Sweden: Swedish Nuclear Fuel and Waste Management Co. (SKB). Technical Report TR-10-11. 368 p. ISSN 1404-0344.
Åkesson, M., Börgesson, L., & Kristensson, O. 2010b. SR-Site Data report. THM modelling of buffer, backfill and other system components. Stockholm, Sweden: Swedish Nuclear Fuel and Waste Management Co. (SKB). Technical Report TR-10-44. 98 p. ISSN 1404-0344.
Alexander, W.R. & Milodowski, A.E. (eds.) 2011. Cyprus Natural Analogue Project: Phase II Final Report. Eurajoki, Finland: Posiva Oy. Working Report 2011-08. 216 p.
430
Alexander, W.R., Berry, J.A., Kelly, M.J. & Swanton, S. 2011. Review of colloids in the geosphere and their treatment in performance assessment. Didcot, UK: Serco. Report to NDA-RWMD. Serco/TAS/002924/01.
Alonso, E.E., Gens, A. & Josa, A. 1990. A constitutive model for partially saturated soils. Géotechnique. Vol. 40, no. 3, p. 405-430.
Anderson, C.R. & Pedersen, K. 2003. In situ growth of Gallionella biofilms and partitioning of lanthanides and actinides between biological material and ferric oxyhydroxides. Geobiology. Vol. 1, no. 3. p. 169–178.
Anderson, C.R., James, R.E., Fru, E.C., Kennedy, D.B. & Pedersen, K. 2006. In situ ecological development of a bacteriogenic iron oxide-producing microbial community from a subsurface granitic rock environment. Geobiology. Vol. 4, p. 24–42. doi: 10.1111/j.1472-4669.2006.00066.x.
Andersson, J., Ahokas, H., Hudson, J.A., Koskinen, L., Luukkonen, A., Löfman, J., Keto, V., Pitkänen, P., Mattila, J., Ikonen, A.T.K. & Ylä-Mella, M. 2007. Olkiluoto Site Description 2006. Olkiluoto, Finland: Posiva Oy. POSIVA 2007-03. 536 p. ISBN 978-951-652-151-3.
Andersson-Östling, H.C.M. & Sandström, R. 2009. Survey of creep properties of copper intended for nuclear waste disposal. Stockholm, Sweden: Swedish Nuclear Fuel and Waste Management Co. (SKB). Technical Report TR-09-32. 96 p. ISSN 1404-0344.
Anttila, M. 1999. Criticality safety calculations of the nuclear waste disposal canisters for twelve spent fuel assemblies. Helsinki, Finland: Posiva Oy. Working Report 1999-03. 20 p.
Anttila, M. 2005. Criticality safety calculations for three types of final disposal canisters. Olkiluoto, Finland: Posiva Oy. Working Report 2005-13. 23 p.
Appelo, C.A.J. & Postma, D. 2005. Geochemistry, groundwater and pollution. 2nd ed. Rotterdam, The Netherlands: Balkema. 683 p. ISBN-10: 0415364280, ISBN-13: 978-0415364287.
Apted, M.J., Arthur, R., Bennett, D., Savage, D., Sällfors, G. & Wennerström, H. 2010. Buffer erosion: An overview of concepts and potential safety consequences. Stockholm, Sweden: Swedish Radiation Safety Authority (SSM). Report 2010-31. 76 p. ISSN 2000-0456.
Arcos, D., Grandia, F. & Domènech, C. 2006. Geochemical evolution of the near-field of a KBS-3 repository. Stockholm, Sweden: Swedish Nuclear Fuel and Waste Management Co. (SKB). Technical Report TR-06-16. 94 p. ISSN 1404-0344.
Arenius, M., Hansen, J., Juhola, P., Karttunen, P., Koskinen, K., Lehtinen, A., Lyytinen, T., Mattila, J., Partamies, S., Pitkänen, P., Raivio, P., Sievänen, U., Vuorinen, U. & Vuorio, M. 2008. R20 Summary Report: The groundwater inflow management in
431
ONKALO – the future strategy. Eurajoki, Finland: Posiva Oy. Working Report 2008-44. 234 p.
Arilahti, E., Lehtikuusi, T., Olin, M., Saario, T. & Varis, P. 2010. Evidence for internal diffusion of sulphide from groundwater into grain boundaries ahead of a crack tip in a CuOFP copper. 4th International workshop on long-term prediction of corrosion damage in nuclear waste systems. Brugges, Belgium, June 28 – July 2, 2010.
Arthur, R. 2011. Handling of hydrogeochemical relations in erosion and swelling pressure models for the buffer and backfill. Helsinki, Finland: Radiation and Nuclear Safety Authority (STUK). STUK-TR 10. 4 p. + 30 p. + 15 p. ISBN 978-952-478-638-6 (print), ISBN 978-952-478-639-3 (pdf), ISSN 1796-7171.
Arthur, R. & Zhou, W. 2005. Reactive-transport model of buffer cementation. Stockholm, Sweden: Swedish Nuclear Power Inspectorate (SKI). SKI Report 2005:59. 36 p. ISSN 1104-1374.
ASME Section III 2008. ASME Boiler & Pressure Vessel Code, Section III – Rules for construction of nuclear power plant components – Divisions 1 and 2. New York, USA: ASME International.
ASME Section XI 2008. ASME Boiler & Pressure Vessel Code, Section XI – Rules for inservice inspection of nuclear power plant components. New York, USA: ASME International.
Atkins, P. & de Paula, J. 2002. Physical chemistry (7th Edition). Oxford University Press. 1149 p.
Autio, J., Hassan, Md. M., Pintado, X., Keto, P. & Karttunen, P. 2012. Backfill design. Eurajoki, Finland: Posiva Oy. POSIVA 2012-15. ISBN 978-951-652-196-4.
Barcena, I., Fuentes-Cantillana, J. & García-Siñeriz, J. 2003. Dismantling of the heater 1 at the FEBEX “in situ” test. Madrid, Spain: Asociación para la Investigación y Desarrollo (AITEMIN). Tech Report 70-AIT-L-6-03. 134 p.
Barker, D., Sharp, M.J., Fitzsimons, S.J. & Turner, R.J. 2006. Abundance and dynamics of dissolved organic carbon in glacier systems. Artic, Antarctic, and Alpine Research. Vol. 38, no. 2, 163-172. ISSN 1523-0430.
Barnett, J.A.M., Mortimer, J., Rippon, J.H., Walsh, J.J. & Watterson, J. 1987. Displacement geometry in the volume containing a single normal fault. American Association of Petroleum Geologists Bulletin. Vol. 71, no. 8. p. 925-937. ISSN 01491423.
Becker, R. & Hermansson, H.-P. 2011. Evolution of hydrogen by copper in ultrapure water without dissolved oxygen. Stockholm, Sweden: Swedish Radiation Safety Authority. Research 2011:34. ISSN 2000-0456. 27 p.
432
Birgersson, M. & Karnland, O. 2009. Ion equilibrium between montmorillonite interlayer space and an external solution—Consequences for diffusional transport. Geochimica et Cosmochimica Acta 73 (2009) p. 1908–1923. Birgersson, M., Börgesson, L., Hedström, M., Karnland, O. & Nilsson, U. 2009. Bentonite Erosion, Final Report. Stockholm, Sweden: Swedish Nuclear Fuel and Waste Management Co. (SKB). Technical Report TR-09-34. 171 p. ISSN 1404-0344.
Birgersson, M., Karnland, O. & Nilsson, U. 2010. Freezing of bentonite. Stockholm, Sweden: Swedish Nuclear Fuel and Waste Management Co. (SKB). Technical Report TR-10-40. 50 p. ISSN 1404-0344.
Black, P.B. 1995. Applications of the Clapeyron equation to water and ice in porous media. Hanover, NH, USA: U.S. Army Cold Regions Research and Engineering Laboratory. CRREL Report 95-6. 7 p.
Bödvarsson, R., Lund, B., Roberts, R. & Slunga, R. 2006. Earthquake activity in Sweden. Study in connection with a proposed nuclear waste repository in Forsmark or Oskarshamn. Stockholm, Sweden: Swedish Nuclear Fuel and Waste Management Co. (SKB). Report R-06-67. 40 p. ISSN 1402-3091.
Boetius, A., Ravenschlaug, K., Schubert, C.J., Rickert, D., Widdel, F., Gleseke, A., Amann, R., Jörgensen, B.B., Witte, U. & Pfannkuche, O. 2000. A marine microbial consortium apparently mediating anaerobic oxidation of methane. Nature. Vol. 407, no. 6804, p. 623-626. ISSN 0028-0836.
Bojinov, M., Betova I. & Lilja, C. 2010. A mechanism of interaction of copper with a deoxygenated neutral aqueous solution. Corrosion Science. Vol. 52, no. 9, p. 2917-2927.
Börgesson, L. & Hernelind, J. 2009. Mechanical interaction buffer/backfill. Finite element calculations of the upward swelling of the buffer against both dry and saturated backfill. Stockholm, Sweden: Swedish Nuclear Fuel and Waste Management Co. (SKB). Report R-09-42. 32 p. ISSN 1402-3091.
Börgesson, L. & Sandén, T. 2006. Piping and erosion in buffer and backfill materials. Current knowledge. Stockholm, Sweden: Swedish Nuclear Fuel and Waste Management Co. (SKB). Report R-06-80. 21 p. ISSN 1402-3091.
Börgesson, L. & Hernelind, J. 2009. Mechanical interaction buffer/backfill. Finite element calculations of the upward swelling of the buffer against both dry and saturated backfill. Stockholm, Sweden: Swedish Nuclear Fuel and Waste Management Co. (SKB). Report R-09-42.
Börgesson, L., Dueck, A. & Johannesson, L.-E. 2010. Material model for shear of the buffer. Evaluation of laboratory test results. Stockholm, Sweden: Swedish Nuclear Fuel and Waste Management Co. (SKB). Technical Report TR-10-31. 27 p. ISSN 1404-0344.

433
Bruno, J., Arcos, D. & Duro, L. 1999. Processes and features affecting the near field hydrochemistry. Groundwater - bentonite interactions. Stockholm, Sweden: Swedish Nuclear Fuel and Waste Management Co. (SKB). Technical Report TR-99-29. 56 p. ISSN 1404-0344.
Cama, J., Ganor, J., Ayora, C. & Lasagna, C.A. 2000. Smectite dissolution kinetics at 80°C and pH 8.8. Geochimica et Cosmochimica Acta. Vol. 64, no. 15, p. 2701-2712.
Canfield, D. 1989. Reactive iron in marine sediments. Geochimica et Cosmochmica Acta. Vol. 53, no. 3, p. 619-632.
Carlson, L. 2004. Bentonite mineralogy. Part 1: methods of investigation – a literature review. Part 2: mineralogical research of selected bentonites. Olkiluoto, Finland: Posiva Oy. Working Report 2004-02. 105 p.
Carlson, L., Karnland, O., Olsson, S., Smart, N. & Rance, A. 2006. Experimental studies on the interaction between anaerobically corroding iron and bentonite. Olkiluoto, Finland: Posiva Oy. Working Report 2006-60. 83 p.
Cau Dit Coumes, C., Courtois, S., Nectoux, D., Leclercq, S. & Bourbon, X. 2006. Formulating a low-alkalinity, high-resistance and low-heat concrete for radioactive waste repositories. Cement and Concrete Research. Vol. 36, no. 12, p. 2152-2163. ISSN 00088846.
Chen, J., Qin, Z. & Shoesmith, D.W. 2011a. Rate controlling reactions for copper corrosion in anaerobic aqueous sulphide solutions. Corros. Sci. Eng. Technol. Vol. 46, p. 138-141.
Chen, J., Qin, Z. & Shoesmith, D.W. 2011b. Long-term corrosion of copper in a dilute anaerobic sulphide solution. Electrochim. Acta. Vol. 56, p. 7854-7861.
Cowie, P.A. & Scholz, C.H. 1992. Growth of faults by accumulation of seismic slip. Journal of Geophysical Research-Solid Earth. Vol. 97, p. 11085-11095.
Crawford, M.B. & Wilmot, R.D. 1998. Normal evolution of a spent fuel repository at the candidate sites in Finland. Helsinki, Finland: Posiva Oy. POSIVA 98-15. 89 p. ISBN 951-652-053-7.
Cuadros, J. & Linares, J. 1996. Experimental kinetic study of the smecite-to-illite transformation. Geochimica et Cosmochimica Acta. Vol. 60, no. 3, p. 439-453. ISSN 00167037.
Dash, J.G., Rempel, A.W. & Wettlaufer, J.S. 2006. The physics of premelted ice and its geophysical consequences. Reviews of Modern Physics. Vol. 78, no. 3, p. 695-741. ISSN 00346861.
Daucousse, D. & Lloret, A. 2003. Results of “in situ” measurements of water content and dry density. FEBEX II project. Barcelona, Spain: CIMNE. 70-UPC-L-5-012.
434
Davison, W. 1991. The solubility of iron sulphides in synthetic and natural waters at ambient temperature. Aquatic Sciences. Vol. 53, no. 4, p. 309-29. ISSN 10151621.
Davison, W., Phillips, N. & Tabner, B.J. 1999. Soluble iron sulphide species in natural waters: Reappraisal of their stoichiometry and stability constants. Aquatic Sciences. Vol. 61, no. 1, p. 23-43.
Dawers, N.H., Anders, M.H. & Scholz, C.H. 1993. Growth of normal faults: displacement-length scaling. Geology. Vol. 21, no. 12, p. 1107-1110. ISSN 00917613.
Degueldre, C., Pfeiffer, H.-R., Alexander, W.R., Wernli, B. & Bruetsch, R. 1996. Colloid properties in granitic groundwater systems. I Sampling and characterisation. Applied Geochemistry. Vol. 11, no. 5, p. 677-695. ISSN 08832927, ISBN 0521330246.
Delos, A., Trinchero, P., Richard, L. Molinero, J., Dentz, M. & Pitkänen, P., 2010. Quantitative assessment of deep gas migration in Fennoscandian sites. Stockholm, Sweden: Swedish Nuclear Fuel and Waste Management Co. (SKB). Report R-10-61. 59 p.
Dillström, P. & Bolinder, T. 2010. Damage tolerance analysis of canister inserts for spent nuclear fuel in the case of an earthquake induced rock shear load. Stockholm, Sweden: Swedish Nuclear Fuel and Waste Management Co. (SKB). Technical Report TR-10-29. 49 p. ISSN 1404-0344.
Dillström, P., Alverlind, L. & Andersson, M. 2010. Development of acceptance criteria and damage tolerance assessment of the cast iron insert (in Swedish: Framtagning av acceptanskriterier samt skadetålighetsanalyser av segjärn insatsen). Stockholm, Sweden: Swedish Nuclear Fuel and Waste Management Co. (SKB). Report R-10-11. 129 p. ISSN 1402-3091.
Dixon, D., Anttila, S., Viitanen, M. & Keto, P. 2008a. Tests to determine water uptake behaviour of tunnel backfill (Baclo Tests at Äspö). Stockholm, Sweden: Swedish Nuclear Fuel and Waste Management Co. (SKB). Report R-08-134. 148 p. ISSN 1402-3091.
Dixon, D., Lundin, C., Örenthal, E., Hedin, M. & Ramqvist, G. 2008b. Deep repository, engineering barrier system. Half scale tests to examine water uptake by bentonite pellets in a block–pellet backfill system. Stockholm, Sweden: Swedish Nuclear Fuel and Waste Management Co. (SKB). Technical Report R-08-132. 110 p. ISSN 1402-3091.
Dixon, D., Jonsson, E., Hansen, J., Hedin, M. & Ramqvist, G. 2011. Effect of localized water uptake on backfill hydration and water movement in a backfilled tunnel: Half-scale tests at Äspö Bentonite Laboratory. Stockholm, Sweden: Swedish Nuclear Fuel and Waste Management Co. (SKB). Report R-11-27. 54 p. ISSN 1402-3091.
Dixon, D., Hansen, J., Karvonen, T., Korkiala-Tanttu, L., Marcos, N. & Sievänen, U. 2012. Underground Disposal Facility Closure Design 2012. Eurajoki, Finland: Posiva Oy. Working Report 2012-09.

435
Eng, A., Nilsson, U. & Svensson, D. 2007. Äspö hard rock laboratory, Alternative buffer material, Installation report. Stockholm, Sweden: Swedish Nuclear Fuel and Waste Management Co. (SKB). International Progress Report IPR-07-15. 65 p.
Eriksson, M. & Lindström, L. 2008. KBS-3H post-grouting. Mega-Packer test at -220 m level at Äspö HRL. Stockholm, Sweden: Swedish Nuclear Fuel and Waste Management Co. (SKB). Report R-08-42. 67 p. ISSN 1402-3091.
Eronen, M., Glückert, G., van de Plassche, O., van de Plicht, J. & Rantala, P. 1995. Land uplift in the Olkiluoto-Pyhäjärvi area, Southwestern Finland, during last 8000 years. Helsinki, Finland: Nuclear Waste Commission of Finnish Power Companies (YJT). Report YJT-95-17. 27 p. + app. ISSN-0359-548X.
Eshelby, J.D. 1957. The determination of the elastic field of an ellipsoidal inclusion, and related problems. Proceedings of the Royal Society of London. Series A, Mathematical and Physical Sciences. Vol. 241, no. 1226, p. 376-396. ISSN 13645021.
Fälth, B. & Hökmark, H. 2011. Modelling end-glacial earthquakes at Olkiluoto. Eurajoki, Finland: Posiva Oy. Working Report 2011-13. 74 p.
Fälth, B. & Hökmark, H. 2012. Modelling end-glacial earthquakes at Olkiluoto. Expansion of the 2010 study. Eurajoki, Finland: Posiva Oy. Working Report 2012-08. 41 p.
Fälth, B., Hökmark, H. & Munier, R. 2010. Effects of large earthquakes on a KBS-3 repository. Evaluation of modelling results and their implications for layout and design. Stockholm, Sweden: Swedish Nuclear Fuel and Waste Management Co. (SKB). Technical Report TR-08-11. 171 p. ISSN 1404-0344.
FENCAT (Earthquake Catalogue for Northern Europe) (data until 31.12.2010). Institute of Seismology of Helsinki University. 2011. www.helsinki.fi/geo/seismo/index.html.
Fenton, C., Adams, J. & Halchuk, S. 2006. Seismic hazards assessment for radioactive waste disposal sites in regions of low seismic activity. Geotechnical and Geological Engineering. Vol. 24, no. 3, p. 579-592. ISSN 09603182.
Ferris, F.G., Konhauser, K.O., Lyven, B. & Pedersen K. 1999. Accumulation of metals by bacteriogenic iron oxides in a subterranean environment. Geomicrobiology Journal. Vol. 16, p. 181-192. DOI:10.1080/014904599270677.
FIM Friedland Industrial Minerals GmbH 2011a. FIMONIT SEAL bentonite-aggregate for mixed granular mineral seals (in German: FIMONIT SEAL Bentonit-Zuschlagsstoff für gemischt körnige mineralische Dichtungen). Berlin, Germany: FIM Friedland Industrial Minerals GmbH. Available http://www.friemin.de/download/ 090525_fimonit_seal_d.pdf. Referred 10.10.2011. Appendix 3.2.
FIM Friedland Industrial Minerals GmbH 2011b. frieBOfast DG 8-16 for well boring. Sealing granules of Friedland bentonite (in German: frieBOfast DG 8-16 für den Brunnenbau. Dichtungsgranulat aus Friedland Bentonit). Friedland, Germany: FIM

436
Friedland Industrial Minerals GmbH. Available: http://www.friemin.de/ download/friebofast_datenblatt.pdf. Referred 10.10.2011. Appendix 3.1.
Finnish Concrete Association 2004. by 50, Concrete Code 2004 (in Finnish: by 50, Betoninormit 2004). Helsinki, Finland: Finnish Concrete Association. 263 p. ISBN 952-5075-60-5, ISSN 0358-5239.
Fox, A., Forchhammer, K., Pettersson, A., La Pointe, P. & Lim, D.-H. 2012. Geological discrete fracture network model for Olkiluoto - version 2. Eurajoki, Finland: Posiva Oy. POSIVA 2012-27.
FUD 2010. RD&D Programme 2010. Programme for research, development and demonstration of methods for the management and disposal of nuclear waste. Sweden: Swedish Nuclear Fuel and Waste Management Co. (SKB). Technical Report TR-10-63. 455 p. ISSN 1104-8395.
Gaboreau, S., Prêt, D., Tinseau, E., Claret, F., Pellegrini, D. & Stammose, D. 2011. 15 years of in situ cement–argillite interaction from Tournemire URL: Characterisation of the multi-scale spatial heterogeneities of pore space evolution. Applied Geochemistry. Vol. 26, no. 12, p. 2159-2171. ISSN 08832927.
García-García, S., Wold, S. & Jonsson, M. 2007. Kinetic determination of critical coagulation concentrations for sodium- and calcium-montmorillonite colloids in NaCl and CaCl2 aqueous solutions. Journal of Colloid and Interface Science. Vol. 315, no. 2, p. 512-519.
Garrels, R.M. 1984. Montmorillonite/illite stability diagrams. Clays and Clay Minerals. Vol. 32, no. 3, p. 161-166. ISSN 00098604.
Garrels, R.M. & Christ, C.L. 1965. Solutions, minerals and equilibria. New York, USA: Harper and Row. 450 p. ISBN-10: 0877353336, ISBN-13: 978-0877353331.
Gaucher, E. & Blanc, P. 2006. Cement/clay interactions - A review: Experiments, natural analogues, and modeling. Waste Management. Vol. 26, no. 7, p. 776-788.
Gaucher, E.C., Tournassat, C., Pearson, F.J., Blanc, P., Crouzet, C., Lerouge, C. & Altmann, S. 2009. A robust model for pore-water chemistry of clayrock. Geochimica et Cosmochimica Acta. Vol. 73, p. 6470–6487.
Gehör, S. 2007. Mineralogical characterization of gouge fillings in ONKALO facility at Olkiluoto. Olkiluoto, Finland: Posiva Oy. Working Report 2007-33. 84 p.
Gehör, S., Karhu, J., Kärki, A., Löfman, J., Pitkänen, P., Ruotsalainen, P. & Taikina-aho, O. 2002. Fracture calcites at Olkiluoto: Evidence from Quaternary infills for palaeohydrogeology. Helsinki, Finland: Posiva Oy. POSIVA 2002-03. 118 p. ISBN 951-652-110-X.
Gelhar, L.W. 1987. Applications of stochastic models to solute transport in fractured rocks. Stockholm, Sweden: Swedish Nuclear Fuel and Waste Management Co. (SKB). Technical Report 87-05. 55 p.

437
Grandia, F., Domenech, C., Arcos, D. & Duro, L. 2006. Assessment of the oxygen consumption in the backfill. Stockholm, Sweden: Swedish Nuclear Fuel and Waste Management Co. (SKB). Report R-06-106. 37 p. ISSN 1402-3091.
Grandia, F., Galíndez, J.-M., Molinero, J. & Arcos, D. 2010. Evaluation of low-pH cement degradation in tunnel plugs and bottom plate systems in the frame of SR-Site. Stockholm, Sweden: Swedish Nuclear Fuel and Waste Management Co. (SKB). Technical Report TR-10-62. 49 p. ISSN 1404-0344.
Grim, R.E. & Güven, N. 1978. Bentonites: geology, mineralogy, properties and uses. Amsterdam, The Netherlands: Elsevier. 266 p (Developments in Sedimentology 24). ISBN-10: 0444416137, ISBN-13: 978-0444416131.
Gripenberg, H. 2009. Residual stress investigation of copper plate and canister EB weld complementary results. Eurajoki, Finland: Posiva Oy. Working Report 2009-21. 76 p.
Gubner, R. & Andersson, U. 2007. Corrosion resistance of copper canister weld material. Stockholm, Sweden: Swedish Nuclear Fuel and Waste Management Co. (SKB). Technical Report TR-07-07. 23 p. ISSN 1404-0344.
Gutenberg, B. & Richter, C.F. 1944. Frequency of earthquakes in California. Bulletin of the Seismological Society of America. Vol. 34, no. 4, p. 185-188. ISSN 00371106.
Guyonnet, D., Gaucher, E., Gaboriau, H., Pons, C. H., Clinard, C., Norotte, V. & Didier, G. 2005. GCL interaction with leachate: correlation between microstructure, surface chemistry and permeability. Journal of Geotechnical and Geoenvironmental Engineering. Vol. 131, no. 6, p. 740-749. ISSN 10900241.
Haaramo, M. & Lehtonen, A. 2009. Principal plug design for deposition tunnels. Eurajoki, Finland: Posiva Oy. Working Report 2009-38. 60 p.
Hagelia, P. & Sibbick, R.G. 2009. Thaumasite Sulfate Attack, Popcorn Calcite Deposition and acid attack in concrete stored at the «Blindtarmen» test site Oslo, from 1952 to 1982. Materials Characterization. Vol. 60, no. 7, p. 686-699.
Hakala, M., Hudson, J.A., Harrison, J.P. & Johansson, E. 2008. Assessment of the potential for rock spalling at the Olkiluoto site. Eurajoki, Finland: Posiva Oy. Working Report 2008-83. 60 p.
Hakanen, M., Ervanne, H. & Puukko, E. 2013. Safety case for the disposal of spent nuclear fuel at Olkiluoto: Radionuclide migration parameters for the geosphere. Eurajoki, Finland: Posiva Oy. POSIVA 2012-41. ISBN 978-951-652-221-3.
Hallbeck, L. 2010. Principal organic materials in a repository for spent nuclear fuel. Swedish Nuclear Fuel and Waste Management Co. (SKB), Stockholm, Sweden. Technical Report TR-10-19.
Hansen, J., Korkiala-Tanttu, L., Keski-Kuha, E. & Keto, P. 2010. Deposition tunnel backfill design for a KBS-3V repository. Eurajoki, Finland: Posiva Oy. Working Report 2009-129. 108 p.

438
Hartikainen, J. 2006. Numerical simulation of permafrost depth at Olkiluoto. Olkiluoto, Finland: Posiva Oy. Working Report 2006-52. 34 p.
Hartikainen, J. 2013. Simulations of permafrost evolution at Olkiluoto. Eurajoki, Finland: Posiva Oy. Working Report 2012-34.
Hartley, L., Hoek, J., Swan, D., Roberts, D., Joyce, S. & Follin, S. 2009. Development of a hydrogeological discrete fracture network model for the Olkiluoto Site Descriptive Model 2008. Eurajoki, Finland: Posiva Oy. Working Report 2009-61. 226 p.
Hartley, L., Hoek, J., Swan, D. & Roberts, D. 2010. Hydrogeological discrete fracture network modelling of groundwater flow under open repository conditions. Eurajoki, Finland: Posiva Oy. Working Report 2010-51. 102 p.
Hartley, L., Appleyard, P., Baxter, S., Hoek, J., Roberts, D. & Swan D. 2013a. Development of a hydrogeological discrete fracture network model for the Olkiluoto Site Descriptive Model 2011. Eurajoki, Finland: Posiva Oy. Working Report 2012-32 (to be published).
Hartley, L., Hoek, J., Swan, D., Appleyard, P., Baxter, S., Roberts, D. & Simpson, T. 2013b. Hydrogeological modelling for assessment of radionuclide release scenarios for the repository system 2012. Eurajoki, Finland: Posiva Oy. Working report 2012-42 (to be published).
Hartley, L., Hoek, J., Swan, D., Baxter, S. & Woollard, H. 2013c. Hydrogeological discrete fracture modelling to support Rock Suitability Classification. Eurajoki, Finland: Posiva Oy. Working Report 2012-48 (to be published).
Hauser, W., Geikeis, H., Kim, J.I. & Fierz, T. 2002. A mobile laser-induced breakdown detection system and its application for the in situ-monitoring of colloid migration. Colloids and Surfaces A. Vol. 203, no. 1-3, p. 37-45.
Hauser, W., Geckeis, H., Götz, R., Noseck, U. & Laciok, A. 2007. Colloid detection in natural ground water from Ruprechtov by laser-induced breakdown detection. In: Buckau, G. Kienzler, B., Duro, L. & Montoya, V. (eds.). 2nd Annual Workshop Proceeding of integrated project “Fundamental processes of Radionuclide Migration” - 6th EC FP IP FUNMIG, SKB Report TR-07-05, p. 367-373.
Haveman, S.A. & Pedersen, K. 2002. Distribution of culturable anaerobic microorganisms in Fennoscandian shield groundwater. FEMS Microbiology Ecology. Vol. 39, no. 2, p. 129-137. ISSN 0168-6496.
Haveman, S.A., Pedersen, K. & Ruotsalainen, P. 1999. Distribution and metabolic diversity of microorganisms in deep igneous rock aquifers of Finland. Geomicrobiology Journal. Vol. 16, no. 4, p. 277-294. ISSN 0149-0451.
Heidbach, O., Tingay, M., Barth, A., Reinecker, J., Kurfe, D. & Müller, B. 2008. The World Stress Map database release 2008. doi: 10.1594/GFZ.Rel200.
439
Henry, K.S. 2000. A review of the thermodynamics of frost heave. Hanover, NH, USA: U.S. Army Cold Regions Research and Engineering Laboratory. Technical Report ERDC/CRREL, TR-00-16. 19 p.
Hernelind, J. 2010. Modelling and analysis of canister and buffer for earthquake induced rock shear and glacial load. Stockholm, Sweden: Swedish Nuclear Fuel and Waste Management Co. (SKB). Technical Report TR-10-34. 124 p. ISSN 1404-0344.
Hiemenz, P.C. & Rajagopalan, R. 1997. Principles of colloid and surface chemistry. 3rd edition. New York, USA: Marcel Dekker, Inc. 653 p. ISBN 0824793978.
Hjerne, C., Nordqvist, R. & Harrström, J. 2009. Compilation and analyses of results from cross-hole tracer tests with conservative tracers. Stockholm, Sweden: Swedish Nuclear Fuel and Waste Management Co. (SKB). Report R-09-28. 75 p. ISSN 1402-3091.
Hökmark, H., Lönnqvist, M. & Fälth, B. 2010. THM-issues in repository rock. Thermal, mechanical, thermo-mechanical and hydro-mechanical evolution of the rock at the Forsmark and Laxemar sites. Stockholm, Sweden: Swedish Nuclear Fuel and Waste Management Co. (SKB). Technical Report TR-10-23. 276 p. ISSN 1404-0344.
Holmberg, J.-E. & Kuusela, P. 2011. Analysis of probability of defects in the disposal canisters. Eurajoki, Finland: Posiva Oy. Working Report 2011-36. 60 p.
Holmboe, M. 2011. The Bentonite Barrier: Microstructural properties and the influence of γ-radiation. Doctoral thesis, KTH, School of Chemical Science and Engineering (CHE), Chemistry, Nuclear Chemistry. 81 p.
Holmström, S., Laukkanen, A. & Andersson, T. 2013. Creep life simulations of EB welded copper overpack. Eurajoki, Finland: Posiva Oy. Working Report 2012-03.
Hölttä, P. & Hakanen, M. 2008. Silica colloids and their effect on radionuclide sorption - A literature review. Eurajoki, Finland: Posiva Oy. Working Report 2008-29. 51 p.
Hölttä, P., Hakanen, M. & Lahtinen, M. 2009. Silica colloids and their effect on radionuclide sorption – Experimental study. Eurajoki, Finland: Posiva Oy. Working Report 2009-26. 39 p.
Honeyman, B.D. 1999. Colloidal culprits in contamination. Nature. Vol. 397, p. 23-24.
Hora, S. & Jensen, M. 2005. Expert panel elicitation of seismicity following glaciation in Sweden. Swedish Radiation Safety Authority (SSI). SSI Report 2005:20. 125 p. ISSN 0282-4434.
Huang, W.-L., Longo, J.M. & Pevear, D.R. 1993. An experimentally derived kinetic model for a smectite-to-illite conversion and its use as a geothermometer. Clays and Clay Minerals. Vol. 41, no. 2, p. 162-177. ISSN 00098604.
Huang, Y. Bhaskaran, G., Wang, S. & Newman, R.C. 2012. Fundamental aspects of stress corrosion cracking of copper relevant to the Swedish deep geologic repository
440
concept. Stockholm, Sweden: Swedish Nuclear Fuel and Waste Management Co. (SKB). Technical Report TR-12-06.
Huertas, F.J., Caballero, E., Jiménez de Cisneros, C., Huertas, F. & Linares, J. 2001. Kinetics of montmorillonite dissolution in granitic solutions. Applied Geochemistry. Vol. 16, no. 4, p. 397-407. ISSN 08832927.
Huertas, F., Villar, M.V., Garcia-Siñeriz, J.L., Sellin, P., Stührenberg, D. & Alheid, H.-J. 2005. NF-Pro Deliverable: D 3.6.2. Final Synthesis Report RTD Component 3: Thermo-hydro-mechanical (geochemical) processes in the engineered barrier system.
Hultquist, G., Szakálos, P., Graham, M.J., Sproule, G.I. & Wikmark, G. 2008. Detection of hydrogen in corrosion of copper in pure water. 17th International Corrosion Conference 2008, Proceedings, Paper No. 3884. Las Vegas, USA: ICC 2008. 9 p.
Hutri, K.-L. 2007. An approach to paleoseismicity in the Olkiluoto (sea) area during the early Holocene. Helsinki, Finland: Radiation and Nuclear Safety Authority (STUK). STUK-A222. 64 p. + App. 55 p. ISBN 978-952-478-223-4 (print), ISBN 978-952-478-224-1 (pdf), ISSN 0781-1705.
Hutri, K.-L., Heinsalu, A., Kotilainen A. & Ojala, A. 2007. Dating early Holocene palaeoseismic event(s) in the Gulf of Bothnia, Baltic Sea. Boreas. Vol. 36, p. 55-64.
Idiart, A., Maia, F. & Arcos, D. 2013. Geochemical evaluation of the near-field for future HLW repository at Olkiluoto. Eurajoki, Finland: Posiva Oy. Working Report (in prep.).
Ikonen, K. 2009. Thermal dimensioning of the repository for spent fuel. Eurajoki, Finland: Posiva Oy. Working Report 2009-69. 60 p.
Ikonen, K. & Raiko, H. 2013. Thermal dimensioning of Olkiluoto repository for spent fuel. Eurajoki, Finland: Posiva Oy. Working Report 2012-56.
Jallad, K.N., Santhanam, M. & Cohen, M.D. 2003. Stability and reactivity of thaumasite at different pH levels. Cement and Concrete Research. Vol. 33, no. 3, p. 433-437.
Järvinen, E., Manninen, P., Takala, M. & Vilhunen, S. 2011. Sampling and characterisation of groundwater colloids in ONKALO at Olkiluoto, Finland, 2009–2010. Eurajoki, Finland: Posiva Oy. Working Report 2011-29. 25 p.
Jerz, J.K. & Rimstidt, J.D. 2004. Pyrite oxidation in moist air. Geochimica et Cosmochimica Acta. Vol. 68, no. 4, p. 701-714. ISSN 00167037.
Johannesson, L.-E., Sandén, T. & Dueck, A. 2008. Deep repository - engineered barrier system. Wetting and homogenization processes in backfill materials. Laboratory tests for evaluating modeling parameters. Stockholm, Sweden: Swedish Nuclear Fuel and Waste Management Co. (SKB). Report R-08-136. 63 p. ISSN 1402-3091.
Johansson, A.J. & Brinck, T. 2012. Mechanisms and energetics of surface reactions at the copper-water interface. A critical literature review with implications for the debate
441
on corrosion of copper in anoxic water. Stockholm, Sweden: Swedish Nuclear Fuel and Waste Management Co. (SKB). Technical Report TR-12-07. 43 p. ISSN 1404-0344.
Johansson, E., Siren, T. & Hakala, M. 2013. POSE Experiment: Outcome from the PSOE Phase 1 and 2. Eurajoki, Finland: Posiva Oy. Working Report 2012-60 (in prep.).
Juvankoski, M. 2013. Buffer Design 2012. Eurajoki, Finland: Posiva Oy. POSIVA 2012-14. ISBN 978-951-652-195-7.
Kahr, G., Kraehenbuehl, F., Stoeckli, H.F. & Müller-Vonmoos, M. 1990. Study of the water-bentonite system by vapour adsorption, immersion calometry and X-ray techniques: II. Heats of immersion, swelling pressures and thermodynamic properties. Clay Minerals. Vol. 25, p. 499–506.
Käpyaho, E. (ed.), Ahokas, H., Penttinen, T., Korkealaakso, J., Karvonen, T., Trinchero, P., Molinero, J., Luna, M., Jimenez, S. & Ruiz, E. 2012. The Infiltration Experiment – monitoring and modelling results 2009. Eurajoki, Finland: Posiva Oy. Working Report 2012-31. 156 p.
Kari, O.-P. 2009. Modelling the durability of concrete for nuclear waste disposal facilities. Espoo, Finland: Helsinki University of Technology. Licentiate Thesis. 40 p.
Karnland, O. 2010. Chemical and mineralogical characterization of the bentonite buffer for the acceptance control procedure in a KBS-3 repository. Stockholm, Sweden: Swedish Nuclear Fuel and Waste Management Co. (SKB). Technical Report TR-10-60. 29 p. ISSN 1404-0344.
Karnland, O. & Birgersson, M. 2006. Montmorillonite stability with special respect to KBS-3 conditions. Stockholm, Sweden: Swedish Nuclear Fuel and Waste Management Co. (SKB). Technical Report TR-06-11. 39 p. ISSN 1404-0344.
Karnland, O., Olsson, S. & Nilsson, U. 2006. Mineralogy and sealing properties of various bentonites and smectite-rich clay materials. Stockholm, Sweden: Swedish Nuclear Fuel and Waste Management Co. (SKB). Technical Report TR-06-30. 117 p. ISSN 1404-0344.
Karnland, O., Olsson, S., Dueck, A., Birgersson, M., Nilsson, U. & Hernan-Hakansson, T. 2009. Long term test of buffer material at the Äspö Hard Rock Laboratory, LOT project. Final report on the A2 test parcel. Stockholm, Sweden: Swedish Nuclear Fuel and Waste Management Co. (SKB). Technical Report TR-09-29. 296 p. ISSN 1404-0344.
Karttunen, P. (ed.), Kosunen, P., Lamminmäki, T., Pekkanen, J., Pöllänen, J., Tarvainen, A.-M. & Toropainen, V. 2010. Drilling and associated drillhole measurements of the pilot hole ONK-PH9. Eurajoki, Finland: Posiva Oy. Working Report 2010-09. 194 p.
Karvonen, T. 2011. Foreign materials in the repository - update of estimated quantities. Eurajoki, Finland: Posiva Oy. Working Report 2011-32. 102 p.
442
Karvonen, T. 2010. Prediction of long-term influence of ONKALO and Korvensuo Reservoir on groundwater level and water balance components on Olkiluoto Island. Eurajoki, Finland: Posiva Oy. Working Report 2010-55. 86 p.
Keto, V. 2010. Developing two-phase flow modelling concepts for rock fractures. Eurajoki, Finland: Posiva Oy. Working Report 2010-10. 64 p.
Kim, J., Dong, H., Seabaugh, J., Newell, S.W. & Eberl, D.D. 2004. Role of microbes in the smectite-to-illite reaction. Science. Vol. 303, no. 5659, p. 830-832.
Kim, Y.-S. & Sanderson, D.J. 2005. The relationship between displacement and length of faults: a review. Earth-Science Reviews. Vol. 68, no. 3-4, p. 317-334. ISSN 00128252.
King, F. 2002. Corrosion of copper in alkaline chloride environments. Stockholm, Sweden: Swedish Nuclear Fuel and Waste Management Co. (SKB). Technical Report TR-02-25. 77 p. ISSN 1404-0344.
King, F. 2004. The effect of discontinuities on the corrosion behaviour of copper canisters. Stockholm, Sweden: Swedish Nuclear Fuel and Waste Management Co. (SKB). Technical Report TR-04-05. 44 p. ISSN 1404-0344.
King, F. 2007. Mixed-potential modelling of the corrosion of copper in the presence of sulphide. Eurajoki, Finland: Posiva Oy. Working Report 2007-63. 62 p.
King, F. 2010. Critical review of the literature on the corrosion of copper by water. Stockholm, Sweden: Swedish Nuclear Fuel and Waste Management Co. (SKB). Technical Report TR-10-69.
King, F. & Kolář, M. 2004. Theory manual for the copper corrosion model for stress corrosion cracking of used fuel disposal containers CCM-SCC.0. Ontario, Canada: Ontario Power Generation, Nuclear Waste Management Division. Report 06819-REP-01300-10095-R00.
King, F. & Kolář, M. 2005. Preliminary assessment of the stress corrosion cracking of used fuel disposal containers using the CCM-SCC.0 model. Ontario, Canada: Ontario Power Generation, Nuclear Waste Management Division Report 06819-REP-01300-10103-R00.
King, F. & Lilja, C. 2011. Scientific basis for corrosion of copper in water and implications for canister lifetimes. Corrosion Engineering, Science and Technology. Vol. 46, no. 2, p. 153-158(6).
King, F. & Newman, R. 2010. Stress corrosion cracking of copper canisters. Stockholm, Sweden: Swedish Nuclear Fuel and Waste Management Co. (SKB). Technical Report TR-10-04. 60 p. ISSN 1404-0344.
King, F. & Wersin, P. 2013. Review of supercontainer copper shell-bentonite interactions and possible effects on buffer performance for the KBS-3H design. Eurajoki, Finland: Posiva Oy. Working Report (in prep.).

443
King, F., Litke, C.D. & Ryan, S.R. 1992. A mechanistic study of the uniform corrosion of copper in compacted Na-montmorillonite/sand mixtures. Corrosion Science. Vol. 33, no. 12, p. 1979-1995. ISSN 0010938X.
King, F., Lilja, C., Pedersen, K., Pitkänen, P. & Vähänen, M. 2012. An update of the state-of-the-art report on the corrosion of copper under expected conditions in a deep geologic repository. Eurajoki, Finland: Posiva Oy. POSIVA 2011-01. 246 p. ISBN 978-951-652-178-0. (Also printed as SKB TR-10-67.)
Kirkkomäki, T. 2009. Design and a stepwise implementation of the final repository (in Finnish: Loppusijoituslaitoksen asemointi ja vaiheittainen rakentaminen, incl. an English abstract). Eurajoki, Finland: Posiva Oy. Working Report 2009-51. 40 p.
Kiviranta, L. & Kumpulainen, S. 2011. Quality control and characterization of bentonite materials. Eurajoki, Finland: Posiva Oy. Working Report 2011-84. 98 p.
Kniemeyer, O., Musat, F., Sievert, S.M., Knittel, K., Wilkes, H., Blumenberg, M., Michaelis, W., Classen, A., Bolm, C., Joye, S.B. & Widdel, F. 2007. Anaerobic oxidation of short-chain hydrocarbons by marine sulphate-reducing bacteria. Nature. Vol. 449, no. 7164, p. 898-902.
Korkiala-Tanttu, L. 2009. Finite element modelling of deformation of unsaturated backfill due to swelling of the buffer. Eurajoki, Finland: Posiva Oy. Working Report 2008-88. 35 p.
Korzhavyi, P.A. & Johansson, B. 2011. Literature review on the properties of cuprous oxide Cu2O and the process of copper oxidation. Stockholm, Sweden: Swedish Nuclear Fuel and Waste Management Co. (SKB). Technical Report TR-11-08. 47 p. ISSN 1404-0344.
Koskinen, K. 2013. Effects of cementitious leachates on the EBS. Eurajoki, Finland: Posiva Oy. POSIVA 2013-0x (in prep.).
Kostka, J.E., Dalton, D.D., Skelton, H., Dollhopf, S. & Stucki, J.W. 2002. Growth of Iron(III)-reducing bacteria on clay minerals as the sole electron acceptor and comparison of growth yields on a varity of oxidized iron forms. Applied and Environmental Microbiology. Vol. 68, no. 12, p. 6256-6262. ISSN 00992240.
Kristensson, O. & Åkesson, M. 2008. Mechanical modeling of MX-80 – Quick tools for BBM parameter analysis. Physics and Chemistry of the Earth. Vol. 33, p. 508–515.
Kuivamäki, A. 2000. Lineament database of the Finnish potential repository sites for the calculation of bedrock movements induced by earthquakes. Helsinki, Finland: Posiva Oy. Working Report 2000-12. 32 p. + app.
Kuivamäki, A., Vuorela, P. & Paananen, M. 1998. Indications of postglacial and recent bedrock movements in Finland and Russian Karelia. Espoo, Finland: Geological Survey of Finland. Report YST-99. 92 p. ISBN 951-960-719-9.

444
Kumpulainen, S. & Kiviranta, L. 2010. Mineralogical and chemical characterization of various bentonite and smectite-rich clay materials. Part A: Comparison and development of mineralogical characterization methods. Part B: Mineralogical and chemical characterization of clay materials. Eurajoki, Finland: Posiva Oy. Working Report 2010-52. 74 p.
Kumpulainen, S. & Kiviranta, L. 2011. Mineralogical, chemical and physical study of potential buffer and backfill materials from ABM Test Package 1. Eurajoki, Finland: Posiva Oy. Working Report 2011-41. 50 p.
Kumpulainen, S., Carlsson, T., Muurinen, A., Kiviranta, L., Svensson, D., Sasamoto, H., Yui, M., Wersin, P. & Rosch, D. 2010. Long-term alteration of bentonite in the presence of metallic iron. Eurajoki, Finland: Posiva Oy. Working Report 2010-71. 92 p.
La Pointe, P.R., Cladouhos, T. & Follin, S. 1999. Calculation of displacements on fractures intersecting canisters induced by earthquakes: Aberg, Beberg and Ceberg examples. Stockholm, Sweden: Swedish Nuclear Fuel and Waste Management Co. (SKB). Technical Report TR-99-03. 103 p. ISSN 0284-3757.
Laaksoharju, M. & Wold, S. 2005. The colloid investigations conducted at the Äspö Hard Rock Laboratory during 2000–2004. Stockholm, Sweden: Swedish Nuclear Fuel and Waste Management Co. (SKB). Technical Report TR-05-20. 211 p. ISSN 1404-0344.
Laaksoharju, M., Vuorinen, U., Snellman, M., Allard, B., Pettersson, C., Helenius, J. & Hinkkanen, H. 1993. Colloids or artefacts? A TVO/SKB co-operation project in Olkiluoto, Finland. Stockholm Sweden: Swedish Nuclear Fuel Waste Management Co. Technical Report 93-32. 56 p.
Laaksonen, R. 2010. MANU. Isostatic compression of buffer blocks – Small scale. Eurajoki, Finland: Posiva Oy. Working Report 2009-134. 40 p.
Lagerbäck, R. 1979. Neotectonic structures in northern Sweden. Geologiska Föreningens i Stockholm Förhandlingar. Vol. 100, no. 3, p. 263-269.
Laine, H. & Karttunen, P. 2010. Long-term stability of bentonite - A literature review. Eurajoki, Finland: Posiva Oy. Working Report 2010-53. 128 p.
Lambeck, K., Smither, C. & Johnston, P. 1998. Sea-level change, glacial rebound and mantle viscosity for northern Europe. Geophysical Journal International. Vol. 134, no. 1, p. 102-144. ISSN 0956540X.
Lantenois, S., Lanson, B., Muller, F., Bauer, A., Jullien, M. & Plancon, A. 2005. Experimental study of smectite interaction with metal Fe at low temperature: 1. smectite destabilization. Clay and Clay Minerals. Vol. 53, no. 6, p. 597-612.
Lehikoinen, J. 2009. Bentonite-cement interaction - preliminary results from model calculations. Eurajoki, Finland: Posiva Oy. Working Report 2009-37. 35 p.

445
Leonard, M. 2010. Earthquake fault scaling: Self-consistent relating of rupture length, width, average displacement, and moment release. Bulletin of the Seismological Society of America. Vol. 100, no. 5A, p. 1971-1988. ISSN 00371106.
Leoni, M. 2013. 2D and 3D finite element analysis of buffer-backfill interaction. Eurajoki, Finland: Posiva Oy. POSIVA 2012-25. ISBN 978-951-652-206-0 (to be published).
Liu, J. & Neretnieks, I. 2006. Physical and chemical stability of the bentonite buffer. Stockholm, Sweden: Swedish Nuclear Fuel and Waste Management Co. (SKB). Report R-06-103. 43 p. ISSN 1402-3091.
Liu, L., Moreno, L. & Neretnieks, I. 2009a. A dynamic force balance model for colloidal expansion and its DLVO-based application. Langmuir. Vol. 25, no. 2, p. 679-687.
Liu, L., Moreno, L. & Neretnieks, I. 2009b. A novel approach to determine the critical coagulation concentration of a colloidal dispersion with plate-like particles. Langmuir. Vol. 25, no. 2, p. 688-697.
Löfman, J. & Karvonen, T. 2012. Simulations of hydrogeological evolution at Olkiluoto. Eurajoki, Finland: Posiva Oy. Working Report 2012-35.
Löfman, J. & Poteri, A. 2008. Groundwater flow and transport simulations in support of RNT-2008 analysis. Eurajoki, Finland: Posiva Oy. Working Report 2008-52. 100 p.
Löfman, J., Mészáros, F., Keto, V., Pitkänen, P. & Ahokas, H. 2009. Modelling of groundwater flow and solute transport in Olkiluoto - Update 2008. Eurajoki, Finland: Posiva Oy. Working Report 2009-78. 274 p.
Löfman, J., Poteri, A. & Pitkänen, P. 2010. Modelling of salt water upconing in Olkiluoto. Eurajoki, Finland: Posiva Oy. Working Report 2010-25. 146 p.
Lund, B. & Schmidt, P. 2011. Stress evolution and fault stability at Olkiluoto during the Weichselian glaciations. Eurajoki, Finland: Posiva Oy. Working Report 2011-14. 92 p.
Luukkonen, A., Pitkänen, P. & Partamies, S. 2004. Significance and estimations of lifetime of natural fracture mineral buffers in the Olkiluoto bedrock. Olkiluoto, Finland: Posiva Oy. Working Report 2004-08. 38 p.
Luukkonen, A., Pitkänen, P. & Partamies, S. 2005. Evaluation of Olkiluoto hydrogeochemical data in 3-D - Extended with recent geochemical interpretation results. Olkiluoto, Finland: Posiva Oy. Working Report 2005-72. 71 p.
Lydmark, S. 2011. Analyses of microorganisms, gases, and water chemistry in buffer and backfill, 2010. Äspö Hard Rock Laboratory – Prototype repository. Stockholm, Sweden: Swedish Nuclear Fuel and Waste Management Co. (SKB). Report P-11-16. 26 p.

446
Maak, P. & King, F. 2005. A model for predicting stress corrosion cracking behaviour of copper containers in a deep geologic repository. In: Van Iseghem, P. (ed.) 2005. Scientific Basis for Nuclear Waste Management XXIX, Mat. Res. Soc. Symp. Proc. 932. Warrendale, PA, USA: Materials Research Society. P. 837-844.
Macdonald, D.D. & Sharifi-Asl, S. 2011. Is copper immune to corrosion when in contact with water and aqueous solutions? Stockholm, Sweden: Swedish Radiation Safety Authority (SSM). Research 2011:09. 247 p. ISSN 2000-0456.
Madigan, M.T., Martinko, J.M., Dunlap, P.V. & Clark, D.P. 2008. Brock biology of microorganisms. 12th ed. San Francisco, USA: Pearson Benjamin-Cummings, 2008/2009. ISBN 0-13-2232460-1.
Mäkelä, J. & Manninen, P. 2007. Humic and fulvic acids in groundwater. Olkiluoto, Finland: Posiva Oy. Working Report 2007-23. 21 p.
Marrett, R. & Allmendinger, R.W. 1990. Kinematic analysis of fault-slip data. Journal of Structural Geology. Vol. 12, no. 8, p. 973-986. ISSN 01918141.
Marshall, C. 1935. Layer lattices and base exchange. Zeitschrift für Kristallographie. Vol. 91, p. 433-449.
Martikainen, J. & Schatz, T. 2010. Laboratory Studies on the Effect of Freezing and Thawing Exposure on Bentonite Buffer Performance: Closed System Tests, Eurajoki, Finland: Posiva Oy. Working Report 2010-06. 58p.
Martikainen, J. & Schatz, T. 2011. Laboratory tests to determine the effect of Olkiluoto bounding brine water on buffer performance. Eurajoki, Finland: Posiva Oy. Working Report 2011-68. 24 p.
Martin, C.D. & Christiansson, R. 2008. Estimating the potential for spalling around a deep nuclear waste repository in crystalline rock. International Journal of Rock Mechanics and Mining Sciences. Vol. 46, no. 2, p. 219-228.
Martinsson, Å., Andersson-Östling, H.C.M., Seitisleam, F., Wu, R. & Sandström, R. 2010. Creep testing of nodular iron at ambient and elevated temperatures. Stockholm, Sweden: Swedish Nuclear Fuel and Waste Management Co. (SKB). Report R-10-64. 31 p. ISSN 1402-3091.
Marty, N.C.M., Cama, J., Sato, T., Chino, D., Villiéras, F., Razafitianamaharavo, A., Brendlé, J., Giffaut, E., Soler, J.M., Gaucher, E.C. & Tournassat, C. 2011. Dissolution kinetics of synthetic Na-smectite. An integrated experimental approach. Geochimica et Cosmochimica Acta. Vol. 75, no. 20, p. 5849-5864. ISSN 00167037.
Masurat, P. & Pedersen, K. 2004. Microbial sulphide production in compacted bentonite at the commencement of long-term disposal of high.level radioactive waste. Material Research Society Symposium Proceedings, 827, 805-810. ISBN 1-55899-752-0.
Masurat, P., Eriksson, S. & Pedersen, K. 2010a. Microbial sulphide production in compacted Wyoming bentonite MX-80 under in situ conditions relevant to a repository
447
for high-level radioactive waste. Applied Clay Science. Vol. 47, no. 1-2, p. 58-64. ISSN 01691317.
Masurat, P., Eriksson, S. & Pedersen, K. 2010b. Evidence of indigenous sulphate-reducing bacteria in commercial Wyoming bentonite MX-80, Applied Clay Science, 47, no 1-2, 51-57. ISSN 01691317.
McEwen, T. (ed.), Aro, S., Hellä, P., Kosunen, P., Käpyaho, A., Mattila, J., Pere, T. & RSC working group 2013. Rock Suitability Classification, RSC-2012. Eurajoki, Finland: Posiva Oy. POSIVA 2012-24. ISBN 978-951-652-205-3 (to be published).
Melkior, T., Gaucher, E. C., Brouard, C., Yahiaoui, S., Thoby, D., Clinard, C., Ferrage, E., Guyonnet, D., Tournassat, C. & Coelho, D. 2009. Na+ and HTO diffusion in compacted bentonite: Effect of surface chemistry and related texture. Journal of Hydrology. Vol. 370, no. 1-4, p. 9-20. ISSN 00221694.
Mellanen, S. (ed.), Koskinen, L., Hellä, P., Löfman, J., Lanyon, B., Öhberg, A., Autio, J., Sacklén, N., Saukkonen, K., Saari, J., Lakio, A., Silvast, M., Wiljanen, B., Vuokko, J. & Lyytinen, T. 2008. EDZ Programme, EDZ studies in ONKALO 2007-2008. Olkiluoto, Finland: Posiva Oy. Working Report 2008-66. 110 p.
Miller, B. & Marcos, N. 2007. Process report. FEPs and scenarios for a spent fuel repository at Olkiluoto. Eurajoki, Finland: Posiva Oy. POSIVA 2007-12. 274 p. ISBN 978-951-652-162-9.
Milodowski, A.E., Crave, M.R., Kemp, S.J., Taylor, H., Vickers, B.P., Green, K.A., Williams, C.L. & Shaw, R.A. 2009. Mineralogical investigations between iron corrosion products and bentonite from the NF-PRO experiments (phase 1). Stockholm, Sweden: Swedish Nuclear Fuel and Waste Management Co. (SKB). Technical Report TR-09-02. 56 p. ISSN 1404-0344.
Missana, T. & Adell, A. 2000. On the applicability of DLVO theory to the prediction of clay colloids stability. Journal of Colloid and Interface Science. Vol. 230, no. 1, p. 150-156. ISSN 10957103, ISBN 0313301891.
Montes-H, G., Marty, N., Fritz, B., Clement, A. & Michau, N. 2005. Modelling of long-term diffusion-reaction in a bentonite barrier for radioactive waste confinement. Applied Clay Science. Vol. 30, no. 3-4, p. 181-198. ISSN 01691317.
Moreno, L., Neretnieks, I. & Liu, L. 2010. Modelling of erosion of bentonite gel by gel/sol flow. Stockholm, Sweden: Swedish Nuclear Fuel and Waste Management Co. (SKB). Technical Report TR-10-64. 56 p. ISSN 1404-0344.
Morin, K.A. 1993. Rates of sulfide oxidation in submerged environments: implications for subaqueous disposal. In: Proceedings of the 17th Annual Mine Reclamation Symposium. Port Hardy, British Columbia, Canada. May 4-7, 1993. Vancouver, Canada: Mining Association of British Columbia. P. 235-247.
448
Morth, A.H. & Smith, E.E. 1966. Kinetics of the sulfide-to-sulfate reaction. Symp. Fossil Fuels Environmental Pollution, ACS Division, Fuel Chemistry Preprints 10(l):83-92.
Morton, J.D., Semrau, J.D. & Hayes, K.F. 2001. An X-ray absorption spectroscopy study of the structure and reversibility of copper adsorbed to montmorillonite clay. Geochimica et Cosmochimica Acta. Vol. 65, no. 16, p. 2709-2722. ISSN 00167037.
Mosser-Ruck, R., Cathelineau, M., Guillaume, D., Charpentier, D., Rousset, D., Barres, O. & Michau, N. 2010. Effects of temperature, pH, and iron/clay and liquid/clay ratios on experimental conversion of dioctahedral smectite to berthierine, chlorite, vermiculite, or saponite. Clays and Clay Minerals. Vol. 58, p. 280-291.
Motamedi, M., Karland, O., Pedersen, K. 1996. Survival of sulphate reducing bacteria at different water activities in compacted bentonite. FEMS Microbiology Letters. Vol. 141, p. 83–87.
Munier, R. 2010. Full perimeter intersection criteria. Definitions and implementation in SR-Site. Stockholm, Sweden: Swedish Nuclear Fuel and Waste Management Co. (SKB). Technical Report TR-10-21. 103 p. ISSN 1404-0344.
Muraoka, H. & Kamata, H. 1983. Displacement distribution along minor fault traces. Journal of Structural Geology. Vol. 5, no. 5, p. 483-495. ISSN 01918141.
Mustonen, S., Norokallio, J., Mellanen, S., Lehtimäki, T. & Heikkinen, E. 2010. EDZ09 Project and related EDZ studies in ONKALO 2008-2010. Eurajoki, Finland: Posiva Oy. Working Report 2010-27. 404 p.
Muurinen, A. 2001. Development and testing of analysis methods for bentonite porewater. Helsinki, Finland: Posiva Oy. Working Report 2001-07. 37 p.
Muurinen, A. & Lehikonen, J. 1999. Porewater chemistry in compacted bentonite. Helsinki, Finland: Posiva Oy. POSIVA 99-20. 46 p. ISBN 951-652-075-8.
Näslund, J.-O. 2006. Climate and climate-related issues for the safety assessment SR-Can. Stockholm, Sweden: Swedish Nuclear Fuel and Waste Management Co. (SKB). Technical Report TR-06-23. 186 p. ISSN 1404-0344.
Neretnieks, I., Liu, L. & Moreno, L. 2009. Mechanisms and models for bentonite erosion. Stockholm, Sweden: Swedish Nuclear Fuel and Waste Management Co. (SKB). Technical Report TR-09-35. 174 p. ISSN 1404-0344.
Neretnieks, I., Liu, L. & Moreno, L. 2010. Mass transfer between waste canister and water seeping in rock fractures. Revisiting the Q-equivalent model. Stockholm, Sweden: Swedish Nuclear Fuel and Waste Management Co. (SKB). Technical Report TR-10-42. 51 p. ISSN 1404-0344.
Nicholson, R.V., Gilham, R.W. & Reardon, E.J. 1988. Pyrite oxidation in carbonate-buffered solution: 1. Experimental kinetics. Geochimica et Cosmochimica Acta. Vol. 52, no. 5, p. 1077-1085. ISSN 00167037.
449
Nicholson, R.V., Gilham, R.W. & Reardon, E.J. 1990. Pyrite oxidation in carbonate-buffered solution: 2. Rate control by oxide coatings. Geochimica et Cosmochimica Acta. Vol. 54, p. 395-402.
Nieminen, J. 2012. Ventilation systems of encapsulation plant (in Finnish: Kapselointilaitoksen ilmastointijärjestelmät). Eurajoki, Finland: Posiva Oy. Working Report 2012-55.
Nurmikolu, A. 2005. Degradation and frost susceptibility of crushed rock aggregates used in structural layers of railway track. Tampere, Finland: Tampere University of Technology. Publication 567. ISBN 952-15-1481-7.
Ojala, V.J., Kuivamäki, A. & Vuorela, P. 2004. Postglacial deformation of bedrock in Finland. Espoo, Finland: Geological Survey of Finland. Report YST-120. 23 p. ISBN 951-690-897-7.
Okko, V. 1964. Soil (in Finnish: Maaperä). In: Rankama, K. (ed.). The geology of Finland (in Finnish: Suomen geologia). Helsinki, Finland: Kirjayhtymä. P. 239-332.
Olivella, S., Carrera, J., Gens, A. & Alonso, E.E. 1994. Non-isothermal multiphase flow of brine and gas thorough saline media. Transport Porous Media. Vol. 15, p. 271-293.
Olivella, S., Gens, A., Carrera, J. & Alonso, E.E. 1996. Numerical formulation for a simulator (CODE-BRIGHT) for the coupled analysis of saline media. Engineering Computations. Vol. 1, p. 87-112.
Olivella, S., Toprak, E., Mokni, N. & Pintado, X. 2013. Thermo-hydro-mechanical modelling of buffer. Eurajoki, Finland: Posiva Oy. POSIVA 2012-47. ISBN 978-951-652-229-9 (to be published).
Oversby, V.M. 1996. Criticality in a high level waste repository. A review of some important factors and an assessment of the lessons that can be learned from the Oklo reactor. Stockholm, Sweden: Swedish Nuclear Fuel and Waste Management Co. (SKB). Technical Report 96-07. 41 p. + 9 p. ISSN 0284-3757.
Oversby, V.M. 1998. Criticality in a repository for spent fuel: lessons from Oklo. In: McKinley, I. G. & McCombie, C. (eds). Scientific Basis for Nuclear Waste Management XXI. Warrendale, USA: Materials Research Society. P. 781-788 (Materials Research Society Symposium Proceedings 506). ISBN 1-55899-411-4.
Paananen, M. & Kuivamäki, A. 2007. Regional lineament analysis of the southern Satakunta area. Olkiluoto, Finland: Posiva Oy. Working Report 2007-04. 33 p.
Parkhurst, D.L. & Appelo, C.A.J. 1999. User’s guide to PHREEQC (version 2) - A computer program for speciation, batch-reaction, one-dimensional transport, and inverse geochemical calculations. Denver, USA: U.S. Geological Survey. Water-Resources Investigations Report 99-4259. 312 p.
450
Påsse, T. 1996. A mathematical model of the shore level displacement in Fennoscandia. Stockholm, Sweden: Swedish Nuclear Fuel and Waste Management Co. (SKB). Technical Report 96-24. 92 p.
Pastina, B. & Hellä, P. (eds.) 2006. Expected evolution of a spent nuclear fuel repository at Olkiluoto. Olkiluoto, Finland: Posiva Oy. POSIVA 2006-05. 405 p. ISBN 951-652-145-2.
Pastina, B. & Hellä, P. 2010. Models and Data Report 2010. Eurajoki, Finland: Posiva Oy. POSIVA 2010-01. 478 p. ISBN 978-951-652-172-8.
Paulamäki, S. & Kuivamäki, A. 2006. Depositional history and tectonic regimes within and in the margins of the Fennoscandian Shield during the last 1300 million years. Olkiluoto, Finland: Posiva Oy. Working Report 2006-43. 137 p.
Pedersen, K. (ed.) 2006. Microbiology of transitional groundwater of the porous overburden and underlying fractured bedrock aquifers in Olkiluoto, Finland. Olkiluoto, Finland: Posiva Oy. Working Report 2006-09. 45 p.
Pedersen, K. 2007. Microbiology of transitional groundwater of the porous overburden and underlying shallow fractured bedrock aquifers in Olkiluoto 2005, Finland. October 2005–January 2006. Olkiluoto, Finland: Posiva Oy. Working Report 2007-20. 48 p.
Pedersen, K. 2008. Microbiology of Olkiluoto groundwater 2004–2006. Eurajoki, Finland: Posiva Oy. POSIVA 2008-02. 156 p. ISBN 978-951-652-161-2.
Pedersen, K. 2010. The deep biosphere. GFF. Vol. 132, no. 1, p. 93-94. ISSN 1103-5897.
Pedersen, K., Motamedi, M., Karnland, O. & Sanden, T. 2000a. Cultivability of microorganisms introduced into a compacted bentonite clay buffer under high-level radioactive waste repository conditions. Engineering Geology. Vol. 58, p. 149–161.
Pedersen, K., Motamedi, M., Karnland, O. & Sanden, T. 2000b. Mixing and sulphate-reducing activity of bacteria in swelling, compacted bentonite clay under high-level radioactive waste repository conditions. Journal of Applied Microbiology. Vol. 89, p. 1038–1047.
Pedersen, K., Kennedy, C., Nederfeldt, K.-G., Bergelin, A, 2004. Äspö Hard Rock Laboratory. Prototype repository: Chemical measurements in buffer and backfill; sampling and analysis of gases. Svensk Kärnbränslehantering AB. SKB IPR-04-26,
Pedersen, K., Arlinger, J., Eriksson, S., Hallbeck, M., Johansson, J., Jägevall, S. & Karlsson, L. 2008a. Microbiology of Olkiluoto groundwater. Results and interpretations 2007. Eurajoki, Finland: Posiva Oy. Working Report 2008-34. 97 p.
Pedersen, K., Arlinger, J., Hallbeck, A., Hallbeck, L., Eriksson, S. & Johansson, J. 2008b. Numbers, biomass and cultivable diversity of microbial populations relate to depth and borehole-specific conditions in groundwater from depths of 4 to 450 m in Olkiluoto, Finland. The ISME Journal. Vol. 2, no. 7, p. 760-775. ISSN 1751-7362.
451
Pedersen, K., Bomberg, M. & Itävaara, M. 2013. Summary report. Microbiology of Olkiluoto and ONKALO groundwater. Eurajoki, Finland: Posiva Oy. POSIVA 2012-42. ISBN 978-951-652-222-0 (in print).
Penttinen, T., Partamies, S., Lahdenperä, A.-M., Pitkänen, P., Ahokas, T. & Kasa, S. 2011. Results of monitoring at Olkiluoto in 2009, Hydrogeochemistry. Eurajoki, Finland: Posiva Oy. Working Report 2010-44. 296 p.
Penttinen, T., Partamies, S., Lahdenperä, A.-M., Sireeni, S., Lamminmäki, T. & Lehtinen, A. 2012. Results of monitoring at Olkiluoto in 2011, Hydrogeochemistry. Eurajoki, Finland: Posiva Oy. Working Report 2012-44.
Pere, T., Mattila, J., Wikström, L., Lindgren, S., Vaittinen, T. & Ahokas, H. 2013. Layout determining features, their influence zones and respect distances at the Olkiluoto site. Eurajoki, Finland: Posiva Oy. POSIVA 2012-21.
Pimenoff, N., Venäläinen, A. & Järvinen, H. 2011. Climate scenarios for Olkiluoto on a time-scale of 120,000 years. Eurajoki, Finland: Posiva Oy. POSIVA 2011-04. 102 p.
Pintado X., Adesola F., Turtiainen M. 2013a. Down-scaled Buffer Tests. Eurajoki, Finland: Posiva Oy. POSIVA Working Report 2012-100 (to be published)..
Pintado, X., Hassan, Md. M., Martikainen, J. 2013b. Thermo-hydro-mechanical tests of buffer material. Eurajoki, Finland: Posiva Oy. POSIVA 2012-49. ISBN 978-951-652-231-2 (to be published).
Pintado, X. & Rautioaho, E. 2013. Thermo-Hydraulic Modelling of Buffer And Backfill. Eurajoki, Finland: Posiva Oy. POSIVA 2012-48 (to be published)..
Pitkänen, P., Luukkonen, A., Ruotsalainen, P., Leino-Forsman, H. & Vuorinen, U. 1999. Geochemical modelling of groundwater evolution and residence time at the Olkiluoto site. Helsinki, Finland: Posiva Oy. POSIVA 98-10. 184 p. ISBN 951-652-048-0.
Pitkänen, P., Partamies, S. & Luukkonen, A. 2004. Hydrogeochemical interpretation of baseline groundwater conditions at the Olkiluoto site. Olkiluoto, Finland: Posiva Oy. POSIVA 2003-07. 167 p. ISBN 951-652-121-5.
Pitkänen, P., Partamies, S., Lahdenperä, A.-M., Lehtinen, A., Ahokas, T., Hirvonen, H. & Hatanpää, E. 2007a. Results of monitoring at Olkiluoto in 2006 - Hydrogeochemistry. Olkiluoto, Finland: Posiva Oy. Working Report 2007-51. 243 p.
Pitkänen, P., Ahokas, H., Ylä-Mella, M., Partamies, S., Snellman, M. & Hellä, P. 2007b. Quality review of hydrochemical baseline data from the Olkiluoto site. Olkiluoto, Finland: Posiva Oy. POSIVA 2007-05. 133 p. ISBN 978-951-652-153-7.
Pitkänen, P., Partamies, S., Lahdenperä, A.-M., Lehtinen, A., Pedersen, K., Ahokas, T., Penttinen, T., Lamminmäki, T. & Hatanpää, E. 2008a. Results of monitoring at Olkiluoto in 2007: Hydrogeochemistry. Eurajoki, Finland: Posiva Oy. Working Report 2008-24. 212 p.
452
Pitkänen, P., Korkealaakso, J., Löfman, J., Keto, V., Lehtinen, A., Lindgren, S., Ikonen, A., Aaltonen, I., Ahokas, H., Ahokas, T. & Karvonen, T. 2008b. Investigation plan for infiltration experiment in Olkiluoto. Eurajoki, Finland: Posiva Oy. Working Report 2008-53. 38 p.
Pitkänen, P., Partamies, S., Lahdenperä, A.-M., Ahokas, T. & Lamminmäki, T. 2009. Results of monitoring at Olkiluoto in 2008; Hydrogeochemistry. Eurajoki, Finland: Posiva Oy. Working Report 2009-44. 236 p.
Pöllänen, J. & Rouhiainen, P. 2005. Difference flow and electric conductivity measurements at the Olkiluoto site in Eurajoki, Boreholes KR1, KR2, KR4, KR7, KR8, KR12 and KR14. Olkiluoto, Finland: Posiva Oy. Working Report 2005-51. 30 p. + app.
Posiva 2003a. TKS-2003 Nuclear Waste Management of the Olkiluoto and Loviisa power plants: Programme for research, development and technical design for 2004-2006. Olkiluoto, Finland: Posiva Oy. 288 p.
Posiva 2003b. Baseline conditions at Olkiluoto. Olkiluoto, Finland: Posiva Oy. POSIVA 2003-02. 127 p. ISBN 951-652-116-9.
Posiva 2008. Safety case plan 2008. Eurajoki, Finland: Posiva Oy. POSIVA 2008-05. 80 p. ISBN 978-951-652-165-0.
Posiva 2009a. TKS-2009 Nuclear Waste Management at Olkiluoto and Loviisa power plants - Review of current status and future plans for 2010-2012. Eurajoki, Finland: Posiva Oy. 532 p.
Posiva 2009b. Olkiluoto Site Description 2008. Eurajoki, Finland: Posiva Oy. POSIVA 2009-01. 714 p. ISBN 978-951-652-169-8.
Posiva 2012a. Monitoring at Olkiluoto - a programme for the period before repository operation. Eurajoki, Finland: Posiva Oy. POSIVA 2012-01. 161 p.
Posiva 2012b. YJH-2012 - Nuclear waste management at Olkiluoto and Loviisa power plants: Review of current status and future plans for 2013–2015 (in Finnish: Olkiluodon ja Loviisan voimalaitosten ydinjätehuollon ohjelma vuosille 2013 – 2015). Eurajoki, Finland: Posiva Oy. YJH-2012.
Puigdomenech, I., Banwart, S.A., Bateman, K., Milodowski, A.E., West, J.M., Griffault, L., Gustafsson, E., Hama, K., Yoshida, H., Kotelnikova, S., Pedersen, K., Lartigue, J.E., Michaud, V., Trotignon, L., Morosini, M., Rivas Perez, J. & Tullborg, E.L. 1999. Redox experiment in detailed scale (REX). First project status. Stockholm, Sweden: Swedish Nuclear Fuel and Waste Management Co. (SKB). International Cooperation Report ICR-99-01. 111 p. ISSN 1104-3210.
Puigdomenech, I., Ambrosi, J.-P., Eisenlohr, L., Lartigue, J.E., Banwart, S.A., Bateman, K., Milodowski, A.E., West, J.M., Griffault, L., Gustafsson, E., Hama, K., Yoshida, H., Kotelnikova, S., Pedersen, K., Michaud, V., Trotignon, L., Rivas Perez, J. & Tullborg, E.-L. 2001. O2 depletion in granitic media. The REX project. Stockholm, Sweden:

453
Swedish Nuclear Fuel and Waste Management Co. (SKB). Technical Report TR-01-05. 86 p.
Punkkinen, O., Pulkkanen, V.-M. & Olin, M. 2010. Erosion of buffer caused by groundwater leakages based on EMS-application. COMSOL Conference 2010 Paris, France. November 17-19, 2010. 7 p.
Pusch, R. 1994. Waste disposal in rock. Amsterdam, The Netherlands: Elsevier Scientific Publishing Company. 490 p (Developments in Geotechnical Engineering, 76). ISBN 0-444-89449-7.
Pusch, R. 1998. Backfilling with mixtures of bentonite/ballast materials or natural smectitic clay. Stockholm, Sweden: Swedish Nuclear Fuel and Waste Management Co. (SKB). Technical Report TR-98-16. 52 p. ISSN 0284-3757.
Pusch, R. 2008. Geological storage of highly radioactive waste. Berlin, Germany: Springer. 379 p. ISBN-10: 3540773320, ISBN-13: 978-3540773320.
Pusch, R. & Karnland, O. 1996. Physico/chemical stability of smectite clays. Engineering Geology. Vol. 41, no. 1-4, p. 73-85. ISSN 00137952.
Pytte, A. 1982. The kinetics of the smectite to illite reaction in contact metamorphic shales. Hanover, N.H., USA: Dartmouth College. M.A. Thesis. 78 p.
Pytte, A.M. & Reynolds, R.C. 1989. The thermal transformation of smectite to illite. In: Naeser, N.D. & McCulloh, T.H. (eds.). Thermal history of sedimentary basins. New York, USA: Springer. P. 133-140. ISBN-10: 3540967028, ISBN-13: 978-3540967026.
Raiko, H. 2012. Canister design 2012. Eurajoki, Finland: Posiva Oy. POSIVA 2012-13. ISBN 978-951-652-194-0.
Raiko, H., Sandström, R., Rydén, H. & Johansson, M. 2010. Design analysis report for the canister. Stockholm, Sweden: Swedish Nuclear Fuel and Waste Management Co. (SKB). Technical Report TR-10-28. 80 p. ISSN 1404-0344.
Raivio, P. & Hansen, J. 2007. Technical performance of cementitious grouting materials for ONKALO - laboratory tests 2006. Olkiluoto, Finland: Posiva Oy. Working Report 2007-76. 104 p.
Ranta-aho, A. 2008. Review of the radiation protection calculations for the encapsulation plant. Eurajoki, Finland: Posiva Oy. Working Report 2008-63. 84 p.
Ranta-Korpi, R., Karttunen, P. & Sievänen, U. 2007. R20 programme: field testing of grouting materials. Eurajoki, Finland: Posiva Oy. Working Report 2007-102. 129 p.
Reguera, G., McCarthy, K.D., Mehta, T., Nicoll, J.S., Tuominen, M.T. & Lovley, D.R. 2005. Extracellular electron transfer via microbial nanowires. Nature. Vol. 435, no. 7045, p. 1098-1101.

454
Rickard, D. & Luther, G.W. 2007. Chemistry of iron sulphides. Chemical Reviews, 107, 514-562. DOI: 10.1021/cr0503658
Rickard, D. & Morse, J.W. 2005. Acid Volatile Sulfide (AVS). Marine Chemistry. Vol. 97, p. 141-197.
Riikonen, S. 2009. Flow-through and wetting tests of pre-compacted backfill blocks in a quarter-scale test tunnel. Eurajoki, Finland: Posiva Oy. Working Report 2008-89. 222 p.
Rossi, J., Raiko, H. & Suolanen, V. 2009. Assessment of radiation doses in normal operation, upset and accident conditions at the Olkiluoto nuclear waste facility. Eurajoki, Finland: Posiva Oy. Working Report 2009-106. 65 p.
Rozalén, M.L., Huertas, F.J., Brady, P.V., Cama, J., García-Palma, S. & Linares, J. 2008. Experimental study of the effect of pH on the kinetics of montmorillonite dissolution at 25 C. Geochimica et Cosmochimica Acta. Vol. 72, no. 17, p. 4224-4253. ISSN 00167037.
Rozalén, M.L., Huertas, F.J. & Brady, P.V. 2009a. Experimental study of the effect of pH and temperature on the kinetics of montmorillonite dissolution. Geochimica et Cosmochimica Acta. Vol. 73, no. 13, p. 3752-3766. ISSN 00167037.
Rozalén, M.L., Huertas, F.J. & Brady, P.V. 2009b. Surface chemistry of K-montmorillonite: Ionic strength, temperature dependence and dissolution kinetics. Journal of Colloid and Interface Science. Vol. 333, no. 2, p. 474-484.
Saanio, T., Ikonen, A., Keto, P., Kirkkomäki, T., Kukkola, T., Nieminen, J. & Raiko, H. 2010. Outline design of the disposal facility 2009. Eurajoki, Finland: Posiva Oy. Working Report 2010-50. 152 p.
Saanio, T., Ikonen, A., Keto, P., Kirkkomäki, T., Kukkola, T., Nieminen, J. & Raiko, H. 2013. Design of the disposal facility 2012 (in Finnish: Loppusijoituslaitoksen suunnitelma 2012). Eurajoki, Finland: Posiva Oy. Working Report (to be published).
Saari, J. 1997. Seismicity in the Olkiluoto area (in Finnish: Olkiluodon alueen seismisyys; incl. an English abstract). Helsinki, Finland: Posiva Oy. Working Report 97-61. 37 p.
Saari, J. 2000. Seismic activity parameters of the Finnish potential repository sites. Helsinki, Finland: Posiva Oy. POSIVA 2000-13. 31 p. ISBN 951-652-099-5.
Saari, J. 2008. Seismicity in the Olkiluoto area. Eurajoki, Finland: Posiva Oy. POSIVA 2008-04. 55 p. ISBN 978-951-652-164-3.
Saari, J. 2012. Seismic activity parameters of the Olkiluoto site. Eurajoki, Finland: Posiva Oy. POSIVA 2012-34.
Saari, J. & Malm, M. 2012. Local seismic network at the Olkiluoto site, Annual report for 2011. Eurajoki, Finland: Posiva Oy. Working Report 2012-29. 37 p.

455
Saari, J. & Slunga, R. 1996. Fault plane solutions of microearthquakes in the Loviisa area in south-eastern Finland. Helsinki, Finland: Posiva Oy. POSIVA 96-02. ISBN 951-652-001-4.
Sacchi, E., Michelot, J.-L. & Pitsch, H. 2000. Porewater extraction from argillaceous rocks for geochemical characterisation. Methods and interpretations. Paris, France: OECD Nuclear Energy Agency. 188 p. ISBN 9789264182462.
Sahlstedt, E., Karhu, J. & Rinne, K. 2009. Paleohydrogeological implications from fracture calcites and sulfides in a major hydrogeological zone HZ19 at Olkiluoto. Eurajoki, Finland: Posiva Oy. Working Report 2009-54. 96 p.
Sahlstedt, E., Karhu, J.A. & Pitkänen, P. 2010. Sulphide indications for the past redox environments in deep groundwaters from the isotopic composition of carbon and oxygen in fracture calcite, Olkiluoto, SW Finland. Isotopes in Environmental and Health Studies. Vol. 46, no. 3, p. 370-391.
Sahlstedt, E., Karhu, J. & Rinne, K. 2013a. Fracture mineral study of the hydraulic feature HZ20 and implications to paleohydrogeology. Eurajoki, Finland: Posiva Oy. Working Report 2012-93 (to be published).
Sahlstedt, E., Rinne, K. & Karhu, J. 2013b. Fracture mineral investigations at Olkiluoto in 2010: Implications to palaeohydrogeology. Eurajoki, Finland: Posiva Oy. Working Report 2012-94 (to be published).
Sandén, T. & Börgesson, L. 2006. Deep repository – Engineered barrier system. Piping and erosion in tunnel backfill. Laboratory test to understand processes during early water uptake. Stockholm, Sweden: Swedish Nuclear Fuel and Waste Management Co. (SKB). Report R-06-72. 94 p. ISSN 1402-3091.
Sandén, T. & Börgesson, L. 2010. Early effects of water inflow into a deposition hole. Laboratory tests results. Stockholm, Sweden: Swedish Nuclear Fuel and Waste Management Co. (SKB). Report R-10-70. 74 p. ISSN 1402-3091.
Sandén, T., Börgesson, L., Dueck, A., Goudarzi, R. & Lönnqvist, M. 2008. Deep repository – Engineered barrier system. Erosion and sealing processes in tunnel backfill materials investigated in laboratory. Stockholm, Sweden: Swedish Nuclear Fuel and Waste Management Co. (SKB). Report R-08-135. 93 p. ISSN 1402-3091.
Sandström, R. & Jin, L.-Z. 2009. Modified Armstrong-Frederick relation for handling back stresses in FEM computations. In: Shi, I.A. (ed.) Proceedings 2nd international ECCC conference. Creep & fracture in high temperature components – design & life assessment issues, Dübendorf, Switzerland.
Sane, P., Laurila, T., Olin, M. & Koskinen, K. 2013. Current status of mechanical erosion studies of bentonite buffer. Eurajoki, Finland: Posiva Oy. POSIVA 2012-45. ISBN 978-951-652-227-5 (to be published).
Savage, D. 2011. A review of analogues of alkaline alteration with regard to long-term barrier performance. Mineralogical Magazine 75, 1-18.
456
Savage, D. & Benbow, S. 2007. Low pH cements. Stockholm, Sweden: Swedish Nuclear Power Inspectorate (SKI). SKI Report 2007:32. 55 p. ISSN 1104-1374.
Savage, D., Walker, C., Arthur, R., Rochelle, C., Oda, C. & Takase, H. 2007. Alteration of bentonite by hyperalkaline fluids: A review of the role of secondary minerals. Physics and Chemistry of the Earth, Parts A/B/C. Vol. 32, no. 1-7, p. 287–297.
Savage, S., Arthur, R., Watson, C. & Wilson, J. 2010. An evaluation of models of bentonite porewater evolution. Swedish Radiation Safety Authority (SSM). Research Report 2010:12. 52 p. ISSN 2000-0456.
Schatz, T. & Kanerva, N. 2012. Formation of accessory mineral bed layers during erosion of bentonite buffer material. Clays in Natural & Engineered Barriers for Radioactive Waste Confinement. 5th International Meeting, Montpellier, France, October 22–25, 2012. Poster presentation.
Schatz, T. & Martikainen, J. 2010. Laboratory studies on the effect of freezing and thawing exposure on bentonite buffer performance: Closed system tests. Eurajoki, Finland: Posiva Oy. POSIVA 2010-06. 58 p. ISBN 978-951-652-177-3.
Schatz, T. & Martikainen, J. 2013. Laboratory tests and analyses on potential backfill materials. Eurajoki, Finland: Posiva Oy. Working Report 2012-74 (to be published).
Schatz, T., Olin, M., Seppälä, A., Kanerva, N., Sane, P. & Koskinen, K. 2013. Clay erosion in dilute waters. Eurajoki, Finland: Posiva Oy. Working Report 2012-44 (to be published).
Schoonen, M.A.A. & Barnes, H.L. 1991. Reactions forming pyrite and marcasite from solution: II. Via FeS precursors below 100°C. Geochimica et Cosmochimica Acta. Vol. 55, no. 6, p. 1505-1514. ISSN 00167037.
Sena, C., Salas, J. & Arcos, D. 2010. Aspects of geochemical evolution of the SKB near field in the frame of SR-Site. Stockholm, Sweden: Swedish Nuclear Fuel and Waste Management Co. (SKB). Technical Report TR-10-59. 106 p. ISSN 1404-0344.
Sidborn, M., Sandström, B., Tullborg, E.-L., Salas, J., Maia, F., Delos, A., Molinero, J., Hallbeck, L. & Pedersen, K. 2010. SR-Site: Oxygen ingress in the rock at Forsmark during a glacial cycle. Stockholm, Sweden: Swedish Nuclear Fuel and Waste Management Co. (SKB). Technical Report TR-10-57. 148 p. ISSN 1404-0344.
Siitari-Kauppi, M., Ikonen, J. & Lamminmäki, S. 2010. Investigation of excavation damage zone by PMMA autoradiography method on samples from ONKALO facility at Olkiluoto. Eurajoki, Finland: Posiva Oy. Working Report 2009-118. 60 p.
Siren, T. 2011. Fracture mechanics prediction for Posiva’s Olkiluoto Spalling Experiment (POSE). Eurajoki, Finland: Posiva Oy. Working Report 2011-23. 30 p.
SKB 2006. Long-term safety for KBS-3 repositories at Forsmark and Laxemar - a first evaluation. Main Report of the SR-Can project. Stockholm, Sweden: Swedish Nuclear

457
Fuel and Waste Management Co. (SKB). Technical Report TR-06-09. 620 p. ISSN 1404-0344.
SKB 2010a. Design, production and initial state of the backfill and plug in deposition tunnels. Stockholm, Sweden: Swedish Nuclear Fuel and Waste Management Co. (SKB). Technical Report TR-10-16. 99 p. ISSN 1404-0344.
SKB 2010b. Buffer, backfill and closure process report for the safety assessment SR-Site. Stockholm, Sweden: Swedish Nuclear Fuel and Waste Management Co. (SKB). Technical Report TR-10-47. 368 p. ISSN 1404-0344.
SKB 2010c. Corrosion calculations report for the safety assessment SR-Site. Stockholm, Sweden: Swedish Nuclear Fuel and Waste Management Co. (SKB). Technical Report TR-10-66. 52 p. ISSN 1404-0344.
SKB 2011. Long-term safety for the final repository for spent nuclear fuel at Forsmark. Main Report of the SR-Site project. Volumes I−III. Stockholm, Sweden: Swedish Nuclear Fuel and Waste Management Co. (SKB). Technical Report TR-11-01. 893 p. ISSN 1404-0344.
Slunga, R. 1991. The Baltic Shield earthquakes. Tectonophysics. Vol. 189, no. 1-4, p. 323-331.
Smith, M.W. & Onysko, D. 1990. Observations and significance of internal pressures in freezing soil. Proceedings of the Fifth Canadian Permafrost Conference. Quebec, Canada: Université Laval, Québec City. P. 75-82.
Soler, J.M. 2010. Reactive transport modeling of grout-rock interaction at the ONKALO site. Eurajoki, Finland: Posiva Oy. Working Report 2010-73. 64 p.
Soler, J.M. 2011. Reactive transport modelling of grout-water interaction in a fracture at the ONKALO site - Effect of different potential groundwater compositions. Eurajoki, Finland: Posiva Oy. Working Report 2011-83. 58 p.
Sposito, G. 2008. The chemistry of soils. 2nd ed. Oxford, UK: Oxford University Press. 342 p. ISBN-10: 0195313690, ISBN-13: 978-0195313697.
Srodon, J. & Eberl, D.D. 1984. Illite. In: Ribbe, P.H. (ed.) Micas. Washington, D.C., USA: Mineralogical Society of America. Reviews in Mineralogy. Vol. 13, p. 495-544.
Sternbeck, J. & Sohlenius, G. 1997. Authigenic sulfide and carbonate mineral formation in Holocene sediments of the Baltic Sea. Chemical Geology. Vol. 135, no. 1-2, p. 55-73. ISSN 00092541.
Strawn, D.G., Palmer, N.E., Furnare, L.J., Goodell, C., Amonette, J.E. & Kukkadapu, R.K. 2004. Copper sorption mechanisms on smectites. Clays and Clay Minerals. Vol. 52, no. 3, p. 321-333. ISSN 00098604.
Stroes-Gascoyne, S., Pedersen, K., Haveman, S.A., Dekeyser, K., Arlinger, J., Daumas, S., Ekendahl, S., Hallbeck, L., Hamon, C.J., Jahromi, N. & Delaney, T.L. 1997.
458
Occurrence and identification of microorganisms in compacted clay-based buffer material designed for use in a nuclear fuel waste disposal vault. Canadian Journal of Microbiology 43, 1133–1146.
Stroes-Gascoyne, S., Hamon, C.J., Kohle, C. & Dixon, D.A. 2006. The effects of dry density and porewater salinity on the physical and microbiological characteristics of highly compacted bentonite. Ontario Power Generation, Nuclear Waste Management Division Report 06819-REP-01200-10016.
Stroes-Gascoyne, S., Schipper, A., Schwyn, B., Poulain, S., Sergeant, C., Simonoff, M., Le Marrec, C., Altmann, S., Nagaoka, T., Mauclaire, L., Mckenzie, J., Daumas, S., Vinsot, A., Beaucaire, C. & Matray, J.-M. 2007a. Microbial community analysis of Opalinus Clay drill core samples from the Mont Terri Underground Research Laboratory, Switzerland. Geomicrobiology Journal. Vol. 24, no. 1, p. 1-17. ISSN 01490451.
Stroes-Gascoyne, S., Maak, P., Hamon, C.J. & Kohle, C. 2007b. Potential implications of microbes and salinity on the design of repository sealing system components. Nuclear Waste Management Organization Report, NWMO TR-2007-10.
Svensson, D. & Sandén, T. 2011. Alternative buffer material. Stockholm, Sweden: Swedish Nuclear Fuel and Waste Management Co. (SKB). Technical Report TR-11-06.
Szakálos, P., Hultquist, G. & Wikmark, G. 2007. Corrosion of copper by water. Electrochemical and Solid-State Letters. Vol. 10, no. 11, p. C63-C67. ISSN 10990062.
Takala, M. & Manninen, P. 2006. Sampling and characterisation of groundwater colloids at ONKALO, Olkiluoto, Finland. Olkiluoto, Finland: Posiva Oy. Working Report 2006-98. 28 p.
Taniguchi, N. & Kawasaki, M. 2008. Influence of sulfide concentration on the corrosion behaviour of pure copper in synthetic seawater. Journal of Nuclear Materials. Vol. 379, no. 1–3, p. 154–161.
Taylor, H.F.W. 1997. Cement chemistry, 2nd Edition. London, UK: Thomas Telford Ltd. 480 p. ISBN 0727725920.
Techer, I., Bartier, D., Boulvais, P., Tinseau, E., Suchorski, K., Cabrera, J. & Dauzères, A. 2012. Tracing interactions between natural argillites and hyper-alkaline fluids from engineered cement paste and concrete: Chemical and isotopic monitoring of a 15-years old deep-disposal analogue. Applied Geochemistry. Vol. 27, no. 7, p. 1384–1402.
Tournassat, C. & Appelo, C.A.J. 2011. Modelling approaches for anion-exclusion in compacted Na-bentonite. Geochimica et Cosmochimica Acta. Vol. 75, no. 13, p. 3698-3710.
Trinchero, P., Molinero, J., Luna, M., Jimenez, S. & Ruiz, E. 2012. Coupled groundwater flow and reactive transport modeling of the Infiltration Experiment. Eurajoki, Finland: Posiva Oy. Working Report 2012-95.

459
Trinchero, P., Román-Ross, G., Maia, F. & Molinero, J. 2013. Hydrogeochemical evolution of the Olkiluoto site. Eurajoki, Finland: Posiva Oy. Working Report (to be published).
Uski, M., Hyvönen, T., Korja, A. & Airo, M.-L. 2003. Focal mechanisms of three earthquakes in Finland and their relation to surface faults. Tectonophysics. Vol. 363, no. 1-2, p. 141-157. ISSN 00401951.
Uski, M., Tiira, T., Korja, A. & Elo, S. 2006. The 2003 earthquake swarm in Anjalankoski, south-eastern Finland. Tectonophysics. Vol. 422, no. 1-4, p. 55-69. ISSN 00401951.
Vaittinen, T., Ahokas, H., Klockars, J., Nummela, J., Pentti, E., Penttinen, T., Tammisto, E., Karvonen, T. & Lindgren, S. 2010. Results of monitoring at Olkiluoto in 2009 – Hydrology. Eurajoki, Finland: Posiva Oy. Working Report 2010-43. 272 p.
Vaittinen, T., Ahokas, H., Klockars, J., Nummela, J., Pentti, E., Penttinen, T., Pöllänen, J., Karvonen, T. & Lindgren, S. 2011a. Results of monitoring at Olkiluoto in 2010 – Hydrology. Eurajoki, Finland: Posiva Oy. Working Report 2011-43. 378 p.
Vaittinen, T., Ahokas, H., Nummela, J. & Paulamäki, S. 2011b. Hydrogeological structure model of the Olkiluoto site – Update in 2010. Eurajoki, Finland: Posiva Oy. Working Report 2011-65. 330 p.
Valli, J., Kuula, H. & Hakala, M. 2011. Modelling of the in situ stress state at Olkiluoto. Eurajoki, Finland: Posiva Oy. Working Report 2011-34. 96 p.
Venäläinen, A., Tuomenvirta, H., Lahtinen, R. & Heikinheimo, M. 2001. The influence of climate warming on soil frost in case of snow-free surfaces in Finland. Climatic Change. Vol. 50, no. 1/2, p. 111–128.
Vieno, T. & Ikonen, A.T.K. 2005. Plan for Safety Case of spent fuel repository at Olkiluoto. Olkiluoto, Finland: Posiva Oy. POSIVA 2005-01. 69 p. ISBN 951-652-133-9.
Vieno, T., Lehikoinen, J., Löfman, J., Nordman, H. & Mészáros, F. 2003. Assessment of disturbances caused by construction and operation of ONKALO. Olkiluoto, Finland: Posiva Oy. POSIVA 2003-06. 92 p. ISBN 951-652-120-7.
Viola, G., Mattila, J., Zwingmann, H., Todd, A. & Raven, M. 2011. Structural and K/Ar illite geochronological constraints on the brittle deformational history of the Olkiluoto region, SW Finland. Eurajoki, Finland: Posiva Oy. Working Report 2011-37.
Vogt, C., Lagerblad, B., Wallin, K., Baldy, F. & Jonasson, J.-E. 2009. Low pH self-compacting concrete for deposition tunnel plugs. Stockholm, Sweden: Swedish Nuclear Fuel and Waste Management Co. (SKB). Report R-09-07. 78 p. ISSN 1402-3091.
Vuorela, A., Penttinen, T. & Lahdenperä, A.-M. 2009. Review of Bothnian sea shore-level displacement data and use of a GIS tool to estimate isostatic uplift. Eurajoki, Finland: Posiva Oy. Working Report 2009-17. 192 p.

460
Walsh, J.J. & Watterson, J. 1989. Displacement gradients on fault surfaces. Journal of Structural Geology. Vol. 11, no. 3, p. 307-316. ISSN 01918141.
Welch, V.S. II, Dann, M.W. & Mehta, B. 1990. Predicting oxygen depletion in reservoir environments. Society of Petroleum Engineers. Paper SPE 20721. 12 p. DOI: 10.2118/20721-MS.
Wells, D.L. & Coppersmith, K.J. 1994. New empirical relationships among magnitude, rupture length, rupture width, rupture area and surface displacement. Bulletin of the Seismological Society of America. Vol. 84, no. 4, p. 974-1002. ISSN 00371106.
Wersin, P. 2003. Geochemical modelling of bentonite porewater in high-level waste repositories. Journal of Contaminant Hydrology. Vol. 61, no. 1-4, p. 405-422.
Wersin, P., Spahiu, K. & Bruno, J. 1994. Time evolution of dissolved oxygen and redox conditions in a HLW repository. Stockholm, Sweden: Swedish Nuclear Fuel and Waste Management Co. (SKB). Technical Report 94-02. 32 p. ISSN 0284-3757.
Wersin, P., Johnson, L.H., Schwyn, B., Berner, U. & Curti, E. 2003. Redox conditions in the near field of a repository for SF/HLW and ILW in Opalinus Clay. Wettingen, Switzerland: Nagra. Technical Report NTB 02-13. 38 p. + 4 p. ISSN 1015-2636.
Wersin, P., Curti, E. & Appelo, C.A.J. 2004. Modelling bentonite-water interactions at high solid/liquid ratios: swelling and diffuse double layer effects. Applied Clay Science. Vol. 26, no. 1-4, p. 249-257. ISSN 01691317.
Wersin, P., Birgersson, M., Olsson, S., Karnland, O. & Snellman, M. 2007a. Impact of corrosion-derived iron on the bentonite buffer within the KBS-3H disposal concept - the Olkiluoto site as case study. Eurajoki, Finland: Posiva Oy. POSIVA 2007-11. 70 p. ISBN 978-951-652-159-9.
Wersin, P., Johnson, L.H. & Mckinley, I.G. 2007 b. Performance of the bentonite barrier beyond 100 C: a critical review. Physics and Chemistry of the Earth. Vol. 32, no. 8-14, p. 780-788. ISSN 14747065.
Wersin, P., Kiczka, M. & Rosch, D. 2013a. Safety case for the disposal of spent nuclear fuel at Olkiluoto: Radionuclide solubility limits and migration parameters for the canister and the buffer. Eurajoki, Finland: Posiva Oy. POSIVA 2012-39. ISBN 978-951-652-219-0 (to be published).
Wersin, P., Kiczka, M., Rosch, D., Ochs, M. & Trudel, D. 2013b. Safety case for the disposal of spent nuclear fuel at Olkiluoto: Radionuclide solubility limits and migration parameters for the backfill. Eurajoki, Finland: Posiva Oy. POSIVA 2012-40. ISBN 978-951-652-220-6 (to be published).
Wersin, P., Pitkänen, P., Snellman, M., Román-Ross, G., Smith, P., Filby, A., Kiczka, M. 2013c. Sulphide fluxes in the spent nuclear fuel repository at Olkiluoto. Eurajoki, Finland: Posiva Oy. Working Report (to be published).

461
Williamson, M.A. & Rimstidt, J.D. 1994. The kinetics and electrochemical rate-determining step of aqueous pyrite oxidation. Geochimica et Cosmochimica Acta. Vol. 58, no. 24, p. 5443-5454. ISSN 00167037.
Wilson, J., Savage, D., Cuadros, J., Shibata, M. & Ragnarsdottir, K.V. 2006a. The effect of iron on montmorillonite stability. (I) Background and thermodynamic considerations. Geochimica et Cosmochimica Acta. Vol. 70, no. 2, p. 306-322. ISSN 00167037.
Wilson, J., Cressey, G., Cressey, B., Cuadros, J., Ragnarsdottir, K.V., Savage, D. & Shibata, M. 2006b. The effect of iron on montmorillonite stability: (II) Experimental investigation. Geochimica et Cosmochimica Acta. Vol. 70, no. 2, p. 323-336. ISSN 00167037.
Wold, S. 2010. Sorption of prioritized elements on montmorillonite colloids and their potential to transport radionuclides. Stockholm, Sweden: Swedish Nuclear Fuel and Waste Management Co. (SKB). Technical Report TR-10-20. 43 p. ISSN 1404-0344.
Wolery, T., Jove-Colon, C., Rard, J., Wijesinghe, A. 2004. Pitzer database development: Description of the Pitzer geochemical thermodynamic database data0.ypf. Appendix I. In In-Drift Precipitates/Salts Model (P. Mariner) Report ANL-EBS-MD-000045 REV 02. Las Vegas, Nevada: Bechtel SAIC Company.
Xu, T., White, S.P. & Pruess, K. 2000. Pyrite oxidation in saturated and unsaturated porous media flow: A comparison of alternative mathematical modeling approaches. Transport in Porous Media. Vol. 39, no. 1, p. 25-56.
Xu, T., Sonnenthal, E., Spycher, N. & Pruess, K. 2008. TOUGHREACT User’s Guide: A simulation program for non-isothermal multiphase reactive transport in variably saturated geologic media, Version 1.2.1. Lawrence Berkeley National Laboratory, University of California, Berkeley.
YVL 8.1. Disposal of low and intermediate level waste from the operation of nuclear power plants, 10 September 2003. Helsinki, Finland: Radiation and Nuclear Safety Authority (STUK). ISBN 951-712-779-0 (html).
YVL 8.2. Clearance of nuclear waste and decommissioned nuclear facilities, 18 February 2008. Helsinki, Finland: Radiation and Nuclear Safety Authority (STUK). ISBN 978-952-478-320-0 (html).
YVL 8.3. Treatment and storage of low and intermediate level waste at a nuclear power plant, 29 June 2005. Helsinki, Finland: Radiation and Nuclear Safety Authority (STUK). ISBN 952-478-038-0 (html).
YVL 8.4. Long-term safety of disposal of spent nuclear fuel, 23 May 2001. Helsinki, Finland: Radiation and Nuclear Safety Authority (STUK). ISBN 951-712-472-4 (html).
YVL 8.5. Operational safety of a disposal facility for spent nuclear fuel, 23 December 2002. Helsinki, Finland: Radiation and Nuclear Safety Authority (STUK). ISBN 951-712-702-2 (html).

462
Zhang, G., Kim, J., Dong, H., Sommer, A.J. 2007. Microbial effects in promoting the smectite to illite reaction: Role of organic matter intercalated in the interlayer. American Mineralogist. Vol. 92, no. 8-9, p. 1401-1410. ISSN 0003004X
Zheng, Y., Zaoui, A. & Shahrour, I. 2011. A theoretical study of swelling and shrinking of hydrated Wyoming montmorillonite. Applied Clay Science. Vol. 51, no. 1, p. 177-181.
Zwally, H.J., Abdalati, W., Herring, T., Larson, K., Saba, J. & Steffen, K. 2002. Surface melt-induced acceleration of Greenland ice-sheet flow. Science. Vol. 297, no. 5579, p. 218-222.

463
APPENDICES
APPENDIX A: SELECTED INFLOW CASES FOR BACKFILL AND BUFFER PERFORMANCE
The following cases are used for the design of the tunnel backfill and in the performance assessment of the tunnel backfill and buffer in the deposition holes. The inflows to a deposition hole and a deposition tunnel are defined for the operational period i.e. when the tunnels are open. The aim was to define a typical case of inflow as well as an almost “dry” and a wet case. The suggested cases are defined based mainly on the modelling results presented in Hartley et al. (2010), but taking into account also the ONKALO monitoring data (Vaittinen et al. 2011) and the updated inflow estimates to the DEMO tunnel (Hartley et al. 2013).
TUNNELS
Case 1, wet tunnel
Total inflow to the tunnel is 5 L/min. It is possible that the deposition tunnel is intersected by a local, hydraulically conductive zone. According to Hartley et al. (2010), the probability of having a total inflow above 1 L/min to the tunnel is significant (41 %) and inflow over 10 L/min has a probability of 18 %. However, such large inflows will be grouted (non-cementitious grouts are allowed in the deposition tunnels) or can also be partly avoided by not extending the tunnels to such zones. Further, the experience from ONKALO shows that the leakage from the major hydrogeological zones HZ19 and HZ20 (such zones are not allowed to intersect deposition tunnels) does not exceed 10 L/min after grouting (see e.g. Vaittinen et al. 2011, Section 3.4.1).
It can be assumed that the main part of the flow is coming from a fracture or a few fractures related to a local hydraulically conductive zone. Lower inflows (0.01 L/min−0.1 L/min) occur also adjacent to the highest inflow within approximately 10−20 m from the main inflow. These inflows are likely to be more or less pointwise. The tunnel may additionally have a few pointwise inflows up to 0.1 L/min.
Case 2, typical tunnel
Total inflow to the tunnel is 0.5 L/min. This value corresponds to the median value of the inflow estimates according to Hartley et al. (2010). Approximately this inflow is obtained also if the inflow estimates for the DEMO tunnels in Hartley et al. (2013) and the observed inflow to ONKALO below the HZ20 zone are scaled to a 250−300 m long deposition tunnel.
The tunnel contains one or two 10−20 m long sections with a few fractures having an inflow in the order of 0.1 L/min and additional pointwise inflows up to 0.01 L/min. The tunnel may additionally have a few pointwise inflows of 0.0001 L/min−0.01 L/min.
Case 3, an almost “dry” tunnel
The inflow to the tunnel is less than 0.01 L/min. According to Hartley et al. (2010), about 22 % of the tunnels could have an inflow less than 0.01 L/min. According to the inflow estimates for the DEMO facility (Hartley et al. 2013), such low inflows to a
464
tunnel are quite unlikely, but they are possible according to the analytical estimates based on pilot hole data.
The tunnel contains a few pointwise inflows of 0.0001 L/min−0.01 L/min.
TUNNEL SECTIONS
Case 1, wet tunnel section
The inflow to the tunnel section (9 m corresponding to an average distance between canister positions) is 1−2 L/min. According to Hartley et al. (2010), there is a probability of a few percent to have an inflow higher than 1 L/min (see also Tunnel Case 1). There is a notable probability of inflows higher than 0.1 L/min according to the results for the DEMO facility (Hartley et al. 2013) and this is likely to originate from an intersection with or connections to, a single zone.
Similar to the Tunnel Case 1, it can be assumed that the main part of the flow is coming from a fracture or a few fractures related to a local hydraulically conductive zone. Lower inflows (0.01 L/min–0.1 L/min) occur also adjacent to the highest inflow. These inflows are likely to be more or less pointwise.
Case 2, tunnel section with some inflow
The inflow is 0.001 L/min, similar to the Deposition Hole Case 2 (below). According to Hartley et al. (2010, Figures 3-8 and 3-9), the inflow distribution to a tunnel section and to a deposition hole are quite similar despite the larger diameter of the deposition tunnel. This is considered appropriate for the purpose of definition of illustrative cases.
Also the distribution of the inflow can be considered similar to the Deposition Hole Case 2.
Case 3, an almost “dry” tunnel section
Following similar argumentation as in case two, the Deposition Hole Case 3 is used.
DEPOSITION HOLES
Case 1, Wet hole
The inflow is 0.1 L/min, which represents the maximum allowed inflow to a deposition hole.
Two subcases based on the distribution of the flow in the deposition hole are defined:
A: the flow originates from a single fracture and the actual leakage comes from a few spots located at the intersection of the fracture with the deposition hole; and
B: the flow originates mainly from a single fracture; although the deposition hole may also include a few other fractures contributing to the inflow, the inflow from (and transmissivity of) these fractures is one or two orders of magnitude lower than those of the fracture contributing mainly to the flow.
465
Case 2, deposition hole with some inflow
The inflow is 0.001 L/min. This value is based on the simulations presented in Hartley et al. (2010, Figure 3-9 and 2012, Chapter 9), according to which less than 10 % of the deposition holes would have inflow higher than 0.001 L/m. However, according to analytical estimates based on pilot hole data considering also the presence of the low transmissivity fractures, the mean inflow is of this order of magnitude (Hartley et al. 2013, Chapter 9).
Similarly to Case 1, two subcases based on the distribution of the flow in the deposition hole are defined:
A: the flow originates from a single fracture and the actual leakage comes from a few spots located at the intersection of the fracture with the deposition hole; and
B: the main part of the flow originates from a single fracture, although the deposition hole may also include a few additional fractures contributing to the inflow, the inflow from (and transmissivity of) these fractures is one or two orders of magnitude lower than the fracture contributing mainly to the flow.
Case 3, an almost dry deposition hole
The inflow to the deposition hole is less than 0.0001 L/min. According to Hartley et al. (2010), only 11 % of the deposition holes have higher inflow than 0.0001 L/min. The result according to simulations in Hartley et al. (2013) is similar. However, according to the analytical estimates, nearly all the deposition holes will have an inflow above 0.0001 L/min.
References
Hartley, L., Hoek, J., Swan, D. & Roberts, D. 2010. Hydrogeological discrete fracture network modeling of groundwater flow under open repository conditions. Eurajoki, Finland: Posiva Oy. Working Report 2010-51. 102 p.
Hartley, L., Appleyard, P., Baxter, S., Hoek, J., Roberts, D., Swan D. & Follin, S. 2013. Development of a hydrogeological discrete fracture network model for the Olkiluoto Site Descriptive Model 2011. Eurajoki, Finland: Posiva Oy. Working Report 2012-32 (to be published).
Vaittinen, T., Ahokas, H., Klockars, J., Nummela, J., Pentti, E., Penttinen, T., Pöllänen, J., Karvonen, T. & Lindgren, S. 2011. Results of monitoring at Olkiluoto in 2010 – Hydrology. Eurajoki, Finland: Posiva Oy. Working Report 2011-43. 378 p.

466

467
Appendix B: Model used for corrosion failure calculations
B.1 Introduction
Chemical species that can cause corrosion of the copper canisters are present at low concentrations in the groundwater and in the porewater of the buffer and backfill. The main corrosive agent of concern is sulphide. The low rates of water flow in the buffer, backfill and surrounding rock greatly limit the rates at which sulphide can migrate to, and interact with, the canister surfaces. Nevertheless, the possibility must be examined that sufficient corrosion occurs in a million year time frame to cause failure of some of the canisters. The likelihood of failure is increased if, during this time frame, significant erosion of the buffer and/or backfill occurs, leading to advective conditions around the canisters. Section 7.5 describes how significant chemical erosion of the buffer associated with the penetration of low-ionic strength glacial meltwater to repository depth cannot be ruled out for some less favourable canister positions. Backfill erosion that could lead to sufficient loss of buffer density for advective conditions to arise is, however, ruled out (see Section 7.5.). The following sections describe a model to evaluate the possible occurrence of corrosion failure over this time frame.
A canister will fail by corrosion at time tfail [a], when the following condition is satisfied:
failt
t
ddtj0 , (B.1-1)
j [m/a] is the corrosion rate and d [m] is the initial thickness of the copper shell.
The corrosion rate is given by:
A
F
N
Nj
s
c
2
(B.1-2)
with:
Nc and Ns the atomic and molecular weights of copper (64) and sulphide (33);
density of copper (8900 kg/m3);
F the rate of transport of sulphide to the canister surface [kg/a]; and
A an effective area of the canister surface over which corrosion occurs [m2].
The factor of 2 in Eq. B.1-2 arises from the fact that 2 moles of copper are corroded per one mole of sulphide arriving at the canister surface, assuming the final product is Cu2S.
The quantification of F and A depends on the dominant transport mechanism for sulphide in the buffer and on the transport paths considered. The following situations are considered in the models presented in Parts B.2 and B.3:

468
The buffer ensures that diffusion is the dominant transport mechanism for dissolved species in the buffer:
1. sulphide diffuses through the buffer to the canister surface from groundwater flowing in a horizontal fracture that intersects the deposition hole;
2. sulphide diffuses vertically to the canister surface through the buffer from the backfill in the deposition tunnel.
The buffer becomes locally eroded where it is intersected by a fracture, giving rise to advective conditions where flowing groundwater with dissolved sulphide contacts the canister surface.
Application of the models requires flow-related data from groundwater flow modelling, and information on the sulphide concentration in the groundwater and deposition tunnel backfill. The application of these data is discussed in Part B.4. Finally, Part B.5 addresses corrosion with local erosion of the buffer, including the periods both before and after advective conditions arise in the buffer. The results of the models are given in Sections 7.7. and 8.2.
B.2 Buffer providing a diffusive barrier
B.2.1 Diffusion from a fracture intersecting the deposition hole
Consider first a steady-state situation where sulphide diffuses through the buffer to the canister surface from groundwater flowing in a horizontal fracture that intersects the deposition hole. For this situation, FDH [kg/a] denotes the rate of transport of sulphide to the canister surface and ADH [m2] denotes an effective area of the canister surface over which corrosion occurs. The ratio FDH/ADH [kg/(m2·a)], needed to evaluate corrosion rate, is taken to be the highest rate of corrosion anywhere on the canister surface. In the presence of a horizontal fracture, the maximum rate occurs along a line on the canister surface that is directly opposite (i.e. closest to) the fracture.
An expression for FDH/ADH is derived in App. B.8 of Smith et al. (2007)16:
brrrr
CD
A
F
ctct
be
DH
DH
/2ln2
(B.2-1)
with
Cb the sulphide concentration at the buffer/rock interface [kg/m3];
2b fracture aperture [m];
De effective diffusion coefficient of anions (sulphide) in the buffer [m2/a];
rt deposition hole radius [m]; and
rc canister radius [m].
16 The quantity FDH/ADH is termed fmax in Smith et al. (2007). Note that the 2 inside the logarithm term in Eq. 2-1 is erroneously given as 4 in Eq. B.8-13 of Smith et al. (2007).
469
The unknown concentration Cb is obtained by considering mass balance at the buffer/rock interface.
Let Qf [m3/a] be the flow rate through a layer of water within the fracture as it enters the
buffer/rock interface zone known as the “boundary layer”. The exchange of sulphide between the flowing water in the fracture and the stagnant pore water in the buffer takes place by diffusion between the buffer and boundary layer. Sulphide enters the boundary layer from upstream parts of the fracture at a rate CsQf, where Cs [kg/m3] is the sulphide concentration in the groundwater away from the interface. Sulphide leaves the boundary layer and is carried downstream at a rate CbQf, where Cb [kg/m3] is the sulphide concentration at the buffer/rock interface.
It follows from mass balance:
fbfsDH QCQCF . (B.2-2)
FDH will also be proportional to the sulphide concentration difference across the buffer. It is assumed that the copper corrosion reaction is rapid, such that the sulphide concentration at the canister surface may be taken as zero. Hence, we can write:
bbDH CQF , (B.2-3)
where Qb [m3/a] is an effective flow rate describing the steady-state rate of mass transfer
across the buffer by diffusion driven by a unit concentration difference [m3/a].
From these two equations, the unknown concentration Cb is given by:
bf
bsb QQ
QCC
/1/1
/1
. (B.2-4)
An expression for Qb is also derived in App. B.8 of Smith et al. (2007) (note the change in notation in the present appendix):
b
rrrD
Qct
teb
2ln
2 2
(B.2-5)
Qf is taken directly from the results of groundwater flow modelling (see Section B.4).
From Eqs. B.2-1, B.2-3 and B.2-5, the effective area for corrosion is given by:
cttDH rrrA 4 , (B.2-6)
and is thus equal in area to a band around the buffer with a half width equal to the buffer thickness. The reference corrosion area ADH can be obtained using rt=0.875 m and rc=0.525 m, which give ADH=3.85 m2. A localised corrosion factor of 5 was used in previous safety assessments (Vieno et al. 1992, Vieno & Nordman 1999). This was to account for the geometric configuration of a fracture intersecting a deposition hole
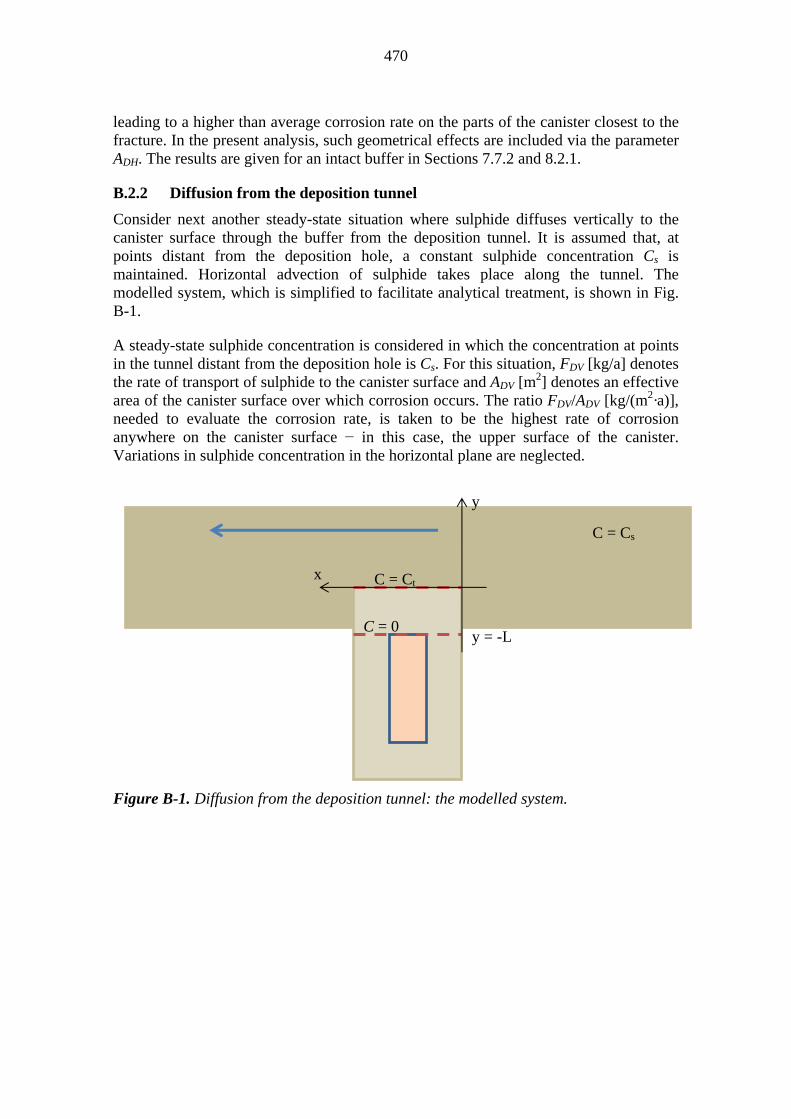
470
leading to a higher than average corrosion rate on the parts of the canister closest to the fracture. In the present analysis, such geometrical effects are included via the parameter ADH. The results are given for an intact buffer in Sections 7.7.2 and 8.2.1.
B.2.2 Diffusion from the deposition tunnel
Consider next another steady-state situation where sulphide diffuses vertically to the canister surface through the buffer from the deposition tunnel. It is assumed that, at points distant from the deposition hole, a constant sulphide concentration Cs is maintained. Horizontal advection of sulphide takes place along the tunnel. The modelled system, which is simplified to facilitate analytical treatment, is shown in Fig. B-1.
A steady-state sulphide concentration is considered in which the concentration at points in the tunnel distant from the deposition hole is Cs. For this situation, FDV [kg/a] denotes the rate of transport of sulphide to the canister surface and ADV [m2] denotes an effective area of the canister surface over which corrosion occurs. The ratio FDV/ADV [kg/(m2·a)], needed to evaluate the corrosion rate, is taken to be the highest rate of corrosion anywhere on the canister surface − in this case, the upper surface of the canister. Variations in sulphide concentration in the horizontal plane are neglected.
Figure B-1. Diffusion from the deposition tunnel: the modelled system.
C = 0
C = Ct
C = Cs
y
x
y = -L

471
Disregarding, for the moment, the finite size of the deposition tunnel, the amount of sulphide M [kg] diffusing vertically in the deposition tunnel to the boundary between the deposition tunnel and the deposition hole in a typical time tadv [a] taken for an element of fluid to be advected horizontally across the top of the deposition hole is given approximately by17:
2 , (B.2-7)
with
Ct the sulphide concentration at the buffer/backfill interface [kg/m3];
porosity of the backfill [kg/m3]; and
Det vertical effective diffusion coefficient of anions (sulphide) in the backfill
[m2/a];
This is also the amount of sulphide that diffuses, in the same time, to the upper surface of the canister.
Taking the time tadv to be the average travel time of a particle moving with flowing water in the deposition tunnel to cross the deposition hole:
2 , (B.2-8)
where q is the Darcy velocity in the backfill. From Eqs. B.2-7 and B.2-8:
2 2 2 . (B.2-9)
Because of the finite size of the tunnel, this expression gives an upper bound to the rate of sulphide diffusion. A further constraint on the rate of mass transfer by diffusion to the deposition hole is given by the rate of advective transport along the tunnel. Thus, for modelling purposes, we take the smaller of
2 2 1 2 (B.2-10)
where As [m2] is the cross-sectional area of the deposition tunnel.
17 Eq. B.2.7 is obtained by considering a frame of reference moving with the fluid in the tunnel. In this case, the problem is equivalent to that of 1-D diffusion into a semi-infinite medium, with a fixed concentration at the boundary. The solution may be obtained, e.g. by Laplace transform methods, see Section 9.11 in Riley (1974).

472
The vertical diffusive flux, FDH, is also given by:
2 , (B.2-11)
where L is the vertical distance from the top of the canister to the top of the deposition hole (Fig. B-1).
Eliminating the unknown concentration Ct from Eqs. B.2-10 and B.2-11, and noting that ADV is simply the upper surface area of the canister, the ratio FDV/ADV needed to evaluate corrosion rate is given by the smaller of:
22
2 2 / 2 2 (B.2-12)
In the limiting case of a large flow in the deposition tunnel:
. (B.2-13)
The results are shown in Section 8.2.
B.3 Buffer becoming locally eroded
Consider now the steady-state situation where the buffer is eroded near to its interface with a horizontal fracture, such that advective transport dominates in a region of the buffer near to the fracture. The situation is illustrated in Fig. B-2.
For this situation, FAH [kg/a] denotes the rate of transport of sulphide to the canister surface and AAH [m2] denotes an effective area of the canister surface over which corrosion occurs.
Figure B-2. Buffer becomes locally eroded: the modelled system.
473
The situation has been analysed by SKB for SR-Site, and the approach discussed here is closely based on that described in detail in SKB (2010).
FAH is expressed as a product of an equivalent flow rate, QAH [m3/a], and the groundwater sulphide concentration Cs.
(B.3-1)
The equivalent flow rate is given by the smaller of:
limQQ
Q
Q
A
A
AH
. (B.3-2)
This formulation is taken from the appendix of Neretnieks et al. (2010).
QA [m3/a] is the flow through a plane intersecting the fracture normal to the flow direction that has a width of twice the deposition diameter, which accounts for the convergence of streamlines towards the deposition hole.
Qlim [m3/a] is given by:
2lim
4
ct
w
rr
VDQ
, (B.3-3)
where V is the volume of eroded buffer, given by18:
322
3
2
2 ctctt rrrrrV
. (B.3-4)
In SR-Site, two alternative expressions are proposed for AAH that take account of the localised nature of erosion (Section 4.3.3 of SKB 2010). The expression that is considered the more realistic is:
ctcAH rrrA . (B.3-5)
Note that, in SR-Site, the corroded volume is approximated to a band extending around half the circumference of canister, to account for the erosion and subsequent corrosion taking place mostly on the up-stream side of the deposition hole. Using Eq. B.3-5 is thus equivalent to setting the width of this band to equal the buffer thickness (see Figure B-3).
18 This equation is obtained by an exact integration of the volume shown in blue in Fig. B-2. It differs somewhat from the approximate volume used by SKB in SR-Site (Section 4.3.3 of SKB 2010): . However, the difference is considered small compared to other uncertainties in the analysis of buffer erosion. In particular, the volume shown in Fig. B-2 corresponds to one snapshot in time as the eroded volume first contacts the canister. The semicircular shape of the eroded volume will be lost as erosion continues.
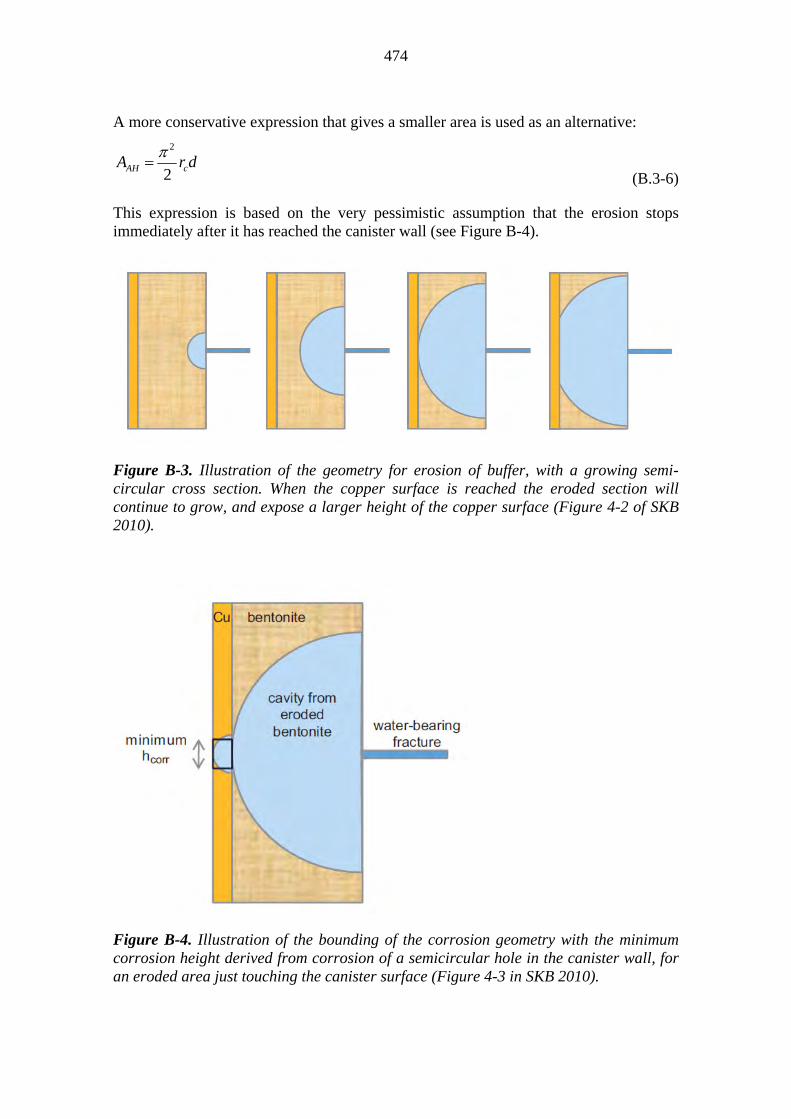
474
A more conservative expression that gives a smaller area is used as an alternative:
drA cAH 2
2
(B.3-6)
This expression is based on the very pessimistic assumption that the erosion stops immediately after it has reached the canister wall (see Figure B-4).
Figure B-3. Illustration of the geometry for erosion of buffer, with a growing semi-circular cross section. When the copper surface is reached the eroded section will continue to grow, and expose a larger height of the copper surface (Figure 4-2 of SKB 2010).
Figure B-4. Illustration of the bounding of the corrosion geometry with the minimum corrosion height derived from corrosion of a semicircular hole in the canister wall, for an eroded area just touching the canister surface (Figure 4-3 in SKB 2010).
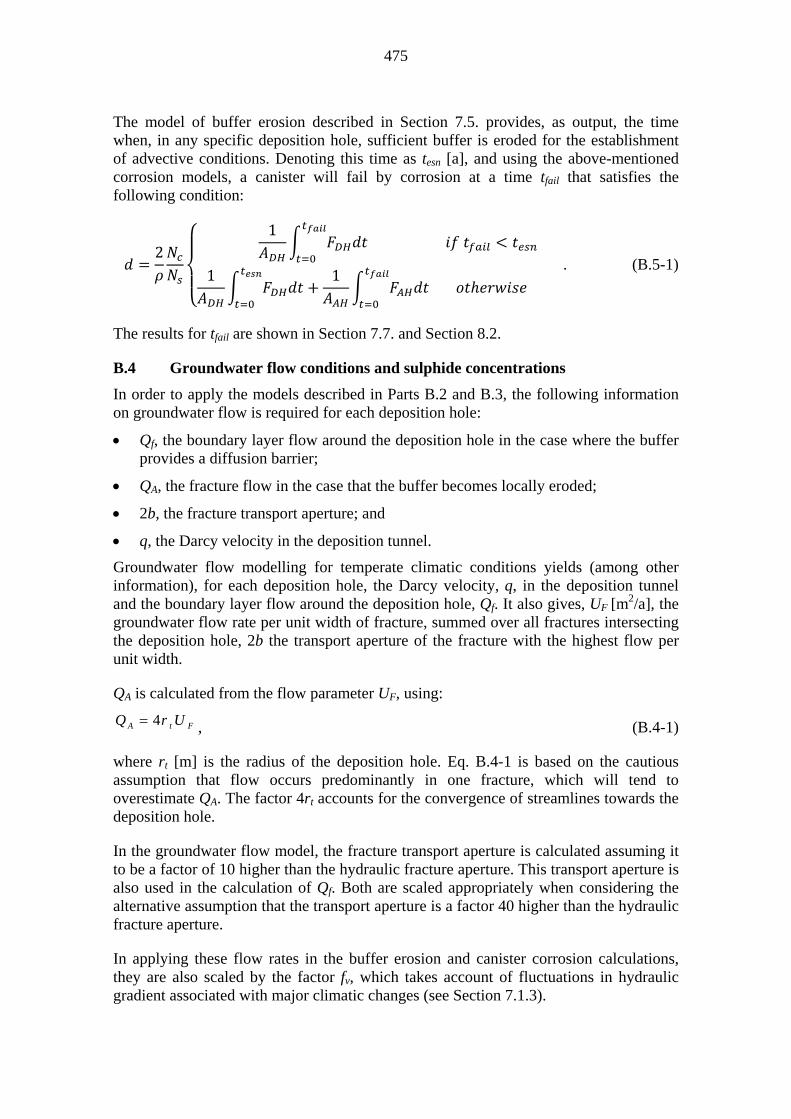
475
The model of buffer erosion described in Section 7.5. provides, as output, the time when, in any specific deposition hole, sufficient buffer is eroded for the establishment of advective conditions. Denoting this time as tesn [a], and using the above-mentioned corrosion models, a canister will fail by corrosion at a time tfail that satisfies the following condition:
21
1 1 . (B.5-1)
The results for tfail are shown in Section 7.7. and Section 8.2.
B.4 Groundwater flow conditions and sulphide concentrations
In order to apply the models described in Parts B.2 and B.3, the following information on groundwater flow is required for each deposition hole:
Qf, the boundary layer flow around the deposition hole in the case where the buffer provides a diffusion barrier;
QA, the fracture flow in the case that the buffer becomes locally eroded;
2b, the fracture transport aperture; and
q, the Darcy velocity in the deposition tunnel.
Groundwater flow modelling for temperate climatic conditions yields (among other information), for each deposition hole, the Darcy velocity, q, in the deposition tunnel and the boundary layer flow around the deposition hole, Qf. It also gives, UF [m
2/a], the groundwater flow rate per unit width of fracture, summed over all fractures intersecting the deposition hole, 2b the transport aperture of the fracture with the highest flow per unit width.
QA is calculated from the flow parameter UF, using:
FtA UrQ 4 , (B.4-1)
where rt [m] is the radius of the deposition hole. Eq. B.4-1 is based on the cautious assumption that flow occurs predominantly in one fracture, which will tend to overestimate QA. The factor 4rt accounts for the convergence of streamlines towards the deposition hole.
In the groundwater flow model, the fracture transport aperture is calculated assuming it to be a factor of 10 higher than the hydraulic fracture aperture. This transport aperture is also used in the calculation of Qf. Both are scaled appropriately when considering the alternative assumption that the transport aperture is a factor 40 higher than the hydraulic fracture aperture.
In applying these flow rates in the buffer erosion and canister corrosion calculations, they are also scaled by the factor fv, which takes account of fluctuations in hydraulic gradient associated with major climatic changes (see Section 7.1.3).
476
References
Neretnieks, I., Liu, L. & Moreno, L. 2010. Mass transfer between waste canister and water seeping in rock fractures. Revisiting the Q-equivalent model. Stockholm, Sweden: Swedish Nuclear Fuel and Waste Management Co. (SKB). Technical Report TR-10-42. 51 p. ISSN 1404-0344.
Riley, K. F. 1974. Mathematical methods for the physical sciences: An informal treatment for students of physics and engineering. Cambridge, UK: Cambridge University Press. 552 p. ISBN-10: 0521098394, ISBN-13: 978-0521098397.
SKB 2010. Corrosion calculations report for the safety assessment SR-Site. Stockholm, Sweden: Swedish Nuclear Fuel and Waste Management Co. (SKB). Technical Report TR-10-66. 52 p. ISSN 1404-0344.
Smith, P. A., Johnson, L. H., Snellman, M., Pastina, B. & Gribi, P. 2007. Safety assessment for a KBS-3H spent nuclear fuel repository at Olkiluoto - Evolution report. Eurajoki, Finland: Posiva Oy. POSIVA 2007-08. 298 p. ISBN 978-951-652-156-8 and Stockholm, Sweden: Swedish Nuclear Fuel and Waste Management Co. (SKB). Report R-08-37. 233 p. ISSN 1402-3091.
Vieno, T. & Nordman, H. 1999. Safety assessment of spent fuel disposal in Hästholmen, Kivetty, Olkiluoto and Romuvaara − TILA-99. Helsinki, Finland: Posiva Oy. POSIVA 99-07. 253 p. ISBN 951-652-062-6.
Vieno, T., Hautojärvi, A., Koskinen, L. & Nordman, H. 1992. TVO-92 safety analysis of spent fuel disposal. Nuclear Waste Commission of Finnish Power Companies (YJT), Helsinki, Finland. Report YJT-92-33E.
477
Appendix C: Oxygen consumption in the backfill under saturated and unsaturated conditions - the role of pyrite
C.1 Introduction
Redox conditions in the near field strongly affect the corrosion of the Cu-canister and thus its integrity. Because of the reducing environment of the surrounding host rock, corrosion rates are expected to be very low (King et al. 2012). During the initial period after repository closure however, molecular O2 is present in the partially saturated buffer and backfill materials and in the EDZ. This O2 may diffuse to the canister surface where it will corrode the copper surface at a much higher rate than during the later anaerobic period. It is therefore important to consider this process in safety assessment.
The largest O2 pool is in the emplaced backfill. Oxygen will react with accessory minerals, such as pyrite and siderite during its passage towards the rock and the buffer. Moreover, microbial degradation processes − if these were to occur in the backfill – would enhance the consumption rate of O2. Thus, the O2 flux to the canister will be attenuated. Similar processes will occur in the buffer which also contains impurities of reactive iron minerals (Kumpulainen & Kiviranta 2010).
The time scales of O2 consumption have been estimated previously by considering mineral reaction rates. Wersin et al. (1994a) estimated a range of 7−290 years for O2 depletion in the saturated buffer from pyrite oxidation rates. These rates were based on a “shrinking core” model in which pyrite surfaces are coated with ferric hydroxide. This model assumption is very pessimistic, as also discussed by Puigdomenech et al. (1999), and hence the proposed oxidation rates of Wersin et al. (1994a) probably yield excessively long time scales of O2 depletion. Grandia et al. (2006) assessed O2 consumption in the saturated backfill for the SKB concept (30 % MX-80, 70 % crushed rock), by considering iron mineral reactions, aerobic respiration and diffusion into the rock. Their modelling results indicated rapid O2 consumption (in the range of a few to about 30 days) induced by pyrite and siderite dissolution. The omission of iron mineral and microbial degradation reactions led to much slower depletion rates according to the results of Grandia et al. (2006).
There is some uncertainty regarding the potential oxidation of pyrite and formation of oxidised layers during processing and storage in the purchased clay materials.
The previous assessments highlight the important role of pyrite in reducing oxygen levels in backfill and buffer. Pyrite is a prominent accessory mineral in the backfill foreseen in Posiva’s concept, which is composed of compacted Friedland clay blocks and Milos bentonite pellets. The averaged material contains 0.8 wt.% of pyrite and 1.1 wt.% of siderite.
Pyrite oxidation by oxygen generates sulphuric acid. This process is buffered by dissolution of carbonates which are present as accessory minerals in the backfill and the buffer.
The scope here is to estimate the O2 consumption rates and respective time scales based on pyrite oxidation for the Olkiluoto case. For this mineral, rather good understanding of this reaction process exists. An important aspect, not considered in previous

478
assessments (e.g. Wersin et al. 1994a, Grandia et al. 2006) is the fate of O2 under unsaturated conditions. Such conditions are expected to prevail for long periods (> 500 years) in many deposition tunnels.
This appendix is organised as follows: First, relevant literature on pyrite oxidation by molecular O2 is briefly presented. Second, design-specific parameters for the backfill required for the assessment are compiled. Third, the O2 consumption rates are estimated from pyrite oxidation for the saturated and unsaturated cases. Fourth, the results are discussed and uncertainties are outlined.
C.2 Pyrite oxidation rates
The oxidation of pyrite is a complex electrochemical process and involves a number of reaction steps and multi-electronic transfer (e.g. Rimstidt & Vaughan 2003). In the presence of molecular oxygen, the overall reaction under circum-neutral conditions is often represented as:
FeS2 + 15/4O2 + 7/2H2O Fe(OH)3 + 2SO42- + 4H+ (eq. C.2-1)
Thus, 3.75 mol of O2 are consumed per mol of pyrite. As shown by numerous studies, in particular those of Rimstidt, Nicholson & co-workers (e.g. Nicholson 1994, Williamson & Rimstidt 1994), the oxidation rate is dependent on the pyrite surface area, oxygen and ferric ion concentrations and temperature. Under circum-neutral conditions, the reaction rate tends to be enhanced relative to that in acidic conditions.
C.2.1 Saturated conditions
As shown by data compilations (Nicholson 1994, Williamson & Rimstidt 1994), there is a good correlation between pyrite oxidation rates and oxygen concentration if normalised to pyrite surface area. The reaction studied was:
FeS2 + 7/2O2 + H2O Fe2+ + 2SO42- + 2H+ (eq. C.2-2)
The rate model proposed by Williamson & Rimstidt (1994) is:
Rpy =10-8.19(0.10) [O2]0.5(0.04)/[H+]0.11(0.01) (eq. C.2-3)
where Rpy is the pyrite weathering rate in mol/(m2·s). The fractional order dependence on oxygen concentration was explained by the sorption of O2 onto the pyrite surface according to a Freundlich isotherm. The rate model indicates a weak correlation with pH, displaying a slight positive correlation between the oxidation rate and pH. This proposed relationship is rather independent of site-specific conditions and was shown to cover a large range of O2 concentrations.
From the compilations of Morin (1993), Nicholson (1994) and Mäder (2002) it can be inferred that pyrite oxidation rates under saturated conditions at room temperature are in the order of 310-10−810-10 mol/(m2·s). The corresponding O2 consumption rates, according to eq. C.2-1, are roughly 110-9−310-9 mol/(m2·s).

479
The temperature dependence of the pyrite oxidation can be described by an Arrhenius relationship. The activation energy is about 60−80 kJ/mol and was derived from plotting experimentally determined rates as a function of 1/T (Nicholson 1994).
C.2.2 Unsaturated conditions
Comparatively fewer pyrite oxidation data exist for unsaturated conditions. Generally speaking, reported rates tend to be higher because of the higher availability of O2 in the gaseous phase and the resulting larger concentration gradients (e.g. Morin 1993). But because of this fact, reported rate data often reflect mixed rates including both O2 transport and chemical oxidation rates. On the basis of experimental data of Welch et al. (1990), Xu et al. (2000) proposed that the (chemical) pyrite oxidation rate reaches a maximum rate at a water saturation of 0.4 and shows a linear decrease at lower and higher moisture contents (Fig. C.2-1).
A systematic study on pyrite oxidation in moist air (at 96.7 % relative humidity) was conducted by Jerz (2002) and published by Jerz & Rimstidt (2004). In the first part, a compilation of previously reported oxidation rates under unsaturated conditions was presented. The data showed a range of about 310-7−210-9 mol O2/(m
2·s) (or 910-8−610-10 mol pyrite/(m2·s)). The rates are thus higher or similar to those obtained for saturated conditions (see above). In the study of Jerz (2002), a fast initial rate of 10-7 mol/(m2·s) was obtained, in agreement with most of the published data. However, after longer reaction times, rates slowed down considerably and reached constant rates below those reported for saturated conditions (Fig. C.2-2).
Figure C.2-1. The rate of pyrite oxidation, expressed as liquid saturation dependent factor, f(SI), as a function of water saturation. Figure taken from Xu et al. (2000).
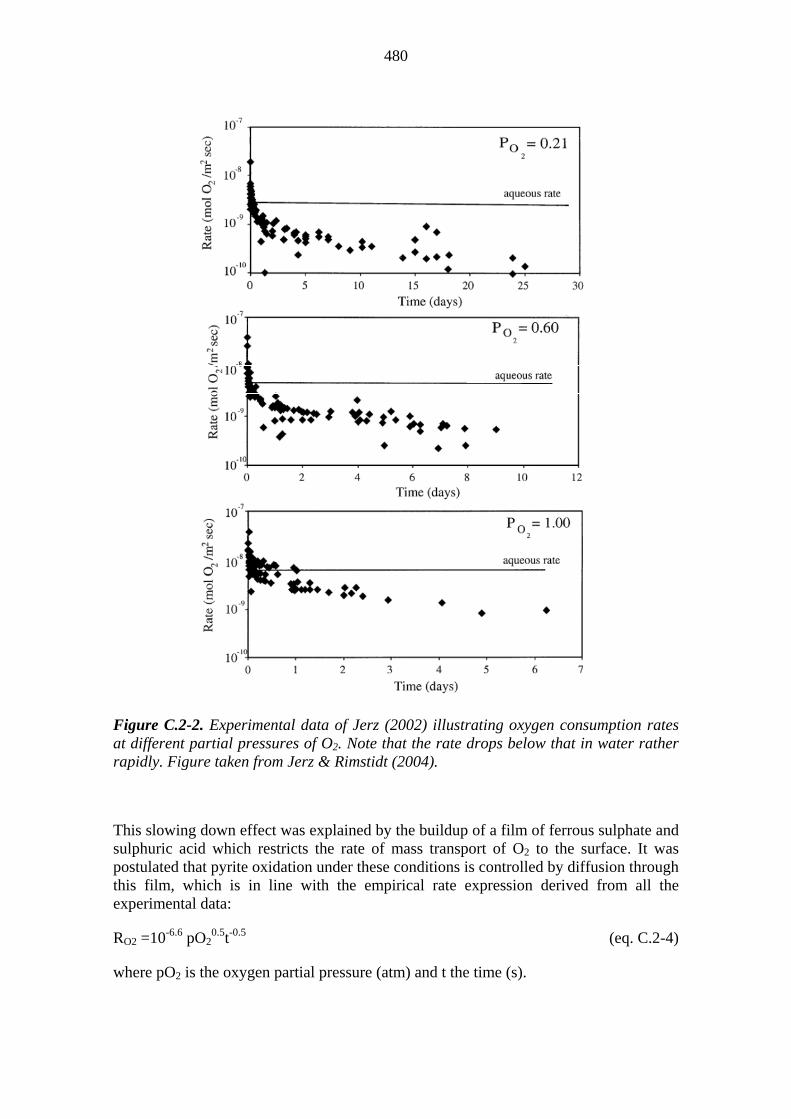
480
Figure C.2-2. Experimental data of Jerz (2002) illustrating oxygen consumption rates at different partial pressures of O2. Note that the rate drops below that in water rather rapidly. Figure taken from Jerz & Rimstidt (2004).
This slowing down effect was explained by the buildup of a film of ferrous sulphate and sulphuric acid which restricts the rate of mass transport of O2 to the surface. It was postulated that pyrite oxidation under these conditions is controlled by diffusion through this film, which is in line with the empirical rate expression derived from all the experimental data:
RO2 =10-6.6 pO20.5t-0.5 (eq. C.2-4)
where pO2 is the oxygen partial pressure (atm) and t the time (s).

481
Conforming to this reaction process, the rate increases with decreasing moisture content down to the situation in which pyrite oxidation becomes limited by the lack of water (Jerz & Rimstidt 2004). This is in line with the conceptual model proposed by Xu et al. (2000).
C.3 Site-specific data for the backfill
The design used for the backfill is based on the previous reference design by Hansen et al. (2010) with added update in the excavation tolerances (400 mm for the floor and 300 mm for the walls and roof)19 and is illustrated in Fig. C.3-1. It consists of compacted Friedland blocks surrounded by rather loosely compacted Milos bentonite fine-grained pellets at the walls and roof and by coarse-grained Milos bentonite granules at the floor. The relevant petrophysical and mineralogical parameters are given in Table C.3-1.
The concentration of O2 in the backfill was calculated from the porosity, the initial moisture content, the air density (1.1839 g/L at 25 °C), the O2 mass fraction in air (0.233) and the molecular weight (32 g/mol). The resulting O2 mass per tunnel-m is 37.8 mol, i.e. about half of which resides in the pellet filling material. Assuming the O2 amount per tunnel metre given in Table C.3-1, the amount of oxygen, m, in moles in a
Figure C.3-1. Layout of the deposition tunnel backfill design (based on Hansen et al. 2010 updated with the excavation tolerances).
19 The reference layout, which has minor changes made relative to the layout presented here, is presented in the Backfill Production Line.

482
section of backfilled deposition tunnel equal in length to the deposition hole spacing L = 9 m is equal to 37.838 moles/m × L = 340.5 moles. Both the Friedland clay and the Milos bentonite contain significant amounts of pyrite. The calculated mass of pyrite is 1839 mol per tunnel-m, thus in substantial excess compared with the initially present oxygen. Note that the backfill also contains significant fractions of siderite and organic mater. These compounds however occur primarily in the Friedland clay and not in the Milos bentonite.
Table C.3-1. Petrophysical, design and mineralogical parameters of different backfill components and average materials (system parameters are based on the earlier design by Hansen et al. 2010 with added update on the excavation tolerances20; mineral data from Kumpulainen & Kiviranta 2010).
Friedland blocks (gaps filled)
Gaps between blocks
Milos granules (floor)
Milos pellets (wall/roof)
Averaged backfill material
System parameters
Volume per tunnel-m (m3) 11.3 0.23 1.27 3.83 16.460
Dry density (kg/dm3) 2.07 1.25 0.95 1.717
Grain density (kg/dm3) 2.79 2.75 2.75 2.780
Total porosity (-) 0.26 1.00 0.55 0.65 0.382
Initial water content (wt-%) 6.00 10.00 10.00 7.156
Pore volume per tunnel-m (m3) 2.88 0.23 0.69 2.49 6.294
Air volume per tunnel-m (m3) 1.50 0.23 0.53 2.13 4.389
Saturation degree (-) 0.48 0.00 0.23 0.15 0.303
O2 amount per tunnel-m (mol) 12.92 1.98 4.61 18.32 37.838
Reactive minerals / org. matter
Pyrite (wt-%) 0.80 0.90 0.90 0.820
Pyrite conc. per tunnel-m (mol) 1463.03 113.42 259.94 1839.337
Siderite (wt-%) 1.60 - - 1.082
Organic carbon (wt-%) 0.27 0.02 0.02 0.189
20 The current reference design and intial state for the backfill is given in Backfill Production Line report and in Description of the Disposal System. The values of the averaged backfill material properties do not differ significantly between the two designs (Hansen et al. 2010 with added tolerances and the reference design). In the calculation presented here, a conservative estimate of oxygen present is used compared to that reported in Description of the Disposal System, Chapter 8.4.3.

483
The surface area of pyrite in the backfill is a rather uncertain parameter. The particle size in MX-80 is in the range of one to a few micrometres according to SEM analysis (Karnland et al. 2009). The specific surface area of pyrite (s, m2/kg) can be estimated from its generally spherical shape which yields the following relationship (Nicholson 1994):
s = 6/dpy (eq. C.3-1)
where d is the diameter of the pyrite particle (m) and py is the pyrite density (5010 kg/m3).
From the relationship for spherical particles given in eq. C.3-1, the geometric surface area (Spy) can be calculated. Thus, for pyrite particles with d = 1 m, Spy = 1.2 m2/g and with d = 10 m, Spy = 0.12 m2/g. From the dry density (1.72 kg/L) and the porosity (0.382) of the backfill (Table C.3-1), the surface area per unit pore volume is 43.5 m2/L and 4.35 m2/L, for 1 m and 10 m diameter particles, respectively.
C.4 Bounding calculations for oxygen consumption
This section presents some bounding calculations of the degree to which a copper canister could be corroded by oxygen entrapped within the partly saturated KBS-3 backfill at the time of emplacement.
The calculations are as follows: the amount of corrosion that would occur if, hypothetically, all the entrapped oxygen in the backfill reacted with the canister lid; and the amount of corrosion that would occur before oxygen in the backfill is consumed by reaction with pyrite in the backfill, considering both partially saturated and fully saturated conditions.
C.4.1 Mass balance
In the following mass balance, it is assumed that all the entrapped oxygen in the backfill reacts with the canister lid, the paths to the lid being the shortest from the backfill to any part of the canister. Any consumption of oxygen due to reaction with secondary minerals in the backfill is conservatively neglected. Oxygen in the buffer is assumed to be of minor importance.
The modelled system is illustrated in Fig. C.4-1.
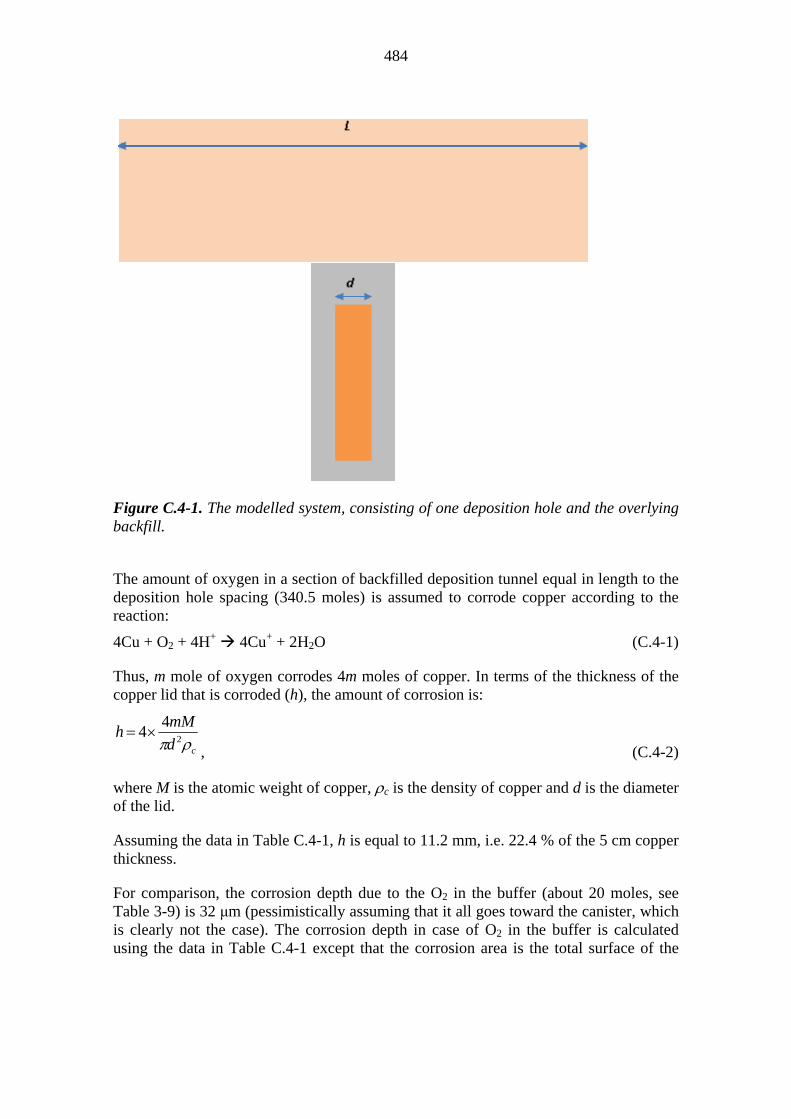
484
Figure C.4-1. The modelled system, consisting of one deposition hole and the overlying backfill.
The amount of oxygen in a section of backfilled deposition tunnel equal in length to the deposition hole spacing (340.5 moles) is assumed to corrode copper according to the reaction:
4Cu + O2 + 4H+ 4Cu+ + 2H2O (C.4-1)
Thus, m mole of oxygen corrodes 4m moles of copper. In terms of the thickness of the copper lid that is corroded (h), the amount of corrosion is:
cd
mMh
2
44
, (C.4-2)
where M is the atomic weight of copper, c is the density of copper and d is the diameter of the lid.
Assuming the data in Table C.4-1, h is equal to 11.2 mm, i.e. 22.4 % of the 5 cm copper thickness.
For comparison, the corrosion depth due to the O2 in the buffer (about 20 moles, see Table 3-9) is 32 μm (pessimistically assuming that it all goes toward the canister, which is clearly not the case). The corrosion depth in case of O2 in the buffer is calculated using the data in Table C.4-1 except that the corrosion area is the total surface of the
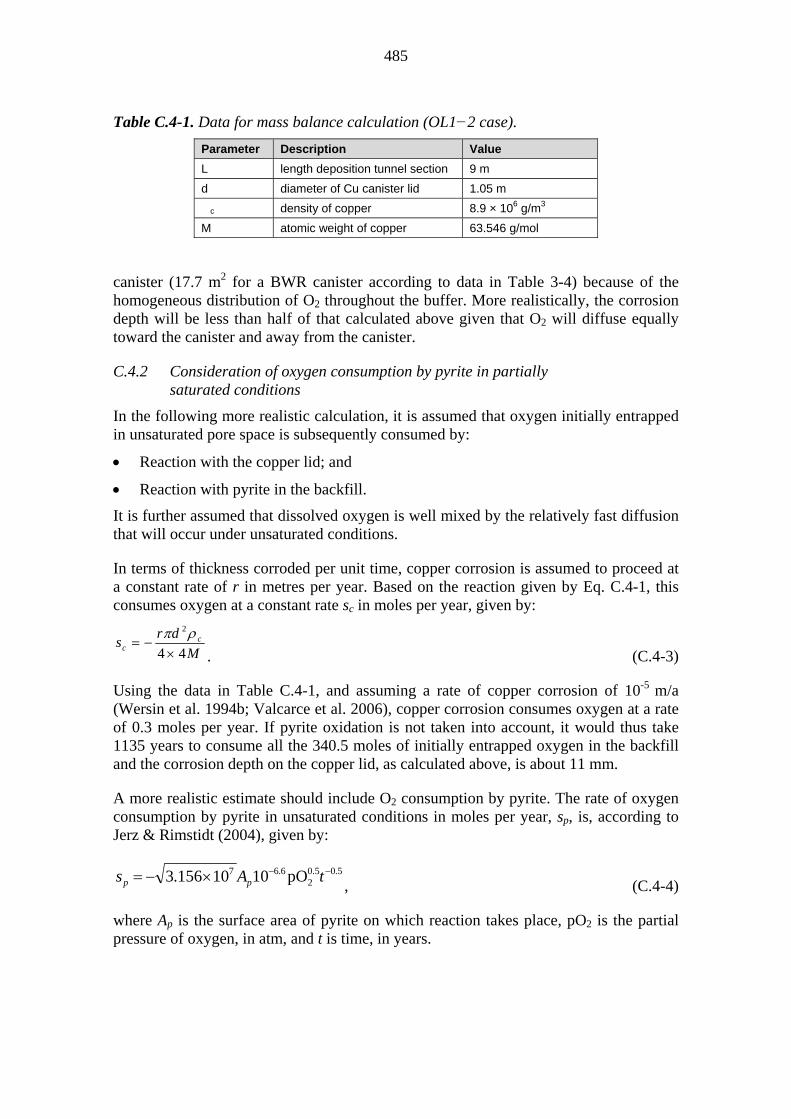
485
Table C.4-1. Data for mass balance calculation (OL1−2 case).
Parameter Description Value
L length deposition tunnel section 9 m
d diameter of Cu canister lid 1.05 m
�c density of copper 8.9 × 10⁶ g/m3
M atomic weight of copper 63.546 g/mol
canister (17.7 m2 for a BWR canister according to data in Table 3-4) because of the homogeneous distribution of O2 throughout the buffer. More realistically, the corrosion depth will be less than half of that calculated above given that O2 will diffuse equally toward the canister and away from the canister.
C.4.2 Consideration of oxygen consumption by pyrite in partially saturated conditions
In the following more realistic calculation, it is assumed that oxygen initially entrapped in unsaturated pore space is subsequently consumed by:
Reaction with the copper lid; and
Reaction with pyrite in the backfill.
It is further assumed that dissolved oxygen is well mixed by the relatively fast diffusion that will occur under unsaturated conditions.
In terms of thickness corroded per unit time, copper corrosion is assumed to proceed at a constant rate of r in metres per year. Based on the reaction given by Eq. C.4-1, this consumes oxygen at a constant rate sc in moles per year, given by:
M
drs c
c 44
2
. (C.4-3)
Using the data in Table C.4-1, and assuming a rate of copper corrosion of 10-5 m/a (Wersin et al. 1994b; Valcarce et al. 2006), copper corrosion consumes oxygen at a rate of 0.3 moles per year. If pyrite oxidation is not taken into account, it would thus take 1135 years to consume all the 340.5 moles of initially entrapped oxygen in the backfill and the corrosion depth on the copper lid, as calculated above, is about 11 mm.
A more realistic estimate should include O2 consumption by pyrite. The rate of oxygen consumption by pyrite in unsaturated conditions in moles per year, sp, is, according to Jerz & Rimstidt (2004), given by:
5.00.52
6.67 pO1010156.3 tAs pp , (C.4-4)
where Ap is the surface area of pyrite on which reaction takes place, pO2 is the partial pressure of oxygen, in atm, and t is time, in years.

486
Treating oxygen as an ideal gas:
325 101/10OpO 322 RT , (C.4-5)
where R is the gas constant 8.3145 J/(mol·K), T is temperature, taken here to be 298.15 K (25 °C) and [O2] is the molar oxygen concentration in the unsaturated void space in the backfill. From Eqs. C.4-4 and C.4-5:
5.05.0
2O tCs p , (C.4-6)
where
5.036.67 325 101/101010156.3 RTAC p . (C.4-7)
The rate will thus start high, and decrease with time and with decreasing oxygen concentration.
Considering first only oxygen consumption by pyrite:
5.05.0
22 O
O tCsdt
dV p
, (C.4-8)
where V is the unsaturated pore space in the backfill.
This ordinary differential equation has the solution:
.OO2
5.05.0
init22
t
V
C
(C.4-9)
All oxygen is consumed at time Tunsat, given by:
2
init2O
C
VTunsat
, (C.4-10)
where [O2]init is the initial oxygen concentration:
V
minit2O
. (C.4-11)
The unsaturated pore space in the backfill, in litres, is:
SVV s 1 , (C.4-12)
where S is the degree of saturation (Table C.3-1) and Vs is the total pore volume in the backfill (in litres):
487
.11000 LAVs (C.4-13)
In Eq. C.4-13, is the backfill porosity (0.382, see Table C.3-1) and A is the cross-sectional area of the tunnel (16.46 m2).
From these equations, Vs is equal to 91,551 litres and V is equal to 63,811 litres and [O2]init = 0.0053 M.
Assuming either 4.35 m2 or 43.5 m2 of pyrite surface per litre of total pore volume in the backfill, i.e.:
25p
2
m103.98A and ,L
m 43.5or 35.4
s
p
V
A
, (C.4-14)
the time needed to consume all initially trapped oxygen is 2.8 years using the above data or about 10 days (i.e. about 100 times faster) if the higher pyrite surface area is used.
Thus, oxygen consumption by the oxidation of pyrite is the faster reaction compared with oxidation of copper (see above), and initially trapped oxygen will be consumed in between about 10 days and about three years. In 10 days, the amount of copper corrosion is about r × 0.03, which is 0.3 microns. In three years, the amount of copper corrosion is r × 3, which is 30 microns.
The comparison of this calculation with that for the unsaturated case shows that the O2 consumption rate is faster under saturated conditions. This differs from the common view of generally faster pyrite oxidation rates under non-saturated conditions (see above). The reason for this apparent discrepancy is the slowing down effect in the applied rate law proposed by Jerz & Rimstidt (2004). Notwithstanding this discrepancy, the applied pyrite oxidation rate from Jerz & Rimstidt (2004) may regarded as pessimistic with regard to oxygen consumption timescales under unsaturated conditions.
C.4.3 Consideration of oxygen consumption by pyrite in fully saturated conditions
In the following calculation, it is assumed that oxygen initially entrapped in unsaturated pore space is fully dissolved in the pore water, and that the backfill becomes saturated before significant consumption by chemical reactions occurs. The reaction considered is the reaction with pyrite in the backfill.
The rate of oxygen consumption by pyrite in saturated conditions in moles per year, sp, is, according to Eq. (C.2-2) (Williamson & Rimstidt 1994) given by:
5.0
211.0
5.0219.87 O4.5
H
O10
2
71016.3
ppp AAs
, (C.4-15)
where [H+] can be taken to be 10-8 M, and it is assumed that each mole of pyrite consumes 7/2 moles of O2.
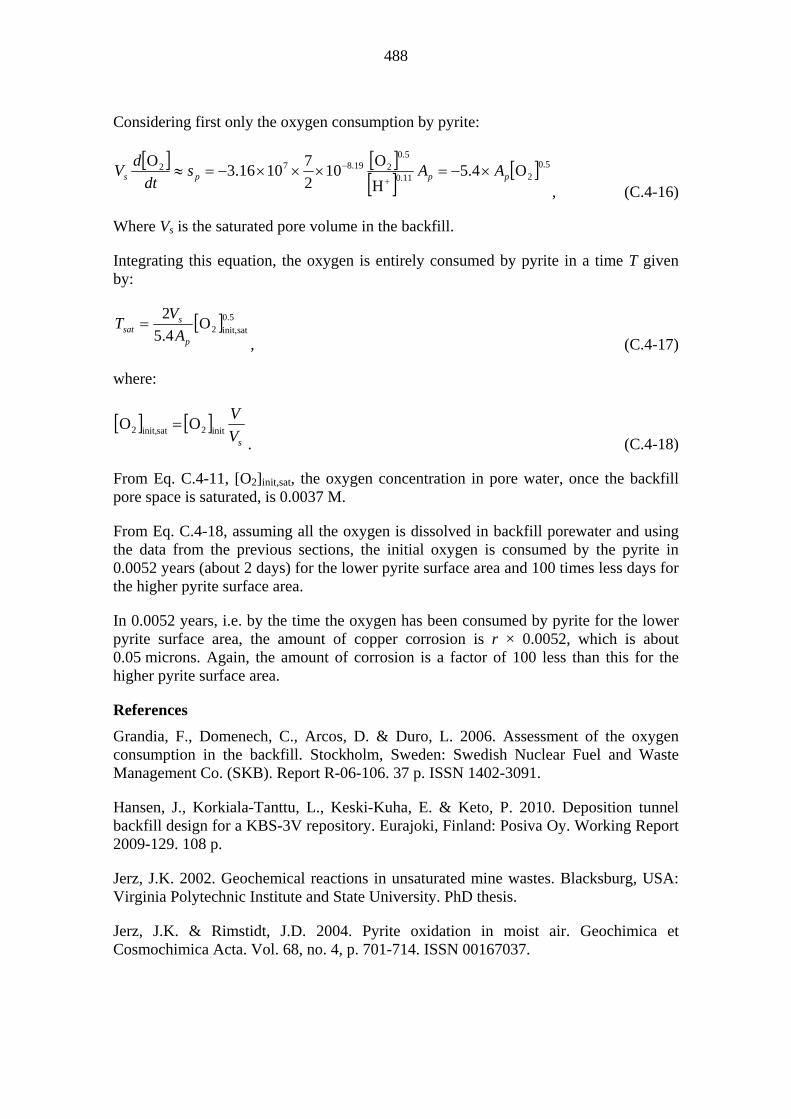
488
Considering first only the oxygen consumption by pyrite:
5.0
211.0
5.0219.872 O4.5
H
O10
2
71016.3
Oppps AAs
dt
dV
, (C.4-16)
Where Vs is the saturated pore volume in the backfill.
Integrating this equation, the oxygen is entirely consumed by pyrite in a time T given by:
0.5
satinit,2O4.5
2
p
ssat A
VT
, (C.4-17)
where:
sV
Vinit2satinit,2 OO
. (C.4-18)
From Eq. C.4-11, [O2]init,sat, the oxygen concentration in pore water, once the backfill pore space is saturated, is 0.0037 M.
From Eq. C.4-18, assuming all the oxygen is dissolved in backfill porewater and using the data from the previous sections, the initial oxygen is consumed by the pyrite in 0.0052 years (about 2 days) for the lower pyrite surface area and 100 times less days for the higher pyrite surface area.
In 0.0052 years, i.e. by the time the oxygen has been consumed by pyrite for the lower pyrite surface area, the amount of copper corrosion is r × 0.0052, which is about 0.05 microns. Again, the amount of corrosion is a factor of 100 less than this for the higher pyrite surface area.
References
Grandia, F., Domenech, C., Arcos, D. & Duro, L. 2006. Assessment of the oxygen consumption in the backfill. Stockholm, Sweden: Swedish Nuclear Fuel and Waste Management Co. (SKB). Report R-06-106. 37 p. ISSN 1402-3091.
Hansen, J., Korkiala-Tanttu, L., Keski-Kuha, E. & Keto, P. 2010. Deposition tunnel backfill design for a KBS-3V repository. Eurajoki, Finland: Posiva Oy. Working Report 2009-129. 108 p.
Jerz, J.K. 2002. Geochemical reactions in unsaturated mine wastes. Blacksburg, USA: Virginia Polytechnic Institute and State University. PhD thesis.
Jerz, J.K. & Rimstidt, J.D. 2004. Pyrite oxidation in moist air. Geochimica et Cosmochimica Acta. Vol. 68, no. 4, p. 701-714. ISSN 00167037.

489
Karnland, O., Olsson, S., Dueck, A., Birgersson, M., Nilsson, U. & Hernan-Hakansson, T. 2009. Long term test of buffer material at the Äspö Hard Rock Laboratory, LOT project. Final report on the A2 test parcel. Stockholm, Sweden: Swedish Nuclear Fuel and Waste Management Co. (SKB). Technical Report TR-09-29. 296 p. ISSN 1404-0344.
King, F., Lilja, C., Pedersen, K., Pitkänen, P. & Vähänen, M. 2012. An update of the state-of-the-art report on the corrosion of copper under expected conditions in a deep geologic repository. Eurajoki, Finland: Posiva Oy. POSIVA 2011-01. 246 p. ISBN 978-951-652-178-0, ISSN 1239-3096. (Also printed as SKB TR-10-67.)
Kumpulainen, S. & Kiviranta, L. 2010. Mineralogical and chemical characterization of various bentonite and smectite-rich clay materials. Eurajoki, Finland: Posiva Oy. Working Report 2010-52. 74 p.
Mäder, U. 2002. Oxidation of clay-rich host rock during the operational phase of a nuclear waste repository: Case studies and quantitative estimates of pyrite oxidation in Opalinus Clay and Marl of the Palfris Formation. Wettingen, Switzerland: Nagra. Unpublished internal report. 100 p.
Morin, K.A. 1993. Rates of sulfide oxidation in submerged environments: implications for subaqueous disposal. In: Proceedings of the 17th Annual Mine Reclamation Symposium. Port Hardy, British Columbia, Canada. May 4-7, 1993. Vancouver, Canada: Mining Association of British Columbia. P. 235-247.
Nicholson, R.V. 1994. Iron-sulfide oxidation mechanism: laboratory studies. In: Jambor, J.L. & Blowes, D.W. (eds.). Short course handbook on environmental geochemistry of sulfide mine-waters. Mineralogical Association of Canada. Vol 22, p. 163-184.
Puigdomenech, I., Banwart, S. A., Bateman, K., Milodowski, A. E., West, J. M., Griffault, L., Gustafsson, E., Hama, K., Yoshida, H., Kotelnikova, S., Pedersen, K., Lartigue, J. E., Michaud, V., Trotignon, L., Morosini, M., Rivas Perez, J. & Tullborg, E. L. 1999. Redox experiment in detailed scale (REX). First project status. Stockholm, Sweden: Swedish Nuclear Fuel and Waste Management Co. (SKB). International Cooperation Report ICR-99-01. 111 p. ISSN 1104-3210.
Rimstidt, J. D. & Vaughan, D. J. 2003. Pyrite oxidation: A state-of-the-art assessment of the reaction mechanism. Geochimica et Cosmochimica Acta. Vol. 67, no. 5, p. 873-880. ISSN 00167037.
Valcarce, M.B., De Sanchez, S.R. & Vazquez, M. 2006. A comparative analysis of copper and brass surface films in contact with tap water. J. Mater. Sci. Vol. 41, p. 1999-2007.
Welch, V.S. II, Dann, M.W. & Mehta, B. 1990. Predicting oxygen depletion in reservoir environments. Society of Petroleum Engineers. Paper SPE 20721.
490
Wersin, P., Spahiu, K. & Bruno, J. 1994a. Time evolution of dissolved oxygen and redox conditions in a HLW repository. Stockholm, Sweden: Swedish Nuclear Fuel and Waste Management Co. (SKB). Technical Report 94-02. 32 p. ISSN 0284-3757.
Wersin P., Spahiu K., Bruno J. 1994b: Kinetic modelling of bentonite-canister interaction. Long-term predictions of copper canister corrosion under oxic and anoxic conditions. SKB Technical Report TR 94-25
Williamson, M.A. & Rimstidt, J.D. 1994. The kinetics and electrochemical rate-determining step of aqueous pyrite oxidation. Geochimica et Cosmochimica Acta. Vol. 58, p. 5443-5454.
Xu, T., White, S.P. & Pruess, K. 2000. Pyrite oxidation in saturated and unsaturated porous media flow: A comparison of alternative mathematical modeling approaches. Transport in Porous Media. Vol. 39, no. 1, p. 25-56.
491
Appendix D: Summary of the models used for analysing hydrogeological and hydrogeochemical evolution
D.1 Introduction
In this Appendix, a brief summary of the main modelling studies carried out to assess groundwater flow, solute transport and hydrogeochemical evolution at the site is given. These studies are reported in detail by Löfman & Karvonen (2012), Hartley et al. (2013a, b, c), Trinchero et al. (2013) and Wersin et al. (2013). The modelling has assessed the impact of the excavation of the tunnels, presence of open tunnels, heat generated by the spent fuel, as well as of the natural phenomena related to the ongoing crustal uplift and to future glaciations.
The short-term hydrogeologic impacts are expected during the repository operation, because the open tunnels and shafts of the ONKALO, and the subsequent repository, are likely to create a hydraulic disturbance to the site’s groundwater system for about a hundred years. Potential disturbances include inflow of groundwater to the open tunnels, drawdown of the groundwater table, intrusion of surface water and sea water deep into the bedrock. In particular, below the tunnels the deep highly saline groundwater may rise up to the planned repository rock volume. During the post-closure phase hydrological disturbances will cease, but both post-glacial crustal uplift and the thermal effects of the decay heat of the spent fuel will continue to affect the flow. The development of the permafrost due to cooling climate decreases the hydraulic conductivity and the infiltration into the bedrock, which affect the flow conditions during permafrost periods. In addition to permafrost evolution, groundwater flow is affected also by the ongoing crustal uplift and the changes in salinity. During glaciation the pressure of the ice sheet is the major driving force to the groundwater flow. Consequently, the modelling has considered representative climate time windows during the next glacial cycle: 1) temperate, 2) permafrost, and 3) glacial (ice-sheet retreat) conditions. Each of these time windows has been modelled separately and the permafrost conditions have been considered only by Löfman & Karvonen (2012).
Groundwater flow modelling has been carried out to represent the hydraulic evolution and to assess the flow conditions including flow rates, flow-related transport properties, flow paths both to and from the repository, and the salinity evolution in the geosphere, especially around and through the repository and underground facilities. Two types of flow models, equivalent continuous porous medium (ECPM) combined with a dual porosity (DP) approach and discrete fracture network (DFN) models, have been applied in the groundwater flow modelling. The ECPM conceptualisation has been used to simulate the evolution of the groundwater flow and salinity at the site scale. DFN models have been used to describe the distribution of the groundwater flow, including determination of the flow-related transport properties on a detailed scale in the vicinity of deposition tunnels and deposition holes. The approach is based on a stochastic representation of the bedrock fractures. The discussion in this report is based on groundwater flow modelling based on ECPM and DP approaches (Löfman & Karvonen 2012) and the DFN-approach (Hartley et al. 2013a, b, c). Hartley et al. (2013a, b) used the EPCM model to represent the evolution of site-scale groundwater flow and solute transport over the temperate period and to provide the boundary conditions and salinity distribution at selected times for the DFN model. Further, Hartley et al. (2013b, Section
492
7.3) compared the results of a DFN model and an ECPM model based on upscaled properties of a DFN model.
The main processes affecting the geochemical evolution in the bedrock are mixing of groundwaters, and water-rock interactions. The hydrogeochemical evolution at the site has been studied by reactive transport modelling applying FASTREACT (FrAmework for Stochastic REACtive Transport, Trinchero et al. 2010) and reported by Trinchero et al. (2013) and Wersin et al. (2013). The model evaluates the mixing of the infiltrating waters with the initial waters, taking into account the main reactions between these mixed waters and rock matrix and fracture minerals along the streamlines.
D.2 Modelling of groundwater flow and salinity evolution by Löfman & Karvonen (2012)
Löfman & Karvonen (2012) address the groundwater flow and salinity evolution during the following time windows:
the excavation of the ONKALO and
the operational period lasting about a hundred years,
the post-closure temperate period. Depending on the model variant (see below), the modelling of the post-closure temperate period has been carried out for either 10,000 years or 50,000 years.
the representative permafrost period(s) based on Hartikainen (2013). During the first period permafrost extends to a depth of approximately 80 metres and it is used to represent a shallow permafrost conditions. During the second period permafrost extends to a depth of approximately 300 metres and it is used to represent deep permafrost conditions. Both periods last for approximately 10,000 years, and
the representative glacial period, retreat of a warm-based ice sheet considering cases when ice margin is passing over the site (at rate of 200 m/year) or stopping close to the site (for 1000 years at each of the considered locations).
The effects of the glacial cycle on the flow conditions have been studied by considering representative periods of permafrost and ice-sheet retreat that are expected to have the highest impact on the groundwater flow in the repository volume. A continuous modelling has not been considered feasible because of the uncertainties in the climate evolution and computational efforts.
Löfman & Karvonen (2012) conceptually model the fractured bedrock by an approach, in which the rock volume is divided into two hydraulic units: planar hydrogeological zones (HZ) and the sparsely fractured rock (SFR) between the zones. The ECPM approach is applied to model transient and density-driven flow and heat transfer by conduction and the DP approach for modelling salt transport. From the standpoint of groundwater flow, the hydraulic characteristics of the HZs and the SFR were modelled by using a deterministic or stochastic equivalent continuous porous medium (ECPM) approach. In the ECPM approach, the fractured system in each hydraulic unit (the HZs and the SFR) is treated as a single continuum with representative averaged or stochastic characteristics, and water is assumed to flow everywhere in the system. In the current site-scale simulations the flow in the matrix blocks with low conductivity and
493
essentially stagnant water are not important and can be approximated to be in pressure equilibrium with the fractures, in which water mainly flows. The ECPM representation of rock is used also for thermal conduction, which was assumed to be the dominant heat transfer mechanism in this study.
From the standpoint of solute transport, Löfman & Karvonen (2012) conceptually model the fractured rock by using the dual-porosity (DP) approach. In the DP model, the system is assumed to consist of two overlapping continua: the fractures with flowing water and the matrix blocks with essentially stagnant water representing the rest of the system. Advection and dispersion are the dominant processes within the water-bearing fractures, whereas in the matrix, solutes are transported only by diffusion. Salt transport in the water-bearing fractures is accompanied by the exchange of solute particles to and from the surrounding porous matrix blocks; i.e. the matrix blocks act as sources (or sinks) that feed (or drain) the fractures with flowing water. In the DP system, the matrix diffusion of solutes from the rock blocks with stagnant water moderates the transport of solutes in the water-bearing fractures. The diffusive mass transfer between the water-bearing fractures and rock matrix is proportional to the concentration difference between these two systems. The EPM and DP concepts were applied to both the HZs and the SFR.
The averaged hydraulic properties of the two hydraulic units, hydrogeological zones and sparsely fractured rock are based on site-specific data (hydraulic conductivity/transmissivity, fracture aperture, fracture spacing defining the matrix block size, flow and diffusion porosity, see Löfman & Karvonen 2012, Chapter 4). In the modelling, three combinations of hydrogeological model and repository layout were considered as alternative site models and layouts are available and enable to assess the sensitivity of the result on different model assumptions, see Table D-1.
The models cover the entire island and extend to the depth of 2000 m. The lateral boundaries are located far away from the island in order to minimise the impact of the boundary conditions and associated uncertainties within the area of primary interest (the potential repository volume in the centre of the island). In the following a brief description of the initial and boundary conditions for the different time periods considered is given, more details are found in Löfman & Karvonen (2012).
Temperate period
On the lateral boundaries and at the bottom of the model, a no-flow boundary condition has been applied whereas on the top of the model (set to present sea level z = 0), a head boundary condition has been applied. The current rate of the crustal uplift is approximately 6 mm/a at the Olkiluoto area and the crust is still expected to rise approximately 80 metres during the next 50,000 years. The net effect of the uplift and global sea level rise gradually enlarges the area of the island and increases the elevation of the groundwater table. These transient changes of the water table as well as the effect of overburden are taken into account in the time-dependent boundary conditions on the top surface provided by the Surface HYDrological model (SHYD model, Löfman & Karvonen 2012, Ch. 3) and Hartley et al. 2013a (see Figure D-1 for the head boundary condition used for model variants 2009SH and 2011SH).

494
Table D-1. Summary of the model variants used in the simulations by Löfman & Karvonen (2012).
Flow model Description
2009SH Base case. Hydrogeological structure model 2008 (Posiva 2009, Vaittinen et al. 2009). Repository layout for 5500 tU of the spent nuclear fuel (Saanio et al. 2010). In this variant, the hydraulic properties of the hydrogeological zones (HZ) and the sparsely fractured rock (SFR) are semi-homogeneous (SH), which means that for most of the HZs homogeneous properties are used, whereas the SFR is divided into depth intervals in which either depth-dependent or homogeneous values are used. The hydraulic properties for the zones are based on geometric means as effective values of the measured transmissivity at drillhole intersections. For some salt-transport-related properties (such as diffusion porosity and dispersion lengths), homogeneous properties were applied to the whole modelled volume. The same semi-homogeneous (SH) hydraulic properties as in the calibrated base case of the site description 2008 (Löfman et al. 2009; Löfman et al. 2010). The top boundary condition is based on the results by the surface hydrological model (SHYD model, Löfman & Karvonen 2012). The thermal effects caused by the decay heat of the spent fuel are either taking into account (temperate cases only) or disregarded.
2011SH Hydrogeological structure model 2010 (Site Description; Vaittinen et al. 2011). Repository layout for 9000 tU of the spent nuclear fuel (Saanio et al. 2013); in groundwater flow modelling, all the tunnels are located at a depth of 410 m, the average depth of the floor of the deposition tunnels. Similar to model variant 2009SH, the hydraulic properties of the HZs and SFR are semi-homogeneous (SH), except for updated values. The semi-homogeneous (SH) hydraulic properties based partly on the calibration performed in the site description 2008 (Posiva 2009). The top boundary condition is based on the results by the SHYD model (as in 2009SH). The thermal effects caused by the decay heat of the spent fuel are disregarded.
2011HE Hydrogeological structure model 2010 (Site Description; Vaittinen et al. 2011). Repository layout 2011 designed for 9000 tU of the spent nuclear fuel (Saanio et al. 2013). The upscaled heterogeneous (HE) hydraulic properties based on the discrete fracture network model (Hartley et al. 2013a). Model variant 2011HE is based on the same hydrogeological zone model and layout as model variant 2011SH. However, heterogeneous (HE) hydraulic properties are applied to both the hydrogeological zones and the sparsely fractured rock between them. The properties are based on an ECPM representation of the discrete fracture network (DFN) models of the Olkiluoto site performed by Hartley et al. (2013a). The top boundary condition is based on the results by Hartley et al. (2013a). The thermal effects caused by the decay heat of the spent fuel are disregarded.
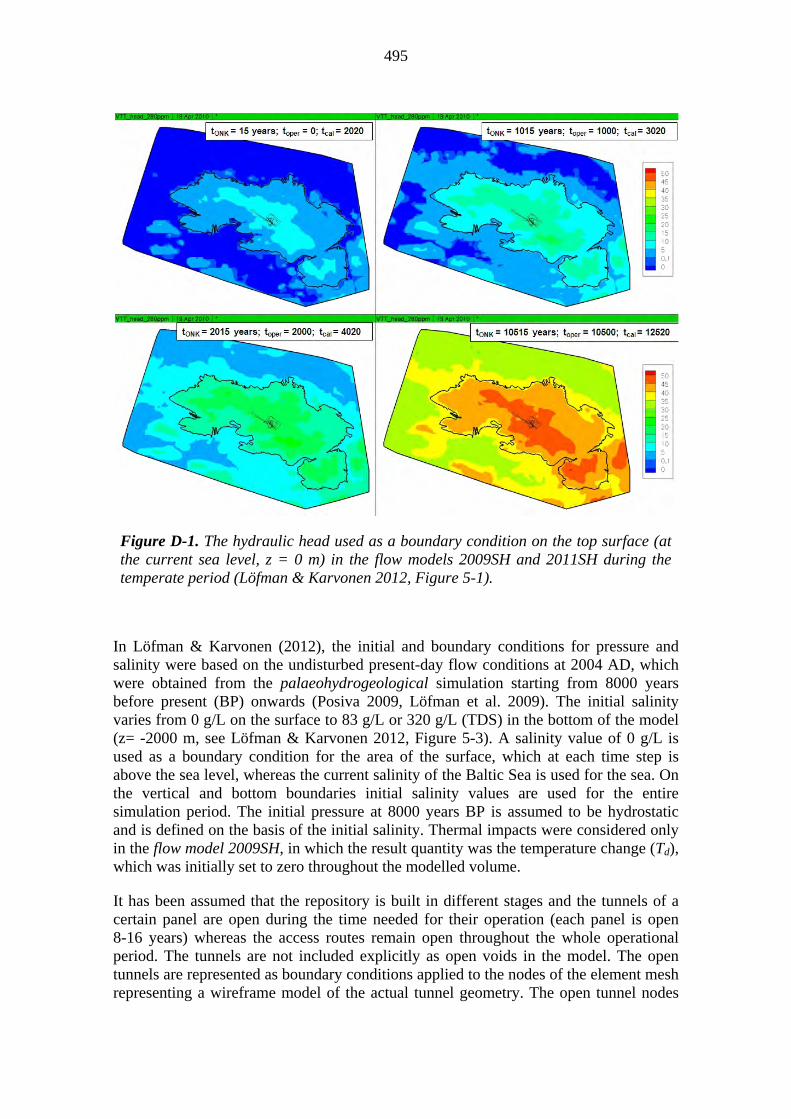
495
Figure D-1. The hydraulic head used as a boundary condition on the top surface (at the current sea level, z = 0 m) in the flow models 2009SH and 2011SH during the temperate period (Löfman & Karvonen 2012, Figure 5-1).
In Löfman & Karvonen (2012), the initial and boundary conditions for pressure and salinity were based on the undisturbed present-day flow conditions at 2004 AD, which were obtained from the palaeohydrogeological simulation starting from 8000 years before present (BP) onwards (Posiva 2009, Löfman et al. 2009). The initial salinity varies from 0 g/L on the surface to 83 g/L or 320 g/L (TDS) in the bottom of the model (z= -2000 m, see Löfman & Karvonen 2012, Figure 5-3). A salinity value of 0 g/L is used as a boundary condition for the area of the surface, which at each time step is above the sea level, whereas the current salinity of the Baltic Sea is used for the sea. On the vertical and bottom boundaries initial salinity values are used for the entire simulation period. The initial pressure at 8000 years BP is assumed to be hydrostatic and is defined on the basis of the initial salinity. Thermal impacts were considered only in the flow model 2009SH, in which the result quantity was the temperature change (Td), which was initially set to zero throughout the modelled volume.
It has been assumed that the repository is built in different stages and the tunnels of a certain panel are open during the time needed for their operation (each panel is open 8-16 years) whereas the access routes remain open throughout the whole operational period. The tunnels are not included explicitly as open voids in the model. The open tunnels are represented as boundary conditions applied to the nodes of the element mesh representing a wireframe model of the actual tunnel geometry. The open tunnel nodes
496
were treated as hydraulic sinks applying an atmospheric pressure corresponding to the elevation of the node for the flow equation and the calculated nodal inflow rate for the salt transport equation. Once the tunnels are closed the boundary conditions for the open tunnels nodes are removed, i.e. no pressure or concentration boundary conditions are associated to the backfilled tunnel nodes. The properties of the elements next to the tunnel nodes have been adjusted so that the inflow predicted by the model corresponds to the observed one. This adjustment means that, in the model, the transmissivity of the hydrogeological zones intersecting the tunnels and the hydraulic conductivity of the sparsely fractured rock around the tunnels has been reduced compared to the natural state. This adjustment can be considered to take into account the effects of grouting and the positive skin around the tunnels (for details see Löfman & Karvonen 2012). Once the tunnels are closed the boundary conditions for the open tunnels are removed, but the properties of the adjusted elements are kept, although the hydraulic properties are likely to tend back to their undisturbed values. As this modelling has been done with the main focus on the site scale modelling, this assumption has no effect on the results. However, if the focus had been on the tunnel flow characteristics, the backfill properties would have affected the results (p. 78 in Löfman & Karvonen 2012).
In the flow model 2009SH the deposition tunnel nodes were treated as point heat sources according to the disposal schedule referred to above by assigning a time-dependent decay heat power to each node for the heat transfer equation. The total amount of spent nuclear fuel and the corresponding decay heat (average burn-up of 40 MWd/kgU) is based on Anttila (2005) and Pastina & Hellä (2006) and presented in Löfman & Karvonen (2012, Figure 4-11).
Permafrost period
The two representative cases of permafrost lasting for 10,000 years were assumed to follow the temperate period.
Similarly to the temperate period, the SHYD modelling, based on the same permafrost evolution data by Hartikainen (2013), provided hydraulic head applied as the top boundary conditions for model variants 2009SH and 2011SH. For model variant 2011HE, because of the differences in the hydrogeological model and its properties, the boundary conditions on the top surface are derived from the ECPM model by Hartley et al. (2013a). Due to a lack of the head data from the permafrost period for model variant 2011HE, the temperate heads at 12,000 AD were applied as boundary condition for the permafrost period. The impact of this inconsistency is probably small, because the occurrence of permafrost dominates the flow conditions by decreasing the fresh water infiltration, regardless of the boundary condition on the top surface.
In all three flow models the initial and boundary conditions for pressure and salinity were taken from the corresponding temperate results prevailing at 12,000 AD, although the possibility of the onset of next glaciation is expected to be highest at 50,000–60,000 years after present (Pimenoff et al. 2011). This is due to the largest reliability on the data and models for this shorter time span (until 12,000 AD) compared to prolonged temperate period. A salinity value of 0 g/L is used as a boundary condition for the top surface, as the Olkiluoto area is completely above the sea level.
497
On the vertical boundaries and at the bottom of the model, no-flow boundary condition and the same initial salinity as for the temperate period was applied to the entire simulation period of ~10,000 years.
Retreat of the ice sheet
The ice sheet is the main driving force during the retreat period. The ice sheet is assumed to be warm-based The ice sheet model, which is presented in details in Löfman & Karvonen (2012, Appendix O), is based on the climate simulation at the end of the last glacial cycle and the theoretic profile by Nye (1952). During the ice-sheet retreat periods the Olkiluoto area has been submerged due to the glacial loading and also the retreating ice sheet margin has been floating and thus partially below water level. In the flow models the ice sheet was assumed to be grounded and the theoretic profile was applied so that the floating part of the ice sheet was disregarded. The grounded ice sheet thickness and the height of the sea level determined the pressure boundary condition on the top of the flow model (Figure D-2). The ice sheet model includes two alternative sea level height estimates, which resulted in a hydraulic gradient of 2–3 % at the ice margin (Figure D-3). The first case with the higher gradient was selected for the simulations in this study.
The ice sheet margin is assumed to be line-shaped and retreating towards the north-west. The ice sheet pressure is one-dimensional, i.e. the same profile is used perpendicular across the ice margin. The retreating rate of the ice sheet margin was 200 m/year, which was based on ice sheet data from the last glacial cycle (Löfman & Karvonen, Appendix O). Thus, the top boundary condition is comprised of the specified pressure (Figure D-2), which moves across the modelled area to the north-west with a constant speed. Initially the ice margin is located at the south-east corner of the flow model. The imposed boundary condition implies that the presence of the ice sheet in the flow model constitutes an infinite source of meltwater with a hydraulic head at the base of the ice sheet equal to 90 % (due to the ice density) of the ice sheet thickness. The meltwater infiltrates into the bedrock below the ice sheet and discharges outside the ice margin.
In all three flow models the initial and boundary conditions for pressure and salinity were taken from the corresponding results prevailing at the end of the permafrost period 1 (shallow permafrost and assuming presence of taliks).
A salinity value of 0 g/L is used as a boundary condition for the top surface, because the seawater of the Yoldia Sea was probably fairly dilute close to the ice margin due to the large volumes of glacial meltwater (Posiva 2009, p. 304). On the vertical boundaries and at the bottom of the model, no-flow boundary condition and initial salinity was applied to the entire simulation period.
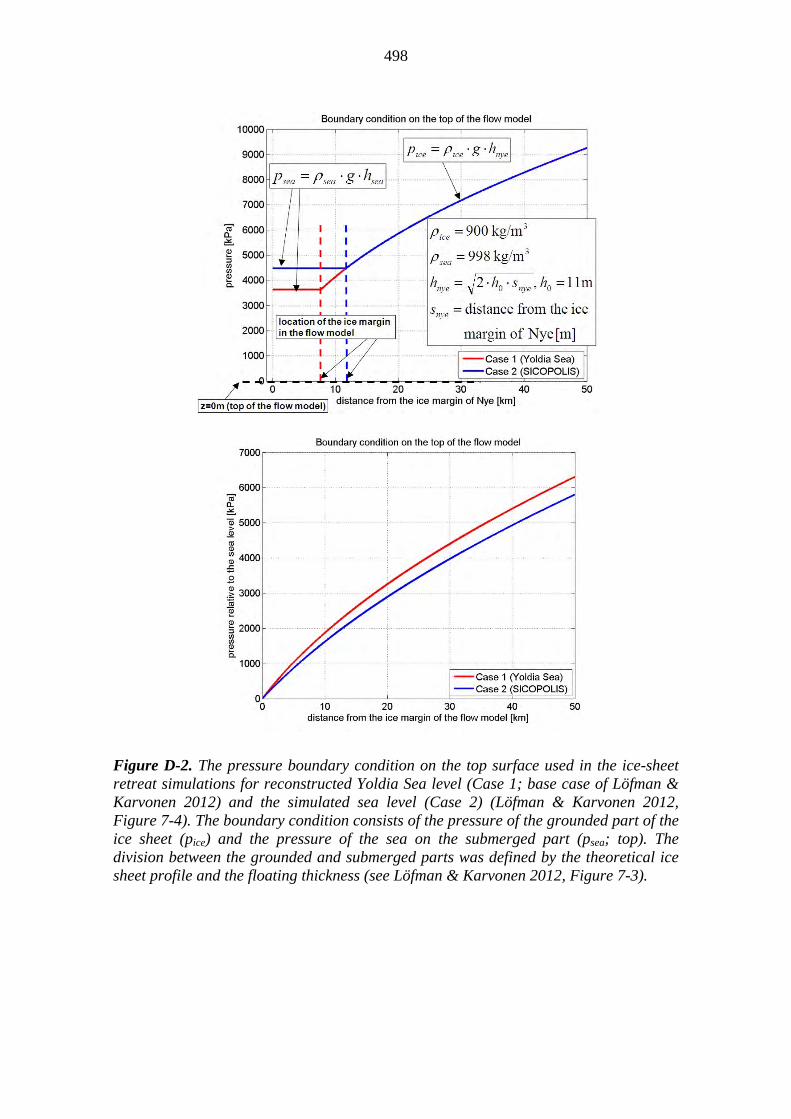
498
Figure D-2. The pressure boundary condition on the top surface used in the ice-sheet retreat simulations for reconstructed Yoldia Sea level (Case 1; base case of Löfman & Karvonen 2012) and the simulated sea level (Case 2) (Löfman & Karvonen 2012, Figure 7-4). The boundary condition consists of the pressure of the grounded part of the ice sheet (pice) and the pressure of the sea on the submerged part (psea; top). The division between the grounded and submerged parts was defined by the theoretical ice sheet profile and the floating thickness (see Löfman & Karvonen 2012, Figure 7-3).

499
Figure D-3. The hydraulic gradient resulting from the pressure boundary condition on the top surface (see Figure D-2) used in the ice-sheet retreat simulations for reconstructed Yoldia Sea level (Case 1; base case in this study) and the simulated sea level (Case 2) (Löfman & Karvonen 2012).
Main results of the modelling are the distribution of flow and salinity within the model volume. Specifically the groundwater flow rate into and out from the reference volume taking into account flow to and from all the faces of the reference volume, inflow to the open tunnels during the operational period as well as average, minimum and maximum salinity in the reference volume are calculated. The reference volume is located at a depth of 370–470 m and its outer boundaries were selected close to the repository to minimise the intersections with the nearby hydrogeological zones (HZ099, HZ20A and HZ20B) (see Figures D-4 and D-5). In addition to the repository, the reference volume includes also the parts of the ONKALO located below a depth of 370 m. The reference volume has an area of 1.5 km2 and volume of 0.15 m3. Given that the lowest parts of the shafts reach a depth of 460 m and considering the variation in the depth of the actual deposition tunnels and deposition holes and the resolution of the site scale model, a larger depth range than just the repository depth is used to estimate the salinity variation in the repository volume. For the sake of comparisons between the three flow models, the same reference volume is applied in all cases, although the repository layout description 2011 (used in the flow models 2009SH and 2011HE) does not completely fit into it.
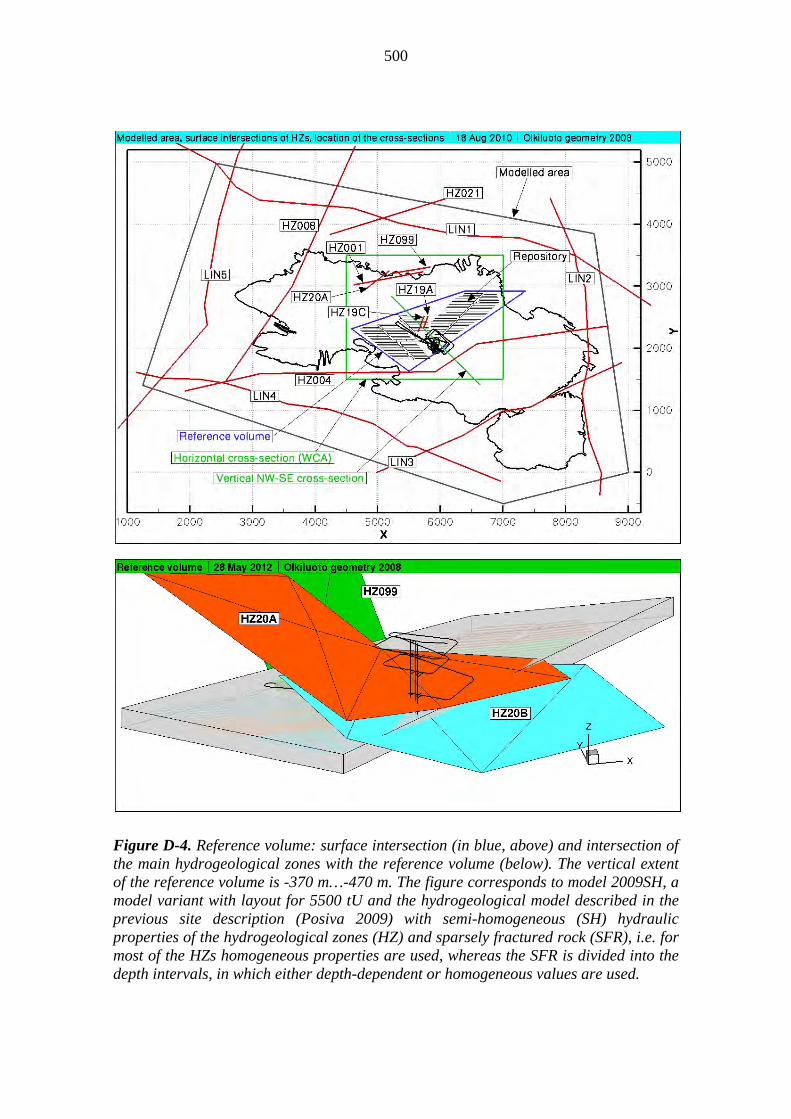
500
Figure D-4. Reference volume: surface intersection (in blue, above) and intersection of the main hydrogeological zones with the reference volume (below). The vertical extent of the reference volume is -370 m…-470 m. The figure corresponds to model 2009SH, a model variant with layout for 5500 tU and the hydrogeological model described in the previous site description (Posiva 2009) with semi-homogeneous (SH) hydraulic properties of the hydrogeological zones (HZ) and sparsely fractured rock (SFR), i.e. for most of the HZs homogeneous properties are used, whereas the SFR is divided into the depth intervals, in which either depth-dependent or homogeneous values are used.
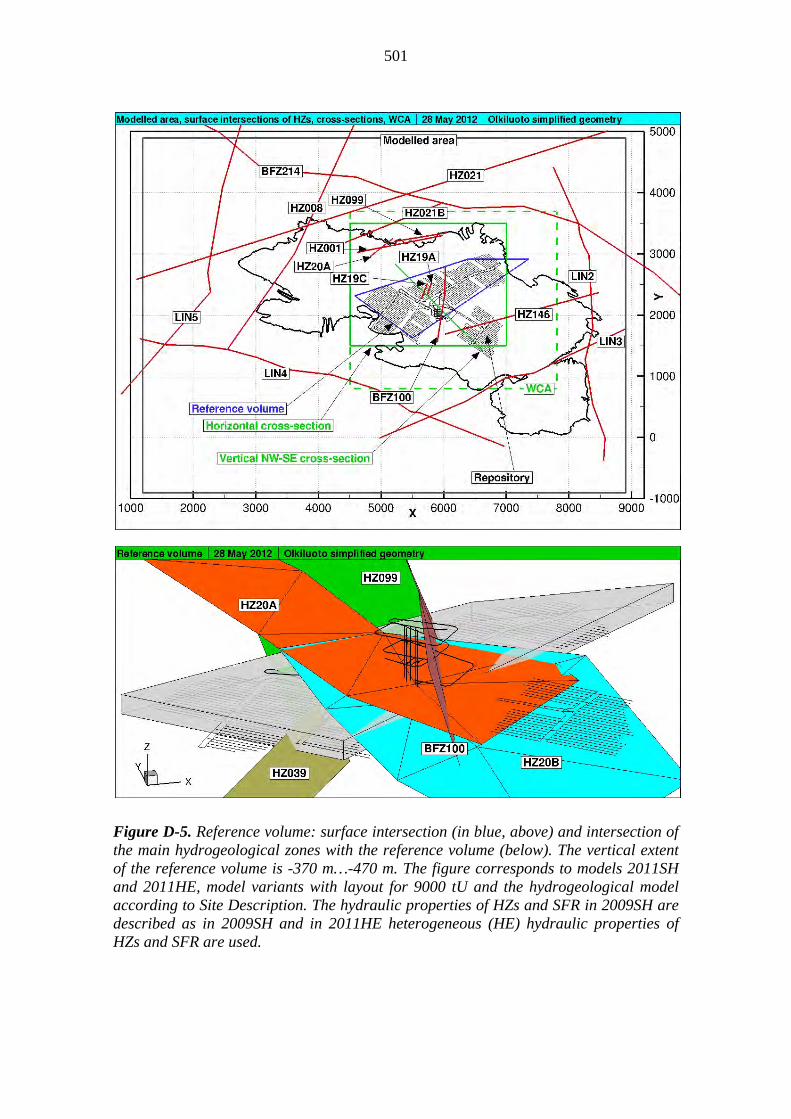
501
Figure D-5. Reference volume: surface intersection (in blue, above) and intersection of the main hydrogeological zones with the reference volume (below). The vertical extent of the reference volume is -370 m…-470 m. The figure corresponds to models 2011SH and 2011HE, model variants with layout for 9000 tU and the hydrogeological model according to Site Description. The hydraulic properties of HZs and SFR in 2009SH are described as in 2009SH and in 2011HE heterogeneous (HE) hydraulic properties of HZs and SFR are used.

502
D.3 Hydrogeological modelling by Hartley et al. (2013a, b, c)
Hartley et al. (2013a, b, c) address the groundwater flow and salinity evolution during the following time windows:
the operational period lasting about a hundred years,
the post-closure temperate period over the next 10,000 years, and
retreat of the ice sheet considering selected cases based on Löfman & Karvonen (2012).
Hartley et al. (2013a) presents the hydrogeological DFN model (Hydro-DFN) including alternative interpretations used in the analysis. Hartley et al. (2013b) present the modelling carried out for the assessment of radionuclide release scenarios with the main aim to calculate the repository performance measures relating to the distributions of groundwater flow around the deposition holes, deposition tunnels and through the excavation damaged zone (EDZ); flow-related transport resistance along and the exit locations for groundwater pathways from the repository to the surface. Other analyses by Hartley et al. (2013b) include the effectiveness of screening out less favourable deposition locations on inflows during open repository conditions or on fractures mapped on tunnel walls; the potential infiltration of dilute groundwaters to repository depth. A comprehensive set of sensitivity studies of these performance measures are performed to quantify the robustness of results to uncertainties in the site description, conceptual models, structural model, engineering characteristics and parameters, sealing of drillholes and climate evolution. Hartley et al. (2013c) consider the groundwater flow under open repository conditions to get information on the fulfilment of the inflow (including comparison with the post-closure flows) and large fracture criteria in the deposition tunnels and deposition holes, as well as provide information on likely properties adjacent to large fractures and deformation zones and quantify saline water upconing to support definition of the respect distances to the fault zones and hydraulically active zones. In addition, the effects of grouting of some fractures on the inflows to deposition holes and tunnels and the effects of more detailed phasing of excavations on the inflows are studied. The results are presented for a base case model, with sensitivities analysed by multiple realisations and alternative Hydro-DFN models (Hartley et al. 2013a).
The approach adopted is to combine a deterministic representation of these hydrozones with a stochastic representation of the surrounding sparsely fractured rock. The fractured bedrock is overlaid by a thin layer of Quaternary deposits, typically 2 m thick. The sparsely fractured bedrock is further subdivided into hydraulic domains, representing spatial variations in fracture geometrical and hydraulic properties identified through the interpretation of site data. A summary of the description for the sparsely fractured bedrock is given in Hartley et al. (2013b, Section 2.2.2) with the representation of deformation zones discussed in Hartley et al. (2013b, Section 2.2.3).
Three different scales (see Figure D-6); regional, site and repository, with varying levels of detail of the representation of the sparsely fractured rock, hydrogeological zones and underground openings (e.g. deposition holes, deposition tunnels, other tunnels and shafts) are used (see Tables D-2 and D-3). The results of the repository scale model are
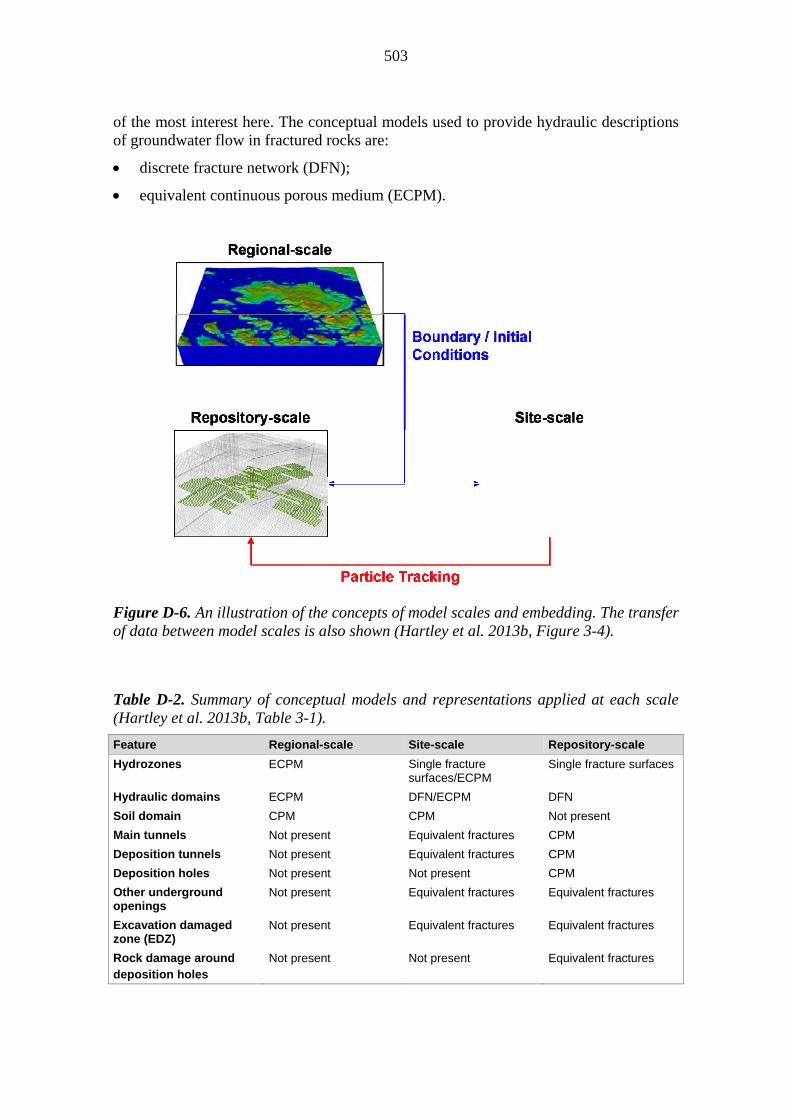
503
of the most interest here. The conceptual models used to provide hydraulic descriptions of groundwater flow in fractured rocks are:
discrete fracture network (DFN);
equivalent continuous porous medium (ECPM).
Figure D-6. An illustration of the concepts of model scales and embedding. The transfer of data between model scales is also shown (Hartley et al. 2013b, Figure 3-4).
Table D-2. Summary of conceptual models and representations applied at each scale (Hartley et al. 2013b, Table 3-1).
Feature Regional-scale Site-scale Repository-scale
Hydrozones ECPM Single fracture surfaces/ECPM
Single fracture surfaces
Hydraulic domains ECPM DFN/ECPM DFN
Soil domain CPM CPM Not present
Main tunnels Not present Equivalent fractures CPM
Deposition tunnels Not present Equivalent fractures CPM
Deposition holes Not present Not present CPM
Other underground openings
Not present Equivalent fractures Equivalent fractures
Excavation damaged zone (EDZ)
Not present Equivalent fractures Equivalent fractures
Rock damage around deposition holes
Not present Not present Equivalent fractures

504
Table D-3. Summary of the modelling approach adopted at each scale (Hartley et al. 2013b, Table 3-2).
Regional-scale Site-scale Repository-scale
Earliest time simulated
6000 BC 2000 AD 2000 AD
Latest time simulated
12000 AD, 50000 AD 12000 AD 5000 AD
Flow model Saturated flow in a porous medium (ECPM/CPM)
Saturated flow at fixed time slices in a porous medium (ECPM/CPM) with an embedded discrete feature network (DFN)
Saturated flow at fixed time slices in a discrete fracture network (DFN) with an embedded CPM representation of the tunnels
Transport model Dual porosity Single porosity Single porosity
Fluid properties Salinity S(x,y,z,t) Temperature T(z) Density ρ(S, T) Viscosity μ(T)
Salinity S(x,y,z|t) Temperature T(const.) Density ρ(S) Viscosity μ(const.)
Salinity S(x,y,z|t) Temperature T(const.) Density ρ(S) Viscosity μ(const.)
Modelling procedure 1. Multiple heterogeneous realisations. 2. Transient boundary conditions. 3. Solve for flow and transport of reference waters at each time step.
1. Multiple heterogeneous realisations. 2. Fixed boundary conditions at different time slices. 3. Consistent flow at each time slice. 4. Steady-state flow particle tracking at each time slice.
1. Multiple heterogeneous realisations. 2. Fixed boundary conditions at different time slices. 3. Consistent flow at each time slice. 4. Steady-state flow particle tracking at each time slice.
Primary output Fluid pressure and density at different time slices.
Particle tracking performance measures, exit locations
Flow and particle tracking performance measures.
Secondary output Evolution of salinity at repository
Particle exit locations at different time slices.
Inflows to deposition holes during operations; flows through tunnels
Hydrogeological DFN models explicitly represent fractures through which groundwater flows, and are characterised by the stochastic nature of the structural-hydraulic quantities associated with these fractures. The flow and transport properties of hydrogeological DFN models can be upscaled to ECPM properties. That is, the ECPM approach honours the intrinsic heterogeneity and anisotropy of hydrogeological DFN models on the scale of resolution of the chosen computational grid. Since each ECPM model is based on a particular underlying stochastic hydrogeological DFN realisation, the ECPM models are also stochastic. Uncertainties relating to spatial variability in the geometrical and/or hydraulic properties are quantified by means of multiple realisations.
Homogeneous (deterministic) CPM models typically have constant hydrogeological properties within each given sub-domain. That is, the CPM approach is useful for describing groundwater flow in more homogeneous media, e.g. overburden and backfilled tunnels.
Boundary conditions applied to the regional-scale model are identical to those developed for the 2011 SDM (Hartley et al. 2013a). In summary, they consist of a
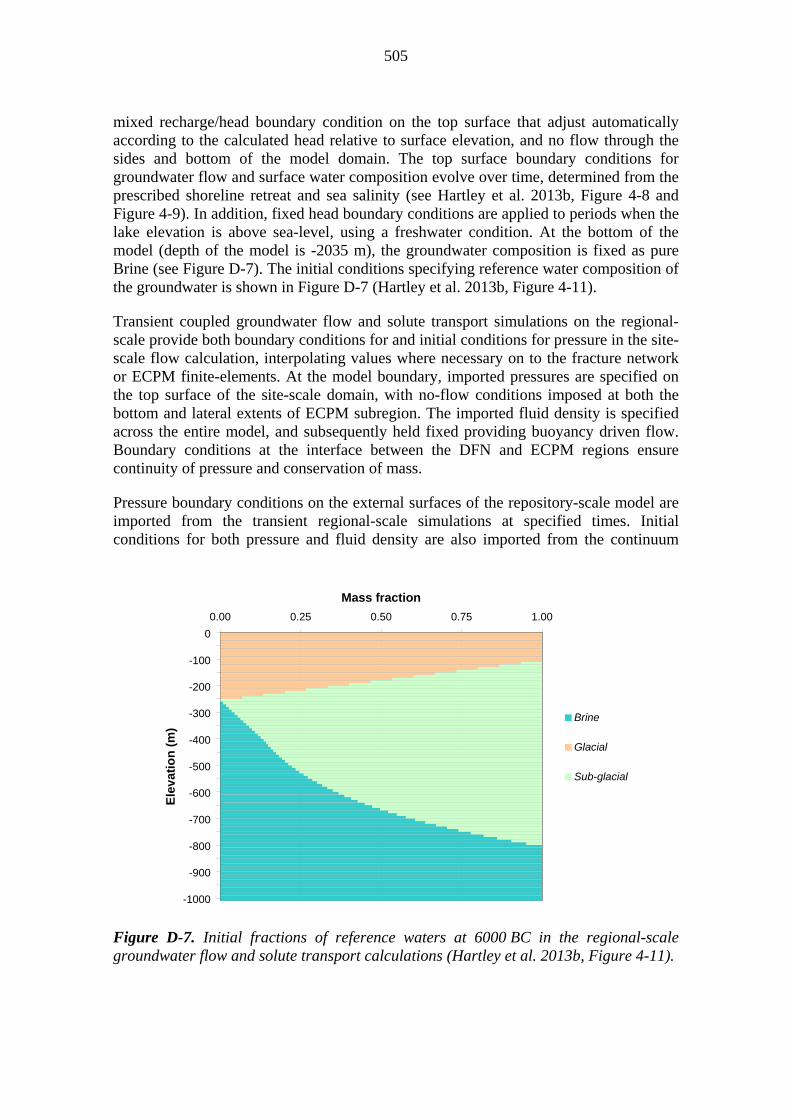
505
mixed recharge/head boundary condition on the top surface that adjust automatically according to the calculated head relative to surface elevation, and no flow through the sides and bottom of the model domain. The top surface boundary conditions for groundwater flow and surface water composition evolve over time, determined from the prescribed shoreline retreat and sea salinity (see Hartley et al. 2013b, Figure 4-8 and Figure 4-9). In addition, fixed head boundary conditions are applied to periods when the lake elevation is above sea-level, using a freshwater condition. At the bottom of the model (depth of the model is -2035 m), the groundwater composition is fixed as pure Brine (see Figure D-7). The initial conditions specifying reference water composition of the groundwater is shown in Figure D-7 (Hartley et al. 2013b, Figure 4-11).
Transient coupled groundwater flow and solute transport simulations on the regional-scale provide both boundary conditions for and initial conditions for pressure in the site-scale flow calculation, interpolating values where necessary on to the fracture network or ECPM finite-elements. At the model boundary, imported pressures are specified on the top surface of the site-scale domain, with no-flow conditions imposed at both the bottom and lateral extents of ECPM subregion. The imported fluid density is specified across the entire model, and subsequently held fixed providing buoyancy driven flow. Boundary conditions at the interface between the DFN and ECPM regions ensure continuity of pressure and conservation of mass.
Pressure boundary conditions on the external surfaces of the repository-scale model are imported from the transient regional-scale simulations at specified times. Initial conditions for both pressure and fluid density are also imported from the continuum
Figure D-7. Initial fractions of reference waters at 6000 BC in the regional-scale groundwater flow and solute transport calculations (Hartley et al. 2013b, Figure 4-11).
0.00 0.25 0.50 0.75 1.00
0
-100
-200
-300
-400
-500
-600
-700
-800
-900
-1000
Ele
vati
on
(m
)
Mass fraction
Brine
Glacial
Sub-glacial

506
regional-scale model, and interpolated on to the fracture network and deposition tunnels and central tunnels represented by CPM approach. The fluid density values are held fixed (but non-uniform in space) during calculations, with the pressure field solved to give conservation of mass.
For glacial simulations three cases from those analysed by Löfman & Karvonen (2012) were selected. No regional-scale simulations were carried out instead the pressure and salinity distributions at snapshots of time corresponding to these three cases calculated by Löfman & Karvonen (2012) were used to define boundary conditions and fluid densities distributions for the repository-scale and site-scale models. The top surface pressure boundary condition in the glacial modelling is based on a prescribed ice profile behind the ice front and zero pressure ahead of it (see Hartley et al. 2013b, Section 5.6). For each case flow calculations are performed on the repository-scale and site-scale to calculate the pressure and flow fields consistent with the imported fluid density and pressure boundary conditions for the base case hydrogeological model. Particle tracks are then calculated in the repository-scale model and then continued in the site-scale model to provide performance measures for the F-, DZ- and TDZ-release pathways.
Main results discussed in Performance Assessment are the inflow to and flow rates around the deposition holes and deposition tunnels, flow paths between the repository and the surface environment and flow and transport properties along these paths provided by the repository scale model. Three release path types with exit from the deposition hole to:
a host-rock fracture intersecting the deposition hole (F-path),
the excavation damaged zone (EDZ) below the tunnel floor (DZ-path) or
the tunnel backfill above the deposition hole (TDZ-path).
The sensitivity of these results on varying assumptions concerning (for summary see Table D-4):
the representation of water-conducting features in the bedrock;
the properties of the rock damaged zones around deposition holes, of the deposition tunnel EDZ, of the tunnel backfill and of sealed drillholes; and
the variability of the flow field with time.
The central case is named ps_r0_2000. The “r0” refers to a specific realisation of the stochastic features of the DFN model. The multiple DFN realisations (r1, r2, … r10) that are created to explore uncertainty in the spatial distribution of non-deterministic water conducting features in the site give rise to cases ps_r1 … r10_2000. The index “2000” in the name of the central case indicates that the flow situation corresponds to present-day topography. Variants consider the expected topography at 3000 AD and 5000 AD. As noted above, the influence of the retreating shoreline on groundwater flow in the vicinity of the repository is expected to be negligible after a few thousand years. Thus, the situation at 5000 AD is also expected to be representative of the situation at later times.

507
The intensity and size distribution of potential flowing fractures in the sparsely fractured bedrock is uncertain. Hence, three quite different conceptual approaches have been investigated (Hartley et al. 2013a):
Case A: The intensity of potential flowing fractures is based on an estimate of open fracture intensity. This case uses a power-law size model for intensity as a function of fracture size, and is adopted in the central case.
Case B: The intensity of potential flowing fractures is estimated from the intensity of flowing fractures detected from Posiva Flow Log (PFL) measurements. This case uses a log-normal size model.
Case C: The intensity of potential flowing fractures is estimated from the intensity of all fractures. This case is based on a global power-law size model for intensity as a function of fracture size that was derived for a geological discrete fracture network (Geo-DFN). The Geo-DFN defines site scale fracture domains and the geometrical parameters for models of all fractures, i.e. sealed and open fractures, whether connected or not (Fox et al. 2012). In applying this model to Case C, parts of the fracture surface area available for flow are assigned according to a probability function that depends on fracture size (i.e. a larger proportion of fracture surface area is assumed open in large fractures than in small).

508 508
Tab
le D
-4. F
low
mod
elli
ng c
entr
al c
ase
and
sens
itiv
ity
case
s.
Flo
w m
od
ellin
g c
ase
A
ims
and
co
mm
ents
K
ey
ass
um
pti
on
s
ps_r
0_2
000
C
entr
al c
ase
(see
mai
n te
xt).
Pro
vid
es a
re
fere
nce
agai
nst
wh
ich
to c
om
pare
the
varia
nt c
ases
Fra
ctur
e si
ze m
odel
: cas
e A
T
rans
mis
sivi
ty m
odel
: sem
i-cor
rela
ted
Hyd
roge
olo
gica
l zon
e tr
ansm
issi
vity
: det
erm
inis
tic
Roc
k da
mag
e ar
ound
dep
ositi
on h
ole:
yes
E
DZ
bel
ow
the
tunn
el fl
oor
: dis
cont
inuo
us
Flo
w fi
eld:
ye
ar 2
000
AD
ps_r
1 …
r10
_200
0
To
exam
ine
impa
ct o
f alte
rnat
ive
real
isat
ions
of s
toch
astic
frac
ture
s.
Mod
el a
ssum
ptio
ns a
s in
the
cent
ral c
ase
with
the
follo
win
g ex
cept
ions
: H
ydro
geo
logi
cal z
one
tran
smis
sivi
ty: s
toch
astic
ps_r
0_a
_un
corr
_20
00
To
exam
ine
impa
ct o
f alte
rnat
ive
frac
ture
si
ze a
nd
tran
smis
sivi
ty c
orre
latio
ns
Mod
el a
ssum
ptio
ns a
s in
the
cent
ral c
ase
with
the
follo
win
g ex
cept
ions
: T
rans
mis
sivi
ty m
ode
l: un
corr
ela
ted
ps_r
2_a
_un
corr
_20
00
Mod
el a
ssum
ptio
ns a
s in
the
cent
ral c
ase
with
the
follo
win
g ex
cept
ions
: T
rans
mis
sivi
ty m
ode
l: un
corr
ela
ted
H
ydro
geo
logi
cal z
one
tran
smis
sivi
ty: s
toch
astic
ps_r
0_a
_cor
r_20
00
M
ode
l ass
umpt
ions
as
in th
e ce
ntra
l cas
e w
ith th
e fo
llow
ing
exce
ptio
ns:
Tra
nsm
issi
vity
mod
el: c
orre
late
d
ps_r
2_a
_cor
r_20
00
M
ode
l ass
umpt
ions
as
in th
e ce
ntra
l cas
e w
ith th
e fo
llow
ing
exce
ptio
ns:
Tra
nsm
issi
vity
mod
el: c
orre
late
d H
ydro
geo
logi
cal z
one
tran
smis
sivi
ty: s
toch
astic
ps_r
0_b
_20
00
To
exam
ine
the
impa
ct o
f alte
rnat
ive
assu
mpt
ions
re
gard
ing
frac
ture
inte
nsity
an
d si
ze
Mod
el a
ssum
ptio
ns a
s in
the
cent
ral c
ase
with
the
follo
win
g ex
cept
ions
: F
ract
ure
size
mod
el: c
ase
B
Hyd
roge
olo
gica
l zon
e tr
ansm
issi
vity
: sto
chas
tic
ps_r
2_b
_20
00
Mod
el a
ssum
ptio
ns a
s in
the
cent
ral c
ase
with
the
follo
win
g ex
cept
ions
: F
ract
ure
size
mod
el: c
ase
B
ps_r
0_c
_200
0
Mod
el a
ssum
ptio
ns a
s in
the
cent
ral c
ase
with
the
follo
win
g ex
cept
ions
: F
ract
ure
size
mod
el: c
ase
C
ps_r
2_c
_200
0
Mod
el a
ssum
ptio
ns a
s in
the
cent
ral c
ase
with
the
follo
win
g ex
cept
ions
: F
ract
ure
size
mod
el: c
ase
C
Hyd
roge
olo
gica
l zon
e tr
ansm
issi
vity
: sto
chas
tic

509 509
Flo
w m
od
ellin
g c
ase
A
ims
and
co
mm
ents
K
ey
ass
um
pti
on
s
ps_r
0_e
xt_
hz_
200
0
To
exam
ine
the
impa
ct o
f ad
ditio
nal
stoc
hast
ic h
ydro
geol
ogi
cal z
one
s ou
tsid
e th
e w
ell c
hara
cter
ised
are
a
Mod
el a
ssum
ptio
ns a
s in
the
cent
ral c
ase
with
the
follo
win
g ex
cept
ions
: S
toch
astic
pre
sent
atio
n of
the
hyd
roge
olo
gica
l zon
es o
utsi
de th
e w
ell
char
acte
rise
d ar
ea
ps_r
0_e
cpm
_con
t_e
dz_
200
0
To
exam
ine
the
impa
ct o
f usi
ng a
n eq
uiv
alen
t con
tinu
ous
por
ous
med
ium
(E
PM
) re
pres
ent
atio
n of
bed
rock
, in
conj
unct
ion
with
unc
erta
intie
s re
late
d to
th
e E
DZ
Mod
el a
ssum
ptio
ns a
s in
the
cent
ral c
ase
with
the
follo
win
g ex
cept
ions
: C
once
ptu
al m
ode
l: E
PM
E
DZ
bel
ow
the
tunn
el fl
oor
: con
tinuo
us
ps_r
0_e
cpm
_no_
edz
_20
00
E
PM
rep
rese
ntat
ion
of b
edro
ck
Mod
el a
ssum
ptio
ns a
s in
the
cent
ral c
ase
with
the
follo
win
g ex
cept
ions
: C
once
ptu
al m
ode
l: E
PM
E
DZ
bel
ow
the
tunn
el fl
oor
: no
ps_r
0_c
ont_
edz_
2000
To
eval
uate
the
impa
ct o
f unc
erta
intie
s re
gard
ing
the
ED
Z a
nd th
e d
amag
ed
zone
aro
und
the
dep
ositi
on h
ole
s. N
ote:
ps
_r0
_no
_sp
all_
2000
use
d to
der
ive
flow
-rel
ated
ra
dio
nucl
ide
tra
nsp
ort
para
met
er v
alu
es fo
r ca
lcul
atio
n ca
ses
wh
ere
no h
ydra
ulic
ally
sig
nifi
cant
roc
k da
ma
ge is
mo
delle
d ar
ound
the
dep
ositi
on
hole
s (S
ectio
ns 9
.6.4
and
10
.2)
Mod
el a
ssum
ptio
ns a
s in
the
cent
ral c
ase
with
the
follo
win
g ex
cept
ions
: E
DZ
bel
ow
the
tunn
el fl
oor
: con
tinuo
us
ps_r
0_n
o_e
dz_2
000
To
eval
uate
the
impa
ct o
f unc
erta
intie
s re
gard
ing
the
ED
Z a
nd th
e d
amag
ed
zone
aro
und
the
dep
ositi
on h
ole
s.
Mod
el a
ssum
ptio
ns a
s in
the
cent
ral c
ase
with
the
follo
win
g ex
cept
ions
: E
DZ
bel
ow
the
tunn
el fl
oor
: no
ED
Z
ps_r
0_n
o_s
pal
l_20
00
Mod
el a
ssum
ptio
ns a
s in
the
cent
ral c
ase
with
the
follo
win
g ex
cept
ions
: R
ock
dam
age
arou
nd d
epos
ition
hol
e: n
o
ps_r
0_c
ond
x10_
200
0
Mod
el a
ssum
ptio
ns a
s in
the
cent
ral c
ase
with
the
follo
win
g ex
cept
ions
: E
DZ
bel
ow
the
tunn
el fl
oor
an
d in
dam
aged
roc
k zo
ne a
rou
nd d
epo
sitio
n h
oles
: co
nduc
tivity
10
tim
es h
igh
er
ps_r
0_c
row
n_
200
0
To
eval
uate
the
impa
ct o
f unc
erta
intie
s re
gard
ing
the
hyd
rau
lic p
rope
rtie
s of
the
tunn
els
, ram
ps a
nd s
hafts
Mod
el a
ssum
ptio
ns a
s in
the
cent
ral c
ase
with
the
follo
win
g ex
cept
ions
: H
igh
cond
uctiv
ity la
yer
at th
e to
p of
all
tunn
els
: 10-3
m/s
and
0.1
m th
ick
ps_r
0_t
unne
l_co
ndx1
0_2
000
M
ode
l ass
umpt
ions
as
in th
e ce
ntra
l cas
e w
ith th
e fo
llow
ing
exce
ptio
ns:
all t
unne
ls a
nd s
hafts
10
times
hig
her
con
duct
ivity

510 510
Flo
w m
od
ellin
g c
ase
A
ims
and
co
mm
ents
K
ey
ass
um
pti
on
s
ps_r
0_n
ond
ep_t
unn
el_c
ond
x10_
2000
M
ode
l ass
umpt
ions
as
in th
e ce
ntra
l cas
e w
ith th
e fo
llow
ing
exce
ptio
ns:
mai
n tu
nne
ls, r
amps
an
d sh
afts
: 100
tim
es h
ighe
r co
nduc
tivity
ps_r
0_t
unne
l_co
ndx1
0_2
000
M
ode
l ass
umpt
ions
as
in th
e ce
ntra
l cas
e w
ith th
e fo
llow
ing
exce
ptio
ns:
all t
unne
ls a
nd s
hafts
10
times
hig
her
con
duct
ivity
ps_r
0_n
ond
ep_t
unn
el_c
ond
x10_
2000
M
ode
l ass
umpt
ions
as
in th
e ce
ntra
l cas
e w
ith th
e fo
llow
ing
exce
ptio
ns:
mai
n tu
nne
ls, r
amps
an
d sh
afts
: 100
tim
es h
ighe
r co
nduc
tivity
ps_r
0_e
xt_
hz_
200
0
To
eval
uate
the
impa
ct o
f uns
eale
d in
vest
igat
ion
drill
hol
es
Mod
el a
ssum
ptio
ns a
s in
the
cent
ral c
ase
with
the
follo
win
g ex
cept
ions
: S
ite-in
vest
igat
ion
bore
hol
es in
clu
ded
with
con
duc
tivity
0.1
m/s
. F
low
fiel
d: a
s in
the
cent
ral c
ase,
but
ass
umin
g fr
esh
wat
er d
ensi
ty in
the
drill
hole
s.
ps_r
0_3
000
T
o in
vest
igat
e th
e ev
olu
tion
of th
e flo
w
field
with
tim
e. N
ote:
ps_
r0_5
000
used
to
deriv
e flo
w-r
ela
ted
radi
onuc
lide
tran
spor
t pa
ram
eter
val
ues
for
mos
t cal
cula
tion
case
s (s
ee S
ect
ion
6.2)
Mod
el a
ssum
ptio
ns a
s in
the
cent
ral c
ase
with
the
follo
win
g ex
cept
ions
: flo
w fi
eld:
ye
ar 3
000
AD
ps_r
0_5
000
M
ode
l ass
umpt
ions
as
in th
e ce
ntra
l cas
e w
ith th
e fo
llow
ing
exce
ptio
ns:
flow
fiel
d: y
ear
500
0 A
D
ps_r
0_c
limat
e_im
mob
ile3_
100
To
eval
uate
the
impa
ct o
f ice
-she
et
retr
eat o
n flo
w c
ond
ition
s
An
imm
obile
ice
mar
gin
nort
hw
est
of t
he r
epos
itory
, th
e re
pos
itory
is n
o lo
nger
un
der
the
ice
shee
t. Ic
e m
argi
n ha
s st
aye
d in
the
sam
e lo
catio
n fo
r 10
0 ye
ars
. F
low
fiel
d: a
ccor
ding
to g
laci
al m
ode
l by
Löfm
an &
Kar
von
en (
2012
)
ps_r
0_c
limat
e_m
obile
_10
Ic
e sh
eet i
s re
trea
ting
over
the
site
, ice
mar
gin
sou
thea
st o
f the
rep
osito
ry;
the
repo
sito
ry is
stil
l un
der
the
ice
shee
t.
Flo
w fi
eld:
acc
ordi
ng to
gla
cia
l mod
el b
y Lö
fman
& K
arvo
nen
(20
12)
ps_r
0_c
limat
e_m
obile
_10
0
Ice
shee
t is
retr
eatin
g ov
er th
e si
te, i
ce m
arg
in n
orth
we
st o
f the
site
an
d th
e re
posi
tory
is n
o lo
nger
bel
ow
the
ice
shee
t.
Flo
w fi
eld:
acc
ordi
ng to
gla
cia
l mod
el b
y Lö
fman
& K
arvo
nen
(20
12)

511
Case A is assumed in the central case and in most other cases. Flow modelling cases ps_r0_b_2000 and ps_r0_c_2000 are examples of where cases B and C, respectively, are assumed. Case C gives rise to channelling within fractures.
The degree of correlation between fracture transmissivity and size is also uncertain. Here again, three different conceptual approaches have been used, with fracture transmissivity correlated, semi-correlated21or uncorrelated with fracture size (see Table 2-2 of Hartley et al. 2013b). The semi-correlated approach is used in the central case. ps_r0_a_corr_2000 and ps_r0_a_uncorr_2000 are, respectively, examples of cases where the correlated and uncorrelated approaches are used.
Excavation of the repository openings and the thermal effects of the spent nuclear fuel may lead to damage to the immediately adjacent rock. It is assumed in the central case flow model that the rock surrounding all deposition holes is damaged, and that this damage is hydraulically significant. There is also an excavation-damaged zone (EDZ) below the emplacement tunnels. The treatment of the deposition tunnel, deposition holes and their associated damaged zones in the central case is shown in Figure D-7 (see Section 4.3.1 of Hartley et al. (2013b) for further details).
The deposition tunnels are modelled with rectangular cross sections (the green feature in Figure D-7). Their EDZs are included in the model structures situated below the tunnels, which, in the central case, are assumed to be discontinuous (broken into discrete sections with gaps in between). Each section of an EDZ structure is represented by two fractures. One of these fractures is horizontal parallel to the floor of the tunnel. This fracture may, in some cases, intersect a deposition hole (see the purple features in Figure D-7). The other is vertical, and serves to connect the horizontal fracture to the tunnel backfill hydraulically. This is necessary since, in the model, fractures can only conduct flow in their planes. Cases ps_r0_cont_edz_2000 and ps_r0_no_edz_2000 consider the alternatives of, respectively, a continuous EDZ and no (hydraulically significant) EDZ. The possibility of voids in the crown space of the tunnel is modelled as a layer of high conductivity and high porosity (case ps_r0_crown_2000).
21 Log-normal distribution about a power-law correlated mean; see Table 2-2 of Hartley et al. (2013a).

512
Figure D-7. DFN modelling of the deposition tunnel and holes. The features shown are the deposition tunnel (green), discontinuous EDZ fractures below the deposition tunnel (purple), the deposition holes (yellow) and the eight fractures per hole representing rock damage around the holes. Four are parallel to the faces of the deposition hole (blue) and four cross fractures connect these to the deposition hole (red). After Fig. 4-18 of Hartley et al. (2013b).
The treatment of the damaged zones around the deposition holes is based in part on concepts presented in Neretnieks et al. (2010). However, it also takes into account observations from Posiva’s Olkiluoto Spalling Experiment (POSE), indicating that rock damage is dispersed along the walls of the deposition holes, and does not occur as triangular notches, as assumed in Neretnieks et al. (2010). The deposition holes are represented as rectangular, vertical block elements (the yellow features in Figure D-7). The damaged zones around the holes are each represented by four interconnected fractures with their faces parallel to the hole surfaces (shown in blue in Figure D-7), and four orthogonal fractures that connect these to the buffer in the hole itself (shown in red). Although early rock damage around the deposition holes is judged to be likely and is thus included in the central case, its hydraulic properties are uncertain, and may evolve over time as, for example, buffer swelling pressure develops and some buffer is potentially extruded into damaged zone fractures. Thus, as an alternative assumption, case ps_r0_no_spall_2000 is considered in which there is no hydraulically significant rock damage around the holes.
In central case, the transmissivity of EDZ is 10-8 m2/s and the transmissivity of the fractures representing the damaged zones around the deposition holes is set to about a quarter of this value, such that the EDZ and damaged zones have the same hydraulic conductivity. These transmissivities are significantly higher than the transmissivities of most of the conductive natural fractures. Less than 10 % of the conductive fractures have transmissivities greater than 10-8 m2/s and the majority have values below 10-9 m2/s.
513
D.4 Reactive transport modelling to assess hydrogeochemical evolution
Trinchero et al. (2013) address the geochemical evolution and Wersin et al. (2013) sulphide evolution during the following time windows:
the operational period lasting about a hundred years,
the post-closure temperate period over the next 10,000 years, and
retreat of the ice sheet considering two selected cases based on Löfman & Karvonen (2012), both considering an ice front staying at the site for 1000 years, but at different locations.
The conceptual model on which the study is based, assumes that the hydrochemical evolution of the groundwater at repository depth is the result of infiltration processes from the surface of the domain to the repository. The infiltrating waters, in turn, undergo geochemical reactions with the rock and fracture minerals. The main result of the modelling is the groundwater composition at the nodes representing the intersection of the recharge path lines with the repository tunnels.
Trinchero et al. (2013) and Wersin et al. (2013) have applied the FASTREACT (FrAmework for Stochastic REACtive Transport, Trinchero et al. 2010) to combine the flow and the chemical reactions. In this approach, particle tracking methods are used to define particle trajectories, streamlines, along which reactive transport simulations are carried out. The streamlines are characterised by the longitudinal coordinate interpreted in terms of traveltime. The streamlines have been defined based on the velocity field obtained by model variant 2009SH by Löfman & Karvonen (2012). Therefore the streamlines present a snapshot of the flow and salinity field at selected time instants. Similar to Löfman & Karvonen (2012) a dual porosity model was applied in which the dispersion and advection as well kinetic and equilibrium reactions along the streamline are taken into account and the mass transfer between the streamline and the surrounding rock matrix by matrix diffusion is accounted for. However, also single porosity model neglecting the matrix diffusion was used for the operational period, which lasts for a relatively short time and as a comparison of the resulting salinity field with the one by Löfman & Karvonen (2012) did show that the results are in agreement. Single porosity model was also considered as a sensitivity case for the glacial simulation cases.
Microbial populations and processes also affect the groundwater composition. The microbially mediated reactions have, so far, not been explicitly taken into account in the reactive transport modelling. However, considering only inorganic oxygen consumption in the reactive transport modelling is conservative as the microbial reactions would increase oxygen consumption. The role of microbially mediated reactions in sulphate reduction has been assessed based on the extensive groundwater and microbial sampling data from the site (see Chapter 3 of the main report).
Hydrogeochemical calculations were performed with PHREEQC-2 (Parkhurst & Appelo 1999). The thermodynamic database used in the simulations is the PHREEQC.dat database.

514
In the model, the mixing of the infiltrating waters (meteoric and seawater for the temperate phase and glacial meltwater for the melting phase of a glaciation) and the initial waters and the reactions of the mixed waters with the fracture-filling minerals in the host rock is evaluated along the determined flowpaths. For the temperate phase simulation, the initial distribution of the reference water types was defined according to salinity distribution by Löfman & Karvonen (2012). The water types in the order of increasing salinity are (see Table D-2 for composition of these waters):
brackish carbonate-rich water,
brackish sulphate-rich water,
brackish saline water,
saline water
highly saline water.
Prior to the reactive transport calculations, the meteoric water has been equilibrated with Fe(OH)3(am) and calcite. The resulting water is referred as “Altered Meteoric Water”. The initial waters for the temperate phase has been modified by equilibrating them with calcite and pyrite or FeS(am) (see Figure D-8). For the simulation of the melting phase of the glaciation, the groundwaters with composition at the end of the temperate phase are used as initial waters. The Baltic Seawater and the glacial meltwater also used as boundary waters were not equilibrated. It is noted however, that glacial waters are equilibrated with calcite in the first cell of the model, close to surface. As a consequence, the pH of the glacial water rises up to pH 9. This value is in agreement with measurements of melting glacial water (Grimsel water, Pastina & Hellä 2010). The composition of the infiltrating waters is given in Table D-6 and the initial interfaces of the reference waters are given in Table D-7 for two selected profiles, one located below the island (A) and the other in the sea area north of the island (B).
Table D-5. Chemical composition of reference groundwaters (Trinchero et al. 2013, Table 4-3).
Brackish HCO3
Brackish SO4 Brackish Saline Water
Saline water Highly Saline water
Sample KR4_81_1 KR6_135_8 KR20_465_1 KR10_498_1 KR12_741_1
TDS (mg/L) 1122 7225 10544 22099 49483
Ionic Strength 0.02 0.15 0.22 0.48 1.13
pH 7.4 7.6 7.4 8 8.2
Total Concentrations (mol/L)
Cl 9.90x10⁻³ 1.13x10⁻¹ 1.81x10⁻¹ 3.81x10⁻¹ 8.63x10⁻¹
SO4 9.58x10⁻⁴ 4.79x10⁻³ 2.10x10⁻⁴ 1.00x10⁻⁵ 5.00 x10⁻⁵
DIC 4.87x10⁻³ 1.86x10⁻³ 5.50x10⁻⁴ 1.10x10⁻⁴ 4.00 x10⁻⁵
SiO2 2.00x10⁻⁴ 3.92x10⁻⁴ 3.60x10⁻⁴ 2.80x10⁻⁴ 2.10 x10⁻⁴
PO4 3.87x10⁻⁶ - - 1.05x10⁻⁷ 2.63 x10⁻⁶
F 3.16x10⁻⁵ 1.58x10⁻⁵ 5.26x10⁻⁵ 6.32x10⁻⁵ 6.32 x10⁻⁵
Br 1.75x10⁻⁵ 1.65x10⁻⁴ 5.51x10⁻⁴ 1.19x10⁻³ 2.55 x10⁻³

515
Brackish HCO3
Brackish SO4 Brackish Saline Water
Saline water Highly Saline water
Al 1.48x10⁻⁶ - - 3.70x10⁻⁷ 2.22 x10⁻⁶
Na 1.31x10⁻² 7.70x10⁻² 1.15x10⁻¹ 2.10x10⁻¹ 3.61 x10⁻¹
K 2.48x10⁻⁴ 4.87x10⁻⁴ 2.80x10⁻⁴ 3.60x10⁻⁴ 4.90 x10⁻⁴
Ca 1.34x10⁻³ 1.63x10⁻² 3.24x10⁻² 8.91x10⁻² 2.55 x10⁻¹
Mg 7.40x10⁻⁴ 7.41x10⁻³ 2.60x10⁻³ 1.60x10⁻³ 1.50 x10⁻³
Fe 1.15x10⁻⁵ 6.45x10⁻⁶ 2.50x10⁻⁶ 2.00x10⁻⁶ 3.80 x10⁻⁷
Mn 3.46x10⁻⁶ 2.18x10⁻⁵ 5.83x10⁻⁶ 7.28x10⁻⁶ 9.28 x10⁻⁶
Table D-6. Chemical composition of the infiltrating waters; meteoric water, Baltic seawater and glacial meltwater (Trinchero et al. 2013, Table 4-2, Baltic sea water and glacial meltwater after Pastina & Hellä 2010).
Meteoric wáter Altered Meteoric Water after equilibrium
Baltic seawater (1)
Glacial Meltwater (1)
Sample PVP4_2
Ionic Strength 0.01 0.997 0.0324
pH 7.3 7.2 7.7 5.8
Eh (mV) 48 789 919
Total Concentrations (mol/L)
Concentration (mmol/L)
Cl 1.69x10⁻³ 1.69x10⁻³ 8.53x10⁻²
SO4 4.99x10⁻⁴ 4.99x10⁻⁴ 4.68x10⁻³ 5.2x10⁻⁴
DIC 5.80x10⁻³ 5.69x10⁻³ 2.6x10⁻³
SiO2 3.56x10⁻⁴ 3.56x10⁻⁴ 9.65x10⁻⁶ 1.7x10⁻⁴
PO4 2.11x10⁻⁷ 2.11x10⁻⁷ 3.1x10⁻⁶
F 3.16x10⁻⁵ 3.16x10⁻⁵ 1.42x10⁻⁵
Br 1.25x10⁻⁶ 1.25x10⁻⁶ 1.29x10⁻⁴ 1.2x10⁻⁵
Al 9.64x10⁻⁸ 9.64x10⁻⁸ 3.7x10⁻⁶
Na 1.07x10⁻³ 1.07x10⁻³ 7.70x10⁻² 6.5x10⁻³
K 1.71x10⁻⁴ 1.71x10⁻⁴ 1.69x10⁻³ 3.8x10⁻³
Ca 2.30x10⁻³ 2.20x10⁻³ 2.00x10⁻³ 3.2x10⁻³
Mg 6.49x10⁻⁴ 6.49x10⁻⁴ 9.00x10⁻³ 4.1x10⁻³
Fe 9.51x10⁻⁵ 9.51x10⁻⁵ 1.8x10⁻⁶
Mn 2.28x10⁻⁵ 2.28x10⁻⁵

516
Table D-7. Initial conditions of the reactive transport simulations - vertical depth of the interfaces between the different water types (Trinchero et al. 2013, Table 3-1). Profile A located below the island and profile B in the sea area north of the island.
Interface Depth (masl)
Profile A Profile B
Brackish HCO3/Brackish SO4 (S1/S2) -120.0 -
Brackish SO4/Brackish saline (S2/S3) -380.0 -
Brackish saline/Saline (S3/S4) -460.0 -460.0
Saline/Highly saline (S4/S5) -575.0 -575.0
Thus, based on data on rock matrix and fracture mineralogy and the basic understandings of weathering and cation exchange reactions, the following processes have been accounted for and implemented in the numerical model:
calcite and pyrite/FeS(am) dissolution/precipitation,
aluminosilicates weathering,
cation exchange reactions,
aqueous redox reactions.
Mineral dissolution and/or precipitation have been simulated under equilibrium or kinetic assumptions. The minerals with clearly faster kinetic rates than water velocities, are assumed to be at local equilibrium (e.g. calcite). On the other hand, minerals with low or very low kinetic rates are modelled using a kinetic approach. Pyrite equilibrium is assumed, although this assumption is not necessarily well justified. However, it is likely that taking into account kinetic dissolution of pyrite would lead to lower, and less pessimistic, sulphide concentrations than those under assumption of pyrite equilibrium. Biogeochemical reactions are not included in the model. Consequently, the following minerals and processes are taken into account (see also Figure D-8):
Dissolution/precipitation of calcite, pyrite, amorphous iron sulphide (FeS(am)), kaolinite and amorphous silica (SiO2(am)) assuming mineral equilibrium.
Kinetic dissolution reactions for albite, K-feldspar and illite.
Precipitation of siderite, amorphous silica, amorphous iron(III)hydroxide (Fe(OH)3(am)) was considered possible although these minerals are not present initially.
Sensitivity calculations (Trinchero et al. 2013) showed that the groundwaters remain unsaturated with respect to illite and thus the precipitation of illite was not further considered in the modelling. An illite-like phase to be the main solid exchanger and the model of Bradbury & Baeyens (2002) has been used to describe the exchange reactions involved in the mineral/groundwater interface. Kaolinite is abundant, but it is reactive only in acid conditions, which are not expected. Kinetic dissolution of silicate minerals, even though a slow process, and calcite equilibrium are the most important pH buffering processes in the groundwaters.

517
In the modelling by Trinchero et al. (2013), two cases were considered: presence of pyrite in the fracture-coating minerals (base case) and presence of amorphous iron sulphide (FeS(am)) in the fracture-coating minerals (variant case). The presence of amorphous iron sulphide leads to a higher sulphide concentration in the equilibrated initial waters compared with pyrite-equilibrated waters. Further, amorphous iron sulphide plays a role in controlling both the redox conditions and the aqueous sulphide concentration. In the modelling, a homogeneous distribution of fracture-filling minerals and a constant porosity are assumed.
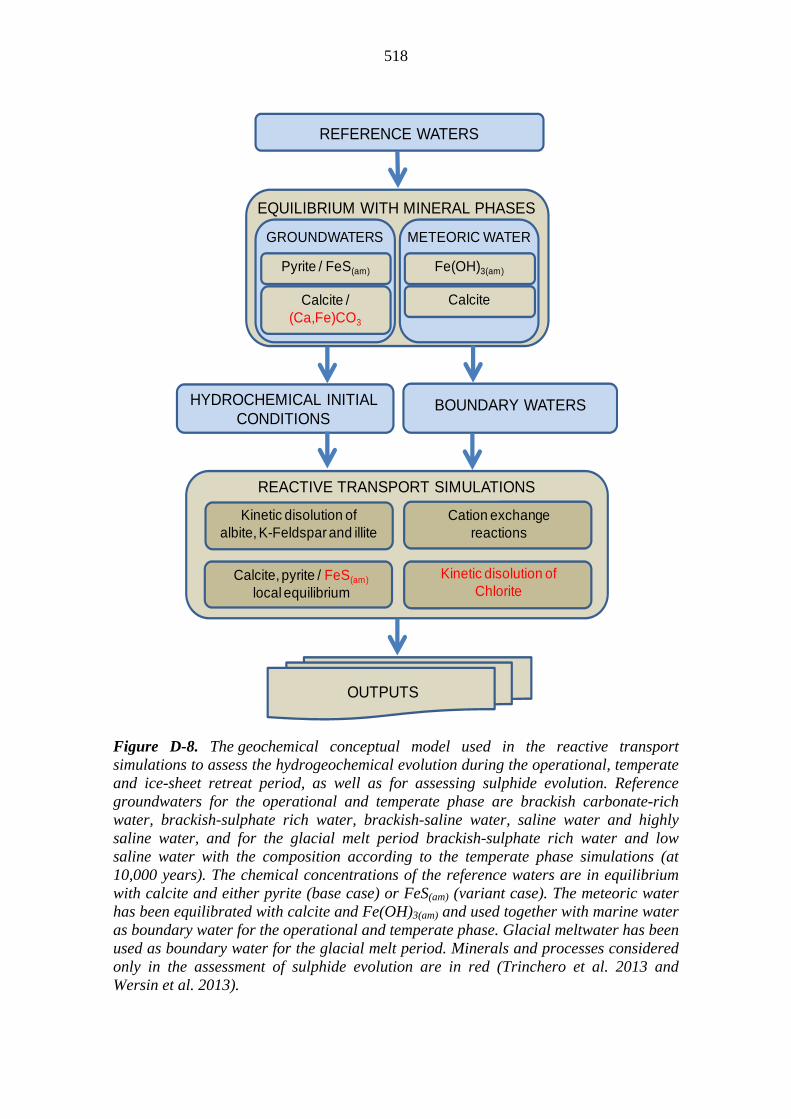
518
Figure D-8. The geochemical conceptual model used in the reactive transport simulations to assess the hydrogeochemical evolution during the operational, temperate and ice-sheet retreat period, as well as for assessing sulphide evolution. Reference groundwaters for the operational and temperate phase are brackish carbonate-rich water, brackish-sulphate rich water, brackish-saline water, saline water and highly saline water, and for the glacial melt period brackish-sulphate rich water and low saline water with the composition according to the temperate phase simulations (at 10,000 years). The chemical concentrations of the reference waters are in equilibrium with calcite and either pyrite (base case) or FeS(am) (variant case). The meteoric water has been equilibrated with calcite and Fe(OH)3(am) and used together with marine water as boundary water for the operational and temperate phase. Glacial meltwater has been used as boundary water for the glacial melt period. Minerals and processes considered only in the assessment of sulphide evolution are in red (Trinchero et al. 2013 and Wersin et al. 2013).
REFERENCE WATERS
BOUNDARY WATERSHYDROCHEMICAL INITIAL CONDITIONS
REACTIVE TRANSPORT SIMULATIONS
OUTPUTS
EQUILIBRIUM WITH MINERAL PHASES
GROUNDWATERS
Pyrite / FeS(am)
Calcite / (Ca,Fe)CO3
METEORIC WATER
Fe(OH)3(am)
Calcite
Kinetic disolution ofalbite, K-Feldspar and illite
Calcite, pyrite / FeS(am)
local equilibrium
Cation exchangereactions
Kinetic disolution ofChlorite

519
References
Site Description Olkiluoto Site Description 2011. Eurajoki, Finland: Posiva Oy. POSIVA 2011-02. ISBN 978-951-652-179-7.
Anttila, M. 2005. Criticality safety calculations for three types of final disposal canisters. Olkiluoto, Finland: Posiva Oy. Working Report 2005-13. 23 p.
Bradbury, M. & Baeyens, B. 2002. Near field sorption data bases for compacted MX-80 bentonite for performance assessment of a high-level radioactive waste repository in Opalinus Clay host rock. Paul Scherrer Institute (PSI). PSI Bericht 03-07.
Fox, A., Forchhammer, K., Pettersson, A., La Pointe, P. & Lim, D.-H. 2012. Geological discrete fracture network model for Olkiluoto - version 2. Eurajoki, Finland: Posiva Oy. POSIVA 2012-27.
Hartikainen, J. 2013. Simulations of permafrost evolution at Olkiluoto. Eurajoki, Finland: Posiva Oy. Working Report 2012-34.
Hartley, L., Appleyard, P., Baxter, S., Hoek, J., Roberts, D. & Swan D. 2013a. Development of a hydrogeological discrete fracture network model for the Olkiluoto Site Descriptive Model 2011. Eurajoki, Finland: Posiva Oy. Working Report 2012-32 (to be published).
Hartley, L., Hoek, J., Swan, D., Appleyard, P., Baxter, S., Roberts, D. & Simpson, T. 2013b. Hydrogeological modelling for assessment of radionuclide release scenarios for the repository system 2012. Eurajoki, Finland: Posiva Oy. Working report 2012-42 (to be published).
Hartley, L., Hoek, J., Swan, D., Baxter, S. & Woollard, H. 2013c. Hydrogeological discrete fracture modelling to support Rock Suitability Classification. Eurajoki, Finland: Posiva Oy. Working Report 2012-48 (to be published).
Löfman, J. & Karvonen, T. 2012. Simulations of hydrogeological evolution at Olkiluoto. Eurajoki, Finland: Posiva Oy. Working Report 2012-35.
Löfman, J., Mészáros, F., Keto, V., Pitkänen, P. & Ahokas, H. 2009. Modelling of groundwater flow and solute transport in Olkiluoto - Update 2008. Eurajoki, Finland: Posiva Oy. Working Report 2009-78. 274 p.
Löfman, J., Poteri, A. & Pitkänen, P. 2010. Modelling of salt water upconing in Olkiluoto. Eurajoki, Finland: Posiva Oy. Working Report 2010-25. 146 p.
Neretnieks, I., Liu, L. & Moreno, L. 2010. Mass transfer between waste canister and water seeping in rock fractures. Revisiting the Q-equivalent model. Stockholm, Sweden: Swedish Nuclear Fuel and Waste Management Co. (SKB). Technical Report TR-10-42. 51 p. ISSN 1404-0344.

520
Nye, J.F. 1952. A method of calculating the thicknesses of the ice-sheets. Nature. Vol. 169, no. 4300, p. 529-530.
Parkhurst, D.L. & Appelo, C.A.J. 1999. User’s guide to PHREEQC (version 2) - A computer program for speciation, batch-reaction, one-dimensional transport, and inverse geochemical calculations. Denver, USA: U.S. Geological Survey. Water-Resources Investigations Report 99-4259. 312 p.
Pastina, B. & Hellä, P. (eds.) 2006. Expected evolution of a spent nuclear fuel repository at Olkiluoto. Olkiluoto, Finland: Posiva Oy. POSIVA 2006-05. 405 p. ISBN 951-652-145-2.
Pastina, B. & Hellä, P. 2010. Models and Data Report 2010. Eurajoki, Finland: Posiva Oy. POSIVA 2010-01. 478 p. ISBN 978-951-652-172-8.
Pimenoff, N., Venäläinen, A. & Järvinen, H. 2011. Climate scenarios for Olkiluoto on a time-scale of 120,000 years. Eurajoki, Finland: Posiva Oy. POSIVA 2011-04. 102 p.
Posiva 2009. Olkiluoto Site Description 2008. Eurajoki, Finland: Posiva Oy. POSIVA 2009-01. 714 p. ISBN 978-951-652-169-8.
Saanio, T., Ikonen, A., Keto, P., Kirkkomäki, T., Kukkola, T., Nieminen, J. & Raiko, H. 2010. Outline design of the disposal facility 2009. Eurajoki, Finland: Posiva Oy. Working Report 2010-50. 152 p.
Saanio, T., Ikonen, A., Keto, P., Kirkkomäki, T., Kukkola, T., Nieminen, J. & Raiko, H. 2013. Design of the disposal facility 2012 (in Finnish: Loppusijoituslaitoksen suunnitelma 2012). Eurajoki, Finland: Posiva Oy. Working Report (to be published).
Trinchero, P., Molinero-Huguet, J., Salas-Navarro, J., and Piqué, A. 2010. A Lagrangian approach to solve multicomponent reactive transport in complex geological environments. Proceedings XVIII International Conference on Water Resources CMWR, June 21-24, 2010, Barcelona, Spain.
Trinchero, P., Román-Ross, G., Maia, F. & Molinero, J. 2013. Hydrogeochemical evolution of the Olkiluoto site. Eurajoki, Finland: Posiva Oy. Working Report (to be published).
Vaittinen, T., Ahokas, H., Nummela, J. & Paulamäki, S. 2009. Hydrogeological structure model of the Olkiluoto site – Update in 2008. Eurajoki, Finland: Posiva Oy. Working Report 2009-15. 276 p.
Vaittinen, T., Ahokas, H., Nummela, J. & Paulamäki, S. 2011. Hydrogeological structure model of the Olkiluoto site – Update in 2010. Eurajoki, Finland: Posiva Oy. Working Report 2011-65. 330 p.
Wersin, P., Pitkänen, P., Snellman, M., Román-Ross, G., Smith, P., Filby, A., Kiczka, M. 2013. Sulphide fluxes in the spent nuclear fuel repository at Olkiluoto. Eurajoki, Finland: Posiva Oy. Working Report (to be published).
LIST OF REPORTS
15.2.2013
POSIVA-REPORTS 2012
_______________________________________________________________________________________
POSIVA 2012-01 Monitoring at Olkiluoto – a Programme for the Period Before Repository Operation Posiva Oy ISBN 978-951-652-182-7 POSIVA 2012-02 Microstructure, Porosity and Mineralogy Around Fractures in Olkiluoto
Bedrock Jukka Kuva (ed.), Markko Myllys, Jussi Timonen, University of Jyväskylä Maarit Kelokaski, Marja Siitari-Kauppi, Jussi Ikonen, University of Helsinki Antero Lindberg, Geological Survey of Finland Ismo Aaltonen, Posiva Oy ISBN 978-951-652-183-4
POSIVA 2012-03 Safety Case for the Disposal of Spent Nuclear Fuel at Olkiluoto - Design Basis 2012 ISBN 978-951-652-184-1 POSIVA 2012-04 Safety Case for the Disposal of Spent Nuclear Fuel at Olkiluoto - Performance Assessment 2012 ISBN 978-951-652-185-8