safety and durability of structures icosados 2016 · safety and durability of structures icosados...
TRANSCRIPT

7th International Conference on Safety and Durability of Structures
ICOSADOS 2016 May 10 - 12, 2016, UTAD, Portugal
VULNERABILITY ASSESSMENT OF REAL WATER DISTRIBUTION
NETWORKS USING THE TV-WPN INFORMATICS TOOL
António A.L.S. Duarte1,a, Diogo Sousa1, João Varajão2, Tiago Pinto3, Isabel Bentes3
1Civil Engineering Department, University of Minho, Campus de Gualtar, 4710 057 Braga, Portugal, [email protected]
2 Centro ALGORITMI, Department of Information Systems, University of Minho, Portugal, [email protected]
3C-MADE, Centre of Materials and Building Technologies, UBI/UTAD, Portugal, [email protected], [email protected]
Keywords: Water supply safety; risk assessment; vulnerability; failure scenarios; TV-WPN software tool; real-world distribution network.
ABSTRACT: The design, operation and rehabilitation of water supply systems must have an asset management strategy, addressing hydraulic, technical, economic, social, environmental, and health issues with a high level of complexity. The vulnerability assessment and the resilience increment of a water distribution networks can be supported by the emerging Theory of Vulnerability of Water Pipe Networks (TV-WPN), which allows to systematize failure scenarios and map the major disproportions between failure consequences and the initial damage. Failure scenarios are defined leading simultaneously with hydraulic capacity deterioration and structural integrity, the main issues of water networks safety. The manual application of TV-WPN is almost impossible to be used in real-world water networks due to the work overload. So, it was initially tested using only simple theoretical networks, needing new and more expeditious tools that could encourage its use by designers and managers of this type of hydraulic infrastructure. The recent development of the TV-WPN software tool allowed to speed up the calculation process, enabling the application of this theory to real water supply networks. This work presents the application of tool to a real water distribution network located in a village of Braga municipality for analyze their hydraulic performance and vulnerability, as well as to check and evaluate TV-WPN performance in a real-world case. It was concluded that the frequent presence of pipelines with very low flow velocities (due to the imposition of regulatory minimum diameters) can compromise the successful application of this software to real water distribution networks, namely in rural areas where flow rates are generally lower, which is an opportunity for future developments.
1. INTRODUÇÃO
The design, operation and rehabilitation of water supply systems must have an asset management strategy, addressing hydraulic, technical, economic, social, environmental, and health issues with a high level of complexity. The vulnerability assessment and the resilience increment of a water distribution networks can be supported by the emerging Theory of Vulnerability of Water Pipe Networks (TV-WPN).
The Theory of Vulnerability (TV) was initially developed for application to structures (TVE) (Wu et al., 1993) and the theoretical foundations of TVE were defined and subsequently quantified the probability of damage scenario (Hashimoto, 1994). In 1997 started to develop a computer program for the practical application of TVE (Yu, 1997). Later, TVE has been revised in order to allow the implementation of structural analysis in 3D (Lu, 1998). In 2002 it was possible to quantify the risk of a vulnerable damage scenario (Pinto, 2002; Pinto et al., 2002).
Argawal et al. (2001) found that the theoretical foundations of TV could be applied to other areas besides structures, as in the case of traffic networks, water networks, electrical circuits and even companies. In the case of water supply networks, have been developed some works (Pinto et al., 2010; Bentes et al., 2011) that led to the formulation of a theory, called Theory of Vulnerability of Water Pipe Networks (TV-WPN).
The theory of vulnerability of water pipe networks (TV-WPN) is a theory still in development, which aims to identify the most vulnerable parts of a water supply system (WPN). This can be very useful, either in the design phase, either in the management and operation phase, because it will allow more robust design solutions and assist in the potential failure mitigation process in water supply systems. It is important to ensure universal access to safe water safeguarding of public health. The application of TVRAA in the design phase allows to identify and prioritize the need to strengthen or resizing network areas structurally or hydraulically most vulnerable. In phases like management and operation of a WPN, TV-WPN will be an important decision-support tool in developing maintenance plans and rehabilitation, and in the definition of intervention priorities. It allows the selection of most critical network elements based on the effects produced by one or more damage scenarios. These gains justify the TV-WPN constitute a valuable complement to classical theories of design WPN, since supported by user-friendly and automatic reliable calculation tools.
In this context, a WPN is vulnerable when allow situations where a small effort would result in a disproportionate and/or inadmissible damage in the system. The damage has been considered as a partial or total loss of one or more network parts. A damage scenario corresponds to an ordered sequence of damage events.
The vulnerability is associated with the form quality of a WPN where the connection between sections is highly valued. The application of TV-WPN to a given water supply system identifies five distinct types of vulnerable damage scenarios among which we highlight the total collapse scenario and the maximum vulnerability damage scenario. The total collapse scenario corresponds to the scenario that requires less effort for network be fully inoperable (i.e., unable to supply water quality at any point) and the maximum vulnerability scenario is the one that presents the greatest disparity between the effort to be a certain damage and the consequent loss of respective WPN.
The recent development of the TV-WPN software tool allowed to speed up the calculation process (Varajão et al., 2012), enabling the application of this theory to real water supply networks.
This work presents the application of the TV-WPN software to a real water pipe network located in Este (S. Mamede), a village of Braga municipality (Portugal), aiming to analyze their hydraulic performance and vulnerability, as well as to check and evaluate TV-WPN performance in a real-world case.
2. METHODS
2.1. Software tools
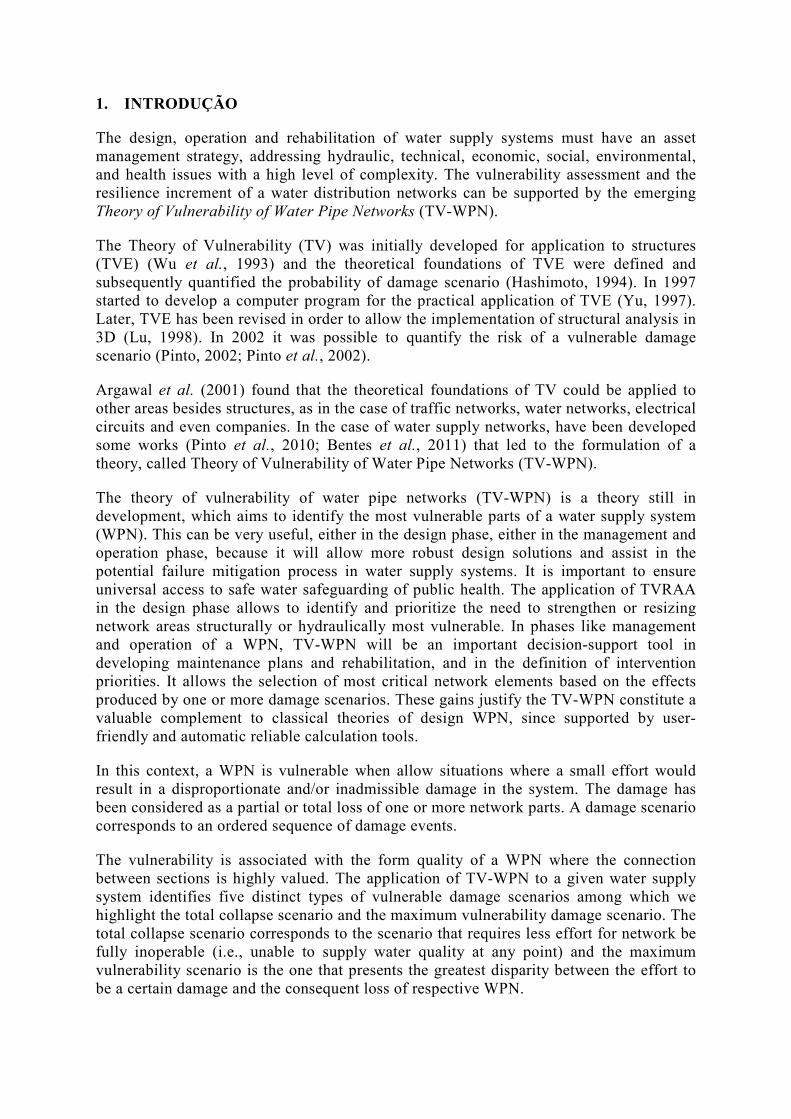
The software tool TV-WPN is a Web application, in development, currently in 1.9 Beta version, which allows to identify and quantify the vulnerable damage scenarios of a RAA, but also helps to calculate the practical application of the TV-WPN. For the development of TV-WPN application were used the PHP, HTML, JavaScript and CSS languages, and a Web Apache execution environment server on Linux operating system. Being a Web application, it can be used using any latest Internet browser. The computer program is structured according to the flowchart shown in Figure 1 (Pinto et al., 2010c).
Figure 1: Flowchart of the TV WPN program.
The Figure 2 shows the homepage of the current Web application, which contains a menu with several options, allowing, among other features, access to the development of the TV-WPN, access to theoretical examples of WPN selected for testing the theory and also the access to the software. The TV-WPN program allows reading WPN defined in XML (the XML structure to follow can be found through the option "XML sample file"), and select the details of the calculation steps which are intended to display, for example, the agglutination process or the construction of the hierarchical model.

Figure 2: Home page of the software TV-WPN.
The calculation process is initiated when it is selected the "Load File" option. As a final result, a table is presented, identifying vulnerable damage scenarios and the vulnerability parameters for each of these scenarios (Table 1). Additionally, it is identified the maximum vulnerability and total collapse scenarios (Table 2). A future version of the TV-WPN will provide the graphical representation of various elements of the calculation process, such as setting the WPN or the phased calculation of the desaglutination process.
Table 1: Vulnerable damage scenario identified through the desaglutination process.
Table 2: Identification of the different types of vulnerable damage scenario.
In this work, the EPAtoTV informatics tool has also been developed (tested and applied), aiming to provide an easy and quick connection between EPANET 2.0 hydraulic results (the most used software for water supply networks modeling and simulation) and TV-WPN input data required.
This interface software allows to import, automatically, the EPANET output data files, imposing that the simulation report file must be selected before than the exportation file of the water supply network (WSN) simulated. This program was structured in four steps: open files; process; add tank (if necessary); and export to XLM. In this last step, all imported and processed information is saved in XML file format that can be load by TV-WPN program.
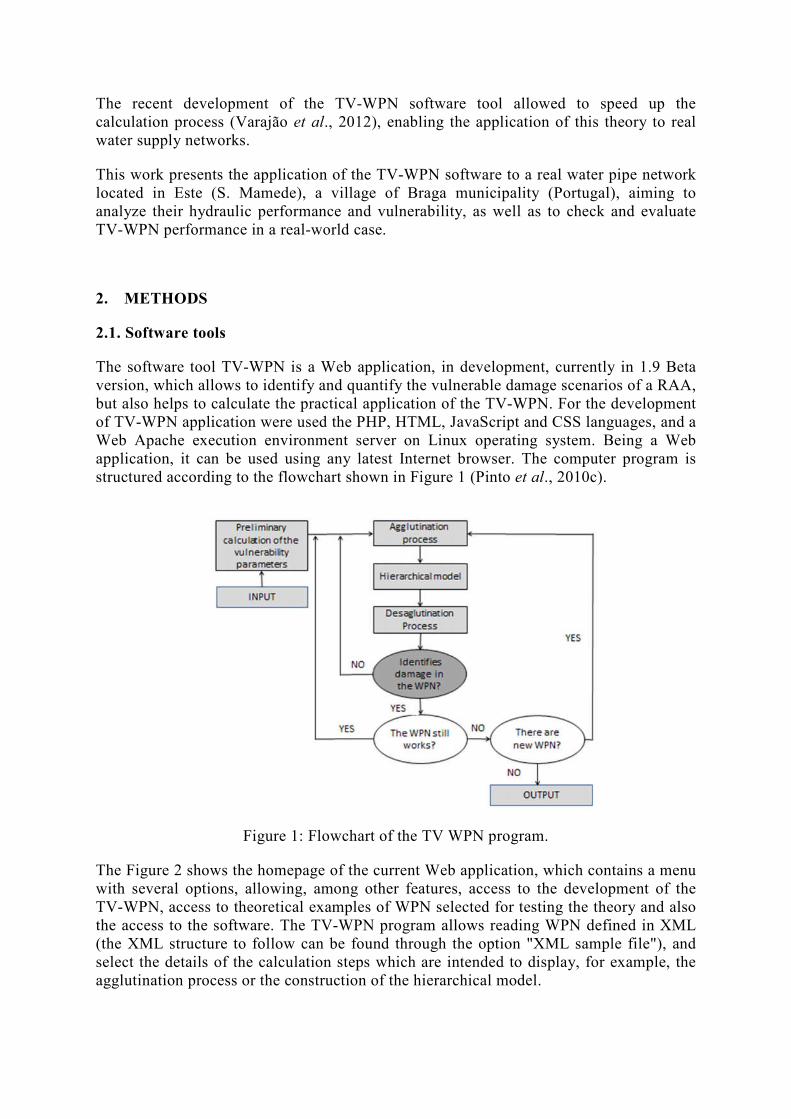
Table 3 presents a print screen of the third step (“Process”), showing the program structure and some obtained results for the studied WDN (Este - S. Mamede).
Table 3. The EPAtoTV structure and an extract of the process step result.
Although the simulation report this water network is quite extensive, the EPAtoTV tasks were efficiently performed in only three minutes, drastically contracting with the two hours spended to make the same tasks by manual processing.
2.2. Case study
The case study consists in the application of the software tool TV-WPN to the subsystem of Este – S. Mamede from Braga municipality’s water supply network (Figure 3a). This consists of a main system supplying fifteen subsystems, including the Este - S. Mamede (ESM) (Figure 3b), delivering on average over 38,000 m3/dia drinking water to Braga municipality and serving a total population of more than 180,000 resident inhabitants. Currently, the subsystem of Este - S. Mamede supplies only about 2,500 inhabitants.
The subsystem of Este – S. Mamede was selected due, mainly, to the following factors:
Its structure contains network areas only ramified or only meshed and other mixed, ideal situations to test and analyze the TV-WPN and EPAtoTV programs;
It has a very considerable extension to serve resident population which may cause hydraulic conditions that could modify the quality of water distributed. It happens mainly due to the high residence time of water in the pipes and excessive decay of free residual chlorine at the end points of the network.

Figure 3: a) Layout of water supply system of Braga municipality; b) Layout of the water supply subsystem of Este – S. Mamede.
The network has dimensioned to meet the consumption needs and also the requirements imposed by Decree-Law No. 207/94. In particular as regards the instantaneous flow for firefighting because some urbanized areas of the network are identified with degree 1 of fire risk. This implies that the network should be dimensioned for an instantaneous flow rate of 15 ls-1 at any hydrant valve.
The material of the pipes in older network zones is PVC (polyvinyl chloride), and the most recent in HDPE (high density polyethylene). The nominal diameters ranging between 63 and 160 mm and its nominal pressure is 1 MPa class for both materials.
3. RESULTS AND DISCUSSION
3.1. Hydraulic performance of Este-S. Mamede WPN
A properly modeled water distribution network (WDN) has the great advantage to obtain a deepen knowledge of its operation, namely increasing the sensitivity of their behavior in terms of variability of its hydraulic conditions. After its calibration and validation, a hydrodynamic simulation model (HSM) brings, together in a single support, a compiled diversity of information that allows us to understand how a specific WDN works, under different operational scenarios.
The application of the TV-WPN software tool to this case study requires prior hydraulic simulation of Este-S. Mamede WPN (ESM-WPN), which was performed using a simulation model based on the well-known EPANET hydraulic analysis package. Figure 4 shows the obtained flow and average velocity ranges for this real WDN, showing a sensitive spatial variation of these two hydraulic parameters and their high interdependence, due to the small diameter variation of its pipes.

Figure 4: Flow and velocity spatial distributions resulting from ESM-WDN modeling.
It can be seen that the flow path moves from the inner zone (where the reservoir is located) to the network edge areas (with lower demographic density). The biggest flows occur in pipes connecting the reservoir of the input source (reservoir) to the different sub-networks (red lines). Therefore, the crucial link between north and south sub-networks, where flow rate is also significant, has no alternative path, highlighting the absence of system redundancy at this point, and its great vulnerability, because, if there is a break in this connection, all the northern sub-network will be out of service. The peripheral ducts are those with the lowest flow rates (blue lines), because there just circulate the flows meet the water needs of each border areas (predominantly rural). Many terminal pipes only supply one or two single family dwellings.
In general, for peak flow scenario, the obtained water velocities are very low, even below the regulatory value of 0.3 m/s (Portuguese Regulatory Decree 23/95), namely at the edge areas, which can promote the disposal of SS leading to pipes’ abrasion increase, and drinking water quality deterioration. The occurrence of these low velocity rates results not only from a small water consumption, but is especially due to the regulatory imposition of a minimum diameter that leads to an undesirable over sizing of peripheral pipes for this range of flows rates. In fact, the legal imposition of a minimum diameter of 80 mm, when fire-fighting must also be ensured, tends to an irrational over sizing of peripheral ducts.
Low flow rates in water supply networks can also affect drastically the microbial drinking water quality, since the decay of chlorine content over the network increases for higher residence times, promoting the development of biofilms on the pipe walls, which may harbor pathogens colonies, some of them chlorine-resistant. This pathogens can be easily carried out along WDS to the tap of consumers, endangering their health. Thus, in the future, water quality monitoring programs must be strengthened at the northern area of the ESM-WDN, and in all WSN with similar hydraulic conditions.
In addition to its effectiveness, it is still to highlight two complementary aspects of EPAtoTV software that validate its applicability to real networks. One of them relates to its efficiency in terms of processing time information. Indeed, for a large and complex network like this, the manual performance of tasks assigned to EPAtoTV took more than two hours, while the program was processed it in just three minutes, although the simulation report is quite extensive. The other is the success in selecting the desired information and required by the TV-WPN software tool (presented in the reports and files from the MSH), as well as its good performance on treat and organize it.
3.2. Vulnerability analysis of Este-S. Mamede WPN using the TV-WPN software
The application procedure of the TVWPN consists of two main stages: a clustering process; and an unzipping process. The clustering process results in a description of a hierarchical model of the WPN for use in the next stage. The unzipping process results in the identification of failure scenarios. A detailed description of how these processes are performed is delivered in Pinto et al. (2010).
Successfully completed the validation of the new interface, EPAtoTV, the application of TV-WPN software began the analysis of the hydraulic network vulnerability of the studied ESM-WDS. Unfortunately, after uploading the file generated by EPAtoTV, it was found that the simulation in TV-WPN was not successful. Indeed, the program only performed pre-processing (it includes the EPAtoTV output file reading), the clustering process has yet been identified, although without showing the respective results, but other program steps do not even reached be identified.
Considering the type of error messages, it seems that the software cannot run simulations on networks that have sections with flow/velocities near zero. This may result from the fact that, actually in TV-WPN, the quality form parameter is calculated based on the total head loss, which is also near zero at these identified adverse hydraulic conditions.
So, whenever these conditions occur, it is recommended to proceed to a sectorization of the global network in a similar type of subnets (looped, branched, hybrid). The optimal size of each subsystem will depend upon the geometry of the whole network, spatial variation of population density, topography of the area, and location of water input points.
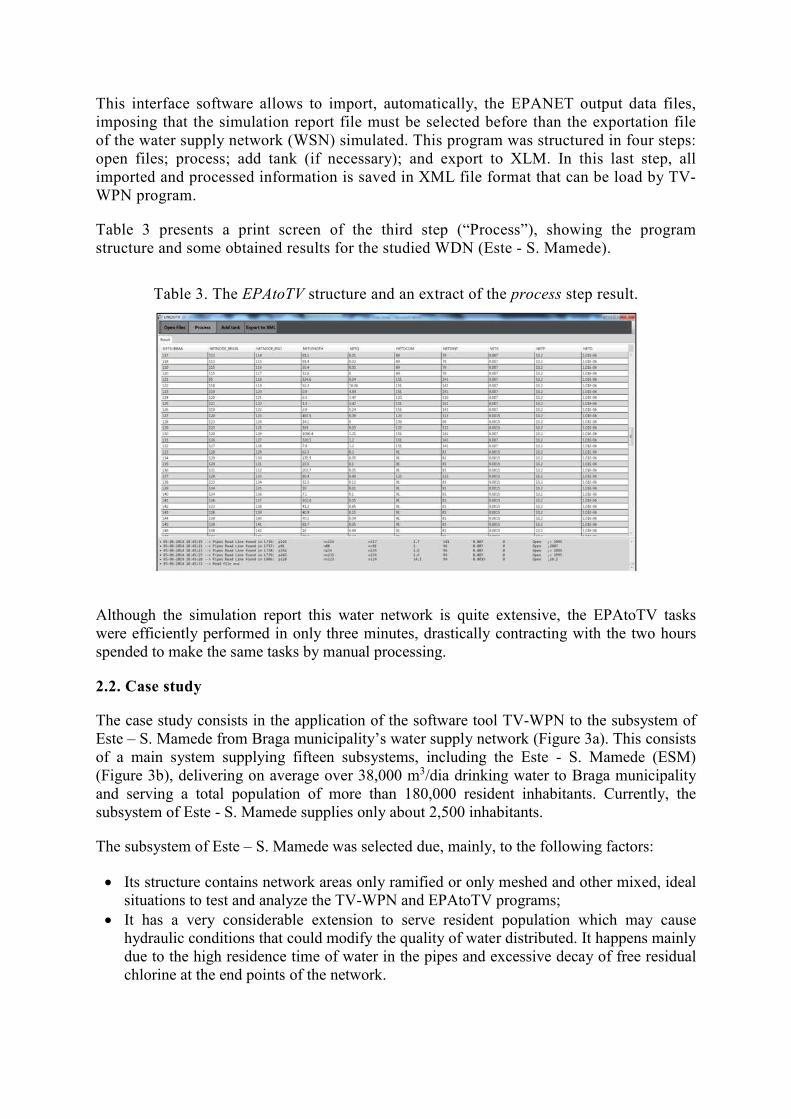
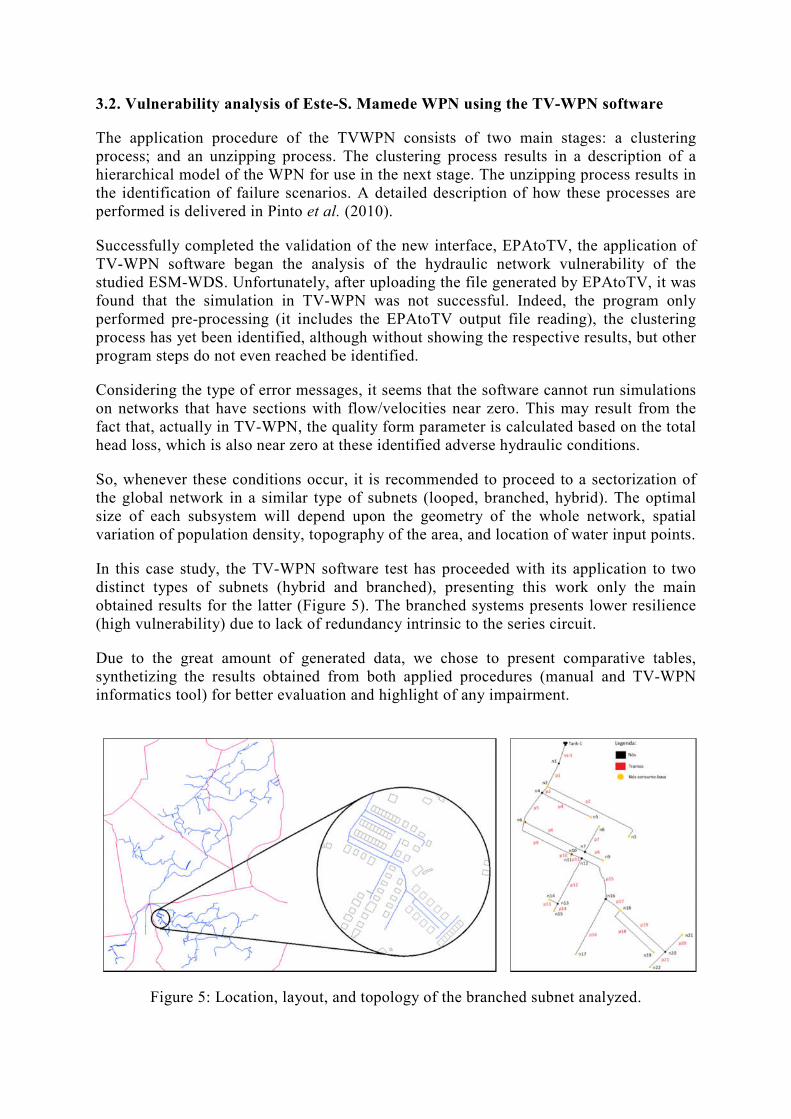
In this case study, the TV-WPN software test has proceeded with its application to two distinct types of subnets (hybrid and branched), presenting this work only the main obtained results for the latter (Figure 5). The branched systems presents lower resilience (high vulnerability) due to lack of redundancy intrinsic to the series circuit.
Due to the great amount of generated data, we chose to present comparative tables, synthetizing the results obtained from both applied procedures (manual and TV-WPN informatics tool) for better evaluation and highlight of any impairment.
Figure 5: Location, layout, and topology of the branched subnet analyzed.
The major stages of TV-WPN, which results were latter object of comparison, are:
• Preprocessing, where input modeling information are analyzed in order to obtained a correct network definition, and to calculate the requested hydraulic parameters (e.g., head loss, tank distance) used to assess the well formedness of each WPN branch cluster considered;
• Clustering process, leading to progressive formation of WPN branch clusters that present better form and are tightly connected to each other than to the rest of the WPN. It starts at the lowest level by using only primitive clusters (in this study case, 30 candidates were firstly compared), and finishes, at the highest level, by having the whole WPN, including the existing storage tanks. It is a selective process that requires five clustering criteria to decide the next WPN branch cluster to be formed at each level of definition, and it allows defining the hierarchical model of a WPN, which is crucial to an effective vulnerability approach;
• Hierarchical model scheme definition, for clearly identification of WPN branch clusters formed during the clustering process and also the respective used primitive clusters. Simultaneously, the WPN rings that represent these WPN branch clusters and the clustering criteria used for the candidate selection are also shown. The part of the WPN that appears at the bottom of the hierarchical model has better form than the other parts appearing higher up in the hierarchy;
• Unzipping process, where the hierarchical model of a WPN is used to search for the vulnerable failure scenarios. Each WPN branch is unzipped in turn by introducing deteriorating events until a WPN branch cluster or the whole WPN becomes totally inoperative. After every deteriorating event, the WPN branch cluster changes and, therefore, it becomes necessary to re-cluster and to define a corresponding new hierarchical model of the damaged WPN branch cluster.
Comparing the results obtained in the preprocessing stage (manually and using TV-WPN tool), it was found that there were no sensitive differences in the definition of failure scenarios. So, may be considered that this tool was successful in this initial task.
The results obtained in the clustering process using TV-WPN tool (in the ESM branched subnet) showed that the only difference between the two procedures is in the candidates’ numeration criteria to be clustered. With TV-WPN tool all candidates are sequentially numbered, whereas in the manual procedure only the selected candidates need to be. The unique consequence is the increase of complexity in dataset analysis for the software users.
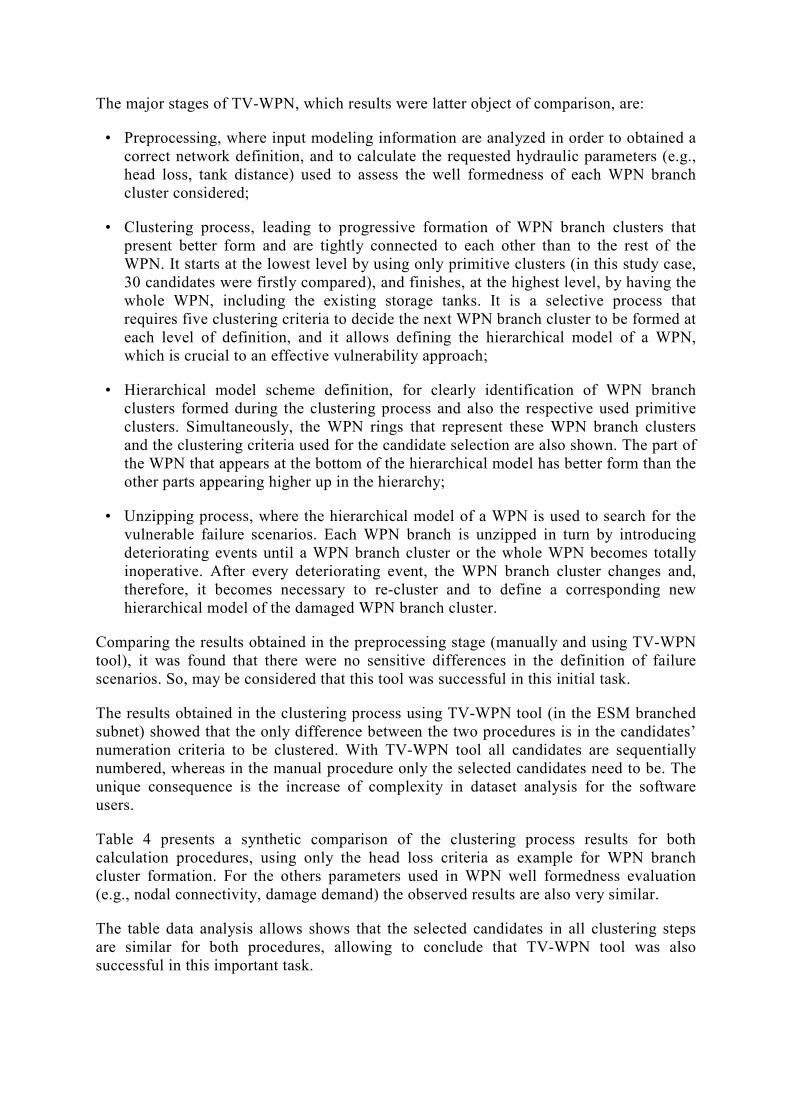
Table 4 presents a synthetic comparison of the clustering process results for both calculation procedures, using only the head loss criteria as example for WPN branch cluster formation. For the others parameters used in WPN well formedness evaluation (e.g., nodal connectivity, damage demand) the observed results are also very similar.
The table data analysis allows shows that the selected candidates in all clustering steps are similar for both procedures, allowing to conclude that TV-WPN tool was also successful in this important task.
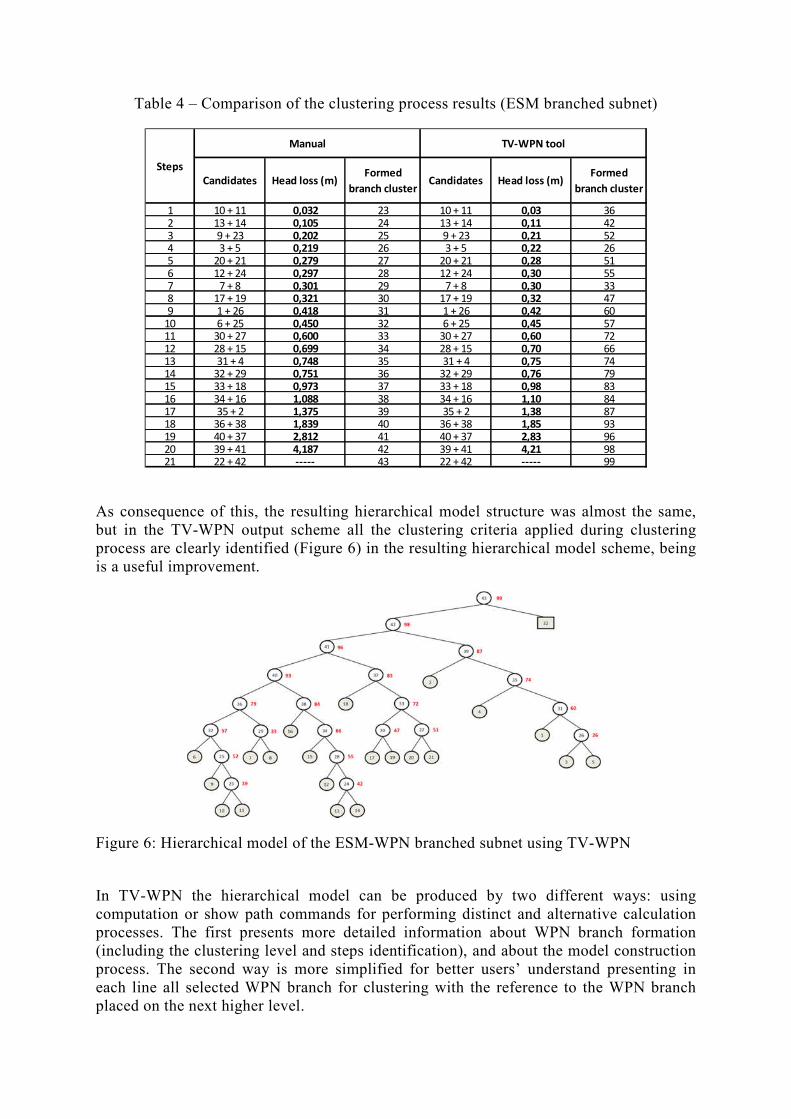
Table 4 – Comparison of the clustering process results (ESM branched subnet)
As consequence of this, the resulting hierarchical model structure was almost the same, but in the TV-WPN output scheme all the clustering criteria applied during clustering process are clearly identified (Figure 6) in the resulting hierarchical model scheme, being is a useful improvement.
Figure 6: Hierarchical model of the ESM-WPN branched subnet using TV-WPN
In TV-WPN the hierarchical model can be produced by two different ways: using computation or show path commands for performing distinct and alternative calculation processes. The first presents more detailed information about WPN branch formation (including the clustering level and steps identification), and about the model construction process. The second way is more simplified for better users’ understand presenting in each line all selected WPN branch for clustering with the reference to the WPN branch placed on the next higher level.
1 10 + 11 0,032 23 10 + 11 0,03 362 13 + 14 0,105 24 13 + 14 0,11 423 9 + 23 0,202 25 9 + 23 0,21 524 3 + 5 0,219 26 3 + 5 0,22 265 20 + 21 0,279 27 20 + 21 0,28 516 12 + 24 0,297 28 12 + 24 0,30 557 7 + 8 0,301 29 7 + 8 0,30 338 17 + 19 0,321 30 17 + 19 0,32 479 1 + 26 0,418 31 1 + 26 0,42 60
10 6 + 25 0,450 32 6 + 25 0,45 5711 30 + 27 0,600 33 30 + 27 0,60 7212 28 + 15 0,699 34 28 + 15 0,70 6613 31 + 4 0,748 35 31 + 4 0,75 7414 32 + 29 0,751 36 32 + 29 0,76 7915 33 + 18 0,973 37 33 + 18 0,98 8316 34 + 16 1,088 38 34 + 16 1,10 8417 35 + 2 1,375 39 35 + 2 1,38 8718 36 + 38 1,839 40 36 + 38 1,85 9319 40 + 37 2,812 41 40 + 37 2,83 9620 39 + 41 4,187 42 39 + 41 4,21 9821 22 + 42 ----- 43 22 + 42 ----- 99
StepsCandidates
Manual TV-WPN tool
Head loss (m)Formed
branch clusterCandidates Head loss (m)
Formed
branch cluster

The particularity of this representation (Figure 6) is the sequence of WPN branch, which is held by individual branches of the hierarchical model, allowing to focus on one specific leg that is all decomposed, and then moves to the next leg and so on until the last.
Although ESM branched subnet is a small network (with only 21 sections), it led to forming a hierarchical model with 9 levels, already presenting a considerable degree of complexity. If it was applied to the whole supply system, the complexity and extent of that increase exponentially and could become almost impossible to interpret and analyze.
In TV-WPN tool, unzipping process is performed considering the WPN branch clusters, created and selected during the initial clustering process, as autonomous branch clusters. Thus, it held a new clustering processes and builds new hierarchical models for each of these new WPN branch cluster. Then, the respective failure scenarios are defined and new vulnerability parameters are computed, making the break-up of these new hierarchical models. Despite being a different method that one performed in manual calculation, it does not lead to any change in final results.
Table 5 presents a synthesis of the results, related with failure scenarios identified and vulnerability parameters values using both calculation methods, for easier comparison. It appears that the obtained results (from both methods) do not match in full.
Table 5 – Comparison of the unzipping process results and the obtained vulnerability parameters (ESM branched subnet)
Comparing the failure scenarios resulting from unzipping process, it is confirmed that the results obtained with TV-WPN are valid, because all found failure scenarios are identical. On the contrary, regarding the values of vulnerability parameters, the results no longer coincide in most cases, deserving a deeper analysis. The reason for these disparities may lie in the fact that TV-WPN tool evaluates the separateness based only on the unzipped WPN branch cluster instead of the whole WPN.
43 1 1,00 0,048 21,00 99 ---- ---- ---- ----42 1 1,00 0,048 21,00 98 1 1,00 0,048 21,0041 6-9 0,67 0,095 7,05 96 6-9 0,67 0,095 7,0640 6-9 0,67 0,095 7,05 93 6-9 0,44 0,095 4,6239 1 1,00 0,048 21,00 87 1 0,33 0,048 6,8938 15-12 0,49 0,095 5,17 84 15-12 0,26 0,095 2,7337 17 0,23 0,048 4,88 83 17 0,23 0,048 4,8836 6-9 0,67 0,095 7,05 79 6-9 0,18 0,095 1,8935 1 1,00 0,048 21,00 74 1 0,18 0,048 3,7334 15-12 0,49 0,095 5,17 66 15-12 0,17 0,095 1,7533 17 0,23 0,048 4,88 72 17 0,14 0,048 3,0032 6-9 0,67 0,095 7,05 57 6-9 0,11 0,095 1,1331 1 1,00 0,048 21,00 60 1 0,10 0,048 2,0730 17 0,23 0,048 4,88 47 17 0,08 0,048 1,6029 7-8 0,07 0,095 0,75 33 7-8 0,07 0,095 0,7628 12 0,07 0,048 1,49 55 12 0,07 0,048 1,4927 20-21 0,07 0,095 0,70 51 20-21 0,07 0,095 0,7026 3 0,80 0,048 16,85 26 3 0,05 0,048 1,0925 9 0,54 0,048 11,35 52 9 0,05 0,048 1,0224 13-14 0,03 0,095 0,26 42 13-14 0,03 0,095 0,2623 11-10 0,50 0,095 5,25 36 11-10 0,01 0,095 0,08
Manual
WPN branch
cluster
Failure
scenario
Damage
demand
TV-WPN
Failure
scenarioSeparateness
Damage
demand
Vulnerability
indexSeparateness
Vulnerability
index
WPN branch
cluster

The TV-WPN tool results concerning damage demand values are also similar with the one obtained in the manual calculation, validating again its successful application to ESM-WPN branched subnet. Being the WPN vulnerably index calculation based on other two parameters (separateness and damage demand), any disparities in the values of these variables (as with the separateness values) necessarily imply changes in this index values, as noted in the last table.
The display mode used by TV-WPN tool to describe unzipping process, unlike previous processes, is quite suitable and perceptible, as it allows the user to analyze each step during the process without necessity to expand all others WPN branch clusters.
Finally, the display of final results, essential for the user, since it is where there are the failure scenarios found and respective vulnerability parameters, it is quite clear and friendly, allowing the user to observe and analyze all scenarios, and define the most critical and/or more relevant for its personal analysis.
4. CONCLUSIONS
In this case study, the high length of the pipeline from the central reservoir to the remotest distribution sites, associated with low velocities observed in many of the edge pipes lead to water residence times too high, which promote the development of biofilms of microorganisms (possibly chlorine-resistant) over the walls of the pipes. This undesirables hydraulic conditions may even compromising drinking water quality, and endanger the users’ health.
It was concluded that the frequent presence of pipelines with very low flow velocities (due to the imposition of regulatory minimum diameters) can compromise the successful application of this software to real water distribution networks, namely in rural areas where flow rates are excessively low and non-regulatory. To overcome this difficulty we recommend the sectorization of the whole network in order to enable the application of TV-WPN tool, as made, in this work, to the studied ESM-WPN branched subnet.
Some differences noted between the results of manual calculation and TV-WPN computing obtained for this real network, namely in calculation of some vulnerability parameters, recommend an improvement of this informatics tool in processing some of the TV concepts and stages, as well as, in its graphics capabilities. Future TV-WPN tool versions should continue to be tested in real water supply systems, with distinct layout and hydraulic conditions.
The TV-WPN software has a great potential to become an important asset management tool, especially if integrated into decision support systems (DDS) by water supply utilities. Your ability to predict and detect the most vulnerable areas and its susceptibly to different failure scenarios, during network life cycle, make it a tool of undeniable interest and usefulness in the design, construction, operational control and rehabilitation of water supply systems.

REFERENCES Argawal J, Blockley D I, Woodman N J, Vulnerability of Systems, Civil Engineering & Environmental Systems, Vol. 18, 141-165, 2001.
Bentes I, Afonso L, Varum H, Pinto J, Varajão J, Duarte A, Agarwal J, A New Tool to Assess Water Pipe Networks Vulnerability and Robustness, Engineering Failure Analysis, 18, 7, 1637 – 1644, 2011.
Hashimoto M, Vulnerability and Reliability of Structural Systems, PhD Thesis, University of Bristol, UK, 1994.
Lu Z, Strutural Vulnerability Analysis, PhD thesis, University of Bristol, UK, 1998.
Pinto J T, Blokley D I, Woodman, N J, The Risk of Vulnerable Failure, Structural Safety Journal, 24, 107-122, 2002.
Pinto J, Varum H, Bentes I, Agarwal J, A Theory of Vulnerability of Water Pipe Network (TVWPN), Water Resources Management, 24, 15: 4237 – 4254, 2010 a).
Pinto J, Afonso L, Varajão J, Bentes I, Varum H, Duarte, A. Agarwal J, Contribution for the Vulnerability Assessment of Water Pipe Network Systems, WSEAS Transactions on Fluid Mechanics, 5 (3), 236-245, 2010 b).
Pinto J, Varajão J, Varum H, Duarte A, Bentes I, Sistemas de abastecimento de água – Avaliação da vulnerabilidade, Recursos Hídricos, ed. Associação Portuguesa dos Recursos Hídricos, 31 (2), 61-71, 2010 c).
Pinto J. The Risk of a Vulnerable Scenario, PhD Dissertation, University of Bristol, UK, 2002.
Sousa D, Aplicação da Teoria da Vulnerabilidade a Redes de Abastecimento de Água Reais com Desenvolvimento e Recurso a Programas de Cálculo Automático, Msc Thesis, University of Minho, Portugal, 2014, (in Portuguese).
Varajão J, Rodrigues T, Duarte A, Varum H, Pinto J, Bentes I, TV WPN – Programa de Cálculo Automático para Análise da Vulnerabilidade de Redes de Abastecimento de Água, Águas & Resíduos, 1, 45 – 55, 2012.
Wu X, Blocley D, Woodman N, Vulnerability Analysis of Structural Systems, Part I: Rings and Clusters, Part II: Failure Scenarios, Journal Civil Engineering Systems, 10, 301-333, 1993.
Yu Y, Analysis of Structural Vulnerability, PhD Thesis, University of Bristol, UK, 1997.