saeedian, meysam; pournazarian, bahram; seyedalipour, s
TRANSCRIPT

This is an electronic reprint of the original article.This reprint may differ from the original in pagination and typographic detail.
Powered by TCPDF (www.tcpdf.org)
This material is protected by copyright and other intellectual property rights, and duplication or sale of all or part of any of the repository collections is not permitted, except that material may be duplicated by you for your research use or educational purposes in electronic or print form. You must obtain permission for any other use. Electronic or print copies may not be offered, whether for sale or otherwise to anyone who is not an authorised user.
Saeedian, Meysam; Pournazarian, Bahram; Seyedalipour, S. Sajjad; Eskandari, Bahman;Pouresmaeil, EdrisEmulating Rotational Inertia of Synchronous Machines by a New Control Technique in Grid-Interactive Converters
Published in:Sustainability
DOI:10.3390/su12135346
Published: 01/01/2020
Document VersionPublisher's PDF, also known as Version of record
Published under the following license:CC BY
Please cite the original version:Saeedian, M., Pournazarian, B., Seyedalipour, S. S., Eskandari, B., & Pouresmaeil, E. (2020). EmulatingRotational Inertia of Synchronous Machines by a New Control Technique in Grid-Interactive Converters.Sustainability , 12(13), [5346]. https://doi.org/10.3390/su12135346

sustainability
Article
Emulating Rotational Inertia of SynchronousMachines by a New Control Technique inGrid-Interactive Converters
Meysam Saeedian 1 , Bahram Pournazarian 1, S. Sajjad Seyedalipour 2 , Bahman Eskandari 1
and Edris Pouresmaeil 1,*1 Department of Electrical Engineering and Automation (EEA), Aalto University, 02150 Espoo, Finland;
[email protected] (M.S.); [email protected] (B.P.); [email protected] (B.E.)2 Faculty of Electrical Engineering, K. N. Toosi University of Technology, Tehran 19697-64499, Iran;
[email protected]* Correspondence: [email protected]
Received: 20 May 2020; Accepted: 29 June 2020; Published: 1 July 2020
Abstract: Integration of renewable energy sources (RESs) into power systems is growing due toeco-friendly concerns and ever-increasing electricity demand. Voltage source converters (VSCs) arethe main interface between RESs and power grids, which have neither rotational inertia nor dampingcharacteristics. Lack of these metrics make the power grid sensitive to frequency disturbances andthereby under frequency, to load shedding activation or even large-scale collapse. In this regard,the contribution of this paper is to develop a new control technique for VSCs that can provide virtualinertia and damping properties with the DC-link capacitors inhered in the DC-side of grid-tied VSCs.The applied VSC is controlled in the current controlled model, with the capability of injecting extraactive power with the aim of frequency support during perturbations. The dynamics assessmentof the proposed platform is derived in detail. It is revealed that the control scheme performs in astable region even under weak-grid conditions. Finally, simulations are conducted in MATLAB todepict the efficacy and feasibility of the proposed method. The results show that frequency deviationis mitigated under step up/down changes in the demand, and the rate of change of frequency isimproved by 47.37% compared to the case in which the synthetic inertia loop is canceled out.
Keywords: synthetic inertia; frequency stability; virtual synchronous machine; grid-connectedvoltage source converter
1. Introduction
In conventional power grids, the major portion of electricity demand is generated by synchronousgenerators (SGs), which have inherent rotational inertia and damping properties. During majordisturbances (typically loss of generating unit or stochastic demand fluctuation), primary and secondarycontrols are triggered to maintain stable system frequency and restore power balance [1]. The kineticenergy preserved in the rotational mass of the SGs is highly important in the primary control,which imposes a limit on the frequency oscillations and slows down frequency dynamics [2,3].Lack of this energy in low-inertia grids might lead to undesirable situations such as pole slippingand catastrophic failure of SGs under frequency load shedding activation or even cascading failureafter perturbation. The power system can be more vulnerable to these problems under high levelsof renewable energy sources (RESs) penetration [4,5]. In other words, the power electronics-basedgenerators have no rotational inertia and damping characteristics. The frequency regulation adequacyis assessed by two more cited metrics: (1) frequency nadir or the minimum frequency reached followinga disturbance and (2) rate of change of frequency [3]. The overall grid inertia is the main factor affecting
Sustainability 2020, 12, 5346; doi:10.3390/su12135346 www.mdpi.com/journal/sustainability

Sustainability 2020, 12, 5346 2 of 14
the aforesaid indices, i.e., the more inertia, the better primary frequency regulation [6]. On the otherhand, the diminution of grid inertia limits further increase in RESs integration. To address this issue,grid-connected converters, such as the interface between RESs and power systems, must be equippedwith grid supportive functionalities defined by new grid codes [7,8].
Intensive research has been conducted on the control of grid-tied converters with respect tothe aforementioned concerns [9–22]. Changing the requirements of rate of change of frequency(RoCoF) withstand capabilities of SGs is a straightforward solution that has been accepted as anefficient approach by system operators in Ireland [9]. However, the inertia concern is not solvedin this method and the cost increment with regard to generator testing might bind its applications.Employing backup SGs with partial loading (i.e., spinning reserve) or synchronous condensers toprovide more rotating masses is another possible solution for inertia augmentation [10]. Nevertheless,these approaches yield high capital and operating cost. Motivated by conventional SG dynamics,the concept of providing synthetic inertia using virtual synchronous generators (VSGs) VSGs wasintroduced in 2007 [11]. This method emulates the inertial response of real SGs by the grid-connectedvoltage source converters (VSCs) through a control technique, resulting in fast frequency supportduring contingencies. Since then, similar concepts, named synchronverter and inducverter, have beendeveloped, on which detailed information can be found in [12,13]. Additionally, [14] improved thepower quality and grid stability of distributed generation using VISMA. This technique aims toset up static and dynamic characteristics of SGs on the three-phase hysteresis controlled inverters.Similar to conventional generators, wind turbines enjoy a considerable amount of kinetic energypreserved in their blades. However, a variable speed wind turbine generator (e.g., doubly-fed inductiongenerator or permanent magnet synchronous generator) does not naturally contribute to the gridinertia due to the converter interface [15]. Various control mechanisms have been introduced toenable wind turbines to provide inertia support. For example, an enhanced control technique isproposed in [16] that adjusts the turbine torque set point as a function of the frequency deviation∆f and the RoCoF, enabling wind generator to emulate inertia. Employing energy storage systems(ESS) ESSs such as supercapacitors and battery banks on the DC-side of VSCs and proportionallinking their active power references with the frequency oscillations is another emerging methodof enhancing inertial response in power systems [17,18]. These approaches can provide sufficientinertia and damping properties for fast restoring power balance in the grid. The research work in [19]designed a high-performance battery converter system for providing virtual inertia at the distributednetwork level in which the grid frequency is measured to derive design criteria for the control system.The frequency derivative-based (df/dt) method is the other technique of inertia emulation by VSCs.Nonetheless, the research conducted in [20] shows that df/dt-based synthetic inertia emulation caninduce instability into two modes of the system, one associated with the output filter and the other onewith the inner current control loop. In [21], the authors developed a new technique of emulating virtualinertia through the DC-link capacitors adhered to the DC-side of grid-tied converters. The concernswith respect to this approach are instability problems due to applying df/dt based inertia emulationand the limitation of its responsiveness [20,22].
The main contribution of this work to the research field is summarized as follows: we develop anew control technique for the provision of synthetic inertia support through grid-tied voltage sourceconverters employed in the power grids dominated by RESs. The proposed platform comprises twomain control loops, i.e., an inner current loop and outer voltage loop equipped with a new syntheticinertia control. The synchronous reference frame transformation introduced by the phase-locked loop(PLL) dynamics is also included in the control system for the required compensation. It is noteworthythat the DC-link capacitance is applied as the energy buffer for grid inertia augmentation. With theproposed control scheme, (1) the system stability margin and (2) the inertial response of the converterare improved compared to the method in [21].
The rest of this paper is organized as follows. Following Section 1, a brief analysis of inertialresponse in the real SGs is presented in Section 2. Then, a detailed model of the proposed VSC

Sustainability 2020, 12, 5346 3 of 14
controller is derived in Section 3. The stable operation of the system is revealed in Section 4 by derivingclosed-loop transfer functions of the system and bode analyses. Furthermore, Section 4 includes thecomparison of the proposed method with [21] in terms of system stability margin. Section 5 providessimulations to depict the efficacy of the system under step up/down changes in the demand. The resultsdemonstrate that the proposed controller enhances the RoCoF metric by 47.37% and 23.1% comparedto the conventional VSC system and [21], respectively. The paper ends with the conclusion presentedin Section 6.
2. Inertial Response of Synchronous Machines
It is known that the stability of a power system can be analyzed by the swing equation [1]describing the power imbalance between input mechanical power and electromagnetic power followinga contingency. Thereby, the equation of motion is represented by:
Pm − Pe −D(ω−ωr) = Jωdωdt≈ Jωr
dωdt
. (1)
Note that in (1), it is assumed that the pole pairs of SG is one. During steady state operation,(1) can be rewritten as:
ω = ωno −m Pe
ωno = ωr + m Pm(2)
in which m = 1/D is synonymous with the droop coefficient. It is clear that the primary motionequation-based control is the developed version of simple droop control [23]. After a disturbance,the small-signal model of (1) in terms of inertia constant (H = Jωr
2/2VAbase) is represented by [24]:
∆Ppum − ∆Ppu
e −D∆ωpu = 2Hd∆ωpu
dt. (3)
The frequency control diagram of a real SG is illustrated in Figure 1, and the correspondingparameters are defined in Table 1. Since only the primary frequency regulation and inertial responseare of interest in this work, the automatic generation control signal (∆PAGC
pu) is neglected. To analyzethe effect of rotational inertia on the system frequency response, the transfer function of frequencydeviation (∆ω) over the load disturbance (∆Pe) is derived as (4).
TF∆ω/∆Pe(s) =∆ω(s)∆Pe(s)
=−R(1 + sTG)(1 + sTCH)(1 + sTRH)
(D + 2Hs)(1 + sTG)(1 + sTCH)(1 + sTRH)R + sFHPTRH + 1. (4)
Sustainability 2020, 12, x FOR PEER REVIEW 3 of 15
controller is derived in Section 3. The stable operation of the system is revealed in Section 4 byderiving closed-loop transfer functions of the system and bode analyses. Furthermore, Section 4 includes the comparison of the proposed method with [21] in terms of system stability margin. Section 5 provides simulations to depict the efficacy of the system under step up/down changes in the demand. The results demonstrate that the proposed controller enhances the RoCoF metric by 47.37% and 23.1% compared to the conventional VSC system and [21], respectively. The paper ends with the conclusion presented in Section 6.
2. Inertial Response of Synchronous Machines
It is known that the stability of a power system can be analyzed by the swing equation [1] describing the power imbalance between input mechanical power and electromagnetic power following a contingency. Thereby, the equation of motion is represented by:
( ) .m e r rd dP P D J Jdt dtω ωω ω ω ω− − − = ≈ (1)
Note that in (1), it is assumed that the pole pairs of SG is one. During steady state operation, (1) can be rewritten as:
no m
no e
r
mm
PPω
ωω
ω=
−+
=(2)
in which m = 1/D is synonymous with the droop coefficient. It is clear that the primary motion equation-based control is the developed version of simple droop control [23]. After a disturbance, the small-signal model of (1) in terms of inertia constant (H = Jωr2/2VAbase) is represented by [24]:
2 .pu
pu pu pum e
dP P D Hdtωω ΔΔ − Δ − Δ = (3)
The frequency control diagram of a real SG is illustrated in Figure 1, and the correspondingparameters are defined in Table 1. Since only the primary frequency regulation and inertial response are of interest in this work, the automatic generation control signal (∆PAGCpu) is neglected. To analyze the effect of rotational inertia on the system frequency response, the transfer function of frequency deviation (∆ω) over the load disturbance (∆Pe) is derived as (4).
( ) ( )( )
( )( )( )( )( )( )( )/
1 1 1.
2 1 1 1 1G CH RH
Pee G CH RH HP RH
s R sT sT sTTF s
P s D Hs sT sT sT R sF Tω
ωΔ Δ
Δ − + + += =
Δ + + + + + + (4)
1/R
∆PAGCpu
+ -1
1+sTG
1+sFHPTRH(1+sTCH)(1+sTRH) +
-
∆Pepu
∆Pmpu 1
2Hs
D
∆ω pu
-
Governor Turbine Motion Equation
Figure 1. The frequency response control of a synchronous generator (SG).
Table 1. A typical set of the synchronous generator parameters.
Parameter Value Governor time constant (TG) 0.1 s
Inlet volume time constant (TCH) 0.2 s Re-heater time constant (TRH) 7 s
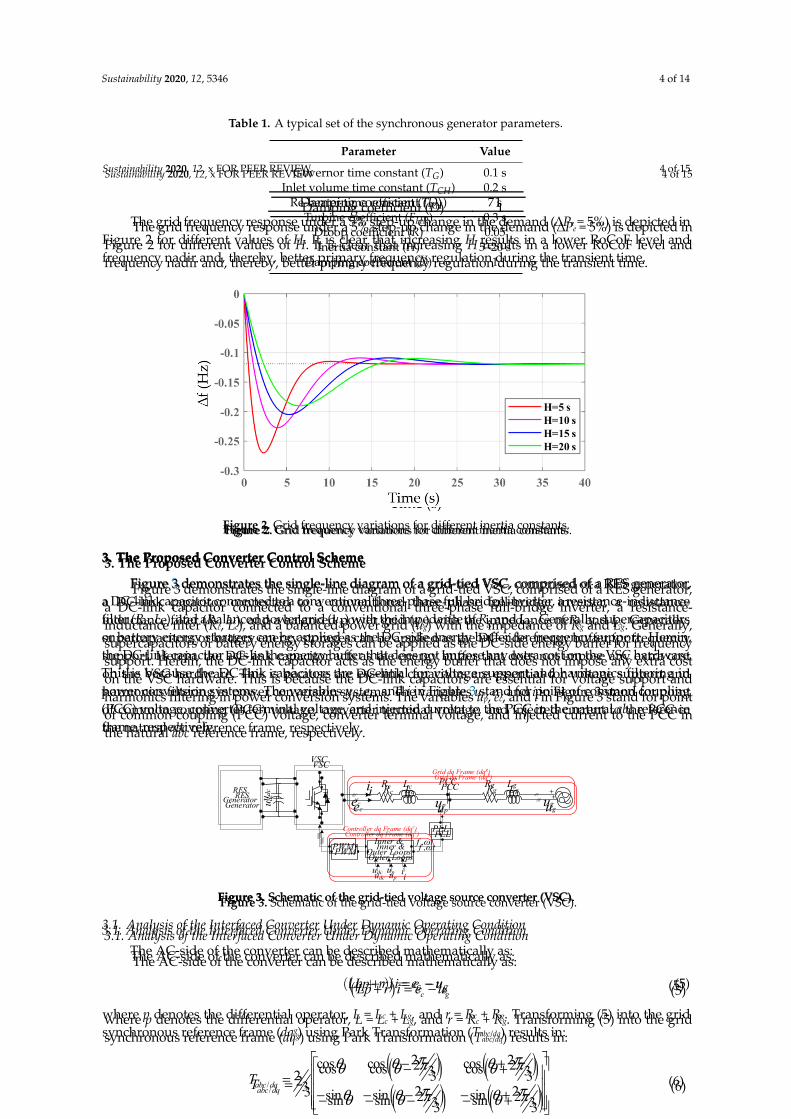
Turbine coefficient (FHP) 0.3 s Droop coefficient (R) 0.05Inertia constant (H) 5–20 s
Figure 1. The frequency response control of a synchronous generator (SG).
The grid frequency response under a 5% step-up change in the demand (∆Pe = 5%) is depictedin Figure 2 for different values of H. It is clear that increasing H results in a lower RoCoF level andfrequency nadir and, thereby, better primary frequency regulation during the transient time.
Sustainability 2020, 12, 5346 4 of 14
Table 1. A typical set of the synchronous generator parameters.
Parameter Value
Governor time constant (TG) 0.1 sInlet volume time constant (TCH) 0.2 s
Re-heater time constant (TRH) 7 sTurbine coefficient (FHP) 0.3 s
Droop coefficient (R) 0.05Inertia constant (H) 5–20 s
Damping coefficient (D) 1
Sustainability 2020, 12, x FOR PEER REVIEW 4 of 15
Damping coefficient (D) 1The grid frequency response under a 5% step-up change in the demand (∆Pe = 5%) is depicted in
Figure 2 for different values of H. It is clear that increasing H results in a lower RoCoF level and frequency nadir and, thereby, better primary frequency regulation during the transient time.
Figure 2. Grid frequency variations for different inertia constants.
3. The Proposed Converter Control Scheme
Figure 3 demonstrates the single-line diagram of a grid-tied VSC, comprised of a RES generator, a DC-link capacitor connected to a conventional three-phase full-bridge inverter, a resistance-inductance filter (Rc, Lc), and a balanced power grid (ug) with the impedance of Rg and Lg. Generally, supercapacitors or battery energy storages can be applied as the DC-side energy buffer for frequency support. Herein, the DC-link capacitor acts as the energy buffer that does not impose any extra cost on the VSC hardware. This is because the DC-link capacitors are essential for voltage support and harmonics filtering in power conversion systems. The variables up, ec, and i in Figure 3 stand for point of common coupling (PCC) voltage, converter terminal voltage, and injected current to the PCC in the natural abc reference frame, respectively.
LcRc PCC
ec
+iup
LgRg
ug
VSC
u dc
PWM
PLLf ,ωt
udc iup
Controller dq Frame (dqc)
Grid dq Frame (dqg)
Inner & Outer Loops
RES Generator
Figure 3. Schematic of the grid-tied voltage source converter (VSC).
3.1. Analysis of the Interfaced Converter Under Dynamic Operating Condition
The AC-side of the converter can be described mathematically as:
( ) c gLp r i e u+ = − (5)
where p denotes the differential operator, L = Lc + Lg, and r = Rc + Rg. Transforming (5) into the grid synchronous reference frame (dqg) using Park Transformation (Tabc/dq) results in:
( ) ( )( ) ( )/
2 2cos cos cos3 323 2 2sin sin sin3 3
abc dqTπ πθ θ θ
π πθ θ θ
− + = − − − − +
(6)
Figure 2. Grid frequency variations for different inertia constants.
3. The Proposed Converter Control Scheme
Figure 3 demonstrates the single-line diagram of a grid-tied VSC, comprised of a RES generator,a DC-link capacitor connected to a conventional three-phase full-bridge inverter, a resistance-inductancefilter (Rc, Lc), and a balanced power grid (ug) with the impedance of Rg and Lg. Generally, supercapacitorsor battery energy storages can be applied as the DC-side energy buffer for frequency support. Herein,the DC-link capacitor acts as the energy buffer that does not impose any extra cost on the VSC hardware.This is because the DC-link capacitors are essential for voltage support and harmonics filtering inpower conversion systems. The variables up, ec, and i in Figure 3 stand for point of common coupling(PCC) voltage, converter terminal voltage, and injected current to the PCC in the natural abc referenceframe, respectively.
Sustainability 2020, 12, x FOR PEER REVIEW 4 of 15
Damping coefficient (D) 1 The grid frequency response under a 5% step-up change in the demand (∆Pe = 5%) is depicted in
Figure 2 for different values of H. It is clear that increasing H results in a lower RoCoF level and frequency nadir and, thereby, better primary frequency regulation during the transient time.
Figure 2. Grid frequency variations for different inertia constants.
3. The Proposed Converter Control Scheme
Figure 3 demonstrates the single-line diagram of a grid-tied VSC, comprised of a RES generator, a DC-link capacitor connected to a conventional three-phase full-bridge inverter, a resistance-inductance filter (Rc, Lc), and a balanced power grid (ug) with the impedance of Rg and Lg. Generally, supercapacitors or battery energy storages can be applied as the DC-side energy buffer for frequency support. Herein, the DC-link capacitor acts as the energy buffer that does not impose any extra cost on the VSC hardware. This is because the DC-link capacitors are essential for voltage support and harmonics filtering in power conversion systems. The variables up, ec, and i in Figure 3 stand for pointof common coupling (PCC) voltage, converter terminal voltage, and injected current to the PCC in the natural abc reference frame, respectively.
LcRc PCC
ec
+iup
LgRg
ug
VSC
u dc
PWM
PLLf ,ωt
udc iup
Controller dq Frame (dqc)
Grid dq Frame (dqg)
Inner & Outer Loops
RES Generator
Figure 3. Schematic of the grid-tied voltage source converter (VSC).
3.1. Analysis of the Interfaced Converter Under Dynamic Operating Condition
The AC-side of the converter can be described mathematically as:
( ) c gLp r i e u+ = − (5)
where p denotes the differential operator, L = Lc + Lg, and r = Rc + Rg. Transforming (5) into the grid synchronous reference frame (dqg) using Park Transformation (Tabc/dq) results in:
( ) ( )( ) ( )/
2 2cos cos cos3 323 2 2sin sin sin3 3
abc dqTπ πθ θ θ
π πθ θ θ
− + = − − − − +
(6)
Figure 3. Schematic of the grid-tied voltage source converter (VSC).
3.1. Analysis of the Interfaced Converter Under Dynamic Operating Condition
The AC-side of the converter can be described mathematically as:
(Lp + r)i = ec − ug (5)

Sustainability 2020, 12, 5346 5 of 14
where p denotes the differential operator, L = Lc + Lg, and r = Rc + Rg. Transforming (5) into the gridsynchronous reference frame (dqg) using Park Transformation (Tabc/dq) results in:
Tabc/dq =23
cosθ cos(θ− 2π
3
)cos
(θ+ 2π
3
)− sinθ − sin
(θ− 2π
3
)− sin
(θ+ 2π
3
) (6)
id = Gplant(s) ×(ecd − ugd +ωrLiq
)iq = Gplant(s) ×
(ecq − ugq −ωrLid
) (7)
where Gplant(s) is expressed as:
Gplant(s) =1
Ls + r. (8)
The subscripts d and q stand for the d-axis and q-axis components of the corresponding variables.It is clear that the d and q axes are coupled through the terms ωrLid and ωrLiq, which gives rise to thecontrol complexity. Nonetheless, the cross-coupling terms can be eliminated by applying appropriatecurrent feedforward control. The inner current loops (7) are controlled via two separate proportionalintegral (PI) PI controllers (Gi(s) = kcp + kci/s) since the dq variables are constant in the synchronousreference frame.
Ignoring power losses in the converter, the output current of the VSC can be translated into theDC-link capacitor voltage (udc) by:
G1(s) =udc(s)id(s)
=−3Upd
2Udc,re f C s. (9)
The voltage udc reaches its reference by controlling the d-axis current through a PI controller(Gu(s) = −kup − kui/s), which forms the outer control loop. The time-delay introduced by the pulse-widthmodulation (PWM) PWM updates and reference computations can be approximately modeled using afirst-order function Gd(s) in which fs denotes the sampling frequency [25].
Gd(s) =1
1 +(
1.5fs
)s
. (10)
3.2. Dynamic Analysis of the Phase-Locked Loop
The synchronization of the VSC with the network is obtained using a PLL. Due to the operation ofthe PLL, the system shown in Figure 3 comprises two separate dq frames: dqg frame correspondingto the grid and dqc frame corresponding to the VSC controller. In steady state operating conditions,the controller dq frame is aligned with the grid dq frame. When a small contingency occurs in thesystem, the two frames are no longer aligned due to the dynamics of the PLL. It means that the dqc
frame lags ∆θ as demonstrated in Figure 4a.
Sustainability 2020, 12, x FOR PEER REVIEW 5 of 15
( ) ( )d plant cd gd r qi G s e u Liω= × − + ( ) ( )q plant cq gq r di G s e u Liω= × − −
(7)
where Gplant(s) is expressed as:
( ) 1 .plantG sLs r
=+
(8)
The subscripts d and q stand for the d-axis and q-axis components of the corresponding variables. It is clear that the d and q axes are coupled through the terms ωrLid and ωrLiq, which gives rise to the control complexity. Nonetheless, the cross-coupling terms can be eliminated by applying appropriate current feedforward control. The inner current loops (7) are controlled via two separate proportional integral (PI) PI controllers (Gi(s) = kcp + kci/s) since the dq variables are constant in the synchronous reference frame.
Ignoring power losses in the converter, the output current of the VSC can be translated into the DC-link capacitor voltage (udc) by:
( ) ( )( )1
,
3.
2pddc
d dc ref
Uu sG s
i s U C s−
= = (9)
The voltage udc reaches its reference by controlling the d-axis current through a PI controller (Gu(s) = −kup-kui/s), which forms the outer control loop. The time-delay introduced by the pulse-width modulation (PWM) PWM updates and reference computations can be approximately modeled using a first-order function Gd(s) in which fs denotes the sampling frequency [25].
( ) 1 .1.51
d
s
G ssf
= +
(10)
3.2. Dynamic Analysis of the Phase-Locked Loop
The synchronization of the VSC with the network is obtained using a PLL. Due to the operation of the PLL, the system shown in Figure 3 comprises two separate dq frames: dqg frame corresponding to the grid and dqc frame corresponding to the VSC controller. In steady state operating conditions, the controller dq frame is aligned with the grid dq frame. When a small contingency occurs in the system, the two frames are no longer aligned due to the dynamics of the PLL. It means that the dqc frame lags ∆θ as demonstrated in Figure 4a.
d g
qg
d c
qc
∆θ
(a)
T∆θ kppll+kipll/s
updg
upqg upq
c
updc
∆ ω 1/s∆θ
(b)
Figure 4. (a) The grid and controller SRFs, (b) SRF-PLL model.
The averaged model of the synchronous reference frame PLL (SRF-PLL) is shown in Figure 4b, in which the PCC voltage vector in the dqg frame is rotated to the dqc frame using matrix T∆θ for feedback control purpose [26]. During steady state operation, we can conclude (12):
( ) ( )( ) ( )
cos sinsin cos
T θ
θ θθ θΔ
Δ Δ =
− Δ Δ (11)
Figure 4. (a) The grid and controller SRFs, (b) SRF-PLL model.

Sustainability 2020, 12, 5346 6 of 14
The averaged model of the synchronous reference frame PLL (SRF-PLL) is shown in Figure 4b,in which the PCC voltage vector in the dqg frame is rotated to the dqc frame using matrix T∆θ forfeedback control purpose [26]. During steady state operation, we can conclude (12):
T∆θ =
[cos(∆θ) sin(∆θ)− sin(∆θ) cos(∆θ)
](11)
ugp = uc
p (12)
where the vectors upg and up
c denote the PCC voltage in the grid frame and the controller frame,respectively. Equation (12) points out that the angle difference (∆θ) between PCC voltage vectors inthe two frames is zero. Using matrix T∆θ, (12) can be rewritten as: uc
pduc
pq
= [cos(0) sin(0)− sin(0) cos(0)
]×
ugpd
ugpq
. (13)
A disturbance in the grid leads to small signal deviations in the PCC voltage vector. Then, (13) canbe rewritten as: Uc
pd + ucpd
Ucpq + uc
pq
= [cos(0 + ∆θ) sin(0 + ∆θ)− sin(0 + ∆θ) cos(0 + ∆θ)
]×
Ugpd + ug
pdUg
pq + ugpq
. (14)
By simplifying trigonometric functions and ignoring the steady state values, the connectionbetween PCC voltage vectors in the dqc and dqg frames can be expressed as: Uc
pd + ucpd
Ucpq + uc
pq
≈ [1 ∆θ−∆θ 1
]×
Ugpd + ug
pdUg
pq + ugpq
ucpd
ucpq
≈ ug
pd + Ugpq∆θ
−Ugpd∆θ+ ug
pq
. (15)
From Figure 4b, ∆θ is obtained as:
∆θ = ucpq ×
(kppll +
kipll
s
)×
1s
. (16)
Substituting (16) into (15) results in the relationship between ∆θ and ugpq as:
TFPLL =∆θ
ugpq
=kpplls + kipll
s2 + Ugpdkpplls + Ug
pdkipll. (17)
Because in the synchronous reference frame Ugpq = 0 and assuming the VSC is operating in the
unity power factor, (15) can be further simplified to (18) as follows: ucpd
ucpq
≈ 0−Ug
pd∆θ+ Id∆θ
. (18)
From (18), we can conclude that the dynamics introduced by the operation of the PLL duringperturbations add −Ug
pd·∆θ and + Id·∆θ terms in the q-axis control loop, as depicted in Figure 5.On the other hand, due to the coupling between two axes, any variations in ∆θ leads to the changes inid (this correlation is elaborated in Section 4).

Sustainability 2020, 12, 5346 7 of 14Sustainability 2020, 12, x FOR PEER REVIEW 7 of 15
id
ugd
-ωrLiq
+
-Gi Gplant
ecd Udc,ref+Gd
+id,refGu
G1
+-
iq
ugq
-+
ωrLid
-
-Gi Gplantecq +
+
Upd-
TFPLL
Gd
LcL
+
+
iq,ref
LgL
+
Id
∆θ upq
+
s
∆ω
sHp
1+sTjDp
+
+∆ui
∆udc
udc
G2(s)
Figure 5. The d-q control loops augmented with the frequency support controller.
3.3. Fast Grid Frequency Support
The imbalance between generation and demand following a contingency would cause the frequency to fall/rise at a rate determined by the total grid inertia. The less inertia, the faster and higher frequency deviations. Various methodologies for providing synthetic inertia have been reported, which further information can be found in [27]. A promising technique recommended in [21], in which the frequency support is conducted by means of regulating the DC-link capacitor voltage. This method is based on a basic proportional controller that bounds its responsiveness [22]. Herein, this problem is fixed using a supplementary controller composed of a frequency-time derivative (df/dt) term (aimed at mitigation of the RoCoF) with a scheduled active power injection and delivery time Tj. The time delay Tj in discharging the DC-link capacitor is analogous to gradually releasing the kinetic energy of rotational SGs. The controller is added to the outer voltage loop during the initial support period. The proposed technique is described mathematically as:
( ) ( )1
pi p r
j
H su s D
sTω
ω ω= − ++
(19)
where Hp and Dp emulate the inertia and damping characteristics of the real SGs, respectively. A disturbance in the power system results in a small deviation in the variables around their steady state values. Thus, the corresponding small-signal model of the synthetic inertia loop can be derived by canceling the steady state values of (19) as:
( )
( ) ( )( )2
1
.1
pi p
j
pip
j
H su s D
sT
H su sG s D
s sT
ωω
ω
ΔΔ = Δ +
+
Δ= = +
Δ +
(20)
It is noteworthy that ∆ui = 0 during steady state operation of the system. Indeed, the frequency support level is limited by the maximum acceptable DC-link voltage deviations in the foregoing method. This is because udc must be kept in an acceptable range for linear modulation of the converter and limiting current flow through components of the conversion system. Thereby, the d-q control loops augmented with the frequency support controller are formed as Figure 5.
Figure 5. The d-q control loops augmented with the frequency support controller.
3.3. Fast Grid Frequency Support
The imbalance between generation and demand following a contingency would cause thefrequency to fall/rise at a rate determined by the total grid inertia. The less inertia, the faster andhigher frequency deviations. Various methodologies for providing synthetic inertia have been reported,which further information can be found in [27]. A promising technique recommended in [21], in whichthe frequency support is conducted by means of regulating the DC-link capacitor voltage. This methodis based on a basic proportional controller that bounds its responsiveness [22]. Herein, this problem isfixed using a supplementary controller composed of a frequency-time derivative (df /dt) term (aimed atmitigation of the RoCoF) with a scheduled active power injection and delivery time Tj. The timedelay Tj in discharging the DC-link capacitor is analogous to gradually releasing the kinetic energyof rotational SGs. The controller is added to the outer voltage loop during the initial support period.The proposed technique is described mathematically as:
ui(s) = Dp(ω−ωr) +Hpsω
1 + sT j(19)
where Hp and Dp emulate the inertia and damping characteristics of the real SGs, respectively.A disturbance in the power system results in a small deviation in the variables around their steadystate values. Thus, the corresponding small-signal model of the synthetic inertia loop can be derivedby canceling the steady state values of (19) as:
∆ui(s) = Dp∆ω+Hps∆ω1+sT j
G2(s) =∆ui(s)∆ω(s) = Dp +
Hps1+sT j
.(20)
It is noteworthy that ∆ui = 0 during steady state operation of the system. Indeed, the frequencysupport level is limited by the maximum acceptable DC-link voltage deviations in the foregoingmethod. This is because udc must be kept in an acceptable range for linear modulation of the converterand limiting current flow through components of the conversion system. Thereby, the d-q control loopsaugmented with the frequency support controller are formed as Figure 5.

Sustainability 2020, 12, 5346 8 of 14
4. Dynamics Assessment of the Proposed Control Technique
To validate the effectiveness of the proposed control system, it is necessary to analyze the stabilityof the control loops. According to Figure 5, the closed-loop transfer functions of inner current loopscorresponding to the d-q axes can be obtained as (21) and (22).
TFid(s) =id(s)
id,re f (s)=
Gi(s) Gd(s) Gplant(s)
1 + Gi(s) Gd(s) Gplant(s)(21)
TFiq(s) =iq(s)
iq,re f (s)=
L Gi(s) Gd(s) Gplant(s)L+Lg Upd Gd(s) TFPLL(s)−Lg Id Gi(s) Gd(s) TFPLL(s)+L Gi(s) Gd(s) Gplant(s)
. (22)
Because of the coupling between the d-q axes, there is a correlation between ∆θ and id,which produces an effect on the outer voltage controller by the synthetic inertia loop. This relationshipis visible in Figure 5. Hence, the transfer function between ∆θ and id is derived as (23).
TF∆θ/id(s) =∆θ(s)id(s)
=ωr Lg L Gi(s) Gd(s) Gplant(s) TFPLL(s)
L+Lg Upd Gd(s) TFPLL(s)−Lg Id Gi(s) Gd(s) TFPLL(s)+L Gi(s) Gd(s) Gplant(s). (23)
In addition, the frequency support can be provided by incorporating the angular frequencydeviations (∆ω) into the DC-link voltage regulator. Mathematically, ∆ω is equivalent to thetime-derivative of ∆θ, as illustrated in Figure 4b. Thereby, the transfer function between ∆ui and id isderived as:
TF∆ui/id(s) =∆ui(s)∆ω(s)
×∆ω(s)∆θ(s)
×∆θ(s)id(s)
= s G2(s) TF∆θ/id(s) . (24)
According to Figure 5, the transfer function between ∆ui and id can be considered in parallel withG1. This is because the two corresponding paths start with id and reach the identical summer. It meansthat the dynamics caused by the PLL in the q-axis are reflected in the d-axis by means of the virtualinertia loop. Then, the function that appeared in the feedback path is formed as follows:
G2(s) = G1(s) − TF∆ui/id(s). (25)
Finally, the open-loop and closed-loop transfer functions of the proposed control system arederived as follows, respectively:
(TFudc/∆udc)ol =udc(s)
∆udc(s)= Gu(s) TFid(s) G2(s) (26)
(TFudc/∆udc)cl =udc(s)Udc(s)
=Gu(s) TFid(s) G1(s)
1 + Gu(s) TFid(s) G1(s)(1− TF∆ui/id(s)
G1(s)
) . (27)
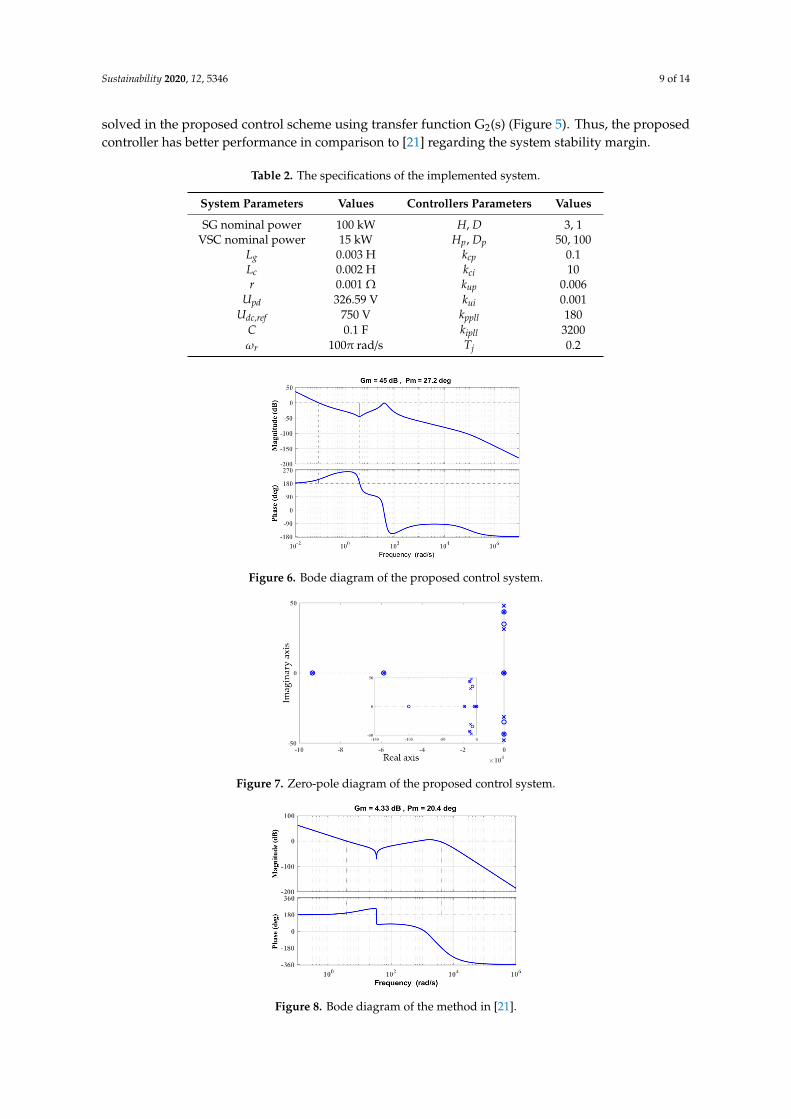
The stability of the system is investigated by bode diagram and zero-pole map analyses. Figure 6depicts the bode-plot of the frequency response of the open-loop model, with the parameters listed inTable 2. As can be seen from this figure, the gain and phase margins are 45 dB and 27.2 deg, respectively,which validate the stable operation of the model described by (26). Moreover, the zero-pole diagram ofthe closed-loop transfer function (27) is demonstrated in Figure 7. The zeros and poles are representedby circles and crosses, respectively. It is clear that all the poles are located in the left-hand side of thecomplex plane, which signifies the stability of the whole system. Therefore, the proposed controller ismathematically proved to operate stably.
To demonstrate the advantage of the proposed controller compared to [21] in terms of stabilitymargin, the same bode analysis has been carried out for [21], and the result is illustrated in Figure 8.As observed from this figure, the gain margin and phase margin of the VSC system controlled by themethod in [21] drop to 4.33 dB and 20.4 deg, respectively. This deterioration in the stability metricsarises from only applying the df/dt term and its corresponding gain in [21], in which this problem is
Sustainability 2020, 12, 5346 9 of 14
solved in the proposed control scheme using transfer function G2(s) (Figure 5). Thus, the proposedcontroller has better performance in comparison to [21] regarding the system stability margin.
Table 2. The specifications of the implemented system.
System Parameters Values Controllers Parameters Values
SG nominal power 100 kW H, D 3, 1VSC nominal power 15 kW Hp, Dp 50, 100
Lg 0.003 H kcp 0.1Lc 0.002 H kci 10r 0.001 Ω kup 0.006
Upd 326.59 V kui 0.001Udc,ref 750 V kppll 180
C 0.1 F kipll 3200ωr 100π rad/s Tj 0.2
Sustainability 2020, 12, x FOR PEER REVIEW 9 of 15
solved in the proposed control scheme using transfer function G2(s) (Figure 5). Thus, the proposed controller has better performance in comparison to [21] regarding the system stability margin.
Table 2. The specifications of the implemented system.
System Parameters Values Controllers Parameters Values SG nominal power 100 kW H, D 3, 1
VSC nominal power 15 kW Hp, Dp 50, 100 Lg 0.003 H kcp 0.1 Lc 0.002 H kci 10 r 0.001 Ω kup 0.006
Upd 326.59 V kui 0.001 Udc,ref 750 V kppll 180
C 0.1 F kipll 3200 ωr 100π rad/s Tj 0.2
Figure 6. Bode diagram of the proposed control system.
Figure 7. Zero-pole diagram of the proposed control system.
Figure 8. Bode diagram of the method in [21].
Figure 6. Bode diagram of the proposed control system.
Sustainability 2020, 12, x FOR PEER REVIEW 9 of 15
solved in the proposed control scheme using transfer function G2(s) (Figure 5). Thus, the proposed controller has better performance in comparison to [21] regarding the system stability margin.
Table 2. The specifications of the implemented system.
System Parameters Values Controllers Parameters Values SG nominal power 100 kW H, D 3, 1
VSC nominal power 15 kW Hp, Dp 50, 100 Lg 0.003 H kcp 0.1 Lc 0.002 H kci 10 r 0.001 Ω kup 0.006
Upd 326.59 V kui 0.001 Udc,ref 750 V kppll 180
C 0.1 F kipll 3200 ωr 100π rad/s Tj 0.2
Figure 6. Bode diagram of the proposed control system.
Figure 7. Zero-pole diagram of the proposed control system.
Figure 8. Bode diagram of the method in [21].
Figure 7. Zero-pole diagram of the proposed control system.
Sustainability 2020, 12, x FOR PEER REVIEW 9 of 15
solved in the proposed control scheme using transfer function G2(s) (Figure 5). Thus, the proposed controller has better performance in comparison to [21] regarding the system stability margin.
Table 2. The specifications of the implemented system.
System Parameters Values Controllers Parameters Values SG nominal power 100 kW H, D 3, 1
VSC nominal power 15 kW Hp, Dp 50, 100 Lg 0.003 H kcp 0.1 Lc 0.002 H kci 10 r 0.001 Ω kup 0.006
Upd 326.59 V kui 0.001 Udc,ref 750 V kppll 180
C 0.1 F kipll 3200 ωr 100π rad/s Tj 0.2
Figure 6. Bode diagram of the proposed control system.
Figure 7. Zero-pole diagram of the proposed control system.
Figure 8. Bode diagram of the method in [21]. Figure 8. Bode diagram of the method in [21].

Sustainability 2020, 12, 5346 10 of 14
5. Simulation Results and Discussions
Simulations have been conducted in MATLAB to demonstrate the validity of the proposedtechnique for control of the grid-tied VSCs. The main parameters of the implemented system aretabulated in Table 2. A 100 kW synchronous generator models the power grid with the internalimpedance of 0.001 + j0.94 Ω. The grid-tied VSC operates under the following conditions. The ratedpower is 15 kW. The maximum acceptable DC-link voltage deviation is ±60 V, and the modulationindex is considered ma = 0.86. Two scenarios are considered for simulations, step-up and step-downchanges in the demand. Then, in each scenario, the proposed controller is compared with the methodin [21] and the conventional VSC system in terms of frequency stability metrics (i.e., frequency nadirand RoCoF).
5.1. Scenario 1
In this scenario, a 5% step-up change in the demand occurs at t = 20 s. Figure 9 depicts frequencyvariations when the grid-interactive converter is controlled by the (1) proposed controller, (2) methodin [21], and (3) conventional control system without virtual inertia functionality. As observed fromthis figure, without providing synthetic inertia, the frequency nadir and RoCoF peaks at 49.82 Hzand 0.19 Hz/s, respectively, and the grid frequency is stabilized after 6 s. The VSC system augmentedwith the proposed virtual inertia loop can improve the RoCoF level by 47.37% and 23.1% comparedto the conventional controller and [21], respectively. Moreover, the proposed technique yields lowermaximum frequency oscillations (i.e., 49.85 Hz) in comparison to the other ones. It should be mentionedthat further providing inertia support by the method in [21] leads to the instability of the whole system,which is in agreement with the stability analysis presented in Figure 8. Thus, better primary frequencyregulation during transient time is achieved with the proposed supplementary controller. The DC-linkcapacitor voltage oscillation is illustrated in Figure 10. The voltage drops to 690 V right after the stepchange in the load and returns to the nominal value (750 V). It means that the discharged energy bythe DC-link capacitor supports the frequency, which is analogous to the released kinetic energy of SGsduring perturbation.
Sustainability 2020, 12, x FOR PEER REVIEW 10 of 15
5. Simulation Results and Discussions
Simulations have been conducted in MATLAB to demonstrate the validity of the proposed technique for control of the grid-tied VSCs. The main parameters of the implemented system are tabulated in Table 2. A 100 kW synchronous generator models the power grid with the internal impedance of 0.001 + j0.94 Ω. The grid-tied VSC operates under the following conditions. The rated power is 15 kW. The maximum acceptable DC-link voltage deviation is ± 60 V, and the modulation index is considered ma = 0.86. Two scenarios are considered for simulations, step-up and step-down changes in the demand. Then, in each scenario, the proposed controller is compared with the method in [21] and the conventional VSC system in terms of frequency stability metrics (i.e., frequency nadir and RoCoF).
5.1. Scenario 1
In this scenario, a 5% step-up change in the demand occurs at t = 20 s. Figure 9 depicts frequency variations when the grid-interactive converter is controlled by the (1) proposed controller, (2) method in [21], and (3) conventional control system without virtual inertia functionality. As observed from this figure, without providing synthetic inertia, the frequency nadir and RoCoF peaks at 49.82 Hz and 0.19 Hz/s, respectively, and the grid frequency is stabilized after 6 s. The VSC system augmented with the proposed virtual inertia loop can improve the RoCoF level by 47.37% and 23.1% compared to the conventional controller and [21], respectively. Moreover, the proposed technique yields lower maximum frequency oscillations (i.e., 49.85 Hz) in comparison to the other ones. It should be mentioned that further providing inertia support by the method in [21] leads to the instability of the whole system, which is in agreement with the stability analysis presented in Figure 8. Thus, better primary frequency regulation during transient time is achieved with the proposed supplementary controller. The DC-link capacitor voltage oscillation is illustrated in Figure 10. The voltage drops to 690 V right after the step change in the load and returns to the nominal value (750 V). It means that the discharged energy by the DC-link capacitor supports the frequency, which is analogous to the released kinetic energy of SGs during perturbation.
Figure 9. Frequency nadir and rate of change of frequency (RoCoF) metrics under a 5% step-up
change in the demand.
Figure 10. DC-link voltage oscillation under a step-up change in the demand.
As stated earlier, the DC-link voltage deviations must be limited, which means to a finite frequency support level. When the DC-link voltage is reduced with the aim of frequency support, the modulation index (ma) must increase in order to (1) increase the difference angle between converter voltage and PCC voltage (Δ) and (2) prevent reactive power exchange with the grid (i.e., the equation ed = ma × udc × cosΔ = upd holds true). This can be observed in Figure 11. The modulation index peaks at
Figure 9. Frequency nadir and rate of change of frequency (RoCoF) metrics under a 5% step-up changein the demand.
Sustainability 2020, 12, x FOR PEER REVIEW 10 of 15
5. Simulation Results and Discussions
Simulations have been conducted in MATLAB to demonstrate the validity of the proposed technique for control of the grid-tied VSCs. The main parameters of the implemented system are tabulated in Table 2. A 100 kW synchronous generator models the power grid with the internal impedance of 0.001 + j0.94 Ω. The grid-tied VSC operates under the following conditions. The rated power is 15 kW. The maximum acceptable DC-link voltage deviation is ± 60 V, and the modulation index is considered ma = 0.86. Two scenarios are considered for simulations, step-up and step-down changes in the demand. Then, in each scenario, the proposed controller is compared with the method in [21] and the conventional VSC system in terms of frequency stability metrics (i.e., frequency nadir and RoCoF).
5.1. Scenario 1
In this scenario, a 5% step-up change in the demand occurs at t = 20 s. Figure 9 depicts frequency variations when the grid-interactive converter is controlled by the (1) proposed controller, (2) method in [21], and (3) conventional control system without virtual inertia functionality. As observed from this figure, without providing synthetic inertia, the frequency nadir and RoCoF peaks at 49.82 Hz and 0.19 Hz/s, respectively, and the grid frequency is stabilized after 6 s. The VSC system augmented with the proposed virtual inertia loop can improve the RoCoF level by 47.37% and 23.1% compared to the conventional controller and [21], respectively. Moreover, the proposed technique yields lower maximum frequency oscillations (i.e., 49.85 Hz) in comparison to the other ones. It should be mentioned that further providing inertia support by the method in [21] leads to the instability of the whole system, which is in agreement with the stability analysis presented in Figure 8. Thus, better primary frequency regulation during transient time is achieved with the proposed supplementary controller. The DC-link capacitor voltage oscillation is illustrated in Figure 10. The voltage drops to 690 V right after the step change in the load and returns to the nominal value (750 V). It means that the discharged energy by the DC-link capacitor supports the frequency, which is analogous to the released kinetic energy of SGs during perturbation.
Figure 9. Frequency nadir and rate of change of frequency (RoCoF) metrics under a 5% step-up
change in the demand.
Figure 10. DC-link voltage oscillation under a step-up change in the demand.
As stated earlier, the DC-link voltage deviations must be limited, which means to a finite frequency support level. When the DC-link voltage is reduced with the aim of frequency support, the modulation index (ma) must increase in order to (1) increase the difference angle between converter voltage and PCC voltage (Δ) and (2) prevent reactive power exchange with the grid (i.e., the equation ed = ma × udc × cosΔ = upd holds true). This can be observed in Figure 11. The modulation index peaks at
Figure 10. DC-link voltage oscillation under a step-up change in the demand.
As stated earlier, the DC-link voltage deviations must be limited, which means to a finite frequencysupport level. When the DC-link voltage is reduced with the aim of frequency support, the modulationindex (ma) must increase in order to (1) increase the difference angle between converter voltage and
Sustainability 2020, 12, 5346 11 of 14
PCC voltage (∆) and (2) prevent reactive power exchange with the grid (i.e., the equation ed = ma
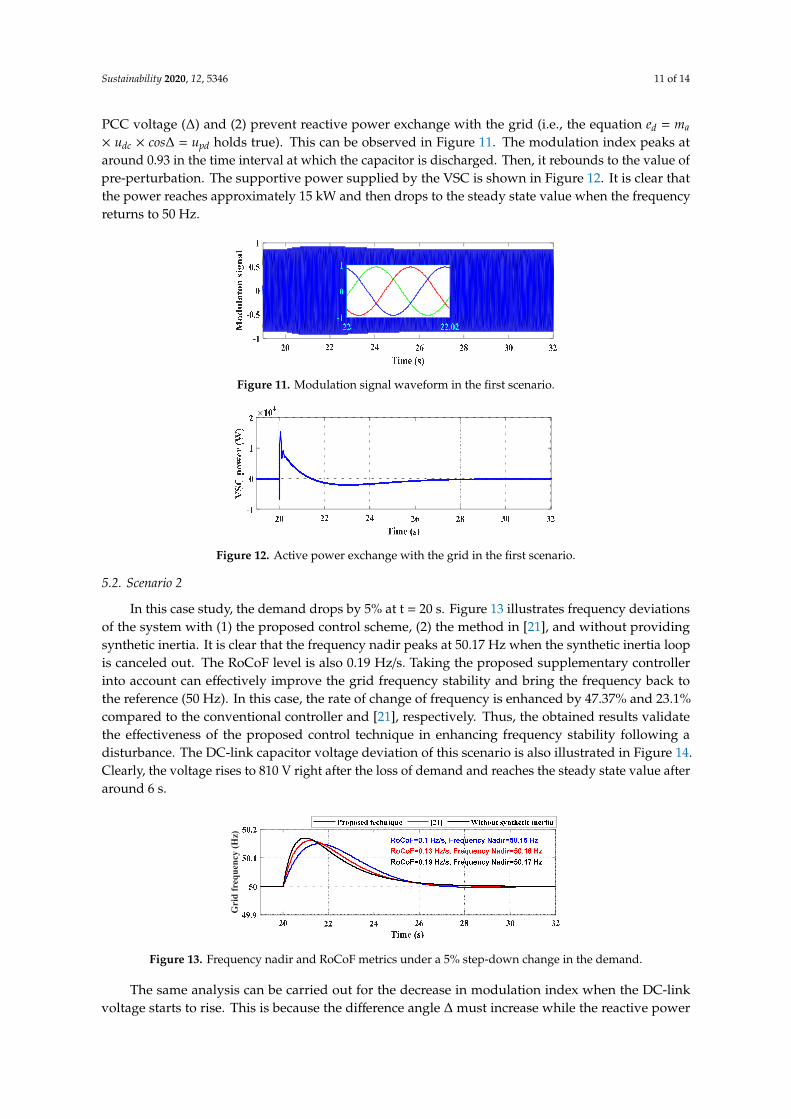
× udc × cos∆ = upd holds true). This can be observed in Figure 11. The modulation index peaks ataround 0.93 in the time interval at which the capacitor is discharged. Then, it rebounds to the value ofpre-perturbation. The supportive power supplied by the VSC is shown in Figure 12. It is clear thatthe power reaches approximately 15 kW and then drops to the steady state value when the frequencyreturns to 50 Hz.
Sustainability 2020, 12, x FOR PEER REVIEW 11 of 15
around 0.93 in the time interval at which the capacitor is discharged. Then, it rebounds to the value of pre-perturbation. The supportive power supplied by the VSC is shown in Figure 12. It is clear that the power reaches approximately 15 kW and then drops to the steady state value when the frequency returns to 50 Hz.
Figure 11. Modulation signal waveform in the first scenario.
Figure 12. Active power exchange with the grid in the first scenario.
5.2. Scenario 2
In this case study, the demand drops by 5% at t = 20 s. Figure 13 illustrates frequency deviations of the system with (1) the proposed control scheme, (2) the method in [21], and without providing synthetic inertia. It is clear that the frequency nadir peaks at 50.17 Hz when the synthetic inertia loop is canceled out. The RoCoF level is also 0.19 Hz/s. Taking the proposed supplementary controller into account can effectively improve the grid frequency stability and bring the frequency back to the reference (50 Hz). In this case, the rate of change of frequency is enhanced by 47.37% and 23.1% compared to the conventional controller and [21], respectively. Thus, the obtained results validate the effectiveness of the proposed control technique in enhancing frequency stability following a disturbance. The DC-link capacitor voltage deviation of this scenario is also illustrated in Figure 14. Clearly, the voltage rises to 810 V right after the loss of demand and reaches the steady state value after around 6 s.
Figure 13. Frequency nadir and RoCoF metrics under a 5% step-down change in the demand.
The same analysis can be carried out for the decrease in modulation index when the DC-link voltage starts to rise. This is because the difference angle Δ must increase while the reactive power exchange remains zero during contingency (again, the equation ed = ma × udc × cosΔ = upd holds true). Then, the modulation index decreases as the DC-link capacitor voltage increases. The modulation signal in this scenario is observed in Figure 15. The power absorbed by the VSC with the aim of
Gri
d fr
eque
ncy
(Hz)
Figure 11. Modulation signal waveform in the first scenario.
Sustainability 2020, 12, x FOR PEER REVIEW 11 of 15
around 0.93 in the time interval at which the capacitor is discharged. Then, it rebounds to the value of pre-perturbation. The supportive power supplied by the VSC is shown in Figure 12. It is clear that the power reaches approximately 15 kW and then drops to the steady state value when the frequency returns to 50 Hz.
Figure 11. Modulation signal waveform in the first scenario.
Figure 12. Active power exchange with the grid in the first scenario.
5.2. Scenario 2
In this case study, the demand drops by 5% at t = 20 s. Figure 13 illustrates frequency deviations of the system with (1) the proposed control scheme, (2) the method in [21], and without providing synthetic inertia. It is clear that the frequency nadir peaks at 50.17 Hz when the synthetic inertia loop is canceled out. The RoCoF level is also 0.19 Hz/s. Taking the proposed supplementary controller into account can effectively improve the grid frequency stability and bring the frequency back to the reference (50 Hz). In this case, the rate of change of frequency is enhanced by 47.37% and 23.1% compared to the conventional controller and [21], respectively. Thus, the obtained results validate the effectiveness of the proposed control technique in enhancing frequency stability following a disturbance. The DC-link capacitor voltage deviation of this scenario is also illustrated in Figure 14. Clearly, the voltage rises to 810 V right after the loss of demand and reaches the steady state value after around 6 s.
Figure 13. Frequency nadir and RoCoF metrics under a 5% step-down change in the demand.
The same analysis can be carried out for the decrease in modulation index when the DC-link voltage starts to rise. This is because the difference angle Δ must increase while the reactive power exchange remains zero during contingency (again, the equation ed = ma × udc × cosΔ = upd holds true). Then, the modulation index decreases as the DC-link capacitor voltage increases. The modulation signal in this scenario is observed in Figure 15. The power absorbed by the VSC with the aim of
Gri
d fr
eque
ncy
(Hz)
Figure 12. Active power exchange with the grid in the first scenario.
5.2. Scenario 2
In this case study, the demand drops by 5% at t = 20 s. Figure 13 illustrates frequency deviationsof the system with (1) the proposed control scheme, (2) the method in [21], and without providingsynthetic inertia. It is clear that the frequency nadir peaks at 50.17 Hz when the synthetic inertia loopis canceled out. The RoCoF level is also 0.19 Hz/s. Taking the proposed supplementary controllerinto account can effectively improve the grid frequency stability and bring the frequency back tothe reference (50 Hz). In this case, the rate of change of frequency is enhanced by 47.37% and 23.1%compared to the conventional controller and [21], respectively. Thus, the obtained results validatethe effectiveness of the proposed control technique in enhancing frequency stability following adisturbance. The DC-link capacitor voltage deviation of this scenario is also illustrated in Figure 14.Clearly, the voltage rises to 810 V right after the loss of demand and reaches the steady state value afteraround 6 s.
Sustainability 2020, 12, x FOR PEER REVIEW 11 of 15
around 0.93 in the time interval at which the capacitor is discharged. Then, it rebounds to the value of pre-perturbation. The supportive power supplied by the VSC is shown in Figure 12. It is clear that the power reaches approximately 15 kW and then drops to the steady state value when the frequency returns to 50 Hz.
Figure 11. Modulation signal waveform in the first scenario.
Figure 12. Active power exchange with the grid in the first scenario.
5.2. Scenario 2
In this case study, the demand drops by 5% at t = 20 s. Figure 13 illustrates frequency deviations of the system with (1) the proposed control scheme, (2) the method in [21], and without providing synthetic inertia. It is clear that the frequency nadir peaks at 50.17 Hz when the synthetic inertia loop is canceled out. The RoCoF level is also 0.19 Hz/s. Taking the proposed supplementary controller into account can effectively improve the grid frequency stability and bring the frequency back to the reference (50 Hz). In this case, the rate of change of frequency is enhanced by 47.37% and 23.1% compared to the conventional controller and [21], respectively. Thus, the obtained results validate the effectiveness of the proposed control technique in enhancing frequency stability following a disturbance. The DC-link capacitor voltage deviation of this scenario is also illustrated in Figure 14. Clearly, the voltage rises to 810 V right after the loss of demand and reaches the steady state value after around 6 s.
Figure 13. Frequency nadir and RoCoF metrics under a 5% step-down change in the demand.
The same analysis can be carried out for the decrease in modulation index when the DC-link voltage starts to rise. This is because the difference angle Δ must increase while the reactive power exchange remains zero during contingency (again, the equation ed = ma × udc × cosΔ = upd holds true). Then, the modulation index decreases as the DC-link capacitor voltage increases. The modulation signal in this scenario is observed in Figure 15. The power absorbed by the VSC with the aim of
Gri
d fr
eque
ncy
(Hz)
Figure 13. Frequency nadir and RoCoF metrics under a 5% step-down change in the demand.
The same analysis can be carried out for the decrease in modulation index when the DC-linkvoltage starts to rise. This is because the difference angle ∆ must increase while the reactive power

Sustainability 2020, 12, 5346 12 of 14
exchange remains zero during contingency (again, the equation ed = ma × udc × cos∆ = upd holds true).Then, the modulation index decreases as the DC-link capacitor voltage increases. The modulationsignal in this scenario is observed in Figure 15. The power absorbed by the VSC with the aim offrequency support is also brought in Figure 16. The power reaches approximately −15 kW after theloss of demand and becomes zero when the grid frequency returns to 50 Hz.
Sustainability 2020, 12, x FOR PEER REVIEW 12 of 15
frequency support is also brought in Figure 16. The power reaches approximately −15 kW after the loss of demand and becomes zero when the grid frequency returns to 50 Hz.
Figure 14. DC-link voltage oscillation under a step-down change in the demand.
Figure 15. Modulation signal waveform in the second scenario.
Figure 16. Active power exchange with the grid in the second scenario.
6. Conclusions
This paper proposed a new control scheme for grid-tied voltage source converters, which is composed of a conventional inner current loop, outer voltage loop, and a new synthetic inertia function. The virtual inertia loop provides primary frequency support through discharging/charging the DC-link capacitors of converters employed in the power electronics-based generators, e.g., solar and wind farms. The synchronous reference frame transformation introduced by the PLL dynamics has also been included in the control system for the required compensation. The dynamics model of the proposed scheme has been built and the bode-plot and zero-pole map analyses have confirmed that the proposed controller can perform in a stable operating condition. The stability analyses depicted that the proposed controller has a better performance compared to [21] in terms of the system stability margin. Moreover, the simulations illustrated that the rate of change of frequency is improved by 47.37% and 23.1% compared to the conventional controller and the method in [21], respectively.
Author Contributions: All authors worked on this manuscript together and all authors have read and approved the final manuscript.
Funding: This research received no external funding.
Conflicts of Interest: The authors declare no conflict of interest.
Figure 14. DC-link voltage oscillation under a step-down change in the demand.
Sustainability 2020, 12, x FOR PEER REVIEW 12 of 15
frequency support is also brought in Figure 16. The power reaches approximately −15 kW after the loss of demand and becomes zero when the grid frequency returns to 50 Hz.
Figure 14. DC-link voltage oscillation under a step-down change in the demand.
Figure 15. Modulation signal waveform in the second scenario.
Figure 16. Active power exchange with the grid in the second scenario.
6. Conclusions
This paper proposed a new control scheme for grid-tied voltage source converters, which is composed of a conventional inner current loop, outer voltage loop, and a new synthetic inertia function. The virtual inertia loop provides primary frequency support through discharging/charging the DC-link capacitors of converters employed in the power electronics-based generators, e.g., solar and wind farms. The synchronous reference frame transformation introduced by the PLL dynamics has also been included in the control system for the required compensation. The dynamics model of the proposed scheme has been built and the bode-plot and zero-pole map analyses have confirmed that the proposed controller can perform in a stable operating condition. The stability analyses depicted that the proposed controller has a better performance compared to [21] in terms of the system stability margin. Moreover, the simulations illustrated that the rate of change of frequency is improved by 47.37% and 23.1% compared to the conventional controller and the method in [21], respectively.
Author Contributions: All authors worked on this manuscript together and all authors have read and approved the final manuscript.
Funding: This research received no external funding.
Conflicts of Interest: The authors declare no conflict of interest.
Figure 15. Modulation signal waveform in the second scenario.
Sustainability 2020, 12, x FOR PEER REVIEW 12 of 15
frequency support is also brought in Figure 16. The power reaches approximately −15 kW after the loss of demand and becomes zero when the grid frequency returns to 50 Hz.
Figure 14. DC-link voltage oscillation under a step-down change in the demand.
Figure 15. Modulation signal waveform in the second scenario.
Figure 16. Active power exchange with the grid in the second scenario.
6. Conclusions
This paper proposed a new control scheme for grid-tied voltage source converters, which is composed of a conventional inner current loop, outer voltage loop, and a new synthetic inertia function. The virtual inertia loop provides primary frequency support through discharging/charging the DC-link capacitors of converters employed in the power electronics-based generators, e.g., solar and wind farms. The synchronous reference frame transformation introduced by the PLL dynamics has also been included in the control system for the required compensation. The dynamics model of the proposed scheme has been built and the bode-plot and zero-pole map analyses have confirmed that the proposed controller can perform in a stable operating condition. The stability analyses depicted that the proposed controller has a better performance compared to [21] in terms of the system stability margin. Moreover, the simulations illustrated that the rate of change of frequency is improved by 47.37% and 23.1% compared to the conventional controller and the method in [21], respectively.
Author Contributions: All authors worked on this manuscript together and all authors have read and approved the final manuscript.
Funding: This research received no external funding.
Conflicts of Interest: The authors declare no conflict of interest.
Figure 16. Active power exchange with the grid in the second scenario.
6. Conclusions
This paper proposed a new control scheme for grid-tied voltage source converters, which iscomposed of a conventional inner current loop, outer voltage loop, and a new synthetic inertia function.The virtual inertia loop provides primary frequency support through discharging/charging the DC-linkcapacitors of converters employed in the power electronics-based generators, e.g., solar and windfarms. The synchronous reference frame transformation introduced by the PLL dynamics has also beenincluded in the control system for the required compensation. The dynamics model of the proposedscheme has been built and the bode-plot and zero-pole map analyses have confirmed that the proposedcontroller can perform in a stable operating condition. The stability analyses depicted that the proposedcontroller has a better performance compared to [21] in terms of the system stability margin. Moreover,the simulations illustrated that the rate of change of frequency is improved by 47.37% and 23.1%compared to the conventional controller and the method in [21], respectively.
Author Contributions: All authors worked on this manuscript together and all authors have read and approvedthe final manuscript.
Funding: This research received no external funding.
Conflicts of Interest: The authors declare no conflict of interest.

Sustainability 2020, 12, 5346 13 of 14
Nomenclature
Abbreviations:dqg, dqc Synchronous reference frames corresponding to the grid and the controllerESS Energy storage systemPLL Phase-locked loopPCC Point of common couplingRESs Renewable energy sourcesRoCoF Rate of change of frequencySGs Synchronous generatorsVSC Voltage source converterVSG Virtual synchronous generatorVariables:i Current flowing into the gridma Modulation IndexPm Input mechanical power of SGPe Electromagnetic power of SGudc, ec, up, ug DC-link capacitor voltage, converter voltage, PCC voltage, grid voltageup
g, upc PCC voltage vectors in the grid frame and the controller frame
ω Angular velocity/frequency of the rotor/grid∆ The difference angle between the converter voltage and the PCC voltageParameters:C DC-link capacitanceD, Dp Damping coefficient, virtual damping coefficientFHP Turbine coefficientfs Sampling frequencyH, Hp Inertia constant, virtual inertia constantId Rated value of the current i in the d-axisJ Moment of inertia of the turbine and the generatorkcp, kci Proportional and integral gains of the current controllerkup, kui Proportional and integral gains of the voltage controllerkppll, kipll Proportional and integral gains of the PLLLc, Lg Inductance of the filter and the gridRc, Rg Resistance of the filter and the gridR Droop coefficientTG Governor time constantTCH Inlet volume time constantTRH Re-heater time constantUdc,ref DC-link voltage referenceUpd Nominal PCC voltage in the d-axisωr Reference angular velocity/frequency of the rotor/grid
References
1. Kundur, P. Power System Stability and Control, 1st ed.; McGraw-Hill Education: New York, NY, USA, 1994.2. Alipoor, J.; Miura, Y.; Ise, T. Power System Stabilization Using Virtual Synchronous Generator with Alternating
Moment of Inertia. J. Emerg. Sel.Top. Power Electron. 2015, 3, 451–458. [CrossRef]3. Saeedian, M.; Eskandari, B.; Taheri, S.; Hinkkanen, M.; Pouresmaeil, E. A Control Technique Based on
Distributed Virtual Inertia for High Penetration of Renewable Energies Under Weak Grid Conditions.IEEE Syst. J. 2020. [CrossRef]
4. Fang, J.; Li, H.; Tang, Y.; Blaabjerg, F. On the Inertia of Future More-Electronics Power Systems. J. Emerg.Sel.Top. Power Electron. 2018, 7, 2130–2146. [CrossRef]
5. Dreidy, M.; Mokhlis, H.; Mekhilef, S. Inertia Response and Frequency Control Techniques for RenewableEnergy Sources: A Review. Renew. Sustain. Energy Rev. 2017, 69, 144–155. [CrossRef]
6. Vorobev, P.; Greenwood, D.M.; Bell, J.H.; Bialek, J.; Taylor, P.; Turitsyn, K. Deadbands, Droop, and InertiaImpact on Power System Frequency Distribution. IEEE Trans. Power Syst. 2019, 34, 3098–3108. [CrossRef]
Sustainability 2020, 12, 5346 14 of 14
7. Mehrasa, M.; Pouresmaeil, E.; Sepehr, A.; Pournazarian, B.; Catalão, J.P.S. Control of Power Electronics-BasedSynchronous Generator for the Integration of Renewable Energies into the Power Grid. Int. J. Electr. PowerEnergy Syst. 2019, 111, 300–314. [CrossRef]
8. Golpîra, H.; Messina, A.R.; Bevrani, H. Emulation of Virtual Inertia to Accommodate Higher PenetrationLevels of Distributed Generation in Power Grids. IEEE Trans. Power Syst. 2019, 34, 3384–3394. [CrossRef]
9. EirGrid/SONI. RoCoF Modification Proposal—TSOs’ Recommendations; EirGrid/SONI: Dublin, Ireland, 2012.10. Nguyen, H.T.; Yang, G.; Nielsen, A.H.; Højgaard Jensen, P. Combination of Synchronous Condenser and
Synthetic Inertia for Frequency Stability Enhancement in Low-Inertia Systems. IEEE Trans. Sustain. Energy2019, 10, 997–1005. [CrossRef]
11. Beck, H.-P.; Hesse, R. Virtual Synchronous Machine. In Proceedings of the 9th International Conference onElectrical Power Quality and Utilisation, Barcelona, Spain, 9–11 October 2007; pp. 1–6.
12. Zhong, Q.; Weiss, G. Synchronverters: Inverters That Mimic Synchronous Generators. IEEE Trans. Ind. Electron.2011, 58, 1259–1267. [CrossRef]
13. Ashabani, M.; Freijedo, F.D.; Golestan, S.; Guerrero, J.M. Inducverters: PLL-Less Converters withAuto-Synchronization and Emulated Inertia Capability. IEEE Trans. Smart Grid 2016, 7, 1660–1674. [CrossRef]
14. Chen, Y.; Hesse, R.; Turschner, D.; Beck, H.-P. Improving the Grid Power Quality Using Virtual SynchronousMachines. In Proceedings of the International Conference on Power Engineering, Energy and ElectricalDrives, Malaga, Spain, 11–13 May 2011; pp. 1–6.
15. Wang, S.; Tomsovic, K. Fast Frequency Support From Wind Turbine Generators With Auxiliary DynamicDemand Control. IEEE Trans. Power Syst. 2019, 34, 3340–3348. [CrossRef]
16. Morren, J.; de Haan, S.W.H.; Kling, W.L.; Ferreira, J.A. Wind Turbines Emulating Inertia and SupportingPrimary Frequency Control. IEEE Trans. Power Syst. 2006, 21, 433–434. [CrossRef]
17. Kim, J.; Gevorgian, V.; Luo, Y.; Mohanpurkar, M.; Koritarov, V.; Hovsapian, R.O.; Muljadi, E. Supercapacitor toProvide Ancillary Services with Control Coordination. IEEE Trans. Ind. Appl. 2019, 55, 5119–5127. [CrossRef]
18. Namor, E.; Sossan, F.; Cherkaoui, R.; Paolone, M. Control of Battery Storage Systems for the SimultaneousProvision of Multiple Services. IEEE Trans. Smart Grid 2019, 10, 2799–2808. [CrossRef]
19. Gollenstede, J.; Beushausen, L.; Benger, R.; Beck, H.-P.; Schael, M.; Kruschel, W.; Ulbrich, T.; Schmies, S.Design of a High-Performance Battery Converter System for Providing Synthetic Inertia at DistributionNetwork Level. In Proceedings of the 20th European Conference on Power Electronics and Applications,Riga, Latvia, 17–21 September 2018; pp. 1–10.
20. Duckwitz, D.; Fischer, B. Modeling and Design of df/dt-Based Inertia Control for Power Converters. IEEE J.Emerg. Sel. Top. Power Electron. 2017, 5, 1553–1564. [CrossRef]
21. Fang, J.; Li, H.; Tang, Y.; Blaabjerg, F. Distributed Power System Virtual Inertia Implemented byGrid-Connected Power Converters. IEEE Trans. Power Electron. 2018, 33, 8488–8499. [CrossRef]
22. Markovic, U.; Früh, N.; Aristidou, P.; Hug, G. Interval-Based Adaptive Inertia and Damping Control of aVirtual Synchronous Machine. In Proceedings of the 2019 IEEE PowerTech conference IEEE, Milano, Italy,23–27 June 2019.
23. Wu, W.; Chen, Y.; Luo, A.; Zhou, L.; Zhou, X.; Yang, L.; Dong, Y.; Guerrero, J.M. A Virtual Inertia ControlStrategy for DC Microgrids Analogized With Virtual Synchronous Machines. IEEE Trans. Ind. Electron. 2017,64, 6005–6016. [CrossRef]
24. Pournazarian, B.; Pouresmaeil, E.; Saeedian, M.; Lehtonen, M.; Chan, R.; Taheri, S. Microgrid Frequency &Voltage Adjustment Applying Virtual Synchronous Generator. In Proceedings of the International Conferenceon Smart Energy Systems and Technologies (SEST), Porto, Portugal, 9–11 September 2019; pp. 1–6.
25. Wen, B.; Boroyevich, D.; Burgos, R.; Mattavelli, P.; Shen, Z. Analysis of D-Q Small-Signal Impedance ofGrid-Tied Inverters. IEEE Trans. Power Electron. 2016, 31, 675–687. [CrossRef]
26. Rodriguez, P.; Pou, J.; Bergas, J.; Candela, J.I.; Burgos, R.; Boroyevich, D. Decoupled Double SynchronousReference Frame PLL for Power Converters Control. IEEE Trans. Power Electron. 2007, 22, 584–592. [CrossRef]
27. Tamrakar, U.; Shrestha, D.; Maharjan, M.; Bhattarai, B.; Hansen, T.; Tonkoski, R. Virtual Inertia: CurrentTrends and Future Directions. J. Appl. Sci. 2017, 7, 654. [CrossRef]
© 2020 by the authors. Licensee MDPI, Basel, Switzerland. This article is an open accessarticle distributed under the terms and conditions of the Creative Commons Attribution(CC BY) license (http://creativecommons.org/licenses/by/4.0/).