saab q3 2021 presentation
TRANSCRIPT

11
Saab Q3 2021 Presentation22 October 2021
Micael Johansson, President and CEO
Christian Luiga, CFO and Deputy CEO
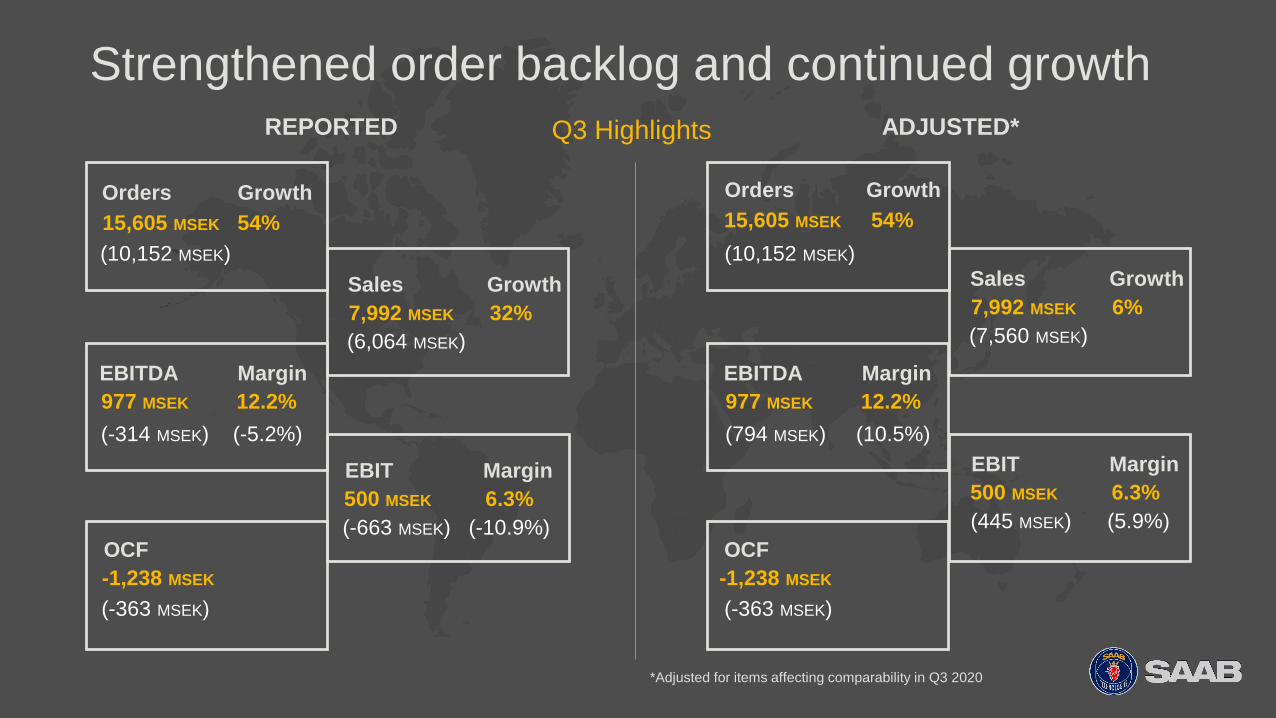
Orders Growth
15,605 MSEK 54%
Strengthened order backlog and continued growth
(10,152 MSEK)
Sales Growth
7,992 MSEK 32%
(6,064 MSEK)
EBITDA Margin
977 MSEK 12.2%
(-314 MSEK) (-5.2%)
EBIT Margin
500 MSEK 6.3%
(-663 MSEK) (-10.9%)OCF
-1,238 MSEK
(-363 MSEK)
REPORTED Q3 Highlights
Orders Growth
15,605 MSEK 54%
(10,152 MSEK)
Sales Growth
7,992 MSEK 6%
(7,560 MSEK)
EBITDA Margin
977 MSEK 12.2%
(794 MSEK) (10.5%)
EBIT Margin
500 MSEK 6.3%
(445 MSEK) (5.9%)
OCF
-1,238 MSEK
(-363 MSEK)
ADJUSTED*
*Adjusted for items affecting comparability in Q3 2020

Market highlights
Continued positive trend in the defence market
• Strong demand in Sweden, Europe and the U.S.
• Expecting decision from important campaigns in the near future
• Continued weak civil aviation market
Strong order intake in the quarter
• Total order intake 15.6 BSEK, increase of 54% y-o-y
• Driven by large orders, up 106% y-o-y
• Order backlog of 105 BSEK
Key orders
• Large contract to modernize German Navy’s F123 Frigates
• Further capability order for the A26 Submarine for Sweden
• Orders for Carl-Gustaf
• Combat training solutions to Poland
• Digital Tower order to the Belgium Air Traffic Control organization
3

MSEK Q3 2021 Q3 2020 YTD 2021 YTD 2020
Order intake 3,190 5,811 7,937 10,197
Sales 1,456 1,480 5,900 4,684
EBITDA 223 133 808 545
EBITDA margin 15.3% 9.0% 13.7% 11.6%
EBIT margin 13.8% 7.6% 12.6% 10.2%
Business area summary
MSEK Q3 2021 Q3 2020 YTD 2021 YTD 2020
Order intake 299 901 4,662 4,022
Sales 2,479 1,770* 8,626 7,763*
EBITDA 79 -943* 570 -484*
EBITDA margin 3.2% -53.3% 6.6% -6.2%
EBIT margin 1.9% -54.8% 5.6% -7.2%
Aeronautics
• Several Gripen campaigns ongoing
• Grand opening of the new U.S. facility in West Lafayette
• T-7A operations impact results negatively
• Lower sales in civil aviation operations
Dynamics
• Favourable market demand in several product areas
• Large orders for Carl-Gustaf and Combat Training
• Strong profitability in Q3 driven by good project
completion – especially in Ground Combat
*Sales and EBITDA impacted by project estimate adjustment of 1.1 BSEK in Q3 2020.
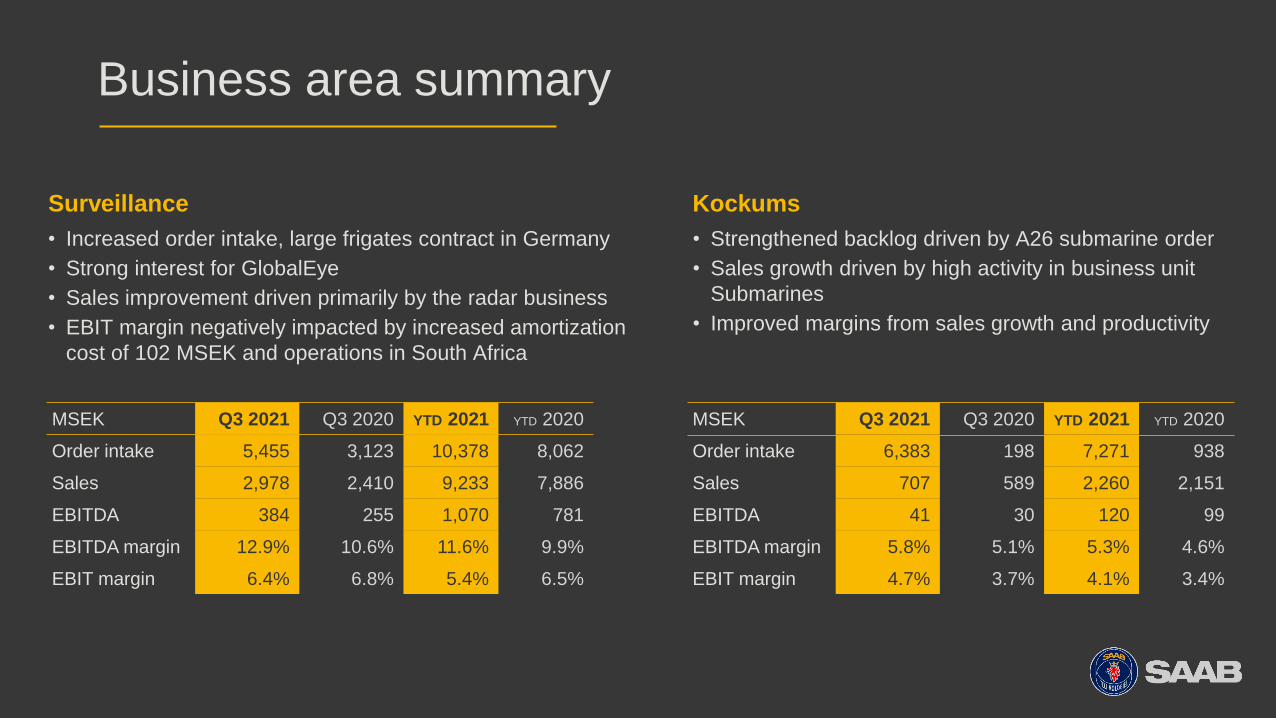
Surveillance Kockums
• Increased order intake, large frigates contract in Germany
• Strong interest for GlobalEye
• Sales improvement driven primarily by the radar business
• EBIT margin negatively impacted by increased amortization
cost of 102 MSEK and operations in South Africa
Business area summary
MSEK Q3 2021 Q3 2020 YTD 2021 YTD 2020
Order intake 5,455 3,123 10,378 8,062
Sales 2,978 2,410 9,233 7,886
EBITDA 384 255 1,070 781
EBITDA margin 12.9% 10.6% 11.6% 9.9%
EBIT margin 6.4% 6.8% 5.4% 6.5%
MSEK Q3 2021 Q3 2020 YTD 2021 YTD 2020
Order intake 6,383 198 7,271 938
Sales 707 589 2,260 2,151
EBITDA 41 30 120 99
EBITDA margin 5.8% 5.1% 5.3% 4.6%
EBIT margin 4.7% 3.7% 4.1% 3.4%
• Strengthened backlog driven by A26 submarine order
• Sales growth driven by high activity in business unit
Submarines
• Improved margins from sales growth and productivity

6
The Uniqueness
• Technology leader in the
naval domain and strong offering on
land systems
• Radar, EW, CS and ATM
• Leveraging the best of Swedish and
American innovation
Growth Potential
• Stable customer base – serving five
branches of the US military
• Growing radar demand in the US,
accounts for ~50% of global demand
• Market expected to grow in airborne,
land and maritime domains
• Key U.S. programs and prospects such
as the US Army, US Navy, US Air Force
Export opportunities out of US
Our Surveillance footprint
• Sales ~200 MUSD
• 9% Sales CAGR last 10Y
• Increased technology work
done locally
• Extensive manufacturing and
test facilities
• Base in Syracuse, N.Y. with
~500 employees
US Surveillance business–a blueprint for the Saab multi domestic strategy
Key recent wins
• Advanced Digital Radar Technology
• Threat Systems Radars
• Variable Aperture Digital Radar
• MK9 Continuous Wave llluminator
• AN/ SPN-50 Low Rate Initial Production
• CEROS Demonstrator (for USN)
• Laser Warning Systems Technology
Demonstration
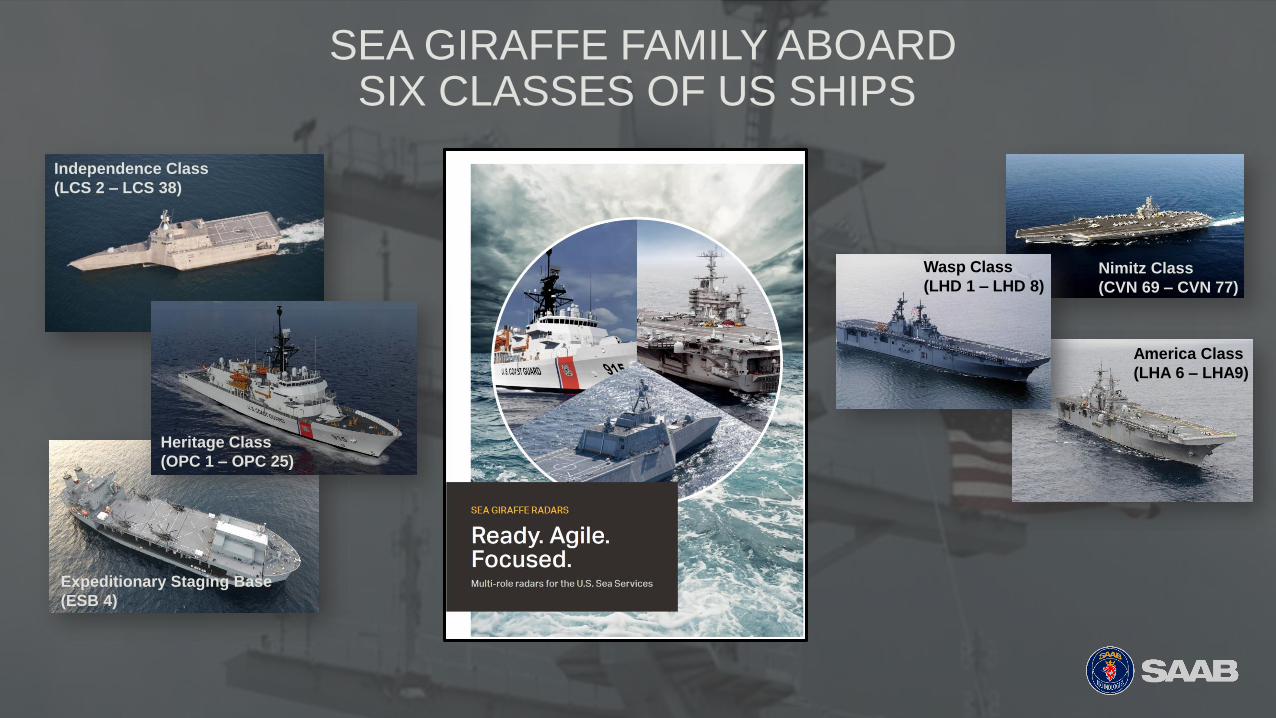
Independence Class
(LCS 2 – LCS 38)
Expeditionary Staging Base
(ESB 4)
Heritage Class
(OPC 1 – OPC 25)
Nimitz Class
(CVN 69 – CVN 77)
America Class
(LHA 6 – LHA9)
Wasp Class
(LHD 1 – LHD 8)
SEA GIRAFFE FAMILY ABOARDSIX CLASSES OF US SHIPS

Accelerating our sustainability efforts
8
Our commitment to a sustainable society
• A commitment to society has been at the core of Saab’s business
since its founding, supporting nations to keep people and society safe
• In line with UN Sustainable Development Goal 16 for peace, justice
and strong institutions
Highlights during the quarter
• Saab has committed to the “Business Ambition for 1.5°C” campaign,
backed by Science-Based Targets
• Saab is now part of the UN Climate Champions and “Race to Zero”
initiative, to reach net-zero emissions by 2050
• Saab has conducted stakeholder dialogue, which will constitute input
to the company’s updated sustainability strategy
• Saab’s carbon emission reduction from operations down 15% year-to-
date
Focus going forward
• International growth and M&A in key markets
• Productivity and efficiency improvements
• Focus on major market campaigns
• Execution on our key programmes
• Support ramp-up of Ground Combat
• Accelerating sustainability efforts
9

Financial SummaryChristian Luiga, CFO & Deputy CEO
10

• Q3 order intake 15.6 BSEK, up 54%
• Large and medium sized-orders,
accounting to ~73% of total
• Decline in small-sized orders
• Order backlog of 105 BSEK
(+10% vs Q3 2020)
• 68% of backlog outside Sweden
• 2022 planned backlog to sales
conversion up 17.5% y-o-y
Order backlog support continued growth
11
Order backlog of 105 BSEK (10% vs Q3 2020)
10.3
30.8
22.7
16.9
23.9
9.6
26.2
20.3
16.3
22.3
0
5
10
15
20
25
30
35
2021 2022 2023 2024 After 2024
Backlog 2021 Q3 Backlog 2020 Q3
BS
EK
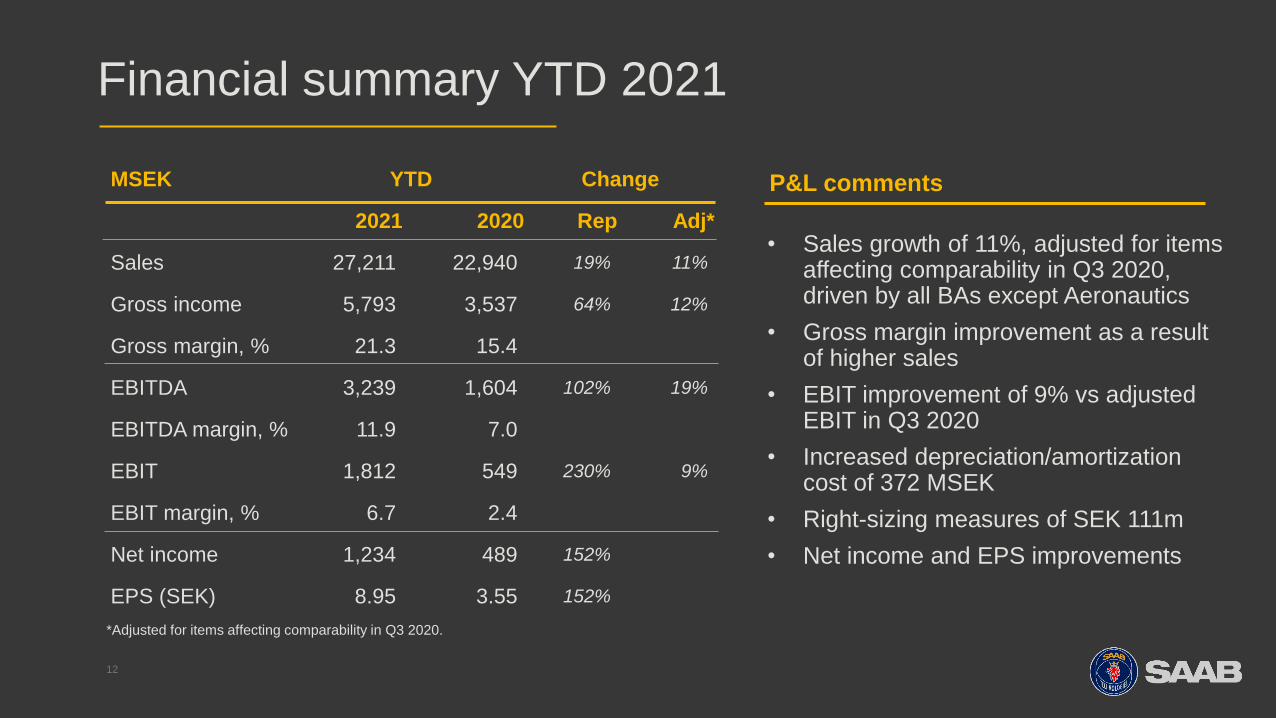
• Sales growth of 11%, adjusted for items affecting comparability in Q3 2020, driven by all BAs except Aeronautics
• Gross margin improvement as a result of higher sales
• EBIT improvement of 9% vs adjusted EBIT in Q3 2020
• Increased depreciation/amortization cost of 372 MSEK
• Right-sizing measures of SEK 111m
• Net income and EPS improvements
P&L commentsMSEK YTD Change
2021 2020 Rep Adj*
Sales 27,211 22,940 19% 11%
Gross income 5,793 3,537 64% 12%
Gross margin, % 21.3 15.4
EBITDA 3,239 1,604 102% 19%
EBITDA margin, % 11.9 7.0
EBIT 1,812 549 230% 9%
EBIT margin, % 6.7 2.4
Net income 1,234 489 152%
EPS (SEK) 8.95 3.55 152%
Financial summary YTD 2021
12
*Adjusted for items affecting comparability in Q3 2020.
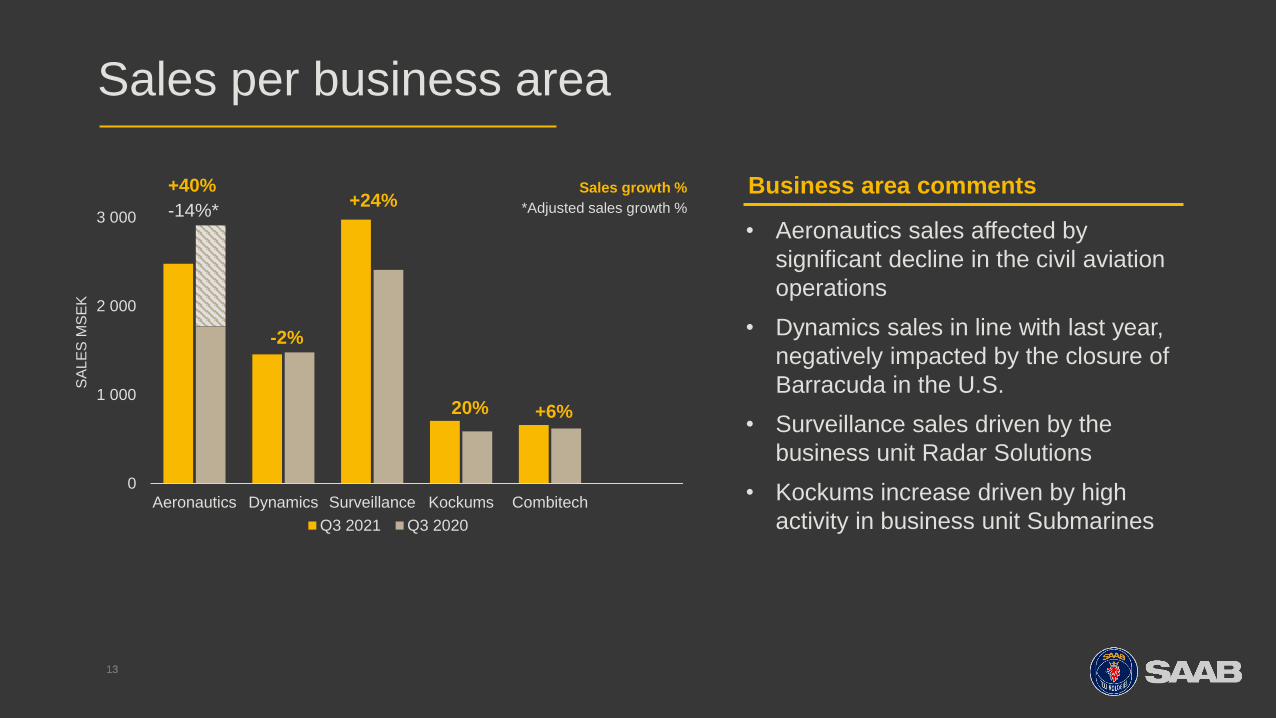
Sales per business area
1313
• Aeronautics sales affected by
significant decline in the civil aviation
operations
• Dynamics sales in line with last year,
negatively impacted by the closure of
Barracuda in the U.S.
• Surveillance sales driven by the
business unit Radar Solutions
• Kockums increase driven by high
activity in business unit Submarines
Business area comments
0
1 000
2 000
3 000
Aeronautics Dynamics Surveillance Kockums Combitech
Q3 2021 Q3 2020
+40%
-2%
+24%
20% +6%
SA
LE
S M
SE
K
Sales growth %
*Adjusted sales growth %-14%*
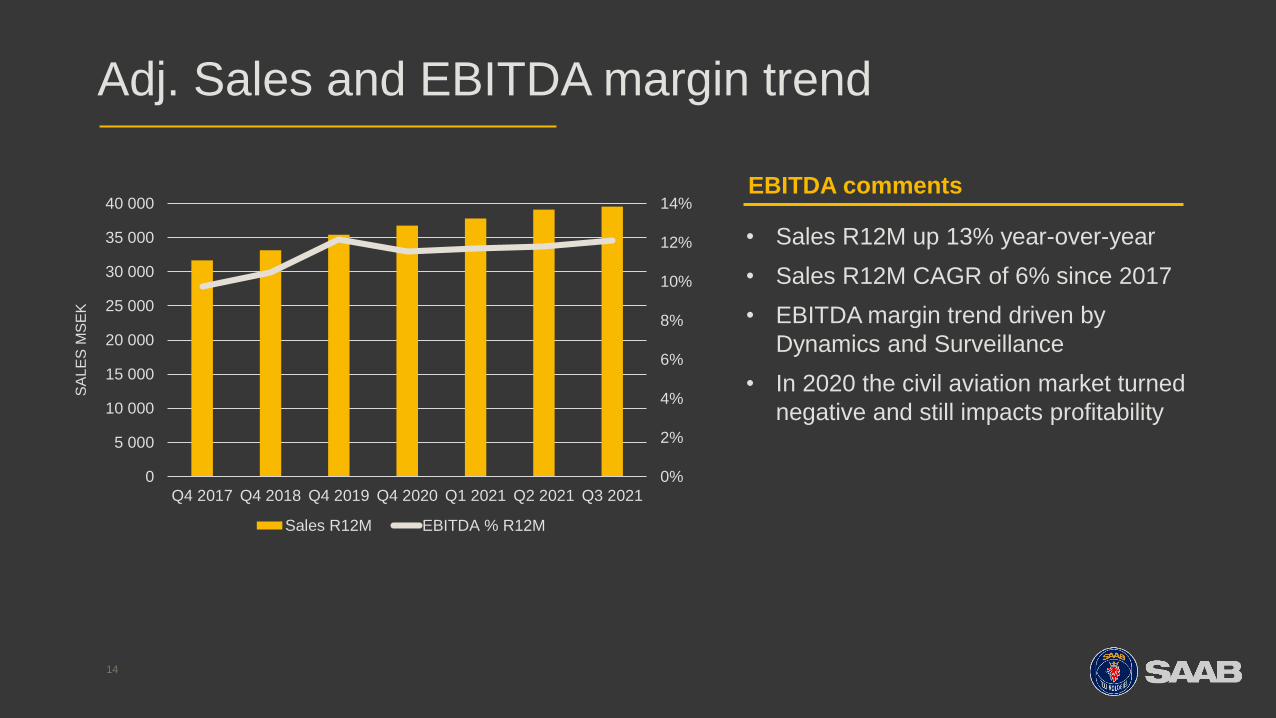
Adj. Sales and EBITDA margin trend
0%
2%
4%
6%
8%
10%
12%
14%
0
5 000
10 000
15 000
20 000
25 000
30 000
35 000
40 000
Q4 2017 Q4 2018 Q4 2019 Q4 2020 Q1 2021 Q2 2021 Q3 2021
Sales R12M EBITDA % R12M
14
EBITDA comments
SA
LE
SM
SE
K
• Sales R12M up 13% year-over-year
• Sales R12M CAGR of 6% since 2017
• EBITDA margin trend driven by
Dynamics and Surveillance
• In 2020 the civil aviation market turned
negative and still impacts profitability

• Aeronautics negatively impacted by T-7A
and by the civil aviation operations
• Strong improvement in Dynamics driven by
several project completions and deliveries
• Improved operating income in Surveillance,
partly offset by higher amortization cost and
negative South Africa operations
• Higher margins in Kockums driven by
sales growth and productivity
EBIT and margins per business area
1515
- 100
- 50
0
50
100
150
200
250
300
350
400
Aeronautics Dynamics Surveillance Kockums Combitech
Q3 2021 Q3 2020
-970
MSEK
7.6%
13.8%
6.8%
3.7%4.7%7.0%
6.4%
4.0%
EB
IT M
SE
K
EBIT margin %Business area comments
1.9%
5.2%*
*Adjusted EBIT margin %

Business summary - Combitech
16
• 2,100 employees in 4 Nordic Countries
• Core expertize in Defence, Cyber Security and
Digitalization
• No 1 in Cyber Security Services in the Nordics
with 270 consultants
• Strong in Industry 4.0, Public 4.0 and Civil &
Military Defense
• Sales up 6% y-o-y in Q3, from strong growth in
Public Sector and Defence
• EBIT margin improvement y-o-y primarily from
higher sales and cost control
• Strong market situation with high demand
MSEK Q3 2021 Q3 2020 YTD 2021 YTD 2020
Order intake 520 555 2,342 2,289
Sales 660 621 2,336 2.173
EBITDA 50 26 222 165
EBITDA margin 7.6% 4.2% 9.5% 7.6%
EBIT margin 7.0% 4.0% 9.0% 7.4%
Comments
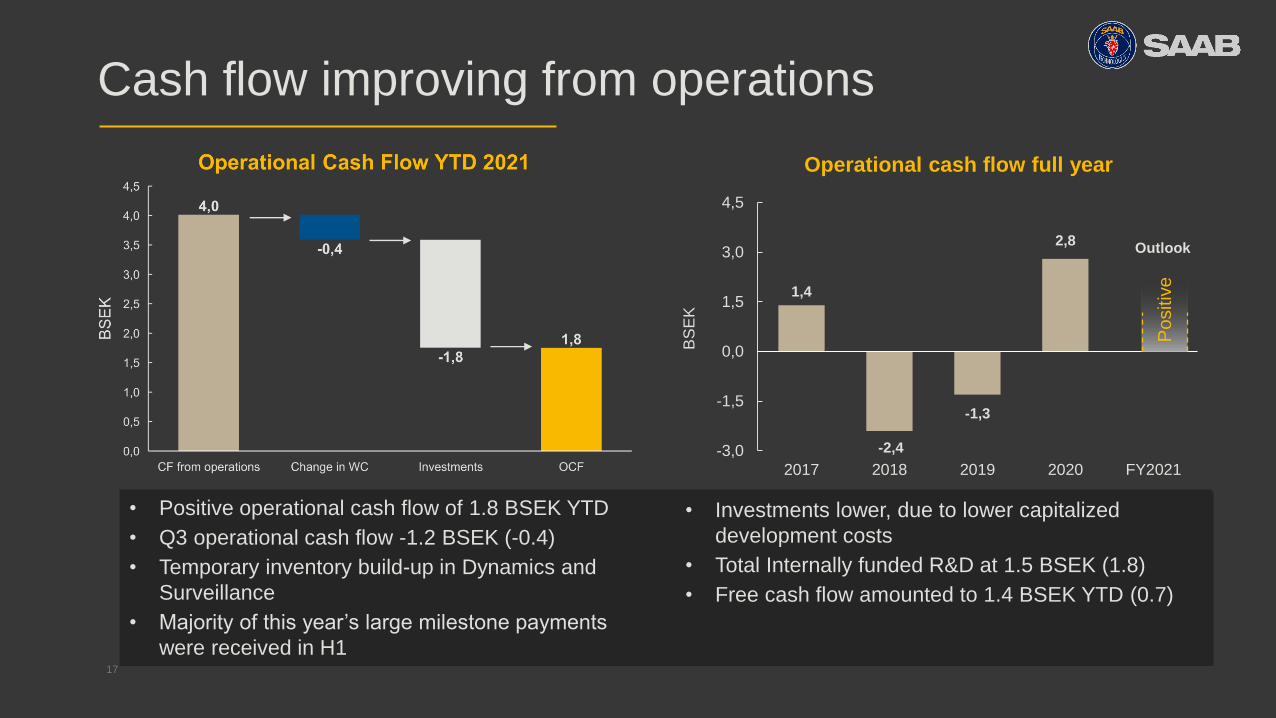
Cash flow improving from operations
17
1,4
-2,4
-1,3
2,8
-3,0
-1,5
0,0
1,5
3,0
4,5
2017 2018 2019 2020 FY2021
BS
EK
Operational cash flow full year
Po
sitiv
e
• Positive operational cash flow of 1.8 BSEK YTD
• Q3 operational cash flow -1.2 BSEK (-0.4)
• Temporary inventory build-up in Dynamics and
Surveillance
• Majority of this year’s large milestone payments
were received in H1
Outlook
• Investments lower, due to lower capitalized
development costs
• Total Internally funded R&D at 1.5 BSEK (1.8)
• Free cash flow amounted to 1.4 BSEK YTD (0.7)

Net debt Q3 2021
18
Pension liabilities Leasing liabilities (IFRS16)
2.5bn
Other cash less liabilities Net debt
3.1bn+4.5bn 3.9bn- =
Net debt/EBITDA rolling 12 months
*Adjusted for items affecting comparability.
0.64x
Reported Adjusted*
0.69x
• Debt with maturity less than 12 months equals 1.8 BSEK
• Unutilized Revolving credit facilities 6 BSEK
• Maturity 2 BSEK in 2023 and 4 BSEK in 2026
• Net Debt / Adjusted EBITDA at 0.64x comp to 1.0x at Dec 2020
• Equity / Asset ratio of 36.4% (35.5)

ORGANIC GROWTH
EBIT MARGIN
OPERATIONAL CASH FLOW
Outlook 2021*
**Adjusted for items affecting comparability.*The uncertainty surrounding Covid-19 and its future effects remain.
EBIT-margin in line with adjusted EBIT-margin for 2020 (7.4%)**
Positive
Organic sales growth for the full year to be around 10 per cent
This presentation may contain forward-looking statements which reflect Saab AB’s current view on
future events and financial and operational development. Words such as “intend”, “expect”,
“anticipate”, “may”, “believe”, “plan”, “estimate” and other expressions which imply indications or
predictions of future development or trends, and which are not based on historical facts, are
intended to identify forward-looking statements. Forward-looking statements inherently involve both
known and unknown risks and uncertainties as they depend on future events and circumstances.
Forward-looking statements do not guarantee future results or development and the actual outcome
could differ materially from the forward-looking statements.
Important information

Q&A