s10-spc-alpha operon at strain level 34 hiroto tamura ... · application note no. classification of...
TRANSCRIPT

ApplicationNote
No.
1Classification of Bacteria by MALDI-TOF MS Based on Ribosomal Protein Coding in S10-spc-alpha Operon at Strain Level
LAAN-C-XX-E019
34
Life
Scie
nce
Classification of Bacteria by MALDI-TOF MS Based on Ribosomal Protein Coding in S10-spc-alpha Operon at Strain LevelHiroto Tamura*1, Keisuke Shima*2
1. IntroductionIdentification of bacteria is associated with the environmental management and clinical microbiological testing in the food and pharmaceutical field, etc. The identification methods most commonly applied are morphological observation, physiological and biochemical characteristics testing, and DNA sequence analysis. Simple identification at the genus to species level is conducted by DNA sequence analysis, in which the 16S rRNA gene sequencing technique has become widely used in recent years; however, the following shortcomings of this approach underscore the need for a new microbial identification method.
1) Extraction of the DNA from the sample and determination of the DNA base sequence typically requires considerable time and effort.
2) These techniques require familiarity with gene handling, such as PCR and DNA sequencing.
3) Discrimination at the subspecies or strain level is generally difficult. Discrimination even at the species level can often be difficult depending on the species (Example: Bacillus cereus and Bacillus thuringiensis).
*1: Laboratory of Environmental Microbiology, Faculty of Agriculture, Meijo University
*2: Global Applications Development Center, Analytical and Measuring Instruments Division, Shimadzu Corporation
ApplicationNote
No.
2
34
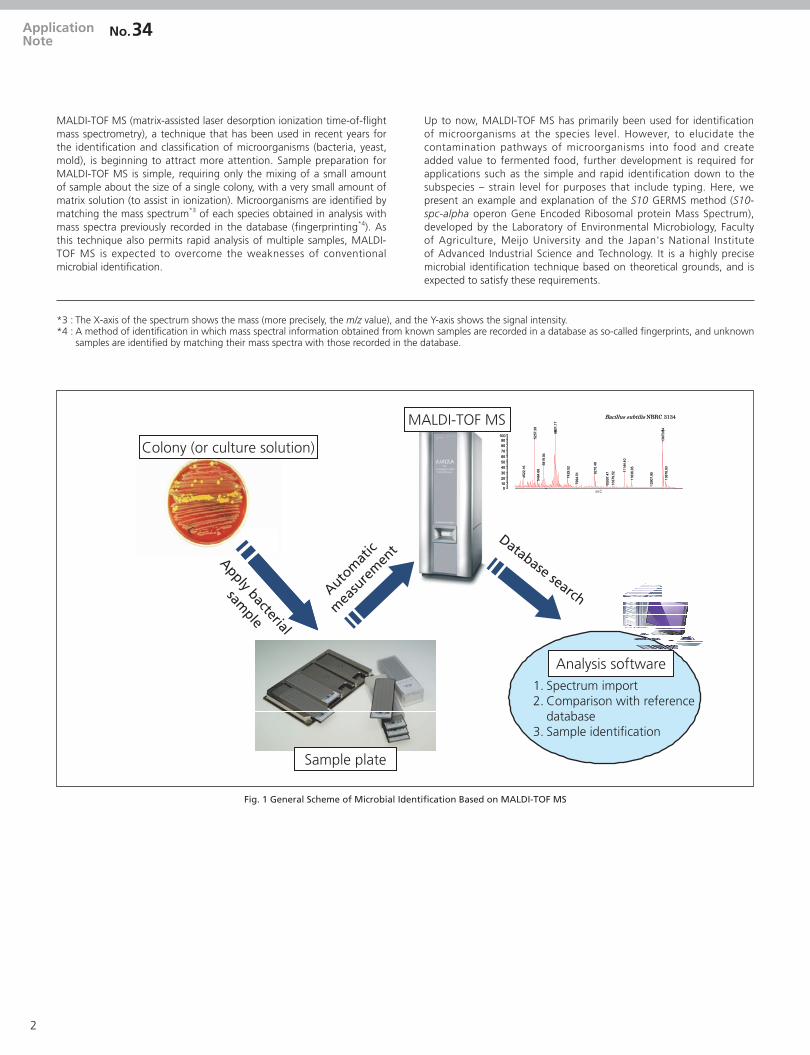
MALDI-TOF MS (matrix-assisted laser desorption ionization time-of-flight mass spectrometry), a technique that has been used in recent years for the identification and classification of microorganisms (bacteria, yeast, mold), is beginning to attract more attention. Sample preparation for MALDI-TOF MS is simple, requiring only the mixing of a small amount of sample about the size of a single colony, with a very small amount of matrix solution (to assist in ionization). Microorganisms are identified by matching the mass spectrum*3 of each species obtained in analysis with mass spectra previously recorded in the database (fingerprinting*4). As this technique also permits rapid analysis of multiple samples, MALDI-TOF MS is expected to overcome the weaknesses of conventional microbial identification.
Up to now, MALDI-TOF MS has primarily been used for identification of microorganisms at the species level. However, to elucidate the contamination pathways of microorganisms into food and create added value to fermented food, further development is required for applications such as the simple and rapid identification down to the subspecies – strain level for purposes that include typing. Here, we present an example and explanation of the S10 GERMS method (S10-spc-alpha operon Gene Encoded Ribosomal protein Mass Spectrum), developed by the Laboratory of Environmental Microbiology, Faculty of Agriculture, Meijo University and the Japan's National Institute of Advanced Industrial Science and Technology. It is a highly precise microbial identification technique based on theoretical grounds, and is expected to satisfy these requirements.
*3 : The X-axis of the spectrum shows the mass (more precisely, the m/z value), and the Y-axis shows the signal intensity.*4 : A method of identification in which mass spectral information obtained from known samples are recorded in a database as so-called fingerprints, and unknown
samples are identified by matching their mass spectra with those recorded in the database.
601.
17
.39
54
Bacillus subtilis NBRC 3134
601.
17
.39
54
Bacillus subtilis NBRC 3134MALDI-TOF MS
0102030405060708090
100
66
5257
.
1367
0.5
5819
.04
1114
4.40
9210
.48
4522
.16
7429
.52
1387
8.63
1163
6.03
5464
.66
7994
.51
1037
9.52
1000
7.47
1290
7.95
m/z0102030405060708090
100
66
5257
.
1367
0.5
5819
.04
1114
4.40
9210
.48
4522
.16
7429
.52
1387
8.63
1163
6.03
5464
.66
7994
.51
1037
9.52
1000
7.47
1290
7.95
Colony (or culture solution)
Analysis software
Sample plate
Apply bacterial
sample
Database searchAutom
atic
mea
sure
men
t
1. Spectrum import2. Comparison with reference
database3. Sample identification
Fig. 1 General Scheme of Microbial Identification Based on MALDI-TOF MS

3Classification of Bacteria by MALDI-TOF MS Based on Ribosomal Protein Coding in S10-spc-alpha Operon at Strain Level
*5 : 4-Hydroxy-3,5-dimethoxycinnamic Acid*6 : α-cyano-4-hydroxycinnamic acid
8090
100 6601
.17
5257
.39
1367
0.54
Bacillus subtilis NBRC 3134
010203040506070
5819
.04
1114
4.40
9210
.48
4522
.16
7429
.52
1387
8.63
1163
6.03
5464
.66
7994
.51
1037
9.52
1000
7.47
1290
7.95
%Int.
7271
.93
30405060708090
100 ×10
7707
.16
8325
.38
7333
.07
9064
.89
6255
.85
9738
.82
1118
3.73
1300
1.25
Escherichia coli NBRC 3972
01020
4000 6000 8000 10000 12000 14000
1029
8.41
5382
.30
4365
.97
1069
2.83
1380
3.27
m/zFig. 2 Mass Spectra of Bacillus Subtilis and Escherichia Coli
2. Microbial Identification Based on MALDI-TOF MSThe most common approach to microbial identification using MALDI-TOF MS relies on fingerprinting. Fig. 1 shows the general scheme from sample preparation to microbial identification.
A major advantage of MALDI-TOF MS is that sample preparation is extremely simple. While preparation procedures may vary slightly, the flow is basically the same. The following is an example of the preparation process.
Step 1: Bacteria scraped from a single colony on agar medium are applied to a MALDI-TOF MS sample plate.
Step 2: Matrix solution consisting of sinapic acid*5 or CHCA*6 is added via micropipette to the bacteria that were applied to the sample plate. Bacteria and matrix solution are mixed using a micropipette, and the sample solution is dried before measurement.
MALDI-TOF MS measurement can then be conducted (Whole Cell MALDI-TOF MS: WC-MS) after completing this easy sample preparation process. Typical examples (Escherichia coli and Bacillus subtilis) of the mass
spectra obtained using samples prepared in this way are shown in Fig. 2. The amount of sample required for analysis is at the μg level, and given the number of bacteria in the example, a mass spectrum specific to each type of bacterium can be obtained with a sample that contains approximately 105 E. coli.
When a sample is prepared using this general method, approximately one hundred to one hundred-fifty peaks will be observed in the obtained mass spectrum, and each one of those peaks is derived from one of the proteins comprising that bacterium. Often, the amino acid sequence is different in proteins of the same type that are derived from different bacterial species. These differences in amino acid sequence result in differences in molecular weight for the protein, or in other words, with a different x-axis value (m/z) for the detected peak. Indeed, the mass spectral patterns differ considerably depending on the type of microorganism, as shown in Fig. 2, which clearly demonstrates the effectiveness of the fingerprinting method in identification of microorganisms. An application system that combines the AXIMA series of Shimadzu MALDI-TOF MS instruments with software for microbial identification using a fingerprinting database of mass spectra for bacterial species is now being marketed in the United States and Japan as the Axima iD Plus Microbial Identification System.
ApplicationNote
No.
4
34
3. Microbial Identification by MALDI-TOF MS Using Ribosomal Proteins as BiomarkersMicrobial identification by MALDI-TOF MS fingerprinting cannot be used to specify the protein from which each observed peak substance originates, but microbial identification using fingerprinting is not especially difficult.
When using this method,1) There must be a theoretical basis for application to molecular
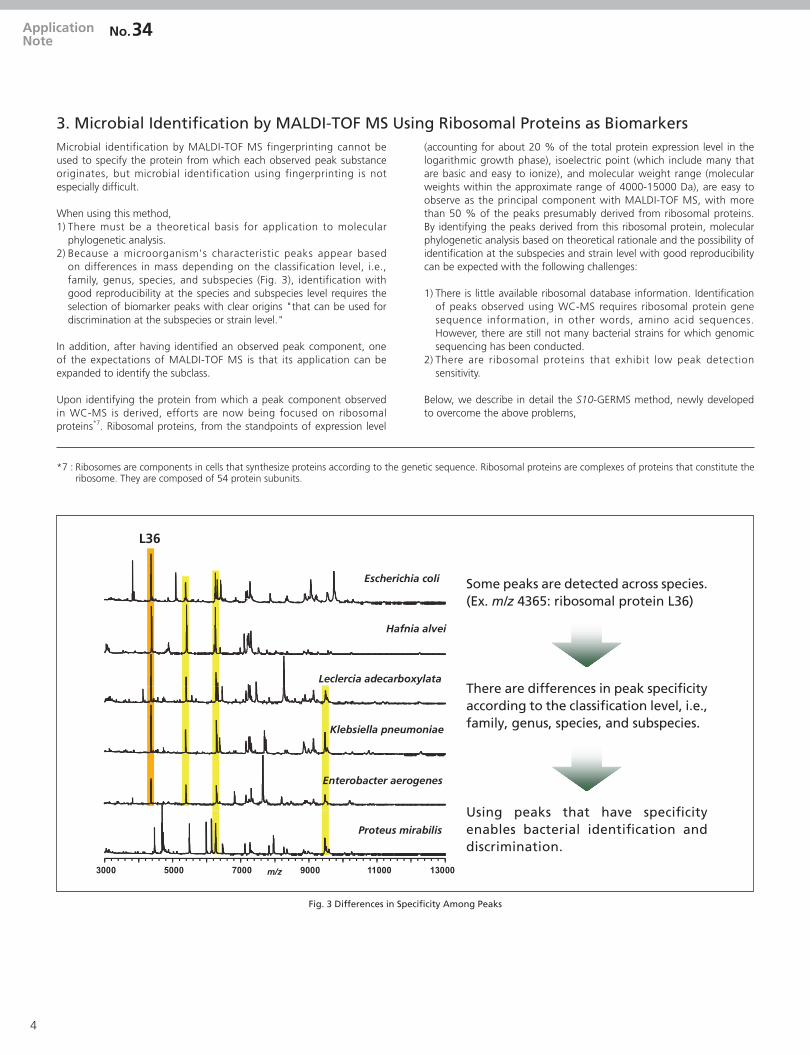
phylogenetic analysis.2) Because a microorganism's characteristic peaks appear based
on differences in mass depending on the classification level, i.e., family, genus, species, and subspecies (Fig. 3), identification with good reproducibility at the species and subspecies level requires the selection of biomarker peaks with clear origins "that can be used for discrimination at the subspecies or strain level."
In addition, after having identified an observed peak component, one of the expectations of MALDI-TOF MS is that its application can be expanded to identify the subclass.
Upon identifying the protein from which a peak component observed in WC-MS is derived, efforts are now being focused on ribosomal proteins*7. Ribosomal proteins, from the standpoints of expression level
(accounting for about 20 % of the total protein expression level in the logarithmic growth phase), isoelectric point (which include many that are basic and easy to ionize), and molecular weight range (molecular weights within the approximate range of 4000-15000 Da), are easy to observe as the principal component with MALDI-TOF MS, with more than 50 % of the peaks presumably derived from ribosomal proteins. By identifying the peaks derived from this ribosomal protein, molecular phylogenetic analysis based on theoretical rationale and the possibility of identification at the subspecies and strain level with good reproducibility can be expected with the following challenges:
1) There is little available ribosomal database information. Identification of peaks observed using WC-MS requires ribosomal protein gene sequence information, in other words, amino acid sequences. However, there are still not many bacterial strains for which genomic sequencing has been conducted.
2) There are ribosomal proteins that exhibit low peak detection sensitivity.
Below, we describe in detail the S10-GERMS method, newly developed to overcome the above problems,
*7 : Ribosomes are components in cells that synthesize proteins according to the genetic sequence. Ribosomal proteins are complexes of proteins that constitute the ribosome. They are composed of 54 protein subunits.
Escherichia coli
Hafnia alvei
Leclercia adecarboxylata
Klebsiella pneumoniae
Enterobacter aerogenes
3000 5000 7000 9000 11000 13000m/z
Proteus mirabilis
Some peaks are detected across species. (Ex. m/z 4365: ribosomal protein L36)
There are differences in peak specificity according to the classification level, i.e., family, genus, species, and subspecies.
Using peaks that have specificity enables bacterial identification and discrimination.
L36
Fig. 3 Differences in Specificity Among Peaks
5Classification of Bacteria by MALDI-TOF MS Based on Ribosomal Protein Coding in S10-spc-alpha Operon at Strain Level
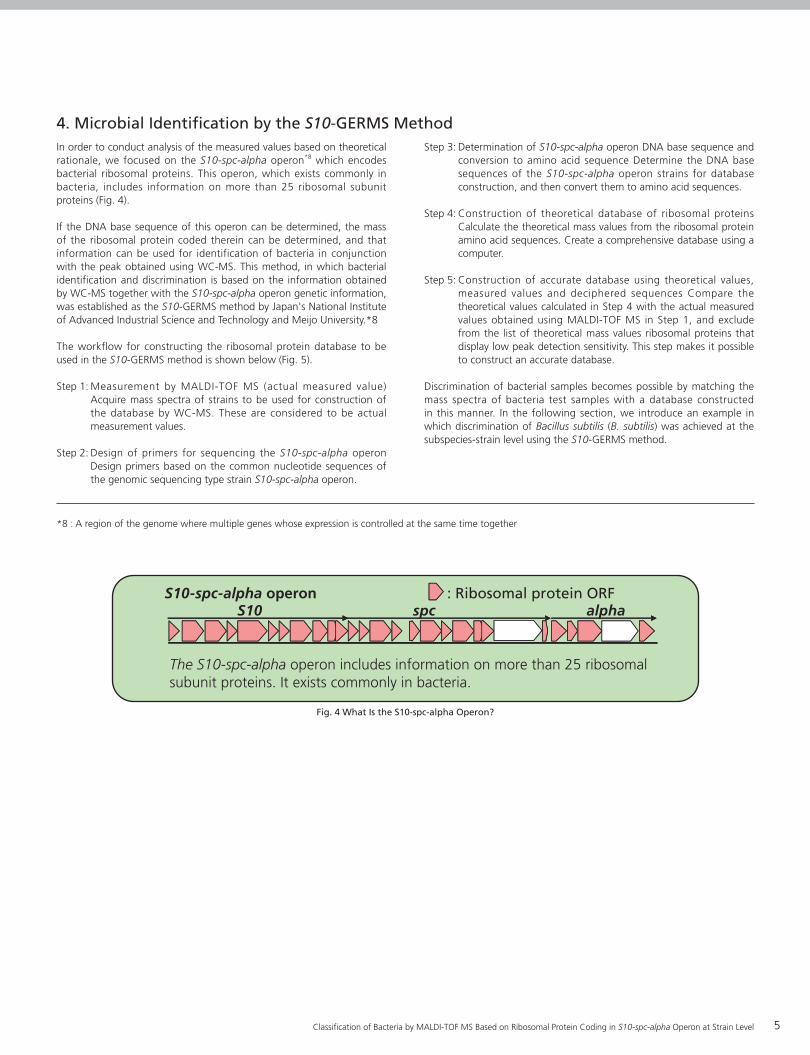
4. Microbial Identification by the S10-GERMS MethodIn order to conduct analysis of the measured values based on theoretical rationale, we focused on the S10-spc-alpha operon*8 which encodes bacterial ribosomal proteins. This operon, which exists commonly in bacteria, includes information on more than 25 ribosomal subunit proteins (Fig. 4).
If the DNA base sequence of this operon can be determined, the mass of the ribosomal protein coded therein can be determined, and that information can be used for identification of bacteria in conjunction with the peak obtained using WC-MS. This method, in which bacterial identification and discrimination is based on the information obtained by WC-MS together with the S10-spc-alpha operon genetic information, was established as the S10-GERMS method by Japan's National Institute of Advanced Industrial Science and Technology and Meijo University.*8
The workflow for constructing the ribosomal protein database to be used in the S10-GERMS method is shown below (Fig. 5).
Step 1: Measurement by MALDI-TOF MS (actual measured value)Acquire mass spectra of strains to be used for construction of the database by WC-MS. These are considered to be actual measurement values.
Step 2: Design of primers for sequencing the S10-spc-alpha operon Design primers based on the common nucleotide sequences of the genomic sequencing type strain S10-spc-alpha operon.
Step 3: Determination of S10-spc-alpha operon DNA base sequence and conversion to amino acid sequence Determine the DNA base sequences of the S10-spc-alpha operon strains for database construction, and then convert them to amino acid sequences.
Step 4: Construction of theoretical database of ribosomal proteins Calculate the theoretical mass values from the ribosomal protein amino acid sequences. Create a comprehensive database using a computer.
Step 5: Construction of accurate database using theoretical values, measured values and deciphered sequences Compare the theoretical values calculated in Step 4 with the actual measured values obtained using MALDI-TOF MS in Step 1, and exclude from the list of theoretical mass values ribosomal proteins that display low peak detection sensitivity. This step makes it possible to construct an accurate database.
Discrimination of bacterial samples becomes possible by matching the mass spectra of bacteria test samples with a database constructed in this manner. In the following section, we introduce an example in which discrimination of Bacillus subtilis (B. subtilis) was achieved at the subspecies-strain level using the S10-GERMS method.
*8 : A region of the genome where multiple genes whose expression is controlled at the same time together
Fig. 4 What Is the S10-spc-alpha Operon?
: Ribosomal protein ORFS10-spc-alpha operonS10 spc alpha
The S10-spc-alpha operon includes information on more than 25 ribosomal subunit proteins. It exists commonly in bacteria.

ApplicationNote
No.
6
34
Step 2: Design of primers for sequencing the S10-spc-alpha operon
Genome Sequencing Type Strain S10-spc-alpha Operon Base Sequence
Primer design
Primer Sequence (5'-3') -220f TTCTTCAARGGCTACCGTCC 119f CTTTTARCGGGCGTAKTSCG 615f TTCACCGAAGAAGGTGTCTC 635r GAGACACCTTCTTCGGTGAA 1505f AACAAGAAGATGTAYCGCGC 1525r GCGCGRTACATCTTCTTGTT2310f AAGCAGCATTACCGTCTGGT
S17 MAEAEKTVRT…………RAVEVS19 MPRSLKKGPF ………………KKAKR
2310f AAGCAGCATTACCGTCTGGT 2330r ACCAGACGGTAATGCTGCTT 3265f GAAGTAGCCGCTAAGTTGTC
S19L23 MNQERVFKVL……………………………SSSAES14 MAKKSMKNRE…………………………………VKASWL24 MQKIRRDDEI……………………………………KAVDAS10 MQNQQIRIRL……………………………………………QISLGL22 MEVAAKLSGA…………………………………………………KVADKL18 MTDKKVIRLR………………………………………………………………GGLEFS13 MARIAGVNIP……………………………………………………………………………KPIRK S11 MAKPAARPRK……………………………………………………………………………………KKRRVS08 MSMQDPLADM…………………………………………………………………………………………LCTVF
S19
3 S14
50
100S1
7
L23
L24
S10
L22
L18
S13 S1
1S0
8
0
Step 1: Measurement by MALDI-TOF MS (actual measured value)
<Point>Primers are designed based on common sequences of the genomic sequencing type strain S10-spc-alpha operon.
Step 3: Determination of S10-spc-alpha operon DNA base sequence and conversion to amino acid sequence
Fig. 5 Ribosomal Protein Database Construction ― Workflow

7Classification of Bacteria by MALDI-TOF MS Based on Ribosomal Protein Coding in S10-spc-alpha Operon at Strain Level
P. putida P. fulva P. fluorescens P.azotoformansP.chlororaphis P. aeruginosa P.mendocina P. straminea P. stutzeri P.alcaligenes
NBRC 14164 NBRC 16637 NBRC 14160 NBRC 12693 NBRC 3904 NBRC 12689 NBRC 14162 NBRC 16665 NBRC 14165 NBRC 14159
L22 11911.95 11911.95 11911.95 11911.95 11911.95 11911.95 11911.95 11911.95 11897.92 11893.91L23 10900.65 10900.65 10945.74 10945.74 10945.74 10950.71 11015.74 11085.83 10920.64 10955.60L29 7173.31 7173.31 7173.31 7173.31 7173.31 7202.35 7205.35 7215.39 7274.42 7215.44S10 11753.58 11753.58 11753.58 11753.58 11753.58 11767.61 11783.61 11755.55 11753.58 11783.61S17 9902.53 9902.53 9966.58 9966.58 9984.61 9955.60 9974.55 10014.66 9973.57 9957.61S19 10218.07 10218.07 10246.12 10189.07 10204.04 10227.08 10175.98 10190.01 10162.99 10186.01L18 12497.41 12485.36 12556.43 12512.38 12512.38 12531.43 12413.29 12457.30 12477.34 12561.35L24 11330.24 11330.24 11336.25 11336.25 11345.26 11471.46 11344.27 11344.27 11413.37 11340.32L30 6334.54 6292.46 6395.60 6395.60 6395.60 6347.44 6363.48 6448.54 6463.62 6278.33L36 4435.39 4435.39 4435.39 4435.39 4435.39 4435.39 4435.39 4435.39 4421.36 4407.34S08 13845.12 13861.12 13962.26 13920.23 13973.29 14040.42 13928.16 13914.18 13869.10 13951.25S14 11259.27 11288.27 11304.32 11304.32 11274.24 11435.25 11359.15 11385.32 11326.23 11394.33S11 13529.50 13529.50 13485.44 13485.44 13499.47 13499.47 13517.48 13479.39 13513.50 13503.46S13 13126.31 13140.34 13210.43 13164.45 13239.43 13135.23 13118.33 13058.28 13176.42 13177.40
Step 4: Construction of theoretical database of ribosomal proteins
Step 5: Construction of accurate database using theoretical values, measured values and deciphered sequences
Fig. 5 (cont'd) Ribosomal Protein Database Construction ― Workflow

ApplicationNote
No.
8
34
5. Phylogenetic Analysis and Discrimination at Strain Level by S10-GERMS Method ― Actual ExampleB. subtilis is a type of resident bacteria widely present in the natural environment, including the air and soil. Because of its high heat resistance, it is widely known to be one of the microorganisms that cause bacterial contamination in food factories, etc. Fig. 6 shows examples of mass spectra of Bacillus bacteria type strains. Comparison of these with the data in a ribosomal protein database confirmed, with good repeatability, that the detected ribosomal protein is the same as that of Bacillus bacteria. Next, the homology of the 16S rRNA gene is 99.9 % (1473 of the 1475 bases match), with comparison of the mass spectra of B. subtilis subsp. subtilis NBRC 13719T, B. subtilis subsp.
Spizizenii NBRC 101239T, and B. subtilis NBRC 104440 shown in Fig. 7. The differences among the masses of the ribosome subunit proteins L29, L22 and L18 peaks of the B. subtilis strains suggests that discrimination among these is possible at the strain level. Eight types of ribosomal proteins were singled out as biomarkers from among those encoded in the ribosomal protein S10-spc-alpha operon, and the results of cluster analysis*9 for each strain of B. subtilis based on this information are shown in Fig. 8. The S10-GERMS method based on these 8 biomarkers was shown to be effective in discriminating among the variants of the B. subtilis strains at the subspecies and strain levels.
*9 : The classification technique in which similar items among a larger number of items are grouped together (clustered).
L24
60
80
100
60
80
100
36 L34
32
a) B. cereus NBRC 15305T
5100 4 20 4100
11000 12000 13000 14000 15000 16000m/z
L20
S10
L22
L18
S09
S12
0
20
40
0
20
40
4000 5000 6000 7000 8000 9000 10000 11000m/z
S18
L30
S14
S15
S19
L L L3
L28
L35
L29
S20 S1
6
b) B. subtilis subsp. subtilis NBRC 13719T
L35
0
20
40
60
80
4000 5000 6000 7000 8000 9000 10000 11000m/z
L34
L36
L32
L28 S2
0
S19
S14
S15
S18
L29 S1
6
L30
L2
11000 12000 13000 14000 15000 16000m/z
0
20
40
60
80
L22
L18
S10
L20
S09
S12
Fig. 6 MALDI Mass Spectra of Bacillus Type Strains

9Classification of Bacteria by MALDI-TOF MS Based on Ribosomal Protein Coding in S10-spc-alpha Operon at Strain Level
L29 L22 L18a)
b)
c)
Inte
nsity
(%
)
7700 7800m/z
12500 13000m/z
a ) B. subtilis subsp. subtilis NBRC 13719T
b ) B. subtilis subsp. spizizenii NBRC 101239T
c ) B. subtilis NBRC 104440
50
100
50
100
0
50
1000
1000
50
1000
100
0
50
0
50
B. subtilis NBRC13719T
B. subtilis NBRC14474390.05 B. subtilis NBRC14415
B. subtilis NBRC101588
B. subtilis subsp. spizizenii NBRC101239T
B. subtilis NBRC1372239
36
B. subtilis NBRC101246
B. subtilis NBRC104440
Fig. 7 Comparison of Mass Spectra of B. subtilis Strains
Fig. 8 Results of B. subtilis Cluster Analysis (by neighbor-joining method)

ApplicationNote
No.
10
34
6. ConclusionThe advantages of conducting microbial identification by MALDI-TOF MS, namely fast and simple operation and low running costs, can be expected to shift attention to this alternative toward morphological, physiological and biochemical techniques. This in turn will advance progress in the field of clinical microbiology. On the other hand, further expectations of MALDI-TOF MS include the identification of
microorganisms in addition to discrimination at the subspecies-strain level for the purpose of typing, etc. Discrimination of bacteria using MALDI-TOF MS has not reached the stature of conventional methods with respect to typing, but with the appearance of the S10-GERMS method based on theoretical rationale, it can be expected to occupy a position as one of the leading strain typing methods.
11Classification of Bacteria by MALDI-TOF MS Based on Ribosomal Protein Coding in S10-spc-alpha Operon at Strain Level
-Related Products-
MALDI-TOF Mass Spectrometer Microorganism Identification and Classification System
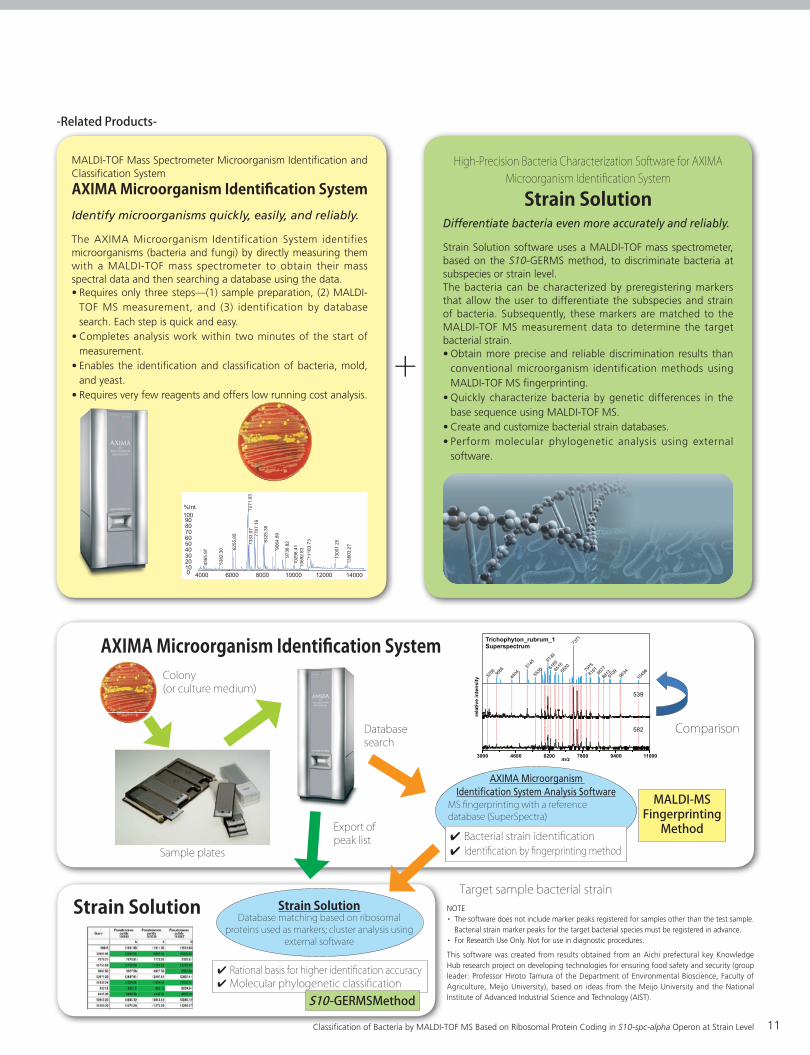
AXIMA Microorganism Identification SystemIdentify microorganisms quickly, easily, and reliably.
The AXIMA Microorganism Identification System identifies microorganisms (bacteria and fungi) by directly measuring them with a MALDI-TOF mass spectrometer to obtain their mass spectral data and then searching a database using the data.• Requires only three steps—(1) sample preparation, (2) MALDI-
TOF MS measurement, and (3) identification by database search. Each step is quick and easy.
• Completes analysis work within two minutes of the start of measurement.
• Enables the identification and classification of bacteria, mold, and yeast.
• Requires very few reagents and offers low running cost analysis.
High-Precision Bacteria Characterization Software for AXIMA Microorganism Identification System
Strain SolutionDifferentiate bacteria even more accurately and reliably.
Strain Solution software uses a MALDI-TOF mass spectrometer, based on the S10-GERMS method, to discriminate bacteria at subspecies or strain level.The bacteria can be characterized by preregistering markers that allow the user to differentiate the subspecies and strain of bacteria. Subsequently, these markers are matched to the MALDI-TOF MS measurement data to determine the target bacterial strain.• Obtain more precise and reliable discrimination results than
conventional microorganism identification methods using MALDI-TOF MS fingerprinting.
• Quickly characterize bacteria by genetic differences in the base sequence using MALDI-TOF MS.
• Create and customize bacterial strain databases.• Perform molecular phylogenetic analysis using external
software.
0 10 20 30 40 50 60 70 80 90
%Int.
4000 6000 8000 10000 12000 14000
7271
.93
7707
.16
8325
.38
7333
.07
9064
.89
6255
.85
9738
.82
1118
3.73
1029
8.41
5382
.30
4365
.97
1069
2.83
1300
1.25
1380
3.27
10 20 30 40 50 60 70 80
%Int.
4000 6000 8000 10000 12000 14000
7271
.93
7707
.16
8325
.38
7333
.07
9064
.89
6255
.85
9738
.82
1118
3.73
1029
8.41
5382
.30
4365
.97
1069
2.83
1300
1.25
1380
3.27
100
0
+
AXIMA Microorganism Identification System
Strain Solution
Colony(or culture medium)
Database search
Sample plates
3000 4600 6200 7800 9400 11000
rela
tive
inte
nsity
3685
3256
4404
5145
5535
6139
6820 79
75
8577
8161
9109
8813 96
3410
49661
65
7371
539
Trichophyton_rubrum_1Superspectrum
582
m/z
Comparison
Export of peak list
AXIMA Microorganism Identification System Analysis Software
MS fingerprinting with a reference database (SuperSpectra)
✔ Bacterial strain identification✔ Identification by fingerprinting method
Strain SolutionDatabase matching based on ribosomal
proteins used as markers; cluster analysis using external software
✔ Rational basis for higher identification accuracy✔ Molecular phylogenetic classification
S10-GERMSMethod
MALDI-MS Fingerprinting
Method
Target sample bacterial strainNOTE
・ The software does not include marker peaks registered for samples other than the test sample. Bacterial strain marker peaks for the target bacterial species must be registered in advance.
・ For Research Use Only. Not for use in diagnostic procedures.
This software was created from results obtained from an Aichi prefectural key Knowledge Hub research project on developing technologies for ensuring food safety and security (group leader: Professor Hiroto Tamura of the Department of Environmental Bioscience, Faculty of Agriculture, Meijo University), based on ideas from the Meijo University and the National Institute of Advanced Industrial Science and Technology (AIST).

ApplicationNote
No.
2014
34
First Edition: April, 2014
[Acknowledgments]
[References]
The results in part of this Application Note are thanks to the support of the Aichi prefectural key Knowledge Hub research project on developing technologies for ensuring food safety and security.
• Yudai Hotta, Kanae Teramoto, Hiroaki Sato, Hiromichi Yoshikawa, Akifumi Hosoda, and Hiroto Tamura: Classification of Genus Pseudomonas by MALDI-TOF MS Based on Ribosomal Protein Coding in S10-spc-alpha Operon at Strain Level. J. Proteome Res. , 2010, 9 (12), 6722–6728.
• Yudai Hotta, Hiroaki Sato, Akifumi Hosoda, and Hiroto Tamura: MALDI-TOF MS analysis of ribosomal proteins coded in S10 and spc operons rapidly classified the Sphingomonadaceae as alkylphenol polyethoxylate-degrading bacteria from the environment. FEMS Microbiol. Lett., 2012, 330, 23-29
• Yudai Hotta, Jun Sato, Hiroaki Sato, Akifumi Hosoda, and Hiroto Tamura: Classification of the Genus Bacillus Based on MALDI-TOF MS Analysis of Ribosomal Proteins Coded in S10 and spc Operons. J. Agric. Food Chem., 2011, 59 (10), 5222–5230.