s pdb viewer
DESCRIPTION
swissTRANSCRIPT
http://www.proteinstructures.com/Modeling/Modeling/model-quality.html
estimate the quality or correctness of the model. Among these criteria is model energy, model geometry (bonds, the Ramachandran plot)
interactions with surrounding atoms). If there are no bad contacts, the energy is around or below zero, whereas bad contacts will have high energy above the zero (red regions).
It is also possible to use the energy minimization tool of SPDBV for removing high energies. Note: this tool provides hints and should be used in conjunction with the analysis of the hydrophobicity of residues, the overall structure, and common sense! It works better for displacement of large fragments than for just one or two residues, as it analyses the mean force potential for the whole protein. One should also develop a habit of inspection of suspicious regions of the structure directly on the graphics screen. You will see directly a potential problem, if you are used to analyze protein structures.At the early stages of homology modeling you can also evaluate how good your model is by using the "select aa making clashes" items of the "Select" menu. This will allow you to quickly focus on potentially problematic regions (holding the option key while you select these will not only select aa but also draw the clashes in pink on the screen). You can then choose the "Fix Selected Sidechains (quick and dirty)" item of the "Tools" menu, which will browse the rotamer library to choose the best rotamer (the same commands are used if you want to replace an amino acid by another). By repeating the "Select aa making clashes" process, you should see that far less amino-acids are making problems. If not, this is probably a good clue that your threading is incorrect.Important Note: Fixing the side chains is just for you to evaluate the preliminary model prior to submitting it to the server. It will have little influence on model building and the quality of the final model, as the server reconstructs side chains during that process.
ANOLEA makes an assessment of packing quality of the model. This will immediately reveal if there are regions with steric clashes (atoms coming too close to each other), since such regions will have very high energy. The GROMOS potential is used for the analysis of conformations obtained by protein homology modeling
http://spdbv.vital-it.ch/TheMolecularLevel/ModQual/#Threading energy (homology mode
Threading energy (homology modeling)
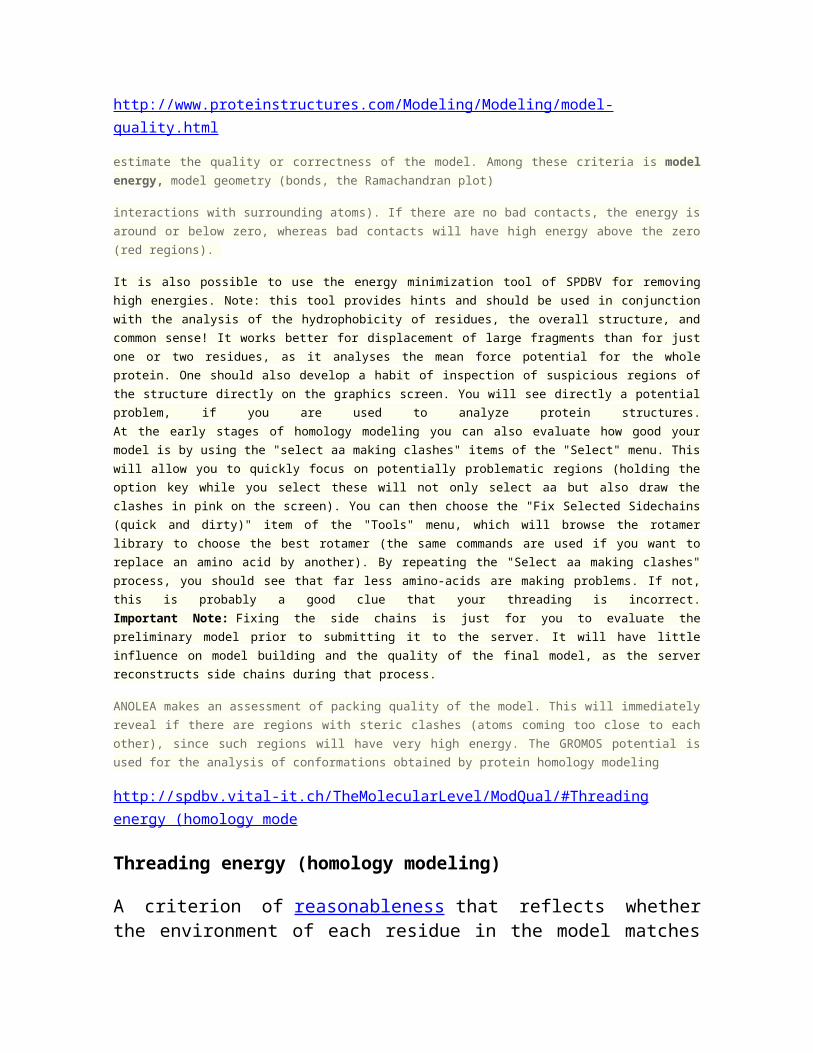
A criterion of reasonableness that reflects whether the environment of each residue in the model matches what is found for the same residue type in a representative set of protein folds. For a given residue, a small value of threading energy implies a reasonable environment for that residue type. Examples of residues that would have high threading energies are 1) a hydrophobic residue on the surface of a model, or 2) an ionic residue buried without compensating charge in a hydrophobic core.
Region of high threading energy (red ribbon) in a homology model. A possible reason for high threading energy here is the presence of cysteine in a surface loop. Note in comparing this view with the full model that this is also a region of high model B-factor, and hence a low-confidence region. Convergent stereo.
Manual SwissPDB
Computing pseudo energy: mean force potential (also pair potential, threadingenergy, or PP)When modeling structures, a plot of PP versus the amino acid sequence lets you quickly visualizewhich region of the alignment might be wrong (PP values above zero indicate that this arrangement is not observed in the set of protein structures that was used for the training of the PP).
Computing energy: force field (also FF)
Both displaying the resulting force at each atom, and plotting the FF vs. the amino acid sequence, will let you quickly visualize parts of the structure with incorrect geometry or too close contacts.
Assessing Protein Structures with a Non-local Atomic Interaction EnergyMean force potentialcorrelate high scores with point errors and misalignments in the models The point errors are frequently found in loops or regions of structural differences between the template and the target protein The misalignments are clearly detected with very high scores. If the alignment of the sequence on its template is not correct, the model is guaranteed to be wrong
http://spdbv.vital-it.ch/distort_tut.html
Identifying Distorted Residues.
The best way to illustrate this is to give a practical example. Load the protein 1CRN.pdb (which is included in the tutorial package), and color it by Force Field Energy (but do only compute bond and angles energies; and do not show the energy report). Overall, the protein topology is correct, the residue with the highest energy (the more bond distortion) beeing Proline 5.
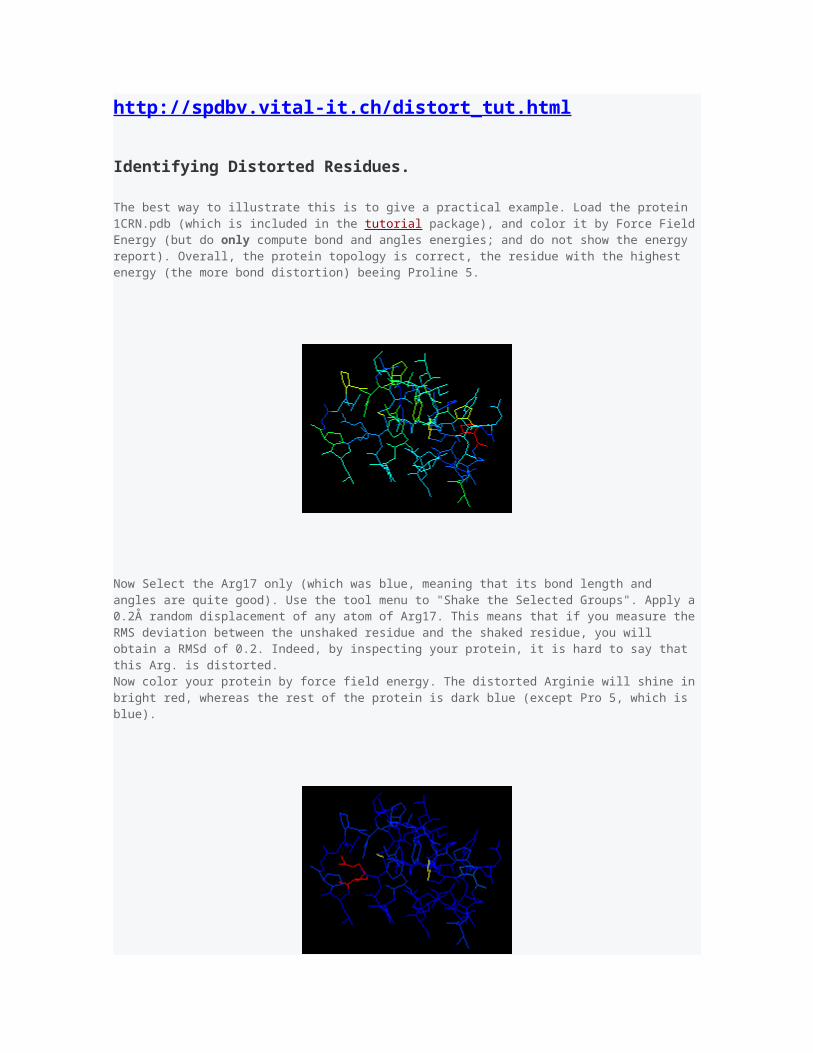
Now Select the Arg17 only (which was blue, meaning that its bond length and angles are quite good). Use the tool menu to "Shake the Selected Groups". Apply a 0.2Å random displacement of any atom of Arg17. This means that if you measure the RMS deviation between the unshaked residue and the shaked residue, you will obtain a RMSd of 0.2. Indeed, by inspecting your protein, it is hard to say that this Arg. is distorted.Now color your protein by force field energy. The distorted Arginie will shine in bright red, whereas the rest of the protein is dark blue (except Pro 5, which is blue).
http://spdbv.vital-it.ch/modeling_tut.htmlClick on the "smooth" text, and set a smoothing factor of 1. It means that the energy off each residue will be the average of itself plus the energy of 1 flanking residue on each side.
http://sebbm.es/BioROM/contenido/JCorzo/temascompletos/InteraccionesNC/inicial/radio_de_van_der_waals.htmSi inicialmente los átomos están suficientemente alejados no interaccionan entre ellos; ahora bien, al acercarse se atraen cada vez con más fuerza, debido a las fuerzas de London, que se discuten más adelante. Esta atracción aumenta rápidamente al disminuir la distancia interatómica. Por otra parte, a distancias muy pequeñas los átomos experimentan una fuerte repulsión (es la repulsión de Van der Waals) debida a las nubes electrónicas, muy juntas y que se repelen fuertemente al tener carga negativa. Esta repulsión depende de la duodécima potencia de la distancia interatómica, por lo que sólo es importante cuando la distancia interatómica es muy pequeña. Del balance (mostrado en verde) de las fuerzas anteriores, atracción y repulsión, se establece un equilibrio que es el que alcanzarían espontáneamente los dos átomos en ausencia de influencias exteriores. La distancia a la que se disponen los dos átomos es la distancia de Van der Waals.
Busqueda Google: van der waals radiihttp://academic.reed.edu/chemistry/roco/Geometry/vdw_radius.html
van der Waals radius
Our study of limonene showed that atoms do not approach each other closely when they are not bonded to each other. This suggests that atoms in different molecules cannot approach each other closely either and must occupy a well-defined molecular volume.
One way to measure molecular volumes is to study gas behavior over a range of temperatures. Real gases do not perfectly obey the ‘ideal’ gas law (PV = nRT), and deviations between ‘ideal’ and real behavior can give information about molecular volume.
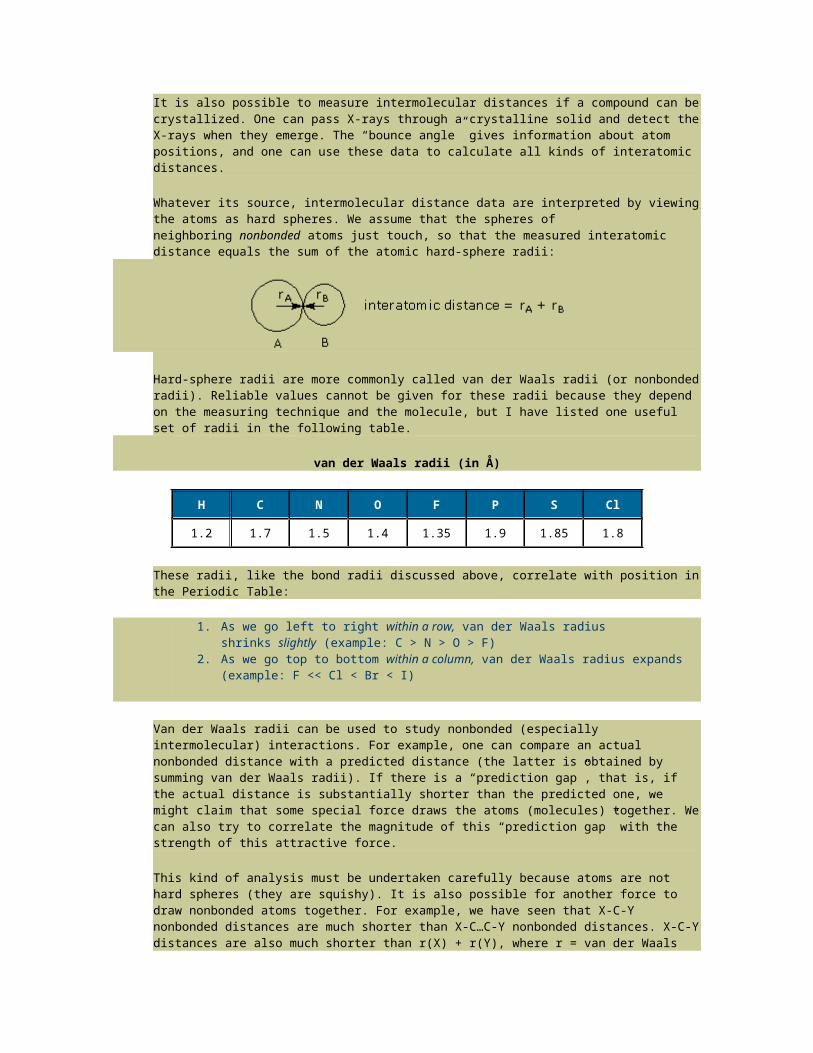
It is also possible to measure intermolecular distances if a compound can be crystallized. One can pass X-rays through a crystalline solid and detect the X-rays when they emerge. The “bounce angle” gives information about atom positions, and one can use these data to calculate all kinds of interatomic distances.
Whatever its source, intermolecular distance data are interpreted by viewing the atoms as hard spheres. We assume that the spheres of neighboring nonbonded atoms just touch, so that the measured interatomic distance equals the sum of the atomic hard-sphere radii:
Hard-sphere radii are more commonly called van der Waals radii (or nonbonded radii). Reliable values cannot be given for these radii because they depend on the measuring technique and the molecule, but I have listed one useful set of radii in the following table.
van der Waals radii (in Å)
H C N O F P S Cl
1.2 1.7 1.5 1.4 1.35 1.9 1.85 1.8
These radii, like the bond radii discussed above, correlate with position in the Periodic Table:
1. As we go left to right within a row, van der Waals radius shrinks slightly (example: C > N > O > F)
2. As we go top to bottom within a column, van der Waals radius expands (example: F << Cl < Br < I)
Van der Waals radii can be used to study nonbonded (especially intermolecular) interactions. For example, one can compare an actual nonbonded distance with a predicted distance (the latter is obtained by summing van der Waals radii). If there is a “prediction gap”, that is, if the actual distance is substantially shorter than the predicted one, we might claim that some special force draws the atoms (molecules) together. We can also try to correlate the magnitude of this “prediction gap” with the strength of this attractive force.
This kind of analysis must be undertaken carefully because atoms are not hard spheres (they are squishy). It is also possible for another force to draw nonbonded atoms together. For example, we have seen that X-C-Y nonbonded distances are much shorter than X-C…C-Y nonbonded distances. X-C-Y distances are also much shorter than r(X) + r(Y), where r = van der Waals radius. The large “prediction gap” does not mean that X and Y attract each other, however. A much more likely explanation is that C forces X and Y to approach each other in order to make CX and CY bonds.
Homology modelling: a review about the method on hand of the diabetic antigen GAD 65 structure prediction Molecular surfaces are defined by the van der Waals radii of the constituted atoms. The van der Waals radius of an atom is the radius of the sphere around the atom centre, which cannot be entered by anotheratoms spherical boundary because of an increasing repulsive force�http://structure.usc.edu/mmtk/MMTK_4.htmlhttp://dirac.cnrs-orleans.fr/Manuals/MMTK/mmtk.html#energy-minimizationMMTK has two energy minimizers using different algorithms: steepest descent (MMTK.Minimization.SteepestDescentMinimizer) and conjugate gradient (MMTK.Minimization.ConjugateGradientMinimizer) . Steepest descent minimization is very inefficient if the goal is to find a local minimum of the potential energy. However, it has the advantage of always moving towards the minimum that is closest to the starting point and is therefore ideal for removing bad contacts in a unreasonably high energy configuration. For finding local minima, the conjugate gradient algorithm should be used.
Busqueda Google: chimera minimization force fieldhttp://plato.cgl.ucsf.edu/pipermail/chimera-users/2011-March/006197.htmlhttp://www.cgl.ucsf.edu/chimera/1.5.3/docs/ContributedSoftware/minimize/minimize.html
Minimize Structure <="" h3="">
Minimize Structure energy-minimizes molecule models, optionally holding some atoms fixed. Minimization routines are provided by MMTK, which is included with Chimera.Amber parameters are used for standard residues, and Amber's Antechamber module (also included with Chimera) is used to assign parameters to nonstandard residues.
Minimize Structure is in early development and has several limitations.
There are several ways to start Minimize Structure, a tool in the Structure Editing category. It is also implemented as the command minimize.
Models to minimize can be chosen from the list with the left mouse button. Ctrl-click toggles the status of an individual model. To choose a block of models without dragging, click on the first (or last) and then Shift-click on the last (or first) in the desired block. All chosen models are treated as a single system for energy calculations; other models are ignored.
Currently, only steepest descent minimization is performed.
Steps (default 100) - maximum number of minimization steps Step size (A) (default 0.02 Å) - initial step length Update interval (default 10) - how frequently to update the display, in
terms of minimization steps Fixed atoms - atoms to hold in place during minimization:
o none (default) - all atoms will be allowed to moveo selected - any selected atoms should be held fixed, all other
atoms allowed to moveo unselected - any selected atoms should be allowed to move, all
other atoms held fixed Memorize options chosen in subsequent dialogs - as explained
below, Dock Prep and further tools may be called to prepare structures for minimization; this option specifies saving their settings in the preferences file for future uses of Minimize Structure
Use previously memorized options, if any - use settings saved with the preceding option in a prior use of Minimize Structure
Neither memorize nor use memorized options - do not use previously saved settings; show the dialogs so that settings can be chosen explicitly for this use of Minimize Structure, but do not save the settings
Clicking Minimize dismisses the dialog (unless the option to Keep dialog up after Minimize is checked) and may call Dock Prep to perform several tasks to prepare the system for energy calculations. In turn, Dock Prep may call additional tools:
AddH to add hydrogens. If Minimize has already been clicked, the selection will be adjusted prior to minimization to include any newly attached atoms in the fixed and movable sets. Note that any other models in the vicinity will influence hydrogen placement even if hydrogens are not being added to those other models. If such interactions are not desired, the other models should be closed beforehand.
Add Charge to associate atoms with partial charges and other force field parameters. Required even when alternative charges will be used.
It is sometimes useful to run Dock Prep independent of Minimize Structure beforehand, then skip all tasks when it reappears after Minimize is clicked:
adding hydrogens separately beforehand allows them to be deleted or repositioned as needed prior to minimization
adding charges separately beforehand allows alternative charges to be specified prior to minimization
Close dismisses the Minimize Structure dialog. Help opens this manual page in a browser window.
Force Field Parameters
Different procedures are used to assign parameters to standard residues, monatomic ions, and nonstandard residues.
Standard residues include water, standard amino acids, standard nucleic acids, and a few common variants and capping groups.
1. Add Charge recognizes standard residues based on their atom and residue names and assigns Amber residue names.
2. Add Charge assigns Amber ff99 atomic partial charges (details).3. Minimize Structure uses the Amber residue names to associate
standard residues with Amber ff99 parameters other than charges.
Monatomic ions are assigned user-specified net charges and Amber ff99 VDW parameters. Only the ions in ff99 are handled: Na+, K+, Rb+, Cs+, Mg2+, Ca2+, Zn2+, and Cl–.
Nonstandard residues are all residues not recognized as standard residues or monatomic ions.
1. Add Charge uses Amber's Antechamber module (included with Chimera) to assign GAFF types and calculate atomic partial charges within each nonstandard residue. It is necessary to specify the formal charge of each nonstandard residue and which charge calculation
method should be used. Publications involving Antechamber use should cite:
Automatic atom type and bond type perception in molecular mechanical calculations. Wang J, Wang W, Kollman PA, Case DA. J Mol Graph Model. 2006 Oct;25(2):247-60.
2. Minimize Structure uses the GAFF types to associate nonstandard residues with parameters other than charges. The GAFF atom types and associated parameters are described online and in:
Development and testing of a general amber force field. Wang J, Wolf RM, Caldwell JW, Kollman PA, Case DA. J Comput Chem. 2004 Jul 15;25(9):1157-74.
User-Specified Partial Charges
For nonstandard residues, arbitrary partial charges (such as obtained from the literature or parameter databases) can be specified. To do so:
1. run Dock Prep independent of Minimize Structure to perform any necessary tasks including charge addition (thus running Add Charge)
2. reassign the charge attribute of the atoms to the desired values (using Define Attribute, defattr, or setattr)
3. run Minimize Structure and turn off all options in the ensuing Dock Prep dialog, as the necessary tasks have already been performed
This procedure will not work for atoms in standard residues, because Minimize Structure will always associate those atoms with the standard parameters, including charges.
Limitations
Lack of access to many settings. There is no way to specify several MMTK settings, including minimization algorithm and force field options such as distance cutoffs. MMTK defaults are used.
No choice of force field. The only force fields in MMTK suitable for biomolecular simulations are Amber ff94 and ff99. Minimize Structure uses ff99 for standard residuesand GAFF for nonstandard residues.
Limited ability to use arbitrary parameters. It is difficult to change or add parameters. For nonstandard residues only, arbitrary partial charges can be specified.
http://ambermd.org/The force field
More information about Amber force fields
Glycam parameters for carbohydrates Amber/Glycam input configurator tool , a web-based interface to help prepare
inputs for sander. Modified nucleosides for RNA , prepared by the groups of John SantaLucia and
Berny Schlegel at Wayne State. Zinc parameters , from Yuan-Ping Pang. REDDB (Resp Esp charge Data Base) , a database of resp charges and force field
libraries for small molecules and biological molecular fragments, by P. Cieplak, F. Dupradeau and co-workers.
The ff99SBildn force field contains some modifications to ff99SB, described here: K. Lindorff-Larsen, S. Piana, K. Palmo, P. Maragakis, J.L. Klepeis, R.O. Dror and D.E. Shaw. Improved side-chain torsion potentials for the Amber ff99SB protein force field. Proteins, 78:1950, 2010. To use these, download the ff99SBildn.tar file, untar it in your $AMBERHOME directory, and type "source leaprc.ff99SBildn" in your LEaP input.
The ff99SBnmr force field contains another set of torsional modifications for ff99SB. See D.-W. Li and R. Bruschweiler. NMR-based protein potentials. Angew. Chem. Int. Ed. 49:6778, 2010.
Contributed parameters database, maintained by Richard Bryce at the University of Manchester
Using the Amber force field in other software packages
Using the Amber force fields in Accelrys programs (via AmberFFC). Using the Amber force field in Gaussian QM/MM calculations . Using the Amber force field in NAMD (UIUC documentation). Using the Amber force field in NAMD (Rutgers documentation). Using the Amber force field in CHARMM . Using the Amber force field in GROMACS (via ffamber). Using the Amber force field in GROMACS (via acpype). Using the Amber force field in X-plor
Using the Amber force field in MOLDEN ; (see also this link.) Using the Amber force field in desmond (Preliminary version) Using the Amber force field in openMM
http://spdbv.vital-it.ch/display_guide.html
Show H-bondsSame for H-bonds, providing that they have been computed ! (to compute H-bonds of the current layer, choose the appropriate item of the "Edit" menu)
Show H-bonds distancesDraw the distance between donor and acceptor at the middle of each H-bond. When several H-bonds are very close, some screen garbage can occur, and you may need to rotate a little the molecule to be able to read the distance. (This menu can also be accessed from the Layer Infos Window)
Show only H-bonds from selectionShow only H-bonds whose one extremity belongs to the selected groups (groups appearing in red in the control panel)
Show only groups with visible H-bondsAllows to focus on important things. Very useful in conjunction with the previous function:Imagine that you want to display only groups that make H-bonds with an enzymatic cofactor (NAD, ATP...) click on NAD in the control panel (it is now the only selected group), ask to "show only H-bonds from selection", and then ask to "show only groups with visible H-bonds", which will clean-up the view. Quite easy isn't-it ?
Busqueda Spinger: molecular docking affinity studyBusqueda Google:stereochemistry validation protein structureBusqueda Google Scholar:molecular docking
http://www.pymolwiki.org/index.php/APBSAPBS, the Adaptive Poisson-Boltzmann Solver, is a freely available macromolecular electrostatics calculation program released under the GPL. It is a cost-effective but uncompromised alternative to GRASP, and it can be used within PyMOL. PyMOL can display the results of the calculations as an electrostatic potential molecular surfacehttp://www.poissonboltzmann.org/apbs/examples/visualization/apbs-electrostatics-in-pymolhttp://kryptonite.nbcr.net/pdb2pqr/
En manualProbing ElectrostaticsQuantitative electrostatics calculations are typically difficult and time−consuming to perform. They require the specialist skills of a computational chemist to carefully consider missing protein segments and side chain atoms, histidine ionization, and the presence of specific counter−ions from bulk solvent. Furthermore, calculations involving ligands usually require high−level quantum calculations to obtain reasonable atomic partial charges for novel scaffolds. Assuming that such issues have been addressed, PyMOL can call upon the Adaptive Poisson−Boltzmann Solver (APBS) under a Unix environment to perform quantitative electrostatic calculations. The program can also read pre−calculated potentials from the Grasp, Delphi, or Zap electrostatics solvers.
In lieu of rigorous calculations, a simple, local (but technically incomplete), quasi−Coulombic calculation can often help answer the qualitative question: "Is this region of the protein surface likely to be positive, negative, or neutral relative to the rest of the protein?" PyMOL provides such answers for proteins by performing an automated calculation which essentially amounts to smoothing out the local charge density from nearby atoms (within 10 Angstroms), without taking into account solvent screening effects. To perform this calculation, follow the Actions ("A") menu for the protein object to item "generate" −> "vacuum electrostatics" −> "protein contact potential". After a minute or two, PyMOL will create a new object with the protein shown as an electrostatic surface colored blue in the positive regions and red the negative regions. You can then CTRL−click−and−drag along the slider to change the color levels.
MANUAL DEL PROGRAMA PDB VIEWER (Deep View)Coloreado y accesibilidad Utilizando la función Color: Accessibility el programa calcula la accesibilidad de cada residuo al entorno (dependiendo del ordenador esta operación puede llevar varios segundos). El color de cada residuo se basa en el porcentaje de área de cada residuo expuesta al medio. Los colores van desde el violeta para el menos accesible hasta el naranja para los más expuestos al disolvente
Visualizacion de moleculashttp://www.pymolwiki.org/index.php/Galleryhttp://ihome.cuhk.edu.hk/~b102142/pymol/pymol_tutorial.htmlhttp://www.mrc-lmb.cam.ac.uk/rlw/text/MacPyMOL_tutorial.html
Reasonableness (homology modeling)
If a homology model appears to be correct (not harboring impossibilities such as clashing atoms) and accurate (fitting its templates well), we can also ask if it is reasonable, or in keeping with expectations for similar proteins. Researchers have developed several assessments of reasonableness that can sometimes signal problems with a model or specific regions of a model. One is to sum up the probabilities that each residue should occur in the environment in which it is found in the model. For all Protein Data Bank models, each of the 20 amino acids has a certain probability of belonging to one of the following classes: solvent-accessible surface, buried polar, exposed nonpolar, helix, sheet, or turn. Regions of a model that do not fit expectations based on these probabilities are suspect.
Another criterion of reasonableness is to look at how often pairs of residues interact with each other in the model in comparison to the same pairwise interactions in templates or proteins in general. The sum of pairwise potentials for the model, usually expressed as an "energy" (smaller is better) should be similar to that for the templates. One form of this criterion is called threading energy. Such criteria ask, in a sense, whether a particular stretch of residues is
"happy" in its three-dimensional setting. If a fragment is "unhappy" by these criteria, then that part of the model may be in error.
To be meaningful, all assessments of reasonableness of the model must be compared with the same properties of the templates. After all, the templates themselves, even if they are high-quality experimental structures, may be unusual in comparison to the average protein.
http://www.proteinstructures.com/Modeling/Modeling/model-quality.html
Quality of a homology model: Model energy
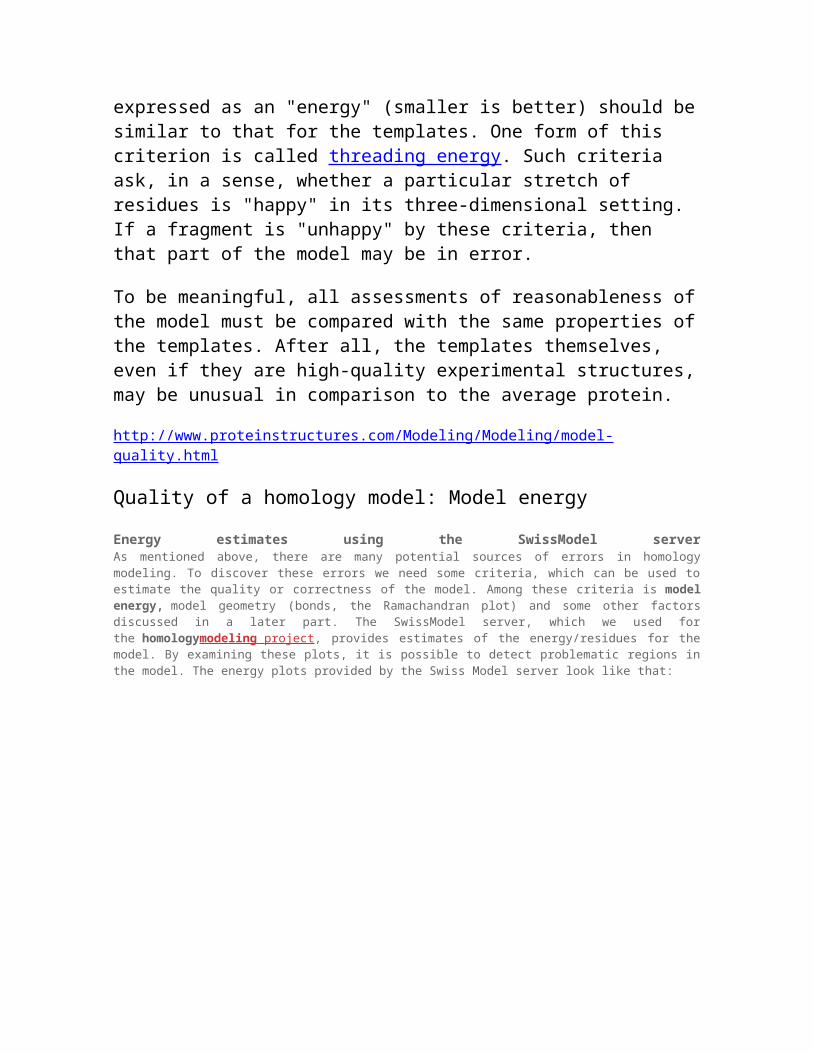
Energy estimates using the SwissModel serverAs mentioned above, there are many potential sources of errors in homology modeling. To discover these errors we need some criteria, which can be used to estimate the quality or correctness of the model. Among these criteria is model energy, model geometry (bonds, the Ramachandran plot) and some other factors discussed in a later part. The SwissModel server, which we used for the homologymodeling project , provides estimates of the energy/residues for the model. By examining these plots, it is possible to detect problematic regions in the model. The energy plots provided by the Swiss Model server look like that:
There are three options given by the server: atomic empirical mean force potential ANOLEA, GROMOS calculated energies and verify3D. The y-axis of the plot represents the energy for each amino acid of the protein structure. Negative energy values (in green) represent favorable energy environment whereas positive values (in red) unfavorable energy environment for a given amino acid. You may notice that there are differences between the two plots. ANOLEA makes an assessment of packing quality of the model. This will immediately reveal if there are regions with steric clashes (atoms coming too close to each other), since such regions will have very high energy. The GROMOS potential is used for the analysis of conformations obtained by protein homology modeling. In addition, using the so called three-dimensional profiles, the Verify3D method is used to analyze the compatibility of the protein homology model with its own amino acid sequence. As noted earlier, in protein structures amino acid residues have their prefered location. Verify3D assigns each residue a structural class based on its location and environment (alpha, beta, loop, polar, apolar etc). Then a database generated from good structures is used to obtain a score for each of the 20 amino acids in this structural class.
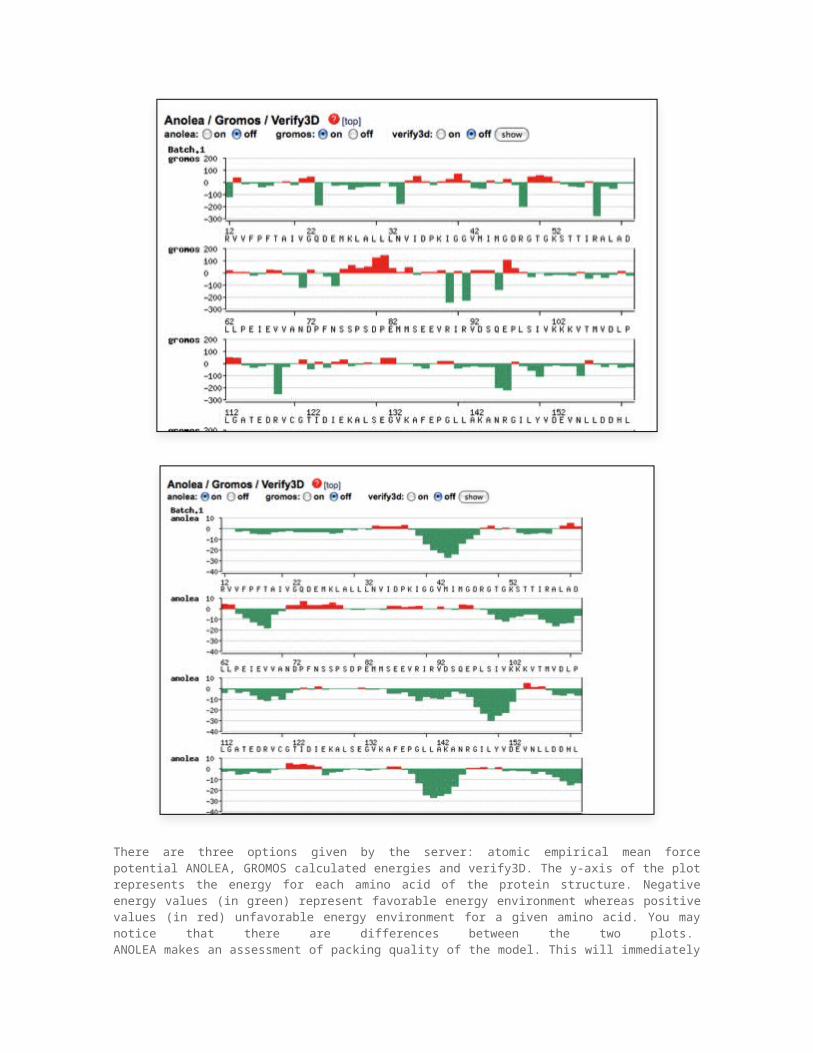
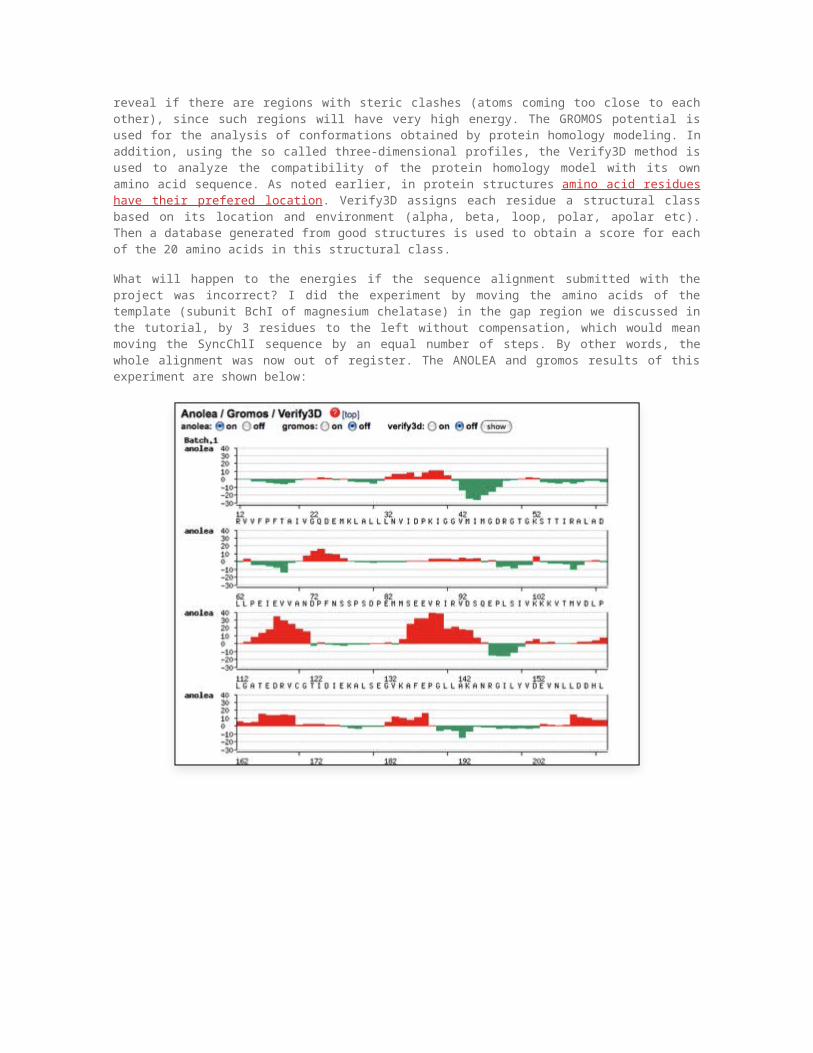
What will happen to the energies if the sequence alignment submitted with the project was incorrect? I did the experiment by moving the amino acids of the template (subunit BchI of magnesium chelatase) in the gap region we discussed in the tutorial, by 3 residues to the left without compensation, which would mean moving the SyncChlI sequence by an equal number of steps. By other words, the whole alignment was now out of register. The ANOLEA and gromos results of this experiment are shown below:
The red regions show that the energy of the comparative model is much higher, presumably due to residues making bad contacts, bad torsion angles, etc. This shows that the energy of the model is a good indication of the correctness of the model adn may be used for detecting potential modeling problems.
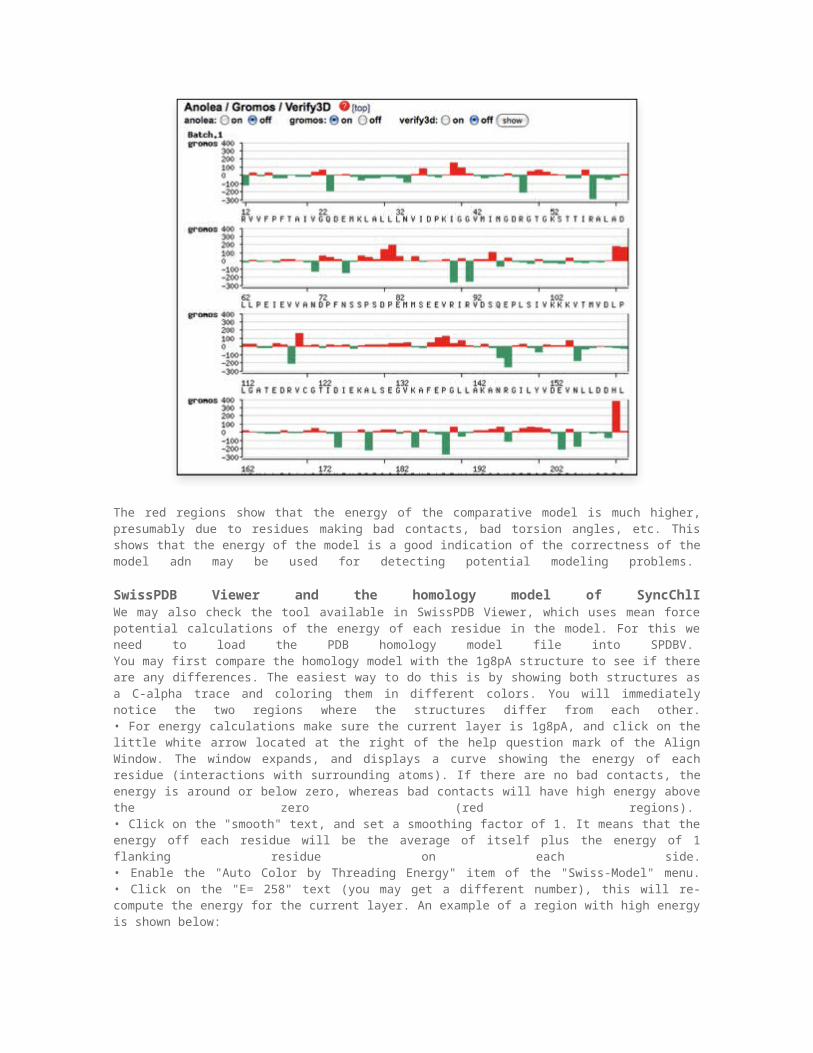
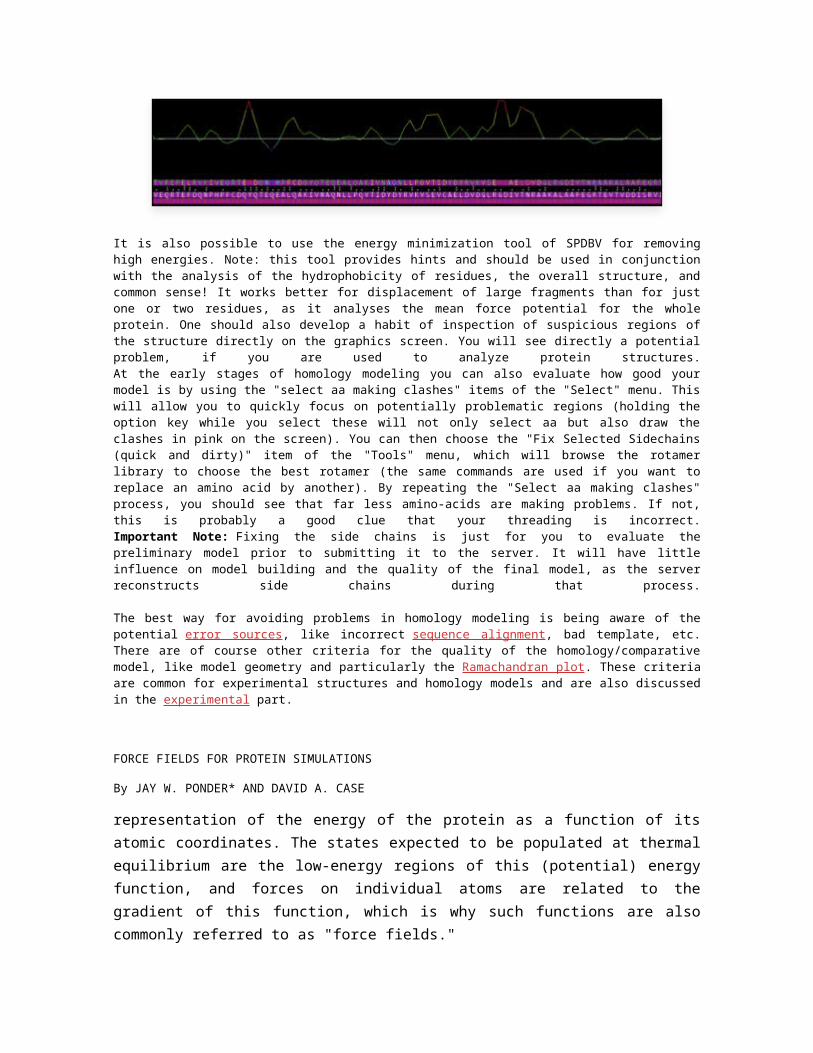
SwissPDB Viewer and the homology model of SyncChlIWe may also check the tool available in SwissPDB Viewer, which uses mean force potential calculations of the energy of each residue in the model. For this we need to load the PDB homology model file into SPDBV. You may first compare the homology model with the 1g8pA structure to see if there are any differences. The easiest way to do this is by showing both structures as a C-alpha trace and coloring them in different colors. You will immediately notice the two regions where the structures differ from each other.• For energy calculations make sure the current layer is 1g8pA, and click on the little white arrow located at the right of the help question mark of the Align Window. The window expands, and displays a curve showing the energy of each residue (interactions with surrounding atoms). If there are no bad contacts, the energy is around or below zero, whereas bad contacts will have high energy above the zero (red regions). • Click on the "smooth" text, and set a smoothing factor of 1. It means that the energy off each residue will be the average of itself plus the energy of 1 flanking residue on each side.• Enable the "Auto Color by Threading Energy" item of the "Swiss-Model" menu.• Click on the "E= 258" text (you may get a different number), this will re-compute the energy for the current layer. An example of a region with high energy is shown below:
It is also possible to use the energy minimization tool of SPDBV for removing high energies. Note: this tool provides hints and should be used in conjunction with the analysis of the hydrophobicity of residues, the overall structure, and common sense! It works better for displacement of large fragments than for just one or two residues, as it analyses the mean force potential for the whole protein. One should also develop a habit of inspection of suspicious regions of the structure directly on the graphics screen. You will see directly a potential problem, if you are used to analyze protein structures.At the early stages of homology modeling you can also evaluate how good your model is by using the "select aa making clashes" items of the "Select" menu. This will allow you to quickly focus on potentially problematic regions (holding the option key while you select these will not only select aa but also draw the clashes in pink on the screen). You can then choose the "Fix Selected Sidechains (quick and dirty)" item of the "Tools" menu, which will browse the rotamer library to choose the best rotamer (the same commands are used if you want to replace an amino acid by another). By repeating the "Select aa making clashes" process, you should see that far less amino-acids are making problems. If not, this is probably a good clue that your threading is incorrect.Important Note: Fixing the side chains is just for you to evaluate the preliminary model prior to submitting it to the server. It will have little influence on model building and the quality of the final model, as the server reconstructs side chains during that process.
The best way for avoiding problems in homology modeling is being aware of the potential error sources, like incorrect sequence alignment, bad template, etc. There are of course other criteria for the quality of the homology/comparative model, like model geometry and particularly the Ramachandran plot. These criteria are common for experimental structures and homology models and are also discussed in the experimental part.
FORCE FIELDS FOR PROTEIN SIMULATIONS
By JAY W. PONDER* AND DAVID A. CASE
representation of the energy of the protein as a function of its atomic coordinates. The states expected to be populated at thermal equilibrium are the low-energy regions of this (potential) energy function, and forces on individual atoms are related to the gradient of this function, which is why such functions are also commonly referred to as "force fields."
Delphi
http://www.teokem.lu.se/~ulf/Methods/delphi.html
Delphi
Delphi is a program to solve the Poisson-Boltzmann equation to obtain potentials and solvation free energies for heterogenous systems.
The home page of Delphi is at
http://wiki.c2b2.columbia.edu/honiglab_public/index.php/Software:DelPhi
A manual of the program (pdf) is found in http:/honiglab.cpmc.columbia.edu/delphi/doc/delphi_manual.pdf.A similar but better manual in web format is found in http://honiglab.cpmc.columbia.edu/delphi/doc/io.html.
On milleotto:module add pgi32/7.1delphi
It is not available on the local system.
Running delphi
The program is run with the command:delphi inputfile
if inputfile is missing, the name fort.10 is assumed.
This is a sample input file:exdi=80.0scale=2.5indi=1.0perfil=90.0prbrad=1.4bndcon=4in(crg,file="delphi.crg")in(siz,file="delphi.siz")in(pdb)energy(s,g)
Three files (at least) are read in:A pdb file (default fort.13)An atom radii file (siz, default name fort.11)An atom charge file (crg, derault name fort.12)
For small molecules, scale=2.0 may give very poorly converged solvation energies with errors of 29 kJ/mol for water and 54 kJ/mol for imidazoleH+. Scale=10 gives accurate results. For drug-like molecules, the error is up to 7 kJ/mol.
Moreira et al, J. Mol. Struct 729 (2005) 11 have examined the dependence of Delphi results on some parameters. They recommend the following settlings:conv = 10^-3perfil = 90%scale = 2.5coloumbic boundary conditions (bndcon=4).
Parameters
exdi dielectric constant outside the protein (default = 80) indi dielectric constant inside the protein (default = 2.0 !) scale - lattice spacing in number of grids/Angstrom (default 1.2)
perfil - percentage of the lattice that the largest of the x,y or z linear dimensions of the molecule will fill (default = 80 %).
prbrad radius (in Å) of the water probe molecule (default = 1.4) bndcon type of boundary condition:
1 - potential is zero2 - Debue-Huckel potential of the equivalent dipole (default)3 - focussing from a previous phi-map calculation4 - Debue-Huckel potential of all charges
salt - salt concentration (default 0)
Functions.
center(0.2,3,2) Will offset the molecule by 0.2 grids in the x direction, 3 in the y and 2 in the z,You can also let center open a pdb file and center on the centre of geometry of that file: center(file="file").
acenter(1.0,5.6,7.0) Centres the molecule at x=1.0 Å, y=5.6 Å, z=7.0 Å
energy(s,g) Writes out a certain energy, which can be:G or GRID for the grid energy,S or SOL or SOLVATION for the corrected reaction field energyC or COULOMBIC or COU for the coulombic energyAS or ANASURF or ANALYTICALSURFACE for the analytical surface energyAG or ANAGRID or ANALYTICALGRID for the analytical grid energy
read or inReads an input file. It comes with several specifiers, namelySIZ: for radius filesCRG: for charge filePDB: for the pdb fileFRC: for the file use to determine site potentialsPHI: for the phimap used in focussing
write or outWrites an output file. The specifiers are:
PHI : for phimapsFRC : for site potentialsEPS : for epsmapsMODPDB: for modified pdb filesUNPDB: for unformatted pdb fileUNFRC : for unformatted frc filesFor example, out(modpdb, file="test.out") writes a modified pdb file called "test.out".
The atom size file
The file can start with any number of comment lines, starting with !Then a line defining the file format should come. It should be either (exactly for the 16 first characters:)atom__res_radius
which gives the formatatom(a6), residue(a3), radius (f8.3)aaaaaarrrffff.fff
or
atom__resnumbc_radius_
which gives the formatatom(a6), residue(a3), residue_number(a4), subunit(a1), radius (f8.3)aaaaaarrrnnnncffff.fff
Then, the rest of the file is read in this fixed format.Blank fields are considered as wild-card characters.No warnings are given for errors.
The atom charge file
The file can start with any number of comment lines, starting with !Then a line is read but ignored.The rest of the file is read in the following fixed format (same as second atom size format)
atom(a6), residue(a3), residue_number(a4), subunit(a1), charge(f8.3)aaaaaarrrnnnncffff.fff
Blank fields are considered as wild-card characters.
Note that only three decimals are read for the charges (but we have changed that to six decimals)!
Warning!
Note that Delphi does not interpret H-atom names in the format 1HD2 LEU correctly (i.e. as HD21), instead it is interpreted litteraly as "1HD2" and if the same name is not given in the size and charges files, a "default" charge and radii are used for those atoms, without any crash!
Use changepdb format 0.
Warning 2!Strangely enough the program does not allow radii of 0 (as in Parse for non-polar hydrogens). If they are set to 0.1 (or even 0.001), it works. In our test case, there is no difference with an radius of 0.1 and 0.001, or even with 1.0.
charged atom number 2radius changed from zero to 1.000000
Problems
We have not been able to run focusing calculations for big system. The problem has been traced to the handling of phimap.
Example of a focusing file (that does not work):exdi=80.0scale=2.5indi=1.0perfil=90.0prbrad=1.4BNDCON=3in(crg,file="delphi.crg")in(siz,file="delphi.siz")in(pdb)in(phi,unit=14)energy(s,g)
Changes made to the source files
1. We decided to let the program read in specific radii and charges for all atoms. Therefore, we had to increase five parameters in the file qdiffpar5.h:
parameter (nclist = 50000) parameter (nrlist = 50000)cc nrmax= maximum number of entries in radius file parameter (nrmax = 50000)c ncmax= maximum number of entries in charge file parameter (ncmax = 50000)
2. Second, we forced the program to read 6 decimals for the charges (needed to get the correct charge on the residues with standard Amber charges):
In file rdhcrg.f, we changed the following line (from F8.3):202 format(A6,A3,A4,A1,F11.6)
3. To read more than 10000 atoms, I changed (19/1-10) in getatm2.f: parameter(natmax=100000)
Sample output file __________DelPhi V. 4 Release 1.1 ______________ | | | A program to solve the PB equation | | in 3D, using non-linear form, incorporating | | many dielectric regions, multisalt ionic | | strength, different probe radii, periodic | | and focussing boundary conditions, utilizing | | stripped optimum successive over-relaxation | | and an improved algorithm for mapping the | | Mol. Surface to the finite-Difference grid | | Recompiled on Linux and PC | | January 2002 -------- Walter Rocchia | |__________________ ___________________| DelPhi V. 4 program started on Mon Jan 18 2010 at 15:19:06 opening parameter file delphi.in atom radii read from file delphi.siz ! Atomic radii for delphi automatically generated by WtDelph ! PARSE radii reading pK style radius file # of radius parameter records: 3 atomic charges read from file delphi.crg ! Atomic charges for delphi automatically generated by WtDel ! Amber charges from prmtop file # of charge parameter records: 3 assigning charges and radii... opening formatted file:delphi.pdb You are not reading from an objectfile! assuming having only molecules, and one dielectric medium number of atoms read in = 3 atomic coordinates, charges and radii written to file delphi.mpb Direct mapping of epsilon: (0/1)(n/y) 1 time to read in and/or assign rad/chrg= 0.0000000E+00
http://www.biochem.arizona.edu/xray/delphifaq.html
Delphi FAQ
1. I can't run delphi! Why do I get an error message about fort.10 not found?
I can't run delphi! Why do I get an error message about fort.10 not found?
You have to tell delphi the *.prm (parameter file) to use. This is the file that, among other things, tells delphi where to find your pdb and charge files. Fort.10 is the name of the default file. If the *.prm file name is, for instance, np4.prm, start delphi by typing delphi np4.prm
Nuevohttp://biskit.pasteur.fr/install/applications/prosa2003