,s o,,ad-a205 :,lo 052 - defense technical information … engineering,s o,,ad-a205 :,lo 052...
TRANSCRIPT

I Iw I1m JI I@
USA-CERL TECHNICAL REPORT P-89/09December 1988
US Army Corpsof EngineersConstruction Engineering,s :,Lo o,,AD-A205 052Research Laboratory D A 0 05
Data Envelopment Analysis as a Tool ToEvaluate Efficiency of Army Real PropertyManagement Activities (RPMA) SpendingbyGonzalo PerezOsman CoskunogluAlan W. Moore
"The U.S. Army is developing an Output Oriented Re-source Management System (DORMS) to compare the valueof resources expended with those received for all Army pro-grams. One of the programs to be encompassed by OORMSis Real Property Management Activities (RPMA).
The RPMA program consists of a wide range of goalsfrom which it is difficult to identify a single, quantifiable"entity" that represents the overall goal. Thus, to enable arealistic assessment in OORMS, a performance index isneeded to evaluate the efficiency of RPMA at US. Armyinstallations. D T IC
Three alternative modeling techniques were consideredfor potential use in developing such an index. Data En- E L E CT Evelopment Analysis (DEA) was selected because of itsability to accommodate multiple inputs and outputs simul- FEB2 119 qtaneously without requiring that weight and functionalrelationships be specified.
The performance index was applied to RPMA and its use IHin several stages of the resource management process wasanalyzed. Results were distributed to managers at the Major
Command (MACOM) headquarters and installation levelsfor review. In general, DEA appears to be a feasible model-ing technique for RPMA performance; however, the methodneeds refinement to enable better discrimination amongefficient installations and to optimize features of the index.A prototype should be developed and implemented at theinstallations to test different input and output measures.
Approved for public release; distribution is unlimited.
89 025

The contents of this report are not to be used for advertising, publication, ofpromotional purposes. Citation of trade names does not constitute anofficial indorsement or approval of the use of such commercial products.The findings of this report are not to be construed as an official Departmentof the Army position, unless so designated by other authorized documents.
DESTROY THIS REPORT WHEN IT IS NO I ONGER NEEDED
DO NOT RETURN IT TO THE ORIGIN.4 TOR

UNCLASSIFIED
SECURITY CLASSIFICATION OF THIS PAGE
REPORT DOCUMENTATION PAGE %OMAO% -0
I. REPORT SECURITY CLASSIFICATION lb RESTRICTIVE MARKINGS
Unclassified
2a. SECURITY CLASSIFICATION AUTHORITY 3. DISTRIBUTION/AVAILABILITY OF REPORT
Approved for public release; distribution2b. DECLASSIFICATION DOWNGRADING SCHEDULE is unlimited.
4. PERFORMING ORGANIZATION REPORT NUMBER(S) S. MONITORING ORGANIZATION REPORT NUMBER(S)USA-CERL TR P-89/09
68. NAME OF PERFORMING ORGANIZATION 6b. OFFICE SYMBOL 7a. NAME OF MONITORING ORGANIZATIONU.S. Army Construction (Ifappliabl)Engr Research Laboratory CECER-FS
6c. ADDRESS (City, State, and ZIP Code) 7b. ADDRESS (City, State, and ZIP Code)P.O. Box 4005Champaign, IL 61820-1305
Ga. NAME OF FUNDING/SPONSORING 8b. OFFICE SYMBOL 9. PROCUREMENT INSTRUMENT IDENTIFICATION NUMBERORGANIZATION (if jao/kale)
OCE DAEN-ZCP-B OMA8c. ADDRESS (City, State, and ZIP Codl) 10. SOURCE OF FUNDING NUMBERS
PROGRAM i PROJECT TASK WORK UNIT20 Massachusetts Ave., N.W. ELEMENT NO. NO. NO. ACCESSION NO.Washington, DC 20314-1000 r
11. TITLE (Inlude Security Classification)Data Envelopment Analysis as a Tool To Evaluate Efficiency of Army Real PropertyManagement Activities (RPMA) Spending (U)
12. PERSONAL AUTHOR(S)Perez, Gonzalo; Coskunoglu, 0.; Moore, Alan W.
13a. TYPE OF REPORT 13b. TIME COVERED 14. DATE OF REPORT (Year, Month, Oay) 15. PAGE COUNT
final FROM _ TO 1988, December 58
16. SUPPLEMENTARY NOTATIONCopies are available from the National Technical Information Service
Springfield, VA 2216117. COSATI CODES 18. SUBJECT TERMS (Continue on reverse if necessary and identify by block numbe,;
FIELD GROUP SUS-GROUP Output Oriented Resource Management System
05 03 Real Property Management ActivitiesOORMS (Continued)
19, ABSTRACT (Continue on reverse if necessary and identif by block number)
The U.S. Army is developing an Output Oriented Resource Management System(QORMS) to compare the value of resources expended with those received for all Armyprograms. One of the programs to be encompassed by CORMS is Real Property Manage-ment Activities (RPMA).
The RPMA program consists of a wide range of goals from which it is difficult toidentify a single, quantifiable "entity" that represents the overall goal. Thus, to enable arealistic assessment In OORMS, a performance index is needed to evaluate the efficiencyof RPMA at U.S. Army installations.
(Continued)
20. DISTRIBUTION fAVAILAB1LITY OF ABSTRACT 121. ABSTRACT SECURITY CLASSIFICATION
OUNCLASSIFIED/UNLIMITED (3 SAME AS RPT. C OTIC USERS Unclassified
22a. NAME OF RESPONSIBLE INDIVIDUAL 22b. TELEPHONE (Include Are# Code) 22c. OFFICE SYMBOLDana Finney (217) 352-6511 ext. 389 CECER-IMT
DO Form 1473. JUN 86 Previous editom are obsolete. SECURITY WASIFICATION OF THIS PAGEUNCLASSIFIED

UNCLASSIFIED
Block 18. (Continued)
Data Envelopment Analysisresource managementdecision making
Block 19. (Continued)
Three alternative modeling techniques were considered for potential use in devel-oping such an index. Data Envelopment Analysis (DEA) was selected because of itsability to accommodate multiple inputs and outputs simultaneously without requiring thatweight and functional relationships be specified.
The performance index was applied to RPMA and its use in several stages of theresource management process was analyzed. Results were distributed to managers at theMajor Command (MACOM) headquarters and installation levels for review. In general,DEA appears to be a feasible modeling technique for RPMA performance; however, themethod needs refinement to enable better discrimination among efficient installationsand to optimize features of the index. A prototype should be developed and implementedat the installations to test different input and output measures.
UNCLASSIFIED

FOREWORD
This work was performed for the Office of the Chief of Engineers (OCE), as anOperations and Maintenance, Army (OMA) reimbursable project. The OCE TechnicalMonitor was Richard Nelson, DAEN-ZCP-B.
The work was conducted by the Facility Systems Division (FS) of the U.S. ArmyConstruction Engineering Research Laboratory (USA-CERL). Dr. Osman Coskunoglu isan Associate Professor in the College of Engineering, University of Illinois at Urbana-Champaign. Dr. Michael J. O'Connor is Chief, USA-CERL-FS. The technical editor wasDana Finney, USA-CERL Information Management Office.
COL Carl 0. Magnell is Commander and Director of USA-CERL, and Dr. L. R.Shaffer is Technical Director.
I SpECTFD
Accession For
NTIS GRA&IDTIC TAB 0Uriaruo zuCned QJustificati on ,
By-
Dit .?ibution/
Availability CodesAvail and/or
Dist Special
3 I
3

CONTENTS
Page
DD FORM 1473 1FOREWORD 3LIST OF FIGURES AND TABLES 5
1 INTRODUCTION ..................................................... 7BackgroundObjectiveApproach
2 DEVELOPMENT OF AN EFFICIENCY INDEX ............................. 9Alternative MethodologiesMethodology SelectionDEA Application ProcessIdentification of Input MeasuresIdentification of Output MeasuresData Availability
3 DEA COMPUTATIONS AND RESULTS ................................... 19ComputationsValidation of Results
4 IMPLICATIONS FOR MANAGEMENT ......... o .............. .. o..24DEA as a Management Audit ToolPlanning and Budgeting With DEAResource Determination With DEA
5 CONCLUSIONS AND RECOMMENDATIONS ............................. 32
REFERENCES 33
APPENDIX A: Data Envelopment Analysis-Concept and Derivation 35APPENDIX B: Explanation of Computer Output 41
DISTRIBUTION
4

FIGURES
Number Page
1 RPMA Inputs 16
2 RPMA Outputs 16
Al Example Problem With a Simple Geometrical Solution 38
TABLES
I Summary of Results for MACOM #1 in FY85 19
2 Comparison of Efficiency Ratings-MACOM #1 and JointAnalysis (FY85) 20
3 Comparison of Efficiency Ratings--MACOM #2 and Joint
Analysis (FY85) 21
4 Comparison of Installation #19 With Its Reference Set 23
5 Example Requested Budgets for MACOM #2 Installations 25
6 Example Results of Applying Performance Model to RequestedBudgets 26
7 Resource Determination With DEA 31
B1 DEA Results for MACOM #1, FY85 42
B2 DEA Results for MACOM #1, FY84 45
B3 DEA Results for MACOM #1, FY83 47
B4 DEA Results for MACOM #2, FY85 49
B5 DEA Results for MACOMs #1 and #2 52
5

DATA ENVELOPMENT ANALYSIS AS A TOOL TO EVALUATE EFFICIENCY OFARMY REAL PROPERTY MANAGEMENT ACTIVITIES (RPMA) SPENDING
1 INTRODUCTION
Background
The U.S. Army is developing an Output Oriented Resource Management System(CORMS) to compare the value of resources expended with services received for allArmy programs. According to the Army Comptroller, OORMS is intended to meet afunctional requirement of Army resource management: feedback on execution in termsof outputs achieved for inputs planned, programmed, budgeted, and then used. Withoutthis essential feedback, it is difficult to make consistent, informed assessments as to howwell the Army programs are being both planned and executed. The current resourcemanagement process is missing this vital link. Decisions about Army programs andalternatives can be improved measurably if feedback is made an integral part of theprocess. I
Included in the OORMS assessments will be Real Property Management Activities(RPMA) at Army installations. The goal of RPMA is to develop, operate, and maintainthe facilities necessary for the Army to accomplish its mission and provide a qualityworking and living environment for its personnel. 2 With such a broad, multi-objectivegoal, it is difficult to identify a single, quantifiable "entity" capable of representing theoverall goal. In other words, to be able to quantify the degree of goal achieved by aninstallation, it is necessary to measure several different outputs--each accounting for adifferent objective--and to aggregate them properly so as to represent the amount ofgoal achieved. In addition, the aggregate measure of outputs has to be comparable to theamount of resources (input) deployed so that a single composite index can represent theefficiency of an installation. At present, no such index has been developed for RPMA.
Objective
The objective of this research was to develop an output-oriented performancemeasure index to evaluate the efficiency of RPMA at U.S. Army installations. Thisperformance measure index should relate the outputs achieved by RPMA to the resource(input) deployed during operations; that is, it should be able to compare several types ofoutput with several inputs simultaneously. In addition, the results of evaluations usingthis single index should assist in the decision-making process of resource management.
Approach
Three alternative methodologies were considered for index development: (1) dataenvelopment analysis (DEA), (2) ratio analysis, and (3) regression analysis. Mathematical
'Output Oriented Resource Management System, Handbook (Office of the Comptroller ofthe Army, June 1986).
2Real Property Management Activities (RPMA), Executive Summary, Vol 1 (Departmentof the Army Study Group, March 1978).
7

features of all three methods were compared and the method found most appropriate fordealing with RPMA was selected.
Input and output measures of RPMA operations were defined and selected to modelperformance. The performance model was applied to 21 U.S. Army Forces Command(FORSCOM) installations and the results were presented to the prospective users forevaluation. Feedback from the field was analyzed and used to revise the performancemodel.
8

2 DEVELOPMENT OF AN EFFICIENCY INDEX
Alternative Methodologies
Three different methodologies for establishing a performance index were evaluatedfor potential application to RPMA. Each method has already been used in some organ-izations to evaluate different programs.
Data Envelopment Analysis (DEA)
DEA was introduced by Charnes, et al., 3 for measuring the efficiency of not-for-profit entities. The method has been used to measure the efficiency of several organiza-tions such as school systems, 4 health care organizations, 5 Navy District recruitingoffices,6 fighter wings of the U.S. Air Force, 7 and RPMA in the air training commands. 8
DEA is designed to measure relative efficiency among similar organizations, calledDecision-Making Units (DMU), that share the same technology to gain similar achieve-ments (outputs) by using similar resources (inputs). In this study, the DMUs are Army
3A. Charnes, W. W. Cooper, and E. Rhodes, "Measuring the Efficiency of Decision-Making Units," European Journal of Operational Research, Vol 2, No. 6 (November1978), pp 429-444; A. Charnes, W. W. Cooper, and E. Rhodes, "Short Communication:Measuring the Efficiency of Decision-Making Units," European Journal of OperationalResearch (1979), p 331.
4A. Bessent and W. Bessent, "Determining the Comparative Efficiency of SchoolsThrough Data Envelopment Analysis," Educational Administrative Quarterly, Vol 16,No. 2 (1980), pp 57-75; A. Charnes, W. W. Cooper, and E. Rhodes, "Evaluating Programand Managerial Efficiency: An Application of Data Envelopment Analysis to ProgramFollow Through," Management Science, Vol 27, No. 6 (1981), pp 668-697; A. Bessent,W. Bessent, A. Charnes, W. W. Cooper, and N. Thorogood, "Evaluation of EducationalProgram Proposals by Means of DEA," Educational Administration Quarterly, Vol 19,No. 2 (Spring 1983), pp 82-107.
SH. D. Sherman, Measurement of Hospital Efficiency Using Data Envelopment Analysis,unpublished DBA thesis (Graduate School of Business, Harvard University, 1981).
6A. Lewis and R. C. Morey, "Measuring the Relative Efficiency and Output Potential ofPublic Sector Organizations: An Application of Data Envelopment Analysis," Inter-national Journal of Policy Analysis and Information Systems, Vol 5, No. 4 (December1981).
7A. Bessent, W. Bessent, C. T. Clark, and J. Elam, "Constrained Facet Analysis, A NewMethod for Evaluating Local Frontiers of Efficiency and Performance," Air ForceJournal of Logistics (Summer 1984), pp 2-8; C. T. Clark, Data Envelopment Analysis andExtensions for Decision Support and Management Planning, Ph.D. dissertation (TheUniversity of Texas at Austin, May 1983).
8W. F. Bowlin, A Data Envelopment Analysis Approach to Performance Evaluation inNot-for-Profit Entities With an Illustrative Application to the U.S. Air Force, Ph.D.dissertation (The University of Texas at Austin, December 1984); W. F. Bowlin, Reporton Evaluating the Efficiency of Real Property Maintenance Activities in the AirTraining Command (Air Force Institute of Technology, Wright-Patterson AFB, OH,November 1984).
9

installations or, more specifically, the RPMA organization at the installation level. The
notation used to formulate DEA is:
Let DMUj; j = 1,..,n be the set of DMUs to be evaluated.
Let li; i = 1,...,m be the set of input measures to be used in the evaluation.
Let Or; r = 1,...,s be the set of output measures to be used in the evaluation.
Let 0. represent the observed output vector for DMUj, where:
0 = (OlpOij, ... Osj); Oij = the amount of output jused by DMU j
Let f. represent the observed input vector for DMUj, where:
Ij = (Ilj,.Irj..,lm); rj = the amount of input r used by DMU.
Using these definitions, DEA measures the efficiency of a DMU by evaluating theratio of weighted outputs to weighted inputs as follows:
S
r Ur rio
Efficiency of DMUJ 0 , ho- = [Eq 1]
i=l ' 'Jo
where lij o = the amount of input i used by DMUjo and Orjo = the amount of output r used
by DMUo.
In the above ratio, lij o and Oro are observed values and therefore are constants.The variables Ur (one for each output measure) and Vi (one for each input measure) arecalled "virtual multipliers," and their values are computed relative to all DMU1 ;j=l,..,jo,..,n by solving the following mathematical formulation (Eq 2):
s
I Ur Or•
Maximize: h. =r1jo m. V. I°.
i=1 ' * 3
U0
Subject to: r=1 j = ,
mV. l..ViI Ij
U C-> € 0r
V. - > 0 [Eq 21
where c is a non-Archimedean constant that constrains Ur and Vi to positive values.
10
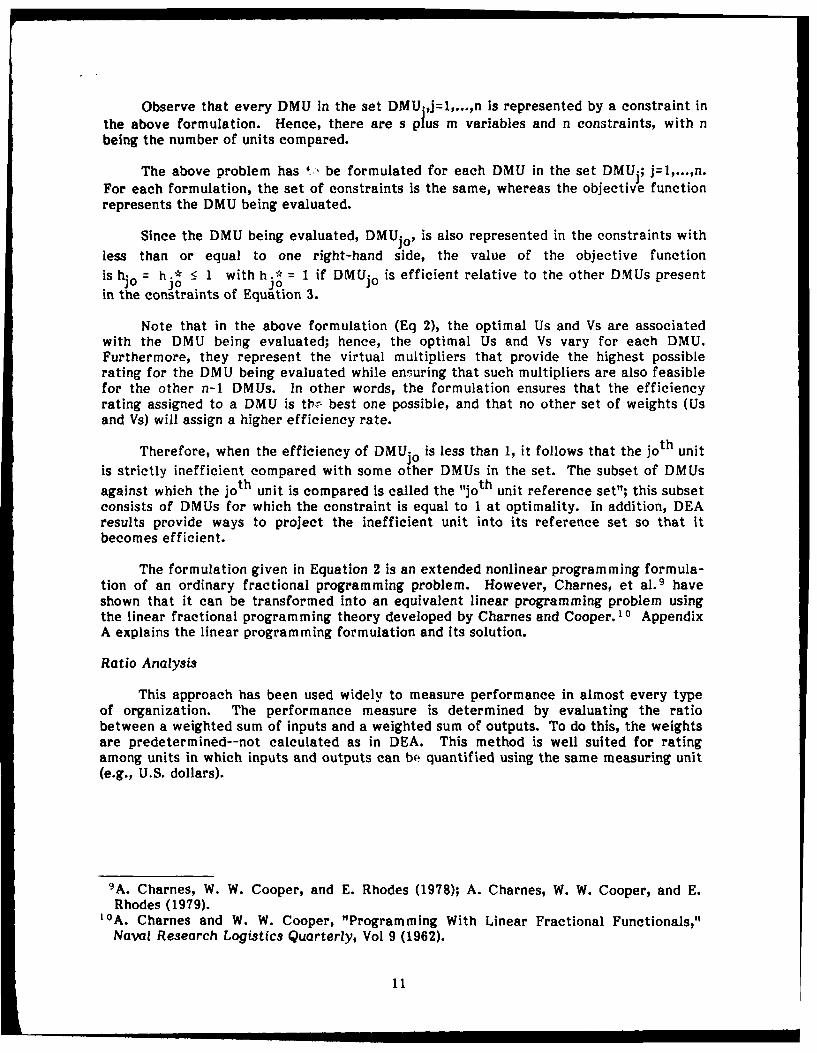
Observe that every DMU in the set DMU,j=1,...,n is represented by a constraint inthe above formulation. Hence, there are s plus m variables and n constraints, with nbeing the number of units compared.
The above problem has + be formulated for each DMU in the set DMU.; j=l,...,n.For each formulation, the set of constraints is the same, whereas the objective functionrepresents the DMU being evaluated.
Since the DMU being evaluated, DMUjo, is also represented in the constraints with
less than or equal to one right-hand side, the value of the objective function
is h. = h "* < 1 with h . = 1 if DMUo is efficient relative to the other DMUs present1o Jo Jo join the constraints of Equation 3.
Note that in the above formulation (Eq 2), the optimal Us and Vs are associatedwith the DMU being evaluated; hence, the optimal Us and Vs vary for each DMU.Furthermore, they represent the virtual multipliers that provide the highest possiblerating for the DMU being evaluated while ens7uring that such multipliers are also feasiblefor the other n-I DMUs. In other words, the formulation ensures that the efficiencyrating assigned to a DMU is tbh- best one possible, and that no other set of weights (Usand Vs) will assign a higher efficiency rate.
Therefore, when the efficiency of DMUjo is less than 1, it follows that the joth unit
is strictly inefficient compared with some other DMUs in the set. The subset of DMUs
against which the joth unit is compared is called the "jo t h unit reference set"; this subsetconsists of DMUs for which the constraint is equal to I at optimality. In addition, DEAresults provide ways to project the inefficient unit into its reference set so that itbecomes efficient.
The formulation given in Equation 2 is an extended nonlinear programming formula-tion of an ordinary fractional programming problem. However, Charnes, et al. 9 haveshown that it can be transformed into an equivalent linear programming problem usingthe linear fractional programming theory developed by Charnes and Cooper. 10 AppendixA explains the linear programming formulation and its solution.
Ratio Analysis
This approach has been used widely to measure performance in almost every typeof organization. The performance measure is determined by evaluating the ratiobetween a weighted sum of inputs and a weighted sum of outputs. To do this, the weightsare predetermined--not calculated as in DEA. This method is well suited for ratingamong units in which inputs and outputs can bf, quantified using the same measuring unit(e.g., U.S. dollars).
9 A. Charnes, W. W. Cooper, and E. Rhodes (1978); A. Charnes, W. W. Cooper, and E.Rhodes (1979).
1 0 A. Charnes and W. W. Cooper, "Programming With Linear Fractional Functionals,"Naval Research Logistics Quarterly, Vol 9 (1962).
n u minu mata im i i11

When Inputs and outputs do not share the same measuring units, it can becomedifficult to find a meaningful performance ratio. Furthermore, the complexity of theproblem increases when the relationships between input and output are unknown.
Several relatively simple ratios might be used to model single relationships betweendifferent sets of inputs and outputs. However, the separate ratios do not explicitlyrecognize the joint use of these inputs to produce a combination of outputs. Therefore, aunit may be rated highly efficient based on one of these ratios, while the same unit maybe rated inefficient with respect to a different ratio. This situation leads to someambiguity as to whether a unit is efficient or inefficient, and calls for a method ofestablishing different priorities (weights) among the separate ratios to generate anoverall efficiency ratio.
However, when dealing with a few relevant outputs and the priorities among themare clear, ratio analysis allows management to stress the goals of the organization moreeffectively than with DEA. Furthermore, ratio analysis provides a way to penalizedeviation in the inputs or in the outputs from some preestablished targets. Also, itpermits management to change the priorities of the goal from time to time when theneeds of the organization call for it.
The weaknesses of ratio analysis are that: (1) when aggregating many inputs andoutputs, the index loses meaning, (2) goals that do not show in the index are disregardedby lower level management, and (3) the design of the ratio may need to be rathercomplex to avoid ambiguity.
Regression Analysis
This approach, although not as widely used as ratio analysis, is very popular amongmany organizations for estimating relationships between one input and one output (linearregression). Regression analysis usually performs well when used to evaluate systems ofone input and a few outputs or vice versa--one output and several inputs. The approachcan be viewed as a technique to design a ratio, in which case regression analysissimplifies the modeling of unknown relationships among inputs and outputs. On the otherhand, regression analysis does not allow managers to emphasize selected goals andtargets over the others.
Methodology Selection
Upon analyzing features of the three methods, it became clear that DEA offeredseveral advantages over the other two methods for evaluating the efficiency of RPMA.These advantages are summarized here; for a more extensive comparison, refer toBowlin, et al. I I and Banker, et al. 1 2
''W. F. Bowlin, A. Charnes, W. W. Cooper, and H. D. Sherman, A Comparative Study ofData Envelopment Analysis and Other Approaches to Efficiency Estimation, ResearchReport CCS 451 (Center for Cybernetic Studies, The University of Texas at Austin,September 1983).
12 R. D. Banker, R. F. Conrad, and R. P. Strauss, "A Comparative Application of DataEnvelopment Analysis and Translog Methods: An Illustrative Study of Hospital Produc-tion," Management Science, Vol 32, No. 1 (January 1986), pp 30-44.
12

DEA differs from ratio analysis in that it handles multiple inputs and outputssimultaneously without requiring a priori specification of weights. Moreover, theproduction function, i.e., efficient input-output relationship, need not be known toevaluate efficiency with DEA.
DEA differs from regression analysis and related statistical techniques in that it isnonparametric and thus does not require specification of the functional forms andrelations to be used. In addition, DEA evaluates the efficiency of a DMU against themost efficient DMUs (i.e., the efficiency "frontier") and not against interior DMUs(average).
There are, however, two limitations to DEA that should be mentioned:
" DEA will not necessarily locate all inefficient units; in other words, DEAmeasures only relative inefficiency.
" DEA is capable of addressing efficiency only and does not attempt to evaluatethe effectiveness of the inputs used and/or the outputs obtained.
DEA Application Process
The DEA method is implemented in three steps: (1) identification of units to beevaluated, (2) identification of input and output measures, and (3) application of DEA andanalysis of results.
Step 1: Identification of Units To Be Evaluated
Managers should identify the organizational units for which a DEA efficiencyevaluation would be of interest. Generally, this parameter would be a set of units thatprovide similar services and whose performance management wants to evaluate toimprove efficiency. For this study, the units to be evaluated are the RPMA organiza-tions at the installation level.
Step 2: Identification of Input and Output Measures
Managers should identify the relevant inputs and outputs of units to be evaluated asmeasured over a representative period of time (e.g., for 1 year, quarter, or month).Relevant outputs are those services and other activities for which the unit is responsiblein achieving its mission (i.e., goals). Relevant inputs are the resources required toproduce the designated outputs.
Field applications of DEA have indicated that this process of output and inputidentification often is by itself useful to managers, as outputs and inputs sometimes arenot explicitly identified or understood. In addition, some of the relevant outputs andinputs may not have been measured or captured in the current information system. Theabsence of data on relevant outputs and inputs has raised questions about the adequacy ofthe information system, since this type of input/output data is needed to assess operatingperformance regardless of the techniques used.
13

Unless all relevant outputs and inputs are included in the DEA analysis, the DEAresults will have to be reviewed for any bias that might result. There are four generalguidelines for selecting the input and output measures:
1. The inputs and outputs should be comprehensive. That is, they should fully andproperly measure the RPMAs.
2. There should be some basis for believing that the relationship between inputsand outputs is such that an increase in an input can reasonably be expected to increaseone or more of the outputs.
3. All input and output measures should exist in positive amounts for eachinstallation.
4. The variables should be identifiable and defined and controlled so that theycannot be manipulated in reports, or at least the resulting data should be reviewed toremove these effects which might otherwise influence the results of the performancemodel. As discussed earlier, DEA not only rates efficiency among installations, but alsoprovides additional information regarding the efficiency of input usage and outputachievement. Therefore, the choice of inputs and outputs will determine the value ofinformation provided by the model. In other words, a choice of meaningless input andoutput measures will yield meaningless managerial information. Hence, to fully exploitthe capabilities of DEA, two more guidelines were used for selecting input and outputmeasures in this particular application:
5. The level of detail in defining inputs and outputs should be sufficient for Officeof the Chief of Engineers (OCE)-level planning, programming, and budgeting activities.
6. Existing data sources should be used whenever possible, rather than generatingnew data.
Step 3: Application of DEA and Analysis of Results
At this point, the results of DEA may not be consistent with prior perceptions ofthe units evaluated. This outcome, in turn, may raise questions about how complete andrepresentative the output and input measures are. In this way, the analysis may result inrefinements to the set of inputs and outputs used in the model.
Identification of Input Measures
In general terms, there are two inputs: monetary funds and space used forsupporting RPMA. Monetary funds, as a single input term, may not serve the purposes atthe OCE level. Two alternative disaggregation schemes are possible:
1. According to the destination of the funds (labor, materials, utilities, andequipment), or
2. According to the current accounting system (J, K, L, and M accounts).
14

Furthermore, the level of disaggregation can be considered at different details(e.g., type of labor, or J 1, J 2). Given that the main purpose of performance measure-ment is planning, programming, and budgeting at the OCE level, the following input listis recommended (Figure 1):
I1: Cost of operation of utilities: J account.
12: Cost of M&R of real property: K account.
13: Cost of minor construction: L account.
14 : Cost of engineering support: M account.
15: Square feet of maintenance and production buildings.
Identification of Output Measures
In general terms, the RPMA resources are used to:
1. Accommodate and provide services to Army personnel.
2. Maintain and repair facilities.
Therefore, outputs can be divided into two major groups: those related to personnel andthose related to the physical plant. This division is shown in Figure 2 and is explainedbelow.
Personnel Related Outputs
Quantity as well as quality of the service provided to persons living and working atthe installations should be considered. Therefore, the following outputs are proposed:
0 : population served; measures the quantitative aspect of serving people.
02: (population served)/(number of complaints + 1); measures the quality of serviceprovided to the people.
Note that, as the number of complaints decreases, 02 increases. Hence, 02 can be
perceived as a surrogate measure for the quality of life at an installation.
Facility (Physical Plant)-Related Outputs
An Army installation does not have an external output. Moreover, internal outputsare difficult to measure, as with any nonprofit organization.
In a resource ma.iagement system, one way of determining the outputs is to answerthis question: for what purposes are the resources used at an installation? The physicalfacilities use the inputs (resources) listed above in two ways:
1. As space and surface that require maintenance, repair, and upgrading.
2. As space that consumes energy.
15

INPUTS
J ACCOUNT K ACCOUNT L ACCOUNT M ACCOUNT SPACE
Figure 1. RPMA inputs.
OUTPUTS
PEOPLE FACILITY
QUANTITY QUALITY MAINTENANCE & REPAIR ENERGY CONSUMPTIONOF SPACE OR SURFACE
QUANTITY QUALITY QUANTITY QUALITY
Figure 2. RPMA outputs.
16

The amount of space and surface maintained, repaired, and upgr-oad is an output;likewise, the quality of these services Is an output, as Is the amc int ' space thatconsumes energy. However, the quality of energy consumption is not considered here,since it is an output of a different Army program--the Energy Conservation ImprovementProgram--(ECIP), not of RPMA.
The relationship between the outputs and inputs proposed can vary substantiallyfrom one facility to another. The following features of the facilities introduce thisvariance:
" Function (e.g., warehouse versus hospital),
" Structural characteristics (e.g., paved surface versus building),
" Geographic location.
Therefore, the specific definitions of the outputs should account for these features. Inview of these considerations, the following outputs are proposed:
03: Cost of duplicating the existing facility. This duplication cost (DC) can becomputed as follows:' 3
DC = Acquisition Cost x Index (1) + Historical Renewal Costs x Index (2).
Renewal includes improvements in the existing facility, but excludes main-tenance and repair. Indexes 1 and 2 can be obtained from the BuildingConstruction Index published by the Engineering News Record.
o: Total of backlog maintenance and repair (BMAR) and deferred maintenanceand repair (DMAR). This output is undesirable; therefore, the inverse,1/(BMAR + DMAR), should be used in the performance formula.
0s: Number of square feet of building space conditioned; modified by a buildingtype energy use factor 14 and by heating/cooling degree days.
The output 0 represents the "quantity" of the physical facilities maintained andrepaired; It accounis for the functional, structural, and locational differences betweenthe facilities. Furthermore, 03 is directly related to the inputs proposed under Identifi-cation of Input Measures. Therefore, it is a more useful measure than square feet of thefacilities maintained and repaired.
The BMAR and DMAR values in output 0 are commonly used as surrogatemeasures of the facilities' physical condition. They also account for the functional,structural, and locational differences among facilities. Therefore, in the absence of amore direct measure for the condition of the facilities, 0 can be used as a surrogatemeasure for the quality of maintenance and repair consumption.
130. Coskunoglu, "Appraisal of Army's Facilities," RPMA Information Paper No. 37 (U.S.Army Construction Engineering Research Laboratory, November 1985).
1 Developed by the U.S. Army Construction Engineering Research Laboratory (USA-CERL); see Design Criteria, Architectural and Engineering Instructions (OCE,Engineering Division, 13 March 1987). Available through PAXMAIL.
17
' , , i i I I I l l

Finally, O is a measure of output pertaining to energy consumption. Again, itaccounts for the functional, structural, and locational differences among facility types.
Data Availability
To avoid having to generate new data, a compromise was reached betweendesirable data and data on-hand. As a result, the list of inputs and outputs used in thisstudy can be summarized as:
01: Number of people living and working at the installation.
02: Not used.
03: Redefined as millions of square feet of building area.
0 : 10 9/BMAR; only BMAR is used.
0: (building area in sq ft) x (USA-CERL energy factor for building type andlocation).
I 1 2'1 3',: Total J, K, L, and M accounts, respectively.
Is: Total area of the buildings (sq ft) used for maintenance and repairpurposes.
18

3 DRA COMPUTATIONS AND RESULTS
Computations
A portable personal computer (Compaq 286) with an off-the-shelf linear program-ming package (Vino) was used to solve the DEA computations. Vino was chosen becauseit reads data from Lotus 1-2-3, which is the most popular spreadsheet program.
Results were computed for two major commands (MACOMs) over 3 fiscal years asfollows:
1. MACOM #1, FY852. MACOM #1, FY843. MACOM #1, FY834. MACOM #2, FY855. MACOMs #1 and #2, FY85; joint analysis.
The results for each computation are explained in Appendix B. Table 1 summarizes theresults of MACOM #1 for FY85.
Table 1
Summary of Results for MACOM #1 in FY85
Efficiency Reference No. of Times inInstallation Rate (%) Set* Reference Set**
1 100.00 1 22 100.00 2 03 100.00 3 44 100.00 4 05 95.13 10,15,20,21 -
6 93.74 1,12,14,21 -7 87.86 3,10,14,20 -
8 99.11 1,14,21 -
9 100.00 9 210 100.00 10 711 100.00 1i 112 100.00 12 113 69.67 10,15,20,21 -14 100.00 14 315 100.00 15 516 75.15 3,9,10,15,20 -17 55.11 10,15,20 -
18 89.37 3,9,10,15,20 -
19 65.89 3,10,1120 100.00 20 621 100.00 21 4
*The set of 100 percent efficient installations against which the inefficient
installation is compared. Also see the section Alternative Methodologies andAppendix A.
**The more times an installation is in a reference set, the more indisputable
its efficiency. Furthermore, when an installation is rated 100 percent and
it is not In any reference set, its efficiency can be questioned.
19

Installations within MACOM #1 that were rated 100 percent efficient in each ofthe 3 years examined were numbers 3, 9, 10, 11, 12, 15, and 20. In contrast, the set ofinstallations rated as less than 100 percent efficient in each of those same 3 yearsincluded numbers 6, 13, 16, and 18.
To further review and validate the results obtained for MACOM #1 from thisanalysis, data were gathered for FY85 from 21 installations in MACOM #2 and combinedwith those of MACOM #1 for a joint analysis. With this approach, more observationscould be included in the analysis which should provide better overall efficiency in theevaluations. Even if the two sets of installations are not quite comparable, it shouldappear in the results as a consistent separation of their efficiency evaluations.
Tables 2 and 3 compare the efficiency rating calculated using FY85 annual datawhen the MACOMs were analyzed separately (column 2) and when they were analyzedtogether (column 3).
Table 2
Comparison of Efficiency Ratings-MACOM #1 andJoint Analysis (FY85)
Installation MAOON 11 MACOMs 11 & 12
1 100.00 100.002 100.00 98.383 100.00 98.694 100.00 100.00
5 95.13 95.136 93.75 88.357 87.75 83.338 99.12 93.579 100.00 100.0010 100.00 100.0011 100.00 93.4412 100.00 100.0013 69.67 69.6714 100.00 100.0015 100.00 100.0016 75.15 71.0717 55.11 48.2018 89.38 80.8319 65.90 47.2820 100.00 100.0021 100.00 100.00
20

Table 3
Comparison of Efficiency Ratings-MACOM #2and Joint Analysis (FY85)
Installation MACOM 12 MACOMs 1 &12
1 100.00 100.002 99.89 97.423 91.02 87.484 100.00 100.005 100.00 100.006 100.00 100.007 79.17 78.66
8 100.00 100.009 100.00 100.0010 79.04 71.9711 100.00 100.0012 100.00 1P.0013 100.00 95.9114 100.00 100.00
15 100.00 100.0016 90.48 89.6517 78.17 70.11
18 100.00 100.0019 62.60 61.8720 87.74 85.1021 100.00 100.00
Validation of Results
The results were submitted to prospective users of RPMA resources for validationat two different levels: (1) OCE and (2) the installations. At the headquarters level, themanagers agreed that, in the case of MACOM #1, the installations identified by DEA asinefficient were likely to be relatively inefficient, although values of the slacks*associated with the inputs and outputs in some of the cases were viewed as out ofrange. In addition, the managers thought that the efficiency rate assigned to installation#17 (55.11 percent) was too low and might be due to the geographic location of theinstallation (Alaska).
Regarding the results for MACOM #2, managers at the headquarters level stronglyagreed that installation #19, which was rated at 62.6 percent in FY85, is one of the mostefficient installations. In both cases (i.e., MACOM #1 and MACOM #2), the managersagreed that not all of the installations rated as 100 percent efficient could be perceivedas equally efficient. In other words, the managers held that the model should be able todifferentiate better among efficient installations.
*A geometrical interpretation of the slacks variables, along with their suggested usageby managers, is given in Appendix A.
21

At the installation level, as might be expected, managers were less receptive of themodel's capabilities. From their viewpoint, the model suggests budget reductions sincethe level of outputs is not under their control. However, the installation managersoffered valuable suggestions toward improving the model.
Analysis of the user feedback from both levels reveals that the model shouldproduce better results with the following adjustments:
1. The replacement value, as defined earlier, should be used as 03, instead ofsquare feet of building, to help account for the variety of building types.
2. Instead of using the inverse of BMAR as an output, BMAR should be consideredan input.
3. I, 12, 13, and 14 should be aggregated into only one input, 1, = $(J+K+L+M).
The advantage of the first recommendation was explained in Chapter 2. To under-stand how the second recommendation will benefit the model, consider installation #19and its reference set for the analysis of MACOM #2 in FY85. Table 4 shows the resultsof evaluating those installations under 10 different criteria. Clearly, installation #19 isless efficient for 9 of the 10 criteria. Only under the criterion BMAR/Ksq ft is installa-tion #19 the most efficient. Note also that the seven criteria under which installation#19 is inefficient are all included in the performance model, whereas BMAR/Ksq ft isnot. For this criterion to be included in the performance model, BMAR has to beconsidered an input. As such, the model would rate installation #19 as 100 percentefficient since no other installation is more efficient under this criterion.
Finally, the third recommendation will improve the quality of the results becausethe number of 100 percent efficient installations will decrease as aggregation reducesthe number of degrees of freedom for the model. In addition, aggregation of the fouraccounts into only one input (I) will avoid the difficulties in explaining the value of theslacks associated with each account.
22

Table 4
Comparison of Installation #19 With Its Reference Set
Criteria
Installation SK/Ksq ft SL/Ksq ft $N/1sq ft
5 $576.85 $94.6 $248.1011 $2,432.00 $318.00 5953.3312 $1,314.19 S200.27 5827.7218 $1,074.79 S67.55 $424.3119 $2,075.79 $445.05 $1,478.54
$(J+K+L M)/Pop. $(J K+L+M)/Ksq ft $BMAR/Xsq ft
5 $3,061.84 $1,066.90 $2,388.6111 $268.13 $4,048.67 $800.7312 S1,577.86 $3,659.35 5679.2118 S2,204.70 $2,010.55 $1,355.8219 $2,108.26 $5,152.20 $201.19
SM/Pop. $J/Pop.
5 $712.01 $422.8511 $56.07 S20.3112 $388.77 $477.7518 $465.28 $486.7719 $605.01 $471.73
03/15 SJ/Btu
5 5.3432 $0.002311 13.0435 $0.005812 36.1590 0.014518 9.2885 $0.008119 9.2667 $0.0179
03 = Replacement value15 = Sq ft of shops
23

4 IMPLICATIONS FOR MANAGEMENT
DEA was next evaluated for use in the following managerial tasks: audit andreview of operations, planning, and budgeting, and resources determination and predic-tion. Results from the previous analysis were applied to this evaluation to study themodel from a practical standpoint.
DEA as a Management Audit Tool
The most straightforward use of the DEA results is for auditing to distinguishbetween relatively efficient and inefficient installations. By doing so, managers canconcentrate on those inefficient installations most likely to profit from furtheranalysis.15 In addition, since the efficient installations are in the reference set ofinefficient installations, managers can make comparisons to better understand the sourceof inefficiency. In comparing an inefficient installation with its reference set, the valuesof the slacks for inputs and outputs show where the comparison is weaker and by howmuch. Therefore, by analyzing these values, managers should be able to understand theparticulars of the inefficient installation and whether those properties are admissible.
Efficient installations also have to be analyzed since DEA results measure onlyrelative efficiency. The values of the "virtual multipliers" (U , V ), provide informationabout the input and output mixture that rates these installahions as 100 percent effi-cient. Thus, managers have to decide if that mixture is the appropriate one.
Planning and Budgeting With DEA
For managers at installations rated less than 100 percent efficient, there is animmediate way to profit from the performance model results: by planning in such a wayas to become more like the units in their reference set (hence, more efficient).
Another possible use of the performance model is in the budgeting process. At theMACOM level, the performance model can be used to simulate the budgets submitted byeach installation as if they were real data. For the installations whose budgets are ratedas less than 100 percent efficient, MACOM management can "negotiate" an alternativebudget based on the budgets of the other installations in their reference set. For theinstallations whose budgets are rated as 100 percent efficient, MACOM managers shouldensure that (1) the budget is appropriate and (2) the installations follow it as closely aspossible.
As an example of using the performance model in budgeting, suppose that therequested budget of each installation in MACOM #2 is that shown in Table 5. Table 6
1sH. D. Sherman, "Data Envelopment Analysis as a New Managerial Audit Methodology--Test and Evaluation," Auditing: A Journal of Practice and Theory Vol 4, No. 1 (Fall1984), pp 35-53.
24

Table 5
Example Requested Budgets for MACOM #2 Installations
Replacement
Instal- Population Value Energylation Served D.C. Budget $(J+K+L+M) OMAR Msq ft
1 8.904 1.750433 0.693742 54.135 15.19642 0.5962 46.049 2.893076 1.525868 74.879 14.95708 1.4263 42.212 2.257709 1.310005 56.891 17.57870 1.5754 2.265 1.979978 0.099975 6.37 1.141 0.0255 1.698 0.358625 0.316338 5.199 11.6397 0.9126 46.233 1.430648 0.716229 61.64 5.3088 0.3027 15.765 1.62362 0.495335 32.464 11.991 0.4498 23.874 1.073542 0.615065 35.712 5.517 0.3669 2.784 0.965905 0.254581 113.458 0.89 0.15710 12.656 0.695382 0.378755 29.659 3,809 0.362
11 25.503 0.091396 0.08973 6.073 1.2011 0.11512 25.174 1.251925 0.827437 39.721 8.031 0.32713 40.012 2.61558 1.346354 60,181 28.54462 1.39214 15.499 0.753619 0.46455 23.434 9.509921 0.257
15 15.822 0.756672 0.473115 40.136 26.898 0.20716 19.015 1.08138 0.36737 29.833 1.321 0.24217 3.807 0.493099 0.132355 12.258 2.29 0.09618 3.024 1.549681 0.18198 6.667 4.495892 0.35719 19.702 0.959136 0.519221 41.537 1.622 0.8720 35.387 2.815029 0.95207 52.144 5.288 1.12121 47.023 2.796394 0.842773 36.66 2.281 0.651
lists the results of applying the performance model to these requested budgets. Theresults in terms of installation #1 can be interpreted as folows:
" The budget requested by Installation #1 is only 60.07 percent efficient com-pared with the budgets requested by the rest of the installations in MACOM #2.
" Installations that had the most influence on installation #I's efficiency rate are4, 12, and 21 (reference set).
To increase the efficiency of installation #1's budget, management should try todecrease the amount of inputs budgeted. As an example, there are three possible ways ofmaking this installation's requested budget 100 percent efficient:
1. Reduce (J+K+L+M) by 47 percent, or
2. Reduce BMAR by 88 percent, or
3. Reduce (J+K+L+M) and BMAR by 46 percent each.
25

u
9 CIO 0 V 0 0af 0 P0ei 9 0
N 00 00 00 em
v g o '0
0W @V. g~N ON N
goo googo V.. -.
to I
0 0 0 0 0
-0000- 0- 0- 0- 0-0
* ~ (fl 0 0 00 0
(N;
. 0 0 0 - C;V
00.
- - CV. ~ .-
p~ Li;~ V ~ O ~ V26

v ioi0 0
- ~ 0 0 cc-- o C, a.c i a.i
0w em~ 0-0
mM,-~~~4, -0n 00 ONN
0 0 0 0 m 0
0N
gC a
-,~~ N- 0CIO
0- C
co co 00 00 0 0000
o . . .n.10,0 0 C4-VN0 ' OM
Qy 0 0 N-
NV0 n- - N~l V 0n0 - .M 00 27n

N
N 008
w 00
a-go0 -mNO 0 NWM~; 70 0 N
T0 W, c!
N
j00 00 W a 0 000
In 0 -00 -0 W00 -0. 0
-0 0 - o 0 0f a 0 C
-0! W *0WN - 40 do 0p.
-, N- C0 N cc- go 0 0 o oo0
CU 10 0 0 Sic ic 0
-I~C - (- 40 N
-'00 N 000 000 co 000 0o0
o ;C;
0 -
0 - - -28

Resource Determination With DEA
One of the most attractive features of DEA is its ability to identify the efficiencyfrontier, which allows managers to know if a "production possibility" will be relativelyefficient compared with the rest of the DMU. This property of DEA can be exploitedfurther by managers when trying to predict the level of resources (inputs) needed toreach a specific level of outputs in the future.
The above problem can be approached using DEA as follows:
Let ad -- (0 id'""Osd) be the known level of outputs that installation d wants toproduce next year.
Let I'd = (lid'"".Imd) be the unknown input vector necessary for installation d toproduce 0 d next year.
Let I = (I ,... I) be an estimated input vector for installation d. In other.9 ang 'mg -
words, I 9 is an input vector with which management "feels" confident to produce 0 dg.next year in installation d. Then:
Let DMUD be a dummy DMU with its input-output vector represented by (0d' -g).
Now DMUD can be added to the set of installations, DMUj; j=l,...,n, and theefficiency of DMUD can be evaluated with respect to the extended set of installations,DMUj; j=l,...,n,D.
Suppose that DMUD is rated as less than 100 percent efficient. Then, project-ing (Od' Y' ) into the efficiency frontier 16 will make DMUD 100 percent efficient. Inother words, the input vector = 0 • I - S. will be enough to produce 0 next yeardg dif DMUD operates efficiently.
Observe that the production possibility represented by (Od, Yd) is the efficiencyfrontier point "closest" to (Od, Y ). Here, "close" means similar in production technol-
ogy or input-mix. Thus, the problem being addressed has several different solutions, eachdepending on the input-mix (recipe) to be used to produce 0d"
Since the value Id' as determined above, depends on the value I seeded, theprocess can be repeated several times to explore the various alternatives in input-mix forDMUD to produce Od" Managers will be responsible for deciding which Id (input-mix)DMUD should use the following year to produce 0d#
*Feasible set of inputs and output values.16A. Charnes and W. W. Cooper, "The Non-Archimedean CCR ratio for Efficiency
Analysis: A Rejoinder to Boyd and Fare," European Journal of Operational Research,Vol 15 (1984), pp 333-334.
29

To continue the example, suppose now that the data in Table 5 are the real datacorresponding to the installations in MACOM #2 for FY86. Then, Table 6 now containsthe results of evaluating the Installation's performance during FY86. In other words, nowthe interpretation of results regarding installation #1 is:
* The efficiency rate assigned to installation #1 in FY86 is 60.07 percent.
* Installations with the most influence on installation #1's efficiency rate are 4,12, and 21.
Suppose also that the managers want to know how much (J+K+L+M)-- 1--will cost tooperate installation #1 in 1990 assuming that: (1) 0, 03' 0., and 15 will remain at thesame level as that in 1986, (2) 02 will increase 10 percent with respect to the 1986 level,and (3) 12 (BMAR) will not exceed $5 million. To solve this problem, the managersproceed as explained earlier:
1. Create a dummy DMU for installation #1 - with: 01 8.904, 03 1.925476, 05= 0.693742, I = dummy = 54.135, 12 = 5 and 1. = 0.596.
2. Add the above dummy DMU to the set of installations in Table 5 and apply DEAto the new set. The efficiency rate of the dummy DMU is then 66.43 percent (Table 7).
3. Decrease the value of I in dummy DMU until its efficiency rate equals 100percent (Table 7). The value of 11 that makes the dummy DMU's efficiency rate 100percent is 13 = 29.31139. This figure will be the cost to operate installation #1 effi-ciently in 1990 assuming 1986 prices do not change.
One more issue should be addressed under this discussion--the reallocation ofresources among efficient DMUs. Here, the question is "Which DMU will have thegreatest potential to use additional resources," or, "Which DMUs are underfunded, and byhow much." The answer to these questions requires a deeper analysis of the efficiencyfrontier.
At first glance, the underfunded installations, if any, must be among the units rated100 percent efficient by DEA. As a general rule of thumb, resources should be real-located from inefficient units to relatively efficient ones. However, the efficiencyfrontier must be studied closely since DEA does not differentiate among relativelyefficient installations. One way to further differentiate among relatively efficientinstallations using DEA is by seeding a small number of "utopian" installations into theset of DMUs (utopian in the context of efficiency). By doing so, only the fictitiousinstallations will be rated relatively efficient, and the rest of the DMUs (DMU = j; j1,...,n) will be evaluated against them.
The main drawback to this approach is that the utopian installations do not belongto the production possibility set; hence, the new efficiency rate of the real installationmay be unrealistic. However, this problem can be alleviated by selecting the utopianDMU to be as realistic as possible.
30

Table 7
Resource Determination With DEA
U1 U3 U5 VI v2 v5
01 03 05 11 12 i5
0.0001 0.0001 95.76124 0.842747 3.012537 65.96505
Dummy $l 8.904 1.925476 0.693742 54.135 5 0
1.532 0.376766 0 0 0 0
REF.SET 21 12 9
LAMBDA 0.000907 0.174583 2.154602
Decreasing 12
0.0001 0.351734 123.5046 2.339895 0.0001 29.63733
Dummy 1 8.904 1.925476 0.693767 35.18775 5 0.596
24.07107 0 0 0 0.406969 0
REF.SET 21 12 5
LAMBDA 0.581312 0.219265 0.07808
Further Decreasing 12
0.005986 0.323894 143.1764 2.713590 0.0001 34.32949
Dummy 12 8.904 1.925476 0.693742 29.31139 5 0.596
0 0 0 0 0 0
REF.SET Dummy £1
LAMBDA1
01 = Population served03 = Replacement value
05 = Btu/yr.II = S (J+K+L+M)12 = SBMAR15 = Sq ft of shops
31
5 CONCLUSIONS AND RECOMMENDATIONS
Three modeling techniques have been studied for potential in providing an output-oriented performance index to evaluate the efficiency of RPMA programs at U.S. Armyinstallations. The methodology chosen for further evaluation was DEA because of itsability to handle multiple inputs and outputs simultaneously and without requiring a priorispecification of weight or functional relationships among these parameters. Thesefeatures make DEA suitable for application to not-for-profit organizations such as Armyinstallations.
The DEA proccess was analyzed, and it was concluded that:
1. DMUs identified as inefficient by DEA were strictly inefficient compared withother existing DMUs.
2. DEA can associate a narrow set of relatively efficient units (the reference set)with the inefficient unit under evaluation, which helps managers identify the source ofinefficiency.
3. DEA identifies an efficiency frontier consisting of relatively efficient DMUs,which means this frontier is a practically attainable production possibility set.
4. DEA does not necessarily locate all inefficient units; thus, some units rated asrelatively efficient may be strictly inefficient.
5. DEA identifies alternative paths for making inefficient DMUs become relativelyefficient.
6. The choice of input and output measures used is critical to the inherent value ofthe results.
Input and output measures were selected to fully exploit the capabilities of DEAfor the user. A compromise was reached between the desired data and that which wasavailable. Numerical results of the analysis were presented to a panel of managers forvalidation. These managers suggested that the model should further differentiatebetween the installations rated as 100 percent efficient.
This study has shown that DEA is a theoretically sound technique capable ofevaluating the performance of RPMA at Army installations. Optimal use of DEA will bepossible once the method Is "fine-tuned" by testing alternative input and output measuresuntil Its capabilities are fully exploited.
Based on these findings, it is recommended that a prototype of the performancemodel be implemented within OORMS to allow prospective users to test alternative inputand output measures.
32

REFERENCES
Banker, R. D., R. F. Conrad, and R. P. Strauss, "A Comparative Application of DataEnvelopment Analysis and Translog Methods: An Illustrative Study of HospitalProduction," Management Science, Vol 32, No. 1 (January 1986).
Bessent, A., and W. Bessent, "Determining the Comparative Efficiency of SchoolsThrough Data Envelopment Analysis," Educational Administrative Quarterly, Vol16, No. 2 (1980).
Bessent, A., W. Bessent, A. Charnes, W. W. Cooper, and N. Thorogood, "Evaluation ofEducational Program Proposals by Means of DEA," Educational AdministrativeQuarterly, Vol 19, No. 2 (Spring 1983).
Bessent, A., W. Bessent, C. T. Clark, and J. Elam, "Constrained Facet Analysis, A NewMethod for Evaluating Local Frontiers of Efficiency and Performance," Air ForceJournal of Logistics (Summer 1984).
Bowlin, W. F., A. Charnes, W. W. Cooper, and H. D. Sherman, A Comparative Study ofData Envelopment Analysis and Other Approaches to Efficiency Estimation,Research Report CCS 451 (Center for Cybernetic Studies, The University of Texasat Austin, September 1983).
Bowlin, W. F., A Data Envelopment Analysis Approach to Performance Evaluation inNot-for-Profit Entities With an Illustrative Application to the U. S. Air Force,Ph.D. dissertation (The University of Texas at Austin, December 1984).
Bowlin, W. F., Report on Evaluating the Efficiency of Real Property MaintenanceActivities in the Air Training Command (Air Force Institute of Technology, Wright-Patterson AFB, OH, November 1984).
Charnes, A., and W. W. Cooper, "The Non-Archimedean CCR Ratio for EfficiencyAnalysis: A Rejoinder to Boyd and Fare," European Journal of OperationalResearch, Vol 15 (1984).
Charnes, A., and W. W. Cooper, "Preface to Topics in Data Envelopment Analysis,"Annals of Operations Research, Vol 2 (1985).
Charnes, A., and W. W. Cooper, "Programming With Linear Fractional Functionals,"Naval Research Logistics Quarterly, Vol 9 (1962).
Charnes, A., W. W. Cooper, and E. Rhodes, "Evaluating Program and ManagerialEfficiency: An Application of Data Envelopment Analysis to Program FollowThrough," Management Science, Vol 27, No. 6 (1981).
Charnes, A., W. W. Cooper, and E. Rhodes, "Measuring the Efficiency of Decision-MakingUnits," European Journal of Operational Research, Vol 2, No. 6 (November 1978).
Charnes, A., W. W. Cooper, and E. Rhodes, "Short Communication: Measuring theEfficiency of Decision-Making Units," European Journal of Operational Research(1979).
33

Clark, C. T., Data Envelopment Analysis and Extensions for Decision Support andManagement Planning, Ph.D. dissertation (The University of Texas at Austin, May1983).
Coskunoglu, 0., "Appraisal of Army"s Facilities," RPMA Information Paper No. 37 (U.S.Army Construction Engineering Research Laboratory, November 1985).
Design Criteria, Architectural and Engineering Instructions (OCE, Engineering Division,13 March 1987). Available through PAXMAIL.
Lewis, A., and R. C. Morey, "Measuring the Relative Efficiency and Output Potential ofPublic Sector Organizations: An Application of Data Envelopment Analysis,"International Journal of Policy Analysis and Information Systems, Vol 5, No. 4(December 1981).
Output Oriented Resource Management System, Handbook (Office of the Comptroller ofthe Army, June 1986).
Real Property Management Activities (RPMA), Executive Summary, Vol 1 (Departmentof the Army Study Group, March 1978).
Sherman, H. D., "Data Envelopment Analysis as a New Managerial Audit Methodology--Test and Evaluation," Auditing: A Journal of Practice and Theory, Vol 4, No. 1(Fall 1984), pp 35-53.
Sherman, H. D., Measurement of Hospital Efficiency Using Data Envelopment Analysis,unpublished DBA thesis (Graduate School of Business, Harvard University, 1981).
34
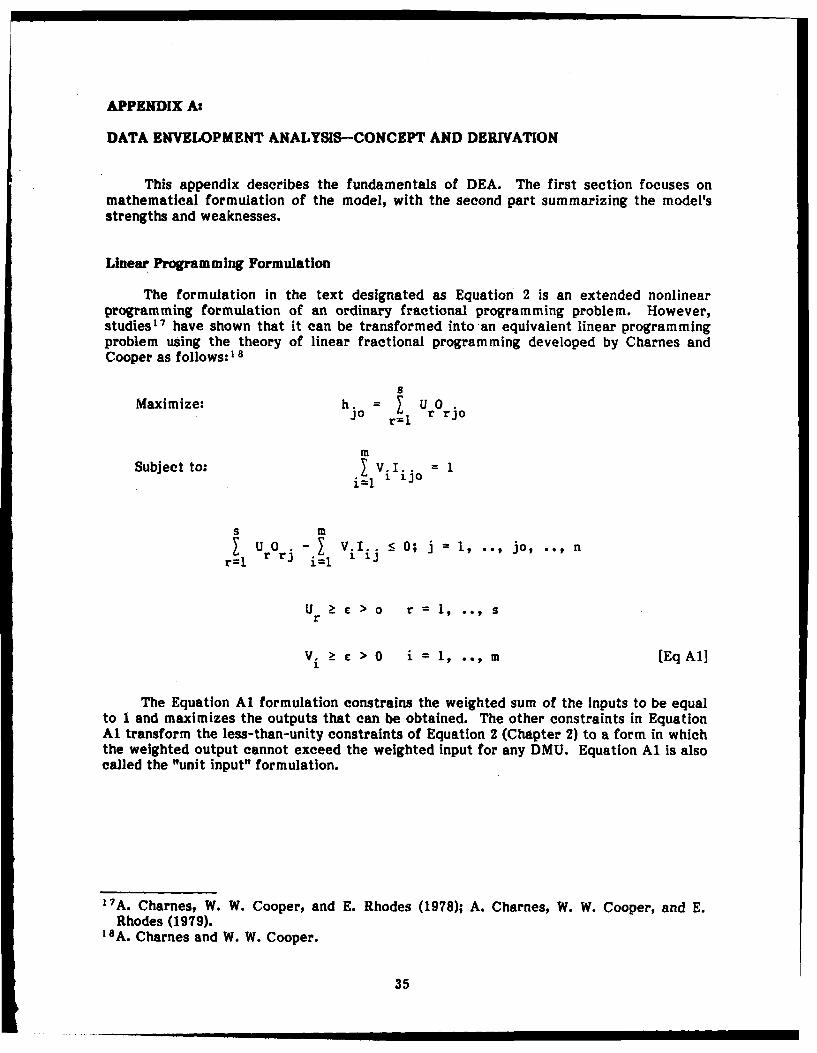
APPENDIX A:
DATA ENVELOPMENT ANALYSIS-CONCEPT AND DERIVATION
This appendix describes the fundamentals of DEA. The first section focuses onmathematical formulation of the model, with the second part summarizing the model'sstrengths and weaknesses.
Linear Programming Formulation
The formulation in the text designated as Equation 2 is an extended nonlinearprogramming formulation of an ordinary fractional programming problem. However,studies 7 have shown that it can be transformed into an equivalent linear programmingproblem using the theory of linear fractional programming developed by Charnes andCooper as follows: 18
s
Maximize: h. = O0J r=1 r rjo
m
Subject to: V.I = 1
s mI ur~ -r Vi Iii 0; j =1, .., jo, .. ,n
Ur > o r 1,.,s
V. > C > 0 i = 1, .. , m [EqAl]1
The Equation Al formulation constrains the weighted sum of the inputs to be equalto 1 and maximizes the outputs that can be obtained. The other constraints in EquationAl transform the less-than-unity constraints of Equation 2 (Chapter 2) to a form in whichthe weighted output cannot exceed the weighted Input for any DMU. Equation Al is alsocalled the "unit input" formulation.
17A. Charnes, W. W. Cooper, and E. Rhodes (1978); A. Charnes, W. W. Cooper, and E.Rhodes (1979).
'8 A. Charnes and W. W. Cooper.
35

The dual linear program of Equation Al can be written as follows:
Minimize: (0 S- + I S+))i=l r r
n
Subject to: -X 0 - Sr= 0 r = 1, sj rji r rjo "
n
- I~ X -Ie .. =7+e. 0 i = 1, .. , mjf1 J IJ I 1JO ' "
Xi, S+r S- 1 0 and e unrestricted in sign (Eq A21j, r' .j
Where:
0 = An intensity value or multiplier of the observed input vector XioS = output slack for output "r"r
S. = input slack for input "i"i
e = A small non-Archimedean constant.
In Equation A2, the variable 0 is considered an "intensity" variable that reduces thevalue of all inputs to the smallest number permitted by the constraints. Thevariables A . ; j=l,..,n are the dual variables associated with the constraints representingDMUj; j=l,..,n in Equation Al. For X ,.to be positive (>0), its corresponding DMU.constraint in Equation Al has to be equal to 0, which means that DMU. is in the refer-ence set of the DMU being evaluated, DMUjo.
The name "data envelopment analysis" comes from the facts that, in EquationA2: (1) the linear combination of output vectors represented by the X .0 . envelops thej robserved output vector of the DMU being evaluated from above, and (2) the same linearcombination, but with the input vectors, envelops the "minimum" vector of observedinputs from below.
The presence of the non-Archimedean constant in the objective function ofEquation A2 is equivalent to a double optimization since e is so small that
m s +(I S- + I S )] does not affect the value of 0. In other words, two optimizations
=1 r=1 M soccur at the same time: (1) minimize 0 and (2) maximize (I S + S)
i=1 r=1
By virtue of the duality theory of linear programming:
s 8 s
Maximize h. = U 0 • = Minimize (0 - £ (S 5r + I S) [Eq A3]Mxmzho=r 1 r rjo ir= il
Also note that S+ and S. are the dual variables associated with the constraints Ur >C ,r I
Vi _£ in Equation A2, respectively; therefore, at optimality, the only time the cor-responding Ur = e and/or Vi = c is when s > 0 and/or S4r > 0.
36

From the above discussion, it can be shown that a DMU is considered efficient if
and only If e* = I, and all S. and Sr are equal to zero In Equation A3. This reason-
ing is called the non-Archimedean efficiency theorem for which formal proof can befound elsewhere. 19
Efficiency Adjustments and Projections
In addition to measuring the relative efficiency of a DMU, DEA provides additionalinformation for the inefficient DMU to become efficient. Let 0*, X., S i Sr be anoptimal solution of Equation A2 for DMUjo. Then, Equation A2 can be rewritten as:
n0* . - S. = I..X i=1, .., m
10 1 11 J [Eq A4]
+* M *0 + S = 0 r. r=l, .., Sro r j. 1 rj j
If the left-hand side of Equation A4 is replaced with Equation A5:
= 0 I. - S. i=l, .. , m10 10 1
0 =0 +S$ r1l, .. , sro ro r
then a DMU with its production vector represented by the new values (,I) will be+* J Jrated efficient, relative to the same set DMU j=l,...,n, since 0'* = 1, S r = 0 and e
0 will be an optimal solution of Equation A2. (Formal proof of this derivation is shownelsewhere. 20) Thus, the transformation (Eq A5) projects DMU. into its reference set,and the values S. * Sr and 0* represent the adjustments needed for DMUjo to becomeefficient. ' r
To better explain the Charnes, et al. formulation, it can be applied to a simpleproblem with a simple geometrical solution. Consider a set of four DMUs each with twoInputs, I and 12, and one output, 01. To simplify, assume that O is equal to 1 for thefour DMU's. Figure Al represents the four DMUs by their coordinate values for I, and12. For example, P, has Ill = 2, '21 = 2, Oil = 1; P 2 has 12 = 3, 122 = 2, O12 = 1; andso on.
19A. Charnes and W. W. Cooper, "Preface to Topics in Data Envelopment Analysis,"Annals of Operations Research, Vol 2 (1985), pp 59-94.20A. Charnes and W. W. Cooper (1985).
37

X2
P4 P3
(4)@) P ? P
-2 (32)-t
Figure Al. Example problem with a simple geometrical solution.
To evaluate P 2 ' its coordinates are inserted into Equation A3 to obtain:
Minimize: 0 - CS -S - C
Subject to: 30 = 2X + R 2 + 1X3 + 6x + S 1
2=2X1 +22+4 3 +44+ 2
1+S1 =1 +) 2 +X3 +X4
for which the solution is:
0 =1, S =1 X Iland
S2 S1 X2 X3 X4 0
Although G* = 1, DMU P2 is not fully efficient since S equals 1. The fact that
X = 1 means that, wheni being evaluated against P1 1 Moreover, the value ofoS P1 toepoduc thwen comparing P 2 with P1 I, P2 uses one more unit of input I than
doe Pito rodce hesame amount of output. In other words, P1 produces the sameamount of output as P 2, but with one unit less of Input, I,, and the same amount of 12 .
For P 2to be as ef ficient as P 1, it has to reduce 11 by one unit, which produces the
2f
same result as if the transformation (Eq A5) had been applied.
38

The solution of Equation A3 for P1 is:
1, S1 = S2 = 91 = 0, X1 = 1
A2 X 3 = X4 = 0
which means that Plis fully efficient, and also that it is evaluated against itself,
= 1). Thus, no other DMU is more efficient than P1.
In the same way, the result of evaluating P4 is:
* A -/ -* 4-*A
o =1, S = 2 = SI =0, = 1
X2 X 3 X 1
which means that P4 is fully efficient, and no other DMU is more efficient than44P 4' (G4 1 ).
Referring to Figure Al, the solid line connecting P , P 1, and P2 is called the"efficiency frontier" and is made up of convex combinations of DMU with the efficiency
rate equal to 1, (o 1). Note that, although P2 is a frontier point, it is not DEA*2
efficient because (S = 1). A point such as P2 is called, in DEA jargon, a "cornerpoint" of the efficiency frontier.
Similarly, the result of evaluating P3 is:
= 1/2 S = 1, X, = I and
-* +* "* "* *
S2 S1 = X2 = X 3 X 0
which is to say that P3 is being evaluated against P = 1 ( = 1). The value of e* 1/2represents the ratio of the Euclidean distance from the origin to P3. For P3 to be asefficient as P1, it has to reduce its inputs in accordance with Equation A5 as follows:
1 13 =6x 1/2-1=2
123 =4x 1/2=2
The reduction in inputs represented by 0 I. bring P3 to P2. This reduction is acontraction in which the mix of inputs (technology) does not change. The reduction ininput represented by Si , on the contrary, requires a change in input mix, which brings
P3 from P 2 to PI, and it does not increase the efficiency rate, 0 . Consequently, thecontraction represented by 0 1. projects the inefficient unit into the efficiency fron-tier, whereas the reduction represented by S1 brings the inefficient unit into the so-called DEA efficiency region.
39

DEA Properites and Interpretations
Properties and interpretations of the DEA model above are summarized below.
Relative Efficiency
One hundred percent relative efficiency is attained by any DMU only whencomparison with other relevant DMUs provides no evidence of inefficiency in the use ofany input or output.
Weights
DEA does not require a priori determination of weight to compute efficiency.
Efficiency Rating (0*)
The efficiency rating assigned by DEA is the best possible value attainable by theDMU being evaluated. The efficiency rating does not depend on the units in which theinputs and outputs are measured.
Reference Set
DEA also provides the relatively inefficient units with a set of relatively efficientunits that have a "similar" input/output mix.
Efficiency Frontier
The efficiency frontier consists of a piecewise linear combination of the efficientunits, which means that it is practically attainable since it is in the production possibilityset.
Efficiency Improvement
V. and U are the dual variables of Equation A2, representing the marginal gain inr
efficiency if one less unit of the ith resource is used or one more unit of the rth output isproduced.
The transformation (Eq A5) that makes an inefficient unit DEA efficient can beseen as a two-stage process:
1. The reduction of Ii to 0 1. increases the efficiency rate to 1 without changingthe input mix ("recipe").
2. S. and S represent the additional marginal improvements possible for the1 runit to become truly efficient.
Production Process
The DEA model assumes that each input has some relationship to one or moreoutputs, but it is not necessary to specify these functional relationships explicitly.
40

APPENDIX B:
EXPLANATION OF COMPUTER OUTPUT
Table B1 contains the FY85 computer output for the 21 installations of MACOM#1. For each installation, there are five lines, of which the first three lines contain thevalues of the weight, slack, and input/output as follows:
Column 1: Name of the installation.
Columns 2-6: Output-related values (note that 02 is missing because of dataunavailability). For the installation, there are three numbers under each of thesecolumns. Consider for example, column 2 (Output-I: Population Served) of row 1(installation #1):
1. First number (u) = 0.001163. This is the weight assigned to output 01 (popula-tion size) installation #1.
2. Second number (01) = 50.79. This is the value of output 01 for installation #1.That is, the population of installation #1 is 50,790.
3. Third number (SO ) = 0. This is the slack in output 1. To illustrate this value,consider installation #5 w~ich has 5.065528 thousand slack. Thus, using the currentresources, installation #5 could serve roughly 5065 additional people. (Appendix A givesdetails.)
Columns 7-11: Input-related values. For example, column 7 (Input 2: K account) ofrow 1 has three numbers:
1. V = 0: the weight assigned to K account by installation #1.
2. 12 = 19.11532: the amount of funds (in millions of dollars) received by installa-tion #1 under K account.
3. SI 2 = 0: Slack (inefficiently used) money by installation K under K account.
Column 12: Efficiency rating (performance) of the installation. This efficiencyrating is relative to other installations in the reference set.
In addition, the reference set of each inefficient installation and its correspondingXi values (as described in Appendix A) are reported in the two lines named REF. SET. and
LAMBDA.
Tables B2 and B3 contain the results for MACOM #1 for FY84 and FY83, respect-ively. Table B4 contains the results for MACOM #2 for FY85; Table B5 lists results ofthe joint analysis for MACOMs #1 and #2 in FY85.
41

- 0 I 4 I a 0 a a
so I Io U a a I so oft I
*~~~~~~. WC *0 I0 Cac 0S~ I n e a a -t sw a4 r- a n a . e a a *c cn , an
I fl~ I a a m.. I ce a mac ao.,, I lr-,vn o-0 0 a. a i a a e rI a
0 0g go 0 10II a a a a -c i - a ~* a 4 a I a a a a -m a - I U
a. 0 1. m m1 0 am0 n I a a a
a ga 4 U~ an ar an 0- 0e a n
z 0 ao :1 aa I . w-- a a -
M a 0 a a P 0ga~e4 a--c m-re a gateI g~O I C ae I gen to
en. ~ ~ ~ ~ ~ Ic Nce 9. go rn a ae- ana C n4 m- a ac a mo IK arv ac- me en N n
an -a. mr- 4 OC a nn a mae ~eaao %-a42

I I i a II aI a IIM Ia a0 0. i, 1 a
U, a aI ai -' ; a a ,I.. i I a a a~v aoe a~ oo I 5 .
* i a a a , a 54,lact- me SO . a ae a ann i at. i S~o I int,
o o 1 W ,I,• o -i aa a p. i a-a,0 a
aa i 0 I It' I
ai a a a a a It a a=. :'
:o. :o : so.
ant It' a 0a c- I 5a I at .
Wat I IIan a e c aes in o N n
ac ant a a n ca ~ c
at a• c a sm . act a aa a se - •- •
W 0 r
no= 0 " 00 "" : '° °.:
a ca a a a -aa
a a a a a a a a
* S-Cc, snc a iatr c a at-n a 5Su• i- o I na -
0 oo - a. aca~~~~6 1 - a s a -a
... . ....... a nea -ca a-o s--wa... .ncao
a ac n an. a.a .. n a .. . a .. . ...
:0o 0o 0 :000 -:coo : -: oo 000 V o : - o0 c: : csoaI I a ac a
lb n - - c a a- an, a a on a *
0 w
ac ni .. . .a . n o a a t. a o aa . a a . a . a ta a a cc a 5
a t c a .am sm a anm a ac-c 55 c a Na -
- a a an a s
I 5 I -a so a * a t'I aI aI
a a- a cacn a ann ~~a - n C.. s n a c n
a ~ ~ ~ ~ ~ ~ 9 ,O a -a a a - a 5 4 a a a Cu a a-a a a n a
I a ne a at- i c a ac a acm a ac' a an-3

u. .a a a a
0 U ra a a I - a 6
a~ ~ aI a a a a
a a a epa 1a a 1 a 1 c a a1 a 1 - a
aZ a a an a .c n a1 a. a a n a a . aa a a a a a a a a a
a a- c a ... IIe a a-va a a a,, a... a I-n aN-nI a-- a aee a a .. a c-.c'a acD~a C- a ae
a a a a1 a a - a a aap,~ ~~~ a a C- a l a a a~a . a N a
a~~ a a a a 1
a .ac a "Wena nan a . 1, a .ac- ac a a a0a~~~ ~ I~ av a ae1 a N0 acw c- a etat e
ann ac. a ce a~..a n a a.. 0.ceca ac ~a -a -0 a 0 n a - n n n - n
a P a a a a 0a a-cal e.O a 0-0ca .a-n. a : a 1n.,a.:a a-
a aa a.. ae ca ac a c- a aw n
a a 0 a-- a a 0 e a -. ao a nc ac a ace a
a a a a a a a a a a a0 ta ~ ~~ ~ ae ca a n a n - -a nea . e cnca a na a~ a .. a nac na . ee pan- a nat- a NN(a -. awe a a...n a 0 -ac ~ae n a n a w n c--- a-c~~~~ a tn a-acana- 0
6 Ne C afn a aN. a
a a a a a a a Iaan a an
a ac e a ~ nca Un~aca aen a a ne a ane a a neaI a.- ac a.- cc am aK an cw l n
a nara a ae ant.. a a.. anc a a-. e
anf~pn p-r a atn an a a- a a.n a.4

Ix Ia I o I I a a a - aWa t It - a an . a a a e aIw a amaC;C I a n a
Ad. Id 1c 11w a1a 0 a a a
at. a a. a a . a a a 0 a1 a-
av a am 1 Ws a- a W a ai. a a '
a .a o a- a - a . a a 1 0 a
a a .a a " a a afl a a
0 0 a e a a a 1 - a a* 0, 4 a1 c a
c o 1 a 0 a 1, 0 a a a . 1 a, v a - 0
a -a a - a a a a - - a
a I a a a a a, a a a a a a
a~~0 0 n - . e ~ r f a- .a~~~~~ no a0 a0:s0e"0=n0n ae at. an
ann- a a~ ae a~c ~ an at- Ic WWa-a 0 a O a0 n a. a c ~ m t ~ a~
a~~~0 a1 a 0a0.a, a a a - a1 a 0 a a a aa ~ ~~~~ a a 0e d c a e I
a 0 : - = a a a a aa n e en ccaced. 0.e eS 00 Cdn
a n V o a-0 u aw ~ 0 0u..
a ~ ~ ~ ~ ~ . :0 a w:c0 c aw a n a m ~a WO a ~ a. a u n cas a - c
a -U aan a. s do t ac - a u t4at

a I a a a a I a a- a a a - a . a a a t o a aa a ac a tO a a a - tea a -
a- a a an a at. a t - ta I - tO aI 0~ Vt a a a - a a are art ti-i a
I - a-~ an an an a. a~ a I- a aa- I a - a.- I- a - a.-. - a ae a - anI a - a rd an a - I a I In a - a - a a
a an a - a . an a a - IV, a - a - a - a aa a a . an a a - a - a-. a - an a - aa In I~ a - an - a . a a a - an a',
- a I - - aa.a a a a a - a a - a - I* a a, I - a am a a a an a - an a- aa a - a a a - a in a a a- a - aa I-. a a a - a a a a a - a a
a I a a a a a a a a a a a* a , a a a a a a a a a a
a a a a a a a a a t aa a a a a a a a I a a a
a )- a a a S S a 5 a S a S a S a 5 a S a 5a U a, e a 0 a 0 t N a C a e I N a ra a o a c a C aa a a a a a - a - a e a n a a o a e a e a t aa a.a a a a a a a a a a - a a aa - Ia 0 a C I n a Vt a c a n a r- a e a c a e a e a
U a a 0 a 0 a * a N a C a S a n a n a e a C N aa - a a a .. a a a - a a a t - a - a aa a.. a t a a a a a a a a a aa a.. I a a a a a a a a a a a al.a a a a a a a a a a I a a aa a t a a a a a a a a a a aa lance, r-ne ante eve cr40 acne acne anne ar-nc tote ceo aa tact- a-- a.. cv a e a-c ace an, acN an. Se aa v.a aNn a cc mm ann a - a-. to.. an. an a.. a.. anat.-. a a. a.- an an a - a. a a. tee to Ic aI,-afl a awe an- ave a-- a e tne C VIe an no tO- a
a an a - at an a as an an 0 an ama a a a a a a a a a a a aa a 0 te ae ac a ac I. 0 I- Ic 0 aa , a a a a a a a a a a a
a a anna a c.c cnn anne a-ne acn aen.- aen. acne acne ton-aa a a~ ann a ran acm a-n a Nn a n-a rant N a . a em,
na ace an. a nN aen tee a fin a eta en a n a - a cn alwv.a art. Sc a eN an ann a cr4 a -ma n-a - a n a fi..aar-li, a ON ann a n-a-c a- a -r- a e. a flea - a n a fin aa a or- a .- e a etev a-N a tea cOt . a a o a n-a* a a a a c a a a - a a n a a, a aa a ace acra a - on ac a era a nc a na - a e a ec aa a a a a a a a a a a a a a
a a ON e a e . c a * n e a e fi c a ce c a ra N c a .- m 0 a a n. a cc e a eve a n ra e aa a edt a C awn a .n a N anN an.. a -Nt m an- INna ma a... a . ann a v. N a-. an. ~N t N at. an.. a- ar-n.. a aNn t C ace a nr a c tote acm a mm a t a.n N.. ap '-~ at- ~ I-N a -. a no a-n a .- a - aNN amN a
ann ten a .n a - a-N -Cv a Nfl t an leN 0* aa a a a a a a a a a - a a a a* a tOn a no a nc a to... ace a n..a n acm t0a a a a a a a a a a t a a aa a ann 0 level e Nt anne acne a e n a a neacec a oNe a o . a a. no a
a a n a .- n anN a e a tea
a anN a - a N an.
ana~-. n eN an: a . anal., a scan,, an. aa a tea cr-a me a t a n am.
a a a NO a-n a a act -- a -c a C a . a...a a a a a a N a a a aa a a a a a r- a a a n a n a . aa a a a a a -n a n-a -. a n I - to- a* a a a a a a a a a a a
- I eec a etc ac-n anno anNe a~nc cnn anne tecc etc atfic aa ra a a a nt INn In.. ann a ec ace awn ace t~N a
- a n a ra a ran lee an. acra a en am. Inc ann NC aa--- a a ra a nm aN. em ac- a cc Inn ten ann ar-v aas-an; a n a ra a net.., an ann a cna.. Ic.. a-n a-n aa a a a Nn ac cv acm a * leN to to toa a a c a v a a a a a . a a a, a r- a - aa a a n a - a ran to.. to ace a c ten ten ac.. ac- aa a a a a a a I a a a a aa a ante anne Ion., en. acee an-c acne annc acne Inca ac-v aa a en a no a me a tnt - an- ann lee I e ac.. a n-a* w, a ten ann a a.a. a nn a - a-v ace tee a - ten a Ne aIntrO a tt ate a 0,0 a tiN a - no at-..- ace a e len a, fin* ~oafl a an.- a-v a nc a en a n a rat ann ten a e a tn a en a
a te~ ave a me a o a ac ac~ an a. a an - a oe a* a I I a a C a c a e a a o a a - a* a toe a e.. a eel c a a - no a- a - te a -o a
a a t a a a a a a a a* i a Sec a nec a N-c a nNe a nec anne anne a--clove a-cetera, aa I on a-n a me ION I-c ace a-c ace tot- ac, a em aa na let Icr- to.. act- aera act ace ton tee ten a nra,
vtO a ten toe acm a en ten ton to en ten ten a mm aroan, 0 a ON tO to lOt o ten 10 10 0 a neta tarn *o lee tee ac tee ace to. tce to.. a a
a Ia n a - a e a - a a e a a a - a - a -,- I evaa tat.. tOn to.- Ic-. Ic Ion ac.. ten Ic.. ac.. a neta - I t a a a a a a a a a- a aa a 'Owe a One anne ammo a ceo Oct. acne cnn anne acne anne aa a a 0 a n Inn a -N a-n a en a rat a er-at, tee ate a
mat - a acta act- ace a n~ a nN a or- lNtt a-- Lee aa-ICC a, a c at- at- an a ma e a nan an - a- a
I a'Ctan a a - a - an. al-am atm a er-a -r- a Ne an. lee Iv, a
a a - a a - ao.- ac a n a a * ae~ IC.. ac.. aa a a a a a a a a a a a aI a I a 10 Ic a ca o a ole le to a
* a i a a a a a a a a a a a* I lena lace, cnn n.e act-c acne ace-anne to-c, v-ce ant-c aa a lt a attn let- ant- a ra at- a -anr- Inn ace me a
-- I en a -t- at a.: a t- tot- a scIoN ant- I en ann aCl art a - an. an a In I t- a, lv at a: a,c'an a... a -e ac ace a Vt a -e a t.v a..n adO act- en a
a Ct eat- at- acm I aon a r- 0.. len Ca-a on Ia a a I a I I I I a a a I
a It Ic IC ac I 10 I ole 10 0 ac a* I , I a a a a a I a a a aa I a a a a a I a a a a aa 0 . a I a a a a a t a I aa L.a a a a a a a a a a a a* I-* I a a I a a a a a a a~ 4. a a a a a a I a a a a a
a a a a a a a a a a aaz .1 a a .a a a ~- a ap a a ~- a a a 9 - ,t~ 411 I a a - a ~.a t a a a fla.-Va
a a a a a I a a a a a a a.1 a a I a a a a a a a a a aa a a a a a a a a a a a
a a a a a a a a a a a a a
46

a a ao a. a a .1~ ta a- a4 a 0 04 t
U~ a- ,t a 1. a o m 0o a-0. a. to an a, n an a a . a-
th0 a00 an a. 0 a-0 to a a an a a- an
a a a. an a 0 a a a a 1n a m 1a
a ao a a a a a aa a1 a;
o Zrp a a a m a a w I a a a a a e a C,a0 sa a a a a I to a a a a
a" - ak a1 - a a aa I I. 1t a a a a1
I
In a a - I an C_ an a to to a avaa an a- o. a-n ti-a. a..0 0 a
a a 1 m a a an at to a
cc. a,- a l - a * t a, n- .fl cc a a- a.. a n .- an a e-a e n 0,*~~ a 1. d a a1.. a . a e a a - , a n a t a . a i r
a to tow~ 0 a a.- a o O
a a a V a a a a a aa a o.. ~e one ~neacnetan. toe toO t."Oa t
- a a a nf an a - a a o- a eww a a aw
0 an a fat~ a oa-e a. p o
a~~m a aaP~ C a ae tme mce tne t-a t e. mo. 040 om ls
~~ 00 a awna a a V a n m a a e a - a a pa~ ~~ . 0t 1a .a 1- a - - a nt* nn a m., . m a *c a, a .. a m a a a a
- aa. Wt te - a a wa a -a a tna - a , a a n
a t a a -a * *- a a 4a7

I C. I. NM - n - in i - g
a0 I 0 i In Iw 1f IN 0 .a 1 I 0 1,
il'* ~ ~ W IN 1 11' .' 1 I I I - I
WO I INO I na I v 14 IC i i
I ~ ~~~~ 0I. I 0 1 0 I 1 I - . I I . I l
I I.. I - .1 I .1 IC I'. I - 11 1.
I~~~~1 II - 1 b I l 0 11. II-. I 101 I W . i I - lb . I 1
I I I I I I IN I I I
I~~~ 0.0 1 I0 0 b I W 0 1 w 1 v 1
* 0 1 0I 1 01 f 0 I 1 I 0 I N
* - II C I C - b I C I 4 I 0 P1 I 1 0 1 N
I ) I C C I 0 I N 0 1 0 . 1 "1 I C I C
I .I I I I 1 I I 1 I I
0 .I0 I0 1 n I I I I l
l,-.0i~ I0. 1O in1. i1. 140 .0 O I C 10 I0II~~~~ ~~~~~ 0~14 I 11 11 b I C * n
II~ ~~~~ 0 .I I I I
l i a - I I. Ia 0 10 I IC I I
I i I I I I I I I I
i on l m 1 CC i 1O 10 0 I~m c.. C b 001 lC~48011
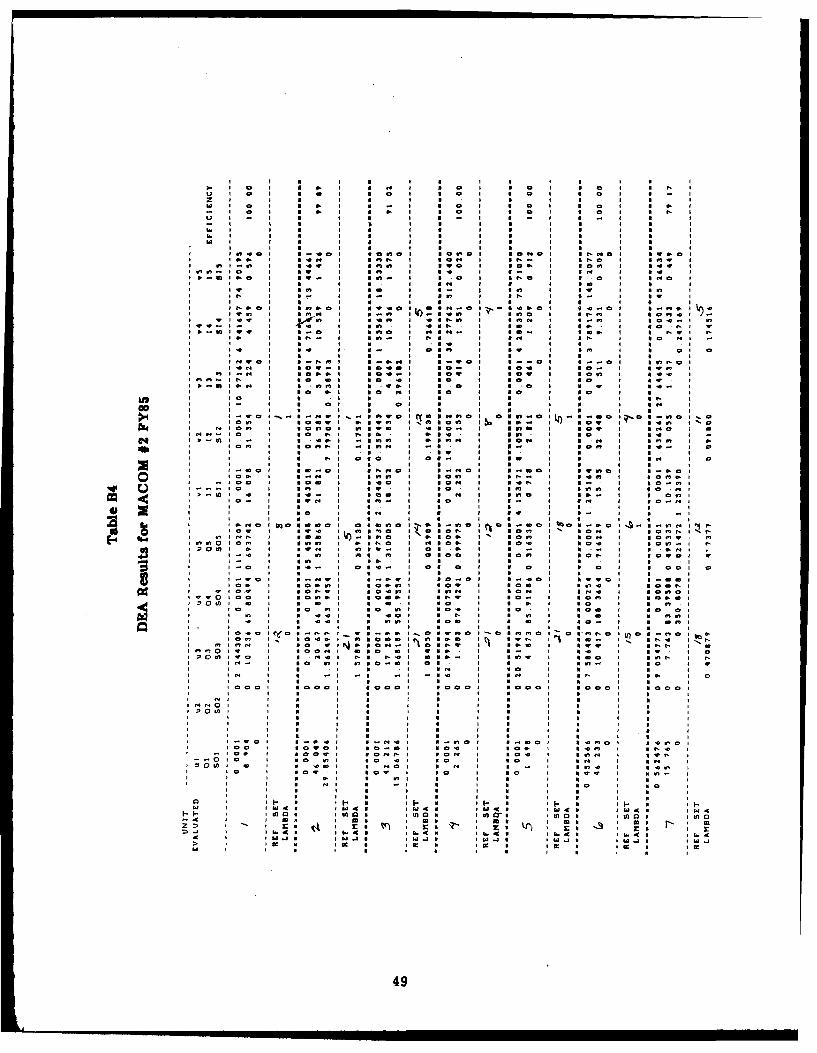
B0 0 . I I ( 0 B S 0 B S N B
30 Bo B I I
n B w
B 5 0 B 40 a 0 0O S B * l e B OC B S I B SW .0 B
B~~~ ~~~ 8 n. B0W' B 1 . B I 0 B I- 5 -o B 0 B0B 1 B v I a S B I B I
B~~~~. I Blow*B S B U BB ~ ~ ~ ~ ~ ~ ~ ~ C BN. 0.0B I 4..B U P40
B ~ ~ ~ - W WV:-.w B4 l. U I. g .s 4 .O tP
B V 4W B .0 B 0 1 B 4 N ' B 5 1 B S B U B 1
- WI o. . UN. - B U.. I I 14 B S C
54 Bw ow 1 8 BW 01 1 B S USU O
'0 on W B cB*cII S W .. O B S.' P N
B0. 00.1 .S 00 70 U0 B 0 B 0. B I
B~3 r B, Sm OrU 0 I B S B U
CO BB I I B U B B S B 49

z n 0 1. N. S . I N .
10 S - 0 10 0 0 0 N - I N 0
9.0 e a 0 0 a 0 0 tt 0
0.c 1T. 0 St4 1 105 1 15. 0 1 H 0 1 N 0
lVOw.N 1 0 -SW 0 W. I Il 0n I 5
5N 0 1 vI 0 I 51 51 N S N I S
I~: 0 . : . IO : 0 0 0:QI NW I 511 N 5 I a
do)N S N
WW a I to I NC A aN Nn a N) a
N~ ~ ~ ~~ I N N I NS.~~~~~~~ ~A A 5 N N C N. N N N
lo lz w w N SK A Sc cc N
I 5-WO 55001 5*W N 5 0 N 5 a~C I N Y

an a o 0 0 1. a 3 0 1 3 .. 00 I
I N ,
-~ ~~ ~ a f ,
3330 g0 W")lO lr*401 5 0 :1 *.,0 I 3 0 I W .
.0 00 .I a0o a30 1 0 3, 5 3 1 V, 1 3a0 1 *0 .
I -S nO I . 0 1 3 01 0 1 33, I 0 II ~ ~ ~ ~~ ~~ 3 10I 3 I 3o n W", I 30 I t o 0 53 1 5303
*~ ~ 30 0 3 3 3 3
-n,,0 w- . no3. , II 0
D 0 0n I 1 5. s iU 5 3
* * 33 0 330 1 03 I 61 .35. 5.
* 53, I 30 oP I 5 I Vl W I 3 , I 0 33 3 I w o I w o
I3, ,60 1 0 I. I 30 1 0" 30"01 . 0.31 g0oo.m .3, : : n3, ..3I . 2 .30 .34 0 w
50 I o0 o. 0 4 0 5l 3 I 33m I I w 3. I0 o I
3 0 3m 0"5 1 50 I 1 3 31 33 I 3 I U 0 0 1
33-0 1 30 *oo a,0 9 * 4 ,0 * 0 I
I 3 3 3 3, , 4 ,3 3 34 35 , , 3
34. IK 54- Ica 0~
51 5. 5~

U a S a 0 a a a a
Z a o a S 5 g C a S~ 0 a I S ei , . C
A 0 , a S C a 5 0 I S - I S a a fl a" a -- a a a a a S I S a 5 . wo I
00 I a g 5 a p 0 w 05 1, I-~~~~~ ~~~~~ I a S 5 l
I - a S I S a p - I S a g a -
a a a a S a I S a a Sha~ ~~~ 0 1 2 S U I O
a a IS a S I S aa onat-tO~~~~~~ 0 g0C a e0ap s n o a a n en
en~~ 00 us- a 0 n e . aVCII4 c v- I 1aa a0t na e- a
Inn-at~ ~ ~~~~~ a n0 n a S, a u, a a- a g
ol1I- a g no a u- e e-0 I I S a S a
IC "1 SN a SWO e c a
I0 we 1 g. - aa 5e a u S
ton Oof 00.e . . a n..Oa fln- 0 u -e a e s -
t- a a wg e a So-n r-0..g a trene
V a4 m n a * en a let- a e s es-. a p-Ca..- Ccn IX CCe X cc- e a Sa- I aai, a n
* r-n .." n. I - a Cu f a ee nr- N52

0 .0 1 so N1 .0 Wm I
U ) m0 1, 0 moo n I iu e I
* ~ ~ ~ ~ ~ ~ ~ 0 0 .a I * * I -m 0 I m a S0
mqfO mr-0 o mW~ 0 *t1 1 aer w .t
N a 0 1 - I S a N
in r Nt- I m- I H , e- I me N o
E- m- I e I.0N N m*~ 4 0
low 0rn t n re n O a ' I C m r ~ ic
V 0 -N . mm p- i -
I" 0 m o m a m II
0 inc .NOI inn eea S veI i-ca * -
*e0-e, :c o me.. me.0 a0 0 :00Iinu et e. :
to WI mO 0 Nn id- 0 m a m
N~~W ecN- m - -n I mn e em a m a m a N .
in-arN ~e mer , -n a Nece-ar i5n

Z n U - I ee 0 0 2 0
0 1 * a g 0 fi 0 a * a I a I
-~~~ u 0 a a- 0 CC C I * C I C C
0. U a I w 1 C I IN I I : 0 1
a I S I N 0 I 0
O ~ ~~~~~ I ~ M.m e I N I en I m
0n MC In eQ tn Q t tn 1 C 1 et n 0e %ItOm r Z rO ~ ~~~ Merl I r. ~ m . '~un - I e - n S~ C 0 g
w 4m-,mW I, C -. N e.
> w I* Ic me* ~ tC N C- H n oo . M b I ~ .. - * .0 I CC
mm- I m e t, men u n 0 ee C t n e544

94 1 0 6 1 6 a I 0
61 0 "1,V I e 1 . 0 I 6 0 I 6 0 I 6 .
-. 6 I I . I' a 0
U 0 I 6 - I 1 0 I 6 0 I . 0 6 0
- 6 0 I 6 01 .06 0 I I 6 1Ph0090. I Mae " 60 1 116 - 6 -I -
-. 6I . ! . .6 0 - I I 6:- . I 6 0
11 11 11 I M'. I 6 0 w I v o - I
0@..)W We e.. I 6 * I -0 I 6 0 1 6 0 0
6 I 6 I 6 I 61 0 6 0 01 I
6*~ ~~~~ 0 0WI 61 I 6 60 I 6 I 6
1 10 1.. -0 :: -V m- v 0 I 85 I
a0 .0 6 0 0 1 1 * I..1 a -0 1 160 0 0 I £-1
e*1 0' 66.1 I 1*1 I-0 -0 a11 00 60
6* 6 I * * 0 'M6 I 51 0
W a o I a I I a N o 6. I 6
v 1W I 6-O-C I*.I 61d .* 0 11O
0 0 0 0 a 0I e0 C 6 0 a* I 6 0 I a0 I IC 0 I
65- o 6 0o I 6n 01 U) tn 0 61 to
Inr..,0 I 60 I 0 *4 I ' O IK 6I I I O Ior
I@ 51 -I -06 I 16111 I .6.1 I 6 fl I 1 I 655

U - I -I m e . I
to to I v I m
£4.0 mtO I flt 4 l~l0, S~t- I mmc m.I
:I o :WoolII 0 I 5~l I S am
4 ~ ~ ~ d vc I4I y i m II
40 .1 m .1 m 0
ammo~~~~~~~~~1 1 wit- I -- ~~e~ n-4 Ef4 a oo
4~~ o-tl e o o I o 5%? a I e f 1~ 0 1mm w
mc' 10 Wc I me w.- e i m me., e* a 4 I 4 a , -m . m m *, *
mu 0 c 0 0 04 m "a a- I a 04 O i 4
m n a I to 13 N I to a a in0cn440 mrte 0.eI i-eI mn- i~ e oi m c
r ac- 4 me , m -. l~- , **m mI safe 4 *Cl mOO ma I mmm I me mm
rs~s,--O N mm I m I m c . -I ma -me*~~~ ~ w-me j Dnt .4 ma am ' e I m m I m a
* m me I 50 - I S~ I m I mu- m
as, , m - m Im S -5m

o~~ ~~~~ N
hi 5 1 0 91 r- ~ 0 a a
-~ ~~ ~ N I ~ r5 I 0 I S I f5 9o~ ~~~~ ~ ~~~~~~ 5 9 m a 5 r a C
- 5 C I 5 C I VS 9-. I r- 0 I 5 ' 5 S a ah~~~~ ~~~~~ a m a P5 5 a 0
1-:o o 5 "C 0 g a a-
hiSLea a O 5 a C
p 0 W
mar-el nneI arse sc-c I sti-ca s.-e a s--aC, I c a g P l s aS t
5550s *.s t f50 UPII I a a 904anr.-hN ~ ~ ~ ~ ".) N -. I S 5 0
r5.fl W I 5 t C
Il S 0 a tA w S a
I ~ ~ ~~ Sta c ~ -l n en s ~ si m . e ~> Ia al'-.r Ixnsc a
57-5. a 5

USA-CERL DISTRIBUTION
Chief of Engineers MDW, ATTN: DEH (3)ATTN: Tech MonitorATTN: CEIM-SL (2) MTMCATTN: CECC-P ATTN: MT-LOF 20315ATTN: CECW ATTN: Facilities Engineer (3)ATTN: CECW-OATTN: CECW-P TRADOCATTN: CEEC HQ, TRADOC, ATTN: ATEN-DEHATTN: CEEC-C ATTN: DEH (18)ATTN- CEEC-EATTN: CERD CECRL, ATTN: Library 03755ATTN: CERD-CATTN: CERD-M CEWES, ATTN: Library 39180ATTN: CERMATTN: DAEN-ZCI Defense Technical Info. Center 22314
ATTN: DDA (2)USAEHSC, ATTN: Library 22060
ATTN: DET III 79906 US Govt Print Office 22304ATTN: CEHSC-F 22060 Receiving Sect/Depository Copies (2)ATTN: CEHSC-TF 22060ATTN: CEHSC-E 22060 155
12/88US Army Europe
AEAEN-ODCS/Engr (2) 09403AEUES 09081V Corps
ATTN: DEH (12)VII Corps
ATTN: DEH (16)21st Support Command
ATTN: DEH (12)
AMC - Dir., Inst., & ServcATTN: DEH (23)
FORSCOMFORSCOM Engr, ATTN: Spt. Det.ATTN: DEH (28)
HSCFt. Sam Houston AMC 78234
ATTN: HSLO-FFitzsimons AMC 80045
ATTN: HSHG-DEHWalter Reed AMC 20307
ATTN: Facilities Engineer
INSCOM - Ch, Instl. Div
ATTN: Facilities Engineer (5)