s n a p s h o t - federal reserve bank of richmond · reports on the fifth district economy were...
TRANSCRIPT

November 2016
S N A P S H O TA MONTHLY UPDATE OF THE FIFTH DISTRICT ECONOMY
November 2016 FEDERAL RESERVE BANK OF RICHMOND
TABLE OF CONTENTS
Data updated as of November 2, 2016
TABLE OF CONTENTS
S N A P S H O T A MONTHLY UPDATE OF THE FIFTH DISTRICT ECONOMY
South Carolina 1South Carolina 2South Carolina 4South Carolina 5
Virginia 1Virginia 2Virginia 4Virginia 5
West Virginia 1West Virginia 2West Virginia 4West Virginia 5
Sources 1Sources 2
Fifth District SummaryLabor Conditions Business ConditionsHousehold ConditionsReal Estate Conditions
District of ColumbiaSummary Labor ConditionsHousehold Conditions Real Estate Conditions
Maryland Summary Labor ConditionsHousehold Conditions Real Estate Conditions
North CarolinaSummary Labor ConditionsHousehold Conditions Real Estate Conditions
District 1District 2 District 3 District 4 District 4
D.C. 1D.C. 2D.C. 4D.C. 5
Maryland 1Maryland 2Maryland 4Maryland 5
North Carolina 1North Carolina 2North Carolina 4North Carolina 5
South CarolinaSummary Labor ConditionsHousehold Conditions Real Estate Conditions
Virginia Summary Labor ConditionsHousehold Conditions Real Estate Conditions
West Virginia Summary Labor ConditionsHousehold Conditions Real Estate Conditions
Sources & NotesData SourcesNotes
Contact InformationMichael Stanley Joseph Mengedoth(804) 697-8437 (804) [email protected] [email protected]
November 2016 FEDERAL RESERVE BANK OF RICHMOND
FIFTH DISTRICTNovember Summary A Closer Look at… Household Income and Benefits
FIFTH DISTRICT 1
S N A P S H O T A MONTHLY UPDATE OF THE FIFTH DISTRICT ECONOMY
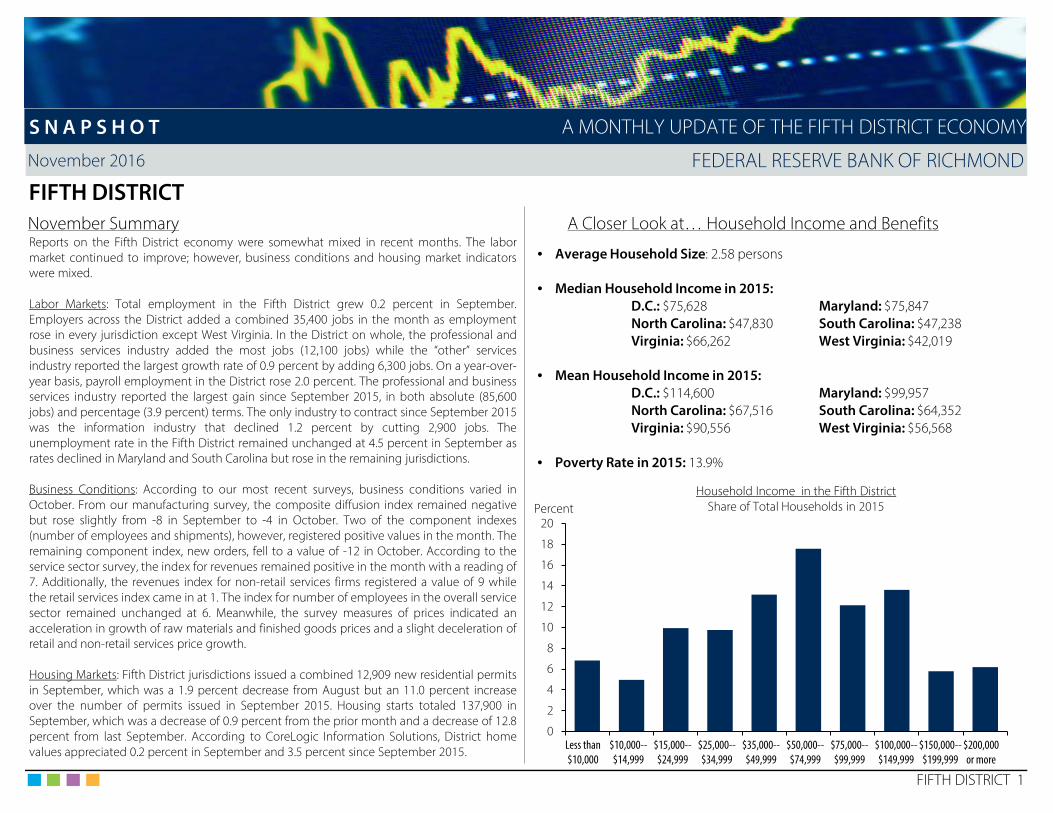
Reports on the Fifth District economy were somewhat mixed in recent months. The labormarket continued to improve; however, business conditions and housing market indicatorswere mixed.
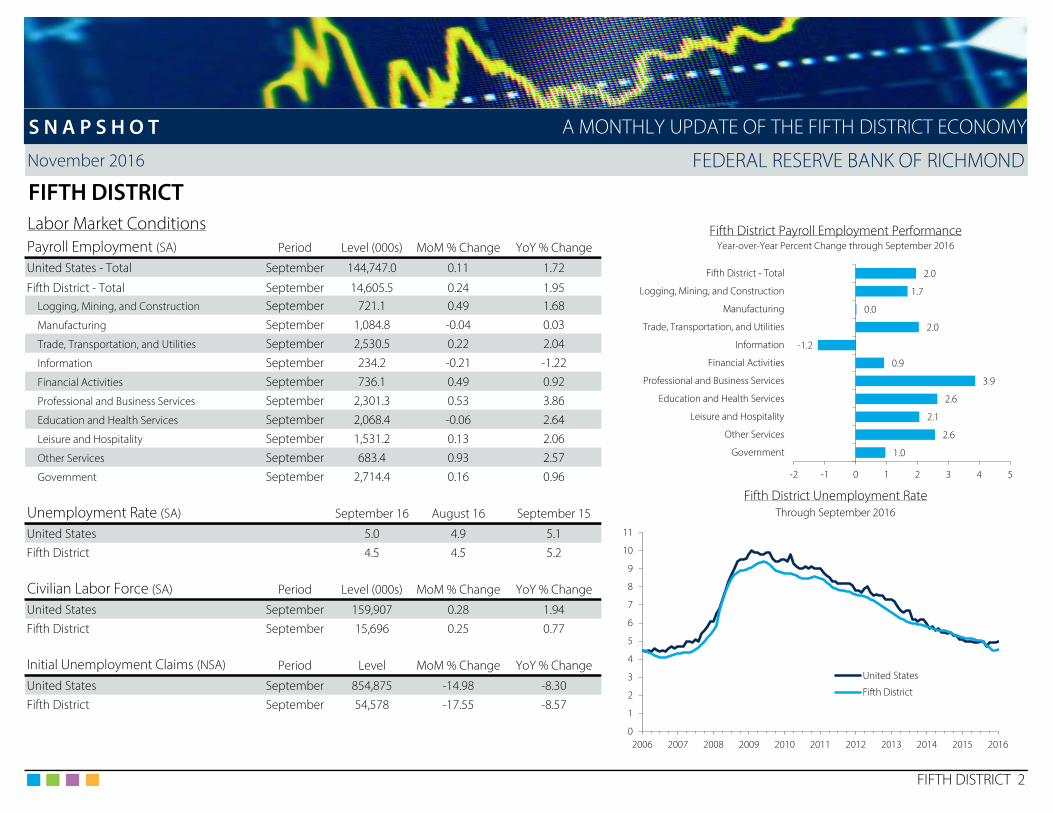
Labor Markets: Total employment in the Fifth District grew 0.2 percent in September.Employers across the District added a combined 35,400 jobs in the month as employmentrose in every jurisdiction except West Virginia. In the District on whole, the professional andbusiness services industry added the most jobs (12,100 jobs) while the “other” servicesindustry reported the largest growth rate of 0.9 percent by adding 6,300 jobs. On a year-over-year basis, payroll employment in the District rose 2.0 percent. The professional and businessservices industry reported the largest gain since September 2015, in both absolute (85,600jobs) and percentage (3.9 percent) terms. The only industry to contract since September 2015was the information industry that declined 1.2 percent by cutting 2,900 jobs. Theunemployment rate in the Fifth District remained unchanged at 4.5 percent in September asrates declined in Maryland and South Carolina but rose in the remaining jurisdictions.
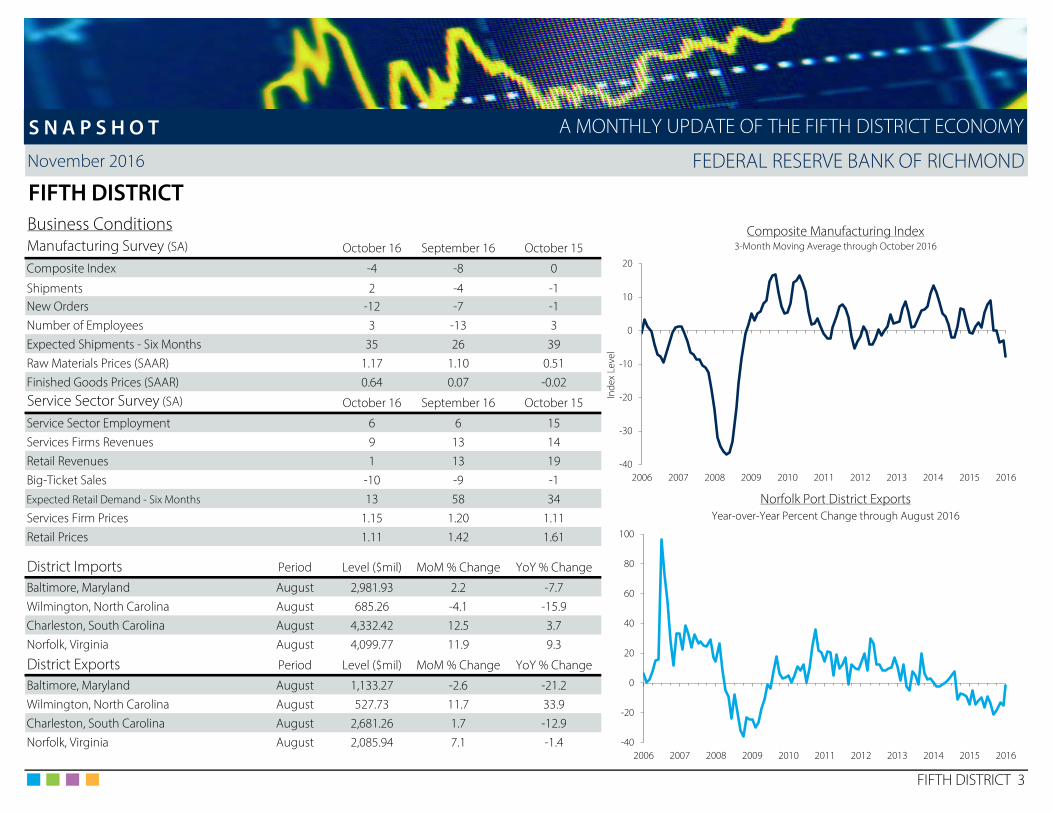
Business Conditions: According to our most recent surveys, business conditions varied inOctober. From our manufacturing survey, the composite diffusion index remained negativebut rose slightly from -8 in September to -4 in October. Two of the component indexes(number of employees and shipments), however, registered positive values in the month. Theremaining component index, new orders, fell to a value of -12 in October. According to theservice sector survey, the index for revenues remained positive in the month with a reading of7. Additionally, the revenues index for non-retail services firms registered a value of 9 whilethe retail services index came in at 1. The index for number of employees in the overall servicesector remained unchanged at 6. Meanwhile, the survey measures of prices indicated anacceleration in growth of raw materials and finished goods prices and a slight deceleration ofretail and non-retail services price growth.
Housing Markets: Fifth District jurisdictions issued a combined 12,909 new residential permitsin September, which was a 1.9 percent decrease from August but an 11.0 percent increaseover the number of permits issued in September 2015. Housing starts totaled 137,900 inSeptember, which was a decrease of 0.9 percent from the prior month and a decrease of 12.8percent from last September. According to CoreLogic Information Solutions, District homevalues appreciated 0.2 percent in September and 3.5 percent since September 2015.
• Average Household Size: 2.58 persons
• Median Household Income in 2015:D.C.: $75,628 Maryland: $75,847North Carolina: $47,830 South Carolina: $47,238Virginia: $66,262 West Virginia: $42,019
• Mean Household Income in 2015:D.C.: $114,600 Maryland: $99,957North Carolina: $67,516 South Carolina: $64,352Virginia: $90,556 West Virginia: $56,568
• Poverty Rate in 2015: 13.9%
0
2
4
6
8
10
12
14
16
18
20
Less than$10,000
$10,000--$14,999
$15,000--$24,999
$25,000--$34,999
$35,000--$49,999
$50,000--$74,999
$75,000--$99,999
$100,000--$149,999
$150,000--$199,999
$200,000or more
PercentHousehold Income in the Fifth District
Share of Total Households in 2015
November 2016 FEDERAL RESERVE BANK OF RICHMOND
FIFTH DISTRICTLabor Market Conditions Fifth District Payroll Employment Performance
Period Level (000s) MoM % Change YoY % Change Year-over-Year Percent Change through September 2016
United States - Total September 144,747.0 0.11 1.72
Fifth District - Total September 14,605.5 0.24 1.95Logging, Mining, and Construction September 721.1 0.49 1.68Manufacturing September 1,084.8 -0.04 0.03Trade, Transportation, and Utilities September 2,530.5 0.22 2.04Information September 234.2 -0.21 -1.22Financial Activities September 736.1 0.49 0.92Professional and Business Services September 2,301.3 0.53 3.86Education and Health Services September 2,068.4 -0.06 2.64Leisure and Hospitality September 1,531.2 0.13 2.06Other Services September 683.4 0.93 2.57Government September 2,714.4 0.16 0.96
Fifth District Unemployment RateSeptember 16 August 16 September 15 Through September 2016
United States 5.0 4.9 5.1Fifth District 4.5 4.5 5.2
Period Level (000s) MoM % Change YoY % Change
United States September 159,907 0.28 1.94Fifth District September 15,696 0.25 0.77
Period Level MoM % Change YoY % Change
United States September 854,875 -14.98 -8.30Fifth District September 54,578 -17.55 -8.57
FIFTH DISTRICT 2
Payroll Employment (SA)
Unemployment Rate (SA)
Civilian Labor Force (SA)
Initial Unemployment Claims (NSA)
S N A P S H O T
2.0
1.7
0.0
2.0
-1.2
0.9
3.9
2.6
2.1
2.6
1.0
-2 -1 0 1 2 3 4 5
Fifth District - Total
Logging, Mining, and Construction
Manufacturing
Trade, Transportation, and Utilities
Information
Financial Activities
Professional and Business Services
Education and Health Services
Leisure and Hospitality
Other Services
Government
0
1
2
3
4
5
6
7
8
9
10
11
2006 2007 2008 2009 2010 2011 2012 2013 2014 2015 2016
United States
Fifth District
A MONTHLY UPDATE OF THE FIFTH DISTRICT ECONOMY
November 2016 FEDERAL RESERVE BANK OF RICHMOND
FIFTH DISTRICTBusiness Conditions Composite Manufacturing IndexManufacturing Survey (SA) October 16 September 16 October 15 3-Month Moving Average through October 2016
Composite Index -4 -8 0
Shipments 2 -4 -1New Orders -12 -7 -1Number of Employees 3 -13 3Expected Shipments - Six Months 35 26 39Raw Materials Prices (SAAR) 1.17 1.10 0.51Finished Goods Prices (SAAR) 0.64 0.07 -0.02Service Sector Survey (SA) October 16 September 16 October 15
Service Sector Employment 6 6 15Services Firms Revenues 9 13 14Retail Revenues 1 13 19Big-Ticket Sales -10 -9 -1Expected Retail Demand - Six Months 13 58 34 Norfolk Port District ExportsServices Firm Prices 1.15 1.20 1.11 Year-over-Year Percent Change through August 2016
Retail Prices 1.11 1.42 1.61
District Imports Period Level ($mil) MoM % Change YoY % Change
Baltimore, Maryland August 2,981.93 2.2 -7.7Wilmington, North Carolina August 685.26 -4.1 -15.9Charleston, South Carolina August 4,332.42 12.5 3.7Norfolk, Virginia August 4,099.77 11.9 9.3
District Exports Period Level ($mil) MoM % Change YoY % Change
Baltimore, Maryland August 1,133.27 -2.6 -21.2Wilmington, North Carolina August 527.73 11.7 33.9Charleston, South Carolina August 2,681.26 1.7 -12.9Norfolk, Virginia August 2,085.94 7.1 -1.4
FIFTH DISTRICT 3
S N A P S H O T
-40
-20
0
20
40
60
80
100
2006 2007 2008 2009 2010 2011 2012 2013 2014 2015 2016
-40
-30
-20
-10
0
10
20
2006 2007 2008 2009 2010 2011 2012 2013 2014 2015 2016
Inde
x Le
vel
A MONTHLY UPDATE OF THE FIFTH DISTRICT ECONOMY

November 2016 FEDERAL RESERVE BANK OF RICHMOND
FIFTH DISTRICTHousehold Conditions Fifth District Real Personal IncomeReal Personal Income (SA) Period Level ($mil) QoQ % Change YoY % Change Year-over-Year Percent Change through Q2:16
United States Q2:16 14,387,983 0.52 2.23
Fifth District Q2:16 1,386,886 0.54 2.56
Non-Business Bankruptcies Period Level QoQ % Change YoY % Change
United States Q3:16 193,820 -4.21 -6.17Fifth District Q3:16 15,702 -6.57 -4.91
Real Estate Conditions
Total Private Building Permits (NSA) Period Level MoM % Change YoY % Change
United States September 107,723 -0.64 10.81 Fifth District Building PermitsFifth District September 12,909 -1.94 11.04 Year-over-Year Percent Change through September 2016
Total Private Housing Starts (SAAR) Period Level (000s) MoM % Change YoY % Change
United States September 1,047 -8.96 -11.94Fifth District September 138 -0.93 -12.83
House Price Index (2000=100) Period Level MoM % Change YoY % Change
United States September 184 1.08 6.34Fifth District September 187 0.24 3.50
FIFTH DISTRICT 4
S N A P S H O T A MONTHLY UPDATE OF THE FIFTH DISTRICT ECONOMY
-6
-4
-2
0
2
4
6
2006 2007 2008 2009 2010 2011 2012 2013 2014 2015 2016
United StatesFifth District
-60
-40
-20
0
20
40
60
80
2006 2007 2008 2009 2010 2011 2012 2013 2014 2015 2016
November 2016 FEDERAL RESERVE BANK OF RICHMOND
DISTRICT OF COLUMBIANovember Summary A Closer Look at… Household Income and Benefits
DISTRICT OF COLUMBIA 1
S N A P S H O T A MONTHLY UPDATE OF THE FIFTH DISTRICT ECONOMY
Recent economic reports on the District of Columbia were mostly positive. Payrollemployment rose and housing market activity picked up while household conditions weremostly positive, despite a slight increase in the unemployment rate.
Labor Markets: Employers in D.C. added 2,500 jobs (0.3 percent) to the economy inSeptember. The most jobs were added in the month by the professional and businessservices industry (1,400 jobs) followed by the leisure and hospitality industry that added 900jobs. Additionally, jobs were added to government, “other” services, and mining, logging, andconstruction payrolls. On the downside, the education and health services industry cut 900jobs (0.7 percent) in September; smaller losses were reported by the financial services andtrade, transportation, and utilities industries. Since September 2015, total employment in D.C.rose 1.9 percent as firms added 14,600 jobs to the economy. The largest employer in D.C.,government, added the most jobs over the last twelve months (4,400 jobs) while the largestgrowth rate was reported by the trade, transportation, and utilities industry that grew 4.0percent. The only two industries to cut jobs on a year-over-year basis were information andlogging, mining, and construction. In the Washington, D.C. MSA, total employment expanded0.4 percent in September and increased 2.4 percent since September 2015.
Household Conditions: The unemployment rate in D.C. rose 0.1 percentage point to 6.1percent in September. In the greater Washington, D.C. metro area, the unemployment ratewas unchanged at 3.9 percent in the month. In the second quarter of 2016, real personalincome in D.C. rose 1.0 percent and increased 3.0 percent since the second quarter of 2015.Also in the second quarter, the share of mortgages with payments 90 or more days past duewas virtually unchanged at 1.2 percent. The prime delinquency rate was also unchanged at0.8 percent while the subprime delinquency rate rose slightly to 5.5 percent in the quarter.
Housing Markets: D.C. issued 1,098 new residential permits in September, up from 444permits in August and 403 permits in September 2015. In the greater Washington, D.C. MSA,2,437 permits were issued in the month, an increase of 4.6 percent from August and 18.4percent since last September. Meanwhile, housing starts in D.C. totaled 11,700 in September,up from 4,700 starts in August and up from the 5,500 starts in September 2015. According toCoreLogic Information Solutions, home values in D.C. appreciated 0.5 percent in Septemberand 3.1 percent on a year-over-year basis. In the Washington, D.C. metro area, house pricesrose 0.5 percent in September and 2.5 percent on a year-over-year basis.
0
2
4
6
8
10
12
14
16
18
20
Less than$10,000
$10,000--$14,999
$15,000--$24,999
$25,000--$34,999
$35,000--$49,999
$50,000--$74,999
$75,000--$99,999
$100,000--$149,999
$150,000--$199,999
$200,000 ormore
PercentHousehold Income in the District of Columbia
Share of Total Households in 2015
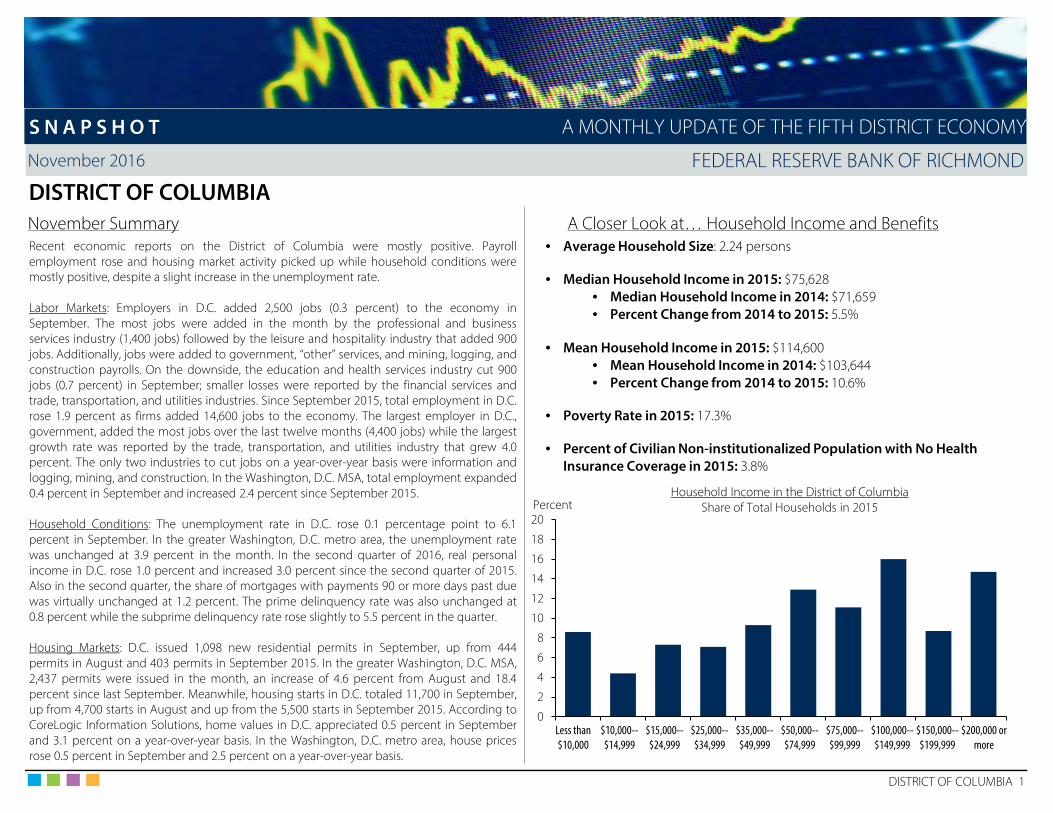
• Average Household Size: 2.24 persons
• Median Household Income in 2015: $75,628• Median Household Income in 2014: $71,659• Percent Change from 2014 to 2015: 5.5%
• Mean Household Income in 2015: $114,600• Mean Household Income in 2014: $103,644• Percent Change from 2014 to 2015: 10.6%
• Poverty Rate in 2015: 17.3%
• Percent of Civilian Non-institutionalized Population with No Health Insurance Coverage in 2015: 3.8%

November 2016 FEDERAL RESERVE BANK OF RICHMOND
DISTRICT OF COLUMBIALabor Market Conditions District of Columbia Payroll Employment PerformancePayroll Employment (SA) Period Level (000s) MoM % Change YoY % Change Year-over-Year Percent Change through September 2016
United States - Total September 144,747.0 0.11 1.72
Fifth District - Total September 14,605.5 0.24 1.95District of Columbia - Total September 781.7 0.32 1.90
Logging, Mining, and Construction September 14.2 0.71 -1.39Manufacturing (NSA) September 1.2 0.00 0.00Trade, Transportation, and Utilities September 34.0 -0.29 3.98Information September 16.8 0.00 -1.75Financial Activities September 30.8 -0.32 1.99Professional and Business Services September 165.7 0.85 2.28Education and Health Services September 128.3 -0.70 1.18Leisure and Hospitality September 75.5 1.21 3.71Other Services September 71.9 0.70 1.27Government September 243.3 0.29 1.84 District of Columbia Total Employment Performance
Washington, D.C. MSA September 3,257.0 0.43 2.39 Year-over-Year Percent Change through September 2016
DISTRICT OF COLUMBIA 2
S N A P S H O T
1.9
-1.4
0.0
4.0
-1.8
2.0
2.3
1.2
3.7
1.3
1.8
-4 -2 0 2 4 6
District of Columbia - Total
Logging, Mining, and Construction
Manufacturing (NSA)
Trade, Transportation, and Utilities
Information
Financial Activities
Professional and Business Services
Education and Health Services
Leisure and Hospitality
Other Services
Government
A MONTHLY UPDATE OF THE FIFTH DISTRICT ECONOMY
2.4
1.9
2.0
1.7
0.0 0.5 1.0 1.5 2.0 2.5 3.0
Washington, D.C. MSA
District of Columbia
Fifth District
United States
November 2016 FEDERAL RESERVE BANK OF RICHMOND
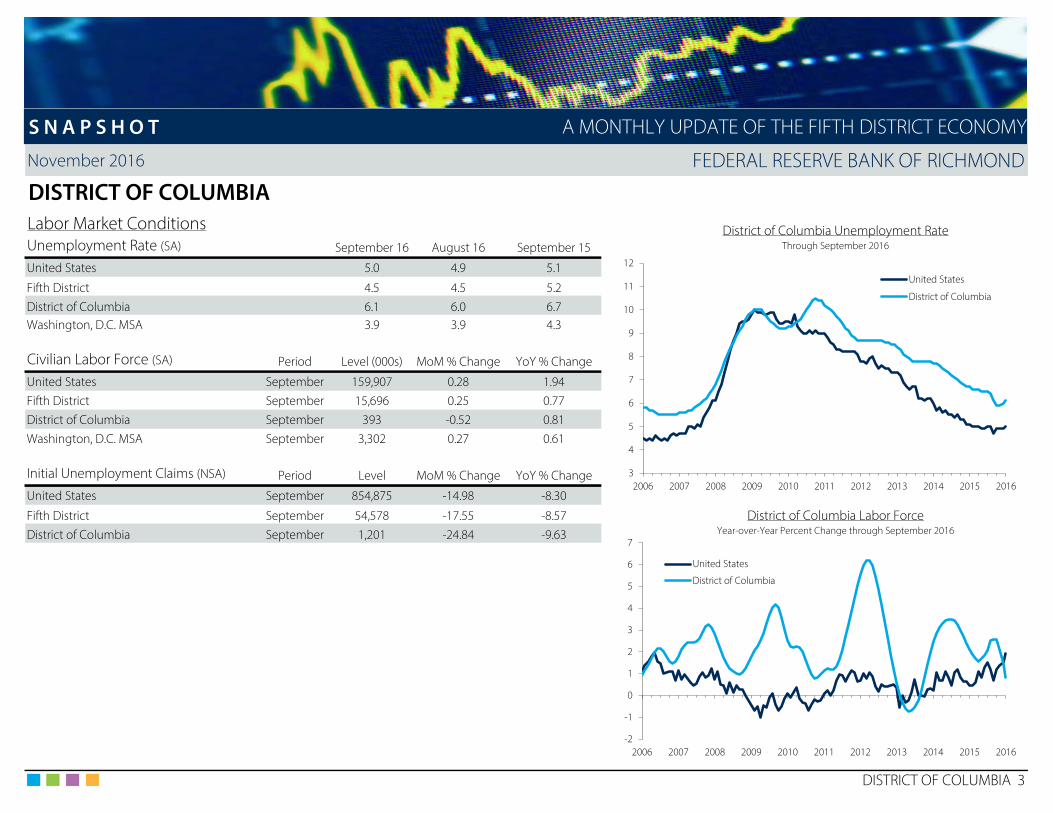
DISTRICT OF COLUMBIALabor Market Conditions District of Columbia Unemployment RateUnemployment Rate (SA) September 16 August 16 September 15 Through September 2016
United States 5.0 4.9 5.1
Fifth District 4.5 4.5 5.2District of Columbia 6.1 6.0 6.7Washington, D.C. MSA 3.9 3.9 4.3
Civilian Labor Force (SA) Period Level (000s) MoM % Change YoY % Change
United States September 159,907 0.28 1.94Fifth District September 15,696 0.25 0.77District of Columbia September 393 -0.52 0.81Washington, D.C. MSA September 3,302 0.27 0.61
Initial Unemployment Claims (NSA) Period Level MoM % Change YoY % Change
United States September 854,875 -14.98 -8.30
Fifth District September 54,578 -17.55 -8.57 District of Columbia Labor ForceDistrict of Columbia September 1,201 -24.84 -9.63 Year-over-Year Percent Change through September 2016
DISTRICT OF COLUMBIA 3
S N A P S H O T A MONTHLY UPDATE OF THE FIFTH DISTRICT ECONOMY
3
4
5
6
7
8
9
10
11
12
2006 2007 2008 2009 2010 2011 2012 2013 2014 2015 2016
United States
District of Columbia
-2
-1
0
1
2
3
4
5
6
7
2006 2007 2008 2009 2010 2011 2012 2013 2014 2015 2016
United States
District of Columbia
November 2016 FEDERAL RESERVE BANK OF RICHMOND
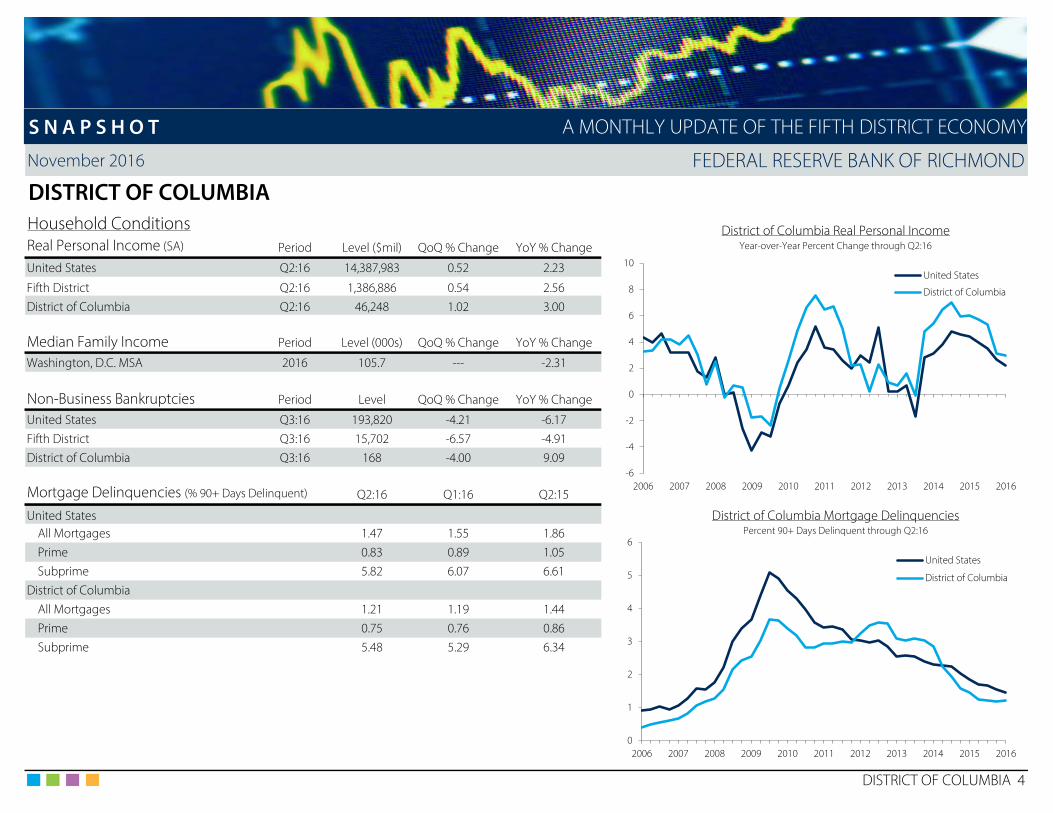
DISTRICT OF COLUMBIAHousehold Conditions District of Columbia Real Personal IncomeReal Personal Income (SA) Period Level ($mil) QoQ % Change YoY % Change Year-over-Year Percent Change through Q2:16
United States Q2:16 14,387,983 0.52 2.23
Fifth District Q2:16 1,386,886 0.54 2.56District of Columbia Q2:16 46,248 1.02 3.00
Median Family Income Period Level (000s) QoQ % Change YoY % Change
Washington, D.C. MSA 2016 105.7 --- -2.31
Non-Business Bankruptcies Period Level QoQ % Change YoY % Change
United States Q3:16 193,820 -4.21 -6.17Fifth District Q3:16 15,702 -6.57 -4.91District of Columbia Q3:16 168 -4.00 9.09
Mortgage Delinquencies (% 90+ Days Delinquent) Q2:16 Q1:16 Q2:15
United States District of Columbia Mortgage DelinquenciesAll Mortgages 1.47 1.55 1.86 Percent 90+ Days Delinquent through Q2:16
Prime 0.83 0.89 1.05Subprime 5.82 6.07 6.61
District of ColumbiaAll Mortgages 1.21 1.19 1.44Prime 0.75 0.76 0.86Subprime 5.48 5.29 6.34
DISTRICT OF COLUMBIA 4
S N A P S H O T A MONTHLY UPDATE OF THE FIFTH DISTRICT ECONOMY
-6
-4
-2
0
2
4
6
8
10
2006 2007 2008 2009 2010 2011 2012 2013 2014 2015 2016
United States
District of Columbia
0
1
2
3
4
5
6
2006 2007 2008 2009 2010 2011 2012 2013 2014 2015 2016
United States
District of Columbia

November 2016 FEDERAL RESERVE BANK OF RICHMOND
DISTRICT OF COLUMBIAReal Estate Conditions Washington, D.C. MSA Building PermitsTotal Private Building Permits (NSA) Period Level MoM % Change YoY % Change Year-over-Year Percent Change through September 2016
United States September 107,723 -0.64 10.81
Fifth District September 12,909 -1.94 11.04District of Columbia September 1,098 147.30 172.46Washington, D.C. MSA September 2,437 4.64 18.36
Total Private Housing Starts (SAAR) Period Level (000s) MoM % Change YoY % Change
United States September 1,047 -8.96 -11.94Fifth District September 138 -0.93 -12.83District of Columbia September 11.7 150.11 114.05
District of Columbia Housing StartsThousands of Units (SAAR) September 2016
DISTRICT OF COLUMBIA 5
S N A P S H O T A MONTHLY UPDATE OF THE FIFTH DISTRICT ECONOMY
-100
-50
0
50
100
150
200
250
2006 2007 2008 2009 2010 2011 2012 2013 2014 2015 2016
0
2
4
6
8
10
12
14
2006 2007 2008 2009 2010 2011 2012 2013 2014 2015 2016
November 2016 FEDERAL RESERVE BANK OF RICHMOND
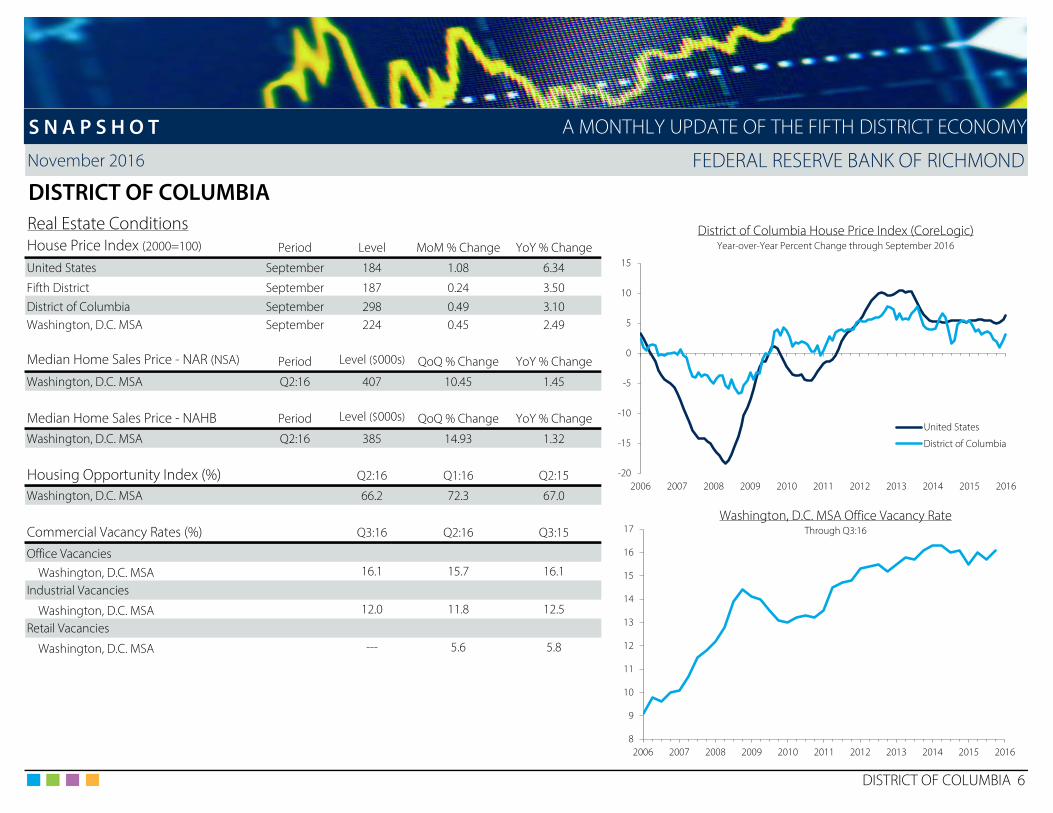
DISTRICT OF COLUMBIAReal Estate Conditions District of Columbia House Price Index (CoreLogic)House Price Index (2000=100) Period Level MoM % Change YoY % Change Year-over-Year Percent Change through September 2016
United States September 184 1.08 6.34
Fifth District September 187 0.24 3.50District of Columbia September 298 0.49 3.10Washington, D.C. MSA September 224 0.45 2.49
Median Home Sales Price - NAR (NSA) Period Level ($000s) QoQ % Change YoY % Change
Washington, D.C. MSA Q2:16 407 10.45 1.45
Median Home Sales Price - NAHB Period Level ($000s) QoQ % Change YoY % Change
Washington, D.C. MSA Q2:16 385 14.93 1.32
Housing Opportunity Index (%) Q2:16 Q1:16 Q2:15
Washington, D.C. MSA 66.2 72.3 67.0
Washington, D.C. MSA Office Vacancy RateCommercial Vacancy Rates (%) Q3:16 Q2:16 Q3:15 Through Q3:16
Office Vacancies Washington, D.C. MSA 16.1 15.7 16.1Industrial Vacancies
Washington, D.C. MSA 12.0 11.8 12.5Retail Vacancies
Washington, D.C. MSA --- 5.6 5.8
DISTRICT OF COLUMBIA 6
S N A P S H O T A MONTHLY UPDATE OF THE FIFTH DISTRICT ECONOMY
8
9
10
11
12
13
14
15
16
17
2006 2007 2008 2009 2010 2011 2012 2013 2014 2015 2016
-20
-15
-10
-5
0
5
10
15
2006 2007 2008 2009 2010 2011 2012 2013 2014 2015 2016
United States
District of Columbia

November 2016 FEDERAL RESERVE BANK OF RICHMOND
MARYLANDNovember Summary A Closer Look at… Household Income and Benefits
MARYLAND 1
S N A P S H O T A MONTHLY UPDATE OF THE FIFTH DISTRICT ECONOMY
Reports on Maryland’s economy were somewhat positive in recent months as labor marketsstrengthened and household conditions improved; however, housing market indicatorswere mostly downbeat.
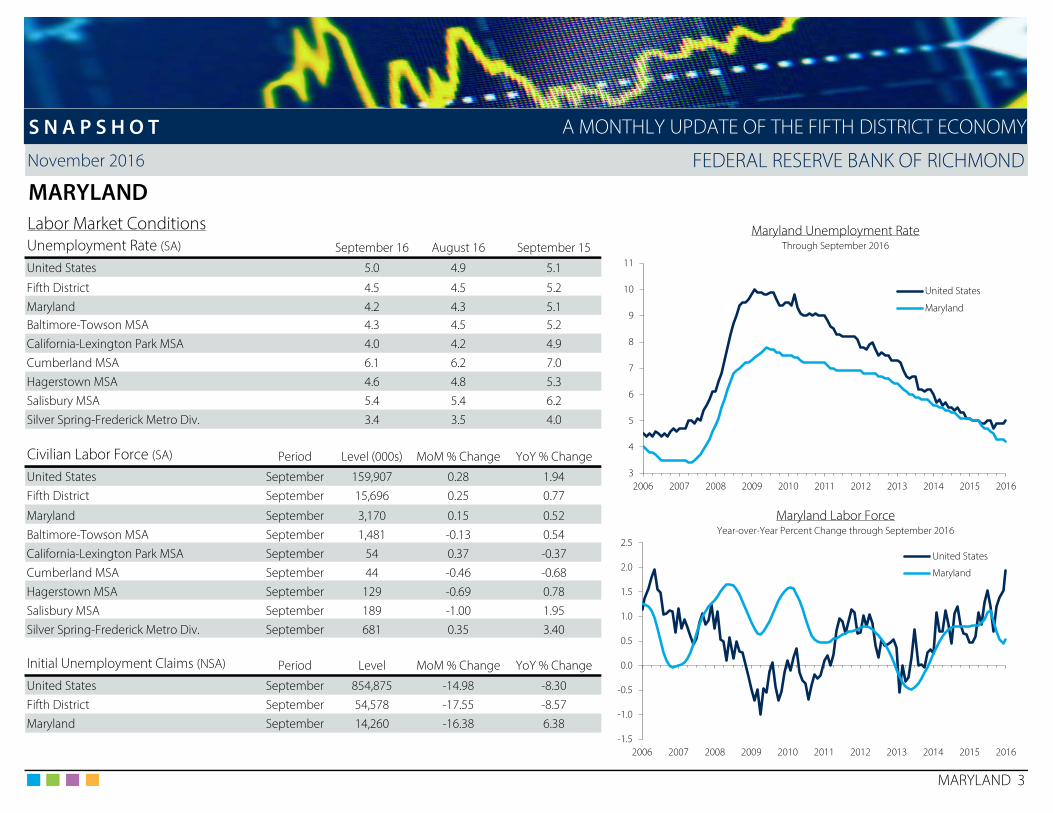
Labor Markets: Payroll employment in Maryland rose 0.1 percent in September as employersadded 3,400 jobs in the month. The government sector accounted for the majority of the netjob gain by adding 4,900 jobs in September. Within the private sector, on the other hand,jobs were cut from a majority of industries with the only job growth in the month comingfrom the financial services, professional services, and “other” services industries. The largestjob losses came from the education and health services (1,800 jobs), leisure and hospitality(1,600 jobs), and trade, transportation, and utilities (1,300 jobs) industries. On a year-over-yearbasis, total employment in Maryland grew 1.7 percent as every industry in the stateexpanded. The leisure and hospitality industry, which increased 4.2 percent by adding 11,100jobs, reported the largest growth in percentage and absolute terms. The professional andbusiness services industry also contributed notably to the year-over-year employment gainby adding 9,800 jobs.
Household Conditions: The unemployment rate in Maryland edged 0.1 percentage pointlower to 4.2 percent in September. At the metro level, jobless rates declined slightly in everyMSA except Salisbury, where the rate was unchanged at 5.4 percent. In the second quarter of2016, real personal income rose 0.6 percent and increased 2.2 percent since the secondquarter of 2015. Also in the second quarter, the share of mortgages with payments 90 ormore days overdue in Maryland declined 0.2 percentage point to 1.9 percent. The primedelinquency rate edged down to 1.0 percent in the quarter while the subprime rate declined0.4 percentage point to 7.6 percent.
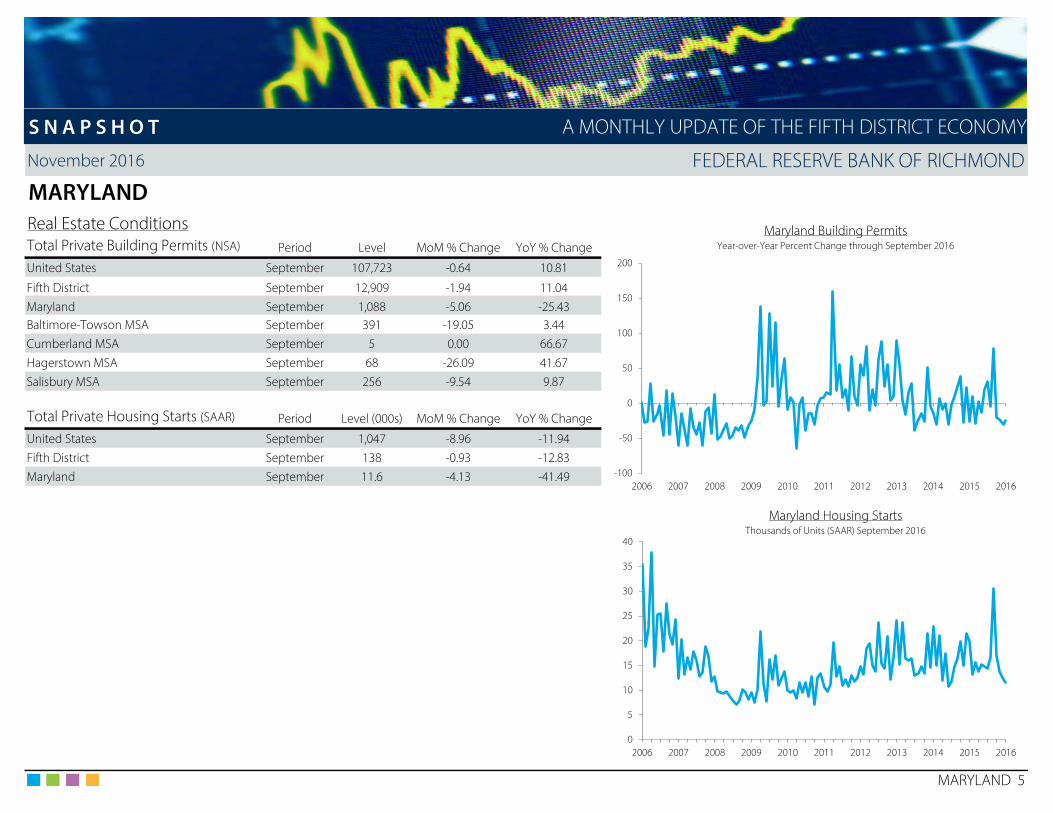
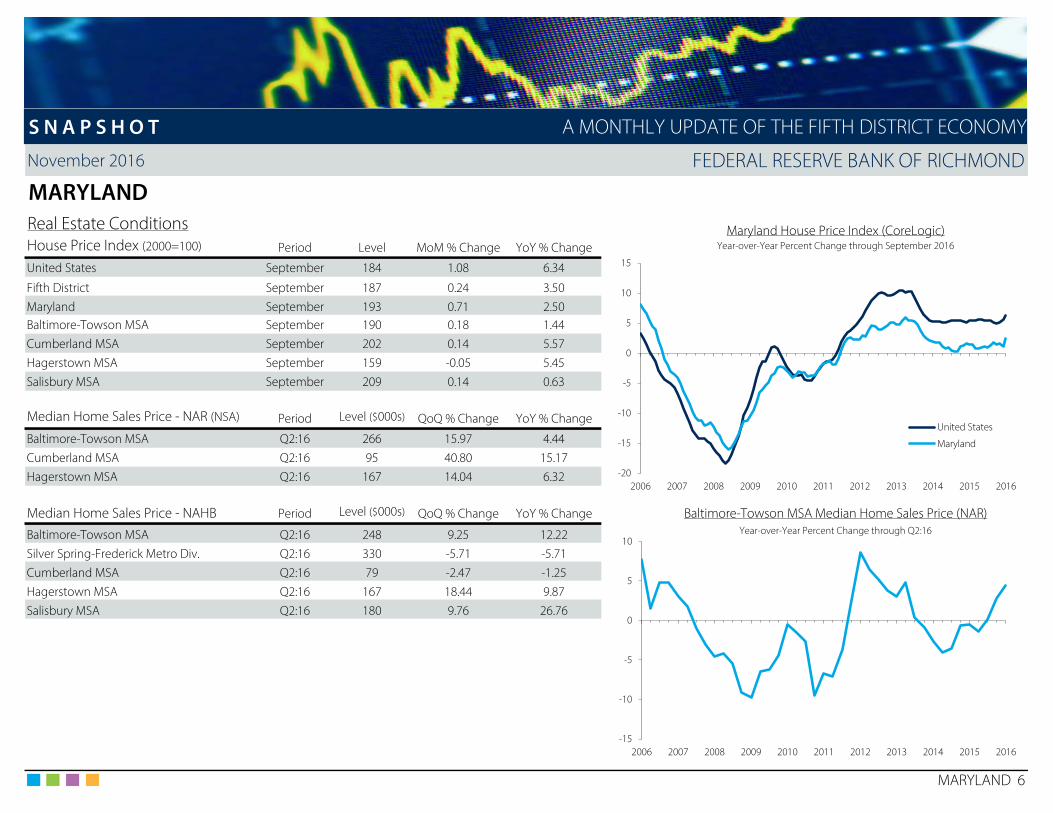
Housing Markets: Maryland issued 1,088 new residential permits in September, a 5.1 percentdecrease from the prior month and a 25.4 percent decrease from September 2015. At themetro level, the Baltimore MSA issued the most permits in the month (391 permits), whichwas a 19.1 percent decline in the month but a 3.4 percent year-over-year increase. Housingstarts in Maryland totaled 11,600 in September, down 4.1 percent in the month and 41.5percent from the prior year. According to CoreLogic Information Solutions, home values inMaryland appreciated 0.7 percent in September and 2.5 percent over the last twelve months.In the state’s metro areas, home prices rose in every MSA in the month except Hagerstownand increased in every metro area on a year-over-year basis.
0
2
4
6
8
10
12
14
16
18
20
Less than$10,000
$10,000--$14,999
$15,000--$24,999
$25,000--$34,999
$35,000--$49,999
$50,000--$74,999
$75,000--$99,999
$100,000--$149,999
$150,000--$199,999
$200,000or more
PercentHousehold Income in Maryland
Share of Total Households in 2015
• Average Household Size: 2.69 persons
• Median Household Income in 2015: $75,847• Median Household Income in 2014: $74,047• Percent Change from 2014 to 2015: 2.4%
• Mean Household Income in 2015: $99,957• Mean Household Income in 2014: $97,128• Percent Change from 2014 to 2015: 2.9%
• Poverty Rate in 2015: 9.7%
• Percent of Civilian Non-institutionalized Population with No Health Insurance Coverage in 2015: 6.6%

November 2016 FEDERAL RESERVE BANK OF RICHMOND
MARYLANDLabor Market Conditions Maryland Payroll Employment PerformancePayroll Employment (SA) Period Level (000s) MoM % Change YoY % Change Year-over-Year Percent Change through September 2016
United States - Total September 144,747.0 0.11 1.72
Fifth District - Total September 14,605.5 0.24 1.95Maryland - Total September 2,710.6 0.13 1.73
Logging, Mining, and Construction September 158.8 0.00 1.21Manufacturing September 105.8 -0.09 1.83Trade, Transportation, and Utilities September 469.9 -0.28 0.79Information September 38.8 -0.26 2.65Financial Activities September 148.7 1.02 1.71Professional and Business Services September 439.7 0.16 2.28Education and Health Services September 442.9 -0.40 1.23Leisure and Hospitality September 278.4 -0.57 4.15Other Services September 117.7 1.03 2.17Government September 509.9 0.97 1.27 Maryland Total Employment Performance
Year-over-Year Percent Change through September 2016
Metro Payroll Employment (NSA) Period Level (000s) YoY % Change
Baltimore-Towson MSA - Total September 1,399.8 2.13California-Lexington Park MSA - Total September 44.9 0.90Cumberland MSA - Total September 39.0 0.00Hagerstown MSA - Total September 105.7 0.57Salisbury MSA - Total September 165.3 3.44Silver Spring-Frederick Metro Div. - Total September 596.1 1.50
MARYLAND 2
S N A P S H O T
1.7
1.2
1.8
0.8
2.6
1.7
2.3
1.2
4.2
2.2
1.3
0 1 2 3 4 5
Maryland - Total
Logging, Mining, and Construction
Manufacturing
Trade, Transportation, and Utilities
Information
Financial Activities
Professional and Business Services
Education and Health Services
Leisure and Hospitality
Other Services
Government
A MONTHLY UPDATE OF THE FIFTH DISTRICT ECONOMY
1.5
3.4
0.6
0.0
0.9
2.1
1.7
2.0
1.7
0 1 2 3 4
Silver Spring-Frederick Metro Div.
Salisbury MSA
Hagerstown MSA
Cumberland MSA
California-Lexington Park MSA
Baltimore-Towson MSA
Maryland (SA)
Fifth District (SA)
United States (SA)
November 2016 FEDERAL RESERVE BANK OF RICHMOND
MARYLANDLabor Market Conditions Maryland Unemployment RateUnemployment Rate (SA) September 16 August 16 September 15 Through September 2016
United States 5.0 4.9 5.1
Fifth District 4.5 4.5 5.2Maryland 4.2 4.3 5.1Baltimore-Towson MSA 4.3 4.5 5.2California-Lexington Park MSA 4.0 4.2 4.9Cumberland MSA 6.1 6.2 7.0Hagerstown MSA 4.6 4.8 5.3Salisbury MSA 5.4 5.4 6.2Silver Spring-Frederick Metro Div. 3.4 3.5 4.0
Civilian Labor Force (SA) Period Level (000s) MoM % Change YoY % Change
United States September 159,907 0.28 1.94Fifth District September 15,696 0.25 0.77
Maryland September 3,170 0.15 0.52 Maryland Labor ForceBaltimore-Towson MSA September 1,481 -0.13 0.54 Year-over-Year Percent Change through September 2016
California-Lexington Park MSA September 54 0.37 -0.37Cumberland MSA September 44 -0.46 -0.68Hagerstown MSA September 129 -0.69 0.78Salisbury MSA September 189 -1.00 1.95Silver Spring-Frederick Metro Div. September 681 0.35 3.40
Initial Unemployment Claims (NSA) Period Level MoM % Change YoY % Change
United States September 854,875 -14.98 -8.30Fifth District September 54,578 -17.55 -8.57Maryland September 14,260 -16.38 6.38
MARYLAND 3
S N A P S H O T A MONTHLY UPDATE OF THE FIFTH DISTRICT ECONOMY
3
4
5
6
7
8
9
10
11
2006 2007 2008 2009 2010 2011 2012 2013 2014 2015 2016
United States
Maryland
-1.5
-1.0
-0.5
0.0
0.5
1.0
1.5
2.0
2.5
2006 2007 2008 2009 2010 2011 2012 2013 2014 2015 2016
United States
Maryland

November 2016 FEDERAL RESERVE BANK OF RICHMOND
MARYLANDHousehold Conditions Maryland Real Personal IncomeReal Personal Income (SA) Period Level ($mil) QoQ % Change YoY % Change Year-over-Year Percent Change through Q2:16
United States Q2:16 14,387,983 0.52 2.23
Fifth District Q2:16 1,386,886 0.54 2.56Maryland Q2:16 312,552 0.60 2.17
Median Family Income Period Level (000s) QoQ % Change YoY % Change
Baltimore-Towson MSA 2016 86.7 --- -3.24Silver Spring-Frederick Metro Div. 2016 113.0 --- -1.40Cumberland MSA 2016 55.1 --- 6.78Hagerstown MSA 2016 69.9 --- 7.04Salisbury MSA 2016 62.0 --- 2.14
Non-Business Bankruptcies Period Level QoQ % Change YoY % Change
United States Q3:16 193,820 -4.21 -6.17
Fifth District Q3:16 15,702 -6.57 -4.91 Maryland Mortgage DelinquenciesMaryland Q3:16 3,693 -18.73 -15.59 Percent 90+ Days Delinquent through Q2:16
Mortgage Delinquencies (% 90+ Days Delinquent) Q2:16 Q1:16 Q2:15
United States All Mortgages 1.47 1.55 1.86Prime 0.83 0.89 1.05Subprime 5.82 6.07 6.61
MarylandAll Mortgages 1.91 2.07 2.40Prime 1.01 1.13 1.41Subprime 7.62 7.96 7.27
MARYLAND 4
S N A P S H O T A MONTHLY UPDATE OF THE FIFTH DISTRICT ECONOMY
-6
-4
-2
0
2
4
6
2006 2007 2008 2009 2010 2011 2012 2013 2014 2015 2016
United States
Maryland
0
1
2
3
4
5
6
2006 2007 2008 2009 2010 2011 2012 2013 2014 2015 2016
United States
Maryland
November 2016 FEDERAL RESERVE BANK OF RICHMOND
MARYLANDReal Estate Conditions Maryland Building PermitsTotal Private Building Permits (NSA) Period Level MoM % Change YoY % Change Year-over-Year Percent Change through September 2016
United States September 107,723 -0.64 10.81
Fifth District September 12,909 -1.94 11.04Maryland September 1,088 -5.06 -25.43Baltimore-Towson MSA September 391 -19.05 3.44Cumberland MSA September 5 0.00 66.67Hagerstown MSA September 68 -26.09 41.67Salisbury MSA September 256 -9.54 9.87
Total Private Housing Starts (SAAR) Period Level (000s) MoM % Change YoY % Change
United States September 1,047 -8.96 -11.94Fifth District September 138 -0.93 -12.83Maryland September 11.6 -4.13 -41.49
Maryland Housing StartsThousands of Units (SAAR) September 2016
MARYLAND 5
S N A P S H O T A MONTHLY UPDATE OF THE FIFTH DISTRICT ECONOMY
-100
-50
0
50
100
150
200
2006 2007 2008 2009 2010 2011 2012 2013 2014 2015 2016
0
5
10
15
20
25
30
35
40
2006 2007 2008 2009 2010 2011 2012 2013 2014 2015 2016
November 2016 FEDERAL RESERVE BANK OF RICHMOND
MARYLANDReal Estate Conditions Maryland House Price Index (CoreLogic)House Price Index (2000=100) Period Level MoM % Change YoY % Change Year-over-Year Percent Change through September 2016
United States September 184 1.08 6.34
Fifth District September 187 0.24 3.50Maryland September 193 0.71 2.50Baltimore-Towson MSA September 190 0.18 1.44Cumberland MSA September 202 0.14 5.57Hagerstown MSA September 159 -0.05 5.45Salisbury MSA September 209 0.14 0.63
Median Home Sales Price - NAR (NSA) Period Level ($000s) QoQ % Change YoY % Change
Baltimore-Towson MSA Q2:16 266 15.97 4.44Cumberland MSA Q2:16 95 40.80 15.17Hagerstown MSA Q2:16 167 14.04 6.32
Median Home Sales Price - NAHB Period Level ($000s) QoQ % Change YoY % Change Baltimore-Towson MSA Median Home Sales Price (NAR)
Baltimore-Towson MSA Q2:16 248 9.25 12.22 Year-over-Year Percent Change through Q2:16
Silver Spring-Frederick Metro Div. Q2:16 330 -5.71 -5.71Cumberland MSA Q2:16 79 -2.47 -1.25Hagerstown MSA Q2:16 167 18.44 9.87Salisbury MSA Q2:16 180 9.76 26.76
MARYLAND 6
S N A P S H O T A MONTHLY UPDATE OF THE FIFTH DISTRICT ECONOMY
-20
-15
-10
-5
0
5
10
15
2006 2007 2008 2009 2010 2011 2012 2013 2014 2015 2016
United States
Maryland
-15
-10
-5
0
5
10
2006 2007 2008 2009 2010 2011 2012 2013 2014 2015 2016

November 2016 FEDERAL RESERVE BANK OF RICHMOND
MARYLANDReal Estate Conditions Baltimore-Towson MSA Office Vacancy RateHousing Opportunity Index (%) Q2:16 Q1:16 Q2:15 Through Q3:16
Baltimore-Towson MSA 74.8 76.9 81.3
Silver Spring-Frederick Metro Div. 77.9 73.9 72.9Cumberland MSA 97.9 98.0 93.0Hagerstown MSA 85.0 91.3 86.2Salisbury MSA 80.1 74.2 80.8
Commercial Vacancy Rates (%) Q3:16 Q2:16 Q3:15
Office Vacancies Baltimore-Towson MSA 12.2 12.7 12.9Retail Vacancies Baltimore-Towson MSA --- 6..2 6.7Industrial Vacancies
Baltimore-Towson MSA 12.9 13.5 14.6
Suburban Maryland (Washington, D.C. MSA) --- --- 13.9 Baltimore-Towson MSA Industrial Vacancy RateThrough Q3:16
MARYLAND 7
S N A P S H O T A MONTHLY UPDATE OF THE FIFTH DISTRICT ECONOMY
11
12
13
14
15
16
17
2006 2007 2008 2009 2010 2011 2012 2013 2014 2015 2016
11
12
13
14
15
16
17
18
2006 2007 2008 2009 2010 2011 2012 2013 2014 2015 2016

November 2016 FEDERAL RESERVE BANK OF RICHMOND
NORTH CAROLINANovember Summary A Closer Look at… Household Income and Benefits
NORTH CAROLINA 1
S N A P S H O T A MONTHLY UPDATE OF THE FIFTH DISTRICT ECONOMY
According to recent reports, North Carolina’s economy improved somewhat. Although thestate posted a small increase in the unemployment rate, payroll employment rose andhousing market indicators were mostly positive, particularly on a year-over-year basis.
Labor Markets: Employers in North Carolina added 9,700 jobs (0.2 percent) in September. Thelargest industry gain, in both absolute and percentage terms, came from the constructionindustry that added 3,300 jobs (1.7 percent) in the month. The professional and businessservices and “other” services industries followed, with 2,700 jobs and 2,500 jobs, respectively.On the downside, the leisure and hospitality industry cut 3,300 jobs in September whilesmaller cuts were made in the manufacturing, information, and education and healthservices industries. Since September 2015, total employment in North Carolina rose 1.9percent as employers added 82,600 jobs over the last twelve months. Year-over-year jobgrowth was reported in every industry except manufacturing, information, and financialservices. The most jobs were added to the professional and business services industry(26,800 jobs) and the trade, transportation, and utilities industry (21,900 jobs). The largestgrowth rate, on the other hand, came from the construction industry that expanded 4.8percent by adding 9,100 jobs.
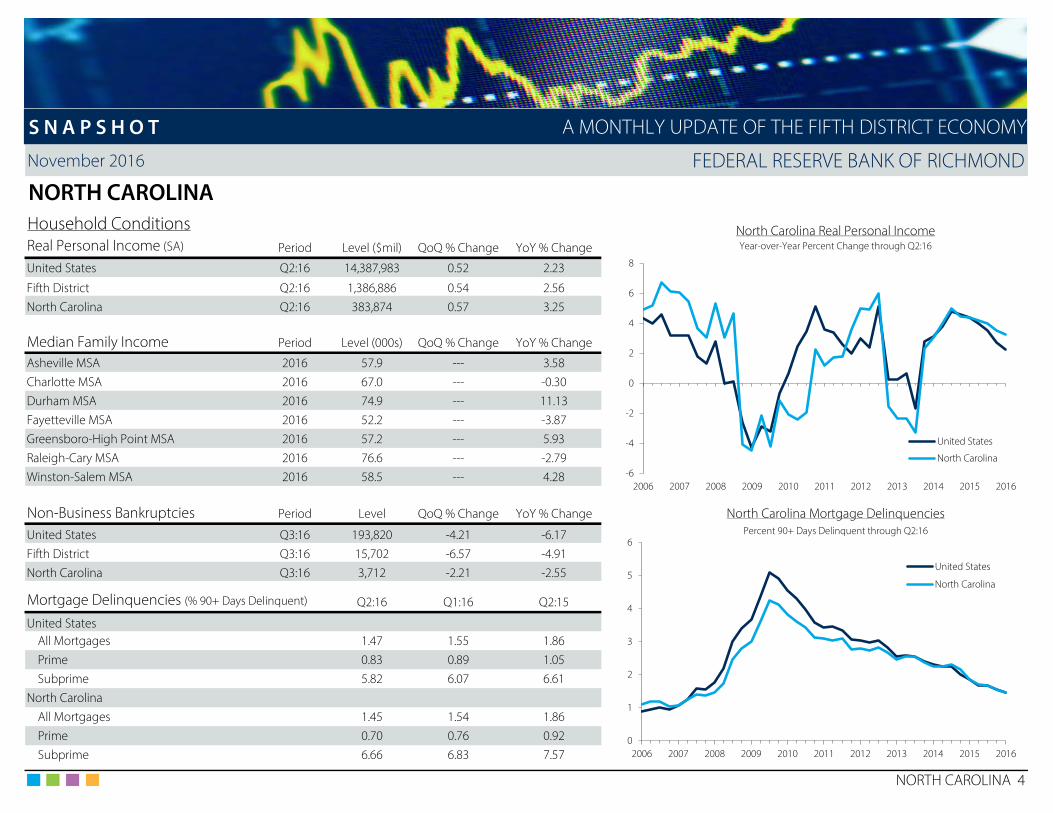
Household Conditions: North Carolina’s unemployment rate ticked up 0.1 percentage pointto 4.7 percent in September. Likewise, in the state’s metro areas, unemployment rates tickedup in every MSA in the month and ranged from 4.1 percent in Asheville to 6.2 percent inFayetteville. In the second quarter of 2016, real personal income in North Carolina rose 0.6percent and was 3.3 percent higher than in the second quarter of 2015. Also in the secondquarter, the share of mortgages with payments 90 or more days past due was virtuallyunchanged at 1.5 percent. The prime delinquency rate edged down to 0.7 percent in thequarter while the subprime rate declined 0.1 percentage point to 6.7 percent.
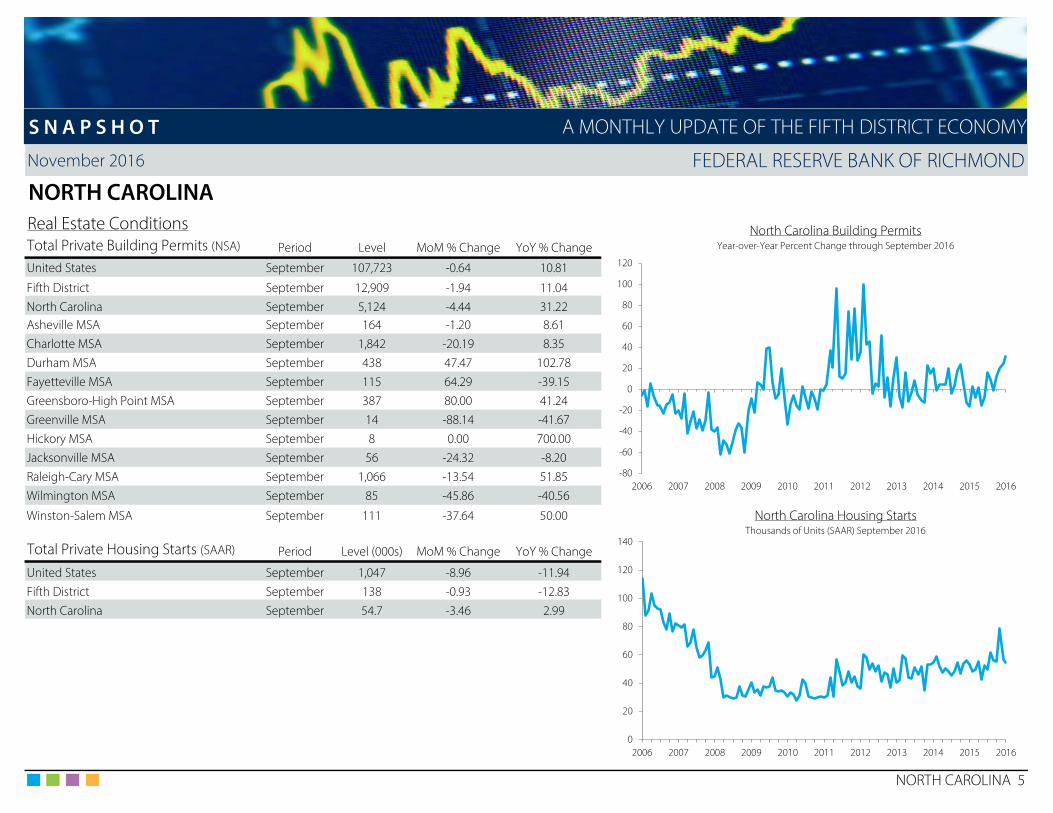
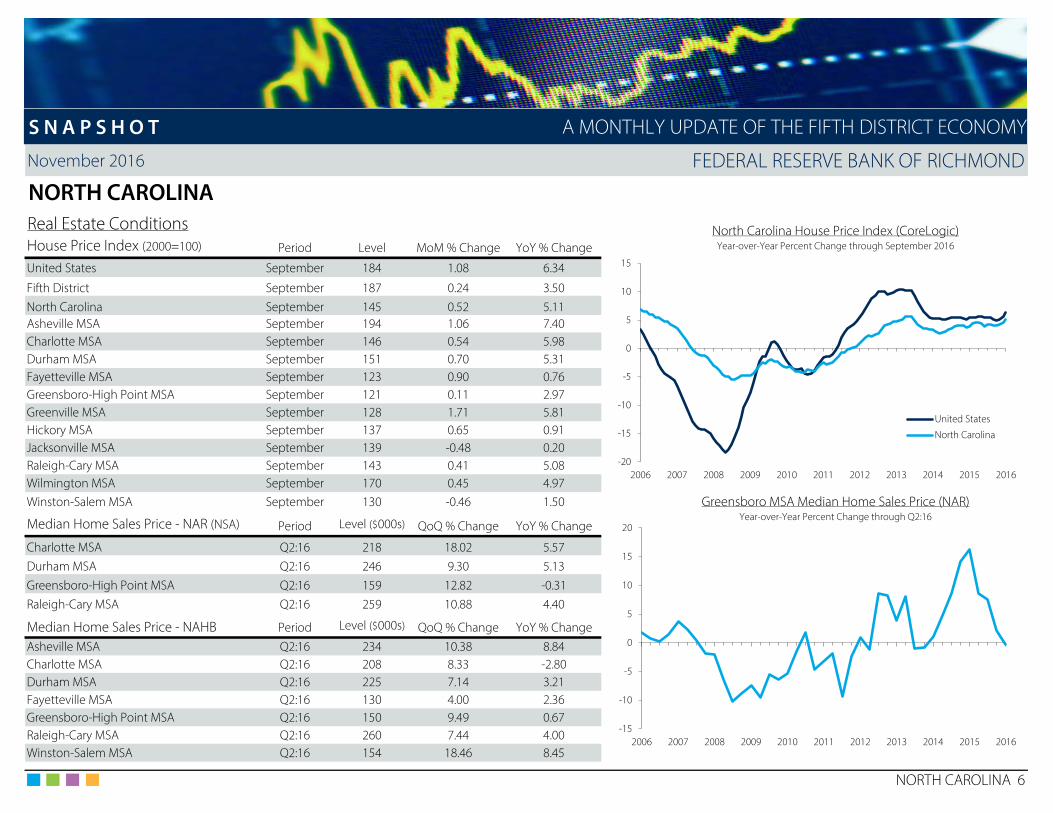
Housing Markets: North Carolina issued 5,124 new residential permits in September, down4.4 percent from the prior month but up 31.2 percent from September 2015. Similarly, themajority of metro areas in the state issued fewer permits in the month but more than in thesame month last year. North Carolina housing starts totaled 54,700 in September, down 3.5percent from August but up 3.0 percent on a year-over-year basis. According to CoreLogicInformation Solutions, home values appreciated 0.5 percent in September and 5.1 percentsince September 2015. House prices grew in September in every MSA except Jacksonvilleand Winston-Salem; prices rose in every metro area on a year-over-year basis.
0
2
4
6
8
10
12
14
16
18
20
Less than$10,000
$10,000--$14,999
$15,000--$24,999
$25,000--$34,999
$35,000--$49,999
$50,000--$74,999
$75,000--$99,999
$100,000--$149,999
$150,000--$199,999
$200,000or more
PercentHousehold Income in North Carolina
Share of Total Households in 2015
• Average Household Size: 2.55 persons
• Median Household Income in 2015: $47,830• Median Household Income in 2014: $46,585• Percent Change from 2014 to 2015: 2.7%
• Mean Household Income in 2015: $67,516• Mean Household Income in 2014: $65,174• Percent Change from 2014 to 2015: 3.6%
• Poverty Rate in 2015: 16.4%
• Percent of Civilian Non-institutionalized Population with No Health Insurance Coverage in 2015: 11.2%

November 2016 FEDERAL RESERVE BANK OF RICHMOND
NORTH CAROLINALabor Market Conditions North Carolina Payroll Employment PerformancePayroll Employment (SA) Period Level (000s) MoM % Change YoY % Change Year-over-Year Percent Change through September 2016
United States - Total September 144,747.0 0.11 1.72
Fifth District - Total September 14,605.5 0.24 1.95North Carolina - Total September 4,337.3 0.22 1.94
Logging and Mining September 5.5 0.00 0.00Construction September 199.6 1.68 4.78Manufacturing September 460.1 -0.20 -0.28Trade, Transportation, and Utilities September 821.8 0.38 2.74Information September 74.8 -0.13 -1.97Financial Activities September 219.2 0.74 -0.86Professional and Business Services September 620.8 0.44 4.51Education and Health Services September 583.9 -0.12 1.81Leisure and Hospitality September 464.8 -0.70 1.13Other Services September 159.3 1.59 4.66 North Carolina Total Employment PerformanceGovernment September 727.5 0.21 0.94 Year-over-Year Percent Change through September 2016
Metro Payroll Employment (NSA) Period Level (000s) YoY % Change
Asheville MSA - Total September 188.2 2.34Charlotte MSA - Total September 1,130.8 2.02Durham MSA - Total September 305.1 2.80Fayetteville MSA - Total September 130.1 2.12Greensboro-High Point MSA - Total September 362.7 1.63Raleigh-Cary MSA - Total September 600.0 2.08Wilmington MSA - Total September 123.4 1.48Winston-Salem MSA - Total September 261.6 0.96
NORTH CAROLINA 2
S N A P S H O T
1.9
0.0
4.8
-0.3
2.7
-2.0
-0.9
4.5
1.8
1.1
4.7
0.9
-3 -2 -1 0 1 2 3 4 5 6
North Carolina - Total
Logging and Mining
Construction
Manufacturing
Trade, Transportation, and Utilities
Information
Financial Activities
Professional and Business Services
Education and Health Services
Leisure and Hospitality
Other Services
Government
A MONTHLY UPDATE OF THE FIFTH DISTRICT ECONOMY
1.0
1.5
2.1
1.6
2.1
2.8
2.0
2.3
1.9
2.0
1.7
0 1 2 3
Winston-Salem MSA
Wilmington MSA
Raleigh-Cary MSA
Greensboro-High Point MSA
Fayetteville MSA
Durham MSA
Charlotte MSA
Asheville MSA
North Carolina (SA)
Fifth District (SA)
United States (SA)

November 2016 FEDERAL RESERVE BANK OF RICHMOND
NORTH CAROLINALabor Market Conditions North Carolina Unemployment RateUnemployment Rate (SA) September 16 August 16 September 15 Through September 2016
United States 5.0 4.9 5.1
Fifth District 4.5 4.5 5.2North Carolina 4.7 4.6 5.7Asheville MSA 4.1 3.9 4.6Charlotte MSA 4.7 4.5 5.4Durham MSA 4.3 4.1 5.0Fayetteville MSA 6.2 5.8 7.3Greensboro-High Point MSA 5.1 4.8 5.9Raleigh-Cary MSA 4.2 4.0 4.7Wilmington MSA 4.8 4.6 5.5Winston-Salem MSA 4.7 4.5 5.4
Civilian Labor Force (SA) Period Level (000s) MoM % Change YoY % Change
United States September 159,907 0.28 1.94
Fifth District September 15,696 0.25 0.77 North Carolina Labor ForceNorth Carolina September 4,824 0.28 1.18 Year-over-Year Percent Change through September 2016
Asheville MSA September 224 1.49 2.42Charlotte MSA September 1,260 0.31 1.97Durham MSA September 288 1.19 2.71Fayetteville MSA September 148 0.68 1.44Greensboro-High Point MSA September 371 1.09 1.76Raleigh-Cary MSA September 676 0.51 2.52Wilmington MSA September 142 0.85 1.65Winston-Salem MSA September 322 1.04 1.19
Initial Unemployment Claims (NSA) Period Level MoM % Change YoY % Change
United States September 854,875 -14.98 -8.30Fifth District September 54,578 -17.55 -8.57
North Carolina September 13,289 -18.58 -16.60
NORTH CAROLINA 3
S N A P S H O T A MONTHLY UPDATE OF THE FIFTH DISTRICT ECONOMY
3
4
5
6
7
8
9
10
11
12
2006 2007 2008 2009 2010 2011 2012 2013 2014 2015 2016
United States
North Carolina
-2
-1
0
1
2
3
4
2006 2007 2008 2009 2010 2011 2012 2013 2014 2015 2016
United States
North Carolina
November 2016 FEDERAL RESERVE BANK OF RICHMOND
NORTH CAROLINAHousehold Conditions North Carolina Real Personal IncomeReal Personal Income (SA) Period Level ($mil) QoQ % Change YoY % Change Year-over-Year Percent Change through Q2:16
United States Q2:16 14,387,983 0.52 2.23
Fifth District Q2:16 1,386,886 0.54 2.56North Carolina Q2:16 383,874 0.57 3.25
Median Family Income Period Level (000s) QoQ % Change YoY % Change
Asheville MSA 2016 57.9 --- 3.58Charlotte MSA 2016 67.0 --- -0.30Durham MSA 2016 74.9 --- 11.13Fayetteville MSA 2016 52.2 --- -3.87Greensboro-High Point MSA 2016 57.2 --- 5.93Raleigh-Cary MSA 2016 76.6 --- -2.79Winston-Salem MSA 2016 58.5 --- 4.28
Non-Business Bankruptcies Period Level QoQ % Change YoY % Change North Carolina Mortgage Delinquencies
United States Q3:16 193,820 -4.21 -6.17 Percent 90+ Days Delinquent through Q2:16
Fifth District Q3:16 15,702 -6.57 -4.91North Carolina Q3:16 3,712 -2.21 -2.55
Mortgage Delinquencies (% 90+ Days Delinquent) Q2:16 Q1:16 Q2:15
United States All Mortgages 1.47 1.55 1.86Prime 0.83 0.89 1.05Subprime 5.82 6.07 6.61
North CarolinaAll Mortgages 1.45 1.54 1.86Prime 0.70 0.76 0.92Subprime 6.66 6.83 7.57
NORTH CAROLINA 4
S N A P S H O T A MONTHLY UPDATE OF THE FIFTH DISTRICT ECONOMY
-6
-4
-2
0
2
4
6
8
2006 2007 2008 2009 2010 2011 2012 2013 2014 2015 2016
United States
North Carolina
0
1
2
3
4
5
6
2006 2007 2008 2009 2010 2011 2012 2013 2014 2015 2016
United States
North Carolina
November 2016 FEDERAL RESERVE BANK OF RICHMOND
NORTH CAROLINAReal Estate Conditions North Carolina Building PermitsTotal Private Building Permits (NSA) Period Level MoM % Change YoY % Change Year-over-Year Percent Change through September 2016
United States September 107,723 -0.64 10.81
Fifth District September 12,909 -1.94 11.04North Carolina September 5,124 -4.44 31.22Asheville MSA September 164 -1.20 8.61Charlotte MSA September 1,842 -20.19 8.35Durham MSA September 438 47.47 102.78Fayetteville MSA September 115 64.29 -39.15Greensboro-High Point MSA September 387 80.00 41.24Greenville MSA September 14 -88.14 -41.67Hickory MSA September 8 0.00 700.00Jacksonville MSA September 56 -24.32 -8.20Raleigh-Cary MSA September 1,066 -13.54 51.85Wilmington MSA September 85 -45.86 -40.56
Winston-Salem MSA September 111 -37.64 50.00 North Carolina Housing StartsThousands of Units (SAAR) September 2016
Total Private Housing Starts (SAAR) Period Level (000s) MoM % Change YoY % Change
United States September 1,047 -8.96 -11.94Fifth District September 138 -0.93 -12.83North Carolina September 54.7 -3.46 2.99
NORTH CAROLINA 5
S N A P S H O T A MONTHLY UPDATE OF THE FIFTH DISTRICT ECONOMY
-80
-60
-40
-20
0
20
40
60
80
100
120
2006 2007 2008 2009 2010 2011 2012 2013 2014 2015 2016
0
20
40
60
80
100
120
140
2006 2007 2008 2009 2010 2011 2012 2013 2014 2015 2016
November 2016 FEDERAL RESERVE BANK OF RICHMOND
NORTH CAROLINAReal Estate Conditions North Carolina House Price Index (CoreLogic)House Price Index (2000=100) Period Level MoM % Change YoY % Change Year-over-Year Percent Change through September 2016
United States September 184 1.08 6.34
Fifth District September 187 0.24 3.50North Carolina September 145 0.52 5.11Asheville MSA September 194 1.06 7.40Charlotte MSA September 146 0.54 5.98Durham MSA September 151 0.70 5.31Fayetteville MSA September 123 0.90 0.76Greensboro-High Point MSA September 121 0.11 2.97Greenville MSA September 128 1.71 5.81Hickory MSA September 137 0.65 0.91Jacksonville MSA September 139 -0.48 0.20Raleigh-Cary MSA September 143 0.41 5.08Wilmington MSA September 170 0.45 4.97Winston-Salem MSA September 130 -0.46 1.50 Greensboro MSA Median Home Sales Price (NAR)
Median Home Sales Price - NAR (NSA) Period Level ($000s) QoQ % Change YoY % ChangeYear-over-Year Percent Change through Q2:16
Charlotte MSA Q2:16 218 18.02 5.57Durham MSA Q2:16 246 9.30 5.13Greensboro-High Point MSA Q2:16 159 12.82 -0.31Raleigh-Cary MSA Q2:16 259 10.88 4.40
Median Home Sales Price - NAHB Period Level ($000s) QoQ % Change YoY % ChangeAsheville MSA Q2:16 234 10.38 8.84Charlotte MSA Q2:16 208 8.33 -2.80Durham MSA Q2:16 225 7.14 3.21Fayetteville MSA Q2:16 130 4.00 2.36Greensboro-High Point MSA Q2:16 150 9.49 0.67Raleigh-Cary MSA Q2:16 260 7.44 4.00Winston-Salem MSA Q2:16 154 18.46 8.45
NORTH CAROLINA 6
S N A P S H O T A MONTHLY UPDATE OF THE FIFTH DISTRICT ECONOMY
-20
-15
-10
-5
0
5
10
15
2006 2007 2008 2009 2010 2011 2012 2013 2014 2015 2016
United States
North Carolina
-15
-10
-5
0
5
10
15
20
2006 2007 2008 2009 2010 2011 2012 2013 2014 2015 2016
November 2016 FEDERAL RESERVE BANK OF RICHMOND
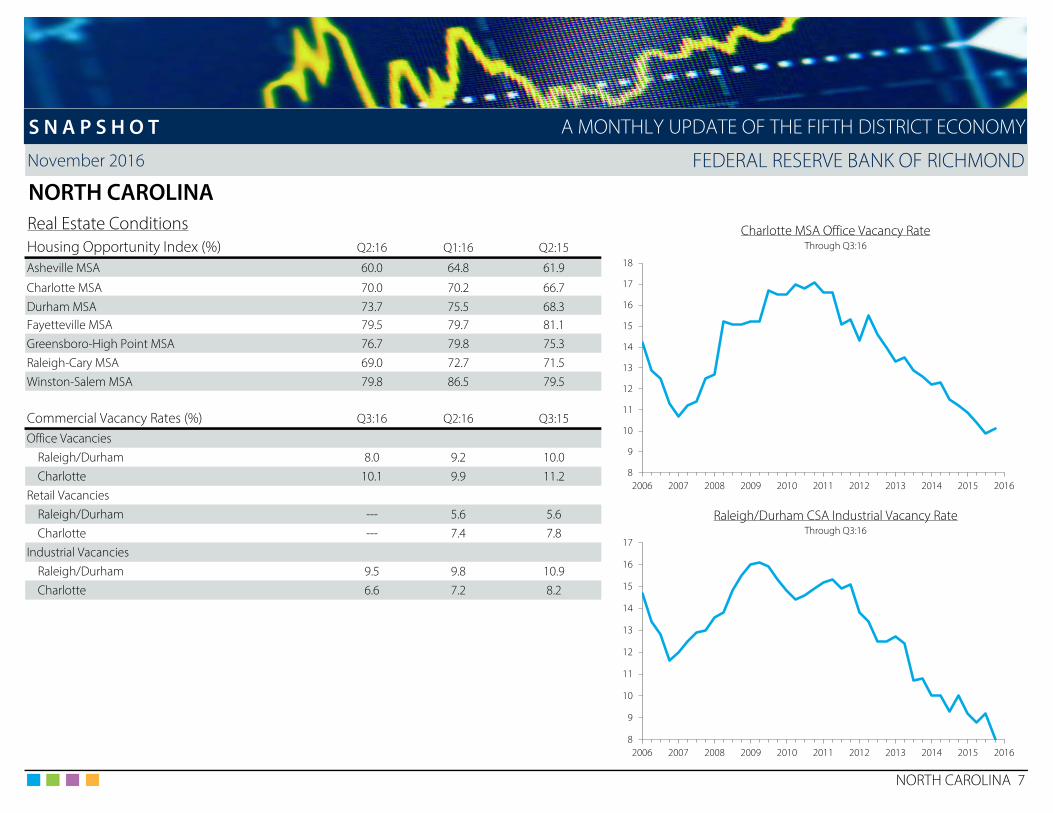
NORTH CAROLINAReal Estate Conditions Charlotte MSA Office Vacancy RateHousing Opportunity Index (%) Q2:16 Q1:16 Q2:15 Through Q3:16
Asheville MSA 60.0 64.8 61.9
Charlotte MSA 70.0 70.2 66.7Durham MSA 73.7 75.5 68.3Fayetteville MSA 79.5 79.7 81.1Greensboro-High Point MSA 76.7 79.8 75.3Raleigh-Cary MSA 69.0 72.7 71.5Winston-Salem MSA 79.8 86.5 79.5
Commercial Vacancy Rates (%) Q3:16 Q2:16 Q3:15
Office VacanciesRaleigh/Durham 8.0 9.2 10.0Charlotte 10.1 9.9 11.2
Retail VacanciesRaleigh/Durham --- 5.6 5.6 Raleigh/Durham CSA Industrial Vacancy RateCharlotte --- 7.4 7.8 Through Q3:16
Industrial VacanciesRaleigh/Durham 9.5 9.8 10.9Charlotte 6.6 7.2 8.2
NORTH CAROLINA 7
S N A P S H O T A MONTHLY UPDATE OF THE FIFTH DISTRICT ECONOMY
8
9
10
11
12
13
14
15
16
17
18
2006 2007 2008 2009 2010 2011 2012 2013 2014 2015 2016
8
9
10
11
12
13
14
15
16
17
2006 2007 2008 2009 2010 2011 2012 2013 2014 2015 2016

November 2016 FEDERAL RESERVE BANK OF RICHMOND
SOUTH CAROLINANovember Summary A Closer Look at… Household Income and Benefits
SOUTH CAROLINA 1
S N A P S H O T A MONTHLY UPDATE OF THE FIFTH DISTRICT ECONOMY
Economic reports on South Carolina were somewhat positive in recent months as payrollemployment continued to expand and household conditions improved; however, housingmarket activity was more sluggish.
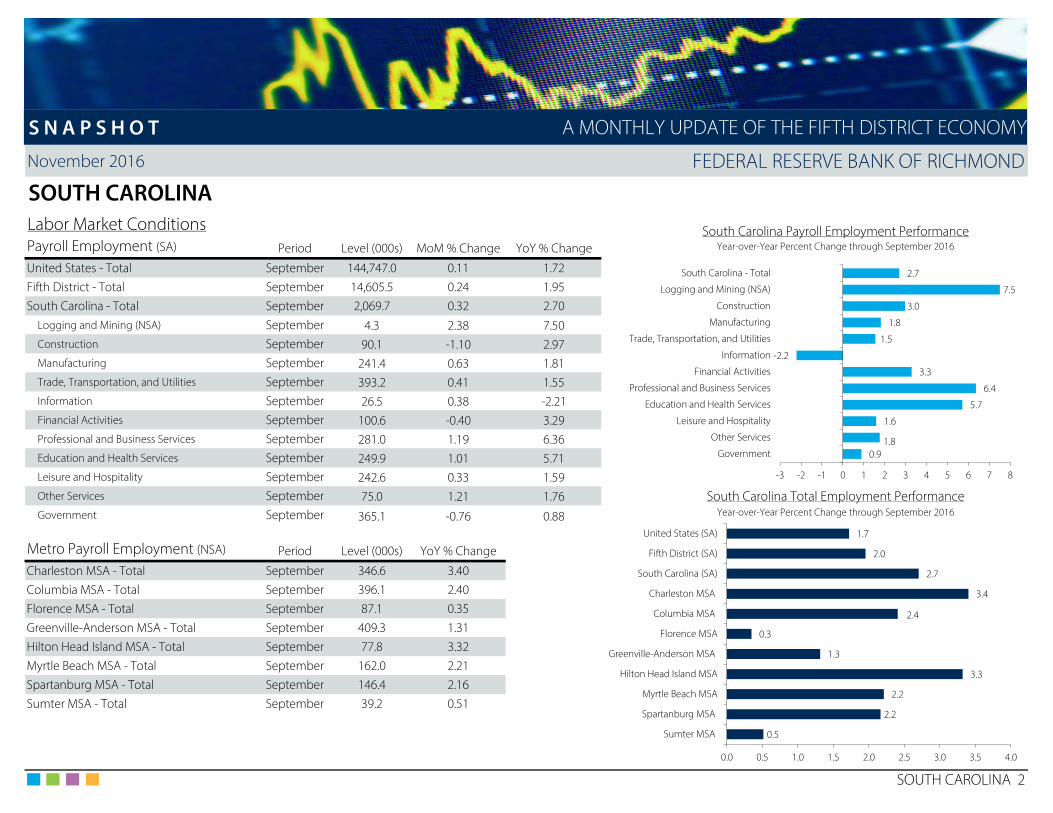
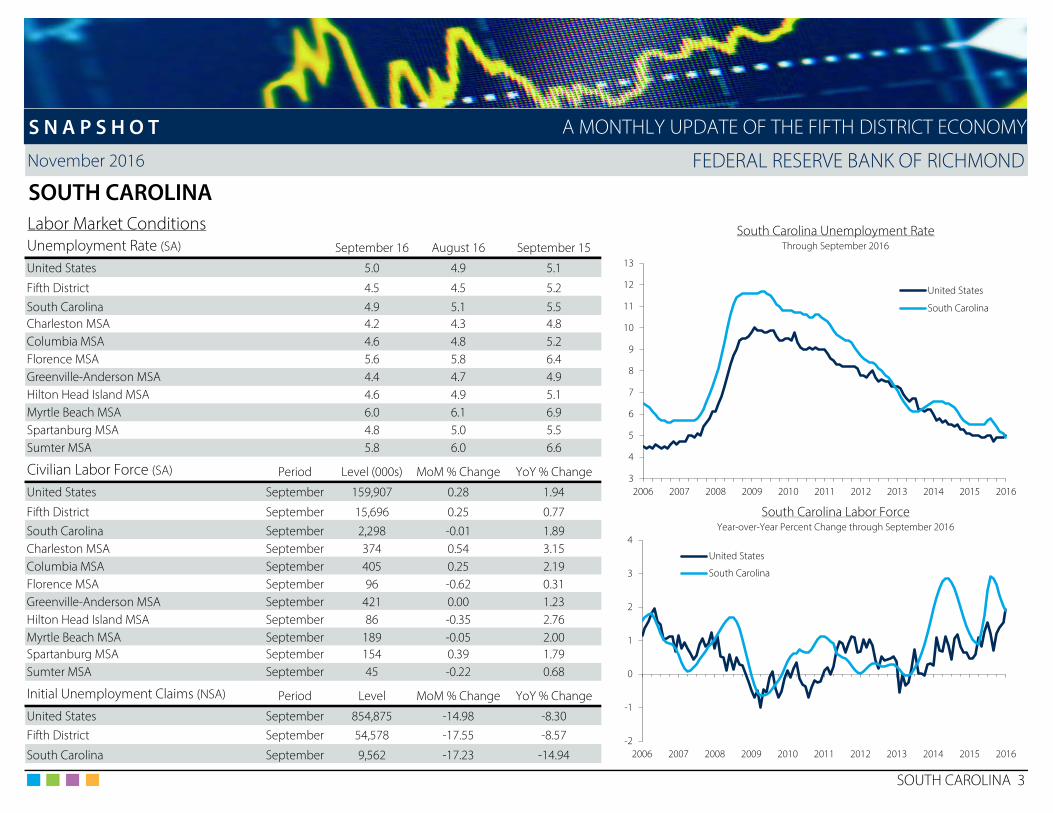
Labor Markets: Total employment in South Carolina rose 0.3 percent in September as firmsadded 6,600 jobs in the month. The most jobs were added to the professional and businessservices industry (3,300 jobs) followed by the education and health services industry (2,500jobs). Smaller job gains were reported in most of the remaining industries; the only industriesto report job losses in September were construction (1,000 jobs), financial services (400 jobs),and government (2,800 jobs). Within the government sector, the loss was attributable to cutsof 500 jobs from state government payrolls and 2,300 jobs from local governmentemployment. On a year-over-year basis, payroll employment in South Carolina grew 2.7percent as every industry except information expanded. The logging and mining industryreported the largest growth rate of 7.5 percent (300 jobs) followed by professional andbusiness services (6.4 percent or 16,800 jobs) and education and health services (5.7 percentor 13,500 jobs).
Household Conditions: The unemployment rate in South Carolina declined 0.2 percentagepoint to 4.9 percent in September. At the metro level, unemployment rates declined in everyMSA in the month and ranged from 4.2 percent in Charleston to 6.0 percent in Myrtle Beach.In the second quarter of 2016, real personal income rose 0.4 percent and increased 3.2percent since the second quarter of 2015. Also in the second quarter, the share of mortgageswith payments 90 or more days overdue fell 0.1 percentage point to 1.5 percent. Thesubprime delinquency rate fell 0.3 percentage point to 5.4 percent in the quarter while theprime delinquency rate edged slightly lower to 0.8 percent.
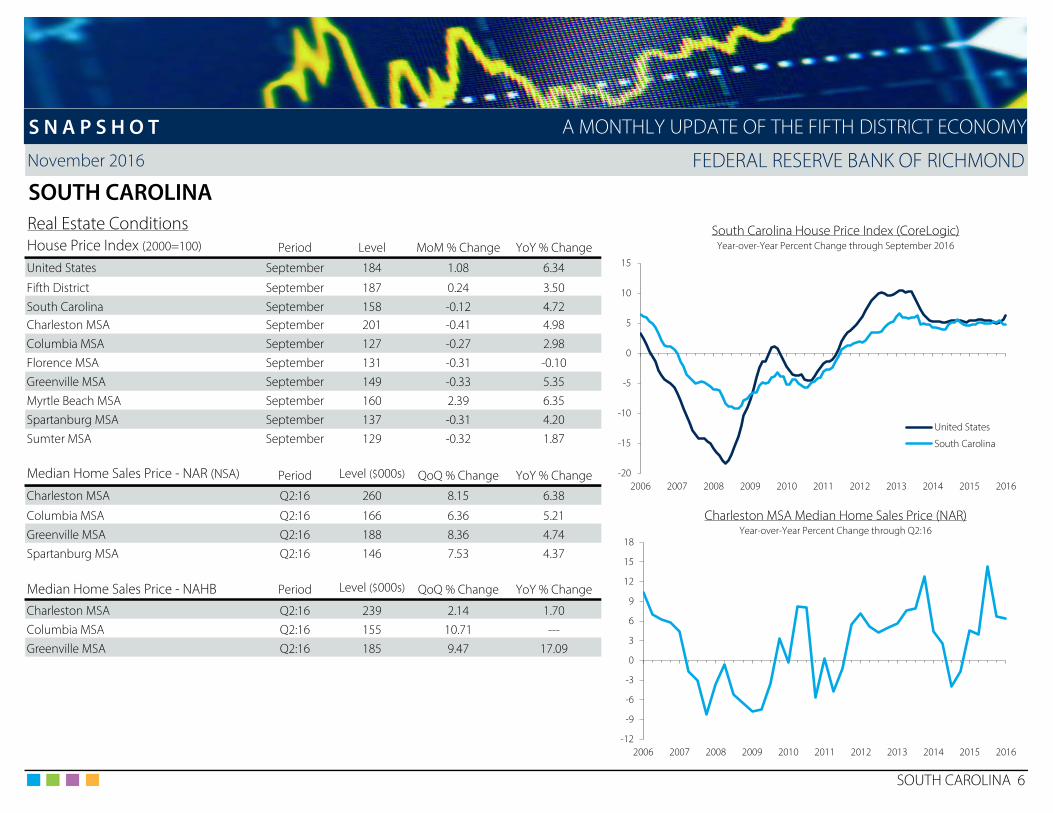
Housing Markets: South Carolina issued 2,759 new residential permits in September, down8.9 percent from the prior month and down 10.5 percent from September 2015. In thestate’s metro areas, permitting activity slowed in the month and on a year-over-year basis inthe majority of MSAs with only the Charleston metro area issuing more permits over bothperiods. Housing starts in South Carolina totaled 29,500 in September, down 7.9 percent inthe month and down 29.8 percent from last September. Home values in the state, accordingto CoreLogic Information Solutions, depreciated 0.1 percent in September but appreciated4.7 percent on a year-over-year basis. Home prices declined in September in every metroarea except Myrtle Beach but rose in every MSA except Florence on a year-over-year basis.
0
2
4
6
8
10
12
14
16
18
20
Less than$10,000
$10,000--$14,999
$15,000--$24,999
$25,000--$34,999
$35,000--$49,999
$50,000--$74,999
$75,000--$99,999
$100,000--$149,999
$150,000--$199,999
$200,000or more
PercentHousehold Income in South Carolina
Share of Total Households in 2015
• Average Household Size: 2.56 persons
• Median Household Income in 2015: $47,238• Median Household Income in 2014: $45,277• Percent Change from 2014 to 2015: 4.3%
• Mean Household Income in 2015: $64,352• Mean Household Income in 2014: $61,974• Percent Change from 2014 to 2015: 3.8%
• Poverty Rate in 2015: 16.6%
• Percent of Civilian Non-institutionalized Population with No Health Insurance Coverage in 2015: 10.9%
November 2016 FEDERAL RESERVE BANK OF RICHMOND
SOUTH CAROLINALabor Market Conditions South Carolina Payroll Employment PerformancePayroll Employment (SA) Period Level (000s) MoM % Change YoY % Change Year-over-Year Percent Change through September 2016
United States - Total September 144,747.0 0.11 1.72Fifth District - Total September 14,605.5 0.24 1.95South Carolina - Total September 2,069.7 0.32 2.70
Logging and Mining (NSA) September 4.3 2.38 7.50Construction September 90.1 -1.10 2.97Manufacturing September 241.4 0.63 1.81Trade, Transportation, and Utilities September 393.2 0.41 1.55Information September 26.5 0.38 -2.21Financial Activities September 100.6 -0.40 3.29Professional and Business Services September 281.0 1.19 6.36Education and Health Services September 249.9 1.01 5.71Leisure and Hospitality September 242.6 0.33 1.59Other Services September 75.0 1.21 1.76 South Carolina Total Employment PerformanceGovernment September 365.1 -0.76 0.88 Year-over-Year Percent Change through September 2016
Metro Payroll Employment (NSA) Period Level (000s) YoY % Change
Charleston MSA - Total September 346.6 3.40Columbia MSA - Total September 396.1 2.40Florence MSA - Total September 87.1 0.35Greenville-Anderson MSA - Total September 409.3 1.31Hilton Head Island MSA - Total September 77.8 3.32Myrtle Beach MSA - Total September 162.0 2.21Spartanburg MSA - Total September 146.4 2.16Sumter MSA - Total September 39.2 0.51
SOUTH CAROLINA 2
S N A P S H O T
2.7
7.5
3.0
1.8
1.5
-2.2
3.3
6.4
5.7
1.6
1.80.9
-3 -2 -1 0 1 2 3 4 5 6 7 8
South Carolina - Total
Logging and Mining (NSA)
Construction
Manufacturing
Trade, Transportation, and Utilities
Information
Financial Activities
Professional and Business Services
Education and Health Services
Leisure and Hospitality
Other Services
Government
A MONTHLY UPDATE OF THE FIFTH DISTRICT ECONOMY
0.5
2.2
2.2
3.3
1.3
0.3
2.4
3.4
2.7
2.0
1.7
0.0 0.5 1.0 1.5 2.0 2.5 3.0 3.5 4.0
Sumter MSA
Spartanburg MSA
Myrtle Beach MSA
Hilton Head Island MSA
Greenville-Anderson MSA
Florence MSA
Columbia MSA
Charleston MSA
South Carolina (SA)
Fifth District (SA)
United States (SA)
November 2016 FEDERAL RESERVE BANK OF RICHMOND
SOUTH CAROLINALabor Market Conditions South Carolina Unemployment RateUnemployment Rate (SA) September 16 August 16 September 15 Through September 2016
United States 5.0 4.9 5.1
Fifth District 4.5 4.5 5.2South Carolina 4.9 5.1 5.5Charleston MSA 4.2 4.3 4.8Columbia MSA 4.6 4.8 5.2Florence MSA 5.6 5.8 6.4Greenville-Anderson MSA 4.4 4.7 4.9Hilton Head Island MSA 4.6 4.9 5.1Myrtle Beach MSA 6.0 6.1 6.9Spartanburg MSA 4.8 5.0 5.5Sumter MSA 5.8 6.0 6.6
Civilian Labor Force (SA) Period Level (000s) MoM % Change YoY % Change
United States September 159,907 0.28 1.94
Fifth District September 15,696 0.25 0.77 South Carolina Labor ForceSouth Carolina September 2,298 -0.01 1.89 Year-over-Year Percent Change through September 2016
Charleston MSA September 374 0.54 3.15Columbia MSA September 405 0.25 2.19Florence MSA September 96 -0.62 0.31Greenville-Anderson MSA September 421 0.00 1.23Hilton Head Island MSA September 86 -0.35 2.76Myrtle Beach MSA September 189 -0.05 2.00Spartanburg MSA September 154 0.39 1.79Sumter MSA September 45 -0.22 0.68
Initial Unemployment Claims (NSA) Period Level MoM % Change YoY % Change
United States September 854,875 -14.98 -8.30Fifth District September 54,578 -17.55 -8.57
South Carolina September 9,562 -17.23 -14.94
SOUTH CAROLINA 3
S N A P S H O T A MONTHLY UPDATE OF THE FIFTH DISTRICT ECONOMY
3
4
5
6
7
8
9
10
11
12
13
2006 2007 2008 2009 2010 2011 2012 2013 2014 2015 2016
United States
South Carolina
-2
-1
0
1
2
3
4
2006 2007 2008 2009 2010 2011 2012 2013 2014 2015 2016
United States
South Carolina

November 2016 FEDERAL RESERVE BANK OF RICHMOND
SOUTH CAROLINAHousehold Conditions South Carolina Real Personal IncomeReal Personal Income (SA) Period Level ($mil) QoQ % Change YoY % Change Year-over-Year Percent Change through Q2:16
United States Q2:16 14,387,983 0.52 2.23
Fifth District Q2:16 1,386,886 0.54 2.56South Carolina Q2:16 175,770 0.44 3.18
Median Family Income Period Level (000s) QoQ % Change YoY % Change
Charleston MSA 2016 68.2 --- 8.43Columbia MSA 2016 64.1 --- ---Greenville MSA 2016 63.5 --- 9.48
Non-Business Bankruptcies Period Level QoQ % Change YoY % Change
United States Q3:16 193,820 -4.21 -6.17Fifth District Q3:16 15,702 -6.57 -4.91South Carolina Q3:16 1,738 7.62 -0.46
South Carolina Mortgage DelinquenciesMortgage Delinquencies (% 90+ Days Delinquent) Q2:16 Q1:16 Q2:15 Percent 90+ Days Delinquent through Q2:16
United States All Mortgages 1.47 1.55 1.86Prime 0.83 0.89 1.05Subprime 5.82 6.07 6.61
South CarolinaAll Mortgages 1.45 1.55 1.82Prime 0.82 0.90 1.03Subprime 5.41 5.72 6.30
SOUTH CAROLINA 4
S N A P S H O T A MONTHLY UPDATE OF THE FIFTH DISTRICT ECONOMY
-6
-4
-2
0
2
4
6
8
2006 2007 2008 2009 2010 2011 2012 2013 2014 2015 2016
United States
South Carolina
0
1
2
3
4
5
6
2006 2007 2008 2009 2010 2011 2012 2013 2014 2015 2016
United States
South Carolina

November 2016 FEDERAL RESERVE BANK OF RICHMOND
SOUTH CAROLINAReal Estate Conditions South Carolina Building PermitsTotal Private Building Permits (NSA) Period Level MoM % Change YoY % Change Year-over-Year Percent Change through September 2016
United States September 107,723 -0.64 10.81
Fifth District September 12,909 -1.94 11.04South Carolina September 2,759 -8.88 -10.54Charleston MSA September 823 62.97 1.86Columbia MSA September 351 -15.22 -36.53Florence MSA September 23 -11.54 4.55Greenville MSA September 377 -12.33 -32.07Myrtle Beach MSA September 463 -3.14 31.91Spartanburg MSA September 136 -28.80 -12.26Sumter MSA September 19 -13.64 -24.00
Total Private Housing Starts (SAAR) Period Level (000s) MoM % Change YoY % Change
United States September 1,047 -8.96 -11.94 South Carolina Housing StartsFifth District September 138 -0.93 -12.83 Thousands of Units (SAAR) September 2016
South Carolina September 29.5 -7.94 -29.78
SOUTH CAROLINA 5
S N A P S H O T A MONTHLY UPDATE OF THE FIFTH DISTRICT ECONOMY
-80
-60
-40
-20
0
20
40
60
80
100
2006 2007 2008 2009 2010 2011 2012 2013 2014 2015 2016
0
10
20
30
40
50
60
70
2006 2007 2008 2009 2010 2011 2012 2013 2014 2015 2016
November 2016 FEDERAL RESERVE BANK OF RICHMOND
SOUTH CAROLINAReal Estate Conditions South Carolina House Price Index (CoreLogic)House Price Index (2000=100) Period Level MoM % Change YoY % Change Year-over-Year Percent Change through September 2016
United States September 184 1.08 6.34
Fifth District September 187 0.24 3.50South Carolina September 158 -0.12 4.72Charleston MSA September 201 -0.41 4.98Columbia MSA September 127 -0.27 2.98Florence MSA September 131 -0.31 -0.10Greenville MSA September 149 -0.33 5.35Myrtle Beach MSA September 160 2.39 6.35Spartanburg MSA September 137 -0.31 4.20Sumter MSA September 129 -0.32 1.87
Median Home Sales Price - NAR (NSA) Period Level ($000s) QoQ % Change YoY % Change
Charleston MSA Q2:16 260 8.15 6.38
Columbia MSA Q2:16 166 6.36 5.21 Charleston MSA Median Home Sales Price (NAR)Greenville MSA Q2:16 188 8.36 4.74 Year-over-Year Percent Change through Q2:16
Spartanburg MSA Q2:16 146 7.53 4.37
Median Home Sales Price - NAHB Period Level ($000s) QoQ % Change YoY % Change
Charleston MSA Q2:16 239 2.14 1.70Columbia MSA Q2:16 155 10.71 ---Greenville MSA Q2:16 185 9.47 17.09
SOUTH CAROLINA 6
S N A P S H O T A MONTHLY UPDATE OF THE FIFTH DISTRICT ECONOMY
-20
-15
-10
-5
0
5
10
15
2006 2007 2008 2009 2010 2011 2012 2013 2014 2015 2016
United States
South Carolina
-12
-9
-6
-3
0
3
6
9
12
15
18
2006 2007 2008 2009 2010 2011 2012 2013 2014 2015 2016
November 2016 FEDERAL RESERVE BANK OF RICHMOND
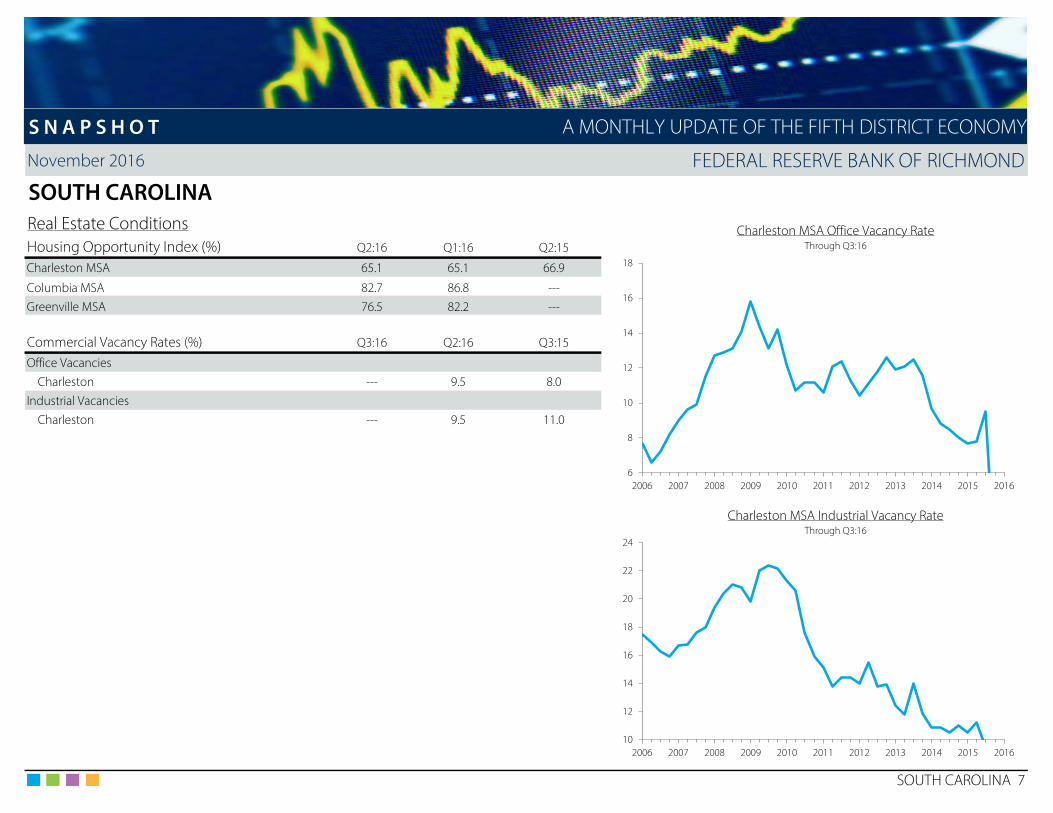
SOUTH CAROLINAReal Estate Conditions Charleston MSA Office Vacancy RateHousing Opportunity Index (%) Q2:16 Q1:16 Q2:15 Through Q3:16
Charleston MSA 65.1 65.1 66.9
Columbia MSA 82.7 86.8 ---Greenville MSA 76.5 82.2 ---
Commercial Vacancy Rates (%) Q3:16 Q2:16 Q3:15
Office VacanciesCharleston --- 9.5 8.0
Industrial VacanciesCharleston --- 9.5 11.0
Charleston MSA Industrial Vacancy RateThrough Q3:16
SOUTH CAROLINA 7
S N A P S H O T A MONTHLY UPDATE OF THE FIFTH DISTRICT ECONOMY
6
8
10
12
14
16
18
2006 2007 2008 2009 2010 2011 2012 2013 2014 2015 2016
10
12
14
16
18
20
22
24
2006 2007 2008 2009 2010 2011 2012 2013 2014 2015 2016
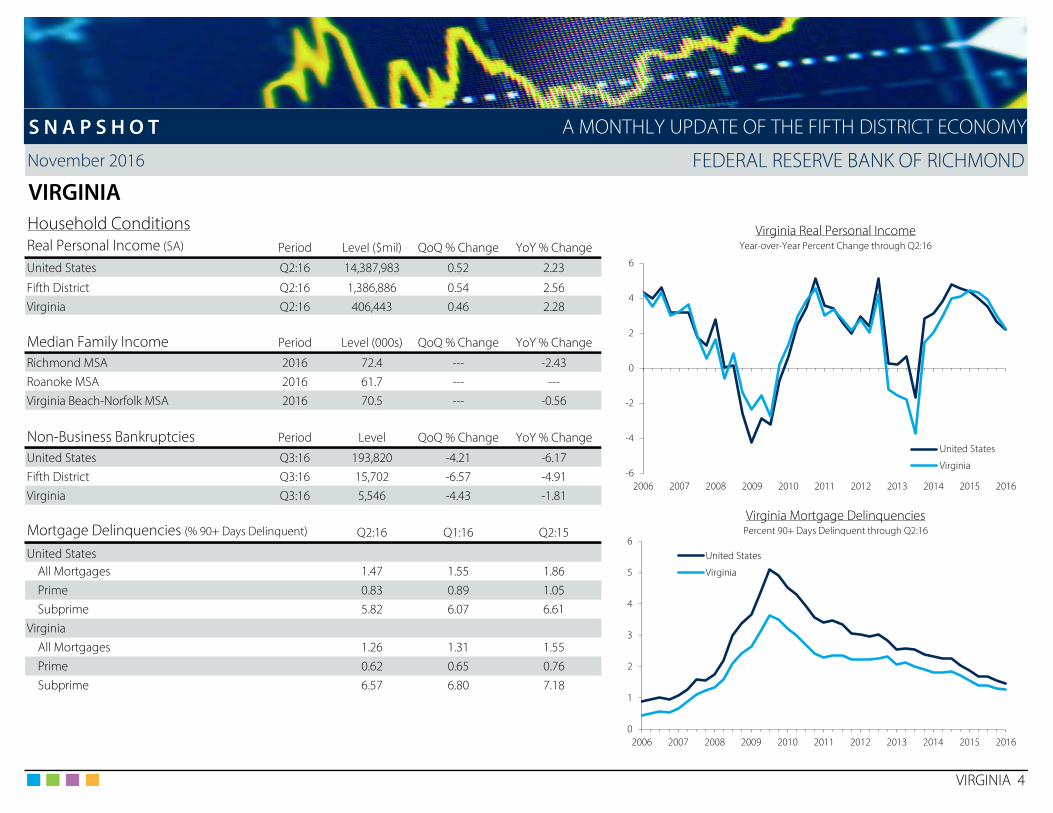
November 2016 FEDERAL RESERVE BANK OF RICHMOND
VIRGINIANovember Summary A Closer Look at… Household Income and Benefits
VIRGINIA 1
S N A P S H O T A MONTHLY UPDATE OF THE FIFTH DISTRICT ECONOMY
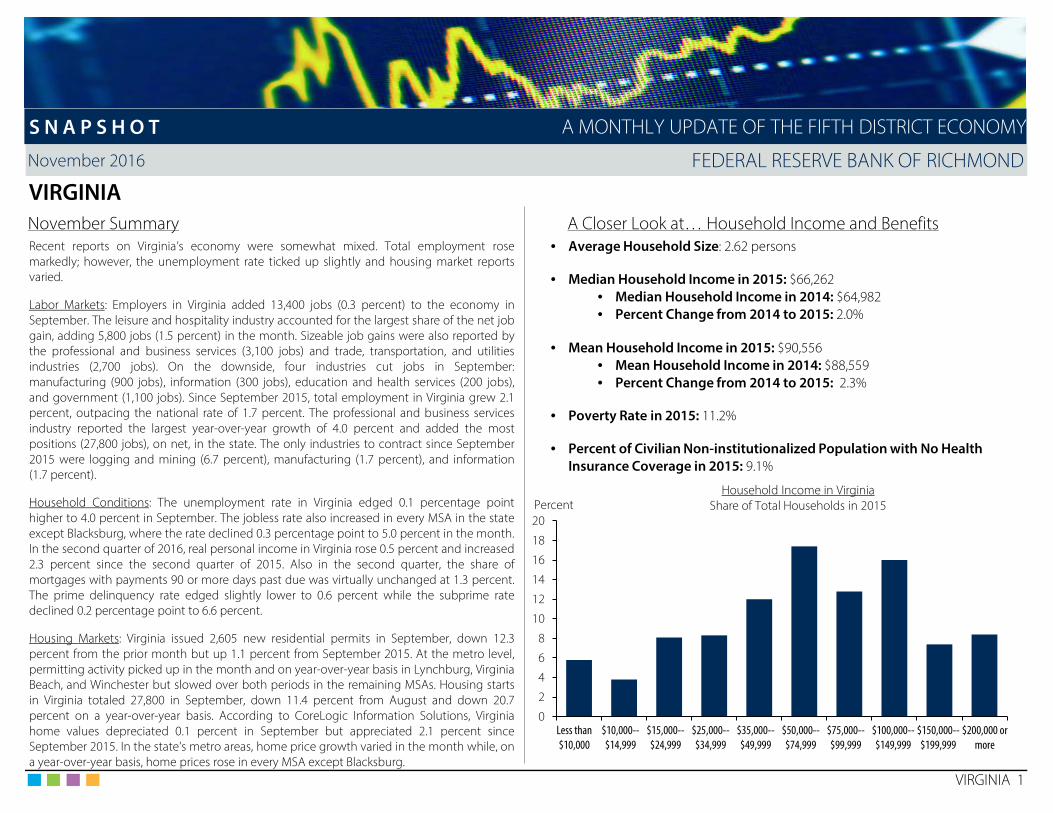
Recent reports on Virginia’s economy were somewhat mixed. Total employment rosemarkedly; however, the unemployment rate ticked up slightly and housing market reportsvaried.
Labor Markets: Employers in Virginia added 13,400 jobs (0.3 percent) to the economy inSeptember. The leisure and hospitality industry accounted for the largest share of the net jobgain, adding 5,800 jobs (1.5 percent) in the month. Sizeable job gains were also reported bythe professional and business services (3,100 jobs) and trade, transportation, and utilitiesindustries (2,700 jobs). On the downside, four industries cut jobs in September:manufacturing (900 jobs), information (300 jobs), education and health services (200 jobs),and government (1,100 jobs). Since September 2015, total employment in Virginia grew 2.1percent, outpacing the national rate of 1.7 percent. The professional and business servicesindustry reported the largest year-over-year growth of 4.0 percent and added the mostpositions (27,800 jobs), on net, in the state. The only industries to contract since September2015 were logging and mining (6.7 percent), manufacturing (1.7 percent), and information(1.7 percent).
Household Conditions: The unemployment rate in Virginia edged 0.1 percentage pointhigher to 4.0 percent in September. The jobless rate also increased in every MSA in the stateexcept Blacksburg, where the rate declined 0.3 percentage point to 5.0 percent in the month.In the second quarter of 2016, real personal income in Virginia rose 0.5 percent and increased2.3 percent since the second quarter of 2015. Also in the second quarter, the share ofmortgages with payments 90 or more days past due was virtually unchanged at 1.3 percent.The prime delinquency rate edged slightly lower to 0.6 percent while the subprime ratedeclined 0.2 percentage point to 6.6 percent.
Housing Markets: Virginia issued 2,605 new residential permits in September, down 12.3percent from the prior month but up 1.1 percent from September 2015. At the metro level,permitting activity picked up in the month and on year-over-year basis in Lynchburg, VirginiaBeach, and Winchester but slowed over both periods in the remaining MSAs. Housing startsin Virginia totaled 27,800 in September, down 11.4 percent from August and down 20.7percent on a year-over-year basis. According to CoreLogic Information Solutions, Virginiahome values depreciated 0.1 percent in September but appreciated 2.1 percent sinceSeptember 2015. In the state’s metro areas, home price growth varied in the month while, ona year-over-year basis, home prices rose in every MSA except Blacksburg.
0
2
4
6
8
10
12
14
16
18
20
Less than$10,000
$10,000--$14,999
$15,000--$24,999
$25,000--$34,999
$35,000--$49,999
$50,000--$74,999
$75,000--$99,999
$100,000--$149,999
$150,000--$199,999
$200,000 ormore
PercentHousehold Income in Virginia
Share of Total Households in 2015
• Average Household Size: 2.62 persons
• Median Household Income in 2015: $66,262• Median Household Income in 2014: $64,982• Percent Change from 2014 to 2015: 2.0%
• Mean Household Income in 2015: $90,556• Mean Household Income in 2014: $88,559• Percent Change from 2014 to 2015: 2.3%
• Poverty Rate in 2015: 11.2%
• Percent of Civilian Non-institutionalized Population with No Health Insurance Coverage in 2015: 9.1%

November 2016 FEDERAL RESERVE BANK OF RICHMOND
VIRGINIALabor Market Conditions Virginia Payroll Employment PerformancePayroll Employment (SA) Period Level (000s) MoM % Change YoY % Change Year-over-Year Percent Change through September 2016
United States - Total September 144,747.0 0.11 1.72Fifth District - Total September 14,605.5 0.24 1.95Virginia - Total September 3,945.3 0.34 2.10
Logging and Mining September 8.3 1.22 -6.74Construction September 188.8 0.91 2.16Manufacturing September 229.5 -0.39 -1.67Trade, Transportation, and Utilities September 677.6 0.40 2.84Information September 68.4 -0.44 -1.72Financial Activities September 200.9 0.60 1.36Professional and Business Services September 726.9 0.43 3.98Education and Health Services September 530.7 -0.04 3.41Leisure and Hospitality September 393.2 1.50 1.52Other Services September 205.0 0.64 3.02 Virginia Total Employment PerformanceGovernment September 716.0 -0.15 0.59 Year-over-Year Percent Change through September 2016
Metro Payroll Employment (NSA) Period Level (000s) YoY % Change
Blacksburg MSA - Total September 79.2 0.25Charlottesville MSA - Total September 118.4 2.96Lynchburg MSA - Total September 103.7 -0.77Northern Virginia - Total September 1,438.5 1.97Richmond MSA - Total September 674.3 2.93Roanoke MSA - Total September 163.3 0.86Virginia Beach-Norfolk MSA - Total September 771.9 0.43Winchester MSA - Total September 63.8 3.07
VIRGINIA 2
S N A P S H O T
2.1
-6.7
2.2
-1.7
2.8
-1.7
1.4
4.0
3.4
1.5
3.0
0.6
-8 -7 -6 -5 -4 -3 -2 -1 0 1 2 3 4 5
Virginia - Total
Logging and Mining
Construction
Manufacturing
Trade, Transportation, and Utilities
Information
Financial Activities
Professional and Business Services
Education and Health Services
Leisure and Hospitality
Other Services
Government
A MONTHLY UPDATE OF THE FIFTH DISTRICT ECONOMY
3.1
0.4
0.9
2.9
2.0
-0.8
3.0
0.3
2.1
2.0
1.7
-1.0 -0.5 0.0 0.5 1.0 1.5 2.0 2.5 3.0 3.5
Winchester MSA
Virginia Beach-Norfolk MSA
Roanoke MSA
Richmond MSA
Northern Virginia
Lynchburg MSA
Charlottesville MSA
Blacksburg MSA
Virginia (SA)
Fifth District (SA)
United States (SA)

November 2016 FEDERAL RESERVE BANK OF RICHMOND
VIRGINIALabor Market Conditions Virginia Unemployment RateUnemployment Rate (SA) September 16 August 16 September 15 Through September 2016
United States 5.0 4.9 5.1
Fifth District 4.5 4.5 5.2Virginia 4.0 3.9 4.2Blacksburg MSA 5.0 5.3 4.3Charlottesville MSA 3.4 3.3 3.7Lynchburg MSA 4.6 4.5 4.6Northern Virginia (NSA) 3.4 3.3 3.5Richmond MSA 4.1 4.0 4.3Roanoke MSA 4.0 3.8 4.2Virginia Beach-Norfolk MSA 4.7 4.5 4.7Winchester MSA 3.7 3.5 4.0
Civilian Labor Force (SA) Period Level (000s) MoM % Change YoY % Change
United States September 159,907 0.28 1.94
Fifth District September 15,696 0.25 0.77 Virginia Labor ForceVirginia September 4,221 0.47 -0.14 Year-over-Year Percent Change through September 2016
Blacksburg MSA September 91 -0.33 -0.11Charlottesville MSA September 118 0.43 1.55Lynchburg MSA September 121 -0.25 -1.47Northern Virginia (NSA) September 1,543 -0.17 0.72Richmond MSA September 670 0.07 1.35Roanoke MSA September 158 0.06 -0.32Virginia Beach-Norfolk MSA September 828 0.05 -0.60Winchester MSA September 70 0.57 1.59
Initial Unemployment Claims (NSA) Period Level MoM % Change YoY % Change
United States September 854,875 -14.98 -8.30Fifth District September 54,578 -17.55 -8.57
Virginia September 12,222 -18.11 -9.95
VIRGINIA 3
S N A P S H O T A MONTHLY UPDATE OF THE FIFTH DISTRICT ECONOMY
2
3
4
5
6
7
8
9
10
11
2006 2007 2008 2009 2010 2011 2012 2013 2014 2015 2016
United States
Virginia
-2
-1
0
1
2
3
2006 2007 2008 2009 2010 2011 2012 2013 2014 2015 2016
United States
Virginia
November 2016 FEDERAL RESERVE BANK OF RICHMOND
VIRGINIAHousehold Conditions Virginia Real Personal IncomeReal Personal Income (SA) Period Level ($mil) QoQ % Change YoY % Change Year-over-Year Percent Change through Q2:16
United States Q2:16 14,387,983 0.52 2.23
Fifth District Q2:16 1,386,886 0.54 2.56Virginia Q2:16 406,443 0.46 2.28
Median Family Income Period Level (000s) QoQ % Change YoY % Change
Richmond MSA 2016 72.4 --- -2.43Roanoke MSA 2016 61.7 --- ---Virginia Beach-Norfolk MSA 2016 70.5 --- -0.56
Non-Business Bankruptcies Period Level QoQ % Change YoY % Change
United States Q3:16 193,820 -4.21 -6.17Fifth District Q3:16 15,702 -6.57 -4.91Virginia Q3:16 5,546 -4.43 -1.81
Virginia Mortgage DelinquenciesMortgage Delinquencies (% 90+ Days Delinquent) Q2:16 Q1:16 Q2:15 Percent 90+ Days Delinquent through Q2:16
United States All Mortgages 1.47 1.55 1.86Prime 0.83 0.89 1.05Subprime 5.82 6.07 6.61
VirginiaAll Mortgages 1.26 1.31 1.55Prime 0.62 0.65 0.76Subprime 6.57 6.80 7.18
VIRGINIA 4
S N A P S H O T A MONTHLY UPDATE OF THE FIFTH DISTRICT ECONOMY
-6
-4
-2
0
2
4
6
2006 2007 2008 2009 2010 2011 2012 2013 2014 2015 2016
United States
Virginia
0
1
2
3
4
5
6
2006 2007 2008 2009 2010 2011 2012 2013 2014 2015 2016
United States
Virginia
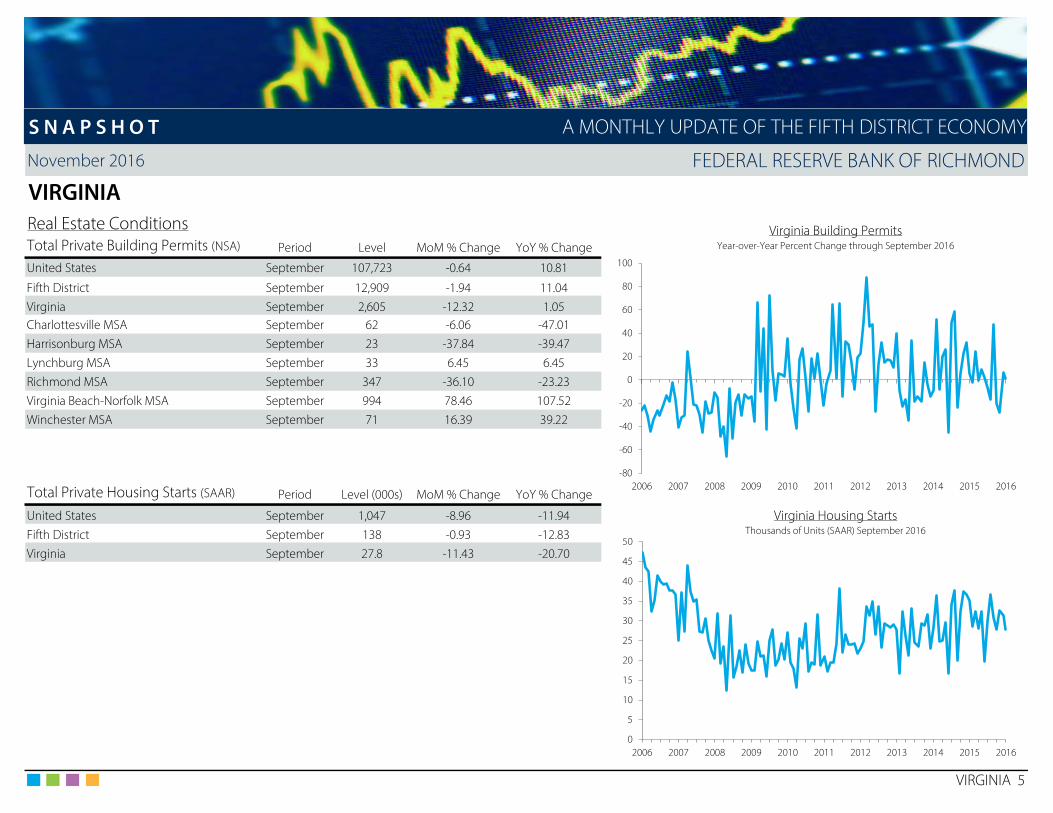
November 2016 FEDERAL RESERVE BANK OF RICHMOND
VIRGINIAReal Estate Conditions Virginia Building PermitsTotal Private Building Permits (NSA) Period Level MoM % Change YoY % Change Year-over-Year Percent Change through September 2016
United States September 107,723 -0.64 10.81
Fifth District September 12,909 -1.94 11.04Virginia September 2,605 -12.32 1.05Charlottesville MSA September 62 -6.06 -47.01Harrisonburg MSA September 23 -37.84 -39.47Lynchburg MSA September 33 6.45 6.45Richmond MSA September 347 -36.10 -23.23Virginia Beach-Norfolk MSA September 994 78.46 107.52Winchester MSA September 71 16.39 39.22
Total Private Housing Starts (SAAR) Period Level (000s) MoM % Change YoY % Change
United States September 1,047 -8.96 -11.94 Virginia Housing StartsFifth District September 138 -0.93 -12.83 Thousands of Units (SAAR) September 2016
Virginia September 27.8 -11.43 -20.70
VIRGINIA 5
S N A P S H O T A MONTHLY UPDATE OF THE FIFTH DISTRICT ECONOMY
-80
-60
-40
-20
0
20
40
60
80
100
2006 2007 2008 2009 2010 2011 2012 2013 2014 2015 2016
0
5
10
15
20
25
30
35
40
45
50
2006 2007 2008 2009 2010 2011 2012 2013 2014 2015 2016

November 2016 FEDERAL RESERVE BANK OF RICHMOND
VIRGINIAReal Estate Conditions Virginia House Price Index (CoreLogic)House Price Index (2000=100) Period Level MoM % Change YoY % Change Year-over-Year Percent Change through September 2016
United States September 184 1.08 6.34
Fifth District September 187 0.24 3.50Virginia September 207 -0.19 2.05Blacksburg MSA September 148 -0.24 -2.14Charlottesville MSA September 177 0.64 2.21Danville MSA September 213 0.22 2.30Harrisonburg MSA September 205 0.28 8.12Lynchburg MSA September 153 -0.82 0.80Richmond MSA September 173 1.24 5.28Roanoke MSA September 152 0.73 1.73Virginia Beach-Norfolk MSA September 189 0.06 2.15Winchester MSA September 195 0.22 5.29
Median Home Sales Price - NAR (NSA) Period Level ($000s) QoQ % Change YoY % Change Virginia Beach-Norfolk MSA Median Home Sales Price (NAR)
Richmond MSA Q2:16 240 10.78 3.67 Year-over-Year Percent Change through Q2:16
Virginia Beach-Norfolk MSA Q2:16 223 12.63 4.69
Median Home Sales Price - NAHB Period Level ($000s) QoQ % Change YoY % Change
Richmond MSA Q2:16 225 12.50 6.64Virginia Beach-Norfolk MSA Q2:16 215 12.57 3.37
VIRGINIA 6
S N A P S H O T A MONTHLY UPDATE OF THE FIFTH DISTRICT ECONOMY
-20
-15
-10
-5
0
5
10
15
2006 2007 2008 2009 2010 2011 2012 2013 2014 2015 2016
United States
Virginia
-15
-10
-5
0
5
10
2007 2008 2009 2010 2011 2012 2013 2014 2015 2016

November 2016 FEDERAL RESERVE BANK OF RICHMOND
VIRGINIAReal Estate Conditions Richmond MSA Office Vacancy RateHousing Opportunity Index (%) Q2:16 Q1:16 Q2:15 Through Q3:16
Richmond MSA 74.8 77.3 78.3
Roanoke MSA 87.0 91.1 88.2Virginia Beach-Norfolk MSA 76.9 80.9 76.9
Commercial Vacancy Rates (%) Q3:16 Q2:16 Q3:15
Office VacanciesNorfolk 12.5 13.0 13.1Richmond 12.7 12.5 12.3
Industrial VacanciesNorthern Virginia --- --- 12.1Richmond --- 10.2 11.6
Richmond MSA Industrial Vacancy RateThrough Q2:16
VIRGINIA 7
S N A P S H O T A MONTHLY UPDATE OF THE FIFTH DISTRICT ECONOMY
8
10
12
14
16
18
20
2006 2007 2008 2009 2010 2011 2012 2013 2014 2015 2016
8
9
10
11
12
13
14
15
16
17
18
2006 2007 2008 2009 2010 2011 2012 2013 2014 2015 2016

November 2016 FEDERAL RESERVE BANK OF RICHMOND
WEST VIRGINIANovember Summary A Closer Look at… Household Income and Benefits
WEST VIRGINIA 1
S N A P S H O T A MONTHLY UPDATE OF THE FIFTH DISTRICT ECONOMY
Economic reports on West Virginia were mixed in recent months as payroll employmentdeclined slightly and the unemployment rate ticked up; however, housing market indicatorswere generally positive.
Labor Markets: Total employment in West Virginia declined slightly in September asemployers cut 200 jobs (0.0 percent) in the month. The job losses were widespread as theonly industries to add jobs in September were professional and business services (900 jobs)and government (1,100 jobs). The leisure and hospitality industry cut 600 jobs (0.8 percent),which was the largest absolute decline in the month; the largest percentage decline camefrom the construction industry that contracted 1.6 percent by cutting 500 jobs. SinceSeptember 2015, payroll employment in the Mountain State rose 0.1 percent despite joblosses occurring in a majority of the state’s industries. Only four industries added jobs over thelast twelve months: professional and business services (700 jobs), education and healthservices (4,900 jobs), leisure and hospitality (2,200 jobs), and government (900 jobs). Thelargest job cut, on the other hand, came from logging and mining industry, which shed 4,300jobs (17.3 percent) since last September.
Household Conditions: The unemployment rate in West Virginia ticked up 0.1 percentagepoint to 5.8 percent in September. At the metro level, unemployment rates rose inSeptember in every MSA except Morgantown, where the rate was unchanged at 4.4 percent.In the second quarter of 2016, real personal income in West Virginia rose 0.5 percent andincreased 0.1 percent since the second quarter of 2015. Also in the second quarter, the shareof mortgages with payments 90 or more days past due declined 0.1 percentage point to 1.5percent. The prime delinquency rate edged down to 0.9 percent in the quarter while thesubprime delinquency rate fell 0.5 percentage point to 7.6 percent.
Housing Markets: West Virginia issued 235 new residential permits in September, up from 213permits in August and 197 permits issued in September 2015. The Charleston MSA issued themost permits in the month (27 permits), which was an increase since August and sinceSeptember 2015. Housing starts in West Virginia totaled 2,500 in September, an 11.6 percentincrease from August but a 6.3 percent decrease from last September. According toCoreLogic Information Solutions, home values in West Virginia depreciated 0.1 percent inSeptember but appreciated 7.2 percent on a year-over-year basis. At the metro-level, houseprices rose in every MSA except Parkersburg in the month and in every MSA on a year-over-year basis.
0
2
4
6
8
10
12
14
16
18
20
Less than$10,000
$10,000--$14,999
$15,000--$24,999
$25,000--$34,999
$35,000--$49,999
$50,000--$74,999
$75,000--$99,999
$100,000--$149,999
$150,000--$199,999
$200,000 ormore
PercentHousehold Income in West VirginiaShare of Total Households in 2015
• Average Household Size: 2.44 persons
• Median Household Income in 2015: $42,019• Median Household Income in 2014: $41,073• Percent Change from 2014 to 2015: 2.3%
• Mean Household Income in 2015: $56,568• Mean Household Income in 2014: $54,941• Percent Change from 2014 to 2015: 3.0%
• Poverty Rate in 2015: 17.9%
• Percent of Civilian Non-institutionalized Population with No Health Insurance Coverage in 2015: 6.0%

November 2016 FEDERAL RESERVE BANK OF RICHMOND
WEST VIRGINIALabor Market Conditions West Virginia Payroll Employment PerformancePayroll Employment (SA) Period Level (000s) MoM % Change YoY % Change Year-over-Year Percent Change through September 2016
United States - Total September 144,747.0 0.11 1.72Fifth District - Total September 14,605.5 0.24 1.95West Virginia - Total September 760.9 -0.03 0.08
Logging and Mining September 20.5 -1.44 -17.34Construction September 31.0 -1.59 -2.82Manufacturing September 46.8 0.00 -1.47Trade, Transportation, and Utilities September 134.0 -0.37 -0.67Information (NSA) September 8.9 -1.11 -3.26Financial Activities September 35.9 -0.55 -1.10Professional and Business Services September 67.2 1.36 1.05Education and Health Services September 132.7 -0.08 3.83Leisure and Hospitality September 76.7 -0.78 2.95Other Services September 54.5 -0.18 -1.27 West Virginia Total Employment PerformanceGovernment September 152.6 0.73 0.59 Year-over-Year Percent Change through September 2016
Metro Payroll Employment (NSA) Period Level (000s) YoY % Change
Beckley MSA - Total September 47.0 -1.05Charleston MSA - Total September 121.8 -0.90Huntington MSA - Total September 142.1 0.71Morgantown MSA - Total September 72.7 1.54Parkersburg MSA - Total September 41.5 -1.66
WEST VIRGINIA 2
S N A P S H O T
0.1
-17.3
-2.8
-1.5
-0.7
-3.3
-1.1
1.1
3.8
3.0
-1.3
0.6
-20 -18 -16 -14 -12 -10 -8 -6 -4 -2 0 2 4 6
West Virginia - Total
Logging and Mining
Construction
Manufacturing
Trade, Transportation, and Utilities
Information (NSA)
Financial Activities
Professional and Business Services
Education and Health Services
Leisure and Hospitality
Other Services
Government
A MONTHLY UPDATE OF THE FIFTH DISTRICT ECONOMY
-1.7
1.5
0.7
-0.9
-1.1
0.1
2.0
1.7
-2.0 -1.5 -1.0 -0.5 0.0 0.5 1.0 1.5 2.0 2.5
Parkersburg MSA
Morgantown MSA
Huntington MSA
Charleston MSA
Beckley MSA
West Virginia (SA)
Fifth District (SA)
United States (SA)
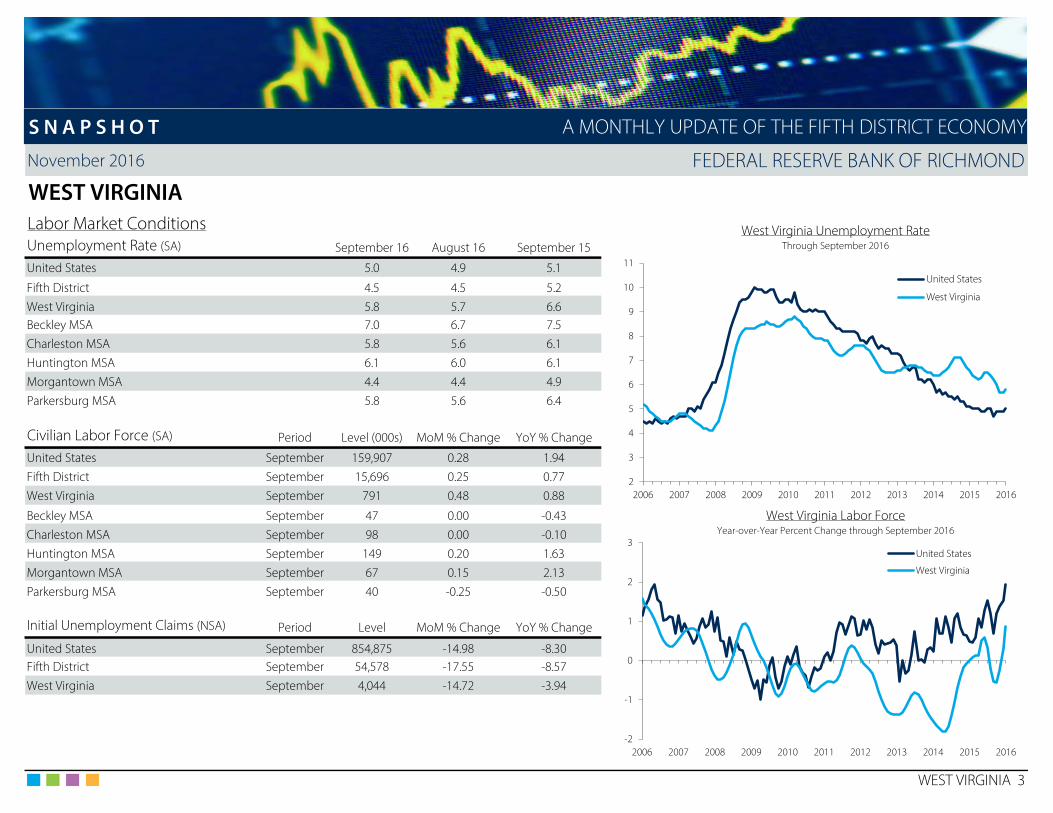
November 2016 FEDERAL RESERVE BANK OF RICHMOND
WEST VIRGINIALabor Market Conditions West Virginia Unemployment RateUnemployment Rate (SA) September 16 August 16 September 15 Through September 2016
United States 5.0 4.9 5.1
Fifth District 4.5 4.5 5.2West Virginia 5.8 5.7 6.6Beckley MSA 7.0 6.7 7.5Charleston MSA 5.8 5.6 6.1Huntington MSA 6.1 6.0 6.1Morgantown MSA 4.4 4.4 4.9Parkersburg MSA 5.8 5.6 6.4
Civilian Labor Force (SA) Period Level (000s) MoM % Change YoY % Change
United States September 159,907 0.28 1.94Fifth District September 15,696 0.25 0.77West Virginia September 791 0.48 0.88
Beckley MSA September 47 0.00 -0.43 West Virginia Labor ForceCharleston MSA September 98 0.00 -0.10 Year-over-Year Percent Change through September 2016
Huntington MSA September 149 0.20 1.63Morgantown MSA September 67 0.15 2.13Parkersburg MSA September 40 -0.25 -0.50
Initial Unemployment Claims (NSA) Period Level MoM % Change YoY % Change
United States September 854,875 -14.98 -8.30Fifth District September 54,578 -17.55 -8.57West Virginia September 4,044 -14.72 -3.94
WEST VIRGINIA 3
S N A P S H O T A MONTHLY UPDATE OF THE FIFTH DISTRICT ECONOMY
2
3
4
5
6
7
8
9
10
11
2006 2007 2008 2009 2010 2011 2012 2013 2014 2015 2016
United States
West Virginia
-2
-1
0
1
2
3
2006 2007 2008 2009 2010 2011 2012 2013 2014 2015 2016
United States
West Virginia
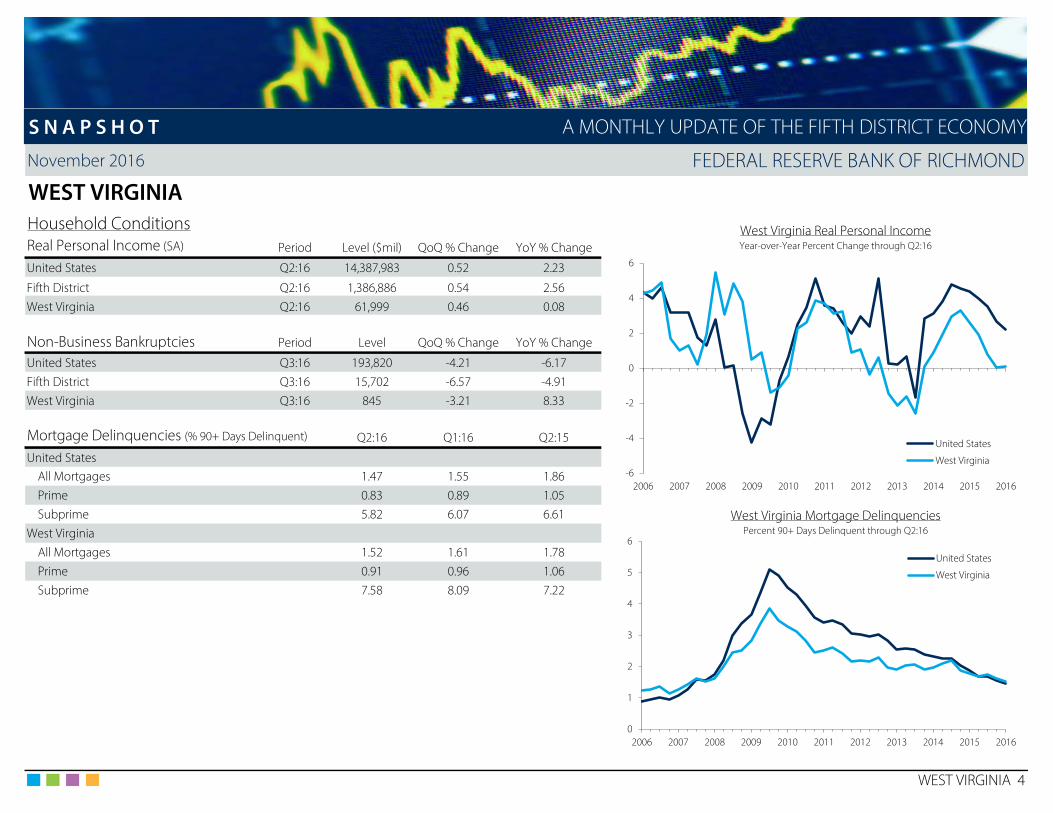
November 2016 FEDERAL RESERVE BANK OF RICHMOND
WEST VIRGINIAHousehold Conditions West Virginia Real Personal IncomeReal Personal Income (SA) Period Level ($mil) QoQ % Change YoY % Change Year-over-Year Percent Change through Q2:16
United States Q2:16 14,387,983 0.52 2.23
Fifth District Q2:16 1,386,886 0.54 2.56West Virginia Q2:16 61,999 0.46 0.08
Non-Business Bankruptcies Period Level QoQ % Change YoY % Change
United States Q3:16 193,820 -4.21 -6.17Fifth District Q3:16 15,702 -6.57 -4.91West Virginia Q3:16 845 -3.21 8.33
Mortgage Delinquencies (% 90+ Days Delinquent) Q2:16 Q1:16 Q2:15
United States All Mortgages 1.47 1.55 1.86Prime 0.83 0.89 1.05Subprime 5.82 6.07 6.61 West Virginia Mortgage Delinquencies
West Virginia Percent 90+ Days Delinquent through Q2:16
All Mortgages 1.52 1.61 1.78Prime 0.91 0.96 1.06Subprime 7.58 8.09 7.22
WEST VIRGINIA 4
S N A P S H O T A MONTHLY UPDATE OF THE FIFTH DISTRICT ECONOMY
-6
-4
-2
0
2
4
6
2006 2007 2008 2009 2010 2011 2012 2013 2014 2015 2016
United States
West Virginia
0
1
2
3
4
5
6
2006 2007 2008 2009 2010 2011 2012 2013 2014 2015 2016
United States
West Virginia
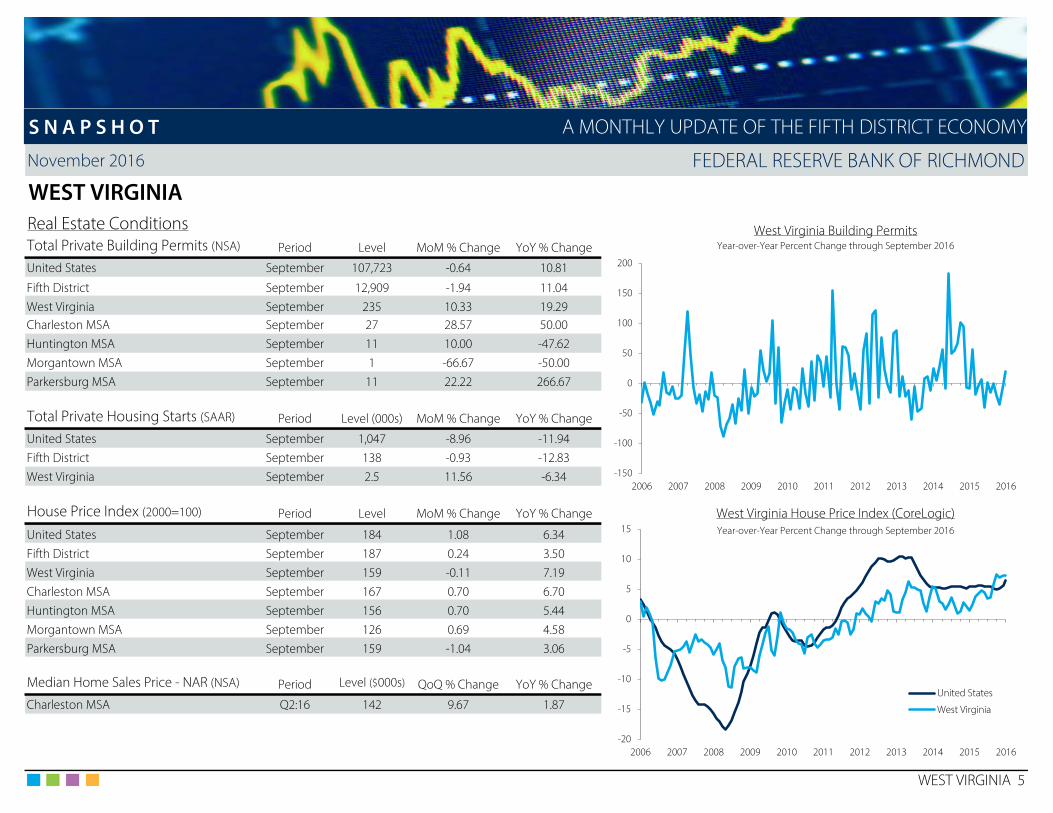
November 2016 FEDERAL RESERVE BANK OF RICHMOND
WEST VIRGINIAReal Estate Conditions West Virginia Building PermitsTotal Private Building Permits (NSA) Period Level MoM % Change YoY % Change Year-over-Year Percent Change through September 2016
United States September 107,723 -0.64 10.81
Fifth District September 12,909 -1.94 11.04West Virginia September 235 10.33 19.29Charleston MSA September 27 28.57 50.00Huntington MSA September 11 10.00 -47.62Morgantown MSA September 1 -66.67 -50.00Parkersburg MSA September 11 22.22 266.67
Total Private Housing Starts (SAAR) Period Level (000s) MoM % Change YoY % Change
United States September 1,047 -8.96 -11.94Fifth District September 138 -0.93 -12.83West Virginia September 2.5 11.56 -6.34
House Price Index (2000=100) Period Level MoM % Change YoY % Change West Virginia House Price Index (CoreLogic)
United States September 184 1.08 6.34 Year-over-Year Percent Change through September 2016
Fifth District September 187 0.24 3.50West Virginia September 159 -0.11 7.19Charleston MSA September 167 0.70 6.70Huntington MSA September 156 0.70 5.44Morgantown MSA September 126 0.69 4.58Parkersburg MSA September 159 -1.04 3.06
Median Home Sales Price - NAR (NSA) Period Level ($000s) QoQ % Change YoY % Change
Charleston MSA Q2:16 142 9.67 1.87
WEST VIRGINIA 5
S N A P S H O T A MONTHLY UPDATE OF THE FIFTH DISTRICT ECONOMY
-150
-100
-50
0
50
100
150
200
2006 2007 2008 2009 2010 2011 2012 2013 2014 2015 2016
-20
-15
-10
-5
0
5
10
15
2006 2007 2008 2009 2010 2011 2012 2013 2014 2015 2016
United States
West Virginia
November 2016 FEDERAL RESERVE BANK OF RICHMOND
SOURCES
Payroll Employment / Unemployment Median Family Income Commercial Vacancy RatesBureau of Labor Statistics National Association of Home Builders/Wells Fargo CB Richard EllisHaver Analytics Haver Analytics Haver Analyticshttp://www.bls.gov http://www.nahb.org http://www.cbre.com
Civilian Labor Force Bankruptcy Filings Median Home Sales Price - NARBureau of Labor Statistics Administrative Office of the U.S. Courts National Association of RealtorsHaver Analytics Haver Analytics Haver Analytics http://www.bls.gov http://www.uscourts.gov/library.html http://www.realtor.org
Unemployment Insurance Claims Mortgage Delinquencies Median Home Sales Price - NAHBU.S. Department of Labor Mortgage Bankers Association of America National Association of Home Builders/Wells FargoHaver Analytics Haver Analytics Haver Analyticshttp://www.dol.gov http://www.mortgagebankers.org http://www.nahb.org
District Imports / Exports Private Building Permits Housing Opportunity IndexU.S. Census Bureau U.S. Census Bureau National Association of Home Builders/Wells Fargo
Haver Analytics Haver Analytics Haver Analyticshttp://www.census.gov http://www.census.gov http://www.nahb.org
Personal Income Private Housing Starts House Price IndexBureau of Economic Analysis Bank of Tokyo-Mitsubishi CoreLogic Information SolutionsHaver Analytics Haver Analytics Federal Reserve Bank of Richmond
http://www.bea.gov http://www.bk.mufg.jp/english/index.html
SOURCES 1
S N A P S H O T A MONTHLY UPDATE OF THE FIFTH DISTRICT ECONOMY
November 2016 FEDERAL RESERVE BANK OF RICHMOND
NOTES
1 Manufacturing & Service Sector Surveys 6 House Price Index
7 Median Home Sales Price - NAR2 Manufacturing Composite Index Single family homes.
8 Median Home Sales Price - NAHBTotal Home Sales.
3 Mortgage Delinquency Rate9 Household Income
Census Bureau, 2015 American Community Surveyhttps://www.census.gov/programs-surveys/acs/
4 Building Permits & Housing Starts
5 Housing Opportunity Index
SA - Seasonally Adjusted NSA - Not Seasonally Adjusted SAAR - Seasonally Adjusted Annual Rate
SOURCES 2
Share of homes sold considered to be affordable to a family earning the area's median income.
Repeat sales index, measuring the average price changes in repeat sales on the same single family properties.
Each index equals the percentage of responding firms reporting increase minus the percentage reporting decrease. All firms surveyed are located within the Fifth Federal Reserve District.
The weighted average of the shipments (33 percent), new orders (40 percent) and employment (27 percent) indexes.
The number of mortgages 90 days past due as a percentage of the total number of mortgages at the end of the period. The delinquency rate does not include loans in the process of foreclosure.
Data on District of Columbia building permits and housing starts are often volatile, leading to disproportionately large percentage changes.
S N A P S H O T A MONTHLY UPDATE OF THE FIFTH DISTRICT ECONOMY