s m department of labor and economic opportunity … · the wioa presents an extraordinary...
TRANSCRIPT

LEO is an equal opportunity employer/program.
Auxiliary aids, services and other reasonable accommodations are available upon request to individuals with disabilities. WORKFORCE DEVELOPMENT, 201 N. WASHINGTON SQ., LANSING, MI 48913 • www.michigan.gov/wda • 517-335-5858
STATE OF MICHIGAN
GRETCHEN WHITMER GOVERNOR
DEPARTMENT OF LABOR AND ECONOMIC OPPORTUNITY LANSING
JEFF DONOFRIO DIRECTOR
December 2, 2019 Ms. Christine Quinn, Regional Administrator United States Department of Labor Employment and Training Administration John C. Kluczynski Building, 6th Floor 230 South Dearborn Street Chicago, IL 60604-1505 Dear Ms. Quinn: I am pleased to submit the State of Michigan’s Program Year 2018 Workforce Innovation and Opportunity Act Annual Report. The information contained in the report was assembled in accordance with the United States Department of Labor Training and Employment Guidance Letter 5-18, issued on November 7, 2018. If you have questions regarding the report, please contact Ms. Krista Johnson, Division Administrator, Talent Development Division of the Workforce Development, at 517-241-3249 or via email at [email protected]. Sincerely, Stephanie Beckhorn, Director Workforce Development SB:VB:ph cc: Danielle Waddell Tommy Ouyang Mike Wurmlinger Krista Johnson Chelsea Mates Matt Shields WIOA State Coordinators

Page 1
Workforce Innovation and Opportunity Act
Annual Report Program Year 2018

Page 2
EXECUTIVE SUMMARY Michigan’s priorities include key actions necessary to improve equity and access to workforce programming resulting in greater opportunities for economic mobility for our state’s citizens. The Michigan Department of Labor and Economic Opportunity-Workforce Development’s (LEO-WD’s) goal is to promote a flexible, innovative, and effective workforce system within the State of Michigan. To accomplish this, WD supports a demand-driven workforce system, assists the structurally unemployed with financial independence, advocates for the integration of workforce development into the K-12 school system, and supports the alignment of workforce development with economic development efforts. The Governor’s State Workforce Board works with the WD to meet regulatory responsibilities as prescribed by federal statute and regulation, including the development and updating of comprehensive state performance and accountability measures to assess the effectiveness of the Workforce Innovation and Opportunity Act (WIOA) core program services to job seekers, customers, and employers. This report is an assessment of performance outcomes for workforce investment activities involving six performance accountability indicators applied to adults, dislocated workers, and youth. Additionally, this report narrative describes progress toward meeting Michigan’s strategic vision and goals.
SERVICE DELIVERY The Michigan Works! System was the first unified workforce development system in the United States and is an integral partner in developing Michigan’s economic future. The system is demand-driven, locally responsive, and ready to meet the needs of each community. Every year, the Michigan Works! System serves nearly four million customers. The WIOA Title I Adult, Dislocated Worker, and Youth funds and Title III Wagner-Peyser funds are an integral part of that impact. The WIOA funding is annually allocated by formula to Michigan’s 16 local Michigan Works! Agencies (MWAs). The MWAs must submit annual plans to the WD for approval. The WIOA programs are designed to strengthen and improve our state and nation’s public workforce system. The WIOA presents an extraordinary opportunity to improve job and career options for our state’s workers and job seekers through an integrated, job-driven public workforce system that links diverse talent to businesses through continuous improvement supported through evaluation, accountability, identification of best practices, and data-driven decision-making. Services Eligibility for WIOA programming is determined based on standards set forth in Part 680 of the 20 Code of Federal Regulations (CFR) for adults and dislocated workers and Part 681 for youth. Program services are provided through the state’s American Job Centers. Services available under WIOA for adults and dislocated workers include:
• Basic career services are available to anyone who comes in to the One-Stop center. Services include, but are not limited to general and program information, outreach, intake and orientation, basic assessments, and information and meaningful assistance in filing for unemployment compensation.
• Individualized career services include, but are not limited to comprehensive and specialized assessments, development of an individual employment plan, individualized or group counseling, career planning/case management, and short-term pre-vocational services.
• Training services for those who qualify include work-based training or occupational training activities. For occupational training activities, participants use an “individual training account” to select an appropriate training program from a qualified training provider.
• Business services include, but are not limited to activities provided to WIOA participants, such as screening and referrals of qualified participants to job openings employers may have, and activities provided to employers such as the development, convening, or implementation of industry sector partnerships, and working with training providers and businesses to develop in-demand training programs to address employer needs.
Page 3
Services available to WIOA Youth include: tutoring; alternative secondary school offerings; paid or unpaid work experiences including internships and job shadowing; occupational skills training; education offered concurrently with and in the same context as workforce preparation activities; leadership development opportunities; supportive services; adult mentoring; follow-up services; comprehensive guidance and counseling; financial literacy education; entrepreneurial skills training; labor market information services such as career awareness, career counseling, and career exploration services; and activities that help youth prepare for and transition to post-secondary education and training. Benchmarks Success in accomplishing the purposes of the WIOA at the State, local, and regional levels will be assessed by whether:
• One-Stop centers are recognized as valuable community resources and are known for high-quality, comprehensive services for customers;
• The core programs and One-Stop centers provide seamless integrated customer service; • Program performance, labor market information, and related data drive policy and strategic decisions
and inform customer choice; • Youth programs reconnect out-of-school youth to education and jobs; • Job seekers access quality career services either online or in a One-Stop center; • One-Stop centers facilitate access to high-quality, innovative education and training; and • Services to businesses are robust and effective, meeting business’ workforce needs across the
business lifecycle. These benchmarks, as measured by the WIOA performance measures, serve as indicators to track progress toward meeting the federal and State goals and vision for the workforce system. The performance accountability system is used by the State to assess the effectiveness of the State and local areas in achieving continuous improvement of workforce investment activities to optimize the return on investment of WIOA funds. Additional related strategic goals in alignment with Governor Gretchen Whitmer’s priorities and the State’s WIOA Unified Plan include:
• The implementation of evidence-based programs and strategies; • Progress toward closing the economic inequity gap; • Meeting Governor Whitmer's statewide post-secondary education goal of 60 percent
of Michigan residents completing a post-secondary certificate or degree by the year 2030; • Placing more of Michigan’s citizens on the path to high-wage skills; and • Increased college readiness.
Target Populations The WIOA prioritizes special populations, focusing on serving individuals with barriers to success in the labor market as defined in WIOA Section 3(24), and seeks to ensure access to quality services for these populations. For example, priority for adults receiving career and training services must be given to veterans, public assistance recipients, other low-income individuals, and individuals who are basic skills deficient. Program Year (PY) 2018 Quarter 3 data showed 84.4 percent of all adult priority group participants were receiving individualized career or training services with the highest represented priority group being those who are low-income at 80.2 percent. Key Partnerships Strong partnerships help to leverage Michigan’s WIOA resources and increase opportunities for job seekers and businesses. They have enhanced the ability of our local workforce investment areas to access information and data, improved services, and increased efficiencies with regard to recruitment processes, referrals, and case management. Strong partnerships are critical to providing the most effective, targeted, and appropriate services for youth to maintain progress along a successful career pathway. Key partnerships of note in Michigan include those with:

Page 4
• Title II Adult Education Partners: Michigan has a robust, integrated employment and training model to leverage Title I and II resources and funding. Further, co-enrollment of Title II participants is strongly encouraged across all Title I and III programs.
• Michigan’s Department of Education (MDE): Michigan’s Title I staff has partnered with MDE’s Career and Technical Education staff to establish a Career Readiness Initiative workgroup. This group focuses on a wide range of topics such as high-quality credentialing, school to work transitions, and seamless connection to workforce services.
• Title IV Partners: Michigan’s Title I staff is actively engaged in the Employment First State Leadership Mentoring Program with a goal to increase competitive integrated employment for individuals with disabilities. Current activities include establishing a common space for business community resources to highlight additional available assistance and streamline the process for the business community to find the resources they want and need to better recruit, employ, and retain individuals with disabilities.
GOVERNOR’S RESERVE FUNDED ACTIVITIES During PY 2018, Michigan provided Governor’s Reserve funding to support five significant projects. Apprenticeship Readiness Training With many high-profile projects coming to the City of Detroit, including the construction of the Gordie Howe International Bridge, the WD and the Michigan Department of Transportation are committed to working in partnership with the City, the MWA (Detroit Employment Solutions Corporation [DESC]), educators, and labor organizations to fill the need for skilled and general labor through an apprenticeship readiness training program; and in the process, assist Detroit residents – especially those who face significant barriers – with access to long term employment. Services will be provided to approximately 1,000 participants. Funds are supporting:
• Occupational, classroom and/or work-based learning, including apprenticeships; • Job readiness (soft/employability skills) training; • Basic skills (literacy/numeracy) training; • Wrap-around support services; and • Job placement assistance.
Amazon Expansion Amazon, the world’s largest retailer, announced that they would be opening three major fulfillment centers in Southeast Michigan over 18 months to employ over 4,000 workers. In agreement with the WD, the Southeast Michigan Community Alliance (SEMCA) Michigan Works! was designated as the single point of contact for Amazon talent development assistance. Funds supported:
• The development/implementation of Amazon application assistance events; • Increased staff time related to planning and coverage for all Amazon on-site hiring events, including at
venues outside of Michigan Works! Service Centers; • The coordination of training for Michigan Works! Service Center staff spread across Southeast
Michigan; • Extended service hours for hiring and application assistance events; and • Ongoing assistance for the project as each fulfillment center prepared to open.
Amazon Application Assistance Events (AAAE) provided hands-on, face-to-face support to those who needed assistance with the fully computerized process. Technology resources and assistance were provided to allow applicants to successfully apply for positions and complete the screening process. The AAAEs were coordinated through partnerships with local service centers in southeast Michigan. In 2017, the AAAE events generated nearly 750 applicants. In PY 2018, 33 AAAEs were held, which generated over 700 applications.

Page 5
FastStart Just-in-Time Training The FastStart Just-in-Time Training (“FastStart”) was created in 2008 via a partnership with Great Lakes Bay Michigan Works! and Delta College to meet local hiring demand for Chemical Process Operators. Since then, FastStart has expanded to include training for other occupations, including solar manufacturing, battery manufacturing, advanced manufacturing, business and customer service, diesel technicians, and emergency medical technicians. Funding has been awarded to Great Lakes Bay Michigan Works! to further expand the program. The MWA meets with employers in a specific industry to determine unmet hiring need and then strategizes on potential training partners. The MWA then brings in the selected training partner(s) to establish the training and to assure the training is listed on Michigan Training Connect (MiTC), Michigan’s Eligible Training Provider List, as an eligible training provider. Generally, employment rates are around 90 percent for individuals participating in FastStart training, as employers are involved in identifying their hiring needs, the timing of the training, training curriculum, and entry/exit requirements. Fiat Chrysler Automobiles The WD has established grants with DESC and the SEMCA for the purpose of supporting Fiat Chrysler Automobiles (FCA) in identifying, preparing, and hiring Detroit residents to fill new positions at the Jefferson North Assembly Plant and the Mack Avenue Engine Plant. As a result of the expansion of the Jefferson North Assembly Plant and the Mack Avenue Engine Plant, FCA will be hiring more than 5,000 new employees in Detroit. DESC, the City of Detroit, and the State of Michigan are committed to supporting FCA in identifying, preparing, and hiring Detroit residents and applicants surrounding Detroit to fill these new positions. The DESC will develop and implement a comprehensive plan for marketing, outreach, preparation, and screening to assist Detroit residents in obtaining employment with FCA. Detroiters had priority access to jobs for a four-week period in late summer/early Fall of 2019. The SEMCA has been designated as the single point of contact for recruitment outside of the City of Detroit for the skilled trades and salaried workforce needed to launch and sustain FCA’s new plant. Due to the high demand for workers with credentials, FCA anticipates that recruitment for these positions will likely require a timeframe extending well into 2020 to reach full capacity. The targeted nature of the recruitment, the technical expertise required, as well as the scale and intensity of the project will require a significant amount of staff time and resources. Integrated Education and Training The WD has allocated funding to support Integrated Education and Training (IET) programs that have already been developed by adult education providers and/or that will be developed jointly by our local MWAs and adult education providers. The intent of IET programming in Michigan is for WIOA Title II adult education providers to partner with a local MWA and/or an existing training provider to co-enroll participants in WIOA Title I and Title II services, when appropriate. The IET program must be part of a regionally or locally defined career pathway. The IET program must include three required components – (1) adult education and literacy activities, (2) workforce preparation activities, and (3) occupational training. The three required components must occur simultaneously within the overall scope of the IET program and must each be of sufficient intensity and quality.
WIOA WAIVERS On January 2, 2018, the following waivers were approved through June 30, 2020 by the United States Department of Labor (USDOL). WIOA Youth Program On January 2, 2018, Michigan was approved for a waiver for the following:
• A waiver of the requirement to expend 75 percent of WIOA Title I Youth State formula funding on the Out-of-School Youth population.
• A waiver of the requirement that local WIOA Title I Youth funding must meet the 75 percent minimum expenditure requirement.

Page 6
• A waiver of the requirement to expend 75 percent of WIOA Title I Statewide Activities funding on the out-of-school population.
Michigan was approved to lower the Out-of-School Youth expenditure minimum percentage to 50 percent for state and local reporting, as well as for the use of Statewide Activities funding to provide direct services to youth. The waiver allows local One-Stop centers to focus additional funding on proactive services to targeted, at-risk in-school youth, such as dropout prevention. Each of Michigan’s local areas is meeting or exceeding a minimum of 50 percent for Appropriation Year 2018 in compliance with the waiver. The implementation of these waivers has not negatively impacted state or local area performance outcomes, as evidenced in the table below comparing PY 2018 data.
The State tracks these expenditures quarterly and annually in the Management of Awards to Recipients System (MARS). Should any area be identified as at-risk following a quarterly review, technical assistance is available and immediately provided. Contracts were already in place based on the 75 percent out-of-school minimum when the waiver was granted. Changes to program planning and contracts take time to implement, so the effects of the waiver will also take time to evaluate.
Eligible Training Provider List On January 2, 2018, Michigan was approved for a waiver of the obligation of eligible training providers to collect performance data on all students in a training program at WIOA Section 116(d)(4)(A) and 122, and 20 CFR 677.230(4) and (5). The waiver allowed the State time to implement reporting requirements for all students via automatic matches with other data sources (not just WIOA participants), while removing the burden on training providers. Following receipt of the waiver, Training and Employment Guidance Letter (TEGL) 3-18, issued on August 31, 2018, stipulated that second and fourth quarter performance outcomes are not required retroactively, and will not be expected for the Annual Quarterly Reports in October 2020 and 2021 respectively (thereby invalidating the waiver). As of October 12, 2018, MiTC (Michigan’s Eligible Training Provider List) has implemented collection of all required data elements. System integration between Michigan’s One-Stop Management Information System (OSMIS) and MiTC has been created to provide to the OSMIS the provider and program information needed to aid the One-Stop centers in assigning approved training activities and to provide performance data needed to create the Employment and Training Administration (ETA) 9171 reports required each year, effective October 1, 2019. While performance information on eligible training providers is not required for PY 2018 because of the waiver, system integration will ensure that accurate and reliable performance data is being obtained. Michigan developed a secure submission process for proprietary schools and other training providers that do not submit program data to the Center for Educational Performance and Information (CEPI) to provide student identifying information and data necessary for WD to match with Michigan wage records and calculate wage outcome

Page 7
information as required for WIOA 9171 performance reporting. The first wage outcome information, Second Quarter after Exit, will be expected in the Annual Report due October 1, 2020. Training providers will need to submit student data from the July 1, 2018 – June 30, 2019 exit timeframe to MiTC by June 30, 2020, to allow calculations to be provided on their behalf. Providers and programs entered after August 13, 2019, have been notified that this data will need to be submitted and will replace self-reporting for all exiting students in the future to provide consistency and accuracy amongst training programs.
PROGRAM OUTCOMES SUMMARY Michigan exceeded all 14 negotiated performance measures for PY 2018. The following charts show Michigan’s WIOA Title I and Title III actual performance results for PY 2017 and PY 2018, with the exception of the first chart which only shows PY 2018 results. The percentages shown are calculated by dividing the actual performance rate by the target performance rate for each measure. The Measurable Skill Gains indicator is a baseline indicator and target performance rates were not established for PY 2018. The actual performance rate is displayed for the Measurable Skill Gains indicator. A description of each performance measure and analysis of Michigan’s results are included.
Statewide Adult Dislocated Worker Youth Wagner-
Peyser Average Indicator
Score Employment 2nd Quarter After Exit 104.0% 104.1% 114.6% 105.7% 107.1%
Employment 4th Quarter After Exit 108.1% 108.5% 111.4% 101.9% 107.5%
Median Earnings 2nd Quarter After Exit 98.6% 105.2% 118.5% 107.5%
Credential Attainment Rate 113.9% 109.4% 124.7% 116.0%
Measurable Skill Gains 42.3% 44.2% 28.2% 38.2%
Average Program Score 106.1% 106.8% 116.9% 108.7% 109.6%
Michigan has implemented several tools and reports in its OSMIS that are used by State and Michigan Works! Agency staff to better serve our participants and attain the State’s performance goals.
9169 and 9173 Reports The 9169 and 9173 performance reports are available in the OSMIS. These reports were created to mirror the federal reports generated from the Participant Individual Record Layout (PIRL) file in the Workforce Integrated Performance System (WIPS). Both these reports can be run as on-demand or quarterly reports. The on-demand reports use live data as of the previous night. The quarterly reports use the quarterly PIRL file that was submitted to the USDOL. Both of these reports provide the State of Michigan and the MWAs with a comprehensive look at Michigan’s WIOA performance. Drill down functionality in the reports leads users to the participant records included in each measure. Both the 9169 and 9173 can also be run as negative performance reports. These reports keep the exact format as the original 9169 and 9173 but instead of displaying the counts for those that met the measure, they display those that did not meet. This allows case managers to pinpoint the participants that need additional assistance or follow up to meet their goals. ETA Performance Matrix Score The Performance Matrix report is a summary report that shows by WIOA program (Adult, Dislocated Worker, Youth and Wagner-Peyser) and Performance Measure (Employment Second and Fourth Quarter, Median Earnings, Credential Rate and Measurable Skill Gains) the Negotiated Performance Target Percentage, the Actual Real-Time Performance Percentage, and an overall Matrix Score. The

Page 8
report is color coded, so at a glance, MWAs and State staff can gauge how well the public is being served, target areas for improvement, and better manage the success of the programs. This report can be run for the whole State of Michigan or by an individual MWA. ETA Performance Standard Report The ETA Performance Standard Report displays each MWA and the count of those in each performance measure, those that met the performance measure and percentage for the measure. The real-time report is color coded, so at a glance, the MWAs and the State can see the measures that are met and areas for improvement.
Employment Rate Second Quarter After Exit The Employment Rate Second Quarter after Exit is defined as the percentage of participants who are in unsubsidized employment during the second quarter after exit from the program. For WIOA Title I Youth, the indicator is the percentage of participants in education or training activities, or in unsubsidized employment during the second quarter after exit. The line graph below indicates Michigan’s negotiated rate for Employment Second Quarter After Exit for each of the WIOA Title I and III programs. The bar graphs indicate Michigan’s actual performance. Michigan exceeded each of the negotiated rates – WIOA Adult by 4 percent, WIOA Dislocated Worker by 3 percent, WIOA Youth by 11 percent, and Wagner-Peyser by 4 percent.
Employment Rate Fourth Quarter After Exit The Employment Rate Fourth Quarter After Exit is defined as the percentage of participants who are in unsubsidized employment during the fourth quarter after exit from the program. For WIOA Title I Youth, the indicator is the percentage of participants in education or training activities, or in unsubsidized employment during the fourth quarter after exit. The line graph below indicates Michigan’s negotiated rate for Employment Fourth Quarter After Exit for each of the WIOA Title I and III programs. The bar graphs indicate Michigan’s actual performance. Michigan exceeded each of the negotiated rates – WIOA Adult by six percent, WIOA Dislocated Worker by seven percent, WIOA Youth by eight percent, and Wagner-Peyser by one percent. For PY 2017, only two quarters of exiters are included in the Fourth Quarter After Exit Employment Rate Measure.
0%
20%
40%
60%
80%
100%
PY17Adult
PY18Adult
PY17DW
PY18DW
PY17Youth
PY18Youth
PY17W/P
PY18W/P
Employment Rate - Second Quarter After ExitActual vs Negotiated Rates
PY17 Actual PY18 Actual Negotiated

Page 9
Median Earnings Median Earnings is the value of wages reported in the second quarter after the exit quarter that is the mid-point between the value of the lowest wage and the value of the highest wage. The Median Earnings performance measure was a baseline measure for the WIOA Youth program for PYs 2017 and 2018 and no target was set. The line graphs below indicate Michigan’s negotiated rate for Median Earnings Second Quarter After Exit for each of the WIOA Title I and III programs. The bar graphs indicate Michigan’s actual performance. Michigan exceeded the negotiated rates for the WIOA Dislocated Worker program by $403 and the Wagner-Peyser program by $1,009. Median Earnings for the WIOA Adult program were $92 below the target rate established for PY 2018. Median Earnings is a baseline indicator of performance for WIOA Youth and no target was set for PY 2017 or PY 2018.
Credential Attainment Rate The Credential Attainment Rate is the percentage of those participants enrolled in an education or training program (excluding those in On-the-Job Training [OJT] and customized training) who attain a recognized post-secondary credential or a secondary school diploma, or its recognized equivalent, during participation in or within four quarters after exit from the program. A participant who has attained a secondary school diploma or its recognized equivalent is included in the percentage of participants who have attained a secondary school diploma or its recognized equivalent only if the participant also is employed within four quarters after exit or is enrolled in an education or training program leading to a recognized post-secondary credential within 365 days of exit from the program.
0%
20%
40%
60%
80%
100%
PY17Adult
PY18Adult
PY17DW
PY18DW
PY17Youth
PY18Youth
PY17W/P
PY18W/P
Employment Rate - Fourth Quarter After ExitActual vs Negotiated Rates
PY17 Actual PY18 Actual Negotiated
$- $1,000 $2,000 $3,000 $4,000 $5,000 $6,000 $7,000 $8,000 $9,000
PY17Adult
PY18Adult
PY17DW
PY18DW
PY17Youth
PY18Youth
PY17W/P
PY18W/P
Median EarningsActual vs Negotiated Earnings
PY17 Actual PY18 Actual Negotiated
Page 10
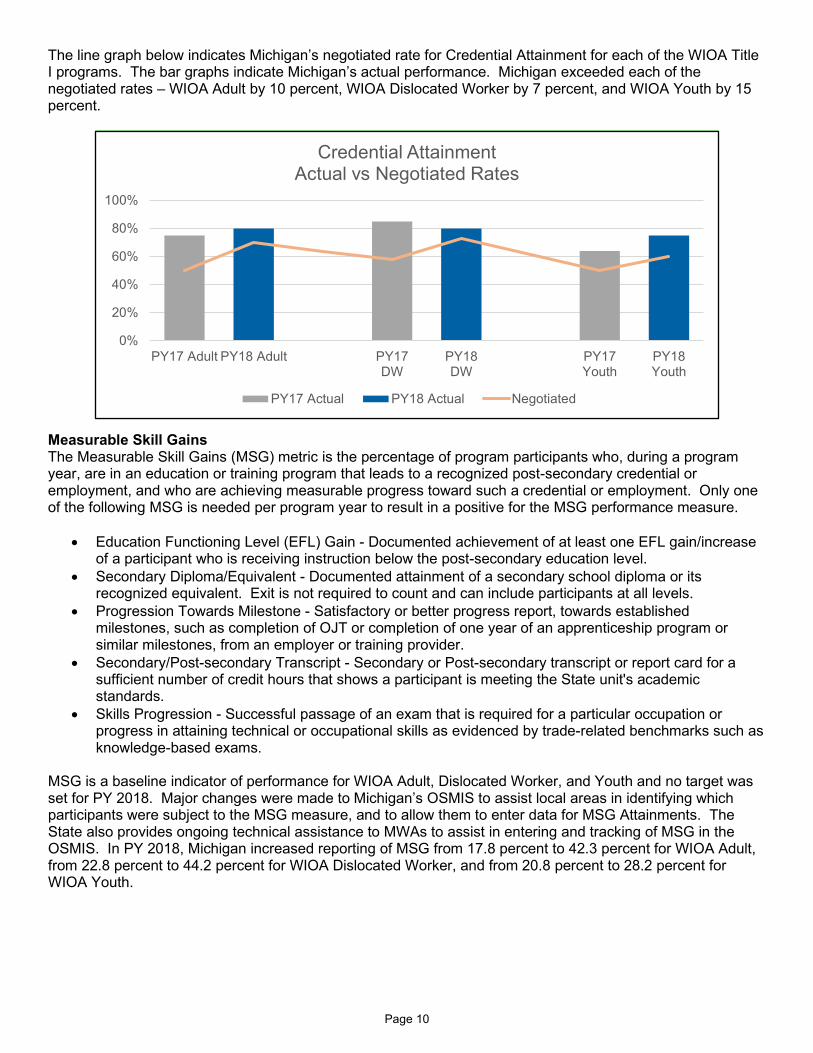
The line graph below indicates Michigan’s negotiated rate for Credential Attainment for each of the WIOA Title I programs. The bar graphs indicate Michigan’s actual performance. Michigan exceeded each of the negotiated rates – WIOA Adult by 10 percent, WIOA Dislocated Worker by 7 percent, and WIOA Youth by 15 percent.
Measurable Skill Gains The Measurable Skill Gains (MSG) metric is the percentage of program participants who, during a program year, are in an education or training program that leads to a recognized post-secondary credential or employment, and who are achieving measurable progress toward such a credential or employment. Only one of the following MSG is needed per program year to result in a positive for the MSG performance measure.
• Education Functioning Level (EFL) Gain - Documented achievement of at least one EFL gain/increase of a participant who is receiving instruction below the post-secondary education level.
• Secondary Diploma/Equivalent - Documented attainment of a secondary school diploma or its recognized equivalent. Exit is not required to count and can include participants at all levels.
• Progression Towards Milestone - Satisfactory or better progress report, towards established milestones, such as completion of OJT or completion of one year of an apprenticeship program or similar milestones, from an employer or training provider.
• Secondary/Post-secondary Transcript - Secondary or Post-secondary transcript or report card for a sufficient number of credit hours that shows a participant is meeting the State unit's academic standards.
• Skills Progression - Successful passage of an exam that is required for a particular occupation or progress in attaining technical or occupational skills as evidenced by trade-related benchmarks such as knowledge-based exams.
MSG is a baseline indicator of performance for WIOA Adult, Dislocated Worker, and Youth and no target was set for PY 2018. Major changes were made to Michigan’s OSMIS to assist local areas in identifying which participants were subject to the MSG measure, and to allow them to enter data for MSG Attainments. The State also provides ongoing technical assistance to MWAs to assist in entering and tracking of MSG in the OSMIS. In PY 2018, Michigan increased reporting of MSG from 17.8 percent to 42.3 percent for WIOA Adult, from 22.8 percent to 44.2 percent for WIOA Dislocated Worker, and from 20.8 percent to 28.2 percent for WIOA Youth.
0%
20%
40%
60%
80%
100%
PY17 Adult PY18 Adult PY17DW
PY18DW
PY17Youth
PY18Youth
Credential AttainmentActual vs Negotiated Rates
PY17 Actual PY18 Actual Negotiated

Page 11
In PY 2018, Michigan made enhancements to the MSG Module in the OSMIS. The module displays a detailed history of a participant’s MSG information. At a glance, OSMIS users can determine what years a participant was in the measure, if they met and the negotiated status of each of the measures. Links in the module lead users to the OSMIS screen where they can update participant data. This module allows case managers to easily monitor the skill gain progress of a participant and has helped lead to improved MSG performance compared to PY 2017.
PROGRAM YEAR 2018 COST EFFECTIVENESS ANALYSIS Cost effectiveness analysis calculates the impact a program achieves relative to the cost incurred, or conversely the cost required to achieve a given impact. The value of cost effectiveness analysis is twofold: first, its ability to summarize a program in terms of an illustrative ratio of effects to costs, and second, the ability to use this common measure to compare multiple programs evaluated in different contexts and in different years. Cost effectiveness analysis is useful and informative as it maximizes the comparability of elements within different programs without straying from a correct and complete representation of the costs and effectiveness of each program as it was evaluated. Michigan has used three methods to measure the cost effectiveness of its workforce programs – Return on Investment, Cost per Dollar Earned, and Cost by Category of Service. Return on Investment The Return on Investment (ROI) is calculated by dividing the return, or gain, by the investment, or expenditures. The gain is calculated by subtracting the expenditures from the wages earned by program exiters. (ROI = (Wages Earned – Expenditures) / Expenditures). This ratio will tell the amount of wages gained per dollar invested, thus revealing the efficiency of the investment. ROI is most useful when comparing current performance to past performance, as opposed to comparing programs. It can be used to determine trends of increasing or decreasing efficiency.
0%
20%
40%
60%
80%
100%
PY17 Adult PY18 Adult PY17DW
PY18DW
PY17Youth
PY18Youth
Measurable Skill Gains Attainment
PY17 Actual PY18 Actual

Page 12
From PY 2017 to PY 2018, the WIOA Title I programs saw significant gains in their ROI. This is primarily due to the continued transition from the Workforce Investment Act to the WIOA. The PY 2017 Annual Report only contained Fourth Quarter After Exit Employment outcomes for six months worth of exiters (July 1, 2016 – December 31, 2016). The PY 2018 annual report is the first to include a full year of exiters for all measures. This means that additional wage record data was available for participants included in the PY 2018 report, resulting in higher wages earned by exiters in the ROI calculation.
ROI analysis serves to identify trends in efficiency. As demonstrated in the charts above, the volume of participants in a program has a significant impact on the ROI. For example, the Title I WIOA Adult program had 5,098 exiters in PY 2018 compared to 1,466 exiters from the Title I WIOA Dislocated Worker program. This means that 3,632 more participants have the potential to contribute to the “Wages Earned by Exiters” for WIOA Adult than WIOA Dislocated Worker. This contributes to a higher ROI for the WIOA Adult program compared to the WIOA Dislocated Worker program. Cost Effectiveness by Program and Performance Measure The following table displays the cost effectiveness by program and performance measure for the WIOA Adult, Dislocated Worker, and Youth programs. This analysis demonstrates the cost per participant, exiter, or
$-
$2.00
$4.00
$6.00
$8.00
$10.00
$12.00
$14.00
$- $50,000,000
$100,000,000 $150,000,000 $200,000,000 $250,000,000 $300,000,000 $350,000,000 $400,000,000
PY17Adult
PY18Adult
PY17DW
PY18DW
PY17Youth
PY18Youth
Title I Return on Investment
Expenditures Gain Return on Investment
PY17W/P
PY18W/P
Wages Earned by ReportableIndividuals $2,247,655,170 $3,704,954,134
Wages Earned by Participants $3,615,973,545 $4,365,004,347ROI for Participants $363.01 $344.56ROI for All Exiters $589.28 $637.88
$- $100.00 $200.00 $300.00 $400.00 $500.00 $600.00 $700.00
$- $1,000,000,000 $2,000,000,000 $3,000,000,000 $4,000,000,000 $5,000,000,000 $6,000,000,000 $7,000,000,000 $8,000,000,000 $9,000,000,000
Title III Return on Investment

Page 13
positive outcome if all program expenditures were applied to that single data element. This is not a true “Cost Per” analysis since all program expenditures are not dedicated to that single data element; however, it utilizes a consistent calculation methodology to allow for comparison across programs. The cost effectiveness by program and performance measure allows us to analyze the volume of positive outcomes in comparison to the funds expended, while the WIOA Performance Measures track the percentage of positive outcomes in comparison to the population receiving services.
In PY 2017 and PY 2018, many of the “Cost Per” calculations are inflated. This can be attributed to several factors, including the availability of wage data for PY 2017, enhancements to the state’s data collection system, and process changes related to the new MSG indicator. The graph below illustrates each of the “Cost Per” calculations stacked together by program. Over time, we expect to see these graphs level out similar to the Cost Per Exiter (orange) sections as local MWAs continue to improve reporting under the WIOA.
Cost per Credential Rate (CCR) $20,332.32
Cost per Measurable Skill Gain (CMSG) $23,305.55
Cost per Employed in 2nd Quarter After Exit (CQ2)
$11,103.23
Cost per Employed in 4th Quarter After Exit (CQ4)
$10,881.63
Cost per Youth Participant Served (CP) $3,632.94
Cost per Exiter (CE) $10,586.94
Cost per Measurable Skill Gain (CMSG) $26,548.03
Ratio Calculation PY 2018 Result
Cost per Employed in 4th Quarter After Exit (CQ4)
$7,977.88
Cost per Credential Rate (CCR) $19,451.03
Cost per Exiter (CE) $10,720.62
Cost per Employed in 2nd Quarter After Exit (CQ2)
$8,440.62
Ratio Calculation PY 2018 Result
Cost per Dislocated Worker Participant Served (CP)
$5,320.39
Cost per Credential Rate (CCR) $10,944.76
Cost per Measurable Skill Gain (CMSG) $10,406.15
Cost per Employed in 2nd Quarter After Exit (CQ2)
$4,744.33
Cost per Employed in 4th Quarter After Exit (CQ4)
$5,281.25
Cost per Adult Participant Served (CP) $2,215.11
Cost per Exiter (CE) $5,309.22
Program Cost Analysis
Ratio Calculation PY 2018 Result
𝑃𝑟𝑜𝑔𝑟𝑎𝑚 𝐸𝑥𝑝𝑒𝑛𝑑𝑖𝑡𝑢𝑟𝑒𝑠𝑃𝑎𝑟𝑡𝑖𝑐𝑖𝑝𝑎𝑛𝑡𝑠 𝑆𝑒𝑟𝑣𝑒𝑑
𝑃𝑟𝑜𝑔𝑟𝑎𝑚 𝐸𝑥𝑝𝑒𝑛𝑑𝑖𝑡𝑢𝑟𝑒𝑠𝑇𝑜𝑡𝑎𝑙 𝑃𝑟𝑜𝑔𝑟𝑎𝑚 𝐸𝑥𝑖𝑡𝑒𝑟𝑠𝑃𝑟𝑜𝑔𝑟𝑎𝑚 𝐸𝑥𝑝𝑒𝑛𝑑𝑖𝑡𝑢𝑟𝑒𝑠
2𝑛𝑑 𝑄𝑢𝑎𝑟𝑡𝑒𝑟 𝐴𝑓𝑡𝑒𝑟 𝐸𝑥𝑖𝑡 𝐸𝑚𝑝𝑙𝑜𝑦𝑚𝑒𝑛𝑡𝑃𝑟𝑜𝑔𝑟𝑎𝑚 𝐸𝑥𝑝𝑒𝑛𝑑𝑖𝑡𝑢𝑟𝑒𝑠
4𝑡ℎ 𝑄𝑢𝑎𝑟𝑡𝑒𝑟 𝐴𝑓𝑡𝑒𝑟 𝐸𝑥𝑖𝑡 𝐸𝑚𝑝𝑙𝑜𝑦𝑚𝑒𝑛𝑡𝑃𝑟𝑜𝑔𝑟𝑎𝑚 𝐸𝑥𝑝𝑒𝑛𝑑𝑖𝑡𝑢𝑟𝑒𝑠
𝐶𝑟𝑒𝑑𝑒𝑛𝑡𝑖𝑎𝑙 𝑅𝑎𝑡𝑒𝑃𝑟𝑜𝑔𝑟𝑎𝑚 𝐸𝑥𝑝𝑒𝑛𝑑𝑖𝑡𝑢𝑟𝑒𝑠𝑀𝑒𝑎𝑠𝑢𝑟𝑎𝑏𝑙𝑒 𝑆𝑘𝑖𝑙𝑙 𝐺𝑎𝑖𝑛𝑠
𝑃𝑟𝑜𝑔𝑟𝑎𝑚 𝐸𝑥𝑝𝑒𝑛𝑑𝑖𝑡𝑢𝑟𝑒𝑠𝑃𝑎𝑟𝑡𝑖𝑐𝑖𝑝𝑎𝑛𝑡𝑠 𝑆𝑒𝑟𝑣𝑒𝑑
𝑃𝑟𝑜𝑔𝑟𝑎𝑚 𝐸𝑥𝑝𝑒𝑛𝑑𝑖𝑡𝑢𝑟𝑒𝑠𝑇𝑜𝑡𝑎𝑙 𝑃𝑟𝑜𝑔𝑟𝑎𝑚 𝐸𝑥𝑖𝑡𝑒𝑟𝑠𝑃𝑟𝑜𝑔𝑟𝑎𝑚 𝐸𝑥𝑝𝑒𝑛𝑑𝑖𝑡𝑢𝑟𝑒𝑠
2𝑛𝑑 𝑄𝑢𝑎𝑟𝑡𝑒𝑟 𝐴𝑓𝑡𝑒𝑟 𝐸𝑥𝑖𝑡 𝐸𝑚𝑝𝑙𝑜𝑦𝑚𝑒𝑛𝑡𝑃𝑟𝑜𝑔𝑟𝑎𝑚 𝐸𝑥𝑝𝑒𝑛𝑑𝑖𝑡𝑢𝑟𝑒𝑠
4𝑡ℎ 𝑄𝑢𝑎𝑟𝑡𝑒𝑟 𝐴𝑓𝑡𝑒𝑟 𝐸𝑥𝑖𝑡 𝐸𝑚𝑝𝑙𝑜𝑦𝑚𝑒𝑛𝑡𝑃𝑟𝑜𝑔𝑟𝑎𝑚 𝐸𝑥𝑝𝑒𝑛𝑑𝑖𝑡𝑢𝑟𝑒𝑠
𝐶𝑟𝑒𝑑𝑒𝑛𝑡𝑖𝑎𝑙 𝑅𝑎𝑡𝑒𝑃𝑟𝑜𝑔𝑟𝑎𝑚 𝐸𝑥𝑝𝑒𝑛𝑑𝑖𝑡𝑢𝑟𝑒𝑠𝑀𝑒𝑎𝑠𝑢𝑟𝑎𝑏𝑙𝑒 𝑆𝑘𝑖𝑙𝑙 𝐺𝑎𝑖𝑛𝑠
𝑃𝑟𝑜𝑔𝑟𝑎𝑚 𝐸𝑥𝑝𝑒𝑛𝑑𝑖𝑡𝑢𝑟𝑒𝑠𝑃𝑎𝑟𝑡𝑖𝑐𝑖𝑝𝑎𝑛𝑡𝑠 𝑆𝑒𝑟𝑣𝑒𝑑
𝑃𝑟𝑜𝑔𝑟𝑎𝑚 𝐸𝑥𝑝𝑒𝑛𝑑𝑖𝑡𝑢𝑟𝑒𝑠𝑇𝑜𝑡𝑎𝑙 𝑃𝑟𝑜𝑔𝑟𝑎𝑚 𝐸𝑥𝑖𝑡𝑒𝑟𝑠𝑃𝑟𝑜𝑔𝑟𝑎𝑚 𝐸𝑥𝑝𝑒𝑛𝑑𝑖𝑡𝑢𝑟𝑒𝑠
2𝑛𝑑 𝑄𝑢𝑎𝑟𝑡𝑒𝑟 𝐴𝑓𝑡𝑒𝑟 𝐸𝑥𝑖𝑡 𝐸𝑚𝑝𝑙𝑜𝑦𝑚𝑒𝑛𝑡𝑃𝑟𝑜𝑔𝑟𝑎𝑚 𝐸𝑥𝑝𝑒𝑛𝑑𝑖𝑡𝑢𝑟𝑒𝑠
4𝑡ℎ 𝑄𝑢𝑎𝑟𝑡𝑒𝑟 𝐴𝑓𝑡𝑒𝑟 𝐸𝑥𝑖𝑡 𝐸𝑚𝑝𝑙𝑜𝑦𝑚𝑒𝑛𝑡𝑃𝑟𝑜𝑔𝑟𝑎𝑚 𝐸𝑥𝑝𝑒𝑛𝑑𝑖𝑡𝑢𝑟𝑒𝑠
𝐶𝑟𝑒𝑑𝑒𝑛𝑡𝑖𝑎𝑙 𝑅𝑎𝑡𝑒𝑃𝑟𝑜𝑔𝑟𝑎𝑚 𝐸𝑥𝑝𝑒𝑛𝑑𝑖𝑡𝑢𝑟𝑒𝑠𝑀𝑒𝑎𝑠𝑢𝑟𝑎𝑏𝑙𝑒 𝑆𝑘𝑖𝑙𝑙 𝐺𝑎𝑖𝑛𝑠
$27,066,39312,219
$27,066,393 5,125
$27,066,393 2,473
$27,066,3935,705
$27,066,393 5,098
$27,066,393 2,601
$15,716,432 2,954
$15,716,432 1,466
$15,716,432 1,862
$15,716,432 1,970
$15,716,432 808
$15,716,432 592
$20,718,632 5,703
$20,718,632 1,957
$20,718,632 1,866
$20,718,632 1,904
$20,718,632 1,019
$20,718,632 889

Page 14
Cost Per Dollar Earned The Cost per Dollar Earned is the inverse of the ROI. It calculates the investment required by the workforce system to result in one dollar of wages earned by a participant that exits the program. Cost per Dollar Earned is calculated by dividing the expenditures by the wages earned by exiters. Many factors can contribute to a lower Cost per Dollar Earned. It may indicate a program’s efficiency in placing individuals in employment. It could also indicate effectiveness in placing individuals in higher wage positions. This measurement identifies total program cost.
Cost by Category of Service The following three charts compare the cost of providing different levels of service to program participants. The categories of service referenced in this analysis are Career Services and Training Services for the WIOA Adult and Dislocated Worker programs. The WIOA Youth program categorizes services as Occupational Skills Training or Services Other than Occupational Skills Training. For the WIOA Adult program, 99.8 percent of participants received Career Services (Basic or Individualized), while 59.1 percent of participants received Training Services. The Career Service Expenditures ($15,582,079) are divided by the number of participants who received Career Services (12,190) to calculate the Cost Per Participant for Career Services. The Career Service Expenditures ($15,582,079) are divided by the number of exiters who received Career Services (5,046) to calculate the Cost Per Exiter for Career Services.
PY17Adult
PY18Adult
PY17DW
PY18DW
PY17Youth
PY18Youth
Cost Effectiveness Comparison: PY17 - PY18
Cost Per Measureable Skill Gain Cost Per Credential
Cost Per Employment - 4th Quarter After Exit Cost Per Employment - 2nd Quarter After Exit
Cost Per Exiter Cost Per Participant Served
$-
$0.10
$0.20
$0.30
$0.40
$0.50
$0.60
$- $50,000,000
$100,000,000 $150,000,000 $200,000,000 $250,000,000 $300,000,000 $350,000,000 $400,000,000
PY17Adult
PY18Adult
PY17DW
PY18DW
PY17Youth
PY18Youth
Title I Cost per Dollar Earned
Expenditures Wages Earned by Exiters Cost per Dollar Earned

Page 15
The Training Service Expenditures ($11,484,315) are divided by the number of participants that received training services, and the result is added to the Cost Per Participant for Career Services to calculate the Cost per Participant for Training Services. The Training Service Expenditures ($11,484,315) are divided by the number of exiters that received training services, and the result is added to the Cost Per Exiter for Career Services to calculate the Cost per Exiter for Training Services.
For the WIOA Dislocated Worker program, 99.8 percent of participants received Career Services (Basic or Individualized), while 52.8 percent of participants received Training Services. The Cost per Dislocated Worker Core Services chart utilizes the same calculations as the Cost per Adult Core Services chart. The Career Service Expenditures ($11,342,729) are divided by the number of participants who received Career Services (2,947) to calculate the Cost Per Participant for Career Services. The Career Service Expenditures ($11,342,729) are divided by the exiters who received Career Services (1,448) to calculate the Cost Per Exiter for Career Services. The Training Service Expenditures ($4,373,704) are divided by the number of participants that received training services, and the result is added to the Cost Per Participant for Career Services to calculate the Cost per Participant for Training Services. The Training Service Expenditures ($4,373,704) are divided by the number of exiters that received training services, and the result is added to the Cost Per Exiter for Career Services to calculate the Cost per Exiter for Training Services.
For the WIOA Youth program, 86.5 percent of participants received Services Other than Occupational Skills Training, while 13.5 percent of participants received Occupational Skills Training. The expenditures for
02,0004,0006,0008,000
10,00012,00014,000
ParticipantsServed
Cost perParticipant
Exiters Cost perExiter
Career Services 12,190 $1,278 5,046 $3,088Training 7,223 $2,868 3,502 $6,367
PY 2
018
Cost per Adult Core Services
02,0004,0006,0008,000
10,00012,00014,000
ParticipantsServed
Cost perParticipant
Exiters Cost perExiter
Career Services 2,947 $3,849 1,448 $7,833Training 1,561 $6,651 816 $13,193
PY 2
018
Cost per Dislocated Worker Core Services

Page 16
Services Other than Occupational Skills Training ($19,979,884) are divided by the number of participants who received Services Other than Occupational Skills Training (4,932) to calculate the Cost Per Participant for Services Other than Occupational Skills Training. The expenditures for Services Other than Occupational Skills Training ($19,979,884) are divided by the number of exiters who received Services Other than Occupational Skills Training (1,586) to calculate the Cost Per Exiter for Services Other than Occupational Skills Training. The Occupational Skills Training Expenditures ($738,748) are divided by the number of participants that received Occupational Skills Training, and the result is added to the Cost Per Participant for Services Other than Occupational Skills Training to calculate the Cost per Participant for Occupational Skills Training.
CATEGORY OF SERVICE IMPACT There are three levels of services provided to participants in the WIOA Adult and Dislocated Worker programs – Basic Career Services, Individualized Career Services, and Training Services. A participant is reported in the highest category of service they received. For example, an individual who received Basic Career Services and Individualized Career Services would be reported in the Individualized Career Services category, since Individualized Career Services are more intense than Basic Career Services. Similarly, an individual who received Basic Career Services, Individualized Career Services, and Training Services would be reported in the Training Services category. There are two levels of services provided to participants in the WIOA Youth program – Services Other than Occupational Skills Training and Occupational Skills Training. Occupational Skills Training is considered the more intense service, so participants that receive both categories of services are reported in the Occupational Skills Training category. The following series of charts demonstrate the impact that the category of service provided has on the participants’ employment related outcomes for each of the WIOA Title I programs. The Quarter Two and Quarter Four Employment charts utilize stacked bar graphs to show the number of participants included in the measures. They also utilize a solid line graph to show the performance level (percent of positive outcomes) for each category of service. The Median Earnings charts compare the median earnings by category of service. Each of the charts in this section compare performance between PY 2017 and PY 2018. WIOA Adult The chart below demonstrates the Employment Rate in the second quarter after exit in PY 2017 was significantly higher when participants received more intense services. Participants who received Individualized Services were eight percent more likely to be employed in the second quarter after exit than participants who only received Basic Career Services. Participants who received Training Services were seventeen percent more likely to be employed during the second quarter after exit than those that only received Basic Career Services. Performance was much more consistent across categories of service in PY 2018.
02,0004,0006,0008,000
10,00012,00014,00016,000
ParticipantsServed
Cost perParticipant
Exiters Cost perExiter
Received services other thanOccupational Skills Training 4,932 $4,051 1,586 $12,598
Received Occupational SkillsTraining 771 $5,009 324 $14,878
PY 2
018
Cost per Youth Core Services

Page 17
The chart for Employment Rate in the fourth quarter after exit shows similar results as the second quarter after exit performance.
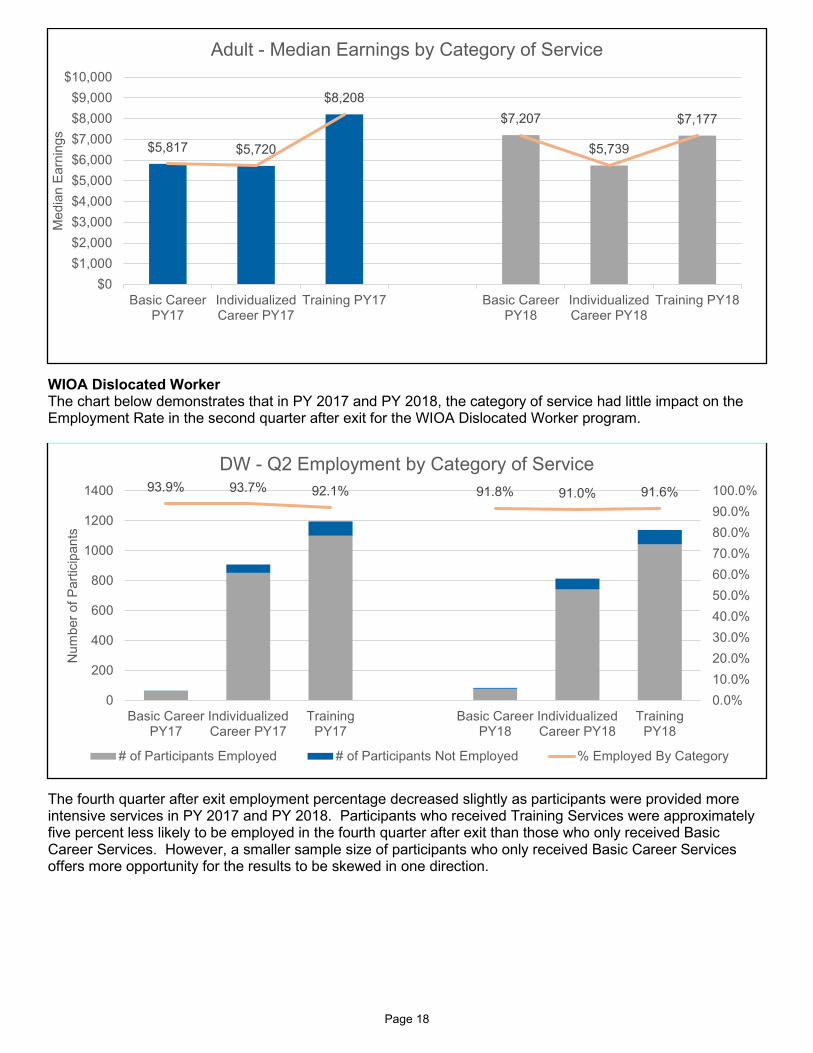
The chart for Median Earnings for WIOA Adults shows that in PY 2017, participants that received Training Services earned significantly higher wages than participants that received Basic or Individualized Career Services. In PY 2018, participants who received only Basic Career Services had higher Median Earnings than those who received Training Services. On the surface, this seems significant; however, only 120 Basic Career Service participants were included in the measure compared to 3,545 Training Service participants. The smaller sample size offers more opportunity for the results to be skewed in one direction.
73.5%81.5%
90.7% 90.9%85.5%
90.5%
0.0%10.0%20.0%30.0%40.0%50.0%60.0%70.0%80.0%90.0%100.0%
0500
10001500200025003000350040004500
Basic CareerPY17
IndividualizedCareer PY17
Training PY17 Basic CareerPY18
IndividualizedCareer PY18
Training PY18
Num
ber o
f Par
ticip
ants
Adult - Q2 Employment by Category of Service
# of Participants Employed # of Participants Not Employed % Employed By Category
70.7%79.1%
87.9%79.1% 77.9%
83.5%
0.0%10.0%20.0%30.0%40.0%50.0%60.0%70.0%80.0%90.0%100.0%
0500
1000150020002500300035004000
Basic CareerPY17
IndividualizedCareer PY17
Training PY17 Basic CareerPY18
IndividualizedCareer PY18
Training PY18 Perc
ent o
f Par
ticip
ants
Em
ploy
ed
Num
ber o
f Par
ticip
ants
Adult - Q4 Employment by Category of Service
# of Participants Employed # of Participants Not Employed % Employed By Category
Page 18
WIOA Dislocated Worker The chart below demonstrates that in PY 2017 and PY 2018, the category of service had little impact on the Employment Rate in the second quarter after exit for the WIOA Dislocated Worker program.
The fourth quarter after exit employment percentage decreased slightly as participants were provided more intensive services in PY 2017 and PY 2018. Participants who received Training Services were approximately five percent less likely to be employed in the fourth quarter after exit than those who only received Basic Career Services. However, a smaller sample size of participants who only received Basic Career Services offers more opportunity for the results to be skewed in one direction.
$5,817 $5,720
$8,208$7,207
$5,739
$7,177
$0$1,000$2,000$3,000$4,000$5,000$6,000$7,000$8,000$9,000
$10,000
Basic CareerPY17
IndividualizedCareer PY17
Training PY17 Basic CareerPY18
IndividualizedCareer PY18
Training PY18
Med
ian
Earn
ings
Adult - Median Earnings by Category of Service
93.9% 93.7% 92.1% 91.8% 91.0% 91.6%
0.0%10.0%20.0%30.0%40.0%50.0%60.0%70.0%80.0%90.0%100.0%
0
200
400
600
800
1000
1200
1400
Basic CareerPY17
IndividualizedCareer PY17
TrainingPY17
Basic CareerPY18
IndividualizedCareer PY18
TrainingPY18
Num
ber o
f Par
ticip
ants
DW - Q2 Employment by Category of Service
# of Participants Employed # of Participants Not Employed % Employed By Category

Page 19
The chart below shows less variation between the Median Earnings for participants in the WIOA Dislocated Worker program than what was observed in the WIOA Adult program. It also demonstrates that dislocated workers are more likely to earn higher wages than WIOA Adult program participants.
92.9% 90.6% 87.9%95.3%
88.5% 89.5%
0.0%
10.0%
20.0%
30.0%
40.0%
50.0%
60.0%
70.0%
80.0%
90.0%
100.0%
0
200
400
600
800
1000
1200
1400
Basic CareerPY17
IndividualizedCareer PY17
Training PY17 Basic CareerPY18
IndividualizedCareer PY18
Training PY18
Perc
ent o
f Par
ticip
ants
Em
ploy
ed
Num
ber o
f Par
ticip
ants
DW - Q4 Employment by Category of Service
# of Participants Employed # of Participants Not Employed % Employed By Category
$7,767
$9,098
$7,911 $7,849 $7,719
$8,544
$0
$1,000
$2,000
$3,000
$4,000
$5,000
$6,000
$7,000
$8,000
$9,000
$10,000
Basic CareerPY17
IndividualizedCareer PY17
Training PY17 Basic CareerPY18
IndividualizedCareer PY18
Training PY18
Med
ian
Earn
ings
DW - Median Earnings by Category of Service

Page 20
WIOA Youth The chart below demonstrates the Employment Rate in the second quarter after exit in PY 2017 was significantly higher when youth participants received Occupational Skills Training. In PY 2018, the difference was less significant, but participants who received Occupational Skills Training were more likely to be employed in the second quarter after exit than participants who received Services Other than Occupational Skills Training. There is a significant difference in the volume of participants that received each category of service, which should be considered when making program decisions.
The chart below shows a considerable drop (9.9 percent) in the Employment Rate during the fourth quarter after exit compared to the second quarter after exit in PY 2017. This may be attributed to the fourth quarter measure only containing six months’ worth of exiters due to the availability of wage record data. PY 2018’s fourth quarter after exit employment data was fairly consistent with its second quarter after exit data.
81.0%
92.9%
81.8%86.8%
0.0%10.0%20.0%30.0%40.0%50.0%60.0%70.0%80.0%90.0%100.0%
0
500
1000
1500
2000
2500
Other ServicesPY17
Occupational SkillsTraining
PY17
Other ServicesPY18
Occupational SkillsTraining
PY18
Num
ber o
f Par
ticip
ants
Youth - Q2 Employment by Category of Service
# of Participants Employed # of Participants Not Employed % Employed By Category
81.9% 83.0% 79.4%86.3%
0.0%10.0%20.0%30.0%40.0%50.0%60.0%70.0%80.0%90.0%100.0%
0
500
1000
1500
2000
2500
Other ServicesPY17
OccupationalSkills Training
PY17
Other ServicesPY18
OccupationalSkills Training
PY18
Perc
ent o
f Par
ticip
ants
Em
ploy
ed
Num
ber o
f Par
ticip
ants
Youth - Q4 Employment by Category of Service
# of Participants Employed # of Participants Not Employed % Employed By Category
Page 21
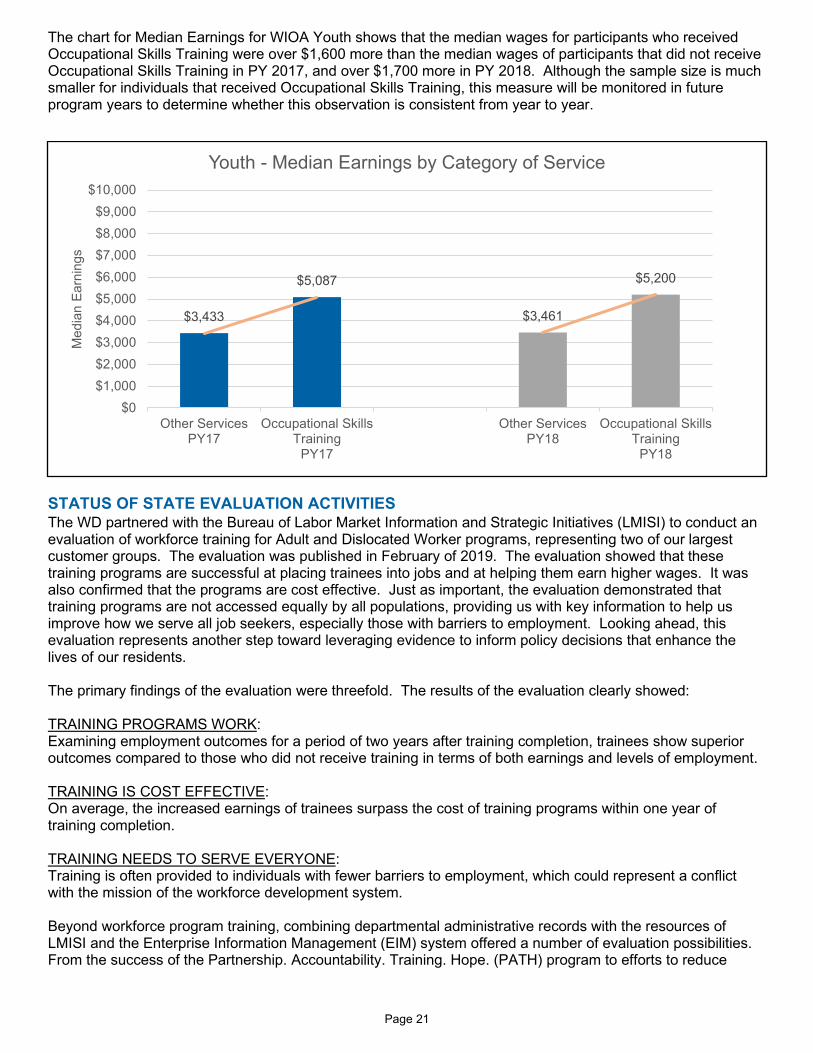
The chart for Median Earnings for WIOA Youth shows that the median wages for participants who received Occupational Skills Training were over $1,600 more than the median wages of participants that did not receive Occupational Skills Training in PY 2017, and over $1,700 more in PY 2018. Although the sample size is much smaller for individuals that received Occupational Skills Training, this measure will be monitored in future program years to determine whether this observation is consistent from year to year.
STATUS OF STATE EVALUATION ACTIVITIES The WD partnered with the Bureau of Labor Market Information and Strategic Initiatives (LMISI) to conduct an evaluation of workforce training for Adult and Dislocated Worker programs, representing two of our largest customer groups. The evaluation was published in February of 2019. The evaluation showed that these training programs are successful at placing trainees into jobs and at helping them earn higher wages. It was also confirmed that the programs are cost effective. Just as important, the evaluation demonstrated that training programs are not accessed equally by all populations, providing us with key information to help us improve how we serve all job seekers, especially those with barriers to employment. Looking ahead, this evaluation represents another step toward leveraging evidence to inform policy decisions that enhance the lives of our residents. The primary findings of the evaluation were threefold. The results of the evaluation clearly showed: TRAINING PROGRAMS WORK: Examining employment outcomes for a period of two years after training completion, trainees show superior outcomes compared to those who did not receive training in terms of both earnings and levels of employment. TRAINING IS COST EFFECTIVE: On average, the increased earnings of trainees surpass the cost of training programs within one year of training completion. TRAINING NEEDS TO SERVE EVERYONE: Training is often provided to individuals with fewer barriers to employment, which could represent a conflict with the mission of the workforce development system. Beyond workforce program training, combining departmental administrative records with the resources of LMISI and the Enterprise Information Management (EIM) system offered a number of evaluation possibilities. From the success of the Partnership. Accountability. Training. Hope. (PATH) program to efforts to reduce
$3,433
$5,087
$3,461
$5,200
$0$1,000$2,000$3,000$4,000$5,000$6,000$7,000$8,000$9,000
$10,000
Other ServicesPY17
Occupational SkillsTraining
PY17
Other ServicesPY18
Occupational SkillsTraining
PY18
Med
ian
Earn
ings
Youth - Median Earnings by Category of Service
Page 22
recidivism in the returning citizen population, rigorous program evaluation represents an important opportunity to improve the effectiveness of programs across state government. LMISI issues monthly publications highlighting workforce data which incorporates relevant ongoing evaluations. Monthly publications can be found at: https://milmi.org/publications. In September 2019, LMISI released a special issue of Michigan’s Labor Market News 2018 Annual Economic Analysis Report. This report is a useful general narrative on trends in the Michigan labor market in 2018. This issue also includes a refreshed analysis of Michigan’s labor market and demographic trends along with a collection of recently published features on population projections, labor supply and demand, and licenses. The report can be found here. Initial stages and discussion for planning future evaluations are underway. For PY 2019, Michigan will be evaluating any noticeable shifts in the characteristics of the customers we currently serve under the WIOA compared to customers served under the Workforce Investment Act (WIA). PY 2013-2014 WIA cohort and PY 2017-2018 WIOA cohort information will be utilized for this evaluation.
STATE’S APPROACH TO CUSTOMER SATISFACTION Job Seekers Continuous improvement of services to both employers and job seekers is crucial to Michigan’s workforce productivity and competitiveness. As part of the certification process for Michigan Works! Service Centers, Michigan requires that local Workforce Development Boards (WDBs) and Chief Elected Officials (CEOs) have a process in place to evaluate One-Stop service centers for the purposes of monitoring customer service levels and implementation of service improvement to employers and job seekers. At the local level, there are different methodologies used to gather information about customer satisfaction, including:
• Surveys completed by participants at the end of each program or workshop and during on-the-job training and work experience site reviews.
• On-line customer satisfaction surveys available on resource room computers that individuals can complete at any time.
• Informal real-time feedback is utilized at all service centers, based on employees’ daily interactions with customers and business service members’ interactions with employers. Feedback is used to identify new opportunities or improvements to the way training recruiting and networking processes are completed.
• Program participants and service center customers are provided a customer satisfaction survey. Information is then analyzed and shared with management and administrative staff at least quarterly.
• Employers participating in local job fairs or hiring events are given surveys to gauge their satisfaction with the event or services being provided by Michigan Works! These surveys provide greater insight on employers’ needs.
• The MWAs may also utilize specialized tracking systems, such as G*Stars, which allows individuals to complete surveys about their experiences.
Based on feedback and information received from the surveys, potential actions taken toward continuous improvement include:
• Identifying ways to improve service delivery or addressing customer service training for staff based on trends or patterns identified in the surveys.
• Feedback received following workshops helps guide changes to curriculum for future workshops and/or the establishment of new workshops where individuals have identified that services are lacking or based on employer feedback as to whether potential job seekers need additional assistance to meet their hiring needs.
• Tracking customer traffic has resulted in decisions about service center location and staffing, including expanding hours, additional staffing during busy hours, service center layout, etc.
• Reviewing customer service through mystery shopper calls and on-site visits.

Page 23
Based on feedback from the MWAs, voluntary response rates to surveys are low as individuals whose needs have been met are unlikely to respond to surveys as opposed to individuals who are upset or individuals who received exemplary services. Effectiveness in Serving Employers Michigan has chosen to report the expected level of performance for the Effectiveness in Serving Employers Indicator Pilot by utilizing the following approaches. The chart below compares Michigan’s performance in each of the employer measures in PY 2017 and PY 2018.
1. Retention with the same employer, measured by the percentage of participants who exit and are employed in the second and fourth quarters after exit. The blue section of the bar graph represents the total number of participants who had the opportunity to be employed four quarters after exiting a WIOA program. The gray section of the bar graph represents the number of participants that were employed with the same employer in the second and fourth quarters after exit.
2. Repeat business customers, based on the percentage of repeat employers using services within the
three previous years. The blue section of the bar graph represents the group of employers served during the program year. The gray section of the bar graph represents the group of employers that also received services during the previous program year.
3. Employer penetration rate based on the percentage of employers using services out of all employers in
the State. The blue section of the bar graph represents the total number of employers in Michigan as defined by the Quarterly Census of Employment and Wages. The gray section of the bar graph represents the number of employers who received services during the program year.
68.4%
78.4%
7.8% 3.9%
16.7% 13.6%
0%
10%
20%
30%
40%
50%
60%
70%
80%
90%
100%
PY17Retentionw/Same
Employer
PY18Retentionw/Same
Employer
PY17 RepeatBusiness
Customers
PY18 RepeatBusiness
Customers
PY17Employer
Penetration
PY18Employer
Penetration
Effectiveness in Serving Employers

Page 24
DATA VALIDATION Michigan’s Data Validation process covers both the accuracy of aggregate reports submitted to the USDOL on program activity and performance outcomes and the accuracy of individual data elements. Michigan conducts participant file review in compliance with the requirement to regularly monitor subrecipients of funding in accordance with 2 CFR 200.331(d). Michigan monitors the activities of the subrecipient as necessary to ensure that the subaward is used for authorized purposes, in compliance with Federal statutes, regulations, and the terms and conditions of the subaward; and that subaward performance goals are achieved. Source documentation is reviewed at this time to verify participants’ eligibility, service receipt, case management, and outcomes. Failure to produce acceptable source documentation results in a finding. Corrective action and/or technical assistance are required as a result of review findings. Michigan has implemented several tools and reports in the OSMIS that are used by State and MWA staff to validate the data submitted in the WIPS.
PIRL Admin Utility The PIRL Admin Utility allows State and MWA staff to view records that did not pass edit checks. The participants and the exact edit check rule that was broken is displayed. Links within the utility lead directly to the errored record. The record can be researched and, where applicable, updated before the PIRL file is submitted in the WIPS. This facilitates more accurate data and identifies possible updates to the OSMIS system. Participant Reports The participant reports allow OSMIS users to run on-demand, real time reports for the individuals served in the Adult, Dislocated Worker, Youth, and Wagner-Peyser programs. For each of these programs, reports are available for active individuals, registrations, participations, activities, exiters, and performance. The flexibility in the filtering/criteria allows users to customize the criteria for each report. The State and MWAs use these reports to find participant lists, answer questions and better serve customers. Performance Summary The performance summary is a robust tool that provides a summary of an individual’s Common Measures participation. Links within this tool take OSMIS users directly to the registrations, activities and MSG information that is included in the Common Measures participation. This summary helps OSMIS users identify which activities may be holding a common measures participation open and what other case manager(s) are serving this customer so together they can assist the participant in reaching their goals.

Page i
APPENDIX 1: SUMMARY OF LOCAL PERFORMANCE WIOA Adult The chart below displays the local performance outcomes for each of the sixteen Michigan Works! Agencies.

Page ii
WIOA Dislocated Worker The chart below displays the local performance outcomes for each of the sixteen Michigan Works! Agencies.

Page iii
WIOA Youth The chart below displays the local performance outcomes for each of the sixteen Michigan Works! Agencies.

Page iv
Wagner-Peyser The chart below displays the local performance outcomes for each of the sixteen Michigan Works! Agencies.

Page v
APPENDIX II: RAPID RESPONSE ACTIVITIES AND LAYOFF AVERSION The State of Michigan Rapid Response program is administered through the Michigan Department of Labor and Economic Opportunity-Workforce Development (LEO-WD), with services delivered locally by sixteen American Job Centers, referred to as Michigan Works! Agencies (MWAs). In collaboration with local MWA partners, the WD executes effective, adaptive, and comprehensive service strategies to proactively and reactively support dislocated workers throughout Michigan. In Program Year (PY) 2018, the WD utilized layoff aversion strategies such as On-the-Job Training, Incumbent Worker Training, and the implementation of Business Resource Networks (BRNs). BRNs seek to understand employer and employee needs prior to economic degrade. The services delivered by BRNs have contributed to increased productivity, improved retention rates, enhanced skills training, higher worker engagement, and have successfully fostered better employer relationships. BRNs align success coaches with onsite employees to address performance challenges and barriers to employment such as transportation, childcare assistance, housing, and finances. In PY 2018, Michigan’s workforce experienced 182 Rapid Response incidents that impacted 13,877 employees. The Rapid Response Team (RRT) provided worker orientations and intervention strategies to 51 percent of those reported incidents. Of the total reported incidents, 36 percent experienced retail and automotive related dislocations. State and local partners worked with retailers such as Shopko, Lowes, Target, Kroger, Lord & Taylor, Younkers, Payless, Sears, Save-A-Lot, JCPenney, GAP, and Charlotte Russe to identify unique worker requirements. Such requirements triggered the execution of the Trade and Economic Transition Grant which allowed specialized worker orientations, career fairs, job coaching and mock interview workshops. For auto manufacturers, Michigan took an aggressive approach to support direct manufacturers like General Motors and Ford Motor Company in addition to impacted suppliers. The RRT worked closely with Trade Adjustment Assistance (TAA) to obtain certifications for impacted workers to offer more re-employment and career enhancement options. Michigan continues to provide a holistic service package for dislocated workers by incorporating partner presentations in Worker Orientation meetings to target special populations. Veteran Services, Michigan Rehabilitation Services, Migrant/Seasonal Farm Workers and Talent Development Liaisons have representatives available to support Rapid Response events and/or Worker Orientation meetings. These partners, along with the MWAs and Unemployment Insurance, offer eligible citizens more options to get back to work. The RRT also worked to coordinate better alignment between TAA with Rapid Response services by improving the incident tracking system and enhancing the intersection between the two programs. Of the 182 incidents reported, 50 TAA petitions were filed, of which 26 certifications were determined.

Page vi
APPENDIX III: NATIONAL DISLOCATED WORKER GRANTS SUMMARY Trade & Economic Transitions Awarded in September of 2018, the Trade and Economic Transitions Grant encompasses two distinct components; development of a predictive analytics tool through the Upjohn Institute in collaboration with the Michigan Bureau of Labor Market Information and Strategic Initiatives, and support for Retail Trade and Finance and Insurance workers with job loss tied to E-commerce. When fully operational, the analytics application will provide job seekers and career planners with customized information about employment prospects and an effective sequence of services. The application will combine real-time employment data with information about skills required by occupation with predictive analytics. The tools will be embedded in a seamless series of informational screens that enhance the operation of Michigan’s One-Stop service centers. Funding also provides workers displaced from Retail Trade and Finance and Insurance positions with reemployment services including career planning, training, placement and all other career and supportive services allowable under the Workforce Innovation and Opportunity Act. National Health Emergency Awarded in April of 2019, the National Health Emergency grant focuses on the criminal justice involved population with an opioid use diagnosis through Macomb Community Corrections and the 16th Circuit Court Drug Court. A secondary but substantial emphasis is on providing workforce services to those recovering from substance abuse that may not be involved in the criminal justice system. The goal is to establish that a targeted approach connecting those most affected by the opioid crisis with training and employment services will result in lowered recidivism, increased employment, and reduced occurrences of relapse. A formal relationship has been established between the Macomb-St. Clair Workforce Development Board, Macomb County Community Corrections, the 16th District Drug Court and CARE, a Community Recovery Organization. The grant allowed CARE to hire five peer recovery coaches to work directly with referrals from Community Corrections and the Drug Court to support people on their path to recovery. Additionally, three staff were hired by Michigan Works! and dedicated to the project, including two career planners to provide case management and employment support and a business account manager to recruit local employers for job placements and on-the-job training opportunities. As individuals with a history of opioid abuse, especially those with a criminal record, often struggle to identify and maintain employment, peer recovery coaches work in tandem with their career planner counterparts on holistic solutions for participants. Referrals can be generated from any partner dependent on the participants’ needs with the goal of self-sustaining employment.

Page vii
APPENDIX IV: SUCCESS STORIES Name: Kerstin Cybak Employer: Karmanos Cancer Center Program: WIOA Adult
Kerstin Cybak visited the Roseville Michigan Works! Career Center, after being out of work for a few years, when a drastic change in her financial situation suddenly made finding employment a priority. She quickly discovered that her lack of recent work experience and marketable skills were barriers to landing a job. Kerstin knew she needed training to make herself more marketable. She met with a career planner to determine the best course of action. After some exploration, Kerstin’s interest in healthcare led her to the pharmacy technician program at Macomb
Community College. She was able to enroll in the program with Workforce Innovation and Opportunity Act (WIOA) tuition assistance. Kerstin excelled in her classes and completed the certification program. It didn’t take long for her to gain a full-time position at a compounding pharmacy at Karmanos Cancer Center. Kerstin expressed her gratitude for the opportunity: “This is the experience of a lifetime. I am extremely grateful for the help of the Roseville and Warren Michigan Works! offices; especially Christine Rinaldi. I am loving my newfound career. I am looking ahead, and my future is looking bright!” Name: Heidi Truckey Employer: Clemens Food Group Program: WIOA Dislocated Worker
Heidi Truckey came to the Michigan Works! Service Center in Coldwater after experiencing a downsizing from a company she had been employed at for ten years. Heidi had experience in proteins and agriculture, so staff from Michigan Works! Southwest discussed a variety of positions, including those available at Clemens Food Group. At the time, she was hesitant to get back into supervision but stated that she would consider it if the right position came along.
Staff submitted her resume to the Food Safety Director at Clemens for a Food Safety Quality Assurance position. Heidi had several interviews and was even invited for a panel interview at the Clemens plant in Pennsylvania. Heidi received an offer for a full-time position as a Food Safety Quality Assurance Supervisor making $27.51/hour. “From the beginning, my experience with Michigan Works! Southwest was nothing short of empowering and positive,” states Heidi. “With Clemens Food Group coming to Coldwater, it was my ambition to seek employment with a new, successful and growing local business. It had been several years since Heidi last interviewed for a position. Delighted at the opportunity but nervous at the prospect of an interview, Michigan Works! Southwest set up a series of mock interviews designed to practice and prepare her job-seeking skills. “They were absolutely crucial and helpful during the entire process,” continues Heidi. “Thanks to Michigan Works! Southwest, I am thriving along with my new employer. They were always encouraging and available for questions whenever I needed them. I could never imagine going through this experience without Michigan Works! Southwest and want to extend my sincerest appreciation for what they do.”
Page viii
Name: Jeremiah Herp Employer: Jobs for Michigan’s Graduates (JMG) – Escanaba High School Program: In-School Youth
Jeremiah Herp faced many challenges in his life, starting with the death of his birth father during middle school and developing a mental impairment that impeded his confidence. His family struggled financially impacting Jeremiah’s ability to see himself as someone who could be successful. After Jeremiah immersed himself in the JMG program and became the 2017-2018 Career Association Secretary at Escanaba High School, he felt that he could be successful. He discovered his passion to become a Chef and decided to pursue this career path after
participating in every Talent Tour and volunteer opportunity that JMG offered. Jeremiah participated in a work-based learning experience through Michigan Works! as a Youth LEGO Robotics Camp Leader at M-TEC, to continue building his confidence and workplace skills. As a senior in high school, he improved his GPA during his junior year from a 2.5 to a 3.1. He graduated with his high school diploma in May of 2018. With assistance from his Talent Specialist, navigating the financial aid processes, Jeremiah was accepted into Northern Michigan University’s Hospitality and Tourism Management program the Fall of 2018. Employer: Choice Services, Inc. Program: WIOA Business Services
Choice Services, Inc. is a federal contractor that provides food service workers to the military. They are based out of Grand Rapids, Michigan, but have a large presence at the air base in Alpena, MI. Choice Services, Inc. was struggling to find enough staff members to operate at the necessary capacity when they were set to open at the Alpena air base. They needed assistance finding a Food Service Site Manager, experienced Cooks, and Food Service Workers, so they came to Michigan Works!
Michigan Works! Business Services posted their job openings on the Pure Michigan Talent Connect website. Michigan Works! also invited Choice to participate in their annual job fair, as well as utilize their Service Center’s Interview Room for follow-up interviews. Thanks to the assistance that Michigan Works! provided, Choice Services was able to fill 25 positions, which, in northeast Michigan is a big accomplishment for both Choice Services and the local job seekers. Nancy Haaser-Jones with Choice Services states, “We used to do interviews at an area hotel until we came to learn about the wonderful resources at Michigan Works! They provided an awesome confidential interview room; they are centrally located, everyone knew where to go, and made it easy for them to interview. We have used Michigan Works! for three years in recruiting. They made it so easy! It was a comfortable environment, great candidates, and the job fair was surprisingly awesome with a wonderful turnout. We fulfilled all our goals and interviewed and hired 25 people.” Nancy continues, “We have used other avenues of hiring before, such as Indeed, but Michigan Works! was by far the most successful in securing the number of staff members we needed and the quality of the candidates. And 4 weeks out from hiring, we have 100% retention, which tells me they were good candidates to start out with.”

Page ix
Name: Daniel Richmond Employer: RDM Enterprises Program: Out-of-School Youth
Due to some poor decisions Daniel had made in the past, he was having trouble getting a job. He looked to Michigan Works! Young Professionals, in hopes of turning his life around. He shared with staff, “I am honest and check yes to the question, “Have you ever been convicted of a felony?” and I feel like I am automatically disqualified before I am given a chance. I have applied for everything from factory work to cart wrangling and it is always the same answer-NO.”
Over several weeks, Daniel attended job readiness workshops, created a resume, job searched, submitted applications, and worked with the Placement Specialist in an effort to obtain employment. In the meantime, Daniel’s resume was submitted to Blue Water Habitat for Humanity for their construction team. He was hired for a 400 hour Paid Work Experience (PWE) as a construction laborer. Daniel gained work skills during the PWE and showed immense improvement between his first and second job evaluations. He learned to manage his time effectively, become more hands-on and interactive with the team, and asked questions when necessary. Habitat for Humanity taught Daniel how to build a home from the ground up; framing, rough carpentry, and finish work; as well as what it took to work efficiently as part of a team. Successfully completing the PWE and having gained new skills, Daniel still found his background to be a roadblock to employment. The Placement Specialist; however, came across an On-the-Job Training (OJT) opportunity he thought might be a great opportunity for Daniel with RDM Enterprises. Since Daniel had mastered time management, multi-tasking, and had built a strong work ethic during his PWE, he had transferrable skills to offer RDM Enterprises. He was hired as a Press Machine Operator under an OJT contract with training funded through the WIOA. Daniel completed 480 training hours and remains employed with RDM Enterprises. When the Career Development Facilitator checked in with Daniel last month, the twenty-two-year-old said the job was “better than ever! I am finally on the right track!". Daniel’s patience, commitment, and his good attitude helped moved him forward and got him back on track toward the life he wants.