s. khonkaen foods public company limited and its
TRANSCRIPT

S. Khonkaen Foods Public Company Limited
and its subsidiaries
Report and consolidated financial statements
31 December 2019

Independent Auditor's Report
To the Shareholders of S. Khonkaen Foods Public Company Limited
Opinion
I have audited the accompanying consolidated financial statements of S. Khonkaen Foods Public
Company Limited and its subsidiaries (the Group), which comprise the consolidated statement of
financial position as at 31 December 2019, and the related consolidated statements of income,
comprehensive income, changes in shareholders’ equity and cash flows for the year then ended,
and notes to the consolidated financial statements, including a summary of significant accounting
policies, and have also audited the separate financial statements of S. Khonkaen Foods Public
Company Limited for the same period.
In my opinion, the financial statements referred to above present fairly, in all material respects,
the financial position of S. Khonkaen Foods Public Company Limited and its subsidiaries and
of S. Khonkaen Foods Public Company Limited as at 31 December 2019, their financial
performance and cash flows for the year then ended in accordance with Thai Financial Reporting
Standards.
Basis for Opinion
I conducted my audit in accordance with Thai Standards on Auditing. My responsibilities under
those standards are further described in the Auditor’s Responsibilities for the Audit of the
Financial Statements section of my report. I am independent of the Group in accordance with the
Code of Ethics for Professional Accountants as issued by the Federation of Accounting
Professions as relevant to my audit of the financial statements, and I have fulfilled my other
ethical responsibilities in accordance with the Code. I believe that the audit evidence I have
obtained is sufficient and appropriate to provide a basis for my opinion.

2
Key Audit Matters
Key audit matters are those matters that, in my professional judgement, were of most significance
in my audit of the financial statements of the current period. These matters were addressed in the
context of my audit of the financial statements as a whole, and in forming my opinion thereon, and
I do not provide a separate opinion on these matters.
I have fulfilled the responsibilities described in the Auditor’s Responsibilities for the Audit of the
Financial Statements section of my report, including in relation to these matters. Accordingly,
my audit included the performance of procedures designed to respond to my assessment of the
risks of material misstatement of the financial statements. The results of my audit procedures,
including the procedures performed to address the matters below, provide the basis for my audit
opinion on the accompanying financial statements as a whole.
Key audit matters and how audit procedures respond for each matter are described below.
Revenue recognition
The revenue from sales is the most significant amount in the statement of income and is also
the key indicator of business performance on which the users of financial statements focus.
In addition, the Group has a large customer base. Therefore, I focused on my audit on the
occurrence of the revenue from sales.
I have examined the revenue recognition of the Group by
• Assessing and testing the Group’s IT system and its internal controls with respect to the
revenue cycle by making enquiry of responsible executives, gaining an understanding of
the controls and selecting representative samples to test the operation of the designed
controls.
• Applying a sampling method to select sales and service agreements to assess whether
revenue recognition was consistent with the conditions of the relevant agreement,
and whether it was in compliance with the Group’s policy.
• On a sampling basis, examining supporting documents for actual sales transactions
occurring during the year and near the end of the accounting period.
• Reviewing credit notes that the Group issued after the period-end.
• Performing analytical procedures on disaggregated data to detect possible irregularities in
sales transactions throughout the period.
3
Provision for diminution in the value of inventories
Estimating the net realisable value of inventories, as disclosed in Note 10 to the financial
statements, is an area of significant management judgment corroborated with actual fact,
particularly with regard to the estimation of allowance for diminution in the value of obsolete and
damaged inventories. This requires detailed analysis of the product life cycle, the competitive
environment, economic circumstances and the situation within the industry. In addition, the Group
has a large quantity and number of categories of inventories. Therefore, I focused my audit on
the measurement of provision set aside for diminution in the value of inventories.
I assessed and tested the internal controls of the Group relevant to the determination of
allowance for diminution in the value of inventories by making enquiry of responsible executives,
gaining an understanding of the controls and selecting representative samples to test the
operation of the designed controls. In addition, I also assessed the method and the assumptions
applied by management in determining such allowance. The procedures that I performed
included:
• Gaining an understanding of the basis applied in determining an allowance for diminution in
value of inventories and reviewing the consistency of the application of that basis, and the
rationale for the recording of specific allowance.
• Comparing the inventories holding periods and inventory movements to identify product
lines with indicators of lower than normal inventory turnover.
• Comparing proceeds from sales transactions occurring after the date of the financial
statements with the cost of inventory for each product line.
• Comparing historical data of actual losses on sales and write-offs of inventories during
previous years with the allowance for diminution in value of inventories recorded at the
preceeding year-end.
Other Information
Management is responsible for the other information. The other information comprises the
information included in annual report of the Group, but does not include the financial statements
and my auditor’s report thereon. The annual report of the Group is expected to be made available
to me after the date of this auditor’s report.
My opinion on the financial statements does not cover the other information and I do not express
any form of assurance conclusion thereon.

4
In connection with my audit of the financial statements, my responsibility is to read the other
information and, in doing so, consider whether the other information is materially inconsistent with
the financial statements or my knowledge obtained in the audit or otherwise appears to be
materially misstated.
When I read the annual report of the Group, if I conclude that there is a material misstatement
therein, I am required to communicate the matter to those charged with governance for correction
of the misstatement.
Responsibilities of Management and Those Charged with Governance for the Financial
Statements
Management is responsible for the preparation and fair presentation of the financial statements in
accordance with Thai Financial Reporting Standards, and for such internal control as
management determines is necessary to enable the preparation of financial statements that are
free from material misstatement, whether due to fraud or error.
In preparing the financial statements, management is responsible for assessing the Group’s
ability to continue as a going concern, disclosing, as applicable, matters related to going concern
and using the going concern basis of accounting unless management either intends to liquidate
the Group or to cease operations, or has no realistic alternative but to do so.
Those charged with governance are responsible for overseeing the Group’s financial reporting
process.
Auditor’s Responsibilities for the Audit of the Financial Statements
My objectives are to obtain reasonable assurance about whether the financial statements
as a whole are free from material misstatement, whether due to fraud or error, and to issue an
auditor’s report that includes my opinion. Reasonable assurance is a high level of assurance, but
is not a guarantee that an audit conducted in accordance with Thai Standards on Auditing will
always detect a material misstatement when it exists. Misstatements can arise from fraud or error
and are considered material if, individually or in the aggregate, they could reasonably be expected
to influence the economic decisions of users taken on the basis of these financial statements.

5
As part of an audit in accordance with Thai Standards on Auditing, I exercise professional
judgement and maintain professional skepticism throughout the audit. I also:
• Identify and assess the risks of material misstatement of the financial statements, whether
due to fraud or error, design and perform audit procedures responsive to those risks, and
obtain audit evidence that is sufficient and appropriate to provide a basis for my opinion.
The risk of not detecting a material misstatement resulting from fraud is higher than for
one resulting from error, as fraud may involve collusion, forgery, intentional omissions,
misrepresentations, or the override of internal control.
• Obtain an understanding of internal control relevant to the audit in order to design audit
procedures that are appropriate in the circumstances, but not for the purpose of
expressing an opinion on the effectiveness of the Group’s internal control.
• Evaluate the appropriateness of accounting policies used and the reasonableness of
accounting estimates and related disclosures made by management.
• Conclude on the appropriateness of management’s use of the going concern basis of
accounting and, based on the audit evidence obtained, whether a material uncertainty
exists related to events or conditions that may cast significant doubt on the Group’s ability
to continue as a going concern. If I conclude that a material uncertainty exists, I am
required to draw attention in my auditor’s report to the related disclosures in the financial
statements or, if such disclosures are inadequate, to modify my opinion. My conclusions
are based on the audit evidence obtained up to the date of my auditor’s report. However,
future events or conditions may cause the Group to cease to continue as a going concern.
• Evaluate the overall presentation, structure and content of the financial statements,
including the disclosures, and whether the financial statements represent the underlying
transactions and events in a manner that achieves fair presentation.
• Obtain sufficient appropriate audit evidence regarding the financial information of the
entities or business activities within the Group to express an opinion on the consolidated
financial statements. I am responsible for the direction, supervision and performance of
the group audit. I remain solely responsible for my audit opinion.
I communicate with those charged with governance regarding, among other matters, the planned
scope and timing of the audit and significant audit findings, including any significant deficiencies in
internal control that I identify during my audit.

6
I also provide those charged with governance with a statement that I have complied with relevant
ethical requirements regarding independence, and to communicate with them all relationships and
other matters that may reasonably be thought to bear on my independence, and where
applicable, related safeguards.
From the matters communicated with those charged with governance, I determine those matters
that were of most significance in the audit of the financial statements of the current period and are
therefore the key audit matters. I describe these matters in my auditor’s report unless law or
regulation precludes public disclosure about the matter or when, in extremely rare circumstances,
I determine that a matter should not be communicated in my report because the adverse
consequences of doing so would reasonably be expected to outweigh the public interest benefits
of such communication.
I am responsible for the audit resulting in this independent auditor’s report.
Pimjai Manitkajohnkit
Certified Public Accountant (Thailand) No. 4521
EY Office Limited
Bangkok: 24 February 2020

S. Khonkaen Foods Public Company Limited and its subsidiaries
Statement of financial position
As at 31 December 2019
(Unit: Baht)
Note 2019 2018 2019 2018
Assets
Current assets
Cash and cash equivalents 8 152,250,713 78,307,864 108,746,660 50,052,387
Current investment - 873,774 - -
Trade and other receivables 7, 9 469,543,555 450,912,121 376,875,386 425,130,781
Short-term loans to subsidiaries 7 - - 6,444,869 215,461,088
Inventories 10 250,919,797 174,263,297 179,988,736 102,568,502
Current biological assets 16 74,000,913 89,690,744 - -
Other current assets 24,792,692 6,065,093 5,300,089 3,102,185
Total current assets 971,507,670 800,112,893 677,355,740 796,314,943
Non-current assets
Restricted bank deposits 11 1,490,256 1,466,938 - -
Long-term loans to subsidiary 7 - - 83,000,000 -
Investments in subsidiaries 13 - - 298,114,862 298,114,862
Investment properties 14 640,306,382 643,830,378 372,765,068 376,488,942
Property, plant and equipment 15 919,875,974 922,530,831 394,342,054 395,019,380
Non-current biological assets 16 9,214,442 14,147,773 - -
Intangible assets 17 13,214,463 13,834,772 9,915,760 12,820,843
Deferred tax assets 25 66,400 142,900 - -
Other non-current assets 10,454,867 9,642,592 8,662,131 8,319,265
Total non-current assets 1,594,622,784 1,605,596,184 1,166,799,875 1,090,763,292
Total assets 2,566,130,454 2,405,709,077 1,844,155,615 1,887,078,235
The accompanying notes are an integral part of the financial statements.
Consolidated financial statements Separate financial statements

S. Khonkaen Foods Public Company Limited and its subsidiaries
Statement of financial position (continued)
As at 31 December 2019
(Unit: Baht)
Note 2019 2018 2019 2018
Liabilities and shareholders' equity
Current liabilities
Bank overdrafts and short-term loans
from financial institutions 18 514,494,417 443,552,106 428,053,888 398,151,308
Trade and other payables 7, 19 296,966,446 324,739,568 216,519,962 257,199,165
Current portion of financial lease payables 20 1,616,613 1,034,954 525,287 -
Current portion of long-term loans 21 95,167,309 93,974,399 37,200,871 43,639,399
Income tax payable 14,343,521 16,664,151 6,611,745 9,488,355
Other current liabilities 24,149,412 19,966,932 17,112,178 14,678,584
Total current liabilities 946,737,718 899,932,110 706,023,931 723,156,811
Non-current liabilities
Financial lease payables, net of current portion 20 2,316,999 1,751,106 1,219,238 -
Long-term loans, net of current portion 21 411,312,345 334,709,820 254,108,949 291,309,820
Deferred tax liabilities 25 26,995,726 32,193,418 16,949,303 18,939,425
Provisions for long-term employee benefits 22 90,507,963 76,749,380 64,596,950 56,843,655
Other non-current liabilities 2,696,675 2,213,659 2,191,170 1,748,218
Total non-current liabilities 533,829,708 447,617,383 339,065,610 368,841,118
Total liabilities 1,480,567,426 1,347,549,493 1,045,089,541 1,091,997,929
The accompanying notes are an integral part of the financial statements.
Consolidated financial statements Separate financial statements

S. Khonkaen Foods Public Company Limited and its subsidiaries
Statement of financial position (continued)
As at 31 December 2019
(Unit: Baht)
Note 2019 2018 2019 2018
Shareholders' equity
Share capital
Registered
32,340,000 ordinary shares of Baht 10 each 323,400,000 323,400,000 323,400,000 323,400,000
Issued and paid-up
32,340,000 ordinary shares of Baht 10 each 323,400,000 323,400,000 323,400,000 323,400,000
Share premium 50,281,000 50,281,000 50,281,000 50,281,000
Share premium on treasury stock 37,552,153 37,552,153 - -
Retained earnings
Appropriated - statutory reserve 23 32,340,000 32,340,000 32,340,000 32,340,000
Unappropriated 479,014,211 451,561,720 273,692,891 269,707,123
Other components of shareholders' equity 161,396,725 161,604,952 119,352,183 119,352,183
Equity attributable to owners of the Company 1,083,984,089 1,056,739,825 799,066,074 795,080,306
Non-controlling interests of the subsidiaries 1,578,939 1,419,759 - -
Total shareholders' equity 1,085,563,028 1,058,159,584 799,066,074 795,080,306
Total liabilities and shareholders' equity 2,566,130,454 2,405,709,077 1,844,155,615 1,887,078,235
- - - -
The accompanying notes are an integral part of the financial statements.
Director Director
Consolidated financial statements Separate financial statements

S. Khonkaen Foods Public Company Limited and its subsidiaries
Income statement
For the year ended 31 December 2019
(Unit: Baht)
Consolidated financial statements Separate financial statements
Note 2019 2018 2019 2018
(Restated) (Restated)
Revenues
Sales 2,836,985,487 2,708,833,776 1,708,511,847 1,898,328,581
Revenue from rental and service 14 8,647,582 11,082,729 8,647,582 11,082,729
Dividend income 13 - - 29,888,208 -
Interest income 213,999 532,033 8,041,947 7,753,165
Other income 19,114,491 14,518,093 17,334,119 9,185,774
Gain on sales of deposits for land - 22,246,400 - 22,246,400
Gain on change in fair value less
cost to sale of biological assets 16 - 34,026,230 - -
Total revenues 2,864,961,559 2,791,239,261 1,772,423,703 1,948,596,649
Expenses
Cost of sales 2,084,798,240 1,943,492,168 1,220,819,743 1,321,514,068
Cost of rental and service 14 14,911,940 15,032,666 14,911,940 15,820,742
Selling and distribution expenses 283,789,062 262,646,989 210,138,560 211,205,338
Administrative expenses 301,222,061 291,126,712 200,468,926 205,352,788
Loss on change in fair value less
cost to sale of biological assets 16 10,018,474 - - -
Total expenses 2,694,739,777 2,512,298,535 1,646,339,169 1,753,892,936
Profit before finance cost and tax expense 170,221,782 278,940,726 126,084,534 194,703,713
Finance cost (33,726,910) (36,781,170) (27,895,660) (28,785,668)
Profit before tax expense 136,494,872 242,159,556 98,188,874 165,918,045
Income tax expenses 25 (24,008,156) (50,510,253) (10,924,968) (29,973,390)
Profit for the year 112,486,716 191,649,303 87,263,906 135,944,655
Profit attributable to:
Equity holders of the Company 112,105,882 191,272,526 87,263,906 135,944,655
Non-controlling interests of the subsidiaries 380,834 376,777
112,486,716 191,649,303
Earnings per share 26
Basic earnings per share
Profit attributable to equity holders of the Company 3.47 5.91 2.70 4.20
The accompanying notes are an integral part of the financial statements.

S. Khonkaen Foods Public Company Limited and its subsidiaries
Statement of comprehensive income
For the year ended 31 December 2019
(Unit: Baht)
Consolidated financial statements Separate financial statements
Note 2019 2018 2019 2018
Profit for the year 112,486,716 191,649,303 87,263,906 135,944,655
Other comprehensive income:
Other comprehensive income to be reclassified
to profit or loss in subsequent periods:
Exchange differences on translation of
financial statements in foreign currency (208,227) (28,436) - -
Other comprehensive income not to be reclassified
to profit or loss in subsequent periods:
Actuarial loss - net of income tax 22 (3,803,391) - (2,428,138) -
Other comprehensive income for the year (4,011,618) (28,436) (2,428,138) -
Total comprehensive income for the year 108,475,098 191,620,867 84,835,768 135,944,655
Total comprehensive income attributable to:
Equity holders of the Company 108,094,264 191,244,090 84,835,768 135,944,655
Non-controlling interests of the subsidiaries 380,834 376,777
108,475,098 191,620,867
The accompanying notes are an integral part of the financial statements.

S. Khonkaen Foods Public Company Limited and its subsidiaries
Statement of changes in shareholders' equity
For the year ended 31 December 2019
(Unit: Baht)
Surplus on
Exchange differences changes in Total other Total equity Equity attributable
Issued and Share premium on translation of Surplus on Surplus on proportion in components of attributable to to non-controlling Total
paid-up on treasury Retained earnings financial statements revaluation revaluation of interest of shareholders' owners of interests of shareholders'
share capital Share premium stock Statutory reserve Unappropriated in foreign currency of assets subsidiary's assets subsidiary equity the Company the subsidiaries equity
Balance as at 1 January 2018 323,400,000 50,281,000 37,552,153 32,340,000 331,437,194 24,296 119,352,183 41,754,649 502,260 161,633,388 936,643,735 1,042,982 937,686,717
Profit for the year - - - - 191,272,526 - - - - - 191,272,526 376,777 191,649,303
Other comprehensive income for the year - - - - - (28,436) - - - (28,436) (28,436) - (28,436)
Total comprehensive income for the year - - - - 191,272,526 (28,436) - - - (28,436) 191,244,090 376,777 191,620,867
Increase non-controling interest
of the subsidiaries - - - - - - - - - - - - -
Dividends paid (Note 28) - - - - (71,148,000) - - - - - (71,148,000) - (71,148,000)
Balance as at 31 December 2018 323,400,000 50,281,000 37,552,153 32,340,000 451,561,720 (4,140) 119,352,183 41,754,649 502,260 161,604,952 1,056,739,825 1,419,759 1,058,159,584
Balance as at 1 January 2019 323,400,000 50,281,000 37,552,153 32,340,000 451,561,720 (4,140) 119,352,183 41,754,649 502,260 161,604,952 1,056,739,825 1,419,759 1,058,159,584
Profit for the year - - - - 112,105,882 - - - - - 112,105,882 380,834 112,486,716
Other comprehensive income for the year - - - - (3,803,391) (208,227) - - - (208,227) (4,011,618) - (4,011,618)
Total comprehensive income for the year - - - - 108,302,491 (208,227) - - - (208,227) 108,094,264 380,834 108,475,098
Increase non-controling interest
of the subsidiaries - - - - - - - - - - - (19,862) (19,862)
Dividends paid (Note 28) - - - - (80,850,000) - - - - - (80,850,000) (201,792) (81,051,792)
Balance as at 31 December 2019 323,400,000 50,281,000 37,552,153 32,340,000 479,014,211 (212,367) 119,352,183 41,754,649 502,260 161,396,725 1,083,984,089 1,578,939 1,085,563,028
- - - - -
- - - - -
The accompanying notes are an integral part of the financial statements.
Other comprehensive income
Consolidated financial statements
Equity attributable to owners of the Company
Other components of equity holders
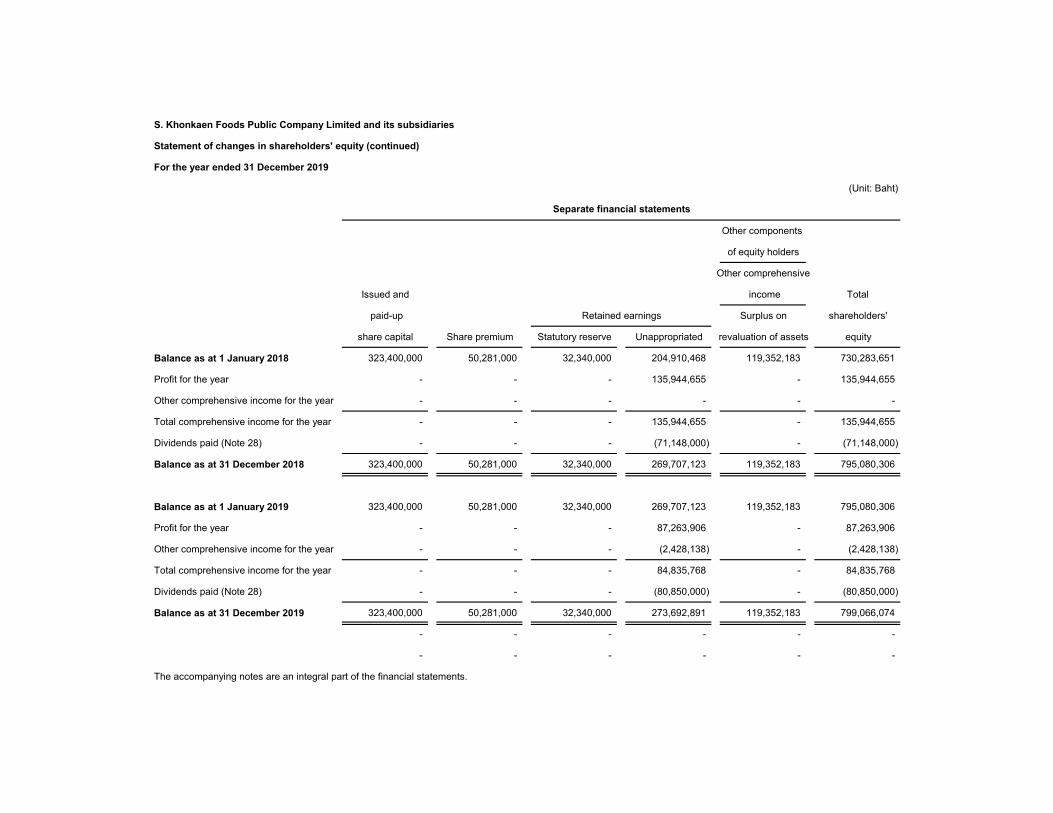
S. Khonkaen Foods Public Company Limited and its subsidiaries
Statement of changes in shareholders' equity (continued)
For the year ended 31 December 2019
(Unit: Baht)
Other components
of equity holders
Other comprehensive
Issued and income Total
paid-up Retained earnings Surplus on shareholders'
share capital Share premium Statutory reserve Unappropriated revaluation of assets equity
Balance as at 1 January 2018 323,400,000 50,281,000 32,340,000 204,910,468 119,352,183 730,283,651
Profit for the year - - - 135,944,655 - 135,944,655
Other comprehensive income for the year - - - - - -
Total comprehensive income for the year - - - 135,944,655 - 135,944,655
Dividends paid (Note 28) - - - (71,148,000) - (71,148,000)
Balance as at 31 December 2018 323,400,000 50,281,000 32,340,000 269,707,123 119,352,183 795,080,306
Balance as at 1 January 2019 323,400,000 50,281,000 32,340,000 269,707,123 119,352,183 795,080,306
Profit for the year - - - 87,263,906 - 87,263,906
Other comprehensive income for the year - - - (2,428,138) - (2,428,138)
Total comprehensive income for the year - - - 84,835,768 - 84,835,768
Dividends paid (Note 28) - - - (80,850,000) - (80,850,000)
Balance as at 31 December 2019 323,400,000 50,281,000 32,340,000 273,692,891 119,352,183 799,066,074
- - - - - -
- - - - - -
The accompanying notes are an integral part of the financial statements.
Separate financial statements

S. Khonkaen Foods Public Company Limited and its subsidiaries
Cash flow statement
For the year ended 31 December 2019
(Unit: Baht)
Consolidated financial statements Separate financial statements
2019 2018 2019 2018
Cash flows from operating activities
Profit before tax expense 136,494,872 242,159,556 98,188,874 165,918,045
Adjustments to reconcile profit before tax expense to
net cash provided by (paid from) operating activities:
Depreciation 90,962,073 87,600,849 40,657,095 39,430,942
Depreciation of biological assets 6,631,358 8,129,393 - -
Amortisation of intangible assets 3,453,809 3,004,757 3,060,983 2,870,880
Amortisation of deferred rental expense (1,018,213) (641,666) 748,213 731,666
Allowance for doubful accounts of trade
and other receivables (reversal) 590,445 143,556 665,445 (119,967)
Allowance for loan to unrelated company - 5,000,000 - 5,000,000
Reduction of inventories to net realisable value (1,509,947) (182,719) (732,062) (201,542)
Loss (gain) on sales of equipment (872,161) 139,797 (747,058) 736,065
Write-off building and equipment 650,975 3,921,576 636,271 3,073,589
Loss on impairment of biological assets - 877,459 - -
Loss on diminution in value of investment in subsidiaries - - - 73,336
Gain on sale of stud swine (4,924,591) (4,043,222) - -
Long-term employee benefit expense 20,351,171 16,972,659 14,796,311 11,702,829
Unrealised loss (gain) on exchange (12,497) 250,030 359,342 221,250
Loss (gain) on changes in fair value less cost to sell
of biological assets 10,018,474 (34,026,230) - -
Gain on sales of deposits for land - (22,246,400) - (22,246,400)
Interest income (214,000) (532,033) (8,041,947) (7,753,165)
Interest expenses 33,726,910 36,781,170 27,895,660 28,785,668
Dividends income - - (29,888,208) -
Profit from operating activities before
changes in operating assets and liabilities 294,328,678 343,308,532 147,598,919 228,223,196
The accompanying notes are an integral part of the financial statements.

S. Khonkaen Foods Public Company Limited and its subsidiaries
Cash flow statement (continued)
For the year ended 31 December 2019
(Unit: Baht)
Consolidated financial statements Separate financial statements
2019 2018 2019 2018
Operating assets (increase) decrease
Trade and other receivables (19,209,381) (33,460,104) 47,239,169 (25,713,323)
Inventories (75,146,553) (13,401,042) (76,688,172) (6,094,450)
Biological assets 1,243,410 (8,721,992) - -
Other current assets (18,727,599) (612,068) (2,197,904) (161,102)
Other non-current assets (812,275) 635,625 (342,866) 716,767
Operating liabilities increase (decrease)
Trade and other payables (31,130,733) 34,382,367 (42,011,869) 13,725,369
Other current liabilities 4,182,480 1,726,612 2,433,594 2,656,538
Other non-current liabilities 1,501,229 (1,858,764) (305,261) (2,078,962)
(11,371,655) (4,940,900) (10,078,189) (3,560,568)
Cash flows from operating activities 144,857,601 317,058,266 65,647,421 207,713,465
Cash paid for corporate income tax (29,908,684) (41,336,357) (15,184,665) (26,934,649)
Net cash flows from operating activities 114,948,917 275,721,909 50,462,756 180,778,816
Cash flows from investing activities
Decrease (increase) in restricted bank deposits (23,318) 14,952 - -
Decrease (increase) in current investments 873,774 (39,389) - -
Decrease (increase) in short-term loans to subsidiaries - - 208,644,380 (20,789,589)
Increase in long-term loans to subsidiary - - (83,000,000) -
Acquisition of equipment (79,788,869) (81,377,895) (33,349,944) (51,951,071)
Acquisition of computer software (2,833,500) (2,273,465) (155,900) (1,581,536)
Acquisition of investment properties (199,878) - - -
Cash paid for a deposits for purchase of land - (4,456,000) - (4,456,000)
Cash received from deposits for land - 153,702,400 - 153,702,400
Proceeds from sales of equipment 1,234,884 4,815,642 914,154 577,268
Proceeds from sales of stud swine 7,654,511 6,983,917 - -
Cash received from interest income 213,999 570,783 8,405,225 7,733,317
Dividend income - - 29,888,208 -
Net cash flows from (used in) investing activities (72,868,397) 77,940,945 131,346,123 83,234,789
The accompanying notes are an integral part of the financial statements.
Cash paid for long-term employee benefit

S. Khonkaen Foods Public Company Limited and its subsidiaries
Cash flow statement (continued)
For the year ended 31 December 2019
(Unit: Baht)
Consolidated financial statements Separate financial statements
2019 2018 2019 2018
Cash flows from financing activities
Increase (decrease) in bank overdrafts and
short-term loans from financial institutions 70,942,311 (203,113,013) 29,902,580 (183,395,392)
Cash receipt from long-term loans 175,675,499 114,680,859 - 114,680,859
Cash paid for long-term loans (97,880,064) (158,148,323) (43,639,399) (106,696,323)
Decrease in financial lease payables (1,542,373) (1,348,879) (439,000) (242,826)
Cash paid for interest expenses (34,073,025) (36,924,265) (28,088,787) (28,843,303)
Dividend paid (81,051,792) (71,148,000) (80,850,000) (71,148,000)
Net cash flows from (used in) financing activities 32,070,556 (356,001,621) (123,114,606) (275,644,985)
Net increase (decrease) in cash and cash equivalents 74,151,076 (2,338,767) 58,694,273 (11,631,380)
Translation adjustments (208,227) (28,436) - -
Cash and cash equivalents at beginning of year 78,307,864 80,675,067 50,052,387 61,683,767
Cash and cash equivalents at end of year (Note 8) 152,250,713 78,307,864 108,746,660 50,052,387
- - - -
Supplemental cash flows information
Non-cash items transaction
Purchases of vehicle under financial lease agreements 2,689,925 - 2,183,525 -
Undue installment for acquisition of equipment 3,118,246 4,176,239 1,525,793 2,606,309
Offseting between accrued commission and
accrued interest income - - 344,380 1,210,411
The accompanying notes are an integral part of the financial statements.

1
S. Khonkaen Foods Public Company Limited and its subsidiaries
Notes to consolidated financial statements
For the year ended 31 December 2019
1. General information
S. Khonkaen Foods Public Company Limited (“the Company”) is a public company
incorporated and domiciled in Thailand. The Company is principally engaged in the
manufacture and distribution of processed food products, restaurants and swine farm.
The registered office of the Company is at 259/13 Soi Pridi Banomyong 13, Sukhumvit
71 Road (Pridi Banomyong), Phrakanong Nuer, Vadhana, Bangkok.
2. Basis of preparation
2.1 The financial statements have been prepared in accordance with Thai Financial
Reporting Standards enunciated under the Accounting Professions Act B.E. 2547 and
their presentation has been made in compliance with the stipulations of the Notification
of the Department of Business Development dated 11 October 2016, issued under the
Accounting Act B.E. 2543.
The financial statements in Thai language are the official statutory financial statements
of the Company. The financial statements in English language have been translated
from the Thai language financial statements.
The financial statements have been prepared on a historical cost basis except where
otherwise disclosed in the accounting policies.
2.2 Basis of consolidation
a) The consolidated financial statements include the financial statements of
S. Khonkaen Foods Public Company Limited (“the Company”) and the following
subsidiary companies (“the subsidiaries”):
Country of Percentage of
Company’s name Nature of business incorporation shareholding
(Percent)
S. Pasusat Company Limited Breeding and sales of finishing swine Thailand 100
S.K.K. Food Company Limited Distribution of processed products Thailand 99
Mahachai Foods Company Limited Manufacture and distribution of
processed food products
Thailand 99
3D Food and Beverage Company Limited Restaurant business and distribution of Thailand 100
food and beverage
S. Training Center Company Limited Training and seminar service Thailand 100

2
Country of Percentage of
Company’s name Nature of business incorporation shareholding
(Percent)
Thai Home Food (Bangkok) Company
Limited
Restaurant business and distribution of
food and beverage and franchise
business
Thailand 80
S. Khonkaen Foods (Netherlands) B.V. Distribution of processed food products The Netherlands 100
b) The Company is deemed to have control over an investee or subsidiaries if it has
rights, or is exposed, to variable returns from its involvement with the investee, and
it has the ability to direct the activities that affect the amount of its returns.
c) Subsidiaries are fully consolidated, being the date on which the Company obtains
control, and continue to be consolidated until the date when such control ceases.
d) The financial statements of the subsidiaries are prepared using the same significant
accounting policies as the Company.
e) The assets and liabilities in the financial statements of overseas subsidiary
company are translated to Baht using the exchange rate prevailing on the end of
reporting period, and revenues and expenses translated using monthly average
exchange rates. The resulting differences are shown under the caption of
“Exchange differences on translation of financial statements in foreign currency” in
the statements of changes in shareholders’ equity.
f) Material balances and transactions between the Group have been eliminated from
the consolidated financial statements.
g) Non-controlling interests represent the portion of profit or loss and net assets of the
subsidiaries that are not held by the Company and are presented separately in the
consolidated profit or loss and within equity in the consolidated statement of
financial position.
2.3 The separate financial statements of the Company, which present investments in
subsidiaries under the cost method.
3
3 New financial reporting standards
(a) Financial reporting standards that became effective in the current year
During the year, the Group has adopted the revised (revised 2018) and new financial
reporting standards and interpretations which are effective for fiscal years beginning
on or after 1 January 2019. These financial reporting standards were aimed at
alignment with the corresponding International Financial Reporting Standards with
most of the changes directed towards clarifying accounting treatment and providing
accounting guidance for users of the standards. The adoption of these financial
reporting standards does not have any significant impact on the Company’s and its
subsidiaries’ financial statements. However, the new standard involves changes to
key principles, which are summarised below:
TFRS 15 Revenue from Contracts with Customers
TFRS 15 supersedes the following accounting standards together with related
interpretations.
TAS 11 (revised 2017) Construction Contracts
TAS 18 (revised 2017) Revenue
TSIC 31 (revised 2017) Revenue - Barter Transactions Involving Advertising
Services
TFRIC 13 (revised 2017) Customer Loyalty Programmes
TFRIC 15 (revised 2017) Agreements for the Construction of Real Estate
TFRIC 18 (revised 2017) Transfers of Assets from Customers
Entities are to apply this standard to all contracts with customers unless those
contracts fall within the scope of other standards. The standard establishes a five-
step model to account for revenue arising from contracts with customers, with
revenue being recognised at an amount that reflects the consideration to which an
entity expects to be entitled in exchange for transferring goods or services to a
customer. The standard requires entities to exercise judgement, taking into
consideration all of the relevant facts and circumstances when applying each step of
the model.
The Group adopted TFRS 15 using the full retrospective method of adoption.
The cumulative effect of the change is described in Note 4.

4
(b) Financial reporting standards that will become effective for fiscal years
beginning on or after 1 January 2020
The Federation of Accounting Professions issued a number of new and revised
financial reporting standards and interpretations, which are effective for fiscal years
beginning on or after 1 January 2020. These financial reporting standards were
aimed at alignment with the corresponding International Financial Reporting
Standards with most of the changes directed towards clarifying accounting treatment
and providing accounting guidance for users of the standards except the following
new standards which involve changes to key principles, which are summarised
below.
Financial reporting standards related to financial instruments
A set of TFRSs related to financial instruments consists of five accounting standards
and interpretations, as follows:
Financial reporting standards:
TFRS 7 Financial Instruments: Disclosures
TFRS 9 Financial Instruments
Accounting standard:
TAS 32 Financial Instruments: Presentation
Financial Reporting Standard Interpretations:
TFRIC 16 Hedges of a Net Investment in a Foreign Operation
TFRIC 19 Extinguishing Financial Liabilities with Equity Instruments
These TFRSs related to financial instruments make stipulations relating to the
classification of financial instruments and their measurement at fair value or
amortised cost (taking into account the type of instrument, the characteristics of the
contractual cash flows and the Company’s business model), calculation of
impairment using the expected credit loss method, and hedge accounting. These
include stipulations regarding the presentation and disclosure of financial
instruments. When the TFRSs related to financial instruments are effective, some
accounting standards, interpretations and guidance which are currently effective will
be cancelled.
The management of the Group believes that adoption of these standards will not
have any significant impact on the financial statements.

5
TFRS 16 Leases
TFRS 16 supersedes TAS 17 Leases together with related Interpretations. The
standard sets out the principles for the recognition, measurement, presentation and
disclosure of leases, and requires a lessee to recognise assets and liabilities for all
leases with a term of more than 12 months, unless the underlying asset is low value.
Accounting by lessors under TFRS 16 is substantially unchanged from TAS 17.
Lessors will continue to classify leases as either operating or finance leases using
similar principles to those used under TAS 17.
The Group plans to adopt TFRS 16 using the modified retrospective method of
adoption of which the cumulative effect is recognised as an adjustment to the
retained earnings as at 1 January 2020, and the comparative information was not
restated.
The management of the Group expects the adoption of this accounting standard to
have the effect on financial position as at 1 January 2020 of increasing the Group’s
assets by approximately Baht 120 million (the Company only: approximately Baht
104 million) and the Group’s liabilities by approximately Baht 120 million (the
Company only: approximately Baht 104 million).
4. Cumulative effects of changes in accounting policies due to the adoption of new
financial reporting standard
As described in Note 3 to the financial statements, during the current year, the Group
has adopted TFRS 15 using the full retrospective method of adoption. The cumulative
has no effect of the statement of financial position and the statement of changes in
shareholders’ equity.
The amounts of the adjustments affecting the statement of income is summarised below:
(Unit: Baht)
Consolidated financial statements
Previous
accounting policy Decrease TFRS 15
Statement of income
Sales 2,869,754,387 (160,920,611) 2,708,833,776
Selling and distribution expenses 423,567,600 (160,920,611) 262,646,989

6
(Unit: Baht)
Separate financial statements
Previous
accounting policy Decrease TFRS 15
Statement of income
Sales 2,059,249,192 (160,920,611) 1,898,328,581
Selling and distribution expenses 372,125,949 (160,920,611) 211,205,338
5. Significant accounting policies
5.1 Income recognition
Sales of goods
Revenue from sale of goods is recognised at the point in time when control of the asset
is transferred to the customer, generally upon delivery of the goods. Revenue is
measured at the amount of the consideration received or receivable, excluding value
added tax, of goods supplied after deducting returns, discounts, allowances and price
promotions to customers.
When a contract provided a customer with a right to return the goods within a specified
period, the Group recognises the amount ultimately expected they will have to return to
customers as a refund liability and recognise the right to recover the goods expected to
be returned by customers as a right of return asset in the statement of financial position.
The asset is measured at the former carrying amount of the inventory, less any expected
costs to recover the goods, including any potential decreases in the value of the returned
goods.
Rendering of services
Service revenue is recognised at a point in time upon completion of the service.
Rental income
Rental income is recognised on an accrual basis over the term of the lease.
Interest income
Interest income is recognised as interest accrues based on the effective rate method.
Dividends
Dividends are recognised when the right to receive the dividends is established.

7
5.2 Cash and cash equivalents
Cash and cash equivalents consist of cash in hand and at banks, and all highly liquid
investments with an original maturity of three months or less and not subject to
withdrawal restrictions.
5.3 Trade accounts receivable
Trade accounts receivable are stated at the net realisable value. Allowance for doubtful
accounts is provided for the estimated losses that may be incurred in collection of
receivables. The allowance is generally based on collection experiences and analysis
of debt aging.
5.4 Inventories
Finished goods and work in process are valued at the lower of cost and net realisable
value. The cost of inventories is measured using the standard cost method, which
approximates actual cost and includes all production costs and attributable factory
overheads.
Raw materials, chemicals, spare parts and factory supplies are valued at the lower of
average cost and net realisable value and are charged to production costs whenever
consumed.
5.5 Investments
Investments in subsidiaries are accounted for in the separate financial statements using
the cost method net of allowance for impairment loss (if any).
5.6 Investment properties
Investment properties are measured initially at cost, including transaction costs.
Subsequent to initial recognition, investment properties are stated at cost less
accumulated depreciation and allowance for loss on impairment (if any).
Depreciation of investment properties with respect to office building for rent is calculated
by reference to its cost on the straight-line basis over estimated useful lives of 20 years.
Depreciation of the investment properties is included in determining income. No
depreciation provided on land and land awaiting development.
On disposal of investment properties, the difference between the net disposal proceeds
and the carrying amount of the asset is recognised in profit or loss in the period when
the asset is derecognised.

8
5.7 Property, plant and equipment and depreciation
Land is stated on a revaluation basis. Plant and equipment are stated at cost less
accumulated depreciation and allowance for loss on impairment of assets (if any).
Land is initially recorded at cost on the acquisition date, and subsequently revalued by
an independent professional appraiser to their fair values. Revaluation is made with
sufficient regularity to ensure that the carrying amount does not differ materially from fair
value at the end of reporting period.
Differences arising from the revaluation are dealt with in the financial statements as
follows:
- When an asset’s carrying amount is increased as a result of a revaluation of the
Group’s assets, the increase is credited directly to the other comprehensive income
and the cumulative increase is recognised equity under the heading of “Surplus on
revaluation of assets”. However, a revaluation decrease is recognised as income to
the extent that it reverses a revaluation decrease in respect of the same asset
previously recognised as an expense.
- When an asset’s carrying amount is decreased as a result of a revaluation of the
Group’s assets, the decrease is recognised in profit or loss. However, the
revaluation decrease is charged to other comprehensive income to the extent that it
does not exceed an amount already held in “Surplus on revaluation of assets” in
respect of the same asset.
Depreciation of plant and equipment is calculated by reference to their costs on a
straight-line basis over the following estimated useful lives:
Land improvements 5 - 20 years
Plant and improvements 5 - 20 years
Machinery and equipment 5 - 10 years
Furniture, fixtures and office equipment 5 years
Motor vehicles 5 years
Depreciation is included in determining income.
No depreciation is provided on land and construction in progress.
An item of property, plant and equipment is derecognised upon disposal or when no
future economic benefits are expected from its use or disposal. Any gain or loss arising
on disposal of an asset is included in profit or loss when the asset is derecognised.
9
5.8 Biological assets
Biological assets are measured at fair value less cost to sale (incremental costs directly
attributable to the disposal of biological assets). If the fair value cannot be measured
reliably, it is measured at cost less accumulated depreciation and accumulated
impairment losses. Gains or losses on changes in fair value less cost to sale are
recognised in profit or loss.
Current biological assets, comprising fattening swine and harvested agricultural
produce, are presented under the caption “Current assets”. Non-current biological
assets, comprising stud swine and bearer plants, are presented under the caption
“Non-current assets” in the statement of financial position.
5.9 Borrowing costs
Borrowing costs directly attributable to the acquisition, construction or production of
an asset that necessarily takes a substantial period of time to get ready for its intended
use or sale are capitalised as part of the cost of the respective assets. All other borrowing
costs are expensed in the period they are incurred. Borrowing costs consist of interest
and other costs that an entity incurs in connection with the borrowing of funds.
5.10 Intangible assets
Intangible assets are recognised at cost less any accumulated amortisation and any
accumulated impairment losses (if any).
Intangible assets with finite lives are amortised on a systematic basis over the economic
useful life and tested for impairment whenever there is an indication that the intangible
asset may be impaired. The amortisation period and the amortisation method of such
intangible assets are reviewed at least at each financial year end. The amortisation
expense is charged to profit or loss.
The intangible asset with finite useful lives is computer software which has useful lives
of 5 - 10 years.
5.11 Related party transactions
Related parties comprise individuals or enterprises that control, or are controlled by, the
Company, whether directly or indirectly, or which are under common control with the
Company.
They also include an individuals or enterprises which directly or indirectly own a voting
interest in the Company that gives them significant influence over the Company, key
management personnel, directors, and officers with authority in the planning and
direction of the Company’s operations.

10
5.12 Long-term leases
Leases of property, plant or equipment which transfer substantially all the risks and
rewards of ownership are classified as finance leases. Finance leases are capitalised at
the lower of the fair value of the leased assets and the present value of the minimum
lease payments. The outstanding rental obligations, net of finance charges, are included
in long-term payables, while the interest element is charged to profit or loss over the
lease period. The assets acquired under finance leases are depreciated over the useful
life of the asset.
Leases of property, plant or equipment which do not transfer substantially all the risks
and rewards of ownership are classified as operating leases. Operating lease payments
are recognised as an expense in profit or loss on a straight-line basis over the lease
term.
5.13 Foreign currencies
The consolidated and separate financial statements are presented in Baht, which is also
the Group’s functional currency. Items of each entity included in the consolidated
financial statements are measured using the functional currency of that entity.
Transactions in foreign currencies are translated into Baht at the exchange rate ruling at
the date of the transaction. Monetary assets and liabilities denominated in foreign
currencies are translated into Baht at the exchange rate ruling at the end of reporting
period.
Gains and losses on exchange are included in determining income.
5.14 Impairment of assets
At the end of each reporting period, the Group performs impairment reviews in respect
of the property, plant and equipment and other intangible assets whenever events or
changes in circumstances indicate that an asset may be impaired. An
impairment loss is recognised when the recoverable amount of an asset, which is the
higher of the asset’s fair value less costs to sell and its value in use, is less than the
carrying amount. In determining value in use, the estimated future cash flows are
discounted to their present value using a pre-tax discount rate that reflects current
market assessments of the time value of money and the risks specific to the asset.
In determining fair value less costs to sell, an appropriate valuation model is used. These
calculations are corroborated by a valuation model that, based on information available,
reflects the amount that the Group could obtain from the disposal of the asset in an arm’s
length transaction between knowledgeable, willing parties, after deducting the costs of
disposal.

11
An impairment loss is recognised in profit or loss. However in cases where land was
previously revalued and the revaluation was taken to equity, a part of such impairment
is recognised in equity up to the amount of the previous revaluation.
In the assessment of asset impairment if there is any indication that previously
recognised impairment losses may no longer exist or may have decreased, the Group
estimates the asset’s recoverable amount. A previously recognised impairment loss is
reversed only if there has been a change in the assumptions used to determine the
asset’s recoverable amount since the last impairment loss was recognised. The
increased carrying amount of the asset attributable to a reversal of an impairment loss
shall not exceed the carrying amount that would have been determined had no
impairment loss been recognised for the asset in prior years. Such reversal is recognised
in profit or loss unless the asset is carried at a revalued amount, in which case the
reversal, which exceeds the carrying amount that would have been determined, is
treated as a revaluation increase.
5.15 Employee benefits
Short-term employee benefits
Salaries, wages, bonuses and contributions to the social security fund are recognised
as expenses when incurred.
Post-employment benefits and other long-term employee benefits
Defined benefit plans and other long-term employee benefits
The Group has obligations in respect of the severance payments it must make to
employees upon retirement under labor law and other employee benefit plans. The
Group treats these severance payment obligations as a defined benefit plan. In addition,
the Group provides other long-term employee benefit plan, namely long service awards.
The obligation under the defined benefit plan and other long-term employee benefit
plans is determined by a professionally qualified independent actuary based on actuarial
techniques, using the projected unit credit method.
Actuarial gains and losses arising from defined benefit plans are recognised immediately
in other comprehensive income.
Actuarial gains and losses arising from other long-term benefits are recognised
immediately in profit and loss.

12
5.16 Provisions
Provisions are recognised when the Group has a present obligation as a result of a past
event, it is probable that an outflow of resources embodying economic benefits will be
required to settle the obligation, and a reliable estimate can be made of the amount of
the obligation.
5.17 Income tax
Income tax expense represents the sum of corporate income tax currently payable and
deferred tax.
Current tax
Current income tax is provided in the accounts at the amount expected to be paid to the
taxation authorities, based on taxable profits determined in accordance with tax
legislation.
Deferred tax
Deferred income tax is provided on temporary differences between the tax bases of
assets and liabilities and their carrying amounts at the end of each reporting period,
using the tax rates enacted at the end of the reporting period.
The Group recognises deferred tax liabilities for all taxable temporary differences while
they recognise deferred tax assets for all deductible temporary differences and tax
losses carried forward to the extent that it is probable that future taxable profit will be
available against which such deductible temporary differences and tax losses carried
forward can be utilised.
At each reporting date, the Group reviews and reduces the carrying amount of deferred
tax assets to the extent that it is no longer probable that sufficient taxable profit will be
available to allow all or part of the deferred tax asset to be utilised.
The Group records deferred tax directly to shareholders' equity if the tax relates to items
that are recorded directly to shareholders' equity.

13
5.18 Fair value measurement
Fair value is the price that would be received to sell an asset or paid to transfer a liability
in an orderly transaction between buyer and seller (market participants) at the
measurement date. The Group applies a quoted market price in an active market to
measure their assets and liabilities that are required to be measured at fair value by
relevant financial reporting standards. Except in case of no active market of an identical
asset or liability or when a quoted market price is not available, the Group measures fair
value using valuation technique that are appropriate in the circumstances and maximise
the use of relevant observable inputs related to assets and liabilities that are required to
be measured at fair value.
All assets and liabilities for which fair value is measured or disclosed in the financial
statements are categorised within the fair value hierarchy into three levels based on
categories of input to be used in fair value measurement as follows:
Level 1 - Use of quoted market prices in an observable active market for such assets
or liabilities
Level 2 - Use of other observable inputs for such assets or liabilities, whether directly
or indirectly
Level 3 - Use of unobservable inputs such as estimates of future cash flows
At the end of each reporting period, the Group determines whether transfers have
occurred between levels within the fair value hierarchy for assets and liabilities held at
the end of the reporting period that are measured at fair value on a recurring basis.
6. Significant accounting judgments and estimates
The preparation of financial statements in conformity with financial reporting standards
at times requires management to make subjective judgements and estimates regarding
matters that are inherently uncertain. These judgements and estimates affect reported
amounts and disclosures; and actual results could differ from these estimates.
Significant judgements and estimates are as follows:
Allowance for diminution in value of inventories
The determination of allowance for diminution in the value of inventories requires the
management to exercise judgement in estimating losses on outstanding inventories,
based on the selling price expected in the ordinary course of business; less selling
expenses and allowance for obsolete, slow-moving and deteriorated inventories, and
taking into account the approximate useful lives of each type of inventories.

14
Property, plant and equipment / Depreciation
In determining depreciation of plant and equipment, the management is required to
make estimates of the useful lives and residual values of the Group’s plant and
equipment and to review estimate useful lives and residual values when there are any
changes.
In addition, the management is required to review property, plant and equipment for
impairment on a periodical basis and record impairment losses in the period when it is
determined that their recoverable amount is lower than the carrying amount. This
requires judgments regarding forecast of future revenues and expenses relating to the
assets subject to the review.
Biological assets
Fattening swine are measured at their fair value less costs to sell. This fair value is
measured with reference to the quoted prices of fattening swine at the reporting date,
after deducting estimated cost to sale. The fair value of harvested agricultural produce
is measured with reference to the quoted prices of such produce after deducting cost of
sale at the point of harvest.
The measurement of fair value related to biological assets involves certain assumptions
and some estimations, such as feeding costs of fattening swine and cost to sale.
Deferred tax assets
Deferred tax assets are recognised for deductible temporary differences and unused tax
losses to the extent that it is probable that taxable profit will be available against which
the temporary differences and losses can be utilised. Significant management
judgement is required to determine the amount of deferred tax assets that can be
recognised, based upon the likely timing and level of estimate future taxable profits.
Post-employment benefits under defined benefit plans and other long-term
employee benefits
The obligation under the defined benefit plan and other long-term employee benefits
determined based on actuarial techniques. Such determination is made based on
various assumptions, including discount rate, future salary increase rate, mortality rate
and staff turnover rate.

15
7. Related party transactions
During the years, the Company and its subsidiaries had significant business transactions
with related parties. Such transactions, which are summarised below, were concluded
on commercial terms and bases agreed upon between the Company and those related
parties.
(Unit: Thousand Baht)
Consolidated
financial statements
Separate
financial statements
2019 2018 2019 2018 Transfer Pricing Policy
Transactions with subsidiary company
(eliminated from the consolidated
financial statements)
Sales of goods - - 26,387 26,026 Cost plus margin
Service income - - 6,484 845 As stipulated in agreements
Sales of equipment and supplies - - 72 124 Cost plus margin
Dividend income - - 29,888 - As declared
Interest income - - 7,970 7,252 Average cost of debt
3.574% - 4.50% per annum
Purchases of goods - - 81,827 333,474 Cost plus margin
Rental expenses - - - 600 As stipulated in agreements
Other expenses - - 911 3,086 Cost plus margin
As at 31 December 2019 and 2018, the balances of the accounts between the Company
and those related companies are as follows:
(Unit: Thousand Baht)
Consolidated Separate
financial statements financial statements
2019 2018 2019 2018
Trade and other receivables (Note 9)
Subsidiaries - - 2,714 2,575
Trade and other payables (Note 19)
Subsidiaries - - 4,671 20,387

16
Loans to the subsidiaries
As at 31 December 2019 and 2018, the balance of loans to the subsidiaries and the
movements are as follows:
(Unit: Thousand Baht)
Separate financial statements
Balance as at Increase Decrease Unrealised Balance as at Less:
31 December during during loss on 31 December Short-term loans Long-term loans
Short-term loans to subsidiaries 2018 the year the year exchange 2019 to subsidiaries to subsidiary
Mahachai Foods Co., Ltd. 122,000 85,000 (207,000) - - - -
S. Pasusat Co., Ltd. 89,000 5,000 (11,000) - 83,000 - 83,000
S. Training Center Co., Ltd. 300 - (300) - - - -
S. Khonkaen Foods
(Netherlands) B.V. 4,161 - (344) (372) 3,445 (3,445) -
3D Food and Beverage Co., Ltd. - 3,000 - - 3,000 (3,000) -
Total 215,461 93,000 (218,644) (372) 89,445 (6,445) 83,000
Those short-term loans bear interest at rates of 3.697% - 4.50% per annum
(2018: 3.574% - 4.50% per annum). No due date for repayment of principal and interests
has been scheduled.
Short-term loans to S. Khonkaen Foods (Netherlands) B.V. of Euro 0.10 million (2018:
Euro 0.11 million) were denominated in Euro. There was no fixed term for repayment.
Directors and management’s benefits
During the years ended 31 December 2019 and 2018, the Company and its subsidiaries
had employee benefit expenses payable to their directors and management as below.
(Unit: Thousand Baht)
Consolidated Separate
financial statements financial statements
2019 2018 2019 2018
Short-term employee benefits 41,540 38,463 24,622 26,270
Post-employment benefits 7,996 4,681 4,323 3,737
Total 49,536 43,144 28,945 30,007
Guarantee obligations with related parties
The Company has outstanding guarantee obligations with its related parties, as
described in Note 29.3 (2).

17
8. Cash and cash equivalents
(Unit: Thousand Baht)
Consolidated
financial statements
Separate
financial statements
2019 2018 2019 2018
Cash 4,391 4,616 4,164 4,005
Bank deposits 147,860 73,692 104,583 46,047
Total 152,251 78,308 108,747 50,052
As at 31 December 2019, bank deposits in saving accounts carried interests between
0.10% and 0.80% percent per annum (2018: between 0.10% and 0.375% per annum).
9. Trade and other receivables
(Unit: Thousand Baht)
Consolidated Separate
financial statements financial statements
2019 2018 2019 2018
Trade accounts receivable - related parties
Aged on the basis of due dates
Not yet due - - 1,847 1,867
Total trade accounts receivable - related parties - - 1,847 1,867
Trade accounts receivable - unrelated parties
Aged on the basis of due dates
Not yet due 443,354 417,882 349,666 396,987
Past due
Up to 3 months 14,209 26,227 12,923 24,794
3 - 6 months 597 - 592 -
6 - 12 months 3,992 359 3,971 -
Over 12 months 1,563 363 1,242 363
Total 463,715 444,831 368,394 422,144
Less: Allowance for doubtful debts (1,382) (768) (1,045) (410)
Total trade accounts receivable - unrelated
parties, net 462,333 444,063 367,349 421,734
Total trade accounts receivable, net 462,333 444,063 369,196 423,601
Other receivables
Other receivables - related parties - - 867 708
Other receivables - unrelated parties 931 6,888 601 1,192
Others 7,023 728 6,643 32
Total 7,954 7,616 8,111 1,932
Less: Allowance for doubtful debts (743) (767) (432) (402)
Total other receivables - net 7,211 6,849 7,679 1,530
Total trade and other receivables - net 469,544 450,912 376,875 425,131

18
10. Inventories
(Unit: Thousand Baht)
Consolidated financial statements
Cost
Reduce cost to net
realisable value Inventories - net
2019 2018 2019 2018 2019 2018
Finished goods 42,148 44,745 (325) (188) 41,823 44,557
Work in process 29,958 18,076 - - 29,958 18,076
Raw materials 137,981 68,012 (83) (439) 137,898 67,573
Packing materials 26,309 28,549 (1,582) (2,699) 24,727 25,850
Spare parts and
factory supplies 8,578 8,184 (119) (292) 8,459 7,892
Animal foods and vaccine
for swine 3,417 3,768 - - 3,417 3,768
Raw materials for production
of animal foods 4,638 6,547 - - 4,638 6,547
Total 253,029 177,881 (2,109) (3,618) 250,920 174,263
(Unit: Thousand Baht)
Separate financial statements
Cost
Reduce cost to net
realisable value Inventories - net
2019 2018 2019 2018 2019 2018
Finished goods 32,183 36,078 (124) (67) 32,059 36,011
Work in process 29,003 16,568 - - 29,003 16,568
Raw materials 94,281 24,871 (83) (278) 94,198 24,593
Packing materials 20,650 22,052 (1,003) (1,519) 19,647 20,533
Spare parts and
factory supplies 5,132 4,992 (50) (128) 5,082 4,864
Total 181,249 104,561 (1,260) (1,992) 179,989 102,569
During the year, the Company and its subsidiaries reduced cost of inventories by Baht
1 million (2018: Baht 2 million) (the Company only: Baht 0.5 million and 2018:
Baht 1 million), to reflect the net realisable value. This was included in cost of sales.
In addition, the Company reversed reduced cost of inventories by Baht 2 million
(2018: Baht 2 million) (the Company only: Baht 1 million and 2018: Baht 1 million),
by reducing the amount of inventories recognised as expenses during the year.
11. Restricted bank deposits
These represent fixed deposits pledged with the banks to secure credit facilitles.

19
12. Loan to unrelated company
As at 31 December 2019 and 2018, the balance of loan to unrelated company and the
movements are as follows.
(Unit: Thousand Baht)
Consolidated financial statements / Separate financial statements
Principal
Allowance for doubtful
account
Loan to unrelated
company - net
Loan to unrelated company 2019 2018 2019 2018 2019 2018
Lao Inter Trade Sole
Company Limited 5,000 5,000 (5,000) (5,000) - -
Total 5,000 5,000 (5,000) (5,000) - -
In October 2015, the Company provided loan of Baht 5 million to an overseas company.
This loan has been guaranteed by the pledge of total shares of the Company amounting
to LAK 1 billion. The loan carried interest at the rate of 9.125% per annum (2018: 9.125%
per annum). The repayment term is five years which is fully repayable in October 2020.
In 2018, the Company fully recognised allowance for doubtful account of loan to
unrelated company.
13. Investments in subsidiaries
Details of investments in subsidiaries as presented in separate financial statements are
as follows:
(Unit: Thousand Baht)
Allowance for
Paid-up Shareholding Cost impairment loss Cost - net
Subsidiaries’ name capital percentage 2019 2018 2019 2018 2019 2018
(Percent)
S. Pasusat Co., Ltd. Baht 45 million 100 44,968 44,968 - - 44,968 44,968
S.K.K. Food Co., Ltd. Baht 120 million 99 119,225 119,225 - - 119,225 119,225
Mahachai Foods Co., Ltd. Baht 85 million 99 127,992 127,992 - - 127,992 127,992
3D Food and Beverage Co., Ltd. Baht 10 million 100 10,000 10,000 (5,000) (5,000) 5,000 5,000
S. Training Center Co., Ltd. Baht 0.5 million 100 500 500 - - 500 500
Thai Home Food (Bangkok) Co., Ltd. Baht 5 million 80 3,999 3,999 (3,573) (3,573) 426 426
S. Khonkaen Foods (Netherlands) B.V. EUR 100 100 4 4 - - 4 4
306,688 306,688 (8,573) (8,573) 298,115 298,115
In 2018, the Company received dividend of Baht 30 million from a subsidiary. Thai Home
Food (Bangkok) Company Limited registered for the dissolution with the Ministry of
Commerce on 14 November 2018 and currently has been in the liquidation process.

20
14. Investment properties
(Unit: Thousand Baht)
Consolidated financial statements Separate financial statements
Land
awaiting
development
Land, office
building
for rent Total
Land
awaiting
development
Land, office
building for
rent Total
Cost:
1 January 2018 342,444 311,482 653,926 74,771 311,482 386,253
Disposals - - - - - -
31 December 2018 342,444 311,482 653,926 74,771 311,482 386,253
Additions 200 - 200 - - -
31 December 2019 342,644 311,482 654,126 74,771 311,482 386,253
Accumulated depreciation: 1 January 2018 - 6,040 6,040 - 6,040 6,040
Depreciation for the year - 3,724 3,724 - 3,724 3,724
31 December 2018 - 9,764 9,764 - 9,764 9,764
Depreciation for the year - 3,724 3,724 - 3,724 3,724
31 December 2019 - 13,488 13,488 - 13,488 13,488
Allowance for impairment loss:
1 January 2018 332 - 332 - - -
Reversal - - - - - -
31 December 2018 332 - 332 - - -
Reversal - - - - - -
31 December 2019 332 - 332 - - -
Net book value:
31 December 2018 342,112 301,718 643,830 74,771 301,718 376,489
31 December 2019 342,312 297,994 640,306 74,771 297,994 372,765
Revenue and expenses related to land and office building for rent for the years ended
31 December 2019 and 2018 are as follows:
(Unit: Thousand Baht)
Consolidated Separate
financial statements financial statements
2019 2018 2019 2018
Revenue from rental and service 8,648 11,083 8,648 11,083
Cost of rental and service 14,912 15,033 14,912 15,821

21
The fair values of the investment properties as at 31 December 2019 and 2018 stated
below:
(Unit: Thousand Baht)
Consolidated
financial statements
Separate
financial statements
2019 2018 2019 2018
Land awaiting development 910,567 910,567 140,252 140,252
Land and office building for rent 319,000 319,000 319,000 319,000
The Group hired an independent professional valuer in 2017, to appraise fair values of
their investment properties. Land awaiting development have been appraised based on
market approach, and land and office building for rent has been appraised based on
income approach.
Key assumptions used in the valuation of office building for rent are summarised below:
Consolidated/Separate
financial statements
Result to fair value
where as an increase
in assumption value
Rental growth rate (%) 10 Increase in fair value
Vacancy rate (%) 35 Decrease in fair value
Expense increasing rate (%) 1-2 Increase in fair value
Discount rate (%) 10 Decrease in fair value
The Group have operating lease agreements in respect of the office rental. The terms of
the agreements are generally between 1 month and 3 years. Future minimum rental
income to be generated under these agreements are as follows.
(Unit: Thousand Baht)
2019 2018
In up to 1 year 7,343 5,011
In over 1 year and up to 3 years 2,729 4,056
The Group has mortaged investment properties with a total net book value of Baht 439
million (2018: Baht 442 million) (the Company only: Baht 373 million, 2018: Baht 376
million) as collaterals to secure credit facilities provided by banks.
22
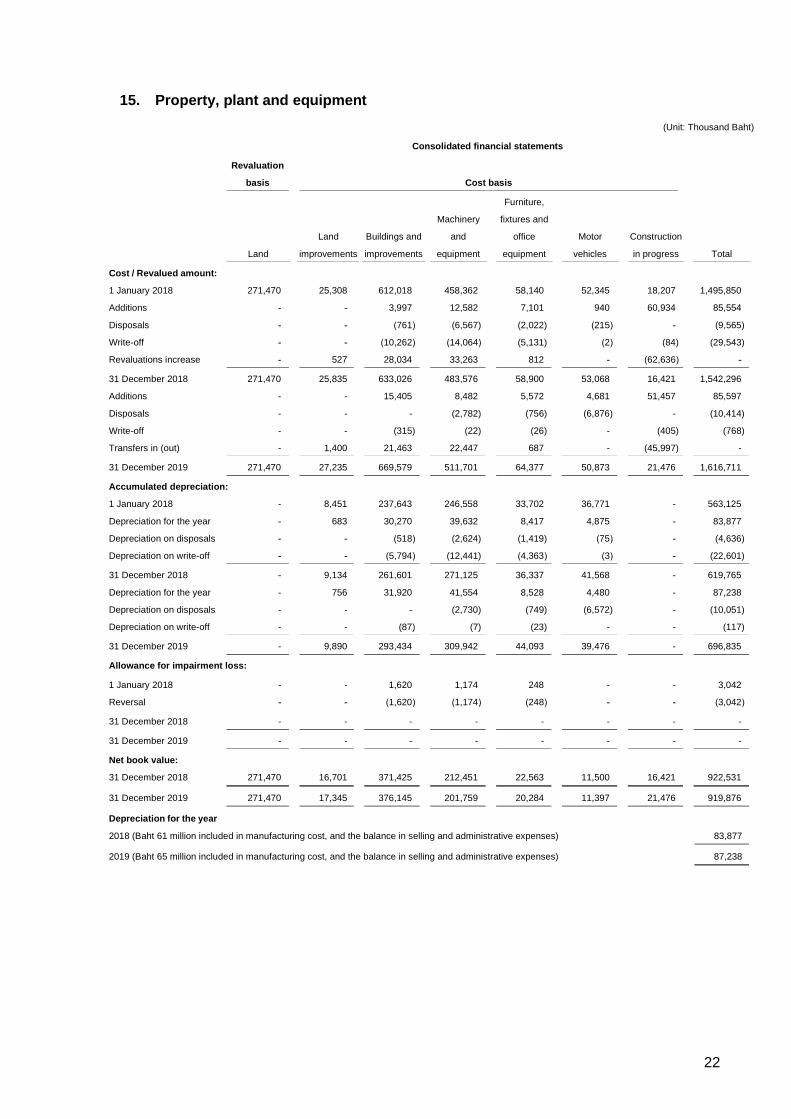
15. Property, plant and equipment
(Unit: Thousand Baht)
Consolidated financial statements
Revaluation
basis Cost basis
Land
Land
improvements
Buildings and
improvements
Machinery
and
equipment
Furniture,
fixtures and
office
equipment
Motor
vehicles
Construction
in progress Total
Cost / Revalued amount:
1 January 2018 271,470 25,308 612,018 458,362 58,140 52,345 18,207 1,495,850
Additions - - 3,997 12,582 7,101 940 60,934 85,554
Disposals - - (761) (6,567) (2,022) (215) - (9,565)
Write-off - - (10,262) (14,064) (5,131) (2) (84) (29,543)
Revaluations increase - 527 28,034 33,263 812 - (62,636) -
31 December 2018 271,470 25,835 633,026 483,576 58,900 53,068 16,421 1,542,296
Additions - - 15,405 8,482 5,572 4,681 51,457 85,597
Disposals - - - (2,782) (756) (6,876) - (10,414)
Write-off - - (315) (22) (26) - (405) (768)
Transfers in (out) - 1,400 21,463 22,447 687 - (45,997) -
31 December 2019 271,470 27,235 669,579 511,701 64,377 50,873 21,476 1,616,711
Accumulated depreciation:
1 January 2018 - 8,451 237,643 246,558 33,702 36,771 - 563,125
Depreciation for the year - 683 30,270 39,632 8,417 4,875 - 83,877
Depreciation on disposals - - (518) (2,624) (1,419) (75) - (4,636)
Depreciation on write-off - - (5,794) (12,441) (4,363) (3) - (22,601)
31 December 2018 - 9,134 261,601 271,125 36,337 41,568 - 619,765
Depreciation for the year - 756 31,920 41,554 8,528 4,480 - 87,238
Depreciation on disposals - - - (2,730) (749) (6,572) - (10,051)
Depreciation on write-off - - (87) (7) (23) - - (117)
31 December 2019 - 9,890 293,434 309,942 44,093 39,476 - 696,835
Allowance for impairment loss:
1 January 2018 - - 1,620 1,174 248 - - 3,042
Reversal - - (1,620) (1,174) (248) - - (3,042)
31 December 2018 - - - - - - - -
31 December 2019 - - - - - - - -
Net book value:
31 December 2018 271,470 16,701 371,425 212,451 22,563 11,500 16,421 922,531
31 December 2019 271,470 17,345 376,145 201,759 20,284 11,397 21,476 919,876
Depreciation for the year
2018 (Baht 61 million included in manufacturing cost, and the balance in selling and administrative expenses) 83,877
2019 (Baht 65 million included in manufacturing cost, and the balance in selling and administrative expenses) 87,238

23
(Unit: Thousand Baht)
Separate financial statements
Revaluation
basis Cost basis
Land
Land
improvements
Buildings and
improvements
Machinery
and
equipment
Furniture,
fixtures and
office
equipment
Motor
vehicles
Construction
in progress Total
Cost / Revalued amount:
1 January 2018 182,173 2,247 174,483 235,108 43,353 25,870 12,805 676,039
Additions - - 5,449 4,879 3,904 940 39,385 54,557
Disposals - - (761) (1,713) (2,181) - - (4,655)
Write-off - - (6,641) (4,752) (3,268) - - (14,661)
Transfers in (out) - - 26,093 13,502 812 - (40,407) -
31 December 2018 182,173 2,247 198,623 247,024 42,620 26,810 11,783 711,280
Additions - - 1,049 4,174 3,570 2,899 25,367 37,059
Disposals - - - (2,745) (427) (5,675) - (8,847)
Write-off - - (314) - (26) - (405) (745)
Transfer in (out) - - 9,691 17,495 249 - (27,435) -
31 December 2019 182,173 2,247 209,049 265,948 45,986 24,034 9,310 738,747
Accumulated depreciation:
1 January 2018 - 2,247 98,484 145,871 24,938 20,939 - 292,479
Depreciation for the year - - 7,958 19,236 6,415 2,098 - 35,707
Depreciation on disposals - - (518) (1,364) (1,487) - - (3,369)
Depreciation on write-off - - (2,403) (3,536) (2,617) - - (8,556)
31 December 2018 - 2,247 103,521 160,207 27,249 23,037 - 316,261
Depreciation for the year - - 9,694 19,347 6,121 1,771 - 36,933
Depreciation on disposals - - - (2,693) (312) (5,675) - (8,680)
Depreciation on write-off - - (87) - (22) - - (109)
31 December 2019 - 2,247 113,128 176,861 33,036 19,133 - 344,405
Allowance for impairment loss:
1 January 2018 - - 1,620 1,174 248 - - 3,042
Reversal - - (1,620) (1,174) (248) - - (3,042)
31 December 2018 - - - - - - - -
31 December 2019 - - - - - - - -
Net book value:
31 December 2018 182,173 - 95,102 86,817 15,371 3,773 11,783 395,019
31 December 2019 182,173 - 95,921 89,087 12,950 4,901 9,310 394,342
Depreciation for the year
2018 (Baht 20 million included in manufacturing cost, and the balance in selling and administrative expenses) 35,707
2019 (Baht 24 million included in manufacturing cost, and the balance in selling and administrative expenses) 36,933

24
During the year 2017, land was revalued by an independent professional appraiser,
using the market approach. Had the land been carried on a historical cost basis, their
net book values as of 31 December 2019 and 2018 would have been as follows:
(Unit: Thousand Baht)
Consolidated Separate
financial statements financial statements
2019 2018 2019 2018
Land 69,997 70,497 32,983 32,983
As at 31 December 2019, the Group have equipment acquired under financial lease
agreement, with net book value amounting to approximately Baht 31 million (2018: Baht
56 million) (the Company only: Baht 27 million, 2018: Baht 52 million).
As at 31 December 2019, certain plant and equipment items have been fully depreciated
but are still in use. The gross carrying amount before deducting accumulated
depreciation and allowance for impairment loss of those assets amounted to
approximately Baht 370 million (2018: Baht 351 million) (the Company only: Baht 221
million, 2018: Baht 208 million).
The Group has mortgaged land and building constructed thereon and machinery with a
total net book value of Baht 507 million (2018: Baht 441 million) (the Company only:
Baht 182 million, 2018: Baht 182 million) as collaterals for credit facilities granted by
banks.
16. Biological assets
(Unit: Thousand Baht)
Consolidated
financial statements
2019 2018
Current biological assets 74,001 89,691
Non-current biological assets 9,214 14,148
Total biological assets 83,215 103,839
Biological assets comprise of fattening swine, stud swine and lemon trees. The Group
presented the biological assets with feeding cycle not over one year as current biological
assets. The biological assets with feeding cycle over one year presented as non-current
biological assets.

25
Movements of the biological assets account for the years ended 31 December 2019 and
2018 are summarised below.
(Unit: Thousand Baht)
Consolidated financial statements
2019 2018
Balance at beginning of year 103,839 73,038
Increases due to feeding costs 239,294 242,528
Decreases due to sales (243,268) (236,747)
Depreciation for the year (6,631) (8,129)
Allowance for impairment of biological assets - (877)
Gain (loss) on change in fair value less cost to sell
of biological assets (10,019) 34,026
Balance at end of year 83,215 103,839
17. Intangible assets
The net book value of intangible assets, computer software, as at 31 December 2019
and 2018 is presented below.
(Unit: Thousand Baht)
Consolidated
financial
statements
Separate
financial
statements
As at 31 December 2019
Cost 33,516 29,231
Less: Accumulated amortisation (20,302) (19,315)
Net book value 13,214 9,916
As at 31 December 2018
Cost 30,682 29,075
Less: Accumulated amortisation (16,847) (16,254)
Net book value 13,835 12,821
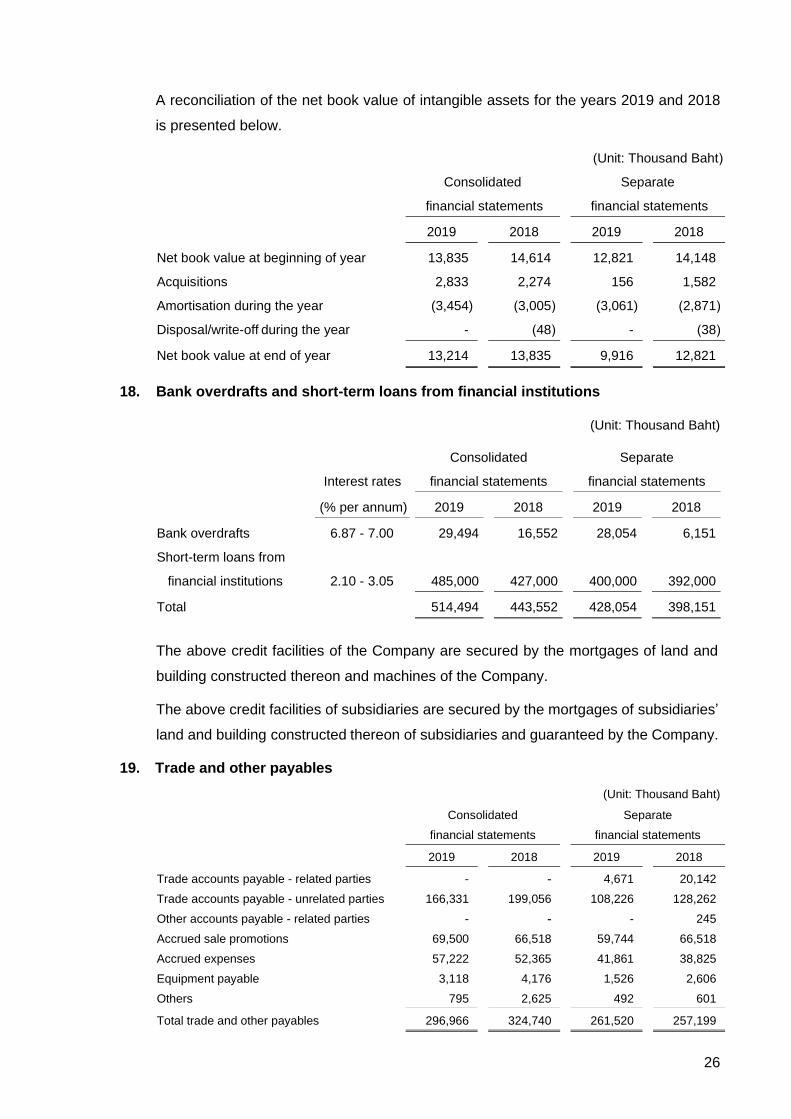
26
A reconciliation of the net book value of intangible assets for the years 2019 and 2018
is presented below.
(Unit: Thousand Baht)
Consolidated
financial statements
Separate
financial statements
2019 2018 2019 2018
Net book value at beginning of year 13,835 14,614 12,821 14,148
Acquisitions 2,833 2,274 156 1,582
Amortisation during the year (3,454) (3,005) (3,061) (2,871)
Disposal/write-off during the year - (48) - (38)
Net book value at end of year 13,214 13,835 9,916 12,821
18. Bank overdrafts and short-term loans from financial institutions
(Unit: Thousand Baht)
Consolidated Separate
Interest rates financial statements financial statements
(% per annum) 2019 2018 2019 2018
Bank overdrafts 6.87 - 7.00 29,494 16,552 28,054 6,151
Short-term loans from
financial institutions 2.10 - 3.05 485,000 427,000 400,000 392,000
Total 514,494 443,552 428,054 398,151
The above credit facilities of the Company are secured by the mortgages of land and
building constructed thereon and machines of the Company.
The above credit facilities of subsidiaries are secured by the mortgages of subsidiaries’
land and building constructed thereon of subsidiaries and guaranteed by the Company.
19. Trade and other payables
(Unit: Thousand Baht)
Consolidated Separate
financial statements financial statements
2019 2018 2019 2018
Trade accounts payable - related parties - - 4,671 20,142
Trade accounts payable - unrelated parties 166,331 199,056 108,226 128,262
Other accounts payable - related parties - - - 245
Accrued sale promotions 69,500 66,518 59,744 66,518
Accrued expenses 57,222 52,365 41,861 38,825
Equipment payable 3,118 4,176 1,526 2,606
Others 795 2,625 492 601
Total trade and other payables 296,966 324,740 261,520 257,199

27
20. Liabilities under finance lease agreements
(Unit: Thousand Baht)
Consolidated Separate
financial statements financial statements
2019 2018 2019 2018
Liabilities under finance lease agreements 4,209 2,986 1,889 -
Less: Deferred interest expenses (275) (200) (145) -
Total 3,934 2,786 1,744 -
Less: Portion due within one year (1,617) (1,035) (525) -
Liabilities under finance lease
agreement - net of current portion 2,317 1,751 1,219 -
The Group has entered into the finance lease agreements with leasing companies for
rental of vehicles, whereby they are committed to pay rental on a monthly basis. The
terms of the agreements are 4 years.
Future minimum lease payments required under the finance lease agreements were as
follows:
(Unit: Thousand Baht)
Consolidated financial statements
As at 31 December 2019 As at 31 December 2018
Less than Less than
1 year 1-5 years Total 1 year 1-5 years Total
Future minimum lease payments 1,774 2,435 4,209 1,138 1,848 2,986
Deferred interest expenses (157) (118) (275) (103) (97) (200)
Present value of future minimum
lease payments 1,617 2,317 3,934 1,035 1,751 2,786
(Unit: Thousand Baht)
Separate financial statements
As at 31 December 2019 As at 31 December 2018
Less than Less than
1 year 1-5 years Total 1 year 1-5 years Total
Future minimum lease payments 599 1,289 1,888 - - -
Deferred interest expenses (74) (70) (144) - - -
Present value of future minimum
lease payments 525 1,219 1,744 - - -

28
21. Long-term loans
As at 31 December 2019 and 2018, long-term loans are presented below.
(Unit: Thousand Baht)
Consolidated
financial statements
Separate
financial statements
2019 2018 2019 2018
Loans from banks 506,480 428,684 291,310 334,949
Less: Current portion of long-term loans (95,168) (93,974) (37,201) (43,639)
Net 411,312 334,710 254,109 291,310
Details of long-term loans are presented below.
Balance of long-term loans
Company’s name 2019 2018 Interest rates Repayment
(Thousand
Baht)
(Thousand
Baht)
(% per annum) (Monthly repayment)
S. Khonkaen Foods Pcl. 3,684 5,280 MLR less fixed rate Final dued in April 2022
71,610 91,650 Fixed rate Final dued in July 2023
11,516 27,519 Fixed rate Final dued in March 2021
204,500 210,500 MLR less fixed rate Final dued in May 2025
Mahachai Foods Co., Ltd. 24,000 48,000 MLR less fixed rate Final dued in December 2020
19,400 41,600 MLR less fixed rate Final dued in November 2020
9,975 - Fixed rate Final dued in February 2022
161,795 - Fixed rate Final dued in November 2024
S. Pasusat Co., Ltd. - 4,135 Year 1: MLR less
fixed rate
Final dued in December 2019
Year 2-6: MLR
Total 506,480 428,684
The long-term loans of the Company is secured by the mortgages of land and building
constructed thereon and investment properties of the Company.
The long - term loans of the subsidiaries are secured by the mortgage of land, building
constructed thereon, machinery, investment properties of subsidiaries and guaranteed
by the Company.

29
The loan agreements contain several covenants which, among other things, require the
Group to maintain debt-to-equity ratio and debt service coverage ratio at the rate
prescribed in the agreements.
As at 31 December 2019, the long-term credit facilities of the Group which have not yet
been drawn down amounted to Baht 64 million (2018: Baht 88 million) (the Company
only: Baht 64 million, 2018: Baht 64 million).
22. Provisions for long-term employee benefits
Provisions for long-term employee benefits, which represent compensations payable to
employees after they retire, are as follows:
(Unit: Thousand Baht)
Consolidated
financial statements
Separate
financial statements
2019 2018 2019 2018
Provisions for long-term employee
benefits at beginning of year 76,749 64,718 56,844 48,701
Included in profit or loss: Current service cost 6,978 15,112 4,367 10,342
Interest cost 2,031 1,860 1,431 1,361
Past service cost 11,342 - 8,998 -
Included in other comprehensive income: Actuarial (gain) loss arising from:
Demographic assumptions changes (2,189) - 472 -
Financial assumptions changes 222 - 24 -
Experience adjustments 6,746 - 2,539 -
Benefits paid during the year (11,371) (4,941) (10,078) (3,560)
Provisions for long-term employee
benefits at end of year 90,508 76,749 64,597 56,844
Line items in profit or loss under which long-term employee benefit expenses are
recognised are as follows:
(Unit: Thousand Baht)
Consolidated
financial statements
Separate
financial statements
2019 2018 2019 2018
Cost of sales 3,005 6,792 1,647 4,068
Selling and administrative expenses 17,346 10,180 13,149 7,635
Total expense recognised in
profit or loss
20,351
16,972
14,796
11,703

30
The Group expect to pay Baht 5 million of long-term employee benefits during the next
year (2018: Baht 11 million) (the Company only: Baht 4 million, 2018: Baht 9 million).
As at 31 December 2019, the weighted average duration of the liabilities for retirement
benefit of long-term employee benefit is 9 years (2018: 10-13 years) (the Company only:
9 years 2018: 10 years)
As at 31 December 2019, the weighted average duration of the liabilities for long service
award of long-term employee benefit is 8 years ( 2018: 8-12 years) (the Company only:
8 years 2018: 8 years)
Significant actuarial assumptions are summarised below:
(Unit: percent per annum)
Consolidated
financial statements
Separate
financial statements
2019 2018 2019 2018
Discount rates for compensation on
employee’s retirement
1.88 2.55 - 2.80 1.88 2.55
Discount rates for long service award 1.83 - 1.83 -
Salary increase rates 6.14 6.80 - 6.95 6.14 6.84
Turnover rates 0.0 - 58.0 0.0 - 67.0 0.0 - 58.0 0.0 - 54.0
The results of sensitivity analysis for significant assumptions that affect the present value
for retirement benefit of the long-term employee benefits obligation as at 31 December
2019 and 2018 are summarized below:
Consolidated financial statements
Obligation change
Obligation change
Increase 2019 2018 Decrease 2019 2018
(%) (Thousand
Baht)
(Thousand
Baht)
(%) (Thousand
Baht)
(Thousand
Baht)
Discount rate 1.0 (5,318) (3,979) (1.0) 5,885 4,417
Salary increase rate 1.0 5,496 4,804 (1.0) (5,081) (4,405)
Turnover rate 1.0 (4,762) (4,341) (1.0) 5,287 4,623
Separated financial statements
Obligation change
Obligation change
Increase 2019 2018 Decrease 2019 2018
(%) (Thousand
Baht)
(Thousand
Baht)
(%) (Thousand
Baht)
(Thousand
Baht)
Discount rate 1.0 (3,788) (2,715) (1.0) 4,188 2,993
Salary increase rate 1.0 3,916 3,291 (1.0) (3,624) (3,038)
Turnover rate 1.0 (3,185) (2,818) (1.0) 3,544 3,130

31
The results of sensitivity analysis for significant assumptions that affect the present value
for long service award of the long-term employee benefits obligation as at 31 December
2019 and 2018 are summarized below:
Consolidated financial statements
Obligation change
Obligation change
Increase 2019 2018 Decrease 2019 2018
(%) (Thousand
Baht)
(Thousand
Baht)
(%) (Thousand
Baht)
(Thousand
Baht)
Discount rate 1.0 (105) (1,125) (1.0) 115 1,414
Salary increase rate 1.0 - - (1.0) - -
Turnover rate 1.0 (111) 101 (1.0) 121 (59)
Separated financial statements
Obligation change
Obligation change
Increase 2019 2018 Decrease 2019 2018
(%) (Thousand
Baht)
(Thousand
Baht)
(%) (Thousand
Baht)
(Thousand
Baht)
Discount rate 1.0 (70) (810) (1.0) 76 1,023
Salary increase rate 1.0 - - (1.0) - -
Turnover rate 1.0 (73) 75 (1.0) 79 (75)
23. Statutory reserve
Pursuant to Section 116 of the Public Limited Companies Act B.E. 2535, the Company
is required to set aside a statutory reserve at least 5% of its net income after deducting
accumulated deficit brought forward (if any), until the reserve reaches 10% of the
registered capital. The statutory reserve is not available for dividend distribution.
At present, the statutory reserve has fully been set aside.

32
24. Expenses by nature
Significant expenses classified by nature are as follows:
(Unit: Thousand Baht)
Consolidated Separate
financial statements financial statements
2019 2018 2019 2018
Salaries and wages and other
employee benefits 640,226 580,877 419,680 392,952
Depreciation and amortisation 101,047 98,735 43,718 42,302
Rental expenses from operating
lease agreements 47,075 42,109 33,861 30,315
Raw materials and consumables used 1,408,410 1,329,725 890,362 1,010,124
Changes in inventories of finished
goods and work in process (5,467) 41,345 8,944 5,259
Sale promotion expenses 136,705 142,781 132,819 142,781
25. Income tax
Income tax expense for the years ended 31 December 2019 and 2018 are made up as
follows:
(Unit: Thousand Baht)
Consolidated
financial statements
Separate
financial statements
2019 2018 2019 2018
Current income tax:
Current income tax charge 27,588 47,003 12,308 31,675
Deferred tax:
Relating to origination and reversal
of temporary differences (3,580) 3,507 (1,383) (1,702)
Income tax expense reported
in profit or loss 24,008 50,510 10,925 29,973

33
The reconciliation between accounting profit and income tax expense is shown below.
(Unit: Thousand Baht)
Consolidated Separate
financial statements financial statements
2019 2018 2019 2018
Accounting profit before tax 136,495 242,160 98,189 165,918
Applicable tax rate 20% 20% 20% 20%
Accounting profit before tax multiplied by
income tax rate 27,299 48,432 19,638 33,184
Effects of:
Non-deductible expenses 2,648 4,105 1,949 3,424
Additional deductible expenses allowed (4,811) (7,362) (4,368) (7,092)
Exempted revenue - - (5,977) -
Others (1,128) 5,335 (317) 457
Total (3,291) 2,078 (8,713) (3,211)
Income tax expense reported in the income
statement 24,008 50,510 10,925 29,973
The components of deferred tax assets and deferred tax liabilities are as follows:
(Unit: Thousand Baht)
Statements of financial position
Consolidated
financial statements
Separate
financial statements
2019 2018 2019 2018
Deferred tax assets
Allowance for doubtful accounts 1,425 1,308 1,296 1,162
Allowance for diminution in value of inventories 422 724 252 398
Impairment on equipment 587 587 521 521
Impairment of biological assets 175 176 - -
Depreciation of stud swine 597 602 - -
Provision for long-term employee benfits 17,422 14,509 12,919 11,369
Deferred rental expenses 248 76 225 -
Total deferred tax assets 20,876 17,982 15,213 13,450
Deferred tax liabilities
Cost of fattening swine (189) (184) - -
Cost of machinery and equipment (2,324) (2,477) (2,325) (2,477)
Surplus on revaluation of assets (40,295) (40,295) (29,837) (29,837)
Gain on change in fair value less cost to sale of
biological assets (4,997) (7,001) - -
Deferred rental expenses - (75) - (75)
Total deferred tax liabilities (47,805) (50,032) (32,162) (32,389)
Deferred tax liabilities - net (26,929) (32,050) (16,949) (18,939)

34
(Unit: Thousand Baht)
Statements of financial position
Consolidated
financial statements
Separate
financial statements
2019 2018 2019 2018
Deferred tax assets (liabilities) presented
in statement of financial position
Deferred tax assets 66 143 - -
Deferred tax liabilities (26,995) (32,193) (16,949) (18,939)
As at 31 December 2019, two subsidiaries have deductible temporary differences and
unused tax losses totaling Baht 10 million, on which deferred tax assets have not been
recognised as those subsidiaries believe future taxable profits may not be sufficient to
allow utilisation of the temporary differences and unused tax losses.
The unused tax losses amounting to Baht 10 million will expire within 2024.
26. Earnings per share
Basic earnings per share is calculated by dividing profit for the year attributable to equity
holders of the Company (excluding other comprehensive income) by the weighted
average number of ordinary shares in issue during the year.
Basic earnings per share are calculated as follows:
Consolidated Separate
financial statements financial statements
2019 2018 2019 2018
Profit attributable to equity holders
of the Company (Thousand Baht) 112,106 191,273 87,264 135,945
Weighted average number
of ordinary shares (Thousand shares) 32,340 32,340 32,340 32,340
Earnings per share (Baht/share) 3.47 5.91 2.70 4.20

35
28. Segment information
Operating segment information is reported in a manner consistent with the internal
reports that are regularly reviewed by the chief operating decision maker in order to
make decisions about the allocation of resources to the segment and assess its
performance.
The Group are organised into business units based on its products and services. Their
operating segments are classified into four reportable segments as follows:
1. Processed food from pork
2. Processed seafood
3. Restaurants
4. Swine farm
The chief operating decision maker monitors the operating results of the business units
separately for the purpose of making decisions about resource allocation and assessing
performance. Segment performance is measured based on operating profit or loss and
total assets and total liabilities and on a basis consistent with that used to measure
operating profit or loss, total assets and total liabilities in the financial statements.
The basis of accounting for any transactions between reportable segments is consistent
with that for third party transactions.
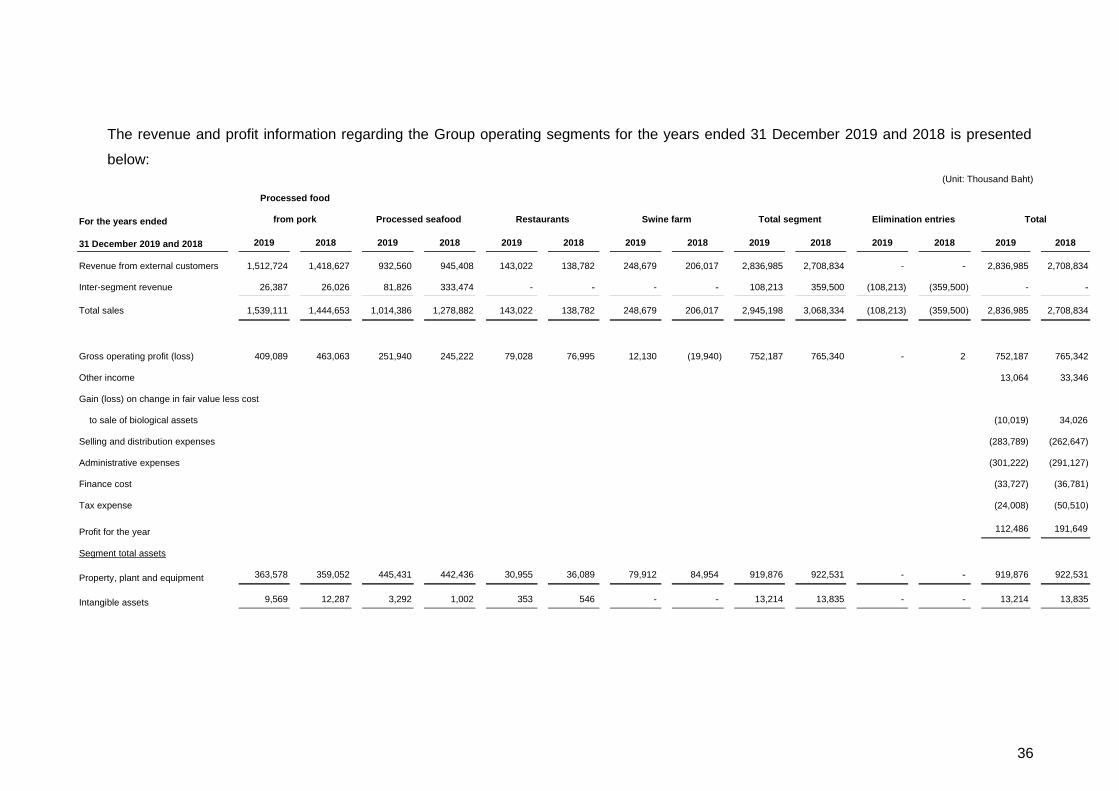
36
The revenue and profit information regarding the Group operating segments for the years ended 31 December 2019 and 2018 is presented
below:
(Unit: Thousand Baht)
For the years ended
Processed food
from pork Processed seafood Restaurants Swine farm Total segment Elimination entries Total
31 December 2019 and 2018 2019 2018 2019 2018 2019 2018 2019 2018 2019 2018 2019 2018 2019 2018
Revenue from external customers 1,512,724 1,418,627 932,560 945,408 143,022 138,782 248,679 206,017 2,836,985 2,708,834 - - 2,836,985 2,708,834
Inter-segment revenue 26,387 26,026 81,826 333,474 - - - - 108,213 359,500 (108,213) (359,500) - -
Total sales 1,539,111 1,444,653 1,014,386 1,278,882 143,022 138,782 248,679 206,017 2,945,198 3,068,334 (108,213) (359,500) 2,836,985 2,708,834
Gross operating profit (loss) 409,089 463,063 251,940 245,222 79,028 76,995 12,130 (19,940) 752,187
765,340 - 2 752,187 765,342
Other income 13,064 33,346
Gain (loss) on change in fair value less cost
to sale of biological assets (10,019) 34,026
Selling and distribution expenses (283,789) (262,647)
Administrative expenses (301,222) (291,127)
Finance cost (33,727) (36,781)
Tax expense (24,008) (50,510)
Profit for the year 112,486 191,649
Segment total assets
Property, plant and equipment 363,578 359,052 445,431 442,436 30,955 36,089 79,912 84,954 919,876 922,531 - - 919,876 922,531
Intangible assets 9,569 12,287 3,292 1,002 353 546 - - 13,214 13,835 - - 13,214 13,835

37
Geographic information
Revenue from external customers is based on locations of the customers.
(Unit: Thousand Baht)
2019 2018
Revenue from external customers
Thailand 2,677,188 2,517,212
Others 159,797 191,622
Total 2,836,985 2,708,834
Major customers
During the year, the Group had revenue from one major customer amounting to Baht
621 million arising from processed food from pork segment (2018: Baht 614 million and
Baht 322 million derived from two major customers in the same segment).
28. Dividends paid
Dividends paid Approved by Total dividends
Dividend
per share
(Thousand Baht) (Baht)
Dividend for 2018 Annual General Meeting of the
shareholders on 25 April 2019 80,850 2.50
Dividend for 2017 Annual General Meeting of the
shareholders on 26 April 2018 71,148 2.20
29. Commitments and contingent liabilities
29.1 Capital commitments
As at 31 December 2019, the Group had capital commitments in respect of construction
of office building and acquisition of assets of approximately Baht 61 million (2018: Baht
15 million) (the Company only: Baht 57 million, 2018: Baht 12 million).

38
29.2 Operating lease and service commitments
The Group has entered into several lease agreements in respect of the lease of land,
office building space and service agreement. The terms of the agreements are generally
between 1 and 16 years.
Future minimum lease payments required under these non-cancellable operating lease
contracts and service agreements are as follows.
(Unit: Thousand Baht)
Consolidated
financial statements
Separate
financial statements
2019 2018 2019 2018
Payable within:
Less than 1 year 63,939 57,375 50,353 40,186
1 to 5 years 53,283 24,458 48,719 18,737
More than 5 years 80,150 8,205 71,750 -
29.3 Guarantees
(1) As at 31 December 2019, the subsidiaries pledged their bank deposit to secure a
fuel credit card of Baht 1 million (2018: Baht 1 million).
(2) As at 31 December 2019, the Company has the obligations in respect of
guarantees provided to banks for loan facilities of the subsidiaries of Baht 347
million (2018: Baht 282 million).
(3) As at 31 December 2019, there were outstanding bank guarantees of
approximately Baht 8 million issued by the banks on behalf of the Company and
its subsidiaries to guarantee utility charges (2018: Baht 8 million) (the Company
only: Baht 6 million, 2018: Baht 6 million).
(4) As at 31 December 2019, there were outstanding bank guarantees of
approximately Baht 10 million issued by the bank on behalf of the Company to
guarantee auction.

39
30. Fair value hierarchy
As at 31 December 2019 and 2018, the Group had assets and liabilities that were
measured at fair value using different levels of inputs as follows:
(Unit: Million Baht)
As at 31 December 2019
Consolidated financial statements Separate financial statements
Level 1 Level 2 Level 3 Total Level 1 Level 2 Level 3 Total
Assets measured at fair value
Land - 271 - 271 - 182 - 182
Biological assets - 16 67 83 - - - -
Assets for which fair value is disclosed
Investment properties - 911 319 1,230 - 140 319 459
(Unit: Million Baht)
As at 31 December 2018
Consolidated financial statements Separate financial statements
Level 1 Level 2 Level 3 Total Level 1 Level 2 Level 3 Total
Assets measured at fair value
Land - 271 - 271 - 182 - 182
Biological assets - 30 74 104 - - - -
Assets for which fair value is disclosed
Investment properties - 911 319 1,230 - 140 319 459
31. Financial instruments
31.1 Financial risk management
The Group's financial instruments, as defined under Thai Accounting Standard No.107
“Financial Instruments: Disclosure and Presentations”, principally comprises cash and
cash equivalents, current investment, trade accounts receivable, restricted bank
deposits, loans, trade accounts payable, bank overdrafts, loans from financial
institutions and financial lease payables. The financial risks associated with these
financial instruments and how they are managed is described below.

40
Credit risk
The Group is exposed to credit risk primarily with respect to trade accounts receivable,
loans and other receivables. The Group manages the risk by adopting appropriate credit
control policies and procedures and therefore do not expect to incur material financial
losses. In addition, the Group does not have high concentration of credit risk since they
have a large customer base. The maximum exposure to credit risk is limited to the
carrying amounts of trade accounts receivable, loans and other receivables as stated in
the statement of financial position.
Interest rate risk
The Group exposures to interest rate risk relates primarily to their cash at banks, loans
to unrelated company, bank overdrafts and loans from financial institutions. Most of the
Group’s financial assets and liabilities bear floating interest rates or fixed interest rates
which are close to the market rate.
Significant financial assets and liabilities classified by type of interest rate are
summarised in the table below, with those financial assets and liabilities that carry fixed
interest rates further classified based on the maturity date, or the repricing date if this
occurs before the maturity date.
(Unit: Thousand Baht)
Consolidate financial statements
As at 31 December 2019
Fixed interest rates
Within 1-5 Over Floating Non-interest Effective
1 year years 5 years interest rate bearing Total interest rate
(% per annum)
Financial assets
Cash and cash equivalents 852 - - 9,221 142,178 152,251 0.10 - 0.80
Trade and other receivables - - - - 469,544 469,544 -
Restricted bank deposits 344 1,146 - - - 1,490 0.90 - 1.05
Financial liabilities
Bank overdrafts and short-term
loans from financial institutions - - - 514,494 - 514,494 2.10 - 7.00
Trade and other payables - - - - 296,966 296,966 -
Financial lease payables 1,617 2,317 - - - 3,934 2.45 - 4.75
Long-term loans 95,167 411,313 - - - 506,480 Note 21

41
(Unit: Thousand Baht)
Consolidate financial statements
As at 31 December 2018
Fixed interest rates
Within 1-5 Over Floating Non-interest Effective
1 year years 5 years interest rate bearing Total interest rate
(% per annum)
Financial assets
Cash and cash equivalents - - - 16,014 62,294 78,308 0.10 - 0.375
Current investment 874 - - - - 874 1.05
Trade and other receivables - - - - 450,912 450,912 -
Restricted bank deposits - 1,414 53 - - 1,467 0.90 - 1.05
Financial liabilities
Bank overdrafts and short-term
loans from financial institutions - - - 443,552 - 443,552 3.00 - 7.125
Trade and other payables - - - - 324,740 324,740 -
Financial lease payables 1,035 1,751 - - - 2,786 1.99 - 4.75
Long-term loans 93,974 334,710 - - - 428,684 Note 21
(Unit: Thousand Baht)
Separate financial statements
As at 31 December 2019
Fixed interest rates
Within 1-5 Over Floating Non-interest Effective
1 year years 5 years interest rate bearing Total interest rate
(% per annum)
Financial Assets
Cash and cash equivalents - - - 1,356 107,391 108,747 0.22 - 0.375
Trade and other receivables - - - - 376,875 376,875 -
Short-term loans to subsidiaries 3,445 - - 3,000 - 6,445 3.697 - 4.50
Long-term loans to subsidiary - - - 83,000 - 83,000 3.697
Financial liabilities
Bank overdrafts and short-term
loans from financial institutions - - - 428,054 - 428,054 2.45 - 7.00
Trade and other payables - - - - 216,520 216,520 -
Financial lease payables 525 1,219 - - - 1,744 -
Long-term loans 37,201 254,109 - - - 291,310 Note 21

42
(Unit: Thousand Baht)
Separate financial statements
As at 31 December 2018
Fixed interest rates
Within 1-5 Over Floating Non-interest Effective
1 year years 5 years interest rate bearing Total interest rate
(% per annum)
Financial Assets
Cash and cash equivalents - - - 11,057 38,995 50,052 0.25 - 0.375
Trade and other receivables - - - - 425,131 425,131 -
Short-term loans to subsidiaries 4,161 - - 211,300 - 215,461 3.574 - 4.50
Financial liabilities
Bank overdrafts and short-term
loans from financial institutions - - - 398,151 - 398,151 3.00 - 7.12
Trade and other payables - - - - 257,199 257,199 -
Long-term loans 43,639 291,310 - - - 334,949 Note 21
Foreign currency risk
The Group’s exposure to foreign currency risk arises mainly from trading transactions
and loans that are denominated in foreign currencies. The Company seeks to reduce
this risk by entering into forward exchange contracts when it considers appropriate.
Generally, the forward contracts mature within one year.
As at 31 December 2019 and 2018, the balances of financial assets and liabilities
denominated in foreign currencies are summarised below.
Financial assets Financial liabilities Average exchange rate
Foreign currency 2019 2018 2019 2018 2019 2018
(Baht per 1 foreign currency unit)
US dollar 36,203 63,265 42,000 - 30.1540 32.2848
HK dollar 3,021,990 3,748,287 - - 3.8328 4.1023
Euro - - 44,355 117,495 34.0846 37.4884
31.2 Fair values of financial instruments
Since the majority of the Group’s financial instruments are short-term in nature or bear
interest at rates close to the market interest rates, their fair value is not expected to be
materially different from the amounts presented in the statement of financial position.

43
32. Capital management
The primary objective of the Group’s capital management is to ensure that it has
appropriate capital structure in order to support its business and maximise shareholder
value. As at 31 December 2019, the Group's debt-to-equity ratio was 1.36:1
(2018: 1.27:1) and the Company's was 1.31:1 (2018: 1.36:1).
33. Event after the reporting period
The meeting of the Company’s Board of Directors held on 24 February 2020 passed a
resolution to propose to the shareholders’ meeting to approve dividend payment from
operating results of the year 2019 at Baht 2.00 per share, or a total of Baht 64.68 million.
The dividend will be paid and accounted for after an approval of the Annual General
Meeting of the shareholders of the Company.
34. Approval of financial statements
These financial statements were authorised for issue by the Company’s Board of
Directors on 24 February 2020.