s. j. peacock thesis submitted to the academic boardepubs.surrey.ac.uk/771940/1/468506.pdf · s. j....
TRANSCRIPT

THE PYROLYSIS OF SOME AROMATIC
HYDROCARBONS
by
S. J. Peacock
Thesis submitted to the Academic Board of the University of Surrey for the Degree of Doctor of Philosophy.
British Gas Corporation, London Research Station, Michael Road, London, S. W. 6.2AD
August, 1977.
University of Surrey, Department of Chemistry, Guildford, Surrey, GU2 5X1J
C J

-11-
ACKNOWLEDGEMENTS
The work presented in this thesis was carried out at the London Research
Station of the British Gas Corporation in collaboration with the Physical
Chemistry Department of University of Surrey under the supervision of
Dr. C. T. Brooks at the London Research Station and Dr. B. G. Reuben at
the University of Surrey. I wish to say how grateful I am to Dr. Brooks
and Dr. Reuben for all their help, friendship and encouragement.
I am grateful to the British Gas Corporation for allowing me to carry
out the work in this thesis.
I would also like to thank all those people who have helped with this
thesis, the following in particular:
Mr. J. Williamson and Mr. T. Laker of the analytical section of the London
Research Station for carrying out the mass spectroscopic and X-ray diffrac-
tion work.
S. I. R. A. for carrying out the electron microscopy work.
Dr. N. D. Parkyns and Mr. G. H. Rhodes of the London Research Station for
helpful discussion of the work described here.
My wife, Kathy, and Miss Liz Caswell for the hard work and trouble that
they have taken in the typing of the manuscript.
And finally to my wife for her patience and understanding while I was
carrying out the work in this thesis.

-111-
ABSTRACT
The Pyrolysis of some Aromatic Hydrocarbons
The pyrolyses of benzene and ethyl benzene in a nitrogen carrier
in a static system were investigated. Some high temperature/low
residence time experiments were also performed with benzene in a flow
system. Product analysis was by gas chromatography,.
Between 913 and 1053K benzene pyrolyses by a free radical chain
mechanism. Hydrogen and diphenyl are the major products. The rate
expression /2
dtH2)]/dt = 109'83 exp (-27,100/T) [C6H j mole litre sec
applies between 952 and 1030K and may be explained by a simple
five-step mechanism. At lower temperatures, the experimental activa-
Lion energy is lower than that predicted by theory.
Above 1053K, the benzene ring opens and acetylene, ethylene,
methane and solid carbon are produced. Many polynuclear hydrocarbons
were found to be adsorbed on the carbon and their presence suggests
a-mechanism for carbon formation.
Pyrolysis of ethyl benzene gives hydrogen and styrene as the
major products together with methane, toluene, ethylene, ethane and
benzene plus traces of higher molecular weight hydrocarbons. The
pyrolysis is a chain reaction with a chain length of the order of
10 initiated by
C6H5C2H5 = C6HSCH2 + CH3
for which
k- 14.4 exp (-35,300/T) sec-1.
This agrees well with previous work involving toluene and aniline carriers.

-iv-
The results may be explained by a complex mechanism involving
free radicals, CH3, C6H5CH2, C6H5CHCH3, C6H5CH2CH2, C2H5, C6H5 and H.
Termination seems to occur mainly by the disproportionation reac-
tion :
2C6H5 CHCH3 = C6H5CH: CH2 + C6NSCZH5
For the reaction:
C6H5CHCH3 = C6H5CH: CIi2 +H
a rate constant:
ka 1015.9 exp (-26,200/T) sec-1
was deduced.
-V-
Contents. Page
ACKNOWLEDGEMENTS ii
ABSTRACT iii
PREFACE xi
SECTION I. INDUSTRIAL BACKGROUND 1
Introduction 2
The gas recycle hydrogenator and fluidised bed hydrogenator 4
Operating conditions and results 6
SECTION 2. THE PYROLYSIS OF BENZENE 7
Introduction. ' 8
Experimental 18
Static Apparatus 18
Flow " 26
The gravimetric apparatus used in surface measurement 28
Reactants used 32
Low Temperature pyrolysis of benzene 34
Procedure 34
Product yield 34
Effect of oxygen 36
Comparison of hydrogen and diphenyl yield 37
Effect of surface and inert gas 40
Effect of residence time and benzene pressure 44
Effect of temperature 47
Preliminary discussion of results 50
Investigation into chain nature of the reaction 51

-vi-
effect of added hydrogen 55
Discussion 57
Possible initiation reactions 57
Mechanism involving ist order initiation 57
it 2nd " is 60
Competition between addition and abstraction reaction 5 64
Comparison of rate expressions with experiment 69
Further reactions of benzene at high temperatures 74
Effect of temperature/residence time on product yield 74
if " pressure and temperature on acetylene yield 76
The formation of soot 79
Surface properties of the soot 82
Heat of adsorption of benzene on the soot 86
Mass spectrometric analysis of the soot 86
Possible structure and mechanism of soot formation 93
SECTION 3. PYROLYSIS OF ETHYL BENZENE 98
Introduction 99
Experimental 105
Preliminary observations 105
Effect of varying residence time and added nitrogen 106
to of surface/volume ratio on product yield 109
It varying ethyl benzene pressure ill
Formation of higher-molecular weight products 115
Effect of temperature on product yield 124
Preliminary analysis and interpretation of results 124

-vii-
Discussion
Initiation reactions 132
Propagation reactions 134
Termination reactions 138
Simplified mechanism 140
Analysis of mechanism in full 145
Comparison of ethane and hydrogen yields 145
Rate of styrene formation 150
rate of hydrogen formation 151
Rate of ethane formation 153
Summary of proposed mechanism 154
SECTION 4. OVERALL SUMMARY AND SUGGESTIONS 156
FOR FUTURE WORK
REFERENCES 161
APPENDIX I 165
Calculation of thermodynamic data by additivity and
activation energies by BEBO methods.
APPENDIX II 170
Estimation of pre-exponential factors by Benson's methods
APPENDIX III 181
Heat of reaction calculation

-viii-
NOTES.
1. In general diagrams and plates are included in the page immediately
following reference to them in the text.
2. List of references are included at the end of section 4 and
appendix 2.
3. C. G. S. units are used throughout this thesis and activation energies
are quoted in calories mole-1. (1 cal = 4.18 Joules).
4. A line above a formulae represents a free radical
e. g. CH 3= methyl radical.
SOME COMMON TERMS USED IN THIS THESIS.
k= rate constant. A pre-exponential factor.
E activation energy. T Absolute temperature.
° Gs Standard free energy. Kp = Equilibrium constant. S- entropy.
-ix-.
PREFACE
The work presented in this thesis deals with homogeneous gas phase
hydrocarbon reactions which could possibly occur when fossilised fuels
are turned into substitute natural gas. The thesis is divided into three
sections.
Section one deals with the industrial significance of the work, and
includes a brief description of the commercial processes.
The second section of the thesis deals with the pyrolysis of benzene
both at relatively low temperatures, in which the ring remains largely intact
and at higher temperatures, in which the ring opens and large quantities
of carbon. are formed. Benzene is an important feedstock constitutent
and reaction intermediate in these homogeneous gas making processes.
Berthelot1, over 100 years ago, observed hydrogen and diphenyl to be the
major products at low temperatures and wrote that these products were,
"rattaches a la benzine par des relations tree-simple". However, the
kinetics and mechanism of this important reaction are still largely unknown.
A considerable number of workers have studied the pyrolysis in the high
temperature region but little agreement can be found regarding the reaction
mechanism. In this section of the thesis, kinetics and mechanism of
the low temperature pyrolysis are proposed and then extended to account
for the experimental data obtained for the high temperature reaction. A
brief study of the surface properties of the carbon produced is included
and possible routes for its formation discussed.
Other industrially important pyrolysis reactions are the group involving
the dealkylation of substituted benzenes. In the work discussed in section
three the pyrolysis of ethyl benzene is chosen, since this aromatic compound
also is thermally fairly stable in industrial gas making plant, and its
presence may contribute to carbon formation via a styrene intermediate.
-X-
Previous studies of the pyrolysis of ethyl benzene have been carried out
using the "toluene carrier technique" developed by Szwarc2. This work
considers the ethyl benzene pyrolysis in the absence of carriers.
Kinetic data obtained are compared with the results obtained by carrier
methods and from the results a reaction mechanism is proposed. A
discussion of the consequences of the work in this thesis and its relevance
to hydrogen processing of oils is included.

-1-
SECTION ONE
INDUSTRIAL BACKGROUND

-2-
In the last 30 years there has been a tremendous growth in the world's
demand for energy. Demand in Western Europe and Japan has risen from
450 million tons of oil equivalent in 1950, of which the bulk was derived 3
from coal, to 1300 million tons of oil equivalent in 1970 of which about
two thirds was derived from crude oil and natural gas. This has recently
been accompanied by a rapid increase in the price of the fuel.
Attempts to find cheaper feedstocks have resulted in interest in the
heavier and less easily used ends of the oil barrel. Any process that
can convert these fractions into a premium fuel such as methane is
attractive. In the past, catalytic processes have been used for methane
manufacture, but no catalytic process has been developed for the
gasification of these heavy fractions. Homogeneous processes, which offer
one solution to the problem, are being developed. -
Thermal hydrogenation processes have been the subject of intensive
research both in the U. K. and U. S. A., where the work of Linden et a14 established conditions for the rapid breakdown of hydrocarbons to methane.
British work however, took the effort a stage further, and Dent and his
co-workers5 were able to develop full scale processes to achieve methane
production from oil hydrogenation. Homogenous thermal hydrogenation
processes are carried out in units called the gas recycle hydrogenator. (GRH)
and the fludized bed hydrogenator (FBH). These plants are shown
diagrammatically in fig. 1.1. Typical operating conditions and results
have been summarised by Brooks and Thompson 6 and their data are
summarised in tables 1 and 2. In order to maximise methane formation
and minimize side reactions attempts are made to optimise the stoichiometry
of the reaction
8CXHy + (16x - 4y)H2 = 8xCH4

-3-
DISTIL,. . P. VAPUL'P PROriCT WITZ: " '* --1 ' GAS HYD"Ot MATING GAS
400-500'C. II (1380 F) (750-930 F)
i'ý'ý rid;, /h'
Jet Insul_tion
Ii 1i1 II I kLi-
i Outer tube
Inner tube
v0
RICH GAS OUTt
r !
r, r
Raffles
inner tube
Distributor
FLUU)ISING R+rý, i GAS wº k ATOMISSlruQ GAS
OIL
The Gas Recycle Hydrogenator The Fluidised-Bed Hydrogenctor
FIG: 1.1 Plant for the production of
substitute natural gas by
homogeneous processes.
-4-
where CXHy represents the average compositon of the hydrocarbon
feedstock.
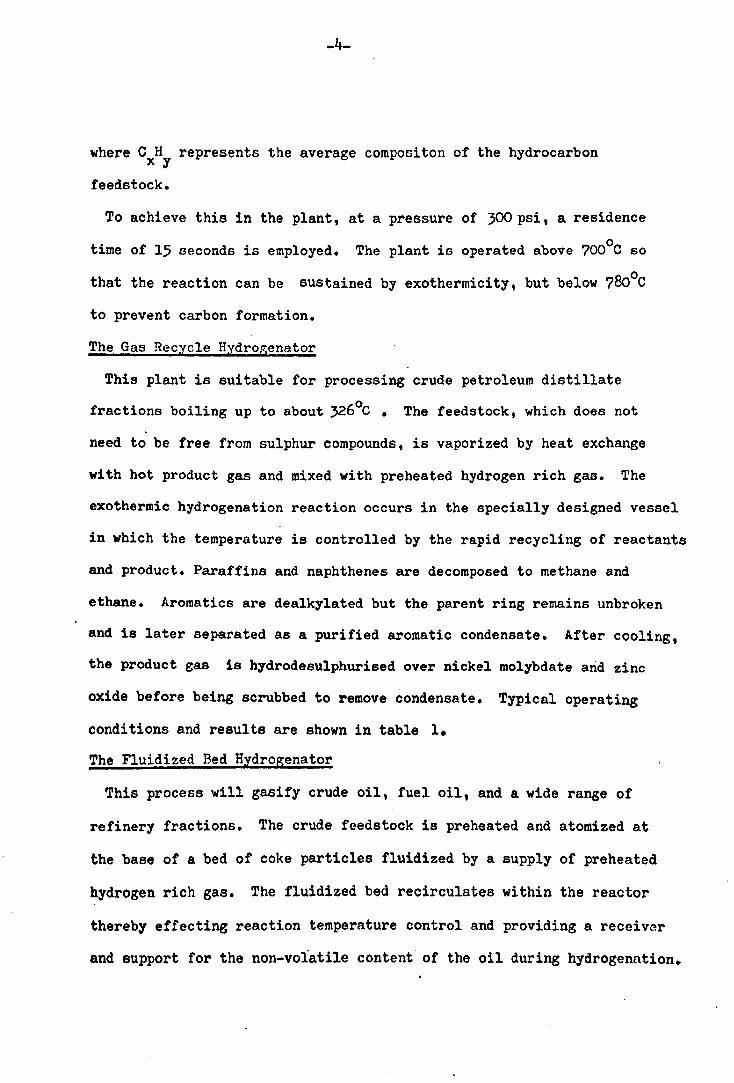
To achieve this in the plant, at a pressure of 300 psi, a residence
time of 15 seconds is employed. The plant is operated above 700°C so
that the reaction can be sustained by exothermicity, but below 780°C
to prevent carbon formation.
The Gas Recycle Hydrogenator
This plant is suitable for processing crude petroleum distillate
fractions boiling up to about 326°C . The feedstock, which does not
need to be free from sulphur compounds, is vaporized by heat exchange
with hot product gas and mixed with preheated hydrogen rich gas. The
exothermic hydrogenation reaction occurs in the specially designed vessel
in which the temperature is controlled by the rapid recycling of reactants
and product. Paraffins and naphthenes are decomposed to methane and
ethane. Aromatics are dealkylated but the parent ring remains unbroken
and is later separated as a purified aromatic condensate. After cooling,
the product gas is hydrodesulphurised over nickel molybdate and zinc
oxide before being scrubbed to remove condensate. Typical operating
conditions and results are shown in table 1.
The Fluidized Bed Hydrogenator
This process will gasify crude oil, fuel oil, and a wide range of
refinery fractions. The crude feedstock is preheated and atomized at
the base of a bed of coke particles fluidized by a supply of preheated
hydrogen rich gas. The fluidized bed recirculates within the reactor
thereby effecting reaction temperature control and providing a receiver
and support for the non-volatile content of the oil during hydrogenation.
-5-
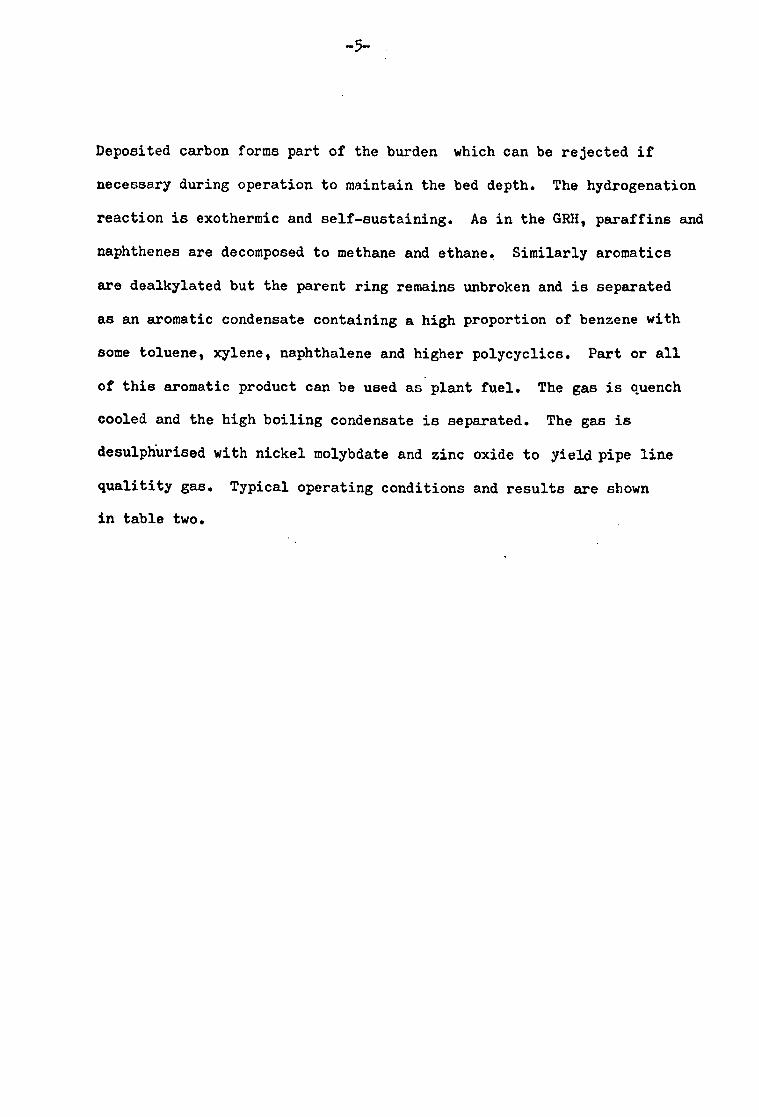
Deposited carbon forms part of the burden which can be rejected if
necessary during operation to maintain the bed depth. The hydrogenation
reaction is exothermic and self-sustaining. As in the GRH, paraffins and
naphthenes are decomposed to methane and ethane. Similarly aromatics
are dealkylated but the parent ring remains unbroken and is separated
as an aromatic condensate containing a high proportion of benzene with
some toluene, xylene, naphthalene and higher polycyclics. Part or all
of this aromatic product can be used as plant fuel. The gas is quench
cooled and the high boiling condensate is separated. The gas is
desulphurised with nickel molybdate and zinc oxide to yield pipe line
qualitity gas. Typical operating conditions and results are shown
in table two.
-6- TABLE 1
TYPICAL CONDITIOr! Ä; 1D R,?:, IULTS ORTAINJ
IN A GAS RECYCLE HY')': OG. EVATOf -
FEEDSTOCK NAPHTHA LOF170 KEROSINE GAS OIL
Operating Conditions
Pressure psi6 900 Temperature C 725
305 305 750 750
Product Gas Composition % by Volume
CO2 0.2 6.8 7.5 Cxliy 0.8 1.0 1.2
co 2.1 3.1 3.0 "H2 24.8 41.7 41.2
CH4 47.1 31.3 29.6 C2H6 24.3 15.3 16.3
N2 1.0 0.8 1.2
TABLE 2
TYPICAL CONDITIONS AND RESULTS OBTAINED
IN A FLUIDISED BED HYDROG . NATOR
FEEDSTOCK ALGERIAN CRUDE MIDDLE i, A:, T C: 2UDZ
Operating Conditions
Pressure psig TemperatureoC
750 750
750
750
Product Gas Composition % by volume
CO2 0.2 0.5 CxHy
0.8 0.5 CO 1.5 1.7 H2
21.7 35.2 CH4
57.5 48.2 c2H6
18.3 13.9

-7-
SECTION TWO
THE PYROLYSIS OF BENZENE

-8-
INTRODUCTION
Benzene is the simplest aromatic hydrocarbon and has been widely
studied. Many of its reactions are quite well understood from both
a theoretical and an experimental viewpoint. Pyrolysis is an exception.
Although various pyrolysis studies have been carried out the kinetics
and mechanism of the reaction are still uncertain.
Apart from the intrinsic interest of the reaction mechanism, the
pyrolysis has many-industrial applications in connection with diphenyl
production and carbon formation. Accordingly the reaction has been
studied from both viewpoints. 1,7,8
Studies date back to Berthelot who found the principle products
of decompostion to be diphenyl and hydrogen. This was confirmed some
years later by Schultz 9,10
who suggested that small amounts of
meta and para diphenyl benzenes were also formed. Much of the work
during the early part of this century 11-19
was involved with
identfication of the reaction products. All workers agreed that
hydrogen and diphenyl were the major products. Some investigators 19
found ortho diphenyl benzene but this was disputed by others. 16
Probably the ortho diphenyl benzene was converted into triphenylene,
although when Bachmann and Clarkei6 pyrolysed it they obtained diphenyl
and carbon only.
Ring opening was a feature of reaction that held the attention of early
workers. Bolton and co-workers 20 found an increase in methane yield as
the temperature rose above 1023K, and attributed this to, "carbon
to carbon decomposition of the benzene molecule. " Kinney and Del Bel21,
however, suggested that "the methane is split out from the more or less
randomly oriented condensed aromatic ring, characteristic of the first
stages of carbon formation, " i. e. the rings tend to shift into a graphite type structure. At reaction temperatures of 1073-1273K these workers21

-9-
found traces. of acetylene in contrast to the work of Zanetti and 15
Egloff who found none. It was observed that carbon deposition was 15
favoured by silica brick packing of the reaction vessel but that
quartz and mullite packing increased the yield of diphenyl. Iley and 22
Riley found three types of carbon deposited which resembled 23
macrocrystalline graphite. Badger and Novotny in"a detailed investigation
identified diphenyl as the major product with significant amounts of
pars-diphenyl, meta-diphenyl benzene and triphenylene at reaction
temperatures of 973K. Fluorene, phenanthrene and possibly ortho diphenyl
benzene were also detected. Methane and ethylene were found in the
exit gases.
Thus it appears that there are two distinct categories of reaction.
The simplest case gives. diphenyl and hydrogen
2C6H6 = (c6H5)2 + H2
and a more complex reaction at higher temperatures, in excess of 1023K
occurs, in which the benzene ring opens. 17
Pease and Morton studied the reaction in static and flow systems
and suggested that it was a normal first order homogeneous gas reaction
At 903K 5% of the benzene decomposed giving equivalent amounts of hydrogen
and diphenyl in the product gases.
On the other hand at reaction temperatures between 1023 and 1125K 18
in a flow system Mead and Burke found the reaction to be heterogeneous
and bimolecular. The reaction was strongly retarded by adsorption
of products on the surface of the reaction vessel. Steel chips in the
reaction vessel had a catalytic effect.

-10-
The rate equation: dx k(a-x) 2 Tt -x
where a= initial concentration
x= amount of decomposition
(l)
fitted the experimental data and an activation energy of 50,000 cals mole-1 was obtained.
Rudenko24-28 showed a heterogeneous reaction to'occur on the
surface of added quartz chips.
Slysh and Kinney29 showed that at 1200K in a flow system with
helium as a carrier gas the reaction was first order with a rate constant
of 20.6 sec. -1. Residence times of between 4 and 112 milliseconds were
obtained by the use of rapid flows through small bore tubes. Products
consisted almost entirely of hydrogen, acetylene and diacetylene together
with diphenyl. For first order reactions, pre-exponential factors of
between 1014 and 1016 are typical. On this basis the rate constant of
20.6 sec. -' would correspond to an activation energy of 70,000 to 80,000 V
cals. mole-1.
As a result of a study of carbon film deposition in a flow system,
Murphy, Palmer and Kinney obtained the rate expression (ii) for benzene
decomposition.
k=5.60 x 10¹⁶ exp (-102,000/RT cal. ) sec`l (ii)
First order kinetics were obtained and a molecular mechanism was
suggested.
Aten and Bauer31, in an attempt to ensure homogeneous reaction
conditions, used a shock tube with a shock temperature in the neighbourhood
of 1500K, and used initial rates of reaction in their calculations.
They deduced the occurrence of a chain reaction with an overall activation
energy of 40,000 cals. mole-1.

-11-
To account for this low value they proposed the following mechanism:
Initiation: C6H6 C6H5+ H (1)
Propagation: C6H6 + H_ C6H5 + H2 (2)
C6H5 = C4H3 + C2H2 (4)
C H3 C4H2 + H (5)
C6H6 + C4H3= C6H5+ C4H4 (6)
Companion Chain: C6H5 C4H4+ C2H (7)
C6H6 + C2H C6H5C2H2 (8)
C4H4 = C4H2 + H2 (9)
Termination: 2C6H5 = C12H10 (3)
2C4H3 = C8H6 (10)
06H5 + C4H3 = C10H8 (11)
For termination via reaction 11 and by ignoring the companion chain they
derived the rate expression (iii)
- d[C6H6] =k4k5+ (2k1
+k4k6 )[c6116]
(iii) dt k1I kll
They proposed that E1=83,000 cals mole-', E6=22,000 cals mole-1 and
E11=0 cals mole-1. Hence on this basis the apparent activation energy
is (E4+16 -Ell) i. e. 105,000 cals mole-1.
This is approximately twice the observed value. If quadratic
termination is considered (e. g. step 3) 52,500ca1s mole-' is predicted.
Hou and Palmer32 studied the pyrolysis at 1173 to 1523K with residence
times from 20 to 250 m secs. in a conventional flow system. In order
to explain their results, complex kinetics involving concurrent first
and second order reactions were invoked. The first order reaction yielded
the rate expression (iv)

-12-
k1 = 109`5exp (-51,000/rT) sec. -1 (iv)
The reaction was assumed to occur via a chain mechanism similar to
that proposed by Aten and Bauer31. It was suggested that the low
activation energy was a result of the stable phenyl radicals decomposing
on the reaction vessel wall in a chain propagation step(4).
C6H5 =C4H3+ 'C2H2 ( 4)
The second order contribution yielded the rate expression (v).
k2 = 1011.0exp(- 40,000/RT)litre mole -1 sec-1 ( v)
This contribution "was postulated to be the homogeneous bi. molecular
formation of diphenyl and hydrogen via a four-centre intermediate.
Fields and Meyerson 33 pyrolysed monodeuterated benzene at 9631:
and observed significant scrambling of hydrogen and deuterium in the
recovered benzene and product diphenyl. Their results are summarised
in table one.
TABLE ONE
PRODUCTS FROM *PYROLYSIS OF B'E'NZENE-d1
No. Rel. abundance of D . 2-Seco contact 21-Sec. contact Atoms Benzene Diphenyl Benzene Diphenyl
0 10.5 7 27.1 13.7 1 84.5 31 52.6 35.0 2 4.9 53 17.3 33.8 3 0.1 9 2.5 13.8 4 ... ... 0.2 3.2
5 ... ... 6 .. 0.5
The isotopic composition of the diphenyl produced corresponded to that
of the benzene that had undergone exchange. They interpreted this as
evidence for a molecular mechanism possibly via a phenylcyclohexadiene
intermediate.

-13-
Reaction (12), however, can also lead to a random loss of 1 atom.
c6H5 + C6H6 = C12H1o +H (12)
Several cannonical structures can be written for the intermediate
radical.
e. g. 470**+ OH 0
ý10.
Their argument is therefore inconclusive.
Mar' yasin and Nabutovskii34 have carried out the pyrolysis of benzene
in shock waves generating reaction conditions of 1400 to 2500K with
6 to 12 milliseconds residence times. Samples after reaction were
automatically selected and analysed by gas-liquid chromatography. Gaseous
products of hydrogen, methane, ethylene, vinylacetylene and diacetylene
as well as carbon black were obtained. For the disappearance of benzene
a second order rate equation was proposed and rate constants were
calculated from expression (vi)
k= 1015exp (-77,000/RT) litre mole-1 sec. -1 (vi)
An abrupt increase in the amount of acetylene produced as the reaction
temperature rose abovel750K was attributed to the start of the frag-
mentation of the benzene ring.
Asaba and Fujii35 recently used a shock tube to study the high
temperature pyrolysis of benzene between 1400 and 1900K. The second
order rate expression (vii) was obtained:
k 109.5exp (-30,000/RT) litre mole-' sec. -' (vii)
The previously postulated molecular mechanisms were questioned.
-ý4-
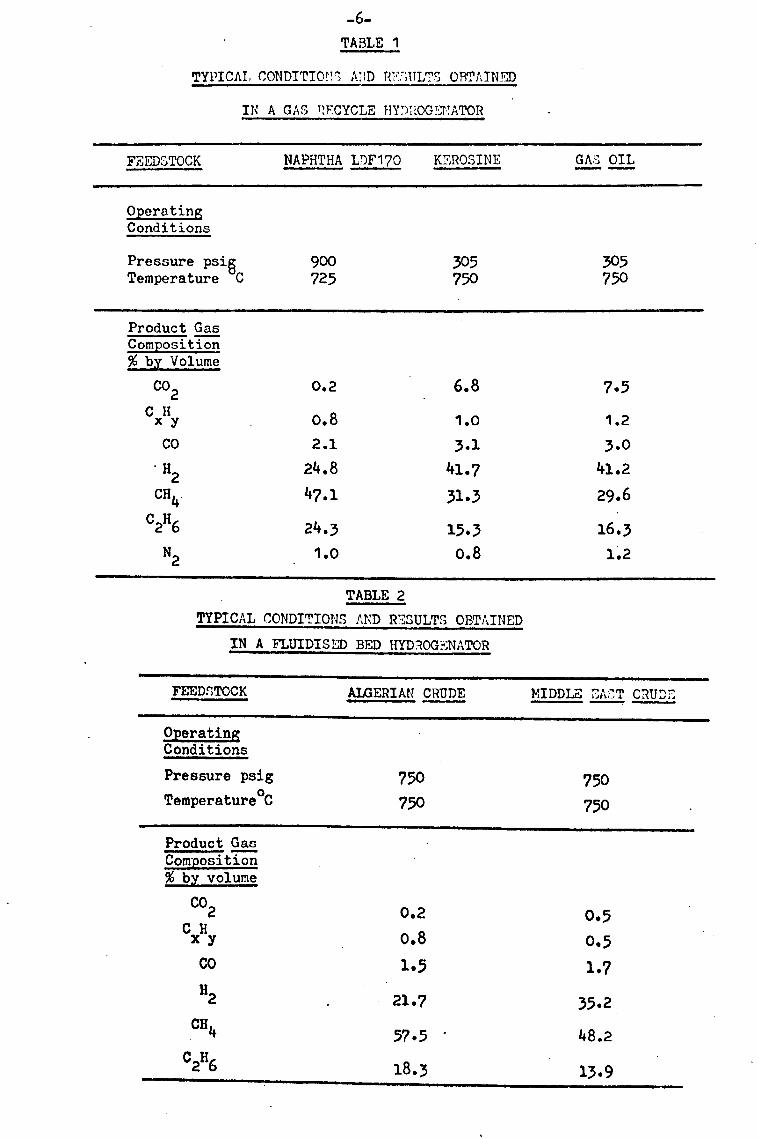
They showed that the reaction was promoted by methane. This was
possibly due to attack on the benzene by hydrogen atoms produced in
methane pyrolysis. This was considered evidence for a chain mechanism.
Also, an induction period was observed in some photo-electric experiments.
Although a complex chain was proposed, it consisted essentially of the
following reactions.
Initiation: c6116 . 06x5 +H (1)
Propagation: C6H6 + 1i = C6H5 + H2 (2)
C6H6 + C6H5 = C12H10 +H (12)
Termination: c6H5 = C4H3 + C2H2 (4)
A stationary state approximation leads to the rate expression (viii)
-dtC6H6]/dt = 2k1(C6H6] + 4k1k12 / k4[C6H61 2 (viii)
Methods due to Benson36'were invoked to show that:
4k1k12 = 109'3exp (-31,000/RT) litre mole-' sec-1 (ix)
For long chains the 2k1tC6H63 contribution in expression (viii) can be
ignored. Thus they suggested that agreement between expression (ix)
and experiment was good.
In a study carried out concurrently with this work Louw and Lucas3?
used a "tank flow reactor" system to establish the free radical nature
of the reaction although the exact mechanism was not established.
Reaction order was found to be 3/2. The mechanism proposed was:
Initiation: C6H6 = C6H5 + H (1)
2C6H6 = C6117 + C6H5 (13)
Propagation: H+ C6H6 C6H7 (14)
+06H6= H2 + 65 (2)
C6H5 +C6H6 =H+ C12H10 (12)
Termination: 06H7 +C6H7 = 20616+ H2 (15)
C6H7 +H = 06H6. + 112 (16)

-15-
The above literature review leads to the following problems and
conclusions.
(a) At temperatures above 1073K there is a wide variation in the results
presented. A tenfold variation in reported rate is not exceptional.
Results obtained are summarised in Fig. 1.2.
(b) At these high temperatures ring opening occurs and large quantities
of carbon are formed.
(c) There is little agreement on orders of reaction.
(d) Little evidence has been presented for the chain nature of the
reaction or for the participation of atoms and radicals. Some investigators
favour a molecular mechanism.
(e) Below 1073K where the reaction
2C6H6 = C12H1o + H2
predominates few kinetic studies have been performed.
(f) There is a difference of opinion regarding the role of the surface
in the reaction.
Table 1.1 summarises the kinetic data obtained to date.
In this work it is hoped to determine the nature of the low
temperature reaction and describe the kinetics of diphenyl formation
and benzene decomposition. Once this has been achieved, it may be
possible to extend the work to higher temperatures and study the
fragmentation of the benzene ring.

-16-
v
v 0 E
b Y
0 r-- C7ý
O
7
t-+
O 5 00
A
40
ssýa T-ýx104(K-1 )
2
U
a) U)
ar
0
El) O
J
.2
.3
( Arrows indicate scale to be used. )
Ko Asaba & Fujii (ref. 35) o Hou & Palmer (2nd order rate const. s 1 (ref. 32 1 ® (1st 32 GSlysh&Kinney(corrected by Hou&Palmer(ref, 29) QMurphy Palmer & Ki nney (ref. 30 ) "Hou&Palmer (corrected by Asaba&Fujii
assuming k =1016.1 exP(-98kcal /RT) sec. -1 ) L ineA from Mar' yasin & Nabutobskii (ref. 34)
FIG. 1: 2 Summary of benzene pyrolysis rate data

-17-
TABI, E _1.1
KINETIC DATA OBTAINED FOR PYROLYISI3 OF BENZENE
alb Reference Order Activation Rate Constant
energy l (cals mole
Pease & Morton (17) 1st order ... ...
Meade & Burk . (18) 2nd order 50,000 ...
Slysh & Kinney (29) 1st order 80,000' 20.6
Murphy et al ' (30) 1st order 102,000 5.6Ox1016exp(-102000/RT)
Aten & Bauer (31) . .. 40,000 ...
Hou & Palmer (32) Mixed d I t 0 1000/RT) 109'5 '( s or er 51, 00 exp -5 k1=
2nd order 40,000 k2=1011'exp (- 40000/RT)
Mar 'yasin and Nabutovskii (34) 2nd order 77,000 1015'0 exp (- 77000/RT)
Asaba & Fujii (35) 2nd order 30,000 109'5 exp (- 30000/RT)
Louw & Lucas (37) 3/2 order ... ... Cham6enQE Al (38) 1st order 52,600 1O$'16 exp(-52, (000/RT)
a. Ist order units: sec. -'
b. 2nd order units: litre mole- 1sec-1
Activation energy estimated from their results.

-18-
EXPERIMENTAL
The majority of the work described in this thesis was carried
out in a static apparatus. It consisted of a vacuum line, sections
of which were fitted with high vacuum stainless steel bellows valves.
This made possible the study of the pyrolysis of relatively high boiling
liquids.
Some experiments where a small residence time was required were carried
out using a linear flow method.
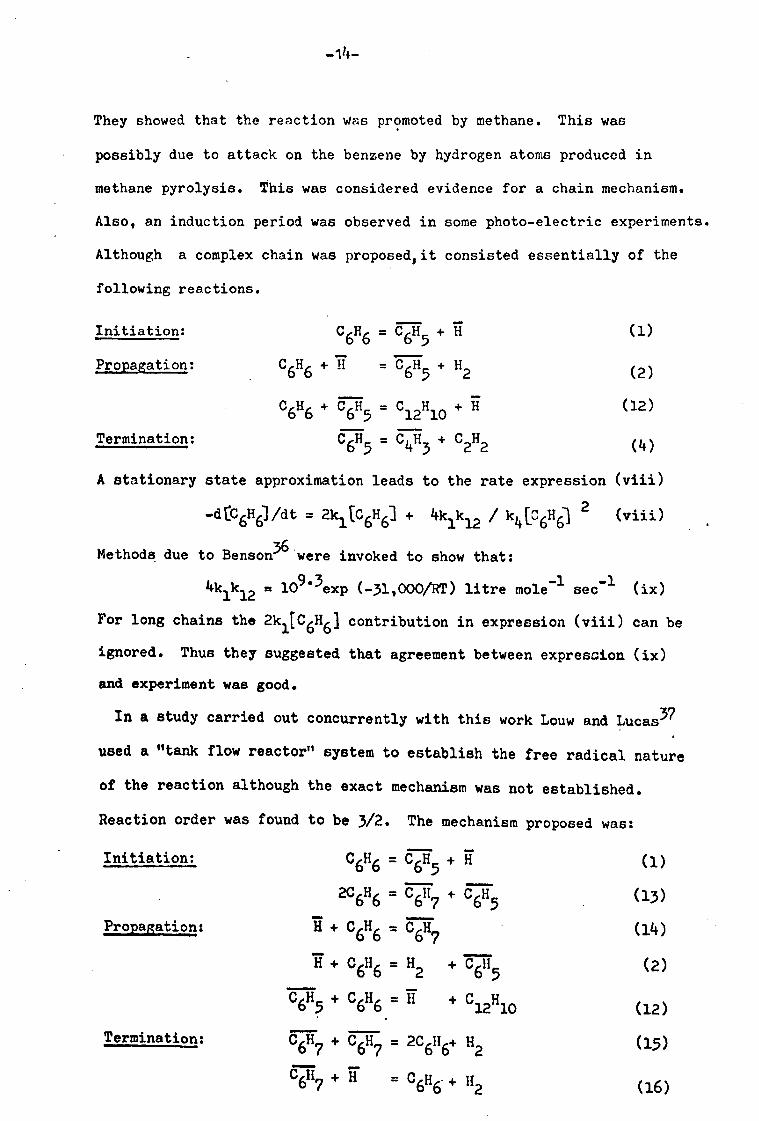
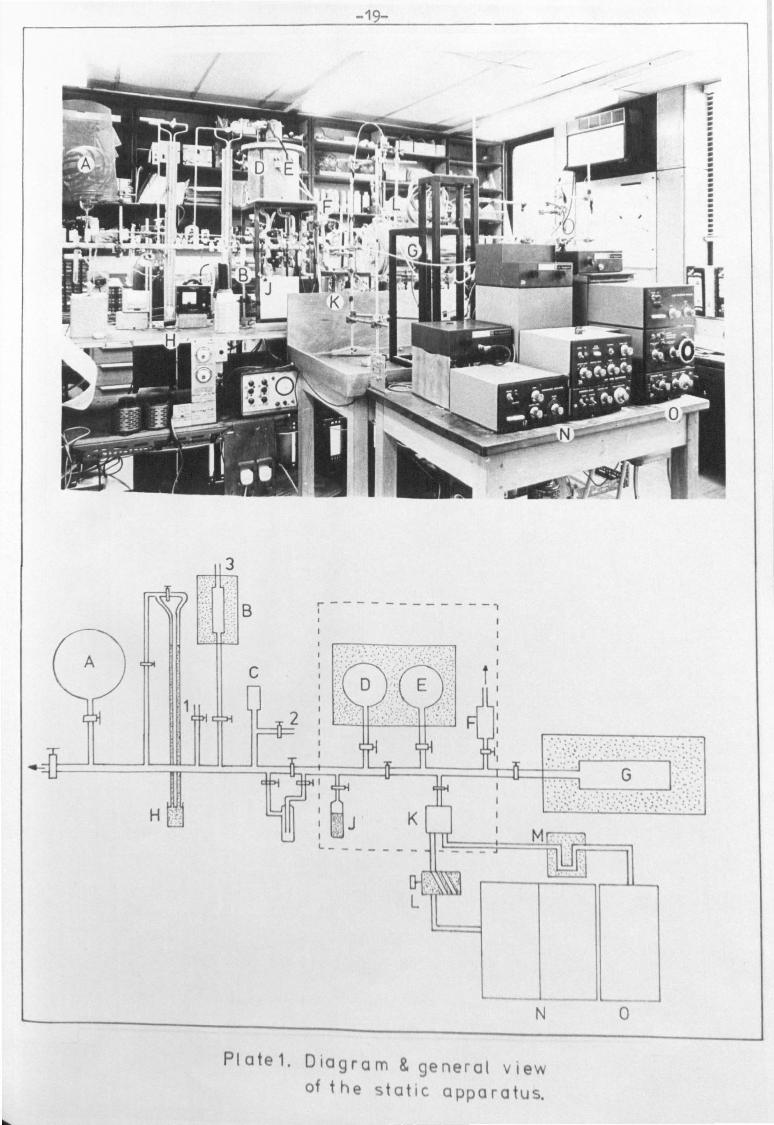
The Static Apparatus
A general view of the apparatus together with a line diagram is shown
in plate 1.
The apparatus consists of four sections.
a) a vacuum line
b) a gas handling system
c) a reaction vessel
d) a sampling and analytical system
a) Vacuum line
A conventional vacuum line, constructed from pyrex tubing was used.
Vacuum was achieved by means of an Edwards D75, two stage, rotary oil pump
together with an Edwards E02 silicon oil diffusion pump. A trap, at liquid
nitrogen temperatures, was incorporated between the pumping system and
the vacuum line. This prevented back diffusion of pump oil and ensured
an ultimate pressure in the system of less than lÖ-4 torr, although a
pressure of 1073 torr was considered acceptable for most work. Vacuum was
measured using an Edwards Pirani gauge (C).
Globe (A) was used as a storage vessel in which gas mixtures were kept,
or alternatively as a temporary storage vessel for gas mixtures that were to
be introduced into the reaction vessel.
-1
ý, ý,
11
1 46-
N0
Plate 1. Diagram & general view of the static apparatus.

-20-
The mercury manometer (H) was used to calibrate the pressure
transducer M.
There were three gas inlets, labelled 1,2 and 3. Each incorporated
a trap, which could be cooled if necessary to facilitate further
purification. Nitrogen was purified by passage through
a tube containing copper turnings heated to 350°C by the furnace (B).
This removed any traces of oxygen in the nitrogen.
A removable "cold finger" trap which could be maintained at liquid
nitrogen temperature was incorporated between the vacuum line and the
gas handling system.. This was used to prevent contamination of the
unheated glassware by reactant and products. The stop-cocks on the
vacuum line were greased with Apiezon M grease. For some of the later
runs with ethyl benzene the line was rebuilt with greaseless taps,
containing teflon and neoprene "0" rings, manufactured by J. Young and Co.
of Acton,
b) The gas handling system
The gas handling system is the section of the apparatus enclosed by
the dotted line on plate 1. It was constructed of thin wall stainless
steel tubing j inch o. d. Connection to the vacuum line was with a glass-
to-metal Covar seal. The whole section could be heated to about 423K
by heating tape,
The reactant liquid was stored in the pyrex reservoir (J) and connected
to the system by a glass-to-metal seal.
Globe (D) was used for mixing and (E) for sampling. These were heated
in an enclosure fitted with a fan to level out temperatures.
Mixture pressures were measured by the pressure transducer (F).

-21-
This pressure transducer was an E. M. I. (S. E. Laboratories Division)
Type SE 180. The coils were encapsulated in epoxy resin. This
enabled it to be used at temperatures up to 448K. The unit was
controlled by a SE905 convertor box and the millivolt output measured
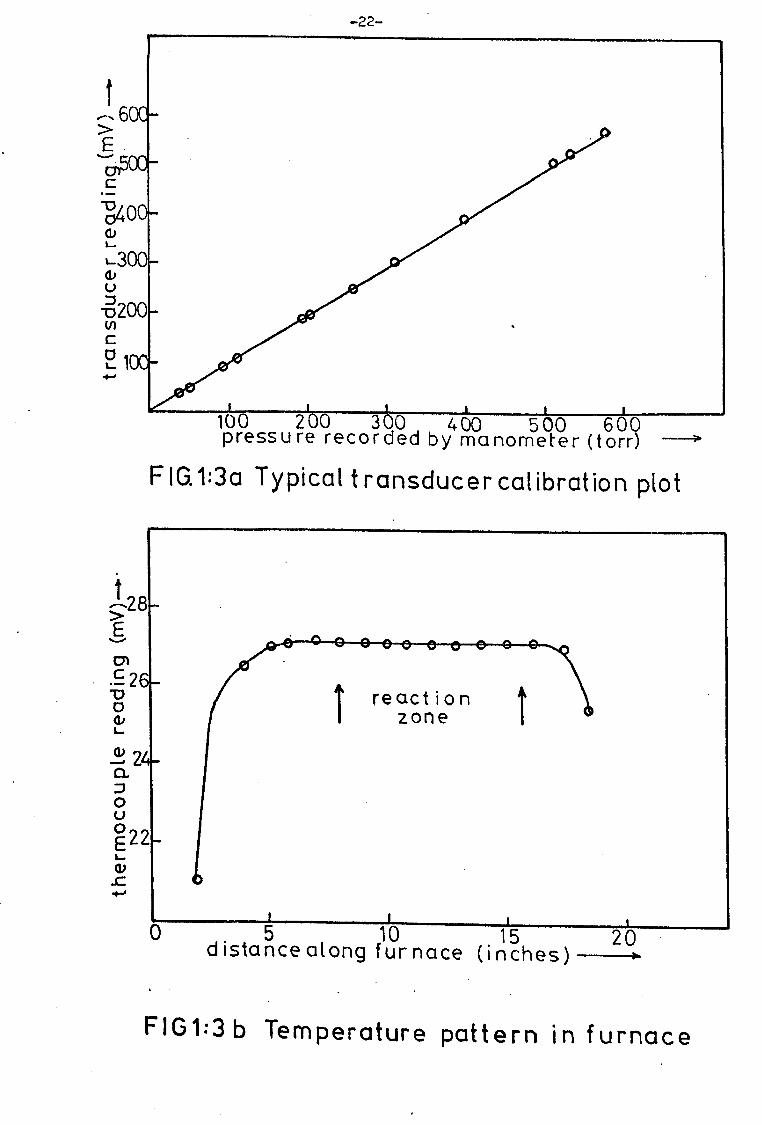
by a Solartron digital voltmeter. A typical calibration graph is shown
in Fig. 1: 3(a). The system is capable of measuring pressure differences of
0.01 torr.
The taps on the gas handling system were Hoke series 4100 stainless
steel bellows sealed valves and connections were made with Hoke Gyrolok
ý" stainless steel fittings. For leak tight operations (especially
at high temperatures) sealing of the valve is achieved by a thin stainless
steel bellows. One end of the bellows is sealed to the valve stein and
the other to a fixed ring. The tapered regulating stem makes possible
a limited degree of metering. Long lifetime and leak-free use was
obtained from these taps, which only ceased to function properly when
the valve seats became damaged and gas leaked across the seat.
c) The Reaction Vessels
Cylindrical clear silica reaction vessels, of the dimensions shown
in table 1: 3 were used. Most experiments involved vessel A, the others
being used tc test for heterogenous behaviour.
TABLE
REACTION VESSELS USED
Vessel. Diameter. Length. Surface/Volume Ratio. (mm) (mm) (mm_ )
A 60 200 0.077 B 45 200 0.100 C 30 200 0.143 D 20 200 0.205
50 200 1.105
'Packed with J" thin wall silica tubes.
-22-
f
FIG 1: 3a Typical t ransducer calibration plot
fie E cm
ü (li L- N
a 0 U O,
c L
FIG1: 3 b Temperature pattern in furnace
d istance along furnace (inches) ------b.
-23-
Vessels were pretreated by washing successively with carbon
tetrachloride, methanol, concentrated nitric acid and distilled water.
Before use vessels were pumped for at least twenty four hours, at
the reaction temperature.
The reaction vessel was housed in a tubular furnace 24ins long
by 12ins. diameter, manufactured by Carbolite Ltd. It had 3 windings
each of which was wired in series and connected to a separate
rheostat. An even temperature over the length of the reaction
vessel could be achieved by adjustment of the current through the end
windings. A typical tamperature pattern is shown in Fig. l: 3(b).
Temperature was controlled to within ± 0.5°C by an AEI platinum
resistance thermometer controller and was measured with a chromel-alumel
thermocouple attached to a Digitec, 0 to 40.00 mV range, digital
voltmeter.
d) Sampling and Analytical System
After reaction, the reaction mixture was passed through a
U-tr4p cooled with an acetone-cardice mixture, and into a gas
chromatograph gas sampling loop. Gases were analysed directly. Liquid
and solid products were trapped in the U tube which was constructed
of very thin walled stainless steel. It was controlled by two Hoke
stainless steel two way taps. The arrangement is shown in Fig. l: (a).
For liquid and solid product analysis the taps were set so that carrier
gas flowed through the U trap, down a thin walled stainless steel transfer
line and through a "precolumn" of silicone gum rubber on chromasorb G,
before entering the gas chromatograph. The U tube and transfer line were
heated whilst the precolumn was cooled with an acetone-cardice mixture.
Products were compressed to a small slug on the precolumn. On removal
of the cold bath products were swept directly onto the column of the
gas chromatograph.

-24-
tosample loop(ga ses)
carrier heated liquid transfer product
react ion l in e mixture : -±-1 --ý'
yvV"
,I"1
"I '""recotumr
acetone- cardice baths
FIG. 1: 4a Product sampling system
transducer
A DB react ion
G
vessel
G
F1 G. '1: 4b Dead space volume

-25-
This was a Perkin Elmer Fll fitted with a flame ionization detector.
A o. d. silicone oil/bentone on chromasorb W column was used for
liquid product analysis. For polynuclear solid products aio. d. silicone
gum rubber on chrdmasorb G column gave a more satisfactory separation.
The oven temperature was 150°C and nitrogen carrier gas at 15 p. s. i. inlet
pressure was used for both analysis.
Another Perkin Elmer F11 was used for gas analysis. The sample contained
in a 50c. c. loop was injected into the chromatograph via a Loenco valve.
A large volume loop could be used without peaks being smeared out because
mixture pressures were usually 200 torr and never went above 400 torr.
Nitrogen carrier at 35 p. s. i. then compressed the sample into a small slug
which was separated on a4 metre 11
o. d. charcoal column. The oven
temperature was 150°C. Hydrogen was analysed by a hot wire detector, but,
for hydrocarbon gas analysis a flame ionisation detector in series with it
was used.
Peak area measurements were made using a Honeywell electronic integrator.
Some Potential errors in the system
i) The largest potential error in a static apparatus is that due to the
dead space volume. This is the volume containing reactant which is
not heated to the reaction temperature. In the system shown in figure
1: 4b the dead space was made up of the inlet glass capillary (0.2c. c. ),
the metal system (0.5c. c. ) and the volume of the transducer(0.5c. c. ).
Altogether, this comprises only 0.2% of the volume of a typical
reaction vessel and was considered negligible.
ii) The error due to the time taken for the pressure and temperature of
the reaction mixture to reach the equilibrium value was also thought
to be negligible.

-26-
With the transducer on its most sengitive setting, equilibrium pressure
was seen to be reached in a time of less than 0.5 seconds. This time
is small compared with the residence times used of 30 seconds to 10
minutes.
iii) It is possible for the heat of reaction to be such that the
temperature at the centre of the reaction vessel is different from
the furnace temperature. Benzene pyrolysis is almost thermoneutral
(AH. = 3000 cals. mole-' ) and this effect is also negligible.
These errors therefore were considered to have no observable effect on
the pyrolysis and in future experiments and discussion were ignored.
The Flow Apparatus
. `A simple flow apparatus operating at atmospheric pressure was built to
enable benzene pyrolysis at high temperatures and small residence times
to be investigated... Aline diagram of the system is shown in figure 1: 5.
Nitrogen was used as a carrier gas and its flow was controlled by a
needle valve and measured on a Matheson rotameter (A) which was monitored
by a soap bubble flowmeter (G).
Benzene was admitted to the system by a simple saturator device (B).
This comprised two traps maintained at a constant temperature (t 0.5°C) by
a cold water bath. The nitrogen bubbled, via a sintered disc, through
the liquid and introduced a known quantity of vapour into the system.
This depended on the vapour pressure of benzene at the bath temperature.
Residence time was varied by alteration of the flow of nitrogen through
the by-pass stream (2). Streams (1) and (2) were allowed to mix and then
enter the reaction vessel (C).
For the runs in which the collection of large quantities of products was desired, operating conditions of the system were similar to those in the static apparatus.

-27-
Ll I
G
qH
A Rota-meter B Saturator C Furnace D Cold trap at -80"C E Trap at 0°C F Sample valve
G Soap bubble fl owm eter H Analysis by gas
chromatography Needle valves Greaseless
stopcocks
Fig 1: 5 Line diagram of the f low apparatus

-28-
Accordingly a furnace and reaction vessel of similar dimensions were
employed.
In order to obtain small residence times a small furnace, shown
diagrammatically in figure 1: 6(a), was constructed using nichrome tape
(12.57ohms per yard) wound round a silica tube former. The whole was
held in place with Autostick high temperature adhesive. A typical
temperature profile is shown in figure 1: 6(b). It is not good, but
as precise kinetic parameters were not required it was considered adequate.
The accurate measurement of reaction temperatures of the order of
1173 to 1273K presented a problem. Radiation errors were minimized
by use*of a fine gauge (0.125 mm diameter) Pt/Pt13%Rh thermocouple. The
gas stream temperature was measured prior to reaction. During. reaction
the thermocouple was removed. Plug flow was assumed for the calculation
of residence times although laminar flow almost certainly occurred.
Solid and liquid products were collected in trap (D) which was maintained
at-83°C by an acetone/solid cardon dioxide bath. Trap(E) was maintained
at 0°C and prevented any carry-over of products into the gas sampling
Loenco valve (F). 'Gases were analysed by the on-line gas chromatograph
(H). Solid and liquid products were injected into a separate gas
chromatograph. Some analyses were performed with an Edwards Chromato-Mass
Spectrometer.
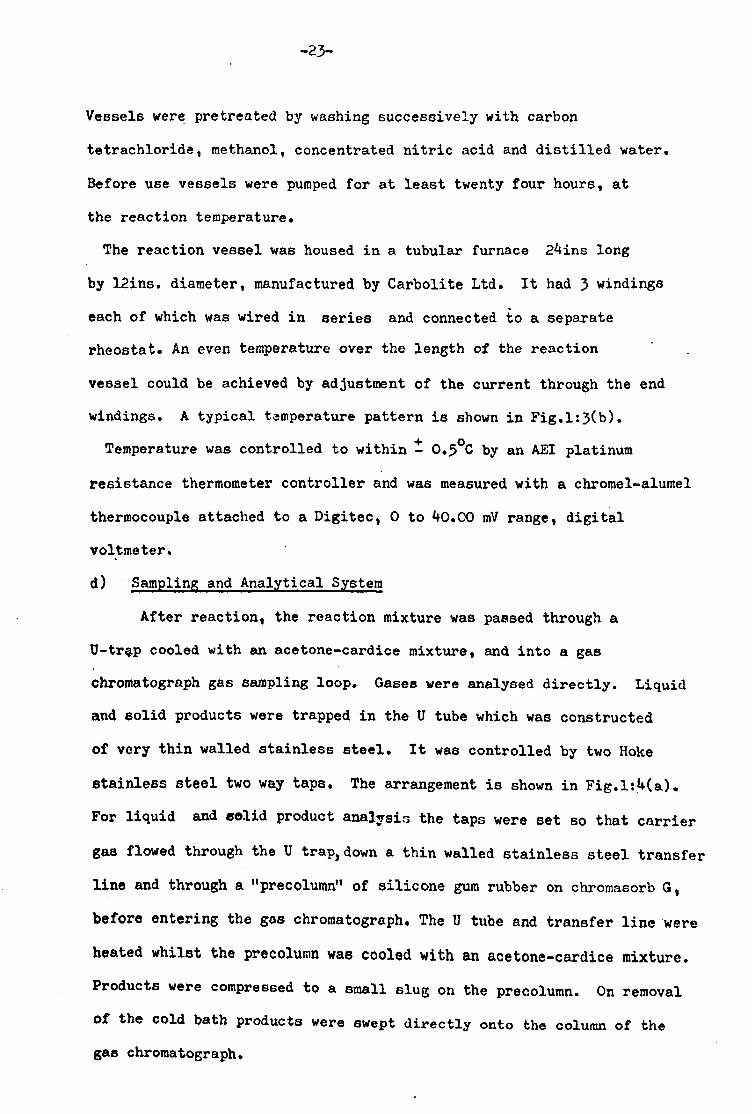
Gravimetric Apparatus used in Surface Measurements
The gravimetric apparatus was used for measurement of the surface
of carbons deposited during pyrolysis. It is illustrated in Plate 2.
The system shown in figures 1: 7(a) and 1: 7(b) has been described by 39 Cutting and was built around. a Cahn Electrobalance with nichrome
hangdown wires and gold buckets. The Cahn balance operates on a null
deflection principle and is capable of measuring mass changes of 10-6 gme

-29-
-reaction vessel
-silica former
®-t `ý". ; ;, " nichrome tape regavolt ;: " ; heating element power A%
00 0 supply 2c . «ý 6c Autosti ckhigh . temp. cement L6
00 0t
240V 100V
0.6cm
FIG. 1: 6a Furnaceand controlling system for flow apparatus
7 E Q c =v 0 a L
Q
3 O V O E L
r
01 distance down reactor (cros) b,
5
F IG. 1: 6b Temperature profile of reactor

--. 30-
Cahn electrobalance
vacuum pumps
elect robalanc control unit
mass recorder
transducer
adsorbate supply
FIG. 1: 7a Gravimetric apparatus used for surface measurements
balance control Tphototube
ma net
[amp
ribbo7ý counter5alanc suspension
ma
sample
FIG. 1: 7b Diagrammatic representation of Cahn microbalance
-31-
ABOVE : General view of the
balance and gas
handling system.
LEFT : Close-up of the
weighing sect ion
of the apparatus.
PLATE 2 Microbalance used for the surface measurements

-32-
A sample of approximately 40 mg mass was accurately weighed in the
sample bucket. It was then counterbalanced with standard weights until
the balance reading was a few milligrams above zero to allow for out-
gassing of the sample. The latter was warmed to 300°C and left overnight
to outgas. An ultimate vacuum of below 10-5 torr was achieved. Doses
of adsorbate were introduce into the balance and the increase in sample
weight measured. A straight trace on the mass recorder indicated that
equilibrium had been reached. Adsorbate pressure was measured on a
Bell and Howell pressure transducer.
Reactants Used In All Systems
Benzene
Phillips research grade benzene was used. Purity was stated to be
greater than 99.90 mol per cent. This was confirmed by gas chromatographic
analysis. The. main impurity was toluene.
Traces of oxygen 4o
can have a profound effect on free radical pyrolysis
reactions and care was taken to ensure that the reagent was thoroughly
degassed before use. On the static apparatus the sample was stored in a small
glass bulb and frozen with liquid nitrogen. The bulb was allowed to warm
up to room temperature and, as the solid meltedythe dissolved air was pumped
off. The procedure was repeated until no more air came off. This usually
occurred after four degassings. The sample could then be warmed up to
about 120°C and used in the static system in situ. In the flow system the
sample was introduced into the saturator device and nitrogen bubbled
through for 30 minutes before a run was started.
Ethyl Benzene
Phillips research grade, stated purity 99.92 mol per cent, ethyl benzene
treated as above, was used.

-33-
Nitrogen
Cylinder nitrogen of white spot quality was used. Traces of oxygen
were removed by passage over copper turnings at 300°C.
Nitric Oxide
Matheson 99.0% pure quality was used. The sample was purified by
being frozen and pumped on as it warmed up. The nitric oxide was allowed
to evaporate into an evacuated globe. Initial and final fractions, the
latter containing a high proportion of nitrogen dioxide (m. p. -11.2°C),
were rejected. This freezing - distillation procedure was repeated four
times to ensure removal of any impurity.
Propylene
Phillips research grade propylene of purity 99.99 mole per cent was
used without further purification. The freezing-distillation procedure
described above was carried cut several times to ensure that any air
admitted during filling of the globe was removed.
a

-34-
THE LOW TEMPERATURE PYROLYSIS OF BET! ; ENE
Procedure
The majority of the experiments described here were carried out
using the static apparatus described earlier 4n this section. Gas
and vapour mixtures were normally made up in the heated globe. In a
typical experiment, forty torr of benzene were taken and nitrogen added
until four hundred torr pressure was reached. When the mixture was
admitted directly to the evacuated reaction vessel the total pressure
dropped immediately to around three hundred torr. After a period of
time the reaction mixture was removed from the vessel and the products
of reaction sampled and analysed.
Some preliminary experiments
The object of these preliminary experiments was to establish some
of the major facts of the pyrolysis and hence the working conditions
for studying the reaction.
The conditions to be established are:
1. determination of a working temperature range,
2. effect of impurities on the reaction (particularly oxygen),
3. effect of vessel surfaces and type of reactor used,
4. effect of added "inert" gas on the reaction,
5. nature of the product distribution.
1. Product yield over a wide temperature range
A reaction mixture was made up and introduced into the reaction vessel
from the mixing globe so as to give 31 torr benzene and 269 torr nitrogen
in the vessel. The results obtained are shown in figure 2: 1.

-35-
2 r-. i 1 O
,,
N L
N
N "L
a U
-Q O
0
FIG. 2'. 1 Pyrolysis of 31 torr benzene; yietd of hydrogen o and rnetha'ne " after one minute.
4
Temperature (°C) ------V,

-36-
Hydrogen is the major product"and small quantities of methane are
also formed. The methane can be formed by at least two routes.
Very small quantities can be formed by the decomposition of toluene
impurity.
The opening of the benzene ring can lead to the formation of straight
chain hydrocarbons. These c^n then be rapidly hydrogenat'd to methane.
The toluene impurity was shown previously to be very small. The
research grade benzene was 99.90 mole per cent pure. Rate data for
methane formation from toluene have been produced l The maximum methane
expected from toluene impurity is 6x10⁻⁴ torr after one minute residence
time. Therefore, at temperatures in excess of 1033K ring opening must
become significant, the apparent activation energy being 83,000 cals mole-'.
The low temperature pyrolysis must therefore, be studied above 883K, so
that measurable quantities of product can be obtained, but below 1033K,
to avoid significant ring opening.
Possible effects of small quantities of oxygen
The effect of small quantities of oxygen has been shown by Leathard
and Purnell40 to be significant in the gas phase pyrolysis of paraffins.
It is probable that this observed sensitising effect will hold true for
aromatic hydrocarbon pyrolysis as well. If oxygen is present in the
purified nitrogen, or air is dissolved in the aromatic hydrocarbon, then
an effect will be observed on the product yield. Air was removed from the
aromatic hydrocarbon by the process described earlier. Once all the air
had been apparently removed a run was carried out. The observed rate of
reaction was independent of the number of degassing cycles and suggests
that oxygen is absent from the hydrocarbon. If air is present in the
purified nitrogen then an effect on the product yield will be observed
when varying amounts of this "nitrogen" are added to the reaction mixture.
-37-
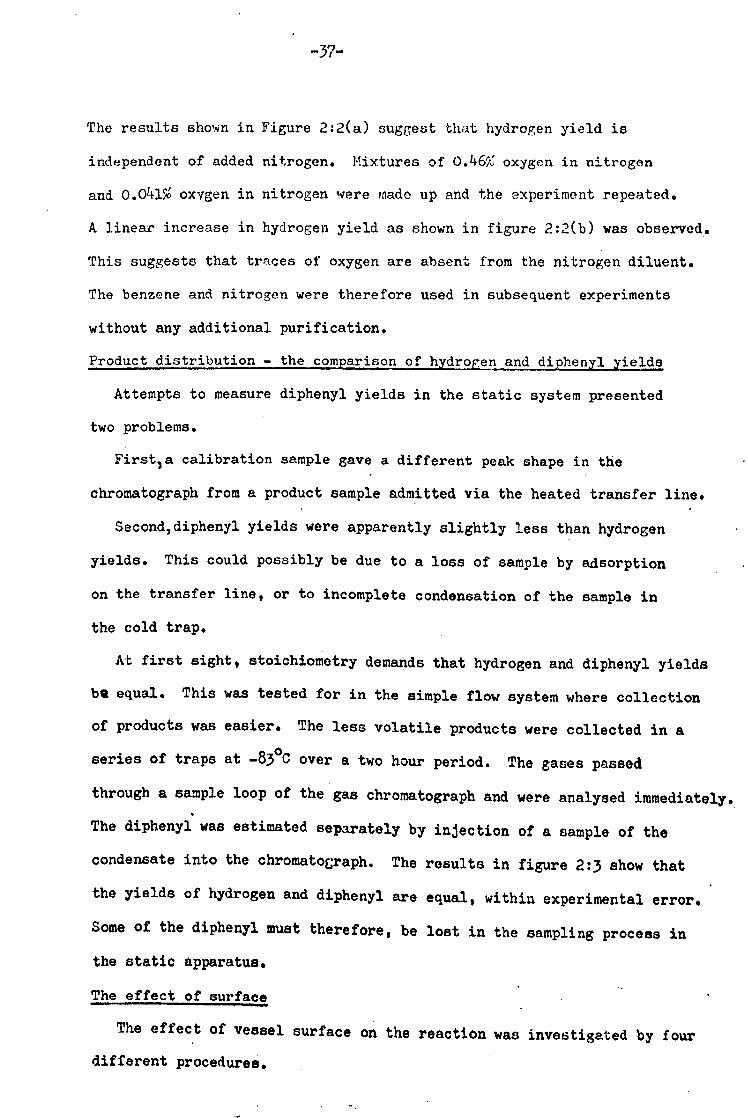
The results shown in Figure 2: 2(a) suggest that hydrogen yield is
independent of added nitrogen. Mixtures of 0.46% oxygen in nitrogen
and 0.041% oxygen in nitrogen were made up and the experiment repeated.
A linear increase in hydrogen yield as shown in figure 2: 2(b) was observed.
This suggests that traces of oxygen are absent from the nitrogen diluent.
The benzene and nitrogen were therefore used in subsequent experiments
without any additional purification.
Product distribution - the comparison of hydrogen and diphenyl yields
Attempts to measure diphenyl yields in the static system presented
two problems.
First, a calibration sample gave a different peak shape in the
chromatograph from a product sample admitted via the heated transfer line.
Second, diphenyl yields were apparently slightly less than hydrogen
yields. This could possibly be due to a loss of sample by adsorption
on the transfer line, or to incomplete condensation of the sample in
the cold trap.
At first sight, stoichiometry demands that hydrogen and diphenyl yields
be equal. This was tested for in the simple flow system where collection
of products was easier. The less volatile products were collected in a
series of traps at -83°C over a two hour period. The gases passed
through a sample loop of the gas chromatograph and were analysed immediately.
The diphenyl was estimated separately by injection of a sample of the
condensate into the chromatocraph. The results in figure 2: 3 show that
the yields of hydrogen and diphenyl are equal, within experimental error. Some of the diphenyl must therefore, be lost in the sampling process in
the static apparatus.
The effect of surface
The effect of vessel surface on the reaction was investigated by four
different procedures,

-38-
b) 0.46% oxygen presen
0
O
7
a)
C0
Q1 O
I, - o. A
0
i i'
,f (b) 0.041 %oxygen
O' present
(a)nitrogen 2 only
0 100 - 200 300 400 500 gas mixture in react ion vessel (torr)
FIG. 2: 2 Effect of added oxygen on the pyrolysis of benzene.

-39-
O
U
"0 O L a
. I- O a,
uI Ul v a
0
FIG. 2: 3 Yields of di phenyl o and hydrogen* ina flow system with 1 minute residence time.
ff
reaction temperature (°C)-ý

_40-
a) Alteration of the surface to volume ratio of the reaction vessel.
b) Alteration of the nature of the vessel's surface, e. g., salt and
carbon coated vessels.
c) Pyrolysis in the presence of various amounts of inert gas whilst
keeping a fixed amount of reactant.
d) Observation of the effect of different "inert" gases on diphenyl yield.
Before use, the vessels were treated by the method described in the
experimental section.
a) Alteration of surface to volume ratios
Reaction vessels A, B, C and D, diameters sixty, forty five, thirty,
twenty mms and E, diameter fifty mm, but packed with silica tubes
were used. A standard benzene pressure of thirty torr was used in
these experiments. Figure 2: 4(a) shows the results obtained at a
reaction temperature of 960K.
b) Alteration of the vessel's surface ;
Vessels of forty five mm diameter were coated with salt and carbon,
and the experiments repeated. The points are also included on Figure
2: 4(a). The carbon coating has little effect on reaction rate but a
salt coating reduces it slightly.
c) Effect of added inert gas on hydrogen yield:
In this and all subsequent experiments reaction vessel A was used.
Various pressures of nitrogen were added to a fixed 31 torr pressure of
benzene. The results summarised in figure 2: 4(b) show that product
yield is independent of added nitrogen,
d) Effect of different inert gases on product_yield :
Hydrogen yields were difficult to measure in the presence of inert
gases other than nitrogen.. Normally, hydrogen concentrations were
measured on a gas chromatograph with a hob wire detector and nitrogen as
a carrier.

-41-
L. 0
carbon coated E0.8 " salt coated 0 c a q)os 0
s 1. -04 0
02
0 0.2 0.4 0.6 0.8 1.2 1.4 surface /vol ume ratio (mm-1)
FtG. 2: 4a Effect of change in surface/volume
ratio on benzene pyrolysis
a

-42-
Oý
-0 a)
C
CJl O i
t
0 100 200 300 400 500 pressure of added nitrogen (torr) ----º
FIG. 2: 4b Effect of added nitrogen on hydrogen yield from benzene pyrolysis
0 N L- a .x0
. 4, a
a,
c 4) r a
00
00 0 0 00 0
ýo 0
reaction 0
t emp968 Kl
0 100,200 300 400 500 pressure of added inert gas (torn)
FIG, 2: 4c Effect of added inert gas on diphenyl yield from benzene pyrolysis 0 argon, * hel i um, ® ni trogen
6
A

-43-
Any inert gas other than nitrogen would appear as a large peak on
the gas chromatograph and mask the relatively small hydrogen product
peak. A possible solution is to use the inert gas as a carrier. This
is satisfactory providing the thermal conductivities of the carrier and
hydrogen are different. Hydrogen and helium have similar conductivities
and a loss of sensitivity results. Therefore, the experiment was
carried out by measurement of diphenyl yield.
Argon, helium and nitrogen were used as diluents and the experiment
was carried out as described in (c) above. The results shown in
figure 2: 4(c) indicate that diphenyl yield is independent of the nature
of the inert gas.
Surface can affect a chain reaction by promoting initiation or
termination of chains. In the former case, free radicals are formed at
the surface and released into the volume of the vessel. In the latter
case, atoms or radicals are adsorbed at the surface and subsequently
combine with further atoms or radicals from the gas phase. In both cases,
the nature of the surface has a marked effect on the reaction rate
and results tend to be irreproducible. The consistency of the results
reported here suggests that heterogeneous effects are insignificant.
At most, in a packed reaction vessel rate is reduced by one third.
It is not uncommon for surface reactions to affect reaction rate by
several orders of magnitude40. All subsequent experiments were carried
out in vessel A of diameter-60mm. High mixture pressures of 300 torr
were used. Under these conditions the small heterogeneous effect ways
ignored..

-44-
Kinetic Experiments
The work was carried out in the 60 mm reaction vessel by the
method described previously. The effects of variation of residence
time, reactant pressure and temperature were measured so that the
order of reaction and its activation energy could be established,
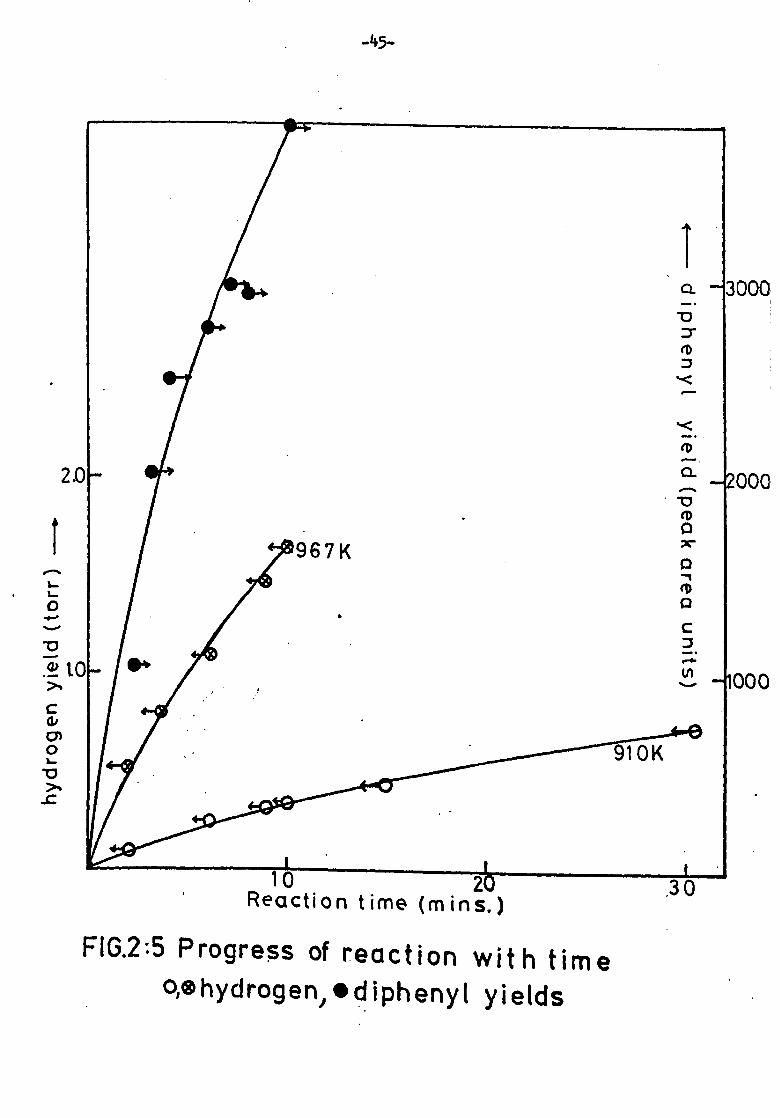
Effect of residence time
Hydrogen formation was measured after residence times between
one and thirty minutes. The experiment was carried out at temperatures
of 910K and 967K. The results are shown in figure 2: 5. Results for
diphenyl formation are also shown.
In all cases curves are slightly convex. In the early stages,
however, they are acceptably close to linearity and the integrated rate
of formation of product after four minutes residence time was usually
taken as proportional to the initial rate of reaction.
Effect of benzene pressure
Benzene pressures from ten to fifty torr were used and the rato
of reaction was measured by observation of both hydrogen and diphenyl
yields. The results are shown in figure 2: 6. The order of reaction
was obtained by the Van't Hoff 4?
- method; log (rate of product formation)
was plotted against log (initial benzene concentration). The slope of
the straight line graph yielded the reaction order. A least squares
analysis of the data in figure 2: 6 gave an order of 1.4 for diphenyl
and 1.6 for hydrogen.
An alternative test for order is to use the integrated form of the
rate equation. For first order reactions the integrated, rate equation
is:
2.303 log10 (a) /-(a-x).. = kt (x)
2.
f
L
0 -r+ v
C 4r CT 0
.C
-45-
FIG. 2: 5 Progress of reaction o, ehydrogen, 0d iphenyt
with time yields
0
' Reaction time (m ins. ) -v

000
4000 t
r
"1 3000
2000
1000
T 0 L
u
O
10 ZU 3U 4U 5U bU benzene pressure (tor r) -----ý
FIG. 2: 6a - Effect of change in benzene pressure on product yield in benzene pyrolysis
(o hydroge n, "d i ph e nyl )
ord erl . 6d. 6
orderl. 3
orderl! order 1.
0
973K 966K
966 K
0923K
4.1
3.7 M
33 0
! Z9
1.0 ýog1.2ýýenzene j.
1.6 1.8 2.0 TO
FIG. 2: 6b Log-log plots to detemine reaction order. (o, ®, cj) hydrogen,. di ph enyt
4

-47-
where a= initisl benzene concentration
x= benzene consumed after time t.
Hence a plot of log10 (a-x) against time t will yield a straight line.
If the order is 3/2 then the integrated. rate equation is:
2 (a-x)-l - a-4 = kt (xi)
Hence a plot of (a-x)-4 against time will be a straight line.
In this analysis, the data presented in figure 2: 5 for reaction at
910K were used. Both ist order and 3/2 order integrated rate expressions
were plotted. The results are shown in figure 227. The curvature of
the 1st order plot eliminates this possibility. The 3/2 plot yields a
good straight line, confirming the previous approach.
The effect of temperature
So far the reaction has been studied with benzene concentration
in pressure units (torr). This is valid as pressure is proportional
to concentration at constant temperature as shown by expression (xii).
C (mole-' litre-1) =P (torr) / (760 xRx T) (xii)
where R=0.082 litre atmos deg-1 mole-1
T= temperature of reaction (K)
Thus for a non first order reaction where temperature is varied the
assumption is no longer valid and concentration units must be used.
The temperature range over which reaction can conveniently be
studied is limited. Below 873K the rate is to small to measure and
above 1036K the ring opens and complicates the kinetics. The effect
of temperature on the reaction was studied over this temperature range. Application of the Arrhenius equations
E/RT k= Ae - (xiii)
yielded the plot shown in Figur. 2: 8,

-48-
N
L O
X 1
0
FIG. 2: 7 Use of integrated rate equations to verify order. "1st order case
03/2 order case
10
5 08
>06
i04
502
0 reside10 nce time (minsý-+
30

-49-
r- -
O
(V .
u 0
0 1
FIG. 2: 8 Arrhenius plot of hydrogen formed from benzene pyrolysis with an initial benzene concentration of 5.372 x 10⁻⁴mole l it re-1 Residence time 4mins.
1.00 1.05 1.10 1/T. x103 (K 1)
---'

-0- 5
The line is slightly curved. If a straight line is assumed, an
overall rate expression of
k= 108*2exp (-46,300/RT ) litre mole 4sec (xiv)
is obtained. Over the temperature range 1036K to 952K the line
is reasonably linear and the rate expression (xv) can be deduced.
(xv) k= 109.83exp (-53,800/RT ) litreemole4sec-1
Preliminary Discussion on Reaction Mechanism
Much of the disagreement concerns the reaction mechanism. Of the
" few workers who have investigated the low temperature reaction in which
the benzene ring remains intact. Fields and Meyerson33 propose a
molecular process, whereas Louw and Luca837 favoured a free radical
chain process.
The experimental results produced so far, suggest a free radical
mechanism for the following reasons:
1. A molecular mechanism based on
2c6H6 = (c6H5)2 + H2
would yield second order kinetics, whereas a free radical chain
reaction could quite easily yield the experimentally observed three
halves order kinetics.
2. Oxygen is more likely to affect a chain mechanism than a molecular one.
If a simple non chain radical process occurs then two feasible
mechanisms can be envisaged. One involving first order initiation,
the other second order initiation.
The first order initiation scheme comprises reactions (1), (2) and (3).
C 6H6 = 06x5 +i (1)
H+ C6H6 = C6H5 + H2 (2)
'6"'5"' C6 = (c 6x5)2 (3)

* Footnote
These data are obtained by the least squares technique. Error
liMit8 are:
k= 10"'2 ± O'2exp(-46,000 ±1,00%T) litre mole-sec
1
for expression (xiv) and
k= 10 9'83 * 0.4exp(-53, äU0 t 2, o00jxT) litreImole 4sec 1
for expression (xv). Similar error limits apply to data presented
later in the thesis. ., ýý

-51-
Application of the stationary state approximation to this mechanism
yielded the rate expression (xvi)
d CH21/ dt = k1CC6H6] (xvi)
It is first order with an activation energy similar to the bond energy
of the C-H bond in benzene. Latest recommended values 43
put this as
high as 110,000 cals mole-1. This is approximately double the
experimental value. Thus the above simple mechanism is inadequate.
An alternative scheme comprises reactionsla, 3 and 4:,
2C6H6 = C6x5 + C6 (la)
c6x + C6H6 = (c6H5)2+ H( 3) U+ C6x7 = C6H6 + H2 ( 4)
and second order kinetics are predicted.
d [H21 = kla CC6H63 -2 (xvii)
Low and Lucas have suggested the rate expression(xviii) for reaction 1a.
In kla = 11.5 - 849000/RT litre mole-1 sec-1 (xviii)
So these data also are not consisent with the experimental results.
Therefore, if a free radical mechanism is to be invoked, other chain
carrying steps must be sought.
Investigations into the chain nature of the reaction
Evidence for chains can be obtained from the effect of inhibitors,
although the nature of the distribution of secondary products can also
yield information.
The effect of inhibitors
Reaction chain length, which is often of the order of hundreds, is a
dominant factor in determining the rate of a chain reaction. Thus the
addition of an inhibitor, which reacts with any of the chain carriers in
such a way as to terminate the chains prematurely, will cause the rate
to be reduced. Often a limiting value is reached.

-52-
This was originally interpreted by Hinshelwood and co-workers 44,
as
implying concurrent free radical and molecular mechanisms in alkane
pyrolysis systems. The inhibitor completely suppressed the free
radical mechanism, leaving the molecular mechanism only. It is now
believed that both the uninhibited and inhibited pyrolyses occur
axclusixely via a free radical mechanism. The inhibited reaction is
a complex modification of the unhibited pyrolysis. Evidence for this
is summarised by Purnell and Quinn 45,
Even though a limiting value to the inhibited rate cannot be taken
to show a molecular process, occurrence of inhibition must be regarded as
good evidence for a free radical process. Both propylene and nitric
oxide were used to test for a chain reaction in the benzene system.
Figure 2: 9 shows the results obtained. - With nitric oxide results
similar to those obtained by Hinshelwood and his co-workers 44
for
alkanes are obtained. With propylene the results are more confused.
After reaching a limiting value, when one torr of propylene is present,
the rate of hydrogen formation starts to increase.
Inhibition was further investigated by addition of nitric oxide at
different reaction temperatures. The results are shown in figure 2: 10.
In this graph the results are presented as per cent inhibition against
added nitric oxide.
Per cent inhibition = (Ro - R1) / Ro x 100 (xix)
where Ro = Uninhibited rate of hydrogen production
R1 = Inhibited rate of hydrogen production
At lower temperatures inhibition approaches 100%.
The formation of secondary products
The formation of solid products other than diphenyl was investigated
with the aid of gas chromatography and chromato-mass spectrometry.

-53-
FlG. 2: 9 Inhibition of benzene pyrolysis by anitric oxide, "propyteneat 966K
C C
s s c
e
FIG. 2: 10 Inhibition of benzene pyrolysis by nitric oxide at various reaction temperatures
2 added i hibitor (torr) lv jc
n
uuu CU mtr, cuxiaej011) -----0

-54-
Three small peaks were observed. PT and meta terphenyls were
positively identified. The third peak although not positively
identified was assumed to be triphenylene.
If the secondary products are formed in a ratio that is independent
of reaction time then product formation occurs simultaneously and
not consecutively.
i. e. for a first order reaction
kb B A k
then dx/dt = kb (a-x) + kc (a-x) (xx)
where lcb and kc are the rate constants of the two side reactions'.
Therefore, on integration
kb+kc = 1/t in a/(a-x) (xxi)
and the reaction as a whole behaves as first order.
Table 4 shows the ratios of peak area obtained for the three products
for various residence times.
TABLE 2: 4
RATIO OF SECONDARY PRODUCT FORMATION
Residence Ratio of Peak Area Time
(mina) triphenylene m-terphenyl p-terphenyl
9 1.6 2.4 1 4.5 1.4 2.4 1 18 1.4 2.6 1

-55-
Thus the ratio of concentration of the secondary products is
independent of time. This suggests that they are formed via a
common intermediate (possibly a free radical). This simple test was
first described by Wegscheider46"
Effect of added hydrogen
Benzene was pyrolysed in the presence of various amounts of
hydrogen. Thirty torr of benzene were taken and total pressure was
kept constant at 300 torr by interchange of hydrogen with nitrogen.
The effect on diphenyl yield was observed. Figure 2: 11 shows the
results obtained. Diphenyl formation decreases with increasing hydrogen
pressure until a limiting value is reached. This suggests that the
system is approaching equilibrium. At 3quilibrium
A G° =-A G° products -, &G 0 reactants (xxii)
at 1000K it can be shown from the data given in appendix 1 that
A 0° = 4,580 cals mole-1
also £ (3o = -RT In Kp (xxiii)
Thus the equilibrium constant, Kp, is 0.1 at 1000K.
This means that under ideal conditions thirty torn of benzene will
dissociate into 5.8 torr of hydrogen and 5.8 torr of diphenyl.
When 300 torr of hydrogen is present 0.3 torr of diphenyl formed
is predicted.
Addition of 300 torr of hydrogen reduces the diphenyl yield by a
factor of 2.7. Diphenyl production in the absence of hydrogen is of the
order of 0.6 torn; therefore, the observed yield when 300 torr of
hydrogen is present is quite close to the equilibrium value of 0.3 torr.
Thus in the absence of hydrogen the system is operation under
conditions far removed from equilibrium, and decrease in diphenyl yield
with increase in hydrogen concentration is a consequence of the system
approaching equilibrium.

-56-
C
C
C
C
d'
L C
i
Q
Z
FIG. 2: 11 Effect of added hydrogen on diphenyl yield from benzene pyrolysis at 966K.
0 100 of added
2300 pr ) hydrogen (torr

-57-
DISCUSSION
In the previous part evidence for a free radical chain mechanism
was presented and preliminary ideas on a possible mechanism were
suggested.
A summary of the evidence is : -
1. Reaction order is about 1.5.
2. The activation energy is low compared with the strength of the
C-H bond.
3. Added oxygen has a profound effect on the rate of reaction.
4. Inhibitors reduce the rate in a way similar to their action in
alkane pyrolysis.
5. Wegscheider's test suggests that secondary products are formed
simultaneously from the same intermediate.
Possible reaction mechanisms
There are two possible modes of initiation
a) Unimolecular C6H6 = C6H5 +H (1)
first suggested by Aten and Bauer31.
b) Bimolecular
2c6H6 C6H5 + C6H7 (lad first suggested by Low and Lucas37.
a) Mechanism involving 1st order initiation
A mechanism involving the steps 1,2 and 3
06x6 = C05 +R (1)
+ C6H6 =5 1T + H2 (2)
2C6 = (c605)2 (3)
has already been discussed, and predicts first order kinetics which
do not fit the experimental results.
-58-
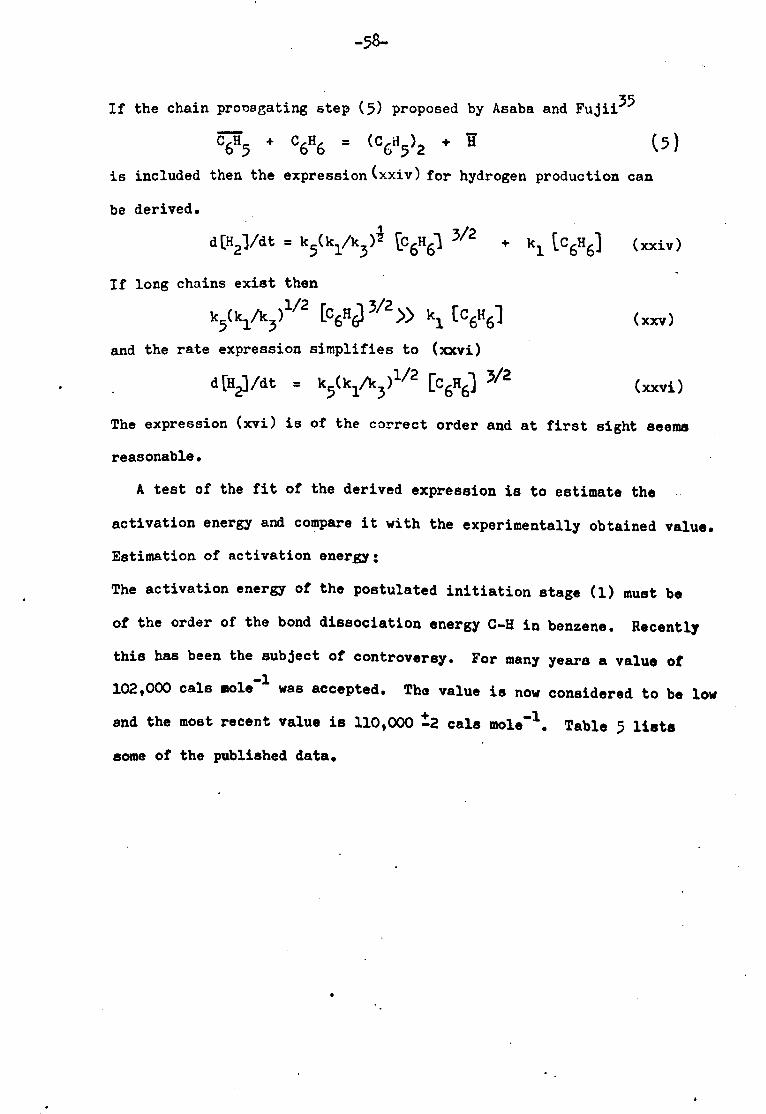
If the chain propagating step (5) proposed by Asaba and Fujii35
C6H5 + C6H6 = (C6H5)2 +R (5)
is included then the expression (xxiv) for hydrogen production can
be derived.
d [H2]/dt = k5(k1/k3 )l tC6H61 3/2 + kl [C6H61 (xxiv )
If long chains exist then
k5(k1/k3)l/2 1C6HQ 3/2 ii kl [C6H6] (xxv)
and the rate expression simplifies to (xxvi)
d [H2] /dt = ks(kl/k3 )1/2 [C6R6] 3/2 (xxvi)
The expression (xvi) is of the correct order and at first sight seems
reasonable.
A test of the fit of the derived expression is to estimate the
activation energy and compare it with the experimentally obtained value.
Estimation of activation energy:
The activation energy of the postulated initiation stage (1) must be
of the order of the bond dissociation energy C-H in benzene. Recently
this has been the subject of controversy. For many years a value of
102,000 cals sole-1 was accepted. The value is now considered to be low
and the most recent value is 110,000 ±2 cals mole-l. Table 5 liste
some of the published data.
0
A

-59-
TABLE 2: 5
DATA FOR C6H5-H BOND ENERGY IN BENZENE
(C6H H) Bond Energy Source and Reference Date of Work
cals mole-'
102,000 Szwarc & Williams 47 1952
107,000 Kandel 48 1954
102,000 Duncan & Trotmann- 49 1962 Dickenson
99,000 Fields & Franklin 50 1954
104,000 Fielding & Pritchard 51 1962
112,000 Rogers, Golden & Benson 52 1967 109,000 Szilagyi & Berces 53 1970
110,000 Chamberlain & Whittle 43 1971
Reaction (3) is a radical recombination process and its activation energy
can be assumed to be zero, although a small negative value is possible.
Calculation of the activation energy of reaction (5) presents mors of
a problem. Established procedures such as the BEBO method 50
are basically
for hydrogen atom transfer reactions, although the method has been extended
to include some other atom transfer reactions.
Alfassi and Benson55 have recently devised a simple empirical method
for estimating activation energies for atom transfer reactions, which
although not strictly applicable, was applied, faute de mieux, to reaction (5). The method applies only to exothermic reactions. It a reaction is
endothermic the back reaction must be considered. Using Benson's
additivity rules36 it can be shown (Appendix 1) that reaction (5) is
slightly exothermic with A H°1OOOK a _694 tale mole".

-60-
The activation energy is predicted as 5,500 cals mole-1. (Details of
the method are listed in Appendix 1). This is in good agreement with 72
a recently measured value of 4,000 cals mole- 1
. The measured value
is used in subsequent discussion.
The overall activation energy predicted by the mechanism is
E5 + (E1 - E3)/2 i. e. 59,000 cals mole 1;
a value slightly higher
than that of 53,000 cals mole-1 obtained experimentally. It seems
possible that some other contribution to the mechanism may be taking
place. It is difficult to envisage any other homogeneous process
involving first order initiation that will lead to three halves ofder
kinetics. Consideration of second order initiation processes, how-
ever, reveals other possibilities.
b) Mechanism involving second order initiation.
The only second order initiation possible is reaction (la).
2C6H6 a C6 5+ C6 7 (la)
Goldfinger, Niclause and Letort32 have proposed empirical rules for
predicting termination reactions from the overall order and the
order of the initiation reaction. They say that, for second order
initiation and three halves order overall simple termination reac-
tions must involve ßu radicals. Aß radical is one involved in a
bimolecular propagating step and au radical is one involved in a
unimolecular propagating step. The rules also state that if
termination reactions involve a third body then ßß radicals are
involved in termination, for three halves order.
-61-
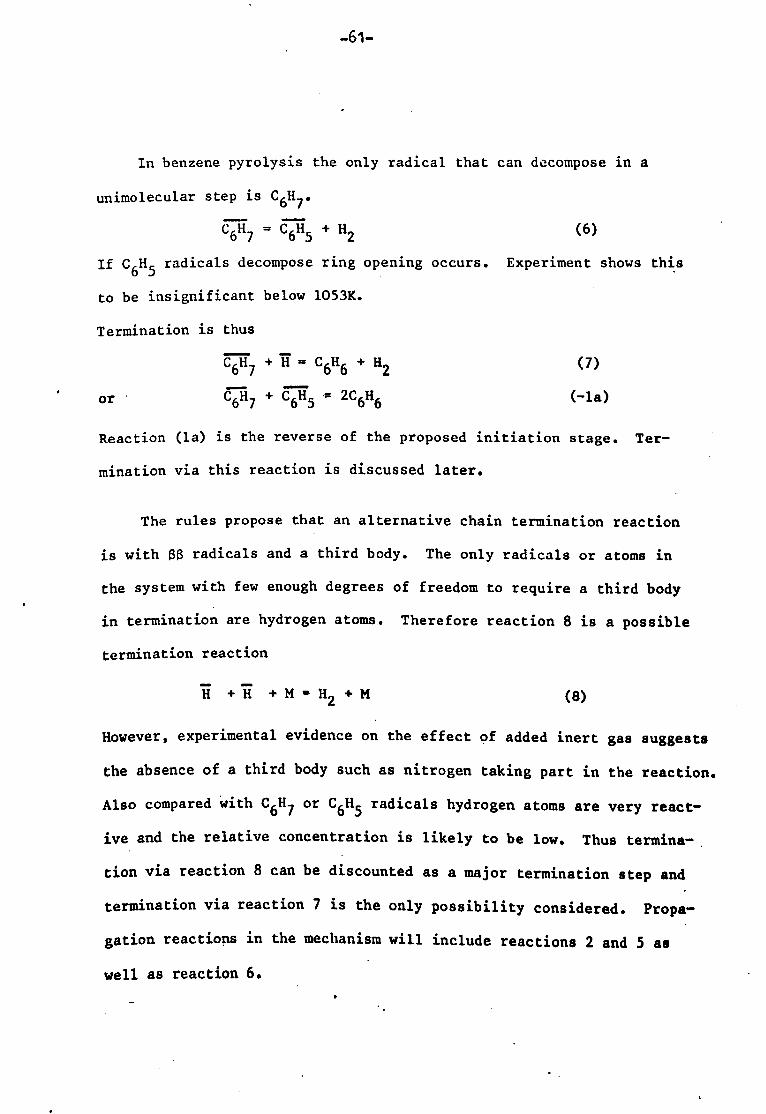
In benzene pyrolysis the only radical that can decompose in a
unimolecular step is C6117.
C6H7 = C6H5 + H2 (6)
If C6H5 radicals decompose ring opening occurs. Experiment shows this
to be insignificant below 1053K.
Termination is thus
C6H7 +H- C6H6 + H2 (7)
or - C6H7 + C6H5 = 2C6H6 (-la)
Reaction (la) is the reverse of the proposed initiation stage. Ter-
mination via this reaction is discussed later.
The rules propose that an alternative chain termination reaction
is with $$ radicals and a third body. The only radicals or atoms in
the system with few enough degrees of freedom to require a third body
in termination are hydrogen atoms. Therefore reaction 8 is a possible
termination reaction
H +H +M-H2+M (8)
However, experimental evidence on the effect of added inert gas suggests
the absence of a third body such as nitrogen taking part in the reaction.
Also compared with C6H7 or C6H5 radicals hydrogen atoms are very react-
ive and the relative concentration is likely to be low. Thus termina-
Lion via reaction 8 can be discounted as a major termination step and
termination via reaction 7 is the only possibility considered. Propa-
gation reactions in the mechanism will include reactions 2 and 5 as
well as reaction 6. 6

-62-
. Reaction 2, however, may not be a simple abstraction reaction
H+C= C6H5 + H2 (2)
The parallel addition reaction 9 may also occur
H+ C6H6 = C6H7 (9)
In recent years evidence has accumulated to show that addition
reactions readily occur at low temperatures. The high bond
energy of the C-H bond in benzene
whittle73 have shown that additioi
radicals in the temperature range
Whittle 43,
however, have shown that
is responsible. Charles and
1 readily occurs with CF3
297°K - 359°K. Chamberlain and
above 413°K genuine hydrogen
abstraction takes place.
At low temperatures hydrogen atoms readily add to benzene via
reaction 9 and Yang74 has obtained a rate constant of
k= 1010 exp (-4,000/RT) litre mole-1 sec-1 (xxvii)
Kim, Lee, Bananno and Timmins75 have more recently obtained a value
of
k=6x 10⁹ exp (-2700/RT) litre mole-1 sec-1 (xxviii)
The work was at low temperatures but Benson and Shaw76 have shown
that the addition reaction (9) readily occurs at temperatures as
high as 664 K.
H+ C6H6 'C (9)
It is therefore possible that the addition reaction takes place in
the pyrolysis reaction as well.

-63-
Rate Data for Addition and Abstraction Reactions (9) and (2)
a) The Abstraction Reaction (2):
For this reaction the activation energy can readily be
estimated by both the bond energy bond order (BEBO)54 and the
Alfassi55 and Benson methods. From the calculations in
Appendix 1 (b) the BEBO method yields a value of 16,000 cals
mole-1 whereas Alfassi and Benson's method yields a value of
11,700 cals mole-1. As the BEBO method uses data completely
outside the field of kinetics an average value of 14,500 cals
mole-1 weighted towards the BEBO result was taken. The BEBO
method has been extended to give A Factors and a value of
1011.8 litre mole-1 was calculated77 for reaction (2). In
recent years Benson36 has devised methods for obtaining A the
pre-exponential factor from thermodynamic data obtained by
group additivity and statistical mechanical considerations.
Thus if entropies of activation can be calculated then the A
factor can be estimated from the transition state expression
(xxix).
(ekT) eAS*/R A-(. h ) (xxix)
AS$ is the entropy change in forming the transition state complex.
From the data listed in Appendix 2a value of 10 11'6
litre
mole-' sec 1
was obtained.

-64-
TA1T O ýI ýG
CALCULATED RATE DATA FOR ABSTRACTION REACTION (2).
Activation Energy
(cals mole-1)
A Factor
(litre mole-1 sec-1) Reference
*16,000 ) 11.8
1011.6 11.6 This
$11,700 ) Work.
7,900 1011.7 Asaba & Fujii29
13,000 1010.0 Louw & Lucas31
*BEBO Method
*Alfassi and Benson Method.
b) Addition Reaction:
Kim, Lee Bonanno and Timmins75 have measured the rate of the
addition reäction and they propose a value of k- 10 10.0 exp (-2,700)/RT
litre mole-1 sec-1.
Competition between Addition and Abstraction.
A plot of the calculated rate constants for reactions (2) and
(9) is shown in Figure 2: 11. Thus even at the high temperatures of
this pyrolysis, addition-can occur. Probably abstraction is a more
complex process involving addition initially followed by decomposition
of the adduct radical
+C6H6 C6 7 (9)
C6 7= C6 + H2 (6)
This has no effect on the first order initiation mechanism as C6H7 and
hence hydrogen are produced only in reactions (9) and (6).

-65-
10-
8
6-
o4 T- o) 0
Z
300 500 700 900 temperature (K) --o.
1100
FIG. 2: 12 Comparison of rate constants for (o) Hatom addition and(e) H atom abstraction reactions with benzene.

-66-
With the second order scheme, however, 76H 7
is also produced in the
initiation stage and hence the kinetics are affected.
The revised mechanism now becomes
2C6H6 = C6H5 + C6H7 (la)
C6H5 +C6H6= (C6H5)2 +H (5)
H+ C6H6 = C6H7 (9)
C6H7= C6 H5 + H2 6
H+C6H7=C6H6+ H2 (7)
and this is essentially the mechanism proposed by Low and Lucas37.
From this a rate expression for hydrogen production of 3
d [H2] /dt = 2kla [C6Hý 2+ ((2klak6k9) /k7)1[C6H J /2 (xxx)
can be obtained. For long chains 3/2
Lkla [C6H6J 2« ((2klak6k9) /kP[C6H6] (xxxi)
and the expression simplifies to 3
d [H2]/dt ' ((2k lak6k9)Ik7) L'6Hý
/2 (xxxii)
For the above an approximate activation energy is (Ela + E6 + E9)/2 as
E7 can be assumed to be zero.
Data for the initiation reaction (1a) have been proposed by Low
and Lucas as
log k1 - 11.5 - (84,000/RT) litre mole-' sec -1 (xviii)
A lower limit of E6 can be estimated from Louw and Lucas data to be
about 33,000 cals mole-1 and from Kim et al's work E9 = 2,700 cals
mole-'. Thus the overall activation energy obtained by the above con-
siderations is 61,000 cals mole 1. Again this value is slightly higher than
that obtained experimentally.
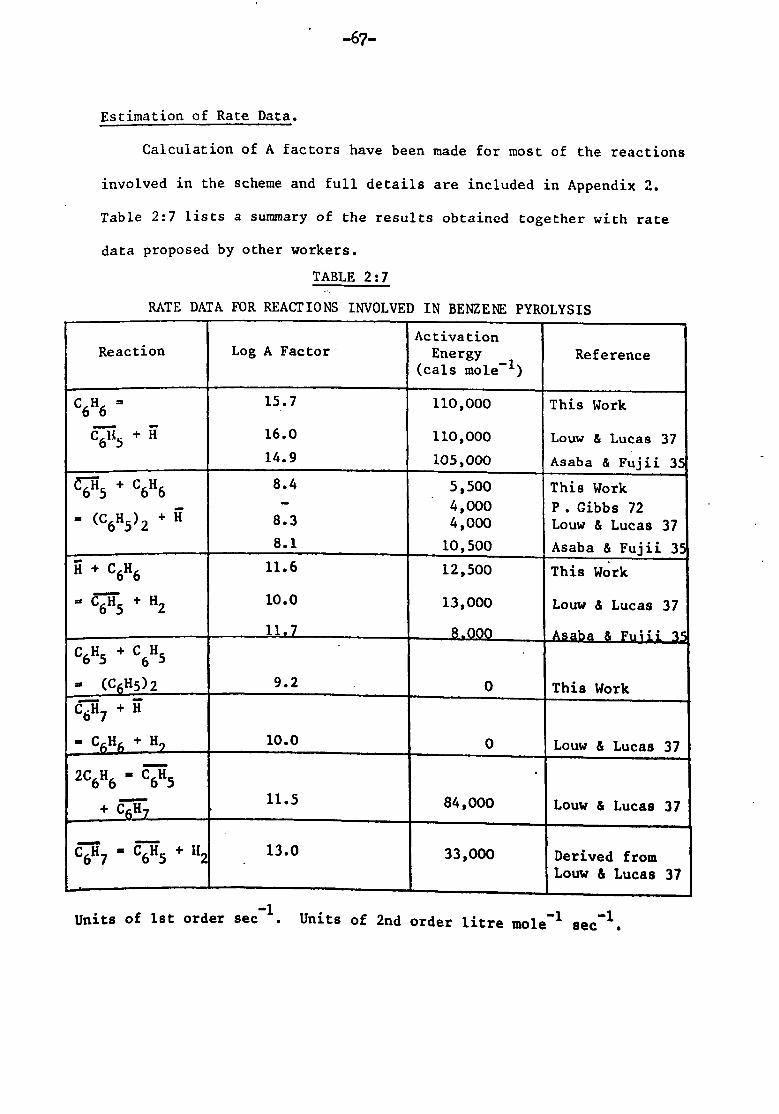
-67-
Estimation of Rate Data.
Calculation of A factors have been made for most of the reactions
involved in the scheme and full details are included in Appendix 2.
Table 2: 7 lists a summary of the results obtained together with rate
data proposed by other workers.
TABLE 2: 7
RATE DATA FOR REACTIONS INVOLVED IN BENZENE PYROLYSIS
Activation Reaction Log A Factor Energy Reference
(cals mole-1)
C6H6= 15.7 110,000 This Work
C6 5+H 16.0 110,000 Low & Lucas 37 14.9 105,000 Asaba & Fujii 3
C, -H5 + C6H6 8.4 5,500 This Work 4,000 P. Gibbs 72
(C6H5)2 +H 8.3 4,000 Low & Lucas 37 8.1 10,500 Asaba & Fujii 3
+ C6H6 11.6 12,500 This Work
C H5 + H2 10.0 13,000 Louw & Lucas 37
11.7 C6H5 +C H5
6
(C H5)2 9.2 0 This Work 66H7 + if
s c61¼ +H 10.0 0 Low & Lucas 37
2C6H6 C6H5
+ C6 11.5 84,000 Low & Lucas 37
= C6H 5+ ii 2 C6 7 13.0 33,000 Derived from Low & Lucas 37
Units of 1st order sec-1. Units of 2nd order litre mole-1 sec-l.

-68-
Competition between the two Mechanisms.
Both mechanisms outlined give solutions which can approximately
describe the observed experimental results. For first order initia-
tion reaction (1) let the rate of reaction = R1; then
Rl = k1 [C6H61 (xvi)
For second order initiation reaction (la) let Rla = the rate of
reaction.
.". ' la = kla [C6H6] 2 (xvii)
If the benzene concentration is 5.372 x 10⁻⁴ moles litre-1 then it
follows that
log R1 = 12.4 moles litre-1 sec -1
log Rla = 12.1 moles litre 1 sec
1
Thus both types of initiation have approximately. the same rate and it
is impossible to differentiate between them on this basis.
Further examination of the proposed mechanisms.
The rate expression (xxiv)
R=d [H2] /dt = kl [C6H j+ k5 (kl/k3) [C6H61 3/2
(xxiv)
Was derived earlier. On dividing by IC6H1 concentration the
expression becomes
R/ [C6H6] a k1 + k5 (kI/k3)1 EC6H6 (xxxiii)
Therefore, for a given set of conditions a plot of R/EC6Hf against
[C6H6]' is a straight line with an intercept equal to kl. If the
data are plotted at different temperatures a value for E1 can be
obtained.
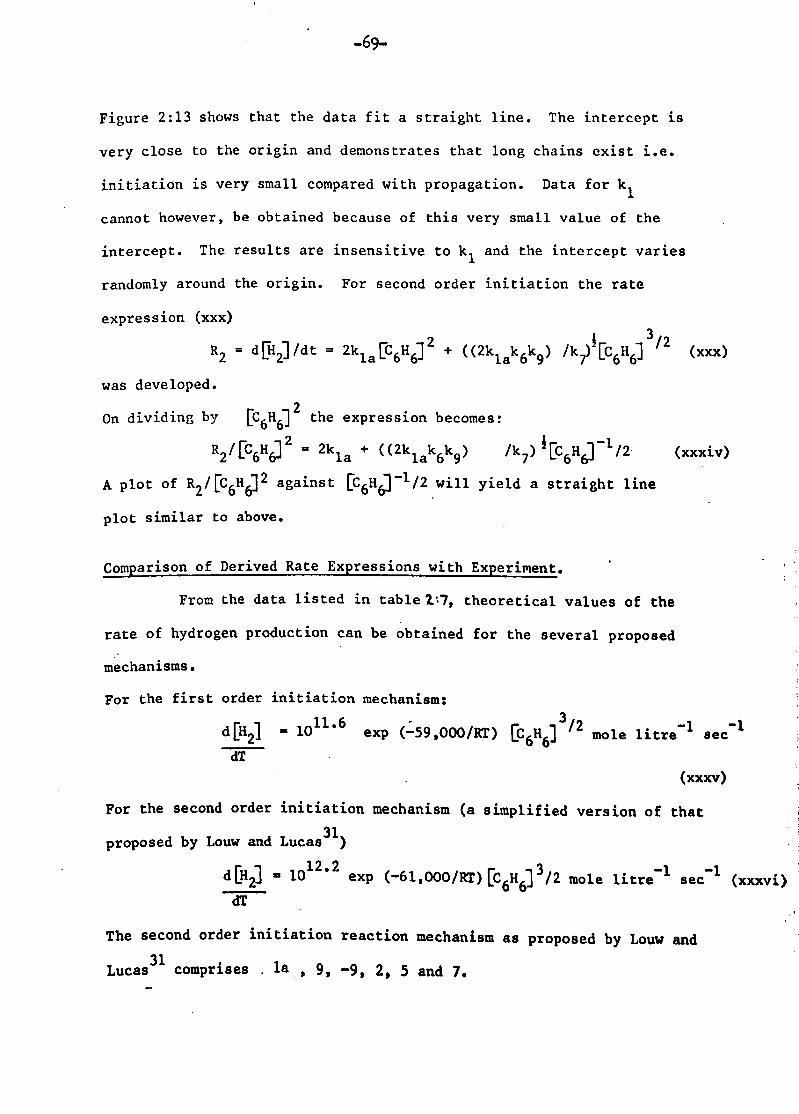
-69-
Figure 2: 13 shows that the data fit a straight line. The intercept is
very close to the origin and demonstrates that long chains exist i. e.
initiation is very small compared with propagation. Data for kl
cannot however, be obtained because of this very small value of the
intercept. The results are insensitive to kl and the intercept varies
randomly around the origin. For second order initiation the rate
expression (xxx)
R2 =d [H2] /dt = 2kla [C6H612 + ((2klak6k9) /ký1 [C6H6] /2 (xxx)
was developed.
On dividing by rC6H61 2 the expression becomes:
2/[ RC6HJ2 = 2kla + ((2klak6k9) /k7) [C6H6-1/2 (xxxiv)
A plot of R2/[C6H6]2 against [C6HJ-1/2 will yield a straight line
plot similar to above.
Comparison of Derived Rate Expressions with Experiment.
From the data listed in table 2t7, theoretical values of the
rate of hydrogen production can be obtained for the several proposed
mechanisms.
For the first order initiation mechanism:
d[H21 - 1011.6 exp (-59,000/RT) [C6H6]3/2 mole litre-1 sec -1
dT (xxxv)
For the second order initiation mechanism (a simplified version of that
proposed by Low and Lucas31) 12.2 d[H2] - 10 exp (-61,000/RT) [C6H6]3/2 mole litre-1 sec-1 (xxxvi)
dT
The second order initiation reaction mechanism as proposed by Low and
Lucas 31
comprises la 9 9, -9,2,5 and 7.
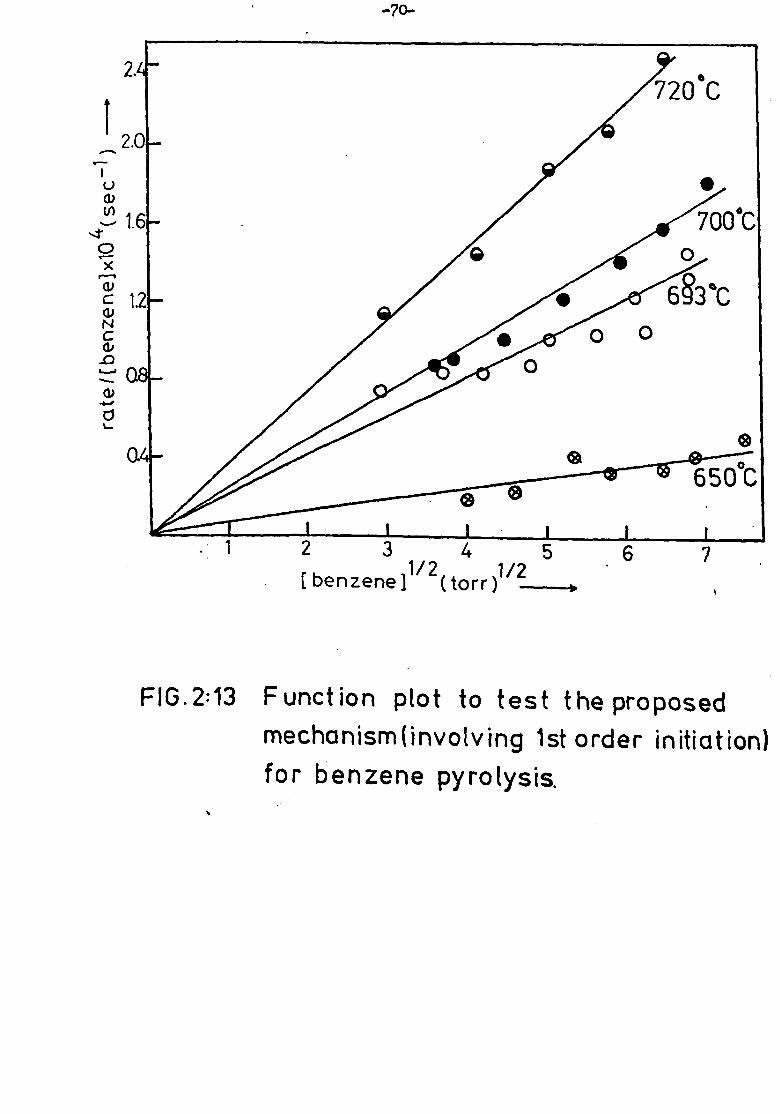
-70-
U a
O X N
N C d
cl L.
FiG. 2: l3 Function plot to test the proposed mechanism (involving 1st order initiation) for benzene pyrolysis.
.1234567 (benzene]
1/2 (torr )iý?

-71-
For this dER21 =
dT
ýý 3/2 k2
ýkla k61 ý6H6]
k9 k7
if long chains exist.
Using their data
(xxxvii)
d [H2] = 10 13.8 exp (-67,000/RT) [C6HJ
3 /2 mole litre l
sec-i (xxxviii)
dT E4. af
This value is far removed from observed experimentally in this work.
which was -
d [H21 = 109.83 exp (-53,800/RT) [C6Hý3/2 mole litre 1 sec-1
dT
For the working benzene concentration of 5.372 x 10⁻⁴ mole litre -1
an Arrhenius plot was obtained for the various expressions. The results
are shown in figure 2: 14. The mechanism with 1st order initiation
agrees best with experiment although the predicted activation energy
at low temperatures is too high. The rate data obtained from
the mechanism proposed by Low and Lucas are not in such good agreement.
Thus the mechanism that best describes the experimental data at tempera-
tures between 973 K and 1023K is: -
C6H6 = C6H5 +H (1)
C6 5+ C6H6 = (C6H5)2. +H (5)
H+ C6H6 = C6R7 (9)
C6H7 C6 + H2 (6)
2C6H5 (C 6H 5)2 (3)
At lower temperatures the Arrhenius plot deviates from linearity and
a rate constant of 8.2
k- 10 exp (-46,300/RT) mole litre sec-1 (xiv)
was obtained over the full temperature range.
(xiv)

-72-
-4:
0 E-5
�-I. N
u- Q r--
O
-6.
p experimental rate.
rate expression assuming 1st
order initiation.
" rate expression assuming 2nd order initiation.
1.00 1.05 1/ Tx 10 3G -1) -----=
0 0
FIG. 2: 14 Comparison of derived rate expressions with experiment for a benzene conc.. of 5.372 k10-
mole 1 itre-1 and a residence time of 4mins.
-73-
One explanation of this might be a catalytic effect on the surface
of the reaction vessel which reduces the apparent activation energy.
Little effect of surface on rate w As observed so this must be ruled out.
An alternative explanation may be termination by reaction (-la)
C6H5 + C6H7 = 2C6H6 (-la)
Inclusion of the reaction in the 1st order initiation scheme does
not yield 3/2
order kinetics, and thus it can be ruled out. Inclusion of
(-la) in the 2nd order initiation scheme does, however, yield 3/2
order
kinetics and a rate expression of.
d[H2] /dt = (2klak5k6/kla) i r06 HJ
3/2 mole-' litre -1 sec-1 (xxxix)
is obtained, which yields an activation energy of 60,000 cals mole-'.
Thus this will not explain the curvature of the plot either. So far
no satisfactory explanation has been found.
-74-
FURTHE2 REACTIONS OF BENZFNE AT HIGHER TEMPERATURES
Mechanisms for diphenyl and hydrogen formation were proposed and
discussed earlier. The results reported in figure 2: 1 (page 35 ) show
that no major gaseous products other than methane and hydrogen are formed.
It is difficult to envisage a mechanism by which methane can be formed above
953K other than ring opening followed by hydrogenation. A carbon balance
indicates that methane cannot be the only product of ring opening.
Some carbon must appear in another form. In the static apparatus,
it appeared as soot, and as the temperature was increased above 1073K
the reaction vessel rapidly became blocked. This factor made studies
of methane formation in the static apparatus impossible. The pyrolysis
was therefore carried out in a flow system where much shorter residence
times of the order of 0.1 sec were possible.
The following experiments were performed using the flow apparatus.
The effect of temperature and residence time on product yields
With an average residence time of 0.1 sec the pyrolysis reaction was
carried out over the temperature range of 1053K to 1243K. The gaseous
product yields are shown in figure 2: 15. Hydrogen is still the major
product, about ten times more abundant by volume than the next major
constituent, but its distribution is altered considerably. Acetylene is
now an important product, and ethylene is also detected. Methane formation
appeared to be less, relative to the other products than was found in
the static apparatus. This effect suggests the acetylene is formed in
a primary process and ethylene and methane are formed in secondary
reactions with the excess hydrogen.
A possible sequence is H2 H2
C2H2-s C2H4 --+s 2CH4
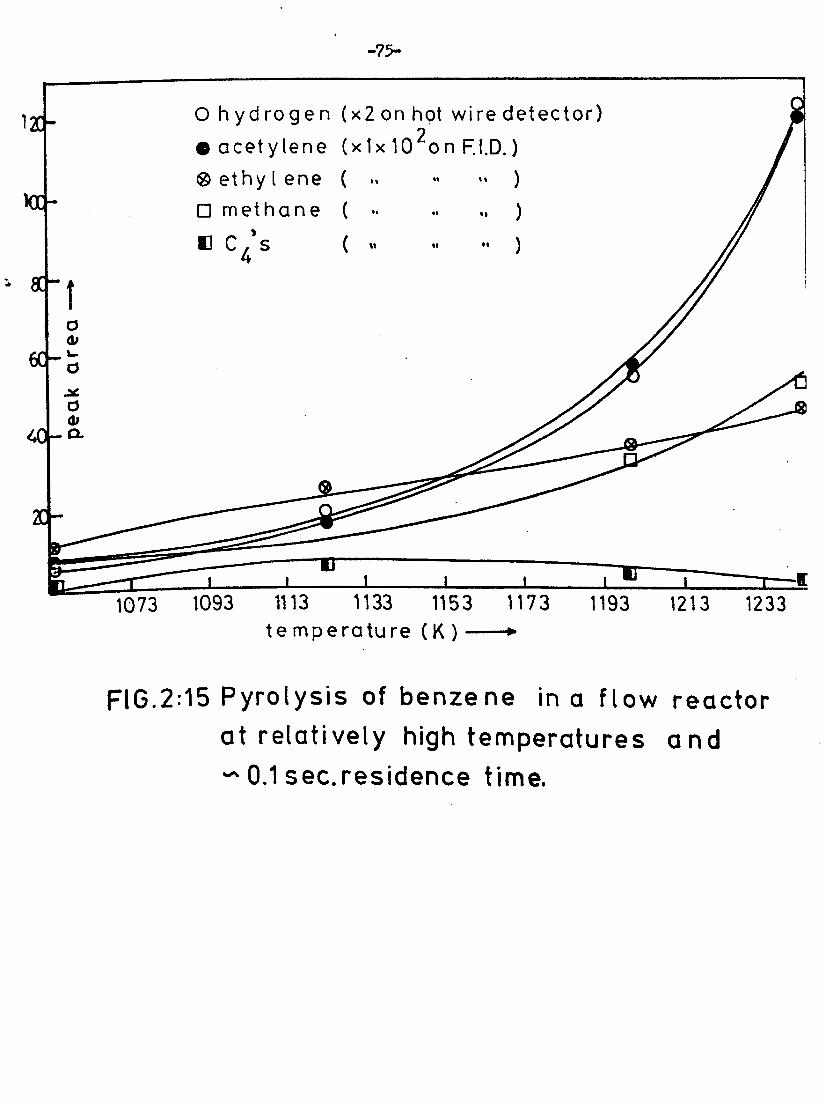
-75-
120- 0 hydrogen (x2 on hot wire detector)
*a cety[ene (xIx 102on F. I. D. )
0 ethy I ene ( .. It p methane ( "" ". is )
III C4's(,. .. to
`.
d do
Zrt_ CL
1073 1093 1113 1133 1153 1173 1193 1213 1233 temperature (K) ---ý
FIG. 2: 15 Pyrolysis of benzene in a flow reactor at relatively high temperatures and "^ 0.1 sec. residence time.

_76-
If ethylene and methane reer-lt from the hydrogenation of acetylene
then the pyrolysis of benzene in the presence of deuterium should yield
deuterium substituted ethylene and methane. Accordingly benzene was
pyrolysed in the presence of deuterium and the gaseous products
analysed on a mass spectrometer. m/e peaks at 19,20, and 30,31 were
observed, which suggest the presence of CD3H and CD4, and C2D2H2 and
C2D3H. This conclusion assumes negligible hydrogen - deuterium exchange.
In a further experiment however, benzene-d6 was pyrolysed in the
presence of hydrogen. The condensate obtained was analysed for various
substituted benzene products. The results in figure 2: 16 show that
scrambling does occur and the conclusions from the previous experiment
must be regarded as tentative.
The effect of pressure on acetylene yield
Benzene pressure was varied by alteration of the flow through the
saturator device. The total flow and hence residence time was kept
constant by passage of nitrogen through the by-pass. The results for
a reaction temperature of 1067K are shown in figure 2: 17. The open
circles show data obtained for acetylene alone. A log-log plot yields
an order of 0.3. If methane and ethylene are formed from acetylene
then a correction for the formation of these products must be made.
The filled circles show this pot. In this case a log-log plot yields
and order of , 0.5.
The activation energy for acetylene formation
Accurate determination of the activation energy is more difficult than
the above pressure dependency experiment. Radiation errors and the
lack of a temperature plateau across the furnace make temperature
measurement extremely difficult. However, an approximate Arrhenius
plot yielded an activation energy of about 50,000 calm mole-l. As this value is lower than that for the low temperature reaction it must be suspect.

-77-
11 C 4
. C
L G C
ö
KEY: O benzene - d6. O benzene -d5 0 benzene -d4 " benzene -d 3 ® benzene -d2 [] benzene -d1 Q benzene
FIG. 2: 16. Hydrogen scrambling between hydrogen and benzene -d 6
873 973 1073 1173 reaction temperature (K

-78-
0
Q. 0 0
a! 3 W
Qi
U
0
CL
FlG, 2: 16 Effect of benzene concentration change on product yield from benzene pyrolysis at 1167K.

-79-
If acetylene is a primary reaction product then possible additional
reactions in the basic scheme are
C6H5 =c4H3+ C2H2
C4H3 + C6H6 =c4H4+ C6H5
Rate expressions for hydrogen and acetylene production are
dJi21/dt = k5(kl/k3)1/2tC6H613/2 + k1(C6H6]
dý 2H2]/d t= k7 (k1/k3 3)
1/CC6H6] 1/2
(7)
(8)
(xxiv)
(xm) Thus the order of acetylene production is predicted to be one half,
with an activation energy of (3E1 - 3E3) +?
El has been established as 110,000 cals mole -1 and E3 for the
termination reaction will be about zero. Estimation of E7 presents
more of a problem. Asaba and Fuiji35 have suggested a value of
83,000 cals male-' which is similar to the heat of reaction. With
this value, an activation energy of acetylene formation of about
138,000 cals mole-1 is predicted. The experimental value of 50,000 -1
cala mole is very different. At the higher end of the, temperature
range, large quantities of carbon are formed. Both benzene and acetylene
are known carbon precursors and the yield of acetylene measured at this
end could be wildly in error. As stated earlier the experiments
conducted in the flow apparatus are only semi - quantitative. For
accurate data another system must be employed and the small reaction
times possible in shock tubes suggest this as a possible solution.
The formation of carbonaceous solids (soot)
Soot formation from the pyrolysis of gases is an important industrial
process, and there is a vast literature on the subject. Collis and
palmer57 have produced a comprehensive review up to 1964"
-80-
Work up to 1971 has been reviewed by Mue11er58.
In the Gas Industry soot is an unwelcome product in hydrogenation
processes. Its precursor is likely to be the aromatic content of
the oil. This part of the thesis describes the formation and properties
of soot from benzene pyrolysis at relatively high temperatures between
1173K to 1273K.
When benzene is pyrolysed in this range carbon is readily formed.
Two distinct types can be identified:
" i) a shiny lustrous type formed on the surface of the reaction vessel
ii)a fluffy type formed at the reaction vessel exit.
Plate 3 shows scanning electron microscope photographs of the two types
of carbon. The photograph of the deposit in the reaction vessel tells
little of its method of formation. That of the deposit at the exit
shows it to be built up of spherical droplets. A mechanism where
gas phase molecules -bigger molecules -%-liquids -droplets
which then pyrolyse may be operating.
The lustrous carbon from the reaction vessel wall was shown by
Xray diffraction to be poorly crystalline with carbon of crystallite 0
size 15 to 20 A.
Chemical analysis gave 98.8% carbon present which if the remainder
is assumed to be hydrogen corresponds to a C: H ratio of approximately
7: 1. This carbon is virtually graphite.
The carbon at the reaction vessel exit, in contrast, did not giv.
an X-ray diffraction pattern, indicating that it is non graphitic and
amorphous. Chemical analysis showed the carbon content to be 94.3%.
This corresponds to a C: H ratio of 1.6: 1. The sooty carbon resembled 5
typical pyrolytic carbons9 and is formed in much greater yield than
the lustrous carbon.

-81-
Mag. x40 Mag. x 44,000 Carbon inside reactor
,,. ý . ýýý
Carbon at reactor exit Electron micrographs of carbon deposited,
PLATE 3
4 ä'^ q
rý '
ý; r", `%
r
Mag. x60 Mag. x12,000

-82-
Future experiments and discussions are thus restricted to this carbon.
The graphitic carbon may of course be formed via a route involving the
fluffy carbon as an intermediate.
Surface properties of the carbon
The surface chemistry of the carbon was investigated by adsorption
studies with the microbalance discussed in part II of this section.
Initially nitrogen adsorption at 77K was investigated. The resulting
isotherm is shown in figure 2: 17
The surface area was calculated by the B. E. T. equation.
P/w(po p) = l/Xmc + (c-1)/Xmc(p/po) (xxxxi)
where p= adsorbate pressure
po = saturated vapour pressure of adsorbate
Xm = monolayer capacity
c= constant
w mass of gas (or vapour adsorped)
A plot of p/w (pö p) against relative pressure p/po will give a straight
line with Xm = 1/gradient + intercept
Hence surface area = (Xm xNx Airk x 10-20 )/M metre 2gm-1 (xxxxii)
where N= Avogadro's number
Am = cross sectional area of the adsorbate 0
molecule A2
M= gram molecular weight of adsorbate
In recent years there have been criticisms of the B. E. T. equation 39 but
in spite of this, the method is still widely used as a comparative method
for surface areas.
In these experiments benzene was used as well as nitrogen as an
adsorbate.

T
u
C O
a L- 0
0
Fl G. 2: 17 Nitrogen adsorption isotherm at 77K on carbon produced from benzene pyrolysis
O1 E
E v
C 0
a 0 -v d
isotherm at 299K on carbon produced from benzene pyrolysis.
0 0.1 0.2re tative
pressure (p/p0jý '8 0.9
FIG. 2: 18 Benzene adsorption

-84-
The isotherm is shown"in figure 2.18. 0
The surface area of the nitrogen molecule was taken as 16.2A and that 0
for benzene as 40A2. This value is described by Gregg and Sing60 as the 0
usual value and is somewhat higher than the value of 30.5A2 derived from
the density of the pure liquid. Application of the B. E. T. equation over
the range p/po =0 to 0.3 yielded surface areas of 12.9 metre2 gm-l with
nitrogen as an adsorbate and 11.6 metre2 gm-1 with benzene.
The nitrogen isotherm is a typical type I isotherm as described by
Langmuir.
Type 1 behaviour can be the result of
a) chemisorption, or 60
b) physical adsorption by a microporous solid
As the isotherm is reversible i. e. the desorption isotherm follows that
for the adsorption isotherm case (a) can be ruled out and the adsorption 0
can be attributed to micropores of diameter less than 10A. On addition
of a dose of nitrogen, pore filling takes place to give a monolayer.
riultilayer formation is not possible as the external area of the sample
is small. Enhanced adsorption often occurs and this gives rise to
B. E. T. areas that are too high. The enhanced adsorption is due to overlap
of the potential fields on opposite sides of the pore resulting in an
attractive force on the nitrogen molecule.
The external surface area of the sample can be measured from an electron
microscope photograph. The carbon sample was embedded in epoxy resin and
sectioned. Plate 4 shows the results obtained at x 6,000 and x 20,000
magnification. A typical radius of a particle in the x 20,000 photograph
is 3.75 x 10 5 cm. If the density of the soot is equal to that of
graphite i. e. 2.25 gm cc-' then the external surface area of the sample
is 4.0 metre2 gm 1. This is in agreement with the previous hypothesis,
and indicates the presence of microporee,

-85-
36 il a fit magnification x6000
magn i fi cation x20,000
PLATE 4 Electron micrographs of the carbon formed during the pyrolysis of benzene.

-86-
The isosteric heat of adsorption of benzene on the soot
Isosteric heats of adsorption are obtained from a study of
adsorption isosteres. The amount of gas adsorbed is kept constant and
the adsorbate measured for various temperatures.
Application of the Clapyron Clausius equation:
dlnp/dt =L Had8/RT (xxxxiii)
where p= adsorbate pressure
T= absolute temperature
LSHads isosteric heat of adsorption
yields the heat of adsorption.
In practice adsorption isotherms are measured at various temperatures
(286K to 340K). For a constant value of amount adsorbed the corresponding
pressure is read off the isotherm. A Van't Hoff plot of log p against 1/`r(K-1)
will then be a straight line of slope A Had$. For a coverage of 0.003 mg
per mg of sample the plot is shown in figure 2: 19. The slope yields an
isosteric heat of adsorption of about 8,000 call mole-l. This is approximately
the same as the latent heat of evaporation. Benzene, therefore is only
physically adsorbed on the carbon. This suggests that the carbon laid
down on the vessel walls is inert and will not enhance chain initiation or
chain destruction.
Mass spectrometric analysis of the soot
This experiment was carried out on a Varian Mat 311A mass spectrometer
coupled to an on-line data system. A carbon sample was prepared by passage
of benzene through the tubular flow reactor, at a reaction temperature of
about 1223K. The sample was collected from the tube exit. It was introduced
into the mass spectrometer via a direct insertion probe at 433K. Figure
2: 20 shows the resulting spectrum. As little fragmentation occurs the peaks
are generally molecular ion peaks.

In- -87-
L 0
.01
a' 1.
U) a, L
c Li. 0
ol 0
0.
)ý
0
2.9 3.0 3.1 3.2 3.3 3.4 3.5 3.6 1/ Tx103 (K-1) ,
FIG. 2: 19 Temperature dependence of benzene adsorption on carbon produced from benzene pyrolysis
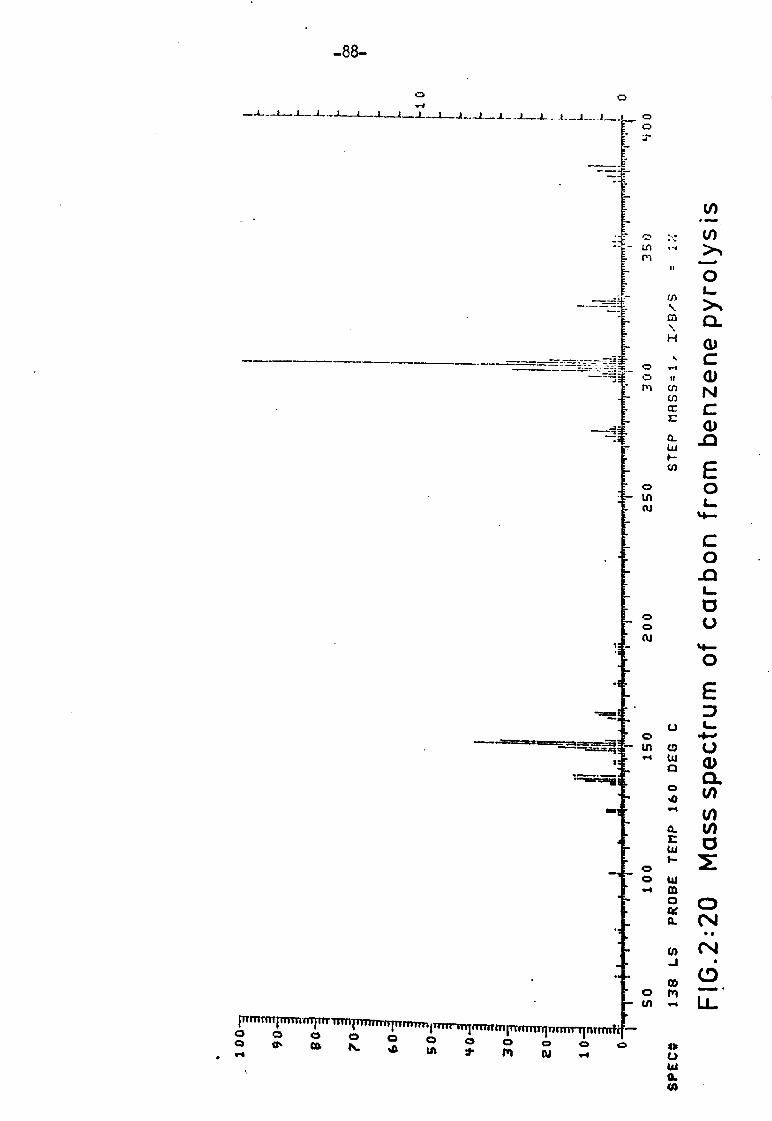
-88- a7 Q N
m
0 0
fn
ö
H
'J If M Ui
(4) Q E
a w
0 LA Cu
4 C. Cu
O 111 0
w a 0
a z w F-
O OU -m
O ce
a
Cr, J
O f+1
0 W d (A
LI)
U,
O
N
a) N C a)
E 0 L
9- C 0
L
V
4- 0
E
u a) CL
0 x
0 N N 6
LL
w CD c2. im N ii rn N .r

-89-
Molecular formulae can be obtained by accurate mass measurements.
The mass of the unknown peak is compared with that of a reference compound.
By this technique the mass to four decimal placds can be found; thus it
is possible to distinguish between compounds of the same molecular
mass and obtain a molecular formula. Table 2: 8 chows the results for
three major peaks.
TABLE 2: 8
Peak Formula Molecular weight
276.0939 C22H12 276.0944
302.1097 C24H14 302.1095
304.1248 C24H16 302.1252
From these data it is possible to draw up a table of possible structures
for each peak. This is shown in table 2: 9.1
Further spectra were obtained by a technique of selective ion
monitoring. The sample was introduced by the direct insertion probe and
heated by a programme from 313K to 773K in 500 seconds. The line 5 on
figure 2: 21 shows that the sample is made up of two major
constituents.
The m/e peaks of 57,302 and 378 were then scanned and the results
also shown in figure 2: 21. Temperatures for maximum intensity of these
peaks are 333K, 433K and 573K respectively. The spectra run at these
temperatures are shown in figure 2: 22.
The soot is composed of two types of compound. The major portion
is aromatic.
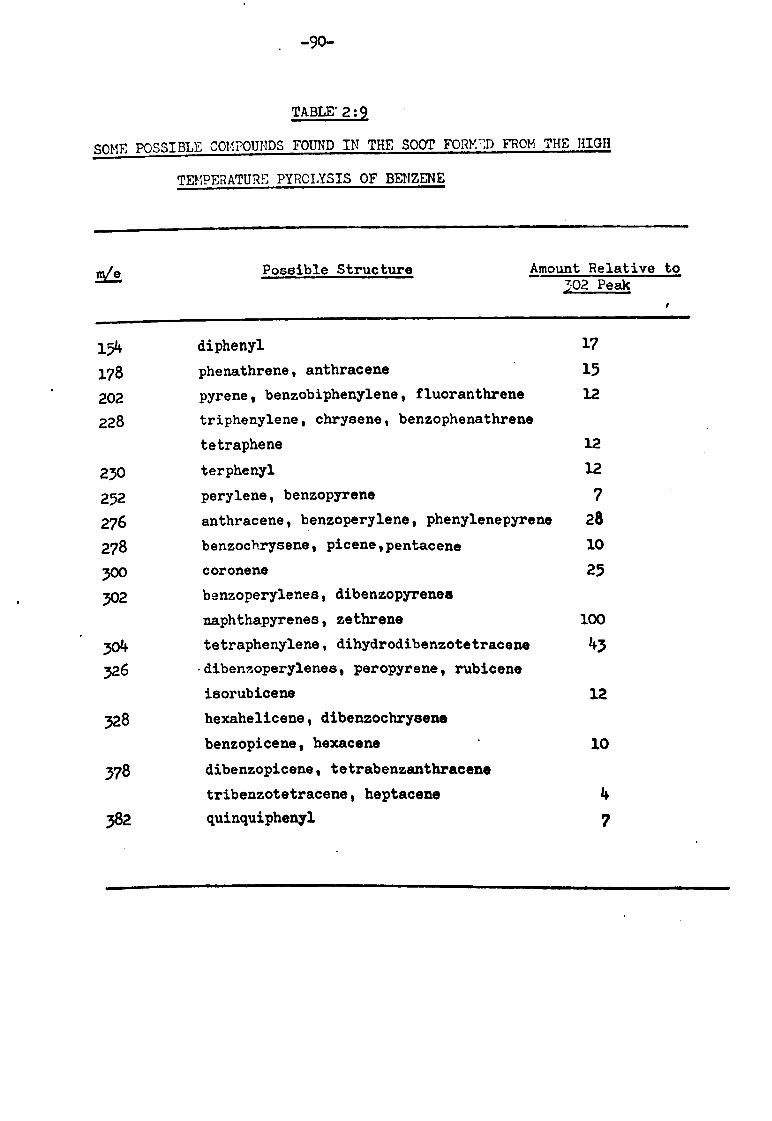
-90-
TABLE' 2:
SOME POSSIBLE COMPOUNDS FOUND IN THE SOOT FORM-'. D FROM THE HIGH
TEMPERATURE PYROLYSIS OF BENZENE
M/e Possible Structure Amount Relative to
302 Peak
154 diphenyl 17
178 phenathrene, anthracene 15
202 pyrene, benzobiphenylene, fluoranthrene 12
228 triphenylene, chrysene, benzophenathrene
tetraphene 12
230 terphenyl 12
252 perylene, benzopyrene 7
276 anthracene, benzoperylene, phenylenepyrene 28
278 benzochrysene, picene, pentacene 10
3co coronene 25
302 benzoperylenes, dibeazopyrenes
naphthapyrenes, zethrene 100
3o4 tetraphenylene, dihydrodibenzotetracene 43 326 "dibenzoperylenes, peropyrene, rubicene
isorubicene 12
328 hexahelicene, dibenzochrysene
benzopicene, hexacene 10
378 dibenzopicene, tetrabenzanthracene
tribenzotetracene, heptacene 4
382 quinquiphenyl 7

1ý ON 0) MM 4l
GD
Y M
n N.
0 0 0 rr
o (DO .P is 1.4 ZM H
-. N
LI üm .4W
12-
LO
CD W
r+ N E
CD 1'1 O
p1 ý o 41
CD .4 ci -t .. L "C
O oE CD c ., C
-~ O
o= G) TO
-1-+ v V 0)
o --r OD = Qý
J I/) vý
ti
oN
MN
o LL Na
es V W Q. N
0OI-1 OO0O OOO OOO
Ma
sualui

M
ee
00
so
to
so
+a
)0
to I
o 50 100
SIEC0 07 LM
is$
re
"0
so
+o 3o
10 ujII
o
s0 100
OPECO lit LM
{i
-92-
probe temperature 60"C
In
ISO 200 250 300 350 400 450 Soo
STEP 11ASS-1,1-18'9 IX
probe temperature 160°C
150 200 2S0 300 3S0 400 450 S00
STEP MR8$. 1" I't's " 1X
O y. ýL fý vN"i"1""r"y-ýT-r-r- ^r°*°r .r, rrr-. f.,.. _ý _ ... --r'--r-. '* º +"'f_. " ' y, r, .ný, a rwy, yy aN l+aýy, T +rtyý" ýr*ý ýý : r, y. ý, y .,, t . r, t. ý, 1 ýý f
f0 loo tf0 200 C60 300 3to "oo yLýý Sn i
{ýLLO 170 LM STEP f1Ntif"1. xifi3 " $5
FIG. 2: 22 Mass specto of the soot at various probe temperatures
t_ . D_

-93-
Polycyclic and compounds composing benzene rings linked head to
tail, up to sexiphenyl, are in this group. A smaller but still
significant type is comprised of straight chain paraffinic compounds
as indicated in spectrum (a) of figure 2: 22.
Structure and mechanism of the soot formation
The work described so far in this section shows that the soot is
amorphous with a carbon to hydrogen ratio of 1.4: 1. It appears at the
reaction vessel exit as small spheres of 3.75 x 10 5cm radius. They
are of low surface area and contain micropores. Benzene is only physically
adsorbed. Chemically the soot is complex and mass spectrometric
analysis indicates formation via both polymerisation and fragmentation
mechanisms.
Numerous theories of carbon formation have been proposed. The major
ones are summarised by Cullis and Palmer57. Recently Graham, Homer and
Rosenfeld6l have produced evidence that at a high temperature in a shock
tube (1600 to 2300K) aromatics produce soot by two routes. These are
either condensation reactions in which the molecules retain their
aromatic character or an indirect route by which the molecule decomposes
into small non-aromatic species before any soot is formed.
(A) 0
.0
condensation ft
. 60
f rvgmentation (B1
fast soot
CHX C Hx SCOW soot z C3Hx

-94-
They also conclude that route A is six times faster than route B QE-fl5 0 Iro1 00 K.
The experiments in this thesis are in accord with this theory and it is
possible to build up a detailed scheme for the condensation reaction
mechanism, for the compounds identified in the soot.
The formation of triphenylene is well known.
H %*.. ý
cj
111
o-terphenyl triphenytene
This reaction can be used as a model for the formation of other
polynuclear compounds found in the soot ni n,.,
l
10 Iý
+ -mss
1121617 dibenzopyrene
tetrabenzanthracene

-95-
Similarly a dibenzopicene can be built up from p- terphenyl.
+ -ý
The compound can now dehydrogenate to give;
/
/
T
Yj
rfl
-s
dibenzopicene
Although not detected (most probably due to evaporation of the
polynuclear compounds on the mass spectrometer probe at too low a
temperature) it is highly possible that hexaperibenzocoronene in
present. A similar synthesis as described above is possible.

i I
-96-
5; 001
ýý
i I
hexaperi benzocoronene
This compound has been synthesised by Clar and Stephen 62.
It is
insoluble in all known solvents and does not melt at temperatures below
760°C. To all intents and purposes it and compounds similar to it can be
regarded as carbon. This 'carbon' can quite easily be built up from
relatively simple compounds. Another interesting feature is the presence
of quinquiphenyl and sexiphenyl.
sexiphenyl
Sexiphenyl has a melting point of about 3800C which suggests that carbon
can be built up quite quickly via this route also. Of course the
complete mechanism is not as simple as described, since compounds based on
tetraphenylene can also be built up.

-97-
iý 'i
tetra phenylene Route (2) involves the ring opening mechanism possible via reaction
C6H5 = C03 + C2H2 (4)
The C4H3 can then perhaps add on to an already formed ring and build-
up can occur this way.
A cross combination of both reaction can yield compounds such as coronene.
i NY ý 0ý
LU coronene
Thus, in aromatic pyrolysis experiments, soot may well be formed by
the above condensation mechanism. A fragmentation route can also occur.
Further work, perhaps with shock tubes, would be required to
establish the detailed mechanism of the high temperature pyrolysis.

_. ý#ýi_
>; ""'TC? N THREE
THE iýY OLY ýI 3 CF : TH'fL II7, CýIE

-99-
Ini-roji, iction
K-: ) In a recent paper on paraffin pyrolysis Bradley co! nr.,. rated,
"Genuine prog; re63 in this field has b een rather slow And erratic., '
the previous section on benzene pyrol ysis cugFcots that in the fi: c ld
of aromatic pyrolysis by comparison, procress has been even slower.
This is also true of de^lkyation stud ies of ethyl benzene. Although
kinetic studies date back to S zwarc's 64
work in 1949, no full
mechanism for the pyrolysis of ethyl benzene in the absence of carriers
has been proposed. Szwarc suggested that the reaction could be
described by a free radical chain mechanism. Initiation occurred by
fission of the aliphatic C-C bond to yield benzyl and methyl radicals.
C6H5CH2CH3 = C6H5C112 + CH3 (1 )
This was followed by the propagation reactions:
C113 + C6H5CIi2CH3 = CH4 + C61E5CH 3
(2 )
CH 3+ C6115CH2CH3 = CH4 + C6H5CH2CH2 (2 a) c6H CHCH3 = H+ C6H5CIICH2 (5 )
+ C6H5C2H5 = 82 + C6H5CH2CH2 (6 )
+ C6H5C2H5 - H2 + C61i GCIHCI13 (6a)
H+ 06H5C2H5 ý C6if6 + C2115 ((jb )
H+ C6H5C2H5 = CH4 + C6If5Crt2 (Cc) C2H5 + C6H5C2H5 C2H6 + C6II5CH2CII2 (8 )
C2H5 + C6x5C2H5 C2H6 + C6Ii` (8a) 3
Possible chain termination processes were
+ C6H5CH2 C6H5CH3 (10e)
2C2H5 C2H4+ C2116 (10d)
H+H+M- 11 2+M (10a)

-100-
The prime object of Szwarc's work was to obtain an accur. -ite value for
the aliphatic C-C bond energy in the ethyl benzene side chain. No , )roof
of the mechanism was proposed. In fact Sjzwarc suggested thi. -. kt as the chain
process is complicated, it is unsuitable for an exact study and propo:, ed
a technique employing excess toluene as a carrier. Thus the reaction was
modified to
C6H5C2H5 = C6H5CH2 + CH3 (1)
c6H5CH3 + CH3 = c6H5CH2 + CH4 (11)
2C6H5CH2 = (c6H5CH2)2 (12)
The excess toluene suppressed the chain by reacting with the methyl
radicals produced by ethyl benzene 'dissociation. Reaction 11 is very
rapid, hence the rate of methane appearance is a measure of the rate of
dissociation of the ethyl benzene. Thus Szwarc was able to obtain a rate
constant given by -1
log10k ( sec )= 13.0 - 63,000/2.3o3RT (i)
from his results in a plug flow reactor. The activation energy was t&ken
to be the C-C bond energy. The carrier method in one form or another
has been widely used in subsequent investigations 65+66,67.
Estban, Kerr and Trotman-Dickenson 65
used aniline as a carrier in a
plug flow apparatus. They were investigating the heat of formation
of the benzyl radicals formed in ethyl benzene pyrolysis. Aniline was
considered a better carrier than toluene because it was unlikely to yield
hydrocarbon side products. It is stable at the pyrolysis temperature
and there is no sign of induced decomposition. The first order rate
constants for ethyl benzene decomposition were calculated from the methane
formed which was assumed to come from the sequence of reactions
0615 2H5 C6M ,+ CH (1)
CH3 + C6H5N12 = C!! 4 + c61(12)

-10'1-
The aniline radical was asmumed to dimerize or oolymt. rize. The amount
of ethane detected was small and the recombination of methyl radicals
was disregarded. Hydrogen found was assumed to come from the molecular
decomposition of ethyl benzene into hydrogen and styrene. Although
no volatile nitrogeneous products were observed, decomposition of the
aniline radical could not be eliminated. Formation of ethylene and
benzene were also considered to be via a molecular decomposition.
Methane formation was regarded as the only significant process and
a rate constant given by
log10k (sec-1) = 14.6 - 70,000/2.303RT (ii)
was obtained.
Crowne, Grigulis and Thro8e1166 used a stirred flow reactor to
study the pyrolysis in the presence of a toluene carrier. Their findings
show that the experimental first order is dependent on the pressure of
toluene and that the rate of methane production falls with a reduction
in carrier pressure for a given partial pressure of reactant. Because
there was a high concentration of benzyl radicals the reverse of
reaction 1 was thought to be significant.
CH3 + C6H5' 2
C6H5C21i5 ( _Z )
An uncorrected value for the rate constant of
log10k (sec-1) 13.1 - 62,2co/2.303RT (iii)
for reaction (1) was obtained. The value was corrected with the help of 68
rate data obtained by Kominar, Jacko and Price for reaction (-1).
log10k (litre mole-'sec-1) = 8.2 - 200/2.303RT (iv)
Clarke and Price 67
have carried out a detailed investigation with a
toluene carrier and have suggested that the pyrolysis occurs at 910
to 1089K by three main reaations.

-102-
c; 6115C2If 5= C6 115C11 2 + CH3 (1)
CrHSC2Ii5 = C6H6 + C2lilt (12 )
C6H5C2TI5 - C6if5C21I3 + 1IZ (13 )
For the initiation react ion (1) a rate constant of
log10k (sec -1) = 14.7 - 70,100/2.303 RT (v)
was obtained.
They showed that at the lowest end of the temperature range negligible
corrections for the reverse of reaction 1 were necessary. At 1025K 35%
decompostion occurs and they suggest that about 151" of ethyl benzene
undergoing decomposition would be expected to be reCenerated. They
consider a correction of 2,000 to 3,000 cals. mole-1 on the activation
energy to be sufficent. Experiments showed ethylene yield to be
surface dependent but in a conditioned quartz vessel a rate constant of
log10k (sec-1) = 9.06 - 51,700/2.303 RT (iv)
for reaction 12 was obtained. In most experiments, benzene yield was
found to be higher that that of ethylene, although the authors state
that the accuracy of the benzene results are open to question.
A rate constant for reaction 13 of
logl0k (sec-1) = 12,. 7 - 64,000/2.303RT
was obtained from the styrene yield.
Experiments without a carrier gas, have been performed by Lee
and Oliver 69,
who used a flow reactor. For reaction temperatures between
848 and 880K they found orders of reaction 0.8 for benzene formation
and 1.1 for toluene formation. Styrene order, however, varied between
one at low temperatures and zero at higher temperatures. No reaction
mechanism was proposed.

-103-
Hausmann and Ki. ng7° repeated these experiments with and without
traces of oxygen present. They used an unusual coiled reactor of 1 metre
length. Residence time was varied from 0.06 sec to 0.17 sec and
temperature from 863 to 923K. In the absence of oxygen, the order of
reaction with respect to styrene was found to be one half. A rate
expression of
d [styrene] / dt = k1 LC611, c211 J (viii)
where k, = 1015 exp(- 70,000/RT)mole I
litre- sec-1 (ix)
was proposed. Considerable scatter on their Arrhenius plot makes
the value unreliable. The following chain mechanism was proposed.
C6H5C2H5 = C6H5CH2 + CIt3 (1)
CH3 + C6H5C2H5 = C6i 5CHCH3 + CH4 (2a)
C6a5CHCÜ3 = C6ü5CHCH2 +H (5)
+ C6H5C2H5 = C616 CH3 + H2 (6a)
2C6H = various products (10c)
The benzyl radical C6H5CH2 was assumed to be unreactive and hence
reactions involving it were not included. For long chains the expression
(x) was found to be consistent with the experimental results.
d Lstyrene] /- dt =(klk52/kloc)3CC6H5C2x5'I (x)
Additional steps to account for ethane, ethylene, and benzene were
suggested. Polynuclear hydrocarbons can be formed as secondary products
in the pyrolysis and Badger and Spotswood ?l have carried out a detailed
non-kinetic study. Compounds identified include phenanthrene,
naphthalene, diphenyl and dibenzyl.
This review shows that the bulk of the kinetic studies have been
carried out with carrier techniques in flow systems. As better experimental
techniques became available the limitations of these processes became
apparent.

104-
Molecular processes which seem unlikely were proposed to account for
hydrogen, ethane, benzene and styrene formation. If the carrier does
not completely suppress the chain (as is often the case with nitric
oxide and propylene inhibition) then the additional chain products will
be observed. The dependence of reaction on toluene pressure shows
that this carrier is not completely 'inert'.
For a complete investigation in which a reaction mechanism can be
proposed it is desirable that the pyrolysis be done in the absence of
carriers. Hausmann and King have attempted this in a flow system but
their results are incomplete.
Modern methods enable accurate results to be obtained for vapours
in a static system. The original objections to non carrier techniques,
proposed by Szwarc, no longer apply. Gas chromatography enables speedy
and accurate product analysis and stainless steel bellows sealed taps
enable vapours to be handled.
The work discussed here uses the static system described earlier
and sets out(a) to confirm that the rate data obtained for the initiation
reaction by carrier techniques applies to the system in the absence of
carrier and (b) to obtain a more complete reaction mechanism for the
reaction.
4

-105-
'r. XP;. RII 1ý74TAL
Introduction
These experiments were carried out with the Static apparatus
and similar procedures to those described earlier. Gas and vapour
mixtures were made up in a heated globe. In a typical experiment, about
40 torr of ethyl benzene was taken and nitrogen added until 400 torr
pressure was reached. When the reaction mixture way admitted to the
evacuated reaction vessel, the total pressure dropped to around 300 torr.
The exact pressure was determined by a previous calibration. After a
period of time, usually four minutes, the reaction mixture was removed
from the vessel and the products of reaction sampled and analysed.
Preliminary Observations
Literature cited previously in this section indicates that the
major products of reaction are hydrogen and styrene. To minimize side
reactions and secondary product formation, the reaction was studied at,
low conversions. A typical experiment at 783K with four minutes
residence time gave about 3y- conversion. Table 3.1 shows the product
distribution for the decomposition of thirty torr of ethyl benzene
under these conditions.
TABLE 1 PRODUCT DISTRIE"UTI )iy IN F: E?: YL BENZENE PYROLYSIS
Product Partial Pressure (torr)
Hydrogen 0-5 Styrene 0-5 Methane 0.05 Ethylene 0.07 Ethane 0.08 Toluene 0.05 Benzene 0.18
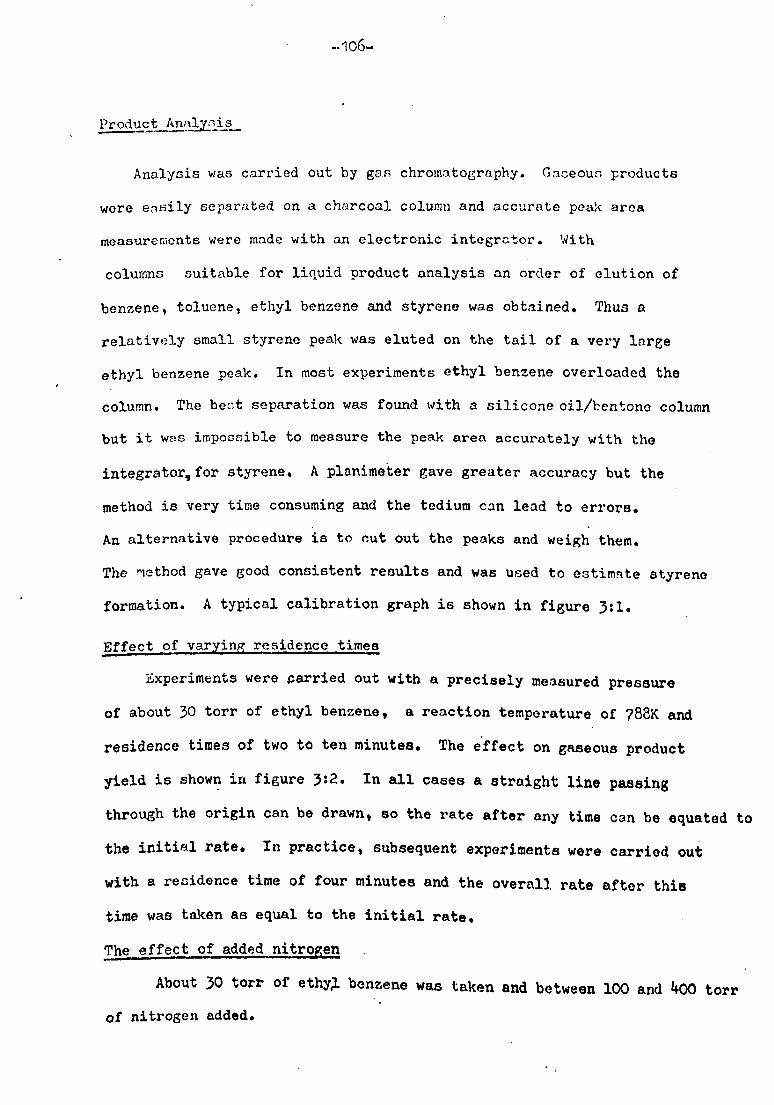
-. 106-
Product ýn z_is
Analysis was carried out by gas chromatography. Gaseous products
were easily separated on a charcoal column and accurate peak area
measurements were made with an electronic integrator. With
columns suitable for liquid product analysis an order of elution of
benzene, toluene, ethyl benzene and styrene was obtained. Thus a
relatively small styrene peak was eluted on the tail of a very large
ethyl benzene peak. In most experiments ethyl benzene overloaded the
column. The best separation was found with a silicone oil/bentone column
but it was impossible to measure the peak area accurately with the
integrator, for styrene. A planimeter gave greater accuracy but the
method is very time consuming and the tedium can lead to errors.
An alternative procedure is to out out the peaks and weigh them.
The method gave good consistent results and was used to estimate styrene
formation. A typical calibration graph is shown in figure 3: 1.
Effect of varying residence times
Experiments were carried out with a precisely measured pressure
of about 30 torr of ethyl benzene, a reaction temperature of 788K and
residence times of two to ten minutes. The effect on gaseous product
yield is shown in figure 3: 2. In all cases a straight line passing
through the origin can be drawn, so the rate after any time can be equated to
the initial rate. In practice, subsequent experiments were carried out
with a residence time of four minutes and the overall. rate after this
time was taken as equal to the initial rate.
The effect of added nitrogen
About 30 torr of ethyl. benzene was taken and between 100 and 400 torr
of nitrogen added.

-107-
U1 E
O1
L
3
d
a
FIG. 3: 1 Typical styrene calibration graph
0.5 Q 0.1 Ostyrene3 pressure orr)ý
07

-C i 0
_C) ( E ov > c cl) rs 0
º. 8
I. b
0
residence time (mins)ON 246 lU
FLG. 3: 2 Progress of ethyl benzene pyrolysis reaction with time.
z residenc4 e time6(mies)___ 10

-109-
1With a reaction temperature of 788K and a recidence time of four
minutes, the effect of nitrogen pressure on the pyrolysis product
yield was observed. Results obtained for gaseous and liquid product
yield are shown in figure 3: 3. Of the gaseous products, methane,
hydrogen , )nd ethane remain unaffected by increase in nitrogen concentration
but a 60jä increase in ethylene yield is seen. As ethane and ethylene are
probably formed via the same intermediate a corresponding decreaie in ethane
yield would be expected. Of the liquid products little effect ie. seen
although benzene yield decreases as nitrogen concentration is increased.
Effect of surface volume ratio on product yield
Leathard and Purnell40 have discussed the role of the surface
in pyrolysis reactions. Rate can easily be affected by several orders
of magnitude. To test for the effect on ethyl benzene pyrolysis,
experiments were carried out in a reaction vessel packed with silica
tubes. Total surface to volume ratio was 1.105 mm-1. The results
were compared with those obtained in the usual reaction ves3el of
surface to volume ratio 0.077 Mn 1. Table 3: 2 shows the results for
a run at a reaction temperature of 792K with a four rinute residence
time and an ethyl benzene concentration of 34 torr.
TALE 3: 2
EFFECT OF VARYING SURFACE. /VOLUME RATIO ON THE UrRYL $i-, NZ NE PYROLYSIS
Product Yield/Torr
Packed Unpacked
methane 0 . 075 0.060 hydrogen 0.52 0.55
ethylene 0-095 0.085 ethane 0.075 0.09

-110-
o. '
O
L
a
o.
0
0 hydrogen ® styrene
4®
01D 8--
100 200 300 400 500 nitrogen pressure (torr )
i 0.08
0 0.0E
Ae.
10 02 00 300 4 00 5 00 nitro gen pressure (torr )
0.0
0.05 0
0.03
U, U,
CL
U
O
a
0.1
00
0 ethylene 0 ethane
600
600
0 methane 0 toluene
0 ar-4 --
00 00 00 000
100 200 300 400 500 nitrogen pressure (torn)
O benzene
0 o s- ý'o-
o
600
100 200 300 400 -500-600- nitrogen pressure (torr)
FLG. 3: 3 Effect Of added nitrogen on ethyl benzene pyrolysis'.

-111-
Effect of nitrogen pressure on reaction in the )-icked vessel
Nitrogen pressure was varied from 100 to 450 tore. The results
are shown in figure 3: 4. Results are very similar to those in the
unpacked vessel although, there is a small effect on ethane yield as would
be expected. In subsequent experiments with the CO rein diameter reaction
vessel surface effects were considered small and ignored.
The effect of pressure on the reaction
Dependence of rate on pressure was investigated at 719K and
a residence time of four minutes. Ethyl benzene pressure was varied
from 10 to 45 torr. The results are shown in figure 3: 5 for both
gaseous and liquid products. Order of reaction with respect to each
product was obtained from graphs of log10 (ethyl benzene) vs log10 (product).
The results are tabulated below in table 3: 3.
TABLE 3: 3
ORDER OF REACTION 'vVITH R P-ECT TO EACH PRODUCT
Product Order
hydrogen 0.65
methane 1.0
toluene 1.0
ethylene 0.9
ethane 1.1
styrene 0.65
benzene 1.0

, -. 0
0.6 ci) T C
O L.
0
O
4)
a E
L. i 0
-0
5 0.1 N C N
.>o. c cl)
L 0
O"C
Q1
-112-
0 0 o O
0 0 0
100 200 300 400 500 600 nitrogen pressure (torr)
O O
,. 0- 4
O E3
O O
LL I- II 0 100 200 300 400 500 600
nitrogen pressure (torn )
0 0 0 o ,r 0
o 100 200 300 400 500 600
nitrogen pressure (torr)
00 0
0 0
0 a'
i011IL 0 100 200 300 400 500 00 nitrogen pressur. e(torr)
FIG. 3: 4 Effect of added nitrogen on ethyl benzene pyrolysis ina packed reaction vessel.

-113_
L 0
ü N
V
O
a
t
O
U)
U
O
CL
FIG. 3: 5a Effect of change in ethyl benzene pressure on product yield in ethyl benzene pyrolysis. ( hydrogen, styrene, benzene, methane. and toluene yields)
ethyl benzene pressure (torr) ---0
0 10 ZO 30 40 ethyl benzene pressure (torr) --1

_111+..
C
HE N C d
0
pressure on product yield in ethyl benzene pyrolysis. ( ethylene and ethane yields a
01 ethyl benzene pressure (torr) v
-1.
ethyl benzene pressure (tore) ---0 E! G. 3: 5 b Effect' of change in ethyl benzene
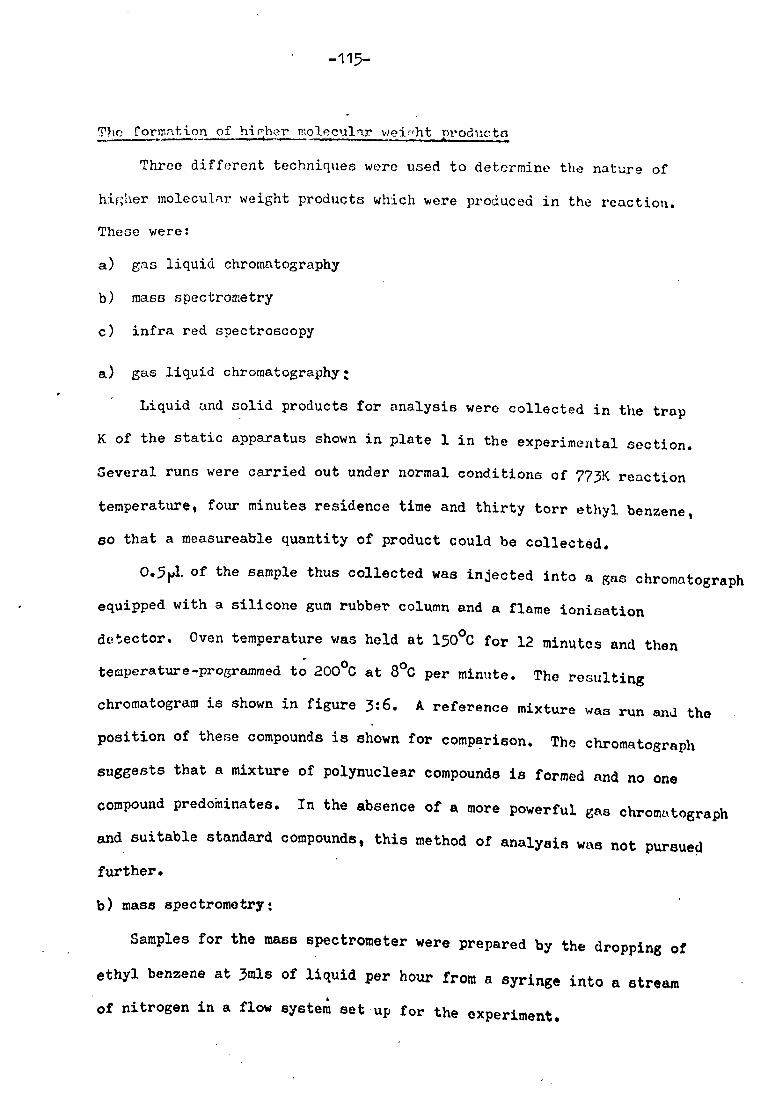
-115-
The formation of hirher molecular weinht products
Three different techniques were used to determine the nature of
higher molecular weight products which were produced in the reaction.
These were:
a) gas liquid chromatography
b) mass spectrometry
c) infra red spectroscopy
a) gas liquid chromatography;
Liquid and solid products for analysis were collected in the trap
K of the static apparatus shown in plate 1 in the experimental section.
Several runs were carried out under normal conditions of 773K reaction
temperature, four minutes residence time and thirty torr ethyl benzene,
so that a measureable quantity of product could be collected.
O. 51,1. of the sample thus collected was injected into a gas chromatograph
equipped with a silicone gum rubber column and a flame ionisation
detector. Oven temperature was held at 150°C for 12 minutes and then
temperature-programmed to 200°C at 8°C per minute. The resulting
chromatogram is shown in figure 3: 6. A reference mixture was run and the
position of these compounds is shown for comparison. The chromatograph
suggests that a mixture of polynuclear compounds is formed and no one
compound predominates. In the absence of a more powerful gas chromatograph
and suitable standard compounds, this method of analysis was not pursued
furthere
b) mass spectrometry:
Samples for the mass spectrometer were prepared by the dropping of
ethyl benzene at 3mis of liquid per hour from a syringe into a stream
of nitrogen in a flow system set up for the experiment.

-116-
15
14.
13
---1Ant, z, ý ---------------
ý' 11
10 Q3 -
r! s st_LLb_ený---------------
_ö -' 8
_3 3.. l LD1 -
-J _ ýiip_h en -1--&-- ""-" f- luorene
a ----ýi4_ý+"Q_in_
5
3
23-
27-
26---
m2 5-
'D24-
0 23--
3*22-
21
5'20
19-
18-
17-
16-
FIG. 3: 6 Gas chromatograph of the solid products obtained from the -pyrolysis of ethyl benzene.
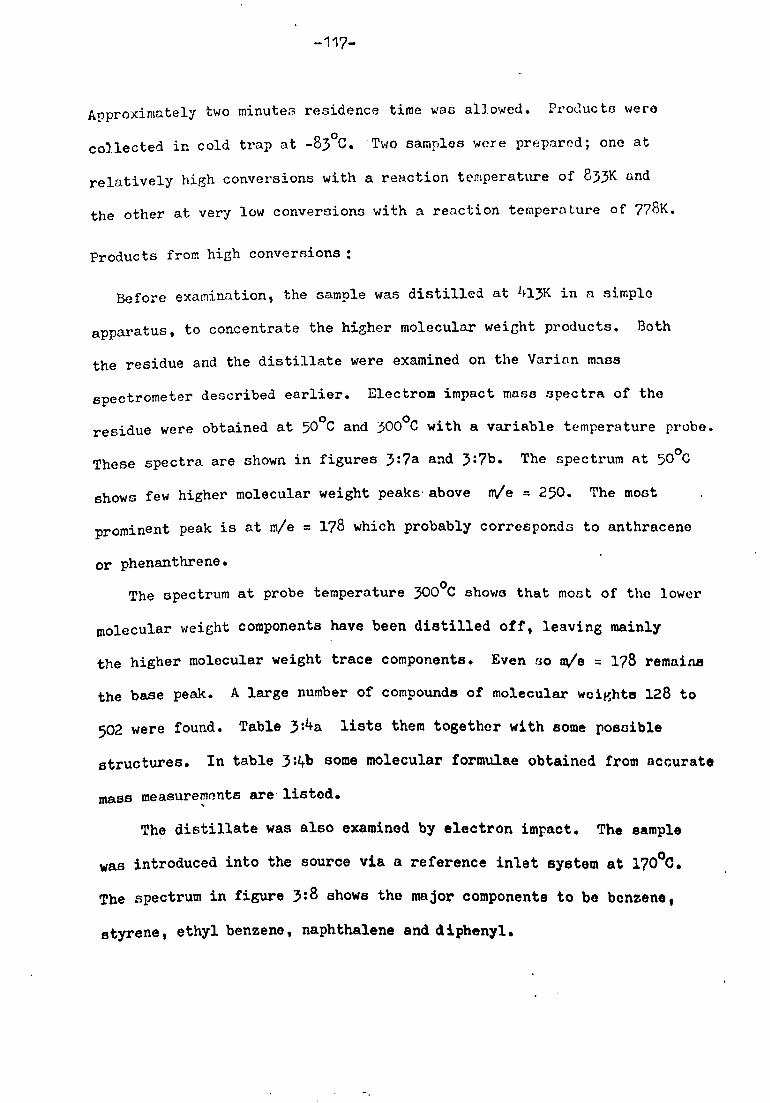
-117-
Approximately two minutes residence time was allowed. Products werd
collected in cold trap at -83 0 C. Two samples were prepared; one at
relatively high conversions with a reaction temperature of 833K and
the other at very low conversions with a reaction temperature of 778K.
Products from high conversions:
Before examination, the sample was distilled at 1º13K in a simple
apparatus, to concentrate the higher molecular weight products. Both
the residue and the distillate were examined on the Varian mass
spectrometer described earlier. Electron impact mass spectra of the
residue were obtained at 50°C and 300°C with a variable temperature probe.
These spectra are shown in figures 3: 7a and 3: 7b. The spectrum at 50°C
shows few higher molecular weight peaks-above m/e = 250. The most
prominent peak is at m/e = 178 which probably corresponds to anthracene
or phenanthrene.
The spectrum at probe temperature 3000C shows that most of the lower
molecular weight components have been distilled off, leaving mainly
the higher molecular weight trace components. Even so rn/e = 178 remains
the base peak. A large number of compounds of molecular weights 128 to
502 were found. Table 3: 4a lists them together with some posoible
structures. In table 3: 4b some molecular formulae obtained from accurate
mass measurements are, listed.
The distillate was also examined by electron impact. The sample
was introduced into the source via a reference inlet system at 170°C.
The spectrum in figure 3: 8 shows the major components to be benzene,
styrene, ethyl benzene, naphthalene and d iphenyl.

-118-
mass spectra of : product s of rea ct ion at high con version
t. t.
I W
Iola X50 : oo LS4 eea 'iý( soil '4S ºse ,
ýo teo es "ee , "
*FCC* IC7" Lh sip ET CEnZEnC ºRC04 CZ Ctlc CTEP fAC6"1. Z'5.3 " IN
F(G. 3: 7a Electron impact spectrum of the distillation residue from ethyl benzene pyrolysis using variable-temperature probe at 50°C
t" tüT
", lid ýI0 ire UI a0"
Mý LN /JI CT 1AMP n[ ºx00% It 300 $Ttº n1. L i"l. i. 0'0 " 131 ; Ls 1
FIG. 3: 7b Electron impact spectrum . of the distillation residue from ethyl benzene pyrolysis using the variable-temperature probe at300°C

-119-
TABLE' r !' !`c"ý; ý' Tý ' vT rr Tý TTT T 'C
`; ULI1) Cýýii'CJ^lý": " FOtii: i7) ý7r Y T' 71.,, > FROM THE
Molecular weight %RI Compound (other isomeric forms
are possible)
128 5 naphthalene 142 trace methyl naphthalene 152 11 diphenylene 154 4 diphenyl 166 5 fluorene 168 2 diphenyl methane 178 100 anthracene 180 20 stilbene 192 14 methyl anthracene 194 2 ethyl fluorene 202 26 pyrene 204 29 ethyl cyclopentace naphthylene 206 5 ethyl anthracene 216 4 methyl pyrene 228 4 chrysene 230 5 p-terphenyl 252 10 benzopyrene 254 17 dinaphthylalkanes 278 9, 'benzochrysenes 280 6 ethyl perylenes 300 trace coronene 302 2 benzoperylenes 304 2 tetraphenylene 330 3 methyl benzonaphthoperinaphthenes 342 trace methyl dibenzo chrysene 350 trace pyreno-pyrene 378 trace dibenzo picenes 380 trace" ethyl benzczethrene 402 trace tetra benzopyrene 502 trace benzanthracenopyrene
TABLE 3: +b
{AMP OF COIII'C)NENTS OF RESIDUE FROM ETHYL BENZENE PYROLYSIS IDENTIFIED BY HIGH RESOLUTION ITT ACT MASS SPECTKONE'TRY
Nominal mass Accurate mass molecular Possible compound (measured) formula
142 142.0770 154 154.0739 166 166.0782 168 168.0939 178 178.0782 180 180.0939 192 192.0939 194 194.1095 202 202.0783 204 204.0939 206 206.1096 216 216.0938
C11Hlp methyl naphthalene C12Hlp diphenyl C13H10 fluorene Ci3H12 diphenyl methane C14H10 anthracene C14H12 stilbene C15H12 methyl anthracene C15H14 ethyl fliiorene C16H10 pyrene C16H12 ethylcyclopentacenaphthylene C16H14 ethyl anthracene 0171112 methyl pyrene

-120-
100
90
80
70
60
SO -
30-
20-
to --
C' 0
SPEC1i
.1 C'
It nlý�
i
.
1.
nm nn R etý nt 44rmt
rýrýýýý ýrý ýM ýýiýIP
ýtml , fýntmn: ýmilmrlmýTTnrýrr'ln^ý'mfrnrý^"ýn'Tj^rTrq' a
5o too i50 800 250
92 LM S. JP ET BEMM-HE PRODS 0-140C EI RI S1"E; P 11AS$r 1
FIG. 3: 8 Electron impact mass spectrum of the distillate from ethyl benzene pyrolysis at high conversion.

-121-
Products from low conversion:
These products were examined with techniques similar to those for
the high conversion sample. Initially only ethyl benzene and styrene
were found. The sample was then concentrated down by distillation so
that only a few microlitres of the high boiling portion rem-wined. This
sam-ole was introduced into the mass spectrometer. The rec. ulting spectrum
is shown in figure 3: 9. In this case the major peals other than ethyl
benzene is at m/e 210. Peaks marked 0 are from straight chain alkanes.
These could be from impurities in the original ethyl benzene or background
from the pump oil. A sample of the original ethyl benzene was treated
as above and showed similar peaks confirming the presence of alkane
impurities.
The compound of molecular weight 210 is present in the reaction
mixture in only fractions of a percent.
A possible structure is:
CH3 0-1
CH-CH CH3
This compound is, however, only one of a number of possible isomers e. g.
\ and
C2H5 \. /\/ CPS
CzHS _ ZH 5-
7
.25 C2H5
C2H5
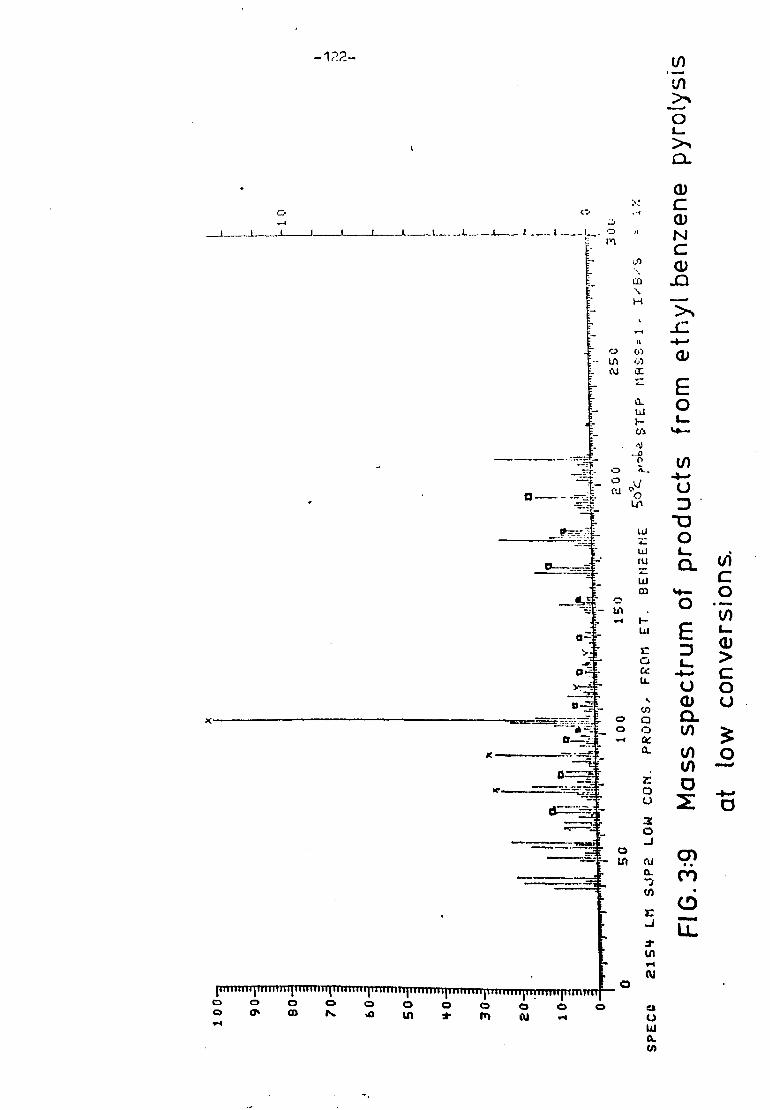
x
C.
-122-
0
CL
(1) J \a/
M C - U)
N S C
c O
ý- L Vi ýa". -
{ O v _ 13ý_ N
W L.. CJ-_
_= rtl [L ý/ýº
V)
W C o 4-. Q
W E L. Oý
a. rx '+', -
W V
n-_ cn Q1 U
--------ýý -t o p
- o o
d- -4 cr
j O
-- J
LA cu
N '^
to .r Cu
O
e) v w CL 0
0o0p00ö... ý ....... 0 47, GD .0 111 :rmQ0ä Cu .. 4

-123-
Crzromlto-mRss ýctrometry
A Perkin Elmer Iß'11 gas chromatograph was connected to an Edwards
) mass spectrometer. A sample of the reaction nixt,: re was injected
into the chromatograph, and as the compounds were eluted, they were
admitted via a heated transfer line to the mass spectrometer. A large
number of secondary products were shown to be present. Some of the
major components are listed in table 3=5
TABLE 3: 5
SECONDARY PRODUCTS FOUND BY CHRO!: ATO-! ASS SPECT'2C'"., T'? Y
Order of elution Compound identified
1 methyl ethyl benzene'
2 3 phenyl prop-l-ene 3 isomer of 1 4 isomer of 1
5 methyl styrene 6 sec-butyl benzene
7 isomer of 5 8 indene 9 1-phenyl but 1 ene
10 methyl indene
11 tetrahydronaphthalene 12 naphthalene
Infra red analysis
A sample of the products mixture was spotted on a thin layer
chromatogaphy plate and the chromatogram run in chloroform. A number
of products were separated. The largest spot was scraped off and the infrared spectrum taken. It is shown as line A in-figure 3: 10.

-1? _ºf-
A sample of the liquid and solid products mixture was then spotted
on a rock salt plate, and the liquid evaporated. An infra red spectrum
was run and the results are given in figure 3: 10 (line B).
Both spectra are typical of a substituted aromatic with peaks around
-1 900 and 1,100 cm . Little other information can be obtained.
Surmary of data on higher molecular weicht products
The higher molecular weight solid products are principally aromatic.
Even at relatively low conversions the mixture produced is complex.
However, at low conversions, a possible chain termination product of
molecular weight 210, is observed. At high conversions anthracene
(or phenanthrene) is found to predominate. This must be formed by some
secondary reaction.
The effect of temperature on reaction
The reaction temperature was varied between 768 and 808K. Thirty
torr of ethyl benzene was used and a residence time of four minutes was
employed. The activation energy was obtained from the Arrhenius plot
of log (product yield or rate constant) against reciprocal tempernturo0
The results are summarised in figures 3: 11 (a) to 3: 11 (f).
Preliminary analysis and interpretation of results
(a) Methane and toluene yields;
Methane is formed in a first order process and i:: related to ethyl
benzene concentration by expression (xi)
d[CH4 1/dt = kmethane [ethyl benzene] (xi)
where kmethane is the first order rate constant for this process. If
-l QCH4 moles litre is the concentration of methane after a time Qt
eecond6 then
'methane = ýCI; 4
£ it (ethyl benzene) (sec-1) (xii)

-125- CO 4
..... .. _.... -- .... ... '
.. ii
. '. ".
:.... :::..........................:. u......... I.....
OCt 06 08 OC 09 L. 5 p 06 1, fir: f ý, '. j r" t lflý . .. -tip CO m
II
r °ý- ---- _ tCL 7Z
ßt ----
VIi.. O
p0ý 06 Oß Of CA OS C) Q" Q. t z0
__. _. ý _. _ý. ý___. ---_. _-' (wry--ý '"I
.. _. ! _-_..
I
W
a L
O
E
0
I
V
Q)
0 C
r
A . JO
'U
O L 0 a a,
U D
'U
001 06 08 .
OIL 09 005 '
oil
1 Is
.,
pct äz jr
to
Q N c
t
I
u
O
a
6 LI)
0 I- co a) c
E O L. 4--
-4-. U
0 L- CL
Z7
0
4- 0
E L
v
C- U,
O
CL
CD
0N ý- C C
0 r
cY)
IL

-126-
Thus a plot of log(kmethane )E ainst l/T K-1 will yield the activation
energy and pre-exponential factor for the process.
A similar expression can be derived for toluene yield. The Arrhenius
plots are shown in figure 3: 11(a). Both toluene yield and methane
yield lie on the same line. Rate expressions (xiii) and (xiv)were obtained
for methane and toluene yields respectively
kmethane - 1014.48 exp(- 70,300/RT)sec-1 (xiii)
ktoluene = 1014'35 exp(- 69,800/RT)sec-1 (xiv)
Hydrogen and styrene yields:
The data obtained were expressed for a constant ethyl benzene
concentration of 6.05 x 10⁻⁴ mole litre-l. This enabled an Arrhenius plot
of log10 product mole litre-1 against reciprocal temperature (K-1) to
be obtained. The results. are shown in figure 3: 11 (b) and (c) yielding -1 activation energies of 91,000 cals mole-' and 86,900 cals mole-'. Thus
combining this with the pressure dependency results, hydrogen and styrene
are formed according to the rate expressions (xv) and (xvi).
d[H2]/dt = 1019.89 exp(- 90,300/RT)[C6H5C2H5)°'63mo1e litre~lsec-1 (xv) 18.2
d [styrene ]/dt = 10 exp(- 86,000/RT)(C6H5C2II }0' G5mo1e li tre-loec-1 (xvi )
Ethane and ethylene yields;
Ethane is formed in a process with an order of 1.1, whereas ethylene
is formed in a process with an order of 0.9. Arrheniue plots of
log kproduct against inverse temperature (K-1) were drawn. The rosults aro
shown in figures 3: 11 (d) and 3: 11 (e). The slopes of the graphs yield
activation energies of 93,300 mole litre-1 for ethane formation and
97,000 mole litre 1
for ethylene formation.
To summarise:
a(02H6)/dt = 1021.08 exp(- 93,300/R1(C6H5C H5 j1 -1 -1 mole litre sec (xvii)
dCC2H4J/dt - 21.48 10 exP(- 97,000iRTXC6H5c2H5 ? '9mole litre-leec-1 (xviii)

-127-,
U Q1
w. 0
O
O
1.22 1,23 1.24 1.25 1.26 1.27 1.28 1.29 1 /Tx103 (K^1) ---+,
FIG. 3: 11a Arrhenius plot for o methane, * toluene formation from the pyrolysis of ethyl benzene.
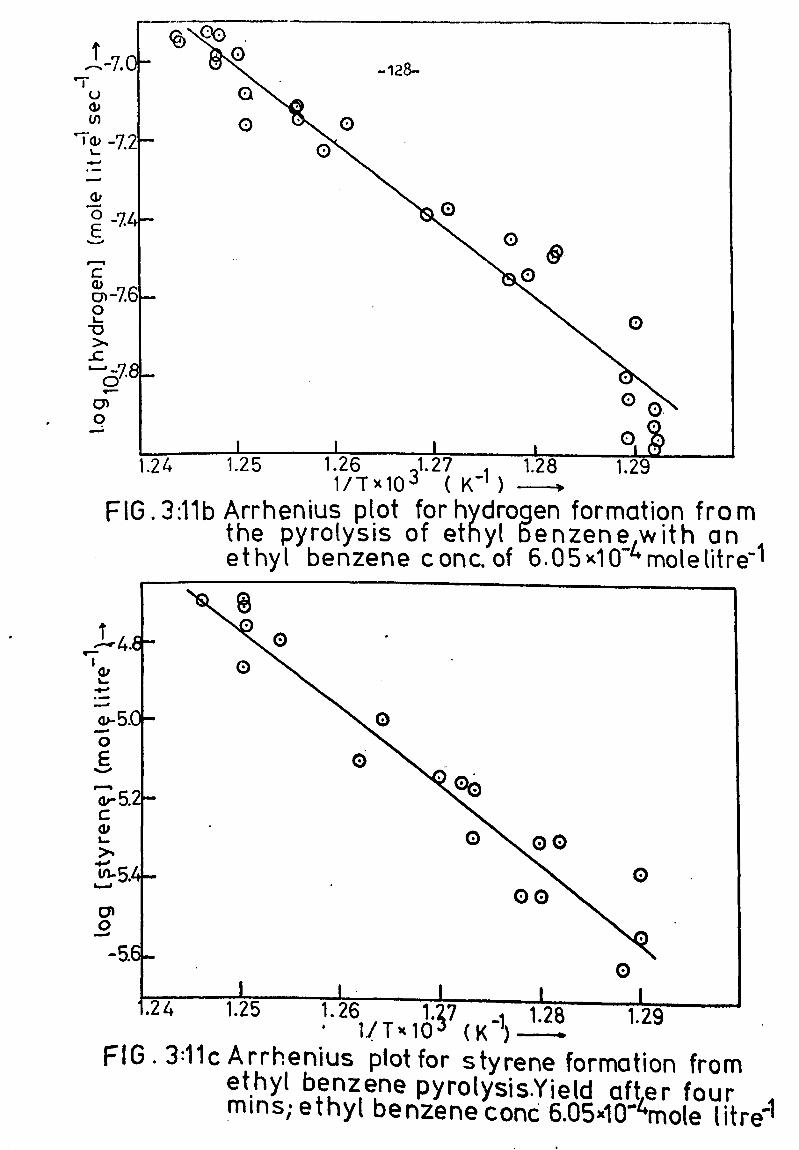
r
U a
a, _7
d O
_7
C
cn O i
S u%
e-
O
° -128--
oº 00 2°
E)
0 0. 0
1 171.1.2 5 1.26 _1.27 1.28 1.29 1/Tx10'J ( K+' )ý
FIG. 3: 11b Arrhenius plot for hydrogen formation from the pyrolysis of ethyl benzene with an ethyl benzene conc. of 6.05x10ý4motelitre 1
it
I 1 N L
O-
O
v
C N L
ui.
CT 0
11 T' 10' (K ') ---- FIG . 3: 11c Arrhenius plot for styrene formation from
ethyl benzene pyrolysis-Yield after four mans; ethyl benzene cone 6.05x10"4mole litre-1

-129-
-It i
U a
C? v 0 E
40 C
L N
ch 0
FIG. 3: 11dArrhenius plot tor ethylene tormation trom ethyl benzene pyrolysis.
FjG. 3: 11e Arrhenius plot for ethane . formation from
ethyl benzene pyrolysis.

-130..
4)
O C-
N C N
.D
Q1 O
FIG. 3: 11f Arrhenius plot for benzene formation from ethyl benzene. pyrolysis.
1/Tx10 3( K-1) -----f.

-131-
Benzene yield:
Benzene in formed in a first order process. T he rate constant k. erzene
was obtained by the same procedure as that described for the rate constant
k methane
Log kbenzene was plotted against l/`' (K-1). The rate expression
(xix) was obtained from the results shown in figure 3: 11(g)
--benzene = 1016.59 exp(- 76,900/RRT)sec-1 (xix)
Table 3: 6 summarises the activation energies and orders obtained by
these methods.
TABLE 3: 6
APPARENT ACTIVATION ENERGIES AND ORDERS CBTAINED
FOR PRODUCTS OF ETHYL B NZEM: YROLYSIS
Product Apparent activation
energy(cals mole-')
Order w. r. t. ethyl benzene
hydrogen 90,300 0.65 methane 70,000 1.0 toluene 69,000 1.0 ethylene 97,000 1.1
ethane 93,300 0.9 styrene 86,000 0.65 benzene 76,900 1.0

-132-
DETAIL'r''D DISCUSSION OF LD{PERIMENTAL RESULTS.
Introduction
In this work, at low conversions, a large number of eecondary
products such at the methyl ethyl benzenes and the methyl styrenes were
formed. These products could arise from free radical attack on reactants
and primary products such as styrene, and the presence of methyl and
ethyl radicals seems likely. This is in agreement with the carrier
studies by previous workers.
To account for the presence of ethylene and ethane in the products
from their carrier experiments, Clark and Price 67
have suggested concurrent
free radical and molecular processes. The argument against such processes
is now well established, and pyrolyses are thought to proceed by either
one mechanism or the other. As no evidence for molecular reactions waa
found in this work, the discussion presented here is limited to free
radical processes. It is convenient to consider the initiation, propagation
and termination stages in turn.
Initiation
Initiation in a free radical chain process usually occurs via the
rupture of the weakest bond in the molecule. In the case of ethyl benzene
the two most likely processes are: -
C6H5CH2CH3 = C6H5CH2 + CH3 (1)
C6H5C2H H= C6H5C2 4+ if (1a)
The C-C bond energy in the ethyl side chain has been estimated by Kominar,
Jacko and Price 6
as 70,500 tale mole 1. The H-H bond energy is similar
to that for H-H in ethane and this is published as 98,000 cols mole-1.
Initiation process (1) is thus more probable. In the previous section,
removal of a hydrogen atom from the ring was diecuooed and shown to be
about 110,000 call Mole-1 endothermic. Initiation via this process is thus
discounted.
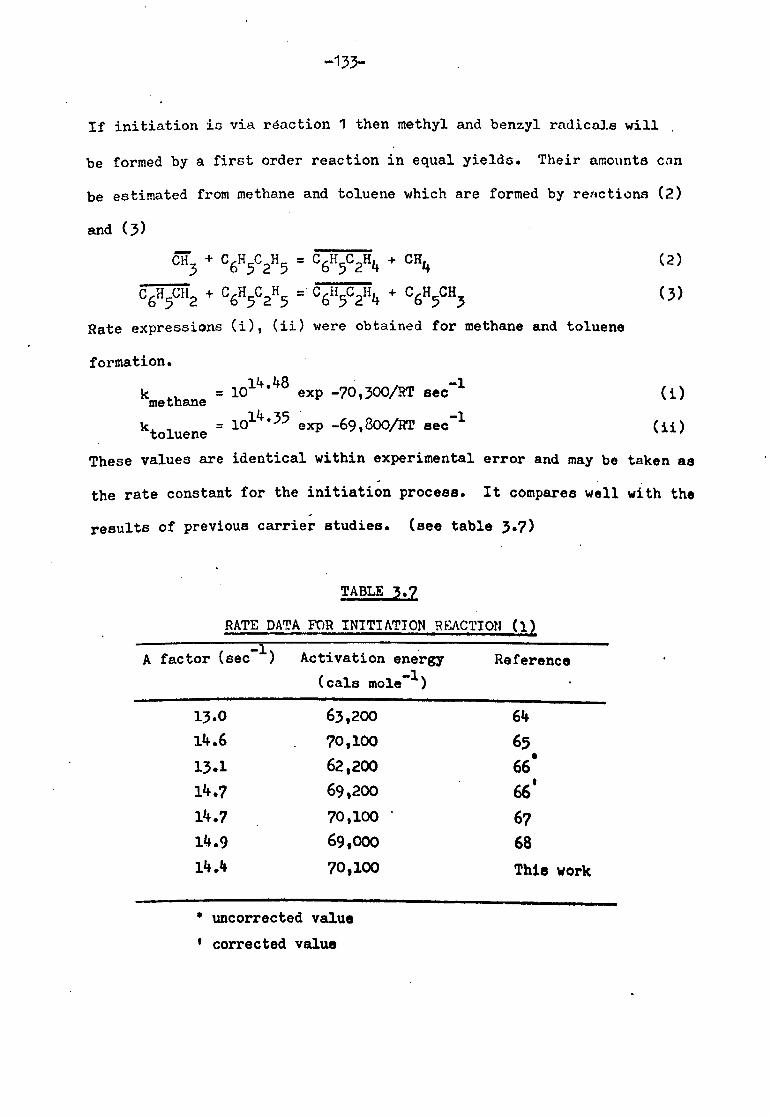
-133-
If initiation is via reaction I then methyl and benzyl radicals will
be formed by a first order reaction in equal yields. Their amounts can
be estimated from methane and toluene which are formed by reflctions (2)
and i3)
6-H 3+ C6H5C2H5 = C6H5C2H4 + CH4 (2)
C6 H5CHI2 + C6H5C2H5 = C6H5C2if4 + C6H5CH3 (3)
Rate expressions (i), (ii) were obtained for methane and toluene
formation.
kmethane = 1014.48 exp -70,300/RT sec-1 (i)
ktoluene = 1014.35 exp -69,800/RT sec-1 (ii)
These values are identical within experimental error and may be taken as
the rate constant for the initiation process. It compares well with the
results of previous carrier studies. (see table 3.7)
TABLE 3.7
RATE DATA FOR INITIATION REACTION (1)
A factor (sec-1) Activation energy Reference (cats mole-
13-0 63,200 64
14.6 70,100 65
13.1 62,200 66 14.7 69,200 66
14.7 70,100 67
14.9 69,000 68
14.4 70,100 This work
0 uncorrected value corrected value

-134-
In further discussion the initiätion reaction is therefore taken to
be (1) with the rate constant k1 = 1014.4 exp -70,100/RT sec-1
Propagation Reactions.
The reaction mechanism cannot be simple because it must account for
all the major reaction products i. e. styrene, hydrogen, methane, toluene,
ethane, ethylene and benzene. The concentration time curves for these
products are linear at low conversions and they are therefore assumed to
be primary products. Szwarc has proposed a scheme comprising reactions
(2), (2a), (5), (6), (6a), (6b), (6c).
CH3 + C6H5C2H5 = CH4 + C6H5 CH22ci 2 (2)
CH 3+ C6H5C2H5 = CH4 + C6H5CH CH 3 (2a)
C6H5CHCH3 = H+ C6H5CH = CH2 (5)
IT + C6H5C2H5 = C6H5CH2 CIT 2+ 112 (6)
+ C6H5C2H5 = C6H + H2 (6a)
+ C6H5C2H5 = C2H5 + C6H6 (6b)
+ C6H5C2H5 = C6H5CH2 + CH4 (6c)
Reaction(6c)is probably insignificant because the data obtained in this
work for the initiation reaction are similar to those obtained by other
workers in carrier studies in which the chain was suppressed by the
addition of toluene. In the subsequent discussion it is ignored. The 64
other reactions seem reasonable. Szwarc reported a chain length of
about 15 to 20. The ratio Initiation Rate/Overall Rate, in this work,
suggested a chain length of just over 10.

-135-
Formation of toluene and methane in equal amounts suggests the
need for reactions (3) and (3a) in which case the benzyl radical is more
reactive than was proposed by Szwarc' .
C6"6H5CH2 + C6H5C2H5 = C6H5- CH2CH2 + C6H5CH3 (3)
6H5CH2 + C6H5C2H5 = C6H5CH Cli3 + C6H5CH3 (3a)
The decomposition of C6H5CHCH3 to hydrogen atoms and styrene in
reaction (S)was proposed to account for styrene formation. The radi-
cS1 C6H5CH2CH2 might similarly react as in reaction(4)to give ethylene
C6H5" CH2CH2 =C6H5+ C2H4 (4)
If phenyl radicals are present, an_ alternative source of benzene could
be:
CH 5+ C6HSC2H5 - C6H6 + C6H5- CH H2 (7)
C6 5+ C6H5C2H5 = C6H6 +C 6H5CH C3 (7a)
Ethane, the remaining product, can be formed by attack of an ethyl
radical on ethyl benzene:
C2H5 + C6H5C2H5 - C61I5CH2CH2 +C2H6 (g)
C- + C6H5C2H5 = C6H5- CI CH3 + C2H6 (8a)
Experiments with added nitrogen show ethylene formation to be dependent
on nitrogen concentration. Lin & Back 78 have shown that the unimolecu-
lar decomposition reaction (9) of ethyl radicals is in its pressure
dependent region under the conditions of this pyrolysis, and this may
account for the dependence.
C2 + (M) - C2H4 +H+ (M) (9)
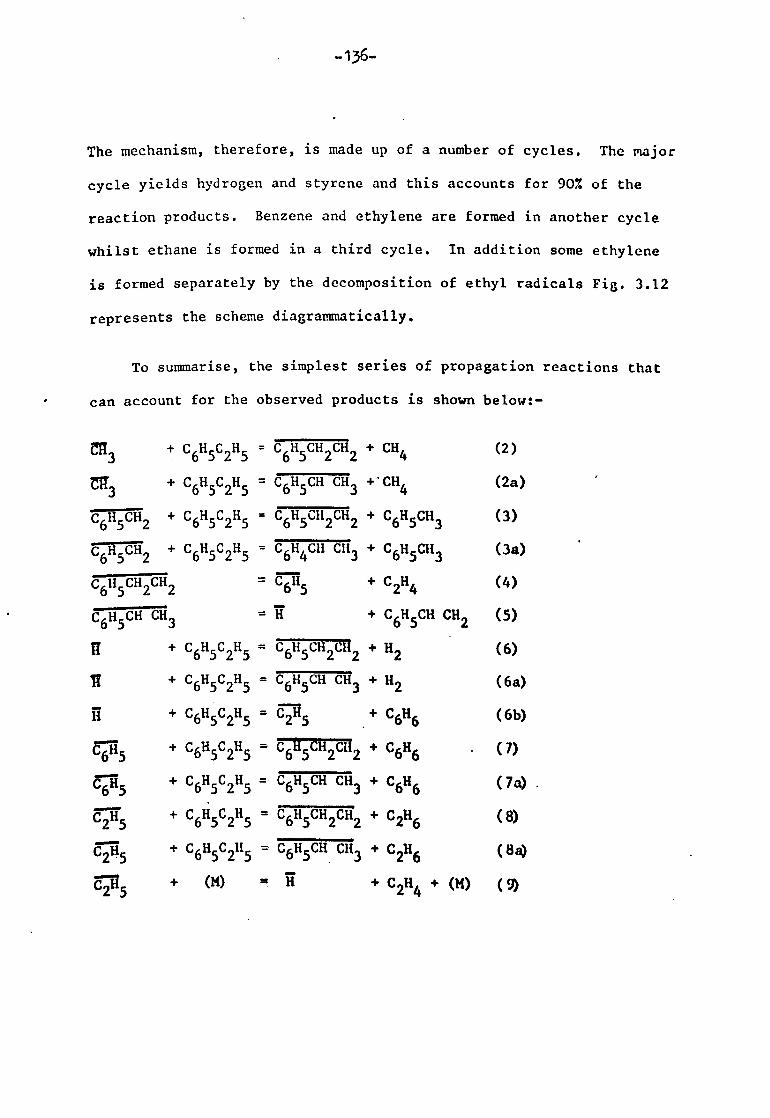
-136-
The mechanism, therefore, is made up of a number of cycles. The major
cycle yields hydrogen and styrene and this accounts for 90% of the
reaction products. Benzene and ethylene are formed in another cycle
whilst ethane is formed in a third cycle. In addition some ethylene
is formed separately by the decomposition of ethyl radicals Fig. 3.12
represents the scheme diagrammatically.
To summarise, the simplest series of propagation reactions that
can account for the observed products is shown below: -
C3 + C6H5C2H5 = C6HSCH2CH2 + CH4 (2)
1T3 + C6H5C2H5 = C6H5CH CH3 +- CH4 (2a)
C6H C2 + C6H5C2H5 = C6HSCH2CH2 + C6HSCH3 (3)
C6H H2 + C6H5C2H5 = C6H4CH CIi3 + C6HSC11 3 (3a)
C6H5- C2C2 = C6115 + C2H4 (4)
C6H5CH CH3 = + C6H5CH CH2 (5)
+ C6H5c2H5= C6H5CH2C 2+ H2 (6)
+ C6H5C2H5 = C6H5CH C3+ H2 (6a)
+ C6H5C2H5 = C2H5 + C6H6 (6b)
C6 5 + C6H5C2H5 = C6 5 2CI 2+ C6H6 (7)
CH 5 + C6H5C2H5 C6HSCH CH3 + C6H6 (7a)
H + C6H5C2H5 = C6H5CH2CH2 + C2H6 (8)
CZ 5 + C6H5C2115 = C6H5CH CH3 + C216 (8a)
C2 5 + (M) =H+ C2H4 + (M) (9)
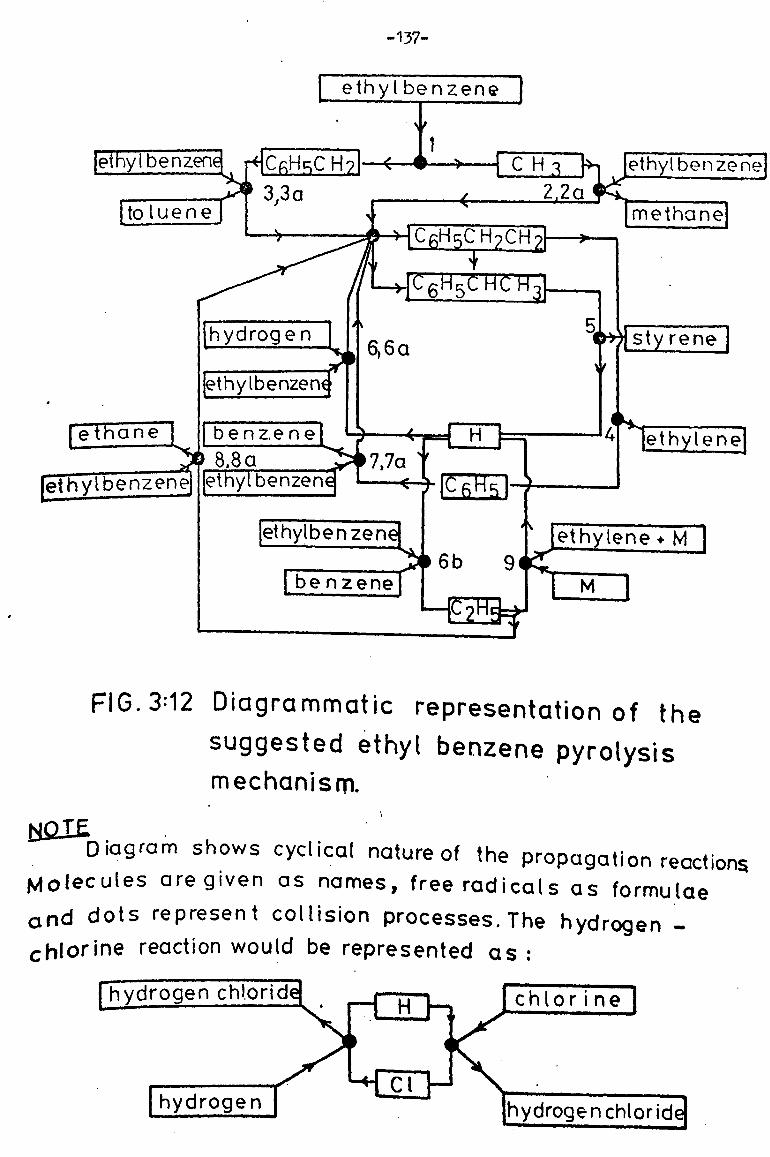
-137-
ethyl benzene
VI benzen CH 71 C 3,3 a ý--- ---c- to luene
cH ethyl benzene 2,2 a
methane 1CcHcC H7CH? I
hydrogen 6,6a
? thvtbenzen
ethäne benzene H4 eth h 8.8 a 7,7a
ylbenzene et y benzen
Jethylbenzen ethylene +M 6b 9
benzene M
FIG. 3: 12 Diagrammatic representation of the suggested ethyl benzene pyrolysis mechanism.
8.8 a j; ý? 217a ylbenzene et y benzen
ethylbenzen
{ benzene
Diagram shows cyclical nature of the propagation reactions Molecules are given as names, free radicals as formulae
ctnd dots represent collision processes. The hydrogen
chlorine reaction would be represented as :
hydrogen chLorid fchtorine
4_H_J--
6
-' ethylene. M 6b 9
M
I stv rene
41 ethvlene
hydrogen hydrogen chtorid

-138-
Termination Reactions.
The free radicals assumed to be involved in the reaction are
H, CH3,76H5)' C6H5CH CH3, C6HSCI. 2CH2,5 plus possibly some polycyclic
radicals.
These radicals can be involved in three kinds of chain termination
reactions if we ignore wall processes which seem to be insignificant.
(a) Recombination of similar free radicals, e. g.
ff +H+M= H2+ (M)
2 C6H5C2H4 = (C6H5C2H4)2
(10a)
(10b)
(b) Recombination of dissimilar radicals (cross combination), e. g.
CH CH3 +H= C6H5C2H5 (10c)
(c) Disproportionation reactions e. g.
2 C6HSCZfl4 = C6H5C2H5 + C6H5C2H3 (10)
For nitrogen as the inert gas 79
the rate constant for reaction (10a)
H+H+M=H2 + (M) (10a)
is k= 109,6 litre2 mole-2 sec-1
which when 300 torr of nitrogen present at 783K corresponds to a pseudo
second order rate constant of
k= 107'4 litre rnolil sec -1
whereas for 2 C2H5 =C2H6 (10d)
k= 1010.4 litre. nole1 sec -1
For large radicals Benson36 suggests a typical value for recombination
of 10 9'8 0'5 litre mole sec .
As cross combination reactions involve large radicals the rate
constant for this group of reactions will be similar to Benson's
typical value.
-139-
Large radicals are generally less reactive than small radicals and hence
achieve the highest intermediate concentration. Furthermore the reaction
H+H+ (M) H2 + (M) (10a)
is third order. Therefore it is unlikely to be significant. Reactions
involving C6H5CH CH3 or C6H5CH2CH2 are more probable. C6H 5 C11 CH3 is a
secondary free radical whereas C6H5CH2CH2 is primary. C6H5 CH CH3 is
therefore likely to achieve higher intermediate concentrations. Also
the isomerisation reaction (11) may occur.
C6 H5CH2CH2 = C6H5CH CH3 (11)
The chain length of the reaction is little more than 10 and if termina-
Lion involves recombination to give products different from the reac-
tants or chain-reaction products then there should be little difficulty
in detecting them. No butane was observed and therefore
2 C2H5 = C4H10
can be discounted.
(10d)
Similarly polynuclear association products should have been observed if
termination involved recombination of large radicals. Small quantities
were found, but quantities were much smaller than the methane and
toluene initiation products yield. If rate of initiation = rate of
termination, then the yield of termination products should equal the
yield of methane and toluene. from the initiation reaction.
Thus termination by disproportionation is more likely
e. g.
2-CC3-. C6H5C2H5 + C6HSC2H3 (10)
6

-140-
although the cross combination reaction
H+ C6 5 CIi CH 3= C6H5C2H5 (10c)
cannot be ruled out at this stage.
Simplified Scheme.
Hydrogen and styrene comprise 90% of the reaction products. If
only formation of these products is considered, then a mechanism com-
prising reactions 1,2,4,5 and 7 together with a termination
reaction can be written
C6H5C2H5 = CH3 + C6H5CH2 (1)
CH3 + C6H5C2H5 = C6HSCH CH3 + CH4 (2)
C6H5CH2 + C6H5C2H5 = C6H5 CH CH3 + C6H5CH3 (4)
C6H5CH CH Y- C6H5CH: CH3 + H (5)
H+ C6H5C2H5 = C6H5CH CH3 + H2 (7)
The simplified scheme ignores the presence of ethyl radicals and any
termination reactions involving them. This is reasonable as butane is
not an observed reaction product.
Suppose that the termination reaction is:
2 C6H5CH CH3 C6H5C2H5 + C6H5CH: CH2 (10)
then the rate equation (xx) for styrene formation is obtained:
d [C6H5CH: CHý /dt - 2k1 [C6H5C2Hý + k5 (k1 /k10)1 [C6H5C2Hý 1 (xx)
Thus:
d [C6H5CH: CH2] /dt 2k1 + k5 (k1 ßk10) i jC6HSC2H5 (xxi)
6H5C2H
'a plot of rate of styrene formation/[ethyl benzene] against (ethyl
benzene)-' should be a straight line with the intercept equal to 2k1.
-141-
Figure 3.13 shows that this is approximately true. 2k1 = 19.42 x 10⁻⁸
sec-l. The least squares intercept is 2.5 x 10⁻⁵ sec-l, but there
is considerable scatter and a slight redrawing of the line would give
a much smaller value. The rate expression (x) is made up of an
initiation term 2k1 [C6H5C2Hý and a propagation term k5(kl/klb
[C6H6C2H5]1. If 2k1[C6H5C2Hý is assumed to be small compared with
k5(k1/k10)ß [c6H6C2H5]1 then the rate expression (xxii) results
d[C6H5CH: CH2] /dt = k5(k1/k10) i
[C6H6C2H5]' (xxii)
Thus, for styrene formation, half order kinetics are predicted. In fact,
the chain length is about 10, so the initiation term will be about
1/10 of the propagation term, and an order slightly greater than 0.5
is predicted. Experiment shows a value of about 0.65. Also the predicted
activation energy is (E5 +I El -I E10). E10 is the activation energy
for the termination reaction and is approximately zero. E1 is the acti-
vation energy for the initiation reaction and experiment has shown this
to be 70,100 cals mole-1. E5 is the activation energy for reaction 5.
Thermochemical calculation (Appendix 3) shows that this has a value of
about 50,000 cals mole-'., Thus the overall activation energy is predicted
as 85,800 cals mole -1. The experimental value for styrene formation
was 87,000 cals mole-1 and therefore agreement is reasonable. Work des-
cribed later in this section develops the argument more fully.
Hydrogen Formation.
The expression
d [H2] /dt - k5 (kl/kl0)1 [C6H5c2H ]' (xxiii)
can be obtained for hydrogen formation.

-142-
i V 0!
N C N N C
s 4--
N
I1
C 0
V
D
0 L
a a) c a,
In
a) y-+
0
FIG. 3: 13 Function plot to test simplified ethyl benzene pyrolysis mechanism.
[ethyl benzene]' (tor( I)

_1ßf3_
Reaction order for hydrogen production is 0.65 and an activation energy
of about 90,000 cals mole-1 was obtained. Once again agreement is reas-
onable with the predicted values 0.5 and 85,800 cals mole. '
The alternative termination process is cross combination between
atoms and C6H5CIi CH3 radicals. If this occurs exclusively then
the rate expression (xxiv) can be deduced and first order kinetics are
predicted for hydrogen production:
d[H2]/dt =(kl/2)(1 + 4k7k5/klkl0c)i CC6H5C2Hý (xxiv).
An order of magnitude calculation can be made for the ratio 4k7k5/k1k10c.
Reaction (7) is bimolecular and a typical bimolecular rate constant
would be of the order of 1012 exp (-10,000/RT) mole litre-1 sec-1.
Reaction (5) is unimo
the order of 1016 exp
1014 exp (-70,300/RT)
1 mole litre sec-1.
Lecular and a typical value for this'would be of
(-50,000/RT) sec-1. k1 has been measured as
sec 1
and using Benson's suggestion k10 is 109.8
Thus the expression 4k7 k5/k1k10 has an approxi-
mate value of 2.5 x 10⁷. This is greatly in excess of one, hence the
rate equation (xxiv) simplifies to
d [H2] /dt - (k7 k5k1) / kl0c [C6I C2H3 (xxv)
First order kinetics are predicted together with an activation energy
of 65,000 cals mole 1.
The experimental activation energy for hydrogen
production is 90,000 cals mole-l. This is considerably higher than the
predicted value. Furthermore this mechanism predicts first order
kinetics for the production of hydrogen whereas the experimental value
value is 0.65.

-144-
Experiment therefore favours termination by the disporportionation
reaction 10.
2C6H5 CH CH 3 C6H5c2H5 + C6H5C9H3 (10)
Hausmann and King7° have considered termination to proceed via reac-
tion
2 C6H5CH CH3 = (C6H5CH CH3)2
This accounted for their experimentally observed 0.5 order for styrene
formation although reaction (10) will also account for it. They did
not, however, identify a product of molecular weight 210. Lee and Oliver69
reported that the order for styrene formation varied between one at
low temperatures and zero at high temperatures. Hausmann & King 7o
found no evidence for this in their work. The work described here was
deliberately carried out at low conversions and low temperatures so
that side reactions would be kept to a minimum. Hith these conditions a
small amount of product 210 molecular weight was found but not in suf-
ficient quantity to be considered as a major termination product.
The variable order behaviour observed by Lee and Oliver could 69
possibly arise fromthe formation of styrene polymers at higher temperatures.
Summary.
This work and some previous work are consistent with a mechanism
involving termination via reaction (10a). Termination via reaction
(bOe) cannot be completely ruled out. Nonetheless, if inserted, it
yields much too low an activation energy compared with experiment.
The following points can now be made.
6
-145-
(1) First order rate constants for methane and toluene yields suggest
initiation via reaction 1.
C6H5 C2H5 = C6H5CH2 + CH 3 (1)
for which the rate constant is
14.4 k= 10 exp (-70,100/RT) sec .
(2) Reactions (2) to (9) are the major propagation steps.
(3) Termination is probably via the disproportionation reaction (10).
Anal ysis of the mechanism in full.
(a) Comp arison of ethane and hydrogen yields.
The above conclusions show that to a first approximation the
reaction can be described by a mechanism in which hydrogen and
styrene are the only products formed by propagation reactions.
If all the proposed propagation reactions are included to
account for ethane and ethylene products as well then the
scheme comprising reactions 2 to 9 given earlier must be used.
From this, rate expressions (xxvi) and (xxvii) can be derived
for hydrogen and ethane formation.
d [H2 ]/dt a (k6 + k6a) [H ] (C6H5C2H5 ] (xxvi)
d [C2H5 ]/dt - (k8 + k8a) [C2H5 ][ C6H5C2H5 ] (xxvii)
These can be combined to give expression (xxviii)
d[H2]/dt (k6 + k6a) Ig. ] (xxviii)
d C2H6 /dt (k8 + k8a) ý2H5]
This can be developed via the stationary state approximation to give (xxix)
d[- (k k)+ (k +k) (k, 9) CHCH 1 [H2]/dt 6., 4- 6a 6 6a 652 5ýý (xxix)
d C2H6 dt k6b (k8 + k8a) b)

-146-
A plot of (d[H2J/dt)/(d[C2H6]/dt) against [C6H5c2115] should
yield a straight line with an intercept of (k6 + k6a)/k6b and
a gradient of (k6 + k6a) k9/(k8 + k8a) k6b'
Figure 3: 14 shows that this holds true for a number of tempera-
tures between 758 and 945K.
The ratio of gradient to intercept will give a value for
k9/(k8 + k8a). Thus an Arrhenius plot of log (gradient/intercept)
against inverse temperature will yield an activation energy and
pre-exponential factor for this ratio of rate constants. However,
a small error in value of the intercept has a large effect on the
function (gradient/intercept)and leads to a meaningless plot. A
more productive approach is to plot log (gradient) against
inverse temperature to yield Arrhenius parameters for the function
(k6 + k6a) k9/(k8 + k8a) k6b" The plot is shown in figure 3: 15.
It yields a value of 11,300 ± 2,800 cals mole-1 for the activation
energy. This is equal to E(6 + 6a) + E9 - E(8
+ 8a) - E6b" The
scattered intercepts in figure 3.14 suggest that E(6 +6-
E6b a
is approximately zero. If so, E9-E(8 +"8a) = 11,300 cals mole-
Arrhenius parameters for reaction 9 are well documented. Lin and
Back's experiments78 lead to the expression (xxx) for reaction 9.
k(O = 10 13'6 exp - 38,000 (cals mole
1)/RT sec -1 (xxx)
k4)0 is the true unimolecular rate constant above the high pressure
limit. Arrhenius parameters for the ethane-forming reactions 8
and 8a are more difficult to obtain.
4

-147-
1i
1
c O U
0 O L 0-
ci s
%0, -
O a. ' d
C 0
U
0 L- CL
o reaction tomp. 845K
4®« 78915 K
764K
(a
III11 0.02 004 0.06 0.08
. 0.10
[etbyt benzene]-] (torn
" reaction temp 825K "ý 798.5 K ® ý, 758K
C N Q1 O L
T
. 04 0.06 0.08 0.10
v
'4- 0
N
d
6
2
[ethyl benzene]-' (torr-1)
0 0.02 0.04 0.06 0.08`1 0.10 (ethyl benzene] (tort
FIG. 3: 14 Comparison of hydrogen and ethane yields from ethyl benzene pyrolysis of various temperatures.

-148-
CD - aG
c
Co
D
b tý
(D -
O
FIG. 3: 15 Arrhenius plot for the function «k6+k6a)/(k84k8a)J /(k9/k6d derived from ethyl benzene pyrolysis.
1.18 1.20 1.22 1.24 1.26 1.28 1.30 1.32
) --> 1 /T x 103(K-1

-149-
Very little data for abstraction reactions by ethyl radicals is
reported in the literature although there is a wealth of informa-
tion for reactions involving methyl radicals. In general these
reactions have rate constants of the order
k= 109 exp (-ll, 000/RT) litre mole-1 sec-1.
The reaction of ethyl radicals with hydrogen
C2H5 + H2 = C2H6 + Ti
has Arrhenius parameters of
k= 10-8.96 exp (-14,100/RT) litre mole-1 sec 1.
Thus, by analogy, the activation energy for reactions 8 and 8a may
be about 14,100 cals mole-1. This means that the estimate of
E9 - E(8 + 8a) is 23,900 cals mole-' compared with the experimental
value of About 11,200 cals mole-1. Lin and Back have shown that
reaction (9)
25+ (M) = CZH4 +H+ (M) (9)
is in its pressure dependent region at all pressures below 1 atmos.
The work described in this thesis was carried out at 300 tort and
hence if reaction (9) participates in the mechanism then it is 78
in its pressure dependent region. Lin and Back have reported
an activation energy of 32,400 cals mole-' for the bimolecular
limit of reaction (9). If this value is chosen for the activation
energy of reaction 9 then the activation energy for the function
E9 - E(8 + 8a) is (32,400-14,100) cals mole-' i. e. 18,200 cals
mole-l. Agreement between this and the experimental value is
better but still only moderate.

-150-
The rate of styrene formation.
Styrene is only formed in the reactions 5 and 10 discussed in the
simple mechanism. Hence the rate equation derived there still holds
true for the mechanism as a whole. i (xxii)
Hence d [styrene ]/dt = k5(kl/kl rC6H5C2Hý
Previous discussion showed this to be reasonable. If a value for the
termination reaction rate constant k10 is assumed then it is possible
to estimate a value for the rate constant of reaction 5.
C6H5CHCH3 =H+ C6H5CH: CH2 (5)
I Now kstyrene = k5 (k1/k10) (xxxi)
Thus by rearrangement and substitution in the Arrhenius equation,
expression (xxxii) is obtained for ks
k5 =A styrene (A11)I exp (-E styrene/I E1)/RT sec-1 (xxxii)
() (A1 )
The rate data for reaction (1) have already been accuratdly measured
and those for styrene formation can be obtained experimentally. If a
value can be estimated for the termination reaction (10) then an esti-
mate can be made for k5. Benson36 has discussed termination reactions
involving large radicals and suggests that a typical value for the
pre-exponential factor in recombination reactions is
109.8 ± 0.5 litre mole-1 sec -1
Now k1 a 1014.4 exp (-70,100/RT) sec -1
and k styrene = 10 18.2
exp (-87,00/RT) mole litre-1 sec-1
if styrene yield is assumed to be half order.
-151-
Thus k5 -- 1015.9 exp (-52,000/RT) sec-1. (xxxiii).
Now for analogous reaction for ethyl radical decomposition (9)
C2H5=C2H4+H (9)
Lin and Back suggest the rate expression for k0, the limiting high
pressure unimolecular rate constant, of
13 .
(xxx). ký = 10.6 exp (-38,000/RT) sec -1
The activation energy estimated for reaction (5) is some 14,000 cals
mole-1 above that for reaction 9. The radical C6H5CHCH3 is however
resonance stabilized
i. e. CHCH3 CHCH3 CHCH3* CHCH3
The resonance energy of this radical is about 12,000 cals mole-1. The
activation energy of reaction 5 will thus be approximately 12,000 cals -1
mole higher than that for reaction 9. Hence the derived value for E5
is reasonable. Thermochemical calculation yields a value of about
50,000 cals mole 1.
Hydrogen Yield.
The derivation of an expression for hydrogen yield is more complicated.
Hydrogen is produced by reactions 6 and 6a.
H+ C6H5C2H5 ' C6H5CH2CH2 + H2 (6)
H+C6H5C2H5-C6H5 CHCH3 + H2 (6a)
These reactions compete with reaction 6b.
H+C6H5C2H5= C2ä5 +C6H6 (6b)

-152-
It is possible to derive an equation (xxxiv) which expresses this
d[H2] = (k6 + k6a)[ C6H5C 2H511 (kl/klO)'O (xxxiv)
dt (k6 + k6a + k6b) 0+ k9k6b
where 0= (k8 + k8a) [C6H6C2H 5
]+ k9
If k6b « (k6 + k6a) then the expression becomes
d[H2]/dt = k5(kI/k10)ß 1C6H6C2H51 (xxiii)
This is identical with the equation derived in the simple mechanism and
is also similar to that derived for styrene production. To a first
approximation this simplfying assumption is valid. Reactions 6 and 6a
lead to hydrogen whereas reaction 6b leads to benzene and ethyl radicals.
The ethyl radicals in turn yield ethane and ethylene via reactions 8,
8a and 9. Reactions 8 and 8a are the only sources of ethane and it
occurs at a level an order of magnitude less than that of hydrogen.
A reaction order for hydrogen formation of about a half is predicted.
The activation energy of the process will be similar to that for
styrene formation. Experiment confirms both these conclusions. The
simplified expression (xxiii) for hydrogen formation is identical with
that derived for styrene yield. Thus to within an order of magnitude
a value for the rate constant for reaction (5) can be isolated by a
similar procedure to that earlier described.
19.89 0.5 0.5 -1 Now kH 2=
10 exp (-90,300/RT) mole litre sec (xxxv)
if hydrogen formation is assumed to be half order.

-153-.
Thus using the data for k1 and k10 given earlier
k5 = 10 16.5 exp (-55,000/RT) sec-1 (xxxvi)
The value is similar to that derived from styrene yield, as would be
expected from the fact that hydrogen and styrene yields were identical.
Ethane Yield.
The expression for ethane yield is:
d [C2H6I (k8 + k8a) {C6115C2H513/2 k6bk5 (kl/klo) ý
(xxv)
dt (k6 + k6a + k6b) 0+ k9k6b
where 0= ((k8 +. k 8a ) CC6H5C2H5) + k9)
An order of three halves is predicted, if 1; 9 » (k8 + k8a) [c6115c2H5J.
If the reverse is true and k9 is small then
d[C2H6] = k6bk5 (k1/k10)1 (C6H5C2H5) (xxvi)
dt (k6 + k6a + k6b)
and an order of one half is predicted. This does not agree with the
experimental value of 1.1 and suggests that the two terms are of simi-
lar magnitude and a considerable quantity of ethane is produced via
reaction 9.
5+ (M) =C211 4+H+ (M) (9)
It confirms the need for the inclusion of reaction 9 in the reaction
scheme.

-154-
Summary of proposed mechanism and rate data obtained.
C6H5CH2CH3 = C6H5CH2 + CH3
CH3 + C6H5CH2CH3 = C6H5CH2CH2 + CH4
CH3 + C6H5CH2CH3 = C6H5CHCH3 + CH4
C6H5CH2 + C6H5CH2CH3 = C6H5CH2CH2 + C6H5CH3
C62 + C6H5CH2CH3 = C6H5CHCH3 + C6H5CH3
C6H5CH2CH2 = C6H5 + C2H4
C6H5CHCH3 = H + C6H5CH: CH2
g + C6H5CH2CH3 = C6H5CH2CH2 + H2
+ C6H5CH2CH3 = C6H5CHCH3 + H2
+ C6H5CH2CH3 C2H5 + C6H6
C6 5 + C6H5CH2CH3 = C6H5CH 2 CH 2 + C6H6
C6H5 + C6H5CH2CH3 C6II5CHCCH3 + C6H6
C2 + C6H5CH2CH3 = C6H55CH2CH2 + C2H6
C H5 + C6H5C2H3= C6H5CHCH3 + C2H6
C2H5 + (M) = H + C2H4 + (M)
2C6H5C2H = C6H5CHCH + "C6H5CH: CH2
In derivin g this mechanism it is assumed that -
(1) There are no secondary reactions at low conversions.
(2) Abstraction from the benzene ring does not occur.
(3) Surface reactions are unimportant.
(1)
(2)
(2a)
(3)
(3a)
(4)
(S)
(6)
(6a)
(6b)
(7)
(7a)
(8)
(8a)
(9)
(10)
(4) The only sources of methane and toluene are via the initiation
reaction.
6
-155-
An examination of the proposed mechanism shows it to agree well with
experiment. All the major products have been shown to be produced
via chain carrying steps and not via secondary reactions. From the
mechanism, a number of rate constants have been derived. Rate
expressions (xiii), (xiv) for the initiation reaction (1) have been
derived.
C6H5c2H5 = C6 2+ CH 3 (1)
k1 = 1014.48 exp (-70,300/RT) sec-1 (xiii)
based on methane yield and
kl = 1014.35 exp (-69,800/RT)-sec-1 (xiv)
based on toluene yield. These expressions agree with data obtained
from carrier techniques.
For reaction 5 the rate expression (xxxiii) was obtained
C6H5CHCH3 =H+ C6H5CH: CH2 (5)
k5 = 1015'9 exp (-52,000/RT) sec -1 (xxxiii)
Rate expressions for hydrogen, styrene, ethane, ethylene and benzene yields
have also been obtained.

-156-
SECTION FOUR
OVERALL SUMMARY AID SUGGESTIONS
FUTURE WORK
-157-
Until recently most studies of benzene pyrolysis had been carried
out in the high temperature region of the reaction where both diphenyl
formation and ring fission occur. Little agreement could be found
between the rate data obtained by different sets of workers.
In section II of this thesis the mechanism for the low temperature
pyrolysis of benzene has been developed. The results show that a free
radical chain mechanism takes place, and hydrogen was shown to be formed
according to the relation (i).
d [H2]/dt = 109.83 exp(53,800/RT) [C6H6 ]3 /2 mole litre_
1 sec-1 (i)
The mechanism below accounts reasonably well for the observed kinetics
of diphenyl and hydrogen formation:
C6H6 = C6H5 +H' (1)
C6H5 + C6H6 = (C6H5)2 +H (5)
H+ C6H6 =C (9)
C6H7 = C6H5 + H2 (6)
2U6-H5 (C6H5)2 (3)
At the lowest temperatures, the experimental Arrhenius plot curves
away from that predicted by the theory. Preliminary experiments with
different surface-to-volume ratio reaction vessels failed to reveal a
significant effect. At most rate, was reduced by 309.. The change in
surface/volume ratio would have caused a change of rate of an order of
magnitude had heterogeneous reactions been important. Further study
is necessary to establish the reason for the low activation at low
temperatures. A full study of the surface effects may prove useful.
-158--
In predicting the overall rate equation for benzene pyrolysis, esti-
mates were made of the pre-exponential factors and activation energies
of the individual elementary reactions. Little experimental work has
been done on the reaction (3).
C6H5 + C6H6 = (C6H5)2 +A (3)
and rate data obtained by Trotmann-Dickenson and Steacie, and Kretch and
Price, for reaction (10) have been disputed by Benson and others.
CH3 +C6H6= CH4 + C6H5 (10)
Further work to establish the rate parameters for these abstraction
reactions is necessary.
The extension of the work to the benzene pyrolysis reaction at
higher temperatures was inconclusive. More sophisticated apparatus
than available for this work is necessary. However, acetylene appears
to be an important product. Carbon is formed in large quantities.
The work here suggests possible routes to carbon formation. The early
stages of reaction, however, were not satisfactorily defined. Shock
tube studies might yield valuable information.
In Part III of the thesis, the pyrolysis of ethyl benzene was con-
sidered. The large number of reaction products suggests the complex
mechanism shown below:
C6H5CH2CH3 = C6H5CH2 + '"C13 (1)
Cü3 + C6H5CH2CH3 - C6H5CH2C 2 + CH4 (2)
CÄ3 + C6H5CH2CH3 = C6H 3 + CH4 (2a)
C6H5CH2 + C6H5CH2CH3 0 C6H5CH2 2 + C6H5CH3 (3)
C6HSCH2 + C6H5CH2CH3 = C6HH5CHCH3 + C6H5CH3 (3a)
C6H5CH2CHH2 = C6 5 + C2H4 (4).

-159-
C6H5CHCH3 = H + C6H5CH: CH2 (5)
+ C6H5CH2CH3 = C6H5CH2CH2 + H2 (6)
+ C6H5CH2CH3 = C6H5CHCH3 + 112 (6a)
C6H5CH2CH3 = C2H5 + C6H6 (6b)
76H5 + C6H5CH2CH3 = C6H5CH2CH2 + C6H6 (7)
U05 + C6H5CH2CH3 = C6H5CHCH3 + C6H6 (7a)
C2H5 + C6H5CH2CH3 = C6H5CH2CH2 + C2H6 (8)
C2H5 + C6H5C2H3 = C6H5CHCH3 + C2H6 (8a)
" C2H5 + (M) =H + C2H4 + (M) (9)
2C6H5C2H4 = C6H5CH2CH3 + C6H5CH: CH2 (10)
Rate data for the initiation reaction of
k= 14.4 exp (-70,300/RT) sec -1
agrees with those of previous workers who used aniline or toluene carrier
techniques.
For reaction (5) rate data of
k= 1015.9 exp (-52,000/RT) sec-1
was derived.
The predicted kinetics from the mechanism were shown to be compat-
ible with those found experimentally.
In this work conversions were kept low and no attempt was made to
study the reaction at higher temperatures where carbon is formed. Some
preliminary experiments showed that polycyclic aromatic compounds can be
formed relatively easily from ethyl benzene. The role of ethyl benzene
in carbon formation is another area in which little is known.
The kinetics of the pyrolysis of n-propyl benzene and the xylenes
in the absence of carriers was another area in which little work has been
published.
-160-
There is little point, however, in going any further up the homolo-
gous series as the work then becomes a study of the chemistry of the
side chain, and is likely to be similar to that of the corresponding
alkanes which have been thoroughly investigated.
The relevance of the work to the gas industry.
In G . R. H . and F .B .H. processes a large number of pyrolysis reactions
occur. A small but important constituent of the feedstock comprises
aromatic compounds. These aromatic compounds will react in the manner
described in this thesis. In order to obtain a fuller understanding of
the process, reaction modelling studies are undertaken. The rate data
obtained in this thesis will be of-use in these modelling studies. In
turn it may be possible to predict conditions under which greater efficiency
of plant operation will occur.
An unwelcome product in F. B. H. Processes is carbon. The work in
this thesis suggests that this carbon is formed via aromatic compounds
and a mechanism for its production can be postulated. By applying the
results found in this thesis it may be possible to minimise and possibly
eliminate this carbon forming process.

-161-
References.
1. M. Berthelot Bull. Soc. Chim. France 6 272
2. M. Szwarc J. Chem. Phys. 17 431
3. B. C. Reuben & M. Burstall The Chemical Economy Longmans
4. E .B. Schultz & H. R. Linden Ind. Eng. Chem 49 2011
5. F J. Dent, R. F. Edge, D. Hebden, F. C. Wood
and T . A. Yarwood. Trans. Inst. Gas Eng. 106 594
6. C. T. Brooks & B. H. Thompson 165th Am. Chem. Soc. Meeting Dallas
7. M. Berthelot Ann Chim. Phys. 9 453
8. M. Berthelot Z. Chem. 707
9. G. Schultz Annalen 174 201
10. H. Schmidt & G. Shultz Annalen 203 118
11. G. McKee J. Soc. Chem. Ind. 23 403
12. C. Smith &WLewcock J. Chem. Soc. 101 1453
13. J . W. Cobb & Hollis Gas World 60 879
14. J. W. Cobb & S. F. Dunton Gas World 69 127
15. J E. Zanetti & G. Egloff Ind. Eng. Chem. 9 350
16. W .E. Backman &H .T. Clarke J. Am. Chem. Soc. 49 2091
17. R. N. Pease & J. M. Morton J. Am. Chem. Soc. 55 3190
18. F. C. Mead & R. E. Burke Ind. Eng. Chem. 27 299
19. K. Andrianov F. Kvitner and V. Titova Org. Chem. Ind. (USSR) 4 161
20. K. Bolton, J .E. Cullingworth B .P. Ghosh and J. W. Cobb J. Chem. Soc. 252
21. C. R. Kinney & E. Delbel Ind. Eng. Chem. 46 548
22. R. Iley & H. L. Riley J. Chem. Soc. 1362
23. G. M. Badger &3. Novotny. J. Chem. Soc. 3400
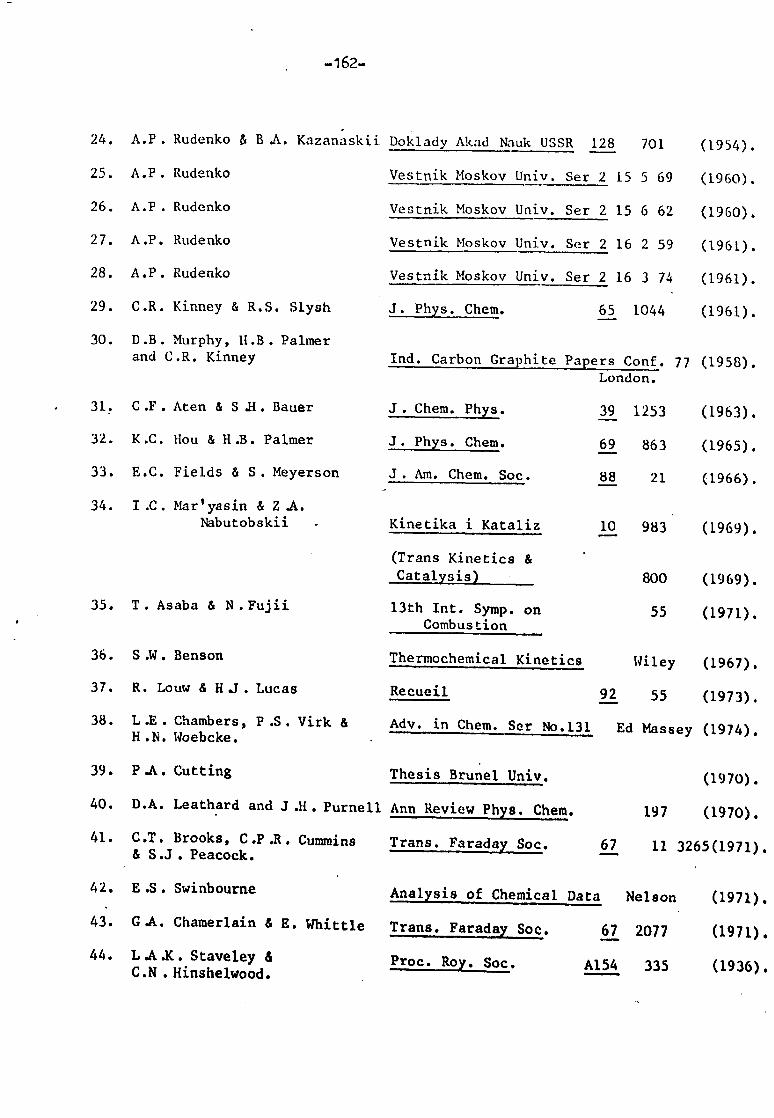
-162-
24. A. P. Rudenko ý B. A. Kazanaskii Doklady Akad Nauk USSR 128 701
25. A. P. Rudenko Vestnik Moskov Univ. Ser 2 15 5 69
26. A. P. Rudenko Vestnik Moskov Univ. Ser 2 15 6 62
27. A .P. Rudenko
28. A .P. Rudenko
29. C. R. Kinney & R. S. Slysh
30. D .B. Murphy, 11. B . Palmer and C. R. Kinney
31. C. F. Aten &S .H. Bauer
32. K .C. Hou &H .B. Palmer
33. E. C. Fields & S. Meyerson
34.1C . Mar'yasin &ZA. Nabutobskii
35. T. Asaba &N. Fujii
36. S. W. Benson
37. R. Low &HJ. Lucas
38. L .E. Chambers, P .S. Virk & H N. Woebcke.
Vestnik Moskov Univ. Ser 2 16 2 59
Vestnik Moskov Univ. Ser 2 16 3 74
J. Phys. Chem. 65 1044
(1954).
(1960).
(1960).
(1961).
(1961).
(1961).
Ind. Carbon Graphite Papers Conf. 77 (1958). London.
J. Chem. Phys. 39 1253 (1963).
J. Phys. Chem. 69 863 (1965).
J. Am. Chem. Soc. 88 21 (1966).
Kinetika i Kataliz
(Trans Kinetics & Catalysis)
13th Int. Symp. on Combustion
Thermochemical Kinetics
Recueii
Adv. in Chem. Ser No. 131
10 983 (1969).
800 (1969).
55 (1971).
Wiley (1967).
92 55 (1973).
Ed Massey (1974).
39. P. A. Cutting Thesis Brunel Univ. (1970).
40. D. A. Leathard and J. H. Purnell Ann Review Phys. Chem. 197 (1970).
41. C. T. Brooks, C. P. R. Cummins Trans. Faraday Soc. 67 11 3265(1971). &S .J. Peacock.
42. E. S. Swinbourne Analysis of Chemical Data Nelson (1971).
43. G . A. Chamerlain & E. Whittle Trans. Faraday Soc. 67 2077 (1971).
44. L. A. K. Staveley & Proc. Roy. Soc. A154 335 (1936). C. N Hinshelwood.
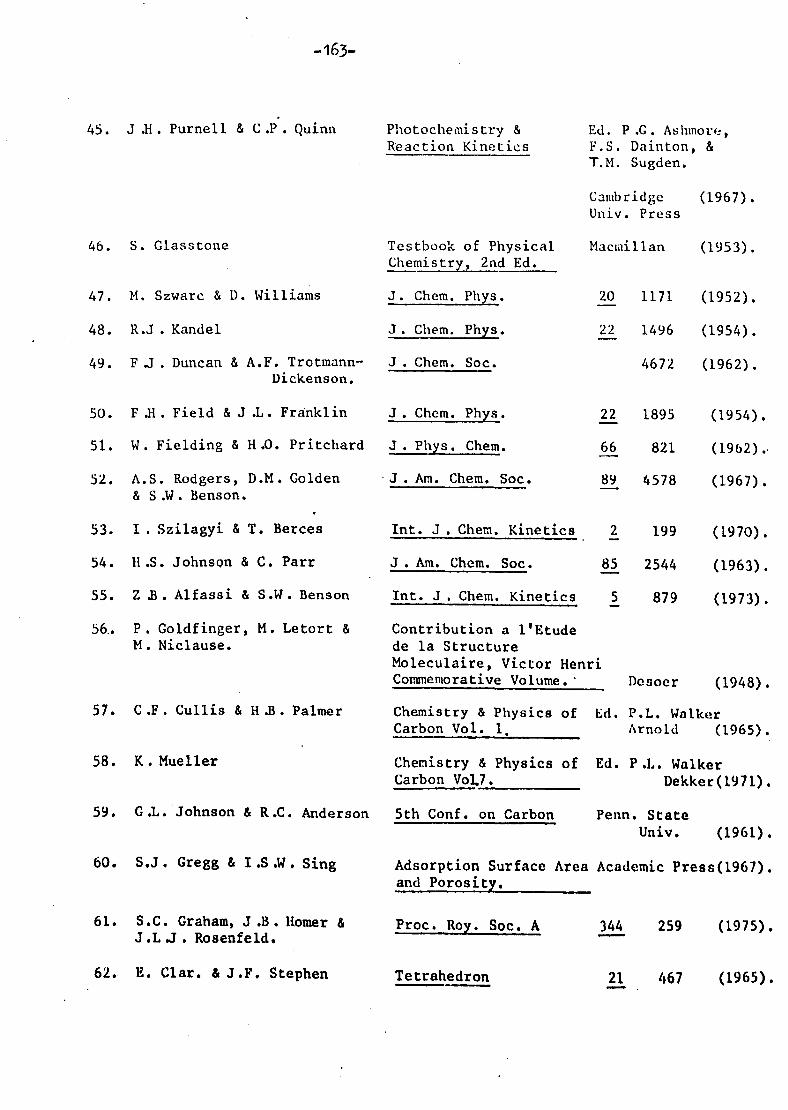
-163-
45. J .H. Purnell &C .P. Quinn
46. S. Glasstone
47. M. Szwarc & D. Williams
48. R. J. Kandel
49. F J. Duncan & A. F. Trotmann- Dickenson.
50. F. H. Field & J. L. Franklin
51. W. Fielding &H . O. Pritchard
52. A. S. Rodgers, D. M. Golden & S. W. Benson.
53. I. Szilagyi & T. Berces
54. H. S. Johnson & C. Parr
55. Z . B. Alfassi & S. W. Benson
56.. P. Goldfinger, M. Letort & M. Niclause.
57. C. F. Cullis & H. B. Palmer
58. K. Mueller
59. G. L. Johnson & R. C. Anderson
60. S. J. Gregg &I .S .W. Sing
61. S. C. Graham, J .B. Homer & J. L J. Rosenfeld.
Photochemistry & Ed. P .G. Aslimort_, Reaction Kinetics F. S. Dainton, &
T. M. Sugden.
Cambridge (1967). Univ. Press
Testbook of Physical Maciuillan (1953). Chemistry, 2nd Ed.
J. Chem. Phys. 20 1171 (1952).
J. Chem. Phys. 22 1496 (1954).
J. Chem. Soc. 4672 (1962).
J. Chem. Phys. 22 1895 (1954).
J. Phys. Chem. 66 821 (1962)..
J. Am. Chem. Soc. 89 4578 (1967).
Int. J. Chem. Kinetics 2 199 (1970).
J. Am. Chem. Soc. 85 2544 (1963).
Int. J. Chem. Kinetics 5 879 (1973).
Contribution a 1'Etude de la Structure Moleculaire, Victor Henri Commemorative Volume. ' Desoer (1948).
Chemistry & Physics of Ed. P. L. Walker Carbon Vol. 1. Arnold (1965).
Chemistry & Physics of Ed. P. L. Walker Carbon Vol. 7. Dekker(1971).
5th Conf. on Carbon Penn. State Univ. (1961).
Adsorption Surface Area Academic Press(1967). and Porosity.
Proc. Roy. Soc. A 344 259 (1975).
62. E. Clar. & J. F. Stephen Tetrahedron 21 467 (1965).

-164-
63. J. N. Bradley Proc. Roy Soc. A 337 1,99 (1974).
64. M. Szwarc J. Chen. Phi. 17 431 (1949).
65. G. L. E . Estban, J A. Kerr J. Chem. Soc. 3873 (1963). & A. F. Trotmann-Dickenson
66. C.. W. P . Crowne, V. J. Grigulis Trans. Faraday Soc. 65 1051 (1969). &J .J. Throssell.
67. W. D. Clark, &SJ. Price Can J. Chem. 48 1059 (1970).
68. R J. Kominar, M. G. Jacko & Can. J. Chem. 45 757 (1967). S. J. Price.
69. E. H. Lee & G. D. Oliver Ind. Eng. Chem. 51 1351 (1959).
70. E D. Hausmann & C. J. King I. & E. C. Fundamentals 5 295 (1966).
71. G M. Badger & T. M. Spotiswood J. Chem. Soc. 4420 (1960).
72. P. Gibbs Project Thesis Univ. of Surrey. (1976).
73. S. W. Charles & E. Whittle Trans. Faraday Soc. 56 794 (1960).
74. K. Yang J. Am. Chem. Soc. 84 3795 (1962).
75. P. Kim, J. H. Lee, R. J. Bananno J. Chem. Phys. 59 9 4593 (1973). and R. B. Timmins
76. S. W. Benson & R. Shaw J. Am. Chem. Soc. 89 5351 (1967).
77. D. B. Smith Private Communication. -
78. M. C. Lin and M. H. Back Can. J. Chem. 44 505 2357 (1966).
79. G. Dixon-Lewis, M. M. "Sutton Proc. Roy. Soc. A 317 227 (1970). and A. Williams
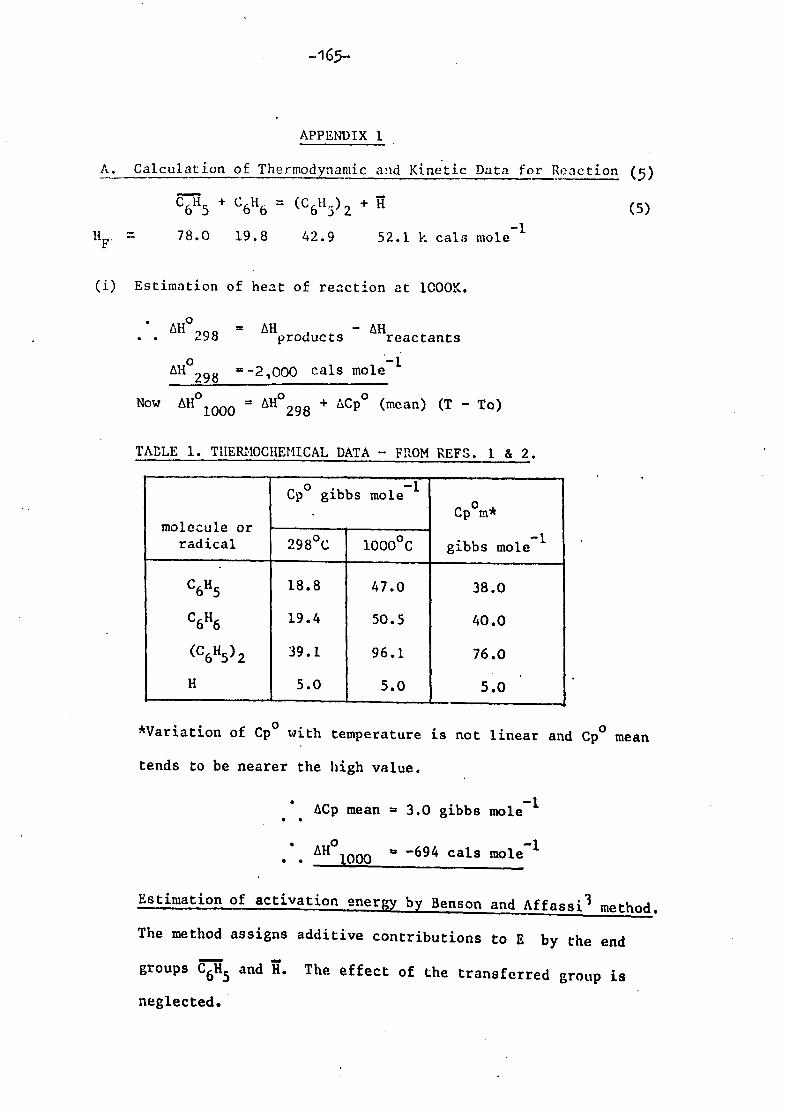
-165-
A flT 11\'Pa\TtT I
A. Calculation of Thermodynamic and Kinetic Data for Reaction (5)
C6H5 +C6H6= (C6H5)2 +H (5)
1ýF, = 78.0 19.8 42.9 52.1 k cals mole-1
(i) Estimation of heat of reaction at 1000K.
Q
. ". A01) 298 = AHproducts
reactants
tHo298 =-2,000 cals mole-1
Now AHo1000 AHo298 + GCp (mean) (T - To)
TABLE 1. TIlERI-10CILEMICAL DATA - FROM REFS. 1&2.
m le r le
Cp° gibbs mole-1 Cpom*
o cu o radical 298°C 1000°C gibbs mole
C6H5 18.8 47.0 38.0
C6H6 19.4 50.5 40.0
(C6H5)2 39.1 96.1 76.0
H 5.0 5.0 5.0
*Variation of Cp° with temperature is not linear and Cp° mean
tends to be nearer the high value.
ACp mean = 3.0 gibbs mole-i
" QHc1000 a -694 cals mole-'
Estimation of activation energy by Benson and Affassi3 method.
The method assigns additive contributions to E by the end r
groups C6H5 and H. The effect of the transferred group is
neglected.

-166-
Both the arithmetic mean and geometric mean values are con-
sidered, where X and F represent the respective end group contribution:;.
Arithmetic Mean.
The end group contribution for H atoms is tabulated but the
value for C6H5 is not known. This can be obtained from a
reaction of known activation energy. The most reliable data
is probably that of Chamberlain and Whittle for the reaction
CF 3+H-C6H5= CF3H + C6H5
For this reaction the experimental activation energy is 9,100
cals mole-1
and nH°298 = 3,900 cals mole-'.
As the method only applies to exothermic reactions the back
reaction must be used.
Eback ~ KCF3 +
XC6H5 where X represents the end group contribution.
' 5.2 = 4.1 + Xc H ''65
Xc6H5 = 1.1 k cals mole-'
and XH = 4.7 k cals mole-1 from tables
For reaction (5)
+xH Ecalc xc6H5
_ (1.1 + 4.7) K cals mole-1
= 5,800 cals mole 1
Geometric Mean
Similarly the end group FC H can be calculated 65
hence Fc H=1.76 cals mole-' 65
and- FH - 3.0 cals mole-1 from tables

-167-
For reaction 5
Ecalc 1.76 x 3.0 k cals mole-
= 5,300 cals mole -1
B. Calculation of the activation energy for the reaction by BEBO
method4 for reaction (7; ).
it + C6H6 =C° 6H5 + H2 AH298 = 6,100 cals mole-1 (2)
Basic data
Decals mole-1) ro(R) -1
B(Ä) -1
p
C6H5 -H 114,000 1.08 1.93 1.084
H-H 109,400 0.74 1.94 1.041
De = dissociation energy measured
from the bottom of the potential energy well.
ro = internuclear distance
= Parameter from the Morse function
p= empirical relationship between bond order,
bond energy and length.
Data above for H-H bonds is listed by Johnson and Parr 4.
For C6H5 - H, p is obtained from the empirical relationship
p-0.26 Rn (D/E
r-r xa
where DS C6H5 -H bond energy.
EX - depth of the Lennard Jones potential of
Noble gas analogue.
rx internuclear distance of the noble gas analogue.
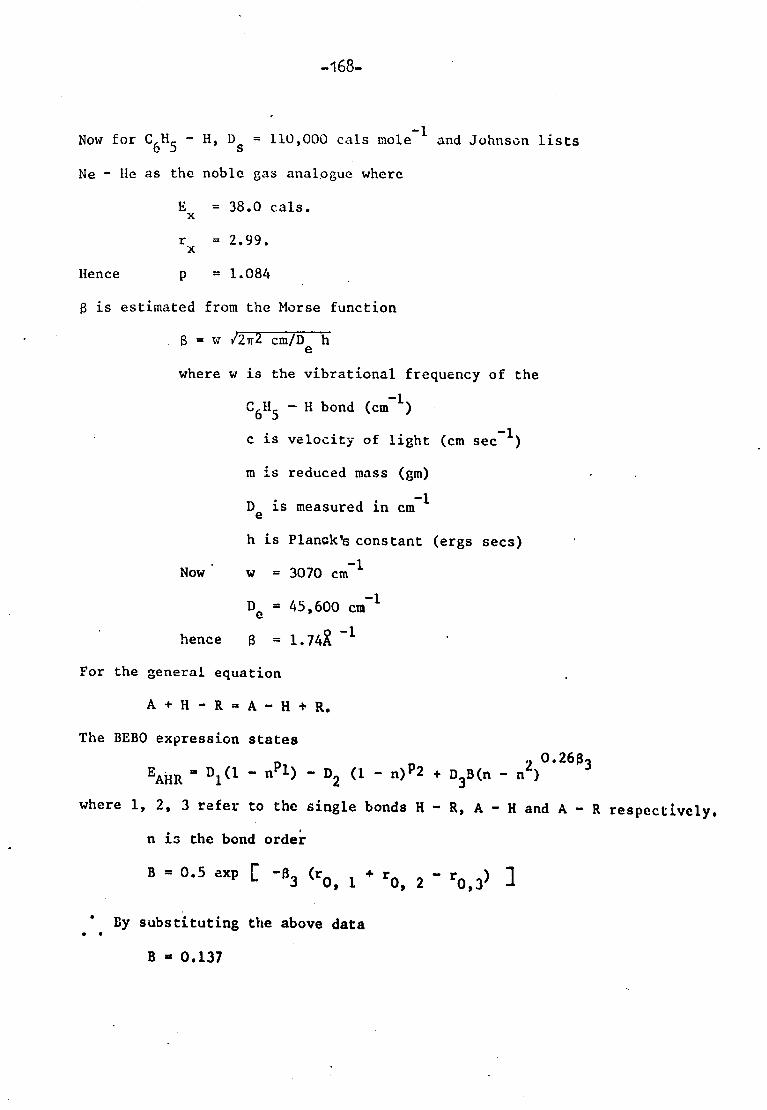
-168-
Now for C6H5-H, Ds = 110,000 cals Mole-1 and Johnson lists
Ne - lie as the noble gas analogue where
E= 38.0 cals. x
r=2.99. x
Hence p=1.084
ß is estimated from the Morse function
ß=w 21T cm/D eh
where w is the vibrational frequency of the
C6H5-. H bond (cm 1)
c is velocity of light (cm sec-1)
m is reduced mass (gm)
De is measured in cm 1
h is Planck's constant (ergs secs)
Now* w= 3070 cm 1
De = 45,600 cm -1
hence ß=1.74Ä -1
For the general equation
A+ H- R= A- H+ R.
The BEBO expression states O. 26ß
EAHR - D1(1 - npl) - D2 (1 - n)P2 + D3B(n - n2) 3
where 1,2,3 refer to the single bonds H-R, A-H and A-R respectively.
n i:; the bond order
B = 0.5 exp [ 'ß3 (r0 1+ r0 2 r0,3) 2
By substituting the above data
B-0.137

-169-
The activation energy for the reaction corresponds to the maximum
value of the potential energy E.
For the reaction
H+C6H6= C6H5 + H2
this corresponds to a value of n=0.41
where E= 16,000 cals mole-1
Benson and Alfassi Method3 for Reaction
H+H - C6H5, = H-H+C6H5.
The basic data for this reaction were calculated in part A of this
Appendix.
(a) Arithmetic Mean
XH = 4.7
XC6H5=1.1
... Ecale = 4.7 + 1.1 (+ endothermicity of the reaction)
= 5.8 + 6.1 k cals mole-1
= 11,900 cals mole-1
(b) Geometric Mean
FH = 3.0
FC6H5=1.76
. ". Ecalc = 1.76 x 3.00 + (endothermicity) k cals mole-'
= 11,400 cals mole-1

-170-
APPENDIX 2
Estimation o Pre-e ponential Factors.
If basic thermodynamic data for reactant molecules and the transi-
tion state can be estimated then it is possible to obtain a value
for the pre-exponential or "A" factor from the transition state
theory expression
ASS !R A= ýe K Tý e
The method is that outlined by Benson in his book 'Thermochemical
Kinetics'. The thermochemistry data used here is either listed
there or estimated by the bond additivity rules described there.
TABLE 1. THERNOCHEMICAL DATA FROM REFS . (IM
Group O HF
-1 k cal"mole S°
_1 gibbs mole CP at 298°K gibbs mole-1
CF, at 1000°K ebbs mole-1
C6H6 19.8 64.3. 19.4 50.5
(C6115)2 42.9 93.9 39.0 96.0
H2 0 31.2 6.90 7.2
52.1 27.4 5.0 5.0
C6 5 78.0 69.4 18.8 47.0
A. Reaction.
+C6H6 =[H ---- H ---- C6H 51 = C6 5+H2
Method.
1. An estimation of the lower limit for the entropy of the rra n sirio n
state is made by comparison with that of a model' compound.

-171-
2. Structural differences are considered so that a value gor the
entropy of the transition state may be estimated.
3. Overall entropy change may be obtained from
_o0 AS S Transition State rS Ground State
--, -I--f --
Consider the contributions to the entropy in turn using benzene as
a model compound.
(i) Translation.
AS=3/2RRn(MCH/MCH .) 6667
= 0.
(ii) Rotation.
Similarly the entropy change will be small.
(iii) Symmetry.
This will lead to a large contribution.
Benzene has 6 C2 axes and therefore the symmetry number
cr=6x2.
(Benson defines the symmetry number as the total number
of independent permutations of identical atoms or groups
in a molecule that can be arrived at by simple rigid
rotations of the entire molecule. )
The transition state has only 1C2 axis and thus v2
' Entropy difference = Rin 6.

-172-
(iv) Spin.
Addition of an atom leads to a change in spin.
Entropy difference = RQn 2.
So $ >, So + RQ, n 6+ R9n 2. c6H7c6H6
lbw OSo = S0 cH-
SH - SC H 67 66
SH+RRn 12 (1) At 10000K
pTm) kn 1000/298 SH(1000) = SH(298) + (Co
Ski = -27.4 + 6.1 Mean Cp = 5.0 gibbs niole-1
Substituting in (1)
ASo* >, 28.6 gibbs mole.
This is with a standard state of 1 atmosphere and molarity units
are required .. Add RQn (eRT) where R outside the logarithm is
in units of calories mole-1 and R inside the logarithm is in
units of litre atmos. deg-' mole-'
ASo* >- 29.6 + 11.1 gibbs mole-1
>- 17.5 gibbs mole-1
A= eKr SSA
> 10 13.7 e -17.5/R
1010.9

-173.
The above analysis has not taken account of the additional
H. H. C bending vibrations with frequencies of about 400 cm 1
which exist in the transition state
A= 10 10.9 100'7 litre mole-1 sec -1
= 10 11'6
litre mole-1 sec-1.
Reaction C6H6 = C6H5 + H.
Consider entropy changes in forming transition state.
Assume I C6H5 ------ H ]$ is the transition state.
Translation entropy changes are small.
Similarly as the extension of the C------H bond will not
appreciably affect the moment of inertia, changes in
rotational entropy are small.
Symmetry will however be affected
a for benzene = 12
but when a bond is elongated the symmetry is reduced to 1C2
axis
a for transition state =2
... symmetry = RRn 6 gibbs mole-
= 3.56 gibbs mole-1
The other major change is in the weakening of the bending
modes of vibration.
In forming the transition state
the one CB -H stretching frequency is lost
and the two CB - CB -H bending modes are modified to
two CB- CB ----H bending modes.

-17r+..
Consider the total vibrational entropy in benzene and the
transition state in turn.
Tý Rnnnnnn
CB -H stretch is at - 3100 cm 1
and this leads to an S0
1 contribution at 1000 K of 0.1 Bibb mole
CB -CB-H bends occur at - 1150 cm 1
and this leads to an
So contribution of 1.2 Gibbs mole-1
Total contribution = 2.4 gibbs mole _1
' Total entropy of vibration concerned in benzene=2.5 gibbs
mole
Benson suggests that in this type of reaction the formation
of the transition state results in a reduction of the bending modes
to about 1/5
of their original values.
. ".
C-C ----- H bending modes occur at - 230 cm 1
' S° contribution = 4.2 gibbs mole-1
As 2 modes are affected contribution = 8.4 gibbs mole-1.
' Total change in vibrational entropy
= (8.4 - 2.5) gibbs mole 1
= 5.9 gibbs mole-'
As the it-electron system is largely unaffected entropy
changes due to possible resonance changes were ignored.
Total entropy change in forming transition state
(3.6 + 5.9) gibbs mole-1.

-175-
AS/R
.A= rekTl e
h
= 1013.7 e 9.5/R
w-10 15.7
sec-1 at 1000°K.
Reaction.
C6H5 + C6H6 = (C6H5 - C6H5) + H.
The A factor for this reaction can be estimated by the lower
limit method by comparison of the entropy of the transition
state with that of a model compound such as diphenyl. Assume
the transition state to be
/.
Then LJ
Translation and rotational entropy changes can be ignored
as the addition of a light hydrogen atom will have little
effect on overall mass or moment of inertia.
Symmetry changes however occur. If diphenyl is assumed to
be planar it has 3C2 axes
a 8.
The transition state has only 1C2 axis.
' v=z.
Entropy difference = RRn 4 gibbs mole-1.

-176-
Spins of the transition state and model compound are differ-
ent
Entropy difference = R2. n 2.
". " So-t : S(C6H5)2 + RQn 4+ Rkn 2.
Now ASofi > S0* - S0 S0 C6H6 C6H5
. '. Ag°t S(0 c6HS) 2+
Rin 8- Sý6H6 - SC0 6H5
This is the lower limit.
The value can be improved by considering the vibrational
differences. -
In the transition state there is a C----C---- H bend added.
Benson suggested these bends have a frequency of 800 cm-
- and this leads to a contribution of 1.8 gibbs mole1.
' AS0*=S(0 CHSo -S 06 5)2 65C6H6.
At 1000K
ASo _ (186.5 - 113.0 - 115.0 + 4.1 + 1.8) gibbs mole-
-35.6 gibbs mole-'.
This is with a standard state of 1 atmos. For a bimolecular
gas reaction RRn (eRT) must be added to convert to molarity units
ASot = -24.5 gibbs mole-1
ekTe AS* /R A =(=-W-)
10$'3 litre mole-1 sec-1

-177-
Termination Reaction.
C6H5 +C6H5= (C6H5 -- C6H5)
The entropy of this reaction can be estimated by the model
compound technique.
Consider diphenyl as a model compound.
Translational differences are virtually nil.
Spin and symmetry of the transition state and the model com-
pound are the same. ' Entropy will be unaffected.
Major differences occur however in vibrational entropy.
Vibrational frequencies affected in diphenyl are
(i) C-C stretching at 1000 cm 1.
(ii) 4CB - CB -C vibrations at 420 cm 1.
In forming the transition state the C-C is lost and 4CB - CB -C
stretching frequencies become
4CB - CB ----C frequencies.
Benson suggests that CB - CB---- C bend = 1/5
CB - CB - C.
Entropy difference due to vibration between diphenyl and
transition state =-(4 x 5.9) + 1.4 + (4 x 3.1)
=-9.8 gibbs mole-1.
Now consider rotational changes.
These can be divided into internal and external rotations.
(a) External.
AS* - R/2 In IB/IA where IB is the
rot moment of inertia of
the complex and I. is
moment of inertia in the ground state

-178-
" ""
AS = R/2
£n x2 where x= extension of rot
the C-C bond.
If x=2.5
AS* = 1.7 gibbs mole-'
Now consider internal rotation.
In forming the transition state the barrier to rotation in
Ph-Ph is reduced . ".
This will lead to a contribution.
1. Estimate moment of inertia of each Phenyl radical
i. e.
IPh - G-0 °O
I=a m(r sin (180-0) 2
where a= internal symmetry number.
m= mass
r= band length
0= bond angle
I=2*x77x1.45 "2
-223amuA
' Reduced Moment
of Intertia = IA x IB IA. + ID
2. Estimate the Rotational Partition Function for. Diphenyl.
v[ 100)11 Qß 3. b IR ýTa internal symmetry
s4
T- Temperature
Q 42.5.

-179-
3. In the transition state there is free rotation but in
the ground state rotation is hindered. Benson suggests
that there is a barrier height (V) of 2.2 k cals mole-1.
Lewis and Randalls tabulate values of the decrease in
entropy (Sf - Sh) of the free rotor as a function of the V
barrier height (expressed as RT) and the partition function
(expressed asl/Qf). This is in fact the entropy change due
to internal rotation in forming the transition state
1, Qf = 0.023
V=1.11. RT
internal rotational entropy difference between
complex and diphenyl = 0.1 gibbs mole-'.
Now consider total entropy of the complex
+ 9.8 1.7 + 0.1) gibbs mole-1 S* (entropy of complex= (S Biphenyl '
0 AS* = SO* - 2S° . C6H5
0 Sdiphenyl + 11.6 - 2SC
6H5
= 31.9 gibbs mole-1
Now reaction is bimolecular and A factor must have units of litre
mole-1 sec Add RRn ORT).
' AS$ 20.8 gibbs mole-1
as* 'A rekT e
/R
Lh 1013.7 10-4.5 litre mole
1 sec
1
109.2 litre mole-1 sec-1

-180-"
Appendix 3
Estimation of heat of reaction for reaction (5)
C6H5 CHCH3 = C6H5CH: CH2 +H (5)
THERMOCHEfICAL DATA
Species AH F cals mole-1 Reference
C6H5CHCH3 38,000 6
C6H5CHCH2 35,300 7
52,100 1
00o AH = AH products -
. MH
reactants
= 49,000 cals mole-'

-181-
References.
1. S. W. Benson Thermochemical Kinetics Wiley 1968.
2. S. W . Benson and HE. 0' Neal Int. J. Chem. Kineti^s 1 221.1969.
3. IB. Alfassi and S. W. Benson Int. J. Chemr,. Kinetics 5 879 1973.
4. H S. Johnson and C. Parr J. Am. Chem. Soc. 85 2544 1963.
5. F. N. Lewis and M. Randel Thermodynamics 2nd. Ed. McGraw Hill 1961.
6. J. D. Cox and G. Pilcher
7. Handbook of Chemistry and Physics.
Thermochemistry of Academic Press (1970). Organic and Or anomet- allic Compounds.
57th Ed. Chemical Rubber Co. (1976).