s irrigation w interpretation m test calibration ... use of saline irrigation water ... the relative...
TRANSCRIPT

24959-89
©Hach Company, 1993-1001. All rights are reserved. Printed in U.S.A. 5-15-93-2ED, rb rev1 10/01
SOIL AND IRRIGATION WATERINTERPRETATION MANUAL

ii
TABLE OF CONTENTS
Page
PREFACE
SECTION IAn Introduction to Soil. . . . . . . . . . . . . . . . . . . . . . . . . . . . . . . . . . . . . . . . . . . . . . . . . . . . . . . . . . . . . . . . . . . . . . . . . . . . . . . . . . . . . . . 1
Physical Properties of Soil . . . . . . . . . . . . . . . . . . . . . . . . . . . . . . . . . . . . . . . . . . . . . . . . . . . . . . . . . . . . . . . . . . . . . . . . . . . . . . . . . . 1Chemical Properties of Soil . . . . . . . . . . . . . . . . . . . . . . . . . . . . . . . . . . . . . . . . . . . . . . . . . . . . . . . . . . . . . . . . . . . . . . . . . . . . . . . . . 1Soil Characterization by Analysis . . . . . . . . . . . . . . . . . . . . . . . . . . . . . . . . . . . . . . . . . . . . . . . . . . . . . . . . . . . . . . . . . . . . . . . . . . . . 2A Discussion of Problem Soils . . . . . . . . . . . . . . . . . . . . . . . . . . . . . . . . . . . . . . . . . . . . . . . . . . . . . . . . . . . . . . . . . . . . . . . . . . . . . . 2
Calcareous Soils . . . . . . . . . . . . . . . . . . . . . . . . . . . . . . . . . . . . . . . . . . . . . . . . . . . . . . . . . . . . . . . . . . . . . . . . . . . . . . . . . . . . . . . . 2Salt Affected Soils . . . . . . . . . . . . . . . . . . . . . . . . . . . . . . . . . . . . . . . . . . . . . . . . . . . . . . . . . . . . . . . . . . . . . . . . . . . . . . . . . . . . . . 3Acid Soils . . . . . . . . . . . . . . . . . . . . . . . . . . . . . . . . . . . . . . . . . . . . . . . . . . . . . . . . . . . . . . . . . . . . . . . . . . . . . . . . . . . . . . . . . . . . . 3Problem Soil Textures (table) . . . . . . . . . . . . . . . . . . . . . . . . . . . . . . . . . . . . . . . . . . . . . . . . . . . . . . . . . . . . . . . . . . . . . . . . . . . . . 4Estimating Soil Texture . . . . . . . . . . . . . . . . . . . . . . . . . . . . . . . . . . . . . . . . . . . . . . . . . . . . . . . . . . . . . . . . . . . . . . . . . . . . . . . . . . 5
Plant Nutrition Overview . . . . . . . . . . . . . . . . . . . . . . . . . . . . . . . . . . . . . . . . . . . . . . . . . . . . . . . . . . . . . . . . . . . . . . . . . . . . . . . . . . . . . 6
Soil Nitrogen. . . . . . . . . . . . . . . . . . . . . . . . . . . . . . . . . . . . . . . . . . . . . . . . . . . . . . . . . . . . . . . . . . . . . . . . . . . . . . . . . . . . . . . . . . . . . . . 7The Nitrogen Cycle . . . . . . . . . . . . . . . . . . . . . . . . . . . . . . . . . . . . . . . . . . . . . . . . . . . . . . . . . . . . . . . . . . . . . . . . . . . . . . . . . . . . . . . 8Nitrogen Transformation in Soil (illustration). . . . . . . . . . . . . . . . . . . . . . . . . . . . . . . . . . . . . . . . . . . . . . . . . . . . . . . . . . . . . . . . . . . 8Nitrogen Cycle Illustration. . . . . . . . . . . . . . . . . . . . . . . . . . . . . . . . . . . . . . . . . . . . . . . . . . . . . . . . . . . . . . . . . . . . . . . . . . . . . . . . . . 9
Conversion Factors for Nitrate-Nitrogen Analysis . . . . . . . . . . . . . . . . . . . . . . . . . . . . . . . . . . . . . . . . . . . . . . . . . . . . . . . . . . . . . . . . 10Nitrate vs. Nitrate-Nitrogen . . . . . . . . . . . . . . . . . . . . . . . . . . . . . . . . . . . . . . . . . . . . . . . . . . . . . . . . . . . . . . . . . . . . . . . . . . . . . . . . 10Nitrate Conversion Factors (table). . . . . . . . . . . . . . . . . . . . . . . . . . . . . . . . . . . . . . . . . . . . . . . . . . . . . . . . . . . . . . . . . . . . . . . . . . . 10Parts Per Million vs. Percent . . . . . . . . . . . . . . . . . . . . . . . . . . . . . . . . . . . . . . . . . . . . . . . . . . . . . . . . . . . . . . . . . . . . . . . . . . . . . . . 10Parts Per Million vs. lbs/Acre . . . . . . . . . . . . . . . . . . . . . . . . . . . . . . . . . . . . . . . . . . . . . . . . . . . . . . . . . . . . . . . . . . . . . . . . . . . . . . 11
Soil pH . . . . . . . . . . . . . . . . . . . . . . . . . . . . . . . . . . . . . . . . . . . . . . . . . . . . . . . . . . . . . . . . . . . . . . . . . . . . . . . . . . . . . . . . . . . . . . . . . . 12What is pH? . . . . . . . . . . . . . . . . . . . . . . . . . . . . . . . . . . . . . . . . . . . . . . . . . . . . . . . . . . . . . . . . . . . . . . . . . . . . . . . . . . . . . . . . . . . . 12Why is pH Important . . . . . . . . . . . . . . . . . . . . . . . . . . . . . . . . . . . . . . . . . . . . . . . . . . . . . . . . . . . . . . . . . . . . . . . . . . . . . . . . . . . . . 12
Soil pH Levels and Associated Conditions (table) . . . . . . . . . . . . . . . . . . . . . . . . . . . . . . . . . . . . . . . . . . . . . . . . . . . . . . . . . . . . 12Soil Acidity. . . . . . . . . . . . . . . . . . . . . . . . . . . . . . . . . . . . . . . . . . . . . . . . . . . . . . . . . . . . . . . . . . . . . . . . . . . . . . . . . . . . . . . . . . . . . 13
Lime Requirement Table . . . . . . . . . . . . . . . . . . . . . . . . . . . . . . . . . . . . . . . . . . . . . . . . . . . . . . . . . . . . . . . . . . . . . . . . . . . . . . . . 13Alkaline Soils . . . . . . . . . . . . . . . . . . . . . . . . . . . . . . . . . . . . . . . . . . . . . . . . . . . . . . . . . . . . . . . . . . . . . . . . . . . . . . . . . . . . . . . . . . . 13
Soil pH and Its Affects on Nutrient Availability (illustration) . . . . . . . . . . . . . . . . . . . . . . . . . . . . . . . . . . . . . . . . . . . . . . . . . . . 14Soil Test Calibration. . . . . . . . . . . . . . . . . . . . . . . . . . . . . . . . . . . . . . . . . . . . . . . . . . . . . . . . . . . . . . . . . . . . . . . . . . . . . . . . . . . . . . . . 15
Nitrate Fertilizer Recommendations . . . . . . . . . . . . . . . . . . . . . . . . . . . . . . . . . . . . . . . . . . . . . . . . . . . . . . . . . . . . . . . . . . . . . . . . . . . 16
Phosphorus Fertilizer Recommendations . . . . . . . . . . . . . . . . . . . . . . . . . . . . . . . . . . . . . . . . . . . . . . . . . . . . . . . . . . . . . . . . . . . . . . . 18
Potassium Fertilizer Recommendations . . . . . . . . . . . . . . . . . . . . . . . . . . . . . . . . . . . . . . . . . . . . . . . . . . . . . . . . . . . . . . . . . . . . . . . . 21
SECTION IIIrrigation Water Quality . . . . . . . . . . . . . . . . . . . . . . . . . . . . . . . . . . . . . . . . . . . . . . . . . . . . . . . . . . . . . . . . . . . . . . . . . . . . . . . . . . . . . 24
Salinity Hazard . . . . . . . . . . . . . . . . . . . . . . . . . . . . . . . . . . . . . . . . . . . . . . . . . . . . . . . . . . . . . . . . . . . . . . . . . . . . . . . . . . . . . . . . . . 24Sodium Hazard. . . . . . . . . . . . . . . . . . . . . . . . . . . . . . . . . . . . . . . . . . . . . . . . . . . . . . . . . . . . . . . . . . . . . . . . . . . . . . . . . . . . . . . . . . 24Nomogram to Determine Sodium Adsorption Ratio. . . . . . . . . . . . . . . . . . . . . . . . . . . . . . . . . . . . . . . . . . . . . . . . . . . . . . . . . . . . . 25Toxic Elements. . . . . . . . . . . . . . . . . . . . . . . . . . . . . . . . . . . . . . . . . . . . . . . . . . . . . . . . . . . . . . . . . . . . . . . . . . . . . . . . . . . . . . . . . . 26Nutritional Benefit . . . . . . . . . . . . . . . . . . . . . . . . . . . . . . . . . . . . . . . . . . . . . . . . . . . . . . . . . . . . . . . . . . . . . . . . . . . . . . . . . . . . . . . 26
Use of Saline Irrigation Water . . . . . . . . . . . . . . . . . . . . . . . . . . . . . . . . . . . . . . . . . . . . . . . . . . . . . . . . . . . . . . . . . . . . . . . . . . . . . . . . 27Leaching Requirement . . . . . . . . . . . . . . . . . . . . . . . . . . . . . . . . . . . . . . . . . . . . . . . . . . . . . . . . . . . . . . . . . . . . . . . . . . . . . . . . . . . . 27High Frequency vs. Conventional Irrigation With Saline Water . . . . . . . . . . . . . . . . . . . . . . . . . . . . . . . . . . . . . . . . . . . . . . . . . . . 27Relative Yields Using Saline Irrigation Water . . . . . . . . . . . . . . . . . . . . . . . . . . . . . . . . . . . . . . . . . . . . . . . . . . . . . . . . . . . . . . . . . 27Permeability Hazard (chart) . . . . . . . . . . . . . . . . . . . . . . . . . . . . . . . . . . . . . . . . . . . . . . . . . . . . . . . . . . . . . . . . . . . . . . . . . . . . . . . . 28Assessing Leaching Requirement Nomogram . . . . . . . . . . . . . . . . . . . . . . . . . . . . . . . . . . . . . . . . . . . . . . . . . . . . . . . . . . . . . . . . . 29Leaching Fraction Table . . . . . . . . . . . . . . . . . . . . . . . . . . . . . . . . . . . . . . . . . . . . . . . . . . . . . . . . . . . . . . . . . . . . . . . . . . . . . . . . . . 30

iii
PageCrop Tolerance to Irrigation Water Salinity (tables) . . . . . . . . . . . . . . . . . . . . . . . . . . . . . . . . . . . . . . . . . . . . . . . . . . . . . . . . . . . . . . 31
Fiber, Grain and Special Crops. . . . . . . . . . . . . . . . . . . . . . . . . . . . . . . . . . . . . . . . . . . . . . . . . . . . . . . . . . . . . . . . . . . . . . . . . . . . . 31Grass and Forage Crops . . . . . . . . . . . . . . . . . . . . . . . . . . . . . . . . . . . . . . . . . . . . . . . . . . . . . . . . . . . . . . . . . . . . . . . . . . . . . . . . . . 31Vegetable and Fruit Crops . . . . . . . . . . . . . . . . . . . . . . . . . . . . . . . . . . . . . . . . . . . . . . . . . . . . . . . . . . . . . . . . . . . . . . . . . . . . . . . . 33Woody Crops. . . . . . . . . . . . . . . . . . . . . . . . . . . . . . . . . . . . . . . . . . . . . . . . . . . . . . . . . . . . . . . . . . . . . . . . . . . . . . . . . . . . . . . . . . . 34Ornamental Shrubs, Trees and Groundcover . . . . . . . . . . . . . . . . . . . . . . . . . . . . . . . . . . . . . . . . . . . . . . . . . . . . . . . . . . . . . . . . . . 35
Common Units of Measure and Their Abbreviations . . . . . . . . . . . . . . . . . . . . . . . . . . . . . . . . . . . . . . . . . . . . . . . . . . . . . . . . . . 37
Convenient Conversion Factors . . . . . . . . . . . . . . . . . . . . . . . . . . . . . . . . . . . . . . . . . . . . . . . . . . . . . . . . . . . . . . . . . . . . . . . . . . . . 38
Glossary . . . . . . . . . . . . . . . . . . . . . . . . . . . . . . . . . . . . . . . . . . . . . . . . . . . . . . . . . . . . . . . . . . . . . . . . . . . . . . . . . . . . . . . . . . . . . . . . 39
Bibliography. . . . . . . . . . . . . . . . . . . . . . . . . . . . . . . . . . . . . . . . . . . . . . . . . . . . . . . . . . . . . . . . . . . . . . . . . . . . . . . . . . . . . . . . . . . . . 44

iv
PREFACE
This manual will acquaint the user of the NPK-1 and SIW-1Test Kits with basic concepts related to soil, soil fertility, plantnutrition, and irrigation water quality. A glossary is included tohelp the user understand unfamiliar terms used in this manualand the NPK-1 and SIW-1 Procedure Manuals.
This manual provides the necessary information to help theanalyst evaluate test results. It also contains fertilizerrecommendations to help determine the proper amount offertilizer in relation to soil test values, crop, and yield goal.Although these recommendations are in the public domain,they are only recommendations. Hach Company assumes noresponsibility to the applicability or accuracy of theserecommendations. They are included only as a resourcefor the analyst.
The fertilizer recommendations and information related tosoil testing were provided by Dr. Raymond Ward of WardLaboratories in Kearney, Nebraska. Dr. Ward compiled thisinformation from extension service bulletins published byOklahoma State University, Kansas State University, andNebraska State University.
The information on irrigation water quality was compiled fromextension service information from Colorado State Universityand from papers by Dr. Jim Rhoades (Director of the UnitedStates Salinity Laboratory in Riverside, California). Moreinformation about irrigation water and/or salt affected soils isavailable from the United States Salinity Laboratory and theland grant universities of the Western United States. Outside theUnited States, this information may be obtained from the localministry of agricultureor universities.
More specific, in-depth information about soil and soil fertility,is found in libraries, especially those of colleges that teach theagricultural sciences.
1
SECTION I
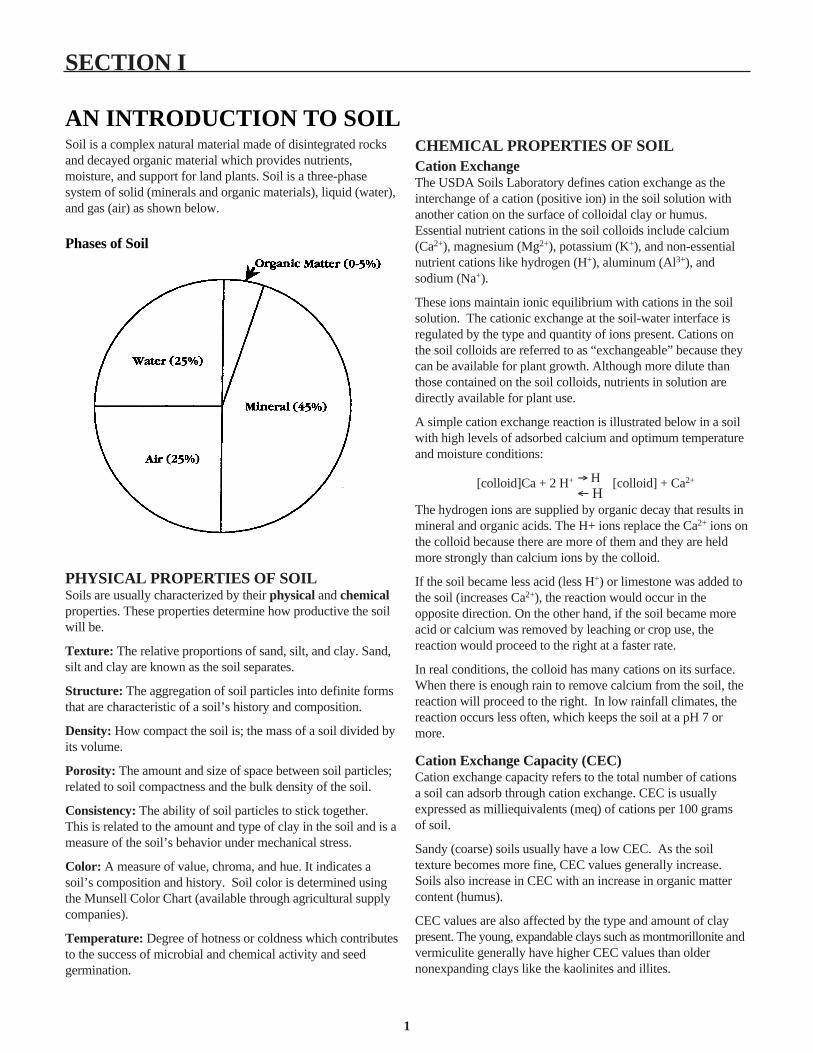
Soil is a complex natural material made of disintegrated rocksand decayed organic material which provides nutrients,moisture, and support for land plants. Soil is a three-phasesystem of solid (minerals and organic materials), liquid (water),and gas (air) as shown below.
PHYSICAL PROPERTIES OF SOILSoils are usually characterized by their physical and chemicalproperties. These properties determine how productive the soilwill be.
Texture: The relative proportions of sand, silt, and clay. Sand,silt and clay are known as the soil separates.
Structure: The aggregation of soil particles into definite formsthat are characteristic of a soil’s history and composition.
Density: How compact the soil is; the mass of a soil divided byits volume.
Porosity: The amount and size of space between soil particles;related to soil compactness and the bulk density of the soil.
Consistency: The ability of soil particles to stick together.This is related to the amount and type of clay in the soil and is ameasure of the soil’s behavior under mechanical stress.
Color: A measure of value, chroma, and hue. It indicates asoil’s composition and history. Soil color is determined usingthe Munsell Color Chart (available through agricultural supplycompanies).
Temperature: Degree of hotness or coldness which contributesto the success of microbial and chemical activity and seedgermination.
CHEMICAL PROPERTIES OF SOILCation Exchange The USDA Soils Laboratory defines cation exchange as theinterchange of a cation (positive ion) in the soil solution withanother cation on the surface of colloidal clay or humus.Essential nutrient cations in the soil colloids include calcium(Ca2+), magnesium (Mg2+), potassium (K+), and non-essentialnutrient cations like hydrogen (H+), aluminum (Al3+), andsodium (Na+).
These ions maintain ionic equilibrium with cations in the soilsolution. The cationic exchange at the soil-water interface isregulated by the type and quantity of ions present. Cations onthe soil colloids are referred to as “exchangeable” because theycan be available for plant growth. Although more dilute thanthose contained on the soil colloids, nutrients in solution aredirectly available for plant use.
A simple cation exchange reaction is illustrated below in a soilwith high levels of adsorbed calcium and optimum temperatureand moisture conditions:
→ H [colloid]Ca + 2 H+ [colloid] + Ca2+
← HThe hydrogen ions are supplied by organic decay that results inmineral and organic acids. The H+ ions replace the Ca2+ ions onthe colloid because there are more of them and they are heldmore strongly than calcium ions by the colloid.
If the soil became less acid (less H+) or limestone was added tothe soil (increases Ca2+), the reaction would occur in theopposite direction. On the other hand, if the soil became moreacid or calcium was removed by leaching or crop use, thereaction would proceed to the right at a faster rate.
In real conditions, the colloid has many cations on its surface.When there is enough rain to remove calcium from the soil, thereaction will proceed to the right. In low rainfall climates, thereaction occurs less often, which keeps the soil at a pH 7 ormore.
Cation Exchange Capacity (CEC) Cation exchange capacity refers to the total number of cationsa soil can adsorb through cation exchange. CEC is usuallyexpressed as milliequivalents (meq) of cations per 100 gramsof soil.
Sandy (coarse) soils usually have a low CEC. As the soiltexture becomes more fine, CEC values generally increase.Soils also increase in CEC with an increase in organic mattercontent (humus).
CEC values are also affected by the type and amount of claypresent. The young, expandable clays such as montmorillonite andvermiculite generally have higher CEC values than oldernonexpanding clays like the kaolinites and illites.
AN INTRODUCTION TO SOIL
Phases of Soil

Percent Base Saturation (%BS)Colloids have two groups of cations that have opposite effectson soil acidity. One group contributes hydrogen ions to the soilsolution (H+, Al3+). The other group, called exchangeable bases(Ca2+, Mg2+, Na+, and K+), neutralize soil acidity. The part ofthe cation exchange capacity occupied by these neutralizingbases is called the percent base saturation. Percent basesaturation is described by the following equation:
%BS = total number exchangeable basic cations ÷ CEC
For example, if a soil’s CEC is 20 milliequivalents/100 gramsand the total number of exchangeable basic cations is 18meq/100 grams, then the %BS would equal (18÷20) X 100 or90%.
Generally the soil pH increases as the %BS increases. Humidsoils that become acidic due to calcium removal can have a%BS of less than 66%. Soils with a low %BS are acidic andhigh in exchangeable H+ and Al3+ content. These soils requirelime to increase the %BS and pH to levels that are optimal forcrop production. Soils in more arid regions have a pH near 7and percentage base saturations of almost 100%.
Soil Reaction (pH)Soil pH is a measure of the soil’s acidity, neutrality, oralkalinity. It is one of the best diagnostic measurementsavailable to identify soil conditions. As shown in the illustration“Soil pH and its Affects on Nutrient Availability” (page 14),soil pH has the greatest economic benefit when all essentialnutrients are available. See Soil pH for more information.
SOIL CHARACTERIZATION BY ANALYSISAnalyzing a soil’s chemical and physical properties providesinformation about the soil and the problems with that soil. Soilanalysis also determines amounts of available nutrients (fertilitylevel) present during the time of sampling. Therefore, soilanalysis serves two important purposes:
1) diagnostic determination
2) fertility assessment.
Diagnostic TestingDiagnostic testing isolates specific problems such as pH, salt, ortexture which can decrease fertility and/or productivity. Oncethese problems are identified, corrective practices can berecommended to aid profitable production.
Fertility AssessmentFertility assessment analyzes the soil for the presence andbalance of essential crop nutrients. Based on these analyses,crop production potential, past history, and research from landgrant universities, fertilizer recommendations are made.
The diagnostic methods characterize the soil in one or more ofthe following soil classifications:
1) Acid Soils—Acid soils have a pH well below 7.0 (pH <6.0).These soils lose productivity due to low nutrient availability andpresence of toxic ions such as aluminum.
2) Alkaline Soils—Alkaline soils have a pH above 7.5. Thesesoils can be subclassed as calcareous or salt affected.
3) Calcareous Soils—Calcareous soils contain high amounts offree lime (CaCO3). The pH of these soils is usually between 7.5and 8.5.
4) Salt-Affected Soils—Salt-affected soils contain highconcentrations of soluble salts (saline) and/or exchangeablesodium (sodic).
5) Sandy Soils—Sandy soils fall into the textural class of sandsor loamy sand. These soils are subject to wind erosion, lowfertility, or droughtiness.
6) Clay Soils—Clay soils are fine textured and presentproblems of drainage, wetness, and aeration.
The fertility measurements evaluate the soil’s cation exchangecapacity, pH, and release of soluble nutrients from organicmatter and minerals. These measurements are important fordetermining the following:
1) A soil’s ability to hold certain fertilizer elements
2) The nutrient balance in the soil
3) The percent organic matter
4) The ability to supply adequate amounts of native nutrients.
A DISCUSSION OF PROBLEM SOILSCalcareous soils Lime as CaCO3 and/or MgCO3 is present in the parent materialof most soils. In humid regions, lime is usually present in lowconcentrations, but may be entirely absent in the topsoil due toleaching as water percolates through the soil. In arid and semi-arid regions, little leaching occurs. In this case, lime isredistributed throughout the soil profile, but is not redissolvedduring low rainfall. Sharply defined lime zones may result fromlimited rain or irrigation water which penetrates to the samedepth each year. When the lime dissolves, it is redistributed bywater. When the water evaporates, the lime is precipitated.
Soils high in lime generally have a pH ranging from 7.5 to 8.4.The high alkalinity affects the solubility or availability ofcertain nutrients. For example, available phosphorus(monohydrogen orthophosphate, HPO4
2–) forms a calcium saltwhich precipitates into a less available form at a pH greater than7.5, reducing the efficiency of applied phosphorus fertilizers.The availability of metal micronutrients (iron, zinc, copper andmanganese) and boron is also decreased by the alkaline pH.
2
3
Calcareous soils may or may not be associated with salt-affected soils. Due to the low solubility of CaCO3, some soilsare 30% lime and yet are not saline. Because calcareous soilswill visibly effervesce (fizz) when exposed to 2.5 Nhydrochloric acid, they are easily identified.
Salt-Affected SoilsThese soils contain excess amounts of either soluble salts orexchangeable sodium or both.
Saline SoilsAlthough salinity does not affect the physical properties of soil,it is harmful because osmotic pressure can create an artificialdrought. This occurs because increased salt in the soil solutionreduces the availability of soil water to plants. In extremecases, water can actually be drawn out of the plant due toosmotic pressure, resulting in dehydration and death. Salinesoils are often called white alkali due to the white saltencrustations on the soil surface.
Sodic SoilsSodic soils are soils in which the exchangeable sodiumpercentage is high enough to cause a change in soilflocculation. In extreme cases, sodium ions disperse the mineralcolloids, which then form a tight soil structure. This structureslows the infiltration/percolation of water. The pH of the soildue to sodium-water hydrolysis can increase to greater than 8.5,which results in dissolution of organic matter in the soil. Thedispersed humus is carried upward by capillary action, makingthe soil black. This type of soil is often referred to as blackalkali, gumbo, or slick spots. Sodic soils frequently occur insemi-arid and arid regions in small irregular areas.
Saline/Sodic SoilsThese salt-affected soils contain large amounts of soluble saltsand a high percentage of exchangeable sodium. They aresimilar to saline soils in appearance and character except thatthe soluble salts are leached out by artificial drainage. Afterleaching the soluble salts, the soils become sodic and degrade inquality.
Saline soils do not respond to chemical amendments. Onlyleaching the salts through adequate drainage reclaims thesesoils. Saline/sodic and sodic soils do respond to calciumamendments and drainage. In the case of sodium-affected soilsthat contain high amounts of free lime, sulfur can be added asan amendment to reclaim the soil.
Chemical Criteria for Calcareous and Salt-Affected Soils
Soil Type pH ECe mS/cm* SAR**Calcareous 7.5-8.4 < 2.0 < 13%Saline < 8.5 > 2.0 < 13%Sodic > 8.5 < 2.0 > 13%Saline/Sodic < 8.5 > 2.0 > 13%
*The current standard unit of conductivity is milliSiemens which is equivalent to mmhos.**SAR is the acronym for sodium adsorption ratio which predicts the degree of sodiumaccumulation on the soil colloids.
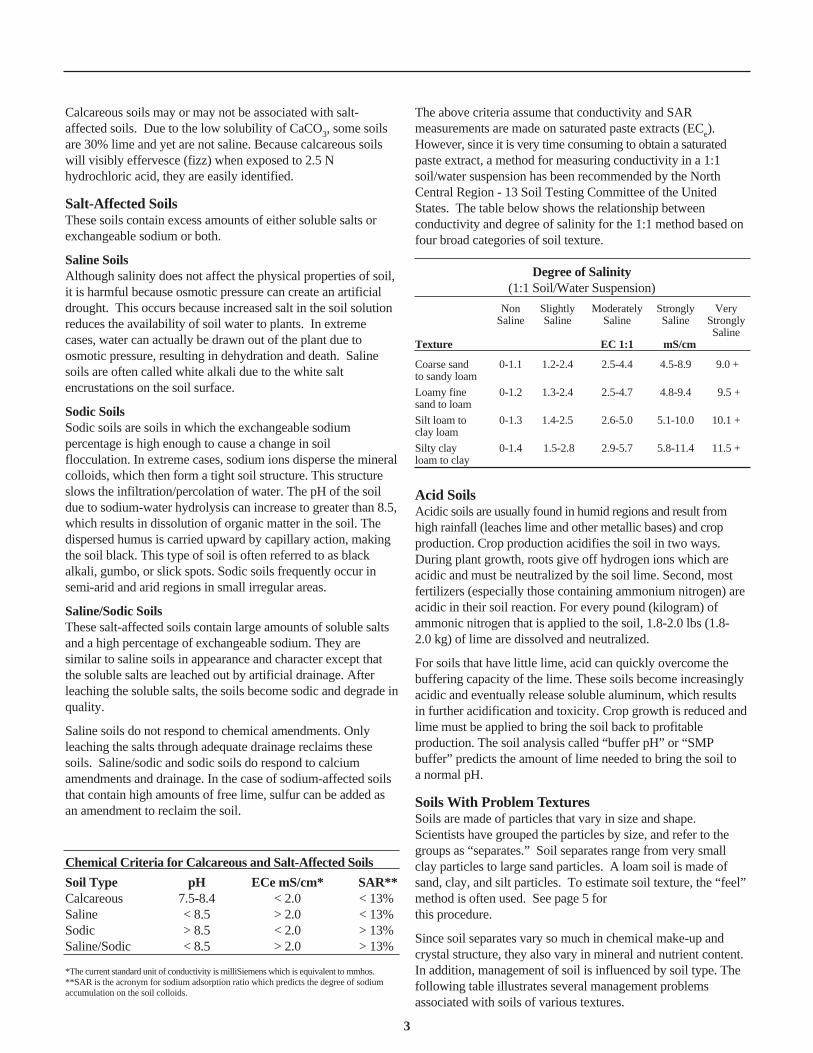
The above criteria assume that conductivity and SARmeasurements are made on saturated paste extracts (ECe).However, since it is very time consuming to obtain a saturatedpaste extract, a method for measuring conductivity in a 1:1soil/water suspension has been recommended by the NorthCentral Region - 13 Soil Testing Committee of the UnitedStates. The table below shows the relationship betweenconductivity and degree of salinity for the 1:1 method based onfour broad categories of soil texture.
Degree of Salinity(1:1 Soil/Water Suspension)
Non Slightly Moderately Strongly Very Saline Saline Saline Saline Strongly
SalineTexture EC 1:1 mS/cm
Coarse sand 0-1.1 1.2-2.4 2.5-4.4 4.5-8.9 9.0 +to sandy loam
Loamy fine 0-1.2 1.3-2.4 2.5-4.7 4.8-9.4 9.5 +sand to loam
Silt loam to 0-1.3 1.4-2.5 2.6-5.0 5.1-10.0 10.1 +clay loam
Silty clay 0-1.4 1.5-2.8 2.9-5.7 5.8-11.4 11.5 +loam to clay
Acid SoilsAcidic soils are usually found in humid regions and result fromhigh rainfall (leaches lime and other metallic bases) and cropproduction. Crop production acidifies the soil in two ways.During plant growth, roots give off hydrogen ions which areacidic and must be neutralized by the soil lime. Second, mostfertilizers (especially those containing ammonium nitrogen) areacidic in their soil reaction. For every pound (kilogram) ofammonic nitrogen that is applied to the soil, 1.8-2.0 lbs (1.8-2.0 kg) of lime are dissolved and neutralized.
For soils that have little lime, acid can quickly overcome thebuffering capacity of the lime. These soils become increasinglyacidic and eventually release soluble aluminum, which resultsin further acidification and toxicity. Crop growth is reduced andlime must be applied to bring the soil back to profitableproduction. The soil analysis called “buffer pH” or “SMPbuffer” predicts the amount of lime needed to bring the soil toa normal pH.
Soils With Problem TexturesSoils are made of particles that vary in size and shape.Scientists have grouped the particles by size, and refer to thegroups as “separates.” Soil separates range from very smallclay particles to large sand particles. A loam soil is made ofsand, clay, and silt particles. To estimate soil texture, the “feel”method is often used. See page 5 for this procedure.
Since soil separates vary so much in chemical make-up andcrystal structure, they also vary in mineral and nutrient content.In addition, management of soil is influenced by soil type. Thefollowing table illustrates several management problemsassociated with soils of various textures.

4
Coarse Medium Fine(Sandy) (Loamy) (Clayey)
Erosion ManagementWater Low High Low-Medium
Wind High Low Moderate
Water ManagementWater Holding Capacity Low Medium High
Infiltration Rapid Medium-slow Rapid when dry Slow when wet
Percolation Excessive Good Fair-Poor
Tillage ManagementHorsepower Requirement Low Medium High
Tillability Easy Medium Difficult
Fertility ManagementPotential Nutrient Imbalance High Moderate-Low Low
Chemical Recommendations Low Medium High
Aeration Good Moderate Poor
Management Problems with Various Soil Textures

Estimating Soil Texture
5

6
Plant nutrition is the biochemical process of absorption,assimilation and utilization of nutrients essential for growth andreproduction. Balanced plant nutrition contributes to high cropyields at the most economical return of crop investment costs(fixed or variable).
Three major factors contribute to plant nutrition:
1) The amount of nutrient in the soil. A crop may be deficientdue to low amounts of nutrients in the soil. Fertilizer may berequired to increase the nutrient level.
2) The soil’s ability to supply the nutrients to the plants.Soil pH is very important in determining how available anutrient is. For example, when the soil pH is above 7, many ofthe micronutrients (i.e., iron, cobalt, zinc) become unavailableto plants because they form insoluble salts. However, at pH 6,they are soluble enough to be available for crops.
3) Environmental factors that affect nutrient availabilityand absorption. Environmental conditions, such as cool and/orwet weather can intensify nutrition problems. An example isgrowing sorghum in Oklahoma, USA. Some Oklahoma soilshave high iron content (red oxidized soils), but iron deficiencyis a major problem for the sorghum crop because of high soilpH (calcareous condition) and cool, wet weather. No one knowswhy this combination of climate and soil conditions producesan iron deficiency.
ESSENTIAL NUTRIENTS IN PLANTNUTRITIONSixteen elements are normally considered essential for plantgrowth. A nutrient is essential if a plant dies when it is absent.The essential nutrients are classified into four groups:
1) Major Non-Mineral MacronutrientsThese are 90-95% of dry plant weight, and are supplied to theplant by water absorption and photosynthesis.
Carbon- CHydrogen- HOxygen- O
2) Primary MacronutrientsThese nutrients are absorbed and used by plants in largeamounts and are most likely to cause nutritional deficiencies forplant growth.
Nitrogen- NPhosphorus- PPotassium- K
3) Secondary MacronutrientsThese are absorbed and used in large amounts, but are lesslikely to cause nutritional deficiencies in plants.
Calcium- CaMagnesium- MgSulfur- S
4) MicronutrientsAlthough no less essential, plants need only trace amounts ofthese nutrients.
Boron- BChlorine- ClCopper- CuIron- FeManganese- MnMolybdenum- MoZinc- Zn
PLANT NUTRITION OVERVIEW

7
Of the 16 essential nutrients, nitrogen is the nutrient most likelyto be deficient worldwide. Nitrogen is used extensively in plantgrowth and must be present in the plant for cell division.Nitrogen is also vital to protein production in a biologicalsystem. Without nitrogen, cell division and protein synthesisstops and the plant eventually dies. Adequate nitrogen increaseswater use efficiency and absorption of other nutrients by theplant.
Many soils are deficient in nitrogen. To compensate for lackof nitrogen, many soils are over-fertilized. Ironically, over-fertilization often causes a decrease in profit, rather than anincrease. Although plants require a certain amount of nitrogen,any nitrogen applied and not used by the crop is wasted. Thisexcess nitrogen can contaminate groundwater supplies,currently a major environmental concern.
Nitrogen is used by plants in two forms, ammonium (NH4+) and
nitrate (NO3–). Ammonium ions are present in soils through
decomposition of organic tissue or manure application. Nitrate isthe final form of nitrogen decomposition, but can also besupplied by fertilizers, irrigation and precipitation (See NitrogenTransformation in the Soil illustration). Other sources are alsoshown in this illustration.
Available nitrogen is lost from soil in several ways:
a) Volatilization—Nitrogen fertilizer not properly tilled into thesoil is lost in gaseous form to the air. This is especially true foralkaline soils during hot weather.
b) Anaerobic denitrification—When a soil is flooded, oxygen isabsent (anaerobic) and nitrogen is converted to nitrogen gas(N2) by anaerobic soil bacteria. The gas is then lost to the air.
c) Leaching—Excluding crop production, this is the mostsignificant way to lose nitrogen from soil. Leaching occurs inareas of heavy rainfall or where irrigation is used.
Normally, ammonium (NH4+) does not leach from soil because
the positive charge is attracted and “held” by the negativecharge on the surface of clay and humus particles. However,when NH4
+ is transformed to NO3–, the (+) charge is lost and
the soil no longer attracts the available nitrogen. Waterpercolating through a soil profile leaches and depletes themobile nitrate from the upper layers to the lower layers andeven into the groundwater if leaching is excessive. Excessivenitrate leaching is most likely in fields where overfertilizationhas occurred.
Nitrate in groundwater is a major environmental and publichealth concern. High nitrate levels in drinking water (>10parts per million) are linked with health problems (i.e.,methemoglobinemia) resulting in miscarriage or “blue babies”.
Calculating Nitrogen Fertilizer ApplicationBefore applying nitrogen fertilizer, consider a realistic yieldgoal and calculate the nitrogen requirement for the crop basedon this goal. Subtract the following from the nitrogenrequirement:• residual nitrate in soil• nitrate from irrigation• nitrate from decay of organic matter• nitrate released from animal and/or green manure
Example (U. S.)A farmer expects a yield of corn to be 170 bushels per acre.The extension agent says it takes 2 lbs of N to produce 1 bushelof corn. So, the nitrogen requirement is 2.0 x 170 = 340 lbs ofN/hectare.
Previously, the farmer applied 10 tons/acre of beef manure,which has about 14 lbs of nitrogen/ton. From the manure, 50%of the nitrogen is available during the first year afterapplication. Testing shows the soil organic level* is 1.8%. At adepth of 24 inches**, nitrate-nitrogen measures 15 ppm (partsper million). Irrigation water† analysis shows nitrate-nitrogenlevels at 6 ppm. The farmer usually uses 18 inches (1.5 acrefeet) of irrigation water per hectare of land in a growing season.
*Organic Matter Nitrogen- % soil organic matter x 22 = approximate Nmineralized/year (varies with location and soil texture)**Residual Soil Nitrate- ppm nitrate in soil x 0.3 x inches of sample depth =lbs/acre of available nitrate (0.3 is based on a soil bulk density of 1.2 g/cm3).†Irrigation Water Nitrogen- ppm nitrate in irrigation water = lbs N applied/acreft of water irrigated.
Example CalculationResidual Nitrate = 15 ppm x 24 inches x 0.3 = 108 lbs N Irrigation Water Nitrogen = 6 ppm x 2.7 x 1.5 = 24.3 lbs N Organic Matter Nitrogen = 1.8% x 20 = 36 lbs NManure Nitrogen = 10 tons x 14 lbs/acre x 50% = 70 lbs Nitrogen Requirement = 170 bushes/acre x 2.0 = 340 lbs/acre
Therefore:340 (required) - (108 + 24 + 36 + 70) = 110 lbs/acre additionalN required
Applying more than the recommended 110 lbs/acre would showlittle or no return on money, invested into fertilizer and greatlyincreases the probability of nitrogen loss due to leaching.
Example (metric)A farmer expects a yield of corn to be 150 hectaliters perhectare. A local soils laboratory has determined that it takes2.6 kg of N to produce 1 hectaliter of corn. So, the nitrogenrequirement is 2.6 x 150 = 390 kg of N/hectare.
SOIL NITROGEN
Previously, the farmer applied 22 metric tons/hectare of beefmanure, which has about 7 kg of nitrogen/metric ton. From themanure, 50% of the nitrogen is available during the first yearafter application. Testing shows the soil organic level* is 1.8%.At a depth of 60 cm**, nitrate-nitrogen measures 15 ppm (partsper million). Irrigation water analysis shows nitrate-nitrogenlevels at 6 ppm (6 kg N/1000 m3 of water irrigated). The farmerusually uses 4569 m3 of irrigation water per hectare of land in agrowing season (1 hectare covered by 46 cm of water).
*Organic Matter Nitrogen- % soil organic matter x 22 = approximate Nmineralized/year (varies with location and soil texture)**Residual Soil Nitrate- ppm nitrate in soil x 0.13.3 x cm of sample depth =kg/ha of available nitrate (0.133 is based on a soil bulk density of 1.2 g/cm3).
Example CalculationResidual Nitrate = 15 ppm x 60 cm x 0.133 = 120 kg N/ha Irrigation Water Nitrogen = 6 kg/1000 m3 x 4569 m3/ha =27 kg N/ha Organic Matter Nitrogen = 1.8% x 22 = 40 kg N/haManure Nitrogen = 22 metric tons/ha x 7 kg N/metric ton x50% = 77 kg N/ha Nitrogen Requirement = 150 hl/ha x 2.6 kg N/hl = 390 kg/ha
Therefore:390 (required) - (120 + 27 + 40 + 77) = 126 kg/ha additional Nrequired
Applying more than the recommended 126 kg/ha would showlittle or no return on money, invested into fertilizer and greatlyincreases the probability of nitrogen loss due to leaching.
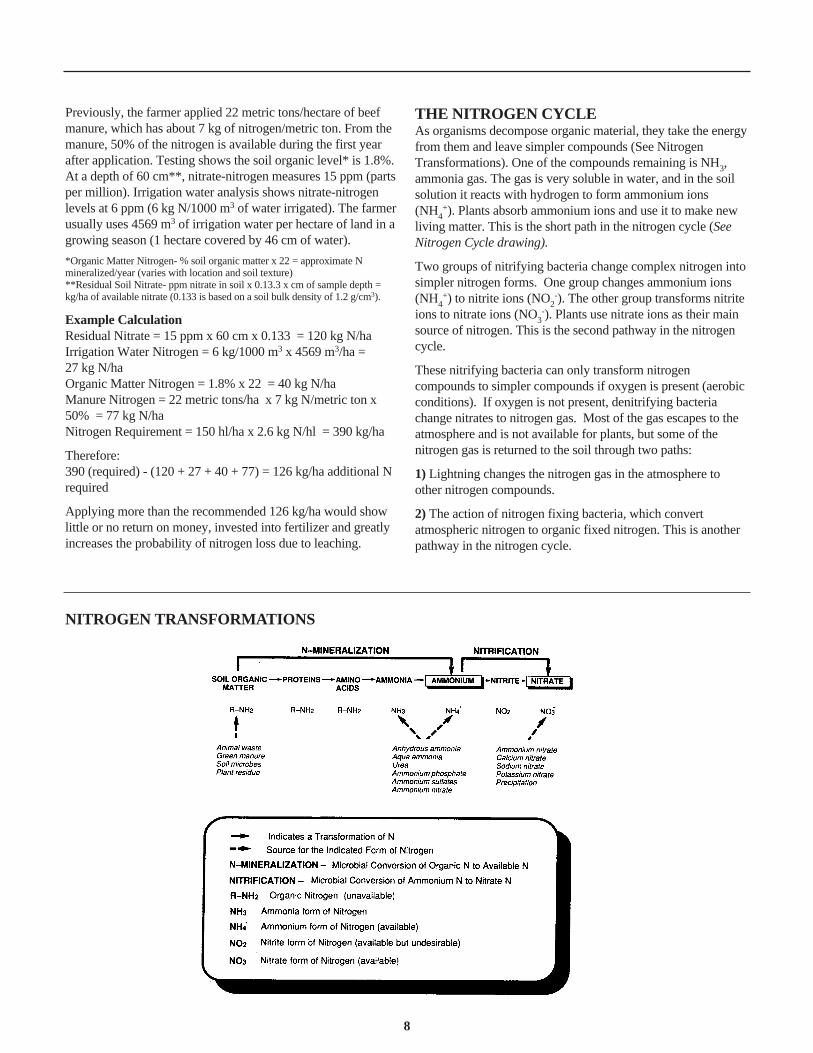
THE NITROGEN CYCLEAs organisms decompose organic material, they take the energyfrom them and leave simpler compounds (See NitrogenTransformations). One of the compounds remaining is NH3,ammonia gas. The gas is very soluble in water, and in the soilsolution it reacts with hydrogen to form ammonium ions(NH4
+). Plants absorb ammonium ions and use it to make newliving matter. This is the short path in the nitrogen cycle (SeeNitrogen Cycle drawing).
Two groups of nitrifying bacteria change complex nitrogen intosimpler nitrogen forms. One group changes ammonium ions(NH4
+) to nitrite ions (NO2-). The other group transforms nitrite
ions to nitrate ions (NO3-). Plants use nitrate ions as their main
source of nitrogen. This is the second pathway in the nitrogencycle.
These nitrifying bacteria can only transform nitrogencompounds to simpler compounds if oxygen is present (aerobicconditions). If oxygen is not present, denitrifying bacteriachange nitrates to nitrogen gas. Most of the gas escapes to theatmosphere and is not available for plants, but some of thenitrogen gas is returned to the soil through two paths:
1) Lightning changes the nitrogen gas in the atmosphere toother nitrogen compounds.
2) The action of nitrogen fixing bacteria, which convertatmospheric nitrogen to organic fixed nitrogen. This is anotherpathway in the nitrogen cycle.
8
NITROGEN TRANSFORMATIONS

9
THE NITROGEN CYCLE

10
There is much confusion about the relationship among:
1) nitrate and nitrate-nitrogen
2) parts per million (ppm) and percent (%) nitrogen
3) ppm and lbs/acre (kg/hectare) in soil nitrate analysis
When reporting, interpreting and analyzing nitrate, it isimportant to be comfortable with converting back and forthbetween the various units of measure.
NITRATE VERSUS NITRATE-NITROGENThere is a mathematical relationship between nitrate (NO3
–) andnitrate-nitrogen (NO3
_N), just as there is a relationship betweeninches and feet or centimeters and meters. This relationship isbased on the chemical formula for these two substances.
The element nitrogen (N) exists in various forms and each ofthese forms can be measured. In a typical wastewater sample, Ncan be present as ammonia (NH3), nitrate (NO3
–), nitrite (NO2–)
and organically as amines (R-NH2), where R is a carbon-basedstructure. An analysis for total nitrogen would measure all thenitrogen, regardless of its chemical form. It would not measurea specific form like NO3
–. If a test measures the amount ofNO3
– in a sample, but the standards calibrate the analysis togive results as NO3
_N, how does the analyst convert themeasurement?
Every element has an atomic mass, based on the number ofprotons and neutrons within an atom of that element’s nucleus.Nitrogen has 7 protons and 7 neutrons, for a total atomic massof 14.
The oxygen atom is larger, with 8 protons and 8 neutrons in itsnucleus, for a total atomic mass of 16. The nitrate ion NO3
– is acombination of 1 nitrogen atom and 3 oxygen atoms. The totalmass for nitrate is 14 + 48 = 62. So, in 62 lbs (kg) of NO3
–,14 lbs (kg) of N and 48 lbs (kg) of oxygen are present. Thisrelationship can be expressed in two ways, either as 62 lbs(62 kg) of nitrate, or as 14 lbs (14 kg) of nitrate-nitrogen. Eitherexpression is correct. Since 62/14 = 4.43, one can convert anitrate measurement to actual nitrogen concentration. Forexample, 10 parts per million NO3–N can be expressed as 10 x4.43, or 44.3 parts per million NO3
–. Both values indicate thesame concentration in a different format. Just as 18 inches(50 cm) of rain is equivalent to 1.5 feet (0.5 meters), 10 ppmNO3
_N is equivalent to 44.3 ppm NO3–.
The following table lists convenient conversion factors. Alsolisted is a factor for converting NO3
– and NO3_N to potassium
nitrate (KNO3) concentration. Expressing N as potassiumnitrate is common when potentially toxic levels of nitrate existin forages for ruminant livestock (cattle, sheep, etc). Theequivalent values in the table are based on formula weight.
NITRATE CONVERSION FACTORSNitrate (NO3
–) = Nitrate-Nitrogen (NO3–N) x 4.4Nitrate (NO3
–) = Potassium Nitrate (KNO3) x 0.6
Nitrate-Nitrogen (NO3––N) = Nitrate (NO3
–) ÷ 4.4Nitrate-Nitrogen (NO3
––N) = Potassium Nitrate (KNO3) x 0.14
Potassium Nitrate (KNO3) = Nitrate (NO3–) x 1.6
Potassium Nitrate (KNO3) = Nitrate-Nitrogen (NO3–N) x 7.0
These conversion factors work whether values are expressed as parts per million, poundsper acre kg/hectare percent (%), or other common units.
Conversion ExampleA feed sample has 1,350 ppm NO3
––N. The value is reportedas: a) NO3
– and b) KNO3.
So, (1,350 ppm NO3––N) x (4.4) = 5,940 ppm NO3
–; and(1,350 ppm NO3
––N) x (7) = 9,450 ppm KNO3. All three valuesare the same concentration of nitrogen.
PARTS PER MILLION VERSUS PERCENT Parts per million is the same as milligrams (mg) of a substancein 1 kilogram of a mixture. Parts per million is also used toexpress pounds of a nutrient present in 1,000,000 pounds ofsoil. As long as the ratio is based on the number or parts in atotal of 1,000,000, the unit ppm may be used. For example, ifthere are 3,300 red flowers in a field of 1,000,000 flowers, theconcentration of red flowers in this field is 3,300 ppm.
Since 10,000 is 1% of 1,000,000, one can convert ppm topercent by dividing ppm by 10,000. Conversely, to convertpercent to ppm, multiply percent by 10,000. For example,1,350 ppm is equivalent to 0.135 %.
So, one nitrate result can be expressed in six different butequivalent ways. The table below uses all six ways to indicatepotentially lethal levels of nitrate (dry matter basis) in feedrations.
Potentially Lethal Nitrate Levels in Feed
ppm %Nitrate (NO3
–) over 9,000 0.9Nitrate-Nitrogen NO3
––N over 2,100 0.21Potassium Nitrate (KNO3) over 15,000 1.5
CONVERSION FACTORS FOR NITRATE-NITROGEN ANALYSIS
11
PPM VERSUS LBS/ACRE IN SOILLaboratories normally multiply ppm NO3
––N by 2 to convertit to lbs/acre NO3
––N. This is based on the assumption that amineral soil weighs 2,000,000 lbs per acre furrow slice. An acrefurrow slice is one acre of soil (43,560 square feet) at a depth of6.67 inches (average furrow depth). However, this conversion isnot truly accurate because the depth of a furrow slice varies, asdoes the depth of a soil sample. A better conversion is based onthe average weight of one acre of mineral soil to a depth of oneinch equals 300,000 lbs. Using this, the conversion is:
ppm NO3––N as analyzed x 0.3 x depth of soil sample (inches)
= lbs/acre
For example, if a soil sample was sampled to a depth of12 inches, and the analysis showed 16 ppm NO3
––N, then16 x 0.3 x 12 = 57.6 lbs NO3
––N/acre.
A Final Word of CautionNitrogen is available to plants in two major forms. The formmost likely to be abundant is nitrate. The ammonium ion(NH4
+) is also available. However, most soil analyses foravailable N measure only nitrate. This is usually adequate forfertilizer recommendations since ammonium levels arenormally low except in soils recently fertilized with nitrogen.
Most nitrogen fertilizers contain a lot of ammonium. Undernormal growing conditions, when soils are warm, ammoniumconverts to nitrogen in 2-3 weeks, making nitrate the mostabundant form of soil nitrogen.

12
WHAT IS pH?pH measures the ratio of acid ions (H+) to base ions (OH–). Asystem that has more H+ ions than OH– ions is acidic. A systemwith more OH– than H+ ions is basic (alkaline). Equal ratios ofH+ and OH– ions result in a neutral system.
The pH scale is a tool that indicates the number of hydrogenions in a solution. A pH of 7 is neutral, a pH greater than 7 isalkaline, and a pH less than 7 is acidic. A system with equalamounts of H+ and OH– ions has a 1:1 ratio of acid to base.
Each step on the scale, from 0 to 14, indicates a 10-fold changein the concentration of hydrogen ions. A system with a pH of 6has a 10:1 ratio of acid to base. A system with a pH of 8 a has a1:10 ratio of acid to base. Since a pH of 4.0 is three incrementsfrom 7.0, a system with a pH of 4.0 is 1,000 times more acidicthan a system with a pH of 7.0 and 10,000 times more acidicthan a system with a pH of 8.0.
pH of Some Common Substances
WHY IS pH IMPORTANT?pH is important because it influences:
1) availability of plant nutrients (see Soil pH and its Affects onNutrient Availability).
2) the solubility of toxic nutrients in the soil.
3) soil microbial activity.
4) physical breakdown of root cells.
5) the cation exchange capacity in soils whose colloids(clay/humus) are pH dependent.
Yearly monitoring of pH is important to good cropmanagement. This is especially true for soils that tend tobecome acidic, and for soils with a coarse (sandy) texture. Thefollowing table indicates some conditions associated with pHlevels in the soil and their relation to crop production.
Soil pH Levels and Associated ConditionsDetermining soil pH helps isolate possible or existing problemsfor crop management. A range of 6.5-7.0 is optimum for mostcrops. When the pH is out of this range, problems can beexpected.
Soil pH Indications Associated Condition
<5.5 Soil is deficient in Ca Poor crop growth due and/or Mg and should to low cation exchangebe limed (determine capacity (CEC) andbuffer pH) possible Al3+ toxicity.
Expect P deficiency.
5.5-6.5 Soil is low in lime Satisfactory for most crop and should be production. P availability closely monitored. is being decreased.
6.5-7.5 Ideal range for crop Soil CEC is near 100% production. base saturation.
7.5-8.4 Free lime (CaCO3) Usually excellentexists in soil. filtration and percolation
of water due to high Ca content on clays. P andmetal micro nutrients arebecoming more available.
>8.4 Almost invariably Very poor physicalindicates a condition. Infiltration andsodic soil. percolation of soil water
is very slow. Rootdeterioration andorganic matterdissolution is possible.
SOIL pH
bleach
Milk of magnesia
borax
blood
milk
vinegar
battery acid
lye
ammonia
seawater
pure water
tomato juice
lemon juice
14
13
12
11
10
9
8
7
6
5
4
3
2
1
0

13
SOIL ACIDITYSoils become acidic for several reasons. Under normalconditions, lime in the soil acts as a “buffer”, and neutralizesthe acid introduced into the soil by rain, plant growth, fertilizer,and organic decay. Once the lime is used up, there is no longera buffer to neutralize the acid present in the soil. When thishappens, the pH decreases quickly and the soil has a highpercentage of soluble exchangeable hydrogen (H+) andaluminum (Al3+). This creates a soil that is toxic to plantgrowth. Adding lime to acidic soil returns the buffering abilityand raises the pH to a range where toxic aluminum precipitatesout of the soil solution.
The most common acceptable method of determining limerequirement is to measure pH on an SMP extraction of the soil.In this method, a buffer is added to an acidic soil. The responseof the soil, measured as an increase in pH, is related to themetric tons of lime (as CaCO3) needed per hectare to raise thesoil pH to either 6.5 or 7.0, depending on the soil manager’sdecision and the return on the investment in the crop.
Lime Requirement Table (U.S.)Tons/Acre of Pure Limestone* (as
CaCO3) Required to Raise Buffer pH
Buffer pH To pH 7.0 To pH 6.56.8 0.1 0.16.7 0.7 0.66.6 1.2 1.06.5 1.9 1.66.4 2.7 2.36.3 3.4 2.96.2 4.2 3.66.1 5.1 4.36.0 5.7 4.85.9 6.7 5.75.8 7.5 6.45.7 8.4 7.15.6 9.1 7.75.5 9.8 8.35.4 10.7 9.15.3 11.5 9.85.2 12.4 10.55.1 13.1 11.15.0 13.9 11.84.9 14.7 12.5
*Values based on tons of pure, fine CaCO3 with a calcium carbonate equivalent (CCE)of 100.
If using limestone other than 100 CCE, calculate the requiredtons by dividing the number of tons from the above table bythe assayed CCE, expressed as a decimal percentage.
Example: If your buffer pH is 6.6, and you wish to raise the
soil pH to 7.0, then add 1.2 tons/acre of 100 CCE limestone tothe top 8 inches of soil. If the CCE of the limestone you wantto use is 87, then apply 1.2/0.87 = 1.37 tons/acre to bring thepH to 7.0.
Lime Requirement Table (Metric)Metric Tons/Hectare of Pure Limestone*(as CaCO3) Required to Raise Buffer pH
Buffer pH To pH 7.0 To pH 6.56.8 0.2 0.26.7 1.4 1.26.6 2.4 2.06.5 3.8 3.26.4 5.4 4.66.3 6.8 5.86.2 8.4 7.26.1 10.2 8.66.0 11.4 9.65.9 13.4 11.45.8 15.0 12.85.7 16.8 14.25.6 18.2 15.45.5 19.6 16.65.4 21.4 18.25.3 23.0 19.65.2 24.8 21.05.1 26.2 22.25.0 27.8 23.64.9 29.4 25.6
*Values based on metric tons of pure, fine CaCO3 with a calcium carbonate equivalent(CCE) of 100.
If using limestone other than 100 CCE, calculate the requiredmetric tons by dividing the number of metric tons from theabove table by the assayed CCE, expressed as a decimalpercentage.
Example: If your buffer pH is 6.6, and you wish to raisethe soil pH to 7.0, then add 2.4 metric tons/ha of 100 CCElimestone to the top 20 cm of soil. If the CCE of the limestoneyou want to use is 87, then apply 2.4/0.87 = 2.76 metric tons/hato bring the pH to 7.0.
ALKALINE SOILSIn arid and semi-arid regions, native lime content in the soilis usually high enough to create a calcareous condition.Calcareous soils contain free particles of calcium and/ormagnesium carbonate. These soils have a pH greater than 7.5and will visibly effervesce (fizz) when 10% hydrochloric acid(muriatic acid) is added dropwise to the soil.
Alkaline soils can affect the availability and efficiency ofphosphorus and many metal micronutrients as well as the lengthof time that herbicides remain in the soil. Banding phosphorusin row crops and applying micronutrients in chelated form canoften help overcome these conditions.

Adding sulfur to calcareous soil to reduce the pH is not veryeconomical. It would actually take many tons (metric tons) ofelemental sulfur per acre or hectare to neutralize a mediumtextured soil with only 2% lime. The cost to do this is very high,so other practices should be considered. Such practices includebanding fertilizer nutrients affected by the alkaline pH and/orusing chelated micronutrients where alkaline conditions createdeficiencies.
In soils that don’t contain lime where the pH is greater than 8.4due to high exchangeable sodium (not a calcareous condition),adding gypsum can reduce the pH. This will also increasewater infiltration and percolation. If native lime is present inthe soil, applying an oxidizable source of sulfur such as sulfuricacid can improve the soil pH.
14
Soil pH and Its Affects on Nutrient AvailabilityThe following illustration shows the degree of nutrient availability based on soil pH.

15
Soil tests predict the amount of plant nutrients needed to supplycrops with 100% of the nutrient requirements. Some soils arevery low in certain plant nutrients and require large quantitiesof fertilizers to supply crop needs. Conversely, some nutrientsfound in very high levels require no additional supplement.
DefinitionA soil test is a chemical means of estimating the nutrientsupplying power of a soil. The test needs to be calibrated beforethe results can be properly interpreted. Soil tests are calibratedby performing fertilizer rate experiments on different soils todetermine the best fertilizer rate for a given soil level ofnutrient. Once several fertility experiments are completed,fertilizer can be recommended based on the soil levels ofnutrients. Field research is necessary before soil test valuescan be used to suggest fertilizer rates. Agricultural ExperimentStations provide this information.
Chemical AnalysisThe chemical method used to measure the available soilnutrient level must be accurate and reproducible. As the soiltest values for a nutrient increase, the response of the crop toadditional fertilization decreases and reaches a point ofdiminishing returns.
Correlation and InterpretationAll nutrient soil test values must correlate with crop growthfrom fields of known response. The experimental site musthave the fertilizer nutrient as the only variable. Such variablesas plant population, planting pattern, tillage practices, variety,planting date, soil and rainfall/irrigation must be identical intime, quality, and quantity. For example, when an experiment iscarried out on a “P” (phosphorus) responding soil, and one plotis fully fertilized while another has everything except “P”, thedifference in growth rate can be measured as the final yield perunit area.
Fertilizer RecommendationsThe soil test indicates the nutrient level in the soil. It indicatesnothing about the potential yield of the soil, the season, themanagement practices, or the amount of fertilizer needed. Theaccuracy of the test interpretation is based on the type andquality of the field research. Most of the correlation research forsoil testing in the United States is conducted by the AgriculturalExperiment Stations.
To determine the level of fertilization, economic considerationsare important. To make an economic judgement it is necessaryto estimate the crop yield response and value. Because this isdifficult to do, it is best to use average yield responses andprices. Therefore, the final fertilizer recommendations dependon accurate soil test analysis and on interpretation of the testresults.
Of Special NoteThe following fertilizer recommendations for nitrogen,phosphorus, and potassium are only guidelines. Therecommendations are based on the type of research mentionedabove, and is available to the general public. Hach Company isproviding this information solely as a service and assumes noresponsibility for its accuracy or application.
SOIL TEST CALIBRATION

16
Plants absorb nitrate from the soil solution and convert it toamino acids for use in plant growth. Nitrate is the last breakdown product in the aerobic nitrogen cycle before it is taken upby plants. Nitrate is soluble and easily extracted from the soil.The total amount measured by the soil test is usually availableto the crop. Nitrogen recommendations are made by assuming100% of the nitrate is available in the surface soil and about75% is available from the subsoil with a few exceptions shownin the table below.
Nitrogen fertilizer recommendations are made by calculatingthe nitrogen requirement and yield goal for the crop andsubtracting the soil nitrate values from the requirement. Theamount of nitrogen available from a past legume crop and/orfrom livestock manure must also be subtracted from thenitrogen requirement. (See Soil Nitrogen—Calculating NitrogenFertilizer Application).
Estimated Amounts of Nitrogen Available From a Past Legume Crop
LEGUME lbs N / Acre kg N / Hectare
A. ALFALFA 100 112B. ALFALFA (1/2 stand) 50 56C. ALFALFA (poor stand) 0 0D. SOYBEANS 40 44.8E. OTHER BEANS 25 28F. CLOVERS 75 84
Estimated Amounts of Nitrogen Available From a Manure Application
SOURCE lbs N / TON kg N / Metric Ton
A. BEEF FEEDLOT 5 2.5B. DAIRY BARN 8 4C. POULTRY 15 7.5D. SWINE 8 4E. SLURRY 17 8.5
The nitrogen requirement for many common crops is shown onthe next page along with the subsoil factor for converting thesubsoil nitrate test to lbs of N per acre (kg of N per hectare).
The total nitrogen requirement is determined by multiplying thecrop yield goal by the nitrogen requirement. All surface soilnitrate ppm readings are multiplied by 0.3 (0.133 for metric)and by the sample depth (inches or cm) to arrive at kg of N peracre (hectare). The lbs (kg) of N in the subsoil are calculated bymultiplying the subsoil nitrate ppm reading by subsoil sampledepth (inches or cm) and the subsoil factor. The sum of nitrogenfrom the surface soil and subsoil is subtracted from thecalculated total nitrogen requirement. To convert the totalpounds of N per acre to kilograms per hectare, multiply by 1.12.If a subsoil nitrate test is not available, assume it to be 5 ppmnitrate nitrogen for fine textured soils and 2 ppm nitratenitrogen for sandy soils.
NITRATE FERTILIZER RECOMMENDATIONS

Nitrogen Requirement Table
CROP Nitrogen Subsoil*Requirement Factor
U.S. (metric) U.S. (metric)Irrigated Corn 1.4 lbs/bu (2.2 kg/hL) 0.22 (0.1)Dryland Corn 1.4 lbs/bu (2.2 kg/hL) 0.22 (0.1)Irrigated Milo 1.4 lbs/bu (2.2 kg/hL) 0.22 (0.1)Dryland Milo 1.4 lbs/bu (2.2 kg/hL) 0.22 (0.1)Popcorn 0.031 lbs/lb (0.031 kg/kg) 0.22 (0.1)Seed Corn 1.6 lbs/bu (2.6 kg/hL) 0.22 (0.1)Corn Silage 11.9 lbs/ton (6.0 kg/ton (M)) 0.22 (0.1)Sorghum Silage 9.5 lbs/ton (4.8 kg/ton (M)) 0.22 (0.1)Feed-Hay 25 lbs/ton (12.5 kg/ton (M)) 0.22 (0.1)Sudan Hay 27 lbs/ton (13.5 kg/ton (M)) 0.22 (0.1)Soybeans1
Pinto Beans1
Great Northern Beans1
Peanuts1
Winter Wheat 2 lbs/bu (3.2 kg/hL) 0.22 (0.1)Spring Wheat 2.2 lbs/bu (3.5 kg/hL) 0.22 (0.1)Oats 1.3 lbs/bu (2.1 kg/hL) 0.22 (0.1)Rye 1.9 lbs/bu (3.0 kg/hL) 0.22 (0.1)Feed Barley 1.5 lbs/bu (2.4 kg/hL) 0.22 (0.1)Malting Barley 1.3 lbs/bu (2.1 kg/hL) 0.3 (0.133)Small Grain Silage 13 lbs/ton (6.5 kg//ton (M)) 0.22 (0.1)Small Grain Hay 40 lbs/ton (20 kg/ton (M)) 0.22 (0.1)Alfalfa 0 ____New Alfalfa1
Grass Alfalfa 20 lbs/ton (10 kg/ton (M)) 0.22 (0.1)Clover 0 ____BromeGrass 40 lbs/ton (20 kg/ton (M)) 0.22 (0.1)BermudaGrass 40 lbs/ton (20 kg/ton (M)) 0.22 (0.1)Fescue 40 lbs/ton (20 kg/ton (M)) 0.22 (0.1)Native Grass 27 lbs/ton (13.5 kg/ton (M)) 0.22 (0.1)LoveGrass 32 lbs/ton (16 kg/ton (M)) 0.22 (0.1)Cool Grass 40 lbs/ton (20 kg/ton (M)) 0.22 (0.1)Sugar Beets 9 lbs/ton (4.5 kg/ton (M)) 0.3 (0.133)Sunflowers 0.05 lbs/cwt (0.05 kg/kg) 0.22 (0.1)Potatoes 0.5 lbs/cwt (0.5 kg/q) 0.3 (0.133)Cotton 0.12 lbs/lb (0.12 kg/kg) 0.3 (0.133)Millet 1.7 lbs/bu (2.7 kg/hL) 0.22 (0.1)Onions 0.25 lbs/cwt (0.25 lkg/q) 0.3 (0.133)Melons 1 lbs/ton (0.5 kg/ton (M)) 0.3 (0.133)
1The nitrogen requirement for these legume crops is calculated based on the P2O5 requirement. Each of these legumes require nitrogen in a 1:3 ratio except pinto beans which require a 1:2ratio. (Example: if a requirement for P2O5 = 90 lbs/acre (101 kg/ha), then with a 1:3 ratio, 30 lbs (34 kg) of N would be required.)*See previous page to convert Subsoil Nitrogen test to lbs per acre or kg per hectare.
17

18
Phosphorus fertilizer recommendations are developed fromphosphorus soil test calibrations and crop requirements. Theactual amount of phosphorus available for a growing crop isvery difficult to measure. Phosphorus is held on the surfacesof soil colloids and is precipitated as insoluble phosphoruscompounds. Therefore, the soil test must estimate how quicklythe phosphate will move from the colloid surfaces into the soilsolution for plant uptake.
The availability of soil phosphorus is estimated fromexperimental data by comparing crop response to phosphorusfertilizer application with the phosphorus soil test level. Afterseveral experiments, a calibration curve is drawn that shows theamount of yield response for each soil test category.
Each soil test range is an estimate of the percent sufficiency.For example, the following table shows that a crop grown in asoil with a P soil test between 6-12 ppm P will produce 45 to80% of the yield produced with adequate phosphorusfertilization.
Percent Sufficiency Ranges and Levels for Phosphorus Soil Tests (based on Mehlich 2 extraction)
SOIL TEST (ppm P) Level % Sufficiency
A. 0–5 VERY LOW 25–50B. 6–12 LOW 45–80C. 13–25 MEDIUM 70–95D. 26–50 HIGH 90–100E. 51+ VERY HIGH 100
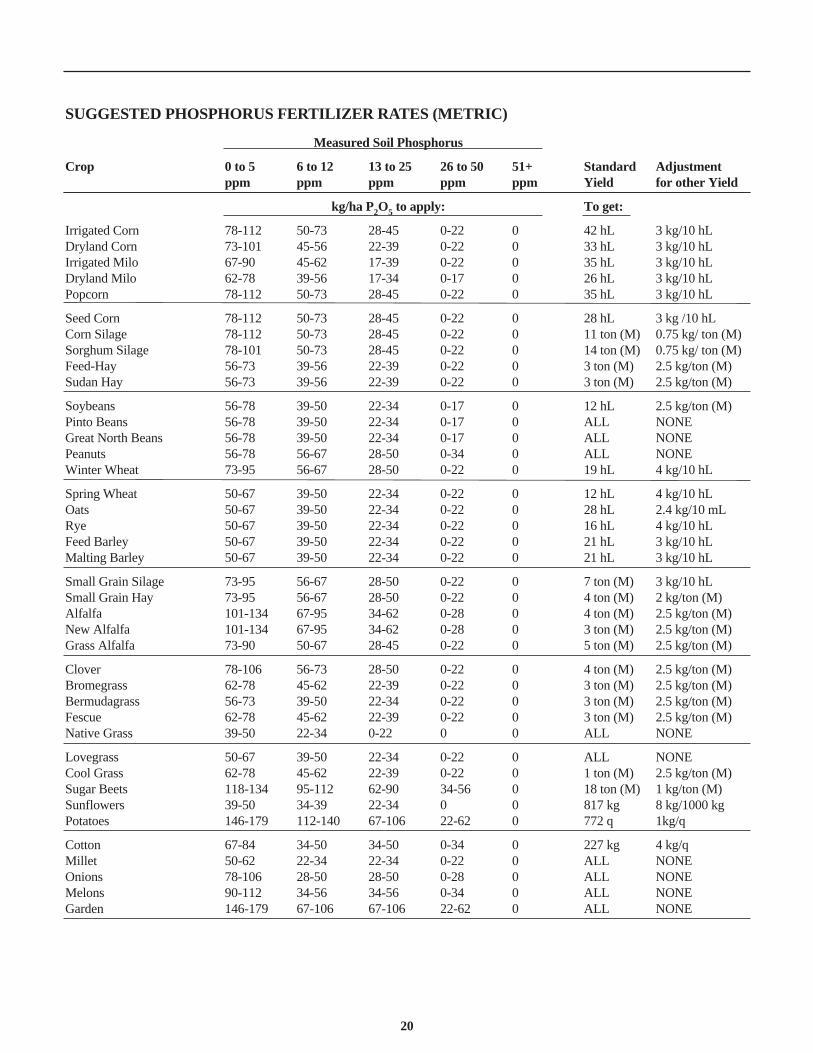
Suggested phosphorus fertilizer rates for many crops are shownin the table “Suggested Phosphorus Fertilizer Rates.” Thesuggested rates of P2O5 per acre are developed for a standardyield as shown. If a different yield goal is desired, the P2O5 rateshould be adjusted according to the suggestions in the righthand column of the table.
Manure application will influence the final rate of phosphorusfertilizer application. The manure application rate is multipliedby the amount of P2O5 per ton or metric ton for the type ofmanure. This amount is then subtracted from the P2O5 ratesdetermined from the “Suggested Phosphorus Fertilizer Rates”recommendation table.
Estimated Amounts of Phosphorus AvailableFrom Manure Application
SOURCE lbs P2O5 / TON Kg P2O5 / Metric Ton
A. BEEF FEEDLOT 4 2B. DAIRY BARN 4 2C. POULTRY 15 7.5D. SWINE 5 2.5E. SLURRY 13 lbs/1000 gal. 1.6 kg/1000 liters
PHOSPHORUS FERTILIZER RECOMMENDATIONS

19
SUGGESTED PHOSPHORUS FERTILIZER RATES (U.S.)
Measured Soil Phosphorus
Crop 0 to 5 6 to 12 13 to 25 26 to 50 51+ Standard Adjustmentppm ppm ppm ppm ppm Yield for other Yield
lbs/Acre P2O5 to apply: To get:
Irrigated Corn 70-100 45-65 25-40 0-20 0 120 bu 2 lbs/10 buDryland Corn 65-90 40-50 20-35 0-20 0 95 bu 2 lbs/10 buIrrigated Milo 60-80 40-55 15-35 0-20 0 100 bu 2 lbs/10 buDryland Milo 55-70 35-50 15-30 0-15 0 75 bu 2 lbs/10 buPopcorn 70-100 45-65 25-40 0-20 0 100 bu 2 lbs/10 bu
Seed Corn 70-100 45-65 25-40 0-20 0 80 bu 2 lbs/10 buCorn Silage 70-100 45-65 25-40 0-20 0 12 ton 1.5 lbs/tonSorghum Silage 70-90 45-65 25-40 0-20 0 15 ton 1.5 lbs/tonFeed-Hay 50-65 35-50 20-35 0-20 0 3 ton 5 lbs/tonSudan Hay 50-65 35-50 20-35 0-20 0 3 ton 5 lbs/ton
Soybeans 50-70 35-45 20-30 0-15 0 35 bu 5 lbs/tonPinto Beans 50-70 35-45 20-30 0-15 0 ALL NONEGreat North Beans 50-70 35-45 20-30 0-15 0 ALL NONEPeanuts 50-70 50-60 25-45 0-30 0 ALL NONEWinter Wheat 65-85 50-60 25-45 0-20 0 55 bu 2.5 lbs/ 10 bu
Spring Wheat 45-60 35-45 20-30 0-20 0 35 bu 2.5 lbs/ 10 buOats 45-60 35-45 20-30 0-20 0 80 bu 1.5 lbs/ 10 buRye 45-60 35-45 20-30 0-20 0 45 bu 2.5 lbs/ 10 buFeed Barley 45-60 35-45 20-30 0-20 0 60 bu 2.0 lbs/ 10 buMalting Barley 45-60 35-45 20-30 0-20 0 60 bu 2.0 lbs/ 10 bu
Small Grain Silage 65-85 50-60 25-45 0-20 0 8 ton 2.0 lbs/ 10 buSmall Grain Hay 65-85 50-60 25-45 0-20 0 4 ton 4 lbs/ tonAlfalfa 90-120 60-85 30-55 0-25 0 4 ton 5 lbs / tonNew Alfalfa 90-120 60-85 30-55 0-25 0 3 ton 5 lbs / tonGrass Alfalfa 65-80 45-60 25-40 0-20 0 5 ton 5 lbs / ton
Clover 70-95 50-65 25-45 0-20 0 4 ton 5 lbs / tonBromegrass 55-70 40-55 20-35 0-20 0 3 ton 5 lbs / tonBermudagrass 50-65 35-45 20-30 0-20 0 3 ton 5 lbs / tonFescue 55-70 40-55 20-35 0-20 0 3 ton 5 lbs / tonNative Grass 35-45 20-30 0-20 0 0 ALL NONE
Lovegrass 45-60 35-45 20-30 0-20 0 ALL NONECool Grass 55-70 40-55 20-35 0-20 0 ton 5 lbs / tonSugar Beets 105-120 85-100 55-80 30-50 0 20 ton 2 lbs / tonSunflowers 35-45 30-35 20-30 0 0 1800 lbs 5 lbs / 600 lbsPotatoes 130-160 100-125 60-95 20-55 0 350 cwt 1 lb / cwt
Cotton 60-75 30-45 30-45 0-30 0 500 lbs 4 lbs / 100 lbsMillet 45-55 20-30 20-30 0-20 0 ALL NONEOnions 70-95 25-45 25-45 0-25 0 ALL NONEMelons 80-100 30-50 30-50 0-30 0 ALL NONEGarden 130-160 60-95 60-95 20-55 0 ALL NONE
SUGGESTED PHOSPHORUS FERTILIZER RATES (METRIC)
Measured Soil Phosphorus
Crop 0 to 5 6 to 12 13 to 25 26 to 50 51+ Standard Adjustmentppm ppm ppm ppm ppm Yield for other Yield
kg/ha P2O5 to apply: To get:
Irrigated Corn 78-112 50-73 28-45 0-22 0 42 hL 3 kg/10 hLDryland Corn 73-101 45-56 22-39 0-22 0 33 hL 3 kg/10 hLIrrigated Milo 67-90 45-62 17-39 0-22 0 35 hL 3 kg/10 hLDryland Milo 62-78 39-56 17-34 0-17 0 26 hL 3 kg/10 hLPopcorn 78-112 50-73 28-45 0-22 0 35 hL 3 kg/10 hL
Seed Corn 78-112 50-73 28-45 0-22 0 28 hL 3 kg /10 hLCorn Silage 78-112 50-73 28-45 0-22 0 11 ton (M) 0.75 kg/ ton (M)Sorghum Silage 78-101 50-73 28-45 0-22 0 14 ton (M) 0.75 kg/ ton (M)Feed-Hay 56-73 39-56 22-39 0-22 0 3 ton (M) 2.5 kg/ton (M)Sudan Hay 56-73 39-56 22-39 0-22 0 3 ton (M) 2.5 kg/ton (M)
Soybeans 56-78 39-50 22-34 0-17 0 12 hL 2.5 kg/ton (M)Pinto Beans 56-78 39-50 22-34 0-17 0 ALL NONEGreat North Beans 56-78 39-50 22-34 0-17 0 ALL NONEPeanuts 56-78 56-67 28-50 0-34 0 ALL NONEWinter Wheat 73-95 56-67 28-50 0-22 0 19 hL 4 kg/10 hL
Spring Wheat 50-67 39-50 22-34 0-22 0 12 hL 4 kg/10 hLOats 50-67 39-50 22-34 0-22 0 28 hL 2.4 kg/10 mLRye 50-67 39-50 22-34 0-22 0 16 hL 4 kg/10 hLFeed Barley 50-67 39-50 22-34 0-22 0 21 hL 3 kg/10 hLMalting Barley 50-67 39-50 22-34 0-22 0 21 hL 3 kg/10 hL
Small Grain Silage 73-95 56-67 28-50 0-22 0 7 ton (M) 3 kg/10 hLSmall Grain Hay 73-95 56-67 28-50 0-22 0 4 ton (M) 2 kg/ton (M)Alfalfa 101-134 67-95 34-62 0-28 0 4 ton (M) 2.5 kg/ton (M)New Alfalfa 101-134 67-95 34-62 0-28 0 3 ton (M) 2.5 kg/ton (M)Grass Alfalfa 73-90 50-67 28-45 0-22 0 5 ton (M) 2.5 kg/ton (M)
Clover 78-106 56-73 28-50 0-22 0 4 ton (M) 2.5 kg/ton (M)Bromegrass 62-78 45-62 22-39 0-22 0 3 ton (M) 2.5 kg/ton (M)Bermudagrass 56-73 39-50 22-34 0-22 0 3 ton (M) 2.5 kg/ton (M)Fescue 62-78 45-62 22-39 0-22 0 3 ton (M) 2.5 kg/ton (M)Native Grass 39-50 22-34 0-22 0 0 ALL NONE
Lovegrass 50-67 39-50 22-34 0-22 0 ALL NONECool Grass 62-78 45-62 22-39 0-22 0 1 ton (M) 2.5 kg/ton (M)Sugar Beets 118-134 95-112 62-90 34-56 0 18 ton (M) 1 kg/ton (M)Sunflowers 39-50 34-39 22-34 0 0 817 kg 8 kg/1000 kgPotatoes 146-179 112-140 67-106 22-62 0 772 q 1kg/q
Cotton 67-84 34-50 34-50 0-34 0 227 kg 4 kg/qMillet 50-62 22-34 22-34 0-22 0 ALL NONEOnions 78-106 28-50 28-50 0-28 0 ALL NONEMelons 90-112 34-56 34-56 0-34 0 ALL NONEGarden 146-179 67-106 67-106 22-62 0 ALL NONE
20

Potassium fertilizer recommendations are developed frompotassium soil test calibrations and crop requirements. Theactual amount of available potassium (K+) for a growing crop isestimated by measuring the exchangeable potassium level in thesoil.
The availability of soil potassium is estimated fromexperimental data by comparing yield response from potassiumfertilizer application with potassium soil test levels. Afterseveral experiments, a calibration curve can be drawn thatshows the amount of yield response for each soil test category.
Each soil test range is an estimate of the percent sufficiency.The following table, for example, shows that a crop grown in asoil with a K+ soil test between 41-80 ppm K+ will produce 45to 80% of the yield produced with adequate potassiumfertilization.
Percent Sufficiency Ranges and Levels For Potassium SoilTests (based on Mehlich 2 extraction)
Soil Test Level (ppm K) Level % Sufficiency
A. 0 - 40 VERY LOW 20 - 50B. 41 - 80 LOW 45 - 80C. 81 - 120 MEDIUM 70 - 95D. 121 - 200 HIGH 90 - 100E. 200+ VERY HIGH 100
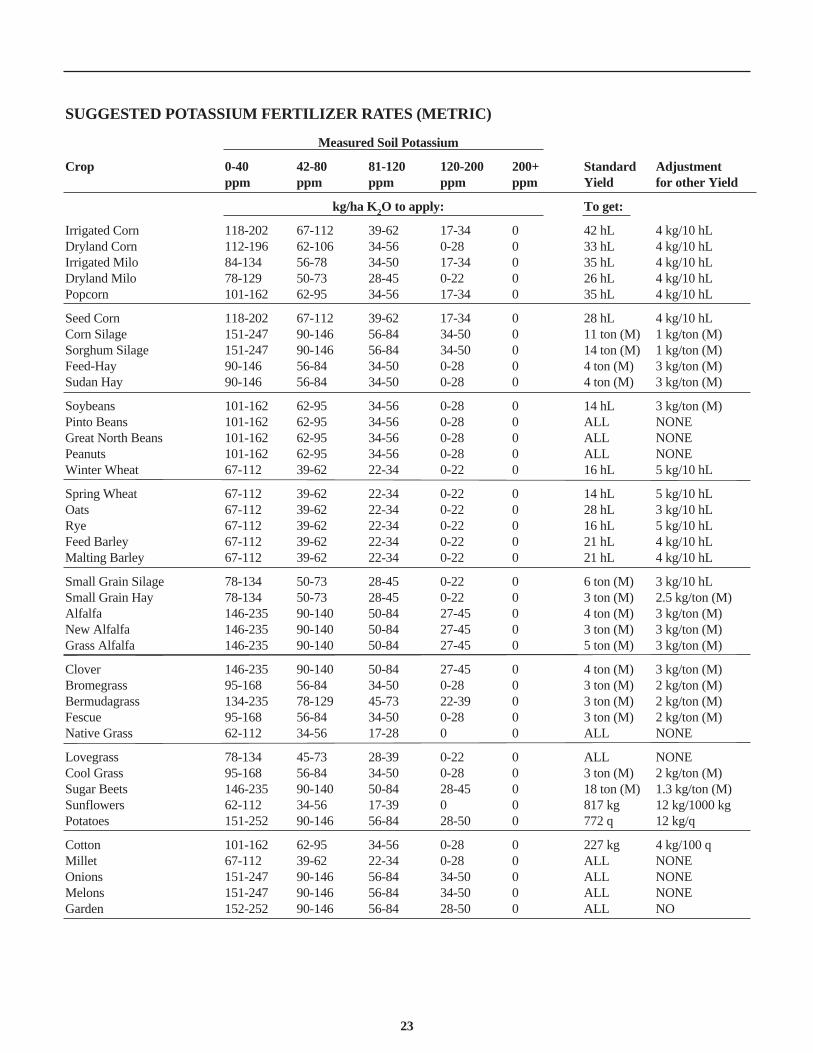
Potassium fertilizer rates suggested for many crops are shownin the tables on the next pages. The suggested rates of K2O peracre or hectare are developed for a standard yield as shown. If adifferent yield goal is desired, the K2O rate should be adjustedaccording to the suggestions in the right hand column in therecommendation table.
Manure application will influence the final rate of potashfertilizer application. The manure application rate is multipliedby the amount of K2O per ton or metric ton for the type ofmanure. This amount is then subtracted from the K2O ratesdetermined from the recommendation table.
Estimated Amounts of Potassium Available From Manure Application
SOURCE lbs K2O/TON kg K/Metric Ton
A. BEEF FEEDLOT 10 5B. DAIRY BARN 12 6C. POULTRY 15 7.5D. SWINE 12 6E. SLURRY 34 lbs/1000 gal 17 kg/1000 liters
21
POTASSIUM FERTILIZER RECOMMENDATIONS

SUGGESTED POTASSIUM FERTILIZER RATES (U.S.)
Measured Soil Potassium
Crop 0-40 42-80 81-120 120-200 200+ Standard Adjustmentppm ppm ppm ppm ppm Yield for other Yield
lbs/Acre K2O to apply: To get:
Irrigated Corn 105-180 60-100 35-55 15-30 0 120 bu 5 lbs/20 buDryland Corn 100-175 55-95 30-50 0-25 0 95 bu 5 lbs/20 buIrrigated Milo 75-120 50-70 30-45 15-30 0 100 bu 5 lbs/20 buDryland Milo 70-115 45-65 25-40 0-20 0 75 bu 5 lbs/20 buPopcorn 90-145 55-85 30-50 15-30 0 100 bu 5 lbs/20 bu
Seed Corn 105-180 60-100 35-55 15-30 0 80 bu 5 lbs/20 buCorn Silage 135-220 80-130 50-75 30-45 0 12 ton 2 lbs/tonSorghum Silage 135-220 80-130 50-75 30-45 0 15 ton 2 lbs/tonFeed-Hay 80-130 50-75 30-45 0-25 0 4 ton 6 lbs/tonSudan Hay 80-130 50-75 30-45 0-25 0 4 ton 6 lbs/ton
Soybeans 90-145 55-85 30-50 0-25 0 40 bu 6 lbs/tonPinto Beans 90-145 55-85 30-50 0-25 0 ALL NONEGreat North Beans 90-145 55-85 30-50 0-25 0 ALL NONEPeanuts 90-145 55-85 30-50 0-25 0 ALL NONEWinter Wheat 60-100 35-55 20-30 0-20 0 45 bu 3 lbs/10 bu
Spring Wheat 60-100 35-55 20-30 0-20 0 40 bu 3 lbs/10 buOats 60-100 35-55 20-30 0-20 0 80 bu 2 lbs/10 buRye 60-100 35-55 20-30 0-20 0 45 bu 3 lbs/10 buFeed Barley 60-100 35-55 20-30 0-20 0 60 bu 5.0 lbs/20 buMalting Barley 60-100 35-55 20-30 0-20 0 60 bu 5.0 lbs/20 bu
Small Grain Silage 70-120 45-65 25-40 0-20 0 7 ton 2.0 lbs/10 buSmall Grain Hay 70-120 45-65 25-40 0-20 0 3 ton 5 lbs/tonAlfalfa 130-210 80-125 45-75 25-40 0 4 ton 6 lbs/tonNew Alfalfa 130-210 80-125 45-75 25-40 0 3 ton 6 lbs/tonGrass Alfalfa 130-210 80-125 45-75 25-40 0 5 ton 6 lbs/ton
Clover 130-210 80-125 45-75 25-40 0 4 ton 6 lbs/tonBromegrass 85-150 50-75 30-45 0-25 0 3 ton 4 lbs/tonBermudagrass 120-210 70-115 40-65 20-35 0 3 ton 4 lbs/tonFescue 85-150 50-75 30-45 0-25 0 3 ton 4 lbs/tonNative Grass 55-100 30-50 15-25 0 0 ALL NONE
Lovegrass 70-120 40-65 25-35 0-20 0 ALL NONECool Grass 85-150 50-75 30-45 0-25 0 3 ton 4 lbs/tonSugar Beets 130-210 80-125 45-75 25-40 0 20 ton 2.5 lbs/tonSunflowers 55-100 30-50 15-35 0 0 1800 lbs 12 lbs/1000 lbsPotatoes 135-225 80-130 50-75 25-45 0 350 cwt 12 lbs/cwt
Cotton 90-145 55-85 30-50 0-25 0 500 lbs 4 lbs/100 lbsMillet 60-100 35-55 20-30 0-20 0 ALL NONEOnions 135-220 80-130 50-75 30-45 0 ALL NONEMelons 135-220 80-130 50-75 30-45 0 ALL NONEGarden 135-225 80-130 50-75 25-45 0 ALL NO
22
SUGGESTED POTASSIUM FERTILIZER RATES (METRIC)
Measured Soil Potassium
Crop 0-40 42-80 81-120 120-200 200+ Standard Adjustmentppm ppm ppm ppm ppm Yield for other Yield
kg/ha K2O to apply: To get:
Irrigated Corn 118-202 67-112 39-62 17-34 0 42 hL 4 kg/10 hLDryland Corn 112-196 62-106 34-56 0-28 0 33 hL 4 kg/10 hLIrrigated Milo 84-134 56-78 34-50 17-34 0 35 hL 4 kg/10 hLDryland Milo 78-129 50-73 28-45 0-22 0 26 hL 4 kg/10 hLPopcorn 101-162 62-95 34-56 17-34 0 35 hL 4 kg/10 hL
Seed Corn 118-202 67-112 39-62 17-34 0 28 hL 4 kg/10 hLCorn Silage 151-247 90-146 56-84 34-50 0 11 ton (M) 1 kg/ton (M)Sorghum Silage 151-247 90-146 56-84 34-50 0 14 ton (M) 1 kg/ton (M)Feed-Hay 90-146 56-84 34-50 0-28 0 4 ton (M) 3 kg/ton (M)Sudan Hay 90-146 56-84 34-50 0-28 0 4 ton (M) 3 kg/ton (M)
Soybeans 101-162 62-95 34-56 0-28 0 14 hL 3 kg/ton (M)Pinto Beans 101-162 62-95 34-56 0-28 0 ALL NONEGreat North Beans 101-162 62-95 34-56 0-28 0 ALL NONEPeanuts 101-162 62-95 34-56 0-28 0 ALL NONEWinter Wheat 67-112 39-62 22-34 0-22 0 16 hL 5 kg/10 hL
Spring Wheat 67-112 39-62 22-34 0-22 0 14 hL 5 kg/10 hLOats 67-112 39-62 22-34 0-22 0 28 hL 3 kg/10 hLRye 67-112 39-62 22-34 0-22 0 16 hL 5 kg/10 hLFeed Barley 67-112 39-62 22-34 0-22 0 21 hL 4 kg/10 hLMalting Barley 67-112 39-62 22-34 0-22 0 21 hL 4 kg/10 hL
Small Grain Silage 78-134 50-73 28-45 0-22 0 6 ton (M) 3 kg/10 hLSmall Grain Hay 78-134 50-73 28-45 0-22 0 3 ton (M) 2.5 kg/ton (M)Alfalfa 146-235 90-140 50-84 27-45 0 4 ton (M) 3 kg/ton (M)New Alfalfa 146-235 90-140 50-84 27-45 0 3 ton (M) 3 kg/ton (M)Grass Alfalfa 146-235 90-140 50-84 27-45 0 5 ton (M) 3 kg/ton (M)
Clover 146-235 90-140 50-84 27-45 0 4 ton (M) 3 kg/ton (M)Bromegrass 95-168 56-84 34-50 0-28 0 3 ton (M) 2 kg/ton (M)Bermudagrass 134-235 78-129 45-73 22-39 0 3 ton (M) 2 kg/ton (M)Fescue 95-168 56-84 34-50 0-28 0 3 ton (M) 2 kg/ton (M)Native Grass 62-112 34-56 17-28 0 0 ALL NONE
Lovegrass 78-134 45-73 28-39 0-22 0 ALL NONECool Grass 95-168 56-84 34-50 0-28 0 3 ton (M) 2 kg/ton (M)Sugar Beets 146-235 90-140 50-84 28-45 0 18 ton (M) 1.3 kg/ton (M)Sunflowers 62-112 34-56 17-39 0 0 817 kg 12 kg/1000 kgPotatoes 151-252 90-146 56-84 28-50 0 772 q 12 kg/q
Cotton 101-162 62-95 34-56 0-28 0 227 kg 4 kg/100 qMillet 67-112 39-62 22-34 0-28 0 ALL NONEOnions 151-247 90-146 56-84 34-50 0 ALL NONEMelons 151-247 90-146 56-84 34-50 0 ALL NONEGarden 152-252 90-146 56-84 28-50 0 ALL NO
23
24
SECTION II
There are four major criteria to consider when evaluatingirrigation water quality:
1) The concentration of soluble salts (salinity hazard)
2) The amount of sodium in water compared to other cations(sodium hazard)
3) The concentration of toxic elements that may inhibit plantgrowth or be an environmental hazard
4) The nutritional benefit resulting from nutrients such asnitrate, phosphate, and sulfate which may be present in theirrigation water in significant amounts.
Of these criteria, salinity and/or sodium hazard is the mostprevalent problem associated with irrigation water. The HachSoil and Irrigation Water Test Kit provides chemistries foranalyzing soluble salts, sodium, nitrate, and phosphate.
SALINITY HAZARDThe definition of salinity in irrigation water is the total sum ofdissolved inorganic ions and molecules. The major positive ions(cations) in salinity are calcium (Ca2+), magnesium (Mg2+), andsodium (Na+). The major negative ions (anions) are chloride(Cl-), sulfate (SO4
2–), and bicarbonate (HCO3–). Other ions may
be present, but normally are not concentrated enough to affectthe total salinity.
All irrigation waters contain some dissolved salts. Whenirrigation water contains excess dissolved salts, the soil beingirrigated can accumulate those salts due to evapo-transpirationand/or poor drainage. This process increases the tendency ofwater to be held by the soil instead of being absorbed by theroots (this tendency is called osmotic pressure).
Another force affecting water adsorption by plant roots ismatrix potential, which is simply the attraction of soil solids(matrix) for water. This force affects how much moisture thesoil retains and the free movement of water in the soil.
These two forces can cause a physiological drought. Even if thesoil contains plenty of moisture, the plants wilt because theycannot absorb enough water to replace the water lost bytranspiration. The combination of osmotic pressure and thematric potential resulting from soil particles decrease the root’sability to absorb enough water. As soils dry out due toevapotranspiration, the soil water becomes more saline and lessavailable to plants.
The salinity hazard of irrigation water is measured routinely bydetermining the electrical conductivity (EC), which is usuallyreported as microSiemens per centimeter (µS/cm). Whenirrigating with water high in EC (salinity hazard), the excesssalts introduced by irrigation must be routinely flushed out ofthe soil by providing adequate drainage and enough excessirrigation water to provide for plant requirements and leaching.
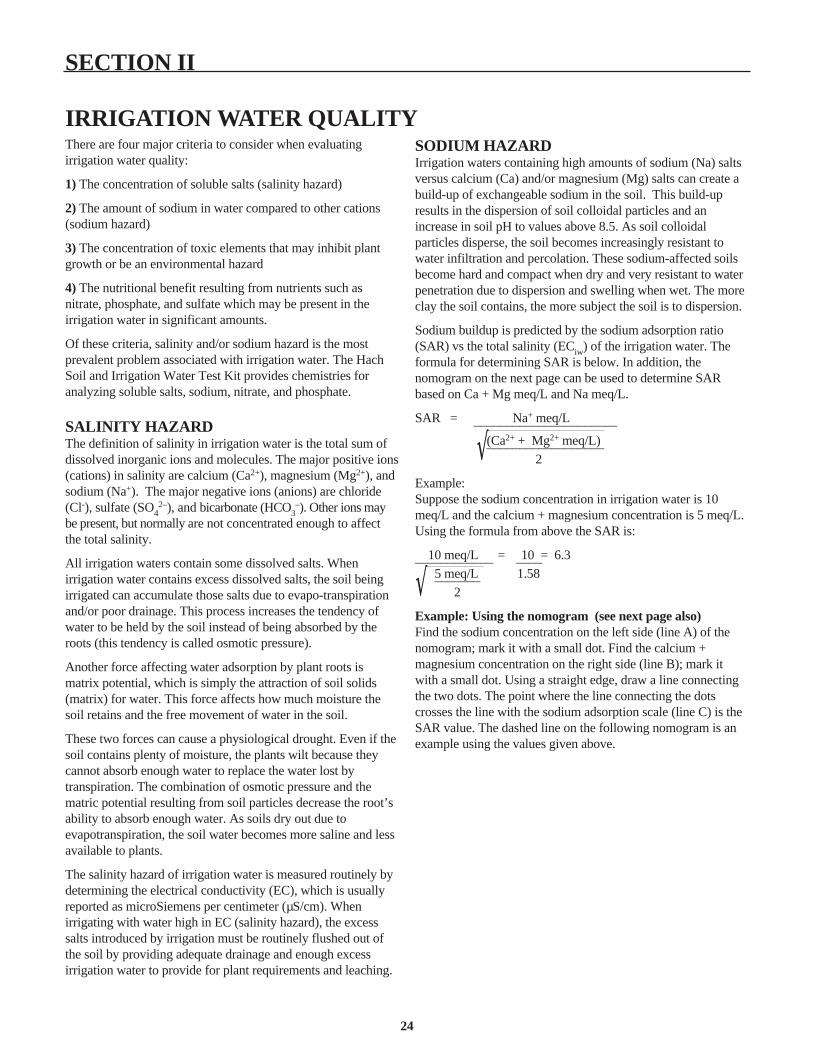
SODIUM HAZARDIrrigation waters containing high amounts of sodium (Na) saltsversus calcium (Ca) and/or magnesium (Mg) salts can create abuild-up of exchangeable sodium in the soil. This build-upresults in the dispersion of soil colloidal particles and anincrease in soil pH to values above 8.5. As soil colloidalparticles disperse, the soil becomes increasingly resistant towater infiltration and percolation. These sodium-affected soilsbecome hard and compact when dry and very resistant to waterpenetration due to dispersion and swelling when wet. The moreclay the soil contains, the more subject the soil is to dispersion.
Sodium buildup is predicted by the sodium adsorption ratio(SAR) vs the total salinity (ECiw) of the irrigation water. Theformula for determining SAR is below. In addition, thenomogram on the next page can be used to determine SARbased on Ca + Mg meq/L and Na meq/L.
SAR = Na+ meq/L______________________
(Ca2+ + Mg2+ meq/L)__________________2
Example:Suppose the sodium concentration in irrigation water is 10meq/L and the calcium + magnesium concentration is 5 meq/L.Using the formula from above the SAR is:
10 meq/L = 10 = 6.3____________ ____5 meq/L 1.58_______
2
Example: Using the nomogram (see next page also)Find the sodium concentration on the left side (line A) of thenomogram; mark it with a small dot. Find the calcium +magnesium concentration on the right side (line B); mark itwith a small dot. Using a straight edge, draw a line connectingthe two dots. The point where the line connecting the dotscrosses the line with the sodium adsorption scale (line C) is theSAR value. The dashed line on the following nomogram is anexample using the values given above.
√
√
IRRIGATION WATER QUALITY

NOMOGRAM TO DETERMINE SAR OF IRRIGATION WATER
25

26
TOXIC ELEMENTSSome elements are highly toxic to crop growth. Becausedifferent crops vary in their tolerance for toxic elements, theactual toxic concentration of the element varies from crop tocrop. Elements which induce toxic effects include boron,sodium, and heavy metals (i.e., arsenic, cobalt, copper, lead,nickel, and zinc).
In addition to toxic risk, many elements required for plantgrowth create environmental hazards if present in excess. Whilewaters high in nitrates and heavy metals can harm humans,waters high in phosphates can result in eutrophication of naturalwaters. The Hach Soil and Irrigation Water Test Kit provideschemistries and instrumentation for nitrate and phosphateanalysis. However, if problems resulting from toxic elementsare suspected, more extensive analytical systems can bepurchased from Hach Company.
NUTRITIONAL BENEFITHigh levels of nitrates and phosphates in irrigation water cancreate environmental concerns, but these waters can aid cropgrowth as effectively as a fertilizer application. An irrigationwater sample containing 10 ppm (10 mg/L) of nitrate-nitrogenwould provide 27 lbs of nitrogen per acre foot of water [17kg/1000 m3 (30 kg of nitrogen per hectare covered by 30 cm ofwater)]. This relationship can be applied to any nutrient beingconsidered as a benefit. The analyst must first determine theppm of the nutrient in question and then multiply by 2.7 toconvert to lbs per acre foot of water (by 1.8 to convert to kg per30 cm of water covering one hectare.
The Hach Soil and Irrigation Water Test Kit provideschemistries and instrumentation for nitrate and phosphateanalysis. If the analyst is interested in other nutrients, a watersample can be sent to a competent laboratory for preciseanalysis or additional testing capabilities can be purchased fromHach Company.
27
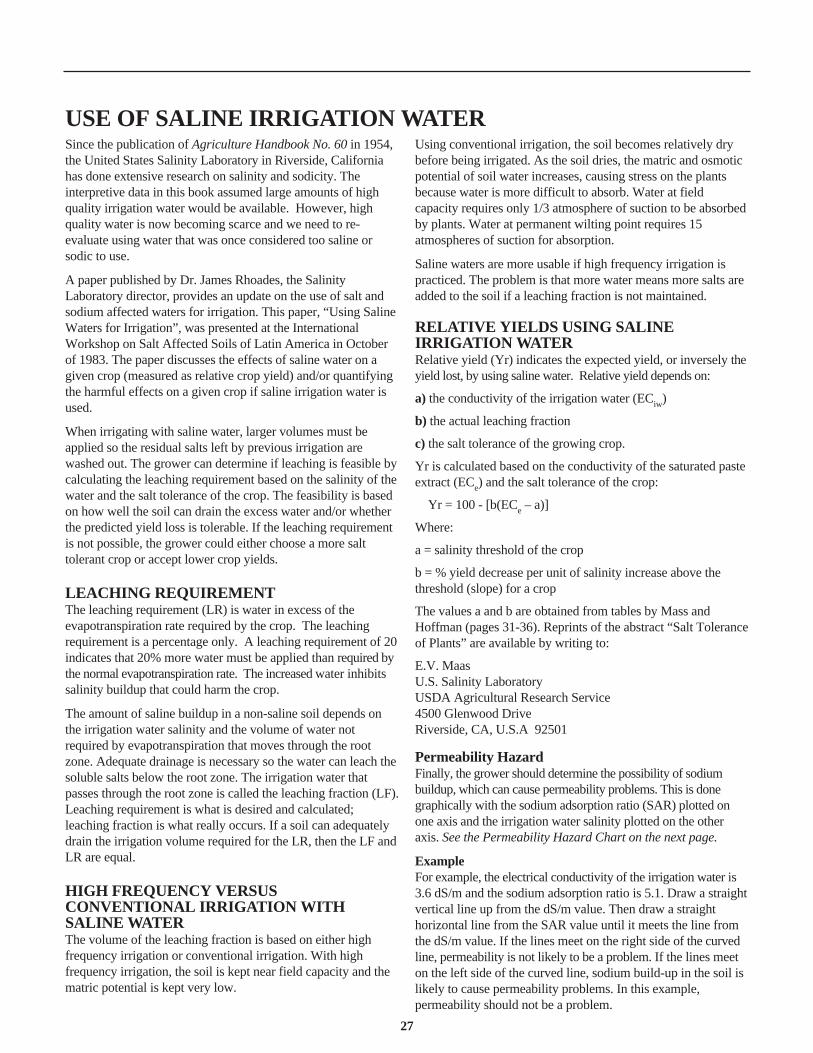
Since the publication of Agriculture Handbook No. 60 in 1954,the United States Salinity Laboratory in Riverside, Californiahas done extensive research on salinity and sodicity. Theinterpretive data in this book assumed large amounts of highquality irrigation water would be available. However, highquality water is now becoming scarce and we need to re-evaluate using water that was once considered too saline orsodic to use.
A paper published by Dr. James Rhoades, the SalinityLaboratory director, provides an update on the use of salt andsodium affected waters for irrigation. This paper, “Using SalineWaters for Irrigation”, was presented at the InternationalWorkshop on Salt Affected Soils of Latin America in Octoberof 1983. The paper discusses the effects of saline water on agiven crop (measured as relative crop yield) and/or quantifyingthe harmful effects on a given crop if saline irrigation water isused.
When irrigating with saline water, larger volumes must beapplied so the residual salts left by previous irrigation arewashed out. The grower can determine if leaching is feasible bycalculating the leaching requirement based on the salinity of thewater and the salt tolerance of the crop. The feasibility is basedon how well the soil can drain the excess water and/or whetherthe predicted yield loss is tolerable. If the leaching requirementis not possible, the grower could either choose a more salttolerant crop or accept lower crop yields.
LEACHING REQUIREMENTThe leaching requirement (LR) is water in excess of theevapotranspiration rate required by the crop. The leachingrequirement is a percentage only. A leaching requirement of 20indicates that 20% more water must be applied than required bythe normal evapotranspiration rate. The increased water inhibitssalinity buildup that could harm the crop.
The amount of saline buildup in a non-saline soil depends onthe irrigation water salinity and the volume of water notrequired by evapotranspiration that moves through the rootzone. Adequate drainage is necessary so the water can leach thesoluble salts below the root zone. The irrigation water thatpasses through the root zone is called the leaching fraction (LF).Leaching requirement is what is desired and calculated;leaching fraction is what really occurs. If a soil can adequatelydrain the irrigation volume required for the LR, then the LF andLR are equal.
HIGH FREQUENCY VERSUSCONVENTIONAL IRRIGATION WITHSALINE WATERThe volume of the leaching fraction is based on either highfrequency irrigation or conventional irrigation. With highfrequency irrigation, the soil is kept near field capacity and thematric potential is kept very low.
Using conventional irrigation, the soil becomes relatively drybefore being irrigated. As the soil dries, the matric and osmoticpotential of soil water increases, causing stress on the plantsbecause water is more difficult to absorb. Water at fieldcapacity requires only 1/3 atmosphere of suction to be absorbedby plants. Water at permanent wilting point requires 15atmospheres of suction for absorption.
Saline waters are more usable if high frequency irrigation ispracticed. The problem is that more water means more salts areadded to the soil if a leaching fraction is not maintained.
RELATIVE YIELDS USING SALINEIRRIGATION WATERRelative yield (Yr) indicates the expected yield, or inversely theyield lost, by using saline water. Relative yield depends on:
a) the conductivity of the irrigation water (ECiw)
b) the actual leaching fraction
c) the salt tolerance of the growing crop.
Yr is calculated based on the conductivity of the saturated pasteextract (ECe) and the salt tolerance of the crop:
Yr = 100 - [b(ECe – a)]
Where:
a = salinity threshold of the crop
b = % yield decrease per unit of salinity increase above thethreshold (slope) for a crop
The values a and b are obtained from tables by Mass andHoffman (pages 31-36). Reprints of the abstract “Salt Toleranceof Plants” are available by writing to:
E.V. MaasU.S. Salinity LaboratoryUSDA Agricultural Research Service4500 Glenwood DriveRiverside, CA, U.S.A 92501
Permeability HazardFinally, the grower should determine the possibility of sodiumbuildup, which can cause permeability problems. This is donegraphically with the sodium adsorption ratio (SAR) plotted onone axis and the irrigation water salinity plotted on the otheraxis. See the Permeability Hazard Chart on the next page.
ExampleFor example, the electrical conductivity of the irrigation water is3.6 dS/m and the sodium adsorption ratio is 5.1. Draw a straightvertical line up from the dS/m value. Then draw a straighthorizontal line from the SAR value until it meets the line fromthe dS/m value. If the lines meet on the right side of the curvedline, permeability is not likely to be a problem. If the lines meeton the left side of the curved line, sodium build-up in the soil islikely to cause permeability problems. In this example,permeability should not be a problem.
USE OF SALINE IRRIGATION WATER

PERMEABILITY HAZARD CHART
28

ASSESSING LEACHING REQUIREMENT
29
Dr. Rhoades has developed a computer program called“wetsuit” that computes and interprets irrigation water data. Asimplified version of his scheme is used in the followingexample.
ExampleData from analysis:
• ECiw = 3600 µS/cm (also expressed as 3.6 mS/cm, 3.6 ds/M, 3600 µMhos/cm, or 3.6 µMhos/cm)
• Ca + Mg = 20 meq/L
• Estimated Na meq/L = [(3.6 x 10) - 20] = 16 meq/L NaSee calculation for determination of estimated Na in the SIW-1 Soil and Irrigation Water Manual
• Crop—Wheat (moderately tolerant; has threshold salinityvalue of 6.0 mS/cm). See Salt Tolerance Tables on pages 31to 36 to determine threshold salinity.
• Irrigation Method—Conventional
Interpretation Strategy1) Determine the leaching requirement (Lr):
a. Determine the permissible rootzone concentration factor (F'c)by dividing the threshold salinity by the ECiw.
6F'c = ___ = 1.73.6
b. Use the Assessing Leaching Requirement graph to determinethe leaching requirement (Lr). Find the value for thepermissable rootzone concentration factor (e.g., 1.7) on thehorizontal scale. Use a straight edge to draw a line to theappropriate curved line (solid line if using conventionalirrigation or broken line if using high frequency irrigation).Then draw a straight horizontal line from that point on thecurve to the leaching requirement scale. In this example, theleaching requirement is 0.15.
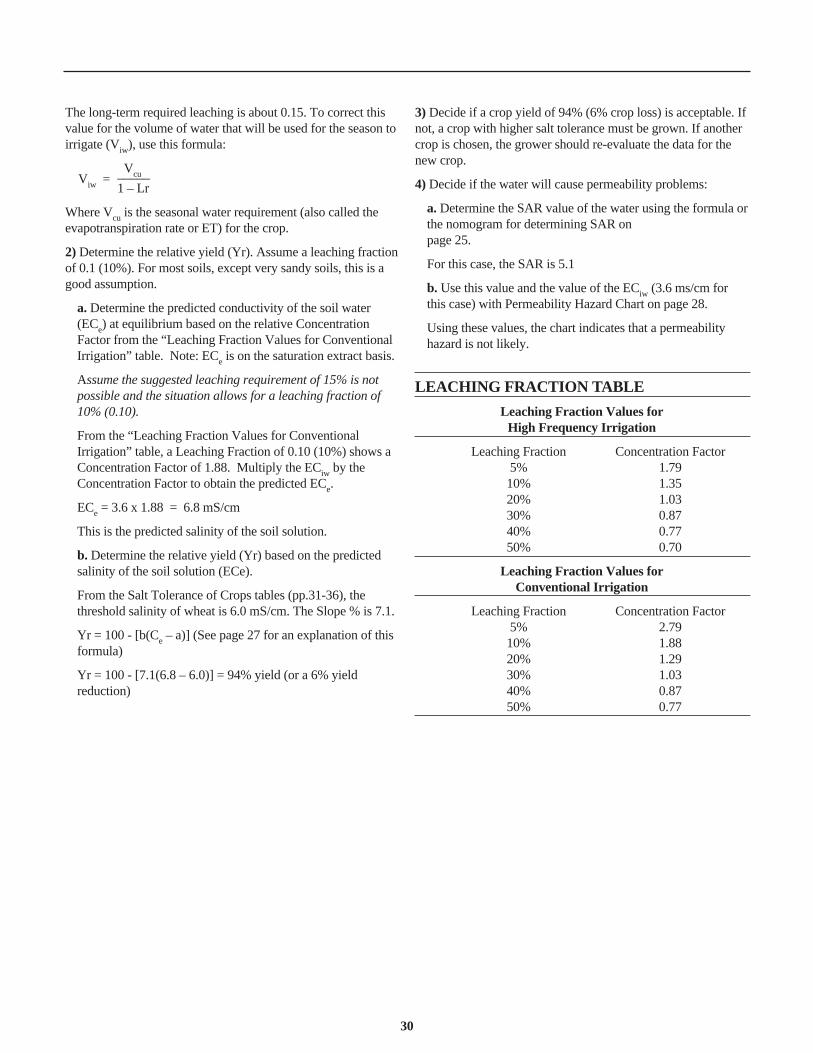
30
The long-term required leaching is about 0.15. To correct thisvalue for the volume of water that will be used for the season toirrigate (Viw), use this formula:
Vcu_____Viw =1 – Lr
Where Vcu is the seasonal water requirement (also called theevapotranspiration rate or ET) for the crop.
2) Determine the relative yield (Yr). Assume a leaching fractionof 0.1 (10%). For most soils, except very sandy soils, this is agood assumption.
a. Determine the predicted conductivity of the soil water(ECe) at equilibrium based on the relative ConcentrationFactor from the “Leaching Fraction Values for ConventionalIrrigation” table. Note: ECe is on the saturation extract basis.
Assume the suggested leaching requirement of 15% is notpossible and the situation allows for a leaching fraction of10% (0.10).
From the “Leaching Fraction Values for ConventionalIrrigation” table, a Leaching Fraction of 0.10 (10%) shows aConcentration Factor of 1.88. Multiply the ECiw by theConcentration Factor to obtain the predicted ECe.
ECe = 3.6 x 1.88 = 6.8 mS/cm
This is the predicted salinity of the soil solution.
b. Determine the relative yield (Yr) based on the predictedsalinity of the soil solution (ECe).
From the Salt Tolerance of Crops tables (pp.31-36), thethreshold salinity of wheat is 6.0 mS/cm. The Slope % is 7.1.
Yr = 100 - [b(Ce – a)] (See page 27 for an explanation of thisformula)
Yr = 100 - [7.1(6.8 – 6.0)] = 94% yield (or a 6% yieldreduction)
3) Decide if a crop yield of 94% (6% crop loss) is acceptable. Ifnot, a crop with higher salt tolerance must be grown. If anothercrop is chosen, the grower should re-evaluate the data for thenew crop.
4) Decide if the water will cause permeability problems:
a. Determine the SAR value of the water using the formula orthe nomogram for determining SAR on page 25.
For this case, the SAR is 5.1
b. Use this value and the value of the ECiw (3.6 ms/cm forthis case) with Permeability Hazard Chart on page 28.
Using these values, the chart indicates that a permeabilityhazard is not likely.
LEACHING FRACTION TABLE
Leaching Fraction Values for High Frequency Irrigation
Leaching Fraction Concentration Factor5% 1.7910% 1.3520% 1.0330% 0.8740% 0.7750% 0.70
Leaching Fraction Values for Conventional Irrigation
Leaching Fraction Concentration Factor5% 2.7910% 1.8820% 1.2930% 1.0340% 0.8750% 0.77

31
The following tables are based on papers presented by Dr. Rhoades and E.V. Maas and G.J. Hoffman.**
SALT TOLERANCE OF HERBACEOUS CROPSa
Electrical conductivityCrop of sat’d soil extract
Common Name Botanical Nameb Thresholdc Slope Ratingd
FIBER, GRAIN AND SPECIAL CROPSdS/m % per dS/m
Barley Hordeum vulgare 8.0 5.0 TBean Phaseolus vulgaris 1.0 19.0 SBroadbean Vicia Faba 1.6 9.6 MS
Corn Zea Mays 1.7 12 MSCotton Gossypium hirsutum 7.7 5.2 TCowpea Vigna unguiculata 4.9 12.0 MT
Flax Linum usitaissimum 1.7 12.0 MS
Guar Cyamopsis tetragonoloba — — MT
Millet, foxtail Setaria italica — — MS
Oats Avena sativa — — MT*
Peanut Arachis hypogaea 3.2 29.0 MS
Rice, paddyf Oryza sativa 3.0g 12.0g SRye Secale cereale — — MT*
Safflower Carthamus tinctorius — — MTSesame Sasamum indicum — — SSorghum Sorghum bicolor 6.8 16 MTSoybean Glycine Max 5.0 20.0 MTSugarbeeth Beta vulgaris 7.0 5.9 TSugarcane Saccharum officinarum 1.7 5.9 MSSunflower Heliantus annuus — — MS*
Triticale X. Triticosecale — — T
Wheate Triticum aestivum 6.0 7.1 MTWheat (semidwarf) T. aestivum 8.6 3.0 TWheat, Durum T. turgidum 5.9 3.8 T
GRASSES AND FORAGE CROPSAlfalfa Medicago sativa 2.0 7.3 MSAlkaligrass, Nuttall Puccinellia airoides — — T*Alkali sacaton Sporobolus airoides — — T*
Barley (forage)e Hordeum vulgare 6.0 7.1 MTBentgrass Agrostis stolonifera palustris — — MSBermudagrassj Cynodon Dactylon 6.9 6.4 TBluestem, Angleton Dicanthium aristatum — — MS*Brome, mountian Bromus marginatus — — MT*Brome, smooth B. inermis — — MSBuffelograss Cenchrus ciliaris — — MS*Burnet Poterium Sanguisorba — — MS*
Canarygrass, reed Phalaris arundinacea — — MTClover, alsike Trifolium hybridum 1.5 12.0 MSClover, Berseem T. alexandrinum 1.5 5.7 MSClover, Hubam Melilotus alba — — MT*Clover, ladino Trifolium repens 1.5 12.0 MS
CROP/PLANT TOLERANCE TO IRRIGATION WATER SALINITY

32
Clover, red T. pratense 1.5 12.0 MSClover, strawberry T. fragiferum 1.5 12.0 MSClover, sweet Melilotus — — MT*Clover, white Dutch Trifolium repens — — MS*Corn (forage) Zea Mays 1.8 7.4 MSCowpea (forage) Vigna unguiculata 2.5 11.0 MS
Dallisgrass Paspalum dilatatum — — MS*
Fescue, tall Festuca elatior 3.9 5.3 MTFescue, meadow F. pratensis — — MT*Foxtail, meadow Alopecurus pratensis 1.5 9.6 MS
Gramma, blue Bouteloua gracilis — — MS*
Hardinggrass Phalaris tuberosa 4.6 7.6 MT
Kallagrass Diplachne fusca — — T*
Lovegrassk Eragrostis sp. 2.0 8.4 MS
Milkvetch, Cicer Astragalus cicer — — MS*
Oatgrass, tall Arrhenatherum, Danthonia — — MS*Oats (forage) Avena sativa — — MS*Orchardgrass Dactylis glomerata 1.5 6.2 MS
Panicgrass Panicum antidotale — — MT*
Rape Brassica napus — — MT*Rescuegrass Bromus unioloides — — MT*Rhodesgrass Chloris Gayana — — MT*Rye (forage) Secale cereale — — MT*Ryegrass, Italian Lolium italicum multiflorum — — MT*Ryegrass, perennial L. perenne 5.6 7.6 MT
Saltgrass, desert Distichlis stricta — — T*Sesbaniaf Sesbania exaltata 2.3 7.0 MSSirato Macroptilium atropurpureum — — MSSphaerophysa Sphaerophysa salsula 2.2 7.0 MSSudangrass Sorghum sudanense 2.8 4.3 MT
Timothy Phleum pratense — — MS*Trefoil, big Lotus uliginosus 2.3 19.0 MSTrefoil, narrow-leaf
birdsfoot L. corniculatus tenuifolium 5.0 10. MTTrefoil, b.leaf birdsfootl L. corniculatus arvenis — — MT
Vetch, common Vicia angustifolia 3.0 11.0 MS
Wheat (forage)i Triticum aestivum 4.5 2.6 MTWheat, Durum (forage) T. turgidum 2.1 2.5 MTWheatgrass, st. crested Agropyron sibiricum 3.5 4.0 MTWheatgrass, frwy.crested A. cristatum 7.5 6.9 TWheatgrass, intermediate A. intermedium — — MT*Wheatgrass, slender A. trachycaulum — — MTWheatgrass, tall A. elongatum 7.5 4.2 TWheatgrass, western A. Smithii — — MT*Wildrye, Altai Elymus angustus — — TWildrye, beardless E. triticoides 2.7 6.0 MT
SALT TOLERANCE OF HERBACEOUS CROPSa (continued)
Electrical conductivityCrop of sat’d soil extract
Common Name Botanical Nameb Thresholdc Slope Ratingd
dS/m % per dS/m

33
Wildrye, Canadian E. canadensis — — MT*Wildrye, Russian E. junceus — — T
Vegetable and fruit cropsArtichoke Helianthus tuberosus — — MT*Asparagus Asparagus officinalis 4.1 2.0 T
Bean Phasoelus vulgaris 1.0 19.0 SBeet, redh Beta vulgaris 4.0 9.0 MTBroccoli Brassica oleracea botrytis 2.8 9.2 MSBrussel sprouts B. oleracea gemmifera — — MS*
Cabbage B. oleracea capitata 1.8 9.7 MSCarrot Daucus carota 1.0 14.0 SCauliflower Brassica oleracea botrytis — — MS*Celery Apium graveolens 1.8 6.2 MSCorn, sweet Zea Mays 1.7 12.0 MSCucumber Cucumis staivus 2.5 13.0 MS
Eggplant Solanum Melongena esculentum — — MS*
Kale Brassica oleracea acephala — — MS*Kohlrabi B. oleracea gongylode — — MS*
Lettuce Lactuca sativa 1.3 13.0 M
Muskmelon Cucumis Melo — — MS
Okra Abelmoschus esculentus — — SOnion Allium Cepa 1.2 16.0 S
Parsnip Pastinaca sativa — — S*Pea Pisum sativum — — S*Pepper Capsicum annuum 1.5 14.0 MSPotato Solanum tuberosum 1.7 12.0 MSPumpkin Cucurbita Pepo Pepo — — MS*
Radish Raphanus sativus 1.2 13.0 MS
Spinach Spinacia oleracea 2.0 7.6 MSSquash, scallop Cucurbita Pepo Melopepo 3.2 16.0 MSSquash, zucchini C. Pepo Melopepo 4.7 9.4 MTStrawberry Fragaria sp. 1.0 33.0 SSweet potato Ipomoea Batatas 1.5 11.0 MS
Tomato Lycopersicon Lycopersicum 2.5 9.9 MSTurnip Brassica Rapa 0.9 9.0 MS
Watermelon Citrullus lanatus — — MS*
a These data serve only as a guideline to relative tolerances among crops. Absolute tolerances vary, depending on climate, soil conditions, and cultural practices.b Botanical and common names follow the convention of Hortus Third where possible.c In gypsiferous soils, plants will tolerate KeS about 2 dS/M higher than indicated.d Ratings with an * are estimates. For references, see the indexed bibliography by Francois and Maas.e Less tolerant during emergence and seedling stage. Ke at this stage should not exceed 4 or 5 dS/m.f Less tolerant during emergence and seedling stage. g Because paddy rice is grown under flooded conditions, values refer to the electrical conductivity of the soil water while the plants are submerged.h Sensitive during germination. Ke should not exceed 3 dS/m.i Data from one cultivar, “Probred”.j Average of several varieties. Suwannee and Costal are about 20% more tolerant and Common and Greenfield are about 20% less tolerant than the average.l Broadleaf birdsfoot trefoil seems less tolerant than narrowleaf.**The reference for the Mass & Hoffman paper is “Crop Salt Tolerance: Evaluation of Existing Data” from proceedings of the International Salinity Conference, Texas Tech University,August 1976. These are in the public domain.
SALT TOLERANCE OF HERBACEOUS CROPSa (continued)
Electrical conductivityCrop of sat’d soil extract
Common Name Botanical Nameb Thresholdc Slope Ratingd
dS/m % per dS/m
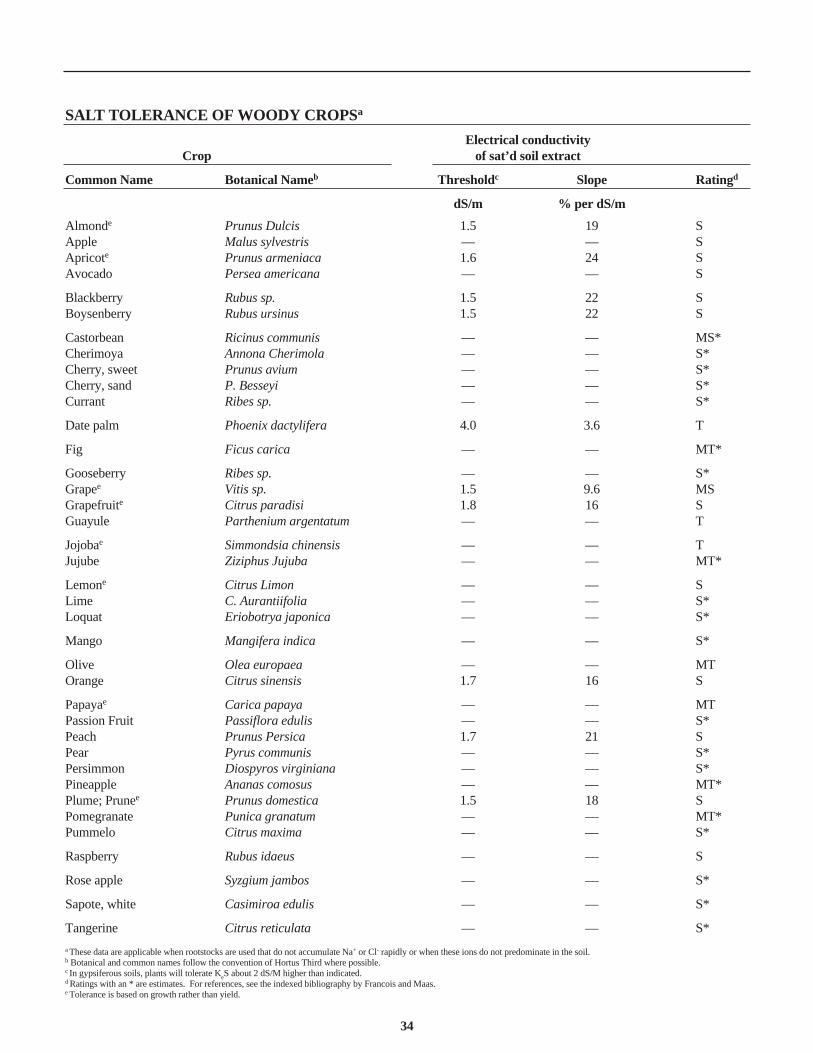
34
Almonde Prunus Dulcis 1.5 19 SApple Malus sylvestris — — SApricote Prunus armeniaca 1.6 24 SAvocado Persea americana — — S
Blackberry Rubus sp. 1.5 22 SBoysenberry Rubus ursinus 1.5 22 S
Castorbean Ricinus communis — — MS*Cherimoya Annona Cherimola — — S*Cherry, sweet Prunus avium — — S*Cherry, sand P. Besseyi — — S*Currant Ribes sp. — — S*
Date palm Phoenix dactylifera 4.0 3.6 T
Fig Ficus carica — — MT*
Gooseberry Ribes sp. — — S*Grapee Vitis sp. 1.5 9.6 MSGrapefruite Citrus paradisi 1.8 16 SGuayule Parthenium argentatum — — T
Jojobae Simmondsia chinensis — — TJujube Ziziphus Jujuba — — MT*
Lemone Citrus Limon — — SLime C. Aurantiifolia — — S*Loquat Eriobotrya japonica — — S*
Mango Mangifera indica — — S*
Olive Olea europaea — — MTOrange Citrus sinensis 1.7 16 S
Papayae Carica papaya — — MTPassion Fruit Passiflora edulis — — S*Peach Prunus Persica 1.7 21 SPear Pyrus communis — — S*Persimmon Diospyros virginiana — — S*Pineapple Ananas comosus — — MT*Plume; Prunee Prunus domestica 1.5 18 SPomegranate Punica granatum — — MT*Pummelo Citrus maxima — — S*
Raspberry Rubus idaeus — — S
Rose apple Syzgium jambos — — S*
Sapote, white Casimiroa edulis — — S*
Tangerine Citrus reticulata — — S*
a These data are applicable when rootstocks are used that do not accumulate Na+ or Cl- rapidly or when these ions do not predominate in the soil.b Botanical and common names follow the convention of Hortus Third where possible.c In gypsiferous soils, plants will tolerate KeS about 2 dS/M higher than indicated.d Ratings with an * are estimates. For references, see the indexed bibliography by Francois and Maas.e Tolerance is based on growth rather than yield.
SALT TOLERANCE OF WOODY CROPSa
Electrical conductivityCrop of sat’d soil extract
Common Name Botanical Nameb Thresholdc Slope Ratingd
dS/m % per dS/m

35
Very sensitiveStar Jasmine Trachelospermum jasminoides 1-2Pyrenese cotoneaster Cotoneaster congestus 1-2Pregon grape Mahonia Aquifolium 1-2Photonia Photonia x Fraseri 1-2
SensitivePineapple guava Feijoa Sellowiana 2-3Chinese holly, cv. Burford Ilex cornuta 2-3Rose, cv. Grenoble Rosa sp. 2-3Glossy abelia Abelia x grandiflora 2-3Southern Yew Podocarpus macrophyllus 2-3Tulip tree Liriodendron Tulipifera 2-3Algerian ivy Hedera canariensis 3-4Japanese pittosporum Pittosporum Tobira 3-4Heavenly bamboo Nandina domestica 3-4Chinese hibiscus Hibiscus Rosa-sinensis 3-4Laurustinus, cv. Robustum Viburnum Tin 3-4Strawberry tree, cv. Compact Arbutus Unedo 3-4Crape Myrtle Lagerstroemia indica 3-4
Moderately SensitiveGlossy privet Ligustrum lucidum 4-6Yellow sage Lantana Camara 4-6Orchid tree Bauhinia purpurea 4-6Southern Magnolia Magnolia grandiflora 4-6Japanese boxwood Buxus microphylla var. japonica 4-6Xylosma Xylosma congestum 4-6Japanese black pine Pinus Thunbergiana 4-6Indian Hawthorn Raphiolepis indica 4-6Dodonaea, cv. atropurpurea Dodonaea viscosa 4-6Oriental arborvitae Platycladus orientalis 4-6Thorny elaeagnus Elaeagnus pungens 4-6Spreading juniper Juniperus chinensis 4-6Pyracantha, cv. Graberi Pyracantha Fortuneana 4-6Cherry plum Prunus cerasifera 4-6
Moderately TolerantWeeping bottlebrush Callistemon viminalis 6-8Oleander Nerium oleander 6-8European fan palm Chamaerops humilis 6-8Blue dracaena Cordyline indivisa 6-8Spindle tree, cv. Grandiflora Euonymus japonica 6-8Rosemary Rosmarinus officinalis 6-8Aleppo pine Pinus halepensis 6-8Sweet gum Liquidambar Styraciflua 6-8
SALT TOLERANCE OF ORNAMENTAL SHRUBS, TREES, AND GROUNDCOVERa
Common Name Botanical Nameb Maximum Permissibleb KedS/m
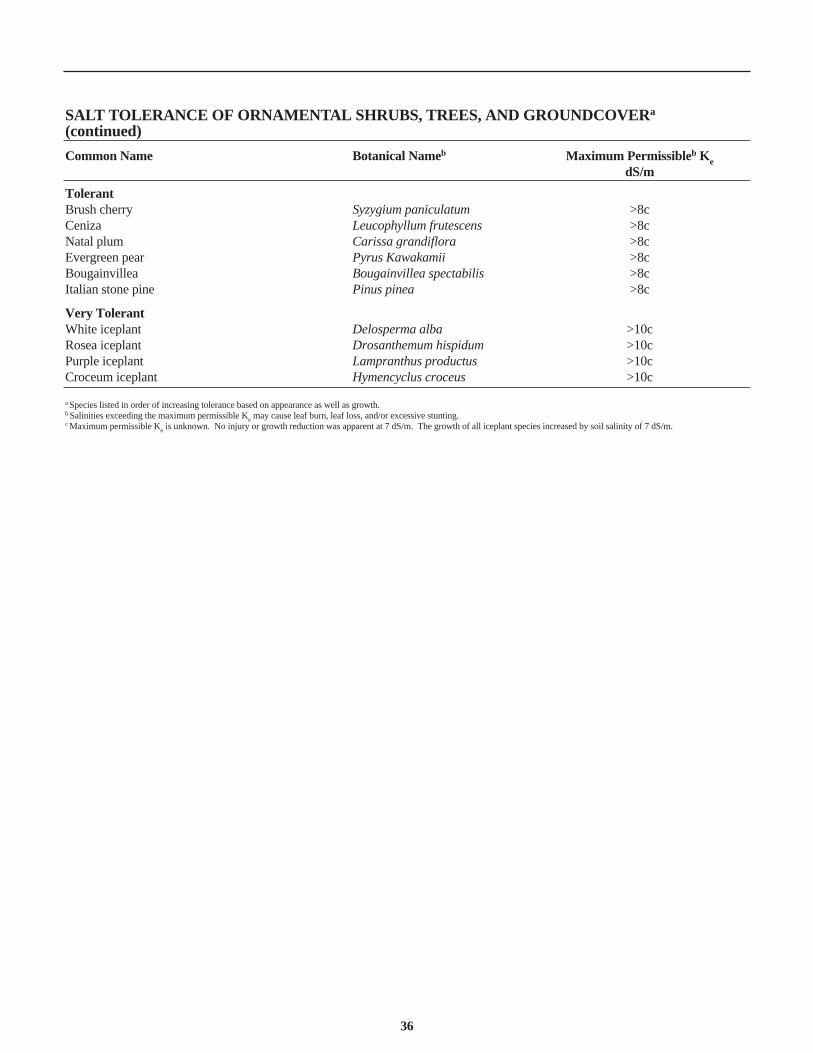
36
TolerantBrush cherry Syzygium paniculatum >8cCeniza Leucophyllum frutescens >8cNatal plum Carissa grandiflora >8cEvergreen pear Pyrus Kawakamii >8cBougainvillea Bougainvillea spectabilis >8cItalian stone pine Pinus pinea >8c
Very TolerantWhite iceplant Delosperma alba >10cRosea iceplant Drosanthemum hispidum >10cPurple iceplant Lampranthus productus >10cCroceum iceplant Hymencyclus croceus >10c
a Species listed in order of increasing tolerance based on appearance as well as growth.b Salinities exceeding the maximum permissible Ke may cause leaf burn, leaf loss, and/or excessive stunting.c Maximum permissible Ke is unknown. No injury or growth reduction was apparent at 7 dS/m. The growth of all iceplant species increased by soil salinity of 7 dS/m.
SALT TOLERANCE OF ORNAMENTAL SHRUBS, TREES, AND GROUNDCOVERa
(continued)
Common Name Botanical Nameb Maximum Permissibleb KedS/m

37
UNIT ABBREVIATION
acre acreacre inch acre-inbushel bubushel/acre bu/acrecentimeter cm
deciSiemen/meter dS/mEnglish ton ton (E)English ton/acre Ton (E)/acregram ghectar ha
hectoliter hlhectoliter/hectare hl/hahundredweight cwthundredweight/acre cwt/acreinch in
kilogram kgkilogram/hectare kg/hapounds/acre furrow slice lbs/AFSliter lmeter m
metric ton ton (M)metric ton/hectare Ton (M)/hamhos/meter mhos/mmicromhos/centimeter µMhos/cmmicroSiemen/centimeter µS/cm
milligram/liter mg/LmilliSieman/centimeter mS/cm millimhos/centimeter mMhos/cmnitrate NO3
–
Nitrogen N
ounce ozparts per million PPM or ppmphosphate PO4
3–
phosphorus Pphosphorus pentoxide P2O5
pound lbpound/acre lb/acrequart qtquintal qSiemen/meter S/m
square foot ft2
square kilometer km2
square meter m2
square mile mile2
yard yd
COMMON UNITS OF MEASURE AND THEIR ABBREVIATIONS

To convert To convertcolumn 1 to column 2 tocolumn 2 column 1Multiply by: Column 1 Column 2 Multiply by
Length1.094 m yd 0.9140.394 cm in. 2.538
Area2.471 ha acre 0.4050.386 km2 mile2 2.591427.100 km2 acre 0.00234
Volume0.010 m3 acre in. 102.83.532 hl ft3 0.2832.838 hl bu. 0.3520.028 l bu. 35.211.057 l qt. 0.946
Mass1.102 ton (metric) ton (English) 0.9072.205 q (quintals) cwt. 0.4542.205 kg lb. 0.454453.800 g lb. 0.0020.035 g oz. 28.571
Yield0.446 ton(M)/ha ton (E)/ha 2.2420.891 kg/ha lb/acre 1.1220.891 a/ha cwt/acre 1.1221.150 hl/ha bu/acre 0.870
Electrical Conductivity (EC)
1.000 S/m Mhos/m 1.01.000 dS/m mMhos/cm 1.01.000 mS/cm mMhos/cm 1.01.000 µS/cm microMhos/cm 1.00.001 µS/cm mS/cm 10000.001 µS/cm dS/m 1000
Miscellaneous1.000 mg/l ppm 1.02.000 ppm lbs/AFS* 0.50.449 kg/ha ppm 2.2270.898 kg/ha lbs/AFS 1.1140.226 NO3
– N 4.4310.326 PO4
3– P 3.0670.437 P2O5 P 2.290
•acre furrow slice
38
CONVENIENT CONVERSION FACTORS

39
GLOSSARY
Absorption—The process of taking in substances (i.e., intakeof water by soil, or intake of gases, water, nutrients, or othersubstances by plants).
Acid—A chemical compound that contributes hydrogen ions(H+) to an aqueous solution.
Acid Soil*—A soil with a pH value below 7.0. A soil that hasa large amount of hydrogen ions (H+) and aluminum ionscompared to hydroxyl ions (OH-) in the soil solution.
Acre Foot—Equivalent to one foot of water covering one acre(equivalent water volume expressions are 43,560 ft3, 2.7 millionlbs, or 326,700 gallons)
Adsorption—The process by which molecules or ions adhereto a surface (i.e., exchangeable ions on soil particles).
Aerobic (soil)—Soils that contain atmospheric oxygen (O2) inthe pore space.
Aggregate*—A group of soil particles cohering so they behaveas a unit.
Alkaline (soil)—A soil with a pH greater than 7.0.
Alkalinity—The basic buffering capacity of a soil. The abilityof soil to resist the effects of hydrogen ions.
Amendment*—Any material (lime, gypsum) that is added to asoil to improve productivity.
Amino Acids—Amino acids have a chain of carbon moleculefor a “backbone”, at least one amino group (NH2) and onecarboxyl group (COOH). Some may also contain sulfur.Proteins are made from amino acids.
H H
N C C OH
H H O
The amino acid glycine
Ammonification—The biochemical conversion of organicnitrogen to inorganic ammonic form.
Anaerobic (soil)—The absence of molecular oxygen (O2).This condition exists in soils when they are flooded orcompacted.
Anion—A negatively charged ion (i.e., NO3–, Cl-, PO4
3–).
Atmosphere (standard)—The pressure exerted by a column ofmercury 760 mm (29.92 in) high. One atmosphere = 14.71lbs/sq. inch (101,325 Pascals), which is normal pressure at sealevel.
Available—The chemical form of a nutrient which can beabsorbed and used by plants. This term should not be confusedwith “exchangeable”.
Available Water (soil)*—The fraction of the water in the soilthat plants can absorb at rates significant to their growth (alsousable or obtainable water).
Base—A chemical compound that contributes hydroxyl ions(OH–) to an aqueous solution.
Buffered (soil)—A soil that contains enough lime or basesaturation to resist change in pH, especially toward acidity.Sandy soils with low cation exchange capacity are low inbuffering capacity; clay soils with high cation exchangecapacity are highly buffered. Soils that contain excess limeare highly buffered against acidity.
Bulk Density—Also called “apparent density”. The mass ofdry soil per bulk volume of the soil, including the air space.Bulk density is expressed in lbs/cubic foot or grams/cubiccentimeter. When expressed as g/cm3, bulk density isnumerically equal to apparent specific gravity or volumeweight. As bulk density increases, the soil porosity (amountof pore space) decreases.
Calcareous (soil)—A soil which is alkaline in pH due to freecalcium carbonate. The soil contains enough calcium carbonate toeffervesce (fizz) when treated with 10% hydrochloric acid.Normally, these soils have a pH range of 7.5–8.4.
Calcium Sulfate Extractant—Reagent used to extract nitratefrom soils. Since nitrates are very soluble in water, the purposeof the calcium sulfate is for easy filtration.
Carbon:Nitrogen Ratio—Compares the amount of carbon ina biochemical system to the amount of nitrogen present. Adecomposable material with a wide C:N ratio (> 40:1) wouldresult in soil nitrate being immobilized.
Cation—A positively charged ion (i.e., NH4+, Ca2+).
Cation Exchange—The interchange between a positive ion inthe soil solution and another positive ion on the surface of a soilparticle (e.g., clay or organic matter).
Cation Exchange Capacity—The total quantity of positiveions a soil can absorb, usually expressed as milliequivalents per100 grams. Measured values of CEC depend on the method ofdetermination. CEC depends on the amount of clay and humusin a soil, the type of clay, and soil pH.
Chelate—Derived from the Greek word “chela”, which meansclaw. Chelates are water-soluble compounds that hold(immobilize) metallic ions. This protects the metal ions frombeing tied up in the soil in forms that plants cannot use.
Chlorosis*—The deficiency of chlorophyll in a plant. Theyellowing of the green portions of a plant, especially the leaves.Chlorophyll gives the plant its green color.
Clay—A soil particle with an average diameter of less than 2microns (0.002 mm). Soil clays are colloidally active and have anegative surface charge that attracts and holds positive ions.
*Soil Improvement Committee, California Fertilizer Assoc., Western Fertilizer Handbook, 7th ed.

40
Clay (soil)—A soil texture class that contains less than 40%sand, less than 40 % silt and greater than 40% clay.
Colloid*—Small soil particles with diameters ranging from0.005-0.200 microns. Colloids in soils (clay and humus) arecharacterized by high cation exchange due to their large surfacearea per mass.
Colorimetric Test—A chemical analysis that measures colorintensity. The substance being measured reacts with the testingchemical(s) and usually produces a color proportional to itsconcentration (higher concentration means more color).
Conductivity—The tendency of a medium (soil, water) totransmit electricity. The standard unit of conductivity is theSiemen. Soil solution conductivity is often expressed inmilliSiemens/cm. The conductivity of water is often expressedin microSiemens/cm.
Conventional Irrigation—Watering practice which allows thesoil to dry out significantly between waterings.
Coring Tube—A metal tube used to obtain soil samples.
DeciSiemens per meter—A unit of conductivity equal tommhos/cm.
Deionized Water—Water purified with ion exchange resins.Deionized water is often used in chemical analyses.
Denitrification—Process by which nitrate (NO3–) is
transformed to atmospheric nitrogen (N2). The N2 gas is lostfrom the soil to the air, decreasing the nitrogen in the soil. Thisprocess occurs in anaerobic soils.
Dispersed soil—Soil in which the clay easily forms a colloidsoil. Dispersed soils usually do not absorb water well. Theyshrink, crack and become hard when they dry. They slake (runtogether to form an impermeable film) and become plasticwhen they are wet. These soils are usually the result of highexchangeable sodium percentage.
Drainage—The discharging of water from soil by surface flowand removal of excess water by downward flow thorough thesoil. Includes both natural and artificial water removal.
Dry Weight Basis—a way to express the mineral compositionof a plant based on the weight of the plant without moisture.Dry weight is more accurate because the moisture content ofplants is variable. If a 100 lbs (45 kg) hay bale contains 8 lbs(3.5 kg) moisture, 92 lbs (41.4 kg) dry matter and 0.3 lbs (0.135kg) of phosphorus, the concentration of phosphorus on a dryweight basis is 0.3/92 = 0.326% (0.135/41.4 = 0.362%)
Electrical Conductivity (EC)—The reciprocal of electricalresistivity. The ability of a solution to conduct current. Inwater, EC depends on the concentration of ions (dissolvedsalts). The term “electrical conductance” is the same as EC.
Equivalent or Equivalent Weight—The weight (grams) of anion or compound that combines with or replaces 1 gram ofhydrogen. The atomic weight or formula weight divided by itsvalence.
Essential Nutrient (plant)*—A compound is essential to plantif, in its absence, the plant cannot survive. In some cases, theplant can survive if another compound can be substituted for theabsent compound.
Evapotranspiration—The loss of water from a soil byevaporation and plant transpiration.
Exchange Complex—The surface-active particles in soils thatexchange cations.
Exchangeable Ion*—Ions held in the soil that can be replacedby other ions that have the same charge. Ions which are held sotightly they cannot be exchanged are nonexchangeable.
Exchangeable Sodium—The sodium in a soil held by thenegative charges of the soil colloids. As soils increase inexchangeable sodium, they become progressively lesspermeable to water.
Exchangeable Sodium Percentage—The percentage ofsodium that makes up the exchangeable cations in the soilcomplex.
Extract—The solution that results from combining a soilextractant and the soil.
Extractant—The solvent or chemical used to bring availablenutrients into solution out of the soil. Extractants areformulated to dissolve out specific substances, depending onanalytical requirements.
Fertility—A measure of a soil’s ability to grow a commercialcrop.
Fertilizer*—Any natural or manufactured material added to asoil to supply one or more plant nutrients. The term usually refersto inorganic material other than lime or gypsum.
Field Moisture Capacity—The moisture content of soil in thefield 2-3 days after a thorough wetting of the soil profile andafter free drainage has almost stopped. Field capacity isexpressed as moisture percentage, dry-weight basis (how muchwater per unit weight of soil).
Flocculation—The amount of clay dispersion in a soil.Calcium and magnesium tend to open (flocculate) soils. Sodiumtends to close (deflocculate) the soil.
Formula Weight—The sum of the atomic weights of theelements in a compound.
Free Lime Estimation—A simple test using acid to determineif a soil has excess carbonates. The test is positive ifeffervescence (fizzing) occurs when acid is added to the soilsample.
*Soil Improvement Committee, California Fertilizer Assoc., Western Fertilizer Handbook, 7th ed.

41
Ground Water—Water in the soil under the soil surface thatfills the pores of material underneath the water table. Thisusually occurs when the pressure holding the water in the soil isgreater than the atmospheric pressure and the soil spaces aremostly filled with water.
Gypsum Requirement—The amount of 100% CaSO4(measured in tons/acre or metric tons/hectare) needed toeliminate the exchangeable sodium in the soil.
Gypsum*—The common name for calcium sulfate (CaSO4), amineral used as a source of calcium and sulfur. Gypsum is alsoused in reclaiming sodium affected soils.
High Frequency Irrigation—Watering practice in which thesoil does not dry much between waterings. Crops irrigated withthis management can tolerate higher salinity irrigation waterthan crops irrigated with conventional methods.
Humus—The organic matter that remains after initial decay ofplant and animal tissues. Most of the soil nitrogen is stored inthe humus. As humus slowly decays, nitrogen is released andbecomes available to plants. Humus is about 5% nitrogen byweight.
Hydrolysis—The dissolution of a non-neutral salt resulting in apH change.
Industrial Fixation—Conversion of atmospheric nitrogen toanhydrous ammonia.
Infiltration—The downward flow of water into the soil.
Infiltration Rate—The maximum rate at which a soil canabsorb water, under certain circumstances, including an excessof water. It is the volume of water passing into the soil per unitof area over a unit of time.
Ions—Elements that are electrically charged due to loss or gainof an electron. An element that gains an electron becomesnegatively charged (anion); an element that loses an electronbecomes positively charged.
Leaching—removal of soluble substances by passing waterthrough the soil.
Leaching Fraction—The portion of irrigation water thatleaches through the effective root zone.
Leaching Requirement—The fraction of irrigation water thatmust pass through the root zone to prevent soil salinity fromexceeding a specific value. Leaching requirement is usuallyused under steady-state or long term average conditions.
Lime—Strictly speaking, lime is calcium oxide (CaO), butcommonly used in agriculture to mean calcium carbonate(CaCO3) and calcium hydroxide Ca(OH)2.
Lime Requirement—The amount of 100% CaCO3 needed toraise the soil pH to 6.5 or to 7.0 (usually measured as tons/acreor metric tons/hectare).
Loam Soil—A soil textural class that contains moderateamounts of sand (> 52%), silt (28-50%) and clay (7-27%).
Macronutrients*—Nutrients that plants require in largeamounts.
Matric Potential—The negative pressure in soil water createdby the adsorption of water to the soil particles.
Micronutrients*—Nutrients that plants require in smallamounts.
Microsiemens per centimeter (µS/cm)—A measure ofconductivity equivalent to 1/1000 milliSiemens per centimeter.
Milliequivalent per Liter (meq/L)—A milliequivalent of anion or a compound in 1 liter of solution. This unit is often usedin irrigation water analysis to quantify the concentration ofcations and anions.
Milliequivalent—one thousandth of an equivalent. Anequivalent is the amount of a substance equal in reactive powerto 1 mole of hydrogen ions.
Milliequivalent Weight—The milligram formula weight of anion or ionic compound divided by its valence.
Milligram per Liter (mg/l)—A concentration unit expressedas the milligrams of dissolved substance in 1 liter of solution.The unit mg/l is equal to parts per million.
MilliSiemens per Centimeter (mS/cm)—a measure ofconductivity equal to 1000 microSiemens per centimeter.
Mineralization—Transforming of a nutrient from organic toinorganic form by microbes in the soil.
Neutral (soil)—Soil with a pH of 7.0. A soil that is neither acidor alkaline.
Nitrification—Aerobic microbial conversion of ammoniumnitrogen to nitrite and then to nitrate.
Nitrogen Fixation—Conversion of nitrogen gas to a form thatis available to plants.
Nitrogen Requirement—The actual amount of nitrogen neededby a plant for desired growth. Determined by multiplying the yieldgoal (bushels/acre or hl/ha) by the amount of nitrogen required toproduce one bushel. Nitrogen requirement is not the same asnitrogen fertilizer recommendation. The fertilizer recommendationis determined by taking the difference of the nitrogen requirementminus the soil nitrogen sources (manure, residual nitrate, etc.).
Non-symbiotic Fixation—Conversion of atmospheric nitrogento protein by soil microbes.
*Soil Improvement Committee, California Fertilizer Assoc., Western Fertilizer Handbook, 7th ed.

42
Organic Matter—The solid fraction of the soil that is non-mineral. This includes the living organisms, fresh tissue, andhumus.
Osmotic Pressure—The tendency of a fluid to pass through asemipermeable membrane into a solution which has a higherconcentration of solids or ions, making the concentration of thesolids or ions equal on both sides of the membrane.
Particle Density—The average density of the soil particles,usually expressed in grams/cubic centimeter. It is also called“real density” or “grain density”. The average particle densityof most mineral soils is 2.65 g/cm3.
Parts per Million—Unit of measure used to express theavailable nutrient concentration in soil. One ppm is equivalent to 2lbs/acre (2.2 kg/ha) if the soil sample is taken at the depth of theplow layer. ppm is chemically equivalentto mg/L.
Percent Base Saturation—The percentage of the cationexchange capacity that is due to base cations (calcium,magnesium, sodium, and potassium).
Percolation—The downward movement of water through soil,especially in saturated or nearly saturated soil. This is aqualitative term.
Permanent Wilting Percentage—The moisture percentage atwhich plants wilt and cannot recover tissue rigidity. Significantfor non-saline soils only since salinity can cause permanentwilting at higher moisture percentages than the permanentwilting percentage.
Permeability—1) Qualitative–How well a porous medium willconduct, absorb, or transmit a fluid. 2) Quantitative–The property that controls the rate with which a porous mediumtransmits fluids under standard conditions.
pH—A numerical expression of the acidity, neutrality, oralkalinity of a system. The pH of soils is often called the “soilreaction”.
Photosynthesis*—The process in green plants that combineswater and carbon dioxide to form carbohydrates which requiresenergy from light (sun). Chlorophyll is required to convert thelight energy into chemical energy.
Plant Nutrition—The biochemical process of absorption,assimilation, and utilization of essential compounds for plantgrowth and reproduction.
Porosity—The fraction of soil volume that is not occupied bysoil particles. It is the volumes of the liquids and gasescompared to the volumes of the solids, liquids, and gases of thesoil.
Profile—A vertical cross-section of a soil. Often the varioushorizons (topsoil, subsoil, parent material) can be seen andclassified in the profile.
Reclamation—The removal of excess soluble salts orexchangeable sodium from soils.
Residual Nitrate—The nitrate-nitrogen remaining in the soilafter harvest.
Saline (soil)—A nonsodic soil that contains soluble salts inquantities that interfere with the growth of most crops.
Saline-Sodic (soil)—A soil that contains enough exchangeablesodium to interfere with the growth of most crops and alsocontains large amounts of soluble salts.
Salinity—The amount of dissolved salts in a medium (as in“the salinity of the soil”).
Salinization—The accumulation of soluble salts in soil.
Salt Affected Soil—A soil that contains enough soluble salts,and/or exchangeable sodium to interfere with normal plantgrowth. Salt affected soils are usually categorized into threegroups: 1) saline, 2) sodic, and 3) saline-sodic.
Sand—A soil mineral particle that is between 0.05 and 2.0 mmin diameter.
Sand (soil)*—The textural name of any soil that contains 85%or more sand and not more than 10% clay.
Saturated Soil Paste—A mixture of soil and water. Atsaturation, the soil paste will glisten, flow slightly when thecontainer is tipped, and the paste will slide freely and cleanlyfrom a spatula (except soils with a high clay content).
Saturation Extract—The solution extracted from a soil at itssaturation percentage.
Saturation Percentage—The moisture percentage of a soilpaste, expressed on a dry-basis weight. For example, if 100grams of soil contains 36 grams of water at saturation, thesaturation percentage is 36%.
Separate (soil)—One of the three sized mineral particles thatmake up soil texture. The soil separates are sand, silt, and clay.
Silt—A soil mineral particle between 0.002 and 0.05 mm indiameter.
Silt (soil)—Soil textural class contain 80% or more silt and lessthan 12% clay.
Sodic Soil—A nonsaline soil containing enough exchangeablesodium to interfere with growing most crops.
Sodicity—The level of exchangeable sodium and its influenceon a soil.
Sodium Adsorption Ratio—A ratio that expresses the relativeactivity of sodium ions in exchange reactions with soil. Usedfor both soil and irrigation water.
*Soil Improvement Committee, California Fertilizer Assoc. Western Fertilizer Handbook, 7th ed.

43
Sodium Estimation—In irrigation water, the estimation ofsodium is calculated from known conductivity and calcium andmagnesium values using this formula:
Est. Sodium meq/L = ECiw mS/cm x 10 – (Ca + Mg meq/L)
Soil Moisture Stress—The sum of the soil-moisture tensionand the osmotic pressure of the soil solution.
Soil Moisture Tension— The equivalent negative pressure orsuction of water in soil. Tension and suction are negativepotentials, which means they reduce the free flow of water inthe soil.
Soil Solution—Water in the soil that contains dissolved saltsand nutrients.
Standard—A solution of known concentration used tocalibrate or prove an analytical procedure is accurate and valid.
Structure (soil)*—The physical arrangement of the soilparticles. Soil structure is important for adequate root growthand water percolation.
Subsoil*—Generally, that part of the soil below the plowdepth. Subsoil is usually lower in organic matter and has lessoxygen than topsoil.
Symbiosis*—The living together of two different organismsthat may result in mutual benefit.
Symbiotic Fixation—Conversion of atmospheric nitrogen toprotein by heterotrophic bacteria living in association with ahost legume.
Texture (soil)*—The relative proportions of the various sizegroups of individual soil grains (separates) in a soil.Specifically, it refers to the proportions of sand, silt, and clay.
Threshold Salt Tolerance (crop)—The conductivity of thesaturated paste extract at which a plant experiences reduction ingrowth.
Tilth*—The physical condition of a soil which allows thegrowth of plants.
Titrant—A standard solution of known concentration andcomposition used in a titration to bring about the endpoint. Inthe Ca+Mg (hardness) test, the titrant is the chelate EDTA.
Titration—A method for analyzing the composition of asolution by adding a known amount of standardized solution(titrant) until a reaction (color change, precipitation, conductivitychange) occurs. The volume of solution added indicates theconcentration of the substance being analyzed.
Topsoil—The upper horizon of a soil profile that is usually theplowed layer in soils that are farmed. Topsoils are more aeratedand higher in organic matter than the soil layers below it.
Total Exchangeable Acidity—The amount of exchangeableH+ and Al3+ in a soil.
Transpiration*—The loss of water vapor from the leaves andstems of living plants into the air.
Volatilization—Relative to soil nitrogen, the loss of nitrogen asa gas from the soil.
Water Table—The upper boundary of groundwater.
*Soil Improvement Committee, California Fertilizer Assoc., Western Fertilizer Handbook, 7th ed.
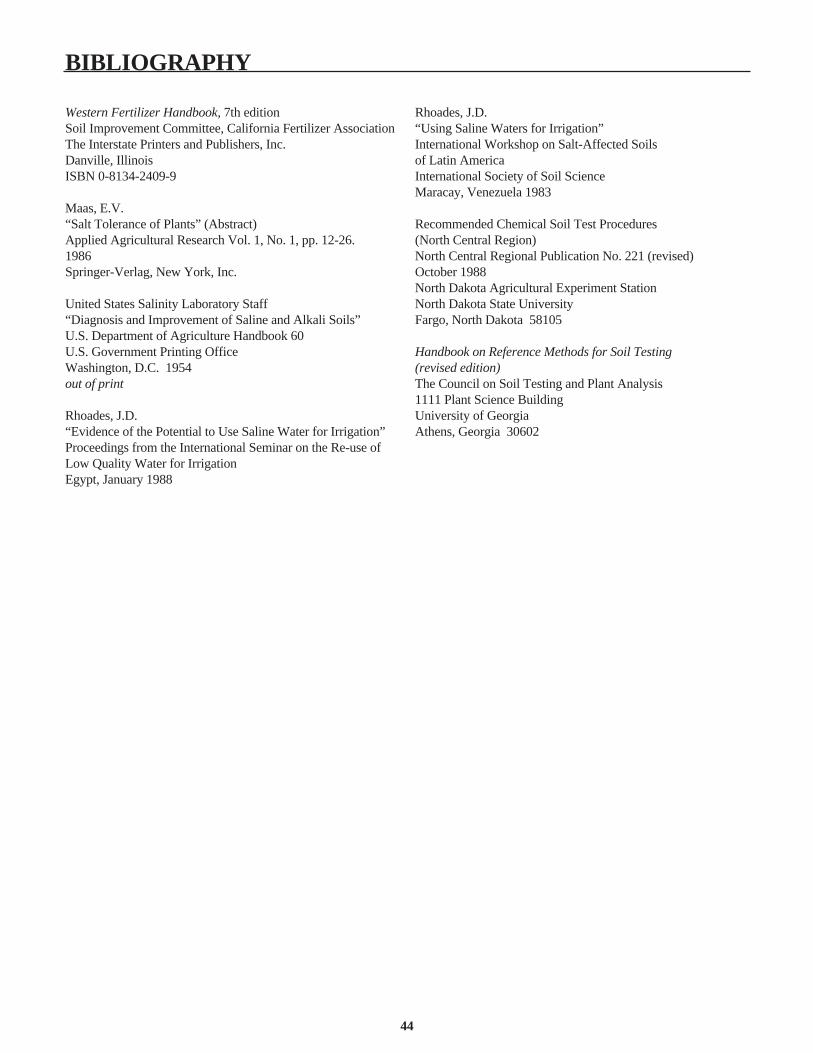
BIBLIOGRAPHY
44
Western Fertilizer Handbook, 7th editionSoil Improvement Committee, California Fertilizer AssociationThe Interstate Printers and Publishers, Inc.Danville, IllinoisISBN 0-8134-2409-9
Maas, E.V.“Salt Tolerance of Plants” (Abstract)Applied Agricultural Research Vol. 1, No. 1, pp. 12-26.1986Springer-Verlag, New York, Inc.
United States Salinity Laboratory Staff“Diagnosis and Improvement of Saline and Alkali Soils”U.S. Department of Agriculture Handbook 60U.S. Government Printing OfficeWashington, D.C. 1954out of print
Rhoades, J.D.“Evidence of the Potential to Use Saline Water for Irrigation”Proceedings from the International Seminar on the Re-use ofLow Quality Water for IrrigationEgypt, January 1988
Rhoades, J.D.“Using Saline Waters for Irrigation”International Workshop on Salt-Affected Soils of Latin AmericaInternational Society of Soil ScienceMaracay, Venezuela 1983
Recommended Chemical Soil Test Procedures (North Central Region)North Central Regional Publication No. 221 (revised)October 1988North Dakota Agricultural Experiment StationNorth Dakota State UniversityFargo, North Dakota 58105
Handbook on Reference Methods for Soil Testing (revised edition)The Council on Soil Testing and Plant Analysis1111 Plant Science BuildingUniversity of GeorgiaAthens, Georgia 30602