s i acid does the trick! augmentation of the … files1 supporting information augmentation of the...
TRANSCRIPT
S1
SUPPORTING INFORMATION
Augmentation of the Productivity in Olefin Cross-Metathesis: Maleic Acid does the Trick!
Leonildo A. Ferreira, Henri S. Schrekker*
Laboratory of Technological Processes and Catalysis, Institute of Chemistry, Universidade Federal do Rio Grande do Sul, Av. Bento Gonçalves 9500, Porto Alegre, RS, 91501-970, Brazil. e-mail: [email protected]
Figure S1 Time-dependent plots of the effect of the MO purification procedure on the product distribution in the CM of MO with MA-H catalyzed by GII .................................S2
Figure S2 Typical chromatogram obtained in the cross-metathesis of MO with MA-H (after derivatization). ......................................................................................................S3
Table S1 Effect of the catalyst on the CM of MO with MA-H. ........................................S4
Table S2 Composition of the vegetable oils used..........................................................S4
Figure S3 Typical 1H NMR spectrum of a vegetable oil with the signal attributions and the formulae used to calculate the molecular weight and number of C-C double bonds per triglyceride................................................................................................................S5
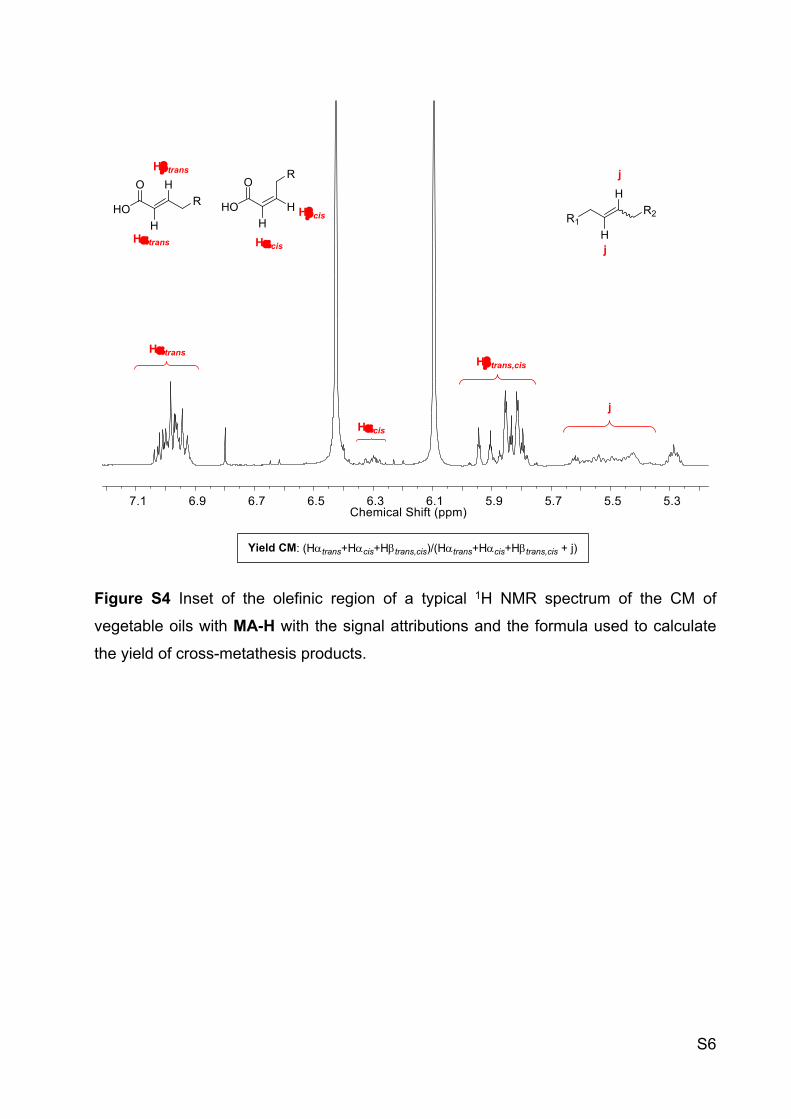
Figure S4 Inset of the olefinic region of a typical 1H NMR spectrum of the CM of vegetable oils with MA-H with the signal attributions and the formula used to calculate the yield of cross-metathesis products...........................................................................S6
Spectra ..........................................................................................................................S7
Electronic Supplementary Material (ESI) for Catalysis Science & Technology.This journal is © The Royal Society of Chemistry 2016
S2
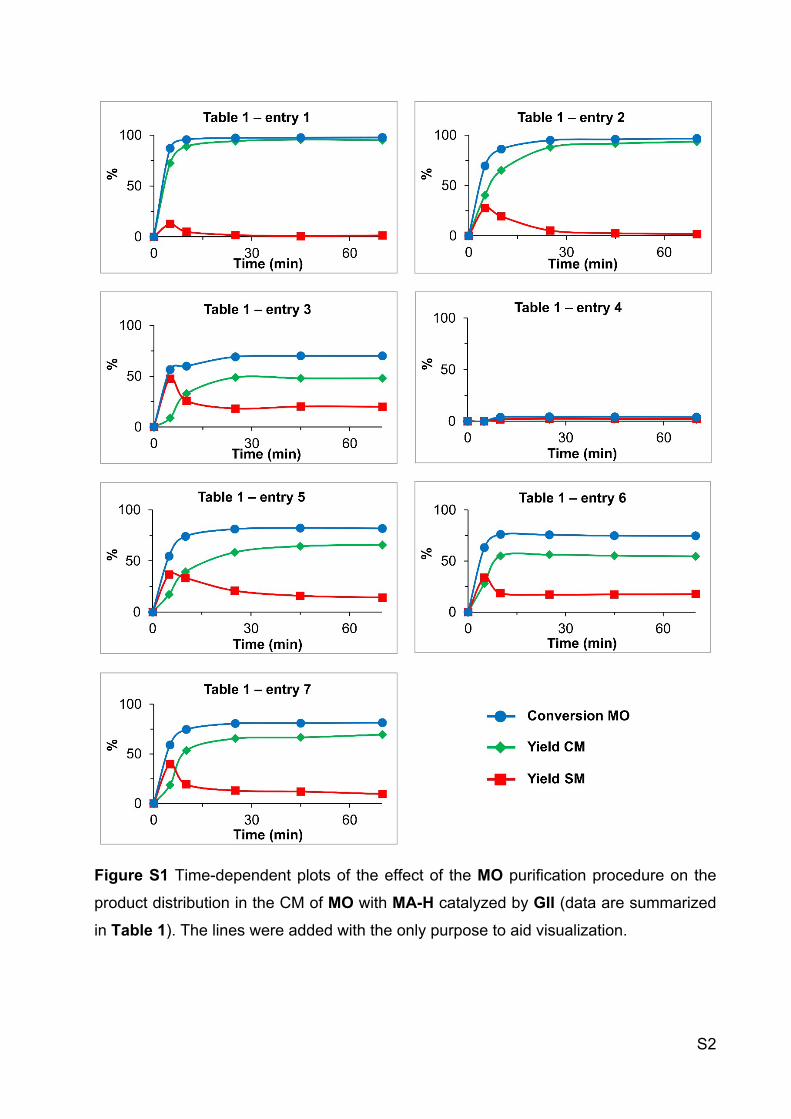
Figure S1 Time-dependent plots of the effect of the MO purification procedure on the
product distribution in the CM of MO with MA-H catalyzed by GII (data are summarized
in Table 1). The lines were added with the only purpose to aid visualization.
S3
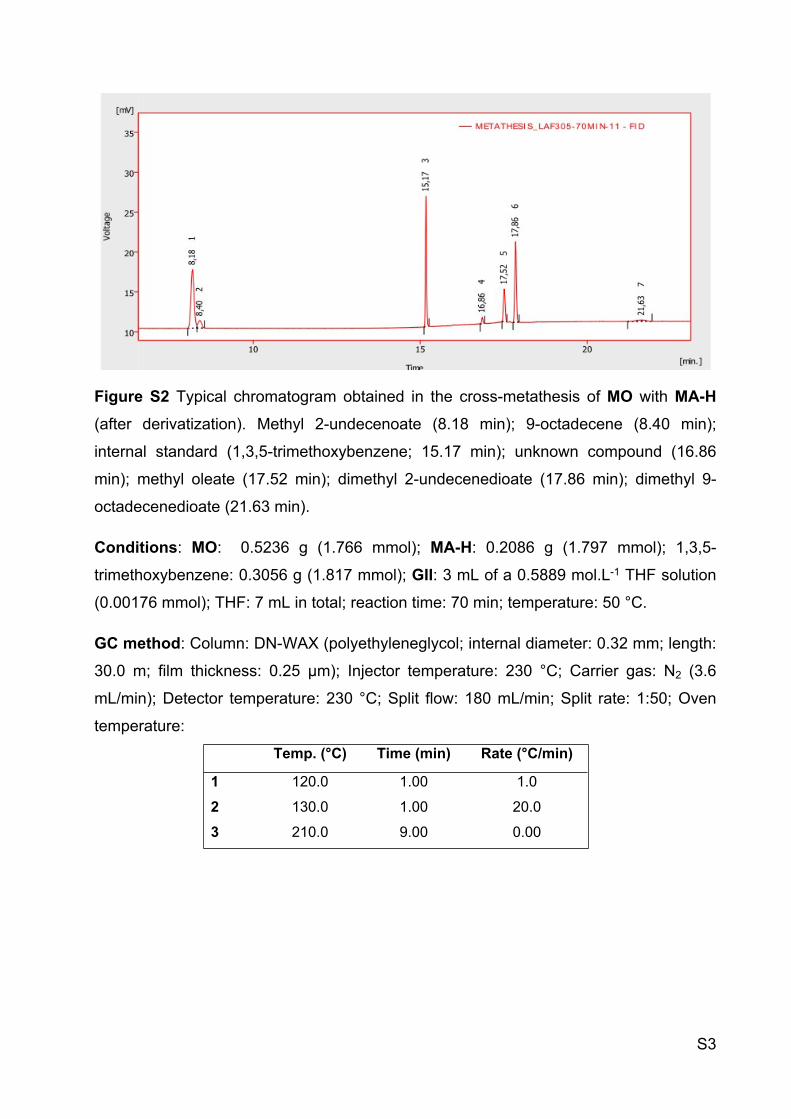
Figure S2 Typical chromatogram obtained in the cross-metathesis of MO with MA-H
(after derivatization). Methyl 2-undecenoate (8.18 min); 9-octadecene (8.40 min);
internal standard (1,3,5-trimethoxybenzene; 15.17 min); unknown compound (16.86
min); methyl oleate (17.52 min); dimethyl 2-undecenedioate (17.86 min); dimethyl 9-
octadecenedioate (21.63 min).
Conditions: MO: 0.5236 g (1.766 mmol); MA-H: 0.2086 g (1.797 mmol); 1,3,5-
trimethoxybenzene: 0.3056 g (1.817 mmol); GII: 3 mL of a 0.5889 mol.L-1 THF solution
(0.00176 mmol); THF: 7 mL in total; reaction time: 70 min; temperature: 50 °C.
GC method: Column: DN-WAX (polyethyleneglycol; internal diameter: 0.32 mm; length:
30.0 m; film thickness: 0.25 µm); Injector temperature: 230 °C; Carrier gas: N2 (3.6
mL/min); Detector temperature: 230 °C; Split flow: 180 mL/min; Split rate: 1:50; Oven
temperature:
Temp. (°C) Time (min) Rate (°C/min)
1 120.0 1.00 1.0
2 130.0 1.00 20.0
3 210.0 9.00 0.00

S4
Table S1 Effect of the catalyst on the CM of MO with MA-H.
Yield (%)Entry Cat.
Temp. (°C)
Conv. (%) CM SM
13a GII 40 94 85 614a GII 50 93 84 615a,b GII 60 92 82 716a GII reflux 90 77 1217 HGII 50 82 57 21
17b HGII 60 88 69 15
19 HGII reflux 82 60 20
20b IndII 60 90 73 13
21b Um42 60 56 14 41
22 Um42 reflux 60 17 42
Conditions: MO:MA-H molar ratio = 1:2 (MO = 1.77 mmol); Cat. = 0.05 mol%; THF =
1.5 mL; purification method D. Isomerization products complete the mass balance. a
values plotted in Figure 6. b Values plotted in Figure 7.
Table S2 Composition of the vegetable oils used.
%a
OilC18:1 C18:2 C18:3 C16:1 C18:0 C16:0 Others
Canola 62.5 21.5 8.7 0.2 2.4 4.7 7.1
Linseed 22.3 15 52.8 0.1 4.1 5.7 9.8
Sunflower 40.1 47.7 1.5 0.1 3.1 7.6 10.6
Grapeseed 20.5 68.2 0.3 0.1 3.7 7.2 10.9
Corn 34.2 51.3 0.8 0.1 0.9 12.7 13.6
Soybeam 23.2 55.9 6.4 0 3 11.5 14.5
Olive 78.3 6.2 0 0.7 3 11.7 14.8
Peanut 52.3 31.9 0 0.2 3 12.5 15.6
Rice 41.6 35.5 1.8 0.1 1.6 19.4 21
Cottonseed 15.3 59 0.1 0.4 2 23.2 25.2
Palm 55.4 12.7 0 0.2 3 28.7 31.7a Calculated by GC.
S5
0.00.51.01.52.02.53.03.54.04.55.05.56.06.57.07.5Chemical Shift (ppm)
a
b
c
de
f
g
h
i+j
O
O
O
O
O
O
ac
d
ef
g
hj
a
cd
ef
gh
i
j
b
c
d
ef
j j
j j
j j
j j j j
g
e
e
e
c
c
*
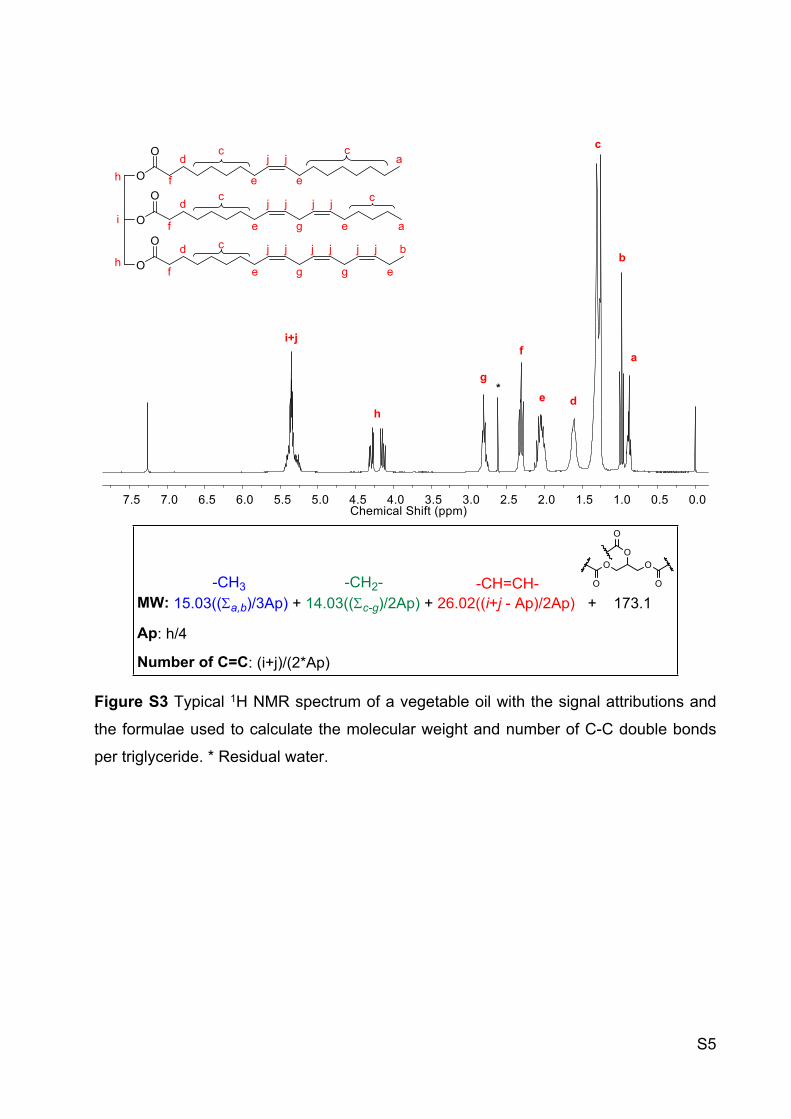
MW: 15.03((a,b)/3Ap) + 14.03((c-g)/2Ap) + 26.02((i+j - Ap)/2Ap) + 173.1
Ap: h/4
-CH3 -CH2- -CH=CH-
Number of C=C: (i+j)/(2*Ap)
OO
O
OO
O
Figure S3 Typical 1H NMR spectrum of a vegetable oil with the signal attributions and
the formulae used to calculate the molecular weight and number of C-C double bonds
per triglyceride. * Residual water.
S6
5.35.55.75.96.16.36.56.76.97.1Chemical Shift (ppm)
HO
OR HO
OR
R1R2
Htrans
Htrans
Hcis
Hcis
j
H
H
HH
H
H
j
HtransHtrans,cis
jHcis
Yield CM: (Htrans+Hcis+Htrans,cis)/(Htrans+Hcis+Htrans,cis + j)
Figure S4 Inset of the olefinic region of a typical 1H NMR spectrum of the CM of
vegetable oils with MA-H with the signal attributions and the formula used to calculate
the yield of cross-metathesis products.

S7
SpectraMA-iPent
0.00.51.01.52.02.53.03.54.04.55.05.56.06.57.07.58.08.59.09.510.0f1 (ppm)
12.4
6
4.09
2.10
4.09
2.00
0.03
0.87
0.89
4.15
4.17
4.18
6.18
6.79
1.501.551.601.651.70f1 (ppm)
1.49
1.51
1.53
1.54
1.59
1.60
1.62
1.64
1.66
1.67
1.69
1.71
1.72
0102030405060708090100110120130140150160170180190200f1 (ppm)
22.4
024
.97
37.0
8
63.8
9
129.
7813
3.59
165.
31
di-isopentylfumarate
di-isopentylfumarate
OO
O O

S8
4000 3500 3000 2500 2000 1500 1000 5000,2
0,4
0,6
0,8
1,0Tr
ansm
itanc
e
(cm-1)
OO
O O
OO
O OH+
OO
O ONa+

S9
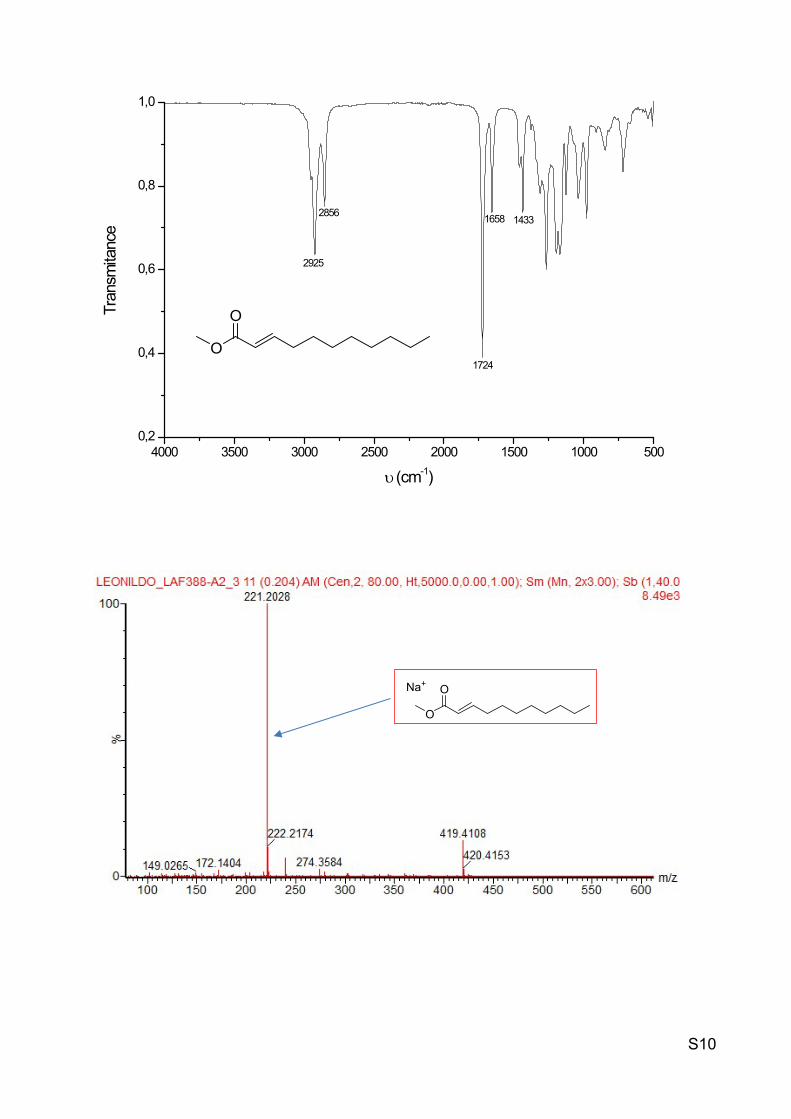
Methyl (E)-undec-2-enoate
0.01.02.03.04.05.06.07.08.09.010.0Chemical Shift (ppm)
3.00
10.0
32.
33
2.14
3.03
1.03
1.00
0.85
0.88
0.90
1.27
1.32
1.40
1.42
1.45
1.47
3.72
5.856.907.05Chemical Shift (ppm)
5.78
5.79
5.79
5.83
5.84
5.84
6.92
6.94
6.97
6.97
7.00
7.02
2.152.202.25Chemical Shift (ppm)
2.15
2.16
2.18
2.18
2.20
2.20
2.22
2.23
1H NMR (300 MHz, CDCl3) δ 6.97 (dt, J = 15.6, 7.0 Hz, 1H), 5.81 (dt, J = 15.6, 1.5 Hz, 1H), 3.72 (s, 3H), 2.19 (qd, J = 7.0, 1.5 Hz, 2H), 1.51 – 1.36 (m, 2H), 1.38 – 1.16 (m, 10H), 0.88 (t, J = 6.7 Hz, 3H).
0102030405060708090110130150170Chemical Shift (ppm)
14.2
222
.79
28.1
729
.28
29.3
329
.49
31.9
832
.37
51.5
1
76.7
477
.16
77.5
8
120.
94
149.
99
167.
36
13C NMR (75 MHz, CDCl3) δ 167.36, 149.99, 120.94, 51.51, 32.37, 31.98, 29.49, 29.33, 29.28, 28.17, 22.79, 14.22.
O
O
S10
4000 3500 3000 2500 2000 1500 1000 5000,2
0,4
0,6
0,8
1,0Tr
ansm
itanc
e
(cm-1)
1724
2925
2856 1658 1433
O
O
O
ONa+

S11
Dimethyl (E)-undec-2-enedioate
0.01.02.03.04.05.06.07.08.09.010.0Chemical Shift (ppm)
6.68
2.15
2.56
2.07
2.11
3.09
3.08
1.01
1.00
1.27
1.33
1.35
1.45
1.47
1.48
1.60
1.62
1.63
1.65
1.67
3.68
3.74
5.805.856.957.00Chemical Shift (ppm)
5.81
5.81
5.85
5.85
5.86
6.94
6.96
6.98
6.98
7.00
7.02
2.202.30Chemical Shift (ppm)
2.18
2.18
2.20
2.20
2.22
2.22
2.23
2.24
2.30
2.32
2.34
1H NMR (400 MHz, CDCl3) δ 6.98 (dt, J = 15.6, 7.0 Hz, 1H), 5.83 (dt, J = 15.6, 1.6 Hz, 1H), 3.74 (s, 3H), 3.68 (s, 3H), 2.32 (t, J = 7.5 Hz, 2H), 2.21 (qd, J = 7.0, 1.6 Hz, 2H), 1.74 – 1.54 (m, 2H), 1.54 – 1.39 (m, 2H), 1.39 – 1.25 (m, 6H).
020406080100120140160180200220Chemical Shift (ppm)
25.0
228
.07
29.0
429
.13
32.2
934
.19
51.5
151
.59
121.
02
149.
78
167.
31
174.
37
13C NMR (75 MHz, CDCl3) δ 174.37, 167.31, 149.78, 121.02, 51.59, 51.51, 34.19, 32.29, 29.13, 29.04, 28.07, 25.02.
O
O
O
O

S12
4000 3500 3000 2500 2000 1500 1000 5000,2
0,4
0,6
0,8
1,0Tr
ansm
itanc
e
(cm-1)
2929
2852
1720
1656
1435
O
O
O
O
O
O
O
ONa+