s-ge foreign trade vademecum 2013
DESCRIPTION
The Vademecum comprises facts & figures on Swiss foreign trade (exports and imports) as well as on the worldwide trade in goods and services. The handy reference book offers data on worldwide foreign direct investments as well as on Switzerland Global Enterprise’s official network abroad.TRANSCRIPT

Foreign Trade Vademecum
2013 Edition
Osec renamed Switzerland
Global Enterprise as of
14 May 2013

SwiSS economic key FigureS 3
global View 4
Worldwide export development by region 4
Worldwide largest exporters 4
Worldwide import development by region 5
Worldwide largest importers 5
SwiSS Foreign Trade 6
Swiss company landscape 6
Development of Swiss foreign trade 6
Exports by destination country 7
Imports by country of origin 8
Exports by sector 9
Imports by sector 9
direcT inVeSTmenTS 10
Foreign countries with the largest capital stocks 10
Direct investments Switzerland/abroad 10
Swiss capital stock by region 11
Swiss capital exports by region 12
Personnel at Swiss companies abroad by region 13
SerViceS oF SwiTzerland global enTerpriSe 14
Export Promotion 14
Import Promotion 14
Investment Promotion 15
Global Network 16
Switzerland in international comparison 18
SME Export Indicator 18
Table of contents

3
Swiss economic key figures
key FigureS economy 2010 2011 2012
GDP (nominal)1 in billion CHF 574.31 586.78 592.81
GDP (nominal) per capita1 in CHF 72,905 74,160 *74,140
GDP growth (real)1 3.0% 1.9% 1.0%
Inflation rate1 0.7% 0.2% -0.7%
Unemployment rate1 3.5% 2.8% 2.9%
counTry 2009 2010 2011
greatest agglomerations2 per thousand inhabitants
Zurich 1,170.2 1,188.6 1,204.0
Geneva 521.4 526.4 530.7
Basel 498.0 497.7 500.6
Berne 350.8 353.3 355.6
Lausanne 330.9 336.4 342.2
largest cities2
per thousand inhabitants
Zurich 368.7 372.9 377.0
Geneva 186.0 187.5 188.2
Basel 166.2 163.2 164.5
Lausanne 125.9 127.8 129.4
Berne 123.5 124.4 125.7
populaTion3 2012
permanent resident population per thousand inhabitants 8,036.9
age groups in % (2011)
0 – 19 years 20.6%
20 – 39 years 26.7%
40 – 64 years 35.5%
65 years and older 17.2%
1 Source: Federal Statistical Office (FSO), State Secretariat for Economic Affairs (SECO) * Estimate
2 Source: Federal Statistical Office (FSO), ESPOP (until 2009), STATPOP (from 2010) 3 Source: Federal Statistical Office (FSO), STATPOP, BEVNAT, ESPOP, SCENARIO

7 16
54
3
2
Global view
exporTS
worldwide exporT deVelopmenT by region
year 1953 1973 1993 2011
Europe 39.4% 50.9% 45.4% 37.1%
Asia 13.4% 14.9% 26.1% 31.1%
North America 24.8% 17.3% 18.0% 12.8%
Middle East 2.7% 4.1% 3.5% 6.9%
South and Central America 9.7% 4.3% 3.0% 4.2%
Africa 6.5% 4.8% 2.5% 3.4%
Miscellaneous 3.5% 3.7% 1.5% 4.5%
Total in billion uSd 84 579 3,676 17,779 Source: WTO 2012
worldwide largeST exporTerS 2011 in billion uSd
1. China 1,899
2. USA 1,481
3. Germany 1,474
4. Japan 823
5. The Netherlands 660
6. France 597
7. South Korea 555
23. Switzerland 235 Source: WTO 2012
1 Europe 37,1%
2 Asia 31,1%
3 North America 12,8%
4 Middle East 6,9%
5 South and Central America 4,2%
6 Africa 3,4%
7 Miscellaneous 4,5% Source: WTO 2012

7 165
4
3
2
imporTS
worldwide imporT deVelopmenT by region
year 1953 1973 1993 2011
Europe 43.7% 53.3% 44.6% 38.1%
Asia 15.1% 14.9% 23.7% 30.9%
North America 20.5% 17.2% 21.4% 17.2%
South and Central America 8.3% 4.4% 3.3% 4.0%
Middle East 2.0% 2.6% 3.3% 3.7%
Africa 7.0% 3.9% 2.6% 3.1%
Miscellaneous 3.4% 3.7% 1.1% 3.0%
Total in billion uSd 85 594 3,786 18,000 Source: WTO 2012
worldwide largeST imporTerS 2011 in billion uSd
1. USA 2,265
2. China 1,743
3. Germany 1,254
4. Japan 854
5. France 715
6. UK 636
7. The Netherlands 597
23. Switzerland 208 Source: WTO 2012
5
1 Europe 38,1%
2 Asia 30,9%
3 North America 17,2%
4 South and Central America 4,0%
5 Middle East 3,7%
6 Africa 3,1%
7 Miscellaneous 3,0% Source: WTO 2012

Swiss foreign trade
SwiSS company landScape ToTal companieS in SwiTzerland 312,861 100%
large companies with > 250 employees 1,154 0.4%
SMEs with < 250 employees 311,707 99.6%
exporTing companieS 36,589 12.2%
with an export share < 1⁄3 of total turnover 21,344 7.1%with an export share between 1⁄3 and 2⁄3 of total turnover 6,568 2.2%
with an export share > 2⁄3 of total turnover 8,677 2.9%
Source: Federal Statistical Office, Business Census 2005
Source: Federal Statistical Office, Business Census 2008
deVelopmenT oF SwiSS Foreign Trade in million cHF
exports in billion cHF
105 109 114 127 132 136 135 146 157 177 198 206 181 193 198 201
imports
103 107 113 129 130 128 129 137 149 165 184 187 160 174 174 177
year
1997 1998 1999 2000 2001 2002 2003 2004 2005 2006 2007 2008 2009 2010 2011 2012
Source: Directorate General for Customs
Exports Imports
97 98 99 00 01 02 03 04 05 06 07 08 09 10 11 12
250,000
200,000
150,000
100,000
50,000
0

4 5
12
3
Source: Directorate General for Customs
7
exporTS by deSTinaTion counTry in million cHF in %
europe 118,325 59.0%
EU 111,297 55.5%
Germany 39,892 19.9%
Italy 14,430 7.2%
France 14,291 7.1%
UK 8,732 4.4%
Austria 5,782 2.9%
Spain 5,447 2.7%
The Netherlands 5,141 2.6%
Belgium 4,685 2.3%
Russian Federation 2,924 1.5%
Poland 1,886 0.9%
Turkey 1,837 0.9%
africa 3,337 1.7%
asia 44,387 22.1%
China 7,422 3.7%
Japan 6,860 3.4%
america 31,844 15.9%
USA 22,300 11.1%
Canada 3,000 1.5%
Brasil 2,351 1.2%
Mexiko 1,367 0.7%
oceania 2,720 1.4%
Total 2012 200,612 100%
Source: Directorate General for Customs
1 Europe 59,1%
2 Asia 22,1%
3 America 15,9%
4 Africa 1,7%
5 Oceania 1,4%

4 5
3
2
1
Swiss foreign trade
imporTS by counTry oF origin in million cHF in %
europe 136,573 77.3%
EU 134,257 75.9%
Germany 54,023 30.6%
Italy 18,253 10.3%
France 14,942 8.5%
Austria 7,677 4.3%
Ireland 6,754 3.8%
The Netherlands 6,304 3.6%
UK 6,246 3.5%
Spain 5,026 2.8%
Belgium 4,304 2.4%
Russian Federation 407 0.2%
africa 2,888 1.6%
asia 24,283 13.7%
China 10,265 5.8%
Japan 3,828 2.2%
america 12,608 7.1%
USA 9,272 5.2%
Brasil 1,089 0.6%
Canada 515 0.3%
oceania 429 0.2%
Total 2012 176,781 100% Source: Directorate General for Customs
1 Europa 77,3%
2 Africa 1,6%
3 Asia 13,7%
4 America 7,1%
5 Oceania 0,2%
Source: Directorate General for Customs

9
exporTS by SecTor in million cHF
Chemicals and related products 79,012 5.85%
Precision instruments, watches and jewellery 44,040 6.75%
Machines, appliances, electronics 33,307 -9.71%
Metals 11,933 -8.45%
Farm and forestry produce, fisheries * 8,656 2.57%
Energy sources 6,846 5.94%
Vehicles 5,095 9.05%
Leather, rubber, plastics 4,138 -5.07%
Textiles, clothing, shoes 3,114 -4.16%
Paper, stationery and graphic products 2,223 -13.03%
Apartment furnishings, toys etc. 1,392 -6.01%
Building materials 857 -0.92%
Total 2012 200,612 1.37% * incl. food, drink and tobaccoSource: Directorate General for Customs
in % compared to
previous year
* incl. food, drink and tobaccoSource: Directorate General for Customs
imporTS by SecTor in million cHF
Chemicals and related products 39,369 5.17%
Machines, appliances, electronics 29,365 -4.29%
Precision instruments, watches and jewellery 19,022 5.16%
Energy sources 17,445 12.91%
Vehicles 17,074 1.40%
Metals 13,811 -6.14%
Farm and forestry produce, fisheries * 13,306 -0.10%
Textiles, clothing, shoes 8,718 -1.82%
Leather, rubber, plastics 6,194 -1.01%
Apartment furnishings, toys etc. 5,250 0.44%
Paper, stationery and graphic products 4,334 -5.43%
Building materials 2,893 -0.75%
Total 2012 176,781 1.37%
in % compared to
previous year
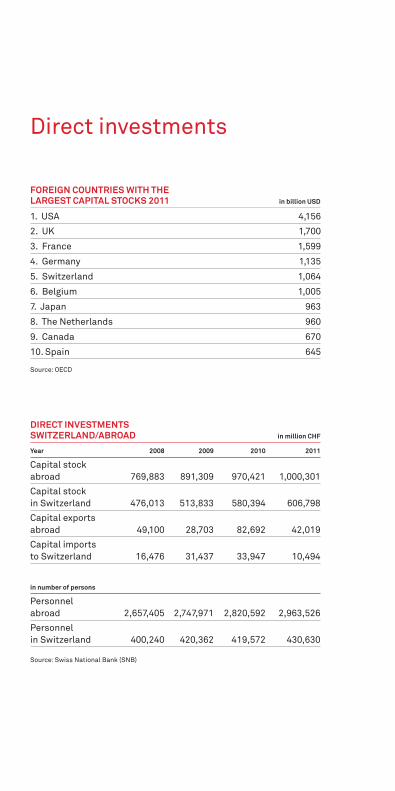
1. USA 4,156
2. UK 1,700
3. France 1,599
4. Germany 1,135
5. Switzerland 1,064
6. Belgium 1,005
7. Japan 963
8. The Netherlands 960
9. Canada 670
10. Spain 645 Source: OECD
Source: Swiss National Bank (SNB)
direcT inVeSTmenTS SwiTzerland/abroad in million cHF
year 2008 2009 2010 2011
Capital stock abroad 769,883 891,309 970,421 1,000,301
Capital stock in Switzerland 476,013 513,833 580,394 606,798
Capital exports abroad 49,100 28,703 82,692 42,019
Capital imports to Switzerland 16,476 31,437 33,947 10,494
in number of persons
Personnel abroad 2,657,405 2,747,971 2,820,592 2,963,526
Personnel in Switzerland 400,240 420,362 419,572 430,630
Direct investments
Foreign counTrieS wiTH THe largeST capiTal STockS 2011 in billion uSd

11
SwiSS capiTal STock by region in million cHF
year 2010 2011
europe 463,787 458,040
eu, thereof 405,580 404,356
Luxemburg 77,500 78,674
UK 78,144 69,451
Germany 55,803 54,656
The Netherlands 54,600 52,843
France 34,323 37,898
Offshore financial centres 40,998 36,777
Italy 25,921 25,139
rest of europe, thereof 58,207 53,684
Russian Federation 6,945 7,244
north america, thereof 209,391 229,346
USA 177,520 197,582
middle and South america, thereof 178,438 182,672
Offshore financial centres 134,748 136,695
Brasil 23,422 22,684
asia, thereof 88,737 97,476
Singapore 17,020 19,311
Japan 14,340 14,970
China 8,466 13,134
Indonesia 7,280 6,997
africa, thereof 11,623 10,416
South Africa 3,934 2,240
oceania, thereof 18,446 22,352
Australia 17,878 21,651
Source: Swiss National Bank (SNB)

SwiSS capiTal exporTS by region in million cHF
year 2010 2011
europe 22,130 3,087
eu, thereof 20,123 5,427
Germany 3,066 3,900
France 4,338 740
The Netherlands 3,614 -1,093
UK 7,258 -2,328
rest of europe, thereof 2,007 -2,340
Russian Federation 1,134 544
Ukraine 305 146
north america, thereof 23,015 11,733
USA 24,013 11,526
middle and South america, thereof 27,967 4,878
Brasil 8,319 1,136
Offshore financial centres 15,754 908
asia, thereof 8’675 16’551
China 1’824 5’293
United Arab Emirates -1’757 3’700
Japan 317 2’935
Singapore 2’388 2’052
africa, thereof 1’618 1’144
South Africa 127 209
oceania, thereof -714 4’626
Australia -650 4’505
Source: Swiss National Bank (SNB)

13
perSonnel aT SwiSS companieS abroad by region in million cHF
year 2010 2011
europe 1,423,339 1,427,227
eu, thereof 1,280,503 1,281,832
UK 375,771 371,001
Germany 271,955 282,099
France 142,850 133,595
Italy 80,251 78,222
Spain 63,179 62,694
rest of europe, thereof 142,836 145,395
Russian Federation 67,222 67,906
Ukraine 27,844 28,835
Turkey 20,009 21,514
north america, thereof 397,337 412,198
USA 342,814 355,247
middle and South america, thereof 252,338 277,101
Brasil 108,437 116,959
Mexiko 43,677 45,412
asia, thereof 583,816 678,373
China 135,062 190,726
India 83,677 93,895
Japan 71,205 71,592
Thailand 50,328 55,915
africa, thereof 116,963 116,967
South Africa 39,306 34,449
oceania, thereof 46,798 51,660
Australia 41,561 45,924 Source: Swiss National Bank (SNB)

Switzerland Global EnterpriseSwitzerland global enterprise works all over the world to
support entrepreneurs and promote Switzerland as a
business location. our role as a center of excellence for
internationalisation is to foster exports, imports and
investments, to help clients develop new potential for
their international businesses and to strengthen
Switzerland as an economic hub. we are a strong and
trusted partner for our clients, the cantons and the Swiss
government, with a global network of experienced
advisers and experts.
exporT promoTion Working on behalf of SECO, Switzerland Global Enter-prise uses its expertise in internationalisation to help Swiss companies, especially SMEs, identify and de-velop new business potential on a worldwide basis. It provides regular information about relevant trends in the global markets, as well as professional advice and support in finding contacts and partners and recognis-ing new business opportunities.
www.switzerland-ge.com/services
inFormaTion Markets Export Know-how News / Studies
neTwork Swiss Business Hubs, Embassies, Chambers of Commerce, Experts, Export Platforms, Commercial Asscociations, Partners
conSulTancy Analysis Strategy Implementation
conTacTS Business Partners / Companies Governmental Authorities Trade Fair Participants

15
imporT promoTionSwitzerland Global Enterprise works on behalf of SECO to support SMEs from selected partner countries, facilitating market access and opening up new busi-ness opportunities in Switzerland and the European Union. In this way, Switzerland Global Enterprise helps to strengthen the competitiveness of the companies concerned and foster cooperation and trade relations between Switzerland, the EU and the partner coun-tries. Importers in Switzerland and Europe benefit from contacts with reliable suppliers in the partner countries.
inVeSTmenT promoTionAs part of its remit from SECO and the cantons, Switzerland Global Enterprise provides potential foreign investors with information about the particular strengths and operating conditions of Switzerland as a business location. Its services for foreign companies include assessing the potential of their projects before they are presented to the cantons. Switzerland Global Enterprise assists the cantons with the relocation of foreign companies, providing market and trend analy-ses and coordinating the activities of all the bodies involved in the promotion of Switzerland as a business location.
online applicaTionS:
warmup2export Test your export fitness www.switzerland-ge.com/warmup2export
Trade4Free Duty-free in 6 steps – and how you can benefit from free trade agreements www.switzerland-ge.com/trade4free

9
7
8
4
3
2
1
10
13 14
5
6
12
97
8
4
3
21
10
1314
115
6
12
Global NetworkSwitzerland global enterprise is represented abroad
by Swiss business Hubs. The majority of these local
teams is based at a Swiss embassy or Swiss con-
sulate-general. bilateral chambers of commerce
take on this role in certain countries.

ABU DHABIATLANTABANGALOREBOSTONDOHAGUANGZHOUHANOIHOUSTONISTANBULJAKARTAJEDDAHKUALA LUMPURKUWAIT CITYLOS ANGELESMEXIKO CITYMONTREALNEW DELHINEW YORKOSAKARIYADHSHANGHAI
14
11
15
1916
17 13
weitere offices
14
15
19
1617
18
17
1 uSa / Chicago2 canada / Toronto3 brazil / São Paulo4 Spain / Madrid5 uk / London6 France / Paris7 italy / Milan8 germany / Stuttgart9 austria / Vienna
10 poland / Warsaw 11 russia / Moscow 12 South africa / Pretoria 13 gcc / Dubai 14 india/ Mumbai 15 aSean / Singapore 16 china / Beijing 17 korea / Seoul 18 Japan / Tokyo 19 Hong kong
Swiss business Hubs
Following an initial consulting session in Switzerland, the Swiss Business Hubs are the next point of contact with Switzerland Global Enterprise in the export country concerned. In addition, these hubs are responsible for promoting Switzerland as a business location abroad. All hubs have a first-rate network of contacts abroad on account of their official status.
Switzerland Global Enterprise relies on the official Swiss representations in the other markets, that is, on the embassies, consulates-general and consulates, as well as on the bilateral chambers of commerce.
ABU DHABIATLANTABANGALOREBOSTONDOHAGUANGZHOUHANOIHOUSTONISTANBULJAKARTAJEDDAHKUALA LUMPURKUWAIT CITYLOS ANGELESMEXIKO CITYMONTREALNEW DELHINEW YORKOSAKARIYADHSHANGHAI
Further offices

Switzerland in international comparison
ranking Switzerland
weF 1 (Global Competitiveness Index 2013)
imd 2 (World Competitiveness Yearbook 2013)
inSead 1 (The Global Innovation Index 2012)
Transparency international 6 (Corruption Perceptions Index 2012)
eTH koF 10 (Index of Globalization 2013)
The Heritage Foundation 5
(Index of Economic Freedom 2013)
city ranking 2 (Mercer 2012)
city ranking 8 (Mercer 2012)
city ranking 9 (Mercer 2012)
(Zurich)
(Geneva)
(Basel)
SME Export IndicatorThe SME Export Indicator is a cooperation between Switzerland Global Enterprise and Credit Suisse. www.switzerland-ge.com/exportindikator
crediT SuiSSe exporT baromeTer In standard deviation, growth threshold = 0
Barometer Exports (yoy) Export trend growth (6-month moving average) Growth Threshold
4.0
3.0
2.0
1.0
0.0
-1.0
-2.0
-3.0Jan 00 Jan 02 Jan 04 Jan 06 Jan 08 Jan 10 Jan 12 Jun 13

20MAKE YOUR WORLD GO
and MAKE YOUR WORLD GO are trademarks of XL Group plc companies.
XL GroupInsurance
From drawing board to landing strip, we’re with youThe moment you have the first idea right through to the finished product, we have the expertise and global reach to cover youaround the world.
We’re the perfect size. Big enough to protect you and small enough to stay flexible.
Talk to your broker or visit us online, and discover how we can help you to keep your business moving forward.
xlgroup.com/insurance
OSEC_Vademecum Guide_Strip Ad_105x210mm_DRAWING BOARD_EN.indd 1 07.06.2013 09:42:44

OFFICIAL PROGRAMMES
[email protected] 0844 811 812
Switzerland Global EnterpriseBleicherweg 10CH-8002 ZurichT +41 44 365 51 51
Switzerland Global EnterpriseCorso Elvezia 16 - CP 5399CH-6901 LuganoT +41 91 911 51 35
Switzerland Global EnterpriseAvenue d,Ouchy 47 - CP 315CH-1001 LausanneT +41 21 613 35 70
www.switzerland-ge.com
© SWITZERLAND GLOBAL ENTERPRISE June 2013.
All rights reserved.
1 000018 000015