s & g e · zusammenfassung heiße, massereiche sterne nehmen eine schlusselstellung im...
TRANSCRIPT
MASSIVE STARS
AS TRACERS FOR
STELLAR & GALACTOCHEMICAL
EVOLUTION
NORBERT PRZYBILLA


Massive Starsas Tracers for
Stellar & GalactochemicalEvolution
Habilitationsschriftder Naturwissenschaftlichen Fakultat
der
Friedrich-Alexander Universitat Erlangen-Nurnberg
vorgelegt von
Norbert Przybillaaus Kosel
Bamberg, den 25. September 2008

Fachmentorat:
Prof. Dr. E. Steffens (Vorsitzender)
Prof. Dr. U. Heber
Prof. Dr. W.-R. Hamann (Universitat Potsdam)
It is also a good rule not to put overmuch con-fidence in the observational results that are putforward until they are confirmed by theory.
– SIR ARTHUR STANLEY EDDINGTON


Zusammenfassung
Heiße, massereiche Sterne nehmen eine Schlusselstellung im Universum ein, als treibende Kraft deskosmischen Materiekreislaufes. Die Energie- und Impulsbilanz des interstellaren Mediums wird durchdie ionisierende Strahlung massereicher Sterne, durch ihre Sternwinde und Supernova-Explosionendominiert. Massereiche Sterne sind ebenfalls wichtige Statten der Nukleosynthese. Aufgrund ihrer ho-hen absoluten visuellen Helligkeit eignen sie sich besonders gut fur bodengebundene spektroskopischeBeobachtungen. Mit Hilfe der heutigen Generation von Teleskopen der 8–10m-Klasse und modernenInstrumenten konnen massereiche Sterne in der Milchstraße, anderen aktiv sternbildenden Galaxiender Lokalen Gruppe, und sogar in Sternsystemen jenseits der Lokalen Gruppe spektroskopiert wer-den. Dies gestattet eine Bestimmung der chemischen Zusammensetzung der kosmischen Materie bisin große Distanzen. Die haufigsten massereichen Sterne, OB-Sterne im Massenbereich von etwa 8 bis30M, sind von besonderem Interesse fur unsere Arbeit. Sie werden von uns auf homogene Weise vonder Hauptreihe bis in spate Entwicklungsstadien als Uberriesen der Spektraltypen B und A untersucht.
Quantitative Analysen von Sternen fruhen Spektraltyps waren in der Vergangenheit nicht genaugenug um wirklich aussagekraftig zu sein – so konnten Elementhaufigkeiten hochstens auf einen Fak-tor ∼2 genau bestimmt werden. Wir haben daher entscheidende Verbesserung an den Modellen undder Analysemethodik vorgenommen. Eine zentrale Rolle spielen dabei Modellatome, fur deren Er-stellung die prazisesten zur Verfugung stehenden Atomdaten verwendet wurden, und die Identifikationund konsequenten Reduktion/Eliminierung von Quellen systematischer Fehler. Sternparameter undElementhaufigkeiten lassen sich dadurch mit weit hoherer Genauigkeit bestimmen als jemals zuvor.Die Fruchte unserer Bemuhungen stellen sich wie folgt dar: Unsicherheiten in der Bestimmung stel-larer Effektivtemperaturen konnten auf weniger als ∼1–2% gedruckt werden, auf ∼10–25% fur dieSchwerebeschleunigung an der Sternoberflache und auf ∼10–25% (statistischer) und ∼15–25% (sys-tematischer 1σ-Fehler) fur Elementhaufigkeiten. Massereiche Sterne werden dadurch zu universellenWerkzeugen fur die Prazisionsdiagnostik in der moderne Astrophysik.
Wir haben unsere neue Analysetechnik auf hochaufgeloste Spektren von B-Hauptreihen-Sternenund BA-Uberriesen in der Milchstraße und anderen Galaxien angewendet. Die Analyseergebnissesind wichtig fur das Verstandnis der Entwicklung massereicher Sterne und der chemischen Entwick-lung von Galaxien, insbesondere der Milchstraße, da erstmalig fundierte Schlusse gezogen werdenkonnen. Die Haufigkeiten der leichten Elemente (He, C, N) liefern Hinweise darauf, wie komplexe(magneto-)hydrodynamische Prozesse im Sterninnern die Sternentwicklung beeinflussen. Anhand derHaufigkeiten der schweren Elemente lasst sich die Metallizitatsverteilung innerhalb einer Galaxis kar-tieren. Zu unseren wichtigsten Resultaten zahlen: I) die Effizienz von Mischprozessen im Sterninnernist um etwa einen Faktor 2 hoher als von etablierten Sternentwicklungsmodellen fur rotierende Sternevorhergesagt. II) Junge massereiche Sterne der Sonnenumgebung weisen entgegen gangiger Lehrmei-nung eine sehr ahnliche chemische Zusammensetzung auf. III) Die daraus ermittelten Referenzwerte
V

VI ZUSAMMENFASSUNG
fur Elementhaufigkeiten (den “kosmischen Haufigkeitsstandard”, in Anlehnung an den solaren Stan-dard) nutzen wir, um auf die chemischen Zusammensetzung des interstellaren Staubs ruckzuschließen.IV) Die galaktische Scheibe weist entgegen gangiger Vorstellungen einen flachen Haufigkeitsgradientenauf, bei insgesamt hohem Metallgehalt und geringer Streuung. V) Erste Resultate von Untersuchun-gen massereicher Uberriesen in anderen Galaxien der Lokalen Gruppe und daruber hinaus werdendiskutiert. Dabei wird Pionierarbeit auf dem jungen Gebiet der Extragalaktischen Stellarastronomiegeleistet. VI) Schließlich wenden wir unsere Analysetechnik auf hochaufgeloste Spektren von drei Ob-jekten einer neuentdeckten Sternklasse an – Fluchtlinge der Milchstraße, so genannte “Hyper-VelocitySterne” (HVS). Dabei erweist sich HVS 7 als ein chemisch sehr pekuliarer Hauptreihenstern. HVS 3entstammt – entgegen der Erwartung – nicht der Milchstraße; seine chemische Zusammensetzungentspricht der von Sternen der Großen Magellanschen Wolke, womit ein Ursprung in unserer Nach-bargalaxie nachgewiesen ist. HD 271791 wird als Uberlebender einer Supernovaexplosion in einemDoppelsternsystem identifiziert. Der Stern stellt den ersten Vertreter einer neuen Kategorie von “Hyper-Runaway Sternen” dar.
Contents
Abstract 1
1 Introduction 3
2 Quantitative Spectroscopy 72.1 Observations . . . . . . . . . . . . . . . . . . . . . . . . . . . . . . . . . . . . . . . 72.2 Models & Analysis Methodology . . . . . . . . . . . . . . . . . . . . . . . . . . . . . 102.3 Stellar Parameter Determination . . . . . . . . . . . . . . . . . . . . . . . . . . . . . 162.4 Elemental Abundances . . . . . . . . . . . . . . . . . . . . . . . . . . . . . . . . . . 182.5 Near-IR Spectroscopy . . . . . . . . . . . . . . . . . . . . . . . . . . . . . . . . . . . 21
3 Observational Constraints on the Evolution of Massive Stars 25
4 Observational Constraints on Galactochemical Evolution 27
5 Hypervelocity Stars 33
6 Extragalactic Stellar Astronomy 39
Bibliography 43
Acknowledgements 49
Appended Papers 51
VII

VIII CONTENTS

Abstract
Hot, massive stars are key drivers of the cosmic cycle of matter. They are the dominant contributors tothe energy and momentum budget of the interstellar medium, via ionizing radiation, stellar winds andsupernova explosions, and they are important sites of nucleosynthesis. Because of their high luminosi-ties these stars are primary targets for spectroscopy over large distances. With the present generationof 8-10m-class telescopes and modern instruments they can be used as powerful tracers of chemicalcomposition throughout the Milky Way, other star-forming galaxies of the Local Group, and even insystems beyond the Local Group. The most frequent massive stars, OB-type stars in the mass rangefrom about 8 to 30M, are of particular interest to us, which are studied in a homogeneous way fromthe main sequence to the evolved stage as BA-type supergiants.
In the past, quantitative studies of early-type stars were not accurate enough – e.g. only to withina factor ∼2 at most for elemental abundances – to derive conclusive results. Here we summarise ouradvances made in the modelling and the analysis methodology. Now, quantitative spectroscopy al-lows stellar parameters and chemical abundances of these objects to be constrained with much higherprecision than previously possible: to .1–2% uncertainty in effective temperature, ∼10–25% in sur-face gravity, and ∼10–25% (random) plus ∼15–25% (systematic 1σ-errors) in elemental abundances.This is achieved by the use of improved atomic data and the identification and consequent reduction ofsystematic errors. Massive stars are thus turned into universal tools for modern astrophysics.
The improved model atmosphere analyses have a strong impact on our understanding of the evo-lution of massive stars and the chemical evolution of galaxies, as thorough conclusions can be drawnfor the first time. We discuss massive stars as tracers for: I) abundances of the light elements, whichmake possible the study of the effects of complex (magneto-)hydrodynamic mixing processes in thestellar interior that govern stellar evolution; II) the abundances of the heavier elements, which allowthe present-day spatial distribution of metals in the Milky Way and other galaxies to be investigated.The most prominent results are: I) mixing efficiencies are higher than predicted by standard evolutionmodels for rotating massive stars, by about a factor 2; II) the young stellar component in the solarneighbourhood is chemically homogeneous, the resulting cosmic abundance standard facilitating tightconstraints to be put on the dust-phase composition of the interstellar medium for the first time; III) aflat abundance gradient is found for the Galactic disk, indicating overall high metallicity and little abun-dance scatter. Finally, first results from studies of massive supergiants in other galaxies within the LocalGroup and beyond are discussed, pioneering the new field of extragalactic stellar astronomy. Attentionis drawn in particular to galactic abundance gradients and a novel spectroscopic distance determinationtechnique. The gap between Galactic and extragalactic research is bridged by a newly discovered classof stars – objects unbound to the Galaxy –, the so-called hyper-velocity stars (HVSs). First quantitativestudies find the survivor of a binary supernova, an unexpected origin of a second HVS in the LargeMagellanic Cloud, and identify a third HVS as an unusual chemically peculiar magnetic star.
1

2 ABSTRACT

1 Introduction
Cosmology, the formation and evolution of galaxies, and the cosmic cycle of matter pose major chal-lenges for modern astronomy. Stars have been the driving force of evolution ever since the CosmicDark Ages. Massive stars are of particular importance as sites of nucleosynthesis and as dominant con-tributors to the energy and momentum budget of the interstellar medium (ISM), via ionizing radiation,stellar winds and supernova explosions (SNe).
One cornerstone in the wide field of galaxy evolution is the investigation of the chemical evolutionof the Milky Way (e.g. Pagel 1997; Matteucci 2001). Here, the predictive power of different modelscenarios (among the more recent work e.g. Hou et al. 2000; Chiappini et al. 2001, 2003; Oey 2003;Kobayashi et al. 2006; Cescutti et al. 2007) can be verified in great detail by comparison with ob-servation. The solar neighbourhood1 is of particular interest. Long-lived low-mass stars in the solarneighbourhood play an important role, as they allow the evolution of the Galaxy to be studied over time(e.g. Edvardsson et al. 1993; Fuhrmann 1998, 2008, and references therein; Gratton et al. 2003; Bensbyet al. 2003; Cayrel et al. 2004; Honda et al. 2004). In order to sample larger distances, more luminousindicators are required, like H II regions or massive stars. These short-lived objects trace present-dayabundances only. However, they provide important information complementary to low-mass cool stars:they allow elemental abundances to be sampled spatially over the entire disk of the Milky Way.
The drivers behind the evolution of the Galaxy are the stars. Massive ones determine the pacebecause of their short life cycles. Only the massive stars pass through all (static) fusion cycles up tosilicon burning, preparing the seed for the synthesis of the heaviest elements (Burbidge et al. 1957;Cameron 1957) in SNe type II. A quantitative understanding of the evolution of massive stars is there-fore essential for the deeper study of the whole picture.
Models of massive star evolution have attained a high degree of sophistication recently. Modelsaccounting for effects of mass-loss and rotation (Heger & Langer 2000; Maeder & Meynet 2000) suc-ceeded in reproducing observed abundance patterns in massive stars. In particular, enriched helium andnitrogen, and depleted carbon are indicative for the mixing of nuclear-processed matter from the stellarcore to the atmosphere, which can be observed in fast-rotating stars even on the main sequence. Morerecent developments concentrated on the interplay of rotation and magnetic fields (Heger et al. 2005;Maeder & Meynet 2005), which – depending on the input physics – may result in quantitatively differentpredictions for the amount of chemical mixing. Systematic investigations of massive stars of differentmass and metallicity can provide the necessary observational constraints to distinguish between com-peting treatments of the complex (magneto-)hydrodynamic processes, which are not fully understoodfrom first principles. Moreover, such observational constraints may guide further refinements of theory.
1In the following we consider the region at distances shorter than ∼1 kpc (and ±500 pc in Galactocentric direction) assolar neighbourhood in order to minimise bias due to Galactic abundance gradients, see Fig. 1 in Przybilla et al. (2008e) for aschematic representation. This encompasses, in particular, Gould’s Belt.
3

4 INTRODUCTION
Figure 1.1: Comparison of Galactochemical evolution models (A-D, see Chiappini et al. 2001 for details) withoxygen abundance determinations from H II regions (Esteban et al. 2005: boxes; Rudolph et al. 2006, and ref-erences therein: circles) and OB-type stars (Gummersbach et al. 1998: filled boxes; Daflon & Cunha 2004:diamonds), as a function of Galactocentric radius Rg. The data indicate the existence of an abundance gradient.Note, however, a systematic offset of the mean observed abundances relative to the model and the enormousspread of the observational data, by &1 order of magnitude at almost any Rg. Typical error bars are shown inthe upper right corner. Symbols are interconnected in cases of double observations. All Rg are scaled to a solarGalactocentric distance of R0 = 8.0 kpc (Reid 1993).
However, deriving accurate observational constraints on stellar and Galactochemical evolution is notsimple. Most of the quantitative information in astronomy comes from spectroscopy. The informationcannot be inferred directly from observation. One has to rely on the interpretation of radiation fromlight-emitting plasmas, and its interaction with matter, i.e. quantitative spectroscopy. Accurate physicalmodelling is crucial, with systematic uncertainties often dominating the error budget.
Well-understood astrophysical indicators that can contribute to our understanding of stellar andGalactochemical evolution in equal measure are most valuable. Such indicators must meet severalcriteria: I) they have to be highly luminous in order to be observable over large distances to sample dif-ferent environments in the universe; II) they should exhibit the spectral features required to address thekey questions posed by the cosmic cycle of matter; III) the analysis methods for these indicators shouldbe essentially free of systematic uncertainties. Dwarfs and giants of late O and early B-type (OB-typestars) are in principle such indicators, and even more so their evolved progeny, the supergiants of spec-tral types B and A.
OB-type Stars. The advantage of OB-type dwarfs and giants lies in their simple atmospheres inradiative equilibrium, which, in combination with insignificant mass-loss, makes the modelling easyin principle. Their spectra exhibit signatures of the light elements, most of the α-process elements,and iron, i.e. many of the astrophysically interesting metal species are accessible. Pristine elementalabundances (unaffected by mixing with nuclear-processed matter or by dust formation and subsequentdepletion on dust grains as in the case of H II regions) can be derived only from these unevolved ob-jects. However, large bolometric corrections limit ground-based high-resolution spectroscopy with theavailable telescopes to objects in the Milky Way and the Magellanic Clouds (MCs).

INTRODUCTION 5
Numerous abundance studies of early-type dwarfs and giants in the solar neighbourhood have beenperformed (among the more recent e.g. Gies & Lambert 1992; Kilian 1992, 1994; Cunha & Lam-bert 1994; Daflon et al. 1999, 2001a,b; Lyubimkov et al. 2005). The early-type stars imply sub-solarpresent-day abundances2 on the mean and a large range in abundance of ∼1 order of magnitude (seeSect. 4 for more details). Even within individual star clusters/associations the range in derived abun-dances can reach a factor ∼3-5, e.g. in the Orion association and its sub-groups (Cunha & Lam-bert 1994). A high degree of chemical inhomogeneity is indicated for the matter in the solar neigh-bourhood. This is in contrast to other observational indicators which imply chemical homogeneity,like the gas-phase ISM (e.g. Sofia & Meyer 2001; Sofia 2004, and references therein), and to theory,which predicts efficient homogenisation of the ISM through turbulent mixing (Edmunds 1975; Roy &Kunth 1995). Some of the discrepancy is certainly related to differences in atmospheric parametersderived by the various authors for individual objects. These can amount to more than 15% in effectivetemperature Teff and ∼0.5 dex in surface gravity log g for the same objects.
The literature on present-day abundances from H II regions and early-type stars throughout theGalactic disk is too vast to be discussed in detail here. A selective but illustrative summary on the state-of-the-art is given in Fig. 1 (for oxygen; similar trends are derived for other elements). Observationindicates the presence of a relatively steep abundance gradient and a remarkable range in abundance atany Galactocentric distance Rg. The abundances vary by &1 order in magnitude, as in the solar neigh-bourhood. Individual stars in more distant clusters also show a scatter in abundances by factors ∼3-5(e.g. Hunter et al. 2007; Trundle et al. 2007). Moreover, a systematic offset between observed andpredicted mean abundances at every Rg exists.
Finally, unevolved early-type stars are prominent among the so-called hyper-velocity stars, objectsmoving so fast that they will escape from the Milky Way into intergalactic space. Here, high-precisionsurface abundance determinations can be used to trace the place of origin of the hyper-velocity stars,see Sect. 5.
BA-type Supergiants. OB-type stars develop to supergiants of late B and A-type (BA-type supergiants,BA-SGs) in a later stage of evolution. These are of particular interest for ground-based observationsbecause of their low bolometric corrections. Thus, BA-type supergiants are among the visually brightestnormal stars in spiral and irregular galaxies. At absolute visual magnitudes up to MV '−9.5 they canrival entire globular clusters and even dwarf spheroidal galaxies in integrated light. Consequently,the present generation of 8-10m-class telescopes and efficient instrumentation allows high-resolutionspectroscopy of individual BA-type supergiants in the galaxies of the Local Group to be performed.At medium resolution this can potentially be done even in systems out to distances of the Virgo andFornax clusters of galaxies (e.g. Kudritzki 1998). This would make all classes of late-type galaxies inthe Hubble sequence accessible to detailed studies – in the field, in galaxy groups and in clusters.
The spectra of BA-type supergiants extend the chemical species traced by OB-type stars to the entireiron group and additionally s-process elements, thus covering many of the indicators relevant for under-standing cosmic nucleosynthesis. These include, but also largely extend the species traced by gaseousnebulae – in particular H II-regions –, the classical abundance indicators in extragalactic research (seee.g. Garnett 2004). Hence, BA-type supergiants can be used to investigate abundance patterns and gra-dients in other galaxies to a far greater extent than from the study of gaseous nebulae alone. Thus, ingeneral, crucial observational constraints for theoretical investigations of galactochemical evolution can
2A reduction of the discrepancies is found if the revised solar abundance standard from hydrodynamic 3-D modelling ofthe solar atmosphere (Asplund et al. 2005) is adopted instead of earlier work (e.g. Grevesse & Sauval 1998).
6 INTRODUCTION
be derived. In parallel, the metallicity-dependence of stellar winds and stellar evolution can be studied.Finally, BA-type supergiants can act as primary indicators for the cosmic distance scale by applicationof the wind momentum–luminosity relationship (WLR, Puls et al. 1996; Kudritzki et al. 1999) andby the flux-weighted gravity–luminosity relationship (FGLR, Kudritzki et al. 2003, 2008; Kudritzki &Przybilla 2003), see Sect. 6. In addition to the stellar metallicity, interstellar reddening and extinctioncan also be accurately determined, so that BA-type supergiants provide significant advantages comparedto classical (photometric) distance indicators such as Cepheid and RR Lyrae stars.
Despite this immense potential, quantitative analyses of BA-SGs are scarce. Only a few of thebrightest Galactic objects were studied in an early phase, e.g. Deneb in a pioneering work by Groth(1961) or η Leo (Przybylski 1969; Wolf 1971). The potential of BA-SGs for extragalactic researchwas already recognised in the first analyses of the visually brightest stars in the Magellanic Clouds(e.g. Przybylski 1968, 1972; Wolf 1972, 1973). These studies were outstanding for their time, but alsorestricted from the present point of view because of simplified model atmospheres, limited accuracy ofatomic data, and the lower quality of the observational material (photographic plates). Note, however,that non-LTE model atmospheres were already investigated at that time (Kudritzki 1973).
BA-type supergiants have become an active field of research again only recently. Venn (1995a,b),Verdugo et al. (1999) and Takeda & Takada-Hidai (2000, and references therein) conducted systematicstudies of larger samples of Galactic BA-type supergiants. Stellar parameters and elemental abundanceswere derived on the basis of hydrostatic line-blanketed LTE model atmospheres, utilising non-LTE line-formation calculations for key ions in some cases. In general, near-solar abundances were found for theheavier elements, resulting in agreement with present-day abundances derived from unevolved GalacticB-stars. Furthermore, the studies indicated (partial) mixing of the surface layers with CN-cycled gasfrom the stellar core. However, the uncertainties were often quite large. Discrepancies of up to ∼20%in Teff , ∼0.5 dex in log g and ∼1 dex in the elemental abundances can be found for individual objectsanalysed by different authors. A considerable mismatch between observed and model spectra persistedeven for the hydrogen line spectrum when hydrodynamic line-blanketed non-LTE model atmosphereswere applied, as in the pilot study on Deneb by Aufdenberg et al. (2002).
Apparently, the quantitative spectroscopy of both – unevolved OB-stars and BA-type supergiants –requires substantial improvements before one can exploit their full potential. This was the motivationfor our own efforts. The present work is divided in two parts. Part 1 highlights the main problemsand major achievements, and puts several so far unpublished results into the context. The essence ofthe work in progress is summarised in Figs. 3.1, 4.1, 4.2 and 4.3. Part 2 (the Appendix) summarisesour original publications of relevance for the discussion. Note that we have also used our models andanalysis methodology with great success for quantitative studies of main sequence A-stars, subluminousB-stars, extreme helium stars, the Sun and solar-type stars. The general outline of Part 1 is as follows.Diagnostic challenges for the quantitative spectroscopy of massive stars are discussed in Sect. 2. Thefocus is on our improvements in the modelling and in the analysis methodology. Part of the work wasaccomplished as mentor of the Diploma and PhD projects of Markus Firnstein and Florian Schiller, andof the PhD thesis of Maria Fernanda Nieva. Then, an overview of the present status of our work on thederivation of observational constraints on stellar and Galactochemical evolution is provided in Sects. 3and 4. Results in the context of hyper-velocity stars are discussed in Sect. 5. Finally, an outlook is givenin Sect. 6 on how the studies can be extended in the framework of the young discipline of extragalacticstellar astronomy to achieve a global understanding of the cosmic cycle of matter, and in particular ofgalactic evolution.

2 Quantitative Spectroscopy
2.1 Observations
The quality of the observational data is one factor that determines the accuracy that can be achievedin quantitative analyses. Because of their brightness, high-resolution spectroscopy of Galactic OB-stars and of BA-type supergiants out to the Magellanic Clouds can be accomplished using 2m-classtelescopes. Echelle spectrographs like FEROS on the Max-Planck-ESO 2.2m (Kaufer et al. 1999) orFOCES on the Calar Alto 2.2m telescope (Pfeiffer et al. 1998) are the preferred instruments as theyallow all diagnostic lines, which are often scattered throughout the entire optical and near-IR range,to be accessed at once. Moreover, even metal line profiles can be resolved, e.g. for slowly-rotatingsupergiants. Spectra of bright targets can be obtained at very high signal-to-noise ratios of severalhundreds. Such data are required for a calibration of the models (see Sect. 2.2), that will later be used forthe analysis of larger samples of stars, where a S/N . 200 is sufficient. Careful data reduction beyondstandard pipeline applications ensures that line profiles – including in particular the broad hydrogenfeatures – are recovered accurately, which can be verified by comparison with long slit spectra.
Examples of the quality achieved for the spectra used in the calibration of our models and for estab-lishing the analysis methodology are shown in Figs. 2.1 and 2.2 for B-stars and BA-type supergiants,respectively. A good sampling of the parameter space, effective temperature Teff and surface gravitylog g, is required for a reliable calibration. Only then can the systematic behaviour of the diagnosticindicators be studied, such as the Stark-broadened hydrogen lines, ionization equilibria (among otherse.g. He I/II, C II/III/IV or Si II/III/IV in early B-stars) or various metal features for abundance studies.
Symmetric absorption lines indicate that the photospheres of the stars under study are (close to)hydrostatic. A clear signature of hydrodynamic phenomena is found only in the most luminous super-giants, restricted largely to Hα, which traces the entire stellar atmosphere because of its strength. Theline develops from symmetric absorption into a P-Cygni-profile because of the strengthening stellarwind with increasing luminosity.
Fainter objects, like early-type main sequence stars in the Magellanic Clouds or supergiants in moredistant Local Group galaxies, require observations with 8-10m-class telescopes. Echelle spectrographslike UVES (Dekker et al. 2000) on the ESO VLT or HIRES (Vogt et al. 1994) and ESI (Sheinis etal. 2002) on Keck are the work horses in this case. However, several hours of observing time per tar-get restrict studies to small samples of stars. Multi-object spectrographs allow these restrictions to beovercome. Instruments like FLAMES/GIRAFFE (Pasquini et al. 2000) on the VLT or DEIMOS (Faberet al. 2003) on Keck provide a multiplex factor of ∼100 for a wide field-of-view at a resolving powerof R=λ/∆λ≈ 5000–15 000, still sufficient for detailed analyses (see Fig. 2.3). At larger distances,in galaxies beyond the Local Group, multi-object spectroscopy of even the most luminous supergiantsis feasible only at low to intermediate resolution (R≈1000–2000) at present. FORS1/2 (Seifert et
7

8 QUANTITATIVE SPECTROSCOPY
Figure 2.1: Spectral morphology of Galactic B-stars around Hδ, He I λ4471, the Si III tripletλλ4552–74 andHe II λ4686 A, arranged in a Teff sequence. The major spectral features are identified, short vertical marks indicateO II lines. From Nieva (2007).
Figure 2.2: Morphology of Galactic BA-type supergiant spectra in regions around Hγ and Hα, arranged inluminosity sequence. The major spectral features are identified, short vertical marks indicate Fe II lines. FromPrzybilla et al. (2006a).

2.1 Observations 9
Figure 2.3: Intermediate resolution multiobject-spectroscopy of blue supergiant candidates around the prominentstar association NGC 206 in M 31 (V band image with targets marked by blue circles) using DEIMOS on Keck II.Three wavelength regions (around 5000 A, Hα and the higher Paschen series) of an early A-type supergiantspectrum are shown.
Figure 2.4: Examples of continuum-normalisedstellar spectra obtained in NGC 3621, displayedalong with Galactic supergiant stars of similarspectral morphology at the same spectral resolu-tion. Ordinate ticks are spaced by 0.5 contin-uum units. (a) An early A-type supergiant (redline), bracketed by Galactic A0 Ia and A2 Ia tem-plate spectra (black). Line identification for thestrongest features is shown at the top (unlabelledshorter marks are used for Fe II lines). (b) An earlyF-type supergiant (red line) compared with Galac-tic F0 Ia and F2 Ia template spectra (black lines).(c) An LBV candidate. Notice the prominence ofseveral Fe II emission features (identified by thevertical marks) and the presence of nebular emis-sion, indicated by the hydrogen Balmer lines inemission. From Bresolin et al. (2001).
al. 2000) on the VLT has been successfully employed out to distances of several Mpc, like for super-giants at V ≈ 20–21.5 mag in the field galaxy NGC 3621 (exposing for ∼11 hrs in total), see Fig. 2.4.
10 QUANTITATIVE SPECTROSCOPY
H
Li Be
Na Mg
K Ca
Rb Sr
Cs Ba
Fr Ra
Sc Ti V Cr Mn Fe Co Ni Cu Zn Ga Ge As Se Br Kr
B C N O F Ne
He
Al Si P S Cl Ar
Th Pa U
Periodic System:
Ac
Y Zr Nb Mo Ru Rh Pd Ag Cd In Sn Sb Te I Xe
RnAtPoBiPbTlPtIrOsReWTaHfLa
Ce Pr Nd Pm Sm Eu Gd Tb Dy Ho Er Tm Yb Lu
14 16
5 6 7 8 9 10
2
13 15 17 18
28 29 30 31 32 33 34 35 36
46 47 48 49 50 51 52 53 54
78 79 81 82 83 84 85 86
63 64 65 66 67 68 69 70 71
1
3 4
11 12
19 20 21 22 23 24 25 26 27
37 38 39 40 41 42 43 44 45
55 56 57 72 73 74 75 76 77
58 59 60 61 62
90 91 92
Tc
87 88 89
Au
first to fourth ionization potential (eV)
LTENLTE
13.60
5.3975.64
5.1447.29
4.3431.63
4.1827.29
3.8923.16
4.0722
9.32
7.6515.04
24.5954.42
8.3025.1518.21
11.2624.38
14.5329.60
13.6235.12 34.97
17.42 21.5640.96
5.9918.83
8.1516.35
10.4919.77
10.3623.34
12.9723.81
15.7627.63
11.876.11
12.806.56 6.83
13.586.75
14.666.77
16.497.43
15.647.90
16.187.88
17.087.64
18.177.73
20.29 17.966.00
20.517.90
15.949.82
18.639.75
21.1911.8121.80
14.0024.36
9.39
5.6911.03
6.2212.24
6.6313.13
6.7614.32
7.0916.16
7.2815.26
7.3616.76
7.4618.08
8.3419.43
7.5821.49
8.9916.91
5.7918.87
7.3414.63
8.6416.53
9.0118.60
10.4519.13
12.1321.21
5.2110.00
5.2810.15
5.5811.06
5.1712.1
6.83 7.8916
7.98 7.8817
8.717
9.117
9.018.56
9.2320.5
6.1120.43
7.4215.03
7.2916.69
8.4219
9.320
10.75211814.9
5.5410.85
6.0811.5
5.89
5.4710.55
6.19
5.5310.73
5.5510.90
5.64 5.6711.2411.07
6.1512.09
5.8611.52
5.9411.67
6.0211.80
6.1111.93
6.1812.05
6.2512.18
5.4313.9
122
71.698.9
60.9
52.2
3546
3343
154218
80.1109
37.9259 64.5
47.977.547.4
77.454.9
87.162.7
97.163.5
12028.4
45.133.5
51.430.2
47.234.8
53.539.6
59.840.7
45.8 50.967.3
24.873.5 52.5
37.047.3
3642.930.8
50.128.4
45.734.2
63.230.7
59.439.7
55.236.8
54.935.2
51.333.5
54.830.7
51.233.7
49.246.729.3
43.327.5 31.0
39.0 42.957
20.561.8 40.7
23.034.3 38.3
25.046.427.1
4629.5
5028.5
4831.1
5332.9
5634.8
5937.5 28.3
54.430.5
44.225.3
37.428.0 33
42 40.932.1
49
3446
19.2
2049
50.02944
29.844
243533.3
23.33322 26
38 4025 27
39 4128 30
4634.2
50.7 42.331.9
3827
4129
20.236.7
20.028.8
21.639.0
23.7 25.1 21.045.243.642.740.4
22.144.0
22.742.742.5
22.841.439.4
21.920.642.724.9
41.423.4
41.0
25.645.3
Hg80
10.4418.76
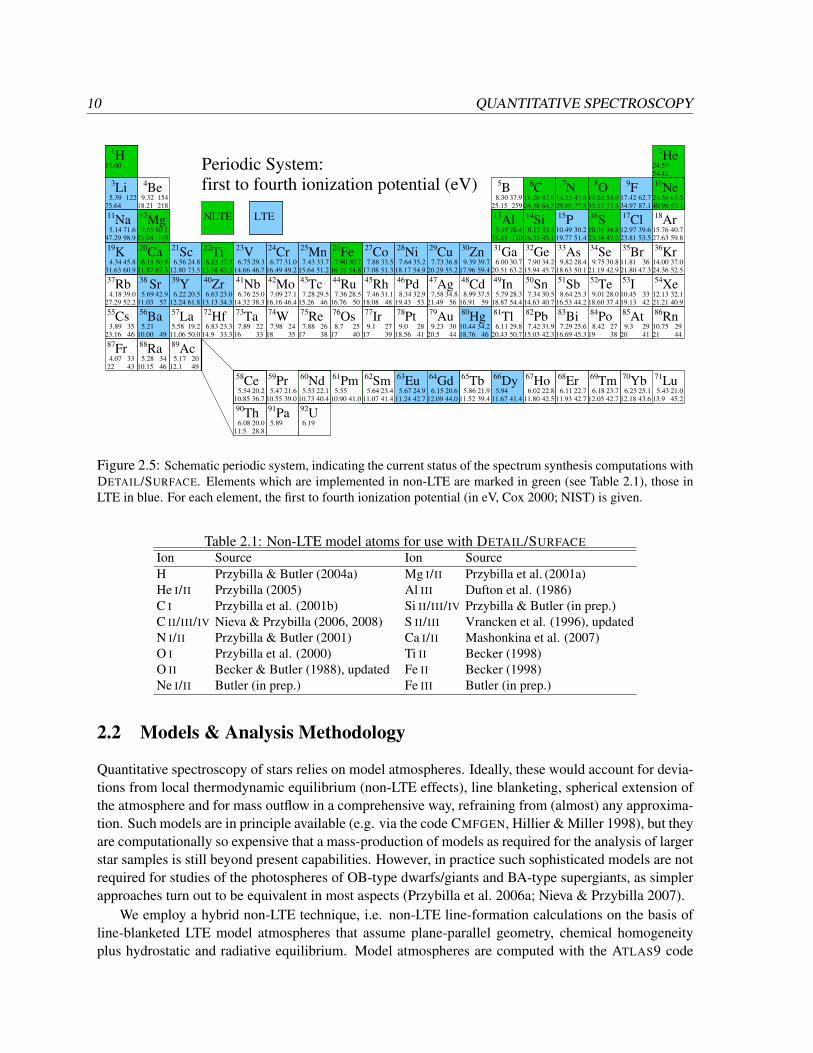
Figure 2.5: Schematic periodic system, indicating the current status of the spectrum synthesis computations withDETAIL/SURFACE. Elements which are implemented in non-LTE are marked in green (see Table 2.1), those inLTE in blue. For each element, the first to fourth ionization potential (in eV, Cox 2000; NIST) is given.
Table 2.1: Non-LTE model atoms for use with DETAIL/SURFACEIon Source Ion SourceH Przybilla & Butler (2004a) Mg I/II Przybilla et al. (2001a)He I/II Przybilla (2005) Al III Dufton et al. (1986)C I Przybilla et al. (2001b) Si II/III/IV Przybilla & Butler (in prep.)C II/III/IV Nieva & Przybilla (2006, 2008) S II/III Vrancken et al. (1996), updatedN I/II Przybilla & Butler (2001) Ca I/II Mashonkina et al. (2007)O I Przybilla et al. (2000) Ti II Becker (1998)O II Becker & Butler (1988), updated Fe II Becker (1998)Ne I/II Butler (in prep.) Fe III Butler (in prep.)
2.2 Models & Analysis Methodology
Quantitative spectroscopy of stars relies on model atmospheres. Ideally, these would account for devia-tions from local thermodynamic equilibrium (non-LTE effects), line blanketing, spherical extension ofthe atmosphere and for mass outflow in a comprehensive way, refraining from (almost) any approxima-tion. Such models are in principle available (e.g. via the code CMFGEN, Hillier & Miller 1998), but theyare computationally so expensive that a mass-production of models as required for the analysis of largerstar samples is still beyond present capabilities. However, in practice such sophisticated models are notrequired for studies of the photospheres of OB-type dwarfs/giants and BA-type supergiants, as simplerapproaches turn out to be equivalent in most aspects (Przybilla et al. 2006a; Nieva & Przybilla 2007).
We employ a hybrid non-LTE technique, i.e. non-LTE line-formation calculations on the basis ofline-blanketed LTE model atmospheres that assume plane-parallel geometry, chemical homogeneityplus hydrostatic and radiative equilibrium. Model atmospheres are computed with the ATLAS9 code

2.2 Models & Analysis Methodology 11
Figure 2.6: Upper panel: Comparison of LTE (ATLAS9) and non-LTE (TLUSTY) model atmosphere structures:temperature and electron density (inset) as a function of column mass for an early B-type dwarf and giant model(Teff and log g as indicated). Overall, excellent agreement of the model atmospheres is found. The temperaturestructures deviate by less than 1% in the inner atmosphere, including the regions where the weaker lines and thewings of the stronger features are formed (at column mass logm&−1). At the formation depths of the cores ofthe stronger H and He lines (−3 . logm.−1.5) the differences may increase to . 2–3%. Larger deviations mayoccur only in the outermost parts of the atmosphere, outside the line-formation depths. Lower panel: Comparisonof spectral energy distributions, the radiation field computed by DETAIL on the basis of the ATLAS9 atmosphericstructure vs. TLUSTY. Excellent agreement is obtained throughout practically the entire wavelength range. Bothcomparisons together indicate the hybrid non-LTE approach to be equivalent to full non-LTE calculations for thiskind of star. From Nieva & Przybilla (2007).
(Kurucz 1993). The non-LTE line-formation package DETAIL/SURFACE (Giddings 1981; Butler &Giddings 1985; both updated by K. Butler) is used to address the restricted non-LTE problem. Thecoupled radiative transfer and statistical equilibrium equations are solved with DETAIL, employing theAccelerated Lambda Iteration scheme of Rybicki & Hummer (1991). This allows even complex ionsto be treated in a realistic way, see Table 2.1 for a summary of model atoms used with DETAIL in thiscontext. Synthetic spectra are calculated on the basis of the resulting level populations with SURFACE,using refined line-broadening theories. Alternatively, the formal solution can also be performed withSURFACE in LTE, see Fig. 2.5 for an overview of implemented models.

12 QUANTITATIVE SPECTROSCOPY
Figure 2.7: Comparison of the most discrepant hydrogen and He I/II line profiles from our hybrid non-LTEapproach – using an ATLAS9 model atmosphere (LTE) plus non-LTE line-formation with DETAIL/SURFACE –and a calculation using the corresponding TLUSTY model atmosphere (non-LTE) plus non-LTE line-formationwith DETAIL/SURFACE for a hot main sequence model. Practically perfect agreement is obtained, with smalldiscrepancies occurring only in the wings of He II λ4686 A. This is another example for the equivalence of ourhybrid non-LTE approach and full non-LTE calculations, this time from the viewpoint of detailed line profiles.From Nieva & Przybilla (2007).
Several conditions need to be met in order to determine reliable level populations (a prerequisitefor an accurate analysis) from the solution of the radiative transfer and statistical equilibrium equations(see e.g. Mihalas 1978): I) the local temperatures and particle densities have to be known (i.e. theatmospheric structure) and II) the radiation field has to be realistic and III) all relevant atomic processeshave to be taken into account and IV) high-quality atomic data have to be available (i.e. accurate cross-sections for the transitions). In particular, I) and II) require a realistic physical model of the stellaratmosphere and an accurate atmospheric parameter determination. Items III) and IV) are related to themodel atoms, i.e. the specifications of atomic input data to be considered in the non-LTE calculations.Shortcomings in any of I)–IV) result in increased uncertainties/errors of the analysis.
Extensive tests have been made to verify the validity of our modelling assumptions in terms of itemsI) and II) above. One example is shown in Fig. 2.6, where a comparison of our approach with full non-LTE models (Lanz & Hubeny 2003) in the OB-star regime is made. Excellent agreement is found for theatmospheric structures and spectral energy distributions, indicating the equivalence of both approaches,see Nieva & Przybilla (2007) for details. This is corroborated further by a comparison of the resultingline profiles of the hydrogen and helium spectra, see Figs. 2.7 and 2.8. The comparison with observationshows that our hybrid non-LTE approach allows the best match to be obtained, outperforming the othermodels discussed in Fig. 2.8. Similar tests have been made for BA-type supergiants (Przybilla 2002;Przybilla et al. 2006a). Good agreement with model predictions from the unified (wind+photosphere)non-LTE code FASTWIND (Puls et al. 2005) is found for this kind of star. Deviations can also occur formetal lines. However, this is mostly due to different model atoms used in the various codes.
2.2 Models & Analysis Methodology 13
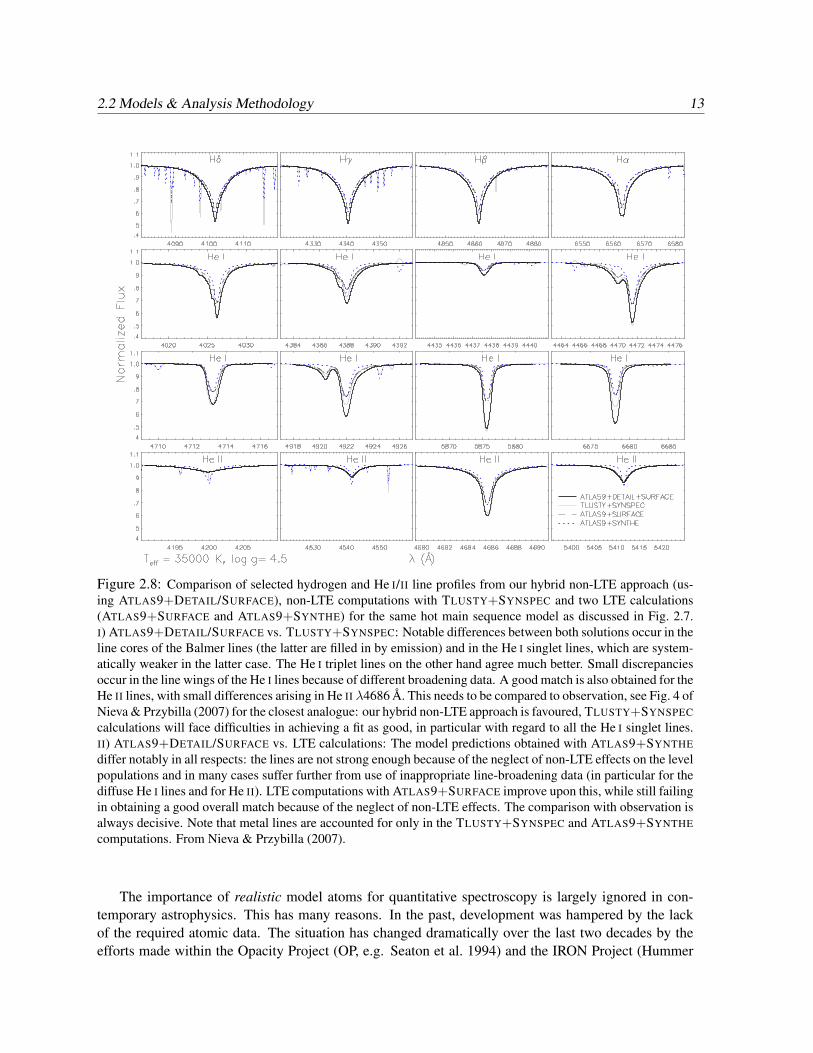
Figure 2.8: Comparison of selected hydrogen and He I/II line profiles from our hybrid non-LTE approach (us-ing ATLAS9+DETAIL/SURFACE), non-LTE computations with TLUSTY+SYNSPEC and two LTE calculations(ATLAS9+SURFACE and ATLAS9+SYNTHE) for the same hot main sequence model as discussed in Fig. 2.7.I) ATLAS9+DETAIL/SURFACE vs. TLUSTY+SYNSPEC: Notable differences between both solutions occur in theline cores of the Balmer lines (the latter are filled in by emission) and in the He I singlet lines, which are system-atically weaker in the latter case. The He I triplet lines on the other hand agree much better. Small discrepanciesoccur in the line wings of the He I lines because of different broadening data. A good match is also obtained for theHe II lines, with small differences arising in He II λ4686 A. This needs to be compared to observation, see Fig. 4 ofNieva & Przybilla (2007) for the closest analogue: our hybrid non-LTE approach is favoured, TLUSTY+SYNSPECcalculations will face difficulties in achieving a fit as good, in particular with regard to all the He I singlet lines.II) ATLAS9+DETAIL/SURFACE vs. LTE calculations: The model predictions obtained with ATLAS9+SYNTHEdiffer notably in all respects: the lines are not strong enough because of the neglect of non-LTE effects on the levelpopulations and in many cases suffer further from use of inappropriate line-broadening data (in particular for thediffuse He I lines and for He II). LTE computations with ATLAS9+SURFACE improve upon this, while still failingin obtaining a good overall match because of the neglect of non-LTE effects. The comparison with observation isalways decisive. Note that metal lines are accounted for only in the TLUSTY+SYNSPEC and ATLAS9+SYNTHEcomputations. From Nieva & Przybilla (2007).
The importance of realistic model atoms for quantitative spectroscopy is largely ignored in con-temporary astrophysics. This has many reasons. In the past, development was hampered by the lackof the required atomic data. The situation has changed dramatically over the last two decades by theefforts made within the Opacity Project (OP, e.g. Seaton et al. 1994) and the IRON Project (Hummer

14 QUANTITATIVE SPECTROSCOPY
Figure 2.9: Comparison of synthetic C II/IIIline profiles for two B-type dwarfs (τ Sco,B0.2 V and HR 1861, B1 IV) using differ-ent model atoms. One calculation is basedon our well-tested reference model includingmany collisional data from ab-initio calcula-tions while the other adopts standard approxi-mations (Van Regemorter 1962; Allen 1973,with collision strength Ω = 1) for evaluatingcollisional rates for all transitions. Abundancedeterminations based on the simple modelwould indicate a significantly larger scatter inthe values derived from individual lines. Notethat the effects vary from star to star. FromNieva & Przybilla (2008).
et al. 1993), and by many developments published continuously in the atomic physics literature, which,however, draw little attention within the astronomical community.
In fact, the bulk of stellar studies addresses objects that are in general supposed to show smalldeviations from detailed equilibrium (cool and tepid stars). There appeared little need to invoke non-LTE techniques for quantitative analyses, a credo being dropped only slowly. For the remainder (hotstars), the focus was to include huge amounts of atomic data required for the computation of non-LTE model atmospheres in the most efficient way. Large, uniform databases like those provided bye.g. the OP allowed simple model atoms to be constructed (nearly) automatically. In reality, modelatmosphere computations do not require an exact treatment of the millions of individual lines. A goodapproximation of the opacities even in a statistical sense is sufficient, masking (most) shortcomings inmodel atoms. However, for the comparison with the observed line spectra any simplification/inaccuracyin the atomic data can matter.
Non-LTE effects prevail whenever radiative processes – which are non-local in character (photonsmay travel wide distances before interacting with the plasma) – dominate the transition rates. Hence,great care is usually (also in our case) exercised to implement accurate oscillator strengths and photoion-ization cross-sections in model atoms. On the other hand, collision processes thermalise. Collisions donot obey the restrictive selection rules for radiative transitions. In consequence, many processes, such asthe coupling between different spin systems in the lighter elements, are determined by collisional rates.However, homogeneous and comprehensive databases on collisional data for ions relevant for stellaratmospheres are still not available. Therefore, simple approximations are usually made to evaluatecollision rates, an assumption too crude for accurate quantitative analyses.
In many cases better data for (mostly) electron-impact excitation cross-sections from ab-initio com-putations exist. A comparison of model predictions accounting for accurate collisional data and for
2.2 Models & Analysis Methodology 15
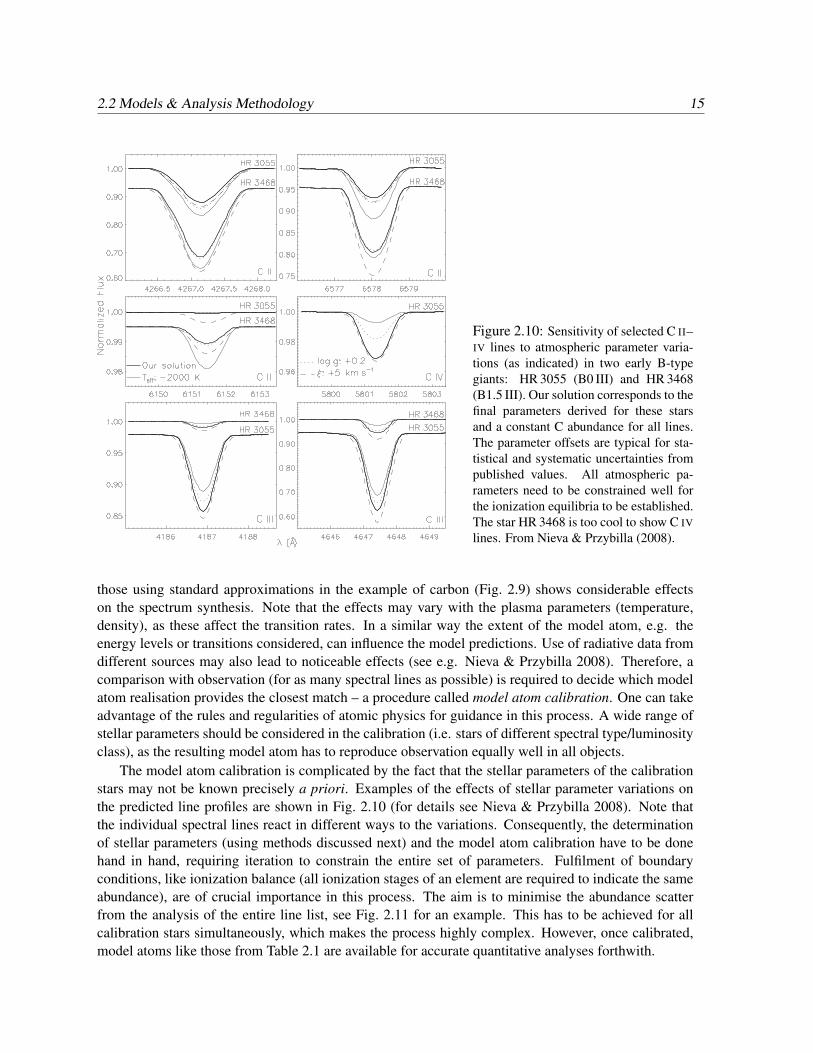
Figure 2.10: Sensitivity of selected C II–IV lines to atmospheric parameter varia-tions (as indicated) in two early B-typegiants: HR 3055 (B0 III) and HR 3468(B1.5 III). Our solution corresponds to thefinal parameters derived for these starsand a constant C abundance for all lines.The parameter offsets are typical for sta-tistical and systematic uncertainties frompublished values. All atmospheric pa-rameters need to be constrained well forthe ionization equilibria to be established.The star HR 3468 is too cool to show C IVlines. From Nieva & Przybilla (2008).
those using standard approximations in the example of carbon (Fig. 2.9) shows considerable effectson the spectrum synthesis. Note that the effects may vary with the plasma parameters (temperature,density), as these affect the transition rates. In a similar way the extent of the model atom, e.g. theenergy levels or transitions considered, can influence the model predictions. Use of radiative data fromdifferent sources may also lead to noticeable effects (see e.g. Nieva & Przybilla 2008). Therefore, acomparison with observation (for as many spectral lines as possible) is required to decide which modelatom realisation provides the closest match – a procedure called model atom calibration. One can takeadvantage of the rules and regularities of atomic physics for guidance in this process. A wide range ofstellar parameters should be considered in the calibration (i.e. stars of different spectral type/luminosityclass), as the resulting model atom has to reproduce observation equally well in all objects.
The model atom calibration is complicated by the fact that the stellar parameters of the calibrationstars may not be known precisely a priori. Examples of the effects of stellar parameter variations onthe predicted line profiles are shown in Fig. 2.10 (for details see Nieva & Przybilla 2008). Note thatthe individual spectral lines react in different ways to the variations. Consequently, the determinationof stellar parameters (using methods discussed next) and the model atom calibration have to be donehand in hand, requiring iteration to constrain the entire set of parameters. Fulfilment of boundaryconditions, like ionization balance (all ionization stages of an element are required to indicate the sameabundance), are of crucial importance in this process. The aim is to minimise the abundance scatterfrom the analysis of the entire line list, see Fig. 2.11 for an example. This has to be achieved for allcalibration stars simultaneously, which makes the process highly complex. However, once calibrated,model atoms like those from Table 2.1 are available for accurate quantitative analyses forthwith.

16 QUANTITATIVE SPECTROSCOPY
Figure 2.11: Sensitivity of carbon abundances to stellar parameter variations (for HR 3055, B0 III): Teff (upper),log g (middle) and microturbulent velocity ξ (lower panel). The offsets of the parameters are displayed in thelower left part of each panel. A large spread in abundance from individual lines of the three ionization stagesresults, in particular for variations of Teff . Note also the implications of using only few lines of one ion forabundance determinations in the presence of systematic errors in the atmospheric parameters. The grey bandscorrespond to 1σ-uncertainties of the stellar C abundance in our solution. From Nieva & Przybilla (2008).
2.3 Stellar Parameter Determination
Our stellar parameter determination relies on a spectroscopic approach. Multiple non-LTE ionizationequilibria and all available Stark-broadened hydrogen lines (usually from the Balmer and Paschen se-ries) are used rigorously as temperature and surface gravity indicators, analysed via detailed line-profilefits (χ2-minimisation). An example of the procedure is shown in Fig. 2.12. Ionization equilibria and thehydrogen lines are both required as the individual indicators are degenerate with respect to simultaneousvariations of Teff /log g. However, the intersection of the different loci determines the stellar parametersto high accuracy. The uncertainties in Teff can be as low as 1–2% and 0.05–0.10 dex in log g (Przybillaet al. 2006a; Nieva & Przybilla 2008). The redundancy of matching several indicators simultaneouslyis one of the main improvements and strengths of our approach.
A further improvement is a self-consistent account of ‘secondary’ parameters, such as helium abun-dance (all available helium lines are analysed), metallicity (from the abundance determination, seeSect. 2.4) and microturbulence3, which were either approximated or even ignored for the basic parame-ter determination in previous studies. These may indeed be of secondary importance for less luminousobjects in most cases. However, in particular close to the Eddington limit they can no longer be ne-glected, as the balance of gravitational forces and radiative acceleration, which strongly impacts theatmospheric structure in supergiants, is delicate (Przybilla et al. 2006a). This complicates the stellar pa-
3The microturbulent velocity ξ is determined as usual by demanding elemental abundances to be independent of lineequivalent width Wλ. Note that we do not find a need to assume different values of ξ for individual ions (even of the sameelement, see e.g. Albayrak 2000), or to assume depth-dependent microturbulent velocities.

2.3 Stellar Parameter Determination 17
Figure 2.12: Impact of stellar parameter variations (within conservative uncertainties) on non-LTE line profilefits for diagnostic lines in the Galactic A-SG η Leo: ionization equilibrium of Mg I (upper left panel) and Mg II(also including He I λ4388 A, upper right panel) and the Stark-broadened Hδ line (lower left panel). Spectrumsynthesis for the final parameters (thin black line) and varied parameters, as indicated (dotted lines), are comparedto observation (grey). Vertical shifts have been applied to the upper profiles. Note the high sensitivity of theminor ionic species Mg I to parameter variations, while Mg II is almost unaffected. Application to the differentparameter indicators allows a fit diagram in the Teff − log g-plane to be constructed (lower right panel). Thestellar parameters are determined from the intersection of the individual indicators. The curves are parameterisedby the helium abundance y. From Przybilla et al. (2006a).
rameter determination enormously, resulting in the need for iterative optimisation in a five-dimensionalparameter space instead of solving the usual two-dimensional problem (in Teff and log g). The hugedifferences in basic parameters of BA-type supergiant studies from the literature (see Sect. 1) can beexpected, as none of the previous investigations accounted for this in full.
An important cross-check is the comparison with the observed spectral energy distribution (SED),i.e. verifying that not only the diagnostic features in the spectra are matched but also the global energyoutput of the star. Examples for the excellent agreement between our model atmosphere computationsand observations for BA-type supergiants and OB-stars are displayed in Fig. 2.13.
Line-profile fitting of high-resolution spectra also allows detailed information on (projected) rota-tional velocity v sin i and macroturbulence ζ to be derived. An example is shown in Fig. 2.14. Macro-turbulent velocity fields turn out to be widespread among OB-type stars and BA-type supergiants.

18 QUANTITATIVE SPECTROSCOPY
Figure 2.13: Comparison of model fluxes (black lines) and observed SEDs from the UV to the near-IR, forBA-SGs (left panel) and B-type stars (right panel). Displayed are IUE spectrophotometry (grey lines), Johnson(boxes), Stromgren (triangles), Walraven (filled circles) and Geneva photometry (open circles). The observationshave been dereddened. From Przybilla et al. (2006a); Nieva & Przybilla (2006).
Figure 2.14: Line-profile fits (thin black) to observation of the A-SG η Leo (grey lines) accounting for rota-tion and macroturbulence (upper comparison) and for rotation only (lower comparison). An excellent match isobtained in the first case. The markers are vertically extended by 0.05 units. From Przybilla et al. (2006a).
Finally, when assembling all information (atmospheric parameters, photometry, comparison withstellar evolution models, etc.), a comprehensive view of the stars under study may be developed. Thisencompasses in particular the fundamental stellar parameters mass M , luminosity L and radius R.
2.4 Elemental Abundances
The chemical composition can be determined with high precision once accurate atmospheric parametersare available. Again, line-profile fitting is preferred over traditional curve-of-growth techniques for theanalysis.

2.4 Elemental Abundances 19
Figure 2.15: Line abundances for several elements in η Leo as a function of equivalent width (see legend forsymbol identifications). The grey bands cover the 1σ-uncertainty ranges around the non-LTE mean values. Non-LTE calculations reduce the line-to-line scatter and remove systematic trends. Note that even weak lines can showconsiderable departures from LTE. From Przybilla et al. (2006a).
An example for the abundance analysis of an A-type supergiant is shown in Fig. 2.15. Homogeneousabundances are derived from all lines in the element spectra, which show little scatter around the meanvalue. Our rigorous non-LTE analysis thus avoids the systematic trends of abundance with line-strengthfound in the LTE approximation, e.g. for N I or O I. In other cases, for S II, Ti II and Fe II, the non-LTE abundances are systematically shifted relative to LTE. Also the statistical scatter is reduced innon-LTE, and contrary to common assumption significant non-LTE abundance corrections are foundeven in the weak-line limit. These can exceed a factor ∼2 for lines with Wλ . 10 mA, in particularfor more luminous objects, where non-LTE effects are amplified. In addition, systematic errors needto be considered because of uncertainties in the stellar parameters, atomic data, and the quality of thespectra. We find that non-LTE abundance uncertainties amount to typically 0.05–0.10 dex (random)and ∼0.10 dex (systematic 1σ-errors) when applying our analysis methodology in combination withrealistic model atoms to high-S/N spectra. This applies to OB-stars and BA-type supergiants alike. It ishereby shown that previously reported problems in reproducing observed spectra are only artefacts ofinadequate models and/or analysis techniques.
20 QUANTITATIVE SPECTROSCOPY
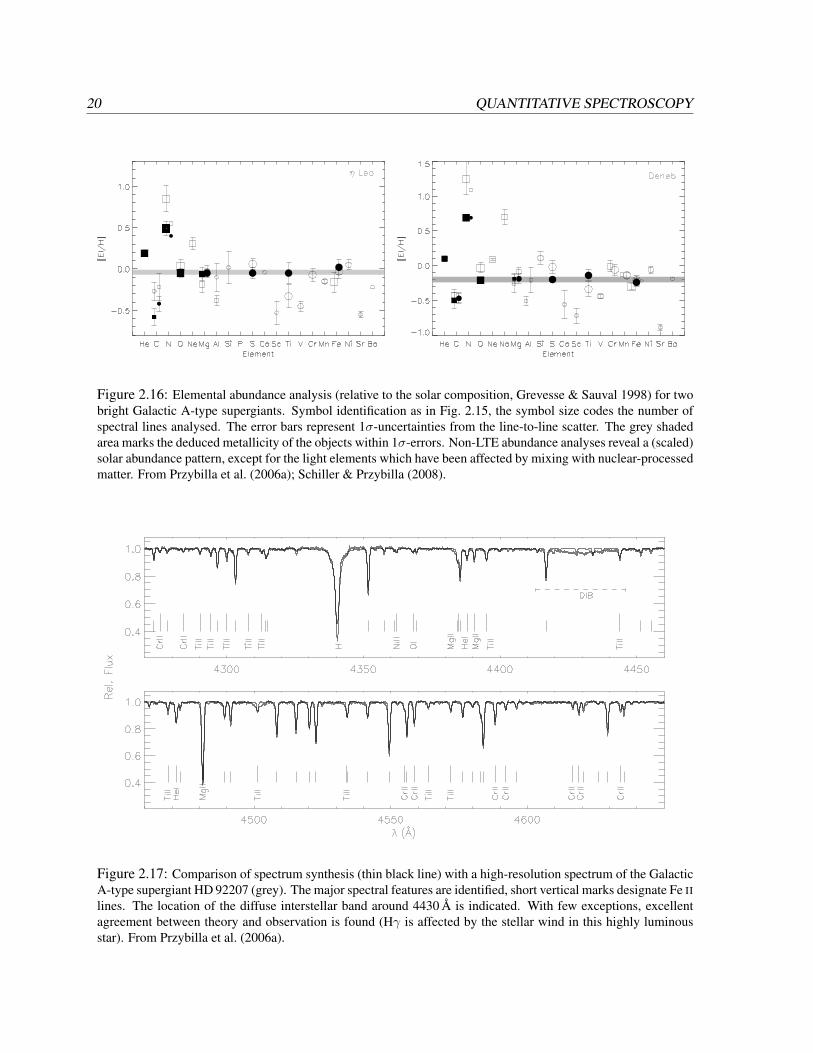
Figure 2.16: Elemental abundance analysis (relative to the solar composition, Grevesse & Sauval 1998) for twobright Galactic A-type supergiants. Symbol identification as in Fig. 2.15, the symbol size codes the number ofspectral lines analysed. The error bars represent 1σ-uncertainties from the line-to-line scatter. The grey shadedarea marks the deduced metallicity of the objects within 1σ-errors. Non-LTE abundance analyses reveal a (scaled)solar abundance pattern, except for the light elements which have been affected by mixing with nuclear-processedmatter. From Przybilla et al. (2006a); Schiller & Przybilla (2008).
Figure 2.17: Comparison of spectrum synthesis (thin black line) with a high-resolution spectrum of the GalacticA-type supergiant HD 92207 (grey). The major spectral features are identified, short vertical marks designate Fe IIlines. The location of the diffuse interstellar band around 4430 A is indicated. With few exceptions, excellentagreement between theory and observation is found (Hγ is affected by the stellar wind in this highly luminousstar). From Przybilla et al. (2006a).

2.5 Near-IR Spectroscopy 21
A comprehensive view of abundances in two Galactic high-luminosity A-type supergiants is givenin Fig. 2.16. The non-LTE analysis gives a scaled solar composition for the heavier elements, andabundance patterns of the lighter elements characteristic for mixing with CN-processed matter. This isconsistent with what is expected for evolved massive Population I stars. Inappropriate LTE analyses onthe other hand tend to systematically underestimate iron group abundances and overestimate the lightand α-process element abundances by up to factors of 2–3 on the mean (most noticeable in HD 92207).Taking the LTE results at face value this would imply α-enhancement, a characteristic feature of oldPopulation II objects, which, however, is in sharp contrast to the young nature of the supergiants. Inother galaxies, where we have less-comprehensive independent information, such LTE analyses mayresult in misleading conclusions. Note that while many astrophysically important elements are coveredby our non-LTE calculations, the investigation of many other species is restricted to LTE in BA-SGs, asmodel atoms are unavailable at present. Considerable efforts will be required to complete the analysisinventory. On the other hand, model atoms for most observed ions in OB-stars are already available.
The precision achieved in the individual line analysis results in a highly consistent match of theentire synthetic spectrum with observation, see e.g. Fig. 2.17. Approximately 70% of the total numberof features in the optical and near-IR spectra of BA-type supergiants can be considered in non-LTE atpresent, and the rest in LTE. The coverage of features that can be treated in non-LTE is over 90% inOB-type stars at these wavelengths, see e.g. Przybilla et al. (2008b) and Fig. 5.1 for examples of thequality that can be achieved in fitting observed spectra.
Such comprehensive spectrum synthesis is a prerequisite for the analysis of medium-resolutionspectra, such as provided by multi-object spectrographs. Individual lines can often no longer be resolvedin that case. Possible applications include in particular the study of faint objects at larger distances likeOB-type main-sequence stars in the Magellanic Clouds or BA-type supergiants in galaxies beyond theLocal Group, see Sect. 6 for a discussion.
2.5 Near-IR Spectroscopy
Near-IR observations of early-type stars are a relatively new field to astronomy. They are motivatedby the desire to study star formation and young stellar populations throughout the Galactic disk and inthe Galactic Centre in particular – regions where strong extinction prohibits observations in the optical.Moreover, the field will grow in importance once the next generation of extremely large telescopes –the 42m-diameter European E-ELT, the 24m Giant Magellan Telescope (GMT) and the Thirty MeterTelescope (TMT) – comes into operation. These will rely on adaptive optics in order to facilitatediffraction-limited observations. As a consequence, they will be operated primarily in the near-IR,limited by technological feasibility and budget constraints.
Little information on quantitative near-IR spectroscopy of normal OB-type dwarfs/giants can befound in modern literature (Lenorzer et al. 2004; Repolust et al. 2005). Even less is known on BA-typesupergiants.
Problems with the models were indicated in the pioneering study of the Paschen and in particularthe Pfund series in the A-supergiant prototype Deneb (Aufdenberg et al. 2002), which were attributedto deficiencies in our understanding of the physics of stellar atmospheres. It was later shown (Przybilla& Butler 2004a) that this was in fact a result of inaccurate electron-impact excitation cross-sectionsused in the hydrogen model atom by Aufdenberg et al. (2002). The sensitivity of the near-IR lines ofhydrogen to the model assumptions is demonstrated in Fig. 2.18. This is because of the amplification

22 QUANTITATIVE SPECTROSCOPY
Figure 2.18: Modelling of hydrogen lines inthe near-IR, e.g. Br11 in the late B-SG β Ori,using different approaches according to the leg-end. Agreement between observation and the-ory can be obtained only in non-LTE whenelectron-impact excitation data from ab-initiocalculations are adopted. Non-LTE computa-tions using approximations for the evaluationof collisional bound-bound rates overpredictequivalent widths by a factor ∼2 in this case,while LTE modelling gives much too weaklines. Stellar parameters as determined from theanalysis in the optical have been adopted. Allthree models reproduce the higher Balmer linesequally well. From Przybilla & Butler (2004a).
of non-LTE effects in the Rayleigh-Jeans tail of the energy distribution of hot stars. The line sourcefunction may be written as
Sl =2hν3/c2
bi/bj exp(hν/kT )− 1, (2.1)
using standard nomenclature for physical constants. The source function is particularly sensitive tovariations in the ratio of the departure coefficients bi
|∆Sl| =∣∣∣∣ Slbi/bj − exp(−hν/kT )
∆(bi/bj)∣∣∣∣
hν/kT1≈
∣∣∣∣ Sl(bi/bj − 1) + hν/kT
∆(bi/bj)∣∣∣∣ (2.2)
when hν/kT is small, because the denominator can adopt values close to zero, amplifying effectsof a varying ∆(bi/bj). This makes near-IR lines in hot stars very susceptible to even small changesin the atomic data and details of the calculation. In fact, the bi vary by only several percent in theexample in Fig. 2.18, resulting in changes by a factor ∼2 in equivalent width. For the particular caseof Deneb, an excellent match of model and observation has been obtained in the meantime (Schiller &Przybilla 2008), see Fig. 2.19.
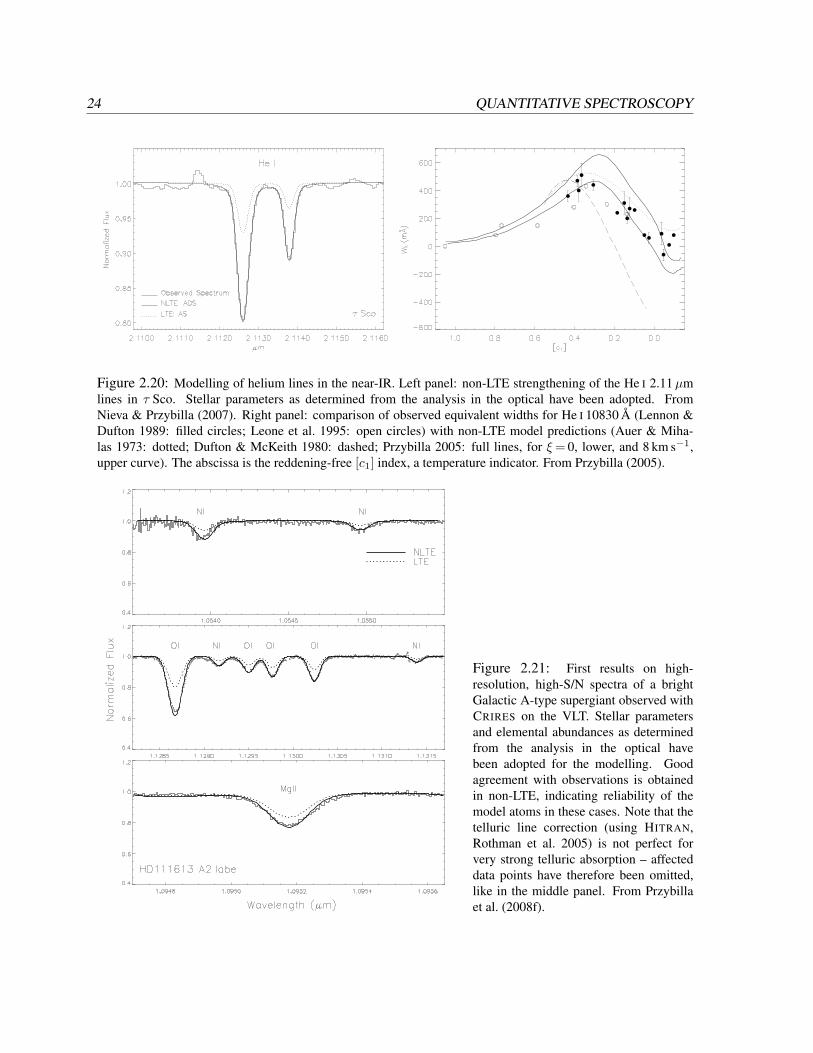
Similar sensitivities to details of the model calculations are also found for helium lines in hot stars(Przybilla 2005; Przybilla et al. 2005; Nieva & Przybilla 2007). Examples are shown in Fig. 2.20.Difficulties were found in earlier non-LTE studies of the He I λ10 830 A line: the observed trends ofWλ
as a function of Teff were not reproduced by the models, which predicted either too strong absorptionor strong emission. These problems were related to inaccurate photoionization cross-sections and theneglect of line blocking – they are reliably solved now.
Little is known about near-IR metal lines in OB-type stars and BA-SGs alike. Because of this,we initiated a pilot study on both kind of stars using the high-resolution near-IR spectrograph CRIRES
(Kaufl et al. 2004) on the ESO VLT. First results are encouraging, showing good agreement betweenanalyses from the near-IR spectra and previous modelling in the optical for some ions, see Fig. 2.21.However, huge efforts are still required to identify a number of photospheric absorption and emission

2.5 Near-IR Spectroscopy 23
Figure 2.19: Modelling (black lines) of the hydrogen lines in the visual and the near-IR spectrum (grey) of theGalactic A-SG Deneb (A2 Ia). Overall, excellent agreement is achieved. The synthetic spectra are calculated withDETAIL/SURFACE (photospheric lines) or FASTWIND (FW, wind-affected lines), as indicated, for the same stellarparameters. Some lines, as Pβ and Hβ, are noticeably affected by the wind. From Schiller & Przybilla (2008).
lines and to extend/test model atoms for the use in the near-IR. Basic work has to be accomplished todetermine all required atomic data for utilising near-IR transitions for quantitative studies in a compre-hensive way, as the current status is meagre (see e.g. Johansson 2005).
The models and analysis methodology introduced previously are not restricted to the two object classesdiscussed here. We have already used these with great success for quantitative analyses of main se-quence A-stars such as Vega (Przybilla 2002), chemically peculiar Bp stars (Przybilla et al. 2008c), sub-luminous B-stars (Przybilla et al. 2006b; Geier et al. 2007), extreme helium stars (Przybilla et al. 2005,2006c), the Sun and solar-type stars (Przybilla & Butler 2004b; Mashonkina et al. 2007).
24 QUANTITATIVE SPECTROSCOPY
Figure 2.20: Modelling of helium lines in the near-IR. Left panel: non-LTE strengthening of the He I 2.11µmlines in τ Sco. Stellar parameters as determined from the analysis in the optical have been adopted. FromNieva & Przybilla (2007). Right panel: comparison of observed equivalent widths for He I 10830 A (Lennon &Dufton 1989: filled circles; Leone et al. 1995: open circles) with non-LTE model predictions (Auer & Miha-las 1973: dotted; Dufton & McKeith 1980: dashed; Przybilla 2005: full lines, for ξ= 0, lower, and 8 km s−1,upper curve). The abscissa is the reddening-free [c1] index, a temperature indicator. From Przybilla (2005).
Figure 2.21: First results on high-resolution, high-S/N spectra of a brightGalactic A-type supergiant observed withCRIRES on the VLT. Stellar parametersand elemental abundances as determinedfrom the analysis in the optical havebeen adopted for the modelling. Goodagreement with observations is obtainedin non-LTE, indicating reliability of themodel atoms in these cases. Note that thetelluric line correction (using HITRAN,Rothman et al. 2005) is not perfect forvery strong telluric absorption – affecteddata points have therefore been omitted,like in the middle panel. From Przybillaet al. (2008f).
3 Observational Constraints on theEvolution of Massive Stars
A determination of accurate atmospheric parameters and elemental abundances for a larger sampleof objects allows tight observational constraints on evolution models for massive stars to be derived.The most rewarding observational indicators for an empirical verification of the models are surfaceabundances of the light elements that participate in the main fusion cycle: carbon, nitrogen, helium, and,to a lesser degree, oxygen. These allow the otherwise inaccessible (magneto-)hydrodynamic mixingprocesses in the stellar interior to be traced. These processes redistribute angular momentum, transportburning products from the core to the surface and replenish hydrogen, thus extending lifetimes andincreasing the stellar luminosity.
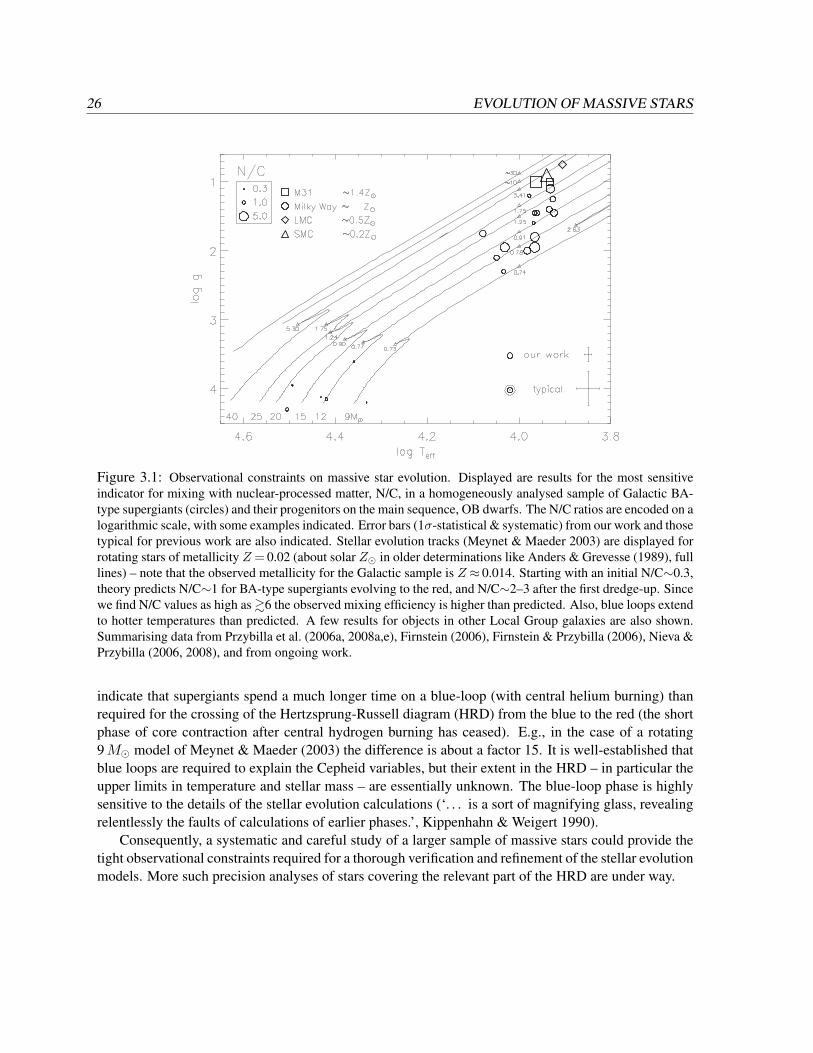
First results from an application of our analysis methodology to B-type dwarfs/giants and BA-type supergiants are summarised in Fig. 3.1. A comparison with evolution tracks is made. Most ofthe apparently slow-rotating B-stars show N/C ratios close to the pristine value of ∼0.3. A notableexception is τ Sco, which is a truly slow-rotating magnetic star (Donati et al. 2006). The situation ismore complex with the BA-SGs. They all exhibit slow rotation because of their expanded envelopes,irrespective of the initial rotational velocity of their progenitors on the main sequence. It appears thatthe objects at masses below ∼15M show larger amounts of nuclear-processed material than thosearound ∼20M. Larger N/C ratios are found again for the most massive objects of the sample. Notethat the sample objects of M & 30M are located either in the Magellanic Clouds or in M31, i.e. theyhave a different metallicity than the Galactic stars.
Two important conclusions can already be drawn from this sample. Let us concentrate first onthe objects more massive than ∼15M. A general trend of increased mixing of nuclear-processedmaterial with increasing stellar mass is found, in accordance with the predictions of evolution models(e.g. Heger & Langer 2000; Maeder & Meynet 2000). Moreover, the strongest mixing signature isfound for the most metal-poor object, AzV 475 in the Small Magellanic Cloud, also in agreement withtheory (e.g. Maeder & Meynet 2001). However, the mixing efficiency appears to be higher (by a factor∼2) than predicted by current state-of-the-art evolution computations for rotating stars with mass-loss.Stellar evolution models accounting for the interplay of rotation and magnetic fields may resolve thisdiscrepancy since they find a higher efficiency for chemical mixing (e.g. Maeder & Meynet 2005).
Larger N/C ratios at M . 15M can be explained if the objects are on a blue loop, i.e. if theyhave already undergone the first dredge-up during a previous phase as a red supergiant, in addition torotational mixing4. This interpretation is in contrast to earlier findings (e.g. Venn 1995b). Furthersupport for the blue-loop scenario comes from lifetime considerations. Stellar evolution calculations
4Also in this case an increased mixing efficiency, by about a factor 2, would be required.
25
26 EVOLUTION OF MASSIVE STARS
Figure 3.1: Observational constraints on massive star evolution. Displayed are results for the most sensitiveindicator for mixing with nuclear-processed matter, N/C, in a homogeneously analysed sample of Galactic BA-type supergiants (circles) and their progenitors on the main sequence, OB dwarfs. The N/C ratios are encoded on alogarithmic scale, with some examples indicated. Error bars (1σ-statistical & systematic) from our work and thosetypical for previous work are also indicated. Stellar evolution tracks (Meynet & Maeder 2003) are displayed forrotating stars of metallicity Z = 0.02 (about solar Z in older determinations like Anders & Grevesse (1989), fulllines) – note that the observed metallicity for the Galactic sample is Z ≈ 0.014. Starting with an initial N/C∼0.3,theory predicts N/C∼1 for BA-type supergiants evolving to the red, and N/C∼2–3 after the first dredge-up. Sincewe find N/C values as high as &6 the observed mixing efficiency is higher than predicted. Also, blue loops extendto hotter temperatures than predicted. A few results for objects in other Local Group galaxies are also shown.Summarising data from Przybilla et al. (2006a, 2008a,e), Firnstein (2006), Firnstein & Przybilla (2006), Nieva &Przybilla (2006, 2008), and from ongoing work.
indicate that supergiants spend a much longer time on a blue-loop (with central helium burning) thanrequired for the crossing of the Hertzsprung-Russell diagram (HRD) from the blue to the red (the shortphase of core contraction after central hydrogen burning has ceased). E.g., in the case of a rotating9M model of Meynet & Maeder (2003) the difference is about a factor 15. It is well-established thatblue loops are required to explain the Cepheid variables, but their extent in the HRD – in particular theupper limits in temperature and stellar mass – are essentially unknown. The blue-loop phase is highlysensitive to the details of the stellar evolution calculations (‘. . . is a sort of magnifying glass, revealingrelentlessly the faults of calculations of earlier phases.’, Kippenhahn & Weigert 1990).
Consequently, a systematic and careful study of a larger sample of massive stars could provide thetight observational constraints required for a thorough verification and refinement of the stellar evolutionmodels. More such precision analyses of stars covering the relevant part of the HRD are under way.
4 Observational Constraints onGalactochemical Evolution
Abundances of the heavier elements, from oxygen on, are unaffected by mixing in the course of stellarevolution in OB-type dwarfs/giants and BA-type supergiants. Also, chemical peculiarities are uncom-mon, as gravitational settling and/or radiative levitation apparently becomes effective only in stars ofspectral types later than about B2 on the main sequence (e.g. Smith 1996). As a consequence, massivestars can be used as tracers of pristine abundances for the variety of elements detectable in their spectra.
The results of the abundance analysis for the B-star and BA-type supergiant sample are discussednext, with particular emphasis on the context of Galactochemical evolution. Note that while our B-star sample is located in the solar neighbourhood, the distribution of the BA-SGs is extended, out todistances of ∼3 kpc. As a result, the B-stars should be almost unaffected by a Galactic abundancegradient, whereas some effects may be present for the BA-type supergiants. This has to be kept in mindin the following discussion.
The status of previous non-LTE abundance studies of early B-type stars in the solar neighbourhoodis illustrated in Fig. 4.1 (older LTE work is excluded). A wide range of abundance values is found formost elements, typically spanning∼1 dex in total (for comparison, such a range is bridged by the cumu-lative effect of ∼13 Gyrs of Galactochemical evolution, see e.g. Fig. 2 of Chiappini 2003). Moreover,the abundance distributions peak in most cases at sub-solar values, in particular when referring to thesolar composition of Grevesse & Sauval (1998). Exceptions are He, where most previous studies findvalues on average larger than solar, and Ne, which is about solar (Grevesse & Sauval 1998) as derivedin the two very recent studies by Cunha et al. (2006) and Morel & Butler (2008). Several of these olderB-star studies were combined by Snow & Witt (1996) and Sofia & Meyer (2001) to derive a referencecomposition, inevitably resulting in sub-solar average values and a large rms scatter (see Table 4.1). Theformer discrepancy has since been largely removed from a re-evaluation of solar abundances (Asplundet al. 2005). However, the status quo in terms of Galactochemical evolution can only be understoodby invoking and fine-tuning extra processes such as infall/outflow of material and local retention ofsupernova products by large amounts.
On the other hand, our sample of early B-stars implies a high degree of homogeneity for present-dayelemental abundances in the solar neighbourhood, with a scatter of∼10%, and absolute values of aboutsolar (Przybilla et al. 2008e). The only exception is nitrogen, which is most sensitive to mixing of theatmospheric layers with CN-processed material. In this case the pristine nitrogen abundance may beindicated by the 3 objects with the lowest value, implying a pristine N/C ratio of 0.31±0.05 (by mass;error bar adjusted to reflect additional uncertainties). Note that mixing with nuclear-processed materialwill also affect the carbon abundances (oxygen and neon are expected to remain essentially unaffecteduntil very late phases of stellar evolution). However, as the initial carbon abundance is much larger
27

28 GALACTOCHEMICAL EVOLUTION
Figure 4.1: Comparison of chemical abundance studies (non-LTE) of B-type stars in the solar neighbourhood.Red bars: present work; full line and thick full line (for the same stars as in our work): Kilian (1992, 1994); dotted:Cunha & Lambert (1994), Cunha et al. (2006) for Ne; short-dashed: Gies & Lambert (1992), excluding brightgiants and supergiants; long-dashed: Daflon et al. (1999, 2001a,b, 2003); dot-dashed: Morel & Butler (2008);triple-dot-dashed: Lyubimkov et al. (2004, 2005). Bin width is σ/2 of the individual studies. Iron abundanceswere derived assuming LTE in all previous work. Solar abundances are also indicated (, Grevesse & Sauval1998; Asplund et al. 2005: lower values). See text for details. From Przybilla et al. (2008e).
than the nitrogen abundance, little depletion is needed to produce a noticeable effect in nitrogen. Stellarevolution models (Meynet & Maeder 2003) predict depletion by up to ∼0.05 dex for stars of averagerotation (∼220 km s−1 on the main sequence) similar to our sample objects. Accounting for smallcorrections in the stars with N-enrichment, a pristine value of log C/H + 12 = 8.35±0.05 is indicated(Nieva & Przybilla 2008).
We regard our sample as representative for the early B-star population in the solar neighbourhood.The stars cover the relevant portion of the H-burning phase of the objects in the HRD in terms of Teff
and log g (see Fig. 3.1). They also sample one hemisphere of the solar neighbourhood (see Fig. 1 inPrzybilla et al. 2008e), half of them located in OB associations and the other half in the field. All 6 starswere analysed by Kilian (1992, 1994), which we regard as one of the most accurate previous studies interms of stellar parameter and abundance determination. Kilian’s values for the 6 stars typically spanthe entire abundance range in her sample of 21 stars (see Fig. 4.1). We therefore also find a chanceselection of stars with similar chemical composition for our sample unlikely. This is supported furtherby 6 BA-type supergiants in the solar neighbourhood (our ‘control sample’) – oxygen and magnesiumabundances of these stars (log O/H + 12 = 8.80±0.02 and log Mg/H + 12 = 7.55±0.07) closely matchthose from the B-stars. The wide abundance ranges found in previous work reflect the lower accuracyof the analyses, while shifts of the abundance distributions relative to each other reflect systematics,with different temperature scales being the most important among these.
The finding of chemical homogeneity for our sample is in excellent accordance with results fromthe analysis of the ISM gas-phase in the solar neighbourhood (Sofia 2004, and references therein)and with theory regarding the efficiency of hydrodynamic mixing in the ISM (Edmunds 1975; Roy
GALACTOCHEMICAL EVOLUTION 29
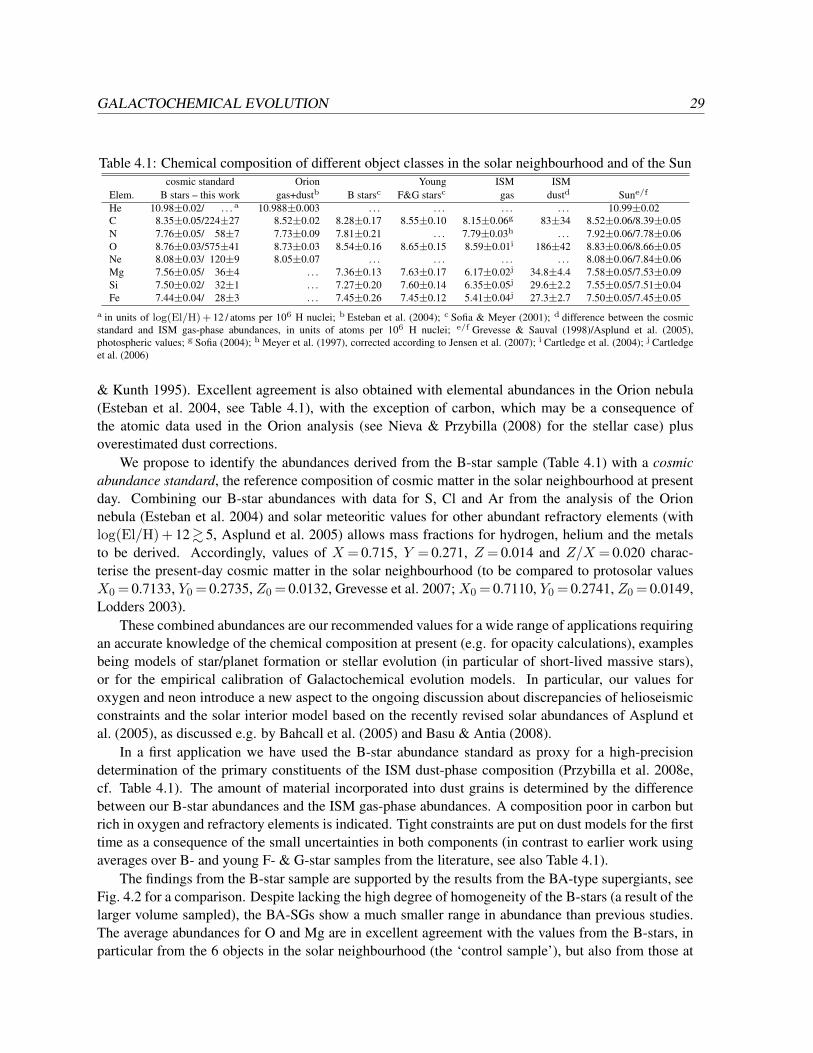
Table 4.1: Chemical composition of different object classes in the solar neighbourhood and of the Suncosmic standard Orion Young ISM ISM
Elem. B stars – this work gas+dustb B starsc F&G starsc gas dustd Sune/f
He 10.98±0.02/ . . . a 10.988±0.003 . . . . . . . . . . . . 10.99±0.02C 8.35±0.05/224±27 8.52±0.02 8.28±0.17 8.55±0.10 8.15±0.06g 83±34 8.52±0.06/8.39±0.05N 7.76±0.05/ 58±7 7.73±0.09 7.81±0.21 . . . 7.79±0.03h . . . 7.92±0.06/7.78±0.06O 8.76±0.03/575±41 8.73±0.03 8.54±0.16 8.65±0.15 8.59±0.01i 186±42 8.83±0.06/8.66±0.05Ne 8.08±0.03/ 120±9 8.05±0.07 . . . . . . . . . . . . 8.08±0.06/7.84±0.06Mg 7.56±0.05/ 36±4 . . . 7.36±0.13 7.63±0.17 6.17±0.02j 34.8±4.4 7.58±0.05/7.53±0.09Si 7.50±0.02/ 32±1 . . . 7.27±0.20 7.60±0.14 6.35±0.05j 29.6±2.2 7.55±0.05/7.51±0.04Fe 7.44±0.04/ 28±3 . . . 7.45±0.26 7.45±0.12 5.41±0.04j 27.3±2.7 7.50±0.05/7.45±0.05
a in units of log(El/H) + 12 / atoms per 106 H nuclei; b Esteban et al. (2004); c Sofia & Meyer (2001); d difference between the cosmicstandard and ISM gas-phase abundances, in units of atoms per 106 H nuclei; e/f Grevesse & Sauval (1998)/Asplund et al. (2005),photospheric values; g Sofia (2004); h Meyer et al. (1997), corrected according to Jensen et al. (2007); i Cartledge et al. (2004); j Cartledgeet al. (2006)
& Kunth 1995). Excellent agreement is also obtained with elemental abundances in the Orion nebula(Esteban et al. 2004, see Table 4.1), with the exception of carbon, which may be a consequence ofthe atomic data used in the Orion analysis (see Nieva & Przybilla (2008) for the stellar case) plusoverestimated dust corrections.
We propose to identify the abundances derived from the B-star sample (Table 4.1) with a cosmicabundance standard, the reference composition of cosmic matter in the solar neighbourhood at presentday. Combining our B-star abundances with data for S, Cl and Ar from the analysis of the Orionnebula (Esteban et al. 2004) and solar meteoritic values for other abundant refractory elements (withlog(El/H) + 12 & 5, Asplund et al. 2005) allows mass fractions for hydrogen, helium and the metalsto be derived. Accordingly, values of X = 0.715, Y = 0.271, Z = 0.014 and Z/X = 0.020 charac-terise the present-day cosmic matter in the solar neighbourhood (to be compared to protosolar valuesX0 = 0.7133, Y0 = 0.2735, Z0 = 0.0132, Grevesse et al. 2007; X0 = 0.7110, Y0 = 0.2741, Z0 = 0.0149,Lodders 2003).
These combined abundances are our recommended values for a wide range of applications requiringan accurate knowledge of the chemical composition at present (e.g. for opacity calculations), examplesbeing models of star/planet formation or stellar evolution (in particular of short-lived massive stars),or for the empirical calibration of Galactochemical evolution models. In particular, our values foroxygen and neon introduce a new aspect to the ongoing discussion about discrepancies of helioseismicconstraints and the solar interior model based on the recently revised solar abundances of Asplund etal. (2005), as discussed e.g. by Bahcall et al. (2005) and Basu & Antia (2008).
In a first application we have used the B-star abundance standard as proxy for a high-precisiondetermination of the primary constituents of the ISM dust-phase composition (Przybilla et al. 2008e,cf. Table 4.1). The amount of material incorporated into dust grains is determined by the differencebetween our B-star abundances and the ISM gas-phase abundances. A composition poor in carbon butrich in oxygen and refractory elements is indicated. Tight constraints are put on dust models for the firsttime as a consequence of the small uncertainties in both components (in contrast to earlier work usingaverages over B- and young F- & G-star samples from the literature, see also Table 4.1).
The findings from the B-star sample are supported by the results from the BA-type supergiants, seeFig. 4.2 for a comparison. Despite lacking the high degree of homogeneity of the B-stars (a result of thelarger volume sampled), the BA-SGs show a much smaller range in abundance than previous studies.The average abundances for O and Mg are in excellent agreement with the values from the B-stars, inparticular from the 6 objects in the solar neighbourhood (the ‘control sample’), but also from those at
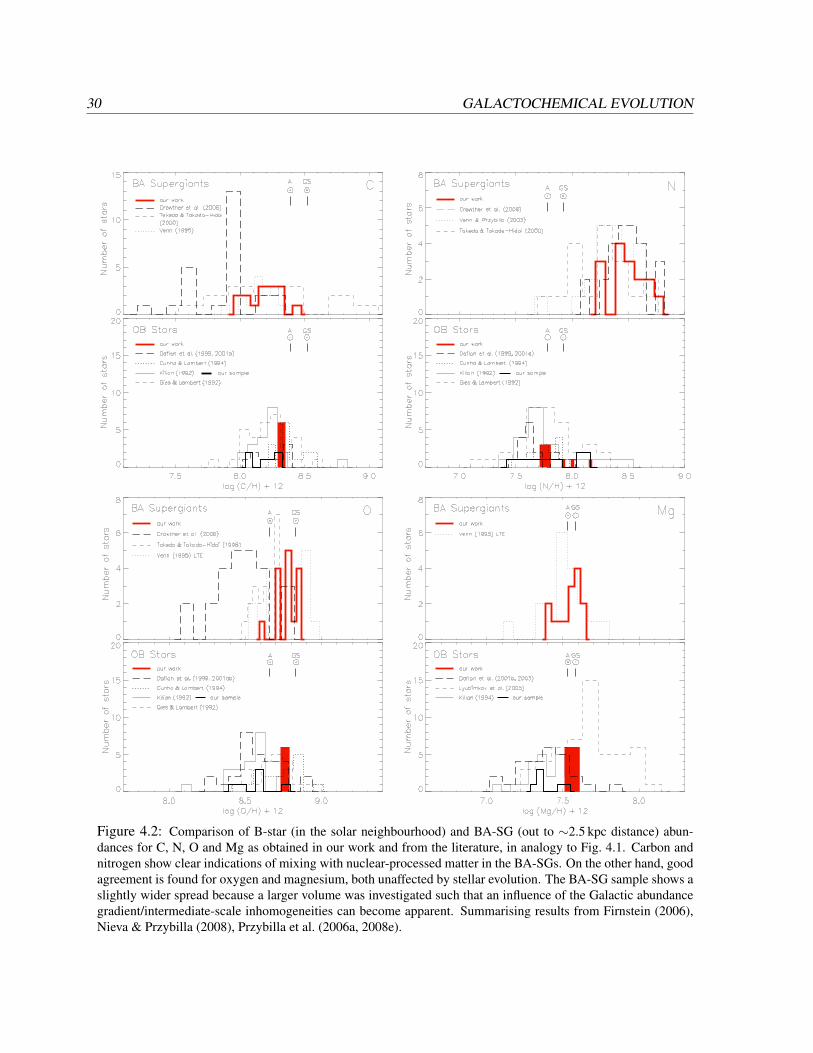
30 GALACTOCHEMICAL EVOLUTION
Figure 4.2: Comparison of B-star (in the solar neighbourhood) and BA-SG (out to ∼2.5 kpc distance) abun-dances for C, N, O and Mg as obtained in our work and from the literature, in analogy to Fig. 4.1. Carbon andnitrogen show clear indications of mixing with nuclear-processed matter in the BA-SGs. On the other hand, goodagreement is found for oxygen and magnesium, both unaffected by stellar evolution. The BA-SG sample shows aslightly wider spread because a larger volume was investigated such that an influence of the Galactic abundancegradient/intermediate-scale inhomogeneities can become apparent. Summarising results from Firnstein (2006),Nieva & Przybilla (2008), Przybilla et al. (2006a, 2008e).

GALACTOCHEMICAL EVOLUTION 31
Figure 4.3: The Galactic oxygen abundance gradient. Upper panel: detail of Fig. 1.1. Lower panel: first resultsfrom our work on BA-type supergiants (dots) and B-stars (triangles). Individual error bars are indicated (1-σ sta-tistical uncertainties), lines mark model predictions of Chiappini et al. (2001), see Fig. 1.1. A clear trend is foundand the scatter in abundance is dramatically reduced when typical systematic errors are eliminated. From thestars alone (baseline of ∼3 kpc) a flat Galactic oxygen abundance gradient of −0.007±0.016 dex kpc−1 is indi-cated. Excellent agreement with the work of Esteban et al. (2005) on H II regions (boxes) is found after applying acorrection of +0.08 dex – as adopted by Esteban et al. (2004) for Orion – to account for depletion on dust grains inthe nebulae. Using the combined sample of stars and H II regions the gradient becomes−0.028±0.009 dex kpc−1,extending the baseline to ∼4.5 kpc. Typically, a steeper gradient of about −0.07 dex kpc−1 is discussed in theliterature, see Gummersbach et al. (1998) for an overview. Data from Przybilla et al. (2006a, 2008e) and Firn-stein (2006).
larger distances. Carbon is depleted and nitrogen enriched as a consequence of the evolved state of thesupergiants. The upper limit of carbon abundances in the BA-SGs is consistent with the pristine valuederived from the B-stars, meeting a boundary condition imposed by mixing.
Consistency is achieved from two classes of indicators, which show completely different spectra(BA-SG spectra are dominated by neutral and single-ionized species, B-type stars by higher ioniza-tion stages). These first results imply that a re-interpretation of studies of massive, early-type starsin the context of Galactochemical evolution is required. It appears that previous findings of chemicalinhomogeneity (Figs. 1.1 & 4.2) were a result of the limited accuracy of the models and the analysismethodology (e.g. photometric temperatures) used. A much higher degree of homogeneity is indi-cated from our work, which needs verification for the solar neighbourhood from a larger sample ofobjects. The work also requires an extension to other regions of the Milky Way to study star clustersand OB associations.
Now we have the tools at hand to determine abundances to the precision necessary to derive unbi-ased elemental abundance gradients in the Milky Way. For the most part, relatively steep abundancegradients (of about −0.07 dex kpc−1, see e.g. Fig. 1.1 and Fig. 4.3, upper panel) are discussed in theliterature, see Gummersbach et al. (1998) for an overview. And, the abundance indicators usually show

32 GALACTOCHEMICAL EVOLUTION
a large scatter around the mean trend. On the other hand, our first results on the Galactic abundancegradient imply a flat gradient and little scatter, see Fig. 4.3 (lower panel) for an example of the dra-matic improvements that can be expected. Note that dust depletion introduces a source of systematicuncertainty to abundances determinations from H II regions for some elements, but it is irrelevant in thestellar case.
Such a flat abundance gradient is in accordance with the identification of the Milky Way as a barredspiral (e.g. Lopez-Corredoira et al. 2007). Barred spiral galaxies usually show shallow abundancegradients (e.g. Zaritsky et al. 1994), which may be attributed to homogenisation due to large-scale radialgas flows induced by the bar (e.g. Roberts et al. 1979). Assuming the flat gradient to be confirmed byanalysis of a larger sample of objects covering the entire extent of the Galactic disk this could removethe need to accept the Milky Way as an exception to the observed trend for barred spirals. An extensionof the analyses, also with regard to the elements considered, will provide tight observational constraintson Galactochemical evolution models and may guide future improvements of the modelling.
5 Hypervelocity Stars
Observational studies of the stellar dynamics in the central arcsecond of our Galaxy over the past∼15 years have provided strong evidence for the presence of a supermassive black hole (SMBH) inthe Galactic centre (GC), coinciding with the radio source Sgr A∗ (e.g. Schodel et al. 2002; Ghez etal. 2005). Three-body interactions of binary stars with the SMBH will inevitably lead to the ejection ofstars with velocities exceeding the escape velocity of our Galaxy5 (Hills 1988; Yu & Tremaine 2003),so-called hyper-velocity stars (HVSs). The GC is therefore the suspected place of origin of the HVSs.Brown et al. (2006a) estimated that the Galactic halo holds ∼2000 HVSs in a sphere of 120 kpc radius.If the GC hosts a tight binary of a SMBH and an intermediate-mass black hole (IMBH), the formationrate of HVSs is ten times larger (Yu & Tremaine 2003). The detection of a binary HVS would be thesmoking gun for a massive binary black hole, as a single SMBH cannot eject a binary star.
Hypervelocity stars are not only fascinating objects in their own right, but they may also be indica-tors of the properties of the SMBH in the GC and the surrounding stellar population. Moreover, HVSsare also regarded as valuable probes for the shape of the Galactic dark matter halo because of the uniquekinematic properties of stars expelled from the GC (Gnedin et al. 2005; Yu & Madau 2007). Becauseof the importance of HVSs to astrophysics it is mandatory to study HVSs in as much detail as possible.
The first HVSs have only recently been discovered serendipitously (Brown et al. 2005; Hirsch etal. 2005; Edelmann et al. 2005; Heber et al. 2008). A total of 17 faint blue stars at high Galactic latitudehave been identified as HVSs so far after a systematic search (see Brown et al. 2006a,b, 2007, 2008).Supposedly none is a binary star, as they all show constant radial velocities to within the measuringprecision. So far, the sample is too small to make comprehensive conclusions on the HVS popula-tion in general, in particular as little more information than photometry, radial velocities and a coarsespectral classification is available for most objects. The reason for this is the faintness of most HVSs(V & 18 mag), preventing them from being studied at high spectral resolution with telescopes of the8–10m-class. This will become feasible only with future extremely large telescopes.
However, a few HVSs are bright enough to be studied in detail. The aim is to characterise the stars(fundamental stellar and atmospheric parameters, elemental abundances) as thoroughly as possible inorder to allow a reliable determination of (spectroscopic) distances, lifetimes and the place of origin,to test Hills’ scenario for HVS ejection. In particular, high precision is required in the abundancedetermination, as the expected chemical signature – α-enhancement for stars born near the GC – differsfrom the solar composition (as typical for a disk star) by only a factor ∼2. Application of our improvednon-LTE modelling and analysis techniques provides the necessary precision, as discussed in Sect. 2.An example of the excellent quality of our final model fits to observation is shown in Fig. 5.1, results aresummarised in Table 5.1. We thus pioneer the field of quantitative spectroscopy of hyper-velocity stars.
5The partner of the original binary will end up in a tight orbit around the SMBH, like the members of the S star population(Lockmann et al. 2008).
33

34 HYPERVELOCITY STARS
Figure 5.1: Comparison of spectrum synthesis for HD 271791 (full line) with observation (grey). The upperpanels illustrate the excellent fit of Balmer and He I lines. The ionization equilibria of Si II/III, O I/II, S II/III andFe II/III are perfectly matched (lower panel, plus S III λ4361 A above). A selection of lines from most ions de-tected can be found in the panels. Note that all atmospheric features of the observed spectrum are simultaneouslyreproduced by the final model spectrum. Abscissa is wavelength (in A), ordinate is normalised flux. InterstellarCa II lines are marked by an asterisk. From Przybilla et al. (2008d).
Table 5.1: Properties of three hyper-velocity starsHE 0437−5439 HD 271791 HVS 7
Type early B-dwarf early B-giant Bp starV (mag) 16.36 12.26 17.80Teff (K) 23 000±1000 18 000±500 12 000±500log g (cgs) 3.95±0.10 3.10±0.10 3.80±0.10v sin i (km s−1) 55±2 124±2 55±2vrad (km s−1) +723±3 +441±1 +529±2M/M 9.1±0.8 11±1 3.7±0.2τevol (Myr) 18±3 25±5 150±10d (kpc) 61±9 21±4 59±6
HE 0437−5439 (HVS 3). HE 0437−5439 was discovered by Edelmann et al. (2005) to be a hyper-velocity star located at a distance of d= 61 kpc. A heliocentric velocity vrad of +723 km s−1 (seeTable 5.1) is found for this early B-type dwarf, corresponding to a Galactic rest-frame velocity of at least563 km s−1 (this value increases for non-zero proper motion). From a kinematic analysis Edelmann etal. (2005) concluded that this star originated in the Large Magellanic Cloud (LMC), because the time offlight from the Galactic Centre would exceed the age of the star (τevol, Table 5.1) by a factor of ∼3–4.A precise abundance determination may constrain this hypothesis further, as the baseline metallicity ofthe LMC (about half solar) differs significantly from the chemical signature of stars in the GC.
We analysed high resolution spectra of HE 0437−5439 obtained with UVES on the ESO VLT (Przy-billa et al. 2008b). A comparison of the derived abundance pattern with the GC reference compositionand our analysis results for two objects from the LMC and the solar neighbourhood is shown in Fig. 5.2.

HYPERVELOCITY STARS 35
Figure 5.2: Comparison of metal abundances in HE 0437−5439 (dots) with a sample of stars close to the GC(triangles) in the upper panel, the LMC reference star NGC 2004-D15 (diamonds) in the middle panel, and thesolar neighbourhood reference star HR 3468 (circles) in the lower panel. Solar reference abundances are adoptedfrom Grevesse & Sauval (1998). Error bars account for statistic and systematic uncertainties. The chemicalsignature of HE 0437−5439 does not show α-enhancement along with solar iron abundance, excluding a GCorigin. The abundance pattern is compatible with ejection from the LMC, however an origin in the outskirts ofthe Galactic disk cannot be ruled out from the chemical signature alone. From Przybilla et al. (2008b).
The abundance pattern of HE 0437−5439 rules out the Galactic Centre as its place of birth. The LMC isthe most likely place of origin. An ejection velocity of about 1000 km s−1 is implied for HE 0437−5439in order for it to have reached its position from the LMC within its lifetime.
This requires an alternative ejection mechanism since no SMBH is known in the LMC. Dynamicalejection from a massive, dense star cluster (Leonard 1991) would be an option that needs further in-vestigation. Candidate clusters within the LMC that are massive and dense enough, and that also havethe right age, are NGC 2100, NGC 2004, NGC 1850 and NGC 1847. Alternatively, the disruption ofa binary system by an IMBH of &103M may be capable of accelerating one of the components tothe observed high velocity (Gualandris & Portegies Zwart 2007). Again, dense clusters like NGC 2100or NGC 2004 are suggested to harbour such a – so far unknown – IMBH (Gualandris & PortegiesZwart 2007). A measurement of the proper motion of HE 0437−5439 is required to trace its orbit foran unambiguous identification of its place of origin.
SDSS J113312.12+010824.9 (HVS 7). HVS 7 is a late B-type HVS discovered by Brown et al. (2006b),which may be an intermediate-mass main-sequence object or alternatively a low-mass horizontal branchstar. Located at a distance of 59 kpc (in the main-sequence case) the star shows a Galactic rest-framevelocity of at least 421 km s−1.
We analysed high-resolution spectra of HVS 7 obtained with UVES on the ESO VLT (Przybilla etal. 2008c). The star has a very low helium content of ∼1/100 solar. It is underabundant in the light

36 HYPERVELOCITY STARS
Figure 5.3: Abundance pattern of HVS 7, relative to solar values (Grevesse & Sauval 1998), compared withmagnetic CP stars. Symbols are identified in the legend. The error bars represent statistical 1σ-uncertainties fromthe line-to-line scatter. Realistic errors, accounting for systematic effects (e.g. if a magnetic field were present),are expected to be larger. Upper limits are indicated by arrows. Asterisks mark abundances for the Cl-Co-richB9p star HR 1094 (Nielsen & Wahlgren 2000) and grey bars abundance ranges observed in a sample of magneticCP stars (Lopez-Garcıa et al. 2001). From Przybilla et al. (2008c).
elements (C, N and O are below the detection limit) but shows strong enrichment of heavy elements(factors up to ∼10 000 times solar for rare-earth elements and mercury), see Fig. 5.3. The derivedabundance pattern of HVS 7 is characteristic of the class of chemical peculiar magnetic B stars onthe main sequence. However, the presence of chlorine and strong phosphorus and cobalt lines in thespectrum of HVS 7 is unusual even for CP stars. The chemical composition and high projected rotationvelocity v sin i= 55 km s−1 make it unlikly that HVS 7 is a low-mass blue horizontal branch star.
Such a surface abundance pattern is caused by atomic diffusion (from the interplay of gravitationalsettling and radiative levitation) in a possibly magnetically stabilised6, non-convective atmosphere.Hence all chemical information on the star’s place of birth and its evolution has been washed out.High-precision astrometry for a determination of the proper motion is the only means to validate a GCorigin for HVS 7.
HD 271791. HD 271791 is an early B-type HVS at a distance of about 20 kpc, discovered by Heber etal. (2008). This is the only HVS for which a proper motion has been measured with sufficient accuracy.Its Galactic rest-frame velocity is about 600 km s−1, hence the star is unbound. From its 3D-space mo-tion Heber et al. (2008) concluded that this star has originated in the outer rim of the Galactic disk (seeFig. 4 in that paper), which excludes the SMBH slingshot mechanism. In order to find an alternativeejection scenario a detailed abundance analysis is required.
6We derive an upper limit of about 3 kG for the stellar magnetic field from identifying the observed microturbulencevelocity with the extra broadening of metal lines due to the Zeeman effect (Kupka et al. 1996). This may put valuableconstraints on magnetic fields in the GC if HVS 7 could be proven to be of GC origin and the field as being of fossil origin(note that the star S2 near the GC is also suggested to be magnetic, Martins et al. 2008).

HYPERVELOCITY STARS 37
Figure 5.4: Elemental abundance pattern of HD 271791 (dots, relative to solar (Grevesse & Sauval 1998) as afunction of atomic number Z, normalised to Fe) compared to hyper-/supernova yields of Nomoto et al. (2006).Error bars account for statistical and systematic uncertainties of 0.1 dex, summed in quadrature. See text fordetails. From Przybilla et al. (2008d).
We analysed high resolution spectra obtained with FEROS on the 2.2m Max-Planck-ESO telescopein La Silla (Przybilla et al. 2008d). Figure 5.1 shows a few examples of the excellent fit quality achievedwith the final synthetic spectrum. The abundance pattern of HD 271791 is exceptional: sub-solar ironalong with enhancement of the α-elements is found, making HD 271791 the first massive Population Istar outside the GC (though at low [Fe/H]) to show such characteristics.
The low iron abundance is consistent with the birth place of the star indeed being located in themetal-poor outer rim of the Galactic disk. On the other hand, α-enhancement indicates capture ofnucleosynthesis products from a core-collapse supernova (SN), as reported e.g. for the secondary inthe low-mass X-ray binary Nova Scorpii 1994 (Israelian et al. 1999). This implies that HD 271791 isthe surviving secondary of a massive binary system disrupted in a supernova explosion. No such run-away star (scenario of Blaauw 1961) has ever been found to exceed the Galactic escape velocity, henceHD 271791 is the first hyper-runaway star. Such a run-away scenario has therefore to be viewed as analternative to the Hills mechanism for the acceleration of some HVSs with moderate velocities. Theobserved chemical composition of HD 271791 puts invaluable observational constraints on nucleosyn-thesis in a supernova from the core-collapse of a very massive star (MZAMS & 55M), which may beobserved as a gamma-ray burst of the long-duration/soft-spectrum type.
A plausible evolutionary scenario for the binary system was developed (Przybilla et al. 2008d), con-sisting of a Wolf-Rayet primary (of WC type) and a main-sequence B-type secondary (HD 271791) inclose orbit previous to the system’s disruption. The final collapse of the WC star into a black hole (Hegeret al. 2003) resulted in an ordinary type Ic SN or a more energetic hypernova (HN). Nucleosynthesisproducts were accreted from the expanding SN-shell onto the secondary (Fryxell & Arnett 1981). Also
38 HYPERVELOCITY STARS
interaction with fall-back material from the explosion could have been significant (Podsiadlowski etal. 2002). Later, the accreted material was partially mixed with unpolluted matter from the secondary’sdeeper layers (and possibly with CN-processed material from its core).
A comparison of the model predictions (using HN-/SN-yields of Nomoto et al. 2006) with observa-tion is shown in Fig. 5.4. Overall, reasonable agreement between the model predictions and observationis obtained, except that too large a magnesium and too low a silicon abundance are predicted. However,this is likely an artifact of the use of integrated yields. More realistic is a latitudinal dependency ofthe ejecta composition in the likely case of an aspherical explosion (Maeda et al. 2008) and a stratifiedabundance distribution in the ejecta. Hydrodynamic instabilities at the trailing edge of the SN-shellwill preferentially lead to an accretion of material from the inner shell on the secondary (Fryxell &Arnett 1981), which is rich in silicon and depleted in magnesium (e.g. Maeda et al. 2002). Tailorednucleosynthesis calculations for this particular case and a detailed hydrodynamical simulation of theSN-shell–secondary interaction have since been initiated.
Conclusions. The precision analysis of high-resolution spectra of hyper-velocity stars has uncoveredthree highly interesting objects, though none could be unambiguously related to a GC origin. Contraryto expectation, one HVS was shown to originate in the outskirts of the Milky Way and another highlylikely to have come from the LMC, providing evidence that alternative scenarios to Hills’ slingshotmechanism are also in operation. It has already become clear, even at this early stage, that the field ofhyper-velocity stars is much more complex than one may initially have thought.
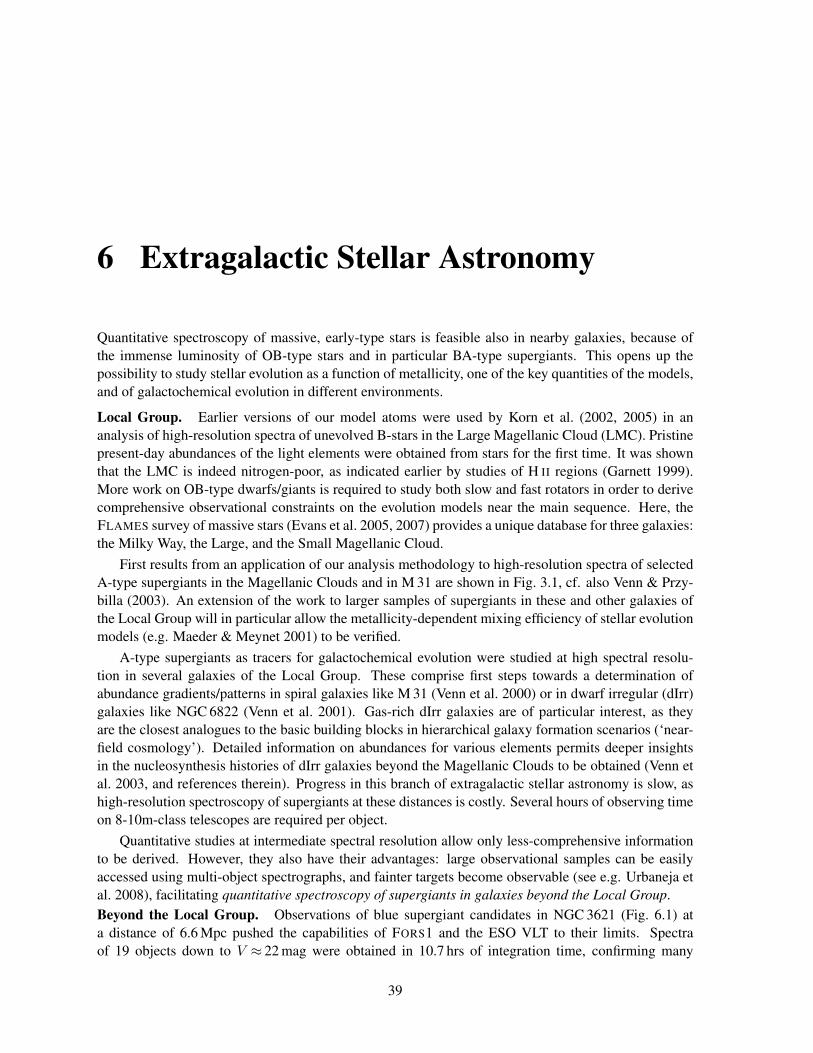
6 Extragalactic Stellar Astronomy
Quantitative spectroscopy of massive, early-type stars is feasible also in nearby galaxies, because ofthe immense luminosity of OB-type stars and in particular BA-type supergiants. This opens up thepossibility to study stellar evolution as a function of metallicity, one of the key quantities of the models,and of galactochemical evolution in different environments.
Local Group. Earlier versions of our model atoms were used by Korn et al. (2002, 2005) in ananalysis of high-resolution spectra of unevolved B-stars in the Large Magellanic Cloud (LMC). Pristinepresent-day abundances of the light elements were obtained from stars for the first time. It was shownthat the LMC is indeed nitrogen-poor, as indicated earlier by studies of H II regions (Garnett 1999).More work on OB-type dwarfs/giants is required to study both slow and fast rotators in order to derivecomprehensive observational constraints on the evolution models near the main sequence. Here, theFLAMES survey of massive stars (Evans et al. 2005, 2007) provides a unique database for three galaxies:the Milky Way, the Large, and the Small Magellanic Cloud.
First results from an application of our analysis methodology to high-resolution spectra of selectedA-type supergiants in the Magellanic Clouds and in M 31 are shown in Fig. 3.1, cf. also Venn & Przy-billa (2003). An extension of the work to larger samples of supergiants in these and other galaxies ofthe Local Group will in particular allow the metallicity-dependent mixing efficiency of stellar evolutionmodels (e.g. Maeder & Meynet 2001) to be verified.
A-type supergiants as tracers for galactochemical evolution were studied at high spectral resolu-tion in several galaxies of the Local Group. These comprise first steps towards a determination ofabundance gradients/patterns in spiral galaxies like M 31 (Venn et al. 2000) or in dwarf irregular (dIrr)galaxies like NGC 6822 (Venn et al. 2001). Gas-rich dIrr galaxies are of particular interest, as theyare the closest analogues to the basic building blocks in hierarchical galaxy formation scenarios (‘near-field cosmology’). Detailed information on abundances for various elements permits deeper insightsin the nucleosynthesis histories of dIrr galaxies beyond the Magellanic Clouds to be obtained (Venn etal. 2003, and references therein). Progress in this branch of extragalactic stellar astronomy is slow, ashigh-resolution spectroscopy of supergiants at these distances is costly. Several hours of observing timeon 8-10m-class telescopes are required per object.
Quantitative studies at intermediate spectral resolution allow only less-comprehensive informationto be derived. However, they also have their advantages: large observational samples can be easilyaccessed using multi-object spectrographs, and fainter targets become observable (see e.g. Urbaneja etal. 2008), facilitating quantitative spectroscopy of supergiants in galaxies beyond the Local Group.Beyond the Local Group. Observations of blue supergiant candidates in NGC 3621 (Fig. 6.1) ata distance of 6.6 Mpc pushed the capabilities of FORS1 and the ESO VLT to their limits. Spectraof 19 objects down to V ≈ 22 mag were obtained in 10.7 hrs of integration time, confirming many
39
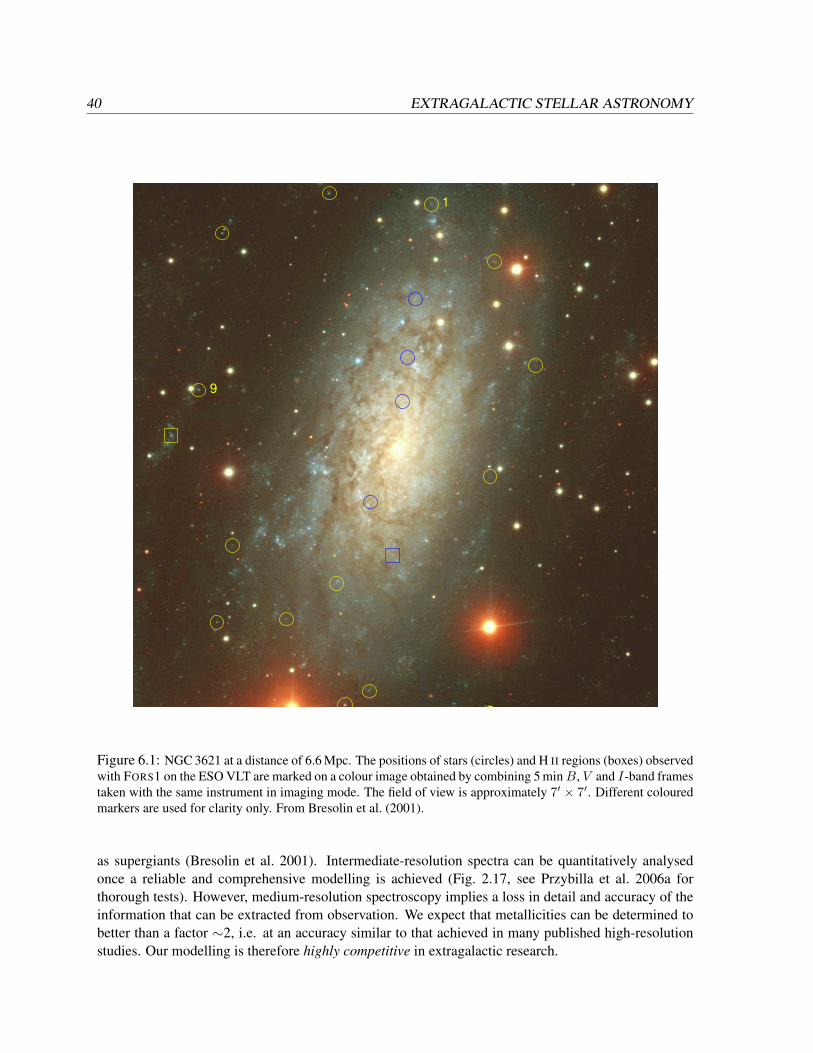
40 EXTRAGALACTIC STELLAR ASTRONOMY
1
9
Figure 6.1: NGC 3621 at a distance of 6.6 Mpc. The positions of stars (circles) and H II regions (boxes) observedwith FORS1 on the ESO VLT are marked on a colour image obtained by combining 5 minB, V and I-band framestaken with the same instrument in imaging mode. The field of view is approximately 7′ × 7′. Different colouredmarkers are used for clarity only. From Bresolin et al. (2001).
as supergiants (Bresolin et al. 2001). Intermediate-resolution spectra can be quantitatively analysedonce a reliable and comprehensive modelling is achieved (Fig. 2.17, see Przybilla et al. 2006a forthorough tests). However, medium-resolution spectroscopy implies a loss in detail and accuracy of theinformation that can be extracted from observation. We expect that metallicities can be determined tobetter than a factor ∼2, i.e. at an accuracy similar to that achieved in many published high-resolutionstudies. Our modelling is therefore highly competitive in extragalactic research.

EXTRAGALACTIC STELLAR ASTRONOMY 41
Figure 6.2: Left: Metallicity [Z] as a function of angular galactocentric distance ρ/ρ0 for A-SGs (filled circles)and early B-SGs (filled squares) in NGC 300. The dashed line represents the regression discussed in the text.Note that typical uncertainties in [Z] are ±0.2 dex. Right: Interstellar reddening E(B − V ) distribution of A-SGtargets in NGC 300. From Kudritzki et al. (2008).
Such studies can be extended to larger samples of objects covering the entire extent of galaxies.This allows the results from the only indicators used so far, luminous H II nebulae, to be verified andextended. The most detailed study in this respect is on NGC 300, a spiral galaxy in the nearby SculptorGroup observed within the Araucaria project (Gieren et al. 2005). A total of 30 blue supergiants have sofar been analysed (Bresolin et al. 2002; Urbaneja et al. 2005; Kudritzki et al. 2008), including 24 BA-type supergiants which were studied using modelling techniques developed by Przybilla et al. (2006a).A metallicity gradient of −0.08 dex kpc−1 is derived for this Sc-type spiral, see Fig. 6.2.
Abundances from nebulae are in most cases derived by strong-line methods, i.e. empirical cor-relations between line ratios and abundance are used (like the R23-index for oxygen), as the spectralfeatures necessary for a direct analysis are often not observed because of their weakness. It turns outthat absolute abundances and the abundance gradient from nebulae depend strongly on the calibration.Several of the most-widely used calibrations from the literature fail to achieve consistency with thestellar indicators: nebular abundances may be too large by up to a factor 2–3, and they may indicate anabundance gradient that is too steep (see Urbaneja et al. 2005 for details). Such discrepancies have alsobeen found in other galaxies, from detailed analyses of H II regions (Kennicutt et al. 2003; Bresolin etal. 2004b). The presence of systematic bias in abundance studies based on photoionization models isalso indicated (Stasinska 2005), in particular for metal-rich nebulae.
These examples indicate that the presently available observational constraints on galactochemicalevolution (based on analyses of H II regions) may potentially be subject to serious systematic error,implying severe deficits in our preset-day understanding of galaxy evolution. Accurate analyses ofextragalactic BA-type supergiants using our models have an enormous potential to improve on this,promising to provide thorough constraints for galactochemical evolution models.
Blue Supergiants & the Extragalactic Distance Scale. Blue supergiants allow not only for a determi-nation of stellar metallicities, but also for the derivation of interstellar reddening and extinction in othergalaxies. As an example, an averaged reddening of ∼0.12 mag is obtained for NGC 300, however witha large variation from 0.07 to 0.24 mag (see Fig. 6.2), which impacts Cepheid distances if not prop-
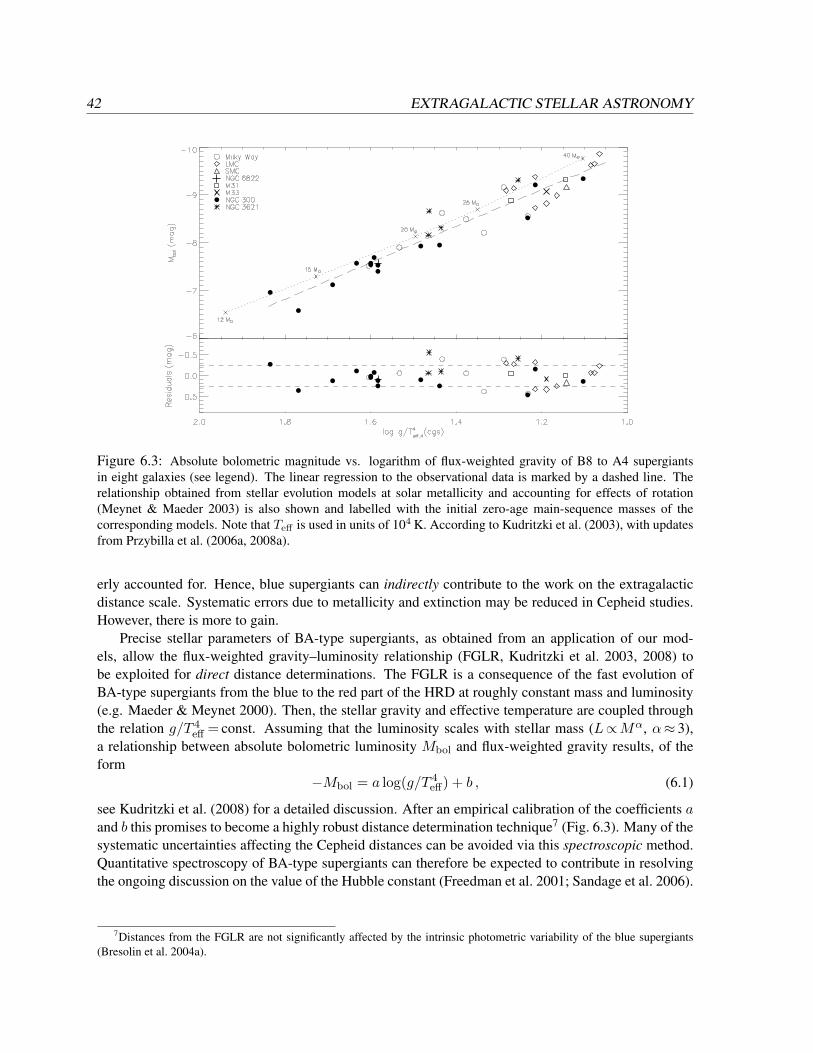
42 EXTRAGALACTIC STELLAR ASTRONOMY
Figure 6.3: Absolute bolometric magnitude vs. logarithm of flux-weighted gravity of B8 to A4 supergiantsin eight galaxies (see legend). The linear regression to the observational data is marked by a dashed line. Therelationship obtained from stellar evolution models at solar metallicity and accounting for effects of rotation(Meynet & Maeder 2003) is also shown and labelled with the initial zero-age main-sequence masses of thecorresponding models. Note that Teff is used in units of 104 K. According to Kudritzki et al. (2003), with updatesfrom Przybilla et al. (2006a, 2008a).
erly accounted for. Hence, blue supergiants can indirectly contribute to the work on the extragalacticdistance scale. Systematic errors due to metallicity and extinction may be reduced in Cepheid studies.However, there is more to gain.
Precise stellar parameters of BA-type supergiants, as obtained from an application of our mod-els, allow the flux-weighted gravity–luminosity relationship (FGLR, Kudritzki et al. 2003, 2008) tobe exploited for direct distance determinations. The FGLR is a consequence of the fast evolution ofBA-type supergiants from the blue to the red part of the HRD at roughly constant mass and luminosity(e.g. Maeder & Meynet 2000). Then, the stellar gravity and effective temperature are coupled throughthe relation g/T 4
eff = const. Assuming that the luminosity scales with stellar mass (L∝Mα, α≈ 3),a relationship between absolute bolometric luminosity Mbol and flux-weighted gravity results, of theform
−Mbol = a log(g/T 4eff) + b , (6.1)
see Kudritzki et al. (2008) for a detailed discussion. After an empirical calibration of the coefficients aand b this promises to become a highly robust distance determination technique7 (Fig. 6.3). Many of thesystematic uncertainties affecting the Cepheid distances can be avoided via this spectroscopic method.Quantitative spectroscopy of BA-type supergiants can therefore be expected to contribute in resolvingthe ongoing discussion on the value of the Hubble constant (Freedman et al. 2001; Sandage et al. 2006).
7Distances from the FGLR are not significantly affected by the intrinsic photometric variability of the blue supergiants(Bresolin et al. 2004a).

Bibliography
Albayrak, B. 2000, A&A, 364, 237
Allen, C. 1973, Astrophysical Quantities, 3rd ed. (Athlone Press, London)
Anders, E., Grevesse, N. 1989, Geochim. Cosmochim. Acta, 53, 197
Asplund, M., Grevesse, N., Sauval, A. J. 2005, in: T. G. Barnes III, F. N. Bash (eds.), Cosmic Abundances asRecords of Stellar Evolution and Nucleosynthesis (ASP, San Francisco), 25
Auer, L. H., Mihalas, D. 1973, ApJS, 25, 433
Aufdenberg, J. P., Hauschildt, P. H., Baron, E., et al. 2002, ApJ, 570, 344
Bahcall, J. N., Basu, S., Pinsonneault, M., Serenelli, A. M. 2005, ApJ, 618, 1049
Basu, S., Antia, H. M. 2008, Phys. Rep., 457, 217
Becker, S. R. 1998, in: I. D. Howarth (ed.), Boulder-Munich II: Properties of Hot, Luminous Stars (ASP, SanFrancisco), 137
Becker, S. R., Butler, K. 1988, A&A, 201, 232
Bensby, T., Feltzing, S., Lundstrom, I. 2003, A&A, 410, 527
Blaauw, A. 1961, Bull. Astron. Inst. Netherlands, 15, 265
Bresolin, F., Kudritzki, R. P., Mendez, R. H., Przybilla, N. 2001, ApJ, 548, L159
Bresolin, F., Gieren, W., Kudritzki, R. P., Pietrzynski, G., Przybilla, N. 2002, ApJ, 567, 277
Bresolin, F., Pietrzynski, G., Gieren, W., Kudritzki, R. P., Przybilla, N., Fouque, P. 2004a, ApJ, 600, 182
Bresolin, F., Garnett, D. R., Kennicutt, R. C., Jr. 2004b, ApJ, 615, 228
Brown, W. R., Geller, M. J., Kenyon, S. J., Kurtz, M. J. 2005, ApJ, 622, L33
Brown, W. R., Geller, M. J., Kenyon, S. J., Kurtz, M. J. 2006a, 640, L35
Brown, W. R., Geller, M. J., Kenyon, S. J., Kurtz, M. J. 2006b, 647, 303
Brown, W. R., Geller, M. J., Kenyon, S. J., Kurtz, M. J., Bromley, B. C. 2007, ApJ, 671, 1708
Brown, W. R., Geller, M. J., Kenyon, S. J. 2008, ApJ, submitted (arXiv:0808.2469[astro-ph])
Burbidge, E. M., Burbidge, G. R., Fowler, W. A., Hoyle, F. 1957, Rev. Modern Phys., 29, 547
Butler, K., Giddings, J. R. 1985, Newsletter on Analysis of Astronomical Spectra, No. 9 (Univ. London)
Cameron, A. G. 1957, PASP, 69, 201
Cartledge, S. I. B., Lauroesch, J. T., Meyer, D. M., Sofia, U. J. 2004, ApJ, 613, 1037
Cartledge, S. I. B., Lauroesch, J. T., Meyer, D. M., Sofia, U. J. 2006, ApJ, 641, 327
Cayrel, R., Depagne, E., Spite, M., et al. 2004, A&A, 416, 1117
Cescutti, G., Matteucci, F., Francois, P., Chiappini, C. 2007, A&A, 462, 943
43
44 BIBLIOGRAPHY
Chiappini, C., Matteucci, F., Romano, D. 2001, ApJ, 554, 1044
Chiappini, C., Romano, D., Matteucci, F. 2003, MNRAS, 339, 63
Cox, A. 2000, Allen’s Astrophysical Quantities (Springer Verlag, Berlin)
Crowther, P. A., Lennon, D. J., Walborn, N. R. 2006, A&A, 446, 279
Cunha, K., Lambert, D. L. 1994, ApJ, 426, 170
Cunha, K., Hubeny, I., & Lanz, T. 2006, ApJ, 647, L143
Daflon, S., Cunha, K. 2004, ApJ, 617, 1115
Daflon, S., Cunha, K., Becker, S. R. 1999, ApJ, 522, 950
Daflon, S., Cunha, K., Becker, S. R., Smith, V. V. 2001a, ApJ, 552, 309
Daflon, S., Cunha, K., Butler, K., Smith, V. V. 2001b, ApJ, 563, 325
Daflon, S., Cunha, K., Smith, V. V., Butler, K. 2003, A&A, 399, 525
Dekker, H., D’Odorico, S., Kaufer, A., Delabre, B., Kotzlowski, H. 2000, Proc. SPIE, 4008, 534
Donati, J.-F., Howarth, I. D., Jardine, M. M., et al. 2006, MNRAS, 370, 629
Dufton, P. L., McKeith, C. D. 1980, A&A, 81, 8
Dufton, P. L., Brown, P. J. F., Lennon, D. J., Lynas-Gray, A. E. 1986, MNRAS, 222, 713
Edelmann, H., Napiwotzki, R., Heber, U., Christlieb, N., Reimers, D. 2005, ApJ, 634, L181
Edmunds, M. G. 1975, Ap&SS, 32, 483
Edvardsson, B., Andersen, J., Gustafsson, B., et al. 1993, A&A, 275, 101
Esteban, C., Peimbert, M., Garcıa-Rojas, J., et al. 2004, MNRAS, 355, 229
Esteban, C., Garcıa-Rojas, J., Peimbert, M., et al. 2005, ApJ, 618, L95
Evans, C. J., Smartt, S. J., Lee J. K., et al. (Przybilla, N.) 2005, A&A, 437, 467
Evans, C. J., Lennon, D. J., Smartt, S. J., Trundle, C. 2007, A&A, 464, 289
Faber, S. M., Phillips, A. C., Kibrick, R. I., et al. 2003, Proc. SPIE, 4841, 1657
Firnstein, M. 2006, Diploma Thesis, Univ. Erlangen-Nuremberg
Firnstein, M., Przybilla, N. 2006, Proceedings of Science, PoS(NIC-IX)095
Freedman, W. L., Madore, B. F., Gibson, B. K. 2001, ApJ, 553, 47
Fryxell, B. A., Arnett, W. D. 1981, ApJ, 243, 994
Fuhrmann, K. 1998, A&A, 338, 161
Fuhrmann, K. 2008, MNRAS, 384, 173
Garnett, D. R. 1999, in: Y.-H. Chu, N. Suntzeff, J. Hesser, D. Bohlender (eds.), New Views of the MagellanicClouds (ASP, San Francisco), 266
Garnett, D. R. 2004, in: C. Esteban, R. J. Garcıa Lopez, A. Herrero, F. Sanchez (eds.), Cosmochemistry (Cam-bridge University Press, Cambridge), 171
Geier, S., Nesslinger, S., Heber, U., Przybilla, N., Napiwotzki, R., Kudritzki, R. P. 2007, A&A, 464, 299
Ghez, A. M., Salim, S., Hornstein, S. D., et al. 2005, ApJ, 620, 744
Giddings, J. R. 1981, Ph. D. Thesis, Univ. London
Gieren, W., Pietrzynski, G. Bresolin, F., et al. 2005, ESO Messenger, 121, 23
Gies, D. R., Lambert, D. L. 1992, ApJ, 387, 673

BIBLIOGRAPHY 45
Gnedin, O. Y., Gould, A., Miralda-Escude, J., Zentner, A. R. 2005, ApJ, 634, 344
Gratton, R. G., Carretta, E., Claudi, R., Lucatello, S., Barbieri, M. 2003, A&A, 404, 187
Grevesse, N., Sauval, A. J. 1998, Space Sci. Rev., 85, 161
Grevesse, N., Asplund, M., Sauval, A. J. 2007, Space Sci. Rev., 130, 105
Groth, H. G. 1961, ZAp, 51, 231
Gualandris, A., Portegies Zwart, S. 2007, MNRAS, 376, L29
Gummersbach, C. A., Kaufer, A., Schaefer, D. R., et al. 1998, A&A, 338, 881
Heber, U., Edelmann, H., Napiwotzki, R., Altmann, M., Scholz, R.-D. 2008, A&A, 483, L21
Heger, A., Langer, N. 2000, ApJ, 544, 1016
Heger, A., Fryer, C. L., Woosley, S. E., Langer, N., Hartmann, D. H. 2003, ApJ, 591, 288
Heger, A., Woosley, S. E., Spruit, H. C. 2005, ApJ, 626, 350
Hillier, D. J., Miller, D. L. 1998, ApJ, 496, 407
Hills, J. G. 1988, Nature, 331, 687
Hirsch, H. A., Heber, U., O’Toole, S. J., Bresolin, F. 2005, A&A, 444, L61
Honda, S., Aoki, W., Kajino, T., et al. 2004, ApJ, 607, 474
Hou, J. J., Prantzos, N., Boissier, S. 2000, A&A, 362, 921
Hummer, D. G., Berrington, K. A., Eissner, W., et al. 1993, A&A, 279, 298
Hunter, I., Dufton, P. L., Smartt, S. J., et al. 2007, A&A, 466, 277
Israelian, G., Rebolo, R., Basri, G., Casares, J., Martın, E. L. 1999, Nature, 401, 142
Jensen, A. G., Rachford, B. L., Snow, T. P. 2007, ApJ, 654, 955
Johansson, S. 2005, in: H. U. Kaufl, R. Siebenmorgen, A. Moorwood (eds.), High Resolution Infrared Spec-troscopy in Astronomy (Springer Verlag, Berlin), 62
Kaufl, H.U., Ballester, P., Biereichel, P., et al. 2004, Proc. SPIE, 5492, 1218
Kaufer, A., Stahl, O., Tubbesing, S., et al. 1999, ESO Messenger, 95, 8
Kennicutt, R. C., Jr., Bresolin, F., Garnett, D. R. 2003, ApJ, 591, 801
Kilian, J. 1992, A&A, 262, 171
Kilian, J. 1994, A&A, 282, 867
Kippenhahn, R., Weigert, A. 1990, Stellar Structure and Evolution (Springer Verlag, Berlin)
Kobayashi, C., Umeda, H., Nomoto, K., Tominaga, N., Ohkubo, T. 2006, ApJ, 653, 1145
Korn, A. J., Keller, S. C., Kaufer, A., et al. (Przybilla, N.) 2002, A&A, 385, 143
Korn, A. J., Nieva, M. F., Daflon, S., Cunha, K. 2005, ApJ, 633, 899
Kudritzki, R. P. 1973, A&A, 28, 103
Kudritzki, R. P. 1998, in: A. Aparicio, A. Herrero, F. Sanchez (eds.), Stellar Astrophysics for the Local Group(Cambridge University Press, Cambridge), 149
Kudritzki, R. P., Przybilla, N. 2003, in: D. Alloin, W. Gieren (eds.), Stellar Candles for the ExtragalacticDistance Scale (Springer Verlag, Berlin), 123
Kudritzki, R. P., Puls, J., Lennon, D. J., et al. 1999, A&A, 350, 970
Kudritzki, R. P., Bresolin, F., Przybilla, N. 2003, ApJ, 582, L83

46 BIBLIOGRAPHY
Kudritzki, R. P., Urbaneja, M. A., Bresolin, F., Przybilla, N., Gieren, W., Pietrzynski, G. 2008, ApJ, 681, 269
Kupka, F., Ryabchikova, T. A., Weiss, W. W., et al. 1996, A&A, 308, 886
Kurucz, R. L. 1993, Kurucz CD-ROM No. 13 (SAO, Cambridge, Mass.)
Lanz, T., Hubeny, I. 2003, ApJS, 146, 417
Lennon, D. J., Dufton, P. L. 1989, A&A, 225, 439
Lenorzer, A., Mokiem, M. R., de Koter, A., Puls, J. 2004, A&A, 422, 275
Leonard, P. J. T. 1991, AJ, 101, 562
Leone, F., Lanzafame, A. C., Pasquini, L. 1995, A&A, 293, 457
Lodders, K. 2003, ApJ, 591, 1220
Lockmann, U., Baumgardt, H., Kroupa, P. 2008, ApJ, 683, L151
Lopez-Corredoira, M., Cabrera-Lavers, A., Mahoney, T. J., et al. 2007, AJ, 133, 154
Lopez-Garcıa, Z., Adelman, S. J., Pintado, O. I. 2001, A&A, 367, 859
Lyubimkov, L. S., Rostopchin, S. I., Rachkovskaya, T., et al. 2005, MNRAS, 358, 193
Maeda, K., Nakamura, T., Nomoto, K., et al. 2002, ApJ, 565, 405
Maeda, K., Kawabata, K., Mazzali, P. A., et al. 2008, Science, 319, 1220
Maeder, A., Meynet, G. 2000, ARA&A, 38, 143
Maeder, A., Meynet, G. 2001, A&A, 373, 555
Maeder, A., Meynet, G. 2005, A&A, 440, 1041
Martins, F., Gillessen, S., Eisenhauer, F., et al. 2008, ApJ, 672, L119
Mashonkina, L., Korn, A. J., Przybilla, N. 2007, A&A, 461, 261
Matteucci, F. 2001, The Chemical Evolution of the Galaxy (Springer Verlag, Berlin)
Meyer, D. M., Cardelli, J. A., Sofia, U. J. 1997, ApJ, 490, L103
Meynet, G., Maeder, A. 2003, A&A, 404, 975
Mihalas, D. 1978, Stellar Atmospheres, 2nd edition (Freeman, San Francisco)
Morel, T., Butler, K. 2008, A&A, 487, 307
Nielsen, K., Wahlgren, G. M. 2000, A&A, 356, 146
Nieva, M. F. 2007, Ph. D. Thesis, Univ. Erlangen-Nuremberg & ON, Rio de Janeiro
Nieva, M. F., Przybilla, N. 2006, ApJ, 639, L39
Nieva, M. F., Przybilla, N. 2007, A&A, 467, 295
Nieva, M. F., Przybilla, N. 2008, A&A, 481, 199
Nomoto, K., Tominaga, N., Umeda, H., Kobayashi, C., Maeda, K. 2006, Nucl. Phys. A, 777, 424
Oey, M. S. 2003, in: K. van der Hucht, A. Herrero, C. Esteban (eds.), A Massive Star Odyssey: From MainSequence to Supernova (ASP, San Francisco), 620
Pagel, B. E. J. 1997, Nucleosynthesis and Chemical Evolution of Galaxies (Cambridge University Press, Cam-bridge)
Pasquini, L., Avila, G., Allaert, E. 2000, Proc. SPIE, 4008, 129
Pfeiffer, M. J., Frank, C., Baumuller, D., Fuhrmann, K., Gehren, T. 1998, A&AS, 130, 381
Podsiadlowski, P., Nomoto, K., Maeda, K., et al. 2002, ApJ, 567, 491

BIBLIOGRAPHY 47
Przybilla, N. 2002, Ph. D. Thesis, Univ. Munich
Przybilla, N. 2005, A&A, 443, 293
Przybilla, N., Butler, K. 2001, A&A, 379, 955
Przybilla, N., Butler, K. 2004a, ApJ, 609, 1181
Przybilla, N., Butler, K. 2004b, ApJ, 610, L61
Przybilla, N., Butler, K., Becker, S. R., Kudritzki, R. P., Venn, K. A. 2000, A&A, 359, 1085
Przybilla, N., Butler, K., Becker, S. R., Kudritzki, R. P. 2001a, A&A, 369, 1009
Przybilla, N., Butler, K., Kudritzki, R. P. 2001b, A&A, 379, 936
Przybilla, N., Butler, K., Heber, U., Jeffery, C. S. 2005, A&A, 443, L25
Przybilla, N., Butler, K., Becker, S. R., Kudritzki, R. P. 2006a, A&A, 445, 1099
Przybilla, N., Nieva, M. F., Edelmann, H. 2006b, Baltic Astronomy, 15, 107
Przybilla, N., Nieva, M. F., Heber, U., Jeffery, C. S. 2006c, Baltic Astronomy, 15, 163
Przybilla, N., Butler, K., Kudritzki, R. P. 2008a, in: G. Israelian, G. Meynet (eds.), The Metal Rich Universe(Cambridge University Press, Cambridge), 335
Przybilla, N., Nieva, M. F., Heber, U., et al. 2008b, A&A, 480, L37
Przybilla, N., Nieva, M. F., Tillich, A., et al. 2008c, A&A, 488, L51
Przybilla, N., Nieva, M. F., Heber, U., Butler, K. 2008d, ApJ, 684, L103
Przybilla, N., Nieva, M. F., Butler, K. 2008e, ApJ, submitted (arXiv:0809.2403[astro-ph])
Przybilla, N., Seifahrt, A., Butler, K., et al. 2008f, in: A. Moorwood (ed.), Science with the VLT in the ELTera (Springer Verlag, Berlin), in press
Przybylski, A. 1968, MNRAS, 139, 313
Przybylski, A. 1969, MNRAS, 146, 71
Przybylski, A. 1972, MNRAS, 159, 155
Puls, J., Kudritzki, R. P., Herrero, A., et al. 1996, A&A, 305, 171
Puls, J., Urbaneja, M. A., Venero, R., et al. 2005, A&A, 435, 669
Reid, M. J. 1993, ARA&A, 31, 345
Repolust, T., Puls, J., Hanson, M. M., et al. 2005, A&A, 440, 261
Roberts, W. W., Jr., Huntley, J. M., van Albada, G. D. 1979, ApJ, 233, 67
Rothman, L. S., Jacquemart, D., Barbe, A., et al. 2005, JQSRT, 96, 139
Roy, J.-R., Kunth, D. 1995, A&A, 294, 432
Rudolph, A. L., Fich, M., Bell, G. R., et al. 2006, ApJS, 162, 346
Rybicki, G. B., Hummer, D. G. 1991, A&A, 245, 171
Sandage, A., Tammann, G. A., Saha, A., et al. 2006, ApJ, 653, 843
Schiller, F., Przybilla, N. 2008, A&A, 479, 849
Schodel, R., Ott, T., Genzel, R., et al. 2002, Nature, 419, 694
Seaton, M. J., Yan, Y., Mihalas, D., Pradhan, A. K. 1994, MNRAS, 266, 805
Seifert, W., Appenzeller, I., Fuertig, W., et al. 2000, Proc. SPIE, 4008, 96
Sheinis, A. I., Bolte, M., Epps, H. W., et al. 2002, PASP, 114, 851

48 BIBLIOGRAPHY
Smith, K. C. 1996, Ap&SS, 237, 77
Snow, T. P., Witt, A. N. 1996, ApJ, 468, L65
Sofia, U. J. 2004, in: A. N. Witt, G. C. Clayton, B. T. Draine (eds.), Astrophysics of Dust (ASP, San Francisco),393
Sofia, U. J., Meyer, D. M. 2001, ApJ, 554, L221
Stasinska, G. 2005, A&A, 434, 507
Takeda, Y., Takada-Hidai, M. 1998, PASJ, 50, 629
Takeda, Y., Takada-Hidai, M. 2000, PASJ, 52, 113
Trundle, C., Dufton, P. L., Hunter, I., et al. 2007, A&A, 471, 625
Urbaneja, M. A., Herrero, A., Bresolin, F., et al. (Przybilla, N.) 2005, ApJ, 622, 862
Urbaneja, M. A., Kudritzki, R. P., Bresolin, F., Przybilla, N., Gieren, W., Pietrzynski, G. 2008, ApJ, 684, 118
Van Regemorter, H. 1962, ApJ, 136, 906
Venn, K. A. 1995a, ApJS, 99, 659
Venn, K. A. 1995b, ApJ, 449, 839
Venn, K. A., Przybilla, N. 2003, in: C. Charbonnel, D. Schaerer, G. Meynet (eds.), CNO in the Universe(ASP, San Francisco), 20
Venn, K. A., McCarthy, J. K., Lennon, D. J., Przybilla, N., Kudritzki, R. P., Lemke, M. 2000, ApJ, 541, 610
Venn, K. A., Lennon, D. J., Kaufer, A., McCarthy, J. K., Przybilla, N., et al. 2001, ApJ, 547, 765
Venn, K. A., Kaufer, A., Tolstoy, E., et al. (Przybilla, N.) 2003, in: K. van der Hucht, A. Herrero, C. Esteban(eds.), A Massive Star Odyssey: From Main Sequence to Supernova (ASP, San Francisco), 30
Verdugo, E., Talavera, A., Gomez de Castro, A. I. 1999, A&A, 346, 819
Vogt, S. S., Allen, S. L., Bigelow, B. C., et al. 1994, Proc. SPIE, 2198, 362
Vrancken, M., Butler, K., Becker, S. R. 1996, A&A, 311, 661
Wolf, B. 1971, A&A, 10, 383
Wolf, B. 1972, A&A, 20, 275
Wolf, B. 1973, A&A, 28, 335
Yu, Q., Madau, P. 2007, MNRAS, 379, 1293
Yu, Q., Tremaine, S. 2003, ApJ, 599, 1129
Zaritsky, D., Kennicutt, R. C., Jr., Huchra, J. P. 1994, ApJ, 420, 87
Acknowledgements
It is my pleasure to thank Uli Heber, for paving the way for this venture, for encouragement, advice andsupport over the past years in Bamberg, and for lessons in diplomacy. I also want to thank Wolf-RainerHamann and Erhard Steffens for their willingness to accompany the progress of this work as mentors.
I am deeply grateful to many colleagues and friends for support, advice, discussions and collabora-tion – Keith Butler, Rolf Kudritzki, Joachim Puls, the Bamberg, Munich, Hawaii, and Tenerife crowds,and many, many more (you know who I mean). Special thanks to Fernanda Nieva, Markus Firnsteinand Florian Schiller for getting enthusiastic about realising ideas.
Schließlich mochte ich meinen Eltern und meiner Partnerin fur ihre Geduld und Unterstutzungwahrend der letzten Jahre danken.
49

50 ACKNOWLEDGEMENTS
Appended Papers
Model Development & Analysis MethodologyAppendix A: N. Przybilla & K. Butler, Non-LTE Line Formation for Hydrogen Revisited, Astrophys-ical Journal, 609, 1181–1191 (2004)Appendix B: N. Przybilla, Non-LTE Modelling of the He I 10830 A Line in Early-Type Main SequenceStars, Astronomy & Astrophysics, 443, 293–296 (2005)Appendix C: N. Przybilla, K. Butler, S. R. Becker & R. P. Kudritzki, Quantitative Spectroscopy ofBA-type Supergiants, Astronomy & Astrophysics, 445, 1099–1126 (2006)Appendix D: M. F. Nieva & N. Przybilla, C II Abundances in Early-Type Stars: Solution to a Notori-ous Non-LTE Problem, Astrophysical Journal, 639, L39–L42 (2006)Appendix E: M. F. Nieva & N. Przybilla, Hydrogen and Helium Line Formation in OB Dwarfs andGiants. A hybrid Non-LTE Approach, Astronomy & Astrophysics, 467, 295–309 (2007)Appendix F: F. Schiller & N. Przybilla, Quantitative spectroscopy of Deneb, Astronomy & Astro-physics, 479, 849–858 (2008)Appendix G: M. F. Nieva & N. Przybilla, Carbon Abundances of Early B-type Stars in the Solar Vicin-ity. Non-LTE Line-formation for C II/III/IV and Self-consistent Atmospheric Parameters, Astronomy &Astrophysics, 481, 199–216 (2008)
Galactochemical EvolutionAppendix H: N. Przybilla, M. F. Nieva, & K. Butler, A Cosmic Abundance Standard: ChemicalHomogeneity of the Solar Neighbourhood & the ISM Dust-Phase Composition, Astrophysical JournalLetters, submitted (arXiv:0809.2403[astro-ph])
Hypervelocity StarsAppendix I: N. Przybilla, M. F. Nieva, U. Heber, M. Firnstein, K. Butler, R. Napiwotzki & H. Edel-mann, LMC Origin of the Hyper-velocity Star HE 0437–5439. Beyond the Supermassive Black HoleParadigm, Astronomy & Astrophysics, 480, L37–L40 (2008)Appendix J: N. Przybilla, M. F. Nieva, A. Tillich, U. Heber, K. Butler & W. R. Brown, HVS 7: AChemically Peculiar Hyper-velocity Star, Astronomy & Astrophysics, 488, L51–L54 (2008)Appendix K: N. Przybilla, M. F. Nieva, U. Heber & K. Butler, HD 271791: An Extreme SupernovaRun-away B Star Escaping from the Galaxy, Astrophysical Journal, 684, L103–L106 (2008)
51

52 APPENDED PAPERS
Extragalactic Stellar AstronomyAppendix L: R. P. Kudritzki, F. Bresolin & N. Przybilla, A New Extragalactic Distance Determina-tion Method Using the Flux-weighted Gravity of Late B and Early A Supergiants, Astrophysical Journal,582, L83–L86 (2003)Appendix M: R. P. Kudritzki, M. A. Urbaneja, F. Bresolin, N. Przybilla, W. Gieren & G. Pietrzynski,Quantitative Spectroscopy of 24 A Supergiants in the Sculptor Galaxy NGC 300: Flux-weighted Gravity-Luminosity Relationship, Metallicity, and Metallicity Gradient, Astrophysical Journal, 681, 269–289(2008)

