s-038-2012 (consultant) m e m o r a n d u m to:...
TRANSCRIPT
S-038-2012 (Consultant)
M E M O R A N D U M TO: Mark Hite, P.E. Director Division of Structural Design FROM: Bart Asher, P.E., L.S. TEBM, Geotechnical Branch BY: Daryl J. Greer, P.E. Geotechnical Branch DATE: September 24, 2015 SUBJECT: Garrard/Mercer Counties FD52 040 0152 000-001 FD52 084 0152 018-019 BRO 5129 (012) MARS No. 8469001D KY 152 Bridge over Herrington Lake Item No. 7-1116.00 Geotechnical Engineering Structure Foundation Report The geotechnical engineering report for the subject project has been completed by Stantec Consulting Services, Inc. We have reviewed and concur with the recommendations as presented in this report. A copy of the report is attached. If you have any questions, please contact this office at 502-564-2374. Attachments cc: W. McKinney R. Powell R. Sprague M. Simpson K. Caudill R. Gossom N. Ridgway C. Raymer (WMB) A. Crace (Stantec) B. Greene
Report of Geotechnical Exploration KY 152 over Herrington Lake Item No. 7-1116.00 Garrard and Mercer Counties, Kentucky Project ID: S-038-2012
Stantec Consulting Services Inc. Design with community in mind
www.stantec.com
Prepared for: WMB, Inc. Lexington, Kentucky
September 18, 2015

Report of Geotechnical Exploration KY 152 over Herrington Lake
Item No. 7-1116.00 Garrard and Mercer Counties, Kentucky
Project ID: S-038-2012
v:\1755\active\175562020\clerical\report\rpt_002_175562020\rpt_002_175562020.docx i
Table of Contents
Section Page No.
1. Introduction ................................................................................................. 1 1.1. Project Overview ................................................................................. 1
2. Site Topography and Geologic Conditions .............................................. 2
3. Summary of Borings .................................................................................... 2
4. Soil and Bedrock Conditions ...................................................................... 4
5. Laboratory Testing and Results ................................................................... 5 5.1. General ................................................................................................. 5 5.2. Laboratory Testing of Standard Penetration Test Samples............ 5 5.3. Unconfined Compression Testing on Rock ...................................... 5
6. Foundation Analyses .................................................................................. 5 6.1. General ................................................................................................. 5 6.2. Bearing Capacity for Spread Footings on Bedrock ....................... 6 6.3. Drilled Shaft Analyses .......................................................................... 6
6.3.1. End Bearing and Side Resistance of Shafts in Bedrock .............................................................................. 6
6.3.2. Strength Limit State ........................................................... 7 6.3.3. Service Limit State ............................................................. 8 6.3.4. Extreme Limit State ............................................................ 8 6.3.5. Lateral Analyses of Shafts ................................................. 8 6.3.6. Uplift .................................................................................... 8
7. Seismic Design Considerations .................................................................. 8
8. Conclusions and Recommendations ........................................................ 8 8.1. General ................................................................................................. 9 8.2. Spread Footings on Bedrock ........................................................... 10 8.3. Drilled Shaft Foundations.................................................................. 10
9. Closing ....................................................................................................... 11

Table of Contents (Continued)
v:\1755\active\175562020\clerical\report\rpt_002_175562020\rpt_002_175562020.docx ii
List of Tables
Table Page No.
Table 1. Approximate Stationing of Bridge Substructure Elements ................... 1
Table 2. Summary of Borings ................................................................................... 3
Table 3. LRFD Resistance Factors for Drilled Shaft Analyses ............................... 6
Table 4. Summary of Drilled Shaft Parameters ..................................................... 7
List of Appendixes
Appendix A
Appendix B
Appendix C
Appendix D
Appendix E
Appendix F
Location Map
Designer Drawings
Subsurface Data Sheets
Coordinate Data Submission Form
Drilled Shaft Capacity Tables
Idealized Subsurface Profiles

Report of Geotechnical Exploration KY 152 over Herrington Lake
Item No. 7-1116.00 Garrard and Mercer Counties, Kentucky
Project ID: S-038-2012
v:\1755\active\175562020\clerical\report\rpt_002_175562020\rpt_002_175562020.docx 1
1. Introduction
1.1. Project Overview
The Kentucky Transportation Cabinet (KYTC) is planning to replace the Kennedy Bridge, KY 152 over Herrington Lake. The existing bridge has been in service since 1933 and is currently operating under a reduced service load of 15 tons. Since the completion of the existing bridge in 1924, the pier nearest the Mercer County side has risen vertically approximately 30 inches and tilted upstream and toward Mercer County approximately 12 inches. The cause of this movement has never been determined.
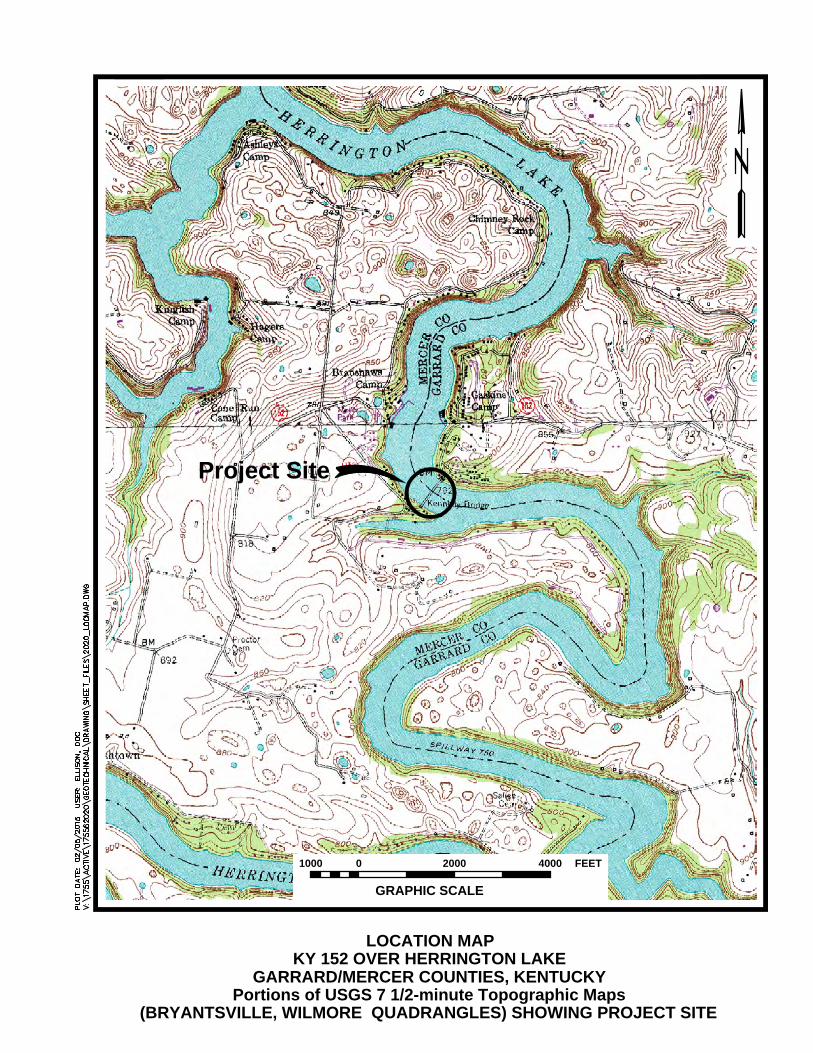
It is proposed that a new bridge will be constructed just downstream of the existing bridge. As part of the bridge replacement project, short pieces of roadway will be relocated and/or reconstructed at either end of the bridge. Currently there are two retaining walls proposed as well. The geotechnical considerations for the approach roadways and retaining walls will be addressed under separate cover. This report addresses the geotechnical considerations associated with the proposed bridge over Herrington Lake. The map provided in Appendix A illustrates the proposed bridge location.
1.2. Structure Location and Description
Structure plans indicate the proposed 3-span structure will be 825 feet in length beginning at KY 152 station 18+35 and ending at station 26+60. Table 1 presents a summary of approximate planned locations of the substructure elements as referenced to KY 152 stationing.
Table 1.Approximate Stationing of Bridge Substructure Elements
Element KY 152 Station Abutment 1 18+35 Pier 1 21+85 Pier 2 25+35 Abutment 2 26+60
Appendix B presents structure drawings received from the project designer, WMB Inc. (WMB) which depicts the proposed plan layout and profile of the bridge.

2. Site Topography and Geologic Conditions
The project area lies within the Bluegrass Physiographic Region of Kentucky. The Bluegrass Region is characterized by gently rolling hills with rich fertile soils. Weathering of the underlying limestone bedrock has produced caves, sinkholes, and springs. The proposed bridge is located close to the Kentucky River Palisades, which formed when the Kentucky River and its tributaries cut through the limestone bedrock to form high cliffs and steep gorges within the study area. Existing topographic relief at the site varies from approximate elevation 790 feet at the abutments to approximate elevation 550 feet below Herrington Lake.
Available geologic mapping (USGS Geologic Map of Bryantsville (1971) Quadrangle, Kentucky) indicates the site is underlain by limestone and possibly dolomite bedrock of the Middle Ordovician age. According to the USGS Quadrangle, the limestones are predominantly light gray to gray, micro-crystalline to fine grained, thin to medium bedded, with shale stringers. The dolomite is described as light gray to gray, micro-crystalline grained, and thick bedded.
Karst activity exists with the Bluegrass Physiographic Region of Central Kentucky. However, based on USGS Geologic mapping, no known karstic features are present in the project vicinity. Stantec encountered small voids in the upper approximately 20 feet of bedrock in several borings at the substructure locations. These voids indicate that minor karstic features may be present within the project vicinity.
Based on USGS Geologic mapping, several unnamed faults are present within approximately one mile of the proposed bridge location. The unnamed faults fall to the north, southwest and south of the bridge location. The Kentucky River Fault Zone is also located near the bridge location. At the closest point, the Kentucky River Fault Zone is approximately 3.25 miles to the southeast of the bridge location. None of these faults are known to have been active within recent history.
Residual clayey and silty soils are the predominant soil type mapped within the approach areas of the bridge. Soils can become very thin to very deep in karst areas within a relatively short distance.
3. Summary of Borings
Fourteen borings were drilled during the 2014 field exploration of the proposed structure. A previous geotechnical exploration was completed in 2013 and included two rock core borings at the abutment 1 location. The borings of the 2014 exploration consisted of four rockline soundings, one undisturbed sample boring, two undisturbed sample borings with rock coring, and seven rock core borings. The borings were staked in the field by WMB survey personnel. The locations and logs of borings are shown on the Subsurface Data Sheets located in Appendix C. Table 2 presents a summary of the borings drilled. All measurements are expressed in feet.
v:\1755\active\175562020\clerical\report\rpt_002_175562020\rpt_002_175562020.docx 2

Table 2. Summary of Borings
Substructure Element
Hole No. Station, Offset
Surface Elevation
Top of Rock
Elevation
Refusal/Begin Core
Elevation
Length of
Coreb
Bottom of Hole
Elevation
Abutment 1
B-1c 18+42, 26.0’ Lt. 786.0 779.5 779.5 319.2 460.3 B-2c 17+80, 16.0’ Lt. 786.6 782.2 782.2 62.3d 731.1 B-3 18+18, 38.0’ Lt. 790.0 788.9a 788.9 N/C 788.9 B-4e 18+32, 16.0’ Rt. 786.1 780.5a 780.5 N/C 780.5 B-5 18+18, 38.0’ Rt. 786.1 779.6a 779.6 N/C 779.6
Pier 1
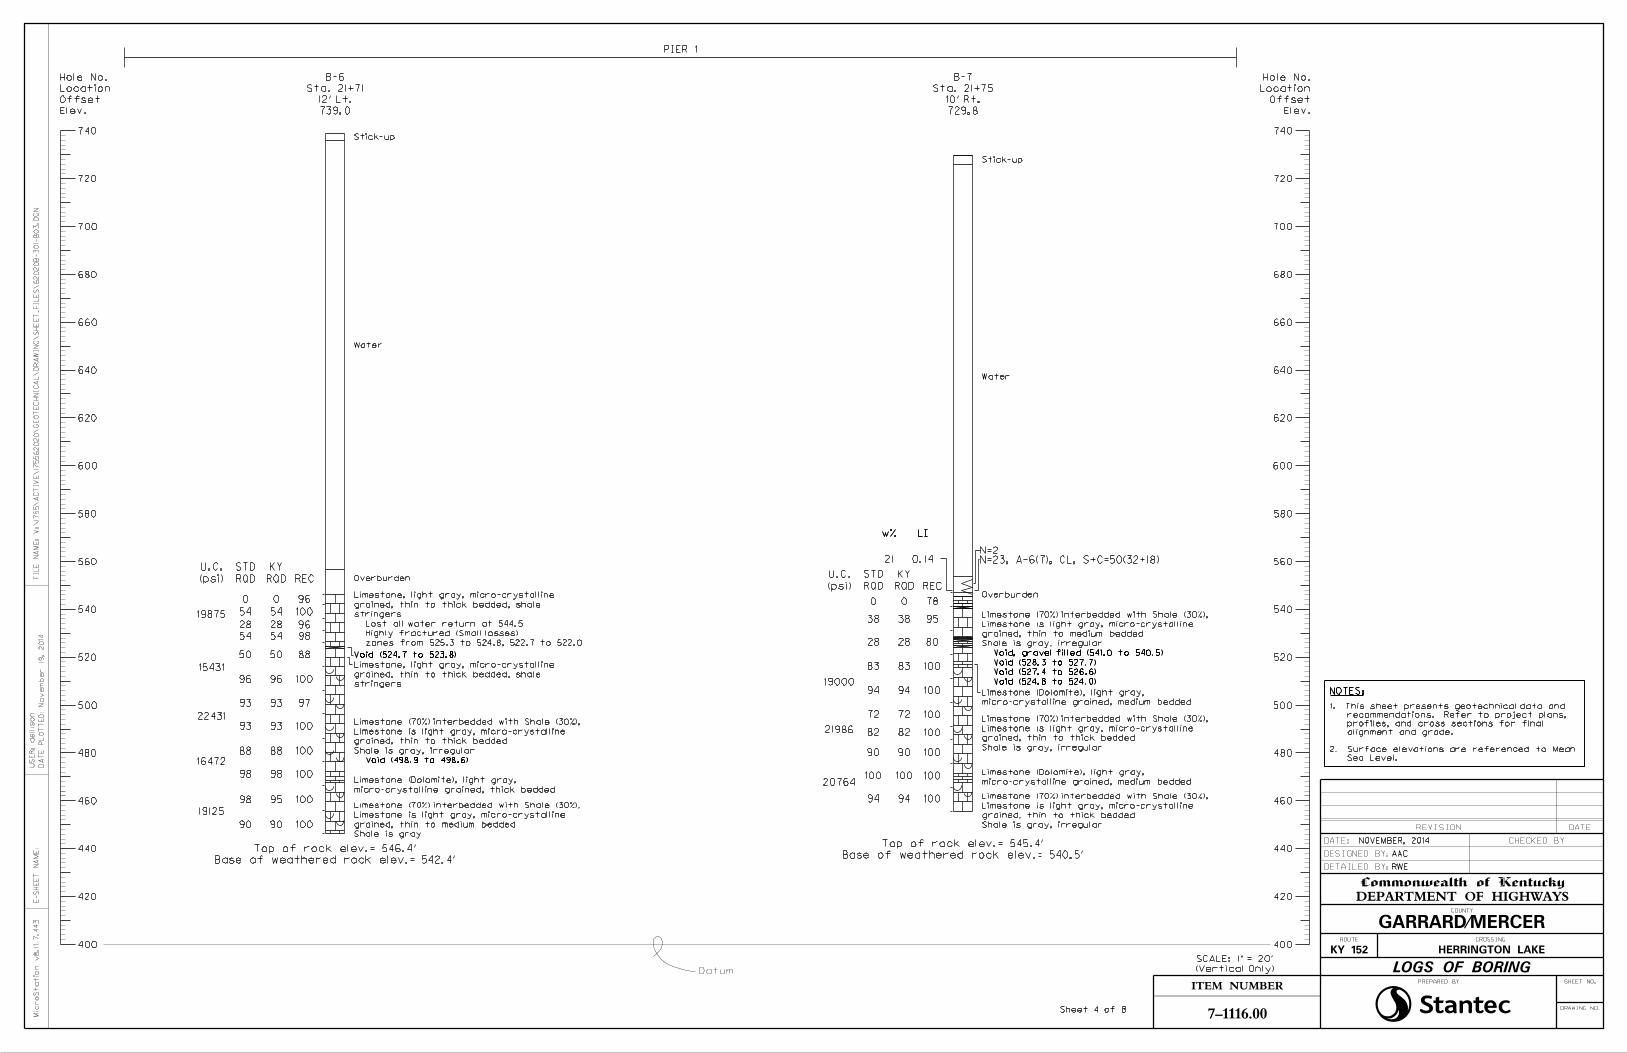
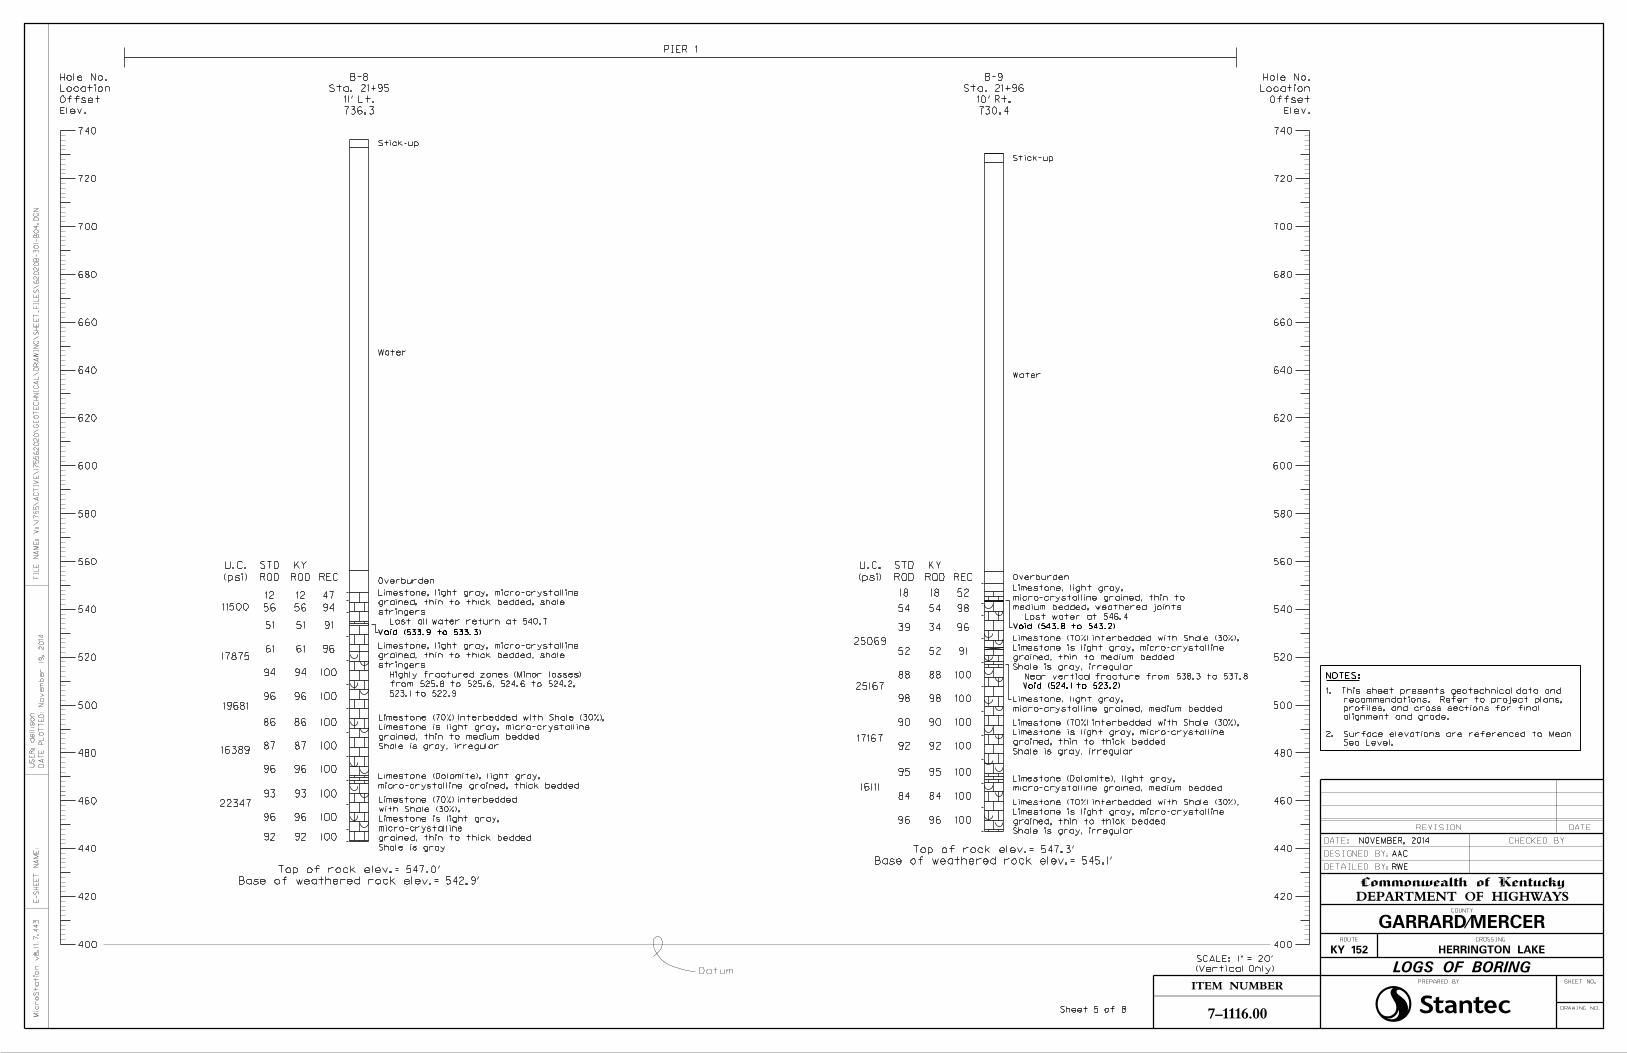
B-6 21+71, 11.8’ Lt. 739.0f 546.4 546.4 100.3 446.1 B-7 21+75, 9.6’ Rt. 729.8f 545.4 547.2 91.5 455.7 B-8 21+95, 10.9’ Lt. 736.3f 547.0 547.0 104.2 442.8 B-9 21+96, 9.5’ Rt. 730.4f 547.3 550.8 103.7 447.1
Pier 2
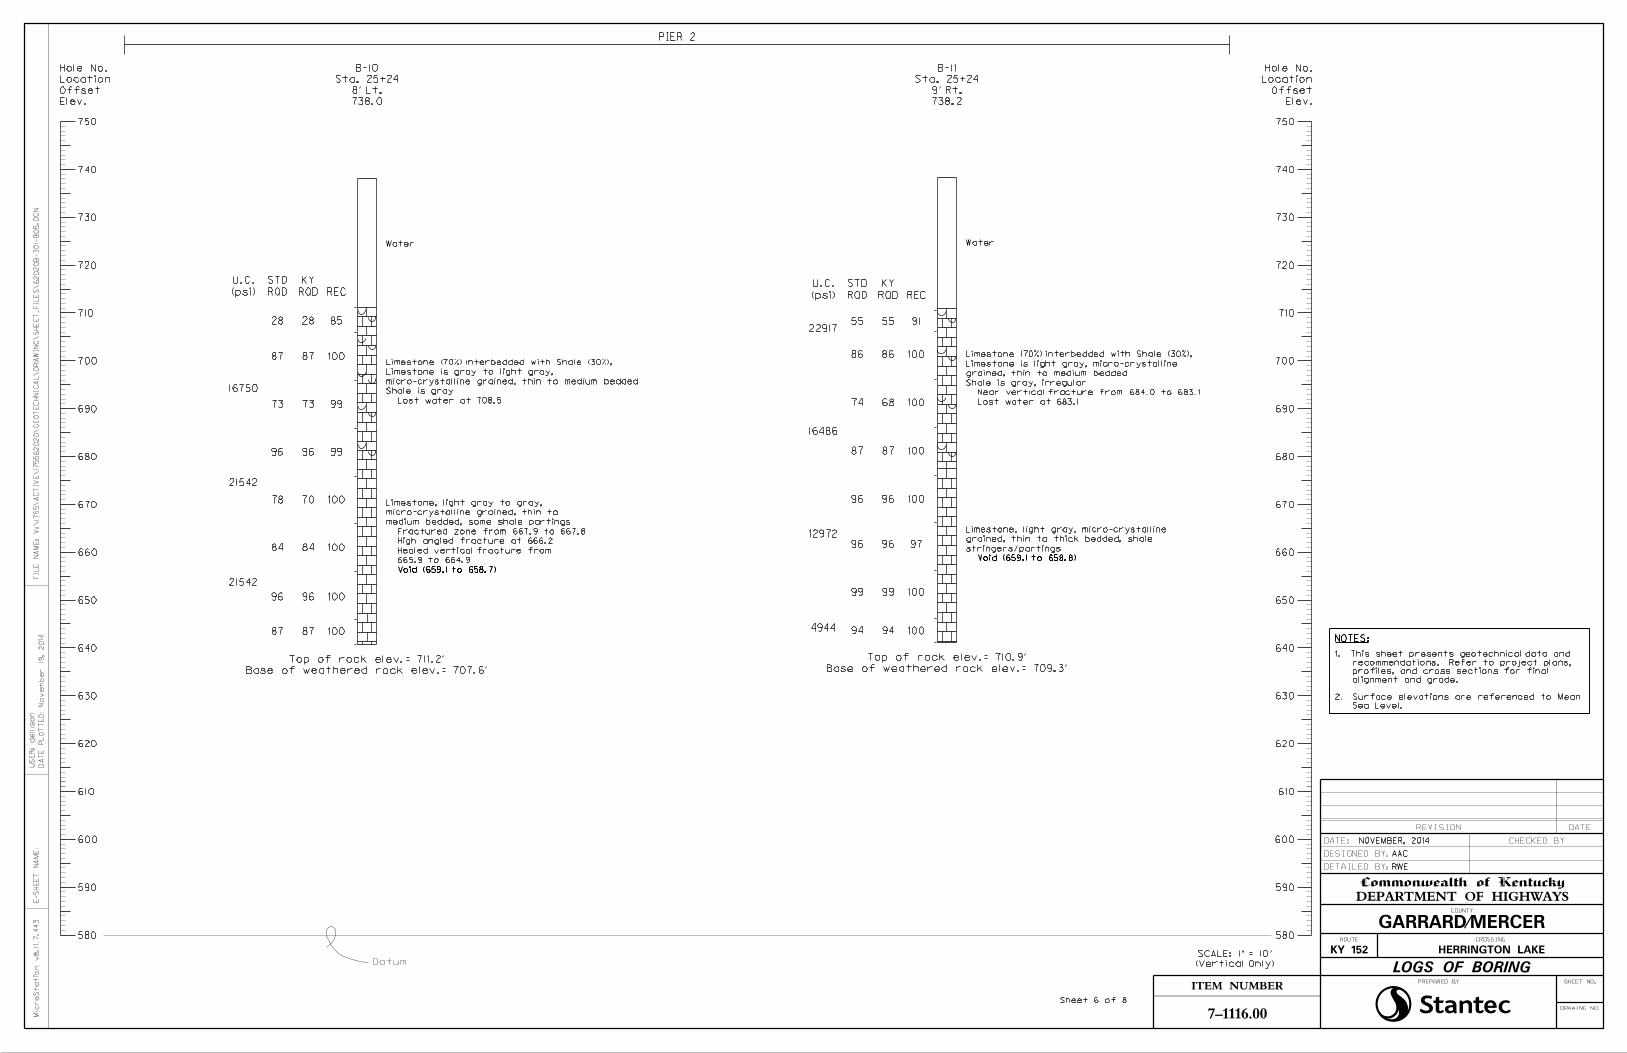
B-10 25+-24, 8.4’ Lt. 738.0f 711.2 711.2 70.5 640.7 B-11 25+24, 8.8’ Rt. 738.2f 710.9 710.9 69.8 641.1 B-12 25+40, 7.6’ Lt. 738.6f 723.2 723.2 71.7 651.5 B-13 25+44, 8.0’ Rt. 738.4f 725.8 725.8 69.5 656.3
Abutment 2 B-14e 26+60, 48.0’ Lt. 782.3 779.4a 779.4 N/C 779.4 B-16 26+60, 15.0’ Rt. 792.4 790.5 790.5 30.6 759.9 B-17 26+60, 41.0’ Rt. 792.2 790.4a 790.4 N/C 790.4
a. Top of rock in this case indicates rock-like resistance to augering. An exact determination cannot be made without performing rock coring.
b. N/C denotes no rock coring performed. c. Boring Nos. B-1 and B-2 were previously drilled in 2013. d. Boring was drilled at a 35 degree angle. Length of core recorded is along the 35 degree angle. e. Boring advanced with a 3” hand-auger due to access. f. Borings were drilled from a floating plant. The surface elevation recorded is referenced to the top of the
casing.
Stantec personnel performed drilling and sampling operations in the summer of 2014. The drill crews operated track-mounted and truck-mounted drill rigs equipped with hollow-stem and flight augers as well as wire line rock coring tools. The field personnel generally performed soil sampling at approximately five-foot intervals of depth to obtain in situ strength data and specimens for subsequent laboratory strength and/or classification testing.
The Pier 1 and Pier 2 borings were completed from a floating plant on Herrington Lake. Due to deep water (180 feet +) at the Pier 1 location and subsequently long unsupported lengths of drill steel, HQ rock coring tools encased in 6-inch steel Flush Joint (FJ) casing were utilized for the borings drilled from the floating plant. Also due to the deep water, a traditional spud system was not feasible to anchor the barge. Stantec utilized a system of cables attached to four anchor points drilled into bedrock approximately 40 feet below the water surface. The anchor points were positioned on either bank, upstream and downstream of the proposed bridge location in an “X” pattern to allow movement of the barge over the different boring locations by lengthening and shortening of the cables.
v:\1755\active\175562020\clerical\report\rpt_002_175562020\rpt_002_175562020.docx 3

Due to variations of the water level in the lake during drilling, the surface elevation recorded is referenced to the top of the 6-inch FJ casing seated into bedrock, and was determined based on the current lake elevation at the time the casing was seated. Lake elevations were obtained through the USGS National Water Information System for Herrington Lake.
Standard penetration testing (SPT) was performed within granular (non-cohesive) materials and thin wall (Shelby) tube samples were taken in cohesive materials as applicable. The drill crews checked each boring for the presence of groundwater prior to backfilling. The Subsurface Data Sheets in Appendix C provide a boring layout that depicts the locations of the borings in relation to the planned structure as well as graphical logs presenting the results of the drilling, sampling, and laboratory testing programs. Refer to Appendix D for the Coordinate Data Submission Form summarizing the as-drilled boring locations, surface elevations, and associated latitudes and longitudes.
The drill rigs utilized for the sampling operations were equipped with automatic hammers to perform SPT testing in accordance with Section 302-5 of the current KYTC Geotechnical Manual. The use of automatic hammers provides for a more efficient and consistent transfer of energy than traditional SPT testing with a safety hammer/rope/cat-head system. Thus, blowcounts observed from automatic hammers are lower than those observed with the safety hammer system. Typical correlations for SPT results used in geotechnical engineering are based on the safety hammer system and require that blowcounts from SPT testing using an automatic hammer be corrected for efficiency.
4. Soil and Bedrock Conditions
Soils encountered in the borings drilled near the abutments consist of silty clays with varying amounts of chert and gravel. The abutment borings indicate that soils tend to be shallow, varying from approximately 1 to 8 feet in thickness. Soils encountered in the borings drilled in Herrington Lake consist of silts and clays and vary in depth up to approximately 10 feet.
The rock core specimens obtained in the borings consist primarily of limestone with zones that have interbedded shale. The limestones were described as light gray to gray in color, thin- to thick-bedded, fine- to microcrystalline-grained, and having shale stringers. The interbedded shales were described as gray in color.
The project engineer determined the location of the base of weathered rock for each rock core boring, and selected samples of the rock cores for Unconfined Compression testing. The percent recovery and rock quality designation (RQD) were also determined for each core run.
The RQD is defined as the sum of all core pieces longer than four inches, divided by the total length of the coring run. KYTC modifies the RQD by excluding from the sum those portions of core which can be broken by hand pressure. The resultant is multiplied by 100 to express the RQD in percent. The RQD provides a simple
v:\1755\active\175562020\clerical\report\rpt_002_175562020\rpt_002_175562020.docx 4

quantitative indication of rock competency. Detailed graphical logs of the borings are presented on the Subsurface Data Sheets in Appendix C.
5. Laboratory Testing and Results
5.1. General
All laboratory tests were performed in accordance with the applicable AASHTO or Kentucky Methods soil and rock testing specifications. Laboratory testing consisted of natural moisture content, grain size-sieve analyses (silt plus clay determinations), soil classification index testing, and unconfined compression testing of rock.
Engineering staff used the test results to establish material properties for subsequent engineering analyses. The following paragraphs provide discussions of the laboratory testing program and its results.
5.2. Laboratory Testing of Standard Penetration Test Samples
Laboratory testing of the SPT samples included natural moisture content, grain-size sieve analysis (silt plus clay determination), and standard engineering classification testing. The SPT soil samples tested classify as CL and GC according to USCS and as A-6 and A-7-6 based on the AASHTO classification system.
5.3. Unconfined Compression Testing on Rock
Several rock core samples were tested for unconfined compressive strength for use in foundation analyses. The results varied from a low of 247 tons per square foot (tsf) in a shale layer at the Abutment 1 location to a high of 2,528 tsf in limestone. The laboratory test results are shown on the Subsurface Data Sheets in Appendix C.
6. Foundation Analyses
6.1. General
Stantec understands that the new bridge will be supported by spread footings and drilled shaft foundations. Spread footings will be designed at the service limit state using presumptive values of allowable bearing pressures found in NAVFAC DM 7.2. Drilled Shaft foundations in this project will be designed using the Load and Resistance Factor Design (LRFD) methodology. LRFD is a design approach in which applicable failure and serviceability conditions can be evaluated considering the uncertainties associated with loads and materials resistances. Where applicable, the following engineering analyses followed the current AASHTO LRFD guidelines. This report provides recommendations for spread footings on bedrock as well as drilled shaft foundations for support of the abutments and piers of the subject structure where applicable.
v:\1755\active\175562020\clerical\report\rpt_002_175562020\rpt_002_175562020.docx 5
6.2. Bearing Capacity for Spread Footings on Bedrock
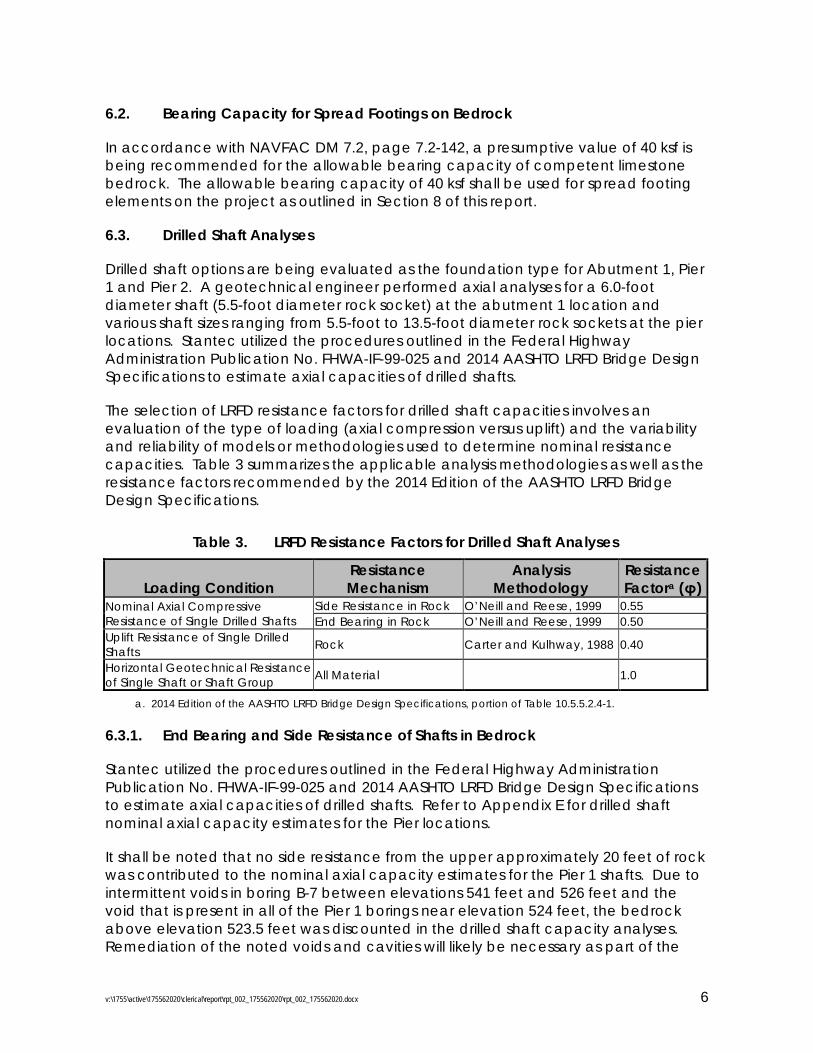
In accordance with NAVFAC DM 7.2, page 7.2-142, a presumptive value of 40 ksf is being recommended for the allowable bearing capacity of competent limestone bedrock. The allowable bearing capacity of 40 ksf shall be used for spread footing elements on the project as outlined in Section 8 of this report.
6.3. Drilled Shaft Analyses
Drilled shaft options are being evaluated as the foundation type for Abutment 1, Pier 1 and Pier 2. A geotechnical engineer performed axial analyses for a 6.0-foot diameter shaft (5.5-foot diameter rock socket) at the abutment 1 location and various shaft sizes ranging from 5.5-foot to 13.5-foot diameter rock sockets at the pier locations. Stantec utilized the procedures outlined in the Federal Highway Administration Publication No. FHWA-IF-99-025 and 2014 AASHTO LRFD Bridge Design Specifications to estimate axial capacities of drilled shafts.
The selection of LRFD resistance factors for drilled shaft capacities involves an evaluation of the type of loading (axial compression versus uplift) and the variability and reliability of models or methodologies used to determine nominal resistance capacities. Table 3 summarizes the applicable analysis methodologies as well as the resistance factors recommended by the 2014 Edition of the AASHTO LRFD Bridge Design Specifications.
Table 3. LRFD Resistance Factors for Drilled Shaft Analyses
Loading Condition Resistance Mechanism
Analysis Methodology
Resistance Factora (φ)
Nominal Axial Compressive Resistance of Single Drilled Shafts
Side Resistance in Rock O’Neill and Reese, 1999 0.55 End Bearing in Rock O’Neill and Reese, 1999 0.50
Uplift Resistance of Single Drilled Shafts Rock Carter and Kulhway, 1988 0.40
Horizontal Geotechnical Resistance of Single Shaft or Shaft Group All Material 1.0
a. 2014 Edition of the AASHTO LRFD Bridge Design Specifications, portion of Table 10.5.5.2.4-1.
6.3.1. End Bearing and Side Resistance of Shafts in Bedrock
Stantec utilized the procedures outlined in the Federal Highway Administration Publication No. FHWA-IF-99-025 and 2014 AASHTO LRFD Bridge Design Specifications to estimate axial capacities of drilled shafts. Refer to Appendix E for drilled shaft nominal axial capacity estimates for the Pier locations.
It shall be noted that no side resistance from the upper approximately 20 feet of rock was contributed to the nominal axial capacity estimates for the Pier 1 shafts. Due to intermittent voids in boring B-7 between elevations 541 feet and 526 feet and the void that is present in all of the Pier 1 borings near elevation 524 feet, the bedrock above elevation 523.5 feet was discounted in the drilled shaft capacity analyses. Remediation of the noted voids and cavities will likely be necessary as part of the
v:\1755\active\175562020\clerical\report\rpt_002_175562020\rpt_002_175562020.docx 6
construction process. Refer to Section 8.3 of this report for recommendations on cavity remediation for drilled shafts.
At the pier 2 location, the foundation system sits on a shelf scenario. The axial capacity contributions from side resistance begin at the base of weathered rock elevation in the lowest boring.
It shall also be noted that the contribution from end bearing is not considered in the estimated nominal axial capacity of the shafts. In hard limestone of this nature, it is assumed that there would not be enough movement to mobilize end bearing.
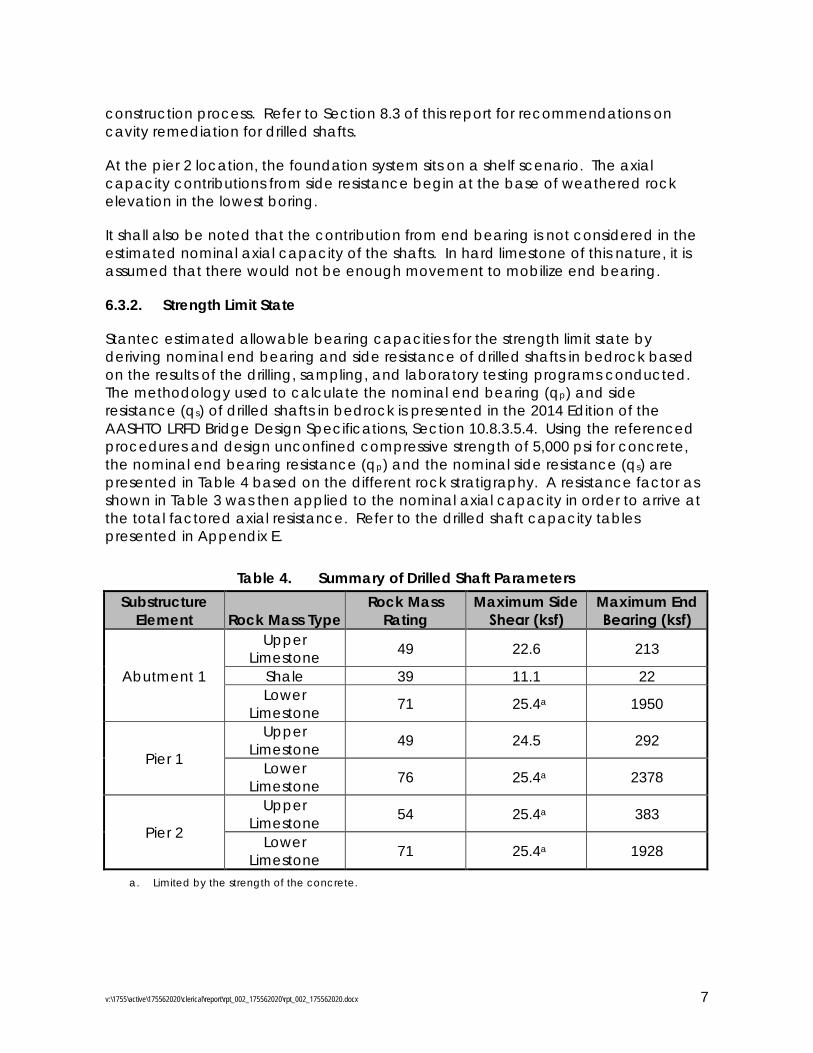
6.3.2. Strength Limit State
Stantec estimated allowable bearing capacities for the strength limit state by deriving nominal end bearing and side resistance of drilled shafts in bedrock based on the results of the drilling, sampling, and laboratory testing programs conducted. The methodology used to calculate the nominal end bearing (qp) and side resistance (qs) of drilled shafts in bedrock is presented in the 2014 Edition of the AASHTO LRFD Bridge Design Specifications, Section 10.8.3.5.4. Using the referenced procedures and design unconfined compressive strength of 5,000 psi for concrete, the nominal end bearing resistance (qp) and the nominal side resistance (qs) are presented in Table 4 based on the different rock stratigraphy. A resistance factor as shown in Table 3 was then applied to the nominal axial capacity in order to arrive at the total factored axial resistance. Refer to the drilled shaft capacity tables presented in Appendix E.
Table 4. Summary of Drilled Shaft Parameters Substructure
Element Rock Mass Type Rock Mass
Rating Maximum Side
Shear (ksf) Maximum End Bearing (ksf)
Abutment 1
Upper Limestone 49 22.6 213
Shale 39 11.1 22 Lower
Limestone 71 25.4a 1950
Pier 1
Upper Limestone 49 24.5 292
Lower Limestone 76 25.4a 2378
Pier 2
Upper Limestone 54 25.4a 383
Lower Limestone 71 25.4a 1928
a. Limited by the strength of the concrete.
v:\1755\active\175562020\clerical\report\rpt_002_175562020\rpt_002_175562020.docx 7
6.3.3. Service Limit State
Stantec determined capacity values for the service limit state using the same procedures outlined above except a Factor of Safety (FS) of three was applied to the nominal axial capacity in order to arrive at the service limit state total allowable bearing capacity. The Service Limit State capacities will be used by the designer for the evaluation of lateral deflection.
6.3.4. Extreme Limit State
Stantec also determined capacity values for the extreme limit state using the same procedures outlined above except a resistance factor of 1.0 (2014 Edition of the AASHTO LRFD Bridge Design Specifications, Section 10.5.5.3.2) was applied to the nominal axial capacity in order to arrive at the extreme limit state total factored axial resistance. Refer to the drilled shaft capacity tables presented in Appendix E for specific capacities with respect to depth.
6.3.5. Lateral Analyses of Shafts
The lateral analyses for the drilled shafts are being performed by the designer. Appendix F provides Idealized Subsurface Profiles that outline the recommended soil and rock parameters for use in lateral load analyses.
6.3.6. Uplift
Uplift analyses were determined for the strength limit state and utilized a resistance factor of 0.4 as described in Table 3. In accordance with AASHTO, the resistance factor used for the socket friction for uplift loading was 0.4, corresponding to uplift resistance of single-drilled shafts. Uplift analysis was also determined for the extreme limit state and utilized a resistance factor of 0.8 (2014 Edition of the AASHTO LRFD Bridge Design Specifications, Section 10.5.5.3.2). Refer to Appendix E for tables showing the total factored uplift resistance.
7. Seismic Design Considerations
The 2014 AASHTO LRFD Bridge Design Specifications provide guidelines for determining the seismic hazard at a bridge site. The seismic hazard for a bridge site is characterized by the acceleration response spectrum and the site factors for the relevant site classification. Based on the results of the exploration and the geology of the area, the subsurface profile in the vicinity of the bridge should be classified as site classification B, as per Table 3.10.3.1.1 - Site Class Definitions, and used for design purposes.
8. Conclusions and Recommendations
Stantec developed the following recommendations based upon reviews of available data, information obtained during the field exploration, results of laboratory testing and engineering analyses, and discussions with WMB and KYTC
v:\1755\active\175562020\clerical\report\rpt_002_175562020\rpt_002_175562020.docx 8

personnel. The recommendations are also based on the structure configuration presented in drawings provided by WMB.
8.1. General
8.1.1. Based on a review of the existing subsurface conditions and anticipated structural loads, it is recommended that rock bearing foundation systems be used for all bridge substructure elements. The following table provides possible foundation alternates using the following notations:
1 = Spread Footings
2 = Drilled Shafts
The foundation alternates shown below are those Stantec considers being most practical. However, other structural and/or economic considerations may dictate which option is most preferable.
Substructure Element and Boring No. Station, Offset
Foundation Alternate
Top of Rock (Feet)
Estimated Bearing
Elevation (Feet)
Service I Bearing
Pressure (psf) Abutment 1
B-1 18+42, 26.0’ Lt. 1, 2b 779.5 749.5 40,000 B-2 17+80, 16.0’ Lt. 1, 2b 782.2 749.5 40,000 B-3 18+18, 38.0’ Lt. 1, 2b 788.9a 749.5 40,000 B-4 18+32, 16.0’ Rt. 1, 2b 780.5a 749.5 40,000 B-5 18+18, 38.0’ Rt. 1, 2b 779.6a 749.5 40,000
Pier 1 B-6 21+71, 11.8’ Lt. 2 546.4
See Capacity Tables – Appendix F
B-7 21+75, 9.6’ Rt. 2 545.4 B-8 21+95, 10.9’ Lt. 2 547.0 B-9 21+96, 9.5’ Rt. 2 547.3
Pier 2 B-10 25+24, 8.4’ Lt. 2 711.2
See Capacity Tables – Appendix F
B-11 25+24, 8.8’ Rt. 2 710.9 B-12 25+40, 7.6’ Lt. 2 723.2 B-13 25+44, 8.0’ Rt. 2 725.8
Abutment 2 B-14 26+60, 48.0’ Lt. 1 779.4a 773.5 40,000 B-16 26+60, 15.0’ Rt. 1 790.5 773.5 40,000 B-17 26+60, 41.0’ Rt. 1 790.4 773.5 40,000
a. Top of rock in this case indicates rock-like resistance to augering. An exact determination cannot be made without performing rock coring.
b. See capacity tables in Appendix F for Foundation Alternate 2 bearing and capacity information.
v:\1755\active\175562020\clerical\report\rpt_002_175562020\rpt_002_175562020.docx 9
8.1.2. Foundation excavations should be properly braced/shored to provide adequate safety to people working in or around the excavations. Bracing should be performed in accordance with applicable federal, state and local guidelines.
8.1.3. A plan note should be included by the designer that indicates that temporary shoring, sheeting, cofferdams, and/or dewatering methods may be required to facilitate foundation construction.
8.1.4. A plan note should be included by the designer: Structure excavation shall be completed just prior to structure foundation construction in order to prevent the bedrock from being exposed for an extended period of time and deteriorating. Rock excavation will be required at the Abutment locations. The contractor shall take care during blasting and other excavation methods to avoid over-breakage and damage to the bedrock beneath the footings.
8.2. Spread Footings on Bedrock
8.2.1. Rock-bearing spread footing options are being provided for the abutment substructure elements. Foundation excavations for footings at the structure locations should be level and free of loose, water softened material, etc. Additional rock excavation to achieve suitable bearing conditions may be required depending upon topography and bedrock weathering conditions.
8.2.2. It is recommended that spread footings should be embedded a minimum of 2 feet. All footing excavations should be neatly cut so that no forming or backfilling is necessary in the construction of the portions of the footing located in rock. Concrete should be placed directly against the cut rock faces.
8.2.3. The bearing surfaces of spread footings should be level, and any soft compressible materials should be removed prior to placement of reinforcing steel and concrete.
8.2.4. Foundation excavations should not be left open to allow the accumulation of water or extended exposure to other climatic conditions. Foundation excavations should be concreted and backfilled immediately after excavation is complete, or if this cannot be done, the last four to six inches of foundation material should not be removed until preparations for placing concrete are ready.
8.2.5. It is recommended that any over-excavation into bedrock be filled to the top of the excavation with mass concrete.
8.3. Drilled Shaft Foundations
8.3.1. The Contractor should use a permanent casing from the top of shaft to the top of unweathered bedrock and use an uncased rock socket which is 6 inches smaller than the inside diameter of the permanent casing.
v:\1755\active\175562020\clerical\report\rpt_002_175562020\rpt_002_175562020.docx 10

8.3.2. Unless otherwise specified, it is recommended that construction methods and materials used for drilled shaft installations be in accordance with the current KYTC “Special Note for Drilled Shafts”.
8.3.3. A plan note should be included by the Designer: Construction cores will not be required at the Pier 1 and Pier 2 drilled shaft locations. Rock cores obtained during the geotechnical exploration were drilled at the center of each shaft and extend deep enough to cover the embedment length.
8.3.4. Drilled Shaft Integrity Testing will be required for each drilled shaft. An appropriate number of Crosshole Sonic Logging (CSL) access tubes, consisting of two (2) inch nominal diameter schedule 40 steel pipe, will be required. These tubes should be shown on the drilled shaft details.
8.3.5. Drilled shaft foundations at Pier 1 will be constructed in deep (180 feet +) water. Traditional spud anchoring systems may not be feasible for drilling and construction operations performed from a barge deck. Special consideration should be taken by the Contractor to establish a sufficient anchoring system for support barges.
8.3.6. Small voids and cavities are present in the upper 20 feet of bedrock at the Pier 1 location. Pier 1 drilled shafts will require cavity remediation using one of the following recommended techniques. A plan note should be included by the designer which indicates: The contractor shall submit a drilled shaft cavity remediation plan for approval prior to beginning drilled shaft construction.
Cavity Remediation Option 1: Drill the rock socket to one foot below the lowest cavity. Perform sonic caliper testing to ensure that cavities aren’t on the edge of a cavern. Fill the rock socket with lean concrete to a depth that is five feet above the highest cavity. Allow two day set on the concrete. Re-drill that portion of the shaft and perform sonic caliper testing again to confirm that the cavities have been sealed. Continue drilling of the shaft to the specified bearing elevation.
Cavity Remediation Option 2: Drill a slightly oversized rock socket to one foot below the lowest cavity. Insert a permanent steel casing that extends from one foot below the lowest cavity to the top of rock. Inside of this steel casing, advance the shaft to the specified bearing elevation with the design rock socket diameter.
9. Closing
9.1. The conclusions and recommendations presented herein are based on data and subsurface conditions from the borings drilled during the geotechnical exploration using that degree of care and skill ordinarily exercised under similar circumstances by competent members of the engineering profession. No warranties can be made regarding the continuity of conditions between borings.
9.2 General soil and rock descriptions and indicated boundaries are based on an engineering interpretation of all available subsurface information and may not
v:\1755\active\175562020\clerical\report\rpt_002_175562020\rpt_002_175562020.docx 11
necessarily reflect the actual variation in subsurface conditions between borings and samples. Collected data and field interpretation of conditions encountered in individual borings are shown on the drafted sheets in Appendix C.
9.3. The observed water levels and/or conditions indicated on the boring logs are as recorded at the time of exploration. These water levels and/or conditions may vary considerably, with time, according to the prevailing climate, rainfall, tail water elevations and/or other factors and are otherwise dependent on the duration of and methods used in the exploration program.
9.4. Stantec exercised sound engineering judgment in preparing the subsurface information presented herein. This information has been prepared and is intended for design and estimating purposes. Its presentation on the plans or elsewhere is for the purpose of providing intended users with access to the same information. This subsurface information interpretation is presented in good faith and is not intended as a substitute for independent interpretations or judgments of the Contractor.
9.5. All structure details shown herein are for illustrative purposes only and may not be indicative of the final design conditions shown in the contract plans.
v:\1755\active\175562020\clerical\report\rpt_002_175562020\rpt_002_175562020.docx 12

Appendix A
Location Map
0 FEET
GRAPHIC SCALE
1000 2000 4000
Project Site
LOCATION MAP
KY 152 OVER HERRINGTON LAKE
GARRARD/MERCER COUNTIES, KENTUCKY
Portions of USGS 7 1/2-minute Topographic Maps
(BRYANTSVILLE, WILMORE QUADRANGLES) SHOWING PROJECT SITE

Appendix B
Designer Drawings

WM
WV PK
WM
WMWMWM
MA
G
WM
WM
SIG
N
PK
WM
ST
C SP
SIG
N
SIG
NSIGN
WVWVWV
SIGN
WV
SIG
N
WMWMWMWV
WM
PK
WM
EL JB
LID
SEPTIC
SIG
N
STEPS
STEPS
STEPS
STEPS
STEPS
STEPS
TEL JB
POOL
GATE
CO
NVE
YO
R
RUIN
S
RUINS
POST
POSTPOST
POST
POST
KENNEDY BRIDGE ROAD
IP
IP
STATE HIGHWAY 152
BO
UN
DA
RY
OBSC
URE
ARE
A
BO
UN
DA
RY
OBSC
URE
ARE
A
BO
UN
DA
RY
OBSC
URE
ARE
A
#145
#146
#147
Fr
Gar
Conc
Carport
Asph
Asph
15"
CM
P
Shed
Fr
Conc
Gar
Metal
Pla
nk
Fe
nce
Gravel
Tank
Septic
eni
L l
ar
et
aL
eni
L l
ar
et
aL
STC
Tank
Septic
eni
L l
ar
et
aL
eni
L l
ar
et
aL
IP
IP
IP
IP
re
C "
8
IP
ec
ne
F
kn
alP
Gazebo
G&
C cnoC
Gravel
Gravel
Gravel
15" C
MP
IP
NO #
NO #
NO #
NO #
NO #
Gravel
Gravel
Asph
Home
Mobile
Res
1-S-Fr
ST
C
Lateral
Lin
e
LIDSEPTIC
Fence
Res
1-S-Fr
Res
1-S-Br
Res
1-S-Fr
Res
1-S-Fr
Asph
Asph
Asph
Asph
Asph
Garage
Res
w/Basement
1-S-Stone
llaW teR
LA
KE
VIE
W
AV
E
GR
ANT
AV
E
GR
ACE
AV
E
2E 1T 1T
V
Shed
Fr
Dirt
1-S-M Comm
Marine Works
2E 1T 1T
V
SL
Gravel
(Stone)
SIGN
2E 1T 1T
V
Sheds
Metal
2E 1T 1T
V
SL
2E 2T 1T
V
1E
1E
1E
ec
ne
F
kn
alP
Gate
Bldg
1-S-Metal
Shed
Fr
2E 1T 1T
V
Res
2-S-Fr
Gravel
Res
2-S-A-Fr
2E 1T 1T
V
Res
1-S-Fr
Res
1-S-Fr
Res
1-S-Fr
Gar
Metal
Gar
Metal
Storage
Metal
Res
1-S-Fr
Res
1-S-Fr
Res
1-S-Fr
Res
1-S-Fr
Sheds
Fr
Grav
el
Asph
Res
1-S-Fr
Asph
Res
2-S-Fr/
Blo
ck
Res
2-S-Fr
Res
2-S-Fr
Res
2-S-Fr
1E
1E 1T
4E 1T
2E 1T
2E 1T
1E 1T
1E
1E
Gravel
Gravel
2E 1T
M H
1E
JO
HNS
ON
AVE
Fence
Fence
Home
Mobile
Gar
Metal
1E
Home
Mobile
Home
Mobile
Gar
Metal
2E 3
T
2E 1
T
2E
Deck
Wood
Bldg
Stor
Block
BREEZ
Y
WA
Y
House
Bird
113.00’’
S76°29’5
2"E
175.05’
S12°5’49
"W
119.6
3’
N57°13
’19"W
164.14’
S46°21’7"E
88.0
0’
S46°21’7"E
Tank
Septic
Gravel/Dirt
169.52’
PANDORA MARINA
CPP
6"Walls
Ret
Garrard
County
Mercer County
54.8
1’S 41°47’14" E
+98.84
40.00
C.P. 1
C.P. 20
C.P. 50
C.P. 5
C.P. 21
C.P. 52
C.P. 53
C.P. 54
KENTUCKY UTILITIES
BILLIE G. ABNER (WF)
JAMES E. ABNER
TAMRIA BARTLEY (WF)
RICHARD D. BARTLEY, JR.
TAMRIA BARTLEY (WF)
RICHARD D. BARTLEY, JR.
PHYLLIS HURST (WF)
TONY HURST
CRYSTAL A. PARSON (WF)
TIM PARSON
SHEILA KAREN SOUTHERS (WF)
WILLIAM EDWARD SOUTHERS
152
10
P
9
P
7
P
1
P
MAGDALEN S. NOEL (SINGLE)
STEPHEN E. GARLAND
2
P
3
P
5
P
3
P
8
P
6
P
4
P
15+00
20
+00
25
+00
30+00
PC 12+93.92
PT 13+84.46
PC 15+27.93
PT 17
+80.00
PC 26
+27.59
PT 28+19.73
PC 28+46.60
PT 29+16.46
PI 2
9+74.56
PI 13+39.69
PI 17+
26.2
0
PI 27+31.
80
PI 2
8+81.9
7
ST
A 21+
85.00
ST
A 25
+35.00
ST
A 18
+35.00
+36.78
+71.06
+05.35
+60.00
N 16
°11’0
8"
W
S 46°2
1’0
7"
E
S 25°3
6’0
8"
E
N 38°51’29" E
C
C
C
C C
C
C
C
C
D
Runout=34.28’
Runoff=34.28’
e=RC
E=109.38’
R=125.00’
L=252.07’
T=198.27’
=115°32’23" Lt
PI STA 17+26.20
7
P
D
Runout=34.28’
Runoff=34.28’
e=RC
E=25.52’
R=200.00’
L=192.14’
T=104.21’
=55°02’37" Lt
PI STA 27+31.80
12’12’+75
11’11’
N 6°03
’06" E
C.P. 23
END PROJECT
STA 29+45.69
TAMRIA BARTLEY (WF)
RICHARD D. BARTLEY, JR.
3
P
2’ FB
DT
C
KENTUCKY UTILITIES
6
P
BEGIN CONSTRUCTION
STA 12+25.00
22
C.P.
STA 15+87.00 KY 152
STA 50+00.00 PANDORA DRIVE =
PANDORA DRIVE
STA 51+50.00 END
To Bry
ants
ville
20.00’
12+25.0020.00’
12+25.00
35.00’
12+75.00
40.00’
13+50.00
47.85’
17+50.39
40.00’
27+00.00
73.20’
27+30.18
70.39’
27+79.90
101.55’
28+32.84
62.43’
29+25.52
50.00’
14+40.00
30.00’
15+10.00
37.00’
15+50.00
39.96’
16+35.00
Esmt
Temp
tm
sE
mr
eP
Esmt
Temp
50
66.10
CCCC
PC 50
+78.26
PT 51+
20.65
PI 50
+99.54
’21
’21
R ’0
5
R
’05
ROGER SWIGER
ANGIE PRUITT (WID)
Esmt
Temp
D
Runout=34.28’
Runoff=34.28’
e=RC
E=3.44’
R=180.00’
L=69.86’
T=35.38’
=22°14’14" Rt
PI STA 28+81.97
D
Runout=34.28’
Runoff=34.28’
e=RC
E=4.16’
R=250.00’
L=90.54’
T=45.77’
=20°44’49" Rt
PI STA 13+39.69
D
e=NC
E=1.13’
R=200.00’
L=42.39’
T=21.28’
=12°08’39" Rt
PI STA 50+99.54
Esmt
Temp
24.49’
29+00.00
32.00’
28+64.57
26+05.40
END CONSTRUCTION
STA 29+28
16+58.93
53.93’
36.09’
15+69.97
66.12’
17+60.00
13+75.00
34.85’
Esmt
Temp
Esmt
Perm
17+12.35
33.70
27+50.81
33.73
28+13.19
32.11’
28+46.18
32.81’
29+45.69
80.41’
14+94.47
64.98’
27+24.86
110.00’
25+78.64110.00’
18+51.34
PANDORA DRIVE
JASON C. NEAL
CHERYL A. NEAL (WF)
CHRISTOPHER W. NEAL
Esmt
Temp


Appendix C
Subsurface Data Sheets

WM
WV
WM
WMWMWM
WM
WM
SIG
N
WM
ST
C SP
SIG
N
SIG
N
SIGN
WVWVWV
SIGN
WV
SIG
N
WMWMWMWV
WM
WM
EL JB
LID
SEPTIC
SIG
N
STEPS
STEPS
STEPS
STEPS
STEPS
TEL JB
POOL
GATE
RUINS
POST
POSTPOST
POST
POST
KENNEDY BRIDGE ROAD
IP
IP
STATE HIGHWAY 152
OBSC
URE
ARE
A
BO
UN
DA
RY
BO
UN
DA
RY
OBSC
URE
ARE
A
BO
UN
DA
RY
OBSC
URE
ARE
A
BOUNDARYOBSCURE AREA
BO
UN
DA
RY
OBSC
URE
ARE
A
#145
#146
#147
Conc
Carport
Asph
Asph
15"
CM
P
Shed
Fr
Conc
Gar
Metal
Pla
nk
Fe
nce
Gravel
Tank
Septic
eni
L l
ar
et
aL
eni
L l
ar
et
aL
STC
Tank
Septic
eni
L l
ar
et
aL
eni
L l
ar
et
aL
IP
IP
IP
IP
re
C "
8
IP
ec
ne
F
kn
alP
Gazebo
G&
C cnoC
Gravel
Gravel
Gravel
15" C
MP
IP
NO #
NO #
NO #
NO #
Gravel
Gravel
Asph
Home
Mobile
Res
1-S-Fr
ST
C
Lateral
Lin
e
LIDSEPTIC
Fence
Res
1-S-Fr
Res
1-S-Br
Res
1-S-Fr
Res
1-S-Fr
Asph
Asph
Asph
Asph
Asph
Garage
Res
w/Basement
1-S-Stone
llaW teRL
AK
E
VIE
W
AV
E
GR
ACE
AV
E
2E 1T 1T
V
Shed
Fr
Dirt
1-S-M Comm
Marine Works
2E 1T 1T
V
SL
Gravel
(Stone)
SIGN
2E 1T 1T
V
Sheds
Metal
2E 1T 1T
V
SL
2E 2T 1T
V
1E
1E
1E
ec
ne
F
kn
alP
Bldg
1-S-Metal
Shed
Fr
2E 1T 1T
V
Res
2-S-Fr
Gravel
2E 1T 1T
V
Res
1-S-Fr
Res
1-S-Fr
Res
1-S-Fr
Storage
Metal
Sheds
Fr
Grav
el
Asph
Res
1-S-Fr
Asph
Res
2-S-Fr/
Blo
ck
Res
2-S-Fr
Res
2-S-Fr
Res
2-S-Fr
1E
1E 1T
4E 1T
2E 1T
2E 1T
1E 1T
1E
1E
Gravel
Gravel
Home
Mobile
Gar
Metal
1E
Home
Mobile
Home
Mobile
Gar
Metal
2E 3
T
2E
Deck
Wood
Bldg
Stor
Block
BREEZ
Y
WA
Y
House
Bird
78.50’’
N17°57’9"
E148.19’’
S89°46’3
0"W
115.70’’
S89°8’3
3"E
113.00’’
S76°2
9’5
2"E
119.50’’
N15°30’21"E
122.30’’
S13°3
2’44
"W
16.75’’
N19°27’34
"E
115.94’
S84°45
’33"E
100.23’’
S6°35’1"
W
71.59’’
N19°27’3
5"E
109.00’’
S78°0’4
1"E
101.7
4’’
S79°2
0’2
2"E
106.01’’
S3°51’3
9"W
58.4
7’’
N58°36’15
"W
124.00’’
N27°0’53"E
395.58’N70°8’56"E
249.7
1’
S61°3
’8"E
146.7
0’
S62°29’2
8"E
191.10
’
N79°25’4"W
67.00’
S34°23’55"W
48.00’
S30°15’47"W
41.99’
S25°8’30"
W
220.04’S55°4’32"W
278.78’S60°12’13"W
329.8
0’
N40°52’2
4"W
168.0
0’
S47°2
6’4
9"E
146.84’
S43°5’25"W
72.23’
S22°45’57
"W
175.05’
S12°5’49
"W
147.09’
S4°18’48"
W
232.8
8’
S75°35’18
"E
219.14’
S75°35’18
"E
180.53’
S28°49’19"W
258.10’
S52°16’8"E
119.6
3’
N57°13
’19"W
89.02’
S38°17’18"W
213.58’
S85°33’2
1"E
88.0
0’
S46°21’2
3"E
148.54’N49°14’27"E
148.55’N49°14’27"E
173.34’N49°14’27"E
163.6
0’
S37°4
0’3
0"E
164.14’
S46°2
1’7"E
88.0
0’
S46°2
1’7"E
132.46’
S22°28’2
4"E
63.6
6’
S50°2’6"E
110.0
0’
S33°1’4
7"E
61.00’S71°7’50"W
69.60’
N76°34’26"E
Tank
Septic
Gravel/Dirt
Mercer County Garrard County
169.52’
PANDORA MARINA
CPP
6"Walls
Ret
LEGEND
Rock Core
0’ 100’ 200’50’
SCALE: 1" = 50’
Sheet 1 of 8
Direction of Angled Boring
B-2B-1
B-8
B-9B-7
B-6
B-13B-11
B-10 B-12
Sounding
B-3
B-4
B-5
B-14
B-16
B-17
Sample Boring with Rock Core
Sample Boring
B-22
E-S
HE
ET
NA
ME:
Micro
Statio
n v8.11.7.443
ITEM NUMBER
DRAWING NO.
SHEET NO.
Commonwealth of Kentucky
DEPARTMENT OF HIGHWAYSCOUNTY
ROUTE CROSSING
PREPARED BY
DETAILED BY:
DESIGNED BY:
DATE: CHECKED BY
REVISION DATE
7-1116.00
AAC
RWE
GARRARD/MERCER
KY 152 HERRINGTON LAKE
BORING LAYOUT
NOVEMBER, 2014
No
ve
mber 19, 2014
DA
TE P
LO
TT
ED:
dellis
on
US
ER:
V:\17
55\
AC
TIV
E\17
5562020\
GE
OT
EC
HNIC
AL\
DR
AWIN
G\
SH
EE
T_FIL
ES\62020
B-10
1-B
L1.
DG
NFIL
E
NA
ME:
PK
MA
G
PK
PK
C.P. 1
C.P. 20
C.P. 50
C.P. 5
C.P. 21
C.P. 52
C.P. 53
C.P. 54
PHYLLIS HURST (WF)
TONY HURST
152
15+00
20
+00
25
+00
30+00
PC 12+93.92
PT 13+84.46
PC 15+27.93
PT 17
+80.00
PC 26
+27.59
PT 28+19.73
PC 28+46.60
PT 29+16.46
PI 2
9+74.56
PI 13+39.69
PI 17+
26.2
0
PI 27+31.
80
PI 2
8+81.9
7
ST
A 21+
85.00
ST
A 25
+35.00
ST
A 18
+35.00
+36.78
+71.06
+05.35
+60.00
N 16
°11’0
8"
W
S 46°2
1’0
7"
E
S 25°3
6’0
8"
E
N 38°51’29" E
C
C
C
C C
C
C
C
C
D
Runout=34.28’
Runoff=34.28’
e=RC
E=109.38’
R=125.00’
L=252.07’
T=198.27’
=115°32’23" Lt
PI STA 17+26.20
D
Runout=34.28’
Runoff=34.28’
e=RC
E=25.52’
R=200.00’
L=192.14’
T=104.21’
=55°02’37" Lt
PI STA 27+31.80
12’12’+75
11’11’
N 6°03
’06" E
C.P. 23
END CONSTRUCTION
STA 28+62.00
END PROJECT
STA 29+49.06
2’ FB
DT
C
BEGIN CONSTRUCTION
STA 12+25.00
22
C.P.
STA 15+87.00 KY 152
STA 50+00.00 PANDORA DRIVE =
PANDORA DRIVE
STA 51+50.00 END
To Bry
ants
ville
Esmt
Temp
tm
sE
mr
eP
Esmt
Temp
+47.83
38.80
+31.77
47.23
+12.35
CCCC
PC 50
+78.26
PT 51+
20.65
PI 50
+99.54
’21
’21
R ’0
5
R
’05
Esmt
Temp
D
Runout=34.28’
Runoff=34.28’
e=RC
E=3.44’
R=180.00’
L=69.86’
T=35.38’
=22°14’14" Rt
PI STA 28+81.97
D
Runout=34.28’
Runoff=34.28’
e=RC
E=4.16’
R=250.00’
L=90.54’
T=45.77’
=20°44’49" Rt
PI STA 13+39.69
D
e=NC
E=1.13’
R=200.00’
L=42.39’
T=21.28’
=12°08’39" Rt
PI STA 50+99.54
+

Elev.
Offset
Location
Hole No.
31 31 65
67 67
61 42 97
100
65 57
72 72 90
66 66
100
59 48 99
99 99 99
84 84 100
96 96
96 96 99
97 97
88 88 91
98 98
62 62
90 90
99 99 99
100
100
100
100
100
100
790
780
770
760
750
740
730
720
710
630
640
650
660
Elev.
Offset
Location
Hole No.
790
780
770
760
750
740
730
720
630
640
650
660
670
680
690
700
710
670
680
690
700
764.2 to 759.0
Weathered from 768.5 to 767.2 and
shale stringers, some weathered zones
to fine grained, thin to medium bedded, with
Limestone, light gray to gray, micro-crystalline
shale stringers, some weathered zones
to fine grained, thin to medium bedded, with
Limestone, light gray to gray, micro-crystalline
620
610
600
590
580
570
560
550
460
470
480
490
500
510
520
530
540
620
610
600
590
580
570
560
550
540
460
470
480
490
500
510
520
530
620 620
Base of weathered rock elev.= 773.6
Top of rock elev.= 779.5
90 90 100
96 96 100
92 92 100
100100
100100
10086 86
10045 45
10047 47
10071 71
10067 53
100100 100
100
100
100
73 73
90 90
96 96
10082 82
10072 72
48 48 98
96 96 99
450450
DatumDatum
Sheet 2 of 8
NOTES:
(Vertical Only)
SCALE: 1" = 10’
Sea Level.
2. Surface elevations are referenced to Mean
alignment and grade.
profiles, and cross sections for final
recommendations. Refer to project plans,
1. This sheet presents geotechnical data and
and 566.4 to 565.6
Weathered from 570.2 to 569.4
Weathered from 579.7 to 578.9
Weathered from 593.5 to 593.0
zones
shale stringers, some weathered
thin to medium bedded, with
micro-crystalline to fine grained,
Limestone, light gray to gray,
Clay seam at 758.0
water staining
weathering, limestone streaks, some
Shale, light brown to dark brown, little
3431
8556
RQD
STD
RQD
KY
REC
RQD
STD
RQD
KY
REC786.0
26’ Lt.
Sta. 18+42
B-1
Weathered from 751.0 to 745.5
shale stringers, some weathered zones
to fine grained, thin to medium bedded, with
Limestone, light gray to gray, micro-crystalline
Lost all water return at 681.0
Void (682.0 to 681.0)
Void (776.5 to 773.6)
42
89
Overburden
Fractured zone from 604.6 to 601.2
Weathered from 629.0 to 627.2
Weathered from 641.0 to 640.0
653.7 to 652.8
Very weathered from 666.8 to 665.2 and
Weathered from 681.0 to 680.0
shale stringers, some weathered zones
to fine grained, thin to medium bedded, with
Limestone, light gray to gray, micro-crystalline
E-S
HE
ET
NA
ME:
Micro
Statio
n v8.11.7.443
ITEM NUMBER
DRAWING NO.
SHEET NO.
Commonwealth of Kentucky
DEPARTMENT OF HIGHWAYSCOUNTY
ROUTE CROSSING
PREPARED BY
DETAILED BY:
DESIGNED BY:
DATE: CHECKED BY
REVISION DATE
7-1116.00
AAC
PJB
GARRARD/MERCER
KY 152 HERRINGTON LAKE
LOGS OF BORING
NOVEMBER, 2014
No
ve
mber 19, 2014
DA
TE P
LO
TT
ED:
pbo
nd
US
ER:
V:\17
55\
AC
TIV
E\17
5562020\
GE
OT
EC
HNIC
AL\
DR
AWIN
G\
SH
EE
T_FIL
ES\62020
B-301-
B01.
DG
NFIL
E
NA
ME:
ABUTMENT 1
(psi)
U.C.
17583
18750
24819
(psi)
U.C.
30611
28069
22625
35042
35111
20111
19986
22056
25681
15292
18000
19472
17806
24542
790
780
770
760
750
740
730
720
710
790
780
770
760
750
740
730
720
710
Datum
Shale stringers, some weathered zones
grained, thin to medium bedded, with
Limestone, gray and tan, fine to medium
742.6 to 742.1
Water stained and weathered from
Shale stringers, some weathered zones
grained, thin to medium bedded, with
Limestone, gray and tan, fine to medium
Base of weathered rock elev.= 782.2
Top of rock elev.= 782.2
STDRQD KYRQD REC
82 82 99
55 55 67
33 33 45
56 56 90
74 74 74
68 68 96
32 32
95 95 98
98 98 98
100
786.6
16’ Lt.
Sta. 17+80
B-2
from 770.0 to 765.6
Clay seam and very weathered
some weathered zones
bedded, with shale stringers,
medium grained, thin to medium
Limestone, gray and tan, fine to
Void (768.8 to 765.4)
Overburden
Void (757.2 to 755.0)
Elev.
Offset
Location
Hole No.
Elev.
Offset
Location
Hole No.
ABUTMENT 1
800 800

Elev.
Offset
Location
Hole No.
790
780
770
760
750
740
730
Elev.
Offset
Location
Hole No.
790
780
770
760
750
740
730
Datum
Sheet 3 of 8
NOTES:
(Vertical Only)
SCALE: 1" = 10’
Sea Level.
2. Surface elevations are referenced to Mean
alignment and grade.
profiles, and cross sections for final
recommendations. Refer to project plans,
1. This sheet presents geotechnical data and
E-S
HE
ET
NA
ME:
Micro
Statio
n v8.11.7.443
ITEM NUMBER
DRAWING NO.
SHEET NO.
Commonwealth of Kentucky
DEPARTMENT OF HIGHWAYSCOUNTY
ROUTE CROSSING
PREPARED BY
DETAILED BY:
DESIGNED BY:
DATE: CHECKED BY
REVISION DATE
7-1116.00
AAC
PJB
GARRARD/MERCER
KY 152 HERRINGTON LAKE
LOGS OF BORING
NOVEMBER, 2014
No
ve
mber 19, 2014
DA
TE P
LO
TT
ED:
rfly
nn
US
ER:
V:\17
55\
AC
TIV
E\17
5562020\
GE
OT
EC
HNIC
AL\
DR
AWIN
G\
SH
EE
T_FIL
ES\62020
B-301-
B02.
DG
NFIL
E
NA
ME:
ABUTMENT 1
800 800
810 810
790.0
38’ Lt.
18+18
B-3
(788.9)
R
786.1
16’ Rt.
18+32
B-4
(780.5)
R
786.1
38’ Rt.
18+18
B-5
LIw%
21 N=11
31 N=26
(779.6)
R
A-7-6(12), GC, S+C=45(14+31)-0.08
0.08
Elev.
Offset
Location
Hole No.
Elev.
Offset
Location
Hole No.
Datum
NOTES:
(Vertical Only)
Sea Level.
2. Surface elevations are referenced to Mean
alignment and grade.
profiles, and cross sections for final
recommendations. Refer to project plans,
1. This sheet presents geotechnical data and
740 740
720720
700 700
680680
660 660
640640
620 620
600600
580 580
560560
540 540
520520
500 500
480480
460 460
440440
420 420
400400
Sheet 4 of 8
SCALE: 1" = 20’
PIER 1
E-S
HE
ET
NA
ME:
Micro
Statio
n v8.11.7.443
ITEM NUMBER
DRAWING NO.
SHEET NO.
Commonwealth of Kentucky
DEPARTMENT OF HIGHWAYSCOUNTY
ROUTE CROSSING
PREPARED BY
DETAILED BY:
DESIGNED BY:
DATE: CHECKED BY
REVISION DATE
7-1116.00
AAC
RWE
GARRARD/MERCER
KY 152 HERRINGTON LAKE
LOGS OF BORING
NOVEMBER, 2014
No
ve
mber 19, 2014
DA
TE P
LO
TT
ED:
dellis
on
US
ER:
V:\17
55\
AC
TIV
E\17
5562020\
GE
OT
EC
HNIC
AL\
DR
AWIN
G\
SH
EE
T_FIL
ES\62020
B-301-
B03.
DG
NFIL
E
NA
ME:
739.0
12’ Lt.
Sta. 21+71
B-6
Stick-up
Water
Overburden
Base of weathered rock elev.= 542.4’
Top of rock elev.= 546.4’
RQD
STD
RQD
KY
REC
0 0 96
Void (524.7 to 523.8)
zones from 525.3 to 524.8, 522.7 to 522.0
Highly fractured (Small losses)
Lost all water return at 544.5
stringers
grained, thin to thick bedded, shale
Limestone, light gray, micro-crystalline
stringers
grained, thin to thick bedded, shale
Limestone, light gray, micro-crystalline
Shale is gray, irregular
grained, thin to thick bedded
Limestone is light gray, micro-crystalline
Limestone (70%) interbedded with Shale (30%),
Void (498.9 to 498.6)
micro-crystalline grained, thick bedded
Limestone (Dolomite), light gray,
Shale is gray
grained, thin to medium bedded
Limestone is light gray, micro-crystalline
Limestone (70%) interbedded with Shale (30%),
54 54 100
28 28 96
54 54 98
50 50 88
96 96 100
93 93 97
93 93 100
88 88 100
98 98 100
98 95 100
90 90 100
(psi)
U.C.
19875
15431
22431
16472
19125
Water
Overburden
Base of weathered rock elev.= 540.5’
Top of rock elev.= 545.4’
RQD
STD
RQD
KY
REC
0 0 78
micro-crystalline grained, medium bedded
Limestone (Dolomite), light gray,
729.8
10’ Rt.
Sta. 21+75
B-7
Stick-up
LIw% LIw%
N=221
Shale is gray, irregular
grained, thin to medium bedded
Limestone is light gray, micro-crystalline
Limestone (70%) interbedded with Shale (30%),
Void, gravel filled (541.0 to 540.5)
Void (528.3 to 527.7)
Void (527.4 to 526.6)
Shale is gray, irregular
grained, thin to thick bedded
Limestone is light gray, micro-crystalline
Limestone (70%) interbedded with Shale (30%),
micro-crystalline grained, medium bedded
Limestone (Dolomite), light gray,
Shale is gray, irregular
grained, thin to thick bedded
Limestone is light gray, micro-crystalline
Limestone (70%) interbedded with Shale (30%),
38 38 95
28 28 80
83 83 100
94 94 100
72 72 100
82 82 100
90 90 100
100
94 94 100
100 100
Void (524.8 to 524.0)
N=23, A-6(7), CL, S+C=50(32+18)0.14
(psi)
U.C.
19000
21986
20764
Elev.
Offset
Location
Hole No.
Elev.
Offset
Location
Hole No.
Datum
NOTES:
(Vertical Only)
Sea Level.
2. Surface elevations are referenced to Mean
alignment and grade.
profiles, and cross sections for final
recommendations. Refer to project plans,
1. This sheet presents geotechnical data and
740 740
720720
700 700
680680
660 660
640640
620 620
600600
580 580
560560
540 540
520520
500 500
480480
460 460
440440
420 420
400400
Sheet 5 of 8
SCALE: 1" = 20’
PIER 1
E-S
HE
ET
NA
ME:
Micro
Statio
n v8.11.7.443
ITEM NUMBER
DRAWING NO.
SHEET NO.
Commonwealth of Kentucky
DEPARTMENT OF HIGHWAYSCOUNTY
ROUTE CROSSING
PREPARED BY
DETAILED BY:
DESIGNED BY:
DATE: CHECKED BY
REVISION DATE
7-1116.00
AAC
RWE
GARRARD/MERCER
KY 152 HERRINGTON LAKE
LOGS OF BORING
NOVEMBER, 2014
No
ve
mber 19, 2014
DA
TE P
LO
TT
ED:
dellis
on
US
ER:
V:\17
55\
AC
TIV
E\17
5562020\
GE
OT
EC
HNIC
AL\
DR
AWIN
G\
SH
EE
T_FIL
ES\62020
B-301-
B04.
DG
NFIL
E
NA
ME:
Water
730.4
10’ Rt.
Sta. 21+96
B-9
Stick-up
Overburden
Base of weathered rock elev.= 545.1’
Top of rock elev.= 547.3’
RQD
STD
RQD
KY
REC
18 18 52
micro-crystalline grained, medium bedded
Limestone (Dolomite), light gray,
Lost water at 546.4
medium bedded, weathered joints
micro-crystalline grained, thin to
Limestone, light gray,
Void (543.8 to 543.2)
Near vertical fracture from 538.3 to 537.8
Shale is gray, irregular
grained, thin to medium bedded
Limestone is light gray, micro-crystalline
Limestone (70%) interbedded with Shale (30%),
Void (524.1 to 523.2)
micro-crystalline grained, medium bedded
Limestone, light gray,
Shale is gray, irregular
grained, thin to thick bedded
Limestone is light gray, micro-crystalline
Limestone (70%) interbedded with Shale (30%),
Shale is gray, irregular
grained, thin to thick bedded
Limestone is light gray, micro-crystalline
Limestone (70%) interbedded with Shale (30%),
54 54 98
39 34 96
52 52 91
88 88 100
98 98 100
90 90 100
92 92 100
95 95 100
84 84 100
96 96 100
(psi)
U.C.
25069
25167
17167
16111
Stick-up
Water
Overburden
Base of weathered rock elev.= 542.9’
Top of rock elev.= 547.0’
RQD
STD
RQD
KY
REC
12 12 47
Void (533.9 to 533.3)
Shale is gray, irregular
grained, thin to medium bedded
Limestone is light gray, micro-crystalline
Limestone (70%) interbedded with Shale (30%),
micro-crystalline grained, thick bedded
Limestone (Dolomite), light gray,
736.3
11’ Lt.
Sta. 21+95
B-8
Lost all water return at 540.7
stringers
grained, thin to thick bedded, shale
Limestone, light gray, micro-crystalline
523.1 to 522.9
from 525.8 to 525.6, 524.6 to 524.2,
Highly fractured zones (Minor losses)
stringers
grained, thin to thick bedded, shale
Limestone, light gray, micro-crystalline
56 56 94
51 51 91
61 61 96
94 94 100
96 96 100
86 86 100
87 87 100
96 96 100
93 93 100
96 96 100
92 92 100Shale is gray
grained, thin to thick bedded
micro-crystalline
Limestone is light gray,
with Shale (30%),
Limestone (70%) interbedded
(psi)
U.C.
11500
17875
19681
16389
22347
Elev.
Offset
Location
Hole No.
750
740
730
720
710
630
640
650
660
Elev.
Offset
Location
Hole No.
750
740
730
720
630
640
650
660
670
680
690
700
710
670
680
690
700
620 620
Datum
Sheet 6 of 8
NOTES:
(Vertical Only)
SCALE: 1" = 10’
Sea Level.
2. Surface elevations are referenced to Mean
alignment and grade.
profiles, and cross sections for final
recommendations. Refer to project plans,
1. This sheet presents geotechnical data and
PIER 2
610
600
590
580
610
600
590
580
E-S
HE
ET
NA
ME:
Micro
Statio
n v8.11.7.443
ITEM NUMBER
DRAWING NO.
SHEET NO.
Commonwealth of Kentucky
DEPARTMENT OF HIGHWAYSCOUNTY
ROUTE CROSSING
PREPARED BY
DETAILED BY:
DESIGNED BY:
DATE: CHECKED BY
REVISION DATE
7-1116.00
AAC
RWE
GARRARD/MERCER
KY 152 HERRINGTON LAKE
LOGS OF BORING
NOVEMBER, 2014
No
ve
mber 19, 2014
DA
TE P
LO
TT
ED:
dellis
on
US
ER:
V:\17
55\
AC
TIV
E\17
5562020\
GE
OT
EC
HNIC
AL\
DR
AWIN
G\
SH
EE
T_FIL
ES\62020
B-301-
B05.
DG
NFIL
E
NA
ME:
738.0
8’ Lt.
Sta. 25+24
B-10
Water
RQD
STD
RQD
KY
REC
Base of weathered rock elev.= 707.6’
Top of rock elev.= 711.2’
Lost water at 708.5
Shale is gray
micro-crystalline grained, thin to medium bedded
Limestone is gray to light gray,
Limestone (70%) interbedded with Shale (30%),
Void (659.1 to 658.7)
28 28 85
87 87 100
73 73
96 96 99
78 70
84 84 100
96 96 100
87 87 100
99
100
665.9 to 664.9
Healed vertical fracture from
High angled fracture at 666.2
Fractured zone from 667.9 to 667.8
medium bedded, some shale partings
micro-crystalline grained, thin to
Limestone, light gray to gray,
(psi)
U.C.
16750
21542
21542
Water
RQD
STD
RQD
KY
REC
Base of weathered rock elev.= 709.3’
Top of rock elev.= 710.9’
Void (659.1 to 658.8)
55 55 91
738.2
9’ Rt.
Sta. 25+24
B-11
stringers/partings
grained, thin to thick bedded, shale
Limestone, light gray, micro-crystalline
86 86 100
74 68 100
87 87 100
96 96 100
96 96 97
99 99 100
94 94 100
Lost water at 683.1
Near vertical fracture from 684.0 to 683.1
Shale is gray, irregular
grained, thin to medium bedded
Limestone is light gray, micro-crystalline
Limestone (70%) interbedded with Shale (30%),
4944
(psi)
U.C.
22917
16486
12972

Elev.
Offset
Location
Hole No.
750
740
730
720
710
630
640
650
660
Elev.
Offset
Location
Hole No.
750
740
730
720
630
640
650
660
670
680
690
700
710
670
680
690
700
620 620
Datum
Sheet 7 of 8
NOTES:
(Vertical Only)
SCALE: 1" = 10’
Sea Level.
2. Surface elevations are referenced to Mean
alignment and grade.
profiles, and cross sections for final
recommendations. Refer to project plans,
1. This sheet presents geotechnical data and
PIER 2
610
600
590
580
610
600
590
580
E-S
HE
ET
NA
ME:
Micro
Statio
n v8.11.7.443
ITEM NUMBER
DRAWING NO.
SHEET NO.
Commonwealth of Kentucky
DEPARTMENT OF HIGHWAYSCOUNTY
ROUTE CROSSING
PREPARED BY
DETAILED BY:
DESIGNED BY:
DATE: CHECKED BY
REVISION DATE
7-1116.00
AAC
RWE
GARRARD/MERCER
KY 152 HERRINGTON LAKE
LOGS OF BORING
NOVEMBER, 2014
No
ve
mber 19, 2014
DA
TE P
LO
TT
ED:
pbo
nd
US
ER:
V:\17
55\
AC
TIV
E\17
5562020\
GE
OT
EC
HNIC
AL\
DR
AWIN
G\
SH
EE
T_FIL
ES\62020
B-301-
B06.
DG
NFIL
E
NA
ME:
Water
RQD
STD
RQD
KY
REC
Base of weathered rock elev.= 711.6’
Top of rock elev.= 723.2’
16 16 95
738.6
8’ Lt.
Sta. 25+40
B-12
668.9 and 668.0 to 667.6
Water stained joints from
bedded, shale stringers/partings
micro-crystalline grained, thick
Limestone, light gray, coarse to
from 659.4 to 659.0
Void (Partially clay filled)
85 85 100
89 89 100
98 98 100
95 95 100
71 60 100
9696 96
Weathered joints at 695.2 and 692.7
Lost water at 716.6
Shale is gray, irregular
grained, medium to thick bedded
Limestone is light gray, micro-crystalline
Limestone (70%) interbedded with Shale (30%),
0 0 83
(psi)
U.C.
18319
11792
11569
Water
Base of weathered rock elev.= 713.6’
Top of rock elev.= 725.8’
738.4
8’ Rt.
Sta. 25+44
B-13
Lost water at 708.4
Clay seam from 714.1 to 713.7
and 716.0 to 715.4
Near vertical fracture from 719.1 to 718.5,
Lost water at 722.9, 50% returned at 719.9
Shale is gray, irregular, weathered joints
grained, thin to medium bedded
Limestone is light gray, micro-crystalline
Limestone (70%) interbedded with Shale (30%),
massive bedded, shale stringers/partings
micro-crystalline grained, thick to
Limestone, light gray, medium to
Void from 659.5 to 659.1
RQD
STD
RQD
KY
REC
0 0 96
39 39 96
93 93 100
96 96 100
96 96 100
100100 100
10092 88
90 90 92
(psi)
U.C.
10361
26125
16319

Elev.
Offset
Location
Hole No.
750
740
730
720
710
Elev.
Offset
Location
Hole No.
750
740
730
720
710
Datum
Sheet 8 of 8
NOTES:
(Vertical Only)
SCALE: 1" = 10’
Sea Level.
2. Surface elevations are referenced to Mean
alignment and grade.
profiles, and cross sections for final
recommendations. Refer to project plans,
1. This sheet presents geotechnical data and
ABUTMENT 2
760 760
770 770
780 780
790 790
800 800
810 810
E-S
HE
ET
NA
ME:
Micro
Statio
n v8.11.7.443
ITEM NUMBER
DRAWING NO.
SHEET NO.
Commonwealth of Kentucky
DEPARTMENT OF HIGHWAYSCOUNTY
ROUTE CROSSING
PREPARED BY
DETAILED BY:
DESIGNED BY:
DATE: CHECKED BY
REVISION DATE
7-1116.00
AAC
RWE
GARRARD/MERCER
KY 152 HERRINGTON LAKE
LOGS OF BORING
NOVEMBER, 2014
No
ve
mber 19, 2014
DA
TE P
LO
TT
ED:
dellis
on
US
ER:
V:\17
55\
AC
TIV
E\17
5562020\
GE
OT
EC
HNIC
AL\
DR
AWIN
G\
SH
EE
T_FIL
ES\62020
B-301-
B07.
DG
NFIL
E
NA
ME:
782.3
48’ Lt.
26+60
B-14
(779.4)
R
RQD
STD
RQD
KY
REC
Base of weathered rock elev.= 777.1’
Top of rock elev.= 790.5’
13 13 97
792.4
15’ Rt.
Sta. 26+60
B-16
12 12 80
0 0 40
66 66
80 80 98
46 46
88 88
100
100
100
Void
Weathered from 772.3 to 771.8
Multiply voids from 782.4 to 777.4
thick bedded, some shale stringers
micro-crystalline grained, thin to
Limestone, light gray, medium to
Lost water at 783.9
weathered
thick bedded, shale stringers,
micro-crystalline grained, thin to
Limestone, light gray, medium to
Shale is gray, irregular
thin bedded
Limestone is light gray, micro-crystalline grained,
Limestone (70%) interbedded with Shale (30%),
Overburden
792.4
41’ Rt.
26+60
B-17
(790.6)
R
Appendix D
Coordinate Data Submission Form

(select one) Sea Level Assumed
18+42.00 26.00' Lt.17+80.00 16.00' Lt.18+18.00 38.00' Lt.18+32.00 16.00' Rt.18+18.00 38.00' Rt.21+70.81 11.84' Lt.21+74.65 9.58' Rt.21+95.12 10.87' Lt.21+96.00 9.51' Rt.25+23.84 8.37' Lt.25+24.36 8.81' Rt.25+40.12 7.55' Lt.25+44.00 8.00' Rt.26+60.00 48.00' Lt.26+60.00 15.00' Rt.26+60.00 41.00' Rt.27+50.00 60.00' Rt.
* These borings were drilled from a floating plant in Herrington Lake. The elevation recorded is referenced to the top of casing seated into bedrock.
Project No.: BRO 5129, FD52 084 0152 018-019, FD 52 040 0152 000-001
HOLENUMBER
B-3
Elevation Datum
789.9
LONGITUDE
-84.704964842
COORDINATE DATA SUBMISSION FORMKYTC DIVISION OF MATERIALS - GEOTECHNICAL BRANCH
37.746170400
County: Garrard/MercerRoad Number: KY 152Survey Crew / Consultant: WMB, IncContact Person: James Napier, PE, PLSItem No.: 7-1116.00Mars No.: 84690
B-1B-2
B-7B-8
B-5
STATION OFFSET
786.0786.6
736.3*
ELEVATION (ft)
786.0786.1739.0*
730.4*
37.746091310
37.74686267037.746136670
37.747362100
729.8*
Date: February 2015
37.745447907
Notes: All coordinates should be NAD-83. Latitude and Longitude in decimal degrees. Station and Offset in KY 152 Stationing. Borings B-1 and B-2 were drilled in 2013. All other borings drilled in 2014. Boring locations were staked by WMB personnel. All borings were drilled by Stantec.
37.74541861037.74535394037.745285840
37.745299242
LATITUDE
-84.705076896
-84.704204130
B-22
B-10
-84.702804770811.5
738.0*
-84.705050110-84.704875200-84.704847280
B-4
B-6
-84.703418180-84.704091750
-84.704138510-84.704148060
B-9
37.746120580
B-11 738.2* 37.746833730 -84.703371190B-12 738.6* 37.746895740 -84.703380170B-13 738.4* 37.746876780 -84.703330140B-14 782.3 37.747207210 -84.703247180B-16 791.1 37.747120120 -84.703058760B-17 792.2 37.747083000 -84.702982000
1 of 1
Appendix E
Drilled Shaft Capacity Tables

Drilled Shaft Diameter (ft) = 6 in overburdenRock Socket Diameter (in) = 66Rock Socket Diameter (ft) = 5.5
9/17/2015
Nominal Nominal Total Total Total Total Total Total TotalShaft Unit Unit Nominal* Nominal Nominal Allowable Allowable Factored Factored Factored FactoredTip Side End Side End Axial Bearing Bearing Axial Uplift Axial Uplift
Elevation Shear Bearing Resistance Resistance Capacity Capacity Capacity Resistance Resistance Resistance Resistance(ft) qss (ksf) qeb (ksf) Rsr (kips) Reb (kips) Qut (kips) FS = 2 (kips) FS = 3 (kips) φRt (kips) φRtu (kips) φRt (kips) φRtu (kips)
Top of Rock >>> 779.5 0.0 0.0 0 0 0 0 0 0 0 0 0779.0 0.0 0.0 0 0 0 0 0 0 0 0 0778.0 0.0 0.0 0 0 0 0 0 0 0 0 0777.0 0.0 0.0 0 0 0 0 0 0 0 0 0776.0 0.0 0.0 0 0 0 0 0 0 0 0 0775.0 0.0 0.0 0 0 0 0 0 0 0 0 0774.0 22.6 213.0 390 0 390 195 130 215 156 390 312773.0 22.6 213.0 781 0 781 390 260 430 312 781 625772.0 22.6 213.0 1171 0 1171 586 390 644 469 1171 937771.0 22.6 213.0 1562 0 1562 781 521 859 625 1562 1250770.0 22.6 213.0 1952 0 1952 976 651 1074 781 1952 1562769.0 22.6 213.0 2343 0 2343 1171 781 1289 937 2343 1874768.0 22.6 213.0 2733 0 2733 1367 911 1503 1093 2733 2187767.0 22.6 213.0 3124 0 3124 1562 1041 1718 1250 3124 2499766.0 22.6 213.0 3514 0 3514 1757 1171 1933 1406 3514 2812765.0 22.6 213.0 3905 0 3905 1952 1302 2148 1562 3905 3124764.0 22.6 213.0 4295 0 4295 2148 1432 2363 1718 4295 3436763.0 22.6 213.0 4686 0 4686 2343 1562 2577 1874 4686 3749762.0 22.6 213.0 5076 0 5076 2538 1692 2792 2031 5076 4061761.0 22.6 213.0 5467 0 5467 2733 1822 3007 2187 5467 4374760.0 22.6 213.0 5857 0 5857 2929 1952 3222 2343 5857 4686759.0 11.1 22.0 6049 0 6049 3025 2016 3327 2420 6049 4839758.0 11.1 22.0 6241 0 6241 3121 2080 3433 2496 6241 4993757.0 11.1 22.0 6433 0 6433 3216 2144 3538 2573 6433 5146756.0 11.1 22.0 6625 0 6625 3312 2208 3644 2650 6625 5300755.0 11.1 22.0 6816 0 6816 3408 2272 3749 2727 6816 5453754.0 11.1 22.0 7008 0 7008 3504 2336 3855 2803 7008 5607753.0 11.1 22.0 7200 0 7200 3600 2400 3960 2880 7200 5760752.0 25.4 1950.0 7639 0 7639 3819 2546 4201 3056 7639 6111751.0 25.4 1950.0 8078 0 8078 4039 2693 4443 3231 8078 6462750.0 25.4 1950.0 8517 0 8517 4258 2839 4684 3407 8517 6813749.0 25.4 1950.0 8956 0 8956 4478 2985 4926 3582 8956 7164748.0 25.4 1950.0 9394 0 9394 4697 3131 5167 3758 9394 7516747.0 25.4 1950.0 9833 0 9833 4917 3278 5408 3933 9833 7867746.0 25.4 1950.0 10272 0 10272 5136 3424 5650 4109 10272 8218745.0 25.4 1950.0 10711 0 10711 5356 3570 5891 4284 10711 8569744.0 25.4 1950.0 11150 0 11150 5575 3717 6132 4460 11150 8920743.0 25.4 1950.0 11589 0 11589 5794 3863 6374 4636 11589 9271742.0 25.4 1950.0 12028 0 12028 6014 4009 6615 4811 12028 9622741.0 25.4 1950.0 12467 0 12467 6233 4156 6857 4987 12467 9973740.0 25.4 1950.0 12906 0 12906 6453 4302 7098 5162 12906 10324
NOTE: * It is assumed that in hard rock both side D (ft.) = 5.5resistance and end bearing will not develop From AASHTO LRFD, 2014 Edition Side Resistance in Rock = 0.55simultaneously. Table 10.5.5.2.4-1 Tip Resistance in Rock = 0.50** If shafts extend below elevation 740.0 feet, Uplift Resistance in Rock = 0.40contact Stantec for additional capacity information. Extreme Limit Side & Tip Resistance = 1.00
Extreme Limit Uplift Resistance = 0.80
DRILLED SHAFT AXIAL CAPACITY TABLE
KY 152 over Herrington Lake - Abutment 1
Service Limit State Strength Limit State Extreme Limit State

Drilled Shaft Diameter (ft) = 8 in overburdenRock Socket Diameter (in) = 90Rock Socket Diameter (ft) = 7.5
9/17/2015
Nominal Nominal Total Total Total Total Total Total TotalShaft Unit Unit Nominal* Nominal Nominal Allowable Allowable Factored Factored Factored FactoredTip Side End Side End Axial Bearing Bearing Axial Uplift Axial Uplift
Elevation Shear Bearing Resistance Resistance Capacity Capacity Capacity Resistance Resistance Resistance Resistance(ft) qss (ksf) qeb (ksf) Rsr (kips) Reb (kips) Qut (kips) FS = 2 (kips) FS = 3 (kips) φRt (kips) φRtu (kips) φRt (kips) φRtu (kips)
Top of Rock >>> 545.5 0.0 0.0 0 0 0 0 0 0 0 0 0544.5 0.0 0.0 0 0 0 0 0 0 0 0 0543.5 0.0 0.0 0 0 0 0 0 0 0 0 0542.5 0.0 0.0 0 0 0 0 0 0 0 0 0541.5 0.0 0.0 0 0 0 0 0 0 0 0 0540.5 0.0 0.0 0 0 0 0 0 0 0 0 0539.5 0.0 0.0 0 0 0 0 0 0 0 0 0538.5 0.0 0.0 0 0 0 0 0 0 0 0 0537.5 0.0 0.0 0 0 0 0 0 0 0 0 0536.5 0.0 0.0 0 0 0 0 0 0 0 0 0535.5 0.0 0.0 0 0 0 0 0 0 0 0 0534.5 0.0 0.0 0 0 0 0 0 0 0 0 0533.5 0.0 0.0 0 0 0 0 0 0 0 0 0532.5 0.0 0.0 0 0 0 0 0 0 0 0 0531.5 0.0 0.0 0 0 0 0 0 0 0 0 0530.5 0.0 0.0 0 0 0 0 0 0 0 0 0529.5 0.0 0.0 0 0 0 0 0 0 0 0 0528.5 0.0 0.0 0 0 0 0 0 0 0 0 0527.5 0.0 0.0 0 0 0 0 0 0 0 0 0526.5 0.0 0.0 0 0 0 0 0 0 0 0 0525.5 0.0 0.0 0 0 0 0 0 0 0 0 0524.5 0.0 0.0 0 0 0 0 0 0 0 0 0523.5 24.5 292.0 577 0 577 289 192 317 231 577 462522.5 24.5 292.0 1155 0 1155 577 385 635 462 1155 924521.5 24.5 292.0 1732 0 1732 866 577 952 693 1732 1385520.5 24.5 292.0 2309 0 2309 1155 770 1270 924 2309 1847519.5 24.5 292.0 2886 0 2886 1443 962 1587 1155 2886 2309518.5 24.5 292.0 3464 0 3464 1732 1155 1905 1385 3464 2771517.5 24.5 292.0 4041 0 4041 2020 1347 2222 1616 4041 3233516.5 24.5 292.0 4618 0 4618 2309 1539 2540 1847 4618 3695515.5 25.4 2378.0 5217 0 5217 2608 1739 2869 2087 5217 4173514.5 25.4 2378.0 5815 0 5815 2908 1938 3198 2326 5815 4652513.5 25.4 2378.0 6414 0 6414 3207 2138 3527 2565 6414 5131512.5 25.4 2378.0 7012 0 7012 3506 2337 3857 2805 7012 5610511.5 25.4 2378.0 7611 0 7611 3805 2537 4186 3044 7611 6088510.5 25.4 2378.0 8209 0 8209 4104 2736 4515 3284 8209 6567509.5 25.4 2378.0 8807 0 8807 4404 2936 4844 3523 8807 7046508.5 25.4 2378.0 9406 0 9406 4703 3135 5173 3762 9406 7525507.5 25.4 2378.0 10004 0 10004 5002 3335 5502 4002 10004 8004
NOTE: * It is assumed that in hard rock both side D (ft.) = 7.5resistance and end bearing will not develop From AASHTO LRFD, 2014 Edition Side Resistance in Rock = 0.55simultaneously. Table 10.5.5.2.4-1 Tip Resistance in Rock = 0.50
Uplift Resistance in Rock = 0.40Extreme Limit Side & Tip Resistance = 1.00
Extreme Limit Uplift Resistance = 0.80
Service Limit State Strength Limit State Extreme Limit State
KY 152 over Herrington Lake - Pier 1
DRILLED SHAFT AXIAL CAPACITY TABLE

Drilled Shaft Diameter (ft) = 10 in overburdenRock Socket Diameter (in) = 114Rock Socket Diameter (ft) = 9.5
9/17/2015
Nominal Nominal Total Total Total Total Total Total TotalShaft Unit Unit Nominal* Nominal Nominal Allowable Allowable Factored Factored Factored FactoredTip Side End Side End Axial Bearing Bearing Axial Uplift Axial Uplift
Elevation Shear Bearing Resistance Resistance Capacity Capacity Capacity Resistance Resistance Resistance Resistance(ft) qss (ksf) qeb (ksf) Rsr (kips) Reb (kips) Qut (kips) FS = 2 (kips) FS = 3 (kips) φRt (kips) φRtu (kips) φRt (kips) φRtu (kips)
Top of Rock >>> 545.5 0.0 0.0 0 0 0 0 0 0 0 0 0544.5 0.0 0.0 0 0 0 0 0 0 0 0 0543.5 0.0 0.0 0 0 0 0 0 0 0 0 0542.5 0.0 0.0 0 0 0 0 0 0 0 0 0541.5 0.0 0.0 0 0 0 0 0 0 0 0 0540.5 0.0 0.0 0 0 0 0 0 0 0 0 0539.5 0.0 0.0 0 0 0 0 0 0 0 0 0538.5 0.0 0.0 0 0 0 0 0 0 0 0 0537.5 0.0 0.0 0 0 0 0 0 0 0 0 0536.5 0.0 0.0 0 0 0 0 0 0 0 0 0535.5 0.0 0.0 0 0 0 0 0 0 0 0 0534.5 0.0 0.0 0 0 0 0 0 0 0 0 0533.5 0.0 0.0 0 0 0 0 0 0 0 0 0532.5 0.0 0.0 0 0 0 0 0 0 0 0 0531.5 0.0 0.0 0 0 0 0 0 0 0 0 0530.5 0.0 0.0 0 0 0 0 0 0 0 0 0529.5 0.0 0.0 0 0 0 0 0 0 0 0 0528.5 0.0 0.0 0 0 0 0 0 0 0 0 0527.5 0.0 0.0 0 0 0 0 0 0 0 0 0526.5 0.0 0.0 0 0 0 0 0 0 0 0 0525.5 0.0 0.0 0 0 0 0 0 0 0 0 0524.5 0.0 0.0 0 0 0 0 0 0 0 0 0523.5 24.5 292.0 731 0 731 366 244 402 292 731 585522.5 24.5 292.0 1462 0 1462 731 487 804 585 1462 1170521.5 24.5 292.0 2194 0 2194 1097 731 1206 877 2194 1755520.5 24.5 292.0 2925 0 2925 1462 975 1609 1170 2925 2340519.5 24.5 292.0 3656 0 3656 1828 1219 2011 1462 3656 2925518.5 24.5 292.0 4387 0 4387 2194 1462 2413 1755 4387 3510517.5 24.5 292.0 5118 0 5118 2559 1706 2815 2047 5118 4095516.5 24.5 292.0 5850 0 5850 2925 1950 3217 2340 5850 4680515.5 25.4 2378.0 6608 0 6608 3304 2203 3634 2643 6608 5286514.5 25.4 2378.0 7366 0 7366 3683 2455 4051 2946 7366 5893513.5 25.4 2378.0 8124 0 8124 4062 2708 4468 3250 8124 6499512.5 25.4 2378.0 8882 0 8882 4441 2961 4885 3553 8882 7106511.5 25.4 2378.0 9640 0 9640 4820 3213 5302 3856 9640 7712510.5 25.4 2378.0 10398 0 10398 5199 3466 5719 4159 10398 8318509.5 25.4 2378.0 11156 0 11156 5578 3719 6136 4462 11156 8925508.5 25.4 2378.0 11914 0 11914 5957 3971 6553 4766 11914 9531507.5 25.4 2378.0 12672 0 12672 6336 4224 6970 5069 12672 10138
NOTE: * It is assumed that in hard rock both side D (ft.) = 9.5resistance and end bearing will not develop From AASHTO LRFD, 2014 Edition Side Resistance in Rock = 0.55simultaneously. Table 10.5.5.2.4-1 Tip Resistance in Rock = 0.50
Uplift Resistance in Rock = 0.40Extreme Limit Side & Tip Resistance = 1.00
Extreme Limit Uplift Resistance = 0.80
DRILLED SHAFT AXIAL CAPACITY TABLE
KY 152 over Herrington Lake - Pier 1
Service Limit State Strength Limit State Extreme Limit State

Drilled Shaft Diameter (ft) = 12 in overburdenRock Socket Diameter (in) = 138Rock Socket Diameter (ft) = 11.5
9/17/2015
Nominal Nominal Total Total Total Total Total Total TotalShaft Unit Unit Nominal* Nominal Nominal Allowable Allowable Factored Factored Factored FactoredTip Side End Side End Axial Bearing Bearing Axial Uplift Axial Uplift
Elevation Shear Bearing Resistance Resistance Capacity Capacity Capacity Resistance Resistance Resistance Resistance(ft) qss (ksf) qeb (ksf) Rsr (kips) Reb (kips) Qut (kips) FS = 2 (kips) FS = 3 (kips) φRt (kips) φRtu (kips) φRt (kips) φRtu (kips)
Top of Rock >>> 545.5 0.0 0.0 0 0 0 0 0 0 0 0 0544.5 0.0 0.0 0 0 0 0 0 0 0 0 0543.5 0.0 0.0 0 0 0 0 0 0 0 0 0542.5 0.0 0.0 0 0 0 0 0 0 0 0 0541.5 0.0 0.0 0 0 0 0 0 0 0 0 0540.5 0.0 0.0 0 0 0 0 0 0 0 0 0539.5 0.0 0.0 0 0 0 0 0 0 0 0 0538.5 0.0 0.0 0 0 0 0 0 0 0 0 0537.5 0.0 0.0 0 0 0 0 0 0 0 0 0536.5 0.0 0.0 0 0 0 0 0 0 0 0 0535.5 0.0 0.0 0 0 0 0 0 0 0 0 0534.5 0.0 0.0 0 0 0 0 0 0 0 0 0533.5 0.0 0.0 0 0 0 0 0 0 0 0 0532.5 0.0 0.0 0 0 0 0 0 0 0 0 0531.5 0.0 0.0 0 0 0 0 0 0 0 0 0530.5 0.0 0.0 0 0 0 0 0 0 0 0 0529.5 0.0 0.0 0 0 0 0 0 0 0 0 0528.5 0.0 0.0 0 0 0 0 0 0 0 0 0527.5 0.0 0.0 0 0 0 0 0 0 0 0 0526.5 0.0 0.0 0 0 0 0 0 0 0 0 0525.5 0.0 0.0 0 0 0 0 0 0 0 0 0524.5 0.0 0.0 0 0 0 0 0 0 0 0 0523.5 24.5 292.0 885 0 885 443 295 487 354 885 708522.5 24.5 292.0 1770 0 1770 885 590 974 708 1770 1416521.5 24.5 292.0 2655 0 2655 1328 885 1460 1062 2655 2124520.5 24.5 292.0 3541 0 3541 1770 1180 1947 1416 3541 2832519.5 24.5 292.0 4426 0 4426 2213 1475 2434 1770 4426 3541518.5 24.5 292.0 5311 0 5311 2655 1770 2921 2124 5311 4249517.5 24.5 292.0 6196 0 6196 3098 2065 3408 2478 6196 4957516.5 24.5 292.0 7081 0 7081 3541 2360 3895 2832 7081 5665515.5 25.4 2378.0 7999 0 7999 3999 2666 4399 3200 7999 6399514.5 25.4 2378.0 8916 0 8916 4458 2972 4904 3567 8916 7133513.5 25.4 2378.0 9834 0 9834 4917 3278 5409 3934 9834 7867512.5 25.4 2378.0 10752 0 10752 5376 3584 5913 4301 10752 8601511.5 25.4 2378.0 11669 0 11669 5835 3890 6418 4668 11669 9336510.5 25.4 2378.0 12587 0 12587 6294 4196 6923 5035 12587 10070509.5 25.4 2378.0 13505 0 13505 6752 4502 7428 5402 13505 10804508.5 25.4 2378.0 14422 0 14422 7211 4807 7932 5769 14422 11538507.5 25.4 2378.0 15340 0 15340 7670 5113 8437 6136 15340 12272
NOTE: * It is assumed that in hard rock both side D (ft.) = 11.5resistance and end bearing will not develop From AASHTO LRFD, 2014 Edition Side Resistance in Rock = 0.55simultaneously. Table 10.5.5.2.4-1 Tip Resistance in Rock = 0.50
Uplift Resistance in Rock = 0.40Extreme Limit Side & Tip Resistance = 1.00
Extreme Limit Uplift Resistance = 0.80
DRILLED SHAFT AXIAL CAPACITY TABLE
KY 152 over Herrington Lake - Pier 1
Service Limit State Strength Limit State Extreme Limit State

Drilled Shaft Diameter (ft) = 14 in overburdenRock Socket Diameter (in) = 162Rock Socket Diameter (ft) = 13.5
9/17/2015
Nominal Nominal Total Total Total Total Total Total TotalShaft Unit Unit Nominal* Nominal Nominal Allowable Allowable Factored Factored Factored FactoredTip Side End Side End Axial Bearing Bearing Axial Uplift Axial Uplift
Elevation Shear Bearing Resistance Resistance Capacity Capacity Capacity Resistance Resistance Resistance Resistance(ft) qss (ksf) qeb (ksf) Rsr (kips) Reb (kips) Qut (kips) FS = 2 (kips) FS = 3 (kips) φRt (kips) φRtu (kips) φRt (kips) φRtu (kips)
Top of Rock >>> 545.5 0.0 0.0 0 0 0 0 0 0 0 0 0544.5 0.0 0.0 0 0 0 0 0 0 0 0 0543.5 0.0 0.0 0 0 0 0 0 0 0 0 0542.5 0.0 0.0 0 0 0 0 0 0 0 0 0541.5 0.0 0.0 0 0 0 0 0 0 0 0 0540.5 0.0 0.0 0 0 0 0 0 0 0 0 0539.5 0.0 0.0 0 0 0 0 0 0 0 0 0538.5 0.0 0.0 0 0 0 0 0 0 0 0 0537.5 0.0 0.0 0 0 0 0 0 0 0 0 0536.5 0.0 0.0 0 0 0 0 0 0 0 0 0535.5 0.0 0.0 0 0 0 0 0 0 0 0 0534.5 0.0 0.0 0 0 0 0 0 0 0 0 0533.5 0.0 0.0 0 0 0 0 0 0 0 0 0532.5 0.0 0.0 0 0 0 0 0 0 0 0 0531.5 0.0 0.0 0 0 0 0 0 0 0 0 0530.5 0.0 0.0 0 0 0 0 0 0 0 0 0529.5 0.0 0.0 0 0 0 0 0 0 0 0 0528.5 0.0 0.0 0 0 0 0 0 0 0 0 0527.5 0.0 0.0 0 0 0 0 0 0 0 0 0526.5 0.0 0.0 0 0 0 0 0 0 0 0 0525.5 0.0 0.0 0 0 0 0 0 0 0 0 0524.5 0.0 0.0 0 0 0 0 0 0 0 0 0523.5 24.5 292.0 1039 0 1039 520 346 571 416 1039 831522.5 24.5 292.0 2078 0 2078 1039 693 1143 831 2078 1663521.5 24.5 292.0 3117 0 3117 1559 1039 1714 1247 3117 2494520.5 24.5 292.0 4156 0 4156 2078 1385 2286 1663 4156 3325519.5 24.5 292.0 5195 0 5195 2598 1732 2857 2078 5195 4156518.5 24.5 292.0 6234 0 6234 3117 2078 3429 2494 6234 4988517.5 24.5 292.0 7274 0 7274 3637 2425 4000 2909 7274 5819516.5 24.5 292.0 8313 0 8313 4156 2771 4572 3325 8313 6650515.5 25.4 2378.0 9390 0 9390 4695 3130 5164 3756 9390 7512514.5 25.4 2378.0 10467 0 10467 5234 3489 5757 4187 10467 8374513.5 25.4 2378.0 11544 0 11544 5772 3848 6349 4618 11544 9236512.5 25.4 2378.0 12622 0 12622 6311 4207 6942 5049 12622 10097511.5 25.4 2378.0 13699 0 13699 6849 4566 7534 5480 13699 10959510.5 25.4 2378.0 14776 0 14776 7388 4925 8127 5910 14776 11821509.5 25.4 2378.0 15853 0 15853 7927 5284 8719 6341 15853 12683508.5 25.4 2378.0 16931 0 16931 8465 5644 9312 6772 16931 13545507.5 25.4 2378.0 18008 0 18008 9004 6003 9904 7203 18008 14406
NOTE: * It is assumed that in hard rock both side D (ft.) = 13.5resistance and end bearing will not develop From AASHTO LRFD, 2014 Edition Side Resistance in Rock = 0.55simultaneously. Table 10.5.5.2.4-1 Tip Resistance in Rock = 0.50
Uplift Resistance in Rock = 0.40Extreme Limit Side & Tip Resistance = 1.00
Extreme Limit Uplift Resistance = 0.80
DRILLED SHAFT AXIAL CAPACITY TABLE
KY 152 over Herrington Lake - Pier 1
Service Limit State Strength Limit State Extreme Limit State

Drilled Shaft Diameter (ft) = 6 in overburdenRock Socket Diameter (in) = 66Rock Socket Diameter (ft) = 5.5
9/17/2015
Nominal Nominal Total Total Total Total Total Total TotalShaft Unit Unit Nominal* Nominal Nominal Allowable Allowable Factored Factored Factored FactoredTip Side End Side End Axial Bearing Bearing Axial Uplift Axial Uplift
Elevation Shear Bearing Resistance Resistance Capacity Capacity Capacity Resistance Resistance Resistance Resistance(ft) qss (ksf) qeb (ksf) Rsr (kips) Reb (kips) Qut (kips) FS = 2 (kips) FS = 3 (kips) φRt (kips) φRtu (kips) φRt (kips) φRtu (kips)
Top of Rock >>> 711.0 0.0 0.0 0 0 0 0 0 0 0 0 0710.0 0.0 0.0 0 0 0 0 0 0 0 0 0709.0 0.0 0.0 0 0 0 0 0 0 0 0 0708.0 0.0 0.0 0 0 0 0 0 0 0 0 0707.0 25.4 383.0 439 0 439 219 146 241 176 439 351706.0 25.4 383.0 878 0 878 439 293 483 351 878 702705.0 25.4 383.0 1317 0 1317 658 439 724 527 1317 1053704.0 25.4 383.0 1756 0 1756 878 585 966 702 1756 1404703.0 25.4 383.0 2194 0 2194 1097 731 1207 878 2194 1756702.0 25.4 383.0 2633 0 2633 1317 878 1448 1053 2633 2107701.0 25.4 383.0 3072 0 3072 1536 1024 1690 1229 3072 2458700.0 25.4 383.0 3511 0 3511 1756 1170 1931 1404 3511 2809699.0 25.4 383.0 3950 0 3950 1975 1317 2172 1580 3950 3160698.0 25.4 383.0 4389 0 4389 2194 1463 2414 1756 4389 3511697.0 25.4 383.0 4828 0 4828 2414 1609 2655 1931 4828 3862696.0 25.4 383.0 5267 0 5267 2633 1756 2897 2107 5267 4213695.0 25.4 383.0 5705 0 5705 2853 1902 3138 2282 5705 4564694.0 25.4 383.0 6144 0 6144 3072 2048 3379 2458 6144 4915693.0 25.4 383.0 6583 0 6583 3292 2194 3621 2633 6583 5267692.0 25.4 383.0 7022 0 7022 3511 2341 3862 2809 7022 5618691.0 25.4 383.0 7461 0 7461 3730 2487 4104 2984 7461 5969690.0 25.4 383.0 7900 0 7900 3950 2633 4345 3160 7900 6320689.0 25.4 383.0 8339 0 8339 4169 2780 4586 3335 8339 6671688.0 25.4 383.0 8778 0 8778 4389 2926 4828 3511 8778 7022687.0 25.4 383.0 9216 0 9216 4608 3072 5069 3687 9216 7373686.0 25.4 383.0 9655 0 9655 4828 3218 5310 3862 9655 7724685.0 25.4 383.0 10094 0 10094 5047 3365 5552 4038 10094 8075684.0 25.4 383.0 10533 0 10533 5267 3511 5793 4213 10533 8427683.0 25.4 383.0 10972 0 10972 5486 3657 6035 4389 10972 8778682.0 25.4 383.0 11411 0 11411 5705 3804 6276 4564 11411 9129681.0 25.4 383.0 11850 0 11850 5925 3950 6517 4740 11850 9480680.0 25.4 383.0 12289 0 12289 6144 4096 6759 4915 12289 9831679.0 25.4 383.0 12728 0 12728 6364 4243 7000 5091 12728 10182678.0 25.4 383.0 13166 0 13166 6583 4389 7242 5267 13166 10533677.0 25.4 383.0 13605 0 13605 6803 4535 7483 5442 13605 10884676.0 25.4 383.0 14044 0 14044 7022 4681 7724 5618 14044 11235675.0 25.4 383.0 14483 0 14483 7242 4828 7966 5793 14483 11586674.0 25.4 383.0 14922 0 14922 7461 4974 8207 5969 14922 11938673.0 25.4 383.0 15361 0 15361 7680 5120 8448 6144 15361 12289
NOTE: * It is assumed that in hard rock both side D (ft.) = 5.5resistance and end bearing will not develop From AASHTO LRFD, 2014 Edition Side Resistance in Rock = 0.55simultaneously. Table 10.5.5.2.4-1 Tip Resistance in Rock = 0.50
Uplift Resistance in Rock = 0.40Extreme Limit Side & Tip Resistance = 1.00
Extreme Limit Uplift Resistance = 0.80
DRILLED SHAFT AXIAL CAPACITY TABLE
KY 152 over Herrington Lake - Pier 2
Service Limit State Strength Limit State Extreme Limit State
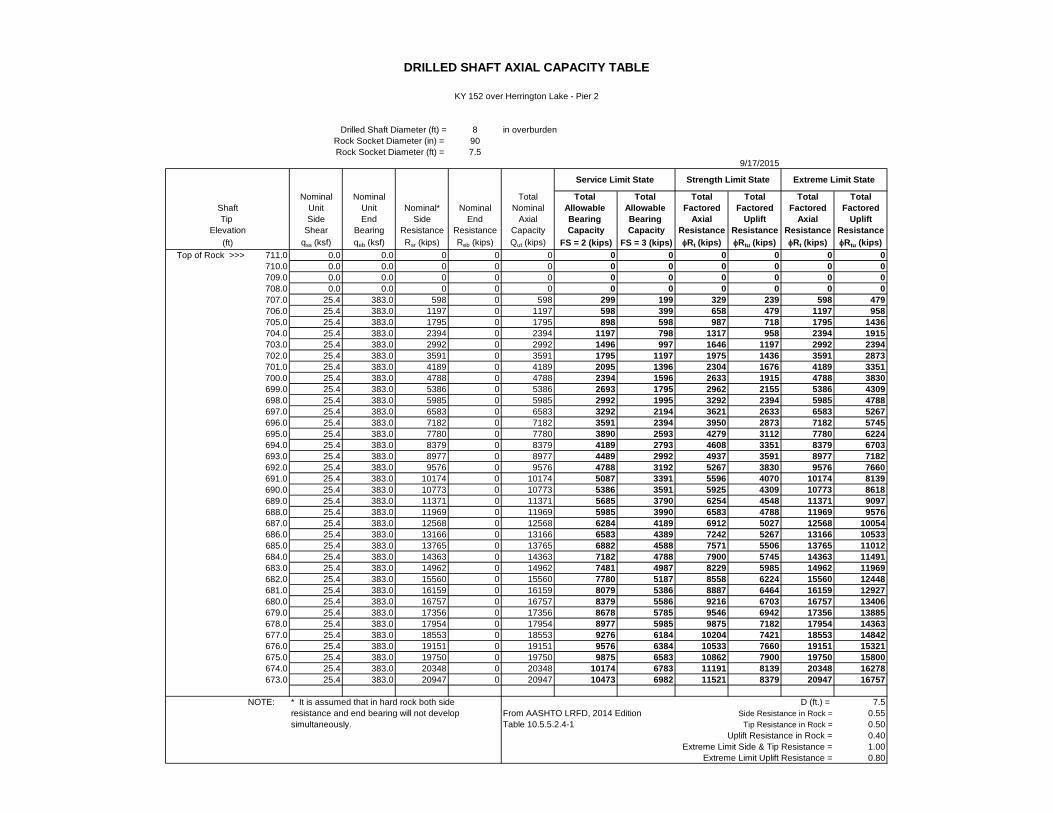
Drilled Shaft Diameter (ft) = 8 in overburdenRock Socket Diameter (in) = 90Rock Socket Diameter (ft) = 7.5
9/17/2015
Nominal Nominal Total Total Total Total Total Total TotalShaft Unit Unit Nominal* Nominal Nominal Allowable Allowable Factored Factored Factored FactoredTip Side End Side End Axial Bearing Bearing Axial Uplift Axial Uplift
Elevation Shear Bearing Resistance Resistance Capacity Capacity Capacity Resistance Resistance Resistance Resistance(ft) qss (ksf) qeb (ksf) Rsr (kips) Reb (kips) Qut (kips) FS = 2 (kips) FS = 3 (kips) φRt (kips) φRtu (kips) φRt (kips) φRtu (kips)
Top of Rock >>> 711.0 0.0 0.0 0 0 0 0 0 0 0 0 0710.0 0.0 0.0 0 0 0 0 0 0 0 0 0709.0 0.0 0.0 0 0 0 0 0 0 0 0 0708.0 0.0 0.0 0 0 0 0 0 0 0 0 0707.0 25.4 383.0 598 0 598 299 199 329 239 598 479706.0 25.4 383.0 1197 0 1197 598 399 658 479 1197 958705.0 25.4 383.0 1795 0 1795 898 598 987 718 1795 1436704.0 25.4 383.0 2394 0 2394 1197 798 1317 958 2394 1915703.0 25.4 383.0 2992 0 2992 1496 997 1646 1197 2992 2394702.0 25.4 383.0 3591 0 3591 1795 1197 1975 1436 3591 2873701.0 25.4 383.0 4189 0 4189 2095 1396 2304 1676 4189 3351700.0 25.4 383.0 4788 0 4788 2394 1596 2633 1915 4788 3830699.0 25.4 383.0 5386 0 5386 2693 1795 2962 2155 5386 4309698.0 25.4 383.0 5985 0 5985 2992 1995 3292 2394 5985 4788697.0 25.4 383.0 6583 0 6583 3292 2194 3621 2633 6583 5267696.0 25.4 383.0 7182 0 7182 3591 2394 3950 2873 7182 5745695.0 25.4 383.0 7780 0 7780 3890 2593 4279 3112 7780 6224694.0 25.4 383.0 8379 0 8379 4189 2793 4608 3351 8379 6703693.0 25.4 383.0 8977 0 8977 4489 2992 4937 3591 8977 7182692.0 25.4 383.0 9576 0 9576 4788 3192 5267 3830 9576 7660691.0 25.4 383.0 10174 0 10174 5087 3391 5596 4070 10174 8139690.0 25.4 383.0 10773 0 10773 5386 3591 5925 4309 10773 8618689.0 25.4 383.0 11371 0 11371 5685 3790 6254 4548 11371 9097688.0 25.4 383.0 11969 0 11969 5985 3990 6583 4788 11969 9576687.0 25.4 383.0 12568 0 12568 6284 4189 6912 5027 12568 10054686.0 25.4 383.0 13166 0 13166 6583 4389 7242 5267 13166 10533685.0 25.4 383.0 13765 0 13765 6882 4588 7571 5506 13765 11012684.0 25.4 383.0 14363 0 14363 7182 4788 7900 5745 14363 11491683.0 25.4 383.0 14962 0 14962 7481 4987 8229 5985 14962 11969682.0 25.4 383.0 15560 0 15560 7780 5187 8558 6224 15560 12448681.0 25.4 383.0 16159 0 16159 8079 5386 8887 6464 16159 12927680.0 25.4 383.0 16757 0 16757 8379 5586 9216 6703 16757 13406679.0 25.4 383.0 17356 0 17356 8678 5785 9546 6942 17356 13885678.0 25.4 383.0 17954 0 17954 8977 5985 9875 7182 17954 14363677.0 25.4 383.0 18553 0 18553 9276 6184 10204 7421 18553 14842676.0 25.4 383.0 19151 0 19151 9576 6384 10533 7660 19151 15321675.0 25.4 383.0 19750 0 19750 9875 6583 10862 7900 19750 15800674.0 25.4 383.0 20348 0 20348 10174 6783 11191 8139 20348 16278673.0 25.4 383.0 20947 0 20947 10473 6982 11521 8379 20947 16757
NOTE: * It is assumed that in hard rock both side D (ft.) = 7.5resistance and end bearing will not develop From AASHTO LRFD, 2014 Edition Side Resistance in Rock = 0.55simultaneously. Table 10.5.5.2.4-1 Tip Resistance in Rock = 0.50
Uplift Resistance in Rock = 0.40Extreme Limit Side & Tip Resistance = 1.00
Extreme Limit Uplift Resistance = 0.80
DRILLED SHAFT AXIAL CAPACITY TABLE
KY 152 over Herrington Lake - Pier 2
Service Limit State Strength Limit State Extreme Limit State

Drilled Shaft Diameter (ft) = 10 in overburdenRock Socket Diameter (in) = 114Rock Socket Diameter (ft) = 9.5
9/17/2015
Nominal Nominal Total Total Total Total Total Total TotalShaft Unit Unit Nominal* Nominal Nominal Allowable Allowable Factored Factored Factored FactoredTip Side End Side End Axial Bearing Bearing Axial Uplift Axial Uplift
Elevation Shear Bearing Resistance Resistance Capacity Capacity Capacity Resistance Resistance Resistance Resistance(ft) qss (ksf) qeb (ksf) Rsr (kips) Reb (kips) Qut (kips) FS = 2 (kips) FS = 3 (kips) φRt (kips) φRtu (kips) φRt (kips) φRtu (kips)
Top of Rock >>> 711.0 0.0 0.0 0 0 0 0 0 0 0 0 0710.0 0.0 0.0 0 0 0 0 0 0 0 0 0709.0 0.0 0.0 0 0 0 0 0 0 0 0 0708.0 0.0 0.0 0 0 0 0 0 0 0 0 0707.0 25.4 383.0 758 0 758 379 253 417 303 758 606706.0 25.4 383.0 1516 0 1516 758 505 834 606 1516 1213705.0 25.4 383.0 2274 0 2274 1137 758 1251 910 2274 1819704.0 25.4 383.0 3032 0 3032 1516 1011 1668 1213 3032 2426703.0 25.4 383.0 3790 0 3790 1895 1263 2085 1516 3790 3032702.0 25.4 383.0 4548 0 4548 2274 1516 2502 1819 4548 3639701.0 25.4 383.0 5306 0 5306 2653 1769 2919 2123 5306 4245700.0 25.4 383.0 6065 0 6065 3032 2022 3335 2426 6065 4852699.0 25.4 383.0 6823 0 6823 3411 2274 3752 2729 6823 5458698.0 25.4 383.0 7581 0 7581 3790 2527 4169 3032 7581 6065697.0 25.4 383.0 8339 0 8339 4169 2780 4586 3335 8339 6671696.0 25.4 383.0 9097 0 9097 4548 3032 5003 3639 9097 7277695.0 25.4 383.0 9855 0 9855 4927 3285 5420 3942 9855 7884694.0 25.4 383.0 10613 0 10613 5306 3538 5837 4245 10613 8490693.0 25.4 383.0 11371 0 11371 5685 3790 6254 4548 11371 9097692.0 25.4 383.0 12129 0 12129 6065 4043 6671 4852 12129 9703691.0 25.4 383.0 12887 0 12887 6444 4296 7088 5155 12887 10310690.0 25.4 383.0 13645 0 13645 6823 4548 7505 5458 13645 10916689.0 25.4 383.0 14403 0 14403 7202 4801 7922 5761 14403 11523688.0 25.4 383.0 15161 0 15161 7581 5054 8339 6065 15161 12129687.0 25.4 383.0 15919 0 15919 7960 5306 8756 6368 15919 12736686.0 25.4 383.0 16677 0 16677 8339 5559 9173 6671 16677 13342685.0 25.4 383.0 17436 0 17436 8718 5812 9590 6974 17436 13948684.0 25.4 383.0 18194 0 18194 9097 6065 10006 7277 18194 14555683.0 25.4 383.0 18952 0 18952 9476 6317 10423 7581 18952 15161682.0 25.4 383.0 19710 0 19710 9855 6570 10840 7884 19710 15768681.0 25.4 383.0 20468 0 20468 10234 6823 11257 8187 20468 16374680.0 25.4 383.0 21226 0 21226 10613 7075 11674 8490 21226 16981679.0 25.4 383.0 21984 0 21984 10992 7328 12091 8794 21984 17587678.0 25.4 383.0 22742 0 22742 11371 7581 12508 9097 22742 18194677.0 25.4 383.0 23500 0 23500 11750 7833 12925 9400 23500 18800676.0 25.4 383.0 24258 0 24258 12129 8086 13342 9703 24258 19406675.0 25.4 383.0 25016 0 25016 12508 8339 13759 10006 25016 20013674.0 25.4 383.0 25774 0 25774 12887 8591 14176 10310 25774 20619673.0 25.4 383.0 26532 0 26532 13266 8844 14593 10613 26532 21226
NOTE: * It is assumed that in hard rock both side D (ft.) = 9.5resistance and end bearing will not develop From AASHTO LRFD, 2014 Edition Side Resistance in Rock = 0.55simultaneously. Table 10.5.5.2.4-1 Tip Resistance in Rock = 0.50
Uplift Resistance in Rock = 0.40Extreme Limit Side & Tip Resistance = 1.00
Extreme Limit Uplift Resistance = 0.80
DRILLED SHAFT AXIAL CAPACITY TABLE
KY 152 over Herrington Lake - Pier 2
Service Limit State Strength Limit State Extreme Limit State

Drilled Shaft Diameter (ft) = 12 in overburdenRock Socket Diameter (in) = 138Rock Socket Diameter (ft) = 11.5
9/17/2015
Nominal Nominal Total Total Total Total Total Total TotalShaft Unit Unit Nominal* Nominal Nominal Allowable Allowable Factored Factored Factored FactoredTip Side End Side End Axial Bearing Bearing Axial Uplift Axial Uplift
Elevation Shear Bearing Resistance Resistance Capacity Capacity Capacity Resistance Resistance Resistance Resistance(ft) qss (ksf) qeb (ksf) Rsr (kips) Reb (kips) Qut (kips) FS = 2 (kips) FS = 3 (kips) φRt (kips) φRtu (kips) φRt (kips) φRtu (kips)
Top of Rock >>> 711.0 0.0 0.0 0 0 0 0 0 0 0 0 0710.0 0.0 0.0 0 0 0 0 0 0 0 0 0709.0 0.0 0.0 0 0 0 0 0 0 0 0 0708.0 0.0 0.0 0 0 0 0 0 0 0 0 0707.0 25.4 383.0 918 0 918 459 306 505 367 918 734706.0 25.4 383.0 1835 0 1835 918 612 1009 734 1835 1468705.0 25.4 383.0 2753 0 2753 1376 918 1514 1101 2753 2202704.0 25.4 383.0 3671 0 3671 1835 1224 2019 1468 3671 2937703.0 25.4 383.0 4588 0 4588 2294 1529 2524 1835 4588 3671702.0 25.4 383.0 5506 0 5506 2753 1835 3028 2202 5506 4405701.0 25.4 383.0 6424 0 6424 3212 2141 3533 2569 6424 5139700.0 25.4 383.0 7341 0 7341 3671 2447 4038 2937 7341 5873699.0 25.4 383.0 8259 0 8259 4129 2753 4542 3304 8259 6607698.0 25.4 383.0 9177 0 9177 4588 3059 5047 3671 9177 7341697.0 25.4 383.0 10094 0 10094 5047 3365 5552 4038 10094 8075696.0 25.4 383.0 11012 0 11012 5506 3671 6057 4405 11012 8810695.0 25.4 383.0 11930 0 11930 5965 3977 6561 4772 11930 9544694.0 25.4 383.0 12847 0 12847 6424 4282 7066 5139 12847 10278693.0 25.4 383.0 13765 0 13765 6882 4588 7571 5506 13765 11012692.0 25.4 383.0 14683 0 14683 7341 4894 8075 5873 14683 11746691.0 25.4 383.0 15600 0 15600 7800 5200 8580 6240 15600 12480690.0 25.4 383.0 16518 0 16518 8259 5506 9085 6607 16518 13214689.0 25.4 383.0 17436 0 17436 8718 5812 9590 6974 17436 13948688.0 25.4 383.0 18353 0 18353 9177 6118 10094 7341 18353 14683687.0 25.4 383.0 19271 0 19271 9635 6424 10599 7708 19271 15417686.0 25.4 383.0 20189 0 20189 10094 6730 11104 8075 20189 16151685.0 25.4 383.0 21106 0 21106 10553 7035 11608 8442 21106 16885684.0 25.4 383.0 22024 0 22024 11012 7341 12113 8810 22024 17619683.0 25.4 383.0 22941 0 22941 11471 7647 12618 9177 22941 18353682.0 25.4 383.0 23859 0 23859 11930 7953 13123 9544 23859 19087681.0 25.4 383.0 24777 0 24777 12388 8259 13627 9911 24777 19821680.0 25.4 383.0 25694 0 25694 12847 8565 14132 10278 25694 20556679.0 25.4 383.0 26612 0 26612 13306 8871 14637 10645 26612 21290678.0 25.4 383.0 27530 0 27530 13765 9177 15141 11012 27530 22024677.0 25.4 383.0 28447 0 28447 14224 9482 15646 11379 28447 22758676.0 25.4 383.0 29365 0 29365 14683 9788 16151 11746 29365 23492675.0 25.4 383.0 30283 0 30283 15141 10094 16656 12113 30283 24226674.0 25.4 383.0 31200 0 31200 15600 10400 17160 12480 31200 24960673.0 25.4 383.0 32118 0 32118 16059 10706 17665 12847 32118 25694
NOTE: * It is assumed that in hard rock both side D (ft.) = 11.5resistance and end bearing will not develop From AASHTO LRFD, 2014 Edition Side Resistance in Rock = 0.55simultaneously. Table 10.5.5.2.4-1 Tip Resistance in Rock = 0.50
Uplift Resistance in Rock = 0.40Extreme Limit Side & Tip Resistance = 1.00
Extreme Limit Uplift Resistance = 0.80
DRILLED SHAFT AXIAL CAPACITY TABLE
KY 152 over Herrington Lake - Pier 2
Service Limit State Strength Limit State Extreme Limit State

Drilled Shaft Diameter (ft) = 14 in overburdenRock Socket Diameter (in) = 162Rock Socket Diameter (ft) = 13.5
9/17/2015
Nominal Nominal Total Total Total Total Total Total TotalShaft Unit Unit Nominal* Nominal Nominal Allowable Allowable Factored Factored Factored FactoredTip Side End Side End Axial Bearing Bearing Axial Uplift Axial Uplift
Elevation Shear Bearing Resistance Resistance Capacity Capacity Capacity Resistance Resistance Resistance Resistance(ft) qss (ksf) qeb (ksf) Rsr (kips) Reb (kips) Qut (kips) FS = 2 (kips) FS = 3 (kips) φRt (kips) φRtu (kips) φRt (kips) φRtu (kips)
Top of Rock >>> 711.0 0.0 0.0 0 0 0 0 0 0 0 0 0710.0 0.0 0.0 0 0 0 0 0 0 0 0 0709.0 0.0 0.0 0 0 0 0 0 0 0 0 0708.0 0.0 0.0 0 0 0 0 0 0 0 0 0707.0 25.4 383.0 1077 0 1077 539 359 592 431 1077 862706.0 25.4 383.0 2155 0 2155 1077 718 1185 862 2155 1724705.0 25.4 383.0 3232 0 3232 1616 1077 1777 1293 3232 2585704.0 25.4 383.0 4309 0 4309 2155 1436 2370 1724 4309 3447703.0 25.4 383.0 5386 0 5386 2693 1795 2962 2155 5386 4309702.0 25.4 383.0 6464 0 6464 3232 2155 3555 2585 6464 5171701.0 25.4 383.0 7541 0 7541 3770 2514 4147 3016 7541 6033700.0 25.4 383.0 8618 0 8618 4309 2873 4740 3447 8618 6894699.0 25.4 383.0 9695 0 9695 4848 3232 5332 3878 9695 7756698.0 25.4 383.0 10773 0 10773 5386 3591 5925 4309 10773 8618697.0 25.4 383.0 11850 0 11850 5925 3950 6517 4740 11850 9480696.0 25.4 383.0 12927 0 12927 6464 4309 7110 5171 12927 10342695.0 25.4 383.0 14004 0 14004 7002 4668 7702 5602 14004 11203694.0 25.4 383.0 15082 0 15082 7541 5027 8295 6033 15082 12065693.0 25.4 383.0 16159 0 16159 8079 5386 8887 6464 16159 12927692.0 25.4 383.0 17236 0 17236 8618 5745 9480 6894 17236 13789691.0 25.4 383.0 18313 0 18313 9157 6104 10072 7325 18313 14651690.0 25.4 383.0 19391 0 19391 9695 6464 10665 7756 19391 15512689.0 25.4 383.0 20468 0 20468 10234 6823 11257 8187 20468 16374688.0 25.4 383.0 21545 0 21545 10773 7182 11850 8618 21545 17236687.0 25.4 383.0 22622 0 22622 11311 7541 12442 9049 22622 18098686.0 25.4 383.0 23700 0 23700 11850 7900 13035 9480 23700 18960685.0 25.4 383.0 24777 0 24777 12388 8259 13627 9911 24777 19821684.0 25.4 383.0 25854 0 25854 12927 8618 14220 10342 25854 20683683.0 25.4 383.0 26931 0 26931 13466 8977 14812 10773 26931 21545682.0 25.4 383.0 28009 0 28009 14004 9336 15405 11203 28009 22407681.0 25.4 383.0 29086 0 29086 14543 9695 15997 11634 29086 23269680.0 25.4 383.0 30163 0 30163 15082 10054 16590 12065 30163 24130679.0 25.4 383.0 31240 0 31240 15620 10413 17182 12496 31240 24992678.0 25.4 383.0 32318 0 32318 16159 10773 17775 12927 32318 25854677.0 25.4 383.0 33395 0 33395 16697 11132 18367 13358 33395 26716676.0 25.4 383.0 34472 0 34472 17236 11491 18960 13789 34472 27578675.0 25.4 383.0 35549 0 35549 17775 11850 19552 14220 35549 28439674.0 25.4 383.0 36627 0 36627 18313 12209 20145 14651 36627 29301673.0 25.4 383.0 37704 0 37704 18852 12568 20737 15082 37704 30163
NOTE: * It is assumed that in hard rock both side D (ft.) = 13.5resistance and end bearing will not develop From AASHTO LRFD, 2014 Edition Side Resistance in Rock = 0.55simultaneously. Table 10.5.5.2.4-1 Tip Resistance in Rock = 0.50
Uplift Resistance in Rock = 0.40Extreme Limit Side & Tip Resistance = 1.00
Extreme Limit Uplift Resistance = 0.80
DRILLED SHAFT AXIAL CAPACITY TABLE
KY 152 over Herrington Lake - Pier 2
Service Limit State Strength Limit State Extreme Limit State
Appendix F
Idealized Subsurface Profiles

Idealized Subsurface Profiles.xls6/2/2015
GENERAL SOIL AND BEDROCK PROFILE LEGEND SHEET
SUMMARY OF PARAMETERS DEVELOPED FOR SOIL PROFILES
Parameter Units Description
t lb/ft3 Total Unit Weight
e lb/ft3 Effective Unit Weight
qU lb/ft2 Unconfined Compressive Strength (soil)
qU ton/ft2 Unconfined Compressive Strength (rock)
CU lb/ft2 Undrained Shear Strength
SDI % Slake Durability Index (Shale only)
( o) Angle of Internal Friction
c lb/ft2 Effective stress cohesion
KS lb/in3 Soil Secant Modulus - Static (computer program LPILEPLUS4.0)
KY 152 over Herrington Lake
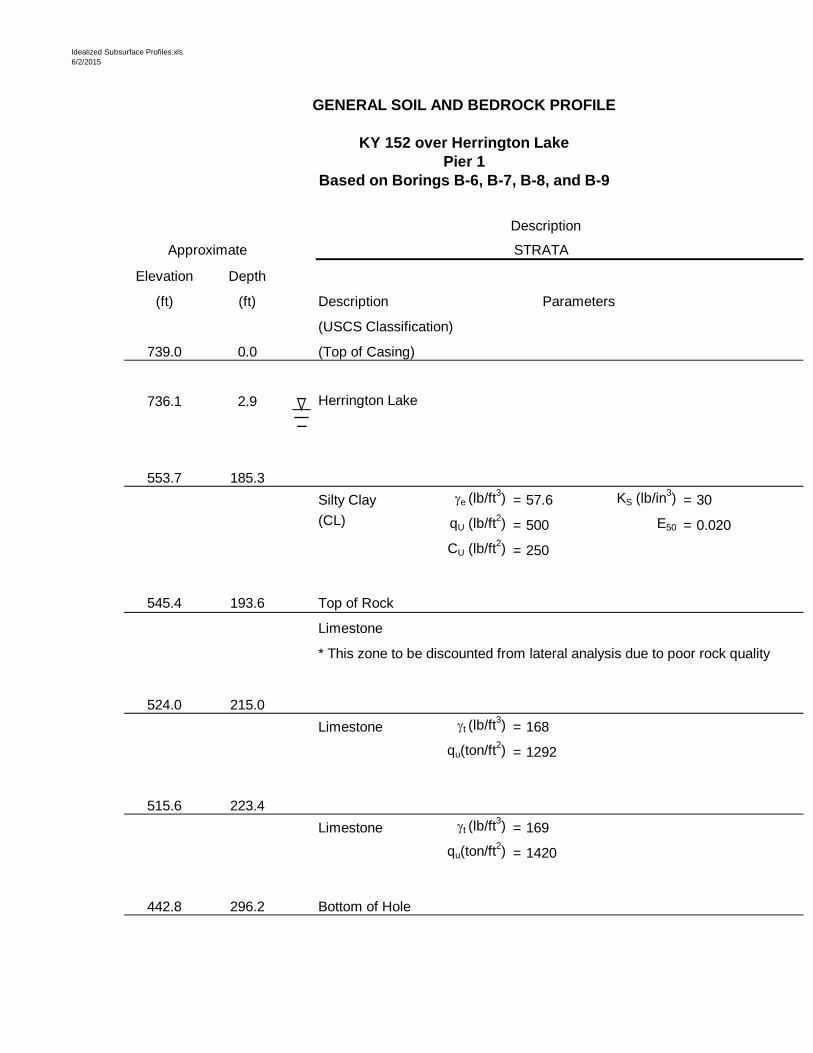
Idealized Subsurface Profiles.xls6/2/2015
GENERAL SOIL AND BEDROCK PROFILE
KY 152 over Herrington LakePier 1
Based on Borings B-6, B-7, B-8, and B-9
Description
STRATA
Elevation Depth
(ft) (ft) Description Parameters
(USCS Classification)
739.0 0.0 (Top of Casing)
736.1 2.9 Herrington Lake
553.7 185.3Silty Clay e (lb/ft3) = 57.6 KS (lb/in3) = 30(CL) qU (lb/ft2) = 500 E50 = 0.020
CU (lb/ft2) = 250
545.4 193.6 Top of Rock
Limestone
* This zone to be discounted from lateral analysis due to poor rock quality
524.0 215.0Limestone t (lb/ft3) = 168
qu(ton/ft2) = 1292
515.6 223.4Limestone t (lb/ft3) = 169
qu(ton/ft2) = 1420
442.8 296.2 Bottom of Hole
Approximate
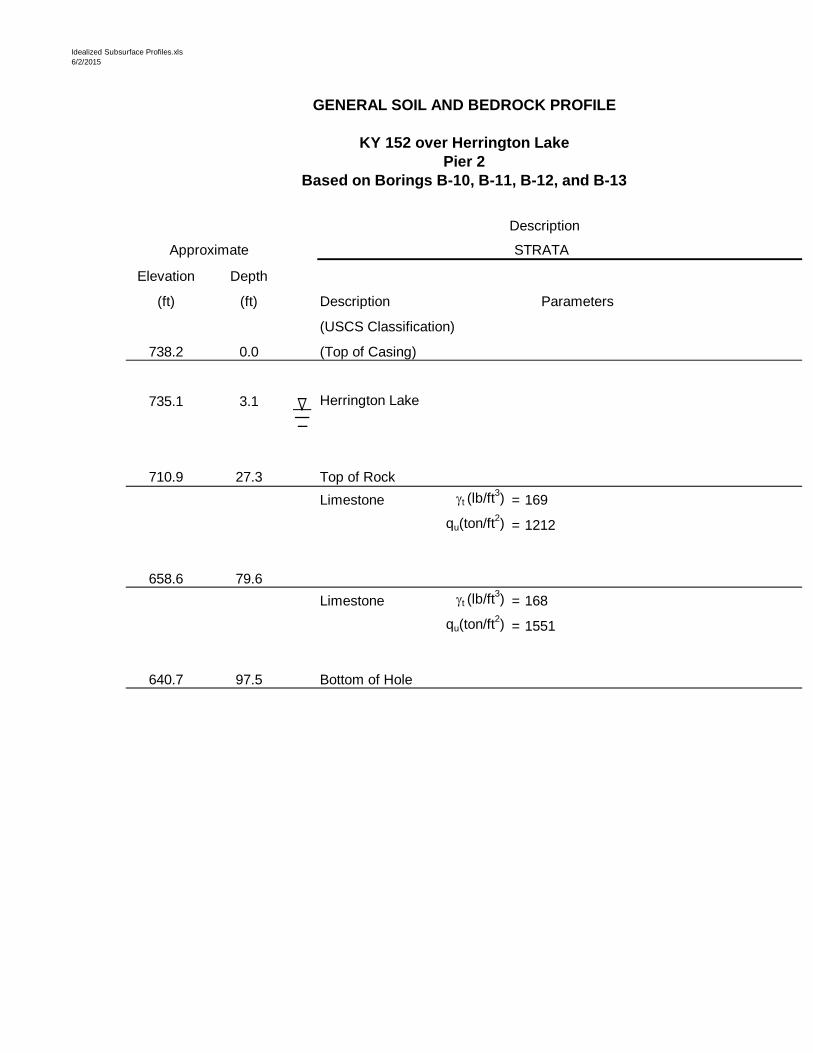
Idealized Subsurface Profiles.xls6/2/2015
GENERAL SOIL AND BEDROCK PROFILE
KY 152 over Herrington LakePier 2
Based on Borings B-10, B-11, B-12, and B-13
Description
STRATA
Elevation Depth
(ft) (ft) Description Parameters
(USCS Classification)
738.2 0.0 (Top of Casing)
735.1 3.1 Herrington Lake
710.9 27.3 Top of Rock Limestone t (lb/ft3) = 169
qu(ton/ft2) = 1212
658.6 79.6Limestone t (lb/ft3) = 168
qu(ton/ft2) = 1551
640.7 97.5 Bottom of Hole
Approximate