russian federation: technical note on stress testing of ... · russian federation: technical note...
TRANSCRIPT

© 2011 International Monetary Fund November 2011
IMF Country Report No. 11/334
Russian Federation: Technical Note on Stress Testing of the Banking Sector This paper was completed in July 2011, based on the information received as of April 2011. The views expressed in this document are those of the staff team and do not necessarily reflect the views of the government of the Russian Federation or the Executive Board of the IMF. The policy of publication of staff reports and other documents by the IMF allows for the deletion of market-sensitive information.
Copies of this report are available to the public from
International Monetary Fund ● Publication Services 700 19th Street, N.W. ● Washington, D.C. 20431
Telephone: (202) 623-7430 ● Telefax: (202) 623-7201 E-mail: [email protected] ● Internet: http://www.imf.org
International Monetary Fund Washington, D.C.

FINANCIAL SECTOR ASSESSMENT PROGRAM STABILITY
MODULE
RUSSIAN FEDERATION
STRESS TESTING ON THE BANKING SECTOR
TECHNICAL NOTE
JULY 2011
International Monetary Fund Monetary and Capital Markets Department

2
Contents Page
Glossary................. ....................................................................................................................3
Executive Summary ...................................................................................................................4
I. Financial Sector Structure and Key Issues .............................................................................6
II. The Impact of the Crisis and Recent Performance ................................................................9 A. The Impact of the Crisis on Russia ...........................................................................9 B. Recent Performance of the Financial System .........................................................11
III. Stress Testing .....................................................................................................................12 A. Overall Framework and Assessment of the Stress Testing Practice at the CBR ....12 B. Details of Simulation Methodologies ......................................................................16 C. Assumptions ............................................................................................................20 D. Results of Individual Tests ......................................................................................22 E. Overall Risk Assessment .........................................................................................25
Appendix I. Macroeconomic Model with the Banking Sector ................................................40
Tables
1. Russia: Bank Balance Sheet Structure, 2008–2010 .............................................................28 2. Russia: Financial Soundness Indicators for the Banking Sector, 2006–2010 .....................29 3. Russia: Financial Soundness Indicators by Types of Banks, 2010 ......................................30 4. Summary of Stress Testing Framework ...............................................................................31 5. Assumptions: Macro Scenario Tests ....................................................................................33 6. Summary of Top-Down Stress Testing Results ...................................................................34 7. Summary of Bottom-Up Stress Testing Results ..................................................................35 8. Estimation Results for the Household Sector NPL Model ..................................................40 9. Estimation Results for the Corporate sector NPL model .....................................................42 Figures
1. Financial Soundness Indicators, Cross-Country ..................................................................36 2. Summary of Top-Down Stress Test Results ........................................................................37 3. Summary of Bottom-Up Stress Test Results .......................................................................39 4. Household sector NPL model ..............................................................................................41 5. Factors driving the corporate NPL model ............................................................................42

3
GLOSSARY
AFS CAR
Available for sales Capital adequacy ratio
CBR Central Bank of Russia FX Foreign exchange LGD Loss given default NPL Non-performing loans PD Probability of Default RWA Risk weighted assets VaR Value at risk VAR Vector auto-regression VEB Vnesheconombank VTB Vneshtrogbank

4
EXECUTIVE SUMMARY
The stress testing exercise for this FSAP is based on the existing Central Bank of Russia (CBR) approaches, as well as separate bottom-up exercise. The top-down single factor tests and macro-scenario tests use bank-by-bank supervisory data as of end-2010 and cover all existing banks in the system (1012) (implemented by the CBR). The bottom-up exercise includes 15 top banks, covering about 57 percent of the system. The CBR and the FSAP team agreed on stress scenarios and the same macroeconomic assumptions as the top-down exercises. The resilience of the system is assessed using the current minimum regulatory capital adequacy ratio (CAR) requirement of 10 percent.
The tests covered broad ranges of risk factors. The single factor tests examined instantaneous impact of credit, concentration, market (foreign exchange, equity, and interest rate), liquidity, and interbank contagion risks. In addition, the test attempted to quantify the impact of adjusting for regulatory weaknesses. The macro scenario test focused on credit, market and liquidity risks with one year risk horizon. The severe scenario examined the impact of a macroeconomic shock equivalent to 1.7 standard deviation shock on real GDP growth rate.
The results of the stress tests suggest that the Russian banking system is, on the whole, resilient to a variety of macroeconomic and financial shocks.
The system has enough capital and profit buffers to withstand significant macroeconomic shocks. Gross losses to the banking sector in a tail economic event might be substantial (about 35 percent of capital), mainly owing to credit losses. However, about one-third of these losses would be offset by profits. Although the system as a whole would maintain a 14 percent capital ratio, banks representing about 8 percent of the system (mainly large private banks) would fall below the 10 percent minimum capital ratio.
Acute, systemic liquidity shocks (including on foreign exchange liquidity) may burden the banking sector significantly in a very short period of time (unlike credit losses, which tend to materialize over a year or two). For most Russian banks, funding would be very volatile during a stress, including individual deposits, which are usually more stable in other countries. At the same time, these stress tests do not take into account the policy reaction of the CBR in the event of a liquidity shock, which, as the experience of the recent crisis shows, can be decisive.
The relative relevance of other types of risks is in line with balance sheet structure. Valuation losses on securities, especially bonds, could be notable, reflecting the recent increase in securities investment. Direct foreign exchange valuation risk is negligible, given the small open foreign exchange position.

5
Concentration risks are significant, especially for smaller banks, given the high degree of credit concentration in the Russian banking system.
Bottom-up test yielded broadly similar results to the top-down tests.
However, the structural and supervisory weaknesses imply that the system may be more fragile and vulnerable to shocks that the stress tests results suggest. The impact of adjusting the baseline balance sheet and capital position of the banking system for these vulnerabilities dwarfs the effects from most of the economic shocks. Adjustments for the potential overestimation of loan quality and for low provisions could give much larger shocks to capital than the aforementioned economic shocks. Adjusting for provisions as described above could wipe out as much as one-third of the capital. Adjusting for the credit quality of extended maturity loans can reduce capital by over 20 percent, especially for state-owned and large private banks, which tend to keep a larger share of restructured loans in standard category. As mentioned above, however, in the absence of hard data, the magnitude of these adjustments is driven to some extent by subjective assumptions.
These results notwithstanding, there are important mitigating factors contributing to the stability of the system and limiting the costs of rescue. Although potential losses from various stresses to the system could be large, high capital buffers and strong profitability could function as shock absorbers. Moreover, even when capital injections are required to restore capital adequacy, the estimated economic cost of recapitalization is small and manageable, given the relatively small size of the Russian banking sector relative to GDP, low government debt, and high reserves. While government interventions to support and recapitalize weak banks may increase moral hazard, the ability and availability of resources to intervene decisively—as in the recent crisis—mitigates systemic risk.

6
I. FINANCIAL SECTOR STRUCTURE AND KEY ISSUES1
1. The Russian financial system is relatively small compared to that in advanced economies and dominated by commercial banks. As of end-2010, total assets of financial institutions were around 80 percent of GDP. Banks accounted for over 90 percent of the total assets. Bank deposits are just above 40 percent of GDP, much smaller than the figures in advanced and large emerging markets (Figure 1).
2. Despite ongoing gradual consolidation, the number of banks in Russia is very large and, at the same time, the system is dominated by a few large state-owned banks. As of end-2010, there were 1,012 banks operating in Russia, a decline by 46 from January 1, 2010, and about 250 less than five years earlier. This trend continued during the crisis, also supported by official policies (the CBR’s minimum capital requirement for banks was raised to Rub 90 million in January 2010, and further increases to Rub 180 million in 2012 and Rub 300 million in 2015 are in store). But the recent consolidations have favored the few, large state-owned banks. Although the share of state-owned banks in total deposits had been falling through most of the decade until 2007, the financial crisis turned this trend around as depositors fled for safety of state-owned banks with implicit guarantees, the same phenomenon in the 1998 crisis. At the end of 2010, the share of the state-owned banks in total deposits was 52 percent. Similar trends were observed in the state banks’ shares in lending and total system capital.
1 Prepared by Hiroko Oura (MCM), building on substantial inputs from the stress testing team at the CBR.
35
40
45
50
55
60
65
2000 2002 2004 2006 2008 2010
Share of Top 5 State-Owned Banks in Banking System2000-2010 (in percent)
Assests Deposits Loans

7
0
5
10
15
20
25
Dec
-04
Apr
-05
Aug
-05
Dec
-05
Apr
-06
Aug
-06
Dec
-06
Apr
-07
Aug
-07
Dec
-07
Apr
-08
Aug
-08
Dec
-08
Apr
-09
Aug
-09
Dec
-09
Apr
-10
Aug
-10
Dec
-10
In p
erce
nt
of
GD
P
Russia: External Borrowings
Banks
Non-bank enterprises
CBR and government
3. Russian banks have fairly plain balance sheet structure (Table 1). Majorities of the assets are loans (mostly to industries),2 followed by plain-vanilla securities (mostly in government and corporate bonds, followed by equities) and interbank transactions (60 percent are vis-à-vis non-resident banks). Banks are mainly funded by deposits of non-financial corporations and individuals and from other banks (including non-resident banks). Borrowings from non-resident declined to 13 percents of the book at end-2010, down from 20 percent in 2007, and they are mostly long-term. About a half of these borrowings are from non-resident banks, and foreign-owned banks tend to rely more on this funding source. Capital market funding through debentures are very limited. Liquidity support from the CBR, which rose substantially in 2008, was largely withdrawn by end-2010.
4. There are several structural and supervisory issues and legacy effects that could affect the stability of the system.
Russian banks have an insufficiently diversified client base. The majority of banks have concentrated exposures on both sides of the book. Loans to top five borrowers, on average, amount to 5 percent of the assets and 50 percent of capital (Tables 2 and 3), and much higher for smaller banks. The operations of a large number of small banks are concentrated to their owners or affiliated parties, and these banks have very limited access to retail clients or interbank funding. Furthermore, the real extent of concentration could be more serious than what is reported owing to the regulatory deficiency to keep track of borrowers who are affiliated in reality but separate for regulatory purposes (narrow definition of related parties).
Deposits are highly volatile for the majority of the banks. Negative historical experiences during the 1990s, when inflation was high and many households lost money in failed banks, weigh on the stability of general deposits. Bankers perceive that the expansion of deposit insurance coverage has yet to bring sufficient stability of
2 Information on the country composition of the loan exposures is kept by the CBR in a limited manner, which is one of the major regulatory deficiencies (see detailed assessment on the compliance with Basel Core Principles).

8
deposits. When stressed, depositors tend to shift funds to large state-owned banks, which carry implicit guarantees.
Weaknesses in loan-loss provisions could be overestimating the available capital buffer. Reported provisions are on the lower end of the ranges determined in the regulations, even when collateral is taken into account. Also, the Russian system allows using collateral for provisioning purposes, but the quality of collateral varies widely, which could affect the adequacy of provisions. The costs of seizing the collateral, as well as the ability to sell it in distressed conditions, may not be reflected accurately in its current valuation.
5. Moreover, the Russian financial system operates in an extremely volatile economic environment, challenging the stability of the financial system. Russia had two crises in the past 15 years, although the natures of the crises were very different each time. The magnitude of the swing in GDP growth from about 5 percent in 2008 to near -8 percent in 2009 far exceeds what were observed in other major emerging markets, not to mention advanced economies. Russia has also recorded consistently higher inflation than its emerging market peers. Although oil prices have gone up substantially in the past 10 years, they remain highly volatile, making the overall cash flows to the economy unstable. Macroeconomic and balance of payments shocks are thus the key underlying risks to the system.

9
Economic Volatilities: Russia and Selected Markets
II. THE IMPACT OF THE CRISIS AND RECENT PERFORMANCE
A. The Impact of the Crisis on Russia
6. The crisis hit the Russian banking system in two waves.
The first wave in late 2008 dried up bank liquidity. With the exception of a few large, state-owned banks, most banks were affected by substantial deposit withdrawals, reaching almost 20 percent of total even in some large banks in a month, although the loss of deposits was considerably smaller for the system as a whole, as some deposits were merely shifted to state-owned banks. The expected depreciation cut back access to foreign currency funding and created incentives for both banks and depositors to place funds in foreign currency. Funds from non-residents were withdrawn sharply, losing $70 billion (about 7 percent of total assets) between September 2008 and end 2009. These liquidity pressures eventually spread through the domestic interbank market, contributing to a brief but sharp spike in the interbank interest rate in January 2009.
1997 1998 1999 2000 2001 2002 2003 2004 2005 2006 2007 2008 2009 20101997- 2010
2000- 2010
1997-2008
2000-2008
Russia 1.4 -5.3 6.4 10.0 5.1 4.7 7.3 7.2 6.4 8.2 8.5 5.2 -7.8 4.0 5.1 4.7 4.0 1.8
Argentina 8.1 3.9 -3.4 -0.8 -4.4 -10.9 9.0 8.9 9.2 8.5 8.6 6.8 0.8 9.2 6.5 6.9 6.8 7.4Brazil 3.4 0.0 0.3 4.3 1.3 2.7 1.1 5.7 3.2 4.0 6.1 5.2 -0.6 7.5 2.5 2.4 2.1 1.8Chile 6.7 3.3 -0.4 4.5 3.5 2.2 4.0 6.0 5.5 4.6 4.6 3.7 -1.7 5.3 2.3 2.1 1.9 1.1Mexico 7.2 5.0 3.6 6.0 -0.9 0.1 1.4 4.0 3.2 5.2 3.2 1.5 -6.1 5.5 3.4 3.5 2.4 2.3
China 9.3 7.8 7.6 8.4 8.3 9.1 10.0 10.1 11.3 12.7 14.2 9.6 9.2 10.3 1.9 1.8 2.0 2.0India 10.3 5.3 3.3 4.4 3.9 4.6 6.9 8.1 9.2 9.7 9.9 6.2 6.8 10.4 2.5 2.3 2.6 2.4Indonesia 4.7 -13.1 0.8 5.4 3.6 4.5 4.8 5.0 5.7 5.5 6.3 6.0 4.6 6.1 5.0 0.8 5.4 0.8Korea 5.8 -5.7 10.7 8.8 4.0 7.2 2.8 4.6 4.0 5.2 5.1 2.3 0.2 6.1 3.9 2.4 4.0 2.0Malaysia 7.3 -7.4 6.1 8.7 0.5 5.4 5.8 6.8 5.3 5.8 6.5 4.7 -1.7 7.2 4.3 3.0 4.2 2.2Philippines 5.2 -0.6 3.4 6.0 1.8 4.4 4.9 6.4 5.0 5.3 7.1 3.7 1.1 7.3 2.3 2.0 2.1 1.6Thailand -1.4 -10.5 4.4 4.8 2.2 5.3 7.1 6.3 4.6 5.1 5.0 2.5 -2.3 7.8 4.8 2.8 4.8 1.6
Hungary 1.4 -5.3 6.4 10.0 5.1 4.7 7.3 7.2 6.4 8.2 8.5 5.2 -7.8 4.0 5.1 4.7 4.0 1.8Ukraine -3.0 -1.9 -0.2 5.9 8.9 5.3 9.6 12.1 2.7 7.4 7.9 1.9 -14.8 4.2 6.8 7.1 4.8 3.3Poland 7.1 5.0 4.5 4.3 1.2 1.4 3.9 5.3 3.6 6.2 6.8 5.1 1.7 3.8 1.9 1.9 1.9 1.9
Source: World Economic Outlook, IMF.
Standard deviation 1/GDP growth rate, in percent
1/ 1997-2010 period includes two Russian crises; 2000-2010 and 1997-2008 periods include one of the two Russian crises, and 200-2008 period include no Russian crises in sample.
0
2
4
6
8
10
0
2
4
6
8
10
Dec-06 Dec-07 Dec-08 Dec-09 Dec-10
Overdue loans and NPLs(percent of total loans)
Household overdue ratio
Corporate overdue ratio
Total overdue ratio
Total NPL ratio(Category IV & V loans)

10
The second wave of the impact—credit risk—started to hit the system in 2009, as the economy nosedived. The NPL ratio jumped by about 7 percentage points between end-2007 and early 2010. Provisioning costs weakened bank profitability substantially, although the sector overall continued to make net profits even in the middle of the crisis.
7. The system avoided a full-blown financial crisis, largely owing to a broad and decisive policy response. The authorities employed monetary policy and exchange rate interventions alongside a wide range of specific measures—including emergency liquidity support operations, capital injections, and forbearance—to stabilize the banking system.
Ruble stability: At the onset of the crisis, the CBR used its sizable reserves (nearly $600 billion as of mid-2008) to support a gradual and predictable depreciation of the ruble, although, the ruble was allowed to depreciate sharply as the total reserve loss between August 2008 and January 2009 amounted to over $200 billion.
Emergency liquidity support: The government auctioned excess budgetary funds to banks. The CBR provided ample liquidity support, including: guaranteeing interbank lending to qualifying banks; widening the range of acceptable collateral on repurchase and Lombard operations; and extending loans that were unsecured or backed by non-marketable collateral and guarantees. Lending from the CBR amounted to about 12 percent of bank assets at end 2008.
Capital injections and enhancing deposit insurance: The Russian government shored up capital in several government-owned banks, including Vneshtorgbank (VTB; the second largest state-owned bank), mortgage and leasing companies, as well as to Vnesheconombank (VEB). These capital injections amounted to Rub 505 billion (1.3 percent of GDP). Additional capital was provided to state and private banks (including Sberbank and VTB) from either VEB or the CBR in the form of subordinated loans, totaling Rub 904 billion (2.2 percent of GDP). To bolster confidence in the banking system, the deposit-insurance limit was raised and the deposit insurance agency was allocated additional resources and powers to deal with bank failures.
Temporary regulatory forbearance: The CBR relaxed loan classification requirements so that a corporate (retail) loan became overdue only if had been delinquent for 30 days (60 days)—up from 5 days (30 days) under the old rules. In addition, restructured loans were allowed to remain in their original classification category. These steps are estimated to have saved banks Rub 300 billion in provisions (7 percent of capital) in mid-2009. The CBR also took steps to loosen accounting standards to limit banks’ mark-to-market losses. All of these forbearance measures were withdrawn as of July 2010, although their grandfathering effects are expected to remain for another year. By late 2010, the estimated savings from these rules had declined to Rub 80 billion (2 percent of capital).

11
B. Recent Performance of the Financial System
8. After the crisis, the performance of banks started to recover. Partly as a result of bank recapitalization using public funds and private capital injections, the aggregate capital adequacy ratio stood at 18.1 percent in December 2010, well above the prudential minimum of 10 percent (Table 2, 3).3 The NPL ratio has stabilized, despite the termination of regulatory forbearance measures. Funding conditions also improved, as household and corporate deposits grew strongly, allowing the CBR to discontinue its emergency liquidity support. Bank assets are now growing again, although at a much slower rate than before the crisis, and the growth is more towards securities and less to credits. Bank profitability rebounded in 2010, largely reflecting lower provisioning costs. The profitability in 2010 was still weak by Russian standards, but it was higher than in comparator countries (Figure 1).
9. The performance varies across different bank groups.
State-owned banks. The 20 state-owned banks, which hold 46 percent of the system’s assets, are well capitalized, but the quality of their loans is weaker than that of other banks (Table 3). These banks have relatively cheap and stable household deposits and can quickly access CBR refinancing, which allows them to hold less excess liquidity.
Foreign-owned banks. Foreign banks (108 banks, 19 percent of the system’s assets) are also well capitalized, but do not typically have a branch network and rely substantially on external funding (particularly from their parent banks). Household loans represent the largest share of their credit portfolios.
Large private banks. These banks have relatively low capitalization and profitability, but also a relatively low share of nonperforming loans.
Small private banks. The aggregate capital and liquidity ratios of around 700 smaller banks are well above the system’s average, reflecting the difficulties in accessing the interbank market and the absence of big foreign parents. These banks face higher concentration risks on both the asset and liability sides and report weaker profitability.
10. Beneath this relatively positive picture, however, major uncertainties lurk due to various structural and supervisory weaknesses. In addition to the issues already discussed in section I, the latest crisis highlighted a few elements that could significantly overstate credit quality and the strength of banks’ capital base suggested by the reported headline figures. These are often difficult to quantify, owing to the lack of accurate data. However, partial data and qualitative information suggest the presence of sizeable non-performing assets and embedded losses owing to following channels:
3 Some declines in the capital ratio in 2010 partly reflect the repayments of subordinated debts by major state owned banks, originally injected for capital support purposes by the government.

12
Foreclosed assets: some assets (especially those collateralized by real estate) that are not earning any cash are said to be reported at an overvalued price on balance sheet.
Opaque transfer of distressed assets: the 2010 financial stability report by the CBR mentions the widespread practice of transferring distressed assets to off-balance sheet entities (special purpose vehicles or distressed asset funds). These entities are often not covered under consolidated reports, given the limited coverage under consolidated supervision, and the difficulty to validate the adequacy of transfer pricing.
Restructured loans: the share of restructured loans4 among large loans increased visibly at the height of the crisis and continued to remain at a higher level than the pre-crisis time. Of these, loans whose maturity are extended are perhaps more likely to have lower credit quality. More than 90 percent of the restructured loans are in the performing categories. There are no visible changes with this figure so far, after the withdrawal of the forbearance measure that allowed banks to avoid classifying the restructured loans to lower quality categories.
III. STRESS TESTING
A. Overall Framework and Assessment of the Stress Testing Practice at the CBR
11. In the 2008 FSAP, stress tests included top-down single factor tests and bottom up tests, but left some methodological and data gaps especially in the area of macro stress testing. Tests consisted of (i) top-down single factor tests (for all living banks) on credit, market, liquidity risks using supervisory data, and (ii) bottom up test (for five major banks) on the same set of risks using banks’ internal data. The test assessed the resilience of the system against these instantaneous shocks using existing regulatory capital (10 percent minimum capital to risk-weighted-assets ratio). The FSAP’s major recommendations on stress testing methodologies included (i) developing macro scenario stress testing framework;
4 The data on restructured loans include loans with any changes with the original terms of loans, including changes with interest rates, payment frequency, and maturity. The restructuring records are collected only for large loans.

13
(ii) consider implementing credit risk VaR models; (iii) collect data on effective maturities to carry out gap analysis for liquidity stress scenario; and (iv) improving cooperation between the CBR and banks regarding bottom-up stress testing.
12. Since the previous FSAP, the CBR has strengthened considerably its stress testing capacities. The Bank now conducts regularly various top-down single factor tests, including a combined test of multiple risk factors (credit, liquidity, and market risks) that mimics a macroeconomic scenario. Moreover, the Bank has recently developed an econometric model-based framework to conduct top-down macro stress tests, where risk factors are linked to macroeconomic indicators (the model is detailed in the appendix).5 The macro stress testing has one year horizon and includes credit, market, and liquidity risks, as in the combined test of multiple single factor shocks. The bottom-up test included this FSAP had better design, by sharing stress scenarios with the top down macro stress scenarios, including a very severe stress case.
13. The stress testing exercise for this FSAP included top-down tests based on the existing CBR approaches, as well as a separate bottom-up exercise. Table 4 and the next subsection details the scope of each test, as well as some key behavioral assumptions and methodological notes. A series of the top-down single-factor tests primarily aim at clarifying the types of risks that are relatively most relevant to the system with limited emphasis on the adequacy of capital levels. Shocks to individual risk factors are calibrated based on their own (individual) historical developments and expert judgments. Macro-scenario tests assess the adequacy of capital buffers in extreme but plausible tail events. Assumptions are calibrated as correlated systemic shocks to multiple sources of risks driven by common macroeconomic variables. The bottom-up tests, using banks’ internal data and models, complements the top-down tests by cross-checking the results and by potentially incorporating various risk-augmenting or mitigating positions that may not be reflected in the supervisory data.
14. The macro stress testing framework broadly captures the core macro-financial linkages in line with the 2009 experience and provides a valuable workhorse at par with frameworks used in other emerging economies. It has the following strengths and weaknesses.
Strengths
Comprehensive coverage of the banking sector: the test covers all the banks in the system.
5 The actual estimation and simulation work for this framework is implemented by an external consulting company with which the CBR has been working closely for a long time on macroeconomic modeling. The core of the framework is a system of about 30 econometric equations covering the real, external, fiscal, and financial sectors, estimated using 1998–2010 data.

14
Comprehensive coverage of the types of risks: in addition to credit risk, which is usually the sole focus of macro stress testing models, the CBR’s model covers market (equity, exchange rate, and interest rate) risks and liquidity risks.
Attempting to include various kinds of macro-financial linkages: the model consists of over 20 econometric equations covering the real, external, fiscal, and financial sectors, including various channels of (second round) feedback effects among various sectors.
Overall, the estimated core macro-financial linkages (i.e., the relationship between NPL ratio and macroeconomic factors) seem to be in line with the actual experience in 2009 (a realization of a tail risk) and earlier IMF estimates.
Potential areas for improvements and recommendations
The number of banks included in the tests could be reduced for the purpose of efficiency and in order to achieve more robust econometric performance. Out of over 1000 banks in the model, the top 250 banks (including all state-owned, foreign-owned, and large private banks) have 95 percent of the sector’s assets, which is more than what a typical FSAP covers. Limiting the sample might help obtain reasonable estimates using more recent and robust estimation techniques for individual banks’ credit risks, such as panel VAR or Arellano-Bond type micro-econometric framework. The resilience of smaller banks could still be reasonably assessed by single factor tests.
The time horizon of stress testing could be extended to 2-3 years and beyond. More and more country authorities and FSAP exercises started to focus on multiple year exercises,6 as they are often more effective at capturing possibly long-lasting lagged effects of a severe shock. For instance, in Russia, the annual change in NPL ratio between end 2008 and 2009 was 5.8 percentage points, but the change for about two years between end 2007 and early 2010 when the NPL ratio peaked at 10 percent was 7½ percentage points. Given the structure of the existing macro model, such an extension should be fairly straightforward.
In considering the future strategy for advancing the model, the benefits of expanding the macro model to include additional features could be weighed against maintaining theoretical and econometric robustness. The current strategy of modeling in Russia is to construct a large system of equations including variables from various sectors, which proxies reduced-form economic relationships among variables. The estimation
6 Recent FSAPs to the U.S. and major EU countries often covered five years, and European Banking Authority’s annual exercise covers two years.

15
technique is OLS, including year-on-year changes, making the estimation susceptible to technical issues such as omitted variables and auto-correlated errors. Partly in order to avoid these types of technical problems, macro-financial models often consist of a smaller main macro model7,8 and a range of separate, satellite models. While this kind of approach could lack overall model consistency, it can incorporate and build on more advanced modeling techniques and economic/financial theories.
Credit risk modeling could be extended to include Basel II (and beyond)-type portfolio loss concept (such as credit VaR), to the extent data allow. Credit loss in the current CBR model is projected by estimating the increases in NPL ratios for the household and corporate sector loans, and by assuming 100 percent provisioning (without risk mitigation using collaterals) for new NPLs. There is very limited set of reliable data for PDs and LGDs, partly because credit registry in the country is still fairly new and rather fragmented. Individual banks have not yet accumulated reliable estimates of their own (Russian banks are under Basel II with standardized approach). Yet, there are some data, especially on corporate sector borrowers at the CBR, as well as increasing number of estimates from private sector companies. Attempt to start utilizing existing data on a pilot basis, even with some caveats, could also help the CBR to prepare for adopting more advanced approaches for credit risk management of the Basel system.
Results could be presented to highlight driving factors for the stress tests and cross-sectional differences. In order to highlight macro-prudential and systemic aspects and considering significant heterogeneity among banks in Russia, the CBR could consider incorporating charts or tables showing (i) key indicators showing the severity of the
7 Established macroeconomic models that are often used by central banks for macroeconomic assessment (especially real business cycle models) usually ignore the financial sector, reflecting the tradition of macroeconomics that implicitly assume Arrow-Debreu type perfect and complete market for financial risks. Such assumption reduces the role played by the financial intermediation sector. For instance, the IMF’s Dynamic Stochastic General Equilibrium (DSGE) model, Global Integrated Monetary and Fiscal model (GIMF) includes interest rates, but does not include banks’ capitalization measures or NPL ratio. For this reason, FSAP teams often use separate satellite models to establish linkages between macro variables that come out of GIMF or other macro models used for building macroeconomic scenario and risk parameters needed for stress testing, including NPL ratio or probability of default. See, for instance, the technical note on U.S. FSAP stress testing http://www.imf.org/external/pubs/cat/longres.cfm?sk=24101.0
8 Another macroeconomic modeling approach that is often used for stress testing is time-series models such as a vector auto-regression (VAR) models and other time-series variations, including vector error correction model (VECM). These statistical models can build various scenarios originating from structural shocks easily. For instance, standard VAR or VECM packages easily allow projecting the macroeconomic impact of a 1 standard (or other) deviation decrease in oil prices on other variables such as GDP. Also, an overall impact of a shock on GDP while keeping some external variables (such as foreign interest rate and oil prices) at a given level could be projected fairly easily. For instance, STATA command such as var and fcast could be set up in a loop where, in each loop, exogenous variables and endogenous variables set by outside-of-the model priors (e.g. exchange rate or policy rate) are inserted to overwrite or add onto variables forecasted using the VAR/VECM.

16
scenario (e.g., NPL increases, liability run); (ii) summary statistics by the types of banks (e.g., state-owned, private etc); and (iii) results for broader cross sectional distribution. Presentation of the macro stress tests in this FSAP could be referenced as a starting point.
15. Some data gaps continue to exist, limiting the scope for reliable analyses. In addition to the above-mentioned issues with credit risk measurement, data gaps continue to constrain liquidity stress tests. The supervisory data lack effective maturity dates for assets and liabilities. The data on liquid assets are too broad, including highly liquid assets (available immediately), liquid assets (available within 30 days) and the rest. Breakdown by underlying assets or securities (whether they are repo-able or not, especially vis-à-vis the central bank) is rather limited. While the data gap for systemic liquidity risk analysis is not a unique issue in Russia, it is strongly recommended to fill this gap as soon as possible initially by utilizing existing reporting,9 given the severity of the liquidity stress observed in Russia in 2008 and 2009 and extraordinary amount of required liquidity injection by the central bank. Then, such systemic liquidity stress tests using granular data could be more effectively and reliably used as inputs for systemic liquidity management purposes by the central bank.
B. Details of Simulation Methodologies
16. The two top-down tests and bottom-up test share broadly similar simulation methodologies but also entail notable differences (Table 4). The single-factor and macro scenario tests use bank-by-bank supervisory data as of end-2010 and cover all existing banks in the system (1012). The bottom-up exercise covers 15 major banks, covering over 55 percent of the system by assets. The CBR’s Supervision Department coordinated the bottom-up test using the same macroeconomic assumptions as the top-down exercises. The resilience of the system is assessed using the current minimum regulatory capital adequacy ratio (CAR) requirement of 10 percent. Other metrics (e.g., losses in percent of capital, core capital ratio, liquidity ratio, and capital shortfalls necessary to achieve the minimum CAR) are also shown as references.10
Top-down single-factor tests
Tested risk factors: credit risks (including adjustment for the adequacy of provisioning requirements, recent forbearance, and the quality of restructured loans, increases in NPL ratio for household and corporate loans, and concentration risk
9 Such as the breakdown of liquid assets by major issuers.
10 Russian banks are currently regulated with Basel II, standardized approach. No specific dates are given for the adoption of more advanced approach. As of April 2010, the CBR does not have any plan to adopt Basel III framework. Therefore, we did not examine capital adequacy with Basel III metrics in detail.

17
(default of top five borrowers)), market risks (interest and exchange rate and equity prices), liquidity risks, and contagion risks within the banking system.
Key characteristics of the calculation methodology:
Risk-weighted-assets (RWA) are kept constant and no current year profit is included in capital.
Credit shocks are assessed conservatively, assuming 100 percent provisioning rate and excluding all collaterals for new NPLs.
Interest rate risks are assessed by estimating valuation losses from bonds using duration data. Impact through interest rate income/expenses is not incorporated.
Valuation losses from interest rate and equity price changes are assessed for securities held in trading book and a portion of available-for-sales (AFS) accounts, following the Basel II guidance on the items subject to market risk charges. As shown in Table 1, very few securities are held in held-to-maturity account.
Only the direct impact of exchange rate fluctuation is assessed, using net open foreign exchange positions.
Liquidity stress is primarily assessed by the impact on solvency, as banks are assumed to sell liquid assets at fire sale prices upon liability withdrawal, incurring losses. Liquidity ratios are also reported as references. Specific behavioral assumptions include the followings:
This test focuses on acute, short-term (immediate-one month) liquidity stress using liquidity stock data, and assume extreme conditions, such as complete shut-down of interbank market, severe stressed haircut (severer than the CBR’s repo haircut for securities on Lombard list), while no cash inflows (except for those obtained through the fire sales of assets) are considered.
There are three crude types of assets by their liquidity values: highly liquid (available within a day, mostly government bonds and deposits at the CBR), liquid (available within a month, mainly lower rated bonds), and illiquid assets (others). These assets could be exchanged for cash with discounts.
The test examines withdrawals from household deposits; funds in settlements, current, and other accounts of non-financial organizations; deposits by non-financial organizations; and cross-border interbank deposits.11
The lack of liquid asset data by currency prevents liquidity tests by currency.
11 Deposits with all maturities are included, as maturity ladder data are not available. In any case, in the past, deposits were withdrawn before maturity at the time of liquidity stress events as there are little legal and financial costs to do so.

18
Combined test: the CBR regularly tests the impact of combined shocks, including increases of NPL ratios for the corporate and household sectors,12 ruble depreciation, equity price declines, interest rate increases, and liquidity withdrawals (household, corporate and cross-border interbank deposits). The combination aims to create a crude macro stress scenario. The adequacy of existing capital is assessed against these combined shocks.
Contagion risk: contagion risks among banks are assessed in using the information of the matrix of interbank positions. This is an add-on test in a sense that the initial solvency stresses correspond to those in the combined shocks. A bank “defaults” on all of its liabilities held by other banks when total losses amount to 75 percent of the capital in the contagion stage.
Top-down macro stress scenario tests
Econometric model linking macro variables and credit risk (headline NPL ratio for the corporate and household sectors separately) is estimated by Prognoz (detailed in the appendix). Assumptions on market risks and liquidity withdrawal rates are also derived from the macro model.
One year horizon.13
Similarly to the combined single factor tests, the tests measure the total impact of the stress on credit (corporate and household loans), market risks (equity, exchange rate, and interest rate), and liquidity risks. As in the single factor tests, equity and interest rate valuation shocks are analyzed for securities in trading and a portion of AFS account, and new NPLs are required to have 100 percent provisioning rate with no collateral mitigation. These risks are included to assess the resilience of banks (i.e., post-stress capital adequacy against broad ranges of risk factors). Then, contagion risk is assessed as an add-on exercise.
Capital buffers include existing capital and all of the projected current year gross profits, assuming 0 payout ratios. However, in the stressed scenario, banks are making losses, leaving nothing to distribute as dividends irrespective of payout policies.
Gross profits (before provisioning) are projected as a function of interest rate assumptions. Interest incomes from performing customer loans are projected by assuming constant margin. Banks lose interest income from newly distressed
12 Corporate and household loan NPL ratios increases to 1.65 standard deviation + historical average (i.e. an increase to the highest 5 percentiles of historical distribution of NPL ratios). 13 The model could not be expanded to include multiple years within the current FSAP schedule. However, the CBR and Prognoz indicated the possibility to expand the horizon with sufficient time.
19
customer loans. Interest income or expenses (differ according to net liquidity position of banks) from interbank loans are assessed at a stressed rate of baseline + 1000 basis points, reflecting liquidity stress (detailed below). Commissions and fee income is projected in line with trend growth.
The macroeconomic model generates growth rate for bank assets as a function of macroeconomic variables. The growth is moderate at about 2 percent under the severe stress scenario. Accordingly, RWA changes in line with the net asset growth and repayment of existing loans that mature. Similarly to single-factor tests, downgrade or increases in PD and LGD do not affect the size of RWA in the exercise.
As in the single-factor tests, liquidity stress is assessed based on its solvency impact. However, the behavioral and market access assumption upon liquidity stress in macro scenario tests are notably different from those for the single factor tests primarily because of different timeframe considered in these two tests. The macro stress tests assume moderate conditions that could be observed throughout a year, while single factor tests focuses on acute liquidity crunch episode lasting for about a month. In particular, in macro scenario tests:
Access to interbank market is allowed, although at a substantial risk premium (baseline + 1000 basis points), and the borrowing possibility is limited to the counterparty banks that have records of transactions with the borrowing bank in the past (reflecting segmented market structure).
Access to collateralized lending by the CBR is allowed by applying official repo-haircuts (which are more moderate than what is typically assumed in the sensitivity tests) to securities on the Lombard list.
Cash inflows from performing loan repayments are included, mitigating cash shortages.
Bottom-up tests
Similarly to top-down tests, the bottom-up tests assessed combined credit, market (equity prices, interest rate, and exchange rate), and liquidity risks. The impact is measured by regulatory capital and core capital ratio and losses in percent of existing capital.
Banks are given three methodological choices: (A) take broad macroeconomic assumptions given by the CBR and use their internal macro model to translate them to relevant risk factors; (B) take combined single-factor assumptions given by the CBR and applied them to their balance sheet data; and (C) report their own stress testing methodology and results. In the end, all the banks chose either (A) or (B). The CBR did not impose specific method to project gross profits.
The bottom-up and top-down exercises shared the same macroeconomic and combined single-factor assumptions.

20
C. Assumptions
17. The assumptions and stress scenarios were agreed between the CBR and the FSAP team.
The single-factor shocks were calibrated to be broadly in line with the 2009 experience as well as the previous FSAP exercise and include increases in the NPL ratio (by about 5 and 8 percentage points in two separate scenarios),14 the simultaneous default of the top five borrowers, a liquidity shock (withdrawal of liabilities followed by fire sales of liquid assets), market risks (exchange rate, equity valuation, and interest rate), and interbank contagion risks (see Table 4, and Figure 2).
The macro scenarios (Table 5) include (i) a baseline scenario (assuming about 4 percent annual GDP growth in 2011–12, slightly below IMF’s WEO forecast); (ii) a pessimistic scenario (assuming a 4½ percent points reduction in GDP growth relative to baseline); and (iii) a severe scenario (assuming an 8 percentage points reduction). The growth shocks in the pessimistic and severe scenarios are equivalent to 1 and 1.7 standard deviations of GDP growth using data for 2000–2010. The swing assumed in the severe scenario is one of the largest in recent Russian experience (second only to the swing experienced during 2009), and is meant to represent a highly unlikely-but-plausible economic shock. It is comparable to the magnitude of macro shocks tested in recent FSAP exercises in major advanced and emerging economies.
Risk parameters (withdrawal rates and haircut) for single-factor liquidity risks are calibrated based on historical episodes and expert judgments (Table 4). These parameters are used for the CBR’s regular stress testing exercise. On additional shock this FSAP incorporated is the shock on cross-border interbank loans, which showed particular stagnation since late 2008. In macro stress tests, the discount rates for liquid assets based on the haircut used by the CBR for its repo operation.
14 Credit shock (A) in table 5 is what the CBR typically tests. In shock (A), 5 percent tail point of the empirical distribution of NPL ratio is taken by applying 1.65 standard deviation shock on historical average NPL ratio. The marginal size of the shock differs depending on where the current actual NPL ratio is compared to historical average. When the actual data is already 1 standard deviation above the average, the marginal shock size is a 0.65 standard deviation. When the actual data is 1 standard deviation below the average, the marginal shock size is a 2.65 standard deviation. While such a calibration has reasonable foundation, it makes time-series comparison of stress test results difficult, by varying the size of the shock each year. Therefore, a different type of shocks is calibrated. Shock (B) gives a 1.65 standard deviation shock onto actual NPL ratio data, maintaining the size of the marginal shock. Using the current data, shock (A) increases headline NPL ratio by 5 percentage points and shock (B) increases it by 8 percentage points (Figure 2).

21
Notably, different magnitudes of liquidity stress levels for different types of banks are tested, incorporating the characteristics of actual liquidity stresses in the past. Deposit shifted to state-owned banks, and larger banks that hold more repo-able securities had easier access to CBR financing. Interbank markets are segmented, and liquidity did not flow well from cash-rich banks to cash-stripped banks (paragraph 2 and 6). Therefore, both in single factor and macro scenario test in this FSAP, the deposit withdrawal rate for state-owned banks are set at more moderate rate than the others. In addition, shocks on major wholesale liabilities (corporate deposits and interbank liabilities, especially interbank funding from foreign banks) are assessed as these are major source of funding for banks and they were also affected by the liquidity stress during the crisis.
In addition to the impact of these shocks, the baseline is adjusted for factors reflecting the effect of regulatory forbearance or structural and supervisory weaknesses referred to in sections 1 and 2, which are possible to estimate approximately, are assessed separately. Specifically, (i) to adjust for the impact of regulatory forbearance introduced during the crisis, the estimated impact of these measures at end-2010 is added to provisions;15 (ii) to adjust for the doubtful quality of restructured loans whose maturity was extended, it is assumed that these loans are provisioned fully; and (iii) to adjust for the low level of provisions, provisions in each loan category are raised to the midpoint of the regulatory range, and poor quality collateral is assumed
15 The adjustment included for the stress testing is based on a rough proxy measure taking the difference of provisions between July 2010 (the last month when forbearance measure was applied) and August 2010. Apparently, this is a very noisy measure, and it could be influenced by a range of other factors such as change in underlying credit quality. In addition, it might not capture the effects with loans carrying grandfathering effects of the forbearance. Having said that, the estimated impact with this methodology—about 2 percent of capital (Table 6)—is in line with the other “bottom-up” estimate built on internal estimates by each major bank (last bullet, paragraph 7), giving some comfort with the estimate.
0
2,000
4,000
6,000
8,000
10,000
12,000
Funds from customers and other credit insitutions (excl. central banks)
(Individual series, in millions of Rubles, total banking sector)
Interbank liabilities deposit of individuals Funds from corporations Other

22
to have no value. Clearly, these adjustments are ad hoc and arguably extreme; but they are useful in order to gauge the underlying strength of bank portfolio and capital.
D. Results of Individual Tests
18. The results of top-down tests are summarized in Table 6 and Figure 2.
Adjustments
The impact of adjusting for forbearance effects on loans with grandfathered effects appears to be minor (2 percent of capital). While seven banks will be undercapitalized due to the adjustment, their share in the system is negligible.
The potential range of uncertainties created by various structural and supervisory weaknesses is notably large. The adjustment for the credit quality of restructured loans or raising provisioning rate to the middle of the permitted range could amount to 20–35 percent of capital, which could impact on the capital position of 61–251 banks (9–38 percent of the system). The adjustment for restructured loans affects state-owned and large private banks more, while that for provisioning rate influence foreign-owned banks the most.
Single-factor tests16
The credit risk shocks are generally higher for smaller banks (Figure 2), reflecting the higher volatility of their historical NPL ratios. Except for foreign-owned banks, most of the risks stem from corporate loan portfolio. For foreign-owned banks, who have relatively higher exposures to individuals (Table 3), potential losses from households nearly match with those from the corporate sector. When the size of marginal credit shocks is set comparable across banks (type B credit shock, adding 1.65 standard deviation shock to the latest actual NPL ratio), most types of banks could experience losses amounting to near 40 percent of capital. The small and medium-sized banks in Moscow region are much more resilient than the others despite of their higher credit shocks due to their stronger current capital position.
The concentration risk could be a major source of risks, especially for smaller banks and large private banks. Credit portfolio of Russian banks is highly concentrated: the share of loans to the largest five borrowers to total loans is 10 percent for the system and is nearly a quarter for smaller banks (Table 3). More than half of the capital could
16 Table 6 shows only the impact of each type of shocks in percent of capital for single factor tests, without showing post-shock CAR, reflecting the view that the resilience of the system (adequacy of CAR) is better be addressed in using macro scenario shock. Therefore the corresponding CAR and capital shortfall data are provided only for macro scenario tests and test of combined single-factor shocks.

23
be lost if the top five borrowers simultaneously default for smaller banks and large private banks,17 although the probability of such an event is highly unlikely. Large borrowers generally have better credit quality—the provisions-to-loans ratio for large loans stands at about 5 percent compared to 8½ percent for the total loans. Large private banks have less serious concentration than smaller banks, but their weaker capital base makes them less resilient.
Stress test highlights liquidity risks are another relevant sources of risks, second to credit risks in line with the development during the 2008–09 crisis (paragraph 6).
In terms of the magnitude of the liability withdrawal, smaller regional banks are affected the most (Figure 2) due to their higher dependence on household and corporate deposits (Table 3) that are not very stable. Foreign-owned banks are also heavily affected, primarily due to their reliance on cross-border interbank funding (Table 3). State-owned banks should be affected the least, despite of their large reliance on individual deposits (Table 3), as they are likely to benefit from explicit and implicit state guarantees and shifting of individual deposits from other types of banks.
However, it is large private banks that are the most vulnerable (Figure 2), followed by foreign-owned banks. Large private banks have relatively low amount of highly liquid assets with lower haircuts, causing them to incur larger losses upon fire sales. Their weaker capital position also results in higher losses relative to capital. This group is the only one that falls short of one of the regulatory liquidity ratios in the stress scenario. Strong capitalization and larger share in highly liquid assets limit the overall losses to smaller regional banks, despite of severe liability withdrawals.
Losses from market risks are generally small relative to capital. In particular, direct impact from Ruble fluctuation is negligible due to near 0 net open foreign exchange positions. As for securities, interest rate shocks are more important than equity price shocks, as the ¾ of the securities are invested in bonds. Large private banks are the most vulnerable group, once again.
For a combined test for credit, liquidity, and market risks, the potential losses could amount to about a half of the existing bank capital. The large private banks are the most severely affected group, mainly due to their weaker capitalization. On the other hand, the small and medium-sized banks in Moscow region come out as the most resilient group. Without additional buffer from current year gross profits, which have been consistently high in the past (including the crisis years), the overall impact could
17 The assumed LGD is extremely conservative at 100 percent, contributing to these severe results.

24
be substantial: wiping out more than a half of the capital, failing over 300 banks, and reducing the system’s average capitalization to below minimum requirement. However, the recapitalization cost to achieve 10 percent minimum requirement is less than 2 percent of GDP, which should be easily supported by the public sector. In any case, the macro scenario test is more appropriate to judge the resilience of the system.
Interbank contagion effects, upon the combined shock, could potentially add small losses amounting to 13 percent of the capital—similar to the combined impact of market risks. However, the contagion risk analysis is layered on top of very severe shock that already makes the overall system undercapitalized. Therefore, its marginal impact on capitalization relative to the minimum requirement is presented in an exaggerated manner, failing additional 600 plus banks. However, the recapitalization costs to recoup these losses are manageable at 1⅓ percent of GDP. Across different groups, the small and medium-sized regional banks are the most affected group, because they have the highest (and possibly more concentrated) domestic interbank exposures as share of assets (Table 3).
Macro scenario tests
In the severe scenario, the system-wise CAR declines by 4 percentage points to 14.1 percent, failing 75 banks (8 percent of the system, Figure 2). The recapitalization cost to achieve the 10 percent minimum regulatory capital requirement is small (0.3 percent of GDP).
The total losses from various sources of risks are 34 percent of capital mainly due to credit costs and to a lesser extent losses from security valuation. It is much smaller than the combined single-factor shock, primarily because of smaller losses from liquidity shock. As discussed in section III B, the two tests consider very different time horizon and hence different parametric and behavioral assumptions. Macro scenario considers more moderate liquidity stress that could last for a longer period of time, and also include various mitigating factors such as cash inflows upon loan repayment or access to interbank market (albeit at punitive interest rates).
A third of the losses are compensated by current year gross profit, leaving banks with net losses of 22 percent of capital. Gross profits of about 11 percent of capital and net profit of -22 percent of capital appear to be conservative compared to historical performance of return on equity, including the crisis time (Table 2).
Consistent with the single factor tests, large private banks are the most vulnerable group and small and medium-sized banks in Moscow region are the most resilient ones.
19. Bottom-up stress test results are broadly in line with the top-down macro scenario test (severe scenario) (Table 7, Figure 3).

25
The headline CAR declines by 3.5 percentage points to 14.1 for the whole sample of participated banks. This is slightly smaller than the top-down macro stress test’s results for the same sample of banks due to the higher gross profits projected by each bank. Otherwise, the projected losses are fairly close between the top-down macro scenario test and bottom-up tests (about 23 percent of capital).
However, at individual bank levels, there are notable differences in terms of the overall impact of the stress between the bottom-up tests. State-owned banks projected much more moderate losses from all types of risk sources and higher profit (double of the top-down macro scenario test), where banks have more flexibility in terms of how to estimate. On the other hand, private Russian banks projected substantially higher losses across all types of risks and more pessimistic profits than the macro scenario test. For the whole sample the effects from these two groups offset each other.
The trends that the private Russian bank group had larger losses than macro scenario tests could reflect that most of the banks in this group chose approach B (Table 7, combined single factor test), which generally assign severer shocks to each risk factor than a macro-model might produce (as is the case with the CBR’s top-down macro stress model). Indeed, their projected losses are fairly close to those in the top-down combined single factor tests (excluding impact from liquidity risks).
In any case, the bottom-up exercise shows qualitatively similar results to those in top-down tests in a sense that larger private Russian banks are more vulnerable than the rest of the system, especially compared to state-owned banks. Also, in terms of the relevant sources of risks, the bottom-up exercise indicates credit risks are the most important sources of risks, followed by valuation losses from securities in line with top-down macro scenario tests.
E. Overall Risk Assessment
20. The results of the top-down stress tests suggest that the Russian banking system is, on the whole, resilient to a variety of macroeconomic and financial shocks (Table 6 and Figure 2).
The system has enough capital and profit buffers to withstand significant macroeconomic shocks. Gross losses to the banking sector in a tail economic event might be substantial (about 35 percent of capital), mainly owing to credit losses. However, about one-third of these losses would be offset by profits. Although the system as a whole would maintain a 14 percent capital ratio, banks representing about 8 percent of the system (mainly large private banks) would fall below the 10 percent minimum capital ratio.
Acute, systemic liquidity shocks (including on foreign exchange liquidity) examined by the single factor test on liquidity stress may burden the banking sector significantly in a very short period of time (unlike credit losses that tend to

26
materialize over a year or two).18 For most Russian banks, funding would be very volatile during a stress, including individual deposits, which are usually more stable in other countries. At the same time, these stress tests do not take into account the policy reaction of the CBR in the event of a liquidity shock which, as the experience of the recent crisis shows, can be decisive.
The relative relevance of other types of risks is in line with balance sheet structure. Valuation losses on securities, especially bonds, could be notable, reflecting the recent increase in securities investment.
Direct foreign exchange valuation risk is negligible, given the small open foreign exchange position. However, indirect risk (feeding through credit risk) is not negligible, especially for the household sector who borrows in FX without having FX income (Appendix). The corporate sector as a whole, on the other hand, could benefit from ruble depreciation, as they tend to have abundant FX income. In addition, some of the broader foreign exchange rate-related risks are captured as liquidity shocks (withdrawal of FX interbank liabilities), which tend to weigh more on foreign-owned banks given their higher share of dependence on FX liabilities.
Concentration risks are significant, especially for smaller banks, given the high degree of credit concentration in the Russian banking system.
Large private banks are the most vulnerable group indicated by all types of tests and shocks. This is primarily because of their weak capital and liquidity positions. The size of the shocks for large private banks is not necessarily the largest. Foreign and small and medium sized banks have more severe liquidity pressures and smaller banks also suffer from more severe credit shocks. Yet, owing to smaller liquidity and capital buffer, the impact relative to these buffers becomes the largest for large private banks.
21. The structural and supervisory weaknesses discussed above imply that the system may be more fragile and vulnerable to shocks that the stress tests results suggest. The impact of adjusting the baseline balance sheet and capital position of the banking system for these vulnerabilities dwarfs the impact from most of the economic shocks. Adjustments for the potential overestimation of loan quality and for low provisions generate much larger capital losses than the aforementioned economic shocks. Adjusting for provisions as described above could wipe out as much as one-third of the capital. Adjusting
18 The losses from liquidity risks are quite different between macro scenario and sensitivity tests. This mainly reflects the difference of time horizon considered in the two tests, and resulting difference regarding the severity of the assumptions and policy measures incorporated in the tests (see Appendix for details).

27
for the credit quality of extended maturity loans can reduce capital by over 20 percent, especially for state-owned and large private banks, which tend to keep a larger share of restructured loans in standard category. As mentioned above, however, in the absence of hard data, the magnitude of these adjustments is driven to some extent by subjective assumptions.
22. These results notwithstanding, there are important mitigating factors contributing to the stability of the system and limiting the costs of rescue. Although potential losses from various stresses to the system could be large especially on an adjusted baseline, high capital buffers and strong profitability could function as shock absorbers. Moreover, even when capital injections are required to restore capital adequacy, the estimated economic cost of recapitalization is small and manageable, given the relatively small size of the Russian banking sector relative to GDP, low government debt, and high reserves. While government interventions to support and recapitalize weak banks may increase moral hazard, the ability and availability of resources to intervene decisively—as in the recent crisis—mitigates systemic risk.

28
Table 1. Russia: Bank Balance Sheet Structure, 2008–2010
2008 2009 2010Balance Sheet Structure
Total asset growth rate, in percent 39.2 5.0 14.9Total customer loans growth rate, in percent 34.5 -2.5 12.6
Asset side, in percent of total assetsTotal customer loans 59.0 54.8 53.7Accounts with CBR and other central banks 7.4 6.0 5.4Interbank lending 8.9 9.3 8.6Securities holdings 8.4 14.6 17.2 of which At fair value through profit or loss statement 2.2 5.0 4.9
Available for sale 4.1 7.3 8.9Held-to-maturity 0.6 0.5 1.4
Liability side, in percent of total assetsFunds from CBR 12.0 4.8 1.0Interbank liabilities 13.0 10.6 11.1Fund raised from organizations (incl saving and deposit certif 31.3 32.5 32.9Individual deposits 21.1 25.4 29.0Bonds, PN and bank acceptance 4.0 3.9 3.9Capital 13.6 15.7 14.0Core capital 8.6 9.9 8.8
Memo items, in percent of total assetsExternal debt: banks' borrwoing from non residents 17.4 13.1 13.0
Of which: short-term 4.5 2.8 3.5
Maturity Structure, share of claims due within one year (contractural)Deposits from individuals 34.8 36.3 35.3Funds raised from non-financial organizations 48.6 53.8 50.0Bonds 0.2 0.9 0.0
Source: Central Bank of the Russian Federation.
29
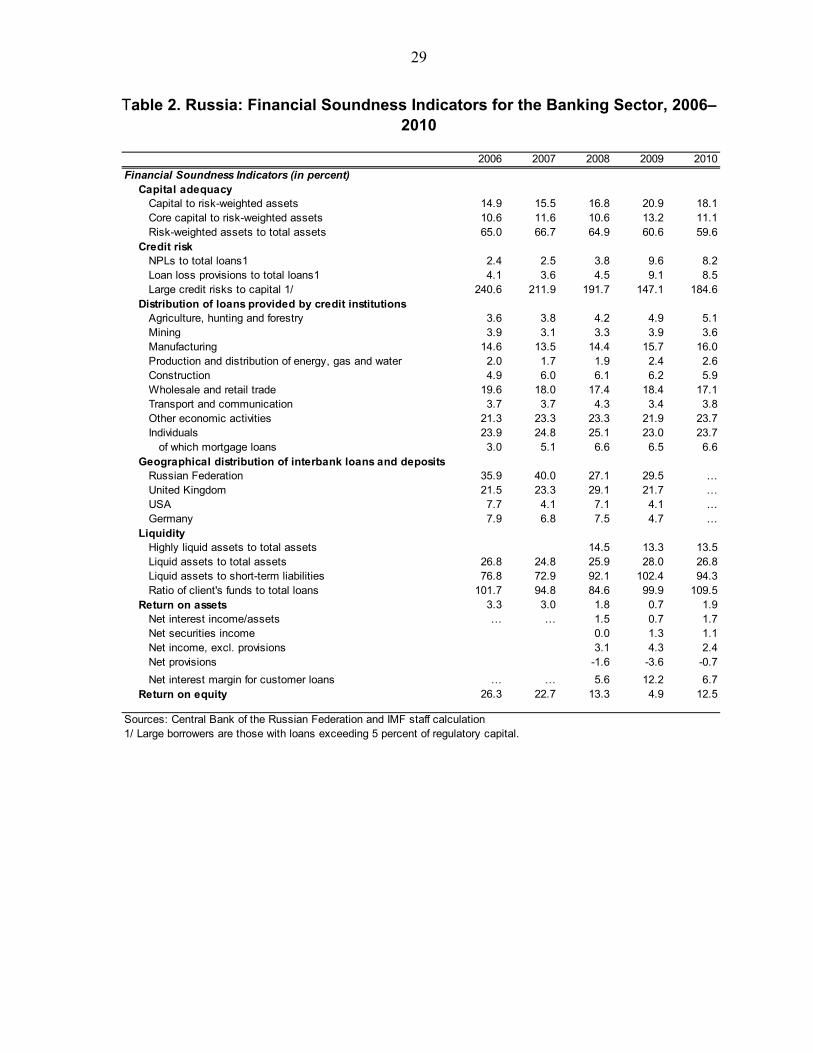
Table 2. Russia: Financial Soundness Indicators for the Banking Sector, 2006–2010
2006 2007 2008 2009 2010
Financial Soundness Indicators (in percent)Capital adequacy
Capital to risk-weighted assets 14.9 15.5 16.8 20.9 18.1Core capital to risk-weighted assets 10.6 11.6 10.6 13.2 11.1Risk-weighted assets to total assets 65.0 66.7 64.9 60.6 59.6
Credit riskNPLs to total loans1 2.4 2.5 3.8 9.6 8.2Loan loss provisions to total loans1 4.1 3.6 4.5 9.1 8.5Large credit risks to capital 1/ 240.6 211.9 191.7 147.1 184.6
Distribution of loans provided by credit institutionsAgriculture, hunting and forestry 3.6 3.8 4.2 4.9 5.1Mining 3.9 3.1 3.3 3.9 3.6Manufacturing 14.6 13.5 14.4 15.7 16.0Production and distribution of energy, gas and water 2.0 1.7 1.9 2.4 2.6Construction 4.9 6.0 6.1 6.2 5.9Wholesale and retail trade 19.6 18.0 17.4 18.4 17.1Transport and communication 3.7 3.7 4.3 3.4 3.8Other economic activities 21.3 23.3 23.3 21.9 23.7Individuals 23.9 24.8 25.1 23.0 23.7
of which mortgage loans 3.0 5.1 6.6 6.5 6.6Geographical distribution of interbank loans and deposits
Russian Federation 35.9 40.0 27.1 29.5 …United Kingdom 21.5 23.3 29.1 21.7 …USA 7.7 4.1 7.1 4.1 …Germany 7.9 6.8 7.5 4.7 …
LiquidityHighly liquid assets to total assets 14.5 13.3 13.5Liquid assets to total assets 26.8 24.8 25.9 28.0 26.8Liquid assets to short-term liabilities 76.8 72.9 92.1 102.4 94.3Ratio of client's funds to total loans 101.7 94.8 84.6 99.9 109.5
Return on assets 3.3 3.0 1.8 0.7 1.9Net interest income/assets … … 1.5 0.7 1.7Net securities income 0.0 1.3 1.1Net income, excl. provisions 3.1 4.3 2.4Net provisions -1.6 -3.6 -0.7
Net interest margin for customer loans … … 5.6 12.2 6.7Return on equity 26.3 22.7 13.3 4.9 12.5
Sources: Central Bank of the Russian Federation and IMF staff calculation1/ Large borrowers are those with loans exceeding 5 percent of regulatory capital.

30
Table 3. Russia: Financial Soundness Indicators by Types of Banks, 2010
All State-owned
Foreign-owned
Large private
Small-Medium, Moscow
Small-Medium, regional
Market structureNumber of banks 1012 20 108 128 317 368Share in the sector by assets 100 46 19 30 3 3
Financial Soundness Indicators (in percent)Capital adequacy
Capital to risk-weighted assets 18.1 18.6 19.7 15.7 25.2 21.3Core capital to risk-weighted assets 11.1 10.2 14.6 9.9 21.1 16.6Risk-weighted assets to total assets 59.6 61.8 57.2 59.6 50.7 59.3
Credit riskNPLs to total loans 8.2 8.7 9.2 7.1 6.8 8.4Loan loss provisions to total loans 8.5 8.7 8.2 8.3 9.6 8.7Large credit risks to capital 1/ 184.6 110.6 156.1 302.2 255.0 229.6Share of loans to largest 5 borrowers/total loans 10.1 8.5 9.2 11.5 24.8 19.9Share of loans to largest 10 borrowers/total loans 15.3 12.3 13.9 18.4 37.8 30.1Share of loans to largest 20 borrowers/total loans 21.1 16.4 19.2 26.3 49.6 39.8
Distribution of loans provided by credit institutionsAgriculture, hunting and forestry 5.1 8.8 1.2 2.0 1.5 3.6Mining 3.6 4.4 2.2 3.7 0.7 0.6Manufacturing 16.0 18.0 16.6 13.8 6.8 9.5Production and distribution of energy, gas and water 2.6 2.7 1.7 3.3 0.6 0.8Construction 5.9 5.7 4.1 6.7 8.4 8.7Wholesale and retail trade 17.1 16.4 15.8 16.4 37.8 27.8Transport and communication 3.8 4.1 3.4 3.9 1.9 2.7Other economic activities 23.7 17.5 21.1 29.9 25.1 19.0Individuals 23.7 22.3 33.8 20.3 17.3 27.2
Geographical distribution of interbank loans and deposits (asset side)Russian Federation … 37.3 34.8 45.9 84.5 97.8United Kingdom … 29.8 20.2 13.0 0.4 0.0USA … 2.6 2.5 2.7 1.3 0.3Germany … 1.8 13.7 6.0 2.4 0.2Austria … 0.7 6.8 5.7 2.7 0.8France … 2.9 3.5 6.3 0.1 0.0Italy … 0.2 0.0 0.0 0.0 0.0Cyprus … 11.9 0.0 0.0 0.0 0.3Netherlands … 0.4 7.8 1.7 0.3 0.0Other … 12.4 10.9 18.7 8.4 0.5
LiquidityHighly liquid assets to total assets 13.5 12.0 15.3 13.3 23.3 20.4Liquid assets to total assets 26.8 21.0 30.9 30.6 40.7 35.2Interbank loan assets to total assets, excl. CBR 8.7 8.6 12.1 7.6 4.6 5.5 Of which
Vis-à-vis non-residents 5.2 5.4 7.9 4.1 0.7 0.1Deposits from individuals to total assets 29.3 36.9 18.6 24.1 23.8 40.3Funds from organizations to total assets 30.6 25.1 30.3 38.1 39.7 33.1Interbank loan liabilities to total assets 11.1 9.4 21.2 9.1 4.6 1.5 Of which
Vis-à-vis non-residents 6.2 4.3 16.1 4.2 0.5 0.1Ratio of highly liquid assets to demand liabilities 64.8 73.6 80.7 51.4 64.7 65.5Liquid assets to short-term liabilities 94.3 99.2 96.9 88.8 95.5 97.1Ratio of client's funds to total loans 109.5 105.5 90.4 119.8 146.4 143.2
Market risk (to aggregate capital) 48.6 43.6 41.7 59.7 56.2 43.2 consisting of:
Interest rate risk 36.7 33.1 34.6 43.1 40.1 35.2Securities risk 8.6 7.4 3.9 13.1 12.7 5.6FX risk 3.2 3.1 3.2 3.4 3.4 2.5
Return on asset 1.9 2.4 2.1 1.1 1.5 1.0Return on equity 12.5 15.2 14.3 8.6 7.4 5.7
Sources: Central Bank of the Russian Federation and IMF staff calculation.1/ Large borrowers are those with loans exceeding 5 percent of regulatory capital.

31
Table 4. Summary of Stress Testing Framework
Top-down Tests Bottom-up Test
Single-factor Macro Scenario
1 Who performed the
tests CBR CBR and Prognoz Individual banks
2 Institutions covered All (1012) 15 (56 percent of the
system)
3 Assessment date and
type of data December 2010, supervisory bank-by-bank data
December 2010, banks’ internal data
4 Risk horizon Instantaneous 1 year
5 Metrics (hurdle rates) Regulatory minimum CAR (10%)
6 Positions and risk factors included
Credit risk (household and corporate loans).
Concentration risk
Market risks (FX, equity and interest rate) from trading + AFS accounts.
Liquidity risk
Combined shock of credit, market and liquidity risks.
Interbank contagion risk.
Adjustment for regulatory issues.
Credit risk (household and corporate loans).
Market risks (FX, equity and interest rate) from trading + AFS accounts.
Liquidity risk
Profit generated within risk horizon.
7 Severity of shocks
Credit risk: (A) 1.65 stdev shock on historical average; (B) 1.65 stdev shock on actual.
Concentration risk: default by top 5 borrowers.
Market risks: FX—20 percent depreciation; equity— 30 percent decline; interest rate— +300 (900) bps for government (corporate) bonds.
Baseline: GDP growth rate 4 percent--slightly below WEO forecast (as of early 2011).
Pessimistic: GDP growth rate -1 percent (1 stdev shock using 2000-2010 history)
Severe: GDP growth rate -4 percent (1.7 stdev shock using 2000–2010 history)
For banks using internal macro-financial model: same macro assumptions (severe scenario) as top-down macro scenario tests.
For banks using combined single-factor test approach: same

32
Liquidity risk: Outflows; household deposit— 20 percent; corporate settlement accounts—20 percent; corporate deposits—10 percent; cross-border interbank deposit—30 percent. Haircut: high liquid asset—5 percent; liquid asset—20 percent; low-liquid assets—60 percent. No access to domestic interbank market.
assumptions as with the top-down combined single-factor test.
8 Methodology
CBR’s regular test
Constant RWA, no profit, 100 percent provisions for new NPLs.
Liquidity risk is measured by its solvency impact due to losses from fire sales of liquid assets, no cash inflows.
Contagion: a bank “defaults” on all of its interbank liabilities when total losses amount to 75 percent of capital.
Operational since early 2011
RWA grows with asset, 100 percent provisions for new NPLs.
Profit modeled with constant interest margin from performing loans.
Liquidity risk measured by solvency. CBR’s haircut is applied for securities available for CBR’s repo operation. Cash inflow from loan repayment and access to interbank market (at punitive rate).
Approach A: use banks own internal macro-financial model and behavioral assumptions
Approach B: follow CBR’s single-factor test (combined shock).

33
Table 5. Assumptions: Macro Scenario Tests
Indicators Baseline Pessimistic Severe
Real GDP growth rate, in percent 4.0 -1.0 -4.0
Oil price, USD/barrel 70 50 43
Inflation (CPI), in percent 9.0 11.0 7.3
Real investments in fixed capital, growth rate in percent
3.1 -1.0 -2.6
Real disposable income of household, growth rate in percent
2.7 -1.5 -3.1
Increase in interest rates of state securities (parallel shift), bps
200 300 350
Increase in interest rates of corporate securities (parallel shift), bps
500 900 1000
Stock price, growth rate in percent 0 -50 -67
Ruble depreciation (basket), in percent 10 20 26

34
Table 6. Summary of Top-Down Stress Testing Results
Memo/assumptions All State-
owned
Foreign-
owned
Large
private
Small-
Medium,
Moscow
Small-
Medium,
regional
End-2010, actual
Regulatory capital ratio (CAR) 18.1 18.6 19.5 15.5 26.8 22.2
Core capital ratio 11.4 10.2 14.4 9.9 22.8 17.2
Adjustments
Forbearance (FB)1/ Crisis time measures 2 1 2 3 2 3
Extended maturity + FB 1/ 2/ 20 21 7 26 15 13
Middle prov. 50% good collateral +FB 1/3/ Middle point prov. Rate 35 34 43 34 24 35
Single factor stress tests, based on unadjusted data as of end-2010
Credit risk
Increase in NPL ratio
A: Historical distribution 24 25 20 26 18 28
Of which: Corporate 20 23 11 20 14 22
Of which: Household 4 2 9 6 4 6
B: 1.65 stdev shock 38 39 40 37 27 38
Default of top 5 borrowers 4/ 100% losses upon default 49 49 32 57 51 59
Liquidity risk 5/ 14 9 18 22 6 11
Market risk (direct impact only) 13 9 10 22 9 6
Of which: Ruble depreciation 20% 0 0 1 0 0 0
Of which: Equity valuation -30% 4 2 2 10 4 2
Of which: Bond valuation 6/ 300 (900) bps up for
government (corporate)
8 7 8 11 6 4
Interbank contagion effects 7/ Combined test 13 15 10 8 13 27
Memo items
Combined test (including credit (increase in NPL ratio (A:historical distribution)), liquidity, and market risks listed above)
Total losses 51 42 49 69 34 45
Regulatory capital ratio % (CAR) 8.9 10.7 10 4.8 17.9 12.1
Capital shortfall % GDP To regain 10% CAR 1.8 0.3 0.4 1.1 0.0 0.1
Macro stress tests, based on unadjusted data as of end 2010
Severe scenario 8/
Regulatory capital ratio % (CAR) 14.1 14.9 15.3 10.2 22.2 16.7
Core capital ratio % 7.1 6.4 8.9 6.1 13.3 10.7
Net losses, % capital -22 -20 -22 -35 -17 -25
Of which: Profits before provisions, % capital 11 11 10 11 9 7
Of which: Total losses, % capital -34 -32 -33 -48 -27 -33
Capital shortfall % GDP To regain 10% CAR 0.3 0.1 0.0 0.1 0.0 0.0
Pessimistic scenario 9/
Regulatory capital ratio % (CAR) 17.1 18.1 18.6 14.4 25.6 20.9
Core capital ratio % 10.4 9.5 13.0 9.0 19.2 15.7
Net losses, % capital -5 -3 -5 -7 -4 -6
Of which: Profits before provisions, % capital 13 13 12 14 9 10
Of which: Total losses, % capital -18 -16 -16 -21 -13 -16
Capital shortfall % GDP To regain 10% CAR 0.1 0.0 0.0 0.0 0.0 0.0
Sources: Central Bank of the Russian Federation and IMF staff calculation.
9/ Assuming a 4.6 p.p. drop in GDP growth rate (about 1 standard deviation using 2000-2010 data) from baseline.
1.65 stdev shock on actual
(Key post-shock indicators)
1/ Impact from losses from forbearance measures temporarily introduced during the crisis time up to July 2010.
2/ Loans whose maturity was lengthened default lose 100% of their values. At end 2010, total restructured loan amounted to 30% among large
loans, a half of which were extended maturity loans.
3/ Raise provisioning rates of each loan category to the middle value of the regulatory acceptable ranges, including high quality collaterals only.
5/Losses from asset firesales upon liability side shocks. Withdrawal rates are 30 % for interbank liabilities from non-resident banks; 20% for
individual deposits and funds from settlement accounts from corporations; 10% for deposits from corproations. 5, 20, and 60 percent haircuts with
highly liquid, liquid, and low-liquid assts respectively. No access to domestic interbank market, including the CBR.
6/ Pararell shift up of bond yield curves
7/ In addition to the combined shocks, including credit (A: historical distribuiton) liquidity and market shocks. In the contagion stage, a bank
"defaults" 100% on its interbank borrowings when its losses from interbank contagion effects reach 75% of its stressed capital.
8/ Assuming, a 8 p.p. drop in GDP growth rate (i.e. 1.68 standard deviation using 2000-2010 data) from baseline.
4/ Loans to top 5 borrowers are about 50% of capital. Compared to other shocks, this secenario should have extremely lower probability to occur.
1.65 stdev shock on
historical average
(In percent)
(Losses under stress in percent of initial capital)
(Losses under stress in percent of initial capital, unless otherwise
mentioned)

35
Table 7. Summary of Bottom-Up Stress Testing Results
All State owned
Foreign Other
SampleNumber of banks 15 2 8 5Share in total banking sector by assets (in percent) 57 36 10 11
Test MethodologyApproach A: Number of banks using internal macro model 6 1 4 1Approach B: Number of banks using combined sensitivity tests 9 1 4 4
Actual data as of end 2010, for bottom-up sampleCAR (in percent) 17.6 19.1 16.1 14.1Core capital ratio (in percent) 9.8 10.0 11.4 7.8NPL ratio (in percent) 9.3 9.7 10.9 6.1
Bottom-up results, severe scenarioCAR (in percent) 14.1 17.0 12.8 5.6Total losses (in percent of capital) 23.2 16.5 26.2 47.8Profit (in percent of capital) 13.6 19.2 6.1 -2.1
Changes in NPL ratio (in percentage points) 3.0 2.4 4.9 3.4
CBR's combined single factor test results, for bottom-up sampleCAR (in percent) 8.5 10.6 7.0 3.6Total losses (in percent of capital) 51.5 44.8 56.3 74.6
Changes in NPL ratio (in percentage points) 5.5 6.1 3.7 5.1
CBR's macro stress test (severe scenario), for bottom-up sampleCAR (in percent) 13.0 15.0 12.5 9.5Total losses (in percent of capital) 23.1 21.9 21.6 27.9Profit (in percent of capital) 11.2 10.9 11.9 11.5
Changes in NPL ratio (in percentage points) 3.6 3.4 4.1 4.2
Source: The Central Bank of Russia.

36
Figure 1. Financial Soundness Indicators, Cross-Country
0 5 10 15 20 25
Serbia
Ukraine
Turkey
Russia
Bulgaria
Brazil
Germany
United Kingdom
Korea
Poland
France
China
Capital to RWA0 5 10 15 20 25
Serbia
Russia
Ukraine
Turkey
Bulgaria
Korea
Brazil
Poland
China
United Kingdom
Germany
France
Capital to assets
0 10 20 30 40 50
Ukraine
Serbia
Russia
Bulgaria
Poland
Turkey
Brazil
France
United Kingdom
Germany
China
Korea
NPL Ratio0 50 100 150 200
Serbia
Brazil
China
Korea
France
Russia
Turkey
Bulgaria
Ukraine
Poland
United Kingdom
Germany
Loan Loss Provisions to NPLs
-5.0 -3.0 -1.0 1.0 3.0
Turkey
Brazil
Russia
Serbia
Bulgaria
China
Poland
France
Korea
United Kingdom
Germany
Ukraine
ROA-20 -10 0 10 20 30
Brazil
Turkey
China
Poland
Russia
Bulgaria
France
Serbia
Korea
United Kingdom
Germany
Ukraine
ROE
0 50 100 150
France
Germany
Russia
Turkey
Brazil
Serbia
China
United Kingdom
Ukraine
Poland
Bulgaria
Liquid Assets to Short-Term Liabilities0 20 40 60 80 100 120
Germany
France
Brazil
Bulgaria
Turkey
Poland
Russia
Ukraine
Serbia
Deposits to GDP
Source: IMC GFSR Statistical Appendix (Fall 2010) and International Financial Statistics.

37
Figure 2. Summary of Top-Down Stress Test Results
p p
( g ( ( )), q y,
Source: CBR and IMF staf f calculation.
4
79
0
200
400
600
800
1000
1200<
0%
0-2
%
2-4
%
4-6
%
6-8
%
8-1
0%
10
-12
%
12
-14
%
14
-16
%
16
-18
%
18
-20
%
20
-22
%
22
-24
%
24
-26
%
26
-28
%
28
-30
%
30
% +
Nu
mb
er
of
ban
ks
Cumulative Distribution of Regulatory Capital Ratio
Actual, end-2010
Severe macro test
0
8
0
10
20
30
40
50
60
70
80
90
100
<0
%
0-2
%
2-4
%
4-6
%
6-8
%
8-1
0%
10
-12
%
12
-14
%
14
-16
%
16
-18
%
18
-20
%
20
-22
%
22
-24
%
24
-26
%
26
-28
%
28
-30
%
30
% +
Mar
ket
shar
e o
f b
anks
Cumulative Distribution of Regulatory Capital Ratio
Actual, end-2010
Severe macro test
11
65
255
0
200
400
600
800
1000
1200
<0
%
0-2
%
2-4
%
4-6
%
6-8
%
8-1
0%
10
-12
%
12
-14
%
14
-16
%
16
-18
%
18
-20
%
20
-22
%
22
-24
%
24
-26
%
26
-28
%
28
-30
%
30
% +
Nu
mb
er
of
ban
ks
Cumulative Distribution of Regulatory Capital Ratio: Various Adjustments
Actual, end-2010
Forbearance (FB)
Extended maturity + FB
Mid prov. 50% good collateral +FB
0
9
38
0
10
20
30
40
50
60
70
80
90
100
<0
%
0-2
%
2-4
%
4-6
%
6-8
%
8-1
0%
10
-12
%
12
-14
%
14
-16
%
16
-18
%
18
-20
%
20
-22
%
22
-24
%
24
-26
%
26
-28
%
28
-30
%
30
% +
Mar
ket
shar
e o
f b
anks
Cumulative Distribution of Regulatory Capital Ratio: Various Adjustments
Actual, end-2010
Forbearance (FB)
Extended maturity + FBMid prov. 50% good collateral +FB
0
2
4
6
8
10
12
14
16
All State Foreign Large private
SM, Moscow
SM, Region
Pe
rce
nta
ge p
oin
ts
Credit risks: Changes in NPL ratio in stress tests
NPL increase A: 5 percentiles of historical dist.NPL increase B: actual +1.65 stdev Pessimistic macro testSevere macro test
-90
-80
-70
-60
-50
-40
-30
-20
-10
0
All State Foreign Large private
SM, Moscow
SM, Region
Combined single factor test: details of impact in percent of capital
Bond loss Equity loss
FX loss Firesales loss
Credit loss Contagion effects

38
Figure 2. Summary of Top-Down Stress Test Results (continued)
p p
( g ( ( )), q y,
Source: CBRand IMF staf f calculation
0
5
10
15
20
All State Foreign Large private
SM, Moscow
SM, Region
Liquidity Stress : Withdrawal of liabilities in percent of assets
Deposit, individual
Settlement account, organizations
Deposit, organizations
Non-resident interbank liabilities
0
5
10
15
20
25
All State Foreign Large private
SM, Moscow
SM, Region
Liquidity Stress: Losses from asset fire sales in percent of capital
0
20
40
60
80
100
120
140
All State Foreign Large private
SM, Moscow
SM, Region
Liquidity Ratio: Liquid assets/ST liabilities in percent
Actual
Single factor liquidity stress testRegulation
0
20
40
60
80
100
120
140
All State Foreign Large private
SM, Moscow
SM, Region
Liquidity Ratio: High liquid assets/demand liability in percent
Actual
Single factor liquidity stress test
-90
-70
-50
-30
-10
10
30
All State Foreign Large private
SM, Moscow
SM, Region
Pessimistic Macro stress tests: details of impact in percent of capital
Bond loss Equity lossFX loss Firesales lossCredit loss Gross profitNet profit
-90
-70
-50
-30
-10
10
30
All State Foreign Large private
SM, Moscow
SM, Region
Severe Macro stress tests: details of impact in percent of capital
Bonds loss Equity lossFX loss Firesales lossCredit loss Gross profitNet profit

39
Figure 3. Summary of Bottom-Up Stress Test Results
Source: The Central Bank of Russia and IMF staff calculations.
-90
-70
-50
-30
-10
10
30
All State owned Foreign Other
Bottom-up test results, losses and profits in percent of capital, by types of banks
Profit Bond valuation lossEquity valuation loss FX lossLiquidiy loss Credit lossChanges in CAR, in %
-90
-70
-50
-30
-10
10
30
All State owned Foreign Other
Top-down macro scenario test results for bottom-up sample, losses and profits in percent of capital, by types of banks
Profit Bond valuation lossEquity valuation loss FX lossLiquidiy loss Credit lossChanges in CAR in %
-90
-70
-50
-30
-10
10
30
All State owned Foreign Other
Combined single factor top-down test result for bottom-up sample, losses and profits in percent of capital, by types of banks
Bond valuation loss Equity valuation loss
FX loss Liquidiy loss
Credit loss

40
APPENDIX I. MACROECONOMIC MODEL WITH THE BANKING SECTOR
23. The model consists of a set of over 20 econometric equations, covering the household, real, external, monetary, and fiscal sectors. Most of the estimation uses quarterly year on year change data for the period of 1998–2010, using OLS.
24. The core part of the macro-financial model consists of linking the aggregate NPL ratios for the corporate sector loans and for the household sector loans to macroeconomic variables. The models are estimated with data from 2000 to 2010, using monthly year-on-year growth rate of each variable. The model for the household sector loans includes CPI, household income, exchange rate (vis-à-vis the US dollar), lending rate to the household, and M0. The model for the corporate sector loans includes exchange rate (vis-à-vis the U.S. dollar), production, fixed capital investment, PPI, oil price, and lending rate to the sector.
Household credit NPL ratio model
Y = -1.5369 + 0.2359*X1[t] – 0.0353*X2[t] + 8.8125*X3[t-4] – 0.7167*X4[t-2] – 1.5575*X5[t]
Y – Percentage point change in NPL ratio (the share of category 4, 5 loans) for credits to individuals
Table 8. Estimation Results for the Household Sector NPL Model
Coefficient/Statistical characteristics ValueStandard
error T-
StatisticA0 (constant) -1.5369 2.4268 -0.6333X1 – Change in consumer price index, percentage points.
0.2359 0.0359 6.5770
X2 – Rate of growth of public real disposable income, in percent
-0.0353 0.0170 -2.0813
X3 – Rate of growth of the exchange rate of the dollar against the ruble, in percent
8.8125 1.3855 6.3603
X4 – Change in refinancing rate, percentage points.
-0.7167 0.0935 -7.6659
X5 – Rate of growth of cash (М0), in percent -1.5575 0.4421 -3.5234R square 0.86 … …Adjusted R square 0.85 … …F statistic – p value 0.00 … …Durbin-Watson Statistic 1.30 … …

41
25. The chosen model produces functioning estimates of NPL, keeping track of the actual development, including during the 2008–2009 crisis time, fairly well (table 8). For household credit, the ruble depreciation affects to the credit quality negatively, as expected and in contrary to the corporate credit model.
Figure 4. Household sector NPL model
In terms of the sources of risks, the model indicates that exchange rate and inflation are the most quantitatively important sources of risks (figure 4).
Corporate credit NPL model
Y = 11.7302 – 0.5807*X1[t] – 0.1227*X2 – 0.0927*X3[t-1] + 0.1052*X4[t] – 8.8787*X5[t] + 0.2026*X6[t-3] Y – Percentage point changes with NPL ratio (share of category 4 and 5 loans) for credit to legal entities
0
0.1
0.2
0.3
0.4
0.5
0.6
0.7
0.8
0.9
Ruble/USD CPI inflation rate Money supply (-) Disposable household income
growth rate (-)(-) indicates the impact of - one standard deviaiton shock
Household sector NPL model: The impact of a one standard deviation shock to each macroeconomic variable

42
Table 9. Estimation Results for the Corporate sector NPL model
Coefficient/ Statistical Characteristics ValueStandard
error t-statistic
A0 (constant) 11.7302 5.1076 2.2966X1 – Rate of growth of the exchange rate of the dollar against the ruble, in percent
-0.5807 0.0552 -10.5277
X2 – Rate of growth of production (GDP), in percent -0.1227 0.0585 -2.0982
X3 – Rate of growth of investment in fixed capital, in percent
-0.0927 0.0168 -5.5217
X4 – Rate of growth of consumer price index, in percent 0.1052 0.0139 7.5474X5 – Change of price of oil, dollars per barrel -8.8787 0.9724 -9.1303X6 – Change in refinancing rate, percentage points. 0.2026 0.0160 12.6262R-Square 0.85 … …Adjusted R square 0.84 … …F statistic, p-value 0.00 … …Durbin Watson Statistic 0.89 … …
Figure 5. Factors driving the corporate NPL model
26. The chosen model produces functioning estimates of NPL, keeping track of the actual development, including during the 2008–2009 crisis time, fairly well (Table 9). For corporate credit, the ruble depreciation affects to the credit quality favorably, as the overall corporate sector have foreign exchange income to benefit from ruble depreciation. 27. In terms of the sources of risks, the model indicates that oil price is the most quantitatively important sources of risks, in line with well-known perception with the Russian economy (Figure 5).
0
0.1
0.2
0.3
0.4
0.5
0.6
0.7
0.8
0.9
1
Oil price (USD) (-)
Ruble/USD (-) PPI inflation Investment growth rate (-)
Refinancing rate
GDP growth rate (-)
(-) indicates the impact of - one standard deviaiton shock
Corporate sector NPL model: The impact of a one standard deviation shock to each macroeconomic variable

43
NPL ratio for individual banks
28. The substantial number of banks in the system (over 1000) made it challenging to use standard panel techniques to work with individual banks’ NPL data. Therefore, the CBR first constructed a model that relates aggregate NPL ratios to macroeconomic variables, and then “allocated” the macro trends to individual banks’ NPL ratio. The increase in sector-wise non-performing loan is allocated according to a coefficient, which is a function of (1) the institution’s current credit quality (relative to sector average); (2) the size of the institution; and (3) the institutions propensity to credit risk. The propensity to credit risk increases when the NPL ratio of the institution is more volatile than the others.