russia, the persian gulf, and world oil...
TRANSCRIPT
Russia, the Persian Gulf, Russia, the Persian Gulf, and World Oil Supplyand World Oil Supply
Mikhail KhodorkovskyWashington, 7 February 2003
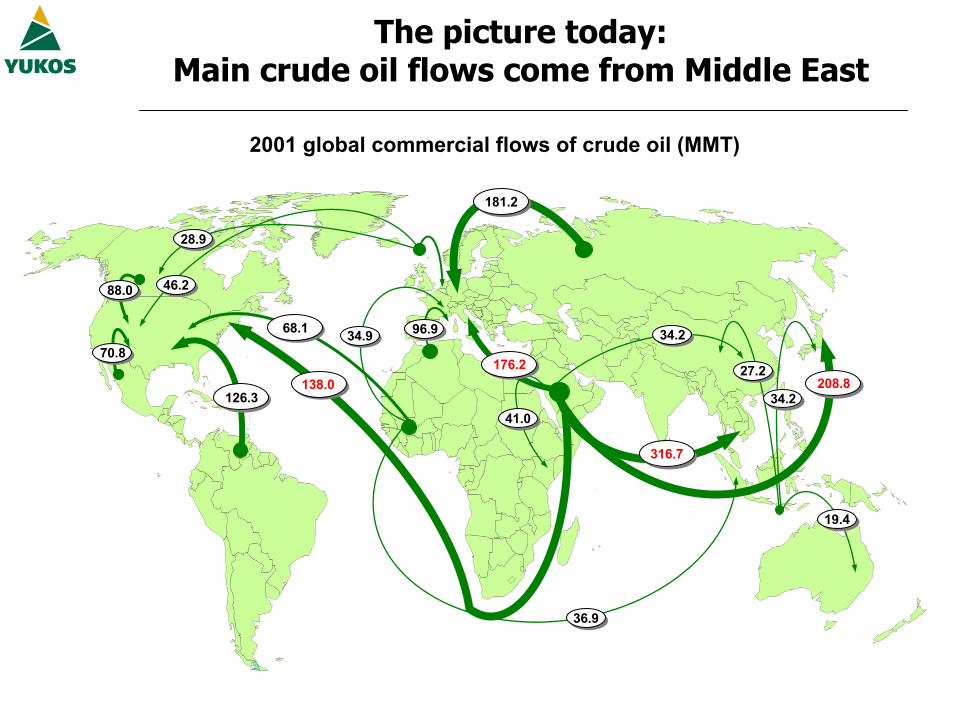
138.0
181.2
126.3208.8
176.2
36.9
68.1
88.0
70.827.2
316.7
46.2
28.9
34.9 34.296.9
19.4
34.241.0
2001 global commercial flows of crude oil (MMT)
The picture today:Main crude oil flows come from Middle East
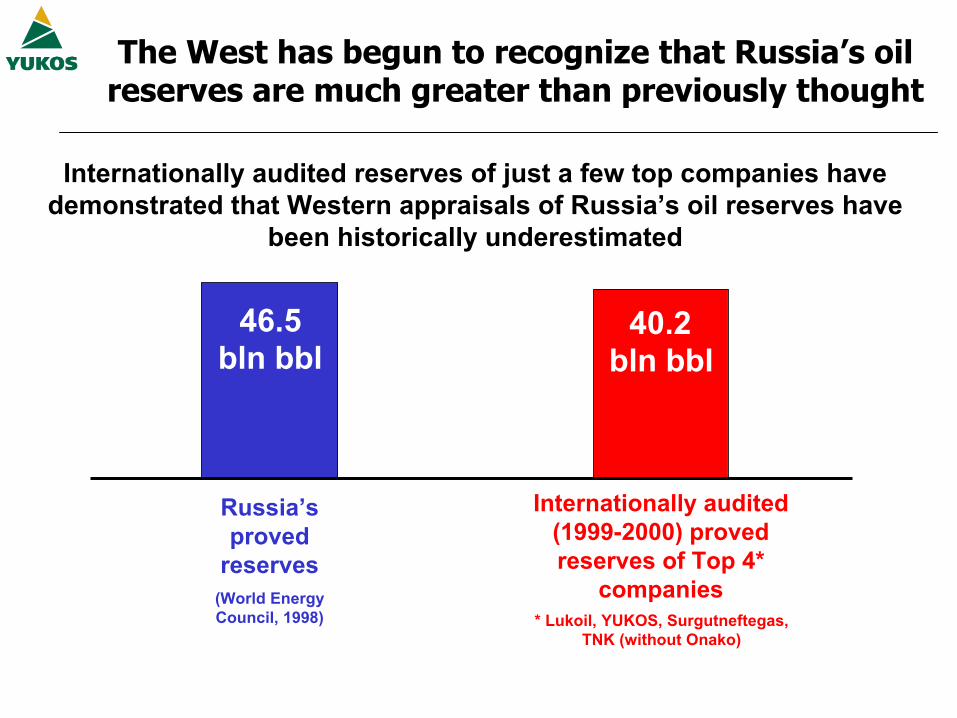
The West has begun to recognize that Russia’s oil reserves are much greater than previously thought
46.5 40.2
Internationally audited reserves of just a few top companies have demonstrated that Western appraisals of Russia’s oil reserves have
been historically underestimated
bln bblbln bbl
* Lukoil, YUKOS, Surgutneftegas,TNK (without Onako)
Internationally audited (1999-2000) proved reserves of Top 4*
companies
Russia’s proved
reserves(World Energy Council, 1998)

Russian oil industry has internal resources to finance production growth at lower than expected cost
Oil industry production increase
Oil industryCAPEX increase
+ 0.5 + $4.4 bln
8,800
CAPEX necessary to increase production
($ per bpd)
20,000
ActualWesternExperts’
Estimates**
mbpd
2001 200120012001 ** Richard Matzke, former VP Chevron/Texaco, 2002* RF Minenergo
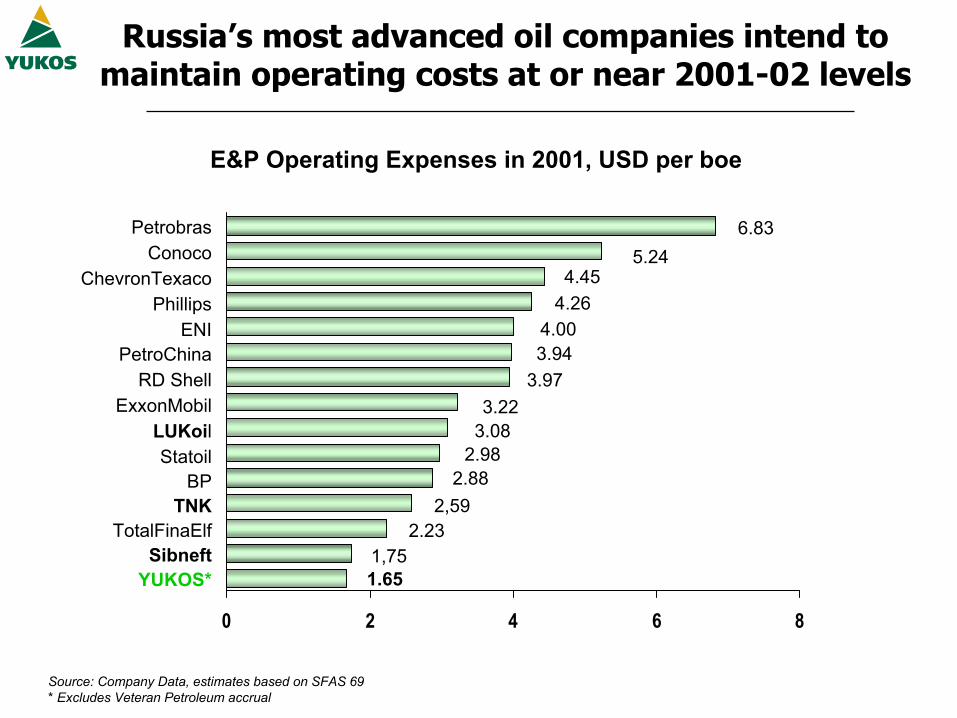
Source: Company Data, estimates based on SFAS 69* Excludes Veteran Petroleum accrual
E&P Operating Expenses in 2001, USD per boe
PetrobrasConoco
ChevronTexacoPhillips
ENIPetroChina
RD ShellExxonMobil
LUKoilStatoil
BPTNK
TotalFinaElfSibneft
YUKOS*
0 2 4 6 8
6.835.24
4.454.26
4.003.94
3.973.22
3.082.98
2.88
2.23
1.65
2,59
1,75
Russia’s most advanced oil companies intend to maintain operating costs at or near 2001-02 levels
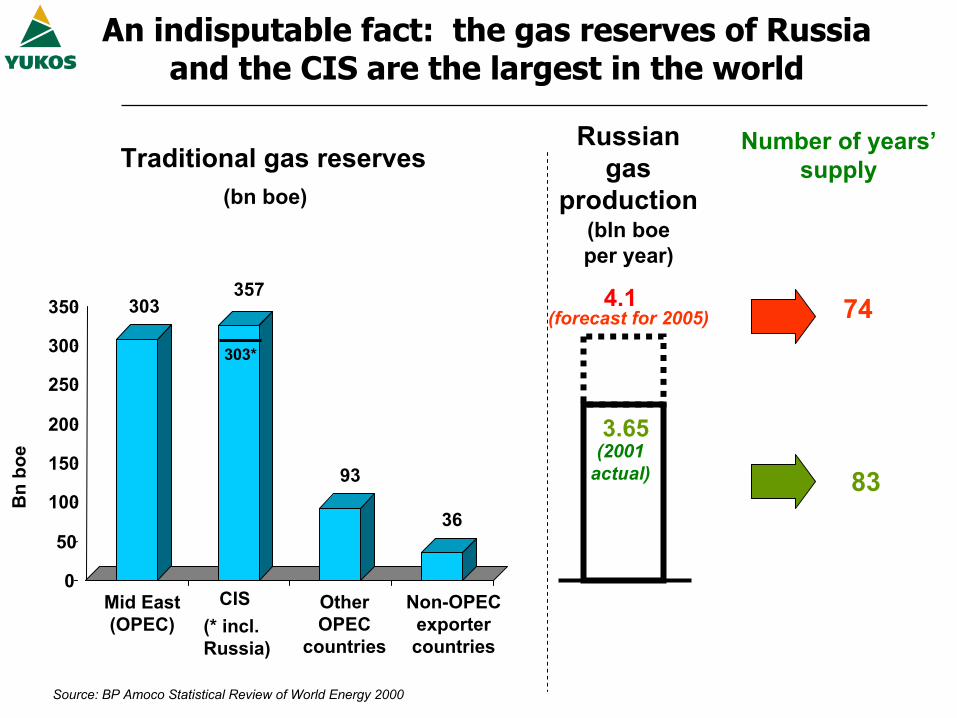
An indisputable fact: the gas reserves of Russia and the CIS are the largest in the world
303357
93
36
0
50
100
150
200
250
300
350
Mid East(OPEC) (* incl.
Russia)
CIS OtherOPEC
countries
Non-OPECexportercountries
Bn
boe
Traditional gas reserves
Source: BP Amoco Statistical Review of World Energy 2000
3.65
Russian gas
production(bln boe per year)
4.1(forecast for 2005)
(2001actual)
Number of years’supply
74
83
303*
(bn boe)
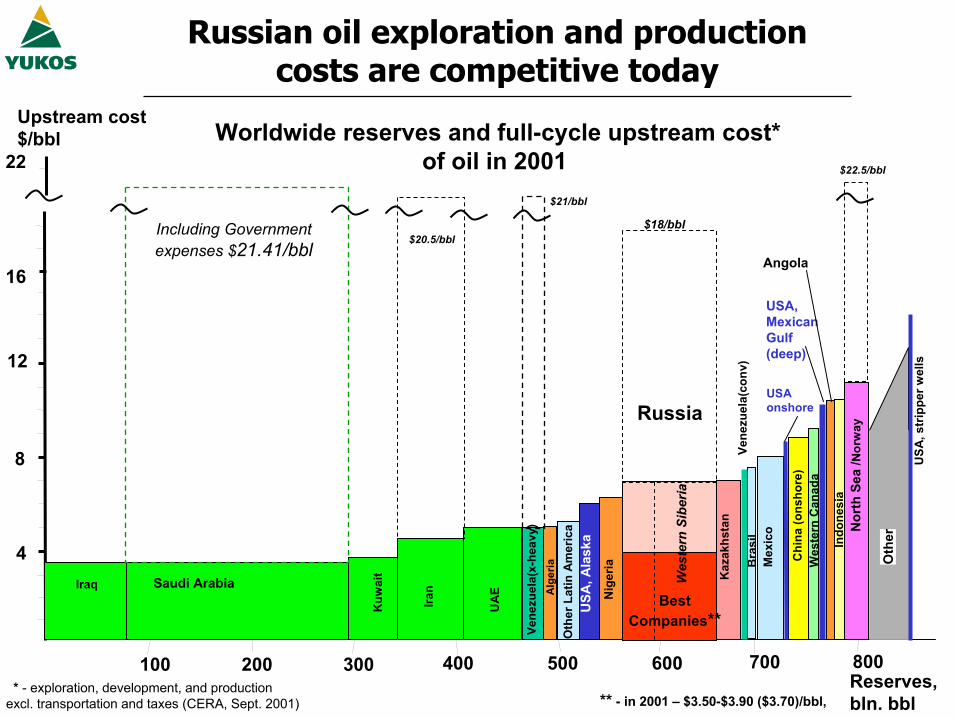
Upstream cost$/bbl
** - in 2001 – $3.50-$3.90 ($3.70)/bbl,
22 $22.5/bbl
* - exploration, development, and production excl. transportation and taxes (CERA, Sept. 2001)
Worldwide reserves and full-cycle upstream cost* of oil in 2001
Reserves,bln. bbl
100
16
12
8
4
200 300 400 500 600 700
Iraq
Kuw
ait
IranSaudi Arabia
UA
E
USA
, str
ippe
rwel
ls
Wes
tern
Sib
eria
Vene
zuel
a(x-
heav
y)
Oth
erLa
tinA
mer
ica
Nig
eria
Alg
eria B
rasi
l Nor
th S
ea/N
orw
ay
Wes
tern
Can
ada
Mex
ico
Chi
na(o
nsho
re)
Indo
nesi
a
USA, MexicanGulf(deep)
USA
, Ala
ska
USA onshore
Angola
Kaz
akhs
tan
Russia
Oth
er
800
BestCompanies**
Vene
zuel
a(co
nv)
$21/bbl
$20.5/bbl$18/bblIncluding Government
expenses $21.41/bbl
Russian oil exploration and production costs are competitive today
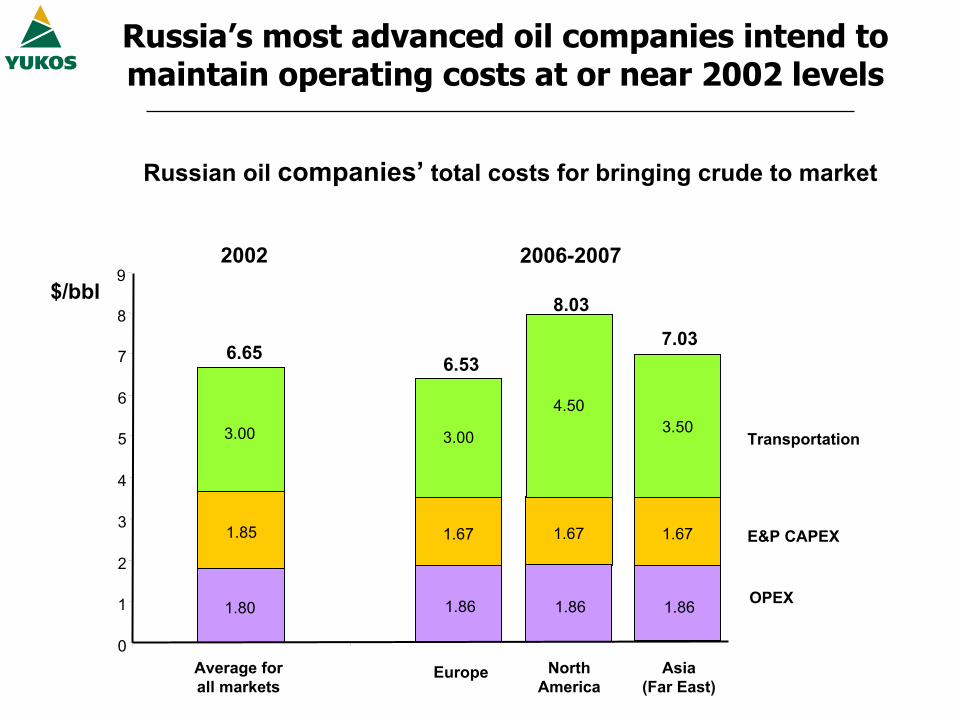
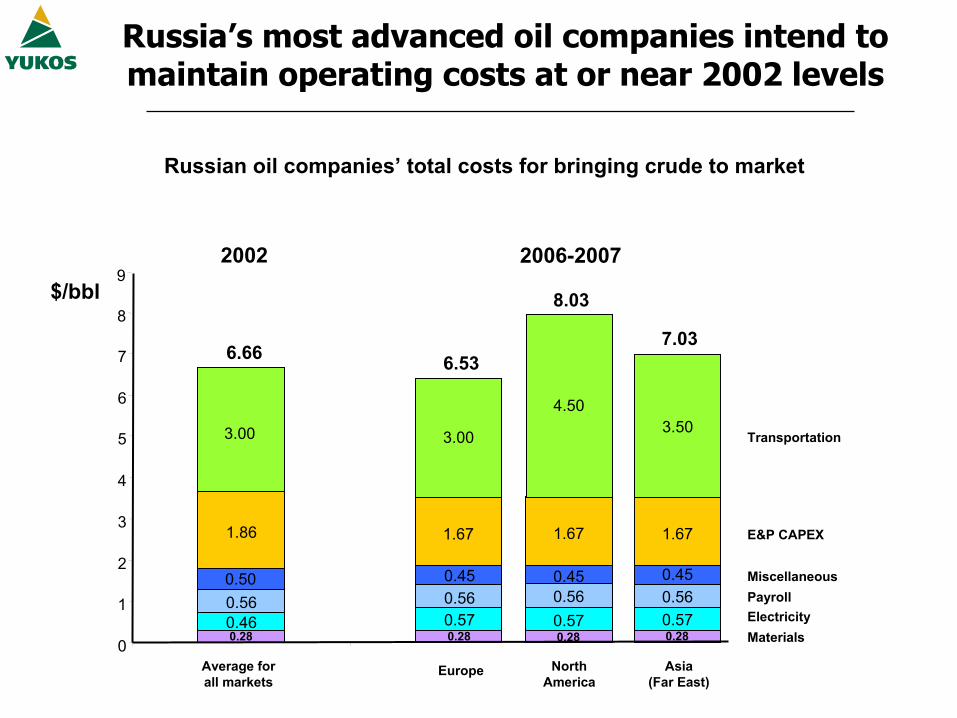
Russia’s most advanced oil companies intend to maintain operating costs at or near 2002 levels
1.80
1.85 1.67
0
1
2
3
4
5
6
7
2002 2006-2007
E&P CAPEX
3.00
8
9
3.00
6.65
Transportation
$/bbl
6.53
1.67
4.50
8.03
1.67
3.50
7.03
Average for all markets
Europe North America
Russian oil companies’ total costs for bringing crude to market
Asia(Far East)
1.86 1.86 1.86 OPEX
0
2
4
6
1995
1996
1997
1998
1999
2000
2001
2005
(forec
ast)
2010
(forec
ast)
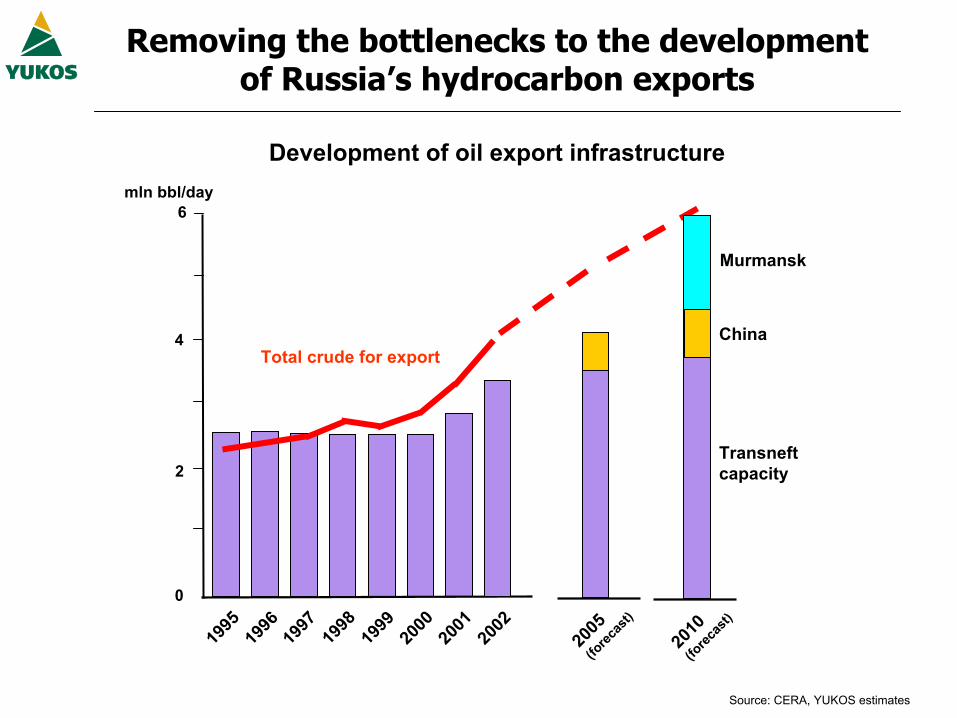
Total crude for export
Transneft capacity
Murmansk
China
Removing the bottlenecks to the development of Russia’s hydrocarbon exports
Development of oil export infrastructure
Source: CERA, YUKOS estimates
2002
mln bbl/day
Источник: worldatlas.com
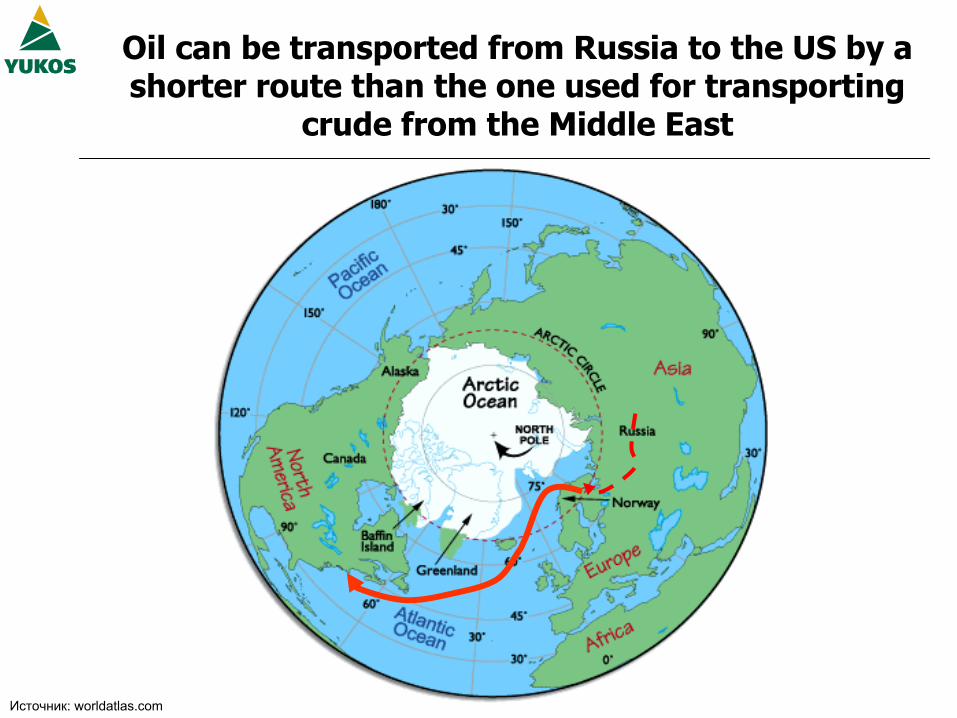
Oil can be transported from Russia to the US by a shorter route than the one used for transporting
crude from the Middle East

The Murmansk Pipeline Project
Nefteyugansk
UsaUkhtaVologda
Region
Murmansk
Moscow
Khanty-MansiyskAutonomous Area
KomiRepublic
Arkhangel’skRegion
Republic
of Karelia
Usa route
Length: 2500 kmCAPEX: $3.4 billion
(preliminary estimate)
Ukhta route
Length: 3600 kmCAPEX: $4.5 billion
(preliminary estimate)
Project milestones
27 Nov 2002: YUKOS signs Memorandum of Understanding with Lukoil, Sibneft, and TNK
April 2003: Declaration of Intent
2003-2004: Investment Case,Feasibility Study,Design Drawings
2004-2007: Construction
2007- : Operation

Mongolia
Russia
China
AngarskChita
Daqing
800 kbopd
~1600 km
~ 800 km
Lake
Baik
al
Facts and figures
• Length ~ 2400 km (1500 miles)
• Initial capacity 400 k bopd
• Estimated cost ~ 1.7 bln USD
• Agreed: pricing formula, volumes, delivery guarantees
• Operator - Transneft
Facts and figures
• Length ~ 2400 km (1500 miles)
• Initial capacity 400 k bopd
• Estimated cost ~ 1.7 bln USD
• Agreed: pricing formula, volumes, delivery guarantees
• Operator - Transneft
Timetable
• July 2002 - Feasibility study
• 2003 - Detailed project
• 2003-2005 - Construction
• 2005-2009 - 400 kbopd shipments
• 2010-2030 - 600 kbopd shipments
Timetable
• July 2002 - Feasibility study
• 2003 - Detailed project
• 2003-2005 - Construction
• 2005-2009 - 400 kbopd shipments
• 2010-2030 - 600 kbopd shipments
capacity
The most promising projects to the Far East:a pipeline to China
Source: CERA research, Yukos estimates
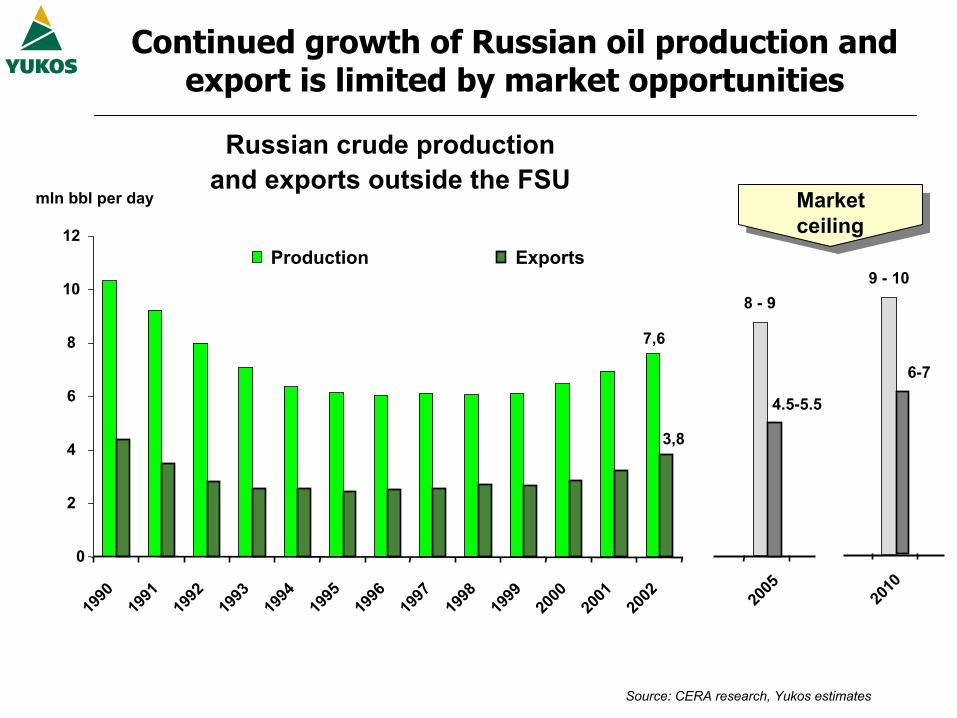
Continued growth of Russian oil production and export is limited by market opportunities
mln bbl per day
Russian crude productionand exports outside the FSU
Marketceiling
0
2
4
6
8
10
12
1990
1991
1992
1993
1994
1995
1996
1997
1998
1999
2000
2001
2002
Production Exports
2005
2010
7,6
3,8
8 - 99 - 10
4.5-5.5
6-7

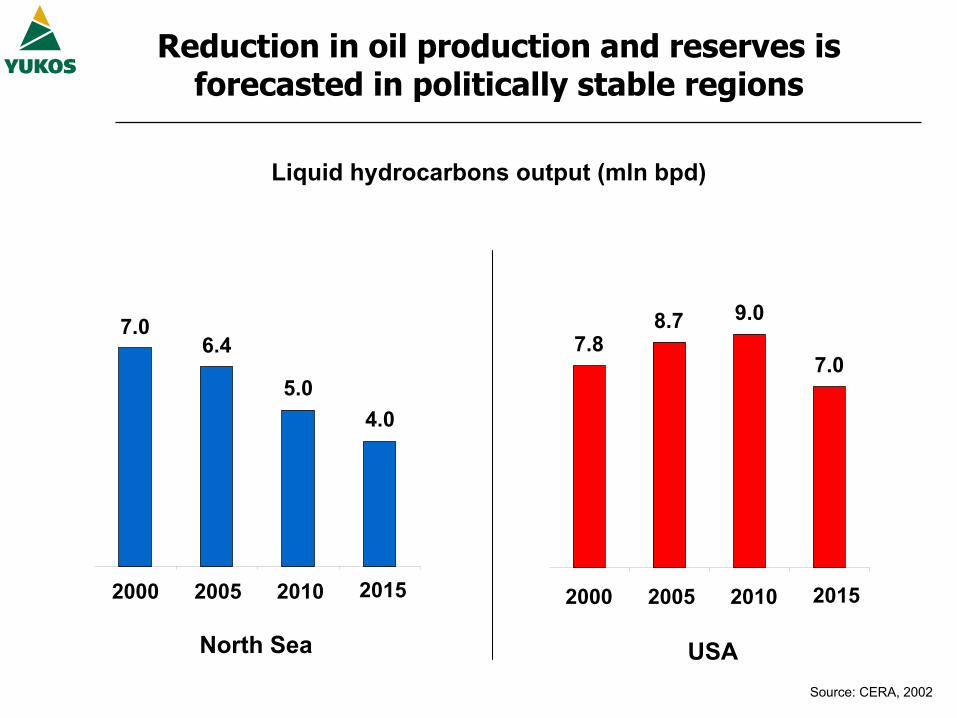
7.06.4
5.04.0
2000
7.88.7 9.0
7.0
2005 2010 2015
Reduction in oil production and reserves is forecasted in politically stable regions
2000 2005 2010 2015
Liquid hydrocarbons output (mln bpd)
North Sea USASource: СERA, 2002
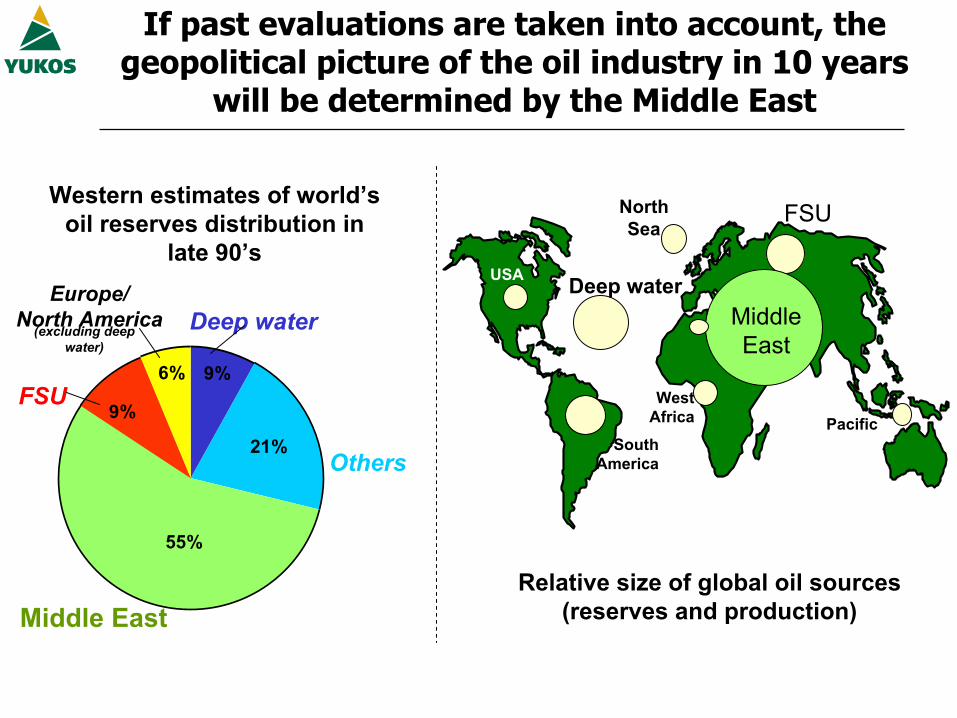
If past evaluations are taken into account, the geopolitical picture of the oil industry in 10 years
will be determined by the Middle East
Relative size of global oil sources(reserves and production)
9%
21%
55%
9%
6%
Europe/North America
(excluding deep water)
Deep water
FSU
Middle East
Others
Western estimates of world’s oil reserves distribution in
late 90’sUSA Deep water
NorthSea
SouthAmerica
MiddleEast
FSU
WestAfrica Pacific
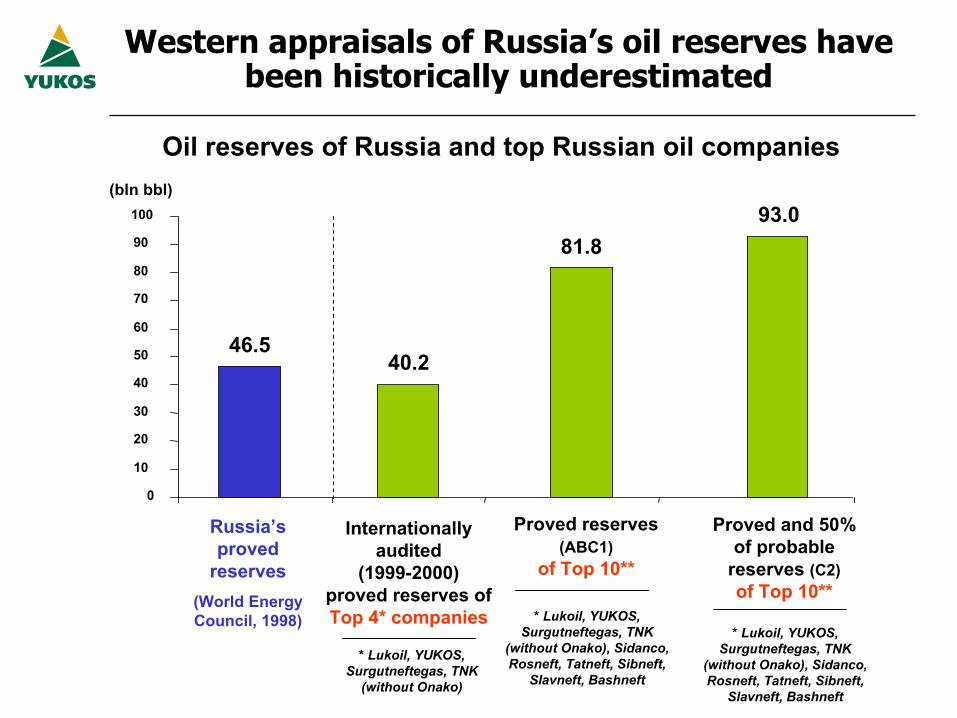
Western appraisals of Russia’s oil reserves have been historically underestimated
Oil reserves of Russia and top Russian oil companies
46.540.2
81.893.0
0
10
20
30
40
50
60
70
80
90
100
(bln bbl)
Internationally audited
(1999-2000) proved reserves of Top 4* companies
Russia’s proved
reserves(World Energy Council, 1998)
* Lukoil, YUKOS, Surgutneftegas, TNK
(without Onako)
Proved reserves (ABC1)
of Top 10**
* Lukoil, YUKOS, Surgutneftegas, TNK
(without Onako), Sidanco, Rosneft, Tatneft, Sibneft,
Slavneft, Bashneft
Proved and 50% of probable
reserves (C2)of Top 10**
* Lukoil, YUKOS, Surgutneftegas, TNK
(without Onako), Sidanco, Rosneft, Tatneft, Sibneft,
Slavneft, Bashneft

80 81 82 92 9383 84 85 86 87 88 89 90 91 94 95 96 97 98 99
World Oil Annual Reports 1980-1999. Petroconsultants
Sudden statistical leaps in combined oil reserve figures forAbu Dhabi, Dubai, Iran, Iraq, Kuwait, and Saudi Arabia
100
200
300
400
500
600
There are grounds to believe that Middle Eastern reserves may be overstated
+ 193increase in one year
Petroconsultantsestimate
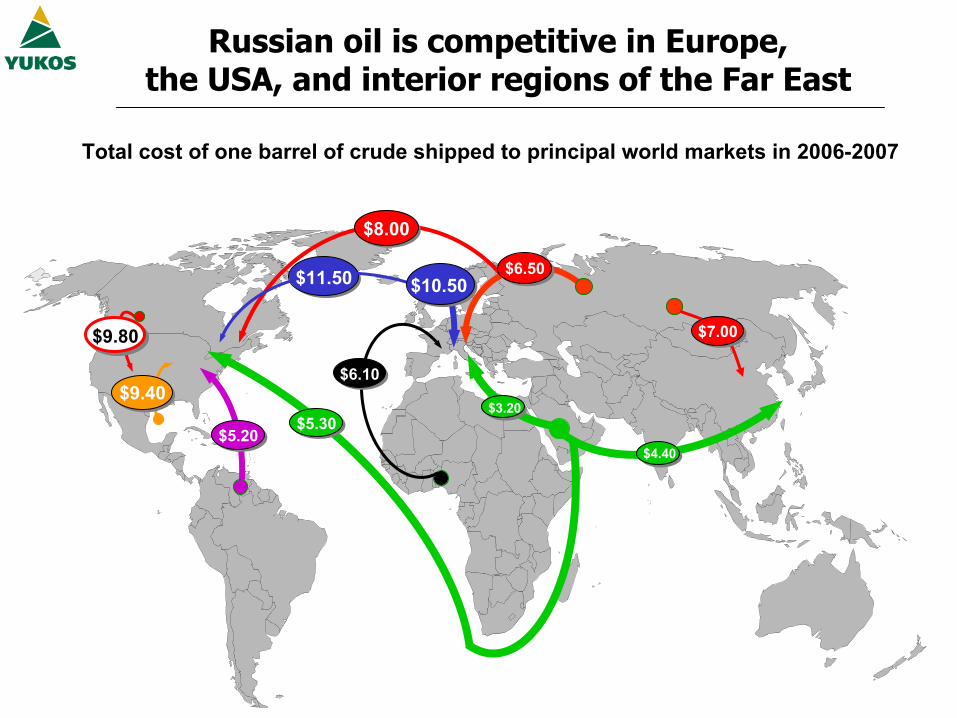
$5.30$5.20
$9.80
$9.40$6.10
Total cost of one barrel of crude shipped to principal world markets in 2006-2007
Russian oil is competitive in Europe,the USA, and interior regions of the Far East
$8.00
$11.50
$3.20
$6.50$10.50
$4.40
$7.00
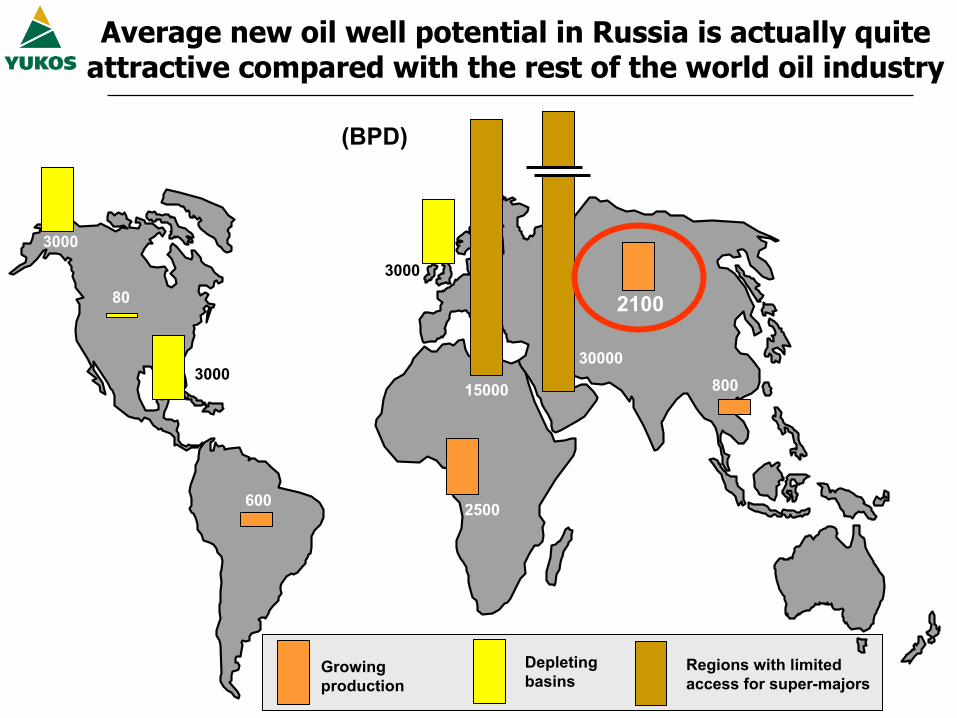
Average new oil well potential in Russia is actually quite attractive compared with the rest of the world oil industry
30000
15000
2500
800
3000
3000
2100
3000
600
80
Depletingbasins
(BPD)
Regions with limitedaccess for super-majors
Growingproduction

Source: Company data
-2%-1%
1%1%1%
2%4%
5%5%
6%6%
11%13%
17%
20%18%
SibneftConoco
YUKOSPhillips
RosneftTNK
BP Petrobras
SurgutneftegasChevronTexaco
Royal Dutch/ShellLUKoil
TotalFinaElfPetroChinaExxonMobil
ENI*
* - excl. Lasmo
Several Russian companies are among the world leaders in oil industry production growth
Relative Production change for selected companies, 2001/2000, %

2000 2005 2010
14.1 14.2 14.4
Source: CERA, 2002
7.06.4
5.0
18% 25%
Western European oil consumption will be more and more dependent on imports in the future
MMBPD
Russia can become a reliable source of crude for Europe for many years to come
North Sea production
ImportsRussia’s
share in 2000Possible Russian
share in 2010

Russia can meet 10% or more of China’s oil import requirements
0
50
100
150
200
250
300
350
1995 2000 2005 2010
170
Chinese domestic production
Imports
Imports from Russia
170 160
320
30
20
260
220
China’s crude requirements (MMT)

The geopolitical imperative for today is to diversify energy sources and concentrate
on the most reliable ones
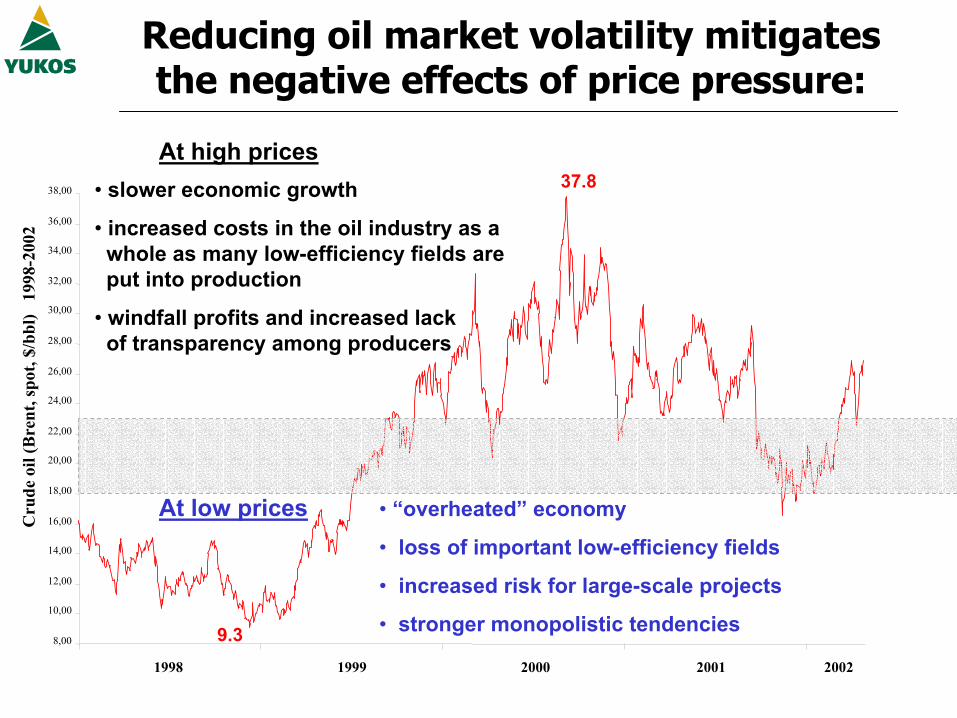
Reducing oil market volatility mitigates the negative effects of price pressure:
Cru
de o
il(B
rent
, spo
t, $/
bbl)
199
8-20
02
1998
8,00
10,00
12,00
14,00
16,00
18,00
20,00
22,00
24,00
26,00
28,00
30,00
32,00
34,00
36,00
38,00
1999 2000 2001 2002
• slower economic growth
• increased costs in the oil industry as awhole as many low-efficiency fields areput into production
• windfall profits and increased lackof transparency among producers
• “overheated” economy
• loss of important low-efficiency fields
• increased risk for large-scale projects
• stronger monopolistic tendencies
37.8
9.3
At high prices
At low prices

A multi-polar geopolitical picture is optimal
• a price range of $18-23 per barrel• a mix of long-term and spot contracts• a rational tax policy in producer and consumer countries
Conditions:
Russia’s most advanced oil companies intend to maintain operating costs at or near 2002 levels
0.28 0.280.46 0.570.56 0.560.50 0.45
1.86 1.67
0
1
2
3
4
5
6
7
2002 2006-2007
MaterialsElectricityPayrollMiscellaneous
E&P CAPEX
3.00
8
9
3.00
6.66
Transportation
$/bbl
6.53
0.280.570.560.45
1.67
4.50
8.03
0.280.570.560.45
1.67
3.50
7.03
Average for all markets
Europe North America
Russian oil companies’ total costs for bringing crude to market
Asia(Far East)