rush river report final - wisconsin department of natural...
TRANSCRIPT
Rush River Watershed
Comprehensive Surface Water Resource Report
St. Croix, Pierce and Pepin Counties, Wisconsin
Prepared by:
Martin P. Engel and William J. Michalek, Jr.
Wisconsin Department of Natural ResourcesWest Central Region
Lower Chippewa River Basin
December, 2002
Rush River WatershedComprehensive Surface Water Resource Report
March, 2002
Contents
Page
Introduction 3
Summary of Water Resource Conditions 5
Methods 8
Results and Discussion 9
Management Recommendations 27
Literature Cited 29
Appendices 30
Lower Chippewa Basin Team Contributors
Marty Engel, Brian Spangler, Dean Johnson, Joe Kurz, Heath Benike, Ken Schreiber, Dan Simonson, PatOldenburg, Tim Hanson, Scott Peavy, Sara Peot, Patty Asher, Holly Eaton, Jeff Briggs, Sarah Beaster, RichHager, Ted Cummings, Nate Anderson, Amanda Rabuck, Jim Devlin, Jay Wanner.
Special Thanks
Thank you to John Koch, project coordinater for the Kiap-tu-Wish Chapter of Trout Unlimited and all the volunteersthat made this project a great success. Also thanks to Arby Linder, President of the Eau Galle Rush River SportsClub and all club members that assisted with field sampling or provided access for field crews.
- 3 -
Introduction
As part of the Lower Chippewa Basin Comprehensive Surface Water Resources Monitoring Program, the
Rush River Watershed was sampled during the 2000 field season. The Rush River watershed comprehensive
stream survey was conducted to gather baseline data on fish habitat, sport and nongame fish communities,
temperature regimes, and macroinvertebrate communities. The purpose of this report is to summarize the
condition of surface water resources in the Rush River Watershed, document impairments, and recommend
management goals and objectives aimed at protecting or improving it. This information will provide a
foundation on which to base future management decisions such as: monitoring, fish stocking, trout stream
classifications, fishing regulations, watershed projects, biodiversity, water regulation and zoning permits,
outstanding and exceptional waters classification, fish habitat restoration, and acquisition goals and
boundaries.
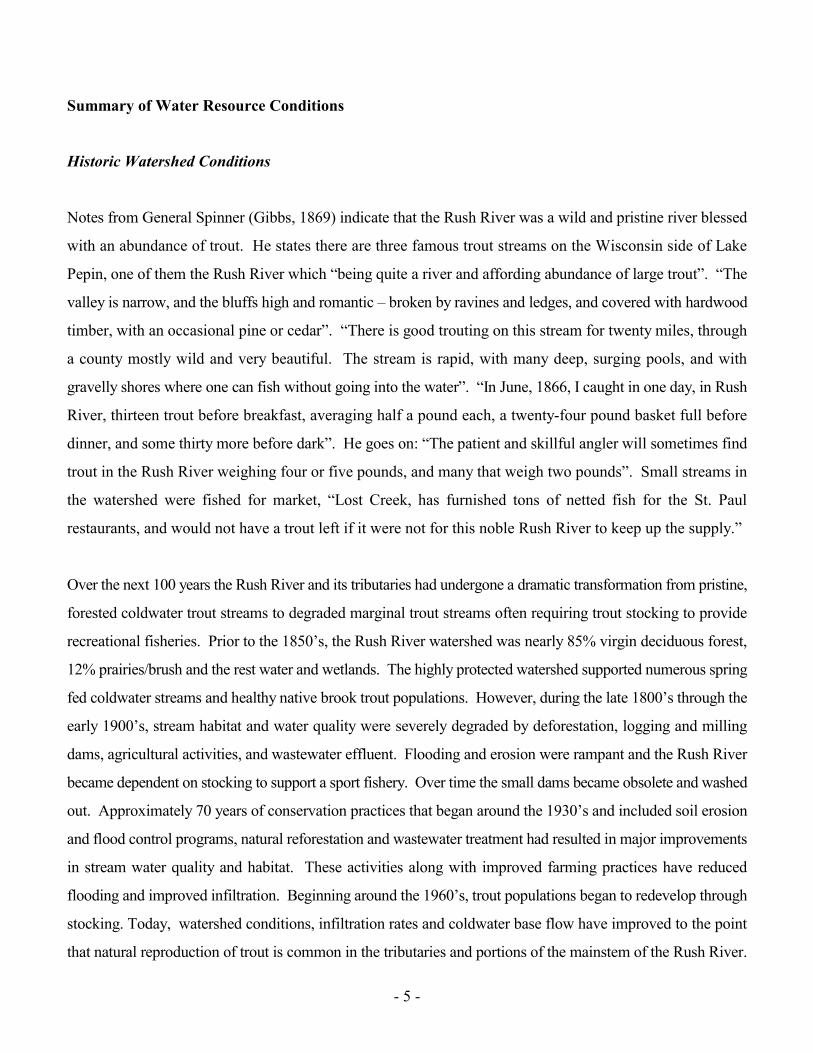
Watershed Description
The Rush River watershed is 289.6 square miles, with approximately 55.3 square miles (19.1%) in St. Croix
County, 186.2 square miles (64.3%) in Pierce County and 48.1 square miles (16.6%) in Pepin County (Figure
1). The watershed drains rolling agricultural and wooded areas with many of the tributaries originating in
steep coulees. The Rush River is the primary waterway with a base flow of approximately 130 cubic feet per
second near its mouth. Lost Creek (Pierce Co.) and Cave Creek are major tributaries to the Rush River while
Brush Creek, Crystal Springs and eight unnamed streams are minor tributaries. Lost Creek (Pepin Co.), Bogus
Creek and Pine Creek are small streams in the watershed that drain directly into Lake Pepin on the Mississippi
River.
The Rush River originates in south central St. Croix County. It flows south about 35 miles where it enters the
Mississippi River in southeastern Pierce County. Prior to this survey, the watershed included six Class II trout
waters encompassing 35.4 stream miles and one Class III trout water encompassing 0.5 stream miles (WDNR
1980). The majority of streams in the watershed, prior to this investigation were considered marginal coldwater
streams or warmwater forage streams.

- 4 -
- 5 -
Summary of Water Resource Conditions
Historic Watershed Conditions
Notes from General Spinner (Gibbs, 1869) indicate that the Rush River was a wild and pristine river blessed
with an abundance of trout. He states there are three famous trout streams on the Wisconsin side of Lake
Pepin, one of them the Rush River which “being quite a river and affording abundance of large trout”. “The
valley is narrow, and the bluffs high and romantic – broken by ravines and ledges, and covered with hardwood
timber, with an occasional pine or cedar”. “There is good trouting on this stream for twenty miles, through
a county mostly wild and very beautiful. The stream is rapid, with many deep, surging pools, and with
gravelly shores where one can fish without going into the water”. “In June, 1866, I caught in one day, in Rush
River, thirteen trout before breakfast, averaging half a pound each, a twenty-four pound basket full before
dinner, and some thirty more before dark”. He goes on: “The patient and skillful angler will sometimes find
trout in the Rush River weighing four or five pounds, and many that weigh two pounds”. Small streams in
the watershed were fished for market, “Lost Creek, has furnished tons of netted fish for the St. Paul
restaurants, and would not have a trout left if it were not for this noble Rush River to keep up the supply.”
Over the next 100 years the Rush River and its tributaries had undergone a dramatic transformation from pristine,
forested coldwater trout streams to degraded marginal trout streams often requiring trout stocking to provide
recreational fisheries. Prior to the 1850’s, the Rush River watershed was nearly 85% virgin deciduous forest,
12% prairies/brush and the rest water and wetlands. The highly protected watershed supported numerous spring
fed coldwater streams and healthy native brook trout populations. However, during the late 1800’s through the
early 1900’s, stream habitat and water quality were severely degraded by deforestation, logging and milling
dams, agricultural activities, and wastewater effluent. Flooding and erosion were rampant and the Rush River
became dependent on stocking to support a sport fishery. Over time the small dams became obsolete and washed
out. Approximately 70 years of conservation practices that began around the 1930’s and included soil erosion
and flood control programs, natural reforestation and wastewater treatment had resulted in major improvements
in stream water quality and habitat. These activities along with improved farming practices have reduced
flooding and improved infiltration. Beginning around the 1960’s, trout populations began to redevelop through
stocking. Today, watershed conditions, infiltration rates and coldwater base flow have improved to the point
that natural reproduction of trout is common in the tributaries and portions of the mainstem of the Rush River.

- 6 -
Current Watershed Problems
Water resource problems most common in the watershed today include: flashy stream flows, flooding and
stream bank erosion, extensive sand bed loads, poor habitat and degraded thermal regimes. Some over-
pasturing and ditching occurs on small streams in the watershed. Other problems in the watershed include
manure runoff, cropland and gully erosion. Lost Creek in Pepin County lacks fish passage due to the
extensive nature of man-made grade controls.
The primary causes of streambank erosion and bedload problems appear to be a combination of frequent flooding
and unstable sediment deposition in the valley floors. Repeated flooding, unstable banks and upland erosion
contribute to loss of fish cover through widening and stagnation of stream channels, sedimentation of pools and
riffles and elimination of bank cover. Wide, sluggish stream channels, loss of bank cover and low groundwater
recharge rates are primary factors contributing to elevated stream temperatures during summer months and
freezing temperatures during winter months. Spawning habitat is lost through sedimentation (filling-in) of
spawning substrate. This filling-in of spawning substrate in riffle areas impairs reproductive success of trout by
reducing inter-gravel flow which is necessary to maintain suitable temperature and oxygen conditions for eggs
and larval fish. Sedimentation of riffles also eliminates habitat for food organisms such as macroinvertebrates.
Many of the streams, including the main stem of the Rush River, have summer water temperatures that are above
optimal for some coldwater aquatic species, especially trout. Elevated summer water temperatures may be
caused by a number of factors including lack of stream shading, reduced infiltration and groundwater recharge,
and a relatively shallow, wide stream morphometry. The elimination of streambank vegetation in the watershed
reduces shading and increases solar radiation, which increases stream temperatures. Streambank erosion and
resulting sedimentation of the bottom results in wider, shallower stream reaches which allows increased solar
radiation and contributes to elevated summer water temperatures.
Current land use problems within the watershed continue to result in loss of habitat, sedimentation, and
degraded thermal regimes. The cumulative effect of these impacts continue to limit the suitability of many
portions of the Rush River watershed to support healthy, native coldwater aquatic communities.
- 7 -
New Threats to the Watershed
New threats to the watershed include urban growth, intensive farming, animal waste runoff and fishkills.
Rapid urban development in the headwaters will result in an increase of impervious surfaces and stormwater
runoff. Failure to address stormwater and inflitration may negatively alter stream temperature and habitat.
The expansion of large dairy operations and the associated increase in herd and forage supply farms bring
intensive farming practices back to the watershed. Lands taken out of production and placed in set-aside
programs are now being tilled again. Gullies allowed to heal are now used as pasture and are showing signs
of severe erosion. Nutrient and manure management present a challenge on soils and topography that is
highly subject to runoff. Failure to apply best mangement practices will lead to degraded water quality and
impaired sport fisheries. If done without regard to the health of the watershed, such intensive activity on the
watershed has the potential to reverse gains made during the past 50 –75 years of soil and water conservation
practices.
Overall Outlook
The overall outlook for stream quality in the Rush River Watershed is good. Many tributaries have
experienced major improvements in native brook trout reproduction. Portions of the Rush River have
significant natural reproduction and documented trout densities have never been higher than in recent history.
Trout densities have improved throughout the river to provide one of the best trout fishing resources in the
midwest and nation. Continued soil and water conservation practices, instream habitat improvement and
installation of innovative Best Management Practices (BMPs) will have positive effects on the water resources
of the Rush River Watershed. In addition, progessive management of stormwater, improved nutrient
management rules and a sincere effort by large scale farm developers to select suitable sites and design
environmentally friendly practices to limit runoff, inflitrate rainwater and protect water quality are essential
to the preservation of the unique water resources in the Rush River Watershed.
Methods
Monitoring activities for this comprehensive watershed survey were initiated in June 2000 and completed
- 8 -
October 2000. The following is a summary of the methods used to collect information for this survey.
Fish Surveys
Fish surveys conducted at 49 sites on 18 streams in the summer of 2000 found predominately coldwater
streams (Figure 1). Three trout species, (brook, brown and rainbow trout), eight warmwater game/panfish
species and 34 additional non-game fish species were found. Currently, brown trout dominate the coldwater
fishery in this watershed. White sucker, brook stickleback, blacknose dace, mottled sculpin and slimy sculpin
were the most common forage species.
Surveys were conducted at approximately one site per mile of permanent stream. Each site was 35 times the
mean stream width (MSW) in length. Single-run electrofishing surveys were conducted at each site to
inventory the sport and nongame fish communities. Within each survey station, all fish species were identified
and counted to determine the fish assemblage. This inventory was also used to calculate trout Catch per Unit
Effort (CPUE), a measure of density or fish abundance. Trout collected were marked and released. If more
than 20 trout > 4 inches per 100 meters were captured, a second electrofishing run was made. Based on the
information from these two runs, a population estimate was calculated using Bailey’s modification of the
Peterson Estimate (Ricker, 1975). A coldwater Index of Biotic Integrity (IBI) (Lyons, et al, 1996) was then
used to calculate the quality and health of the fish community.
On small streams, fish were collected using either one or two AbP-3 pulse DC backpack shockers. On larger
streams, fish were collected using either one or two 235 Volt, 5 Amp DC generator-type stream shockers with
2 to 3 electrodes per shocker. All fish collected were identified to species and counted, and all game and
panfish were measured to the nearest 0.1-inch.
Habitat Assessment
Habitat assessments were conducted at each fish survey site (Figure 1) following procedures outlined in
Simonson et al. (1994). The habitat segment of each station was 35 times the mean stream width (MSW).
- 9 -
The assessments included measurement of stream flow, width, depth, substrate composition, and streambank
characteristics. Stream flow was measured with a Swoffer 2100 flow meter. Fish habitat ratings were
determined for each site according to Simonson et al. (1994) using the appropriate score sheet for the stream’s
width (> 10 or < 10 meters).
Macroinvertebrates
Aquatic macroinvertebrates were collected at eight sites in the watershed, during October 2000 (Figure 1).
Sites were located on the main stem of the Rush River and on the larger tributaries. Samples were collected
with a D-frame net using methods outlined in Hilsenhoff (1982). The samples were preserved in 70% ethanol
and sent to UW-Stevens Point for sorting and identification. Results were reported using the Hilsenhoff
Biotic Index (HBI) which provides a relative measure of organic loading to a stream.
Temperature
HOBO (Onset Computer Corp.) recording thermometers were placed in streams at 22 sites in the watershed
(Table 1). The recording thermometers measured and recorded stream temperatures on a 30-minute interval
between June 13th and September 22nd, 2000. To increase stream coverage, maximum/minimum
thermometers were placed at 17 different locations and deployed for a period of five to six days during
August.
Results and Discussion
The results and discussion section will present a picture of the condition of the entire watershed and the main
stem as a whole. A detailed summary for each survey site is located in Table 1 and Appendices A-C.
- 10 -
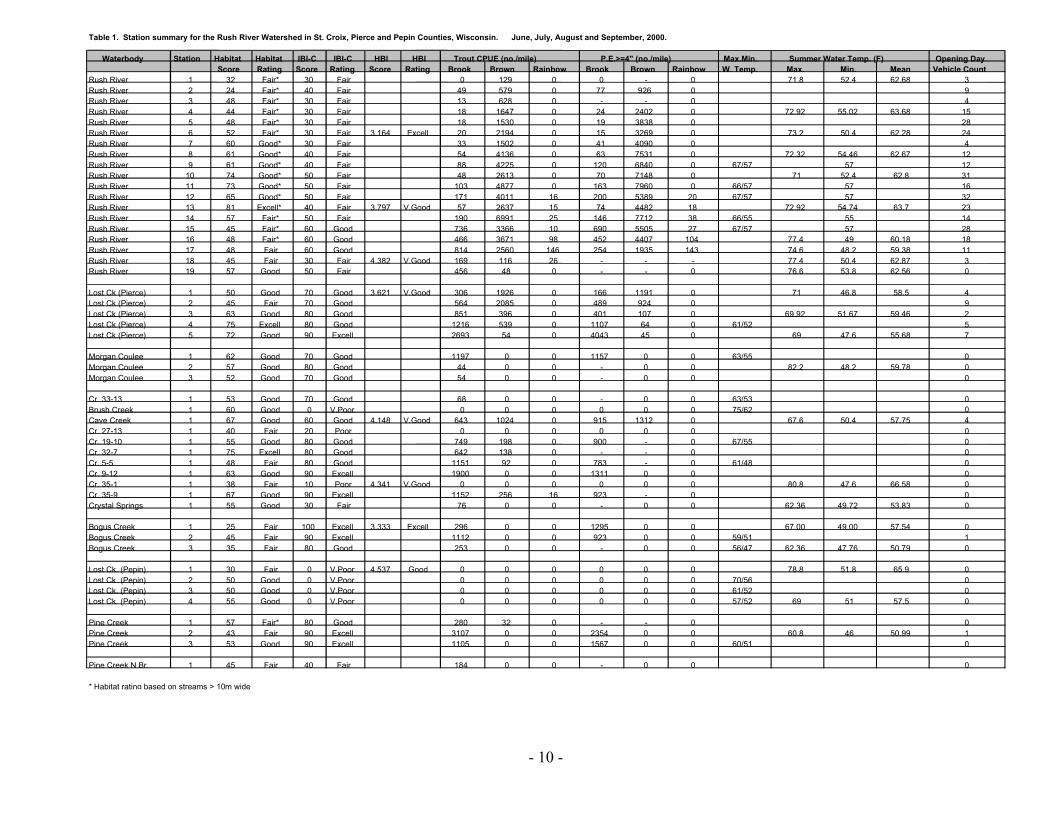
Table 1. Station summary for the Rush River Watershed in St. Croix, Pierce and Pepin Counties, Wisconsin. June, July, August and September, 2000.
Waterbody Station Habitat Habitat IBI-C IBI-C HBI HBI Trout CPUE (no./mile) P.E.>=4" (no./mile) Max.Min. Summer Water Temp. (F) Opening DayScore Rating Score Rating Score Rating Brook Brown Rainbow Brook Brown Rainbow W. Temp. Max. Min. Mean Vehicle Count
Rush River 1 32 Fair* 30 Fair 0 129 0 0 - 0 71.8 52.4 62.68 3Rush River 2 24 Fair* 40 Fair 49 579 0 77 926 0 9Rush River 3 48 Fair* 30 Fair 13 628 0 - - 0 4Rush River 4 44 Fair* 30 Fair 18 1647 0 24 2402 0 72.92 55.02 63.68 15Rush River 5 48 Fair* 30 Fair 18 1530 0 19 3838 0 28Rush River 6 52 Fair* 30 Fair 3.164 Excell 20 2194 0 15 3269 0 73.2 50.4 62.28 24Rush River 7 60 Good* 30 Fair 33 1502 0 41 4090 0 4Rush River 8 61 Good* 40 Fair 54 4136 0 63 7531 0 72.32 54.46 62.67 12Rush River 9 61 Good* 40 Fair 88 4225 0 120 6840 0 67/57 57 12Rush River 10 74 Good* 50 Fair 48 2613 0 70 7148 0 71 52.4 62.8 31Rush River 11 73 Good* 50 Fair 103 4877 0 163 7960 0 66/57 57 16Rush River 12 65 Good* 50 Fair 171 4011 16 200 5389 20 67/57 57 32Rush River 13 81 Excell* 40 Fair 3.797 V.Good 57 2637 15 74 4482 18 72.92 54.74 63.7 23Rush River 14 57 Fair* 50 Fair 190 6991 25 146 7712 38 66/55 55 14Rush River 15 45 Fair* 60 Good 736 3366 10 690 5505 27 67/57 57 28Rush River 16 48 Fair* 60 Good 466 3671 98 452 4407 104 77.4 49 60.18 18Rush River 17 48 Fair 60 Good 814 2560 146 254 1935 143 74.6 48.2 59.38 11Rush River 18 45 Fair 30 Fair 4.382 V.Good 169 116 26 - - - 77.4 50.4 62.87 3Rush River 19 57 Good 50 Fair 456 48 0 - - 0 76.6 53.8 62.56 0
Lost Ck (Pierce) 1 50 Good 70 Good 3.621 V.Good 306 1926 0 166 1191 0 71 46.8 58.5 4Lost Ck (Pierce) 2 45 Fair 70 Good 564 2085 0 489 924 0 9Lost Ck (Pierce) 3 63 Good 80 Good 851 396 0 401 107 0 69.92 51.67 59.46 2Lost Ck (Pierce) 4 75 Excell 80 Good 1216 539 0 1107 64 0 61/52 5Lost Ck (Pierce) 5 72 Good 90 Excell 2693 54 0 4043 45 0 69 47.6 55.68 7
Morgan Coulee 1 62 Good 70 Good 1197 0 0 1157 0 0 63/55 0Morgan Coulee 2 57 Good 80 Good 44 0 0 - 0 0 82.2 48.2 59.78 0Morgan Coulee 3 52 Good 70 Good 54 0 0 - 0 0 0
Cr. 33-13 1 53 Good 70 Good 68 0 0 - 0 0 63/53 0Brush Creek 1 60 Good 0 V.Poor 0 0 0 0 0 0 75/62 0Cave Creek 1 67 Good 60 Good 4.148 V.Good 643 1024 0 915 1312 0 67.6 50.4 57.75 4Cr. 27-13 1 40 Fair 20 Poor 0 0 0 0 0 0 0Cr. 19-10 1 55 Good 80 Good 749 198 0 900 - 0 67/55 0Cr. 32-7 1 75 Excell 80 Good 642 138 0 - - 0 0Cr. 5-5 1 48 Fair 80 Good 1151 92 0 783 - 0 61/48 0Cr. 9-12 1 63 Good 90 Excell 1900 0 0 1311 0 0 0Cr. 35-1 1 38 Fair 10 Poor 4.341 V.Good 0 0 0 0 0 0 80.8 47.6 66.58 0Cr. 35-9 1 67 Good 90 Excell 1152 256 16 923 - 0 0Crystal Springs 1 55 Good 30 Fair 76 0 0 - 0 0 62.36 49.72 53.83 0
Bogus Creek 1 25 Fair 100 Excell 3.333 Excell 296 0 0 1295 0 0 67.00 49.00 57.54 0Bogus Creek 2 45 Fair 90 Excell 1112 0 0 923 0 0 59/51 1Bogus Creek 3 35 Fair 80 Good 253 0 0 - 0 0 56/47 62.36 47.76 50.79 0
Lost Ck. (Pepin) 1 30 Fair 0 V.Poor 4.537 Good 0 0 0 0 0 0 78.8 51.8 65.9 0Lost Ck. (Pepin) 2 50 Good 0 V.Poor 0 0 0 0 0 0 70/56 0Lost Ck. (Pepin) 3 50 Good 0 V.Poor 0 0 0 0 0 0 61/52 0Lost Ck. (Pepin) 4 55 Good 0 V.Poor 0 0 0 0 0 0 57/52 69 51 57.5 0
Pine Creek 1 57 Fair* 80 Good 280 32 0 - - 0 0Pine Creek 2 43 Fair 90 Excell 3107 0 0 2354 0 0 60.8 46 50.99 1Pine Creek 3 53 Good 90 Excell 1105 0 0 1567 0 0 60/51 0
Pine Creek N Br. 1 45 Fair 40 Fair 184 0 0 - 0 0 0
* Habitat rating based on streams > 10m wide
- 11 -
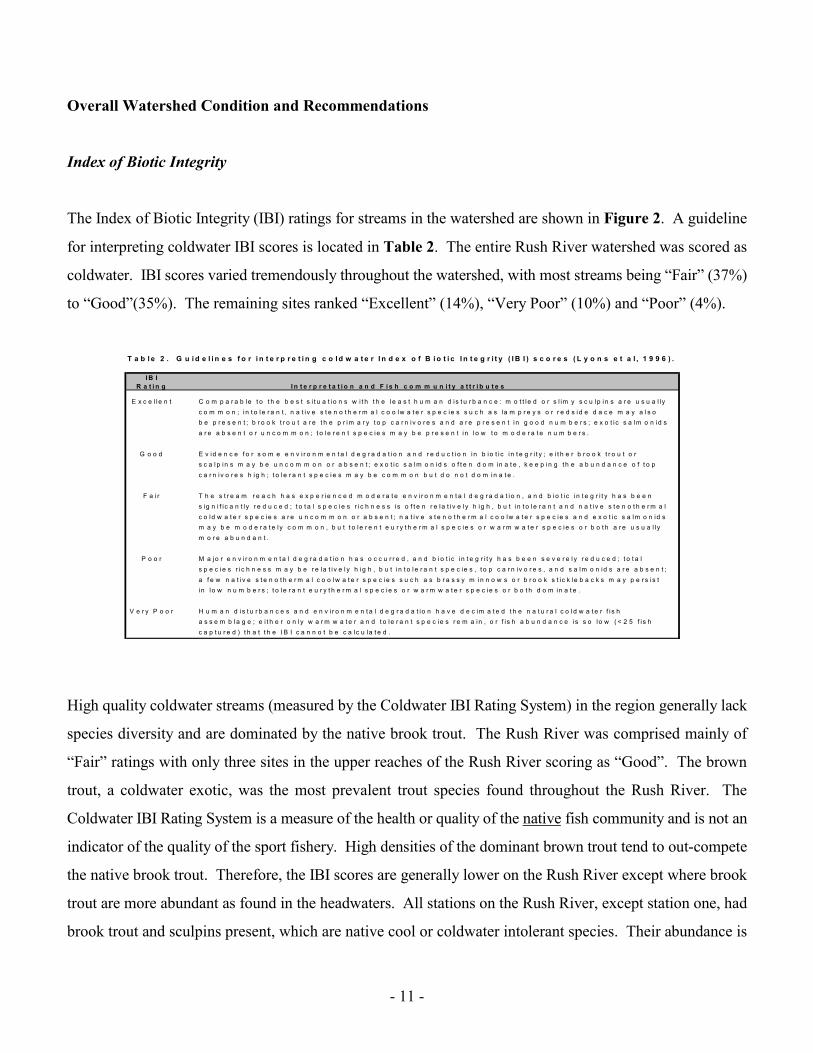
Overall Watershed Condition and Recommendations
Index of Biotic Integrity
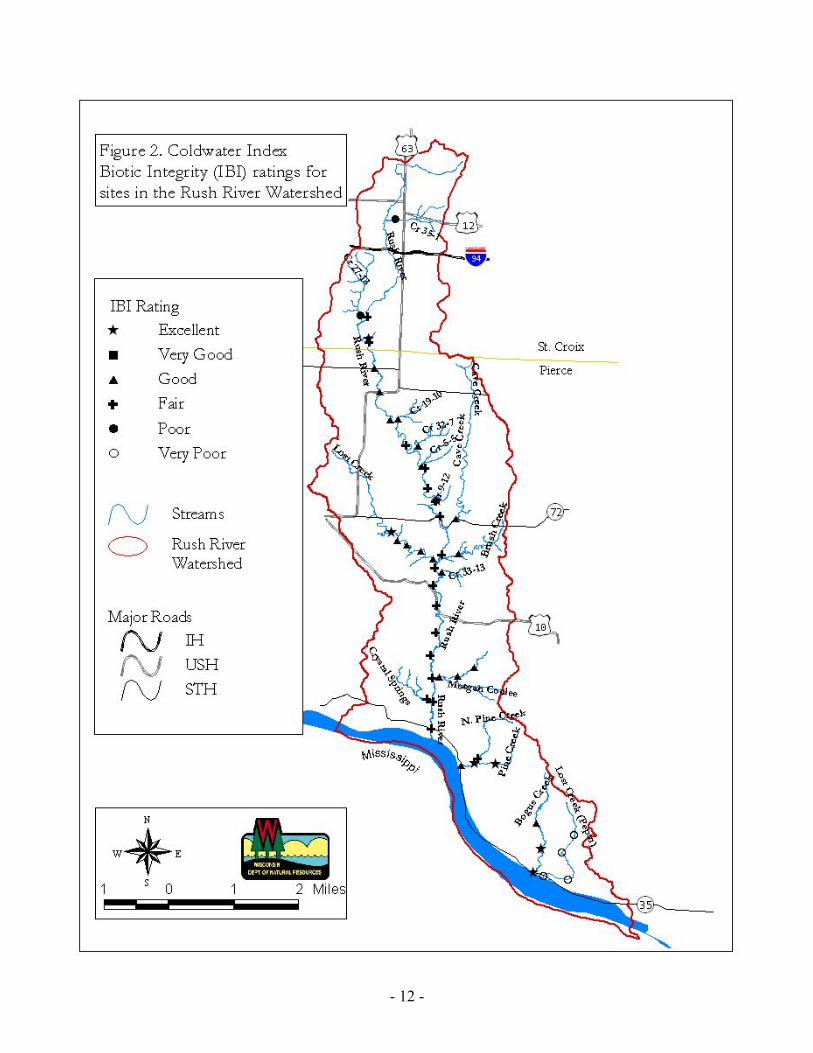
The Index of Biotic Integrity (IBI) ratings for streams in the watershed are shown in Figure 2. A guideline
for interpreting coldwater IBI scores is located in Table 2. The entire Rush River watershed was scored as
coldwater. IBI scores varied tremendously throughout the watershed, with most streams being “Fair” (37%)
to “Good”(35%). The remaining sites ranked “Excellent” (14%), “Very Poor” (10%) and “Poor” (4%).
High quality coldwater streams (measured by the Coldwater IBI Rating System) in the region generally lack
species diversity and are dominated by the native brook trout. The Rush River was comprised mainly of
“Fair” ratings with only three sites in the upper reaches of the Rush River scoring as “Good”. The brown
trout, a coldwater exotic, was the most prevalent trout species found throughout the Rush River. The
Coldwater IBI Rating System is a measure of the health or quality of the native fish community and is not an
indicator of the quality of the sport fishery. High densities of the dominant brown trout tend to out-compete
the native brook trout. Therefore, the IBI scores are generally lower on the Rush River except where brook
trout are more abundant as found in the headwaters. All stations on the Rush River, except station one, had
brook trout and sculpins present, which are native cool or coldwater intolerant species. Their abundance is
T a b l e 2 . G u i d e l i n e s f o r i n t e r p r e t i n g c o l d w a t e r I n d e x o f B i o t i c I n t e g r i t y ( I B I ) s c o r e s ( L y o n s e t a l , 1 9 9 6 ) .
I B IR a t i n g I n t e r p r e t a t i o n a n d F i s h c o m m u n i t y a t t r i b u t e s
E x c e l le n t C o m p a r a b le t o t h e b e s t s i t u a t io n s w i t h t h e l e a s t h u m a n d is t u r b a n c e : m o t t le d o r s l im y s c u lp i n s a r e u s u a l l yc o m m o n ; in t o l e r a n t , n a t i v e s t e n o t h e r m a l c o o lw a t e r s p e c ie s s u c h a s la m p r e y s o r r e d s i d e d a c e m a y a l s ob e p r e s e n t ; b r o o k t r o u t a r e t h e p r im a r y t o p c a r n iv o r e s a n d a r e p r e s e n t in g o o d n u m b e r s ; e x o t i c s a lm o n id sa r e a b s e n t o r u n c o m m o n ; t o le r e n t s p e c ie s m a y b e p r e s e n t in lo w t o m o d e r a t e n u m b e r s .
G o o d E v id e n c e f o r s o m e e n v i r o n m e n t a l d e g r a d a t io n a n d r e d u c t i o n in b io t i c in t e g r i t y ; e i t h e r b r o o k t r o u t o rs c a l p in s m a y b e u n c o m m o n o r a b s e n t ; e x o t i c s a lm o n id s o f t e n d o m in a t e , k e e p in g t h e a b u n d a n c e o f t o pc a r n iv o r e s h ig h ; t o le r a n t s p e c i e s m a y b e c o m m o n b u t d o n o t d o m in a t e .
F a i r T h e s t r e a m r e a c h h a s e x p e r i e n c e d m o d e r a t e e n v i r o n m e n t a l d e g r a d a t i o n , a n d b io t i c i n t e g r i t y h a s b e e ns ig n i f i c a n t l y r e d u c e d ; t o t a l s p e c i e s r i c h n e s s i s o f t e n r e la t i v e ly h ig h , b u t i n t o le r a n t a n d n a t i v e s t e n o t h e r m a lc o ld w a t e r s p e c ie s a r e u n c o m m o n o r a b s e n t ; n a t i v e s t e n o t h e r m a l c o o lw a t e r s p e c ie s a n d e x o t i c s a lm o n id sm a y b e m o d e r a t e ly c o m m o n , b u t t o le r e n t e u r y t h e r m a l s p e c ie s o r w a r m w a t e r s p e c ie s o r b o t h a r e u s u a l l ym o r e a b u n d a n t .
P o o r M a jo r e n v i r o n m e n t a l d e g r a d a t io n h a s o c c u r r e d , a n d b i o t i c in t e g r i t y h a s b e e n s e v e r e l y r e d u c e d ; t o t a ls p e c i e s r i c h n e s s m a y b e r e la t i v e l y h ig h , b u t in t o l e r a n t s p e c ie s , t o p c a r n iv o r e s , a n d s a lm o n id s a r e a b s e n t ;a f e w n a t i v e s t e n o t h e r m a l c o o l w a t e r s p e c ie s s u c h a s b r a s s y m i n n o w s o r b r o o k s t i c k le b a c k s m a y p e r s is tin lo w n u m b e r s ; t o le r a n t e u r y t h e r m a l s p e c ie s o r w a r m w a t e r s p e c ie s o r b o t h d o m in a t e .
V e r y P o o r H u m a n d i s t u r b a n c e s a n d e n v i r o n m e n t a l d e g r a d a t io n h a v e d e c im a t e d t h e n a t u r a l c o l d w a t e r f i s ha s s e m b l a g e ; e i t h e r o n ly w a r m w a t e r a n d t o le r a n t s p e c ie s r e m a in , o r f i s h a b u n d a n c e i s s o lo w ( < 2 5 f i s hc a p t u r e d ) t h a t t h e I B I c a n n o t b e c a lc u la t e d .
- 12 -

- 13 -
heavily dependent on ground water. Overall, the eurothermal (a species adapted to a wide range of water
temperatures) minnows were abundant throughout the Rush River with a combination of dominant species
such as the blacknose dace and white sucker being most abundant. Intolerant rainbow darters and other
eurotherms such as longnose dace and brook sticklebacks were also abundant.
Bogus Creek and Pine Creek each had two of three IBI sites score as “Excellent” and the third site as “Good”.
These streams consist mainly of self-sustaining brook trout populations with few other fish species or numbers
present. A few brown trout and/or eurothermal species were found near the mouth of Pine and Bogus Creeks
resulting in a “Good” ranking. Lost Creek (Pierce County) had ratings of “Good” on all its sites except in the
headwaters where IBI ratings were “Excellent”. Lost Creek had a mixture of brown and brook trout within
its waters. The two sites near the mouth were dominated by the brown trout while the other three sites, near
the headwaters, were dominated by brook trout. The gradual change from brown trout dominance in the
downstream stretches to brook trout dominance in the headwaters resulted in the change from “Good” to
“Excellent” IBI ratings. Cave Creek was rated “Good”, however significant brown trout populations
negatively influenced the ranking. Morgan Coulee only rated “Good” because very few native intolerant
coldwater species (brook trout) were present. Lost Creek (Pepin County) had the lowest IBI rating (“Very
Poor”) of the major tributaries in the watershed. Only four fish species were sampled and the fish sampled
were predominantly tolerant warmwater species such as fathead minnow and creek chubs.
The IBI ratings were quite variable among the minor tributaries. Creeks 27-13 and 35-1 ranked “Poor” while
Brush Creek ranked “Very Poor”. These streams were dominated by tolerant eurotherms. Crystal Springs
and North Branch of Pine Creek ranked “Fair”. These streams had a few brook trout and other coolwater
species, however tolerant eurotherms prevailed. Creeks 33-13, 19-10, 32-7 and 5-5 all ranked “Good”. These
streams primarily contained brook trout and sculpins, however their numbers were either low or brown trout
were present. Creeks 9-12 and 35-9 ranked “Excellent”. These streams were dominated by brook trout.
Overall, the integrity of the coldwater fish community is improving. Native self sustaining coldwater fish
populations appear to be recovering primarily in tributary streams where habitat degradation and thermal
impacts over the past 100 or more years have created a shift from intolerant coldwater species to tolerant cool
and warmwater species. As habitat and thermal conditions improve, we are observing a shift back toward
intolerant coldwater species. The presence of self sustaining brown trout and the desire to preserve brown
- 14 -
trout angling in the Rush River will limit the ability of those streams to regain full native fish community
integrity.
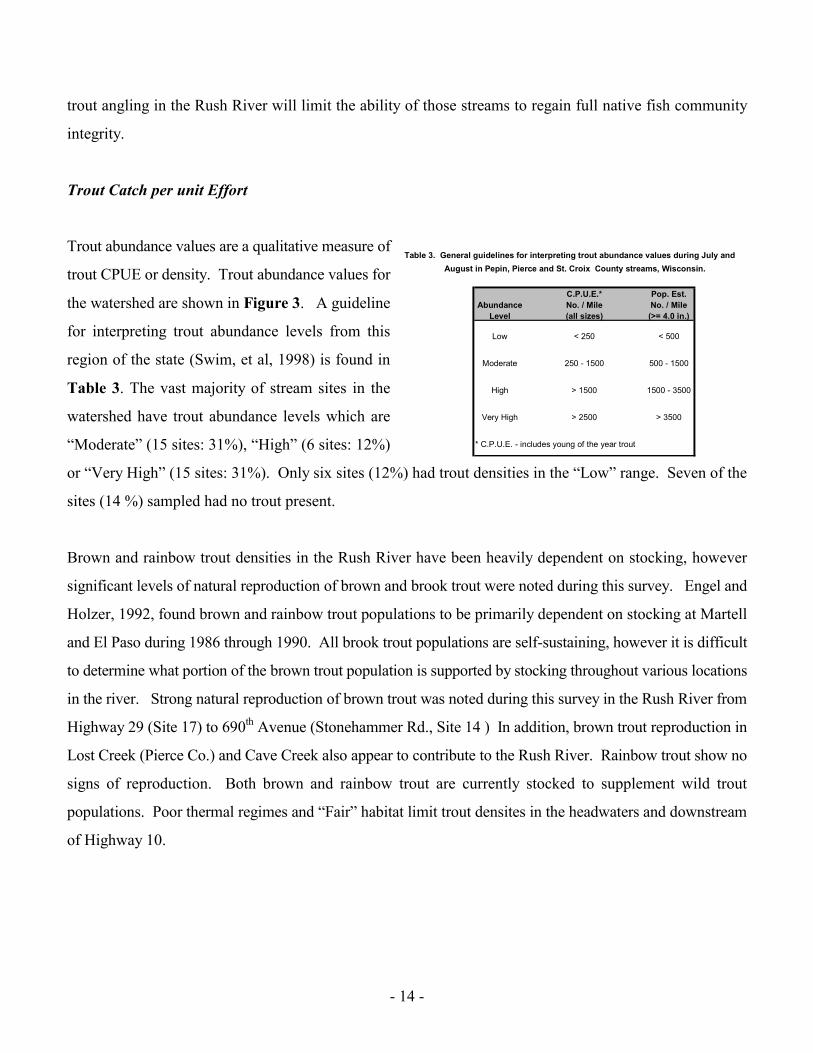
Trout Catch per unit Effort
Trout abundance values are a qualitative measure of
trout CPUE or density. Trout abundance values for
the watershed are shown in Figure 3. A guideline
for interpreting trout abundance levels from this
region of the state (Swim, et al, 1998) is found in
Table 3. The vast majority of stream sites in the
watershed have trout abundance levels which are
“Moderate” (15 sites: 31%), “High” (6 sites: 12%)
or “Very High” (15 sites: 31%). Only six sites (12%) had trout densities in the “Low” range. Seven of the
sites (14 %) sampled had no trout present.
Brown and rainbow trout densities in the Rush River have been heavily dependent on stocking, however
significant levels of natural reproduction of brown and brook trout were noted during this survey. Engel and
Holzer, 1992, found brown and rainbow trout populations to be primarily dependent on stocking at Martell
and El Paso during 1986 through 1990. All brook trout populations are self-sustaining, however it is difficult
to determine what portion of the brown trout population is supported by stocking throughout various locations
in the river. Strong natural reproduction of brown trout was noted during this survey in the Rush River from
Highway 29 (Site 17) to 690th Avenue (Stonehammer Rd., Site 14 ) In addition, brown trout reproduction in
Lost Creek (Pierce Co.) and Cave Creek also appear to contribute to the Rush River. Rainbow trout show no
signs of reproduction. Both brown and rainbow trout are currently stocked to supplement wild trout
populations. Poor thermal regimes and “Fair” habitat limit trout densites in the headwaters and downstream
of Highway 10.
Table 3. General guidelines for interpreting trout abundance values during July and August in Pepin, Pierce and St. Croix County streams, Wisconsin.
C.P.U.E.* Pop. Est.Abundance No. / Mile No. / Mile
Level (all sizes) (>= 4.0 in.)
Low < 250 < 500
Moderate 250 - 1500 500 - 1500
High > 1500 1500 - 3500
Very High > 2500 > 3500
* C.P.U.E. - includes young of the year trout

- 15 -
10.
- 16 -
Lost Creek (Pierce County) and Cave Creek have strong brook and brown trout reproduction, which is
reflected in overall densities being “Very High”, however both streams are extremely wide and shallow, lack
pools and over-head cover for adult trout. Most small, tributary streams entering the Rush River contain high
quality native brook trout populations. Crystal Springs and Creek 33-13 have “Low”densities which may be
related to habitat or temperature problems. Creek 35-1 is a warmwater stream and Brush Creek becomes
intermittent by late summer. Both Bogus and Pine Creek have “Moderate “ densities of native brook trout,
and both would benefit from improved habitat conditions. Lost Creek (Pepin County) contained no trout.
Extensive grade controls prevent any upstream passage of brook trout. The ability of this stream to support
trout may be borderline at this time.
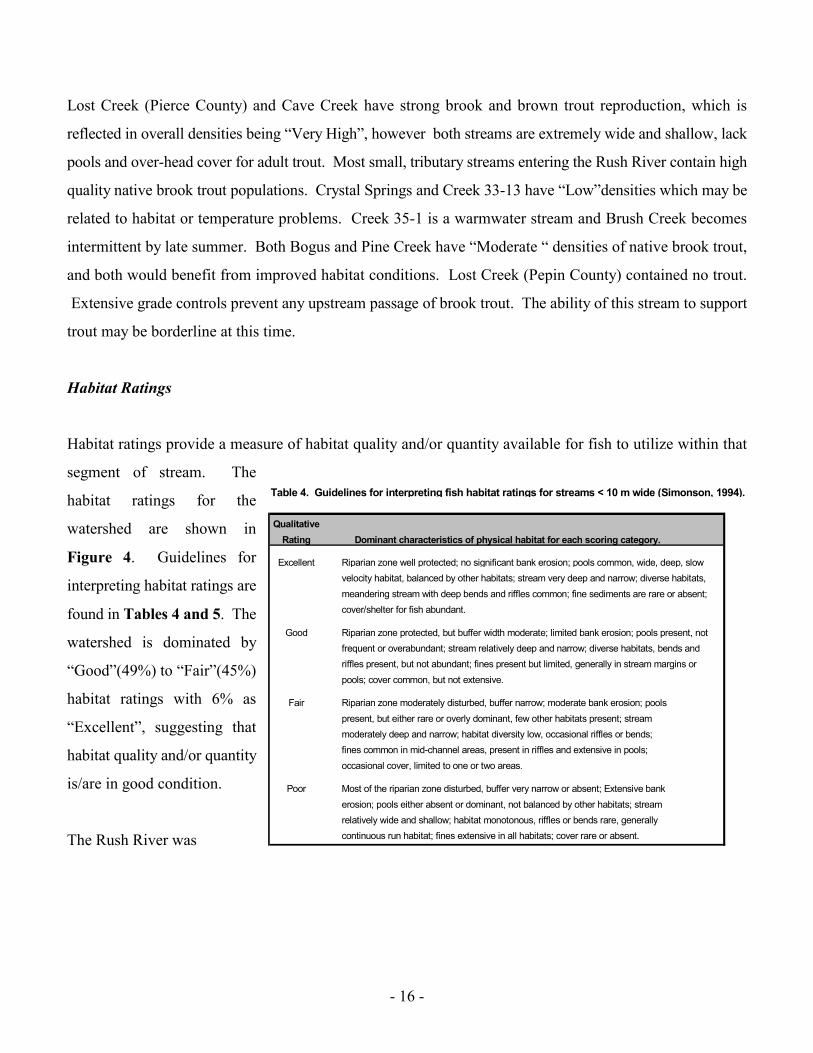
Habitat Ratings
Habitat ratings provide a measure of habitat quality and/or quantity available for fish to utilize within that
segment of stream. The
habitat ratings for the
watershed are shown in
Figure 4. Guidelines for
interpreting habitat ratings are
found in Tables 4 and 5. The
watershed is dominated by
“Good”(49%) to “Fair”(45%)
habitat ratings with 6% as
“Excellent”, suggesting that
habitat quality and/or quantity
is/are in good condition.
The Rush River was
Table 4. Guidelines for interpreting fish habitat ratings for streams < 10 m wide (Simonson, 1994).
QualitativeRating Dominant characteristics of physical habitat for each scoring category.
Excellent Riparian zone well protected; no significant bank erosion; pools common, wide, deep, slowvelocity habitat, balanced by other habitats; stream very deep and narrow; diverse habitats,meandering stream with deep bends and riffles common; fine sediments are rare or absent;cover/shelter for fish abundant.
Good Riparian zone protected, but buffer width moderate; limited bank erosion; pools present, notfrequent or overabundant; stream relatively deep and narrow; diverse habitats, bends andriffles present, but not abundant; fines present but limited, generally in stream margins or pools; cover common, but not extensive.
Fair Riparian zone moderately disturbed, buffer narrow; moderate bank erosion; pools present, but either rare or overly dominant, few other habitats present; streammoderately deep and narrow; habitat diversity low, occasional riffles or bends; fines common in mid-channel areas, present in riffles and extensive in pools; occasional cover, limited to one or two areas.
Poor Most of the riparian zone disturbed, buffer very narrow or absent; Extensive bankerosion; pools either absent or dominant, not balanced by other habitats; stream relatively wide and shallow; habitat monotonous, riffles or bends rare, generally continuous run habitat; fines extensive in all habitats; cover rare or absent.

- 17 -

- 18 -
dominated by “Fair” (58 %) habitat
ratings. “Good” ratings were found at
at 37% of the sites and “Excellent”
ratings at 5%. The “Fair” sites were
located at the lower and upper
portions of the Rush River. The
“Good” and “Excellent” sites were in
the middle reaches of the Rush River.
In the middle reaches, the banks have limited erosion and the river is deep with diverse habitat. It has many
riffles and meanders with deep bends and good cover for fish to hide. Downstream of STH 10 bank erosion
is more prevalent, the river has less fish habitat, fewer bends and riffles, and the substrate is more sandy. The
headwater region contains many long, slow moving pools with limited habitat.
Lost Creek (Pierce County) had 60% of the sites ranked as “Good”, 20% as “Excellent” and 20% as “Fair”.
Lost Creek suffers from the lack of pools and adult fish habitat. Violent floods frequently alter the streambed
and coarse, mobile substrates limit the scouring of pools. Cave Creek which ranked “Good” experiences
similar habitat problems throughout much of its course. Crystal Springs and Creek 33-13 lack fish cover and
have excessive fine sediments, but habitat scores ranked “Good”. The lower end of Crystal Springs appears
to have been ditched. Morgan Coulee also ranked “Good”, but it was ditched in the lower reaches and fine
sediments plague its headwaters. Brush Creek offers little fish cover due primarily to a lack of flow. Creek
35-1 had “Fair” habitat, was 100 percent ditched, and lacked pool area and fish habitat. Creeks 32-7, 9-12
and 35-9 had sufficient buffers and “Good” to “Excellent” habitat scores. Creeks 19-10 and 5-5 ranked
“Good” to “Fair” respectively. The habitat is somewhat impacted by pasturing. Creek 27-13 is also pastured
and ditched resulting in a “Fair” habitat score.
All sites on Bogus Creek ranked “Fair”, limited fish cover and pool area along with abundant fine sediments
impact habitat values. Habitat ranked “Fair to Good” on Pine Creek and its tributary, North Branch. Heavy
grazing and bank erosion contribute fine sediments to the stream in the valley floor negatively impacting
habitat. The headwaters of Pine Creek are protected by a wooded buffer. Lost Creek (Pepin Co.) ranked
“Fair” to “Good”, however it has been ditched for much of its length, lacks pool area, cover for fish and often
has excessive fine sediment loads.
Table 5. Guidelines for interpreting fish habitat ratings for streams > 10 m wide (Simonson, 1994).
QualitativeRating Dominant characteristics of physical habitat for each scoring category.
Excellent No significant bank erosion; stream very deep; diverse habitats, meandering stream withdeep bends and riffles common; extensive rocky substrate; cover/shelter for fish abundant.
Good Limited bank erosion; stream relatively deep; diverse habitats, bends and riffles present,but not abundant; moderate rocky substrate; cover common, but not extensive.
Fair Moderate bank erosion; stream moderately deep; habitat diversity low, occasional riffles or bends; limited rocky substrate; occasional cover, limited to one or two areas.
Poor Extensive bank erosion; stream relatively shallow; habitat monotonous, riffles or bendsrare, generally continuous run habitat; rocky substrate uncommon; cover rare or absent.
- 19 -
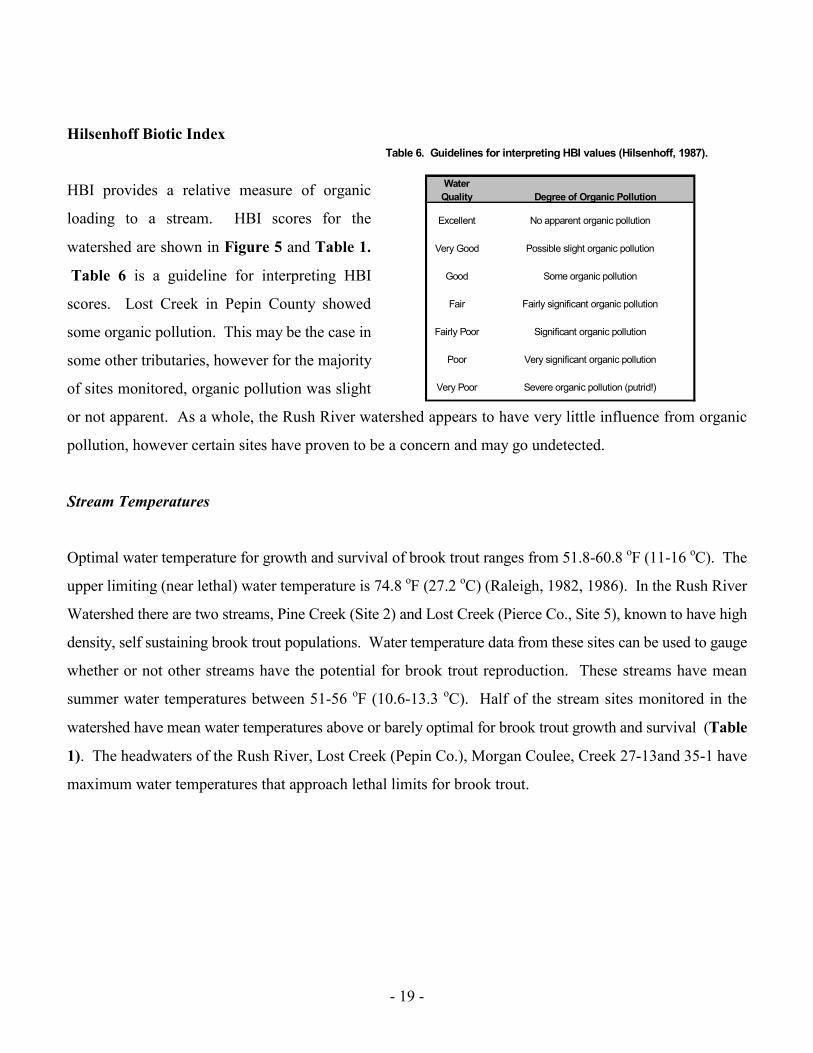
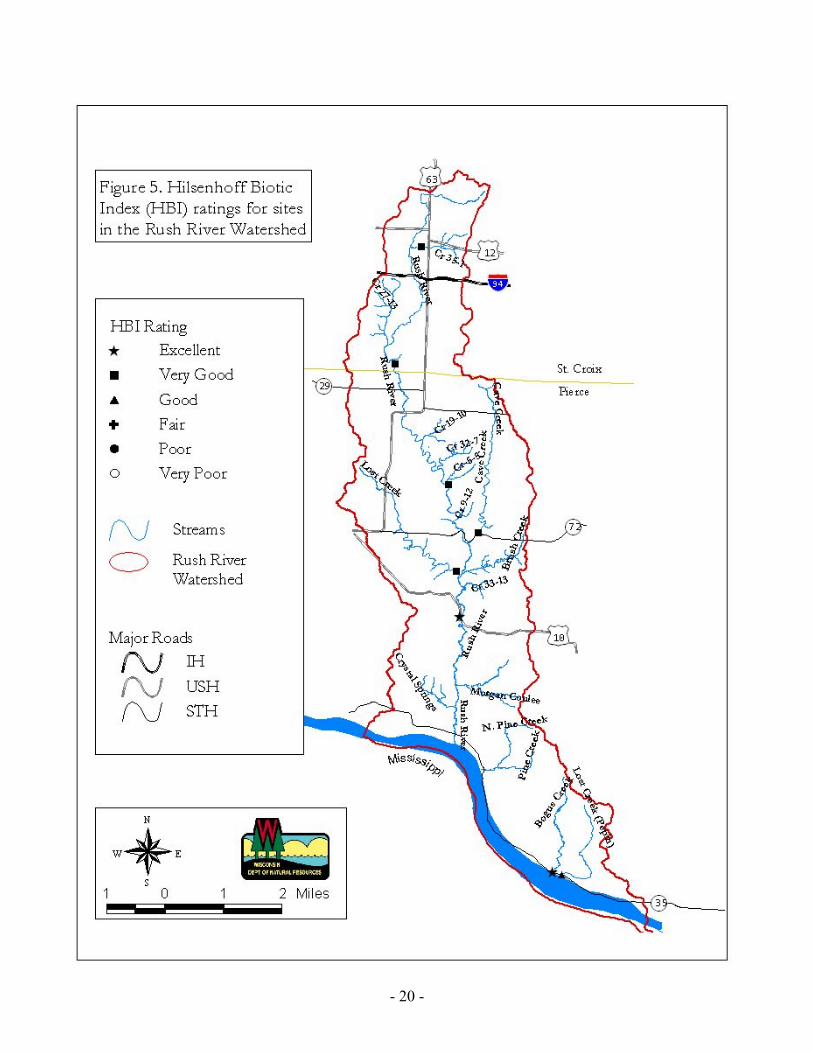
Hilsenhoff Biotic Index
HBI provides a relative measure of organic
loading to a stream. HBI scores for the
watershed are shown in Figure 5 and Table 1.
Table 6 is a guideline for interpreting HBI
scores. Lost Creek in Pepin County showed
some organic pollution. This may be the case in
some other tributaries, however for the majority
of sites monitored, organic pollution was slight
or not apparent. As a whole, the Rush River watershed appears to have very little influence from organic
pollution, however certain sites have proven to be a concern and may go undetected.
Stream Temperatures
Optimal water temperature for growth and survival of brook trout ranges from 51.8-60.8 oF (11-16 oC). The
upper limiting (near lethal) water temperature is 74.8 oF (27.2 oC) (Raleigh, 1982, 1986). In the Rush River
Watershed there are two streams, Pine Creek (Site 2) and Lost Creek (Pierce Co., Site 5), known to have high
density, self sustaining brook trout populations. Water temperature data from these sites can be used to gauge
whether or not other streams have the potential for brook trout reproduction. These streams have mean
summer water temperatures between 51-56 oF (10.6-13.3 oC). Half of the stream sites monitored in the
watershed have mean water temperatures above or barely optimal for brook trout growth and survival (Table
1). The headwaters of the Rush River, Lost Creek (Pepin Co.), Morgan Coulee, Creek 27-13and 35-1 have
maximum water temperatures that approach lethal limits for brook trout.
Table 6. Guidelines for interpreting HBI values (Hilsenhoff, 1987).
WaterQuality Degree of Organic Pollution
Excellent No apparent organic pollution
Very Good Possible slight organic pollution
Good Some organic pollution
Fair Fairly significant organic pollution
Fairly Poor Significant organic pollution
Poor Very significant organic pollution
Very Poor Severe organic pollution (putrid!)
- 20 -
- 21 -
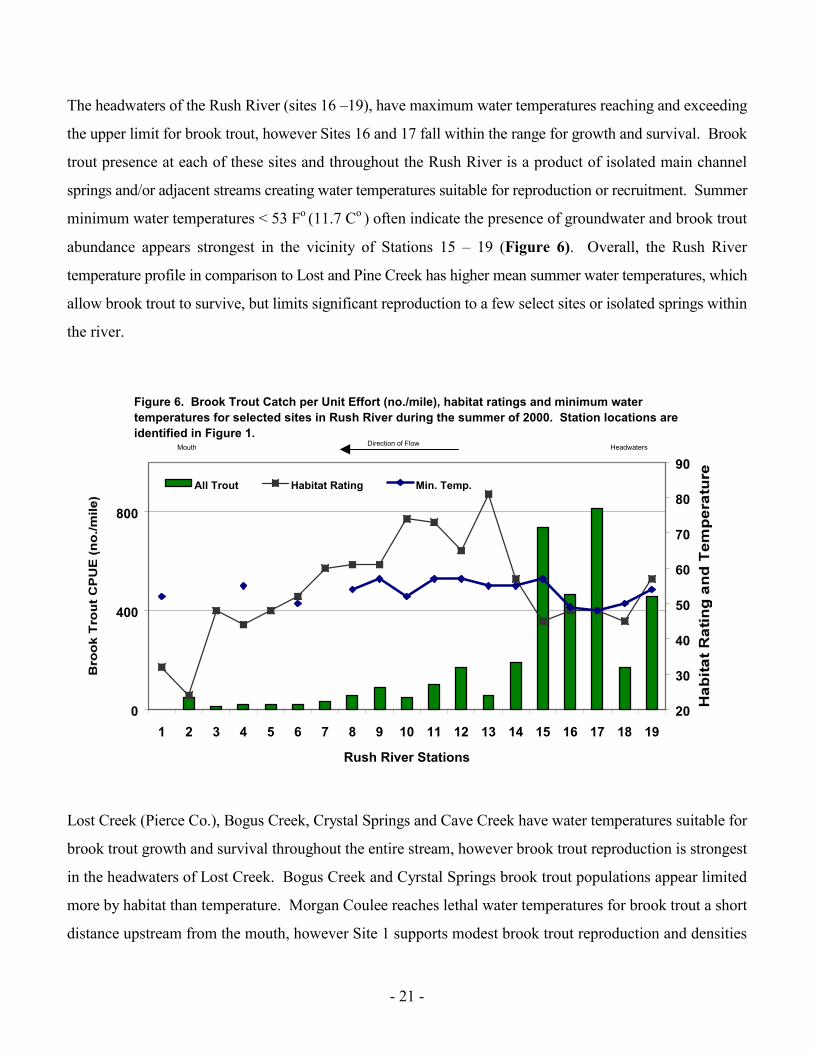
The headwaters of the Rush River (sites 16 –19), have maximum water temperatures reaching and exceeding
the upper limit for brook trout, however Sites 16 and 17 fall within the range for growth and survival. Brook
trout presence at each of these sites and throughout the Rush River is a product of isolated main channel
springs and/or adjacent streams creating water temperatures suitable for reproduction or recruitment. Summer
minimum water temperatures < 53 Fo (11.7 Co ) often indicate the presence of groundwater and brook trout
abundance appears strongest in the vicinity of Stations 15 – 19 (Figure 6). Overall, the Rush River
temperature profile in comparison to Lost and Pine Creek has higher mean summer water temperatures, which
allow brook trout to survive, but limits significant reproduction to a few select sites or isolated springs within
the river.
Lost Creek (Pierce Co.), Bogus Creek, Crystal Springs and Cave Creek have water temperatures suitable for
brook trout growth and survival throughout the entire stream, however brook trout reproduction is strongest
in the headwaters of Lost Creek. Bogus Creek and Cyrstal Springs brook trout populations appear limited
more by habitat than temperature. Morgan Coulee reaches lethal water temperatures for brook trout a short
distance upstream from the mouth, however Site 1 supports modest brook trout reproduction and densities
0
400
800
1 2 3 4 5 6 7 8 9 10 11 12 13 14 15 16 17 18 19
Rush River Stations
20
30
40
50
60
70
80
90All Trout Habitat Rating Min. Temp.
Figure 6. Brook Trout Catch per Unit Effort (no./mile), habitat ratings and minimum water temperatures for selected sites in Rush River during the summer of 2000. Station locations are identified in Figure 1.
Direction of FlowMouth Headwaters
- 22 -
primarily due to heavy spring activity. Cardinal Springs enters Morgan Coulee in this area and provides
significant amounts of coldwater to the stream.
Creek 35-1, Brush Creek and Creek 27-13 have high summer water temperatures and warmwater fish
assemblages. Lost Creek (Pepin Co.) has water temperatures suitable for brook trout growth and survival,
however brook trout are not found there. Temperatures suitable for reproduction may be limited to the
headwaters. Poor habitat and numerous grade control structures prevent any fish passage via the Mississippi
River. The majority of the small unnamed tributaries have water temperatures suitable for brook trout
growth, survival and reproduction. Mean summer water temperatures in the low to mid 50’s oF (10-14 oC)
are common.
Optimal water temperatures for growth and survival for brown trout range from 53.6-66.2 oF (12-19 oC).
Their upper limiting (near lethal) temperature is 81 oF (27.2 oC). According to the mean temperatures found
in the watershed the majority of the waters are optimal for brown trout growth and survival. Bogus and Pine
Creek and a number of unnamed tributaries have water temperatures colder than optimal for brown trout
growth and survival. These cold streams have either no or low densities of brown trout and are dominated
primarily by brook trout populations. Creek 35-1 (Baldwin Creek) and the headwaters of Morgan Coulee
recorded temperatures reaching and exceeding the upper limiting temperature for brown trout. While the
majority of streams have optimal temperatures for brown trout growth and survival, temperatures suitable for
natural reproduction in the Rush River are not as well understood. Both Lost Creek (Pierce) and Cave Creek
have significant levels of brown trout reproduction. Some unnamed tributaries also have some low levels of
natural reproduction, however the main stem of the Rush River receives intensive stocking of brown trout and
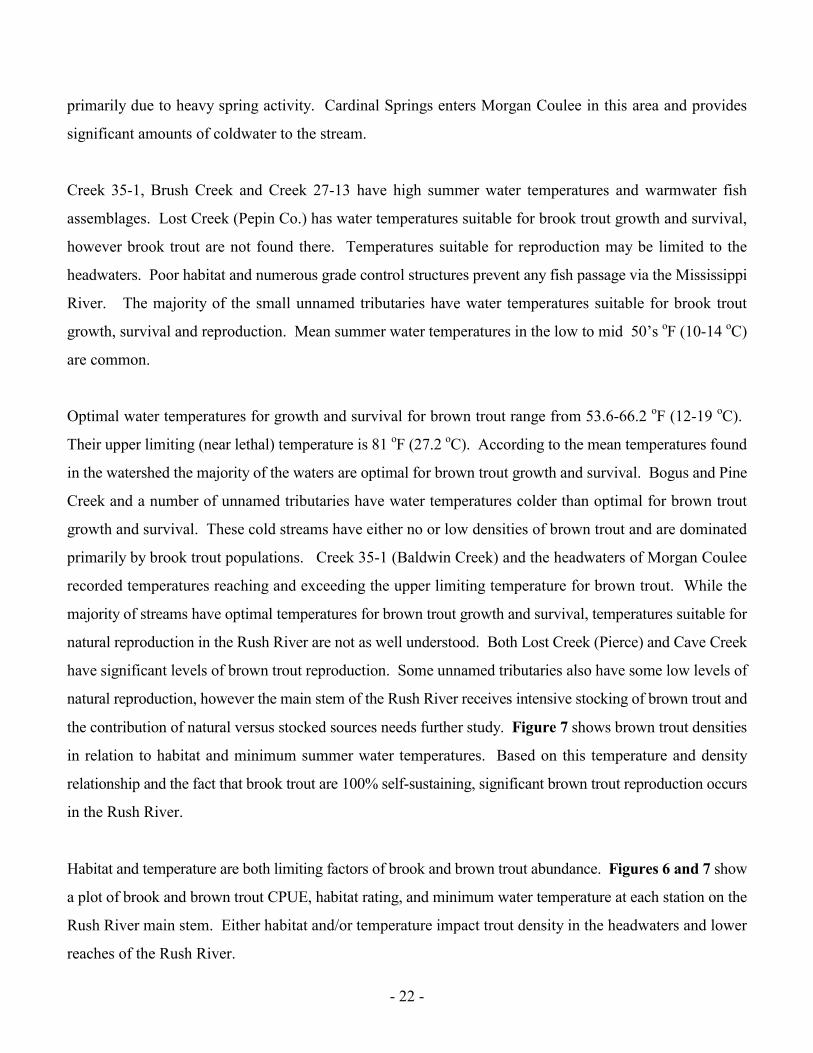
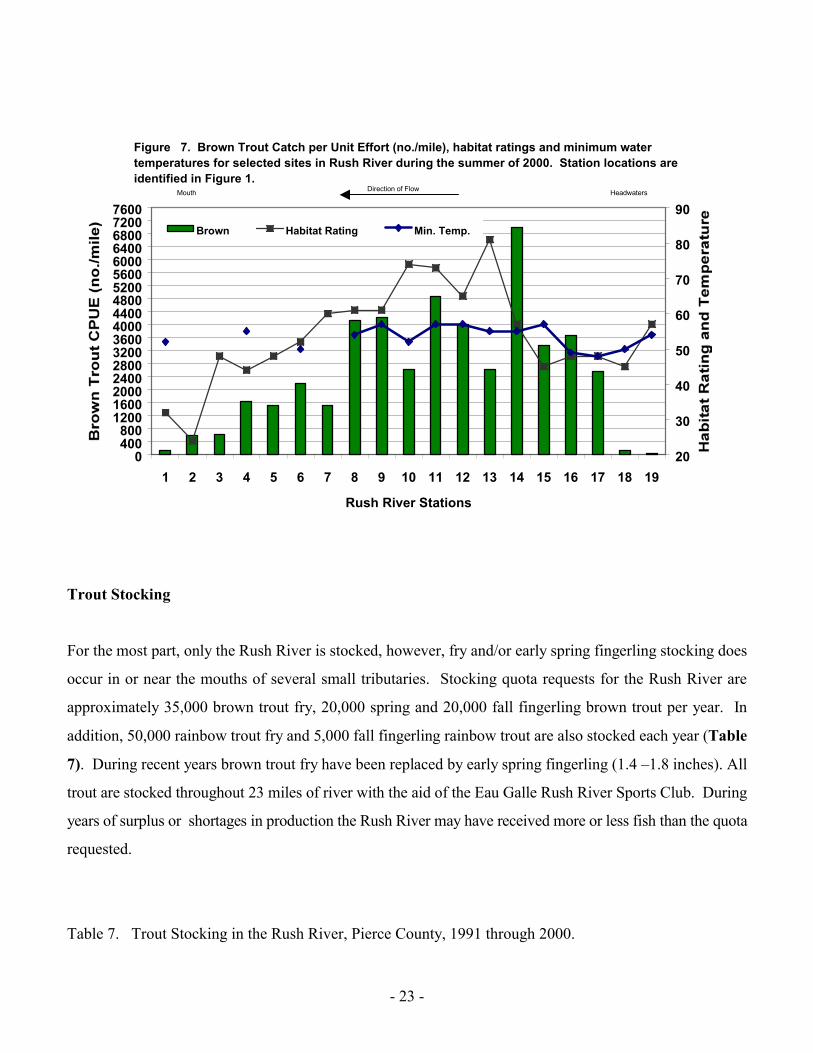
the contribution of natural versus stocked sources needs further study. Figure 7 shows brown trout densities
in relation to habitat and minimum summer water temperatures. Based on this temperature and density
relationship and the fact that brook trout are 100% self-sustaining, significant brown trout reproduction occurs
in the Rush River.
Habitat and temperature are both limiting factors of brook and brown trout abundance. Figures 6 and 7 show
a plot of brook and brown trout CPUE, habitat rating, and minimum water temperature at each station on the
Rush River main stem. Either habitat and/or temperature impact trout density in the headwaters and lower
reaches of the Rush River.
- 23 -
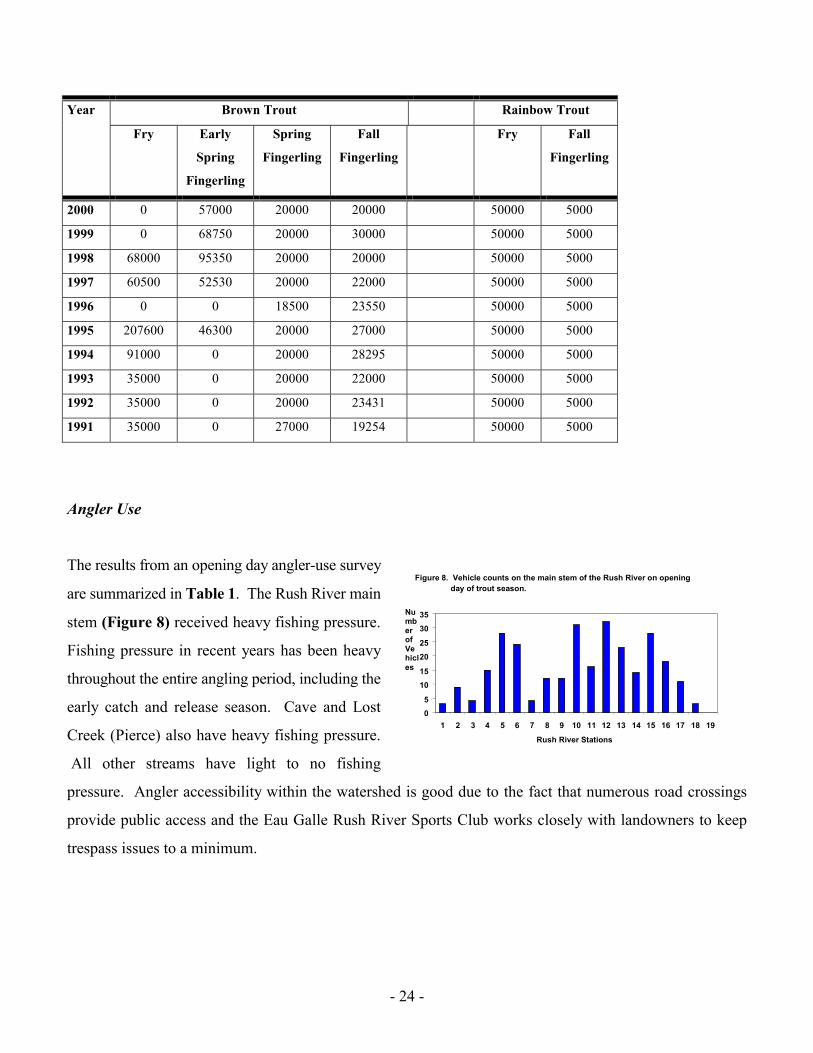
Trout Stocking
For the most part, only the Rush River is stocked, however, fry and/or early spring fingerling stocking does
occur in or near the mouths of several small tributaries. Stocking quota requests for the Rush River are
approximately 35,000 brown trout fry, 20,000 spring and 20,000 fall fingerling brown trout per year. In
addition, 50,000 rainbow trout fry and 5,000 fall fingerling rainbow trout are also stocked each year (Table
7). During recent years brown trout fry have been replaced by early spring fingerling (1.4 –1.8 inches). All
trout are stocked throughout 23 miles of river with the aid of the Eau Galle Rush River Sports Club. During
years of surplus or shortages in production the Rush River may have received more or less fish than the quota
requested.
Table 7. Trout Stocking in the Rush River, Pierce County, 1991 through 2000.
0400800
12001600200024002800320036004000440048005200560060006400680072007600
1 2 3 4 5 6 7 8 9 10 11 12 13 14 15 16 17 18 19
Rush River Stations
20
30
40
50
60
70
80
90Brown Habitat Rating Min. Temp.
Figure 7. Brown Trout Catch per Unit Effort (no./mile), habitat ratings and minimum water temperatures for selected sites in Rush River during the summer of 2000. Station locations are identified in Figure 1.
Direction of FlowMouth Headwaters
- 24 -
Brown Trout Rainbow TroutYear
Fry Early
Spring
Fingerling
Spring
Fingerling
Fall
Fingerling
Fry Fall
Fingerling
2000 0 57000 20000 20000 50000 5000
1999 0 68750 20000 30000 50000 5000
1998 68000 95350 20000 20000 50000 5000
1997 60500 52530 20000 22000 50000 5000
1996 0 0 18500 23550 50000 5000
1995 207600 46300 20000 27000 50000 5000
1994 91000 0 20000 28295 50000 5000
1993 35000 0 20000 22000 50000 5000
1992 35000 0 20000 23431 50000 5000
1991 35000 0 27000 19254 50000 5000
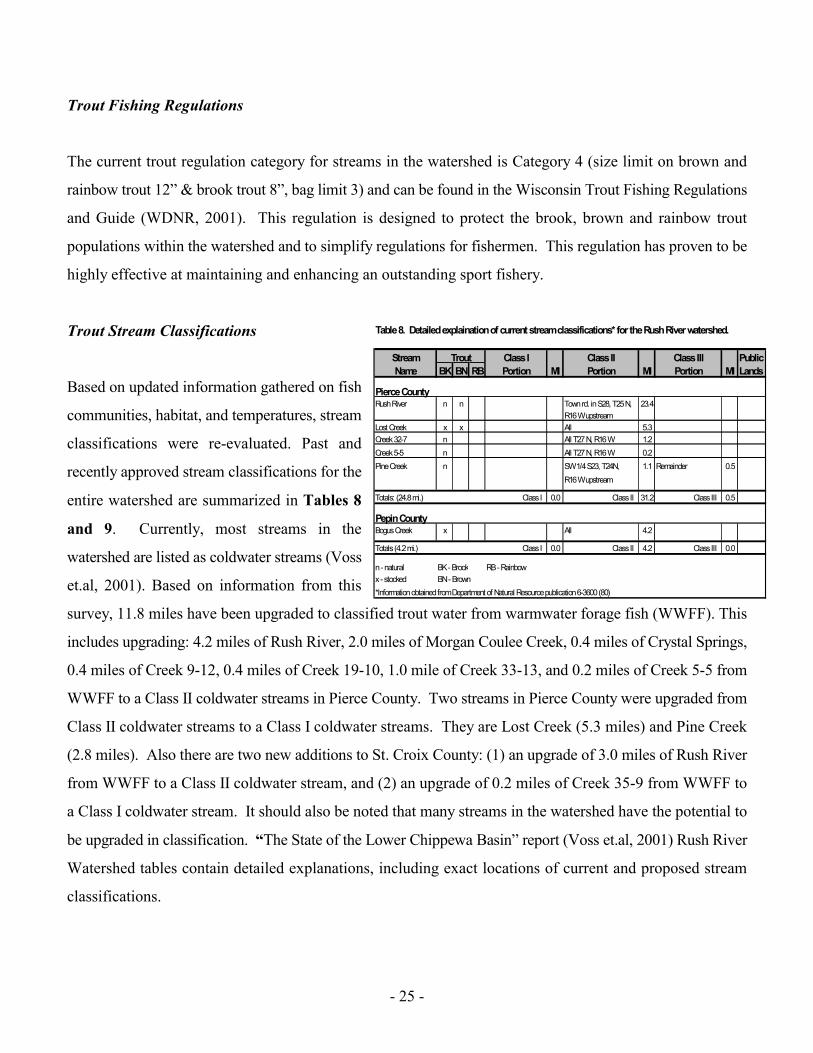
Angler Use
The results from an opening day angler-use survey
are summarized in Table 1. The Rush River main
stem (Figure 8) received heavy fishing pressure.
Fishing pressure in recent years has been heavy
throughout the entire angling period, including the
early catch and release season. Cave and Lost
Creek (Pierce) also have heavy fishing pressure.
All other streams have light to no fishing
pressure. Angler accessibility within the watershed is good due to the fact that numerous road crossings
provide public access and the Eau Galle Rush River Sports Club works closely with landowners to keep
trespass issues to a minimum.
05
1015
2025
3035
1 2 3 4 5 6 7 8 9 10 11 12 13 14 15 16 17 18 19
Rush River Stations
NumberofVehicles
Figure 8. Vehicle counts on the main stem of the Rush River on opening day of trout season.
- 25 -
Trout Fishing Regulations
The current trout regulation category for streams in the watershed is Category 4 (size limit on brown and
rainbow trout 12” & brook trout 8”, bag limit 3) and can be found in the Wisconsin Trout Fishing Regulations
and Guide (WDNR, 2001). This regulation is designed to protect the brook, brown and rainbow trout
populations within the watershed and to simplify regulations for fishermen. This regulation has proven to be
highly effective at maintaining and enhancing an outstanding sport fishery.
Trout Stream Classifications
Based on updated information gathered on fish
communities, habitat, and temperatures, stream
classifications were re-evaluated. Past and
recently approved stream classifications for the
entire watershed are summarized in Tables 8
and 9. Currently, most streams in the
watershed are listed as coldwater streams (Voss
et.al, 2001). Based on information from this
survey, 11.8 miles have been upgraded to classified trout water from warmwater forage fish (WWFF). This
includes upgrading: 4.2 miles of Rush River, 2.0 miles of Morgan Coulee Creek, 0.4 miles of Crystal Springs,
0.4 miles of Creek 9-12, 0.4 miles of Creek 19-10, 1.0 mile of Creek 33-13, and 0.2 miles of Creek 5-5 from
WWFF to a Class II coldwater streams in Pierce County. Two streams in Pierce County were upgraded from
Class II coldwater streams to a Class I coldwater streams. They are Lost Creek (5.3 miles) and Pine Creek
(2.8 miles). Also there are two new additions to St. Croix County: (1) an upgrade of 3.0 miles of Rush River
from WWFF to a Class II coldwater stream, and (2) an upgrade of 0.2 miles of Creek 35-9 from WWFF to
a Class I coldwater stream. It should also be noted that many streams in the watershed have the potential to
be upgraded in classification. “The State of the Lower Chippewa Basin” report (Voss et.al, 2001) Rush River
Watershed tables contain detailed explanations, including exact locations of current and proposed stream
classifications.
Table 8. Detailed explaination of current stream classifications* for the Rush River watershed.
Stream Class I Class II Class III PublicName BK BN RB Portion MI Portion MI Portion MI Lands
Pierce CountyRush River n n Town rd. in S28, T25 N, 23.4
R16 W upstreamLost Creek x x All 5.3Creek 32-7 n All T27 N, R16 W 1.2Creek 5-5 n All T27 N, R16 W 0.2Pine Creek n SW 1/4 S23, T24N, 1.1 Remainder 0.5
R16 W upstream
Totals: (24.8 mi.) Class I 0.0 Class II 31.2 Class III 0.5
Pepin CountyBogus Creek x All 4.2
Totals (4.2 mi.) Class I 0.0 Class II 4.2 Class III 0.0
n - natural BK - Brook RB - Rainbowx - stocked BN - Brown*Information obtained from Department of Natural Resource publication 6-3600 (80)
Trout
- 26 -
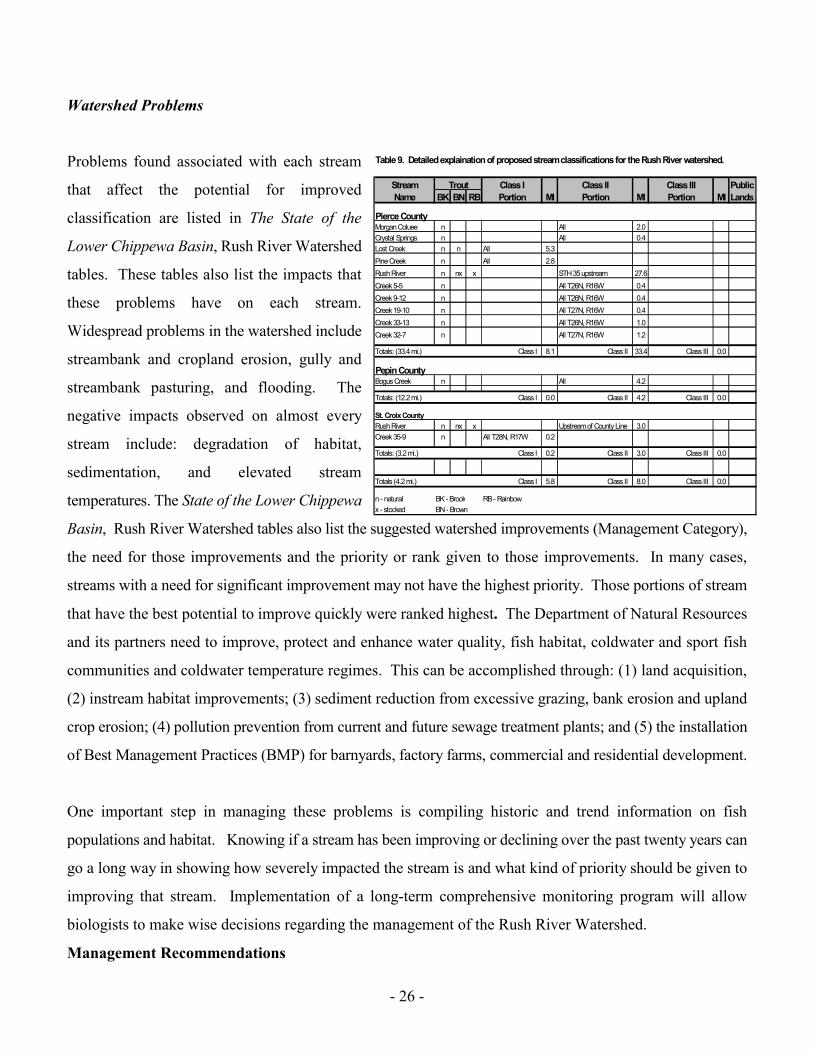
Watershed Problems
Problems found associated with each stream
that affect the potential for improved
classification are listed in The State of the
Lower Chippewa Basin, Rush River Watershed
tables. These tables also list the impacts that
these problems have on each stream.
Widespread problems in the watershed include
streambank and cropland erosion, gully and
streambank pasturing, and flooding. The
negative impacts observed on almost every
stream include: degradation of habitat,
sedimentation, and elevated stream
temperatures. The State of the Lower Chippewa
Basin, Rush River Watershed tables also list the suggested watershed improvements (Management Category),
the need for those improvements and the priority or rank given to those improvements. In many cases,
streams with a need for significant improvement may not have the highest priority. Those portions of stream
that have the best potential to improve quickly were ranked highest. The Department of Natural Resources
and its partners need to improve, protect and enhance water quality, fish habitat, coldwater and sport fish
communities and coldwater temperature regimes. This can be accomplished through: (1) land acquisition,
(2) instream habitat improvements; (3) sediment reduction from excessive grazing, bank erosion and upland
crop erosion; (4) pollution prevention from current and future sewage treatment plants; and (5) the installation
of Best Management Practices (BMP) for barnyards, factory farms, commercial and residential development.
One important step in managing these problems is compiling historic and trend information on fish
populations and habitat. Knowing if a stream has been improving or declining over the past twenty years can
go a long way in showing how severely impacted the stream is and what kind of priority should be given to
improving that stream. Implementation of a long-term comprehensive monitoring program will allow
biologists to make wise decisions regarding the management of the Rush River Watershed.
Management Recommendations
Table 9. Detailed explaination of proposed stream classifications for the Rush River watershed.
Stream Class I Class II Class III PublicName BK BN RB Portion MI Portion MI Portion MI Lands
Pierce CountyMorgan Coluee n All 2.0Crystal Springs n All 0.4Lost Creek n n All 5.3Pine Creek n All 2.8Rush River n nx x STH 35 upstream 27.6Creek 5-5 n All T26N, R16W 0.4Creek 9-12 n All T26N, R16W 0.4Creek 19-10 n All T27N, R16W 0.4Creek 33-13 n All T26N, R16W 1.0Creek 32-7 n All T27N, R16W 1.2
Totals: (33.4 mi.) Class I 8.1 Class II 33.4 Class III 0.0
Pepin CountyBogus Creek n All 4.2
Totals: (12.2 mi.) Class I 0.0 Class II 4.2 Class III 0.0
St. Croix CountyRush River n nx x Upstream of County Line 3.0Creek 35-9 n All T28N, R17W 0.2
Totals: (3.2 mi.) Class I 0.2 Class II 3.0 Class III 0.0
Totals (4.2 mi.) Class I 5.8 Class II 8.0 Class III 0.0
n - natural BK - Brook RB - Rainbowx - stocked BN - Brown
Trout
- 27 -
1. The Department should discontinue all rainbow trout stocking in the Rush River. Rainbow trout stocking
contributes very little to the overall trout population in the river. Rainbows were found at 32% of the sites
on the main stem of the Rush River, but generally contributed less than 1% of the total trout population.
Such a reduction in stocking would result in a cost savings to our hatchery system. Our major cooperator
(Eau Galle Rush River Sports Club) in the area supports this recommendation.
2. The Department should conduct a research project to determine what percent of the legal brown trout
population is supported by natural reproduction, early spring fingerling, late spring fingerling and fall
fingerling stocking, in order to determine if and where stocking efforts can be reduced. The Rush River
brown trout population has increased tremendously in recent years and appears less dependent on
stocking. Historically the Rush River was highly dependent on stocking , when less than 1% of the trout
population came from natural reproduction (Engel and Holzer, 1992). In order not to jeopardize
successful stocking on such an outstanding resource, we recommend conducting a research project using
oxytretracycline (OTC) as a marker to differentiate between natural reproduced and stocked trout. Other
research options may also apply and should be considered.
3. The Department, in cooperation with its partnership groups, should begin an aggressive streambank
easement and acquisition program on the Rush River, Pine Creek, Cave Creek and Lost Creek (Pierce Co.)
in order to protect and enhance these resources. In addition, special emphasis should be given to
providing guaranteed angler access and parking at all major road crossings. Currently, no state public
easements are found on this heavily fished resource. Anglers currently depend on private access and
liberal parking on township roads, however townships and landowners have expressed concerns over both
parking and public access. A streambank easement program has been approved for the Rush River, Cave
and Lost Creek.
4. The Department should work with St. Croix, Pierce, and Pepin County Land Conservation Offices and
the local NRCS Office to obtain streambank buffers through the Conservation Reserve Environmental
Program (CREP) on select streams throughout the watershed. In addition, the Waters Program should
support restoration of wetlands and uplands in the headwaters of the Rush River Watershed through the

- 28 -
Western Prairie Habitat Restoration Area (WPHRA). Such activities will have direct and indirect benefits
to the water quality, fish and aquatic life in the Rush River Watershed.
5. The Department should work with St. Croix, Pierce, and Pepin County Land Conservation Offices and
the local NRCS Office to install Best Management Practices that reduce flooding, upland soil erosion,
nutrient runoff and infiltrate stormwater from upland agricutural areas, factory farms, commerical and
urban development areas. Such activities will help prevent sedimentation of waterways, protect and
improve coldwater discharge, water quality, fish and aquatic life.
6. The Department should work with local clubs and St. Croix, Pierce, and Pepin County Land Conservation
Offices on potential instream habitat restoration activities. By initiating these activities it is likely that
spawning and nursery habitat, as well as overhead cover could be significantly enhanced and would aid
in the recovery of the coldwater fish community.
7. The Department should work with local communities in sensitive headwater areas to address rapid urban
development and the need for storm water management and expanded sewage treatment facilities in order
to prevent pollution, reduce flooding and sedimentation of waterways and to encourage groundwater
recharge. Such activities will help protect and enhance the Rush River and its outstanding trout fishing
resource.
8. In order to protect, preserve and evaluate management projects in the Rush River Watershed, the
Department should implement a long-term comprehensive wadable stream monitoring program to detect
changes that show improvement or decline in resources. We recommend that approximately 15
representative sites be selected throughout the watershed to be sampled once every three to six years.
Literature Cited

- 29 -
Engel, M. P. and J. A. Holzer. 1992. Population Dynamics, Stock Survival and Angling Characteristics of the Rush River, AClass II Brown and Rainbow Trout Stream in Pierce County, Wisconsin. Wisconsin Department of Natural Resources,Baldwin, Wisconsin.
Gibbs, O. Jr. 1869. Lake Pepin-Cowder, in Letters to General Spinner. H. D. McIntyre & Co., @01, William Str. New York.
Hilsenhoff, W. L. 1982. Using a Biotic Index to Evaluate Water Quality in Streams. Technical Bulletin 132. WisconsinDepartment of Natural Resources. Madison, Wisconsin.
Lyons, J. 1992. Using the Index of Biotic Integrity (IBI) to Measure Environmental Quality in Warmwater Streams inWisconsin. General Technical Report 149, U. S. Forest Service, North Central Forest Experiment Station, St. Paul. Minnesota.
Lyons, J., L.Wang and T. Simonson, 1996. Development and Validation of an Index of Biotic Integrity for Coldwater Streamsin Wisconsin. North American Journal of Fisheries Management 16: 241-256.
Raleigh, R. F., L. D. Zuckerman and P. C. Nelson. 1986. Habitat Suitability Index Models Instream Flow Suitability Curves: Brown Trout. U.S. Department of Interior, Fish and Wildlife Service, Biological Report 82:10.124.
Ricker, W.E., 1975. Computation and Interpretation of Biological Statistics of Fish Populations. Bulletin 191 of the FisheriesResearch Board of Canada. Department of the Envirorment Fisheries and Marine Service, Ottawa, Canada.
Simonson, T. D., J. Lyons, and P. D. Kanehl. 1994. Guidelines for Evaluation Fish Habitat in Wisconsin Streams. GeneralTechnical Report 164, U.S. Forest Service, North Central Forest Experiment Station, St. Paul, Minnesota.
Swim, D. J., M. P. Engel and K. Schreiber, 1998. Eau Galle River Watershed Comprehensive Surface Water Report – St.Croix, Pierce, Dunn, and Pepin Counties, Wisconsin. Wisconsin Department of Natural Resources, West Central Region,Lower Chippewa Basin, Baldwin, Wisconsin.
Voss, K., et. al. 2001. The State of the Lower Chippewa River Basin. Publication WT-554 2001. Wisconsin Department ofNatural Resources, Madison, Wisconsin.
WDNR. 1980. Wisconsin Trout Streams. Publication 6-3600, Wisconsin Department of Natural Resources. Madison,Wisconsin.
WDNR. 2001. Wisconsin Trout Fishing Regulations Guide. Publiction FH-302. Wisconsin Department of NaturalResources. Madison, Wisconsin.

- 30 -
Appendix A: Physical Characteristics of Rush River Watershed in St. Croix, Pierce, and Pepin Counties, Wisconsin July, August & September, 2000.
STATION INFORMATION : Stream Name: Rush RiverStation Number: 1 2 3 4 5 6 7 8 9 10 11 12WIBC: 2440300 2440300 2440300 2440300 2440300 2440300 2440300 2440300 2440300 2440300 2440300 2440300Sampling Date: 06/12/00 06/12/00 06/12/00 06/12/00 06/13/00 06/13/00 06/14/00 06/13/00 06/13/00 06/14/00 06/15/00 06/14/00River Mile: 0.75 2.71 4.17 5.67 7.42 9.92 11.33 12.83 13.83 16.42 17.75 19.42Township: 24N 24N 25N 25N 25N 25N 25N 26N 26N 26N 26N 26NRange: 16W 16W 16W 16W 16W 16W 16W 16W 16W 16W 16W 16WSection: 16 4 33 28 16 9 4 33 28 16 9 81/4 Section: NW SW NW NW SE NW NW NW SE SE SW NEStart Latitude :N 44.5700 44.5925 44.6095 44.6272 44.6450 44.6656 44.6813 44.6946 44.7055 44.7342 44.7463 44.7561Start Longitude :W 92.3285 92.3279 92.3297 92.3319 92.3275 92.3274 92.3317 92.3294 92.3227 92.3265 92.3315 92.3402
WATER CHARACTERISTICS :Time (24 hr): 0830 1100 1315 1530 1000 1130 1045 1530 1330 1315 1053 1315Air Temperature (F): 60 72 79 74 66 70 78 72 76 64 68 72Water Temperature (F): 60 58 60 64 57 59 60 66 64 62 58 62Water Level: Normal Normal Normal Normal Normal Normal Low Normal Normal Normal Normal NormalFlow (cfs): 130.00 120.10 102.30 95.20 119.30 83.20 59.50 79.90 56.80 53.50 47.70 45.30Gradient (ft/mi.): 4.00 5.10 5.10 5.10 8.00 7.75 7.75 12.12 14.08 21.86 18.52 14.98
CHANNEL & BASIN CHARACTERISTICS :Station Length (m): 676 630 640.5 532 441 647 630 508 529 630 418 403Basin Area (sq. mi.): 213.0 169.0 158.0Mean Stream Width (m): 19.3 18.0 18.3 15.2 12.6 18.5 18.1 14.5 15.1 18.0 12.0 11.5Channel Condition: Natural Natural Natural Natural Natural Natural Natural Natural Natural Natural Natural Natural% Channelization:
MEAN DISTANCE (m) :Between Bends: 247 718 116.8 204.4 280.5 0 0 200 0 0 0 0Between Riffles: 167.5 215.7 251.5 143.3 68.3 135 131.6 58.9 42.3 70.8 72 59.3
TOTAL LENGTH (m) / MEAN LENGTH (m) :Riffles: 53 / 17.7 110 / 36.7 140 / 70 110 / 36.7 195 / 39 233 / 58.3 129 / 32.2 157.5 / 26.3 341 / 68.2 293 / 41.9 97 / 24.3 119 / 39.7Pools: 0 / 0 0 / 0 103 / 51.5 99 / 49.5 140 / 46.6 341 / 170.5 117 / 58.5 87 / 43.5 130 / 65 89 / 29.7 161 / 40.3 82 / 82Runs: 338 / 169 545 / 272.5 400 / 100 331 / 110.3 181 / 45.3 150 / 37.5 552 / 92 164.5 / 27.4 163 / 40.8 323.7 / 40.5 143 / 28.6 209 / 69.7
FISH HABITAT RATING SCORE > 10 m > 10 m > 10 m > 10 m > 10 m > 10 m > 10 m > 10 m > 10 m > 10 m > 10 m > 10 mRiparian Buffer Width: --- --- --- --- --- --- --- --- --- --- --- ---Bank Erosion: --- --- --- --- --- --- --- --- --- --- --- ---Bank Stability: 4 4 4 8 4 8 8 8 8 12 12 12Pool Area: --- --- --- --- --- --- --- --- --- --- --- ---Maximum Thalweg Depth: 8 8 16 8 8 8 16 8 8 25 16 8Width:Depth Ratio: --- --- --- --- --- --- --- --- --- --- --- ---R:R or B:B Ratio: 12 4 12 12 12 12 12 12 12 12 12 12% Fine Sediment: --- --- --- --- --- --- --- --- --- --- --- ---% Rocky Sediment: 0 8 8 8 16 16 16 25 25 25 25 25Cover for fish: 8 0 8 8 8 8 8 8 8 0 8 8
TOTAL SCORE : 32 24 48 44 48 52 60 61 61 74 73 65QUALITATIVE RATING : Fair Fair Fair Fair Fair Fair Good Good Good Good Good Good
- 31 -
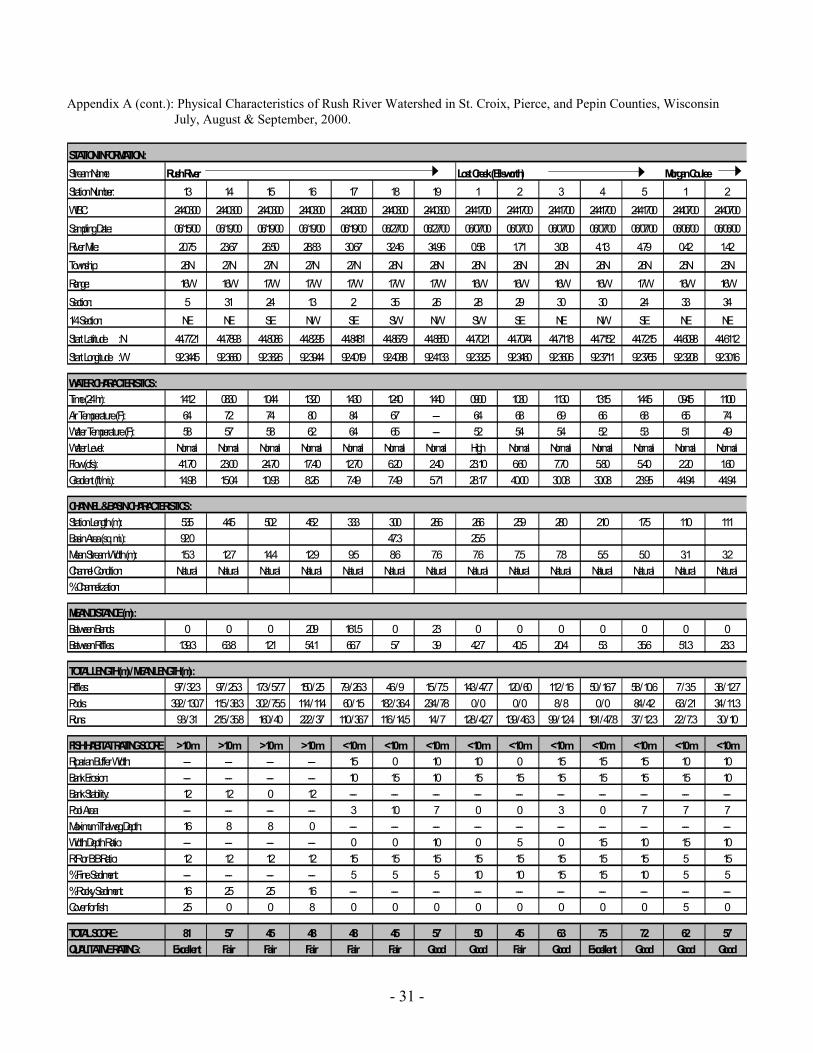
Appendix A (cont.): Physical Characteristics of Rush River Watershed in St. Croix, Pierce, and Pepin Counties, Wisconsin July, August & September, 2000.
STATION INFORMATION : Stream Name: Rush River Lost Creek (Ellsworth) Morgan CouleeStation Number: 13 14 15 16 17 18 19 1 2 3 4 5 1 2WIBC: 2440300 2440300 2440300 2440300 2440300 2440300 2440300 2441700 2441700 2441700 2441700 2441700 2440700 2440700Sampling Date: 06/15/00 06/19/00 06/19/00 06/19/00 06/19/00 06/27/00 06/27/00 06/07/00 06/07/00 06/07/00 06/07/00 06/07/00 06/06/00 06/06/00River Mile: 20.75 23.67 26.50 28.83 30.67 32.46 34.96 0.58 1.71 3.08 4.13 4.79 0.42 1.42Township: 26N 27N 27N 27N 27N 28N 28N 26N 26N 26N 26N 26N 25N 25NRange: 16W 16W 17W 17W 17W 17W 17W 16W 16W 16W 16W 17W 16W 16WSection: 5 31 24 13 2 35 26 28 29 30 30 24 33 341/4 Section: NE NE SE NW SE SW NW SW SE NE NW SE NE NEStart Latitude :N 44.7721 44.7893 44.8086 44.8295 44.8481 44.8679 44.8850 44.7021 44.7074 44.7118 44.7152 44.7215 44.6098 44.6112Start Longitude :W 92.3445 92.3660 92.3826 92.3944 92.4019 92.4088 92.4133 92.3325 92.3460 92.3606 92.3711 92.3765 92.3208 92.3016
WATER CHARACTERISTICS :Time (24 hr): 1412 0830 1044 1320 1430 1240 1440 0900 1030 1130 1315 1445 0945 1100Air Temperature (F): 64 72 74 80 84 67 --- 64 68 69 66 68 65 74Water Temperature (F): 58 57 58 62 64 65 --- 52 54 54 52 53 51 49Water Level: Normal Normal Normal Normal Normal Normal Normal High Normal Normal Normal Normal Normal NormalFlow (cfs): 41.70 23.00 24.70 17.40 12.70 6.20 2.40 23.10 6.60 7.70 5.80 5.40 2.20 1.60Gradient (ft/mi.): 14.98 15.04 10.93 8.26 7.49 7.49 5.71 28.17 40.00 30.08 30.08 23.95 44.94 44.94
CHANNEL & BASIN CHARACTERISTICS :Station Length (m): 535 445 502 452 333 300 266 266 259 280 210 175 110 111Basin Area (sq. mi.): 92.0 47.3 25.5Mean Stream Width (m): 15.3 12.7 14.4 12.9 9.5 8.6 7.6 7.6 7.5 7.8 5.5 5.0 3.1 3.2Channel Condition: Natural Natural Natural Natural Natural Natural Natural Natural Natural Natural Natural Natural Natural Natural% Channelization:
MEAN DISTANCE (m) :Between Bends: 0 0 0 209 161.5 0 23 0 0 0 0 0 0 0Between Riffles: 139.3 63.8 121 54.1 66.7 57 39 42.7 40.5 20.4 53 35.6 51.3 23.3
TOTAL LENGTH (m) / MEAN LENGTH (m) :Riffles: 97 / 32.3 97 / 25.3 173 / 57.7 150 / 25 79 / 26.3 46 / 9 15 / 7.5 143 / 47.7 120 / 60 112 / 16 50 / 16.7 58 / 10.6 7 / 3.5 38 / 12.7Pools: 392 / 130.7 115 / 38.3 302 / 75.5 114 / 114 60 / 15 182 / 36.4 234 / 78 0 / 0 0 / 0 8 / 8 0 / 0 84 / 42 63 / 21 34 / 11.3Runs: 93 / 31 215 / 35.8 160 / 40 222 / 37 110 / 36.7 116 / 14.5 14 / 7 128 / 42.7 139 / 46.3 99 / 12.4 191 / 47.8 37 / 12.3 22 / 7.3 30 / 10
FISH HABITAT RATING SCORE > 10 m > 10 m > 10 m > 10 m < 10 m < 10 m < 10 m < 10 m < 10 m < 10 m < 10 m < 10 m < 10 m < 10 mRiparian Buffer Width: --- --- --- --- 15 0 10 10 0 15 15 15 10 10Bank Erosion: --- --- --- --- 10 15 10 15 15 15 15 15 15 10Bank Stability: 12 12 0 12 --- --- --- --- --- --- --- --- --- ---Pool Area: --- --- --- --- 3 10 7 0 0 3 0 7 7 7Maximum Thalweg Depth: 16 8 8 0 --- --- --- --- --- --- --- --- --- ---Width:Depth Ratio: --- --- --- --- 0 0 10 0 5 0 15 10 15 10R:R or B:B Ratio: 12 12 12 12 15 15 15 15 15 15 15 15 5 15% Fine Sediment: --- --- --- --- 5 5 5 10 10 15 15 10 5 5% Rocky Sediment: 16 25 25 16 --- --- --- --- --- --- --- --- --- ---Cover for fish: 25 0 0 8 0 0 0 0 0 0 0 0 5 0
TOTAL SCORE : 81 57 45 48 48 45 57 50 45 63 75 72 62 57QUALITATIVE RATING : Excellent Fair Fair Fair Fair Fair Good Good Fair Good Excellent Good Good Good
- 32 -
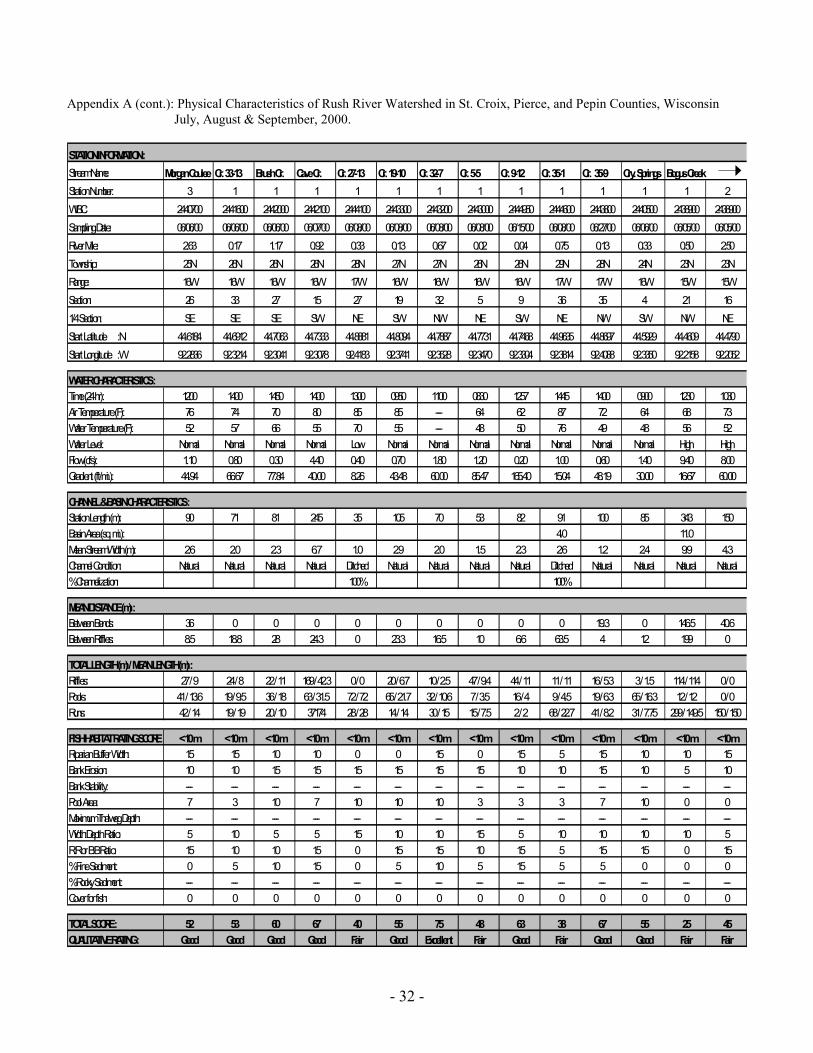
Appendix A (cont.): Physical Characteristics of Rush River Watershed in St. Croix, Pierce, and Pepin Counties, Wisconsin July, August & September, 2000.
STATION INFORMATION : Stream Name: Morgan Coulee Cr. 33-13 Brush Cr. Cave Cr. Cr. 27-13 Cr. 19-10 Cr. 32-7 Cr. 5-5 Cr. 9-12 Cr. 35-1 Cr. 35-9 Cry. Springs Bogus CreekStation Number: 3 1 1 1 1 1 1 1 1 1 1 1 1 2WIBC: 2440700 2441600 2442000 2442100 2444100 2443300 2443200 2443000 2444950 2444600 2443800 2440500 2438900 2438900Sampling Date: 06/06/00 06/06/00 06/06/00 06/07/00 06/08/00 06/08/00 06/08/00 06/08/00 06/15/00 06/08/00 06/27/00 06/06/00 06/05/00 06/05/00River Mile: 2.63 0.17 1.17 0.92 0.33 0.13 0.67 0.02 0.04 0.75 0.13 0.33 0.50 2.50Township: 25N 26N 26N 26N 28N 27N 27N 26N 26N 29N 28N 24N 23N 23NRange: 16W 16W 16W 16W 17W 16W 16W 16W 16W 17W 17W 16W 15W 15WSection: 26 33 27 15 27 19 32 5 9 36 35 4 21 161/4 Section: SE SE SE SW NE SW NW NE SW NE NW SW NW NEStart Latitude :N 44.6184 44.6912 44.7063 44.7333 44.8881 44.8094 44.7887 44.7731 44.7468 44.9635 44.8697 44.5929 44.4609 44.4790Start Longitude :W 92.2836 92.3214 92.3041 92.3078 92.4183 92.3741 92.3528 92.3470 92.3304 92.3814 92.4088 92.3350 92.2158 92.2052
WATER CHARACTERISTICS :Time (24 hr): 1200 1400 1450 1400 1300 0950 1100 0830 1257 1445 1400 0900 1230 1030Air Temperature (F): 76 74 70 80 85 85 --- 64 62 87 72 64 68 73Water Temperature (F): 52 57 66 55 70 55 --- 48 50 76 49 48 56 52Water Level: Normal Normal Normal Normal Low Normal Normal Normal Normal Normal Normal Normal High HighFlow (cfs): 1.10 0.80 0.30 4.40 0.40 0.70 1.80 1.20 0.20 1.00 0.60 1.40 9.40 8.00Gradient (ft/mi.): 44.94 66.67 77.84 40.00 8.26 43.48 60.00 85.47 165.40 15.04 48.19 30.00 16.67 60.00
CHANNEL & BASIN CHARACTERISTICS :Station Length (m): 90 71 81 245 35 105 70 53 82 91 100 85 343 150Basin Area (sq. mi.): 4.0 11.0Mean Stream Width (m): 2.6 2.0 2.3 6.7 1.0 2.9 2.0 1.5 2.3 2.6 1.2 2.4 9.9 4.3Channel Condition: Natural Natural Natural Natural Ditched Natural Natural Natural Natural Ditched Natural Natural Natural Natural% Channelization: 100% 100%
MEAN DISTANCE (m) :Between Bends: 36 0 0 0 0 0 0 0 0 0 19.3 0 146.5 40.6Between Riffles: 8.5 18.8 28 24.3 0 23.3 16.5 10 6.6 63.5 4 12 199 0
TOTAL LENGTH (m) / MEAN LENGTH (m) :Riffles: 27 / 9 24 / 8 22 / 11 169 / 42.3 0 / 0 20 / 6.7 10 / 2.5 47 / 9.4 44 / 11 11 / 11 16 / 5.3 3 / 1.5 114 / 114 0 / 0Pools: 41 / 13.6 19 / 9.5 36 / 18 63 / 31.5 72 / 72 65 / 21.7 32 / 10.6 7 / 3.5 16 / 4 9 / 4.5 19 / 6.3 65 / 16.3 12 / 12 0 / 0Runs: 42 / 14 19 / 19 20 / 10 37174 28 / 28 14 / 14 30 / 15 15 / 7.5 2 / 2 68 / 22.7 41 / 8.2 31 / 7.75 299 / 149.5 150 / 150
FISH HABITAT RATING SCORE < 10 m < 10 m < 10 m < 10 m < 10 m < 10 m < 10 m < 10 m < 10 m < 10 m < 10 m < 10 m < 10 m < 10 mRiparian Buffer Width: 15 15 10 10 0 0 15 0 15 5 15 10 10 15Bank Erosion: 10 10 15 15 15 15 15 15 10 10 15 10 5 10Bank Stability: --- --- --- --- --- --- --- --- --- --- --- --- --- ---Pool Area: 7 3 10 7 10 10 10 3 3 3 7 10 0 0Maximum Thalweg Depth: --- --- --- --- --- --- --- --- --- --- --- --- --- ---Width:Depth Ratio: 5 10 5 5 15 10 10 15 5 10 10 10 10 5R:R or B:B Ratio: 15 10 10 15 0 15 15 10 15 5 15 15 0 15% Fine Sediment: 0 5 10 15 0 5 10 5 15 5 5 0 0 0% Rocky Sediment: --- --- --- --- --- --- --- --- --- --- --- --- --- ---Cover for fish: 0 0 0 0 0 0 0 0 0 0 0 0 0 0
TOTAL SCORE : 52 53 60 67 40 55 75 48 63 38 67 55 25 45QUALITATIVE RATING : Good Good Good Good Fair Good Excellent Fair Good Fair Good Good Fair Fair
- 33 -
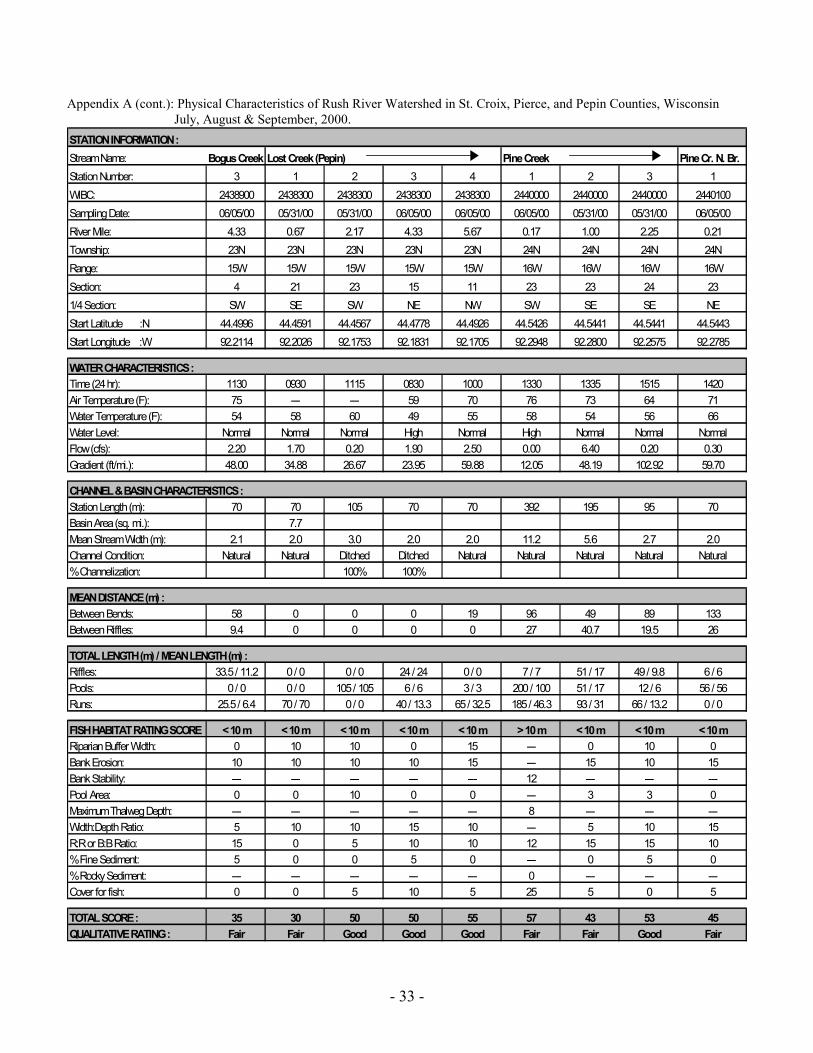
Appendix A (cont.): Physical Characteristics of Rush River Watershed in St. Croix, Pierce, and Pepin Counties, Wisconsin July, August & September, 2000.STATION INFORMATION : Stream Name: Bogus Creek Lost Creek (Pepin) Pine Creek Pine Cr. N. Br.Station Number: 3 1 2 3 4 1 2 3 1WIBC: 2438900 2438300 2438300 2438300 2438300 2440000 2440000 2440000 2440100Sampling Date: 06/05/00 05/31/00 05/31/00 06/05/00 06/05/00 06/05/00 05/31/00 05/31/00 06/05/00River Mile: 4.33 0.67 2.17 4.33 5.67 0.17 1.00 2.25 0.21Township: 23N 23N 23N 23N 23N 24N 24N 24N 24NRange: 15W 15W 15W 15W 15W 16W 16W 16W 16WSection: 4 21 23 15 11 23 23 24 231/4 Section: SW SE SW NE NW SW SE SE NEStart Latitude :N 44.4996 44.4591 44.4567 44.4778 44.4926 44.5426 44.5441 44.5441 44.5443Start Longitude :W 92.2114 92.2026 92.1753 92.1831 92.1705 92.2948 92.2800 92.2575 92.2785
WATER CHARACTERISTICS :Time (24 hr): 1130 0930 1115 0830 1000 1330 1335 1515 1420Air Temperature (F): 75 --- --- 59 70 76 73 64 71Water Temperature (F): 54 58 60 49 55 58 54 56 66Water Level: Normal Normal Normal High Normal High Normal Normal NormalFlow (cfs): 2.20 1.70 0.20 1.90 2.50 0.00 6.40 0.20 0.30Gradient (ft/mi.): 48.00 34.88 26.67 23.95 59.88 12.05 48.19 102.92 59.70
CHANNEL & BASIN CHARACTERISTICS :Station Length (m): 70 70 105 70 70 392 195 95 70Basin Area (sq. mi.): 7.7Mean Stream Width (m): 2.1 2.0 3.0 2.0 2.0 11.2 5.6 2.7 2.0Channel Condition: Natural Natural Ditched Ditched Natural Natural Natural Natural Natural% Channelization: 100% 100%
MEAN DISTANCE (m) :Between Bends: 58 0 0 0 19 96 49 89 133Between Riffles: 9.4 0 0 0 0 27 40.7 19.5 26
TOTAL LENGTH (m) / MEAN LENGTH (m) :Riffles: 33.5 / 11.2 0 / 0 0 / 0 24 / 24 0 / 0 7 / 7 51 / 17 49 / 9.8 6 / 6Pools: 0 / 0 0 / 0 105 / 105 6 / 6 3 / 3 200 / 100 51 / 17 12 / 6 56 / 56Runs: 25.5 / 6.4 70 / 70 0 / 0 40 / 13.3 65 / 32.5 185 / 46.3 93 / 31 66 / 13.2 0 / 0
FISH HABITAT RATING SCORE < 10 m < 10 m < 10 m < 10 m < 10 m > 10 m < 10 m < 10 m < 10 mRiparian Buffer Width: 0 10 10 0 15 --- 0 10 0Bank Erosion: 10 10 10 10 15 --- 15 10 15Bank Stability: --- --- --- --- --- 12 --- --- ---Pool Area: 0 0 10 0 0 --- 3 3 0Maximum Thalweg Depth: --- --- --- --- --- 8 --- --- ---Width:Depth Ratio: 5 10 10 15 10 --- 5 10 15R:R or B:B Ratio: 15 0 5 10 10 12 15 15 10% Fine Sediment: 5 0 0 5 0 --- 0 5 0% Rocky Sediment: --- --- --- --- --- 0 --- --- ---Cover for fish: 0 0 5 10 5 25 5 0 5
TOTAL SCORE : 35 30 50 50 55 57 43 53 45QUALITATIVE RATING : Fair Fair Good Good Good Fair Fair Good Fair
- 34 -
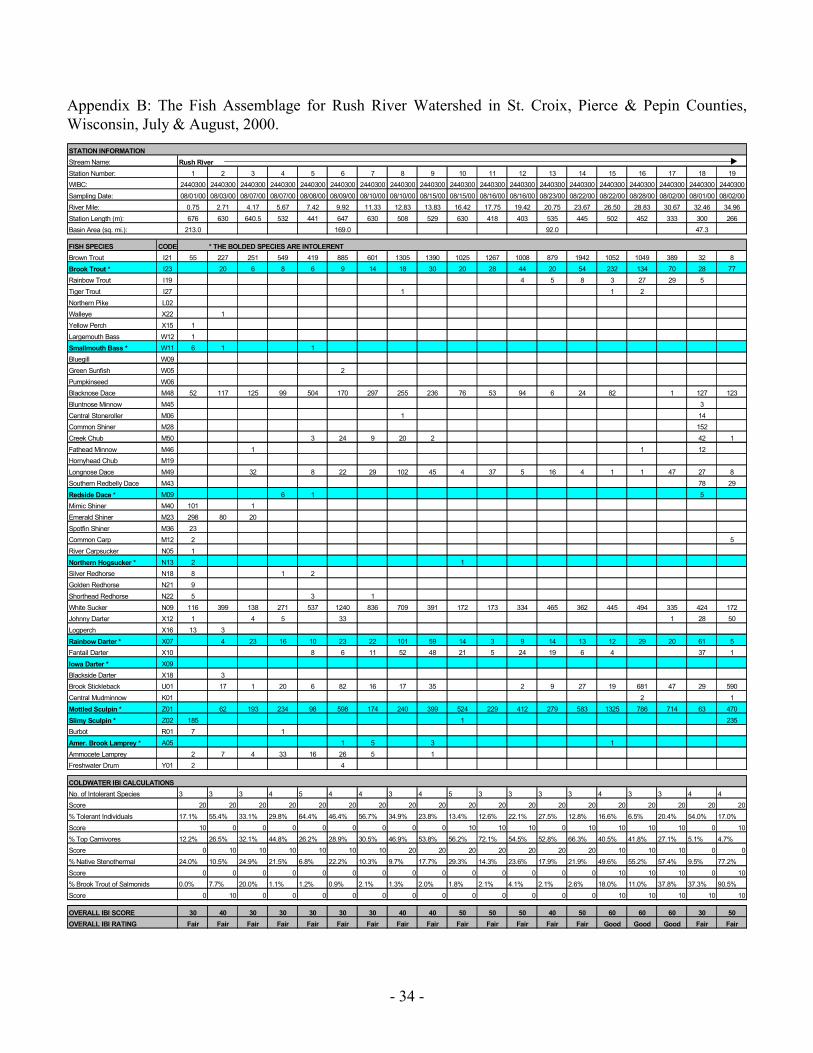
Appendix B: The Fish Assemblage for Rush River Watershed in St. Croix, Pierce & Pepin Counties,Wisconsin, July & August, 2000.STATION INFORMATIONStream Name: Rush RiverStation Number: 1 2 3 4 5 6 7 8 9 10 11 12 13 14 15 16 17 18 19WIBC: 2440300 2440300 2440300 2440300 2440300 2440300 2440300 2440300 2440300 2440300 2440300 2440300 2440300 2440300 2440300 2440300 2440300 2440300 2440300Sampling Date: 08/01/00 08/03/00 08/07/00 08/07/00 08/08/00 08/09/00 08/10/00 08/10/00 08/15/00 08/15/00 08/16/00 08/16/00 08/23/00 08/22/00 08/22/00 08/28/00 08/02/00 08/01/00 08/02/00River Mile: 0.75 2.71 4.17 5.67 7.42 9.92 11.33 12.83 13.83 16.42 17.75 19.42 20.75 23.67 26.50 28.83 30.67 32.46 34.96Station Length (m): 676 630 640.5 532 441 647 630 508 529 630 418 403 535 445 502 452 333 300 266Basin Area (sq. mi.): 213.0 169.0 92.0 47.3
FISH SPECIES CODE * THE BOLDED SPECIES ARE INTOLERENT Brown Trout I21 55 227 251 549 419 885 601 1305 1390 1025 1267 1008 879 1942 1052 1049 389 32 8Brook Trout * I23 20 6 8 6 9 14 18 30 20 28 44 20 54 232 134 70 28 77Rainbow Trout I19 4 5 8 3 27 29 5Tiger Trout I27 1 1 2Northern Pike L02Walleye X22 1Yellow Perch X15 1Largemouth Bass W12 1Smallmouth Bass * W11 6 1 1Bluegill W09Green Sunfish W05 2Pumpkinseed W06Blacknose Dace M48 52 117 125 99 504 170 297 255 236 76 53 94 6 24 82 1 127 123Bluntnose Minnow M45 3Central Stoneroller M06 1 14Common Shiner M28 152Creek Chub M50 3 24 9 20 2 42 1Fathead Minnow M46 1 1 12Hornyhead Chub M19Longnose Dace M49 32 8 22 29 102 45 4 37 5 16 4 1 1 47 27 8Southern Redbelly Dace M43 78 29Redside Dace * M09 6 1 5Mimic Shiner M40 101 1Emerald Shiner M23 298 80 20Spotfin Shiner M36 23Common Carp M12 2 5River Carpsucker N05 1Northern Hogsucker * N13 2 1Silver Redhorse N18 8 1 2Golden Redhorse N21 9Shorthead Redhorse N22 5 3 1White Sucker N09 116 399 138 271 537 1240 836 709 391 172 173 334 465 362 445 494 335 424 172Johnny Darter X12 1 4 5 33 1 28 50Logperch X16 13 3Rainbow Darter * X07 4 23 16 10 23 22 101 59 14 3 9 14 13 12 29 20 61 5Fantail Darter X10 8 6 11 52 48 21 5 24 19 6 4 37 1Iowa Darter * X09Blackside Darter X18 3Brook Stickleback U01 17 1 20 6 82 16 17 35 2 9 27 19 681 47 29 590Central Mudminnow K01 2 1Mottled Sculpin * Z01 62 193 234 98 598 174 240 399 524 229 412 279 583 1325 786 714 63 470Slimy Sculpin * Z02 185 1 235Burbot R01 7 1Amer. Brook Lamprey * A05 1 5 3 1Ammocete Lamprey 2 7 4 33 16 26 5 1Freshwater Drum Y01 2 4
COLDWATER IBI CALCULATIONSNo. of Intolerant Species 3 3 3 4 5 4 4 3 4 5 3 3 3 3 4 3 3 4 4Score 20 20 20 20 20 20 20 20 20 20 20 20 20 20 20 20 20 20 20% Tolerant Individuals 17.1% 55.4% 33.1% 29.8% 64.4% 46.4% 56.7% 34.9% 23.8% 13.4% 12.6% 22.1% 27.5% 12.8% 16.6% 6.5% 20.4% 54.0% 17.0%Score 10 0 0 0 0 0 0 0 0 10 10 10 0 10 10 10 10 0 10% Top Carnivores 12.2% 26.5% 32.1% 44.8% 26.2% 28.9% 30.5% 46.9% 53.8% 56.2% 72.1% 54.5% 52.8% 66.3% 40.5% 41.8% 27.1% 5.1% 4.7%Score 0 10 10 10 10 10 10 20 20 20 20 20 20 20 10 10 10 0 0% Native Stenothermal 24.0% 10.5% 24.9% 21.5% 6.8% 22.2% 10.3% 9.7% 17.7% 29.3% 14.3% 23.6% 17.9% 21.9% 49.6% 55.2% 57.4% 9.5% 77.2%Score 0 0 0 0 0 0 0 0 0 0 0 0 0 0 10 10 10 0 10% Brook Trout of Salmonids 0.0% 7.7% 20.0% 1.1% 1.2% 0.9% 2.1% 1.3% 2.0% 1.8% 2.1% 4.1% 2.1% 2.6% 18.0% 11.0% 37.8% 37.3% 90.5%Score 0 10 0 0 0 0 0 0 0 0 0 0 0 0 10 10 10 10 10
OVERALL IBI SCORE 30 40 30 30 30 30 30 40 40 50 50 50 40 50 60 60 60 30 50OVERALL IBI RATING Fair Fair Fair Fair Fair Fair Fair Fair Fair Fair Fair Fair Fair Fair Good Good Good Fair Fair
- 35 -
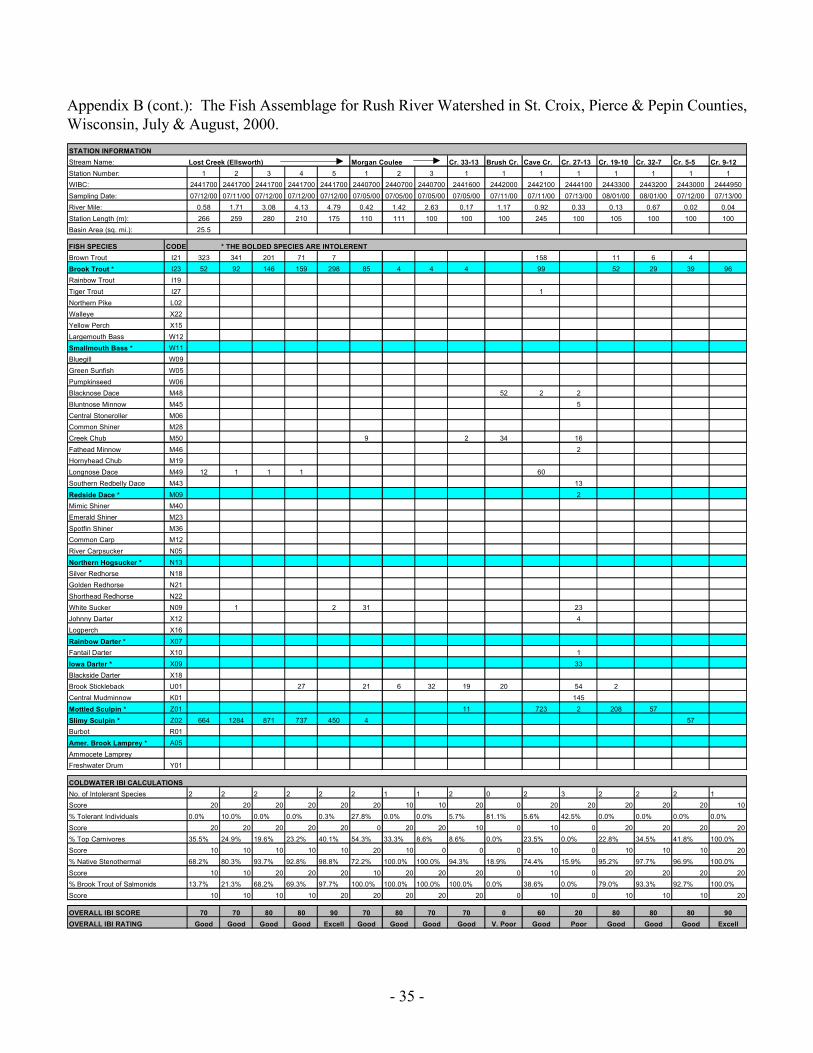
Appendix B (cont.): The Fish Assemblage for Rush River Watershed in St. Croix, Pierce & Pepin Counties,Wisconsin, July & August, 2000.STATION INFORMATIONStream Name: Lost Creek (Ellsworth) Morgan Coulee Cr. 33-13 Brush Cr. Cave Cr. Cr. 27-13 Cr. 19-10 Cr. 32-7 Cr. 5-5 Cr. 9-12Station Number: 1 2 3 4 5 1 2 3 1 1 1 1 1 1 1 1WIBC: 2441700 2441700 2441700 2441700 2441700 2440700 2440700 2440700 2441600 2442000 2442100 2444100 2443300 2443200 2443000 2444950Sampling Date: 07/12/00 07/11/00 07/12/00 07/12/00 07/12/00 07/05/00 07/05/00 07/05/00 07/05/00 07/11/00 07/11/00 07/13/00 08/01/00 08/01/00 07/12/00 07/13/00River Mile: 0.58 1.71 3.08 4.13 4.79 0.42 1.42 2.63 0.17 1.17 0.92 0.33 0.13 0.67 0.02 0.04Station Length (m): 266 259 280 210 175 110 111 100 100 100 245 100 105 100 100 100Basin Area (sq. mi.): 25.5
FISH SPECIES CODE * THE BOLDED SPECIES ARE INTOLERENT Brown Trout I21 323 341 201 71 7 158 11 6 4Brook Trout * I23 52 92 146 159 298 85 4 4 4 99 52 29 39 96Rainbow Trout I19Tiger Trout I27 1Northern Pike L02Walleye X22Yellow Perch X15Largemouth Bass W12Smallmouth Bass * W11Bluegill W09Green Sunfish W05Pumpkinseed W06Blacknose Dace M48 52 2 2Bluntnose Minnow M45 5Central Stoneroller M06Common Shiner M28Creek Chub M50 9 2 34 16Fathead Minnow M46 2Hornyhead Chub M19Longnose Dace M49 12 1 1 1 60Southern Redbelly Dace M43 13Redside Dace * M09 2Mimic Shiner M40Emerald Shiner M23Spotfin Shiner M36Common Carp M12River Carpsucker N05Northern Hogsucker * N13Silver Redhorse N18Golden Redhorse N21Shorthead Redhorse N22White Sucker N09 1 2 31 23Johnny Darter X12 4Logperch X16Rainbow Darter * X07Fantail Darter X10 1Iowa Darter * X09 33Blackside Darter X18Brook Stickleback U01 27 21 6 32 19 20 54 2Central Mudminnow K01 145Mottled Sculpin * Z01 11 723 2 208 57Slimy Sculpin * Z02 664 1284 871 737 450 4 57Burbot R01Amer. Brook Lamprey * A05Ammocete LampreyFreshwater Drum Y01
COLDWATER IBI CALCULATIONSNo. of Intolerant Species 2 2 2 2 2 2 1 1 2 0 2 3 2 2 2 1Score 20 20 20 20 20 20 10 10 20 0 20 20 20 20 20 10% Tolerant Individuals 0.0% 10.0% 0.0% 0.0% 0.3% 27.8% 0.0% 0.0% 5.7% 81.1% 5.6% 42.5% 0.0% 0.0% 0.0% 0.0%Score 20 20 20 20 20 0 20 20 10 0 10 0 20 20 20 20% Top Carnivores 35.5% 24.9% 19.6% 23.2% 40.1% 54.3% 33.3% 8.6% 8.6% 0.0% 23.5% 0.0% 22.8% 34.5% 41.8% 100.0%Score 10 10 10 10 10 20 10 0 0 0 10 0 10 10 10 20% Native Stenothermal 68.2% 80.3% 93.7% 92.8% 98.8% 72.2% 100.0% 100.0% 94.3% 18.9% 74.4% 15.9% 95.2% 97.7% 96.9% 100.0%Score 10 10 20 20 20 10 20 20 20 0 10 0 20 20 20 20% Brook Trout of Salmonids 13.7% 21.3% 68.2% 69.3% 97.7% 100.0% 100.0% 100.0% 100.0% 0.0% 38.6% 0.0% 79.0% 93.3% 92.7% 100.0%Score 10 10 10 10 20 20 20 20 20 0 10 0 10 10 10 20
OVERALL IBI SCORE 70 70 80 80 90 70 80 70 70 0 60 20 80 80 80 90OVERALL IBI RATING Good Good Good Good Excell Good Good Good Good V. Poor Good Poor Good Good Good Excell
- 36 -
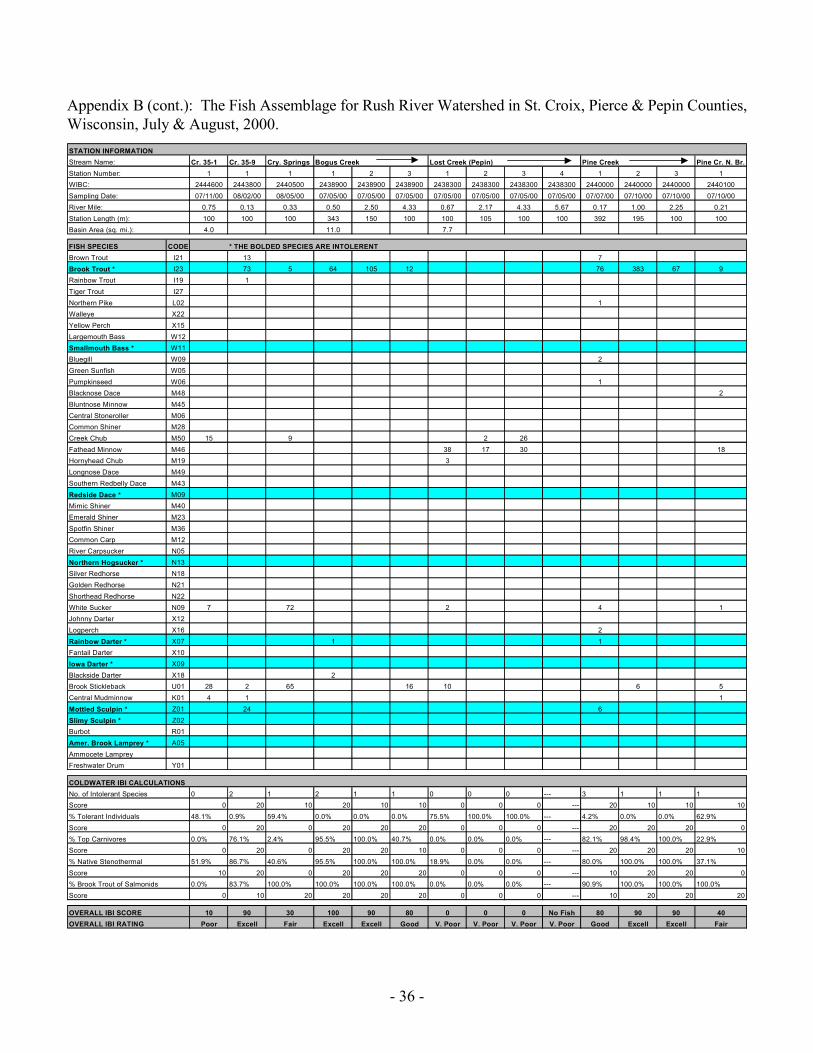
Appendix B (cont.): The Fish Assemblage for Rush River Watershed in St. Croix, Pierce & Pepin Counties,Wisconsin, July & August, 2000.STATION INFORMATIONStream Name: Cr. 35-1 Cr. 35-9 Cry. Springs Bogus Creek Lost Creek (Pepin) Pine Creek Pine Cr. N. Br.Station Number: 1 1 1 1 2 3 1 2 3 4 1 2 3 1WIBC: 2444600 2443800 2440500 2438900 2438900 2438900 2438300 2438300 2438300 2438300 2440000 2440000 2440000 2440100Sampling Date: 07/11/00 08/02/00 08/05/00 07/05/00 07/05/00 07/05/00 07/05/00 07/05/00 07/05/00 07/05/00 07/07/00 07/10/00 07/10/00 07/10/00River Mile: 0.75 0.13 0.33 0.50 2.50 4.33 0.67 2.17 4.33 5.67 0.17 1.00 2.25 0.21Station Length (m): 100 100 100 343 150 100 100 105 100 100 392 195 100 100Basin Area (sq. mi.): 4.0 11.0 7.7
FISH SPECIES CODE * THE BOLDED SPECIES ARE INTOLERENT Brown Trout I21 13 7Brook Trout * I23 73 5 64 105 12 76 383 67 9Rainbow Trout I19 1Tiger Trout I27Northern Pike L02 1Walleye X22Yellow Perch X15Largemouth Bass W12Smallmouth Bass * W11Bluegill W09 2Green Sunfish W05Pumpkinseed W06 1Blacknose Dace M48 2Bluntnose Minnow M45Central Stoneroller M06Common Shiner M28Creek Chub M50 15 9 2 26Fathead Minnow M46 38 17 30 18Hornyhead Chub M19 3Longnose Dace M49Southern Redbelly Dace M43Redside Dace * M09Mimic Shiner M40Emerald Shiner M23Spotfin Shiner M36Common Carp M12River Carpsucker N05Northern Hogsucker * N13Silver Redhorse N18Golden Redhorse N21Shorthead Redhorse N22White Sucker N09 7 72 2 4 1Johnny Darter X12Logperch X16 2Rainbow Darter * X07 1 1Fantail Darter X10Iowa Darter * X09Blackside Darter X18 2Brook Stickleback U01 28 2 65 16 10 6 5Central Mudminnow K01 4 1 1Mottled Sculpin * Z01 24 6Slimy Sculpin * Z02Burbot R01Amer. Brook Lamprey * A05Ammocete LampreyFreshwater Drum Y01
COLDWATER IBI CALCULATIONSNo. of Intolerant Species 0 2 1 2 1 1 0 0 0 --- 3 1 1 1Score 0 20 10 20 10 10 0 0 0 --- 20 10 10 10% Tolerant Individuals 48.1% 0.9% 59.4% 0.0% 0.0% 0.0% 75.5% 100.0% 100.0% --- 4.2% 0.0% 0.0% 62.9%Score 0 20 0 20 20 20 0 0 0 --- 20 20 20 0% Top Carnivores 0.0% 76.1% 2.4% 95.5% 100.0% 40.7% 0.0% 0.0% 0.0% --- 82.1% 98.4% 100.0% 22.9%Score 0 20 0 20 20 10 0 0 0 --- 20 20 20 10% Native Stenothermal 51.9% 86.7% 40.6% 95.5% 100.0% 100.0% 18.9% 0.0% 0.0% --- 80.0% 100.0% 100.0% 37.1%Score 10 20 0 20 20 20 0 0 0 --- 10 20 20 0% Brook Trout of Salmonids 0.0% 83.7% 100.0% 100.0% 100.0% 100.0% 0.0% 0.0% 0.0% --- 90.9% 100.0% 100.0% 100.0%Score 0 10 20 20 20 20 0 0 0 --- 10 20 20 20
OVERALL IBI SCORE 10 90 30 100 90 80 0 0 0 No Fish 80 90 90 40OVERALL IBI RATING Poor Excell Fair Excell Excell Good V. Poor V. Poor V. Poor V. Poor Good Excell Excell Fair
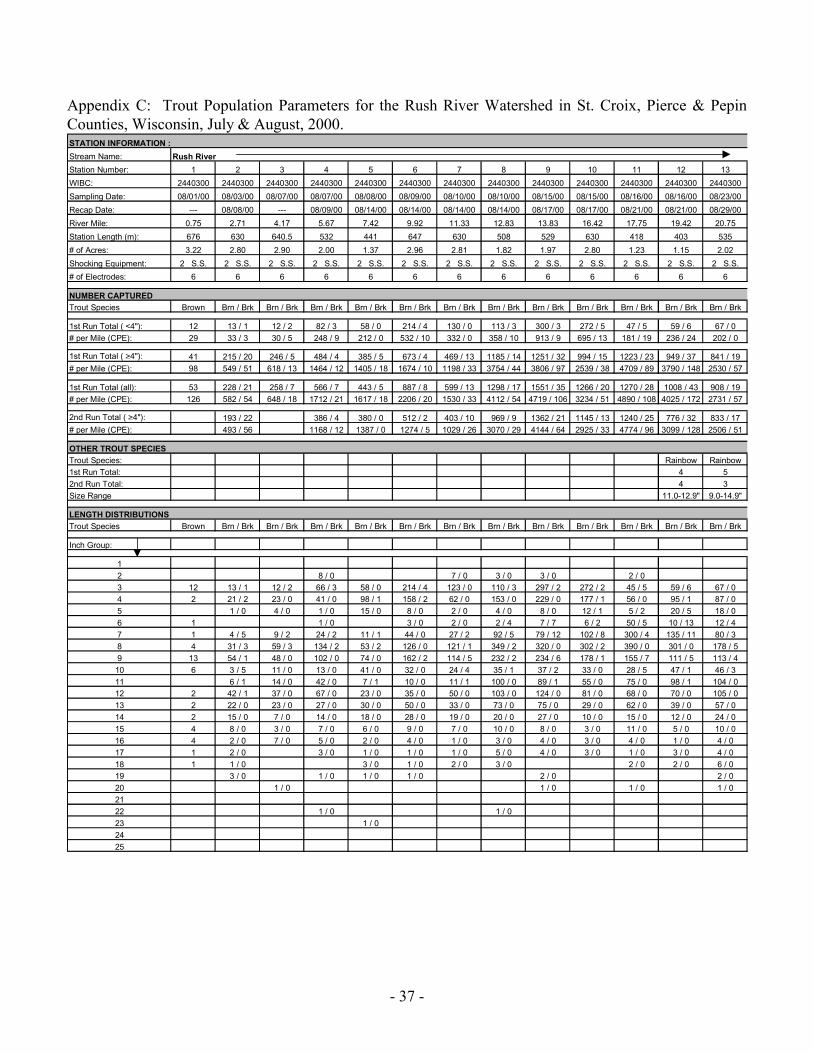
- 37 -
Appendix C: Trout Population Parameters for the Rush River Watershed in St. Croix, Pierce & PepinCounties, Wisconsin, July & August, 2000.STATION INFORMATION : Stream Name: Rush RiverStation Number: 1 2 3 4 5 6 7 8 9 10 11 12 13WIBC: 2440300 2440300 2440300 2440300 2440300 2440300 2440300 2440300 2440300 2440300 2440300 2440300 2440300Sampling Date: 08/01/00 08/03/00 08/07/00 08/07/00 08/08/00 08/09/00 08/10/00 08/10/00 08/15/00 08/15/00 08/16/00 08/16/00 08/23/00Recap Date: --- 08/08/00 --- 08/09/00 08/14/00 08/14/00 08/14/00 08/14/00 08/17/00 08/17/00 08/21/00 08/21/00 08/29/00River Mile: 0.75 2.71 4.17 5.67 7.42 9.92 11.33 12.83 13.83 16.42 17.75 19.42 20.75Station Length (m): 676 630 640.5 532 441 647 630 508 529 630 418 403 535# of Acres: 3.22 2.80 2.90 2.00 1.37 2.96 2.81 1.82 1.97 2.80 1.23 1.15 2.02Shocking Equipment: 2 S.S. 2 S.S. 2 S.S. 2 S.S. 2 S.S. 2 S.S. 2 S.S. 2 S.S. 2 S.S. 2 S.S. 2 S.S. 2 S.S. 2 S.S.# of Electrodes: 6 6 6 6 6 6 6 6 6 6 6 6 6
NUMBER CAPTUREDTrout Species Brown Brn / Brk Brn / Brk Brn / Brk Brn / Brk Brn / Brk Brn / Brk Brn / Brk Brn / Brk Brn / Brk Brn / Brk Brn / Brk Brn / Brk
1st Run Total ( <4"): 12 13 / 1 12 / 2 82 / 3 58 / 0 214 / 4 130 / 0 113 / 3 300 / 3 272 / 5 47 / 5 59 / 6 67 / 0# per Mile (CPE): 29 33 / 3 30 / 5 248 / 9 212 / 0 532 / 10 332 / 0 358 / 10 913 / 9 695 / 13 181 / 19 236 / 24 202 / 0
1st Run Total ( >4"): 41 215 / 20 246 / 5 484 / 4 385 / 5 673 / 4 469 / 13 1185 / 14 1251 / 32 994 / 15 1223 / 23 949 / 37 841 / 19# per Mile (CPE): 98 549 / 51 618 / 13 1464 / 12 1405 / 18 1674 / 10 1198 / 33 3754 / 44 3806 / 97 2539 / 38 4709 / 89 3790 / 148 2530 / 57
1st Run Total (all): 53 228 / 21 258 / 7 566 / 7 443 / 5 887 / 8 599 / 13 1298 / 17 1551 / 35 1266 / 20 1270 / 28 1008 / 43 908 / 19# per Mile (CPE): 126 582 / 54 648 / 18 1712 / 21 1617 / 18 2206 / 20 1530 / 33 4112 / 54 4719 / 106 3234 / 51 4890 / 108 4025 / 172 2731 / 57
2nd Run Total ( >4"): 193 / 22 386 / 4 380 / 0 512 / 2 403 / 10 969 / 9 1362 / 21 1145 / 13 1240 / 25 776 / 32 833 / 17# per Mile (CPE): 493 / 56 1168 / 12 1387 / 0 1274 / 5 1029 / 26 3070 / 29 4144 / 64 2925 / 33 4774 / 96 3099 / 128 2506 / 51
OTHER TROUT SPECIESTrout Species: Rainbow Rainbow1st Run Total: 4 52nd Run Total: 4 3Size Range 11.0-12.9" 9.0-14.9"
LENGTH DISTRIBUTIONSTrout Species Brown Brn / Brk Brn / Brk Brn / Brk Brn / Brk Brn / Brk Brn / Brk Brn / Brk Brn / Brk Brn / Brk Brn / Brk Brn / Brk Brn / Brk
Inch Group:
12 8 / 0 7 / 0 3 / 0 3 / 0 2 / 03 12 13 / 1 12 / 2 66 / 3 58 / 0 214 / 4 123 / 0 110 / 3 297 / 2 272 / 2 45 / 5 59 / 6 67 / 04 2 21 / 2 23 / 0 41 / 0 98 / 1 158 / 2 62 / 0 153 / 0 229 / 0 177 / 1 56 / 0 95 / 1 87 / 05 1 / 0 4 / 0 1 / 0 15 / 0 8 / 0 2 / 0 4 / 0 8 / 0 12 / 1 5 / 2 20 / 5 18 / 06 1 1 / 0 3 / 0 2 / 0 2 / 4 7 / 7 6 / 2 50 / 5 10 / 13 12 / 47 1 4 / 5 9 / 2 24 / 2 11 / 1 44 / 0 27 / 2 92 / 5 79 / 12 102 / 8 300 / 4 135 / 11 80 / 38 4 31 / 3 59 / 3 134 / 2 53 / 2 126 / 0 121 / 1 349 / 2 320 / 0 302 / 2 390 / 0 301 / 0 178 / 59 13 54 / 1 48 / 0 102 / 0 74 / 0 162 / 2 114 / 5 232 / 2 234 / 6 178 / 1 155 / 7 111 / 5 113 / 410 6 3 / 5 11 / 0 13 / 0 41 / 0 32 / 0 24 / 4 35 / 1 37 / 2 33 / 0 28 / 5 47 / 1 46 / 311 6 / 1 14 / 0 42 / 0 7 / 1 10 / 0 11 / 1 100 / 0 89 / 1 55 / 0 75 / 0 98 / 1 104 / 012 2 42 / 1 37 / 0 67 / 0 23 / 0 35 / 0 50 / 0 103 / 0 124 / 0 81 / 0 68 / 0 70 / 0 105 / 013 2 22 / 0 23 / 0 27 / 0 30 / 0 50 / 0 33 / 0 73 / 0 75 / 0 29 / 0 62 / 0 39 / 0 57 / 014 2 15 / 0 7 / 0 14 / 0 18 / 0 28 / 0 19 / 0 20 / 0 27 / 0 10 / 0 15 / 0 12 / 0 24 / 015 4 8 / 0 3 / 0 7 / 0 6 / 0 9 / 0 7 / 0 10 / 0 8 / 0 3 / 0 11 / 0 5 / 0 10 / 016 4 2 / 0 7 / 0 5 / 0 2 / 0 4 / 0 1 / 0 3 / 0 4 / 0 3 / 0 4 / 0 1 / 0 4 / 017 1 2 / 0 3 / 0 1 / 0 1 / 0 1 / 0 5 / 0 4 / 0 3 / 0 1 / 0 3 / 0 4 / 018 1 1 / 0 3 / 0 1 / 0 2 / 0 3 / 0 2 / 0 2 / 0 6 / 019 3 / 0 1 / 0 1 / 0 1 / 0 2 / 0 2 / 020 1 / 0 1 / 0 1 / 0 1 / 02122 1 / 0 1 / 023 1 / 02425
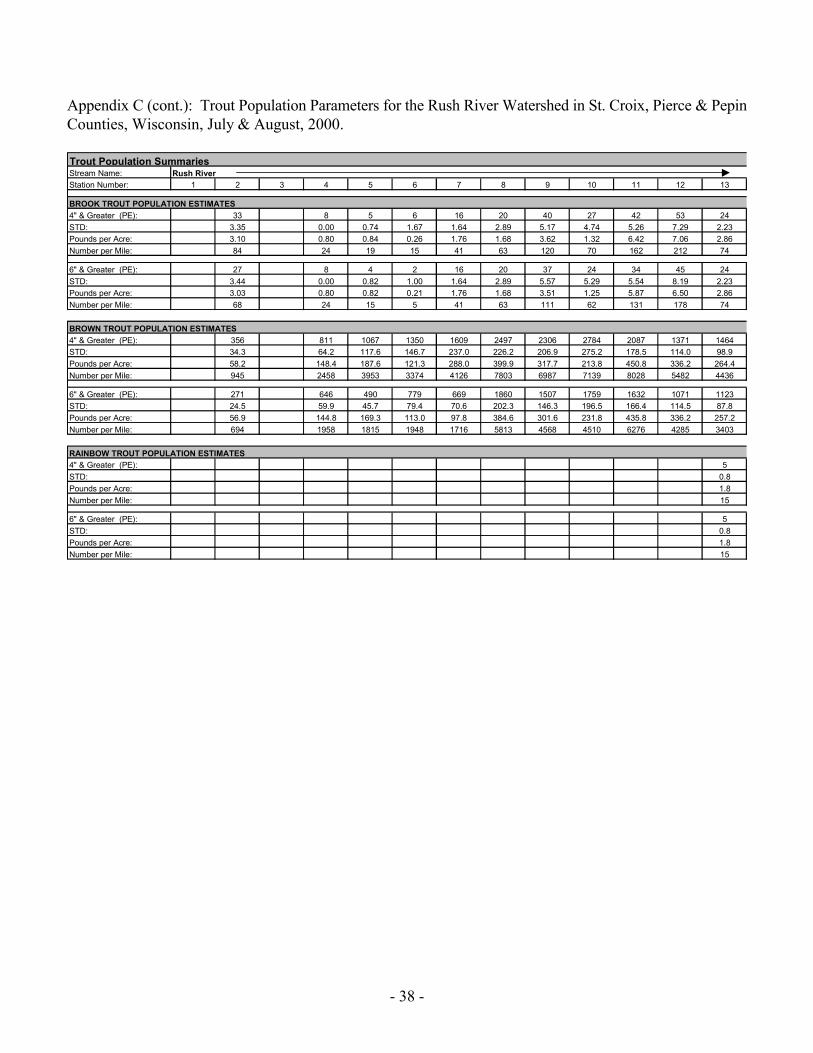
- 38 -
Appendix C (cont.): Trout Population Parameters for the Rush River Watershed in St. Croix, Pierce & PepinCounties, Wisconsin, July & August, 2000.
Trout Population Summaries Stream Name: Rush RiverStation Number: 1 2 3 4 5 6 7 8 9 10 11 12 13
BROOK TROUT POPULATION ESTIMATES4" & Greater (PE): 33 8 5 6 16 20 40 27 42 53 24STD: 3.35 0.00 0.74 1.67 1.64 2.89 5.17 4.74 5.26 7.29 2.23Pounds per Acre: 3.10 0.80 0.84 0.26 1.76 1.68 3.62 1.32 6.42 7.06 2.86Number per Mile: 84 24 19 15 41 63 120 70 162 212 74
6" & Greater (PE): 27 8 4 2 16 20 37 24 34 45 24STD: 3.44 0.00 0.82 1.00 1.64 2.89 5.57 5.29 5.54 8.19 2.23Pounds per Acre: 3.03 0.80 0.82 0.21 1.76 1.68 3.51 1.25 5.87 6.50 2.86Number per Mile: 68 24 15 5 41 63 111 62 131 178 74
BROWN TROUT POPULATION ESTIMATES4" & Greater (PE): 356 811 1067 1350 1609 2497 2306 2784 2087 1371 1464STD: 34.3 64.2 117.6 146.7 237.0 226.2 206.9 275.2 178.5 114.0 98.9Pounds per Acre: 58.2 148.4 187.6 121.3 288.0 399.9 317.7 213.8 450.8 336.2 264.4Number per Mile: 945 2458 3953 3374 4126 7803 6987 7139 8028 5482 4436
6" & Greater (PE): 271 646 490 779 669 1860 1507 1759 1632 1071 1123STD: 24.5 59.9 45.7 79.4 70.6 202.3 146.3 196.5 166.4 114.5 87.8Pounds per Acre: 56.9 144.8 169.3 113.0 97.8 384.6 301.6 231.8 435.8 336.2 257.2Number per Mile: 694 1958 1815 1948 1716 5813 4568 4510 6276 4285 3403
RAINBOW TROUT POPULATION ESTIMATES4" & Greater (PE): 5STD: 0.8Pounds per Acre: 1.8Number per Mile: 15
6" & Greater (PE): 5STD: 0.8Pounds per Acre: 1.8Number per Mile: 15
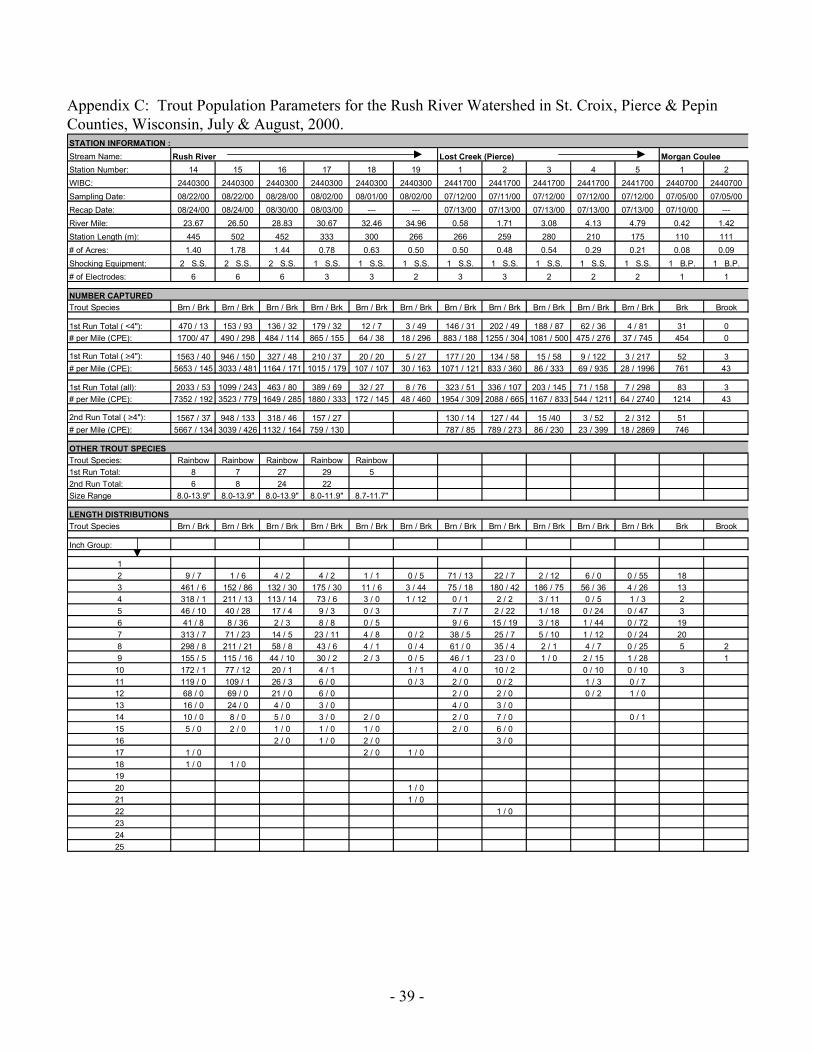
- 39 -
Appendix C: Trout Population Parameters for the Rush River Watershed in St. Croix, Pierce & PepinCounties, Wisconsin, July & August, 2000.STATION INFORMATION : Stream Name: Rush River Lost Creek (Pierce) Morgan CouleeStation Number: 14 15 16 17 18 19 1 2 3 4 5 1 2WIBC: 2440300 2440300 2440300 2440300 2440300 2440300 2441700 2441700 2441700 2441700 2441700 2440700 2440700Sampling Date: 08/22/00 08/22/00 08/28/00 08/02/00 08/01/00 08/02/00 07/12/00 07/11/00 07/12/00 07/12/00 07/12/00 07/05/00 07/05/00Recap Date: 08/24/00 08/24/00 08/30/00 08/03/00 --- --- 07/13/00 07/13/00 07/13/00 07/13/00 07/13/00 07/10/00 ---River Mile: 23.67 26.50 28.83 30.67 32.46 34.96 0.58 1.71 3.08 4.13 4.79 0.42 1.42Station Length (m): 445 502 452 333 300 266 266 259 280 210 175 110 111# of Acres: 1.40 1.78 1.44 0.78 0.63 0.50 0.50 0.48 0.54 0.29 0.21 0.08 0.09Shocking Equipment: 2 S.S. 2 S.S. 2 S.S. 1 S.S. 1 S.S. 1 S.S. 1 S.S. 1 S.S. 1 S.S. 1 S.S. 1 S.S. 1 B.P. 1 B.P.# of Electrodes: 6 6 6 3 3 2 3 3 2 2 2 1 1
NUMBER CAPTUREDTrout Species Brn / Brk Brn / Brk Brn / Brk Brn / Brk Brn / Brk Brn / Brk Brn / Brk Brn / Brk Brn / Brk Brn / Brk Brn / Brk Brk Brook
1st Run Total ( <4"): 470 / 13 153 / 93 136 / 32 179 / 32 12 / 7 3 / 49 146 / 31 202 / 49 188 / 87 62 / 36 4 / 81 31 0# per Mile (CPE): 1700/ 47 490 / 298 484 / 114 865 / 155 64 / 38 18 / 296 883 / 188 1255 / 304 1081 / 500 475 / 276 37 / 745 454 0
1st Run Total ( >4"): 1563 / 40 946 / 150 327 / 48 210 / 37 20 / 20 5 / 27 177 / 20 134 / 58 15 / 58 9 / 122 3 / 217 52 3# per Mile (CPE): 5653 / 145 3033 / 481 1164 / 171 1015 / 179 107 / 107 30 / 163 1071 / 121 833 / 360 86 / 333 69 / 935 28 / 1996 761 43
1st Run Total (all): 2033 / 53 1099 / 243 463 / 80 389 / 69 32 / 27 8 / 76 323 / 51 336 / 107 203 / 145 71 / 158 7 / 298 83 3# per Mile (CPE): 7352 / 192 3523 / 779 1649 / 285 1880 / 333 172 / 145 48 / 460 1954 / 309 2088 / 665 1167 / 833 544 / 1211 64 / 2740 1214 43
2nd Run Total ( >4"): 1567 / 37 948 / 133 318 / 46 157 / 27 130 / 14 127 / 44 15 /40 3 / 52 2 / 312 51# per Mile (CPE): 5667 / 134 3039 / 426 1132 / 164 759 / 130 787 / 85 789 / 273 86 / 230 23 / 399 18 / 2869 746
OTHER TROUT SPECIESTrout Species: Rainbow Rainbow Rainbow Rainbow Rainbow1st Run Total: 8 7 27 29 52nd Run Total: 6 8 24 22Size Range 8.0-13.9" 8.0-13.9" 8.0-13.9" 8.0-11.9" 8.7-11.7"
LENGTH DISTRIBUTIONSTrout Species Brn / Brk Brn / Brk Brn / Brk Brn / Brk Brn / Brk Brn / Brk Brn / Brk Brn / Brk Brn / Brk Brn / Brk Brn / Brk Brk Brook
Inch Group:
12 9 / 7 1 / 6 4 / 2 4 / 2 1 / 1 0 / 5 71 / 13 22 / 7 2 / 12 6 / 0 0 / 55 183 461 / 6 152 / 86 132 / 30 175 / 30 11 / 6 3 / 44 75 / 18 180 / 42 186 / 75 56 / 36 4 / 26 134 318 / 1 211 / 13 113 / 14 73 / 6 3 / 0 1 / 12 0 / 1 2 / 2 3 / 11 0 / 5 1 / 3 25 46 / 10 40 / 28 17 / 4 9 / 3 0 / 3 7 / 7 2 / 22 1 / 18 0 / 24 0 / 47 36 41 / 8 8 / 36 2 / 3 8 / 8 0 / 5 9 / 6 15 / 19 3 / 18 1 / 44 0 / 72 197 313 / 7 71 / 23 14 / 5 23 / 11 4 / 8 0 / 2 38 / 5 25 / 7 5 / 10 1 / 12 0 / 24 208 298 / 8 211 / 21 58 / 8 43 / 6 4 / 1 0 / 4 61 / 0 35 / 4 2 / 1 4 / 7 0 / 25 5 29 155 / 5 115 / 16 44 / 10 30 / 2 2 / 3 0 / 5 46 / 1 23 / 0 1 / 0 2 / 15 1 / 28 1
10 172 / 1 77 / 12 20 / 1 4 / 1 1 / 1 4 / 0 10 / 2 0 / 10 0 / 10 311 119 / 0 109 / 1 26 / 3 6 / 0 0 / 3 2 / 0 0 / 2 1 / 3 0 / 712 68 / 0 69 / 0 21 / 0 6 / 0 2 / 0 2 / 0 0 / 2 1 / 013 16 / 0 24 / 0 4 / 0 3 / 0 4 / 0 3 / 014 10 / 0 8 / 0 5 / 0 3 / 0 2 / 0 2 / 0 7 / 0 0 / 115 5 / 0 2 / 0 1 / 0 1 / 0 1 / 0 2 / 0 6 / 016 2 / 0 1 / 0 2 / 0 3 / 017 1 / 0 2 / 0 1 / 018 1 / 0 1 / 01920 1 / 021 1 / 022 1 / 0232425
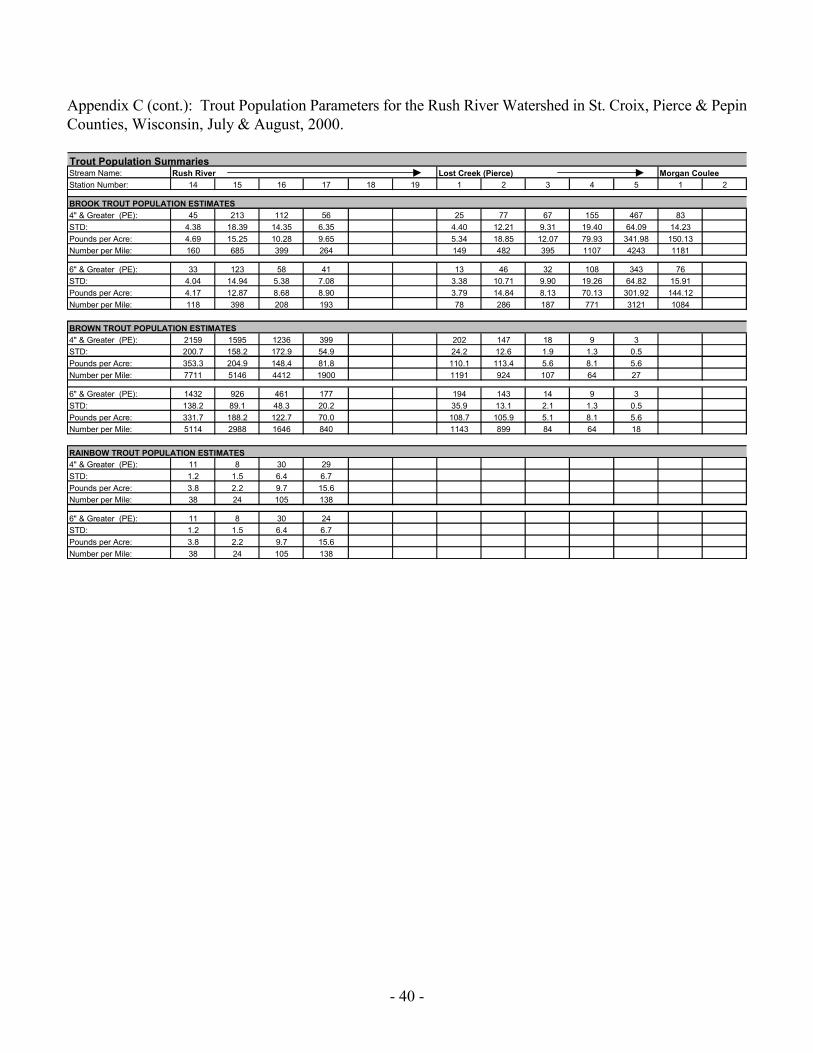
- 40 -
Appendix C (cont.): Trout Population Parameters for the Rush River Watershed in St. Croix, Pierce & PepinCounties, Wisconsin, July & August, 2000.
Trout Population Summaries Stream Name: Rush River Lost Creek (Pierce) Morgan CouleeStation Number: 14 15 16 17 18 19 1 2 3 4 5 1 2
BROOK TROUT POPULATION ESTIMATES4" & Greater (PE): 45 213 112 56 25 77 67 155 467 83STD: 4.38 18.39 14.35 6.35 4.40 12.21 9.31 19.40 64.09 14.23Pounds per Acre: 4.69 15.25 10.28 9.65 5.34 18.85 12.07 79.93 341.98 150.13Number per Mile: 160 685 399 264 149 482 395 1107 4243 1181
6" & Greater (PE): 33 123 58 41 13 46 32 108 343 76STD: 4.04 14.94 5.38 7.08 3.38 10.71 9.90 19.26 64.82 15.91Pounds per Acre: 4.17 12.87 8.68 8.90 3.79 14.84 8.13 70.13 301.92 144.12Number per Mile: 118 398 208 193 78 286 187 771 3121 1084
BROWN TROUT POPULATION ESTIMATES4" & Greater (PE): 2159 1595 1236 399 202 147 18 9 3STD: 200.7 158.2 172.9 54.9 24.2 12.6 1.9 1.3 0.5Pounds per Acre: 353.3 204.9 148.4 81.8 110.1 113.4 5.6 8.1 5.6Number per Mile: 7711 5146 4412 1900 1191 924 107 64 27
6" & Greater (PE): 1432 926 461 177 194 143 14 9 3STD: 138.2 89.1 48.3 20.2 35.9 13.1 2.1 1.3 0.5Pounds per Acre: 331.7 188.2 122.7 70.0 108.7 105.9 5.1 8.1 5.6Number per Mile: 5114 2988 1646 840 1143 899 84 64 18
RAINBOW TROUT POPULATION ESTIMATES4" & Greater (PE): 11 8 30 29STD: 1.2 1.5 6.4 6.7Pounds per Acre: 3.8 2.2 9.7 15.6Number per Mile: 38 24 105 138
6" & Greater (PE): 11 8 30 24STD: 1.2 1.5 6.4 6.7Pounds per Acre: 3.8 2.2 9.7 15.6Number per Mile: 38 24 105 138

- 41 -
Appendix C: Trout Population Parameters for the Rush River Watershed in St. Croix, Pierce & PepinCounties, Wisconsin, July & August, 2000.STATION INFORMATION : Stream Name: Morgan C. Cr. 33-13 Brush Cr. Cave Cr. Cr. 27-13 Cr. 19-10 Cr. 32-7 Cr. 5-5 Cr. 9-12 Cr. 35-1 Cr. 35-9 Cry. SpringsStation Number: 3 1 1 1 1 1 1 1 1 1 1 1WIBC: 2440700 2441600 2442000 2442100 2444100 2443300 2443200 2443000 2444950 2444600 2443800 2440500Sampling Date: 07/05/00 07/05/00 07/11/00 07/11/00 07/13/00 08/01/00 08/01/00 07/12/00 07/13/00 07/11/00 08/02/00 08/05/00Recap Date: --- --- --- 07/12/00 --- 08/02/00 --- 07/12/00 07/13/00 --- 08/02/00River Mile: 2.63 0.17 1.17 0.92 0.33 0.13 0.67 0.02 0.04 0.75 0.13 0.33Station Length (m): 100 100 100 245 100 105 100 100 100 100 100 100# of Acres: 0.06 0.05 0.06 0.41 0.02 0.08 0.05 0.04 0.06 0.06 0.03 0.06Shocking Equipment: 1 B.P. 1 B.P. 1 B.P. 2 B.P. 1 B.P. 1 B.P. 1 B.P. 1 B.P. 1 B.P. 1 B.P. 1 B.P. 1 B.P.# of Electrodes: 1 1 1 2 1 1 1 1 1 1 1 1
NUMBER CAPTUREDTrout Species Brook Brook Brn / Brk Brn / Brk Brn / Brk Brn / Brk Brk Brn / Brk Brook
1st Run Total ( <4"): 0 1 47 / 14 7 / 20 6 / 6 3 / 6 40 13 / 36 3# per Mile (CPE): 0 16 309 / 92 107 / 307 97 / 97 48 / 97 644 209 / 579 48
1st Run Total ( >4"): 3 2 111 / 84 4 / 28 0 / 22 1 / 32 55 0 / 36 1# per Mile (CPE): 48 32 729 / 552 61 / 429 0 / 354 16 / 515 885 0 / 579 16
1st Run Total (all): 3 3 158 / 98 11 / 48 6 / 28 4 / 38 95 13 / 72 4# per Mile (CPE): 48 48 1038 / 644 169 / 736 97 / 451 64 / 612 1529 209 / 1159 64
2nd Run Total ( >4"): 68 / 73 8 / 27 1 / 31 39 0 / 32# per Mile (CPE): 447 / 480 123 / 414 16 / 499 628 0 / 515
OTHER TROUT SPECIESTrout Species: Rainbow1st Run Total: 12nd Run Total: 1Size Range 6.9"
LENGTH DISTRIBUTIONS BrookTrout Species Brook Brook Brn / Brk Brn / Brk Brn / Brk Brn / Brk Brk Brn / Brk
Inch Group:
1 12 8 / 7 2 / 0 2 / 4 1 / 2 37 3 / 9 23 1 39 / 7 7 / 18 4 / 2 2 / 4 2 10 / 27 14 1 / 3 3 / 3 0 / 5 19 0 / 7 15 6 / 39 0 / 20 0 / 11 0 / 13 25 0 / 166 1 25 / 36 0 / 4 0 / 6 0 / 15 7 0 / 107 40 / 10 0 / 1 1 / 3 2 0 / 28 2 2 22 / 4 1 / 1 0 / 1 0 / 19 5 / 1 0 / 1 110 111 2 / 1 0 / 112 3 / 013 2 / 014 3 / 015 1 / 01617 1 / 01819202122232425
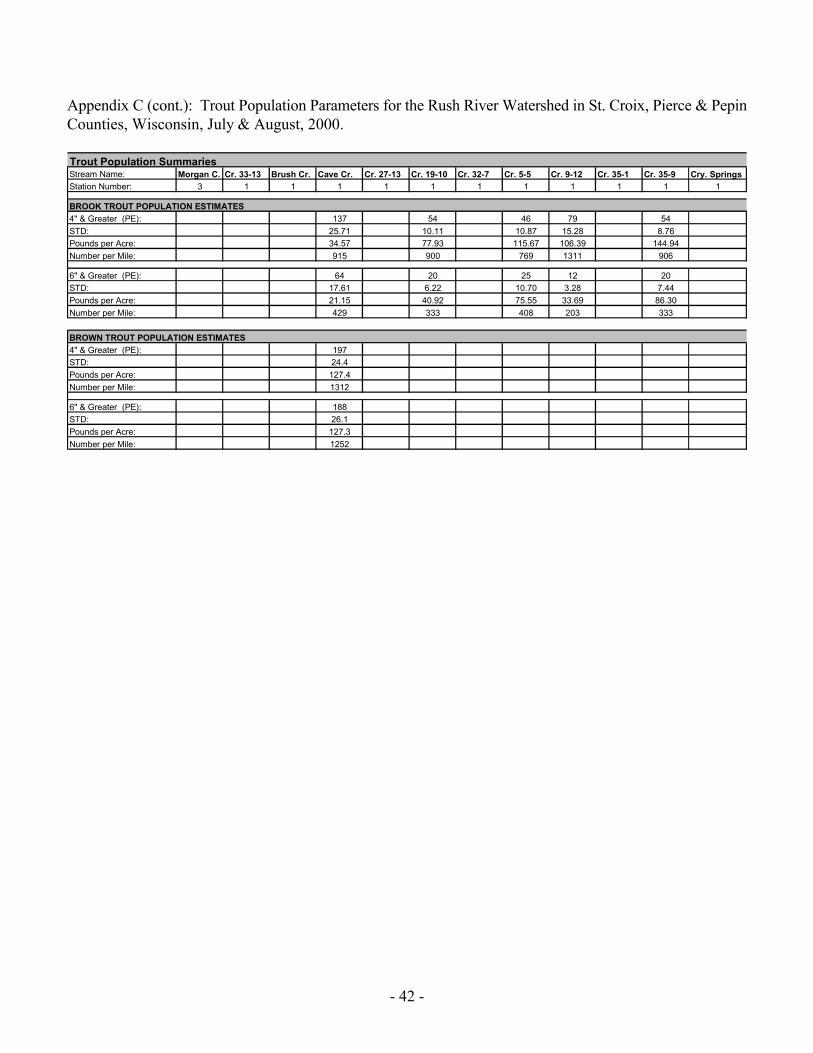
- 42 -
Appendix C (cont.): Trout Population Parameters for the Rush River Watershed in St. Croix, Pierce & PepinCounties, Wisconsin, July & August, 2000.
Trout Population Summaries Stream Name: Morgan C. Cr. 33-13 Brush Cr. Cave Cr. Cr. 27-13 Cr. 19-10 Cr. 32-7 Cr. 5-5 Cr. 9-12 Cr. 35-1 Cr. 35-9 Cry. SpringsStation Number: 3 1 1 1 1 1 1 1 1 1 1 1
BROOK TROUT POPULATION ESTIMATES4" & Greater (PE): 137 54 46 79 54STD: 25.71 10.11 10.87 15.28 8.76Pounds per Acre: 34.57 77.93 115.67 106.39 144.94Number per Mile: 915 900 769 1311 906
6" & Greater (PE): 64 20 25 12 20STD: 17.61 6.22 10.70 3.28 7.44Pounds per Acre: 21.15 40.92 75.55 33.69 86.30Number per Mile: 429 333 408 203 333
BROWN TROUT POPULATION ESTIMATES4" & Greater (PE): 197STD: 24.4Pounds per Acre: 127.4Number per Mile: 1312
6" & Greater (PE): 188STD: 26.1Pounds per Acre: 127.3Number per Mile: 1252

- 43 -
Appendix C: Trout Population Parameters for the Rush River Watershed in St. Croix, Pierce & PepinCounties, Wisconsin, July & August, 2000.STATION INFORMATION : Stream Name: Bogus Creek Lost Creek (Pepin) Pine Creek Pine Cr. N. Br.Station Number: 1 2 3 1 2 3 4 1 2 3 1WIBC: 2438900 2438900 2438900 2438300 2438300 2438300 2438300 2440000 2440000 2440000 2440100Sampling Date: 07/05/00 07/05/00 07/05/00 07/05/00 07/05/00 07/05/00 07/05/00 07/07/00 07/10/00 07/10/00 07/10/00Recap Date: 07/07/00 07/07/00 07/11/00 07/11/00River Mile: 0.50 2.50 4.33 0.67 2.17 4.33 5.67 0.17 1.00 2.25 0.21Station Length (m): 105 150 100 100 105 100 100 392 195 100 100# of Acres: 0.08 0.16 0.05 0.05 0.08 0.05 0.05 1.08 0.27 0.07 0.05Shocking Equipment: 1 B.P. 1 B.P. 1 B.P. 1 B.P. 1 B.P. 1 B.P. 1 B.P. 1 S.S. 1 S.S. 1 B.P. 1 B.P.# of Electrodes: 1 1 1 1 1 1 1 3 3 1 1
NUMBER CAPTUREDTrout Species Brook Brook Brook Brn / Brk Brn / Brk Brook Brook
1st Run Total ( <4"): 1 44 8 0 / 20 0 / 161 6 0# per Mile (CPE): 16 472 129 0 / 82 1329 97 0
1st Run Total ( >4"): 61 60 3 7 / 55 1 / 221 60 8# per Mile (CPE): 982 644 48 29 / 226 8 / 1824 966 129
1st Run Total (all): 62 104 11 7 / 75 1 / 382 66 8# per Mile (CPE): 998 1116 177 29 / 308 8 / 3153 1062 129
2nd Run Total ( >4"): 42 54 0 / 162 40# per Mile (CPE): 676 579 0 / 1337 644
OTHER TROUT SPECIESTrout Species:1st Run Total:2nd Run Total:Size Range
LENGTH DISTRIBUTIONSTrout Species Brook Brook Brook Brn / Brk Brn / Brk Brk Brook
Inch Group:
12 1 43 6 0 / 18 0 / 160 63 0 1 2 0 / 2 0 / 14 2 10 0 / 6 0 / 22 225 23 30 0 / 25 0 / 78 24 56 27 12 0 / 12 0 / 25 117 5 6 1 0 / 7 1 / 36 3 18 1 1 2 3 / 2 0 / 47 29 3 1 3 / 0 0 / 1310 0 / 111 1 / 012 0 / 113 0 / 1141516171819202122232425
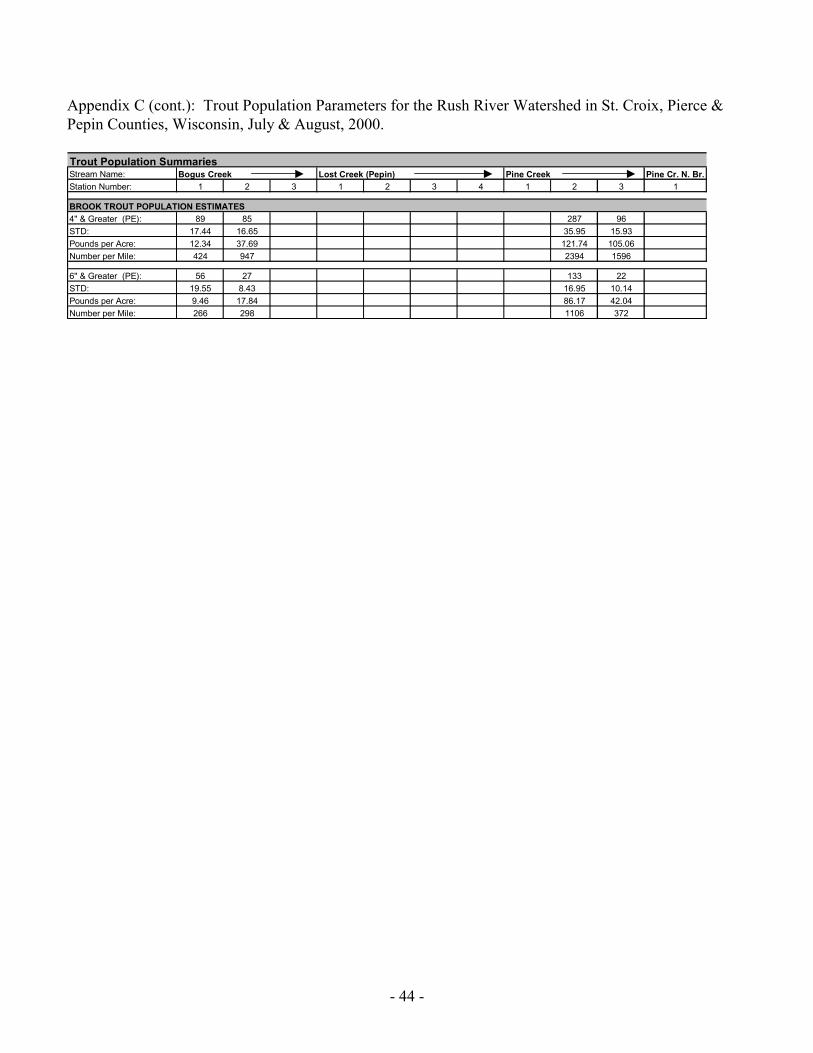
- 44 -
Appendix C (cont.): Trout Population Parameters for the Rush River Watershed in St. Croix, Pierce &Pepin Counties, Wisconsin, July & August, 2000.
Trout Population SummariesStream Name: Bogus Creek Lost Creek (Pepin) Pine Creek Pine Cr. N. Br.Station Number: 1 2 3 1 2 3 4 1 2 3 1
BROOK TROUT POPULATION ESTIMATES4" & Greater (PE): 89 85 287 96STD: 17.44 16.65 35.95 15.93Pounds per Acre: 12.34 37.69 121.74 105.06Number per Mile: 424 947 2394 1596
6" & Greater (PE): 56 27 133 22STD: 19.55 8.43 16.95 10.14Pounds per Acre: 9.46 17.84 86.17 42.04Number per Mile: 266 298 1106 372