rural water supply study - elbert county, colorado - cds/elbert county rural water supply...
TRANSCRIPT

Rural Water Supply Study REVISED DRAFT VERSION
February 2018
Page 1 of 58
Page 1 of 58

Submitted by:
56 Inverness Drive East, Suite 112
Englewood, CO 80112
Project No. 04-16-0199
Page 2 of 58
Page 2 of 58

TABLE OF CONTENTS PAGE Executive Summary E-1 Chapter 1 Introduction 1-1
1.1 Project Overview ................................................................................................. 1-1 1.2 Elbert County Hydrology and Hydrogeology ...................................................... 1-2 1.2.1 – Surface Water........................................................................................... 1-2 1.2.2 – Alluvial Aquifers ..................................................................................... 1-2 1.2.2 – The Denver Basin .................................................................................... 1-2 1.3 Study Objectives .................................................................................................. 1-5 1.3.1 – Planning Areas ......................................................................................... 1-5 1.4 Background Information ...................................................................................... 1-6 1.5 Abbreviations ....................................................................................................... 1-7 Map 1-1 Map 1-2 Map 1-3
Chapter 2 Existing Water Supply and Systems 2-1
2.1 General ................................................................................................................. 2-1 2.2 Municipalities ...................................................................................................... 2-2 2.3 Special Districts ................................................................................................... 2-4 Map 2-1
Chapter 3 Future Water Supplies 3-1
3.1 General ................................................................................................................. 3-1 3.2 Current and Future Population ............................................................................. 3-1 3.2.1 – Current and Future Populations for Elbert County .................................. 3-2 3.2.2 – Current and Future Populations for Planning Areas ................................ 3-3 3.3 Current and Future Demands ............................................................................... 3-4 3.3.1 – Residential and Commercial .................................................................... 3-4 3.3.2 - Irrigation ................................................................................................... 3-5 3.3.3 - Livestock .................................................................................................. 3-6 3.3.4 - Oil and Gas ............................................................................................... 3-7 3.3.5 - Total Countywide Projected Demand ....................................................... 3-8 3.3.6 - Total Projected Demand by Planning Area ............................................ 3-10 3.4 Denver Basin Storage Volume Estimates .......................................................... 3-10 3.4.1 – Current Storage ...................................................................................... 3-10 3.4.2 – Future Remaining Storage ..................................................................... 3-11
Chapter 4 Water Resource Options 4-1
4.1 General ................................................................................................................. 4-1 4.2 Water Supply Options .......................................................................................... 4-2 4.2.1 Import (Renewable Water) ......................................................................... 4-2
Page 3 of 58
Page 3 of 58

4.2.2 Reuse ........................................................................................................... 4-2 4.2.3 Agricultural Transfer .................................................................................. 4-2 4.3 Alternatives Evaluation ........................................................................................ 4-2 4.3.1 Scenario 1: No Renewable Water Import ................................................... 4-4 4.3.2 Scenario 2: 10% Renewable Water Import ................................................. 4-5 4.3.3 Scenario 3: 25% Renewable Water Import ................................................. 4-5 4.4 Other Management Practices ............................................................................... 4-6 4.4.1 Storage ........................................................................................................ 4-6 4.4.2 Reuse Water Systems .................................................................................. 4-6 4.4.3 Conservation Practices ................................................................................ 4-7
Chapter 5 Cost Benefit Analysis 5-1
5.1 General ................................................................................................................. 5-1 5.2 Cost Components ................................................................................................. 5-1 5.2.1 Infrastructure ............................................................................................... 5-1 5.2.2 Operations and Maintenance (O&M) Costs ............................................... 5-3 5.2.3 Water Rights ............................................................................................... 5-3 5.2.4 Agricultural Transfer .................................................................................. 5-3 5.2.5 Groundwater Pumping and the Prototypical Well Analysis ....................... 5-3 5.3 Alternatives Cost Summary ................................................................................. 5-5 5.3.1 Scenario 1 (0% Renewable Water Import) ................................................. 5-5 5.3.2 Scenario 2 (10% Renewable Water Import) ............................................... 5-5 5.3.3 Scenario 3 (25% Renewable Water Import) ............................................... 5-6 Map 5-1
Chapter 6 Summary and Recommendations 6-1
6.1 General ................................................................................................................. 6-1 6.2 Summary and Conclusions .................................................................................. 6-1 6.3 Qualitative Benefits ............................................................................................. 6-2 6.4 Cost Benefits ........................................................................................................ 6-2 6.5 Management and Oversight ................................................................................. 6-2 6.5.1 Regional System ......................................................................................... 6-3 6.5.2 Formation of Management Districts ........................................................... 6-3 6.5.3 Funding ....................................................................................................... 6-3 6.6 Recommendations ................................................................................................ 6-5
References
Appendices: NOT INCLUDED IN THIS DRAFT Appendix A: Memorandum: Tasks 1 and 2 – Elbert County Groundwater Supply and USGS Modeling by McGrane Water Engineers, plus figures Appendix B: Memorandum: Task 3 – Prototypical Well Analysis Details by McGrane Water Engineers
Appendix C: Special District Service Plans Summary/Inventory Appendix D: Alternatives Cost Details
Page 4 of 58
Page 4 of 58

EXECUTIVE SUMMARY
GENERAL Elbert County is a sprawling rural county with a long history of farming and cattle ranching. The county is facing growth pressure from the Denver metropolitan area while trying to preserve the rural character that is so important to its residents. Elbert County’s population is largely concentrated in the areas of Elizabeth and Kiowa in the west, and to the northwest, near Parker and Aurora; these are the areas expected to grow the most. In fact, the county is expected to grow from a 2015 population of approximately 24,700 to a population of over 68,000 by 2050. The county’s residents are almost entirely dependent on nonrenewable Denver Basin groundwater, particularly in the west. The majority of residents rely on domestic wells into the shallower bedrock aquifers (Upper and Lower Dawson), while those served by municipalities or special districts generally rely on deeper aquifers (Denver and Arapahoe). Elbert County’s very limited surface water, and alluvial supplies such as the Kiowa-Bijou and Upper Big Sandy Designated Basins, are primarily used for agriculture. ANALYSIS Approximately half of Elbert County’s total water demand of 17,900 AF in 2017 was met by Denver Basin groundwater. As total annual demand in the county is projected to approach 23,000 AF by 2050, approximately 15,700 AF of that future demand must be met by Denver Basin groundwater (or alternative supplies); nearly 70 percent of the total. Meeting that share of the projected 2050 demand with only Denver Basin groundwater would represent an 80 percent increase over its 2017 use, but the total recoverable volume of Denver Basin groundwater in Elbert County is currently estimated at 54 MAF. Cumulative demands estimated now through 2050 would be expected to reduce the total recoverable volume by only 0.75 percent to 53.6 MAF, and the annual demand in 2050 would take only 0.03 percent of that remaining volume.
FUTURE SUPPLY ALTERNATIVES While this Study presents a countywide analysis, there is greater focus on areas where the most growth is anticipated. The Elizabeth-Kiowa and Northwest planning areas are projected to have a total population of over 59,000 in 2050, comprising 87 percent of the county’s population. The projected water demand for those areas will then total nearly 9,000 AF. This demand could be met through water reuse, agricultural transfers, and one of three water supply alternatives as described: Water Reuse – 810 AF (9 percent of planned demand) 1. New reuse treatment facility starting operation in the Elizabeth-Kiowa area in 2027
2. New reuse treatment facility starting operation in the Northwest area in 2032
Page 5 of 58
Page 5 of 58

Agricultural Transfers – 300 AF (3 percent of planned demand) Water supplies to be converted from agricultural to municipal use as development occurs
Alternatives for Main Supply - 7,860 AF (88 percent of planned demand) 1. No renewable water imported from outside the county; demand met fully by Denver
Basin groundwater
2. 10 Percent renewable water imported from outside the county starting in 2035, reducing the Denver Basin share to 90 percent
3. 25 Percent renewable water imported from outside the county starting in 2035, reducing the Denver Basin share to 75 percent
A present-worth cost analysis, including capital, operation, and maintenance costs to be incurred through 2050 for a combination of reuse, agricultural transfers, and each of the three supply alternatives is shown in Table E-1.
Table E-1 Alternative Groundwater
Pumping Renewable
Water & Reuse Total Cost
Scenario 1 (No Import) $458M $49M $507M Scenario 2 (10% Import) $387M $85M $472M Scenario 3 (25% Import) $367M $134M $501M
CONCLUSIONS In total, the Denver Basin supply is plentiful and can meet Elbert County demands well into the future if managed carefully. There are many variables that can affect well production, however. With heavy dependence on Denver Basin groundwater throughout the region, aquifer pressures are expected to continue declining. That results in less driving force pushing water into the wells, and production at each well will likely decline over time. Also, the aquifers are not homogeneous, and more significant localized declines, or even lost production could occur in certain areas, and at the fringes of the aquifers. Considering the total present-worth costs of water production through 2050 for both water providers and domestic well owners, meeting 10 percent of the main supply needs for the Elizabeth-Kiowa and Northwest planning areas with renewable water imported from outside the county by 2035 (Scenario 2) could save as much as $35M. Having such a system in place would also hedge against the possibility of an increasing rate of decline in the Denver Basin aquifers over the long term.
RECOMMENDATIONS As Elbert County continues to grow, water supply planning and management will become increasingly important. Forsgren recommends the following actions:
Page 6 of 58
Page 6 of 58

1. The USGS is completing a three-year well monitoring program that provides data on pressure levels in the aquifers from over 30 Denver Basin wells. The County should make this an ongoing program and continue to monitor this primary supply indefinitely.
2. Denver Basin groundwater should be preserved as much as practicable through water conservation and efficiency, extending the economically useful life of the aquifers. Front Range water providers have found that tiered water rates in which higher usages are charged at escalating unit costs, are the most effective means of promoting conservation. The County should incentivize central water systems to develop such rate structures.
3. Denver Basin water can be preserved further if a portion of future demands is met by water reuse. Reuse requires sanitary sewer systems to collect wastewater for centralized treatment. The water can then either be distributed to irrigation sites (possibly even individual residences, depending on the level of treatment) or returned to blend with a potable water supply (normally, after first passing through an environmental buffer such as a lake, river, or aquifer). This also points to the need for a service provider to collect wastewater for treatment and reuse.
4. Centralized water service, and possibly sewer service followed by reuse, are only economically practicable for denser developments due to the costs of constructing and maintaining those piping networks. The County should consider incentivizing denser developments that use centralized water and sewer systems.
5. Water providers are also able to economically develop community well systems pumping from the deeper Denver and Arapahoe aquifers, leaving the shallower aquifers for the more dispersed domestic well users.
6. The County’s 300-year rule for new development using Denver Basin groundwater promotes dispersed development on 5- and 10-acre ranchettes vs. subdivisions served by a water distribution system. The County should consider allowing variances to the 300-year rule as an incentive for developers that commit to “best practices” which may include: (1) producing water only from the deeper aquifers; (2) promoting conservation and efficiency through a tiered rate structure; (3) collecting wastewater for treatment and reuse to offset a portion of demand; and (4) adopting water efficient landscaping standards.
7. The cost analysis shows the economy of meeting a portion of future demand with imported renewable supplies to offset 10 percent of projected Denver Basin use in the key planning areas. However, financing, constructing, and then operating a water import system will require many years of planning and collaboration by Elbert County water providers, possibly with facilitation by the County. It will also require working with water providers and regional water partnerships outside of Elbert County. The County and/or its water providers should start engaging in regional water planning as soon as practicable.
Page 7 of 58
Page 7 of 58

8. The County should evaluate storage options further; surface storage as well as recharge and storage in bedrock and alluvial aquifers. Storage will become more important as reuse and renewable water options are implemented.
9. The County could also facilitate provisions for future renewable water delivery by identifying and securing transmission pipeline corridors and treatment plant sites. This could be part of the County’s broader framework of water, wastewater, and reuse systems in the planned growth areas to guide future development. The County should develop a “water and wastewater master plan” to serve as a reference during the land-use planning process so that developers build their systems for compatibility with the bigger picture.
10. Localized zones of low well productivity, or along fringes of the aquifers may not be conducive to dense development, or it may be necessary to have water piped from satellite well fields located in more productive areas. Mapping of these low production zones by aquifer should be considered in the land-use planning process.
Page 8 of 58
Page 8 of 58

Elbert County Rural Water Supply Study Introduction
Page 1-1 Elbert County February 2018
CHAPTER 1 INTRODUCTION
1.1 PROJECT OVERVIEW
Elbert County is a rural, sprawling county with a long history of farming and cattle ranching. The county is feeling growth pressure from the expanding Denver metropolitan area while trying to preserve the rural character that is so important to its residents. At 1,849 square miles, the 2010 population was 23,086 making it the 24th most populous county in the state; in 2015 the population was estimated at 24,694 with a projected population of 68,375 in 2050. Elbert County is situated south and east of Denver and is included in the Denver-Aurora Metropolitan Statistical Area; bounded on the north by Arapahoe County, on the east by Lincoln County, on the southwest by El Paso County, and the west by Douglas County (see Map 1-1: Elbert County and Planning Areas at the end of this chapter) Elbert County’s population is largely concentrated on the west near the towns of Elizabeth and Kiowa and the northwest county lines where the fast growing Denver Metropolitan area is quickly expanding. Elbert County is almost entirely dependent on Denver Basin groundwater for its water supplies. The majority of Elbert County’s residents rely on their own domestic water wells for drinking water, irrigation and other household needs, and do not fall within a water or sewer service provider area. The water and sewer providers in the county, whether they are municipalities or special districts, also rely on Denver Basin groundwater through municipal supply wells. Denver Basin groundwater is considered a nonrenewable water supply. Recharge rates for the Denver Basin aquifers are very slow, and rates of withdrawal far exceed them. Therefore, the county is dependent on a source of water that cannot be relied upon forever. This issue has become more apparent as the state continues to experience a rapid increase in population. In 2016, U.S. Census Bureau estimates show that from 2010-2016, the population of Colorado increased by 511,221, the majority of which are born in, or moving to the Denver Metropolitan Area. This growth is reflected in northwest Elbert County. Observed water level declines in the Denver Basin along with the expected increases in population leads to the need for a better understanding of the water availability in these aquifers for Elbert County residents. This Rural Water Supply Study was developed for Elbert County to examine the reliability of current and future water supplies and under varying projected growth scenarios. The goal is to take a comprehensive view of water supply and infrastructure systems, develop policy options, and identify time-critical thresholds to ensure adequate water supply to meet Elbert County’s future needs.
Page 9 of 58
Page 9 of 58

Elbert County Rural Water Supply Study Introduction
Page 1-2 Elbert County February 2018
1.2 ELBERT COUNTY HYDROLOGY AND HYDROGEOLOGY This section will overview the surface water supplies available in the county as well as overview the Denver Basin groundwater supplies.
1.2.1 Surface Water
Surface water supplies are very limited in Elbert County, despite the 44 named streams that exist. These streams are all small ephemeral tributaries to either the South Platte River or the Arkansas River, and are fed by brief rain events. However, some streams are fed by alluvial groundwater and are able to provide adequate water supplies via alluvial wells (see Section 1.2.2). The county is split between Water Divisions 1 and 2 by the Palmer Divide that spans from the southwest to the northeast through the county. See Map 1-2: “Elbert County Hydrology and Irrigation” at the end of this chapter.
1.2.2 Alluvial Aquifers
Alluvial sand, gravel, and clay deposits overlie the bedrock formations along major stream channels, and these materials form an unconfined alluvial aquifer where saturated with groundwater. In Elbert County, the more significant alluvial aquifers simulated in recent modeling by the Colorado Water Conservation Board (CWCB) as part of the South Platte Decision Support System (SPDSS) study (CDM, 2013) include Wolf, Comanche, and West Bijou Creeks (tributaries to the South Platte River), and the Nussbaum alluvial aquifer in the southeastern portion of the county. The Nussbaum aquifer is in contact with the Big Sandy Creek alluvium on its northern edge, which is a tributary to the Arkansas River. Two designated basins have a significant portion of their areas within Elbert County. They are the Kiowa Bijou Designated Basin and the Upper Big Sandy Designated Basin.
1.2.3 The Denver Basin
Much of Elbert County overlies the Denver Basin aquifer system. From oldest to youngest, or deepest to shallowest, the four main units of the Denver Basin are: the Laramie-Fox Hills aquifer, the Arapahoe aquifer, the Denver aquifer, and the Dawson aquifer (Paschke et. al., 2011) – See Figure 1-1. The Dawson is commonly divided into two units, the Upper Dawson, and the Lower Dawson. See map 1-3: Denver Basin Aquifer Extents in Elbert County at the end of this chapter.
Page 10 of 58
Page 10 of 58

Elbert County Rural Water Supply Study Introduction
Page 1-3 Elbert County February 2018
Figure 1-1 Generalized Geologic Cross Section of the Denver Basin Aquifer System
(Everett, 2014, modified from Robson, 1987)
Figure 1-2 Conceptual Diagram of the Denver Basin Aquifer System (from Paschke et. al., USGS, 2011)
Page 11 of 58
Page 11 of 58

Elbert County Rural Water Supply Study Introduction
Page 1-4 Elbert County February 2018
Figure 1-2 is a block diagram for the southern portion of Denver Basin illustrating the shape of the geologic units located beneath Elbert County. In layman’s terms, the Denver Basin is shaped like a giant bowl. As the center of the basin slowly sank over geologic millennia, the bowl was filled with a sequence of sand, silt, and clay deposits that were compressed to form sedimentary rock. The west side of the bowl slopes steeply up against the uplifted Front Range, and the east side of the bowl slopes gently towards Nebraska and Kansas.
For more detailed information on the Denver Basin aquifers, including depth, water levels, well yields, thicknesses, and water quality, see memorandum by McGrane Water Engineering titled “Tasks 1 and 2 – Elbert County Groundwater Supply and USGS Modeling” dated September 12, 2017 in Appendix A. In summary:
The Laramie-Fox Hills aquifer, as seen in figures 1-1, and 1-2 above, is the deepest and most extensive of the aquifers and its base is approximately 2,200 to 2,300 feet below land surface at the structural center of the basin, and it ranges from 100 to 500 ft in thickness.
The Arapahoe aquifer ranges from 400 to 600 ft in thickness and its base is approximately 1,700 ft below land surface at the structural center of the basin.
The Denver aquifer ranges from 600 to 1,200 ft in thickness.
The Lower Dawson in Elbert County typically ranges from 600 to over 800 feet deep.
The Upper Dawson in Elbert County typically ranges from 200-500 feet deep in Elbert County.
1.3 STUDY OBJECTIVES
The goal of this study is to take a comprehensive view of water supply and infrastructure systems, and to develop policy options and identify time-critical thresholds to ensure adequate water supply to meet Elbert County’s future needs. The main scope of effort relies upon six main Study Objectives:
1. Identify supplies and quantify long-term projected water demand for Elbert County through the 2050 planning horizon under varying growth scenarios (Chapters 2, 3).
2. Review recent Denver Basin groundwater studies and water level data for Elbert County (Appendices A and B)
3. Assess the sustainability of current future use of Denver Basin groundwater by Elbert County’s rural residents, water districts, and municipalities (Chapter 3).
Page 12 of 58
Page 12 of 58

Elbert County Rural Water Supply Study Introduction
Page 1-5 Elbert County February 2018
4. Identify water resource options, and opportunities to optimize existing and future water supply infrastructure including renewable water, reuse and water efficiency alternatives (Chapter 4).
5. Provide comparative cost-benefit analysis for water resource alternatives and identify potential funding scenarios (Chapter 5).
6. Identify goals, opportunities, challenges and measurable outcomes for decision makers’ policy development, and time-critical thresholds for preserving options for existing and new water supply (Chapter 6).
1.3.1 Planning Areas
Although this study presents a countywide analysis, there is a focus on three specific planning areas. These planning areas were chosen at the direction of the Board of County Commissioners (BOCC) due to the high population density and expected growth. These three study areas are: the Northwest Planning Area, the Elizabeth-Kiowa Planning Area, and the Eastern Planning Area (see Figure 1-3).
Figure 1-3 Elbert County and the Three Planning Areas
!5
!5!5
!5
!5
!5SIMLA
KIOWA
AGATE
ELBERT
MATHESON
ELIZABETH
£¤24
§̈¦70
UV86
Northwest Planning Area
Elizabeth-Kiowa Planning Area
Eastern Planning Area
A r a p a h o e C o u n t yA r a p a h o e C o u n t y
Do
ug
las
C
ou
nt
yD
ou
gla
s
Co
un
ty
Li
nc
ol
n
Co
un
ty
Li
nc
ol
n
Co
un
ty
E l P a s o C o u n t yE l P a s o C o u n t y
Page 13 of 58
Page 13 of 58

Elbert County Rural Water Supply Study Introduction
Page 1-6 Elbert County February 2018
1.4 BACKGROUND INFORMATION
In completing this report, several previous studies/reports were referenced:
The Denver Basin Groundwater Model developed by Paschke et. al. and described in the USGS Professional Paper 1770 titled Groundwater Availability of the Denver Basin Aquifer System, 2011. This model was used in determining groundwater storage under Elbert County, future drawdown, and to help determine future pumping costs.
USGS Report 2014-5171, Groundwater Levels in the Denver Basin Bedrock Aquifers of Douglas County, Colorado 2011-2013 by Rhett R. Everett.
The Douglas County Rural Water Supply System Feasibility Study, URS Corporation in association with Harvey Economics, 2013
1.5 ABBREVIATIONS
This section presents common abbreviations used in this report.
AF: acre-feet AFD: acre-feet per day AFY: acre-feet per year AFY: acre-feet per year BOCC: Board of County Commissioners CCF: hundred cubic feet CDPHE: Colorado Department of Public Health and Environment CIP: Capital improvement plan CWCB: Colorado Water Conservation Board DOLA: Department of Local Affairs DWR: Division of Water Resources (Office of State Engineer) FT: feet FT-MSL: feet, mean sea level GAL: gallons GPCD: gallons per capita per day GPD: gallons per day GPM: gallons per minute HP: horsepower IPR: indirect potable reuse LIRF: lawn irrigation return flows KGAL: one thousand gallons MAF: million acre-feet MCL: maximum contaminant level MGAL: one million gallons MGD: million gallons per day
Page 14 of 58
Page 14 of 58

Elbert County Rural Water Supply Study Introduction
Page 1-7 Elbert County February 2018
SDO: State Demography Office SDS: Southern Delivery System SEO: State Engineer’s Office (Office of the State Engineer) SFE: single family equivalent SMWSA: South Metro Water Supply Authority SWSI: Statewide Water Supply Initiative WCP: Water Conservation Plan WHMD: Woodmen Hills Metro District WISE: Water Infrastructure and Supply Efficiency Partnership WRF: Water Reclamation Facility WSMP: Water Supply Master Plan WTP: Water Treatment Plant
Page 15 of 58
Page 15 of 58

!5
!5
!5
!5
!5
!5
!.
Big Sandy Creek
Mustang Creek
South Rush CreekMiddle Rush Creek
Antelope CreekHorse Creek
North Rush Creek
Adobe Creek
Long Creek
Skull Creek
Apache Creek
Little Horse Creek
Kiowa
Creek
East Bijou Creek
West Bijou
Creek
Runn
ing Cr
eek
Coma
nche
Cree
k
Wolf C
reek
Wilson Creek
Beaver Creek
Dry C
reek
Middle B
ijou C
reek
Bland C
reek
Sprin
g Bran
ch
Agate Creek
Reed
Sprin
gs Cr
eek
Key Creek
Gold
Creek
Cool Cree
k
West K
iowa C
reek
Muddy Creek
Gopher Creek
Coal Cree
k
Arikaree River
Rattlesnake CreekBox E
lder C
reek
First Creek
Middlemist Creek
Rattle
snak
e Cree
k
SIMLA
KIOWA
AGATE
ELBERT
MATHESON
ELIZABETH
ELBERT
EL PASO
LINCOLN
ARAPAHOE
DOUGLAS
WASHINGTON
£¤24
§̈¦70
²0 5 10 15 20 25Miles
MAP LEGEND
ELBERT COUNTY RURAL WATER SUPPLY STUDY
Projection:UTM Zone 13N, metersNAD83
Drawn by: L. Rein
Map 1-1: Elbert County and Planning Areas
UV86
!5 City/Town
Highways
Elbert County Boundary
Streams in Water Division 1
Streams in Water Division 2
Planning AreasEastern Planning Area
Elizabeth-Kiowa Planning Area
NW Planning Area
WELDMOFFAT
MESA
BACA
YUMA
PARK
LAS ANIMAS
ROUTT
LARIMER
GUNNISON
GARFIELD
LINCOLN
PUEBLO
BENTSAGUACHE
LOGAN
GRANDRIO BLANCO
KIOWA
EAGLE
EL PASO
ELBERT
MONTROSE
WASHINGTON
DELTA
KIT CARSON
JACKSON
OTERO
LA PLATA
ADAMS
CHEYENNE
PROWERS
FREMONT
MONTEZUMA
PITKIN
MORGAN
HUERFANO
CONEJOSCOSTILLA
CHAFFEE
HINSDALE
ARCHULETA
DOLORES
SAN MIGUEL
MINERAL
CUSTER
DOUGLAS
PHILLIPS
BOULDER
CROWLEYOURAY
ARAPAHOE
TELLER
LAKE
RIO GRANDE ALAMOSA
SEDGWICK
SUMMIT JEFFERSON
SAN JUAN
CLEAR CREEKGILPIN
DENVER
Water Division 1
Water Division 2
Date: 12/5/2017
LIMON
Page 16 of 58
Page 16 of 58

! ! ! ! ! ! ! ! ! ! ! ! ! ! ! ! ! ! ! ! ! ! ! ! ! ! ! ! ! ! ! ! ! ! ! ! ! ! ! ! ! ! ! ! ! ! ! ! ! ! ! ! ! ! ! ! ! ! ! ! ! ! ! ! ! ! ! ! ! ! ! ! ! ! ! ! ! ! ! ! ! ! ! ! ! ! ! ! ! ! ! ! ! ! ! ! ! ! ! ! ! ! ! ! ! ! ! ! ! ! ! ! ! ! ! ! ! ! ! ! ! ! ! ! ! ! ! ! ! ! ! ! ! ! ! ! ! ! ! ! ! ! ! ! ! ! ! ! ! ! ! ! ! ! ! ! ! ! ! ! ! ! ! ! ! ! ! ! ! ! ! ! ! ! ! ! ! ! ! ! ! ! ! ! ! ! ! ! ! ! ! ! ! ! ! ! ! ! ! ! ! ! ! ! ! ! ! ! ! ! ! ! ! ! ! ! ! ! ! ! ! ! ! ! ! ! ! ! ! ! ! ! ! ! ! ! ! ! ! ! ! ! ! ! ! ! ! ! ! ! ! ! ! ! ! ! ! ! ! ! ! ! ! ! ! ! ! ! ! ! ! ! ! ! ! ! ! ! ! ! ! ! ! ! ! ! ! ! ! ! ! ! ! ! ! ! ! ! ! ! ! ! ! ! ! ! ! ! ! ! ! ! ! ! ! ! ! ! ! ! ! ! ! ! ! ! ! ! ! ! ! ! ! ! ! ! ! ! ! ! ! ! ! ! ! ! ! ! ! ! ! ! ! ! ! ! ! ! ! ! ! ! ! ! ! ! ! ! ! ! ! ! ! ! ! ! ! ! ! ! ! ! ! ! ! ! ! ! ! ! ! ! ! ! ! ! ! ! ! ! ! ! ! ! ! ! ! ! ! ! ! ! ! ! ! ! ! ! ! ! ! ! ! ! ! ! ! ! ! ! ! ! ! ! ! ! ! ! ! ! ! ! ! ! ! ! ! ! ! ! ! ! ! ! ! ! ! ! ! ! ! ! ! ! ! ! ! ! ! ! ! ! ! ! ! ! ! ! ! ! ! ! ! ! ! ! ! ! ! ! ! ! ! !
!!
!!
!!
!!
!!
!!
!!
!!
!!
!!
!!
!!
!!
!!
!!
!!
!!
!!
!!
!!
!!
!!
!!
!!
!!
!!
!!
!!
!!
!!
!!
!!
!!
!!
!!
!!
!!
!!
!!
!!
!!
!!
!!
!!
!!
!!
!!
!!
!!
!!
!!
!!
!!
!!
!!
!!
!!
!!
!!
!!
!!
!!
!!
!!
!!
!!
!!
!!
!!
!!
!!
!!
!!
!!
!!
!!
!!
!!
!!
!!
!!
!!
!!
!!
!!
!!
!!
!!
!!
!!
!!
!!
!!
!!
!!
!!
!!
!!
!!
!!
!!
!!
!!
!!
!!
!!
!!
!!
!!
!!
!!
!!
!!
!!
!!
!!
!!
!!
!!
!!
!!
!!
!!
!!
!!
!!
!!
!!
!!
!!
!!
!!
!!
!!
!!
!!
!!
!!
!!
!!
!!
!!
!!
!!
!!
!!
!!
!!
!!
!!
!!
!!
!!
!!
!!
!!
!!
!!
!!
!!
!!
!!
!!
!!
!!
!!
!!
!!
!!
!!
!!
!!
!!
!!
!!
!!
!!
!!
!!
!!
!!
!!
!!
!!
!!!!!!
!!!!!!
!!
!!
!!
!!
!!
!!
!!
!!
!!
!!
!!
!!
!!!!
!!
!!
!!!!
!!!!
!!
!!!!!!
!!
!!
!!
!!
!!
!!
!!
!!
!!
!!
!!
!!
!!
!!
!!
!!
!!
!!
!!
!!
!!
!!
!!
!!
!!
!!!!
!!
!!!!
!!!!
!!
!!
!!
!!
!!
!!
!!!!!!!!!!!!!!!!!!!!!!!!
!!
!!!
!
!!
!!
!!!!!!!!!!!!
!!
!!
!!
!!
!!
!!
!!
!!
!!
!!
!!
!!
!!
!!
!!
!!
!!
!!
!!
!!
!!
!!
!!
!!
!!
!!
!!
!!
!!
!!
!!
!!
!!
!!
!!
!!
!!
!!
!!
!!
!!
!!!!
!!
!!
!!
!!
!!
!!
!!
!!
!!
!!
!!
!!
!!
!!
!!
!!!!
!!
!!
!!
!!
!!
!!
!!
!!
!!
!!
!!!
!
!!
!!
!!
!!
!!
!!
!!
!!!!
!!!!
!!
!!
!!!!
!!
!!
!!
!!
!!
!!
!!
!!
!!
!!
!!
!!!!
!!
!!!!!!
!!
!!
!!
!!
!!
!!!!
!!!!!!!!
!!
!!
!!
!!!!
!!
!!
!!
!!
!!
!!
!!
!!
!!
!!!!!!
!!!!
!!
!!
!!
!!
!!
!!
!!
!!
!!
!!
!!
!!
!!
!!
!!
!!
!!
!!
!!
!!
!
!
!!
!!
!!
!!
!!!!!!!!!!
!!
!!!!
!!!!
!!
!!
!!
!!!
!
!
!
!!
!!
!!
!!
!!
!!
!!
!!!!!!!!!!
!!
!!!!
!!
!!!!
!!
!!
!!
!!
!!
!!
!!
!!
!
!!!
!!
!!
!!
!!
!!
!!
!!
!!
!!
!!
!!!!
!!!
!
!!
!!
!
!
!
!
!
!
!
!
!!
!!!
!
!!
!
!
!!
!
!
!
!
!!
!
!
!!
!!!
!
!
!
!!
!!
!!
!!
!!
!!
!!
!!
!!
!!!
!
!!
!!
!
!
!
!!
!
!!
!!
!!
!!
!!
!!
!
!!!!
!
!!
! !
!!
!!
!!
!!
!!
!!
!!
!
!
!
!
!!
!!
!!
!!
!!
!!
!!
!!
!!
! !
!!
!!
!!
!
!
! !
!!
! !! ! !
!
!!
!
!
! ! ! !
! !
!!
!!
!
!
!!
!!
!!
! !
!!
!!
! !
!
!!
!
! !!!
!
!
!!
! !
!!
! !
!
!
!
!
!!
!
!
!! !
!
! !
!!
!
!
!!
!!
!
!
!!
!!
!
!
!!
!!
!!
!!
!!!!
!
!
!
!
!
!
!
!
!
!
!!
!!
!!!
!
!!
!!
!!
!
!
!!
! !
!
!
!!
!!
!
!
!!
!
!
!!
! !
!
!
! !! !
! !
!
!
!! !
!
! !
!!
! !
!!
!
!
!
!! !
!!
!!
!!
!!
!!
!!
!
!
!!
!!
!
!
!!
!
!
!!
!
!
!!
!!!
!
!!
! !
! !
!
!
!
!
!!
!!
!!
!!
!
!
!
!
!!
!
!!!
!!
!!
!
!
!
!
!
!
!!
!!
!!
!
!
!!
!
!
!
!
!
!
! !
!
!
!!
!!
!
!
!!
!!
!!
!
!
!!
!!
!
!
!
!
!!
!!
!!
!!
!
!
!
!
!!
!!
!!
!
!!
!
!!
!!
!
!
!!
!!
!
!
!!
!!
!!
!
!
!!
!!
!
!!
!!
!
!!
!!
!
!
!!
!!
!
!
!!
!!
!!
!!
!!
!!
!!
!!
!!
!!
!!
!!
!!
!
!
!!
!!
!
!
!
!!
!
!!
!
!
!!
!
!
!!
!!
!!
!
!
!!
!!
!
!
!!
!
!
!
!
!
!
!!
!!
!!
!!
!
!
!!
!.
!.!.
!.
!.
!.
!.S I M L AS I M L A
L I M O NL I M O N
K I O W AK I O W A
A G A T EA G A T E
E L B E R TE L B E R T
M A T H E S O NM A T H E S O N
E L I Z A B E T HE L I Z A B E T H
Mustang Creek
South Rush CreekMiddle Rush Creek
Antelope CreekHorse Creek
North Rush Creek
Adobe Creek
Long Creek
Skull Creek
Apache Creek
Little Horse Creek
Kiowa
Creek
East Bijou Creek
West Bijou
Creek
Runn
ing Cr
eek
Coma
nche
Cree
k
Wolf C
reek
Wilson Creek
Beaver Creek
Dry Creek
Middle B
ijou C
reek
Bland C
reek
Sprin
g Bran
ch
Agate Creek
Reed
Sprin
gs Cr
eek
Key Creek
Gold
Creek
Cool Cree
k
West K
iowa C
reek
Muddy Creek
Gopher Creek
Coal Cree
k
Arikaree River
Rattlesnake CreekBox E
lder C
reek
First Creek
Middlemist Creek
ELBERT
EL PASO
LINCOLN
ARAPAHOE
DOUGLAS
WASHINGTON
£¤24
§̈¦70
²0 4.5 9 13.5 18 22.5Miles
MAP LEGEND
ELBERT COUNTY RURAL WATER SUPPLY STUDY
Projection:UTM Zone 13N, metersNAD83
Date: 3/6/2017Revision: 1Drawn by: L. Rein
Map 1-2: Elbert County Hydrology and Irrigation
UV86
!!
!
! ! ! ! !
!!
!!!!
Water Divisions 1 & 2 Boundary
Irrigaten Lands 2010 (CDSS)
Highways
Elbert County Boundary
Streams in Water Division 1
Streams in Water Division 2
Study AreasEastern Planning Area
Elizabeth-Kiowa Planning Area
NW Planning Area
WELDMOFFAT
MESA
BACA
YUMA
PARK
LAS ANIMAS
ROUTT
LARIMER
GUNNISON
GARFIELD
LINCOLN
PUEBLO
BENTSAGUACHE
LOGAN
GRANDRIO BLANCO
KIOWA
EAGLE
EL PASO
ELBERT
MONTROSE
WASHINGTON
DELTA
KIT CARSON
JACKSON
OTERO
LA PLATA
ADAMS
CHEYENNE
PROWERS
FREMONT
MONTEZUMA
PITKIN
MORGAN
HUERFANO
CONEJOSCOSTILLA
CHAFFEE
HINSDALE
ARCHULETA
DOLORES
SAN MIGUEL
MINERAL
CUSTER
DOUGLAS
PHILLIPS
BOULDER
CROWLEYOURAY
ARAPAHOE
TELLER
LAKE
RIO GRANDE ALAMOSA
SEDGWICK
SUMMIT JEFFERSON
SAN JUAN
CLEAR CREEKGILPIN
DENVER
Water Division 1
Water Division 2
Water Div. 2Water Div. 1
Active Diversion StructuresGround Water
Other
Reservoir
Surface
Page 17 of 58
Page 17 of 58

! ! ! ! ! ! ! ! ! ! ! ! ! ! ! ! ! ! ! ! ! ! ! ! ! ! ! ! ! ! ! ! ! ! ! ! ! ! ! ! ! ! ! ! ! ! ! ! ! ! ! ! ! ! ! ! ! ! ! ! ! ! ! ! ! ! ! ! ! ! ! ! ! ! ! ! ! ! ! ! ! ! ! ! ! ! ! ! ! ! ! ! ! ! ! ! ! ! ! ! ! ! ! ! ! ! ! ! ! ! ! ! ! ! ! ! ! ! ! ! ! ! ! ! ! ! ! ! ! ! ! ! ! ! ! ! ! ! ! ! ! ! ! ! ! ! ! ! ! ! ! ! ! ! ! ! ! ! ! ! ! ! ! ! ! ! ! ! ! ! ! ! ! ! ! ! ! ! ! ! ! ! ! ! ! ! ! ! ! ! ! ! ! ! ! ! ! ! ! ! ! ! ! ! ! ! ! ! ! ! ! ! ! ! ! ! ! ! ! ! ! ! ! ! ! ! ! ! ! ! ! ! ! ! ! ! ! ! ! ! ! ! ! ! ! ! ! ! ! ! ! ! ! ! ! ! ! ! ! ! ! ! ! ! ! ! ! ! ! ! ! ! ! ! ! ! ! ! ! ! ! ! ! ! ! ! ! ! ! ! ! ! ! ! ! ! ! ! ! ! ! ! ! ! ! ! ! ! ! ! ! ! ! ! ! ! ! ! ! ! ! ! ! ! ! ! ! ! ! ! ! ! ! ! ! ! ! ! ! ! ! ! ! ! ! ! ! ! ! ! ! ! ! ! ! ! ! ! ! ! ! ! ! ! ! ! ! ! ! ! ! ! ! ! ! ! ! ! ! ! ! ! ! ! ! ! ! ! ! ! ! ! ! ! ! ! ! ! ! ! ! ! ! ! ! ! ! ! ! ! ! ! ! ! ! ! ! ! ! ! ! ! ! ! ! ! ! ! ! ! ! ! ! ! ! ! ! ! ! ! ! ! ! ! ! ! ! ! ! ! ! ! ! ! ! ! ! ! ! ! ! ! ! ! ! ! ! ! ! ! ! ! ! ! ! ! ! ! ! ! ! ! ! ! ! ! ! ! ! ! ! ! ! !
!!
!!
!!
!!
!!
!!
!!
!!
!!
!!
!!
!!
!!
!!
!!
!!
!!
!!
!!
!!
!!
!!
!!
!!
!!
!!
!!
!!
!!
!!
!!
!!
!!
!!
!!
!!
!!
!!
!!
!!
!!
!!
!!
!!
!!
!!
!!
!!
!!
!!
!!
!!
!!
!!
!!
!!
!!
!!
!!
!!
!!
!!
!!
!!
!!
!!
!!
!!
!!
!!
!!
!!
!!
!!
!!
!!
!!
!!
!!
!!
!!
!!
!!
!!
!!
!!
!!
!!
!!
!!
!!
!!
!!
!!
!!
!!
!!
!!
!!
!!
!!
!!
!!
!!
!!
!!
!!
!!
!!
!!
!!
!!
!!
!!
!!
!!
!!
!!
!!
!!
!!
!!
!!
!!
!!
!!
!!
!!
!!
!!
!!
!!
!!
!!
!!
!!
!!
!!
!!
!!
!!
!!
!!
!!
!!
!!
!!
!!
!!
!!
!!
!!
!!
!!
!!
!!
!!
!!
!!
!!
!!
!!
!!
!!
!!
!!
!!
!!
!!
!!
!!
!!
!!
!!
!!
!!
!!
!!
!!
!!
!!
!!
!!
!!
!!!!!!
!!!!!!
!!
!!
!!
!!
!!
!!
!!
!!
!!
!!
!!
!!
!!
!!
!!
!!
!!!!
!!!!
!!
!!!!!!
!!
!!
!!
!!
!!
!!
!!
!!
!!
!!
!!
!!
!!
!!
!!
!!
!!
!!
!!
!!
!!
!!
!!
!!
!!
!!
!!
!!
!!!!
!!!!
!!
!!
!!
!!
!!
!!
!!!!!!!!!!!!!!!!!!
!!!!!!!!
!!!
!
!!
!!
!!!!!!!!!!
!!
!!
!!
!!
!!
!!
!!
!!
!!
!!
!!
!!
!!
!!
!!
!!
!!
!!
!!
!!
!!
!!
!!
!!
!!
!!
!!
!!
!!
!!
!!
!!
!!
!!
!!
!!
!!
!!
!!
!!
!!
!!
!!!!
!!
!!
!!
!!
!!
!!
!!
!!
!!
!!
!!
!!
!!
!!
!!
!!!!
!!
!!
!!
!!
!!
!!
!!
!!
!!
!!
!!!
!
!!
!!
!!
!!
!!
!!
!!
!!!!
!!!!
!!
!!
!!
!!!!
!!
!!
!!
!!
!!
!!
!!
!!
!!
!!
!!!!
!!
!!!!!
!
!!
!!
!!
!!
!!
!!!!
!!!!!!!!
!!
!!
!!
!!!!
!!
!!
!!
!!
!!
!!
!!
!!
!!
!!!!!!
!!!!
!!
!!
!!
!!
!!
!!
!!
!!
!!
!!
!!
!!
!!
!!
!!
!!
!!
!!
!!
!!
!
!
!!
!!
!!
!!
!!!!!!!!!!
!!
!!!!
!!!!
!!
!!
!!
!!!
!
!
!
!!
!!
!!
!!
!!
!!
!!
!!!!!!!!!!
!!
!!!
!
!!
!!!!
!!
!!
!!
!!
!!
!!
!!
!!
!
!!!
!!
!!
!!
!!
!!
!!
!!
!!
!!
!!
!!!!
!!!!
!!
!!
!
!
!
!
!
!
!
!
!!
!!!
!
!!
!
!
!!
!!
!
!
!!
!
!
!
!
!!!
!
!
!
!!
!!
!!
!!
!!
!!
!!
!!
!!
!!!
!
!!
!!
!
!
!
!!
!
!!
!!
!!
!!
!!
!!
!
!!!!
!
!!
! !
!!
!!
!!
!!
!!
!!
!!
!
!
!
!
!!
!!
!!
!!
!!
!!
!!
!!
!!
! !
!!
!!
!!
!
!
! !
!!
! !! ! !
!
!!
!
!
! ! ! !
! !
!!
!!
!
!
!!
!!
!!
! !
!!
!!
! !
!
!!
!
! !!!
!
!
!!
! !
!!
!!
!
!
!
!
!!
!
!
!! !
!
! !
!!
!
!
!!
!!
!
!
!!
!!
!
!
!!
!!
!!
!!
!!!!
!
!
!
!
!
!
!
!
!
!
!!
!!
!!!
!
!!
!!
!!
!
!
!!
! !
!
!
!!
!!
!
!
!!
!
!
!!
! !
!
!
! !! !
! !
!
!
!! !
!
! !
!!
! !
!!
!
!
!
! ! !
!!
!!
!!
!!
!!
!!
!
!
!!
!!
!
!
!!
!
!
!!
!
!
!!
!!!
!
!!
! !
! !
!
!
!
!
!!
!!
! !
!!
!
!
!
!
!!
!
!!!
!!
!!
!
!
!
!
!
!
!!
!!
!!
!
!
!!
!
!
!
!
!
!
! !
!
!
!!
!!
!
!
!!
!!
!!
!
!
!!
!!
!
!
!
!
!!
!!
!!
!!
!
!
!
!
!!
!!
!!
!
!!
!
!!
!!
!
!
!
!!
!
!
!
!!
!!
!!
!
!
!!
!!
!
!!
!!
!
!!
!!
!
!
!!
!!
!
!
!!
!!
!!
!!
!!
!!
!!
!!
!!
!!
!!
!!
!!
!
!
!!
!!
!
!
!!
!!
!!
!
!
!!
!
!
!!
!!
!!
!
!
!!
!!
!
!
!!
!
!
!
!
!
!
!!
!!
!!
!!
!
!
!!
!.
!.!.
!.
!.
!.
!.S I M L AS I M L A
L I M O NL I M O N
K I O W AK I O W A
A G A T EA G A T E
E L B E R TE L B E R T
M A T H E S O NM A T H E S O N
E L I Z A B E T HE L I Z A B E T H
Mustang Creek
South Rush CreekMiddle Rush Creek
Antelope CreekHorse Creek
North Rush Creek
Adobe Creek
Long Creek
Skull Creek
Apache Creek
Little Horse Creek
Kiowa
Creek
East Bijou Creek
West Bijou
Creek
Runn
ing Cr
eek
Coma
nche
Cree
k
Wolf C
reek
Wilson Creek
Beaver Creek
Dry Creek
Middle B
ijou C
reek
Bland C
reek
Sprin
g Bran
ch
Agate Creek
Reed
Sprin
gs Cr
eek
Key Creek
Gold
Creek
Cool Cree
k
West K
iowa C
reek
Muddy Creek
Gopher Creek
Coal Cree
k
Arikaree River
Rattlesnake CreekBox E
lder C
reek
First Creek
Middlemist Creek
ELBERT
EL PASO
LINCOLN
ARAPAHOE
DOUGLAS
WASHINGTON
£¤24
§̈¦70
²0 5 10 15 20 25Miles
MAP LEGEND
ELBERT COUNTY RURAL WATER SUPPLY STUDY
Projection:UTM Zone 13N, metersNAD83
Drawn by: L. Rein
Map 1-3: Denver Basin Aquifer Extents in Elbert County
UV86
!. City/Town
!!
!
! ! ! ! !
!!
!!!!
Water Divisions 1 & 2 Boundary
Highways
Elbert County Boundary
Alluvium
Streams in Water Division 1
Streams in Water Division 2
WELDMOFFAT
MESA
BACA
YUMA
PARK
LAS ANIMAS
ROUTT
LARIMER
GUNNISON
GARFIELD
LINCOLN
PUEBLO
BENTSAGUACHE
LOGAN
GRANDRIO BLANCO
KIOWA
EAGLE
EL PASO
ELBERT
MONTROSE
WASHINGTON
DELTA
KIT CARSON
JACKSON
OTERO
LA PLATA
ADAMS
CHEYENNE
PROWERS
FREMONT
MONTEZUMA
PITKIN
MORGAN
HUERFANO
CONEJOSCOSTILLA
CHAFFEE
HINSDALE
ARCHULETA
DOLORES
SAN MIGUEL
MINERAL
CUSTER
DOUGLAS
PHILLIPS
BOULDER
CROWLEYOURAY
ARAPAHOE
TELLER
LAKE
RIO GRANDE ALAMOSA
SEDGWICK
SUMMIT JEFFERSON
SAN JUAN
CLEAR CREEKGILPIN
DENVER
Kiowa Bijou
Upper Big Sandy
Denver Basin
Water Div. 2
Water Div. 1
Designated BasinsKiowa Bijou
Upper Big Sandy
Denver Basin AquifersUpper Dawson
Lower Dawson
Denver Aquifer
Arapahoe Aquifer
Laramie Fox-Hills
0 20 40 60 80Miles
¯
Date: 12/5/2017
Planning AreasEastern Planning Area
Elizabeth-Kiowa Planning Area
NW Planning Area
Page 18 of 58
Page 18 of 58

CHAPTER 2 EXISTING WATER SUPPLY AND SYSTEMS
2.1 GENERAL
Elbert County is in an area where there are few surface water supplies. The USGS reported for the year 2010 that Elbert County residential water demand is 100% reliant on groundwater (USGS Circular 1405, Maupin, et. al., 2014). Table 2-1 shows data from the DWR on diversion structures in Elbert County. These are structures with adjudicated surface water rights tied to them, and do not reflect the total number of groundwater wells, including Denver Basin wells, in the county. They do however, reflect the dependence on groundwater. There are 1,516 permitted groundwater “diversion” structures or wells, as compared to 62 permitted and adjudicated surface water diversion structures. It is likely that most, if not all, of the surface water and reservoir diversion structures are used for agricultural irrigation purposes, and the groundwater structures are predominantly used for domestic and municipal water supply. See Map 1-2: Elbert County Hydrology and Irrigation at the end of Chapter 1.
Table 2-1 Active Diversion Structures in Elbert County (source: Colorado DWR)
Note: Active Diversion Structures are considered surface water diversions by DWR. These include groundwater wells that are considered to have a quantifiable impact to surface waters. These largely exclude Denver Basin wells.
The total number of groundwater wells by type are tabulated in Table 2-2. Most of these wells do not require water court adjudication and simply need permits through the State Engineer’s Office (SEO). If the well would be within the boundaries of a designated groundwater basin, the management district for that designated basin provides permitting oversight. These wells are not classified as diversion structures; therefore the count of all wells in the county is much higher.
Surface 62 Ground Water 1,516 Reservoir 42 Other 170 Total 1,790
Active Diversion Structures
Page 19 of 58
Page 19 of 58

Table 2-2 Primary Types of Groundwater Wells in Elbert County
2.2 MUNICIPALITIES There are three incorporated municipalities in Elbert County: the Towns of Elizabeth, Kiowa, and Simla. Elizabeth and Kiowa each have their own municipal water and wastewater systems that serve the town and some of the surrounding community. While Elizabeth and Kiowa both have dedicated water supply systems for their residents, they both rely almost entirely on Denver Basin wells for their water supply – with the exception of one well for Kiowa stated to be drilled into the Quaternary Alluvium. Everywhere else in the county is either served by private wells or covered under a metropolitan district providing water services. The majority of residents rely on domestic wells. Records from the DWR show that the Town of Kiowa has two supply wells that are drilled within the Kiowa-Bijou Designated Groundwater Basin; one into the Dawson Aquifer and one into Quaternary Alluvium, an aquifer surrounding a surface water stream. These were the best records readily available for Kiowa’s wells, as this information was not obtained from the town. Kiowa may have supply wells that were missed in the compilation of this information. See Table 2-3 for the list of water supply wells used by Kiowa. The Town of Elizabeth has five municipal wells as listed in Table 2-4. This list of wells was provided by the town through its pumping and billing records.
Table 2-3 Town of Kiowa Water Supply Wells
Use Number of WellsDomestic 7,748Stock 1,597Commercial 1,442Household Use Only 319Irrigation 307Other 191Municipal 75Industrial 18Total 11,697
Permit # Aquifer Date ConstructedDepth
(ft)Annual Allowed Withdrawal (AF)
2875-F-R DAWSON 2/8/1993 392 152794-F-R QUATERNARY ALLUVIUM 2/10/2006 66 575
Page 20 of 58
Page 20 of 58

Table 2-4 Town of Elizabeth Water Supply Wells
Note: Well 16210-F-R is permitted for, and draws from the Upper Dawson and Denver aquifers in addition to the Lower Dawson.
Tables 2-5 and 2-6 list the population, production, and consumption of water for the towns of Kiowa and Elizabeth, respectively. Production values show how much water was pumped from their municipal wells, which are listed in Tables 2-3 and 2-4; the consumption values indicate how much water was actually billed to the customers through meters. Consumption values are less than production due to system losses.
Table 2-5
Water Supply Production and Consumption in Kiowa with Population (Source: Town of Kiowa)
Permit # Aquifer Date Constructed
Depth (ft) Annual Allowed Withdrawal (AF)
44454-F ARAPAHOE 10/6/1995 2149 13252511-F DENVER 2/20/1995 1010 39.752512-F LOWER DAWSON 2/20/1995 648 21
15617-F-R LOWER DAWSON 8/24/2009 540 5016210-F-R LOWER DAWSON 11/13/2012 1600 150
YearKiowa
Population
Kiowa Water Supply
Production (AF)
Kiowa Water Consumption
(AF)2012 726 148 1362013 731 109 942014 739 102 872015 744 108 992016 - 100 91
Average 735 113 101
Page 21 of 58
Page 21 of 58

Table 2-6 Water Supply Production and Consumption (water sales) in Elizabeth with Population
(Source: Town of Elizabeth)
2.3 SPECIAL DISTRICTS
There are 21 Special Districts in Elbert County, 12 of which provide water service to customers. They are organized for the purposes of providing services to communities in an efficient and area-specific manner as needed. The formation of a special district requires the approval of a “Service Plan” by the Board of County Commissioners and the governing body of each municipality that the district may overlap. Each special district in Elbert County, therefore has submitted a service plan to the County outlining specifics such as: the need for a special district; the type of special district, what services will be provided (this is typically the case for metropolitan districts that provide multiple services), preliminary details on finances and the issuance of bonds; projected infrastructure needs and associated costs. If the special district provides water services, it will often provide details on water supply and infrastructure needs, such as wells, storage tanks, water treatment, and water rights within the service plan. Service plans for all 21 special districts were provided by Elbert County staff (see Table 2-6). Special districts in Elbert County are concentrated in the northwest portion of the county, and all but one - Elbert Water and Sanitation District - fall within the Elizabeth-Kiowa and the NW Planning Areas (see map 2-1: Metropolitan and Water & Sanitation Districts at the end of this chapter).
YearElizabeth
Population
Elizabeth Water Supply
Production (AF)
Elizabeth Water Consumption
(AF)2012 1,364 215 1962013 1,376 199 1832014 1,395 200 1862015 1,412 188 1722016 - 175 161
Average 1,387 195 179
Page 22 of 58
Page 22 of 58

Table 2-6 The 21 Identified Special Districts in Elbert County
These service plans were reviewed for water supply information such as:
• Number of single family homes anticipated within the district
• Secured water rights and water resources (in acre-feet)
• Projected total population of the district
• Service area size (acres)
• Details on groundwater supply wells (if any)
• Water storage (tanks, volumes, decreed storage rights, etc.)
• Water transmission systems
o Pumping systems
Special District Service Plan Available?
Service Plan Date
Developed? Provides Water?*
Britanie Ridge Metropolitan District Yes 2005 Yes YesClearwater Metropolitan District (provides water services to North Pines Metro.) Yes Jul-01 Yes YesDeer Creek Water District Yes Apr-08 Yes YesDiamond Ridge Metropolitan District Yes Jan-06 No NoDiamond Ridge Water & Sanitation District Yes Jan-06 No YesElbert and Highway 86 Commercial Metropolitan District Yes Aug-08 Yes YesElbert and Highway 86 Metropolitan District Yes Oct-02 Yes No Elkhorn Ranch Metropolitan District No. 1 Yes 2002 Yes YesGold Creek Commons Metropolitan District No No NoMiller Ranch Metropolitan District Yes Oct-07 No NoMiller Ranch Water & Sanitation District Yes Oct-07 No YesNorth Pines Metropolitan District (Serves with Clearwater) Yes May-97 Yes NoRitoro Metropolitan District Yes Sep-16 No YesSpring Valley Metropolitan District Nos. 1 Yes Mar-04 Yes YesSpring Valley Metropolitan District Nos. 2 Yes Mar-04 Yes NoSpring Valley Metropolitan District Nos. 3 Yes Mar-04 Yes NoSpring Valley Metropolitan District Nos. 4 Yes Mar-04 Yes NoSterling Crossing Commercial Metropolitan District Yes Sep-04 No YesSterling Crossing Residential Metropolitan District Yes Sep-04 No YesSummit Park Metropolitan District Yes Oct-03 Yes YesUnited Water & Sanitation District Yes Oct-02 Yes No***Those that don't provide water services are typically overlapped by another special district that does (e.g., North Pines Metro. Dist. gets its water services from Clearwater Metro. Distr.)** Does not provide any water in Elbert County
Page 23 of 58
Page 23 of 58

o Transmission lines (linear feet)
• Wastewater treatment
o Reuse (if any)
Availability of this information per service plan varied and was not consistently presented. Largely, this is due to the lack of specificity required by law as to how much detail must be provided by a special district service plan. They are primarily required to present such things as district boundaries and financials, including debt obligations, projected revenues, general infrastructure, and operations and maintenance cost estimates. As long as this information is presented, the special district can decide what degree of detail they would like to go into regarding development plans. Due to the very nature of a service plan being an initial plan, with best estimates as to costs and infrastructure referring to full buildout and development, it is not clear how much in the plans was fully developed as intended. A special district could have been anticipating a certain number of housing developments upon completion of their service plan, and then - perhaps due to economic factors - half of those developments were never completed. More research would be needed to determine to what extent these service plans reflect reality. But these service plans provide readily available estimates as to water infrastructure for areas outside of incorporated municipalities that provide their own water services – Table C-1 in Appendix C summarizes the information obtained from the service plans.
Page 24 of 58
Page 24 of 58

!5
!5
!5
!5
!5
!5
!.
Deer Creek Water District
Miller Ranch Water & Sanitation District
Elbert Water & Sanitation District
Diamond Ridge Water & Sanitation District
United Water & Sanitation DistrictElkhorn Ranch Metropolitan District No. 1
Miller Ranch Metropolitan District
Elbert and Highway 86 Metropolitan District
Spring Valley Metropolitan District No. 2Spring Valley Metropolitan District No. 4
Gold Creek Commons Metropolitan District
Elbert and Highway 86 Commercial Metropolitan District
Senac South Metropolitan District No. 3
Big Sandy Creek
Mustang Creek
South Rush CreekMiddle Rush Creek
Antelope CreekHorse Creek
North Rush Creek
Adobe Creek
Long Creek
Skull Creek
Apache Creek
Little Horse Creek
Kiowa
Creek
East Bijou Creek
West Bijou
Creek
Runn
ing Cr
eek
Coma
nche
Cree
k
Wolf C
reek
Wilson Creek
Beaver Creek
Middle B
ijou C
reek
Bland C
reek
Sprin
g Bran
ch
Agate Creek
Reed
Sprin
gs Cr
eek
Key Creek
West K
iowa C
reek
Muddy Creek
Gopher Creek
Arikaree River
Rattlesnake Creek
First Creek
Middlemist Creek
Rattle
snak
e Cree
k
ELBERT
EL PASO
LINCOLN
ARAPAHOE
DOUGLAS
WASHINGTON
£¤24
§̈¦70
²0 5 10 15 20 25Miles
MAP LEGEND
ELBERT COUNTY RURAL WATER SUPPLY STUDY
Projection:UTM Zone 13N, metersNAD83
Drawn by: L. Rein
Map 2-1: Metropolitan and Water & Sanitation Districts
UV86
!5 City/Town
Highways
Elbert County Boundary
Streams in Water Division 1
Streams in Water Division 2
Planning AreasEastern Planning Area
Elizabeth-Kiowa Planning Area
NW Planning Area
WELDMOFFAT
MESA
BACA
YUMA
PARK
LAS ANIMAS
ROUTT
LARIMER
GUNNISON
GARFIELD
LINCOLN
PUEBLO
BENTSAGUACHE
LOGAN
GRANDRIO BLANCO
KIOWA
EAGLE
EL PASO
ELBERT
MONTROSE
WASHINGTON
DELTA
KIT CARSON
JACKSON
OTERO
LA PLATA
ADAMS
CHEYENNE
PROWERS
FREMONT
MONTEZUMA
PITKIN
MORGAN
HUERFANO
CONEJOSCOSTILLA
CHAFFEE
HINSDALE
ARCHULETA
DOLORES
SAN MIGUEL
MINERAL
CUSTER
DOUGLAS
PHILLIPS
BOULDER
CROWLEYOURAY
ARAPAHOE
TELLER
LAKE
RIO GRANDE ALAMOSA
SEDGWICK
SUMMIT JEFFERSON
SAN JUAN
CLEAR CREEKGILPIN
DENVER
Water Division 1
Water Division 2
Date: 12/5/2017
LIMON
Sterling Crossing ResidentialMetropolitan District
North PinesMetro. Dist.
North PinesMetro. Dist.
Special DistrictsWater and Sanitation Districts
Metropolitan Districts
KIOWAELIZABETH
ELBERT
SIMLA
MATHESON
AGATE
Page 25 of 58
Page 25 of 58

CHAPTER 3 FUTURE WATER SUPPLIES
3.1 GENERAL
There are four main categories of demand that are projected to years 2035 and 2050 in this Study:
1. Residential and Commercial
2. Agricultural Irrigation
3. Livestock
4. Oil and Gas
This chapter provides an overview of current and future water demands for Elbert County. These demands are compared with Denver Basin storage volume estimates prepared by McGrane Water Engineers to understand the future water supply outlook of the county. Of the four categories of water demands being quantified, the second largest after agricultural demand is residential and commercial, which is dependent on the population. Therefore, reasonable current and future population estimates of the county and the planning areas are necessary.
3.2 CURRENT AND FUTURE POPULATION
Elbert County had a population of 23,107 as of the 2010 Census, and recent estimates from Elbert County show a population of 24,694 as of the year 2015. The three areas of particular interest in this study – the Northwest Planning Area, Elizabeth-Kiowa Planning Area, and Eastern Planning Area – will be the focus for future population growth along with the county as a whole. The State Demography Office (SDO) manages and regularly publishes Colorado population data available to the public on statewide, regional, county, and select municipal levels. They also publish population projections. The SDO forecasting model is largely economically based, while taking into account birth and death rates among other demographic factors. The economic basis of the model is the link to net migration into the state, which is very closely correlated to job growth. The SDO model is considered the best available model for Colorado, and it was similarly used in the 2010 Statewide Water Supply Initiative for forecasting statewide populations and water demands. For these reasons, the SDO projections are also used for the Elbert County Rural Water Supply Study.
Page 26 of 58
Page 26 of 58

3.2.1 Current and Future Populations for Elbert County Current Population Data from the SDO for populations of counties and census designated places can be accessed from their website (https://demography.dola.colorado.gov/population/). The SDO will estimate populations for inter-census years along with its decennial census e.g., 2000 or 2010. The most recent estimates developed by the SDO at the time of this writing were for 2015 and were published in October 2016. The SDO updates these forecasts annually in October. For Elbert County, the SDO provides estimates for the county as a whole, the three census designated places (CDP) in the county, and the unincorporated portion of Elbert County. Unincorporated Elbert County comprises the majority of Elbert County’s population. Elbert County historical populations are shown in Table 3-1.
Table 3-1
Population of Elbert County; the Towns of Elizabeth, Kiowa, and Simla; and Unincorporated Elbert County (Source: SDO)
Future Population The Colorado SDO projects the population of Elbert County to be 53,654 in the year 2035 and 68,375 in the year 2050. These estimates were obtained from the most recent projections prepared by the SDO in October 2015 as shown in Table 3-2.
Elbert County Elizabeth Kiowa Simla
Unincorporated Elbert County
1985 8,560 967 287 527 6,7791990 9,646 818 275 481 8,0721995 14,328 903 366 484 12,5752000 20,104 1,464 600 664 17,3762005 22,259 1,440 655 668 19,4962010 23,107 1,358 723 618 20,4082015 24,694 1,412 744 638 21,900
Year
Population
Page 27 of 58
Page 27 of 58

Table 3-2
Elbert County Population Estimates through 2050 (Source: Colorado Department of Local Affairs, State Demographers Office, Oct. 2015)
3.2.2 Current and Future Populations for Planning Areas
Current Population – Planning Areas The planning areas do not have population estimates available for them as they are arbitrarily drawn with regard to where the census makes estimates. Therefore, a GIS analysis was performed using census block data from the 2010 Census. The 2010 Census is the most recent, and therefore, the only data available for making population estimates for the planning areas. Estimates of the 2010 planning area populations are shown in Table 3-3.
Table 3-3 Planning Area Population Estimates
Future Population – Planning Areas To estimate planning area populations into the future, compound annual average growth rates were determined from the Elbert County population projections put together by the SDO, and were similarly applied to the initial population estimates for the planning areas determined in Section 3.2.2. However, the growth rate in the countywide SDO projection
Year Elbert County Population
2010 23,1072015 24,6942020 32,9682025 41,3492030 48,0262035 53,6542040 58,8562045 63,7452050 68,375
Planning Area2010
Population
Fraction of Entire County (2010)
NW Area 7,315 32%Elizabeth Kiowa Area 11,123 48%Eastern Area 61 0.3%All Planning Areas 18,499 80%Elbert County 23,107 -
Page 28 of 58
Page 28 of 58

is likely to be lower than in the Northwest and Elizabeth-Kiowa Planning areas due to the proximity of these areas to the expanding Denver Metro Area. Therefore, the growth rates for these planning areas were assumed to be between 0.4-1.2% higher than the countywide rates.
Table 3-4 Planning Area Population Projections
3.3 CURRENT AND FUTURE DEMANDS
Demands were estimated for the four main categories: Residential and Commercial, Agricultural Irrigation, Livestock, and Oil and Gas development in Elbert County for years 2035 and 2050. This section briefly overviews the assumptions necessary for each, and reports the total estimated demands.
3.3.1 Residential and Commercial
It is assumed that 100% of residential and commercial demand is to be met by Denver Basin groundwater. In estimating total residential water demand, 135 gallons per capita day per day (gpcd) was used and applied to the current and projected population (see Section 3.2 for population projections). This value is also used in the Douglas County Rural Water Supply System Feasibility Study. Douglas County is similarly heavily dependent on Denver Basin groundwater. The Town of Castle Rock, also heavily dependent on the Denver Basin has seen similar per capita demands (Town of Castle Rock Water Efficiency Master Plan, 2015). Therefore, this is considered a reasonable and conservative per capita consumption figure to use for Elbert County planning. Commercial demands are assumed to be 10% of the residential demands.
3.3.2 Irrigation
The USGS most recently compiled water use estimates for Elbert County in 2010. USGS Circular 1405 – Estimated Use of Water in The United States (Maupin et. al., 2014) estimates nationwide water use down to the state and county level. Using their agriculture irrigation water demand estimates for 2010 and the 2010 irrigated acres layer retrieved
Planning Area2010
Population
Fraction of Entire County (2010)
2017 Estimate
2035 Estimate
2050 Estimate
NW Area 7,315 32% 8,398 17,485 23,532Elizabeth-Kiowa Area 11,123 48% 12,770 26,586 35,782Eastern Area 61 0.3% 70 153 238All Planning Areas 18,499 80% 21,239 44,224 59,552Elbert County 23,107 - 27,674 53,654 68,375
Page 29 of 58
Page 29 of 58

from the DWR for Elbert County, an average 1.4 AFY/Acre was calculated to apply to future irrigated acreage estimates. Data on irrigated acreage is also available from the USDA Census of Agriculture for the years 2007 and 2012. To project irrigation demands using future irrigated acreage estimates, DWR data on irrigated acreage in 2010 for Elbert County was used as the starting point. The year 2010 is chosen due to that fact that this is also the starting point for population estimates. The DWR data estimates that 9,226 acres were irrigated for agriculture in Elbert County in 2010; data from the United States Department of Agriculture (USDA) Census of Agriculture reported 13,368 acres in 2007 and 8,435 acres in 2012 (see Table 3-5). Refer to Map 1-2 at the end of Chapter 1.
Table 3-5 Irrigated Acres in Elbert County (Source: USDA, DWR)
This data shows that irrigated acreage has been lost since 2007, most severely between 2007 and 2010. Colorado’s Water Plan also identifies this trend, which is prevalent through Colorado. Loss of irrigated agriculture cannot be entirely halted however, Colorado’s Water Plan places a high priority on the value of agriculture, and prompts steps to minimize the loss of productive farmland. This downward trend in irrigated acreage has been incorporated into the demand model for projections to the year 2050. The 2010 Colorado Statewide Water Supply Initiative estimated a maximum statewide loss of irrigated acreage of 20% by 2050. Irrigated acreage estimates for Elbert County will assume this same overall loss by the year 2050. For the years between 2010 and 2050, estimates will be made by assuming a constant linear loss each year, starting in 2010 and ending in 2050. See Table 3-6 for irrigated acreage estimates out to 2050. Using data from the USGS Denver Basin Groundwater Model (Paschke, 2011), it is assumed that approximately 30% of agricultural irrigation demand comes from Denver Basin groundwater in Elbert County; the other 70% is sourced from alluvial groundwater or surface water supplies – this is also reflected in Table 3-6.
Description 2007* 2010** 2012*Irrigated Land (acres) 13,368 9,226 8,435 *USDA Census of Agriculture
**DWR
Year
Page 30 of 58
Page 30 of 58

Table 3-6 Irrigation Demand for Elbert County
Based on 1.4 AFY/Acre and Irrigated Acreage Estimates
3.3.3 Livestock
The USGS reports that approximately 77% of livestock water demand is sourced from groundwater (Maupin, et. al., 2014). This Study uses a simplifying assumption that 100% of livestock water demands are sourced from the Denver Basin. To assess current demands for livestock, the number (or head) of cattle in the county and the average demand per head of cattle is needed. The USDA reports on head of cattle on a county-level through its National Agriculture Statistics Survey (NASS) annual report. These reports were queried for the years 2010-2016 with 2016 being the most recent available data. Table 3-7 shows the results of this query with 39,000 head of cattle in Elbert County in 2016 – this number is lower than the 43,000 head of cattle reported in 2010 with numbers ranging up and down in between. Due to this variation, it is difficult to predict whether cattle numbers are trending up or down. Based on discussions with the Elbert/Douglas County Livestock Association it was indicated that head of cattle in the county would generally be expected to increase through 2050. Therefore, a growth rate of 1% per year was applied starting with the 2016 value through 2050.
Table 3-7 Head of Cattle in Elbert County from 2010-2016 (Source: USDA, NASS)
Cattle water demands can range between 13-20 gallons per head per day, for this report 20 gallons per head per day will be assumed. Table 3-8 shows the cattle demands for 2017, 2035, and 2050.
2010 2017 2035 2050Irrigated Farmland (Acres) 9,226 8,873 8,025 7,381Total Irrigation Demand (AF) 12,916 12,422 11,235 10,333Irrigation Demand from Surface Water or Alluvial (AF) 9,041 8,695 7,864 7,233Irrigation Demand from Denver Basin (AF) 3,875 3,727 3,370 3,100
ELBERT COUNTY Year
Year Head of Cattle2010 43,0002011 44,0002012 45,5002013 38,0002014 37,0002015 37,0002016 39,000
Page 31 of 58
Page 31 of 58

Table 3-8 Projected Head of Cattle and Cattle Demand for 2017, 2035, and 2050
3.3.4 Oil and Gas
No oil and gas demand for the foreseeable future is being assumed. Starting in 2035, however, the demand model will incorporate 38 AF of demand associated with oil and gas for conservative measure. Unless there are large advances in oilfield drilling technology or a new oilfield discovery within Elbert County, there is no evidence to suggest a large increase in water demand for this activity. This small volume of water for future oil and gas activity is assumed for several reasons: 1) Elbert County is on the very edge and largely just outside of the Denver-Julesburg Basin, and oil and gas yields for new wells in the DJ Basin in this area are unlikely to be economical; 2) according to the Colorado Oil and Gas Conservation Commission, only six oil and gas wells have been drilled in Elbert County since the year 2000 (See Table 3-9), compared to over 16,000 new oil and gas wells drilled in Weld County over the same time period. Weld County is a top producer of oil in Colorado and sits right over the core area of the DJ Basin. Oil and Gas Water Demands The DWR reported in 2010 that hydraulic fracturing alone represented roughly 0.08% of overall water use in the state at roughly 13,900 AFY. At the same time agricultural water use was at 13.9 million acre-feet which represented 85.5% of the state’s water use. It has been shown that median water use for drilling vertical wells (not hydraulically fractured) is around 360,000 gallons and median values for hydraulically fractured horizontal wells can range from roughly 2.8-5.6 million gallons, depending primarily on the horizontal length of the well (Goodwin et. al., 2013). And while this is a large volume of water, specifically for horizontally drilled and hydraulically fractured wells (roughly 8.5 to 17 acre-feet) it is small percentage of the state’s water use. It is important to note that this is a one-time use of water for each new well. Thirty-eight acre-feet of future oil and gas water demand was estimated by taking the median of the range of water demand (8.5 AF + 17 AF) of 12.75 AF and assuming that 3 wells per year could be drilled in the future.
Year Head of Cattle Cattle Demand (AF)2017 39,390 8822035 47,116 1,0562050 54,701 1,225
Page 32 of 58
Page 32 of 58
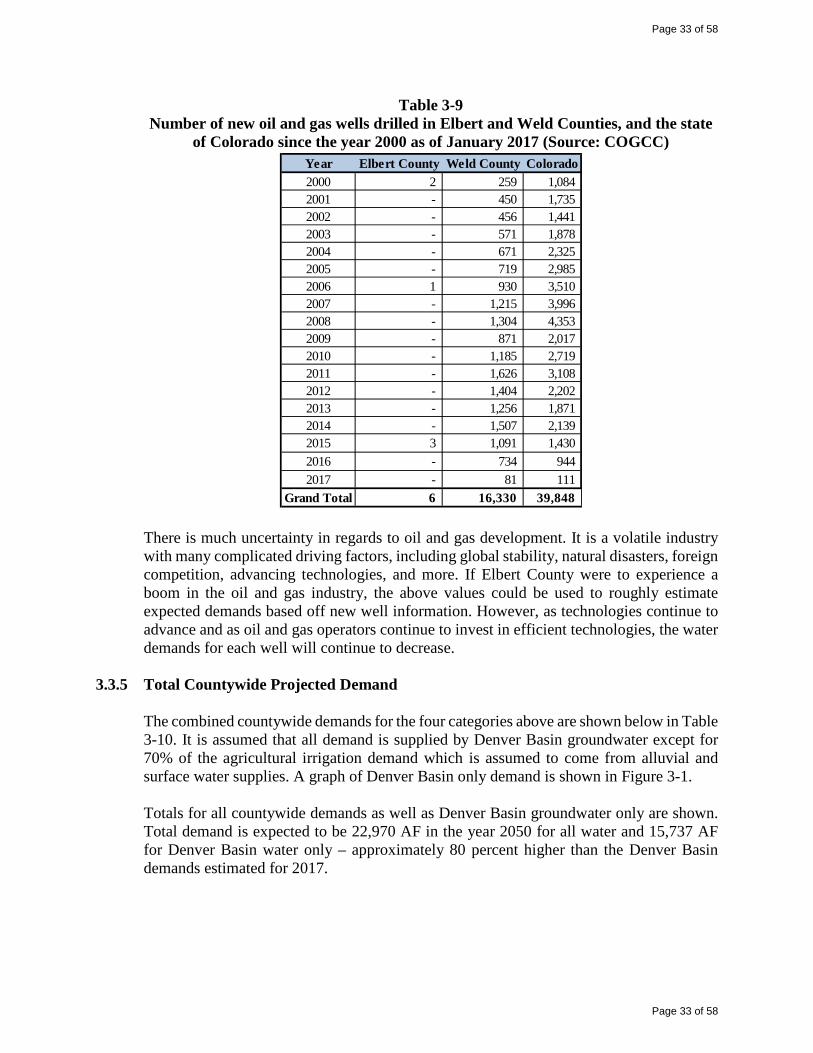
Table 3-9 Number of new oil and gas wells drilled in Elbert and Weld Counties, and the state
of Colorado since the year 2000 as of January 2017 (Source: COGCC)
There is much uncertainty in regards to oil and gas development. It is a volatile industry with many complicated driving factors, including global stability, natural disasters, foreign competition, advancing technologies, and more. If Elbert County were to experience a boom in the oil and gas industry, the above values could be used to roughly estimate expected demands based off new well information. However, as technologies continue to advance and as oil and gas operators continue to invest in efficient technologies, the water demands for each well will continue to decrease.
3.3.5 Total Countywide Projected Demand
The combined countywide demands for the four categories above are shown below in Table 3-10. It is assumed that all demand is supplied by Denver Basin groundwater except for 70% of the agricultural irrigation demand which is assumed to come from alluvial and surface water supplies. A graph of Denver Basin only demand is shown in Figure 3-1. Totals for all countywide demands as well as Denver Basin groundwater only are shown. Total demand is expected to be 22,970 AF in the year 2050 for all water and 15,737 AF for Denver Basin water only – approximately 80 percent higher than the Denver Basin demands estimated for 2017.
Year Elbert County Weld County Colorado2000 2 259 1,084 2001 - 450 1,735 2002 - 456 1,441 2003 - 571 1,878 2004 - 671 2,325 2005 - 719 2,985 2006 1 930 3,510 2007 - 1,215 3,996 2008 - 1,304 4,353 2009 - 871 2,017 2010 - 1,185 2,719 2011 - 1,626 3,108 2012 - 1,404 2,202 2013 - 1,256 1,871 2014 - 1,507 2,139 2015 3 1,091 1,430 2016 - 734 944 2017 - 81 111
Grand Total 6 16,330 39,848
Page 33 of 58
Page 33 of 58

Table 3-10 Total Water Demands for Elbert County including Total Demand for Denver Basin
Groundwater Only
Figure 3-1 Graph of Estimated Denver Basin Groundwater Demand
for Elbert County Years 2017-2050
2010 2017 2035 2050Population 23,107 27,674 53,654 68,375
UserResidential (Countywide) 3,494 4,185 8,114 10,340Commercial 349 418 811 1,034Irrigated Agriculture 12,916 12,422 11,235 10,333 Irrig. Ag. From Surface Water or Alluvial 9,041 8,695 7,864 7,233 Irrig. Ag. From Denver Basin 3,875 3,727 3,370 3,100Livestock 963 882 1,056 1,225Oil and Gas Development 0 0 38 38Total Demand 17,723 17,908 21,253 22,970Total Demand from Denver Basin Only 8,682 9,212 13,389 15,737
YearELBERT COUNTY
Demand in Acre-Feet
0
3,000
6,000
9,000
12,000
15,000
18,000
2017 2020 2023 2026 2029 2032 2035 2038 2041 2044 2047 2050
ACRE
-FEE
T
YEAR
Residential Commercial Irrigated Ag Livestock Oil and Gas
Oil and Gas: 0
882
3,445
418
4,185
Oil and Gas: 0-38
1,056
3,116
811
8,114
Oil and Gas: 0-38
1,225
2,866
1,034
10,340
Page 34 of 58
Page 34 of 58

3.3.6 Total Projected Demand by Planning Area
For each planning area, total demands were only estimated for the residential sector. Residential demands are the demands expected to have substantial increases through the year 2050 and for which new infrastructure and water resource alternatives will be the most necessary. Estimated demands for each planning area are shown in Table 3-11.
Table 3-11 Projected Residential Water Demand Estimates for each Planning Area Through
2050
3.4 DENVER BASIN STORAGE VOLUME ESTIMATES
To gain an understanding of Elbert County’s water supply future, it is necessary to have an understanding of the county’s available supply. Estimates for the volume of Denver Basin groundwater underlying Elbert County and the Planning Areas as were defined in this report.
3.4.1 Current Storage
Due to the nature of the USGS Groundwater Model and the time steps it operates on, 2018 must be the starting point for storage estimates. It is assumed that differences between 2018 and 2017 are negligible. Table 3-12 shows that the amount of unconfined storage in 2018 is approximately 71.6 million acre-feet (MAF). Unconfined storage, in this case, is being defined as water that is not under a coefficient of compressibility within the aquifer; when this water is removed from the aquifer it actively lowers the water table and drains the aquifer – it does not necessarily mean that confining units do not exist above and below the aquifer. The estimated 71.6 MAF of unconfined storage is consistent with 467 MAF of total storage and 269 MAF of recoverable storage in all Denver Basin aquifers previously estimated by the USGS (MWE, Robson, 1987, p. 18). It is then assumed that only 75% of unconfined storage is physically recoverable, resulting in a total of approximately 54 MAF of recoverable storage underlying Elbert County in the Denver Basin aquifers.
Year
Elizabeth-Kiowa Study
AreaNW Study
AreaEastern
Study Area2010 1,682 1,106 92017 1,931 1,270 112035 4,020 2,644 232050 5,411 3,559 36
Demand in Acre-feet
Page 35 of 58
Page 35 of 58

The same process was repeated for the Northwest and Elizabeth-Kiowa Planning Areas. These calculations resulted in approximately 5.1 MAF of recoverable storage underlying the Northwest Planning Area and 10.9 MAF of recoverable storage underlying the Elizabeth-Kiowa Planning Area. For further details on the storage analysis see Memorandum titled “Tasks 1 and 2 – Elbert County Groundwater Supply and USGS Modeling” from McGrane Water Engineers in Appendix A.
Table 3-12 Estimates of Recoverable Storage of Denver Basin Groundwater Underlying Elbert
County and two of the Planning Areas
3.4.2 Future Remaining Storage
Using the storage values shown in Table 3-12, a simple analysis to estimate the future remaining storage was performed in order to gain an understanding of the future available supply remaining to Elbert County residents. Remaining storage estimates for the years 2035 and 2050 were made by subtracting annual cumulative demand from the recoverable storage estimates for 2018 year-by-year out to the year 2050. This method does not account for the effects of pumping from neighboring counties or communities, nor does it account for inter-aquifer flow or recharge – the former will have diminishing effects on aquifer life and the latter could have substantial increasing effects on the life of the aquifers. However, given the demands and volume of recoverable water underlying the county, the effect on available supply through the year 2050 is small (see Figure 3-2). Under the projected demands and available supplies, it is estimated that by the year 2050 Elbert County will see a reduction in available Denver Basin groundwater from 54 MAF to approximately 53.6 MAF a loss of only 0.78 percent (see Table 3-13).
Year County WideNorthwest
Planning AreaElizabeth-Kiowa Planning Area
Confined 300,842 43,417 87,705Unconfined 71,648,530 7,163,878 14,406,871Total 71,949,373 7,207,295 14,494,576Total Recoverable (75% of Unconfined) 54,037,240 5,416,326 10,892,858
Recoverable Storage Estimates in Acre-Feet
Page 36 of 58
Page 36 of 58

Table 3-13 Remaining Recoverable Denver Basin Storage Volumes through 2050
Figure 3-2 Estimated Recoverable Storage for Elbert County Plotted with Cumulative Demand for
Elbert County for 2018-2050
YearElbert County Total
Demand (AF)
Elbert County Cumulative Annual
Demand (AF)
Elbert County Total Recoverable Water
Volume (AF)
2018 9,466 9,466 54,036,0002035 13,389 208,996 53,836,5082050 15,737 429,090 53,616,984
Total Change -0.78%
0
10,000,000
20,000,000
30,000,000
40,000,000
50,000,000
60,000,000
2015 2020 2025 2030 2035 2040 2045 2050 2055
Tota
l Rec
over
able
Sto
rage
(acr
e-fe
et)
Year
Recoverable Storage Under Base Case (No Increase) Pumping Scenario Cumulative Projected Demand
54 MAF(2018)
53.6 MAF(2050)
0.78% Decline
9,272 AF(2018)
417,209 AF(2050)
Page 37 of 58
Page 37 of 58

CHAPTER 4 WATER RESOURCE OPTIONS
4.1 GENERAL
Chapter 4 outlines the options for Elbert County to consider in water resource planning through the year 2050. The options point to making efficient use of current supplies and possibly, supplementing Denver Basin groundwater with renewable water. These options include: importing renewable water from outside the county, reusing water, and transferring water use from agriculture. The above options were discussed in workshops with the BOCC. The alternatives evaluation (Section 4.3) reviews three scenarios that incorporate the water resource supply options selected for evaluation. While these options are considered on a countywide basis, they will be evaluated in more detail for the planning areas. The majority of the population and therefore, water demand, exists and is projected to increase the most in the Northwest and Elizabeth-Kiowa Planning Areas. This chapter also addresses options to help maximize the efficient use of the county’s water supplies. These options were not quantified as a part of the alternatives evaluation, but should be considered. They are:
1. Storage
a. Aquifer Storage and Recovery (ASR), either in the Denver Basin or alluvial aquifers
b. Surface Storage (Reservoirs)
2. Reuse Water Systems
3. Conservation/Efficiency Practices
4.2 WATER SUPPLY OPTIONS 4.2.1 Renewable Water Import
Water could be imported from renewable supplies sourced from the South Platte or Arkansas River basins via participation in regional partnerships, collaboration with water providers outside of Elbert County, and/or water rights purchases and transfers. This option requires extensive infrastructure and funding.
Page 38 of 58
Page 38 of 58

4.2.2 Reuse Reuse can involve everything from reusing water for augmentation supplies, irrigation, storage, indirect, or even direct reuse. Reuse broadly refers to using water after its first use and after it has been treated in a wastewater treatment facility. Utilizing this water involves the construction of sanitary sewer systems, typically in more densely populated areas for which such systems are economically feasible. Reuse systems operate by reclaiming treated wastewater flows, often from a point downstream of treatment plant discharges. This process has the natural effect of improving water quality through river bank and alluvial filtration. After the water is reclaimed within a flowing stream it undergoes further treatment to the point where it can be blended with the potable supply, or used for irrigation. Water could also be left in the river to meet augmentation requirements for alluvial groundwater wells.
4.2.3 Agricultural Transfer
As development and growth in Elbert County progresses, water that was used for farming and irrigation prior to development can then be used for municipal supply. This, however, is water that would continue to be sourced from the Denver Basin and alluvial aquifers within the county.
4.3 ALTERNATIVES EVALUATION
This section presents the alternatives that were screened for closer evaluation. These alternatives focus on how the demand structure could be changed for residential and commercial demand in the planning areas by increasing water reuse, accounting for agricultural transfer, and considering varying degrees of import of renewable water. Again, only the Northwest and Elizabeth-Kiowa planning areas will be the focus for renewable water – the Eastern Planning area is of low projected demand and would be served much more cost effectively from local supplies.
The overall average residential and commercial water demand for the three planning areas in the year 2050 is estimated to be 9,005 AF; the Northwest and Elizabeth-Kiowa Planning Areas total 8,971 AF. Each scenario outlines how this demand can be met. From this information, flow rates are estimated on an average basis for Import, Reuse, and Agricultural Transfer. These values will allow the sizing of the infrastructure necessary to convey water under each alternative scenario. This includes sizing components such as: water treatment plants, raw water piping, reuse water piping, pump stations, and staging reservoirs (see Chapter 5 for details). The demands and flow rates for each water supply option under each scenario in the year 2050 are discussed and presented below (see Figure 4-1). The alternatives are:
1. No Renewable Water Import: Continued use of groundwater, with increased reuse and accounting for a portion of agricultural transfer meeting some water demand.
Page 39 of 58
Page 39 of 58

2. 10% Renewable Water Import: 10% of the groundwater demand is replaced by renewable water import from outside the county, with the same level of reuse and agricultural transfer.
3. 25% Renewable Water Import: 25% of the groundwater demand is now replaced by renewable water import from outside the county, with the same level of reuse and agricultural transfer.
Figure 4-1
Graph of Total Residential and Commercial Demands for the EK and NW Planning Areas in 2050 Under Each Alternative Scenario (all values in acre-feet)
4.3.1 Scenario 1: No Renewable Water Import
The “No Import” scenario does not include any imported renewable water supplies. Reuse and potential agricultural transfers will be the only inputs to the water supply alternatives under this scenario. Otherwise, all residential water demand will continue to be met with Denver Basin groundwater (see Table 4-1).
790
1,970
7,8607,070
5,890
810 810 810301 301 301
0
1,000
2,000
3,000
4,000
5,000
6,000
7,000
8,000
9,000
10,000
No Imported Supplies 10% Imported 25 % Imported
ACRE
-FEE
T
Imported Renewable Water Nonrenewable Groundwater Reuse Ag Transfers
Year: 2050
Page 40 of 58
Page 40 of 58

Table 4-1 - Values for Scenario 1 “No Import” By Planning Area
Note: Totals may differ slightly from Figure 4-1 due to rounding.
4.3.2 Scenario 2: 10% Renewable Water Import
The 10% Import scenario (Scenario 2) incorporates renewable water into the water supply alternatives. This fraction of import water represents 10% of the residential water demand not met by reuse and agricultural transfer water, not 10% of the total residential demand (see Table 4-2).
Table 4-2 - Values for 10% Import by Planning Area
Note: Totals may differ slightly from Figure 4-1 due to rounding.
4.3.3 Scenario 3: 25% Renewable Water Import
The 25% Import scenario (Scenario 3) is similar to Scenario 2, only the renewable water import volume is 25% of the residential and commercial demand not met by reuse and agricultural transfer (see Table 4-3).
Table 4-3 - Values for 25% Import by Planning Area
Note: Totals may differ slightly from Figure 4-1 due to rounding.
AFY GPM MGD AFY GPM MGD AFY GPM MGDImported Renewable Water 0 0 0.00 0 0 0.00 - - -Nonrenewable Groundwater 4,715 2,923 4.21 3,150 1,953 2.81 36 22 0.03Reuse 487 302 0.43 320 199 0.29 3 2 0.003Ag Transfers 209 130 0.19 92 57 0.08 - - -Total 5,411 3,355 4.83 3,562 2,208 3.18 - - -
Water Supply Alternatives: 0% Import
Elizabeth-Kiowa Northwest Eastern
AFY GPM MGD AFY GPM MGD AFY GPM MGDImported Renewable Water 470 291 0.42 310 192 0.28 - - -Nonrenewable Groundwater 4,245 2,632 3.79 2,840 1,761 2.54 36 22 0.03Reuse 487 302 0.43 320 199 0.29 3 2 0.003Ag Transfers 209 130 0.19 92 57 0.08 - - -Total 5,411 3,355 4.83 3,562 2,208 3.18 - - -
Water Supply Alternatives: 10% Import
Elizabeth-Kiowa Eastern Northwest
AFY GPM MGD AFY GPM MGD AFY GPM MGDImported Renewable Water 1,180 732 1.05 790 490 0.71 - - -Nonrenewable Groundwater 3,535 2,192 3.16 2,360 1,463 2.11 36 22 0.03Reuse 487 302 0.43 320 199 0.29 3 2 0.003Ag Transfers 209 130 0.19 92 57 0.08 - - -Total 5,411 3,355 4.83 3,562 2,208 3.18 - - -
Water SupplyAlternatives 25% Elizabeth-Kiowa Eastern Northwest
Page 41 of 58
Page 41 of 58

4.4 OTHER MANAGEMENT PRACTICES
There are other initiatives that the County can encourage or pursue to extend the life of its Denver Basin supplies. These options were not quantified, but nonetheless are valuable options in managing water supplies wisely and efficiently. These include:
1. Storage
a. Aquifer Storage and Recovery (ASR)
b. Surface Water Storage
2. Reuse Water Systems
3. Conservation and Efficiency Practices
4.4.1 Storage
(a) Aquifer Storage and Recovery ASR involves the underground storage of water in aquifers for later use. This practice is a trend that is gaining popularity, particularly in semi-arid states like Colorado. ASR is regarded as a more effective method of water storage due to the elimination of losses from evaporation and seepage. For this option, renewable or reclaimed water could be recharged to an alluvial aquifer, or pumped into bedrock aquifers to extend their life, storing the water as needed. ASR in Colorado is more commonly used for storage in nontributary confined aquifers, and this has been successfully accomplished in Highlands Ranch for many years. It can also be used for alluvial aquifers and, in that case, it may be advisable to confine the storage volume with underground slurry walls to prevent the migration of stored water back to surface waters. The rules for ASR in Colorado are still being refined. However, the long-standing practice of ASR in Denver Basin aquifers is well established, and requires injected water to meet drinking water standards. Recharge occurring to alluvial groundwater typically requires compliance with groundwater standards. As the State Engineers Office continues to expand their rulemaking, allowing for ASR to take place in certain areas, this practice will hopefully become easier to accomplish from an administrative standpoint. ASR is a promising water management strategy that should be evaluated further as the county continues to plan for its water future.
Page 42 of 58
Page 42 of 58

(b) Surface Water Storage
Surface water storage is an important management strategy as well. It allows for seasonal capture of renewable water, year-round storage for reuse water, and helps to provide a buffer in times of drought. New storage facilities were not explored for this Study. Given the relatively low water demands of Elbert County, the proximity to regional water supply reservoirs, and the extreme cost and complexity of permitting and constructing reservoirs, the construction of new surface storage does not currently appear to be the most practical investment. Rather, if water providers in Elbert County were to consider participation in regional projects, such as the South Metro Water Supply Authority’s Water Infrastructure and Supply Efficiency (WISE) partnership, storage in a regional reservoir could be considered at that point.
Such participation would go hand-in-hand with the import option stated in section 4.2.1. For the purposes of this Study, it will be assumed that Elbert County would join a regional project such as WISE for its renewable water supply alternatives. This option could conceptually include storage in Reuter-Hess reservoir – that will be assumed for strictly for purposes of developing conceptual infrastructure costs, but is just one of several possibilities.
4.4.2 Reuse Water Systems
Water reuse is an effective method of increasing the efficiency and conservation of a water supply. By utilizing nonpotable reuse water to irrigate or serve industrial needs that otherwise would have been served by potable water, water providers and municipalities can stretch their supplies further. Reuse can also be integrated into potable supplies, typically after higher-level treatment and an environmental buffer such as a lake, river, or aquifer. Reuse of treated wastewater is included as part of the future water supply scenarios, but is also an efficient practice to extend the life of existing supplies. Nonpotable systems that effectively recycle treated wastewater effluent should be considered as new development continues in the county. Nonpotable water systems can potentially be constructed in combination with indirect potable reuse systems as described in Section 4.2.2.
4.4.3 Conservation Practices
There are multiple conservation practices that can lead to substantial water savings and should be a priority for all districts and municipalities. Things such as:
• Xeric landscaping and proper soil preparation
Page 43 of 58
Page 43 of 58
• Efficient fixtures such as showerheads and toilets
• Smart irrigation practices
• Increasing block rates for water sales
• Distribution system leak repair
• Water audits and surveys
• Public information and education on water use
Page 44 of 58
Page 44 of 58

CHAPTER 5 COST BENEFIT ANALYSIS
5.1 GENERAL
Costs to implement the alternatives presented in Chapter 4 have been estimated to determine what will be most cost effective. Costs were estimated for each category of water supply using the volumes and rates estimated for each alternative (Scenarios 1-3). These volumes and rates, combined with the locations of sources and demands, were used to estimate water rights costs, conceptually size the infrastructure needed to convey the water, and project pumping costs associated with continued use of Denver Basin groundwater. See Table 5-1 on the next page, and Map 5-1 at the end of this chapter for conceptual infrastructure sizing and plans for the Northwest and Elizabeth-Kiowa Planning Areas.
5.2 COST COMPONENTS
The components that comprise the cost estimates associated with the supply alternatives include: infrastructure capital costs, operations and maintenance (O&M) of the facilities, and the purchase of water rights and/or agricultural transfer water.
5.2.1 Infrastructure
To conceptually size the infrastructure for each alternative, the estimated flows as calculated for the 0, 10%, and 25% Import Alternatives under 2050 demands were used (See Section 4.3). Generally, the highest expected flows are used for a design basis. The demands for each type of water supply alternative require different infrastructure as described below:
• Import: Requires diversion structures and water transmission pipelines that would utilize pump stations to convey raw water to demand areas in either the Northwest or Elizabeth-Kiowa Planning areas. Portions of this pipe would need to be sized at the combined demand of both the planning areas. Reuse volumes are taken into account for sizing where reuse water would also be conveyed by these lines. Renewable water would most likely be conveyed from a large reservoir in the region, pursuant to participation in a regional partnership with a water provider(s) outside of Elbert County. Both Aurora and Rueter-Hess Reservoirs are located within 10 miles of Elbert County. The costs for renewable water import are based on conveyance from Rueter-Hess Reservoir, strictly for the purpose of conceptually
Page 45 of 58
Page 45 of 58

estimating the cost of renewable water import; there are no plans to store water for Elbert County there, or in any other reservoir.
• Reuse: Requires waterlines sized at the estimated reuse flow rates that convey recaptured water to treatment facilities.
Financing, designing, and constructing such infrastructure should be expected to take an extended length of time. For the purposes of this report, it is assumed that the Elizabeth-Kiowa Planning Area reuse will not come online until 2027 and Northwest Planning Area reuse will not come online until 2032. This is also a function of the fact that there needs to be enough water use/demand in order for there to be a reliable supply of available reuse water – therefore it is a function of current and expected growth. Due to the complexity associated with importing renewable water from sources outside the county and the infrastructure required to convey it to demand centers within the county, it is assumed that renewable water import does not come online until the year 2035.
Table 5-1 Minimum Necessary Infrastructure for the Alternatives
Item / Description Unit Quantity0% Import
Scenario Sizes
10% Import Scenario
Sizes
25% Import Scenario
SizesRaw Water Pump Station 1 - Import LS 1 0 MGD 0.7 MGD 1.76 MGDRaw Water Pump Station 2 - Import LS 1 0 MGD 0.42 MGD 1.05 MGD
Northwest Planning AreaReuse Pipe - NW Area LF 43,400 6" 6" 6" WTP 1 - NW Area LS 1 0.29 0.57 MGD 1.0 MGDImport Pipe 1A LF 62,800 N/A 10" 10" Import Pipe 1B LF 8,600 N/A 6" 8" Operational Storage Reservoir 1 LS 1 N/A 2 MG 2 MGReuse Pump Station No. 1 LS 1 0.29 MGD 0.29 MGD 0.29 MGD
Elizabeth-Kiowa Planning AreaReuse Pipe - Elizabeth LF 9,500 8" 8" 8" Reuse Pump Station #2 LS 1 0.43 MGD 0.43 MGD 0.43 MGDWTP 2 - Elizabeth LS 1 0.43 MGD 0.85 MGD 1.48 MGDImport Pipe 2 LF 26,300 N/A 6" 8" Operational Storage Reservoir 2 LS 1 N/A 3 MG 4.5 MG
Page 46 of 58
Page 46 of 58

5.2.2 Operations and Maintenance (O&M) Costs
Infrastructure for each alternative requires consideration of operations and maintenance costs, particularly for pump stations and water treatment plants. These costs are estimated using average values of similar facilities; these values are:
• O&M Costs for Water Treatment Plants: $1.00 per kgal per year
• O&M Costs for Pump Stations: $0.35 per kgal per year
These costs would begin the year that these facilities are completed and expected to come online. Therefore pump stations for the renewable water import will not incur costs until 2035. Similarly, for reuse facilities in each planning area; the Northwest Planning Area begins O&M costs in 2027 and the Elizabeth-Kiowa Planning Area begins O&M costs for reuse in 2032.
5.2.3 Water Rights
It is assumed that any renewable water supplies obtained through the purchase of water rights in the South Platte or Arkansas River basins would cost approximately $15,000/AF plus some engineering and legal fees.
5.2.4 Agricultural Transfer
For Elbert County, agricultural transfer water would be in the form of Designated Basin alluvial groundwater or Denver Basin groundwater, not surface water supplies. Based on transactions reviewed in Upper Black Squirrel Designated Basin this water is assumed to cost $7,000/AF plus some engineering and legal fees.
5.2.5 Groundwater Pumping Costs
Groundwater pumping costs are the costs associated with the continued use of Denver Basin groundwater. This will change with each scenario, based on the volume of renewable import water and reuse water replacing groundwater pumping needs, using a prototypical well analysis.
Prototypical Well Analysis The prototypical well analysis uses average aquifer well depths, water demand and aquifer parameters in a cost model developed for each of the planning areas. The demand is driven by population growth which drives the number of wells. New wells were distributed to the various aquifers according to the current ratio of people per well per aquifer obtained from the State’s well database. The number of wells drives the direct capital costs (wells and pumps). The number of pumps drives the operations costs which include pump replacement costs and electrical power. The total cost for each alternative is the sum of
Page 47 of 58
Page 47 of 58

capital and operations costs for each prototypical well multiplied by the number of future wells, which vary in depth by aquifer. Average physical aquifer characteristics were extracted from the USGS (2011) groundwater model including:
• Ground elevation;
• Aquifer bottom (assumed to represent new well depths);
• 2018 and 2053 water level elevation (used to estimate regional water level decline rates); and
• Aquifer characteristics: sand thickness, transmissivity - measure of permeability multiplied by the sand thickness - and confined and unconfined storage properties.
Costs for well drilling and completion, pumping systems (including wellhead appurtenances), and power costs are based on interviews with domestic and municipal drillers and pump installers (Heir Drilling in Castle Rock, and Layne-Christensen in Aurora). The comparative economic analysis calculates the Net Present Value (NPV) of totaled annual direct costs from 2018 to 2050 (32 years) assuming annual inflation rates and a discount rates of 2 percent. The results of the prototypical well analysis are shown for each scenario in Tables 5-2 through 5-4 in section 5.4. As expected, well costs decreased with less reliance on Denver Basin groundwater primarily via an increase in imported renewable water. An extensive memorandum explaining the prototypical well analysis and cost model is found in Appendix B titled “Task 3 – Prototypical Well Analysis Detail” by McGrane Water Engineers dated September 12, 2017.
5.3 ALTERNATIVES COST SUMMARY
The sum of all the costs under each scenario are presented here. For detailed cost tables, see Appendix D. The dollars are reported in Net Present Value (NPV). For NPV an inflation and discount rate of 2% was used.
5.3.1 Scenario 1 (0% Renewable Water Import)
Scenario 1 has no renewable water import, but does contain reuse and agricultural transfer water as new sources. Total costs are summarized in Table 5-2.
Page 48 of 58
Page 48 of 58

Table 5-2 Scenario 1 Total Costs Through the Year 2050
5.3.2 Scenario 2 (10% Renewable Water Import)
Scenario 2 differs from Scenario 1 in that 10% of the groundwater pumping is replaced with renewable water supplies. Scenario 2 costs are summarized in Table 5-3.
Table 5-3 Scenario 2 Total Costs Through the Year 2050
Item / Description Total Cost (2017 $)
Agricultural Water Rights Transfer $6,000,000
Indirect Potable Reuse Systems Project Costs $32,000,000 O&M Costs 11,000,000$
Renewable Water Import Project Costs -$ O&M Costs -$
GW Pumping Cost (2017-2050) $458,000,000
Total Cost - All Alternatives 507,000,000$
Item / Description Total Cost (2017 $)Agricultural Water Rights Transfer 6,000,000$
Indirect Potable Reuse Systems Project Costs 32,000,000$ O&M Costs 11,000,000$
Renewable Water Import (Q = 0.7 MGD) Project Costs 34,000,000$ O&M Costs 2,000,000$
GW Pumping Cost (2017-2050) $387,000,000
Total Cost - All Alternatives 472,000,000$
Page 49 of 58
Page 49 of 58

5.3.3 Scenario 3 (25% Renewable Water Supply) Scenario 3, is similar to Scenario 2, only differing from Scenario 1 in that 25% of groundwater demand is replaced by renewable water. Note that while the costs for indirect potable reuse systems increased in Scenario 3, the volumes of reuse water did not. The increase in cost is due to upsizing the treatment plants to treat raw renewable water. Therefore, an increase in renewable water import results in an increase in water treatment plant size, and operations and maintenance cost per thousand gallons of water. Scenario 3 costs are summarized in Table 5-4.
Table 5-4 Scenario 3 Total Costs Through the Year 2050
Item / Description Total Cost (2017 $)Agricultural Water Rights Transfer 6,000,000$
Indirect Potable Reuse Systems Project Costs 44,000,000$ O&M Costs 17,000,000$
Renewable Water Import (Q = 1.76 MGD ) Project Costs $62,000,000 O&M Costs 5,000,000$
GW Pumping Cost (2017-2050) $367,000,000
Total Cost - All Alternatives 501,000,000$
Page 50 of 58
Page 50 of 58

!.
")
!.
")
!.
!(
!(
Kiowa
Creek
Running Creek
Wolf Cree
k
Dry C
reek
Coma
nche
Creek
Gold
Creek
Cool Cree
k
Gopher Creek
Coal Creek
Little
Dry
Creek
Box E
lder C
reek
²0 8 164
Miles
MAP LEGEND
Projection:UTM Zone 13N, metersNAD83
Drawn by: L. Rein
Map 5-1: Conceptual Importand Reuse System
(Basis for Cost Opinion)
UV86
UV83
Reuse Pump Station 1
ELBERT ELBERT COUNTYCOUNTY
DOUGLAS DOUGLAS COUNTYCOUNTY
ARAPAHOEARAPAHOECOUNTYCOUNTY
AURORA RESERVOIR
QUINCYRESERVOIR
RUETER-HESSRESERVOIR
Date: 1/25/2018
!.
")!(
Runn
ing C
reek
Gold Creek
")
!.
!(
Running Creek
WTP #1
Operational Storage Reservoir
#2
WTP #2
0 0.60.3Miles
0 0.80.4Miles
CR
13
ELBERT COUNTY RURAL WATER SUPPLY STUDY
Reuse Pump Station#2
Operational Storage Reservoir
#1
Refer to Inset 1
Refer to Inset 2
Inset 2
Inset 1
Eastern Planning Area
Elizabeth-Kiowa Planning Area
NW Planning Area
Elbert County Boundary
Elizabeth
Import Pipe 1A
Import Pipe 1B
Import Pipe 2
Reuse Pipe
Reuse PipeElizabeth
Raw Water Pump Station 2
Reuse PipeNW Area
Reuse Pipe ElizabethImport Pipe 2
Import Pipe 1A :Bringing in renewable water from a regional
storage facility or other source - to be determined.
Import Pipe 1B
Reuse Pump Station 2
Raw Water Pump Station 1 Outside of County at Source of Renewable
Water Import - To Be Determined
!. Raw Water Pump Station
!. Reuse Pump Station
") Water Treatment Plant
Page 51 of 58
Page 51 of 58

CHAPTER 6 SUMMARY AND RECOMMENDATIONS
6.1 GENERAL
From the analysis provided in this report, Elbert County has adequate Denver Basin groundwater supplies through the year 2050, considering the county as a whole. While Denver Basin groundwater supplies are not expected to be depleted by the year 2050, it is important to continue to plan for renewable water supplies, and to promote conservation and increased efficiency. This is particularly true as local geological variations in the Denver Basin aquifers could cause some portions to become uneconomical far earlier than others.
6.2 SUMMARY AND CONCLUSIONS
While the modeling performed for this report shows that there is more than adequate overall supply in volume of water available in the Denver Basin underlying the county, there are several important factors to consider:
• These modeling efforts do not account for pumping from neighboring counties and population centers
• While there is adequate supply in all aquifers through the year 2050, local variation in geology and aquifer depth mean that some wells could experience significant water level declines before others
• The prototypical well analysis, while accounting for water level changes, does not and cannot show at what point groundwater pumping becomes uneconomical for specific users
The state’s goals as outlined in Colorado’s Water Plan point to increasing efficiencies, conservation, and pursuing smart storage projects. As a county within a semi-arid state with water supplies that are stretched thin, Elbert County is an integral component in a larger statewide effort in smart water planning. Elbert County has implemented rules in the past with the goal of lengthening the life of the aquifers. DWR rules allow for development of Denver Basin groundwater based on an assumed 100-year life. The estimated total volume of groundwater by aquifer beneath a property is divided by 100 to establish the annual pumping volume allowed from each aquifer. Neighboring Douglas and Arapahoe Counties use this DWR rule for new development. Like El Paso County however, Elbert County has implemented a more onerous 300-year rule, meaning that a particular property can only support one-third the density that would be allowed under the 100-year rule. Although the 300-year rule may have been intended to reduce the draw on Denver Basin groundwater and promote development of renewable supplies, it has had the effect of promoting more dispersed
Page 52 of 58
Page 52 of 58

development in unincorporated Elbert County. Although such a development pattern appears to be compatible with the county’s rural character, it is not conducive to the centralized water services or possibly, wastewater collection for reuse that would make for more efficient use of water resources over the long term. If production from domestic wells is lost due to localized aquifer declines, retrofitting dispersed development areas with centralized water service will either be very costly or not economically feasible. Property values could be affected, particularly if homeowners must resort to hauling water and using cisterns. Dispersed development, in general, makes for more costly infrastructure and maintenance on a per home basis.
6.3 QUALITATIVE BENEFITS
The qualitative benefits to be achieved by pursuing increased efficiencies, conservation, and smart water storage for renewable water, thereby lessening dependence on the Denver Basin include:
• Saves Denver Basin Water for dry years and extended droughts
• Renewable water supply and infrastructure systems, as shown in this report, become the more cost-effective option for the long term.
6.4 COST BENEFITS
According to the cost benefit analysis, Scenario 2 (10% Import) is the least expensive alternative, and is therefore the recommended scenario for Elbert County. Both Scenarios 2 and 3 (25% Import) are less than Scenario 1 (No Import) when compared on a net present value basis over the long-term planning period (see Table 6-1). This is due to lessening groundwater pumping by Elbert County residents. Despite the high cost of renewable water infrastructure and development, these costs will offset, and even make renewable water import more cost effective over time. The large initial investment in renewable water can pay dividends in the long run, as it the offsets ever-increasing costs of continued groundwater pumping. Using only Denver Basin groundwater will require more wells over time even to maintain production as aquifers decline.
Table 6-1 - Summary of Alternatives Costs Alternative Groundwater
Pumping Renewable
Water & Reuse Total Cost
Scenario 1 (No Import) $458M $49M $507M Scenario 2 (10% Import) $387M $85M $472M Scenario 3 (25% Import) $367M $134M $501M
Page 53 of 58
Page 53 of 58

6.5 MANAGEMENT AND OVERSIGHT
The 10% and 25% renewable water import scenarios (2 and 3) would require extensive collaboration and financing to develop. The municipalities and special districts would need to share the vision and commitment to develop a single system. This presents a significant political and institutional hurdle. They may also be able to join in on a larger regional scale to partner on projects such as the WISE (Water Infrastructure and Supply Efficiency) Partnership with the South Metro Water Supply Authority (SMWSA).
6.5.1 Regional System
The WISE partnership consists of 10 of SMWSA’s 13 members that have formed the South Metro WISE Authority. They include: Centennial Water and Sanitation District, Cottonwood Water and Sanitation District, Dominion Water and Sanitation District, Inverness Water and Sanitation District, Meridian Metropolitan District, Parker Water and Sanitation District, Pinery Water and Wastewater District, Rangeview Metropolitan District, Stonegate Village Metropolitan District, and the Town of Castle Rock.
Many of the WISE members are similar to Elbert County water users in that they have a heavy reliance on Denver Basin groundwater. The WISE project seeks to deliver more renewable South Platte Basin water supplies to these water providers in an effort to create a more sustainable long-term water supply future. It is projects such as this that Elbert County water providers should seek to contribute to and partner with. Elbert County itself could help facilitate such participation, or work towards developing similar plans for water supply projects apart from SMWSA.
6.5.2 Formation of Management Districts
Special districts already exist in Elbert County, although their numbers are limited. As the population increases and demand centers begin to develop, more special districts will likely be formed. These districts create an efficient means of funding infrastructure for water supply and wastewater treatment. But, they should be developed around a common plan for long-term water supply. As the water needs of the county become larger and more difficult to manage with time, these districts could potentially form a water authority, similar to SMWSA or the Pikes Peak Regional Water Authority (PPRWA) in the Colorado Springs area. Such an authority would work to coordinate the efforts of the districts in order to help efficiently work together in reaching common, regional, water supply goals.
6.5.3 Funding
Funding for projects that include renewable water supply in the county and increased reuse systems would have to largely come from municipal and special district financing.
Page 54 of 58
Page 54 of 58

However, the Colorado Water Conservation Board (CWCB) has sources of funding through multiple grants and loans specifically for water related projects. Below is a list of some of the grants offered through the CWCB that would have relevance to the water supply alternatives for Elbert County: A. Colorado’s Water Plan Grants
o Provides financial assistance to make progress on the CWP’s Measurable Objectives or critical actions. Current funding levels are shown, but will vary year to year.
Supply and Demand Gap Projects ($2 M available)
Water Storage Projects ($3 M available)
Conservation, Land Use Planning ($1 M available)
Engagement and Innovation Activities ($1 M available)
Agricultural Projects ($1 M available)
Environmental and Recreational Projects ($1 M available)
B. Water Efficiency Grants
o Provides financial assistance to communities, water providers and eligible agencies for water conservation-related activities and projects.
Water Conservation Planning Grants
Water Conservation Implementation Grants
Drought Mitigation Planning Grants
Water Resource Conservation Public Education and Outreach Grants
C. Water Supply Reserve Account
o Provides grants and loans to assist Colorado water users in addressing their critical water supply issues and interests. The funds help eligible entities complete water activities, which may include competitive grants for (requests for these funds must be approved by at least one of Colorado’s nine basin roundtables):
Technical assistance regarding permitting, feasibility studies and environmental compliance;
Page 55 of 58
Page 55 of 58

Studies or analysis of structural, nonstructural, consumptive and nonconsumptive water needs, projects or activities; and
Structural and nonstructural water projects or activities.
D. Severance Tax Trust Fund Operational Account Grants
o Provides grants for regional water resource planning studies and associated demonstration projects.
o The funds from the Account can be used for a study or demonstration project that will benefit a wide range of people and organizations, and/or a large geographic area within Colorado. Approved grants must be able to begin the project 6 months after the application date and complete the project within 12 months.
6.6 RECOMMENDATIONS
1. Although the total volume of Denver Basin groundwater can sustain Elbert County well beyond 2050, the aquifers are expected to continue to decline. Some areas may experience more rapid declines than others, depending on the aquifer. The USGS is close to completing a three-year well monitoring program that provides data on pressure levels in the aquifers from over 30 Denver Basin wells. The County should make this an ongoing program and continue to monitor this supply indefinitely.
2. Denver Basin groundwater should be preserved as much as practicable through water conservation and efficiency, extending the economically useful life of the aquifers. Front Range water providers have found that tiered water rates in which higher usages are charged at escalating unit costs, are the most effective means of promoting conservation. The County should incentivize central water systems to develop such rate structures.
3. Denver Basin water can be preserved further if a portion of future demands is met by water reuse. Reuse requires sanitary sewer systems to collect wastewater for centralized treatment. The water can then either be distributed to irrigation sites (possibly even individual residences, depending on the level of treatment) or returned to blend with a potable water supply (normally, after first passing through an environmental buffer such as a lake, river, or aquifer). This also points to the need for a service provider to collect wastewater for treatment and reuse.
4. Centralized water service, and possibly sewer service followed by reuse, are only economically practicable for denser developments due to the costs of constructing and maintaining those piping networks. The County should consider incentivizing denser developments that use centralized water and sewer systems.
5. The majority of domestic water wells are completed in the Upper and Lower Dawson formations, although the deeper Denver and Arapahoe aquifers generally offer higher
Page 56 of 58
Page 56 of 58

production. It would be beneficial to incentivize central water systems for new developments that use the Denver and Arapahoe aquifers, rather than the Dawson, thus leaving the shallower aquifers for the more dispersed domestic well users.
6. The County’s 300-year rule for new development using Denver Basin groundwater promotes dispersed development on 5- and 10-acre ranchettes vs. subdivisions served by a water distribution system. It will be cost-prohibitive to extend water mains to dispersed development, so those acreages will likely need to continue on Denver Basin groundwater. Denser development served by water mains from a central well system will be easier to convert to renewable water if needed. Such development also allows for cost-effective wastewater collection, allowing reuse to offset a portion of future water supply needs. The County should consider allowing variances to the 300-year rule as an incentive for developers that commit to “best practices” which may include: (1) producing water only from the deeper aquifers for centralized distribution; (2) promoting conservation and efficiency through a tiered rate structure; (3) collecting wastewater for treatment and reuse to offset a portion of demand; and (4) adopting water efficient landscaping standards.
7. The cost analysis shows the economy of meeting a portion of future demand with imported renewable supplies to offset 10 percent of projected Denver Basin use in the key planning areas. However, financing, constructing, and then operating a water import system will require many years of planning and collaboration by Elbert County water providers, possibly with facilitation by the County. It will also require working with water providers and regional water partnerships outside of Elbert County. The County and/or its water providers should start engaging in regional water planning as soon as practicable. (The WISE project took more than 15 years to reach the point of water deliveries in Fall 2017.)
8. The County should evaluate storage options further; surface storage as well as recharge and storage in bedrock and alluvial aquifers. Storage will become more important as reuse and renewable water options are implemented.
9. The County could also facilitate provisions for future renewable water delivery by identifying and securing transmission pipeline corridors and treatment plant sites. This could be part of the County’s broader framework of water, wastewater, and reuse systems in the planned growth areas to guide future development. The County should develop a “water and wastewater master plan” to serve as a reference during the land-use planning process so that the County can fit each development into coordinated system from a countywide perspective.
10. Localized zones of low well productivity, or along fringes of the aquifers may not be conducive to dense development, or it may be necessary to have water piped from satellite well fields located in more productive areas. Mapping of these low production zones by aquifer should be considered in the land-use planning process.
Page 57 of 58
Page 57 of 58
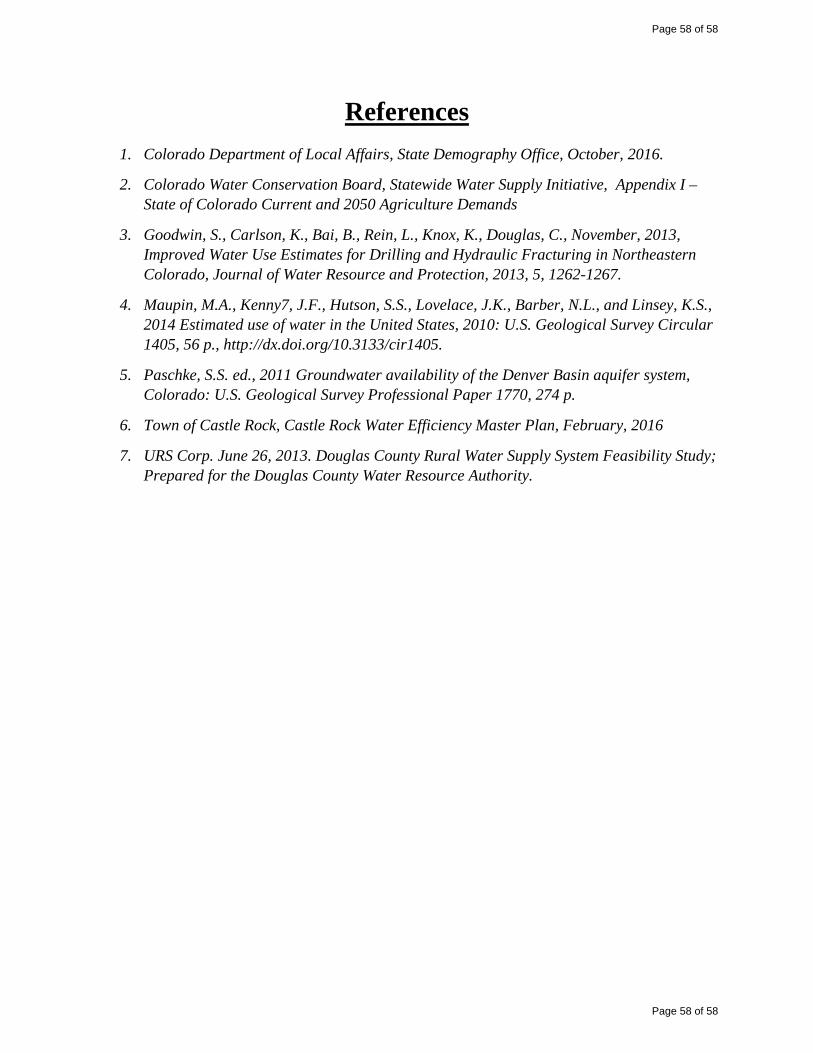
References
1. Colorado Department of Local Affairs, State Demography Office, October, 2016.
2. Colorado Water Conservation Board, Statewide Water Supply Initiative, Appendix I – State of Colorado Current and 2050 Agriculture Demands
3. Goodwin, S., Carlson, K., Bai, B., Rein, L., Knox, K., Douglas, C., November, 2013, Improved Water Use Estimates for Drilling and Hydraulic Fracturing in Northeastern Colorado, Journal of Water Resource and Protection, 2013, 5, 1262-1267.
4. Maupin, M.A., Kenny7, J.F., Hutson, S.S., Lovelace, J.K., Barber, N.L., and Linsey, K.S., 2014 Estimated use of water in the United States, 2010: U.S. Geological Survey Circular 1405, 56 p., http://dx.doi.org/10.3133/cir1405.
5. Paschke, S.S. ed., 2011 Groundwater availability of the Denver Basin aquifer system, Colorado: U.S. Geological Survey Professional Paper 1770, 274 p.
6. Town of Castle Rock, Castle Rock Water Efficiency Master Plan, February, 2016
7. URS Corp. June 26, 2013. Douglas County Rural Water Supply System Feasibility Study; Prepared for the Douglas County Water Resource Authority.
Page 58 of 58
Page 58 of 58