rural management through dairy enterprises in tamilnadu
TRANSCRIPT

...7...
items namely cow dung is used as a prime
material for production of cow dung gas which
is largely used as cooking fuel. The total
population of livestock is in India is 35334
million according to the 1972 census. In
percentage of target is animal husbandry.
India is often described as a land of
contrasts. Nowhere is this vast land of 980
million people is this true than is dairy farming.
The pressure of population ensures that land
remains prime property-Adding to the man-
land intensity is a sizable population of labours
who work on the land but own little or none.
Our population, our land and its limits, also
require that our available soil be used to grow
food crops to meet our people’s needs, needs
that expand not merely because of size but
because we can increasingly afford more and
better food.
No Green Carpet
The priority must be given ensuring basic
nutrition for our people means that little land
can be diverted to the growing of fodder for
cattle. Cattle must make do with what grows
by the side of the fields and such crop resides
as straw, rice polish, bran, oilseed cakes and
Introduction
In a predominantly agricultural economy
like ours, Dairy Development plays a vital role
in providing self employment in rural areas and
ensuring nutrition to the population. Dairy
Development in Tamil Nadu dates back to the
1920s when the State Co-operative Depart-
ment stated organizing milk Co-operative
societies. Dairy Development acquires spe-
cial significance when nature plays truant as
is the case today, in Tamil Nadu, where
unprecedented drought has hit the lives of
many rural people.
Even feeling of milk animals has become
very difficult. Hence, efficient dairy develop-
ment calls for an integrated approach namely
rearing maintenance and marketing of milk
and as its allied products. As Gandhi clearly
pointed out, Villagers are the backbone of the
Indian Economy. In rural areas cattle rearing
is one of the occupations especially among
the rural poor comprising of farmers and
artisans- It can fetch a considerable amount
of additional income for their livestock. It
provides employment opportunity to the un-
educated children in rural areas. The waste
RURAL MANAGEMENT THROUGH DAIRY ENTERPRISES IN TAMILNADU
Dr. M. Perumal,
Associate Prof. of Economics, Urumu
Dhanalakshmi College,, Trichy – 19,
Tamilnadu.
Mr. T. Prakash
Doctoral Research Scholar,
Department of Economics,
Urumu Dhanalakshmi College,
Trichy – 19, Tamilnadu.
ABSTRACT In a predominantly agricultural economy like ours, Dairy Development plays a vital role in providing self
employment in rural areas and ensuring nutrition to the population. Dairy Development in Tamil Nadu dates back to the
1920s when the State Co-operative Department stated organizing milk Co-operative societies. Dairy Development
acquires special significance when nature plays truant as is the case today, in Tamil Nadu, where unprecedented drought
has hit the lives of many rural people.
Even feeling of milk animals has become very difficult. Hence, efficient dairy development calls for an integrated
approach namely rearing maintenance and marketing of milk and as its allied products. As Gandhi clearly pointed
out, Villagers are the backbone of the Indian Economy. In rural areas cattle rearing is one of the occupations especially
among the rural poor comprising of farmers and artisans- It can fetch a considerable amount of additional income
for their livestock. It provides employment opportunity to the uneducated children in rural areas. The waste items
namely cow dung is used as a prime material for production of cow dung gas which is largely used as cooking fuel.
The total population of livestock is in India is 35334 million according to the 1972 census. In percentage of target is
animal husbandry.
RURAL MANAGEMENT THROUGH DAIRY ENTERPRISES IN TAMILNADU

...8...
Voice of Research Vol. 1, Issue 1, January-March 2012
small quantities of coarse grain concentrates.
Not for the Indian cow or buffalo those areas
of green carpet enjoyed by the privileged cattle
in New Zealand, Europe and North America.
As a result, our dairy animals typically
produce no more than three or four litres of
milk a day; many produce far less. The positive
side of our approach to feeding is that because
cattle are fed crop residues, the energy
efficiencies achieved are high, so high that
they would be impossible in a developed world
dairy setting where high nutrition feeds, pro-
duced by using fertilizers and tractors and
which are then shipped long distances, require
that the energy expended in the production of
the milk is comparatively high, quite apart from
the energy used in the machine milking,
factory processing and packaging products,
shipment through extensive cold chains and
the like.
According to the FAO publication Food
2010, India, along with the United States, was
the largest producer pf milk in the world at the
end of 2010. Our total production of 70.8
million tonnes, was expected to over take the
U.S. and go on to produce 74 million tonnes
in 1998. How has this been accomplished?
The Indian Dairy industry was not blessed
with a great many natural advantages. In fact,
we suffered from all possible disadvantages,
save one: India, almost alone among non-
European cultures, is a milk drinking nation.
This, coupled with our large population, en-
sured a constant and growing demand for
milk.
Unfortunately, the policies and
programmes during the colonial era ensured
that our milk production languished at around
20 million tonnes which meant that per capita
access to milk and milk products was falling.
Our very best cattle were taken to the cities to
meet the urban demand for milk and when they
went dry, they were either slaughtered or
abandoned. This practice of shipping milk on
the hoof was responsible for tragically eroding
the genetic potential of dairy cattle in the
country.
A second and equally serious problem
was that dairy farmers in our villages were
compelled to sell milk to middle men at
derisory prices simply because the govern-
ment had given these traders a monopoly of
purchasing the milk in return for supply to cities
like Bombay. The farmers’ problems were
complicated by the fact that milk would not
keep good beyond 3 hours in our climate. The
result was evident in stagnant production.
In this generally dismal scenario, the
farmers of one district Kheda in Gujarat,
sought the advice and help of one of India’s
greatest men—Sardar Vallabhbhai Patel, who
later became Deputy Prime Minister of inde-
pendent India. He told them bluntly that the only
way they should save themselves was to form
a dairy cooperative and sell the milk directly to
the markets instead of through middlemen.
Forming a cooperative offered its own chal-
lenges. Here was an illiterate farming commu-
nity being told to form a modem cooperative
and market their milk in one of India’s most
modern and sophisticated cities—Bombay.
This initiative met with fierce opposition
from all quarters from the colonial government’s
Milk Commissioner in Bombay to the local
privately owned dairy in Kheda, to the traders
who supplied the dairy while bleeding the milk
producer.
The new cooperative struggled against all
odds for years but it survived/ and eventually
it thrived. By 1965 this cooperative—what
everyone today knows as AMUL—had ac-
quired a name for itself as the best run and
most modem dairy cooperative in the country.
Amul products were, as the Sanskrit
name suggests, “price-less”. As the coopera-
tive had created a remunerative and reliable
market for milk, its members wanted to
increase production. So they instructed the

...9...
cooperative management to provide them with
fortified fodder for their cattle and also veteri-
nary on a 24 hour basis. They then made sure
that the cooperative offered artificial insemina-
tion facilities using the best breeds to improve
the dairy potential of their cattle. Because it
was owned by dairy farmers, the cooperative
bought milk all year round. It sold the pasteur-
ized and treated milk in the cities, manufac-
tured dairy products, and regularly distributed
profits as a year-end bonus to its members,
over and above the good prices they received,
twice each day.
In 1965, the then Prime Minister of India,
Lai Bahadur Shastri visited Kheda District and
decided that the Amul example should be
replicated all over the country.
This led to the setting up of the National
Dairy Development Board with the position of
replicating the Amul experience—what came
to be called the Anand pattern of Dairy
cooperatives—all over India. The programme
to achieve that replication—Operation Flood—
began with a plan to build four metropolitan
dairies, one for each India’s biggest cities and
promote dairy cooperatives in 17 promising
areas—-termed milk sheds—in 10 states.
The European Economic Community
played a helpful role in ensuring that the Anand
pattern replication succeeded by donating milk
powder and butter oil to India. These com-
modities were reconstituted into liquid milk and
sold in our metropolitan markers.
The money generated from the sale of the
gift commodities was used to finance the four
metro dairies and to pioneer establishment of
dairy cooperatives to supply them. In the
second phase of Operation Flood, EC com-
modity support was supplemented by World
Bank Loans. During this phase a national milk
grid was established which ensured that major
cities all over the country received their milk
supplies by rail and road tankers from places
as far as 2,000 km away. The third phase
expanded the effort made embrace the entire
country.
Today, there are 10.1 million farmers who
are members of 77,000 village dairy coopera-
tives societies, each of which is affiliated to
one of 170 district and regional cooperatives
unions which in turn, are part of a State
cooperatives marketing federation. There are
22 of these federations which offer dairy and
other products in the market successfully
competing among themselves and with dairy
firms owned by individuals investors and
multinationals.
The industry as a whole today produces
enough milk and milk products to ensure that
the country imports virtually no dairy products.
Significance of Dairy Development
Distribution of milk animals and encour-
agement of milk production is one of the
popular action programmes under the Inte-
grated Rural Development for alleviating pov-
erty in India. The beneficiaries earned a dairy
additional income of Rs. 8.00 with the imple-
mentation of such programmes through erst-
while small farmers’ development agency and
the present rural development agency. Before
1979 the average dairy income of the benefi-
ciaries was between Rs. 8 to 12. After the
implementation of such programme farmers
earned an average of Rs. 10.00 per day.
Dairy Development is conceived as a
major development programme not only in the
context of poverty mitigation plan but also as
a measure to augmenting milk production to
meet the increased demand for milk from
urban consumers.
The annual production of milk in India is
estimated as 583.78 million-tonnes and the
target proposed during the Sixth Plan is the per
capita consumption of milk is 112 grams and it
is proposed to raise to it 210 grams by 2009-
2010.
RURAL MANAGEMENT THROUGH DAIRY ENTERPRISES IN TAMILNADU

...10...
Voice of Research Vol. 1, Issue 1, January-March 2012
Dairy development in Tamil Nadu has
been taken up under of the Co-operative and
State Department of Animal Husbandry. A unit
outline of the programme as reported in Co-
operative Fortnightly is quoted below.
1. A new Apex Federation formed on
1.2.1981. It has taken over activities of dairy
development corporation and has expended
on the same. Its aim is to implementation of
the “Operation Flood—II” programmes in the
state effectively. As per Anand pattern all the
15 Districts have formed District Milk producer’s
unions. Of these 9 districts are under Opera-
tion Flood II programme. Under this programme
costing about Rs. 42 Crores. The massive
expansion and acceptance of dairy enterprise
under given farmer and farm family socio-
economic conditions.
Several research studies and evaluation
reports are available to access, the perfor-
mance of milk production programmes in the
country in general. However, economic inves-
tigation of micro-level covering the basic units
of production are quite lacking and quite often
the need for such studies has been empha-
sized for micro level planning and develop-
ment of milk production units- The presents
study is one such attempt at the development
of Block level. Viz.
Thottiyam Block in Thiruchirapalli District,
Tamil Nadu Hole of Dairying in Sustainable
Crop Farming Dairying in India, in general, is
closely interwoven as an integral part of and
an adjunct to agriculture but it did not receive
as much attention as it richly deserves relative
to crop production for obvious reasons. The
western commercial farming system charac-
terized by use of mega equipment, pesticides
and fertilizers heavily relies on substitution of
capital equipment for labour and higher use of
feedstuff’s edible to man.
This high energy system is heading
towards a pronounced decline in the number
of dairy farms and the number of cows,
increasing stocking rates of cows per farm
associated with significant productivity in-
creases in milk production per cow. According
to a study (Schelhass, 1992) by the year 2000
A.D. the annual average yield per cow will third
and the number of dairy farmers will fall around
50 per cent in 19 western countries which
currently account for almost 50 per cent of the
world milk production.
However, in contrast in India, milk produc-
tion is predominantly the domain of small and
marginal farmers and the landless who keep
1-2 milch animals generally as a part of mixed
farming system. Small holders own about 70
per cent of the milch animal population but
these are widely dispersed in rural areas with
poor infrastructure and limited access to
services and markets. In India, cattle and
buffaloes are raised mainly on feedstuff’s
which are unfit for human consumption, e.g.,
rice straw, wheat straw, maize, sorghum and
millet stovers and other crop byproducts and
waste material.
Despite significant achievements in many
sectors, as explained earlier, India has a large
rural population which suffers from unemploy-
ment or underemployment and is below the
poverty line. And the pressure of land on
account of increasing human population is
such that the little or no land can be exclusively
devoted to production of feeds for the animals.
For about the last two decades there has been
no change in cultivated area devoted to fodder
production, about 4 per cent, in the country.
This will continue to be the case for the
foreseeable future also. Therefore, increase in
production have to be achieved mainly by
feeding the animals on crop residues and
natural herbage which are inedible to man.
The Indian man-land-cattle ecosystem is
based on natural symbiotic relationship. Cattle
and buffaloes have a complementary, supple-
mentary and sustainable relationship with
crops under mixed fanning System prevalent

...11...
in the country (Acharya, 1990). The draught
power for agricultural operations and rural
transport in a great measure is available from
cattle. The dung production by animals helps
in providing organic manure for maintaining
long-term soil fertility and for providing fuel for
kitchen to the farmer family. Organic manure
also helps in mitigating micro-nutrient deficien-
cies in intensive irrigated and cultivated areas
and also results in more efficient use of applied
nutrient and saving of costly chemical fertiliz-
ers.
Traditionally, milk production has only
been incidental to provision of draught power
by cattle but it is an important source of
supplementary income and nutrition to the
farmer family. Availability of regular fluid cash
from daily sale of milk not only helps in dairy
production through purchase of compounded
feed and other inputs but also helps in
improving crop production through purchase
of off-farm inputs like improved seed, fertilizer,
pesticides, etc. The result is that increased
milk production leads to significant improve-
ment in farm production and nutritional and
living standards in rural areas.
In fact, with the growing pressure of
human population, dairying has to be devel-
oped in such a manner so as to avoid
competition between man and animal for the
land and its produce. In the words of M.S.
Swaminathan, “India needs land-saving crop
production and grain-saving livestock produc-
tion”.
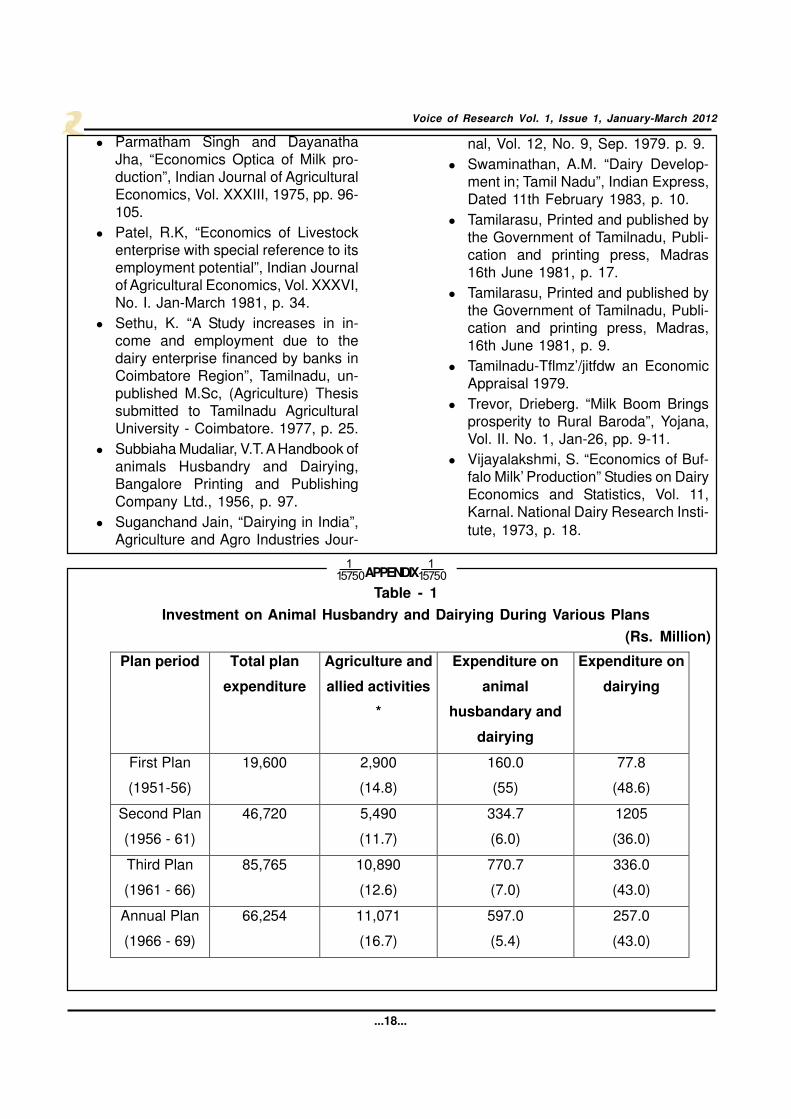
Investment Pattern on Animal Husbandry
and Dairying during various Plan Periods
The investment ort animals husbandry
and dairying programme shows the emphasis
given to this sector by the government for
increasing the production and productivity.
Table 1 gives the total plan expenditure,
expenditure on agriculture and allied activities,
animal husbandry and dairying and exclusively
the dairy sector. The expenditure at current
prices in the dairy sector increased from Rs.
77.8 million in the First Five year Plan to Rs.
6,034.1 million in the Seventh Plan. (Table 1)
The anticipated Eighth Plan expenditure
has been put at Rs. 13,367 million which is
almost equal to sum of the expenditures from
First to 12th Plans. However, these expendi-
tures do not take the rate of inflation into
account. Though the expenditure increased in
monetary terms, the allocation to animal
husbandry and dairy sector as a percentage
of allocation to agriculture varied from 7 per
cent in the Third Plan to 4.6 per cent in the 12th
five year Plan. There was a gradual increase
in the percentage allocation on animal hus-
bandry and dairying sector from the First to the
Third Plan and thereafter it showed “a decline
except in the Sixth Plan. This could be due to
the quantum jump in the plan expenditure to
the agriculture sector.
The percentage expenditure on the dairy
sector compared to the expenditure on animal
husbandry and dairying ranged from 23.2 (Fifth
Plan) to 55.5 (Annual Plans, 1978-80). The
expenditure on dairying is almost 50 per cent
of expenditure on animal husbandry and
dairying since the Sixth Plan. Although the
dairy sector occupies a pivotal position and its
contribution to Indian economy is indeed
significant, the plan investment made so far
does not appear commensurate with its output
and future potential for growth and develop-
ment.
Bovine’s Population
Cattle and buffaloes have been an integral
par of crop-livestock system in Indian farm
economy for thousands of years. Possessing
272.3 million bovines (1990), India claims the
first position in the world, accounting for 51 per
cent of the Asian bovine population (530.1
million) and 19.2 per cent of the world
population (1,420 million) (FAO, 1991).
Decomposing the total bovine population
into cattle and buffaloes also presents a
RURAL MANAGEMENT THROUGH DAIRY ENTERPRISES IN TAMILNADU

...12...
Voice of Research Vol. 1, Issue 1, January-March 2012
similar picture. India with a cattle population of
1973 million accounts for nearly 50 per cent of
the Asian population and 153.4 per cent of
world cattle population. With regard to buffalo
population, the country is placed in a still more
comfortable and enviable position, contributing
to 53.3 per cent of the world population and 55
per cent of Asia. Almost the entire world’s
buffalo population (about 97 per cent) is in the
Asian subcontinent. India, China, Pakistan,
Thailand, Indonesia, Nepal, Vietnam and Phil-
ippines, in that order, are the top eight
countries accounting for the major buffalo
population of the world. The ratio of cattle to
buffalo population approximates 100 to 11 in
the world, 100 to 34.6 in Asia and 100 to 38.1
in India.
A question arises as to how to justify the
burden of keeping an usually large bovine
population in the country. The answer is not far
to seek. Cattle and buffaloes raised in the
country help to provide economic stability to
the fanners in the face of uncertainties asso-
ciated with agricultural production in dry land
rained farming areas which constitute 70 per
cent of the arable land of the country. Further,
bovines are an important source of draught
power, milk, meat, hides and skins, horns,
bones and the much needed organic manure
for the sustainability of soils. In addition, there
are values related to social and cultural
aspects.
Growth Rate
Traditionally in India, cattle have been
raised for draught power for agricultural pur-
poses and buffaloes for milk production. The
trend in the growth rate of bovine population
over time shows the relative importance
attached to cattle and buffaloes as work and
milch animals in the rural economy. A compari-
son of the growth rate of cattle and buffalo
population. However, the growth rate of cattle
and buffalo population in Asia was 0.72 and
0.61 per cent respectively. Whereas buffalo
population in India exhibited an annual growth
rate of 1.76 per cent as against only 0.50 per
cent for cattle, the world buffalo population
grew at the rate of 0.65 per cent and cattle
population increased at an annual rate of G51
per cent. Although the growth rate in cattle
population was more or less similar, the
growth rate in buffalo population in India was
almost three times that of the world. This
further confirms the importance attached to
the keeping of buffalo in the Indian economy.
Relatively lower growth rates in buffalo popu-
lation in Asia relative to India could be attributed
to negative growth rates observed in some
countries like Afghanistan, Turkey, Philippines,
Iraq, China and Nepal. The growth rates for
individual states in India are presented in
Table 2.
Bovine Density
The comparison of bovine population
between regions is more relevant with respect
to per unit total cropped area gives the
stocking rates of bovines in India distributed in
four regions. There were intra- and inter-group
differences in population numbers. This is but
natural to expect as the bovine number
depends on the land area, agro-climatic con-
ditions, availability of feed and fodder and
socio-economic variables. On an average,
very 100 hectares of cropped area in the
country sustained 151 bovines, comprising
111 and 40 buffaloes. (Table 3)
Significant regional disparities were ob-
served in the stocking rates. Surprisingly, the
eastern region had the highest bovine density
(208) and the western region accounted for the
lowest (123). The cattle density was the
highest in the eastern region and lowest in the
northern region whereas the reverse was true
for buffaloes, exhibiting maximum density in
the northern region and lowest in the eastern
region.
Abnormally high stocking rates observed
especially in the eastern region is a matter of

...13...
serious concern and might have contributed to
lower productivity of bovines, relative to other
regions of the country. High stocking rates
excerpt constraining influence on the nutrient
availability for bovine, other livestock as well as
for human population. On a given land area,
with positive increases both in human and
bovine population, the problem is going to get
further accentuated by more and more pres-
sure on the limited and non-extendable and
resource. Whereas sustained efforts are be-
ing made in the country to control the growth
in human population to a manageable opti-
mum number commensurate with availability
of land and feed and fodder resource endow-
ments. As regards the question of interven-
tions in bovine population is concerned, this
would be elaborated in the later sections.
Ratio of Cattle to Buffalo Population
The cattle and buffalo population in differ-
ent regions of the country and the number of
buffaloes per thousand cattle heads are pre-
sented. The cattle population was observed to
be the highest in eastern and the lowest in the
southern region, northern and western region
possessing almost the same number. The top
six states in the country registering high cattle
population are: Madhya Pradesh, Uttar
Pradesh, Bihar, West Bengal, Maharashtra
and Orissa, in that order. (Table 4)
The concentration of buffaloes was maxi-
mum in the northern region (35.3, million) and
minimum in the eastern region (8.4million).
Uttar Pradesh, Andhra Pradesh, Madhya
Pradesh, Rajasthan, Punjab and Bihar were
the six leading states having maximum buffalo
population. The ratio of buffaloes to cattle was
also the highest in the northern region (752
buffaloes per thousand cattle) and the lowest
in the eastern region (129). The southern
region had a ratio of 459 buffaloes per
thousand cattle while the western region had
only 291 buffaloes. The northern and southern
regions were observed to be important from
the point of view of rearing of buffaloes for milk
production.
Breedable Cow and Buffalo Popula-
tion
The breedable cow and buffalo population
is important from the milk production point of
view. India has about 55 million breedable
cows and 32 million buffaloes-The eastern
region has the maximum number of cows
followed by the western, northern and south-
ern region, in that order. The position was
entirely different for breedable buffalo popula-
tion. The maximum number of buffaloes was
in the northern region which alone accounted
for about 44 per cent of the population-The
ranking of the remaining regions in this respect
was southern, western followed by the eastern
region. In fact the eastern region accounted for
less than 10 per cent of the total buffalo
population. (Table 5)
Table 5 also gives the annual compound
growth rates of breedable cow and buffaloes
population. The breedable cows increased at
the rate of 0.53 per cent annum and the
buffaloes at the rate of 1.79 per cent annum
in the country as a whole. There were
significant regional differences in these growth
rates. The growth rate in cows was maximum
in the eastern region (1.53 per cent), followed
by the western region (0.62 per cent) and
northern region (0.20 per cent). Interestingly,
the southern region registered a negative
growth rate of 0.1 per cent in cows. The
breedable buffalo population showed an en-
tirely different picture, the highest annual
growth ate of 2.80 per cent being found in the
northern region followed by the growth rate of
i-12 per cent per annum in buffaloes.
Relatively higher growth rates observed in
buffaloes in all regions except the eastern
region and for the country as a whole further
confirm that buffaloes are preferred over cows
for milk production in the country. In fact/ the
southern region registered a decline in cow
RURAL MANAGEMENT THROUGH DAIRY ENTERPRISES IN TAMILNADU

...14...
Voice of Research Vol. 1, Issue 1, January-March 2012
population suggesting that the unproductive
cows are being gradually eliminated by resort-
ing to crossbreeding programme. A further
examination of the rest its of the states falling;
in the southern region showed that Andhra
Pradesh and Tamil Nadu showed a negative
growth rate of about 0.5 per cent while
Karnataka and Kerala had a positive growth
rate of 0.17 and 1.61 per cent respectively.
These inter-state variations within the region
have resulted in negative growth for this
region. Raju and Seshaiah (1992) analyzing
the growth rate of livestock population in
Andhra Pradesh have attributed the decrease
in cattle population to scarcity of fodder and to
prevalence of drought in some districts and
heavy rains and floods in some other districts
in the state, resulting in high mortality. The
other reasons adduced for the decrease in
cattle include the change over to mechaniza-
tion of farming, high cost of cattle feeds as
compared to the milk yield of the cattle, lack
of demand for cow milk and reduction in the
area under grazing lands.
There appears to be a general tendency
for maintaining buffaloes for milk production in
all the regions especially in the northern region.
This could be due to higher productivity and
higher price realization relative to cow milk
owing to higher fat content of buffalo milk.
Besides, buffaloes are known to be better
converters of poor quality roughages (straws
of rice, wheat, etc.) into milk. The concentra-
tion of world famous breeds of buffaloes in the
northern region and their higher growth rate
compared to breedable cow population sug-
gest that the people of the region prefer buffalo
milk both for fluid milk consumption and for
preparation of milk products like ghee, paneer
and khoa based sweets. The higher growth
rate of breedable cows in the eastern region
was more due to the hilly terrain (especially in
the north-eastern region) where adaptability of
buffaloes was poor due to their large body
size. Further, human population in the eastern
region has a profound preference for cow milk
and cow milk based sweets like rasogolla,
tnistidahi, sandesh, ksheer sugar, etc. In fact
people in the eastern region have a preference
for ghee made out of cow and buffalo popu-
lation in individual states is provided in
Table 2.
Adult Male Stock
Males over three years of age are impor-
tant as draught animals for agricultural opera-
tions and for transportation purposes. It is
interesting to note that male cattle population
showed a negative trend for the country as a
whole as well as in the northern and southern
regions (Table 6). On the other hand, the
eastern region showed a significantly higher
positive Annual growth rate of 1.14 per cent
while in the western region the male cattle
population was almost stagnant. The negative
growth rates observed in the northern and
southern regions and stagnant growth rate in
the western region could be attributed to
increasing adoption of mechanization of farm
operators and lesser reliance on the use of
male cattle for draught purpose. The eastern
region is characterized by low irrigation poten-
tial, small farmers with a poor capital base,
majority of area being hilly and forest region.
Much mechanization has not been restored to
the same extent as in other regions. This could
be the plausible reason for using more bullock
power for draught as well as transportation
purposes in the eastern region contributing to
a positive growth in the male cattle population.
(Table 6)
The male buffalo population showed a
significant increase in the northern region
(1.68 percent) followed by the eastern region
(0.64 per cent) and western region (0.48 per
cent). The southern region showed a negative
growth rate of 2.41 per cent. The male
buffaloes are used both for natural breeding
and transportation purposes in the northern
region and hence showed positive growth.

...15...
Increased use of male buffaloes especially for
transportation has been quite a recent occur-
rence in the northern region especially be-
cause it is used as a single animal and not as
a pair as is the case with bullocks. It is
common knowledge that bullock draught power
is grossly under-utilized and it is an indivisible
resource since a pair has to be used, while in
the southern region, male buffaloes are gen-
erally eliminated at the younger age itself as
they are no longer required for draught ‘pur-
poses. The young buffalo males are being
slaughtered for beef purpose for which there
is a ready market both within the country and
abroad. Further there is no social inhibition on
slaughter of buffalo males.
Young Stock
The young stock (below 3 years old of
age) comprises replenishment stock both for
adult male and female bovine population. Table
7 gives the growth rate of male and female
cattle and buffalo young stock. On an average,
the annual compound growth rate was 0.68
per Cent in cattle male young stock and 0.25
per cent in buffalo male young stock. There
were significant regional variations in the
growth rates. The eastern region witnessed
the highest rate of 1088 per cent in cattle
young stock while it was similar in the northern
region for buffalo male young stock. The
southern region showed negative growth both
in cattle and buffalo male young stock. Young
male stock showed higher growth rate com-
pared to male adult stock which could be due
to higher risk of mortality among young stock
and particularly true for the calves before one
year of age. (Table 7)
The growth rate among female cattle and
buffaloes was observed to be 1.95 per cent in
cattle and 2,15 per cent in buffaloes. Young
female cattle in the eastern region and young
buffalo females in the southern region showed
the highest annual compound growth rate
(Table 8). The higher growth in young stock
observed ill the eastern region is in conformity
with the growth in the breedable cow popula-
tion. It was generally observed that the growth
rate in young female stock was higher com-
pared to breedable female stock, the reason
being higher in the young stock.
Crossbreed Cattle
The cross-breeding programme in cows
has been taken up in the country to increase
the productivity of indigenous of cattle. The
quinquennial livestock census has included
the number of crossbred cattle since 1982
onwards. As per the estimates of the Planning
Commission, the number of crossbred female
cattle in 1989-90 was 9.7 million in the country
(Table 8). The concentration of crossbred
female was more in the southern region (4.2
million) followed by the northern region (2.6
million), eastern region (2.1 million) and west-
ern region (0.8 million). The higher concentra-
tion of crossbred in the southern region could
be adoption of cross-breeding programme
since the beginning of the country; suitably of
climatic conditions especially in some pockets
of Karnataka, Tamil Nadu and Kerala for
adaptability cattle and involvement of foreign
collaboration agencies in providing promoting
crossbreeding programme. This has resulted
in the decrease of nondescript indigenous
breeds of cattle for milk production over the
years. Further, this might have affected
breedable cow population resulting in a nega-
tive growth rate in the southern region. Lack of
any religious sentiments on consumption of
beef in some southern states especially in
Kerala and in the north-Eastern Region might
have contributed significantly to various in the
growth rate of young stock. (Table 8)
Productivity of Milch Animals
The production of milk in different states
and regions depends upon the productivity of
milch animals and the total breedable milch
population. A discussion has already been
RURAL MANAGEMENT THROUGH DAIRY ENTERPRISES IN TAMILNADU

...16...
Voice of Research Vol. 1, Issue 1, January-March 2012
made about breedable bovine population ear-
lier- Till 1985, there were no systematic
attempts estimate are productivity of cows and
buffaloes in country. This department of Animal
Husbandry and Dairying, Ministry of Agriculture
sponsored a scheme to estimate the livestock
productivity in different party of the country.
Table 9 provides the productivity per animal per
day of milch cows and buffaloes for different
states within each region over the three
periods, namely, 2002-03, 2003-04. During the
first two periods, no attempts were made to
collect the productivity separately for indig-
enous breeds and crossbred cows. This was
attempted in some states during the third
period.
Conclusion
The results presented in reveal significant
inter-and-regional differences in the productiv-
ity of cows and buffaloes. As expected,
buffaloes were found to have higher productiv-
ity relative to indigenous cows in all the three
periods studied. Crossbred cows, however,
produced more milk compared to indigenous
cows and buffaloes. The periodicity of milk of
both cows and buffaloes was the highest in
Haryana and Punjab. Next in order, in the
northern region, was Rajasthan followed by
Uttar Pradesh and Himachal Pradesh.
In the western region, the productivity of
cows and buffaloes was the highest in Gujarat
followed by Maharashtra and Madhya Pradesh.
Kerala in the southern region exhibited the
highest productivity for cows whereas Tamil
Nadu showed the highest productivity for
buffaloes. In Karnataka the productivity both for
cows and buffaloes was the least. The picture
of productivity is very much distorted due to
non-availability of information for a majority of
north-eastern states. Even for the states for
which information on productivity is available,
it is mostly incomplete. Hence, valid compari-
son cannot be made. The information for Bihar
and Orissa is available for all the three periods
both for cows and buffaloes Bihar enjoys a
better status in terms of productivity than
Orissa. In general, the productivity of both
cows and buffaloes was the least in Orissa
compared to all the states in all regions for
which data are available.
A comparison of productivity over three
periods of time in all the states revealed that
the productivity in the third period, 2002-03,
was relatively lower than in the two earlier
periods. This could well be attributed to
serious drought conditions experienced in
many of the states in that year in the country.
Compared to the western commercial
type farms, India has a large number of low
producing cows and buffaloes. This is attrib-
uted by our academicians to poor genetic
architecture of indigenous animals, inadequate
nutrition, management and health coverage.
But if -we pause a little and raise some
question will flow of their own accord.
References
l Acharya, R.M. (1990), “Promise of White
Revolution”, Keynote Address to 15th
Dairy Husbandry Officers Workshop.
National Dairy Research Institute, Kamal.
l Agricultural Situation - December 1980.
l Aneja, R.P. (1990), “Pricing Policies and
Marketing of Dairy Products”, Paper
presented at a Symposium on Dairying-
Issues and Policies, organized by the
Indian Society of Agricultural Statistics
held at Gujarat Agricultural University,
Anand.
l Arm Poril, Milk Aid - India Today. Vol No.
19, October 15, 1982. p. 130.

...17...
l Baldev Singh, “Economics of Milk Pro-
duction and Bovine Livestock Composi-
tion in a Growing Economy”—Indian
Journal of Agriculture Economics, Vol.
XXXIV, April-June 1979, No. 2, pp. 63-65.
l Central Statistical Organisation - Na-
tional Accounts Statistics 1980-1961 and
1972-1973. Misaggregated Table-March
1975.
l Chidambaram, V., “Economics of Milk
production and pattern of milk con-
sumption around Madurai”. Tamil Nadu,
unpublished M.Sc, (Agriculture) thesis
submitted to the Tamilnadu Agricul-
tural University, Coimnatore 1977, p.
18.
l Co-operative Fortnighly, Vol. I, Feb. 1-
15, 1983. Editor G.N. Das, Published
in Tamilnadu Co-operative Union, Ma-
dras, p* 2-3*
l Co-operative Fortnightly, Vol. I, Feb.
1*15,1983. Elitor G.N. Das, Published
in Tamilnadu Co-operative Union, Ma-
dras, p. 2.
l Darelaar, H. “Substitutes for
ntiSk”,Yojana, Vol. XIII No. 1. Jan. 26,
1969, p. 9.
l Deivasikamani, M. “Cost Analysis of
Dairying, A case study in Mayram area
of Tanjore District study conducted in
July-August 1980. p. 9.
l Food and Agriculture Organization
(FAO) (1991), FAO Production Year-
book, 1990, United Nations, Rome,
Italy.
l Gangatharan, T.P. “Studies in Feed
milk relationship in cattle in Kerala”,
Ph.D. Thesis submitted to Punjab
University. Chandigarh, 1978. (Unpub-
lished thesis)
l Government of India (1971), Milk Pro-
duction through Small and Marginal
Farmers and Agricultural Laboureres:
Interim Report of National Commis-
sion
l Government of India, “Draft Sixth Five
Year Plan”— Planning Commision,
New Delhi.
l Kulwant Singh, V. “A Talk on Econom-
ics, of Dairy Farming with cross-breed
cows”. Economics; Statistics and
Management Division, National Dairy
Research Institute-KARNUL.
l Kurien, V.G., “Co-operative Dairying”,
Yojana, Vol. XV. Nos. 4 and 5, March
7, 1971, p. 9-10.
l Mahalingam, N. “Lovestock wealth in
India”, Kissan World, Vol. 5. N<& 5, p.
17.
l Naresh Dayal “Dairy Development
and Income. Distribution in India”,
(part-1) Yojana, Vol. XXV/ 18. October
1-15, 1981, p. 10.
l Naresh Dayal “Dairy Development
and Income. Distribution in India” (part
-1), Yojana, Vol. XXV/ 18. October 1-
15, 1981, p. 11.
l National Diary Development Board,
“Spreading the Amu I message”, Busi-
ness India, Cover feature No. 104.
March 1-14, 1982, pp. 47-48.
l National Diary Development Board,
“Spreading the Amul message”, Busi-
ness India, Cover feature No. 104.
March 1-14, 1982, pp. 49-51.
l Nayar, R.K. “Cattle Insurance helps
dairying”, Yojana Xn/19. 16, October
1978, p. 28.
l Nayar, R.K. “Cattle Insurance helps
dairying”^ Yojana XII/19, 14 October
1978, pp. 29-30.
l Pange, V.C., Amble, V.N., & Ravi, K.C,
Cast of Milk Production in Madras
(New Delhi: Indian Council of Agricul-
ture Research) 1963, p. 21*
RURAL MANAGEMENT THROUGH DAIRY ENTERPRISES IN TAMILNADU
...18...
Voice of Research Vol. 1, Issue 1, January-March 2012
APPENDIX Table - 1
Investment on Animal Husbandry and Dairying During Various Plans
(Rs. Million)
Plan period Total plan
expenditure
Agriculture and
allied activities
*
Expenditure on
animal
husbandary and
dairying
Expenditure on
dairying
First Plan
(1951-56)
19,600 2,900
(14.8)
160.0
(55)
77.8
(48.6)
Second Plan
(1956 - 61)
46,720 5,490
(11.7)
334.7
(6.0)
1205
(36.0)
Third Plan
(1961 - 66)
85,765 10,890
(12.6)
770.7
(7.0)
336.0
(43.0)
Annual Plan
(1966 - 69)
66,254 11,071
(16.7)
597.0
(5.4)
257.0
(43.0)
l Parmatham Singh and Dayanatha
Jha, “Economics Optica of Milk pro-
duction”, Indian Journal of Agricultural
Economics, Vol. XXXIII, 1975, pp. 96-
105.
l Patel, R.K, “Economics of Livestock
enterprise with special reference to its
employment potential”, Indian Journal
of Agricultural Economics, Vol. XXXVI,
No. I. Jan-March 1981, p. 34.
l Sethu, K. “A Study increases in in-
come and employment due to the
dairy enterprise financed by banks in
Coimbatore Region”, Tamilnadu, un-
published M.Sc, (Agriculture) Thesis
submitted to Tamilnadu Agricultural
University - Coimbatore. 1977, p. 25.
l Subbiaha Mudaliar, V.T. A Handbook of
animals Husbandry and Dairying,
Bangalore Printing and Publishing
Company Ltd., 1956, p. 97.
l Suganchand Jain, “Dairying in India”,
Agriculture and Agro Industries Jour-
nal, Vol. 12, No. 9, Sep. 1979. p. 9.
l Swaminathan, A.M. “Dairy Develop-
ment in; Tamil Nadu”, Indian Express,
Dated 11th February 1983, p. 10.
l Tamilarasu, Printed and published by
the Government of Tamilnadu, Publi-
cation and printing press, Madras
16th June 1981, p. 17.
l Tamilarasu, Printed and published by
the Government of Tamilnadu, Publi-
cation and printing press, Madras,
16th June 1981, p. 9.
l Tamilnadu-Tflmz’/jitfdw an Economic
Appraisal 1979.
l Trevor, Drieberg. “Milk Boom Brings
prosperity to Rural Baroda”, Yojana,
Vol. II. No. 1, Jan-26, pp. 9-11.
l Vijayalakshmi, S. “Economics of Buf-
falo Milk’ Production” Studies on Dairy
Economics and Statistics, Vol. 11,
Karnal. National Dairy Research Insti-
tute, 1973, p. 18.

...19...
Fourth
Plan(1969-74)
157,788 23,204
(14.7)
1,542.6
(6.6)
787.5
(51.0)
Fifth Plan
(1974-78)
394,262 48,665
(123)
2,324.6
(5.0)
5403
(23.2)
Annual Plan
(1978 - 80)
121,765 19,997
(16.4)
2,087.7
(10.4)
1,157.9
(55.5)
Eleventh Five
year plan Plan
(2005-07)
1,092,917 136,203
(12.5)
8,025.1
(5.8)
4,362.9
(54.4)
12th Five year
Plan (2007 -
2012)
2,202,163 279,611
(12.7)
12,805.6
(4.6)
6,034.1
(47.1)
Total 4,187,234 538,031 28,646.7 13,674.0
Table - 2
Bovine Growth Rate
Country Cattle Buffaloes
India 0.50 1.76
Asia 0.72 0.61
World 051 0.65
Table - 3
Region Per hundred hectares of cropped area
Cattle Buffaloes
(1) (2) (3)
Northern 90 56
Southern 116 48
Eastern 182 26
Western 95 28
India 111 40
RURAL MANAGEMENT THROUGH DAIRY ENTERPRISES IN TAMILNADU

...20...
Voice of Research Vol. 1, Issue 1, January-March 2012
Region
(1)
Cattle
(000)
(2)
Buffaloes
(000)
(3)
Number of buffaloes per thousand cattle heads
(4)
Northern 47,012 35,339 752
Southern 35,323 16,198 459
Eastern 64,595 8,357 129
Western 48.772 14,202 291
India 194,981 72,962 374
Source: Livestock Census of India, 2009.
Table - 4
Table - 5
Female breedable
Population (million)
Growth rate
(per cent)
Region Cows Buffaloes Cows Buffaloes
(1) (2) (3) (4) (5)
Northern 13.23 23.85 0.20 2.80
Southern 10.34 7.73 -0.10 1.42
Eastern 16.91 3.02 1,55 1.12
Western 14.65 6.83 0.62 1.12
India 55.13 31.43 0.53 1.79
Source: Livestock Census of India, 2009.
Table - 6
Growth Rate of Adult Cattle and Buffalo Population (per cent)
Region 1 Cattle 2 Buffaloes 3
Northern -0.74 1.68
Southern -0.73 -2.41
Eastern 1.14 0.64
Western 0.002 0.48
India -0.05 0.12
Source : Report of the Directorate of Agriculture and co-operation – 2010, P.278.

...21...
Table - 7
Growth Rate of Young Male (per cent) and Female Stock
Cattle Buffaloes
Region (1) Male (2) Female (3) Male (4) Female (5)
Northern 0.056 1.05 1.088 1.82
Southern -0.28 2.31 -0.90 3.76
Eastern 1.88 4.21 1.23 2.53
Western 0-42 0.54 1.34 1.05
India 0.68 1.95 0.25 2.15
Source: India Economic Survey – 2010, Appendix IVa.P:XIII.
Table - 8
Crossbred Female Population (2009-10)
Region (1)
Number of crossbred
female
(2)
Number of artificial insemination with exotic
bull semen
(3)
Northern 2.594 2.964
Southern 4.154 5.567
Eastern 2.147 1.664
Western 0.805 2.005
India 9.700 12.200
Source: Economic survey, 2010, Appendix, P.XIII.
Table - 9
Milk Yield Per Animal
Cattle Buffaloes
2009 - 10 2007 -
08
2008 -
09
2009 -
10 Region/States 2008 -
09
2009 -
10
Indigenous Crossbred
Northern
Haryana 3.384 3.391 3.143* 3552 4.580 4.578 4.471
Himachai
Pradesh 1397 1502 1.177 4.987 3.008 3.146 3321
Rajasthan 2.710 2.720 2520 6.456 3.800 3.850 3.750
RURAL MANAGEMENT THROUGH DAIRY ENTERPRISES IN TAMILNADU

...22...
Voice of Research Vol. 1, Issue 1, January-March 2012
Uttar Pradesh 1.826 1.912 1.940 -
Jammu and
Kashmir - - 1586 -
Punjab - - 3202 -
Southern
Andhra Pradesh 1.692 1.722 0.975 5.670 5253
Kanataka 3.089 3.110 1.418 4.523
Kerala 2524 3.019 1.757 -
Tamil Nadu 2.786 3.120 2.927 -
Pondichery - - - -
Eastern
Bihar 1.754 1.764 1.665 4.945
Orissa 0513 0512 0.445 2.445
West Bengal - 1372 2.404 -
Andaman &
Nicobar Islands - 2.647 - -
Sikkim - 2.032 - -
Meghalaya - - 0570 7.280
Assam - - - -
Western
Gujarat 2565 2599 2.371 7.943