rural livelihood development company - tzdpg.or.tz · pdf fileniras would like to thank the...
TRANSCRIPT

Rural Livelihood Development Company
Survey on Dairy Products Market in Tanzania
Final Report
12 May 2010
Survey on Dairy Products Market in Tanzania
i
ACKNOWLEDGEMENT NIRAS would like to thank the Rural Livelihood Development Company (RLDC) for hiring NIRAS to carry out this interesting and strategically important study. First and foremost we appreciated the technical, logistical and administrative input provided by RLDC team led by Mr. Charles Ogutu, CEO, Mr. Heini Conrad, Advisor and Dairy Sector Team Leader, and Ms Ajuaye Sigalla, Dairy Sector Team Leader. Members of Tanzania Milk Processors Association (TAMPA) who actually are the primary users of the study outputs worked very closely with the team, they provided more information on the scope and objectives of the study and also facilitated communication between the Consultant and processors as well as availing some reference materials. The valuable support from TAMPA involved interactions with Dr. D. Mmari, the Chairman of TAMPA and CEO of Tandairies, Mrs. Mboka M. Massawe, Executive Secretary and Mr. Edmund Mariki – Business Manager. NIRAS thanks Tanzania Dairy Board through its Executive Director Mr. Charles Mutagwaba who further clarified on the research questions and provided important information including some background materials. Still at TDB, Prof. Lusato Kurwijilla spared his weekend time to meet with the consultants and shared his wealth of knowledge in the industry. Equally key to this work had been the processors namely Mr. James Matayo – Managing Director of Mara Milk Limited, Dr. E. Mazara – Interim Managing Director, Mr. Samwel Simiyu – Finance Manager, Ms Rebecca Sangura – Milk Collection Centers Coordinator all of New Musoma Dairy Limited. In Arusha the team had the privilege to discuss with Mr. Peter Ngasa – Managing Director of Arusha Dairies Limited, Mrs. Matilda Bella, Acting Head of Economic Development Cluster in Arusha Region and Mr. Yusuph M. Alladin of International Diaries Company Limited. In Arusha the Consultant also met with Mr. Carilus Alando – Zonal Sales and Marketing Manager for Brookside. The work in Tanga involved consultations with to Mr. Alnoor Hussein. – CEO of Tanga Fresh Limited and Mr. Lut Zylstra of Mifugo Bora Company Ltd. The team consisted of two consultants namely Mr. Leif Enemark and Mr. Hebron Mwakalinga, and was supported by the Niras Tanzania office in logistics and quality assurance as well as in project management. Due to the limited time allocated for the work on one side and the relatively demanding scope of output, the team solicited and received support from Mr. Zephania Mposo (MBA Marketing) who followed up data from TRA and assisted coordination of retailer interviews in Arusha, Mr. Ikunda Terry (MBA Student) who worked with the team throughout conducting a survey with retailers and Mr. Charles (BA) who carried out the interview of retailers in Arusha. NIRAS shares any credit for this work with all those mentioned above. However, the liability of any shortcoming shall remain the sole responsibility of Niras. Niras Finland Oy P.O.Box 23070 Dar es Salaam Tanzania Tel. 022 260 2360 Mob.0753 102 006 Email. [email protected] / [email protected]

Survey on Dairy Products Market in Tanzania
ii
TANZANIA COUNTRY PROFILE 2004 2005 2006 2007 2008 Population in millionsi 36.31 37.27 38.67 39.45 40.67 Annual growth of GDP in percent - at 2001 pricesi 7.80 7.40 6.70 7.10 7.40 Growth of livestock sector at 2001 pricesi 6.60 4.40 4.00
4.50
5.10
Percentage contribution–of livestock sector to GDP at 2001 pricesi
4.50
4.40
4.20
4.00
3.80
Domestic milk production in million litres 1,386ii 1,410ii 1,420ii 1,664iii
Exchange rate (in Tshs/USD) iv 1,089 1,123 1,252 1,132 1,280 NOTES i Economic Survey, 2008 ii Match Maker Associates, 2008 iii Ministry of Finance and Economic Affairs, 2009 iv Bank of Tanzania (BOT)

Survey on Dairy Products Market in Tanzania
iii
Contents 1.0 Introduction.....................................................................................................................1
1.1 Background .................................................................................................................1
1.2 Study Objectives, Outputs and Deliverables...............................................................3
1.3 Scope and Methodology of the Study .........................................................................5
1.4 Study Limitations ........................................................................................................5
1.5 Organization of the Report ..........................................................................................6
2.0 Findings ...........................................................................................................................7
2.1 Dairy Market Structure................................................................................................7
2.2 Distribution of Dairy Products ..................................................................................20
2.3 Milk Processing.........................................................................................................32
3.0 Conclusions and recommendations ...............................................................................36
3.1 Conclusions ...............................................................................................................36
3.2 Recommendations .....................................................................................................38
References................................................................................................................................43
Annex I: List of Dairy Processing Plants.................................................................................44
Annex II: Relation Between Population and Installed Dairy Processing Capacity .................45
Annex III (A): Dairy Product Imports by Country of Origin, Value and Quantity (2009) .....46
Annex IV (B): Imports of Dairy Products, by Value and Quantity; 2004 - 2009....................50
Annex IV: Types of Dairy Products Consumed .....................................................................51
Annex V: Abridged Terms of Reference .................................................................................52
Annex VI: Tool Used to Collect Information from Retailers ..................................................54
Annex VII: Comments Made by Participants on the Report ..................................................59
General Comments...............................................................................................................59
Group No. One: How Can We Engage The Government Effectively In The Development Of The Dairy Sector? ................................................................................................................61
Group No. Two: How Can We Improve Cost Competitiveness In Dairy Value Chains? ...63

Survey on Dairy Products Market in Tanzania
iv
LIST OF FIGURES Figure 1.1.1 An Overview Map of the Dairy Sector
Figure 2.1.1 Main Dairy Industry Products in Tanzania based on Installed Capacity
Figure 2.1.2 The Average Composition of Dairy Products Imported in Tanzania by Volume (2004 – 2009)
Figure 2.1.3. Pattern of dairy product consumption over the year
Figure 2.2.1. Relative Position of Dairy Processing Installed Capacity in Tanzania
Figure 2.2.2 Trend of Dairy Products Imports in USD
Figure 2.1.3. Pattern of dairy product consumption over the year
Figure 2.2.1 Product Visibility at Retail Point
LIST OF TABLES
Table 1.1.1 An Overview of the Structure of the Milk Sector
Table 2.1.1 Percentage of Households Consuming Packed Milk (2007)
Table 2.1.2. Locations at Which Consumer Bought Dairy Products (2007).
Table 2.1.3 Estimation of Market Size for Processed Dairy Products in Dar es Salaam in 2007
Table 2.1.4 Relative Price of Pasteurized Milk per Litre (1991, 1998 and 2010)
Table 2.1.5 Cost Structure of Processing One litre into Pasteurised Milk packed in Poly Pouch
Table 2.2.1 Population (Market Potential) Relative to Processing Capacity
Table 2.2.2 Return on Investment on Operating a Refrigerated Truck Between Musoma and Dar es Salaam.
Table 2.2.3 Estimated Capacity to Service a Refrigerator Loan
Table 2.2.4 General Comments by Retailers on How to Improve Distribution
Table 2.2.5 Utilisation of Dairy Processing Capacity in EA (2006)

Survey on Dairy Products Market in Tanzania
v
LIST OF ABBREVIATIONS
BOT Bank of Tanzania
FMCGs Fast moving consumer goods
GDP Gross Domestic Product
HBS Household Budget Survey
kW(H) Kilowatt (Hour)
lme Liquid milk equivalent
lpa Litres per annum
lpd Litres per day
MFEA Ministry of Finance and Economic Affairs
ML&FD Ministry of Livestock and Fisheries Development
MMA Match Maker Associates Limited
Mt. Metric tone
NBS National Bureau of Statistics
NMDL New Musoma Dairy Ltd.
RLDC Rural Livelihood Development Company
TAHA Tanzania Horticulture Association
TAMPA Tanzania Milk Processors Association
TDB Tanzania Dairy Board
TFL Tanga Fresh Limited
UHT Ultra high temperature
USD United States Dollar

Survey on Dairy Products Market in Tanzania
vi
EXECUTIVE SUMMARY Introduction Tanzania has a big potential to develop its dairy industry, in 2008 it was estimated to have 18.8 million heads of cattle, the third in Africa after Ethiopia and Sudan. However the performance of the sector has been dismal in absolute context, the output of milk per cow is such low that in 2008 Tanzania produced 1,664 million litres of milk. A study in 2009 that covered Dodoma, Manyara, Morogoro, Shinyanga, Singida and Tabora indicated that output per traditional cattle is as low as 0.5 litres per lactating day/cow. It is estimated that the dairy sector accounts for 30% of livestock GDP valued at USD 262 million equivalent to Tshs 300 billion. Tanzania has an annual installed milk processing capacity of 353,100 litres per day, in 2009 the milk processed was 88,440 lpd or 32.28 million litres per annum. Thus the installed capacity can absorb 7.75% of domestically produced milk. In 2008 dairy plants operated at about 25% of their capacity, this is 1.94% of the total milk produced in Tanzania. The current situation contrasts sharply with the situation in the 1980s and early 1990s when processing plants were able to process and dispose about 400,000 lpd. The objective of the study is to look into products produced, the market structure relating consumers buying pattern and ability, prices, competition from domestically produced and imported goods. It also looks how distribution is organised and carried out. The findings that culminated into recommendations are expected to help processors develop appropriate strategies in increasing sales for their products. The study used a combination of approaches; an extensive review of literature from both within Tanzania and outside with special interest on neighbouring countries. Preliminary consultations were done with RLDC, TDB and TAMPA representatives. This was followed by data collection from processors and retailers. A limited number of consumers were interviewed. The processors covered chronologically are those in Mara, Arusha, Tanga and Dar es Salaam. Interviews with retailers took place in Musoma, Mwanza, Shinyanga, Singida, Dodoma and Dar es Salaam. Mining of HBS data was done to supplement data collected in the field. Also this report benefited from inputs availed by a team from RLDC and TAMPA on February 17th, 2010. Dairy Market Structure Product Range in the Market: In the market there are a variety of products comprising of domestic and international brands, Tanzania processors however produce fewer products. About 54% of the capacity of processors is used to produce cultured milk, UHT takes 23% followed by yoghurt at 12% and cheese at 11%. Other products produced locally include ghee and cream. Imports of dairy products in liquid milk equivalent between 2004 and 2009 have averaged at 25.925 million litres per annum, growing 9.41% p.a. In 2009 dairy products under milk and cream, concentrated or sweetened account for 68% of the volume of imports, non concentrated or sweetened milk and cream made 16% and cheese and curd at 6%. Butter and other fats and oils accounted for 5%, buttermilk, curdled milk and cream, yoghurt, etc. were at 3%. Whey and other natural milk constituents made 2%. Major sources of imported dairy products are Kenya, South Africa and United Arab Emirates.

Survey on Dairy Products Market in Tanzania
vii
Household Market Segment: Consumption of packed milk is very low even in urban areas, the 2007 HBS estimates that only 0.078% of the households consume processed milk, Dar es Salaam Urban has the highest rate at 1.148% followed by Mara Urban by 0.78%. The low uptake of packed milk could be attributed to relative higher prices, negative consumer perception that processed milk has most of its nutrients taken out, limited distribution capacity of processors and most importantly readily availability of raw milk. Among the surveyed towns, kiosks/small shops are the most important point of sale for processed milk in Arusha and Dar es Salaam, in Dodoma it is the gulio while in Mwanza it they prefer large shops.
Dar es Salaam dairy product market is estimated to be worth Tshs 2.68 billion per month or Tshs 32.12 billion per annum. The total demand of milk in Tanzania then could be around Tshs 96.36 billion or USD 74 million. Imports that occupy 48% at present market for processed dairy products do therefore represent about 11% of the potential market. The current domestic production has a base value of USD 27.41 million leaving a gap of more than USD 40 million. It should be remembered however that milk is sensitive to price. If we look at price trend for processed milk in Tanzania in dollar terms, a litre of processed milk has increased 2.7 times suppressing consumption.
Other Segments: Institutional clientele shows a mixed picture, few organizations provide milk to workers, most don’t. There is no single policy even in the Government setup. It is a market segment that needs different strategies depending on the circumstances. Some processors indicated to sell loose (bulk) milk to offices. The market entry strategy to this segment is to educate workers on the advantages of consuming products that are local, tested and approved instead of imported or raw (non-certified) milk. Restaurants and hotels are quite potential market segment for bulk milk deliveries, like offices most of them buy raw milk under contract supply from cattle keepers or distributors. Processors will have an edge if regulations to require hawkers have their products certified comes into force. Competition among domestic producers in the dairy industry is not very strong, the most serious competition is from hawkers and imports to some extent. Competition with imports is growing in UHT and some cold range products in Arusha. Hawkers (of raw milk) however have a number of advantages over processors including price, efficiency and cost-effectiveness. Major competing countries are Kenya, South African and United Arab Emirates. Weaknesses in enforcing common EAC external tariffs have seen imports compete with domestic products pricewise. Distribution of Dairy Products Mara accounts for 39.5% of the national milk processing capacity, in 2008 they operated at 20.9% contributing 32.9% of the processed milk. Tanga has 14.73% of the total installed capacity, it operated at 49% accounting for 28.8% of the national output. Arusha processors with 17.98% of the national capacity contributed 7.5% of the volume of processed dairy products. Iringa contributed 9.0% from its installed capacity that makes 6.23% of the national capacity operating at 36.4% capacity utilisation. Dar es Salaam accounted for 9% of the total processed output, it had 9.3% of the national installed capacity operating at 24.2%. The major markets are Dar es Salaam, Arusha, Moshi and Mwanza, if operating capacity of the plants is increased the transport cost to the markets becomes less significant. The challenge at present is low volumes, to improve the transport services some companies have hived off the management or ownership of transport services.

Survey on Dairy Products Market in Tanzania
viii
Lack of cooling facilities at retail point is another major constraints facing distribution of milk, most retail shops use refrigerators meant for households, they are not transparent and are mixed with many other products. Some processors are planning to invest in refrigerators it is an important strategy in projecting their brands in the market. Many shop keepers feel cold range dairy products are very risky and are not willing/ready to stock them, education and efficient supply system can help alley this fear. The issue of quality deterioration has been identified to be less significant, very few complaints were reported by retailers, of the very few complaints, quality deterioration before expiry date was the most referred to. Information message to the consumers about the products is very limited as none of the companies do serious promotion, TFL has the highest number of posters in Dar es Salaam and Dodoma. Brookside UHT milk is the most conspicuous dairy product. The processors employ multiple channels but the dominant is the processor-agent-retailer-consumer setup that gives the processors a good balance between control over supply chain and outreach. Many processors however complain of agents being not consistent in delivery and or pricing undermining retailer royalty. To overcome this, some processors have their own depots as agents to moderate the supply behavior while others are contemplating to enhance the monitoring of agents. Among the challenges facing channel management include shortage of transport equipment adapted to various channel and market segment. The optimum truck size for distribution of goods within the urban areas is about 500 – 2,000kgs, bicycles are being used though the narrow margins has rendered this option not very attractive. Milk Processing On the overall milk processing activities in Tanzania are not well developed, the total operable1 installed capacity attends to hardly 7.1% against about 25% in Kenya. International Dairy has a capacity of 10.000 l/day and is at present processing 3.000 l/day. Major products processed are Mtindi in 500 ml sachets, Yoghurt in cups of 250 ml and 500 ml and Cheese (cheddar, mozzarella and feta). Arusha Dairy processes 2.000 l/day, the equipment have a 500 l/hour capacity installed. The major products are full cream pasteurized milk in 500 ml sachets, low fat pasteurized milk in 500 ml sachets, Mala in 500 ml bottles or 500 ml sachets, Flavoured and plain yoghurt in 500 ml sachets, Gouda cheese in 500g blocks, Butter/cream and loose (unpasteurized) bulk milk. Brookside has closed down for lack of raw milk, the installed capacity is 45.000lpd. The facilities are used to store imported dairy products from Brookside Kenya like UHT, mala, cheese and butter. Musoma Dairy overall capacity is approximately 40,000lpd, used for UHT, Yoghurt, Mtindi, Butter and Ghee production. Its major output shall be UHT (70% of the capacity). Mara Milk has a capacity of 16,000lpd, besides the UHT, it produces pasteurised milk, Mtindi and Ghee. The plant UHT unit had stopped working waiting for experts from China. Presently TFL processes about 30.000 l/day, the product mix is pasteurised milk in plastic sachets (500 ml and 250 ml), Mtindi in plastic sachets (500 ml and 250 ml), Yoghurt in cups (250 ml and in bulk), Fresh cream in cups (250 ml and in bulk), Mozzarella cheese in

Survey on Dairy Products Market in Tanzania
ix
packages of 2 kg and 500g and Butter and ghee both in bulk primarily for bakeries. It is currently opening up markets in other parts of the country including Dodoma, Arusha, Kilimanjaro, etc. Tan Dairies has a 10,000 lpd plant, it produces pasteurised milk (250 ml and 500 ml), Mtindi (250 ml and 500 ml) and yoghurt (250 ml) and Mozzarella cheese. The plant faces severe milk supply shortages during the dry season because it relies in a drier milk supply belt. The biggest challenge facing processing plants are frequent power cuts, limited number of dairy specialists in the labour market as many have been forced to hire from Kenya and abroad, very diverse technology even within one production line and taxation that penalise Tanzanian producers. Conclusions Seasonality of milk supply in the market has a high impact on processors cash flows, milk supply can drop to as low as 30% of the volume during flush period pushing prices to the extent that it does not make sense for processors. Hawkers are and will continue to play a dominant role in milk marketing and distribution and giving the formal milk marketing stiff but unfair competition. They however are a blessing to the farmers as they are quite close to them. It is not very evident from organizational setups of many processors whether it is the market that is driving the business or it is the production that drives the business. There are little initiatives to learn from consumers and retailers as good marketing practices recommend. None of the processors has been promoting the products at present because of first lack of production capacity, Tommy Dairy and Cowbell had in the past used media campaign to improve the market position of their products. Cases of products with poor quality might seem to be low as indicated by retailers, however many consumers may not provide the feedback under the knowledge that the feedback won’t change the status quo. Dairy products have unitary own-price elasticity, on the overall prices for dairy products are high that might be related to low consumption of processed dairy products, Production cost structure and consumer-unfriendly margins are some of the major reasons for relatively higher prices of products. Retailers wield more power in setting consumer price and have been found to penalise local UHT by selling at the same price as imported ones.
Dairy products excluding those “Specially prepared for infants” enjoy a protection from a 60% duty and a VAT of 18% making a protection rate of 78% of CIF value. The analysis for UHT however shows that under the cost structure in Tanzania CIF prices will have to be abnormally low to arrive at a retail of Tshs 2,500 per litre at a supermarket. This suggests weaknesses in enforcing duties at our border/entry points.
Recommendations Stabilizing milk supply in the market: In the short run, is proposed that TAMPA work with TDB to seek a stop-gap concession to import powder milk for reconstitution during the dry period to improve the opera. Processors should request for a 78% tax waiver for the quantities needed by each processor per annum, the proposal should certainly indicate how to protect the arrangement against abuse. In the medium term, processors should assess the viability of cheaper, easy to operate and scalable autoclave technology for production of sterilized (long-shelf life) milk products. In the long-run, the Government in collaboration with producers and

Survey on Dairy Products Market in Tanzania
x
processors should work out a programme to improve farmers’ capacity to produce milk during dry season. Improving the Product Mix through Linkage with Smallholder Farmers: Ways to give value to the milk that does not reach the market should be looked into, a good case will be cheese that could be extracted by farmers, improved, branded and marketed by processors. To improve quality the project could be linked with institutions like Sokoine University. Improving Capacity of firms to Undertake Marketing: Any support to train and re-train managers on marketing strategies in a competitive environment will be quite useful as the tendency now with many is more about selling than marketing. Other topics could include organizing, monitoring, supporting agents and retailers and market information. For retailers the education could focus on display, storage, hygiene, customer care and information management. Market Promotion; There is a need to seek support for promoting milk consumption through messages based on medical facts, the funding of generic messages to promote consumption should be funded by the Government as it will benefit every stakeholder. Some companies are looking for funds to put their brands in the market. Support in terms of resources to launch such campaigns using TV, radio and other media will be plausible and effective. Stimulating Demand through Appropriate Pricing Processors need to keep a close eye on prices as they stifle demand, affect sales, it is possible to promote flavoured milk and can promote yoghurt as a market entry product instead of the current context that it is a high income consumer product. Yoghurt can work as brand-flag-carrier for long term recognition as the main consumers are the children. Successful promotion that targets children is more effective as they wield power in decision making for most urban families. Improving Distribution: A number of issues are recommended: -
To achieve cost effectiveness in transporting dairy products processors especially in the Lake Zone could collaborate to make joint shipments
The initiative by the actors to have a dedicated location is a novel one, to minimize investment costs, it should be designed to park reefer containers. The arrangement can learn from common storage and logistic facility owned by Tanzania Horticulture Association (TAHA) members.
Education on channel management among agents will be useful as agents have cited as the cause of irregular deliveries hence eroding the supply chain trust and brand loyalty.
A sector development fund would have been ideal to enable actors (not necessarily processors) access technologies and facilities such as milk collection centres, trucks, refrigerators, etc. in the context of poverty reduction.
Seek for Tax Exemption. Tanzania firms are less competitive because of inherent cost structure of the industry and unfavourable tax regime, efforts by TAMPA and TDB to seek for zero rating all inputs into dairy business should be stepped up. Further, given the nascent nature of the sector it is recommended that actors seek VAT exemption in dairy products that are “wrongly perceived as non basic dairy products like yoghurt.

Survey on Dairy Products Market in Tanzania
1 Niras Finland Oy
1.0 INTRODUCTION
1.1 Background
Tanzania has the third largest herd of cattle in Africa after Sudan and Ethiopia, it is estimated in 2008 to have 18.8 million heads of cattle. The traditional Zebu makes 96.24% while the remaining 3.76% is of improved breeds (MMA, 2007). Between 2001 and 2005 the livestock population grew at an annual rate of 2.2% [MMA, 2007], RLDC reported in 2009 that the sector is growing at a rate 2.1% percent per annum [RLDC, 2009]. In 2008 the livestock sector contributed 3.8%2 to the total gross domestic product (GDP). According to the Ministry of Finance and Economic Affairs (MFEA), in 2008 Tanzania produced 1,664 million litres of milk. It is reported that 90% of the raw milk is consumed at the point of production, hence 10% i.e. 166.4 million litres is marketed. Of the marketed quantity from local production, the Ministry indicates that 90% (that is 149.76 million litres) is distributed through informal marketing channels and the remaining 10% of the marketed milk or 16.64 million litres is marketed through formal channels (Guardian, November 23rd, 2009). Assuming the population of Tanzania in 2008 was 40.67 million [MFEA] the implied annual consumption per capita is therefore 40.6 litres. This compares favourably with 31 litres reported by Scanagri/Business Care Services in 2005.Citing the Agriculture Sector Review MMA [2007] notes however that milk consumption curve over time is not a smooth one, in fact it fell between 2005 and 2007 from 40 litres to 39 litres respectively. A study by Astroproject Association in 2009 that covered Dodoma, Manyara, Morogoro, Shinyanga, Singida and Tabora indicated that output per traditional cattle is as low as 0.5 litres per lactating day/cow, Business Care Services Limited (2008) reported 2.7 litres from a baseline survey for 13 districts3. Despite all the odds facing the dairy sector, a consensus that should be the major driver in the development of the sector is stated in RLDC Strategy which states that:-
If adequately linked to the markets, the dairy sector can make a considerable contribution to poverty alleviation for the cattle keeping rural households in the country.
[Dairy sub-sector Development Strategy, 2009]. The dairy sector accounts for 30% of livestock GDP valued at USD 262 million equivalent to Tshs 300 billion (RLDC, 2009). The other way to look at the value of the dairy industry at farm gate is to extrapolate the data from the Ministry of Finance and Economic Affairs [MFEA], with a farm gate price of Tshs 300/per litre, the value of milk can then be estimated to be worth Tshs 499.2 billion or USD 372.54 million. The value should increase with value addition upstream.
2 At 2001 constant prices. By Ministry of Finance and Economic Affairs, June 2009. 3 Districts of Meru, Monduli, Iringa Rural, Mbarali, Mbozi, Mbeya Rural, Mufindi, Njombe, Kyela, Morogoro Rural, Kilombero, Namtumbo and Songea Rural.

Survey on Dairy Products Market in Tanzania
2 Niras Finland Oy
When explaining the industry structure, there is an adjustment to the volume of milk marketed through formal and informal channel. According to the Ministry of Livestock and Fisheries Development’s 2009 Budget Statement, Tanzania had an annual installed milk processing capacity of 353,100 litres per day (lpd) if Brookside Tanzania Limited (with a 45,000lpd) capacity is included. The milk processed was 88,440 lpd or 32.28 million litres. Brookside was reported to have worked at 2,000 lpd. If we include Brookside the installed capacity can absorb 7.75% of domestically produced milk. On the overall, in 2008 processing plants operated at about 25% of their capacity producing 88,440lpd or 32.28 million litres per annum, this is 1.94% of the total milk produced in Tanzania. Relaxing the definition of formal marketing to include non-processed but tested and sold in hygienically approved and organized environment4, the formal channel may be accounting for more than 2%. In summary the computation is as follows:- Table 1.1.1 An Overview of the Structure of the Milk Sector In million
Litres Percent
Total milk available 1,690.14 100.0%
From imports 26.14 1.5%
Total domestic production 1,664.00 98.5%
From traditional cattle 1,164.80 68.9%
From improved breeds 349.44 20.7%
On the farm consumption1 490.88 29.0%
Available raw milk for marketing 1,173.12 69.4%
Formally marketed raw milk2 32.28 1.9%
Informally marketed from domestic production 1,140.84 67.5%
Installed capacity for processing 128.88 7.6%
Milk processed domestically 32.28 1.9%
By large processors 27.27 1.6%
By small processors 5.02 0.3% Main Source: MF&EA, ML&FD 1 From RLDC comment on feedback, the Consultant is also of strong opinion that around 30% may be consumed by livestock keepers in form of raw, sour or ghee. 2 Note that the MF&EA reported that formal market makes 1% of milk produced in Tanzania, however the operating capacity in 2008 suggests a higher percent of more than 19.4%. 4 A good example is in Mbeya where dairy farmers in Rungwe have organised distribution networks for bulk milk in Mbeya City following to good milk handling regulations but may not be appearing under formal marketing channel..

Survey on Dairy Products Market in Tanzania
3 Niras Finland Oy
1.2 Study Objectives, Outputs and Deliverables
This Milk Market Study builds upon past works that have largely addressed challenges facing the dairy sector in production and marketing areas, many organizations have studied production and marketing (in broad context) to mention but a few, they include the Ministry of Livestock and Fisheries Development, the Ministry of Industry, Trade and Marketing, TAMPA,
Figure. 1.1.1 An Overview Map of the Dairy Sector

Survey on Dairy Products Market in Tanzania
4 Niras Finland Oy
UNDP/TetraPak, SNV, Rural Livelihood Development Company/Astroproject, Land O Lakes, etc. The key research questions in this study have been; Firstly, if Tanzanians in 1980s and early 1990s then with a population of about 26 million people (Population Census, 1988) were able to absorb about 400,000lpd of processed milk from Tanzania Dairy Limited plants (then located in Arusha, Tanga, Musoma, Tabora, Dar es Salaam and Mbeya), why is that at present milk processing plants with about 15% to 20% of the early 1990s capacity are finding it difficult to profitably sell their products? Consumption of processed milk was expected to grow as a result of urbanization rate, population growth, economic growth and increase in educated population. Secondly, in another dimension of the paradox, why there is an increase in imports both in volume and value while local processing capacity had been shrinking? Between 2004 and 2009 imports year-on-year growth has averaged at 9.41% in volume, this is higher than the economic growth that over the period has averaged at 7.28%. Kurwijila (FAO, Undated) estimated that in 1990s there was a supply gap of about 12.5 million litres of milk per annum in Dar es Salaam alone. The local capacity was able to meet about 33% of the demand (TDL/AGRIS, 1994). In sum, the local dairy firms’ market share has been rather staggering while imported products have experienced significant growth. The question then is; how are processors connected to the end markets because principles of competitive value chain development states that
“End markets are a key driver of value chain growth and development. End-market demand informs supply chain actors who in turn build capacity to meet demand and compete in the marketplace. ….. In general, however, successful value chain development relies on a flow of information, requests and purchase orders from end markets. Thus market-led (or market-driven) development should start with end markets, whether they are local, national, regional or global.” and that, “It is one thing to argue for connections with markets; it is another to look to – and accept – demand as the engine of the process. Understanding demand and recognizing that demand pulls supply is a central operating principle. … Production is focused on what can be sold, not on selling what can be produced” [http://www.apps.develebridge.net/amap/index.php/End_market, October 15th, 2009 at 14:00hrs]
In view of the above, RLDC and TAMPA are of the view that there might be some strong reasons/factors that hinder local processors from tapping into the market estimated to be worth of tens of millions of USD per annum. While addressing the situation above, a number of factors needed to be looked into, they included the market structure particularly demand and supply. With the market analysis attempt has been made to relate consumers buying pattern and ability, prices, competition from domestically produced and imported goods. On the supply side, the analysis has looked at competitive elements that include product mix and technology and how they relate to demand. It is pertinent that competitiveness of local products is benchmarked against other successful countries and to draw lessons there from. A firm can gain sustainable competitiveness either by being cost effective in the industry or and differentiating its products

Survey on Dairy Products Market in Tanzania
5 Niras Finland Oy
by targeting certain market segment. Also critical in today’s market is efficiency in distribution systems as well as branding efforts for sustaining and growing market share. RLDC initiated this market study to zoom into distribution aspects of the dairy products value chains in Tanzania. The objective of the study had been to find out the constraints that face the dairy market particularly in the distribution and make practical recommendations to processors so that they can generate strategies to become competitive in the market. Increased marketed volumes are expected to pull milk from farmers who in turn will improve their incomes from reliable market of milk. However in order to have a complete picture the study had to cover other facets of the market including its structure, imports and export, estimation of demand for milk and processing capacity. More information on the study objective can be found in the TORs attached as Annex IV.
1.3 Scope and Methodology of the Study
The major focus of the study is to help medium and large dairy processing plants to understand and use the findings in improving access to markets for their products. The initial phase of the survey involved consultations with RLDC in Dar es Salaam and Dodoma and later with TAMPA and Tanzania Dairy Board. A review of various reports was done before going into the field. Discussions with processors took place between February 8th and 16th , 2010 in Musoma with Mara Milk Limited and Musoma Dairy Limited, in Arusha with Arusha Dairies Limited, International Dairies and Brookside Tanzania Limited, in Tanga with Tanga Fresh Limited) and in Dar es Salaam with Tan Dairies Limited. Apart from consulting the processors, a parallel exercise took place with milk retailers to learn on the distribution and consumer behaviour. Two research assistants were engaged, one who worked closer to the team collected information in Musoma, Mwanza, Shinyanga, Singida and Dodoma. In Arusha the coverage of traders was done by a local research assistant after being trained by the Consultant. A total of 25 outlets stocking milk were consulted during the study, to get a fairer opinion outlets covered outlets in areas designated as low income, middle income and city/municipal centres. A questionnaire was used to collect information from traders and a checklist was used for processors (See Annex V a. and b.). The estimation for demand of milk in Tanzania relied on the review of past studies and data particularly those from 2007 Household Budget Survey. As for lessons from other countries, the study drew significantly from Kenya partly because it has a well developed dairy industry but also because of the EAC Common Market subjects Tanzania to an emerging single market.
1.4 Study Limitations
There were few issues that limited the study comprehensiveness particularly in terms of geographical coverage and depth as highlighted below. Timing of the assignment: The Team worked was in the field between February 7th and 15th, this is the flush period thus it was expected that processors will operating at a relatively higher capacity. Unfortunately, New Musoma Dairy Ltd had stopped production pending the injection of working capital from shareholders and installation of the new Board and Management. Data availed shows that production had stopped from December 2009. At Mara Milk Limited

Survey on Dairy Products Market in Tanzania
6 Niras Finland Oy
production of UHT had been stalled due to technical a problem in the aseptic packaging unit. In Arusha Brookside had stopped production since 2009. International Dairy Limited and Arusha Dairy Limited are operating though at a lower capacity (at 30% and 40% of the optimum capacity5 respectively). At Tanga Fresh Limited operations were on going at a normal level. The challenge had therefore been how to attribute the obtaining performance level to either market-related (exogenous) constraints or firm level (endogenous) technical and managerial constraints. The Client had directed the Consultants to focus on distribution. Area covered vs national picture: The TOR had wanted to obtain a national picture of the constraints facing the distribution of dairy products. Given the limited time, the Consultant visited and obtained in depth inputs from New Musoma Dairy Limited (NMDL), Mara Milk Limited (MML), Brookside Tanzania Limited (BTL), Arusha Dairy Limited (ADL), International Dairies Limited (IDL), Tanga Fresh Limited (TFL) Tan Dairies Limited (TDL). A limited sample of retailers in Musoma, Mwanza, Arusha, Shinyanga, Singida, Dodoma and Dar es Salaam was used. ASAS and CEFA were interviewed by phone which limited information gathered. Import Data: While it is important to recognize the efforts done by Tanzania Revenue Authority to disaggregate dairy products for recording imports, there is high prevalence of products that were not properly classifiable, e.g. the dairy products classified as “Specially prepared for infants” (code number 04022110), goods worth 61.9 million were able to be placed under this code while goods worth Tshs 394.3 million were classified as “other” (code number 04022190) below the category. Inability to classify properly reduces the accuracy of rationalized volume of imports in milk equivalent that is used as a common denominator.
1.5 Organization of the Report
This report has four main chapters. As noted hereto, the first chapter is the introduction that explained the background of the sector and the study. It also contains the scope and methodology. The findings are placed in Chapter Two where there are three sections, section one looks at the market structure that includes demand and consumer behavior, section two addresses distribution that is the core subject of the study while section three looks at processing of dairy products. Chapter three conclusions and recommendations. Note that tables, figures and other exhibits have been numbered according the sections they belong to.
5 Optimum capacity is what the processor can or had achieved when the conditions were favourable, it is normally lower than the installed or rated capacity.

Survey on Dairy Products Market in Tanzania
7 Niras Finland Oy
2.0 FINDINGS
2.1 Dairy Market Structure
The dairy market structure start by looking at products available in the market then gets back to learn how the market needs are being addressed by processors in terms of product mix and volume demanded. Thereafter the section looks at consumer pattern and demand in order to establish quantity demand demanded. Issues to do with prices are discussed under this section.
2.1.1 Product Range in the Market In the market there is a wide array of dairy products, however from domestic production point of view the product range is relatively narrow, there are fermented milk, (mtindi/mala), pasteurized fresh milk, UHT milk and to a small extent, yoghurt, cheese, butter and ghee. Mtindi, cultured milk or mala: The different names are used at different regions but basically the process is the same. To the pasteurised milk a bacteria culture is added. When the acidity in the milk has reached the required level the mtindi is cooled and ready for sale. The shelf life under refrigeration is normally 18-20 days. The texture of the product can vary considerably from smooth uniform to the type with distinct lumps in it. The difference is due to the physical handling of the product. Mtindi is often packed in sachets. But also gable top cartons and bottles are used. UHT (ultra high temperature) milk: The milk is treated at 140 degree Celsius for 3-4 seconds. After this process the commercial sterile milk is aseptic packet. The packing is normally packet in special cartons (blocks), with a shelf life of 6 -12 months without refrigeration. The UHT milk can also be packet in plastic sachets or bottles. Because of the high temperatures used in processing there is a slight difference in taste compared to pasteurised milk. But as most milk irrespective of treatment is being boiled before use the change in taste is probably not being important in marketing. Pasteurised milk: The milk is only treated at 72 degree Celsius in 15 seconds before being packet in gable top cartons or in plastic sachets. Because of the lower temperatures the milk is not sterile and the shelf life is reduced to 5-7 days under refrigeration. Yoghurt: Yoghurt is, like mtindi fermented milk. The cultures used require a constant incubation temperature and in order to get a more thick and creamy texture about 5 % milk powder is added. Yoghurt is often sold in cups of various sizes with addition of flavours or processed fruits. Cheese: There is a large number of cheese types around the world. The most common types produced in Tanzania are Cheddar and Mozzarella. To process cheese you require about 10 l of milk to make one kg of cheese, for Cheddar a little more and for mozzarella a little less. Cheddar cheese requires a ripening period of several months, while mozzarella cheese can be marketed right after processing.

Survey on Dairy Products Market in Tanzania
8 Niras Finland Oy
Cream: Both full cream milk, mtindi and yoghurt require standardisation of the milk. Normally the standard milk will contain 3.2 % fat. As most milk contains more fat, the surplus will be separated as cream. The cream can after pasteurisation be sold as fresh cream or it can be fermented to sour cream. Normally there is either 36 % or 17 % fat in the cream. Butter: The cream containing 36 % fat can be processed into butter. The cream is sometimes fermented with bacteria cultures or used as it is (sweet butter). Depending on customers preference salt can be added. After being processed in the butter churn it is ready for packing. The liquids remaining (butter milk) can be used as refreshing drink. In the butter there will be approximately 86 % fat, the rest being water. Ghee (butter oil): The butter can be turned into ghee simply by evaporating the remaining water in the butter (about 16 %). Heating the butter needs to be done in gentle way otherwise the butter oil will be dark and have a burnt smell. Other dairy products: There are numerous other imported dairy products on the shelves of the supermarkets. Some of them could be fairly easily to be processed locally like sour cream and cottage cheese. The products can be made without sophisticated and expensive equipment and if a market is emerging the opportunity should by all means be utilised. Very special cheese types requiring experienced staff to process may appear attractive when looking at the prices to be obtained, but the potential market will be limited and economies of scale are not likely to be reached. But development of dairy products specifically appealing to the Tanzanian consumers should be encouraged. About 54% of the capacity of processors is used to produce cultured milk, the percentage is even higher when NMDL is taken out because more than 70% of its capacity will be for UHT. In a bid to add value many processors have increased the volume of yoghurt, it accounts for more than 12% of the capacity6. In international trade, dairy products are generically categorized and coded to facilitate information aggregation. 6 Excluding figures from ASAS and CEFA who were not covered
Figure 2.1.1 Main Dairy Industry Products in Tanzania based on Installed Capacity

Survey on Dairy Products Market in Tanzania
9 Niras Finland Oy
In rationalising imports of dairy products into liquid milk equivalent (lme) for the purpose of having a common denominator, conversion ratios were applied at the four digit code level. In 2009 dairy products under milk and cream, concentrated or sweetened account for 68% of the volume of imports, non concentrated or sweetened milk and cream made 16% and cheese and curd at 6%. Butter and other fats and oils derived from milk accounted for 5%, buttermilk, curdled milk and cream, yogurt, etc were at 3% and whey and other natural milk constituents making 2%7.
2.1.2 Consumption Pattern The analysis of consumer pattern relied heavily on data mining from 2007 HBS that surveyed 10,460 households of which 4,935 consumed dairy products during the year. Hence, about 49% of the Tanzanians consume milk8. NOTE that the HBS data recorded expenditure for one year in selected households in the national master sample. The households were classified based on assets in quintiles. The foregoing analysis indicates expenditure by quintiles.
2.1.2.1 Products Consumed Based on HBS, the widely consumed dairy product is fresh milk where households covered show that Mtwara Rural, Ruvuma Rural, Dar es Salaam (Rural) and Lindi had the highest, above 98% of the households who reported to consume dairy products use fresh milk. In the second tier of between 90% and 98% are Pwani Mixed, Arusha Rural, Manyara Rural, Dodoma Urban, Ruvuma Mixed, Mara Rural and Mixed, Dar es Salaam Mixed, Arusha Mixed, Dodoma Mixed, Morogoro Mixed, Mara Urban, Iringa Mixed and Tabora Urban. It can be seen that consumption of fresh milk intensity along the rural, mixed, urban spatial view forms a concentric circle with an exception of Tabora and Dodoma, in most regions areas in the rural and peri-urban (mixed) have a higher percentage of people consuming fresh milk.
7 In order to understand the aggregate supply of processed dairy products in the market one has to add imports with domestic production, this is however difficult because the classification of products by TRA differs with the categories in market. 8 The figure needs reconfirmation from NBS
Figure 2.1.2 The Average Composition of Dairy Products Imported in Tanzania by Volume (2004 – 2009)

Survey on Dairy Products Market in Tanzania
10 Niras Finland Oy
One important conclusion from this scenario is that households in rural, peri-urban and urban are aware of and use fresh milk because of the availability and efficient hawkers-based distribution system.
2.1.2.2 Fermented milk Fermented milk is the second most important form of dairy products, it ranks high in Rukwa, Mbeya, Kigoma, Tabora, Singida, Dodoma, Manyara and Morogoro. Part of the reasons for this pattern could be low capacity to move the milk to the market letting a higher percentage to ferment. Regions with higher processing capacity of Arusha, Tanga and Mara are low in the list of main consumers of fermented milk most likely because some considerable amount is hauled for processing.
2.1.2.3 Packed Milk Perhaps of key interest with the HBS is the situation with packed milk, this category is that of processed and packed milk. Data show that consumption of packed milk is very low albeit in urban areas, the national average is 0.078% of those who reported to consume milk. The highest slot is held by Dar es Salaam Urban where 1.148% reported to consume packed milk. It is followed by Mara Urban by 0.78%. Unexpectedly Ruvuma Mixed had a third position, Mwanza Urban at a fourth place with 0.709%. Others areas were Tabora Mixed, Tanga Urban, Mwanza Mixed, Morogoro Mixed and Arusha Mixed. The figures above have significant implication on market targeting for major urban areas. The low uptake of packed milk as compared to fresh milk is expected because: -
i. Milk has unitary own price elasticity hence a premium of more than 100% for processed milk over unprocessed should certainly curtail consumption of packed products.
ii. Consumer perception that fresh milk is “not baptized” – is sold in its natural form i.e. has a higher fat and more rich in flavour. Also that it is not homogenized which both changes the taste but also make the fat invisible.
iii. Competition with hawkers that have relatively more efficient distribution network compared to processors and their agents in terms of outreach makes fresh milk more accessible.
2.1.2.4 Locations where households buy milk products in Dar es Salaam, Mwanza, Arusha and Dodoma Urban.
Kiosks are the most important point of sale for processed milk in Arusha and Dar es Salaam. In Dodoma due to limited presence of specialised outlets consumers depend on gulio. In Mwanza
Table 2.1.1 Percentage of Households Consuming Packed Milk (2007) Region Urban
/Rural Percent
D'Salaam Urban 1.148%Mara Urban 0.787%Ruvuma Mixed 0.769%Mwanza Urban 0.709%Tabora Mixed 0.355%Tanga Urban 0.236%Mwanza Mixed 0.189%Morogoro Mixed 0.114%Arusha Mixed 0.055%National Average 0.078%
Source: HBS 2007: NBS
Survey on Dairy Products Market in Tanzania
11 Niras Finland Oy
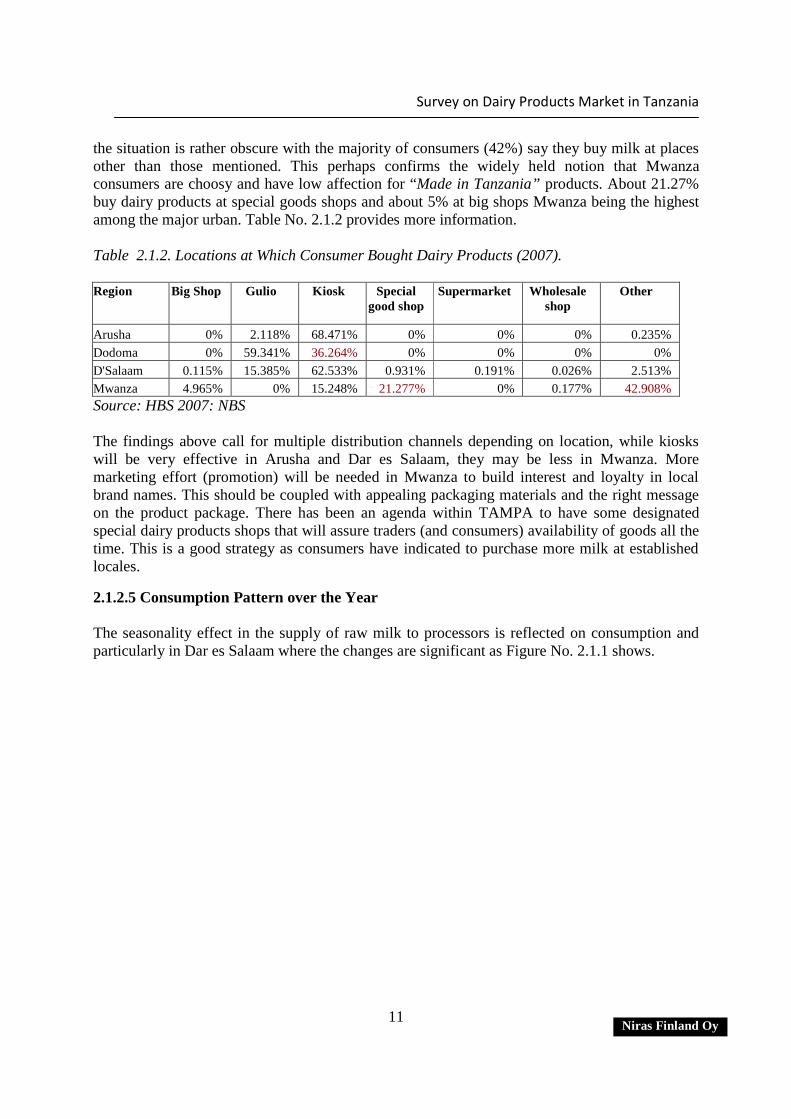
the situation is rather obscure with the majority of consumers (42%) say they buy milk at places other than those mentioned. This perhaps confirms the widely held notion that Mwanza consumers are choosy and have low affection for “Made in Tanzania” products. About 21.27% buy dairy products at special goods shops and about 5% at big shops Mwanza being the highest among the major urban. Table No. 2.1.2 provides more information. Table 2.1.2. Locations at Which Consumer Bought Dairy Products (2007). Region Big Shop Gulio Kiosk Special
good shop Supermarket Wholesale
shop Other
Arusha 0% 2.118% 68.471% 0% 0% 0% 0.235% Dodoma 0% 59.341% 36.264% 0% 0% 0% 0% D'Salaam 0.115% 15.385% 62.533% 0.931% 0.191% 0.026% 2.513% Mwanza 4.965% 0% 15.248% 21.277% 0% 0.177% 42.908% Source: HBS 2007: NBS The findings above call for multiple distribution channels depending on location, while kiosks will be very effective in Arusha and Dar es Salaam, they may be less in Mwanza. More marketing effort (promotion) will be needed in Mwanza to build interest and loyalty in local brand names. This should be coupled with appealing packaging materials and the right message on the product package. There has been an agenda within TAMPA to have some designated special dairy products shops that will assure traders (and consumers) availability of goods all the time. This is a good strategy as consumers have indicated to purchase more milk at established locales.
2.1.2.5 Consumption Pattern over the Year The seasonality effect in the supply of raw milk to processors is reflected on consumption and particularly in Dar es Salaam where the changes are significant as Figure No. 2.1.1 shows.

Survey on Dairy Products Market in Tanzania
12 Niras Finland Oy
Figure 2.1.3. Pattern of dairy product consumption over the year
The higher variation in Dar es Salaam may be attributed by its dependence on processed milk and as processors scale down production in August through November Dar es Salaam is hard hit. It is important therefore that processors continue to work hard to minimise the seasonality effect on the end market. The shortage is a lost market.
2.1.3 Other market segments
2.1.3.1 Offices The habit of using milk at work place dates back during the dominance of parastatal companies in the 1970s and 80s, it was a policy of almost all organizations that they should provide milk or and white tea to workers. The culture has however waned with the demise of parastatal organizations, even within Government offices there is no policy for such a service. For example at Arusha Regional office workers take about 300mls of milk. At Musoma Hospital milk supply to staff has been scaled down, only the theatre section is provided with milk, maternity and child sections used to get milk until 2007. There is a mixed feeling about Government office because they buy on credit and payments are not certain. One processor has had a significant outstanding bill with the army. Competition with milk powder at workplace is common, even at Arusha Regional Office about 30% of the personnel take NIDO instead of fresh milk. It will be difficult to estimate the market value of this segment but it could be significant for example one processor has managed to secure a market for bulk fresh milk at workplace that account for about 10% of the daily processing capacity. Processors need to make more effort to approach, raise awareness and market their fresh milk to potential volume of this segment.

Survey on Dairy Products Market in Tanzania
13 Niras Finland Oy
2.1.3.2 School Feeding Programme Among the strategies that was used to develop the sector in Kenya was to create a generation of people who value and consume milk, school feeding programmes were instituted. There have been efforts in Tanzania to replicate the strategy by stakeholders. The basic constraint to such programme at present will be the capacity to produce, haul milk from farmers to processors, process and distribute it equitably throughout the country.
2.1.3.3 Restaurants and Hotels This is a potential market segment for bulk milk deliveries, at Musoma some hotels are supplied with milk from processors (at least Afrilux Hotel). There are 11 large hotels that could order not less than 20 lpd, 7 middle level hotels that can consume around 10 lpd and 49 restaurants with a potential for at least 10lpd. The combined demand for this segment in Musoma alone could be more than 800 lpd. The quantity is significant if one takes into account district centres and adjoining cities/towns (e.g. Mwanza for Mara based processors). However some hotels e.g. New Mwanza Hotel procures milk from farmers or traders and process (skim) the milk in house. To a large extent processors will have an edge if regulations to require hawkers have their products certified comes into force.
2.1.4 Demand Estimates for Household Segment
Estimating demand for dairy products in Tanzania has been a big challenge, even when one would like to assume that all the off take milk is consumed it is still not enough to ascertain the amount consumed because of non-reliability of production data (as indicated in Scanagri/BCS [2005]. As noted in Section 1.1 above the country processes 32.28 million litres per annum, imports add into the market an equivalent of 29.793 million litres, if the two sources are added imports account for 48% of the market for processed dairy products in Tanzania. An increasing trend on imports show existence of unfulfilled demand. Citing the EAC/COMESA, DA&PPDC (2006) reported that in 2003 Tanzania had a deficit of 386,040 mt of dairy products then. Assuming that the demand grows at a natural rate of the GDP growth, such a deficit, in 2009 the deficit would be around 581,000mt indicating a huge opportunity in the dairy industry.
Since most processors are targeting Dar es Salaam, an attempt to compute the market size has been done based on 2007 Household Budget Survey data. It is estimated that the city with an estimated population of 3.2 million present a market worth Tshs 2.68 billion per month or Tshs 32.12 billion per annum as indicated in Table No. 2.1.3.

Survey on Dairy Products Market in Tanzania
14 Niras Finland Oy
Table 2.1.3 Estimation of Market Size for Processed Dairy Products in Dar es Salaam in 2007
Mean expenditure per household per month in Tshs 154,904
Percent of household income spent on dairy products*
Fresh milk 1.24
Cultured/fermented milk 0.7
Cheese 0.45
Powder milk 0.03
Packed milk 0.01
Total percentage 2.43
Expenditure on Dairy Products in Tshs/month 3,764.17
Estimated number of households in Dar es Salaam 720,000
Total market value per month in Tshs million 2,677
Total dairy product market per annum in Dar es Salaam in million Tshs 32,121
Total dairy product market per annum in million USD 24.84 Some informed opinion has generated a rule of thumb that the combined demand for other urban areas in Tanzania will be twice that of Dar es Salaam, it follows therefore that demand for other urban areas will be Tshs 5.353 billion per month or Tshs 64.241 billion per annum. The total demand of milk in Tanzania then could be around Tshs 96.36 billion or USD 74 million. Imports in this regard take just about 11% of the potential market, domestic production is at a base value of USD 27.41 million, the market (unmet) demand for processed milk is thus around USD 40 million per annum.
2.1.5 Demand Behaviour for Processed Milk In their analysis, Weliwita, Nyange and Tsuji [2003]9 they established that foodstuffs like maize, rice, other cereals, pulses, sugar, edible oils, fish, starch, fruits and vegetables, meat, and others are price inelastic while milk and dairy products have unitary elasticity of demand. This finding had been the basis of extending the analysis further to look into the relationship between household income and consumption of dairy products as well as issues around pricing strategies among value chain actors particularly with respect to UHT milk
9 Food Demand Patterns in Tanzania: A Censored Regression Analysis of Microdata in Sri Lankan Journal of Agricultural Economics. Volume 5. No. 1, 2003

Survey on Dairy Products Market in Tanzania
15 Niras Finland Oy
Confirming what has been widely stated as lack of milk consumption culture in Tanzania, Weliwita, et al noted then that milk and dairy products group had the smallest budget share among all food groups. The report further notes that since dairy products have unitary elasticity of own price it imply that people are likely to consume more products when prices drop. The situation seem to have not changed significantly as data for 2007 indicate that the percentage of household expenditure going to dairy products is still small, it was 3.55% in 2001 and was 2.43% in 2007. In order to understand the impact of decreased percentage of household expenditure going dairy products, it is important to measure the aggregate household income between 2001 and 200710.
2.1.6 Price Level and its Impact on Demand Pricing is a decisive factor for business survival or growth, a number of factors need to be looked at before setting prices. The factors include; most important price elasticity of demand, long term vision of the firm, cost structure, degree of competition from both domestic and foreign, price level of similar or close substitutes, legal and policy framework, degree of diversification and integration, etc. Price elasticity of demand. Studies have shown that in Tanzania price elasticity of demand for dairy products is unitary (Weliwite,at. al.) implying decline in price leads to proportionate increase in consumption, so is the converse. Writing about elasticity for consumers in Kenya, Development Associates a/s and PPD Consultants (DA&PPDC) [2006] notes that…
….price elasticity of demand for raw milk was low with respect to low income groups and high with respect to high income groups. This would indicate that increased price of raw milk will not affect the demand for the product by low income groups, but could reduce demand by high income groups. Similarly, price elasticity of demand for processed milk is high for low income groups and low for high income groups. This means that while the price increase in processed milk will lead to reduced demand by low income groups, it will not affect the demand for the product by the high income groups.
The same reports attributes the success in the market of dairy products to decrease in consumer price that resulted from reduction in the cost of packing materials from as the industry shifted from tetra pack to poly pouches where they state that…
It should be emphasized that the processed milk segment is sensitive to price. This explains why the recent reduction on consumer price through the entry of the “pouch” processed milk has led to the dramatic increase in consumption of the relevant brands.
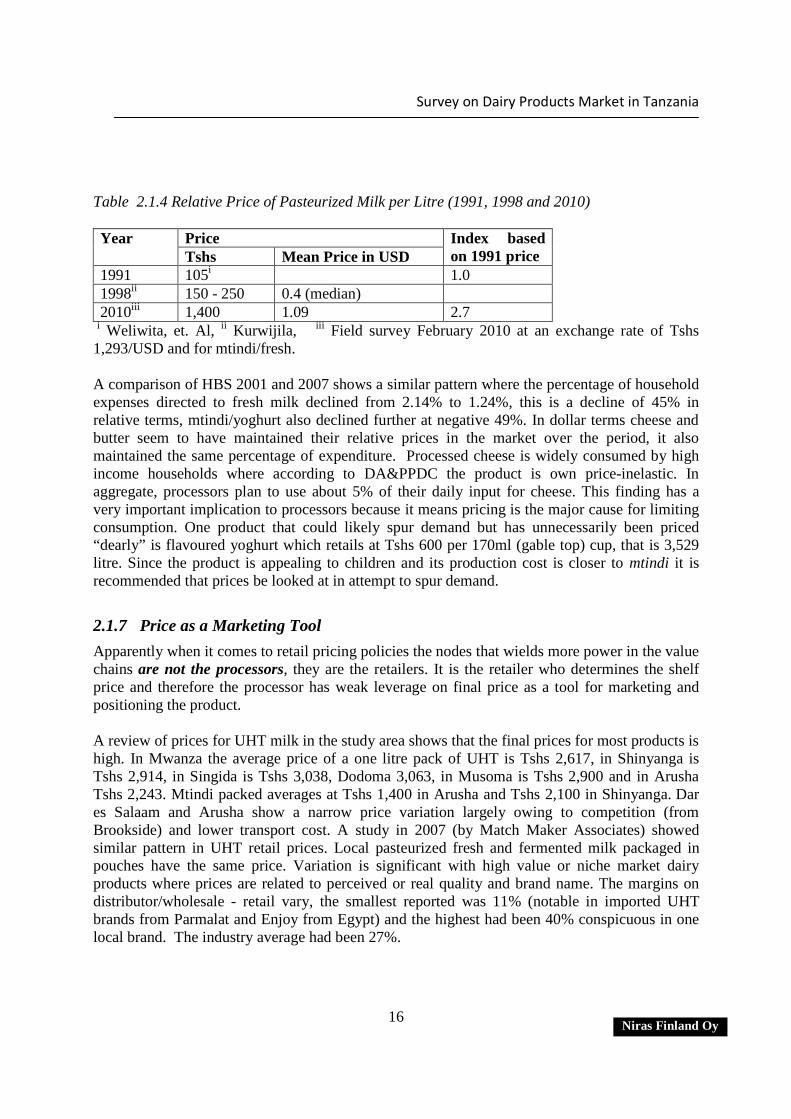
[DA & PPDC, 2006] If we look at price trend for processed milk in Tanzania in dollar terms a litre of processed milk has increased 2.7 times.
10 Data for absolute income in 2007 is available, the 2001 is missing.
Survey on Dairy Products Market in Tanzania
16 Niras Finland Oy
Table 2.1.4 Relative Price of Pasteurized Milk per Litre (1991, 1998 and 2010)
Price Year Tshs Mean Price in USD
Index based on 1991 price
1991 105i 1.0 1998ii 150 - 250 0.4 (median) 2010iii 1,400 1.09 2.7
i Weliwita, et. Al, ii Kurwijila, iii Field survey February 2010 at an exchange rate of Tshs 1,293/USD and for mtindi/fresh. A comparison of HBS 2001 and 2007 shows a similar pattern where the percentage of household expenses directed to fresh milk declined from 2.14% to 1.24%, this is a decline of 45% in relative terms, mtindi/yoghurt also declined further at negative 49%. In dollar terms cheese and butter seem to have maintained their relative prices in the market over the period, it also maintained the same percentage of expenditure. Processed cheese is widely consumed by high income households where according to DA&PPDC the product is own price-inelastic. In aggregate, processors plan to use about 5% of their daily input for cheese. This finding has a very important implication to processors because it means pricing is the major cause for limiting consumption. One product that could likely spur demand but has unnecessarily been priced “dearly” is flavoured yoghurt which retails at Tshs 600 per 170ml (gable top) cup, that is 3,529 litre. Since the product is appealing to children and its production cost is closer to mtindi it is recommended that prices be looked at in attempt to spur demand.
2.1.7 Price as a Marketing Tool Apparently when it comes to retail pricing policies the nodes that wields more power in the value chains are not the processors, they are the retailers. It is the retailer who determines the shelf price and therefore the processor has weak leverage on final price as a tool for marketing and positioning the product. A review of prices for UHT milk in the study area shows that the final prices for most products is high. In Mwanza the average price of a one litre pack of UHT is Tshs 2,617, in Shinyanga is Tshs 2,914, in Singida is Tshs 3,038, Dodoma 3,063, in Musoma is Tshs 2,900 and in Arusha Tshs 2,243. Mtindi packed averages at Tshs 1,400 in Arusha and Tshs 2,100 in Shinyanga. Dar es Salaam and Arusha show a narrow price variation largely owing to competition (from Brookside) and lower transport cost. A study in 2007 (by Match Maker Associates) showed similar pattern in UHT retail prices. Local pasteurized fresh and fermented milk packaged in pouches have the same price. Variation is significant with high value or niche market dairy products where prices are related to perceived or real quality and brand name. The margins on distributor/wholesale - retail vary, the smallest reported was 11% (notable in imported UHT brands from Parmalat and Enjoy from Egypt) and the highest had been 40% conspicuous in one local brand. The industry average had been 27%.

Survey on Dairy Products Market in Tanzania
17 Niras Finland Oy
Consultation with some processors suggested that efforts is needed to empower consumers by indicating recommended prices on packets, this had a mixed feeling because while Unilever has succeeded managed to successfully inform consumers and major outlets are following, Coca Cola, Pepsi Cola and beer manufacturers are finding it difficult to ensure retailers comply to recommended prices. In the case of Coca Cola for example, a distributor has been earmarked a margin of 5.8% and a retailer a margin of 17.8%, the common practice has been to hike the price of from the recommended Tshs 400 to 500 hence elevating their margins to a whopping 32%. Note that these companies wield some power because they even supply refrigerators. To address these challenges the companies have produced smaller 200ml bottles to keep low income consumers. The Cola industry in Tanzania like other major commodities (beer, cement, etc.) is oligopolistic it can survive with the obtaining market dynamics. If local processors can not have a clear competitive edge in the market they may not realize the desired growth path. Considering how important the price is in stimulating demand TAMPA ought to facilitate an industry wide strategy debate to see if there is common interest amongst processors to make a uniform strategy with regard to pricing as a strategy for improving demand as well as countering imports. Care has to be exercised lest people’s opinion is swayed to think cheaper is poor quality. A campaign to instill consumer confidence coupled with rigorous quality assurance mechanism should be agreed and implemented.
2.1.8 Competition
2.1.8.1 Competition among Domestically Produced Products A rapid assessment of retailers in Musoma, Mwanza, Shinyanga, Singida, Dodoma and Dar es Salaam showed that there are no activities by processors geared to edge out one another in the market. All processors acknowledge the existence of low capacity relative to the potential market demand as signified by ever growing imports. Of the eight processors, two have diversified into UHT otherwise for the rest there is a product mix overlap with more than 50% of the capacity dedicated to mtindi/mala. None of the processors is working hard to project its brand name at the expense of others. An observation at Shoprite and BP Petrol Station convenience groceries found out mtindi from Tanga Fresh and ASAS get equal space in the cooler, what exists is more of a consumers’ choice since even small processors (less than 3,000lpd) find market for their products. In some cases larger processors have conceded being outcompeted by small processors because they have managed to adapt their products to consumer preference of full fat milk while larger ones take out a significant amount of fat.
A Hawker in Mwanza Sells up to 40Lts per day at Tshs 600 per litre, purchases the milk at Tshs 300 per litre through a month credit from suppliers month at 300/= per Ltr In order to minimize losses the hawker boils part of the milk that is sold later over the day. Some own lactometers to check density before accepting the milk from suppliers. Hawking is done using aluminium containers on a bicycle.

Survey on Dairy Products Market in Tanzania
18 Niras Finland Oy
The competition that impacts the industry comes from hawkers, they have been mentioned in many reports to be the major impediments to sector growth as it accounts for a considerable volume of milk marketed (90%). Their competitive edge include: - Undercutting processors in consumer price by a wide margin, in Mwanza for example a litre
sells at Tshs 600 as against about Tshs 1,400 i.e. 2.3 times. Flexibility in terms of trade, many hawkers trades on credit on both the supplier and buyer
sides, It has been mentioned also that some hawkers adulterate the milk with water or other
materials (cassava juice was mentioned in Musoma) to increase the volume. They have higher level of versatility in terms of timing consumers preferred time and making
door to door delivery. The margins are hefty hence more rewarding and motivating than those earned by vendors selling processed products. Industry players in Dar es Salaam contend that informal milk channels have an upper hand in delivering milk to all segments i.e. households, restaurants/hotels and institutions. Raw milk sold in Dar es Salaam comes from Kibaha, Chalinze, Bagamoyo, Kigamboni, etc. Wholesale price ranges from Tshs 500 to 600 while retails at Tshs 700 – 800 while pasteurised fresh milk retails at Tshs 1,400. Interviews done in Temeke with restaurants/food vendors confirm that they use raw milk from informal channels.
2.1.8.2 Competition between Domestic and Imported Products Between 2004 and 2009, Tanzania annual import bill for dairy products stood at 25.92 million lme worth USD 4.22 million. In 2009 imports accounted for 1.79% of the national supply, but up the value chain it account for 48% of the processed dairy products end market. The trend shows that imports have been growing at an annual rate of 9.41% per annum, far ahead of the local production (estimated at 6.7% between 2007 and 2008). In 2009 Tanzania imported milk from 37 countries, major ones are South Africa, Kenya, United Arab Emirate, The Netherland, Denmark and Ireland. Others are Australia, China, Cyprus, Egypt, France, Germany, India, Indonesia, Italy, Lebanon, Malaysia, Mauritius, Mauritania, New Zealand, Oman, Pakistan, Poland, Portugal, Saudi Arab, Singapore, Swaziland, Switzerland, Syria, Thailand, Uganda, Ukraine, United Kingdom, United States and Yemen. Annex III provides the list with values.
Figure 2.1.3 Trend of Dairy Products Imports in USD
Source: TRA

Survey on Dairy Products Market in Tanzania
19 Niras Finland Oy
The competition with imported dairy products from EAC countries is expected to grow particularly from Kenya where the sector is bigger, stronger and it seems there is a unified strategy to promote exports particularly to Tanzania and Uganda. Further, Kenya’s vicinity to Tanzania implies they can at short notice enter into cold range products expanding the scope of competition at product level. Already products from Brookside have higher frequency of citation in retail shop in Musoma, Mwanza and Arusha. While the through common external tariff (CET) the EAC market enjoys some through a 60% (80%?) duty there is a strong feeling that some structural constraints to the sector makes it less competitive even with the level of protection. One hypothesis would be that the cost structure in Tanzania is such ineffective that even tariffs of that magnitude can mot work. The second builds on the assumption that the industry is competitive in terms of cost structure, thus, there is weakness in enforcing the well intentioned protection system. The analysis indicate that it is not either or, it could be that the two forces interplay to undercut domestic processors to the extent that even a 60% protection is ineffective. Table 2.1.5 Cost Structure of Processing One litre into Pasteurised Milk packed in Poly Pouch
Tanzanian Firm Kenyan Firm* Variation
(Ke - Tz)
Tshs % Kshs Tshs
Equivalent % Cost of raw milk at factory gate 470 41.59% 20.00 340 52.63% - 130.00 Variable cost 88 7.79% 3.66 62 9.63% - 25.78 Packaging material 50 4.42% 2.30 39 6.05% - 10.90 Total cost at factory gate 608 53.81% 25.96 441 68.32% - 166.68 Transport outward 28 2.48% 1.00 17 3.00% - 11.00 Distribution/retailing cost 145 12.83% 4.00 68 11.00% - 77.00 Total cost 778 68.85% 56.92 526 149.79% - 251.68 Selling price 1,130 100.00% 38 646 100.00%
Source*: DA&PPDC (2006) The table above shows that the cost of processing a litre milk in Tanzania is higher than in Kenya by a significant margin of 48% with the price of raw milk accounting for 51% of the difference. Distribution cost attributes 31% of the difference and processing costs makes 10%. According to actors, the cost of raw materials is high in Tanzania because of dominance of informal marketing activities, less organized milk producers, higher cost of transport due to poor infrastructure and limited access for electricity to power cooling centres. One processor called for industry wide effort to ensure that in the long run producer price stay closer to other countries in the EAC, but indicated that this will require support to farmers from a third party to increase output per cow in order to compensate for loss on price. This strategy could be acceptable if it guarantees a farmer more income through increased productivity of his cow coupled with stable/reliable market. Note that a smallholder farmer in Kenya produces 2.9 ltr/day, Mchau, et. Al (2009) says the average output per cow per lactating day in Tanzania Central Corridor is 0.5litres! Hence, working to improve output is a long-term strategy. Quite

Survey on Dairy Products Market in Tanzania
20 Niras Finland Oy
encouraging, in its strategy, RLDC is going to support actors in the dairy chain in the central corridor to increase output of milk by 4 million litres through facilitating establishment of milk collection centers (MCC), organization and training of producers and supporting producer associations [RLDC Strategy]. Other areas of inefficiency are; transport due to poor infrastructure making per unit cost higher; electricity/power due to higher tariffs and frequent outages; cost of skilled manpower is higher because in Tanzania there are few dairy industry specialists11 caused by shortage of requisite skills has added to the overheads.
2.2 Distribution of Dairy Products
Distribution involves moving dairy products (or stocks or flows) from one market node to another (transportation), warehousing i.e. keeping products in the required conditions with manageable losses in quantity or quality and inventory management particularly receiving and supplying goods based on optimization principles. Effective and efficient distribution is critical because of competition and sophistication of consumers, some companies have emerged successful in the market because they have robust distribution system. In this section we look at how distribution of processed dairy products is organized and its effectiveness. The section looks at the spatial aspects between production and market nodes, then the organization and management of distribution.
2.2.1 Spatial Spread of Production Capacity and Market In its effort to industrialize, the country in the 1970 identified and earmarked locations with comparative advantage either in resource or market for establishment of industries. As for dairy firms the TDL plants were located in Dar es Salaam (market), Tanga (resources), Mara (resources), Tabora (resources and market) and Mbeya (resources and market). Table No 2.2.1 provides more information while figure 2.2.1 gives a visual presentation.
11 Dr. D. Mmary attributes the skilled labour challenge to lack of polytechnic education in Tanzania and neglect of the sector by the Government. Many processors outsource experts from Kenya. One processors in the past used to pay more than USD 10,000 to have a specialist supervise a batch of production because of lack local experts, another processor has one production unit stalling the production flow because there is no person to repair the machine.

Survey on Dairy Products Market in Tanzania
21 Niras Finland Oy
Table 2.2.1 Population (Market Potential) Relative to Processing Capacity Zone Population
(Market) Installed capacity
(Production) Lake (Mara, Mwanza, Kagera, Shinyanga) 10,985,806 (28%) 150,400* (46.2% Coast (Dar es Salaam, Coast, Morogoro) 5,997,851 (15%) 22,500 (7.0%) North Eastern (Arusha, Manyara, Tanga, Kilimanjaro) 6,328,275 (16%) 118,200 (36.3%) Southern Highlands (Mbeya, Iringa, Rukwa, Ruvuma) 6,884,282 23,900 (7.3%) Central (Singida, Dodoma) 3,299,128 (8%) 600 (0.2%) Kigoma 1,692,078 (4% ) (0%)
Tabora 1,692,078 (5%) 10,000 (3.1%) South (Lindi and Mtwara) 2,159,346 (5%) (0%)
Total 39,517,692 325,600 NOTE: * It has been reported that the Diocese of Shinyanga had planned to install a 3,000 lpd processing plant. As it can be seen from the map in Figure No. 2.2.1, production capacity by medium scale processors is lopsided in the Lake and North Eastern Zone. Urban population is the major market driver for processed dairy products because of relatively higher per capita income, population concentration and low cost of market development and distribution. In fact in Kenya Nairobi city accounts for 56% of the market for processed dairy products [DA &PPDC, 2006]. Musoma accounts for 39.51% of the national milk processing capacity with two plants larger plants (NMDL and MML)
Figure 2.2.1. Relative Position of Dairy Processing Installed Capacity in Tanzania

Survey on Dairy Products Market in Tanzania
22 Niras Finland Oy
accounting for 99% of the regional capacity. On the other hand the major markets are Mwanza, Dar es Salaam and Arusha.
2.2.2 Transport from Factory to Major Markets The processor does not have serious transport constraints because of the current low level of operation around 30% of the installed capacity.
2.2.2.1 Transport from Musoma to Mwanza The distance between Musoma and Mwanza is about 240kms, this is about a4-5 hour journey for a truck carrying such delicate products like milk. While UHT does not need cooling, cold range products are chilled over the day then transport in the evening to avoid the impact of sun heat. A 10 tonne truck with a capacity of 6 – 7,000liters of packed milk in crates are transported at a cost of Tshs 142.85 per litre, that is about 10.14% of the retail value for fermented milk and 5.9% for a UHT packet. The need for refrigerated trucks between Musoma and Mwanza is not pressing and indeed may add unnecessary cost.
2.2.2.2 Transport from Musoma to Dar es Salaam The transport of milk to city however is one of the challenges facing processors in Lake Zone. One factory has just started supplying the Dar es Salaam market after an interested distributor ordered some cold range products, consignments were still small making shipment cost as high as about Tshs 500 per litre or about 35.71% of the retail price. The cost could come down considerably with higher volumes that will also include UHT. The other processor has higher targets for Dar es Salaam, to improve efficiency transport and distribution functions have been hived off from the main firm, they are to be contracted to a company that will be responsible for hauling the products from the factory to the retailers. At present transport cost for a 40ft container will carry 25,000 litres with other operating costs (fuel, labour, wear and tear, etc) at about Tshs 3.0 million. This translates to Tshs 120 per litre or 5% of the 1-litre UHT retail price. With adequate number of trucks one can afford to wait for Dar – Mwanza bound (return) cargo to cover the costs of running the truck back. The going rates for a 40 - ft container is between Tshs 5 – 6 million which compares favourably with information from Maersk that charges USD 4,500 one trip to Lake Zone. The strategic partner12 to be involved in transporting milk need to have a fleet that will ensure continuous flow of dairy products to Dar es Salaam as well as transporting cargo (that won’t cause risks to milk) back to the Lake Zone. Most of the refrigerated truck capacity is tied to fish business, an attempt in the past to hire trucks from a fish packing plant by one of the processor failed. Maersk one of the companies with the largest fleet of refrigerated containers indicated that the Mwanza – Dar es Salaam haulage route is always full. The recommendation has been for dairy processors to acquire their own hauling capacity as it is cheaper and easy to control. Economically usable refrigerated
12 At the time of the study the transporter was not yet officially appointed though there were indications that the company will have experience in distributing fast moving consumer goods (FMCGs)

Survey on Dairy Products Market in Tanzania
23 Niras Finland Oy
trucks are available either as new or used/refurbished. Prices for 20 and 40 feet container trucks are as shown in the table below. An analysis based on the information gathered from processors show that running refrigerated trucks can be a viable business on its own, return on investment is highly in favour of a larger 40ft container than smaller 20ft one at 26% and 58% respectively. Table No. 2.2.2 Return on Investment on Operating a Refrigerated Truck Between Musoma and Dar es Salaam.
20 Feet Container Truck 40 Feet Container Truck
Purchase price in USD 50,000 70,000
Purchase price in Tshs 64,750,000 90,650,000
Useful economic life 4 4
Fuel consumption in kms per litre 5 4
Capacity in litres 16,000 25,000
Number of Musoma Dar trips per annum 52 52
Distance Musoma - Dar es Salaam - Musoma 2,400 2,400
Price of diesel 1,600 1,600
Revenue
Transport charge per litre 120 120
Litres hauled per annum 832,000 1,300,000
Revenue per annum 99,840,000 156,000,000
Operating costs
Fuel costs 39,936,000 49,920,000
Labour (3 people @ 500,000 pm) 18,000,000 18,000,000
Servicing, maintenance and major replacements 16,187,500 22,662,500
Total direct expenses 74,123,500 90,582,500
Gross Profit 25,716,500 65,417,500
Overheads at 7.5% of revenues 7,488,000 11,700,000
Vehicle taxes, insurance, licenses, etc. 1,200,000 1,200,000
Total Indirect Cost 8,688,000 12,900,000
Profit before corporate tax 17,028,500 52,517,500
ROI 26% 58% At present both the processors in Musoma have their balance sheets gearing (debt/equity) ratios unfavourable to additional investments thus investing in trucks would be a challenge. One

Survey on Dairy Products Market in Tanzania
24 Niras Finland Oy
processor had indicated that an additional truck is needed. Hence, an economically (not necessarily market wise) rational strategy is to explore possibilities for the two plants to cooperate in ferrying their products to Dar es Salaam so that they are sure of filling a 40 – feet tonne truck. The calculation and evidence from Maersk and FM Abri Transporters confirm that this is a profitable business13.
2.2.2.3 Transport from Arusha and Tanga to Dar es Salaam The installed processing capacity in Arusha is 18,500 lpd14, in 2009 they processed hardly 6,100 lpd i.e. at 32.9% [ML&FD, Survey] of the installed capacity. Note that processors with less than 1,500 lpd contributed 18% of the 6,100lpd processed in the region. The target market for the two remaining processors are more, one is marketing its products in Arusha and Kilimanjaro only because the capacity is limited. Another processor serves Arusha, Moshi, Dar es Salaam and Zanzibar with Mtindi, cheese, yoghurt and to a small extent pasteurised fresh milk. Transport to Dar es Salaam is through hired 7mt refrigerated truck.
2.2.3 The Market Channels
2.2.3.1 Goods Movement from Processor to Consumers Dairy processors use many types of channels to deliver the goods to the consumer. There is the shortest (sometime called direct sales or zero level) market channel usually they are processor-owned retail outlets, they have been seen at Tandiaries, Arusha Dairy and Tanga Fresh. This market channel handles very little amount of the companies’ production. The main advantage of this channel is that it allows greater control of the business by the processor, in fact Tandairies has named it as a “testing” centre implying it also provides feedback on product quality The main disadvantage of this channel is that it can distract the focus of the company marketing personnel away from a broader market. It demands a lot of resources to setup up such outlets something that may divert resources from high impact areas. Level one market channels comprise of the processor, retailer and consumer. The channel is suitable for processor whose market is geographically concentrated in a single area, production capacity is smaller and investment in distribution is minimum. This is the major channel for Mara Milk, International Dairy, Brookside and Tandairies. The channel still provides the processor with higher degree of influence in the product movement and margins. It is also very important when a company is developing its market because it is able to gather more information about market behaviour and was evident with Brookside that they are involved in developing the market. The downside of this arrangement is higher involvement of the processor in managing retailers when sales volumes are high. It has to be remembered that due to seasonality of supply of milk it is counterproductive to have a large workforce that at times has little to market therefore a balance is needed between the number of employees and needs of the company to successfully market the products.
13 The companies have been discussing for quite sometime on opportunities for collaboration, it is proposed that a mechanism possibly encouraged by TAMPA or TDB is put in place. 1414 The figure excludes Brookside with installed capacity of 40,000 lpd because there is no indication that they may reactivate the factory in the foreseeable future.

Survey on Dairy Products Market in Tanzania
25 Niras Finland Oy
Level Two and Three market channels are also common, the relation here is processors – agent (wholesaler) – retailer – consumer (for Level Two) and processor – agent/wholesaler – subagent/sub wholesaler – retailer – consumer for Level Three). They are the dominant channels particularly with Mara Milk, Tanga Fresh and Musoma Dairy because volumes are relatively high and markets are geographically diverse. The main advantage of this setup is that it allows the processor to focus more on production and less on distribution and managing of retailers. For example, TFL has 6 main agents for the entire of Dar es Salaam market that accounts for more than 80% of its products, Mara Milk has 5 agents managing sales in Mwanza and Musoma Dairy is looking forward to let a third party perform the entire marketing function. Effective marketing does not prescribe to a single channel but rather a system of channels that responds to the corporate marketing objective and indeed many companies have multiple channels.
2.2.3.2 Channel Design and Management This is a set of processes related to understanding the demand for each geographical market and related parameters such, delivery time, warehousing, nature of the product, production cycle and services needed. Given its age in the Dar es Salaam market, TFL has a more mature marketing channels system, its agents have in the past been supported with training, cooling facilities and transport. The distribution function in low income area e.g. Buguruni is through bicycle-vendors while in other (higher volume) area is through 2-tonne trucks. For the Mtindi and pasteurised milk TFL is the widely marketed brand in Dar es Salaam, a quick scan with retailers in Temeke, Mikocheni and Ubungo areas show that there is still room to improve on education to retailers, milk delivery and communication. Many traders in Temeke said they don’t stock any cold range product for fear of loss due to expiry15 and frequent power outages. This is an area where some confidence building in a way of training is needed. Milk delivery is another problem. Some traders complained that they do not know when there will be milk and when they are going to miss. Retailers are forced to make calls to agents more often. Brookside Tanzania Limited headquartered in Arusha has a broad target of improving their market share for non-cold range products in all major cities. They have a large warehouse in Arusha from where goods are shipped to Dar es Salaam, the company is implementing market development according to good marketing practices and in designing their channels they emphasize on delivery consistency, education to retailers, replacement policy on expired and leaking packets and recognition of best market performers16. It should be remembered that Brookside Tanzania Ltd is financially backed by Brookside Kenya and it can easily afford to invest in market development where others find it difficult.
15 Coincidentally when the interview was being conducted two people came to ask whether there was Tanga Fresh at the shop. 16 While Brookside indicated that they provide training, swap about-to-expire products and re-align retailers stocks none of the retailers interviewed in Dar es Salaam and Arusha had received the training implying its coverage is still limited.

Survey on Dairy Products Market in Tanzania
26 Niras Finland Oy
Retailers and vendors in town are free to buy milk from any agent (intensive channel) something that compels the agents to work within a certain margin and rely on logistical advantage rather than selling price. However, the processor/main agent divides routes for sub-agents rather than a territory, agents are allowed to compete. During dry season (months of July through September) supply declines as a result agents tend to price the products above the recommended levels. From the agent/depot milk is distributed either by truck or bicycles to retailers, bicycle vending has the challenge generates a challenge to the agent to handle so many records. One processor scaled down bicycle vending in Dar es Salaam because of such challenges of managing a fleet vendors.. There is also no evidence if the processor makes deliberate effort to collect information about opportunities and constraints facing the channel on continuous basis. While the current level of business may not justify more investment in marketing workforce, it is pertinent that the existing personnel have their role widened beyond distribution and are equipped with the necessary marketing skills. The complaints registered by retailers about irregular deliveries have been attributed by processors to agents being biased in allocation of products particularly when there is shortage as well as failure to recognize and cooperate with retailers. In all the incidences reported it was the retailers who called the agent to enquire about goods, none of the agents had ever informed retailers beforehand of imminent non-delivery. Musoma Dairy Limited future marketing channel will depend on the innovation by the third party of as referred by the management a “Strategic Business Partner” as well as the degree of influence the management will have after handing over the marketing function. Going under the Serengeti brand, International Dairy Limited can be categorised as a “niche market” processor, as such the presence of its products is more pronounced in places where high income consumers purchase their groceries (supermarkets). Niche marketing demands more control of channel by the supplier and so does IDL, this includes superior packaging and efficient delivery. One unique feature that underlies IDL, to improve the efficiency of their channel, they process milk according to orders from outlets (normally referred to as manufacture to order – MTO). This channel system is ideally the most economic in that it minimize losses associated with over-production and holding cost. This explains why the company has been growing rather organically. Tandairies Limited employs level one channel because its market is thus far Dar es Salaam, production volumes are still small. It uses 4-tonne trucks to distribute its products. The company has diversified into juices, honey and mineral water to tap into its marketing network. There is a significant amount of milk sold In summary, from firm level point of view distribution functions show the following key weaknesses: - At retail level: There limited cooling facilities to keep cold range dairy products being coupled by erratic power supply, retailers show low level of understanding of handling dairy products At wholesale/agent level: As with retailers, agents face gross shortage of cooling capacity/facilities, also they have shortage of transport equipment. They also have limited interaction with retailer in terms of business development strategy and themselves are not adequately competent to integrate marketing functions.

Survey on Dairy Products Market in Tanzania
27 Niras Finland Oy
At factory level: Inconsistent supply of dairy products by processors is one of the key weaknesses and there is limited promotion being done understandably because of low capacity of production. Lack of economies make long haul relatively expensive. Most processors are not well linked to retailers and consumers. Cooling Facilities at Dar es Salaam Depot One processor from Lake Zone has a cold storage facility in Dar es Salaam which in itself is not adequate to handle the anticipated increased volume of business when production pick up (say around May 2010). According to planned product mix whereby cold range products (mtindi/mala, yoghurt, etc.) will amount to 10,000 lpd with Dar es Salaam getting 8,000lpd, normally a three-day delivery capacity is needed i.e. 24,000lts. Containerised cold rooms offers the most cost effective solution, a 40 feet refurbished refrigerated container will cost USD 12,000 in Nairobi and about USD 6 - 7,000 in Denmark. Another advantage is scalability, each processor can stack have the number of containers needed based on business volume. According Dar es Salaam City by laws large trucks are expected to be barred from entering the city past Ubungo traffic light hence any future plan to locate cold rooms that will receive containerised cargo need to be before Ubungo. TAMPA has been working on the concept of the dairy house which conceptually needs to be a dairy park.
2.2.4 Refrigerators at Retail Point Limited refrigeration capacity at retail level is one of the reasons for poor visibility of products in the market hence stimulating demand as it is with famous drinks (e.g Coca Cola, Pepsi Cola, Kilimnjaro Water, etc.). A survey in regional centres of Mara, Mwanza, Arusha and Dar es Salaam has noted that most retail shops particularly in low income areas use refrigerators meant for households, they are not transparent. Further, the refrigerators are mixed with many other products. Some dairy processors have recognised this challenge and are contemplating on how to improve distribution at retail level and they have identified lack of own convenient refrigerators as among the constraints. The use of own refrigerators is financially viable. Estimates show that weekly sales of Tshs 122,654 can cover investment and running cost for the refrigerator. The sales are equivalent to 9-one litre UHT packets or 25 half –litre packets of Mtindi or 35 cups of 170mls of yoghurt per day. The table below provides more information on the financial viability of the strategy.

Survey on Dairy Products Market in Tanzania
28 Niras Finland Oy
Table No. 2.2.3. Estimated Capacity to Service a Refrigerator Loan
Specification Description Capacity of a refrigerator 200 lts Purchase, transport and training of retailers in USD 500
Cost in Tshs 647,500
Power rating in kW 0.2 Running time per 24hr day 70% Tariff in Tshs/KWH 200 Required Weekly Costs and Revenues
Cost of electricity is 4,704 per wk Amortization 2,490 per wk Space: 5% at a rent of Tshs 60,000 p.m. 750 per wk Labour 1,000 per wk Maintenance 500 per wk Total cost 9,444 per wk Margin per litre 8% per wk Sales target Tshs 122,654 per wk Daily sales Tshs 17,522 How many packs/day?
UHT – 1lt @ 2,000/= 9 per day Mtindi – 0.5lt @ 700/= 25 per day Yoghurt 0.25lt @ 500/= 35 per day
The idea by some processors to invest is own refrigerators is novel, it is an important strategy in projecting their brands in the market. It is being done by all major beverage producers e.g. Coca Cola, Pepsi Cola, Azam, Kilimanjaro Water, etc. It should be encouraged and supported.
2.2.5 Performance of Distribution from Demand Side (from questionnaires)
2.2.5.1 Visibility of Products and Promotion Product visibility at points of purchase is important because it informs the buyer/consumer about availability, on the overall dairy products in the market are not visible except for UHT milk that does not need refrigeration it is kept on the shelves along with long life juices. It is common though to find UHT milk refrigerated as well either due to lack of knowledge that UHT does not need to be refrigerated by sellers or it is done for consumers who prefer drinking it when cold. Retailers estimated that about 36% of milk buyers consume it near/at point of sale and 64% take the milk home. UHT in 250 ml packs is the product that is mostly consumed at the point of sale.

Survey on Dairy Products Market in Tanzania
29 Niras Finland Oy
Many retail outlets keep cold range dairy products in refrigerators intended for domestic use and most of the “not visible answers came from the type of cooling facilities. The refrigerator contents are usually water, juices, soda, etc. Out of 26 outlets surveyed, 5 had posters, 3 (out of 8) in Arusha for Brookside and 2 (out of 3) in Dodoma for Tanga Fresh. Posters are very effective in informing buyers/consumers on the availability of goods. (At least) in Dar es Salaam it is common for traders to hang empty pouches in their shops to keep customers aware of the availability of goods. This is one area that need to b improved, apart from other factors the goods that are moving faster in Arusha are from Brookside and it was reported that it is Brookside that has more posters.
2.2.5.2 Availability of Goods In Shinyanga most shops at Ngokolo area (perceived to be middle income area) had different types of dairy products mostly imported. This area has many hotels and guest houses and it is in this area where the bus stand is situated which reflects that most consumers of processed dairy products in Shinyanga are people with higher income or travelers. This supports the impact of own-price elasticity of demand for dairy products. Among the recommendations made by Shinyanga traders are lowering of prices of dairy products to attract more consumers, education to the general public and promotion of their products. In Singida dairy products were readily available in the town centre and close to the regional hospital, No any dairy product was seen at Kibaoni area where low-income people live for the shops scanned during the survey. Milk from Singidani Milk Packaging Enterprise (Mtindi) was found in five shops (Out of ten shops scanned) at Sabasaba area which surrounds the processing unit and again it is populated by better off people. None of the processor had posters. They recommend that processors look into the possibility of distributing fresh pasteurized milk as well as implementing promotional campaigns. In Dodoma many town shops had dairy products (Tanga Fresh, Dairy Fresh, Farmers Fresh and Tuzo milk. There are posters of Tanga Fresh, Shambani Milk and DESA in front of shops stocking the products. Traders in Dodoma recommend that prices of dairy products be lowered and education to the general public on the value of processed milk.
Figure No. 2.2.1 Product Visibility at Retail Point

Survey on Dairy Products Market in Tanzania
30 Niras Finland Oy
In Mwanza, Dairy Fresh from Brookside was found to occupy more shelf space for UHT brands in city followed by UHT –KCC and lastly Farmers Fresh/Freshi. Mara sour milk is common in Mwanza, Musoma and Shinyanga. Traders in Mwanza wants processors to pay attention to prices that are deemed high, calls for improvement in quality particularly of Mara Milk and consistency in the supply of their products. It appears the stoppage of production at NMDL was not communicated to retailers as sign of weak processor-retailer link. Arusha is one of the few places where the supply and consumption of dairy products is high, downtown supermarkets are well stocked with dairy products. Retailers interviewed suggested among other things improving efficiency in delivering goods at their shops including the delivered product mix. Processors/distributors do sometime distribute a narrow range of products. Higher prices for dairy products is seen as a problem that constrain sales, they are recommending that prices be lowered to spur consumption. In Musoma the most consumed brands are Victoria and Nyuki milk followed by Mara Milk and Farmers Fresh. Mara Milk (Sour and Yoghurt) were present in many town shops and all supermarkets surveyed in Musoma, Mwanza and Shinyanga.
2.2.5.3 Quality and Losses on Distribution Information from traders indicated that very few customers have complained about quality related problems, while this may seem a health situation it may hide reality because complaining is normally the last option, the most common decision is to switch brands. They reported that quality deterioration before expiry date is common with certain domestic brands. One retailer in Morogoro stopped stocking a brand from Musoma because consumers complained about quality. He cites the effort by a Morogoro processor who did rigorous consumer and retailer survey to understand the weakness of their product and made the necessary improvement. Now, the retailer says, their product is high on consumer’s preference curve. Many processors indicated that losses on distribution are as low as 2 -3%, Brookside indicated to have a programme to train its sales force on how to detect losses caused by the processor in order to accept the liability. They have a policy to recover/exchange products about to expire with fresh ones to minimize losses to the retailer. Other processors have the policy of exchanging expired products but unfortunately the frequency they interact with retailers is relatively low. When asked how many times processors have visited retailers only one (in Musoma) could recall, the rest indicated that they are the sales people who come to look for orders. In Arusha the question was narrowed down to between December 2009 and February 2010, again none of the retailers could remember any processor/representative who visited them. UHT in 250 ml is the product that is mostly consumed at the point of purchase, which means consumers do perceive the product on the basis of either nutritional value, or beverage or both. Musoma and Mwanza dairy wholesalers obtain Dairy Fresh (Brookside) milk and UHT (KCC) milk direct from Sirari border. The Shinyanga wholesalers buy from Mwanza while those in Singida buy from Arusha and those in Dodoma buy from Dar es Salaam.

Survey on Dairy Products Market in Tanzania
31 Niras Finland Oy
Table No. 2.2.4. General Comments by Retailers on How to Improve Distribution
Town Comment Mwanza Sh'nga Singida Dodoma Arusha Total Percent No comment 2 1 1 1 5 18% Reduce prices 1 2 2 2 7 25% Improve consistency of supply for all types weekly 3 3 11% Provide education on value of milk 1 1 2 7% Processors implement promotion 1 1 2 7% There has to be consistency in supply 1 1 2 7% Supply fresh milk, it is missing 1 1 4% KCC should deliver at the shop 1 1 4% Improve Mara mtindi shelf life 1 1 4% Improve quality esp. Serengeti mtindi 1 1 4% Deliver on time 1 1 4% Eliminate middlemen to lower the price 1 1 4% Extend credit period above 7 days 1 1 4% Total 5 5 2 4 12 28 100%
In summary, retailers noted that: - Inconsistency in milk delivery has been noted to be a weakness that influences retailers
which supplier to work with. In Musoma retailers complained that even locally produced products are sometime not delivered on time.
Some products have been found to deteriorate in quality before the expiry date specified on
the pack, few complains from consumers are a good reason for the retailers refraining from stocking the product when there is choice.
Retailers have complained that the price of UHT milk is so high for the consumers to afford,
this is true as price ranges from Tshs 2,400 – 3,000 per litre. See the price elasticity of demand arguments in section 2.1.
Education is needed to the general public on the role of milk in relation to their health, a
promotion campaign should be launched countrywide to sensitize the public to value processed milk.
Processors should provide cold facilities, many shops do not have ability to buy refrigerators
for the purpose of stocking dairy products.

Survey on Dairy Products Market in Tanzania
32 Niras Finland Oy
Government should improve sustainability of electric supply to reduce the incidences of cold range dairy products from spoiling. Where possible, processors should provide cold storage facilities which do not rely much on electricity.
2.2.5.4 Sensitivity to Expiry Date There is no clear pattern on consumers sensitivity to expiry date, certain retailers reported a higher rate while others reported very small rate and on the average about 5.5 out of 10 will bother to look at the expiry date. The remaining 4.5 will consume/buy/take the milk without checking the expiry date. It should be remembered however that consumers are more alert to changes in taste than expiry date, some brands have been reported to get bad before expiry date most likely due to poor handling including prolonged exposure to sun heat between unloading from a truck and putting into a refrigerator, prolonged power outages could be another reason. One solution to this problem is to minimize holding time for these products, however the time between orders depends on how frequent is the milk delivered. Note the higher rate of complain about delivery inconsistence in Table No. 2.2.4 above.
2.3 Milk Processing
On the overall milk processing activities in Tanzania are not well developed, the total operable17 installed capacity attends to hardly 7.1% against about 25% in Kenya. In terms of capacity utilisation still Tanzania lags behind other EAC countries as seen in Table No 2.2.5. Table No 2.2.5 Utilisation of Dairy Processing Capacity in EA (2006)
Kenyai
Ugandai
Rwandai
Tanzania
Capacity in lpd Percent Capacity
in lpd Percent Capacity
in lpd Percent Capacity
in lpd Percent
Installed 1,850,000 100%
510,000 100% 49,599 100%
417,000ii 100%
Used 653,181 35%
352,600 69% 36,899 74% 58,700iii 27%
Idle 1,196,619 65%
157,400 31% 12,700 26% 234,000 73% Sources: i. Heifer, 2008 ii. MMA, 2008. Adjusted by taking out Tanzania Royal Dairy capacity of 90,000lpd from a total
of 507,000 lpd. By December 2009 processors that were operating in the country were processing 88,400litres/day. Mchau,W.K. et. al. reported that in 2007 that the 35 processors operated at between 59,000 - 80,000 liters per day in 2007. Active processors are New Musoma Dairy, Mara
17 The capacity that can be activated without significant investment in machinery and other infrastrcture

Survey on Dairy Products Market in Tanzania
33 Niras Finland Oy
Milk Ltd, Arusha Dairies Limited, International Dairy, Tanga Fresh, Tandairies Limited, ASAS, CEFA and New Tabora Dairy Limited. The following is an account of the processors18. The under utilisation of capacity is caused by among others, underdeveloped milk collection systems and weak technological capacity to manage the machineries. The performance of individual plants is as follows.
2.3.1 International Dairy The International Dairy in Arusha has a capacity of 10.000 l/day and is currently processing 3.000litres/day. There are no processing facilities for UHT milk and the major products processed are:
Mtindi in 500 ml sachets Yoghurt in cups of 250 ml and 500 ml. Real fruits are being used instead of flavours. Cheese. The types being processed are cheddar, mozzarella and feta. The market is divided between Moshi, Arusha, Dar and Zanzibar. The 250 ml yoghurt cups are being procured by airline companies. This indicates a high and sustained quality of the products. There appear not to be any technical problems related to processing but UHT milk was on the other hand not processed. The processed milk has over the past 5 years increased from 1.500 l/day up to 3.000 l/day. It has been a modest expansion but the growth has been persistent over a longer period. This create confidence with both the suppliers of raw milk and not least the retailer/consumer.
2.3.2 Arusha Dairy Plant The Arusha Dairy Plant was established 1996 reaching 4.500 l/day in 2002-2004 but reducing the volume down to present level of 2.000 l/day. The equipment is small scale with a capacity of 500 l/hour installed in 2008. The major products being processed are: Full cream pasteurized milk in 500 ml sachets Low fat pasteurized milk in 500 ml sachets Mala in 500 ml bottles or 500 ml sachets Flavoured and plain yoghurt in 500 ml sachets Gouda cheese 500 g blocks Butter/cream Unpasteurised bulk milk
2.3.3 Brookside The milk processing plant in Arusha is at present closed down but with the equipment still intact. There are no facilities for making UHT products but basically all other products. Installed capacity is approximately 45.000ltrs per shift. The facilities are used to store import of dairy products from Kenya like UHT, mala, cheese and butter. There are similar depots in Mwanza and Dar. 18 Data on trend production being awaited from processors

Survey on Dairy Products Market in Tanzania
34 Niras Finland Oy
2.3.4 Musoma Dairy Plant Musoma Dairy Plant is at present the largest processing plant in Tanzania after Royal Dairy in Dar has been dismantled and Brookside in Arusha has basically turned into a warehouse distributing Kenya dairy products, even though the processing equipment is still present. From 2002 – 2007 it was under receivership and during 2008 – 2009 it has been in operation on a kind of trial basis. From December 2009 until mid February 2010 it had stopped processing until working capital is available and new management team is in place. The overall capacity in a single shift is approximately 40,000lpd. The capacity is divided to a long range of products:
UHT sterilising plant with two aseptic filling machines with planned processing in 250 ml and 500 ml cartons for full cream milk and skim milk.
Yoghurt making facilities with planned production of flavoured yoghurt (strawberry, vanilla, chocolate and plain) in 500 ml and 250 ml gable top packages. To improve the quality of the yoghurt 5 % milk powder is added to the milk. This is common practise in yoghurt making around the world.
Mtindi production
Butter and ghee production. The production of butter will depend of how much butterfat there will be separated in processing of UHT milk. The distribution between butter and ghee will depend on the market situation. With a market price for butter planned on 8.000 Tsh/kg compared to 4.000 Tsh/lt for ghee emphasis should be put on the butter.
The power cuts, which do occur even though more detailed data has not been obtainable, is particular effecting the UHT processing as just a few seconds power cut will cause the plant to close down and start a cleaning and sterilising programme before the processing can start again. This process takes 3 hours. Besides the obvious loss incurred by loosing the valuable processing time there is also the risk that not adequately processed milk will be packed and if not detected by the quality control check it will end at the consumer. To overcome this problem a generator and a UPS system is required but adding to an already expensive processing technology. The original packing material to tetra- pak aseptic filling machines is considerably more expensive compared to Chinese made packing material
2.3.5 Mara Milk The Mara Milk Company started in 1999 but stopped processing in 2002. The capacity of the plant was 900 l/hour. Processing was resumed in 2004 and in 2009 the operations moved to new premises with facilities for UHT production with a capacity of 2,000 l/hour and with a shelf life of 6 months. Unfortunately the equipment is not working and awaiting technicians arriving from China. In addition to faulty equipment there is a problem with power cuts and low voltage due to long distance to transformer. Besides the UHT processing there are the following products being processed: Pasteurised milk Mtindi. For these two products approximate

Survey on Dairy Products Market in Tanzania
35 Niras Finland Oy
Ghee. The raw milk contains 4.8-5.2 % butterfat and the UHT is standardised at 3.5 %, which leaves considerable quantities of cream.
2.3.6 Tanga Fresh Tanga Fresh started processing milk at facilities in Tanga town, but has in 2009 moved out of town to utilize the old TDL factory after extensive renovation and installing new dairy equipment. The capacity is approximately 50,000 lpd in a single shift. Presently 30.000litres/day is being processed. The product mix is: Pasteurised milk in plastic sachets (500ml and 250ml) Mtindi in plastic sachets (500ml and 250ml) Yogurt in cups (250ml and in bulk) Fresh cream in cups (250ml and in bulk) Mozzarella cheese in packages of 2kg and 500g Butter and ghee both in bulk primarily for bakeries.
2.3.7 Tan Dairies Ltd Tan Dairies is one of the few milk processing plants left in Dar supplying a wide range of dairy products like pasteurised milk (250ml and 500ml). Fermented milk (mtindi) is processed as well (250ml and 500ml) and yoghurt (250ml). Mozzarella cheese is processed and the excess cream is made into butter and ghee or sold as fresh cream. The capacity of the plant is 10,000lpd with a present utilisation of 40%.

Survey on Dairy Products Market in Tanzania
36 Niras Finland Oy
3.0 CONCLUSIONS AND RECOMMENDATIONS The following key conclusions and recommendations have been drawn from the findings above, they focus on how to improve milk availability to consumers. Though the major subject was distribution, a number of other conditions have been found to militate against the market performance hence they taken on board.
3.1 Conclusions
3.1.1 Stabilising milk supply in the market It has been found that the first cause of irregular milk supply is seasonality of raw milk supply, unless this challenge is addressed, firms may not be able to improve supply. Some measures being taken by processors to address the seasonality challenge include product mix diversification particularly increasing the share of high value products in the mix such as ghee, butter and cheese to capitalise on oversupply of milk during wet season. UHT has become one of the preferred options, in Mara region there is a capacity for production of about 40,000lts per day by the two processors. Technology improvements (autoclave) can allow more processors to diversify into UHT a lesser investment cost.
3.1.2 Improving Distribution Apparently transport from production to major markets accounts for a small percent of final cost, however given the planned expansion in the Lake Zone any saving will be important. Alignment of production and transport is critical so as to achieve efficient and cost-effective distribution. Hawkers are and will continue to play a dominant role in milk marketing and distribution and giving the formal milk marketing stiff but unfair competition as no quality control is carried out on the product they are selling. The regulatory framework being developed by TDB needs to be given support under the understanding that they in the long run could also market products from processor particularly certified bulk milk.
3.1.3 Firms’ Capacity to Carry Out Effective Marketing It is not very evident from organizational setups of many processors whether it is the market that is driving the business or the products. As reported by retailers that many processors have agents whose primary interest is to “drop” the cartons of the milk at the doorstep of a retailers as indicated by lack of regular visits by people who need to provide feedback to the processors. Now that competition is bound to increase, is very likely to see products from outside taking more market share. One processor said, we have just recruited a commercial manager which implies they did not have one. One processor demonstrates good practice in marketing through a well designed and interactive marketing system whereby the staff train retailers and help to “manage” stocks so as to insulate the retailer against processor related risks. Information system is robust and functioning. This is one area that RLDC need to support the processors.

Survey on Dairy Products Market in Tanzania
37 Niras Finland Oy
3.1.4 Promotion None of the processors has been promoting the products at present because of first lack of financial and production capacity. We have noted imports increasing, they are likely to continue to take the existing market share. In the industry, cases abound where promotion campaign has worked, Tommy Dairy and Cowbell had in the past used media campaign to improve the market position of their products. Right now NIDO is promoting its products through outdoor advertisements. Promotion of such a kind serves both short-term and long term benefits. In the short run it creates awareness while in the long run it builds brand loyalty.
3.1.5 Product Quality Cases of products with poor quality might seem to be low as indicated by retailers, however many consumers may not provide the feedback under the knowledge that the feedback won’t change the status quo. Some retailers (not covered by questionnaires) complained of poor quality of products and packaging. Every processor should aim at long-term market share by ultimately building appealing brands. Brand loyalty is strong among high income consumers (impliedly urbanites), for these whom price elasticity of demand for processed product is low and that they tend not to switch brands fast because savings are not worth the switching risk. It is this fact that maintains some very high value imported dairy product brands in the market because consumers (most expatriates) want to maintain the tastes by consuming home products.
3.1.6 Overall price level On the overall prices for dairy products are high, production cost structure and consumer unfriendly margins are some of the major reasons for relatively higher prices. While this is a topical subject in business (finding the balance between skimming and penetration prices) there is strong call for the actors to do something if they want to remain competitive in the market.
3.1.6.1 Addressing Unfair Practices in Import Trade It is understood those dairy products excluding those “Specially prepared for infants” enjoy a protection from a 60% duty and a VAT of 18% making a protection of 78% of CIF. Taking a packed of UHT and working backward, a price of Tshs 2,500 per litre on a supermarket’s shelves implies that a litre of UHT has a CIF value of Tshs 1,200 per litre. This is a deduction from the following assumptions: - Table No. 2.3.1 Incremental Value in Tshs of Imported Milk Shelf price Percent Index Incremental value
in Tshs Cost
Base price 2,500 Retailer margin 20% 2.08 240.38 2,259.62 Handling 5% 1.88 60.10 2,199.52 Wholesaler margin 5% 1.83 60.10 2,139.42 Duty 78% 1.78 937.50 1,201.92 CIF 100% 1 1201.92
It is difficult to comprehend that a litre of UHT would cost less than Tshs 1,200 CIF Dar. Also noted in the analysis of import data is prevalence of significant quantities of dairy products under
Survey on Dairy Products Market in Tanzania
38 Niras Finland Oy
other “other” categories. It is recommended that the Tanzania Dairy Board (TDB) plan and implement a working relationship with similar authorities in major source countries particularly South Africa, United Arab Emirate, Zimbabwe, etc. to exchange import/export data. This will help to increase the understanding of import levels but most important to provide a fair ground for Tanzania products in the market.
3.2 Recommendations
3.2.1 Stabilising milk supply in the market i.) Short-term In the short and medium term though the seasonality problem will continue to render local processors less competitive and less attractive to retailers as compared to imported milk. It is proposed that TAMPA supported by TDB seek a stop-gap concession to import powder milk for reconstitution during the dry period. This measure should be considered in the light of the competitive advantage that other countries have over Tanzania particularly in countries with highly integrated dairy industry. It is understood that the proposal will raise a number of issues including the EAC Customs and common external tariffs, ability to manage concessional imports so that importers do not abuse the incentive, trade-off between initiatives to support livestock farmers Vs imports, etc. Reconstituted milk could fill the 50% shortages experienced in August through November. Assuming the total capacity by main processor is 180,000lpd and that just 50% of the daily requirements will be imported, this shall increase production by about 90,000lme of powder per day and about 7million lme per annum.
ii.) Medium and Long-term
In order to sustain a regular supply of dairy products through retailers to the consumers it is strongly recommended to improve on the relationship to the milk producers and to develop a commitment from both sides. Such an approach has proven to be successful. With a closer linkage by a processor to an organised group of farmers it will be an easier task to take recommended action to level out seasonal fluctuation in milk intake by price differentiation over the year. The existing model that has been working well is the cooperative one in Tanga. It has to be noted that the sector is strong in Kenya partly because producers are well organized on cooperative model. Good practices in value chain development suggest that strong linkages are facilitated by farmers’ participation in decision making upstream (enhancing transparency thus building trust), actors are encouraged to allow producers have shares in processing facilities. Heifer [2007] notes in a business plan to expand chilling capacity in EAC that
“However, there is more value to farmers to sell their milk to a chilling plant in which they have an equity stake”. [Heifer, Et. Al. 2007]
Fortunately, TFL has successfully been able to build the kind of relationship whereby farmers have equity in the processing plant. MDL and Tandairies have bold plans to build the links. The most unfortunate situation is limited participation of the Government which could have taken this opportunity to work closely with processors through District Agriculture Development Plans (DADPs).

Survey on Dairy Products Market in Tanzania
39 Niras Finland Oy
As price differentiation for raw milk during the year is likely to take some time to disappear, it is recommended that processors adjust the quantities of milk by reconstitution using imported milk powder. The quantities of milk powder to be processed by individual dairy plants will be regulated and depend on documented quantities of raw milk processed per year.
In the long run, availability of cheaper, easy to operate and scalable autoclave technology for production of UHT could increase the production capacity for UHT in the country as a way of improving capacity utilization and distribution of milk to consumers.
3.2.2 Improving Dairy Products Distribution For Lake Zone processor it is very important that they share transport facilities along the Mwanza, Shinyanga, Dodoma, Morogoro and Dar es Salaam route. This is very practical if a third party is contracted to haul the cargo, this implies more business volume to the transporter – a win-win situation.
An intact cold chain is essential when dealing with perishable foods like dairy products. The cost of obtaining the cold chain is significant in the value chain and for that reason it is recommended that a common cold store for all interested processors is established in the outskirts of Dar. As processors are not competing at this part of the value chain they would all benefit from reducing cost in obtaining the cold chain. It is recommended that a cold store is based on models made of 40 feet reefer containers. Such a system is flexible as reefers can be added when needed as well as reduced and sold when not needed.
The business model for processor-facilitated refrigerators is novel. However looking at it from the scale of operations processors in the Lake Zone alone may need about 300 units. It could be very useful if RLDC and TAMPA could work out plan to support an independent company that will own and manage the refrigerators that will be available to all TAMPA member processors. The company can be modelled on a common storage and logistic facility owned by Tanzania Horticulture Association (TAHA) operated on commercial terms. The company can have branches in Dar es Salaam, Mwanza, Arusha, Dodoma, Morogoro to start with.
On hawkers, for general health reasons it is recommended to have the hawkers organised and to establish quality control of the products they are selling. Instead of banning hawkers their network should be utilised for distribution of processed dairy products. With more emphasis on quality of dairy products consumers may change their habits of buying raw milk and go for pasteurised milk and other dairy products, which conveniently could be provided by the hawkers.
3.2.3 Value Addition through Linkage with Smallholder Farmers The relative narrow range of dairy products is closely linked to the high price of more special products like cheese, butter and ghee. A more widely use of these products is likely to occur if prices of for example cheese could compete with the price of red meat. To achieve this it is recommended to develop a technology to process the skim milk left from ghee processing into a firm cheese curd to be stored in concentrated salt brine. This technology would be specially designed for areas with indigenous cattle away from organised milk collection. The processed cheese curd and ghee do not need a cold chain and could be branded and marketed through already established dairy plants in the area. It is recommended to develop processing technologies for above cheese making through institutions like Sokoine University. In addition to find consumer preference for fat content in milk as well as the need for homogenisation.

Survey on Dairy Products Market in Tanzania
40 Niras Finland Oy
3.2.4 Improving Capacity of firms to Undertake Marketing There is a strong need for the processors to put more weight on marketing capacity than production that includes training and re-training managers on marketing strategies in a competitive environment. Other topics include organising and supporting distributors and retailers and market information. For retailers the education could focus on display, storage, hygiene, customer care and information management. The training can be organized in the form of TOT to a group of core workers who in turn will train retailers. It is good if staffs from the head offices are fully involved in the capacity building exercise to learn more about the dynamics of marketing dairy products in the field.
3.2.5 Market Promotion Soft approach to promotion like the use of posters should be given utmost importance, however, it is important that the posters are place at most effective points so it is not a matter of giving the retailers the posters but ensuring they are placed at the right place. Resources are needed to undertake this in terms of money for design, printing and placement. RLDC should look into ways to support these activities. However, more powerful media promotion is bound to bring quicker results, some processors have indicated that they are looking for resources to launch such campaigns using TV, radio and other media, this is plausible and need to be supported.
3.2.6 Improving Product Quality Processors need to ensure good and consistent quality; retailers have mentioned some local brands that have failed on quality such that they hesitate to stock them because they are the ones who interface with the consumers. Certainly quality of dairy products in Tanzania needs to be followed up closely because it is one of the weaknesses that have provided leeway for imported dairy products. This is an area where processors in Tanzania could collaborate, at present TFL has a well equipped lab and has indicated that other processors are welcome to use the facility and this could be a good agenda for TAMPA/TDB.
3.2.7 Stimulating Demand through Appropriate Pricing With high price elasticity for dairy products it is essential to keep the price down to a level acceptable to consumers and being able to compete with imported product. For that reason it is recommended that processors through TAMPA should work together for a common approach towards pricing policy in the industry. Such an approach could be linked with promotion campaign for Tanzanian dairy products educating people on the nutritional value of the products, how it is processed and what would be a reasonable price. This might put some pressure on the retailers to reduce their margin to reasonable levels. Processors can promote yoghurt as a market entry product instead of the current context that it is a high income consumer product. Yoghurt can work as brand-flag-carrier for long term recognition as the main consumers are the children. Successful promotion that targets children is more effective as they wield power in decision making for most urban families.

Survey on Dairy Products Market in Tanzania
41 Niras Finland Oy
A survey in Zambia has found out that yoghurt takes a second place in consumer awareness after the pasteurised milk,98% of the urban Zambians are aware of yoghurt with 62% indicating that they are driven by flavour while health drives the purchase of pasteurised and UHT milk. The survey reports that “Ÿoghurt is more driven by kids’ products than a whole family kind of the product” Synovate, 2009 In Zambia flavoured milk of leading brand retails at Tshs 2,300 per litre while that of average brands sells at Tshs 1,942, compare with Tshs 3,529 in Tanzania. Promotion of yoghurt as a mass product can be a good complement to the school milk programme that will continue to face some practical difficulties to implement in the short and medium terms.
3.2.8 Innovating of Energy Sources Limited access to electricity is one of the factors that constrain the outreach of the cold chain, the even where there is power it is quite unreliable. Efforts to scout for cold chain technologies that use renewable energy is showing some positive signs as they have been demonstrated in some countries. Once proven to be practical they could revolutionalise the industry as they will allow different scales of collection centre and processing at virtually any place in the country.
3.2.9 Some Regulatory and Policy Issues Affecting Competitiveness of Tanzanian Products
3.2.9.1 Taxes Throughout the industry there is a concern on over tax burden for Tanzanian processors which adds cost to packaging materials, spares and parts, transport, etc, the items are zero-rated in Kenya giving Kenyan products a cost advantage. (Refer to Table No. 2.1.7 above). Consultations with TAMPA and TDB indicate that efforts are ongoing to convince the Government to level the business ground with that of Kenya.
3.2.9.2 Minimising the Incidence of Unfair Trade Practices TDB/TAMPA need to establish an intelligence mechanism to monitor unfair trade practices in import trade, part of the strategy should be to have protocols with respective authorities in originating countries on sharing market/industry data. In the medium term, resources should be sought for carrying out a comprehensive study that will look into external trade issues with regard to dairy products within and without EAC with a view of creating a fair competition.
3.2.9.3 Harmonisation of dairy products nomenclature in the country There is a wide variation in defining dairy products by various users something that reduces the reliability of information coming from different sources. While NBS has made significant improvements in the classification of dairy products in its 2007 compared to previous ones, there is still a need to improve upon. A good example is the term clotted milk which in the dairy sector lingua franca is non-existent and the product is consumed by 11.5%. Also a group of product appears as LT/Yoghurt which is not common in dairy business. Another HBS may be about five years away, it is pertinent that TDB and NBS agree on the best way to classify dairy products data in future HBSs since this is the single source of data that can provide the insight of

Survey on Dairy Products Market in Tanzania
42 Niras Finland Oy
household preferences, expenditure and pattern with regard to household consumption of dairy products. This classification should also make sure it synchronises with international classification. Methodologically, HBSs use a national master sample so it is quite representative, it requires households to keep records of all expenses thus improving on reliability of data. And it should be remembered that household market segment is the major driver for the development of dairy industry.

Survey on Dairy Products Market in Tanzania
43 Niras Finland Oy
REFERENCES
Ananda Weliwita, David Nyange and Hiroshi Tsujii. Food Demand Patterns in Tanzania: A Censored Regression Analysis of Microdata. Sri Lankan Journal of Agricultural Economics. Vol. 5, No. 1, 2003.
Daily News. November 23rd, 2009.
Development Associates a/s and PPD Consultants Ltd. March, 2006. Kenya Dairy Sector Value Chain Study (Final Report)
Heifer, 2007. East African Dairy Development Programme: Bill & Melinda Gates Submission for August 2007. Unpublished.
Kadigi, R. M. J., May 2000. Market Review of Dairy (1998/99), Ministry of Agriculture0% and Cooperatives
Mchau, K.W., Balakana, J. Laffa, J., Kilima, Kadigi, R. and Banya, P. December 2007. Improving the Competitiveness of the Dairy Industry through Rationalization of Regulatory Compliance and Cost of Doing Business. TAMPA.
Ministry of Finance and Economic Affairs. Economic Survey 2008. NPC Kiuta. Dar es Salaam Tanzania
Synovate, May 2009. Consumer Retail Study for Zambia Dairy Processors Association. Zambia Dairy

Survey on Dairy Products Market in Tanzania
44 Niras Finland Oy
ANNEX I: LIST OF DAIRY PROCESSING PLANTS
REGION
PROCESSOR INSTALLED CAPACITY
PRODUCTION IN 2009
CAPACITY UTIL
Azam 3,000 2,000 67% Tan Dairies 15,000 6,000 40%
1
D'Salaam Tommy Dairy 15,000 - 0%
Tanga Fresh 50,000 25,000 50% 2
Tanga Amy Brothers 2,000 500 25%
Brookside 45,000 2,000 4% International Dairy Products 10,000 3,000 30% Arusha Dairy Company 5,000 500 10% Mountain Green Dairy 1,500 500 33% Kijimo Dairy Cooperative 1,000 300 30%
3
Arusha Longido Women Dairy Cooperative Women Dairy Coop 1,000 300 30%
4 Mwanza Mwanza Mini Dairy 3,000 500 17% Kagera Milk (KADEFA) 3,000 400 13% Kyaka Milk Plant 1,000 450 45% Del Food 1,000 300 30% Bukoba Market Milk Bar 500 300 60% Bukoba Market Milk Bar-Soko Kuu 500 300 60% Mutungi Milk Bar 800 180 23% Salari Milk Bar 800 170 21% Kashai Milk Bar 800 200 25% Kikulula Milk Processing Plant 1,000 500 50%
5
Kagera MUVIWANYA 1,000 350 35%
New Musoma Dairy Limited 120,000 20,000 17% Mara Milk Limited 15,000 6,000 40% Makilagi SSDU 1,500 1,000 67%
6
Mara Baraki Sisters 3,000 2,100 70%
SUA 3,000 200 7% 7
Morogoro Shambani Graduates 1,500 700 47%
Vwawa Dairy Cooperative 900 600 67% 8
Mbeya Mbeya Maziwa 1,000 1,000 100%
9 Dodoma Gondi Foods 600 200 33% 10 Tabora New Tabora Dairies 10,000 200 2%
ASAS Dairy 12,000 6,000 50% 11
Iringa CEFA 10,000 2,000 20%
Nronga Women 3,500 1,250 36% West Kilimanjaro 1,000 300 30% Mboreni Women 1,000 300 30% Marukeni 1,000 450 45% Ng'uni Women 1,000 350 35% Kalali Women 1,000 440 44% Fukeni Mini Dairy 3,000 1,000 33%
12
Kilimanjaro Kondiki Small Scale Dairy 1,200 600 50%
Total 353,100 88,440 25%

Survey on Dairy Products Market in Tanzania
45 Niras Finland Oy
ANNEX II: RELATION BETWEEN POPULATION AND INSTALLED DAIRY PROCESSING CAPACITY (Source : Various)
One million people 20,000 lpd
Key

Survey on Dairy Products Market in Tanzania
46 Niras Finland Oy
ANNEX III (A): DAIRY PRODUCT IMPORTS BY COUNTRY OF ORIGIN, VALUE AND QUANTITY (2009) (Source : TRA Customs Department)
HS Code Description CIF Value (Tshs.)
Net Weight
(Kg) 0401 MILK AND CREAM, NOT CONCENTRATED OR SWEETENED 470,623,541 855,430 04011000 Milk and cream of =<1% fat, not concentrated or sweetened 470,623,541 855,430 SOUTH AFRICA 266,846,717 650,994 KENYA 154,576,646 103,100 UNITED ARAB EMIRATES 31,075,192 77,866 NETHERLAND 13,146,903 2,100 UNITED KINGDOM 3,456,332 1,220 EGYPT 995,503 20,000 GERMANY 526,248 150
04012000 Milk and cream of >1% but =<6% fat, not concentrated or sweetened 4,753,714,273 3,709,041
KENYA 2,992,885,880 2,419,491 SOUTH AFRICA 1,620,122,886 1,001,584 UGANDA 70,597,521 37,610 UNITED ARAB EMIRATES 67,650,405 244,490 EGYPT 1,982,705 5,500 AUSTRALIA 306,876 1 CHINA 168,000 365 04013000 Milk and cream of >6% fat, not concentrated or sweetened 1,027,558,562 887,868 KENYA 970,016,199 827,334 UNITED ARAB EMIRATES 17,616,353 24,057 GERMANY 14,505,841 432 EGYPT 12,564,995 16,029 UGANDA 6,372,462 3,575 SOUTH AFRICA 4,456,493 15,714 MALAYSIA 1,711,327 527 UNITED KINGDOM 314,892 200 0402 MILK AND CREAM, CONCENTRATED OR SWEETENED 1,509,036,773 2,287,390 04021000 Milk and cream in solid forms of =<1.5% fat 450,811,565 427,959 KENYA 149,391,536 15,719 NETHERLAND 95,266,824 157,801 UNITED ARAB EMIRATES 50,351,960 19,716 INDIA 46,024,315 58,745 UNITED KINGDOM 28,590,986 5,894 SINGAPORE 20,318,785 23,110 MURITANIA 19,983,671 67,383 UKRAINE 11,954,700 15,240 OMAN 11,264,062 38,000 IRELAND 5,993,896 6,442 SAUDI ARAB EMIRATESB 5,519,409 16,650 SWAZILAND 2,799,814 1,898

Survey on Dairy Products Market in Tanzania
47 Niras Finland Oy
HS Code Description CIF Value (Tshs.)
Net Weight
(Kg) SOUTH AFRICA 2,656,166 1,021 ITALY 695,441 340 04022110 Specially prepared for infants 61,943,292 115,157 NETHERLAND 248,970,724 SAUDI ARAB EMIRATES 13,723,924 109,858 INDIA 35,926,682 33,879 DENMARK 33,941,441 6,803 DENMARK 18,407,933 26,052 DENMARK 52,349,374 UNITED ARAB EMIRATES 30,868,978 72,550 MAURITIUS 15,481,187 56,022 IRELAND 14,847,227 60,500 UNITED ARAB EMIRATES 7,963,019 22,595 IRELAND 6,833,405 30,250 UNITED KINGDOM 173,590 38 UNITED KINGDOM 249,380 355 UNITED KINGDOM 422,970 OMAN 4,593,441 16,726 UGANDA 4,097,594 625 EGYPT 3,582,927 27,000 OMAN 3,450,773 13,500 THAILAND 2,753,578 20,000 CYPRUS 2,544,099 1,327 MALAYSIA 1,007,025 3,840 LEBANON 845,122 81 THAILAND 179,372 400 04022910 Specially prepared for infants 96,147,855 127,406 UNITED ARAB EMIRATES 234,133,641 322,040 SOUTH AFRICA 140,287,699 188,110 FRANCE 69,678,380 14,571 INDIA 33,231,033 56,125 DENMARK 25,087,993 8,068 UGANDA 18,847,579 6,200 EGYPT 14,935,992 21,934 KENYA 24,864,126 8,380 IRELAND 12,081,729 45,375 SAUDI ARAB EMIRATESB 10,463,690 4,120 OMAN 3,621,961 EGYPT 2,211,776 7,365 ITALY 1,985,381 300 NETHERLAND 8,199,095 MALAYSIA 700,052 1,139 UNITED STATES 537,574 968 CHINA 389,817 GERMANY 98,517 1 UNITED KINGDOM 320,151

Survey on Dairy Products Market in Tanzania
48 Niras Finland Oy
HS Code Description CIF Value (Tshs.)
Net Weight
(Kg) 0403 BUTTERMILK, CURDLED MILK AND CREAM, YOGURT, ETC 306,723,055 237,836 04031000 Yogurt 116,500,491 32,185 SOUTH AFRICA 27,175,243 15,705 UNITED KINGDOM 58,466,481 7,518 UGANDA 24,872,862 7,292 PORTUGAL 5,416,365 1,304 UNITED ARAB EMIRATES 173,170 216 GERMANY 396,370 150 04039000 Buttermilk, curdled milk and cream, etc (excl. yogurt) 190,222,564 205,651 KENYA 129,652,167 145,096 SOUTH AFRICA 40,170,120 30,341 UNITED ARAB EMIRATES 14,411,227 22,200 UNITED KINGDOM 3,718,879 1,854 EGYPT 1,399,895 5,500 CHINA 777,354 238 SYRIA 92,922 422 0404 WHEY AND OTHER NATURAL MILK CONSTITUENTS, NES 149,928,577 196,449
04041000 Whey & modified whey, whether or not concntrtd or contng sweetening matter 93,603,936 43,232
POLAND 90,123,628 41,000 NETHERLAND 3,373,260 2,212 AUSTRALIA 107,048 20 04049000 Products consisting of natural milk constituents, nes 56,324,641 153,217 PAKISTATESN 51,793,000 151,091 UNITED ARAB EMIRATES 2,587,818 1,103 NETHERLAND 1,943,823 1,023 0405 BUTTER AND OTHER FATS AND OILS DERIVED FROM MILK 448,084,678 129,531 04051000 Butter 404,136,322 96,104 UNITED ARAB EMIRATES 341,222,989 23,292 KENYA 30,513,303 5,340 SOUTH AFRICA 12,529,827 3,119 IRELAND 6,538,050 8,194 YEMEN 6,021,963 27,665 SINGAPORE 4,865,448 19,655 INDIA 1,166,433 2,229 DENMARK 658,740 200 OMAN 577,737 5,700 CHINA 41,832 710 04052000 Dairy spreads 16,721,687 3,783 KENYA 10,621,734 1,980 SOUTH AFRICA 4,689,325 60 UNITED ARAB EMIRATES 1,410,628 1,743
04059000 Fats and oils derived from milk (excl. butter and dairy spreads) 27,226,669 29,644
IRELAND 8,726,873 4,524 UNITED ARAB EMIRATES 5,697,480 5,871 UGANDA 5,099,750 960 SWITZERLAN 4,503,709 15,347

Survey on Dairy Products Market in Tanzania
49 Niras Finland Oy
HS Code Description CIF Value (Tshs.)
Net Weight
(Kg) SOUTH AFRICA 2,229,298 889 INDIA 638,252 1,052 OMAN 329,176 1,000 AUSTRALIA 2,131 1 0406 CHEESE AND CURD 521,344,555 246,512
04061000 Fresh (unripened or uncured)cheese, including whey cheese and curd 521,344,555 81,104
UNITED ARAB EMIRATES 261,020,329 SOUTH AFRICA 104,664,785 UNITED KINGDOM 62,816,935 KENYA 27,252,682 IRELAND 22,915,740 20,409 NETHERLAND 15,502,090 2,174 ITALY 12,279,997 11,663 NEW ZEALAN 10,325,132 20,600 FRANCE 2,051,646 LEBANON 716,647 184 GERMANY 662,912 61 UNITED STATES 466,766 24 INDONESIA 342,979 500 INDIA 325,915 1,319

Survey on Dairy Products Market in Tanzania
50 Niras Finland Oy
ANNEX III (B): IMPORTS OF DAIRY PRODUCTS, BY VALUE AND QUANTITY; 2004 - 2009 (Source : TRA Customs Department)
2004 2005 2006 2007 2008 2009 PRODUCT CODE AND DESCRIPTION
Tshs Mt Kgs Mt. Tshs Mt. Tshs Mt. Tshs Mt. Tshs Mt.
0401
Milk and cream, not concentrated or
sweetened 1,391.68 2.143 1,670.28 2.217 2,194.10 2.703 2,909.21 4.533 3,250.72 4.477 6,251.90 5.452
0402 Milk and cream, concentrated or sweetened 26.28 1.858 15.13 1.768 1,305.71 2.756 1,551.66 2.382 1,153.18 1.717 1,509.04 2.287
0403
Buttermilk, curdled milk and cream, yogurt,
etc 78.50 0.032 67.40 0.045 72.15 0.048 558.52 0.239 298.71 0.235 306.72 0.238
0404
Whey and other natural milk constituents,
nes 26.28 0.031 15.13 0.034 62.48 0.028 253.43 0.088 134.52 0.065 149.93 0.196
0405
Butter and other fats and oils derived from
milk 225.55 0.170 224.75 0.177 355.74 0.240 556.99 0.168 496.80 0.462 448.08 0.130
0406 Cheese and curd 436.82 0.166 521.27 0.241 534.32 0.202 730.72 0.327 481.43 0.256 521.34 0.247

Survey on Dairy Products Market in Tanzania
51 Niras Finland Oy
ANNEX IV: TYPES OF DAIRY PRODUCTS CONSUMED (Source : HBS, 2007) Fresh milk Fermented Milk Canned (Packed) milk Cheese and curd Region Urban
/Rural Percent Region Urban
/Rural Percent Region Urban
/Rural Percent Region Urban
/Rural Percent
Mtwara Rural 100.00% Rukwa Rural 81.818% D'Salaam Urban 1.148% Tabora Urban 0.383%
Ruvuma Rural 100.00% Mbeya Rural 59.012% Mara Urban 0.787% Iringa Mixed 0.133% D'Salaam Rural 98.99% Kigoma Urban 58.712% Ruvuma Mixed 0.769% D'Salaam Urban 0.013% Lindi Mixed 98.41% Rukwa Mixed 54.222% Mwanza Urban 0.709% Average 0.078% Rural 98.39% Tabora Rural 53.201% Tabora Mixed 0.355% Pwani Mixed 97.64% Singida Rural 39.303% Tanga Urban 0.236%
Arusha Rural 96.98% Dodoma Rural 37.652% Mwanza Mixed 0.189%
Manyara Rural 96.88% Manyara Mixed 31.717% Morogoro Mixed 0.114%
Dodoma Urban 96.70% Iringa Rural 30.964% Arusha Mixed 0.055% Ruvuma Mixed 96.54% Mbeya Mixed 27.710% Average 0.078% Mara Rural 95.98% Manyara Urban 22.703%
Mixed 94.64% Tabora Mixed 20.567% D'Salaam Mixed 93.73% Morogoro Rural 20.000% Arusha Mixed 92.95% Mbeya Urban 19.837% Dodoma Mixed 92.11% Mwanza Mixed 19.811%
Morogoro Mixed 91.92% K'njaro Rural 19.763% Mara Urban 91.34% Singida Urban 18.367%
Iringa Mixed 91.10% Kagera Rural 18.125% Source: HBS 2007: NBS

Survey on Dairy Products Market in Tanzania
52 Niras Finland Oy
ANNEX V: ABRIDGED TERMS OF REFERENCE RLDC has selected several sub-sectors that are important for the central regions for market assessment and potential future interventions. One of the selected sectors is the dairy sector. Market assessment and analysis have been carried out and are summarized in the dairy sub sector development strategy. Central findings of the dairy strategy are: There is an unsatisfied demand for processed milk and dairy products in Tanzania In consequence there is an unsatisfied demand for raw milk supply from the processors in the country The Central Corridor with its large number of cattle is currently weak in the sector, mostly informally
organized markets with a large untapped potential of milk production. RLDC has commissioned detailed study (milk pocket study) in the Central Corridor to identify potential areas with large production. The findings of the study have been shred with stakeholders and triggered interest of processors.
The central aim of the diary strategy is to link the identified untapped milk production in the Central regions to formally organized milk collection and processing in and outside the region which can unleash an opportunity for the cattle keepers in the region
It is against this background that RLDC has set apart a matching fund and has called for expression of interest. Different proposals from various potential partners in the dairy processing industry were received and discussed with them. All processors are confirming the growing demand for dairy products in the country. Their focus is very much on getting more milk for the processing, but none of them has to date worked out a company’s marketing plan for their business expansion. Meanwhile RLDC has also entered into an agreement with the TANZANIA MILK PROCESSORS ASSOCIATION (TAMPA) to support them in activities to improve and enhance the business environment for the dairy sector. One agreed activity amongst others is to carry out a market survey of the dairy sector which will help their members to draft marketing strategies for their products based on reliable market data for the overall dairy market in Tanzania. Many studies and surveys have been carried out in the country, but most of them are production based and do not give the required market information on current sales and distribution channels for dairy products. Basic data of the dairy market in Tanzania are missing; its size (quantity and value), distribution forms and channels are estimated, but not based on a throughout survey. It is against this background that RLDC want to commission a study on the current state of the dairy market in Tanzania and its potential for future growth and expansion. Objective of the dairy market survey Market structure; Milk distribution channels and main market actors in processing and distribution
(whole selling and retailing).
Quantity and value of processed diary products sold in Tanzania as per market segments in the last 5 years.
Importation and exportation of dairy products and related market actors.
Dairy processing industry: their current business and capacities.
Consumption: Consumer groups and consumption patterns for dairy products.

Survey on Dairy Products Market in Tanzania
53 Niras Finland Oy
Suggestions on promising marketing strategies in the Tanzanian Expected Activities Pre-briefing with RLDC Preparation of study through desk study of available information; contacting relevant actors and
additional sources of information, Submit working plan to RLDC Preparation of the mission and field work Carry out survey:
- Meeting and interviewing relevant actors (processors, importer, distributor, retailers) - assess market data and make estimates of overall market size according to channels and market segments
Prepare draft report and present findings and recommendations to RLDC (debriefing) Finalize report and recommendations
Deliverables Detailed offer for survey, incl. approach to be taken and CV of consultant(s) Pre-briefing with RLDC Work plan for the study and mission Draft report and debriefing with RLDC Final report

Survey on Dairy Products Market in Tanzania
54 Niras Finland Oy
ANNEX VI: TOOL USED TO COLLECT INFORMATION FROM RETAILERS
Tanzania Milk Processor Association
(TAMPA) A Market Survey for Dairy Products in Tanzania
RETAILERS
Name of Respondent (optional) _____________________________________________ Date ______
1. Location of the interview
Street/village___________________________________ Ward __________________ District _______
2. Business Particulars
2.1 What is the type of business _______________________________________________________
2.2. What is the involvement in dairy products ___________________________________________
2.3 Observe and explain how visible dairy products are.
3.4 Is there any poster about dairy products outside? Of which processor?
3. Products being sold by the respondent
Type of and size of dairy product (generic – fresh, UHT, mtindi/mala, yoghurt, cheese, butter, ghee, etc)
Brand name Packaging type and size
Tetrapak, pouches, cups, nylon wrap
Price in Tshs
Who supplies
E.g.Morani Fresh 500mls
Morani Pouches 700 Agent-Maziwa Bora Ltd

Survey on Dairy Products Market in Tanzania
55 Niras Finland Oy
4. What losses you encounter in dealing with dairy products
4.1 Type of losses and extent
Type of dairy product (generic – fresh, UHT, sour milk, yoghurt, cheese, butter, ghee, etc) and brand name
Type of losses e.g. leakage, poor quality on delivery, expiry, under delivery by suppliers, etc.
Estimated loss value (say out of ten, how much will be lost)
E.g Morani - Fresh 500mls, Packet bursting 3 in 100 pkts
4.2 For each loss mentioned above, what happens thereafter?
4.3 Out of ten buyers, how many would check the expiry date before taking the goods?
4.4 How many consumers complained to you about poor product quality/package between January 1st , 2010 and now?
4.5 Which product/brand is mostly complained about poor product quality/packaging?
4.6 Do you have a policy/arrangement to allow returns in case of quality problem?
4.7 If yes to the above question. Who bears the burden of the returns?

Survey on Dairy Products Market in Tanzania
56 Niras Finland Oy
5. Buyers Pattern
Look at your buyers for each of the product, can you estimate out of ten buyers those who :
Type of dairy product (brand name and size)
Who buy and consume right at the shop or elsewhere but not at home.
Take home for family use
Re-sale
Restaurant
Schools and other inst.
Other -mention
What is the average quantity they will buy in a day, week or month?
Type of dairy product and brand name
Who buy and consume right at the shop or elsewhere but not at home.
Take home for family use
Re-sale
Restaurant
Schools and other inst.
Other -mention

Survey on Dairy Products Market in Tanzania
57 Niras Finland Oy
6. Facilities available for dairy products
6.1 What facilities are there and what is their condition for storing cold range dairy products?
6.2 Are they dedicated or used with other things as well? If not dedicated what other things are kept in the same facility?
6.3 How adequate are these cooling facilities with respect to volume of your dairy business/products?
6.4 How did you finance the cooling facilities?
6.5 Is there any support you receive from processor
In terms of facilities?
In terms of training?
6.6 How many times have staff from processors (that you sell their products) visited you between December 1st 2009 and now?
If they visited, What issues did they address?
What issues did you raise?
7. Purchase arrangement
For each of the main product ask the following questions?
7.1 Do you go to buy the dairy products from the processor? Distributor? Another retailer?
7.2 If you go to collect the products, How far is it from your shop in Kms?

Survey on Dairy Products Market in Tanzania
58 Niras Finland Oy
7.3 What kind of transport do you use?
7.4 How much does it cost per unit?
7.5 What is the average quantity you purchase per day/week or month for each product (specify size e.g. 500ml packets, 250gm, etc.)
Type of dairy product, brand name and size Quantity per day in … units
Quantity per week in … units
Quantity per month in … units
8. Milk handling
8.1 When the consignment arrives at your shop, how long (in minutes) does it take to move from the truck to the required cold place?
8.2 Does your supplier offer sales on credit? If yes, Credit of how many days?
9. What should be done to improve distribution of dairy products particularly those from local processors?

Survey on Dairy Products Market in Tanzania
59
ANNEX VII: COMMENTS MADE BY PARTICIPANTS ON THE REPORT A Presentation to Stakeholders at
Morogoro Hotel, Morogoro 23 April, 2009
General Comments
On the overall the meeting had accepted the report to be informative, they however recommended the following improvements: -
Comment No.1. There is limited support to the dairy sector from the Government despite the potential of the sector, instead there is an open bias towards beef sub-sector whose impact and sustainability is limited if compared to dairy sub-sector. Efforts are needed to raise awareness of the government and sensitize them to support the dairy industry because even when stakeholders invite officials from the Ministry their response and participation is below expectations. A good example is the fact that all the extension officers from LGAs that were invited to this workshop did not turn up. Even the Tanzania Dairy Board was not represented at the workshop.
It was noted that part of the reasons for ineffective interaction with the Government is the understaffing of the TDB which is a key link between the private sector and the Government. In a bid to ameliorate this shortcoming RLDC has funded the recruitment of senior personnel hence TBD efficiency is expected to improve soon. Further, RLDC will support a learning visit by TAMPA and the Board to emerging dairy industries in Rwanda and Uganda. The two countries are on scaling up path and therefore has relevant lessons than Kenya which is a mature and well integrated sector.
Workshop’s Response: The problem of low Government profile in the development of the sector needs to be discussed further in groups.
Action: Participants discussed some strategies to enhance PPP in the dairy sector. See Group No One notes below.
Comment No.2. Why Southern Highlands had not been covered in the Study?
Consultant’s Response: The assignment had very limited timeframe and budget, the Consultant had planned to visit Iringa but failed due to deadlines and budget constraint.
Comment No.3. How is the quality of UHT coming to Tanzania? Does it come from raw milk or reconstituted?
Response from an informed participant: A considerable amount of UHT in the market comes from reconstituted milk, for example Parmalat Zambia reconstitutes milk for its Zambia market,

Survey on Dairy Products Market in Tanzania
60
it is integrated backward to a parent a parent company that makes powder milk. Almost all brands from countries with limited cattle population e.g. United Arab Emirate, Egypt, Mauritius supply UHT from reconstituted milk.
Comment No.4. Recast the data at market level in the sub-sector map (PowerPoint presentation No 22), the volumes don’t tally with data at production level.
Consultant’s Response: To be recast
Action: The data has been updated in the Final Draft Report.
Comment No.5. Do we know how efficient are factories in delivering dairy products i.e. time it takes from factory to deliver to retailer and expiry dates? In some countries they have instituted regulations that require provide little room for products from outside the country to discourage imports hence protect local processors.
Consultant’s Response: To be reviewed from the data available/collected because the scope of the work might not allow the Consultant to get into the field.
Action: The review had been limited to data from retailers on consumers’ sensitivity to expiry date.
Consultant’s Opinion: Cold range dairy products from outside Tanzania are common in border cities like Arusha, Mwanza, Musoma, etc, they are largely from Kenya. Distance disfavours products from distant places getting to Dar es Salaam market. The use of expiry date to fend off imports pre-supposes that local processors are efficient, verification of this hypothesis was not part of this study we therefore propose that a separate detailed study be considered.
Comment No.6. When I joined TAMPA I had expected that the association will provide tangible support to its members, instead they are the members who are supporting TAMPA, this is a disincentive to members.
TAMPA Chairman’s Response: TAMPA has done a number of things that has led to improvement in the business environment, they include waiver of VAT on main dairy products. TAMPA has submitted a number of proposals to be studied by the Government for action. It has carried out a number of studies that has been the basis for dialogue with the Government, it is planning a common facility and service centre in Dar es Salaam, etc. The sector still faces a myriad of constraints and it is important that members recognize the limited capacity in terms of manpower and facilities under which the association operates.
Comments from other participants: While TAMPA members have the right to demand support from the Government, much of the success rests in their own drive to contribute for the wellbeing on the Association. Once TAMPA members demonstrate their commitment it is easier to attract support from outside.

Survey on Dairy Products Market in Tanzania
61
GROUP DISCUSSIONS
Group No. One: How Can We Engage the Government Effectively in the Development of the Dairy Sector?
The study had established that the dairy sector faces some challenges that can not be addressed without involving the Government, for example, the problem of seasonality of supply of raw milk. Even if other market development interventions will be implemented if production by smallholders can’t guarantee supply during lean months it will be difficult to realize business objectives by the firms. Apart from support to farmers, there are several issues that need to be handled at Government level, e.g. infrastructure, taxation issues, regulation of the sector, etc.
This agenda was discussed by Group No. One which recommended the following: -
1. Dairy stakeholders including TAMPA, TAMPRODA, and TDB should continue to conduct studies that will provide facts about opportunities and constraints facing the sector as the basis for self-improvement by the actors, for dialogue with the government and for attracting investment from private sector and development partners. This study for example recommends an assessment of whether there is fair competition between imports and domestic products because despite the tariff barriers in place, imports still compete favourably with domestic products in terms of consumer price. Some of the positive points to argue for support are improved health, increased tax base, employment and rural poverty reduction,
2. At present there is limited engagement with LGAs, dairy sector actors i.e. TAMPA,TDB, TAMPRODA and other interested parties should recognize the strategic importance of LGAs in addressing key issues all across the dairy spectrum including organization of farmers, financing local dairy common facility centres that can provide technical and marketing services, building the capacity to access finance, etc. It had been noted that despite its potentials, the dairy sector has not benefitted much from District Agriculture Development Plans (DADPs) and District Agriculture Sector Investment Project (DASIP) funds because of weak engagement with the local governments.
3. TAMPA should continue to lobby with Government so that the sector is accommodated as a priority sector under Kilimo Kwanza and MKUKUTA II considering its strategic role in poverty reduction for dairy farmers, improvement of health due to improved distribution hence consumption of healthy dairy products, (rural) employment and import substitution. The government should be courted to support direct investment in the sector particularly infrastructure such as roads, electricity, cooling centres, etc.

Survey on Dairy Products Market in Tanzania
62
4. More concerted effort should be made to convince the Government to remove a number of taxes and regulations that render the sector less competitive.
5. The Government should be sensitized to make deliberate effort (technical and financial) to support associations/cooperatives like TAMPA to build their capacities in the course of developing the Dairy sector.
6. Government, through media and regulations, should promote consumption of domestic milk drinking culture in all its institutions e.g., Government offices, schools, hospitals, etc. This will be in consonance with recent Finance Bill that calls for all Government offices to buy Tanzanian furniture, TAMPA should seek this directive to be extended to milk.
7. TAMPA should lobby with the Government to have regularized forums to review, analyze and discuss issues facing the sector at a higher frequency than the current situation. Although these forums exist, efforts should be made to strengthen the effectiveness of National Dairy Council and enhance accountability.
8. The dairy private sector, the Government and development partners should work to develop a National Dairy Sector Development Policy and a Strategy to bring about responsibility and accountability in the development process. The Policy and Strategy should be premised on Livestock Policy, Agricultural Marketing Policy, MKUKUTA II, Kilimo Kwanza and Vision 2025. Since the Government uses a participatory approach, the private sector could take a lead in initiating the concept papers.

Survey on Dairy Products Market in Tanzania
63
Group No. Two: How Can We Improve Cost Competitiveness in Dairy Value Chains?
The study had established that Tanzania dairy sector, apart from limited support from the Government, faces a challenge of higher cost of operation, for example the study has indicated that a litre of mtindi is expensive to make and distribute in Tanzania by more than 50% compared to Kenya. Furthermore, the study has established that dairy products have unitary own price elasticity of demand implying that any saving from operating costs that is passed to consumers could improve demand. This issue was discussed with Group Number Two which observed and recommended the following: -
Managing Costs that are Under the Firm’s (Micro) Control
1. Improving Economies of Scale: Diseconomies of scale of Tanzania dairy firms is among the major reasons for higher unit cost. While this challenge can not be addressed in a short run, investors should be aware of the need to scale up operations in order to benefit from economies of scale. Whenever collaboration does not conflict with competition, firms should strive to make joint investment in order to benefit from lower operating costs.
2. Proper Management and Innovation on Energy: Actors in the dairy value chains should to explore for alternative energy technologies in their industrial setups. There are indications that milk collection centres can sustainably and cost-effectively run by renewable energy from solar, biogas and wind. What is needed is for TAMPA members in collaboration with the Board, the Ministry of Energy and Minerals (especially the Rural Energy Agency - REA), the Prime Minister’s Office responsible for promotion of cleaner energy, etc. to continue to research on alternative energy.
Alongside innovative sources of energy is the regular factory energy audit, Tanzanian firms are losing a considerable amount for energy because of poor energy management skills and technologies. Firms need to make regular audit to establish if they use energy efficiently, energy utilization good practices need to be instituted benchmarked from similar plants elsewhere.
3. Adoption of Low Cost Sterilization Technology. Autoclave technology is used to sterilize milk and other products at a lower cost than conventional technologies. When scaling up processors should explore the possibility of using Autoclave technology.
4. Minimizing Costs through Joint Sourcing: One area that TAMPA members could work together is in sourcing of packaging materials, most suppliers will offer significant discounts against higher volumes. Factories in Tanzania could place order from a single source on condition of attracting the discounts, each member could submit a pattern of its label to the supplier and thereafter the cargo shipped jointly. SIDO has been purchasing bottles in bulk

Survey on Dairy Products Market in Tanzania
64
on behalf of SMEs to make quality packaging materials accessible to SMEs who thereafter puts their labels.
5. Minimizing Costs through Joint Distribution: A considerable part of distribution channels can be done jointly reducing per unit costs, improving delivery frequency to agents without hurting competition. A good example will be processors in Musoma shipping cargo to Dar es Salaam or those in Arusha shipping to Dar es Salaam, etc.
Within the same context TAMPA is looking forward to set up a “Dairy House/Park” on the outskirts of Dar es Salaam which will act as a one stop area for milk storage and distribution point. The idea is novel since the Government plans to ban large trucks from entering into the city centre. It is anticipated that the Park will improve access to Tanzania dairy products by buyers from within the and outside the country.
Dealing with Exogenous (Macro) Cost Factors that Constrain the Industry
6. Reduction of Taxes on Packaging Materials, Equipment and Some Dairy Products: TAMPA should continue to lobby with the Government for the removal of VAT on packaging materials and other dairy products coming from domestic firms (e.g. yoghurt).
7. Using the Value Chain Approach to Gain Sector wide Efficiency.: Efficiency in the sector should not be the domain of processors only but be addressed in the context of value chain, supply of soft- and hard- technical input into milk production (extension services, technologies, business skills, etc.), milk producers (TAMPRODA), infrastructure providers, policy and regulations makers (the MLDF, TDB, TFDA, TBS, etc.), processors, and development partners. Given the strategic importance of processors in the development of the sector, TAMPA should seek more representation in the Annual National Dairy Council meeting. The sector is over-regulated, there is a need to streamline the regulations to lower the cost of doing business.