rural environment
TRANSCRIPT

RURAL MARKETING ENVIRONMENT
Presented By:Ashish KajlaMBA General13101022
1
A Case
The life of a farmer, K.T. Srinivasa, has changed recently, though the two dirt roads near his home about 40 miles from India’s high-tech capital of Bengaluru, his house without toilet facility, farm without tractor support and the way in which his family threshes rice by crushing it with a massive stone roller, have remained the same. How?
2

The change has been brought about by a cell phone. The little, attractive gadget is helping him make decisions related to farming. When to plant and harvest, at what price to sell the produce and how and when to transport and sell-all these intriguing questions are now resolved intelligently. Idea Cellular, Mr. Srinivasa’s service provider, has effectively utilized its first mover advantages.
3

Contd.
Close to half the 800 people in the village, including Mr. Srinivasa, have become its subscribers. Most of the villagers make voice calls as they don’t know how to text message or download e-mails.
On an average, rural Indians use their phones around 8.5 hours a month, up by 10 percent over the past year.
4

The villagers are very amused with their new found connectivity with the world.
They are now aware of the people and events affecting the rest of India and the world.
They can answer quiz questions such as who is America’s President and why there is an economic slowdown.
They have understood that recession is hurting their hi-tech neighbors in Bengaluru much more and that the Indian economy is able to absorb the shocks much better than other developed nations.
This is an example of one of the many changes in the rural environment that we have had a profound impact on rural lives.
5

Need To Study The Rural Environment
Consumer decisions and actions can be properly comprehend only when the force field in which they are operating is understood.
Study of environmental factors is important for marketers to realize the developments and trends rather than know the static picture of the environment.
Today’s decisions are not only for current problems but also for future opportunities, performance and results.
6

Rural Environment
Social Environment – Population and households, education and literacy levels, social groups, festivals and melas, entertainment and arts.
Technological Environment – Power and energy sources, postal services, telecommunications, information and communication technology, appropriate technology and innovations.
7

Rural Environment
Economic environment – Occupations, land distribution, land use pattern, irrigation, asset holding, income, consumption, savings, disposable incomes, rural lifestyles and sales potential, rural credit institutions, rural retail outlets, micro financing and rural industry.
Political Environment – Development initiatives and administrative bodies.
8

1. Demand Estimation
2. Segmentation and target marketing
3. Product decision
4. Price decision
5. Place decision
6. Promotion decision
1. Demographics (size and distribution of population by age, gender, occupation, education, geographic areas, income, savings and investment.
2. Demographics, lifestyle indicators, purchase and usage of inventories.
3. Income, quality consciousness, brand awareness, preference of consumers and competition.
4. Disposable incomes, propensity to consume, competition, demand etc.
5. Availability of trade channels, physical distribution facilities, competition and location.
6. Media availability and costs, media habits of target customers, competition etc.
Marketing decisions and environment
9

Demographic Environment
Though the rural proportion in population has come down moderately over the years, there has been a considerable increase in absolute number of people living in rural areas.
With the increased working population, the purchasing power of the rural population has gone up from 40% in 2001 to 45% in 2014.
For marketers, the largest age group shapes the marketing environment. In the case of rural, it is school going children and young adults who define the consumption patterns of consumables and lifestyle products.
The potential for marketers in the rural sector can be assessed by the fact that 48% of the rural population is below the age of 20.
10

Education and the level of demand
Lower levels of education in the rural sector lead to little or low demand for a range of products such as literary books, magazines, notebooks, pens, pencils, drawing instruments, calculators, computers etc.
But change is taking place because literacy rate in the rural sector has risen 23% over the last 20 years. This has contributed significantly to an improvement in the socio-economic status of the people.
With this growth, the demand for educational products has increased.
11

Distribution of households by Occupation of the Head
Head’s Occupation
Urban Rural
Housewife 0.84 1.01
Cultivator 3.45 40.86
Wage Earner 20.93 35.28
Salary Earner 40.72 11.28
Professional 3.59 0.73
Artisan 6.90 3.41
Petty Shopkeeper 16.05 4.97
Businessman 3.68 0.46
Others 3.85 1.98
12

Occupation Pattern
3/4th of rural household heads are either cultivators or wage earners
The cultivator’s disposable income is highly seasonal, with more disposable income available immediately after the harvesting season. This is therefore the time when he is more inclined to make purchases, especially of durables and high-involvement products.
13

Household Pattern (Family Structure)
Rural households have grown by 26 million during the last decade.
The traditional households in rural were joint families, in which a group of people lived under one roof, ate food from common chulha, held income and property in common and were related to each other by bonds of kinship.
But with rise in population and resulting pressure on land and several other socio-economic factors, joint families are now breaking apart and moving towards nuclear family culture.
14

With the increasing number of ‘individualized joint’ (families stay in the same house, but use separate kitchens) and nuclear families, the range and number of branded products coming into the family can increase.
Size of Household Rural Urban
1-2 members 11.1 10.7
3-4 members 30.4 38.8
5-6 members 34.0 32.8
7 and above 24.5 17.7
Household size
15

Rural Housing Pattern
The types of houses in rural areas are a very strong indicator of economic growth.
Over the last twenty years, the trend in house types has changed dramatically from less permanent semi-pucca or kuccha to more permanent pucca types. Today, 40 percent of rural houses, i.e. 50 million are pucca, which is growing at a rate of almost 5% annually.
Statistics indicate that the owners of such houses possess sufficient disposable income.
16

Estimates of Incomes
Urban Rural All India
No. of earners per household
1.34 1.43 1.4
Income(Rs/annum/household)
95,827 51,922 65041
Poverty Ratio 18.7 21.7 20.8
Per capita income 19,935 10,227 13018
Population below poverty line
55.2 159.0 214.2
17
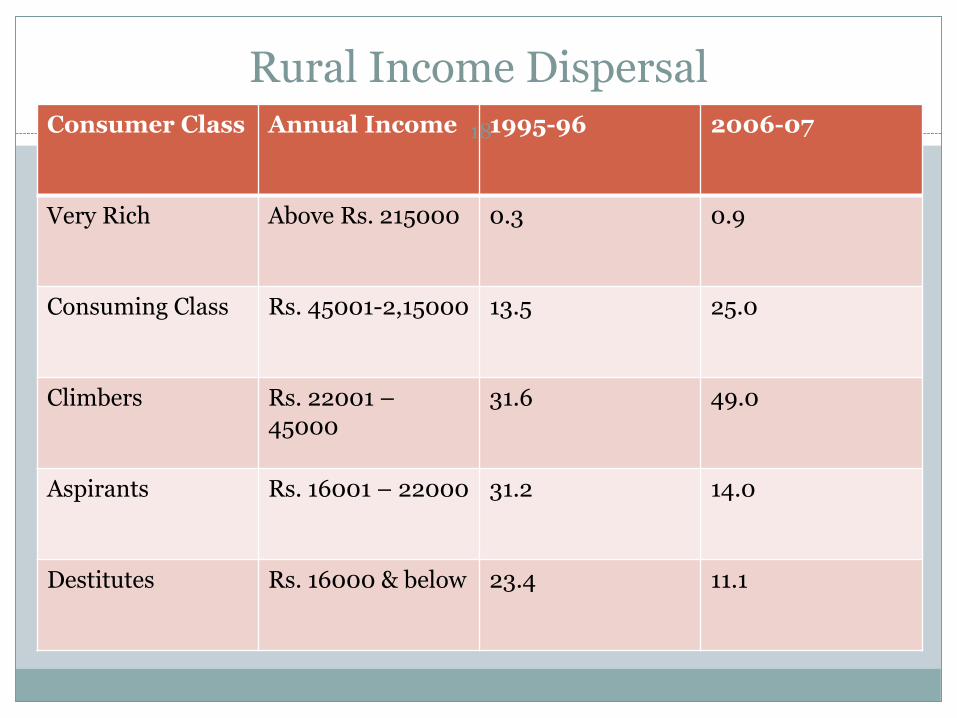
Rural Income DispersalConsumer Class Annual Income 1995-96 2006-07
Very Rich Above Rs. 215000 0.3 0.9
Consuming Class Rs. 45001-2,15000 13.5 25.0
Climbers Rs. 22001 –45000
31.6 49.0
Aspirants Rs. 16001 – 22000 31.2 14.0
Destitutes Rs. 16000 & below 23.4 11.1
18

Income Generation
By sale of agricultural produce
By sale of animal produce
By service – Rendered by teacher, doctor or nurse.
By interest on investment
Government subsidies and grants
By mortgage of properties and gold
By charities and donations
By labour and wages – Labourers do jobs in construction of roads, bridges and buildings.
19

Three Major Revolutions in the Rural Technological Environment
Green Revolution in the Agricultural Sector
Period from 1967 to 1978 heralded a technological thrust into rural areas aimed at improving food grain production in the country and hence achieving food self-sufficiency.
The modernization and mechanization of the farm sector boosted farm productivity, triggered industrial growth, created jobs and initiated a change in the quality of life in villages.
20

White Revolution
Initiated by the government with the aim of achieving self-sufficiency in the area of milk production.
Cornerstone of the government dairy development policy was producing milk in rural areas through producer cooperatives and moving processed milk to urban-demand centers.
21

The NGO Movement
Government programmes implemented through NABARD, CAPART, KVIC and others are given shape by these organizations.
Introduction of low-cost spindles, weaving machinery, technology for leather processing, food processing, natural resources management etc have been some contributions in bringing about change at the grassroots.
NGO’s have been also active in providing basic health and child care services, running homes for destitutes and the distressed and providing education and training opportunities.
22

Problems in Rural marketing
Unevenly Scattered Population
Underdeveloped People and Underdeveloped Market
Lack of proper Physical Communication Facilities
Low per capita incomes
Many Languages and Dialects
Low level of literacy
Logistics Problems
Low Exposure to Market Stimuli
Traditional Life
23

Rural Areas Requirement
Improved seeds and fertilizers
Increased means and methods of irrigation
Multipurpose farming
Use of modern farming equipments and methods
Warehousing and preservation of agri-produce.
Marketing development and remunerative prices for the produce
Improvements in pest control and preservation of crops.
24

25