running the electric meter backwards: real-life experience...
TRANSCRIPT

Running the Electric Meter Backwards:
Real-Life Experience with a Residential
Solar Power System
Brooks Martner
Lafayette, Colorado
University of Toledo
Spring 2013
PHYS 4400 - Principles and Varieties of Solar Energy
1

Our Solar Photovoltaic (PV)
System
2
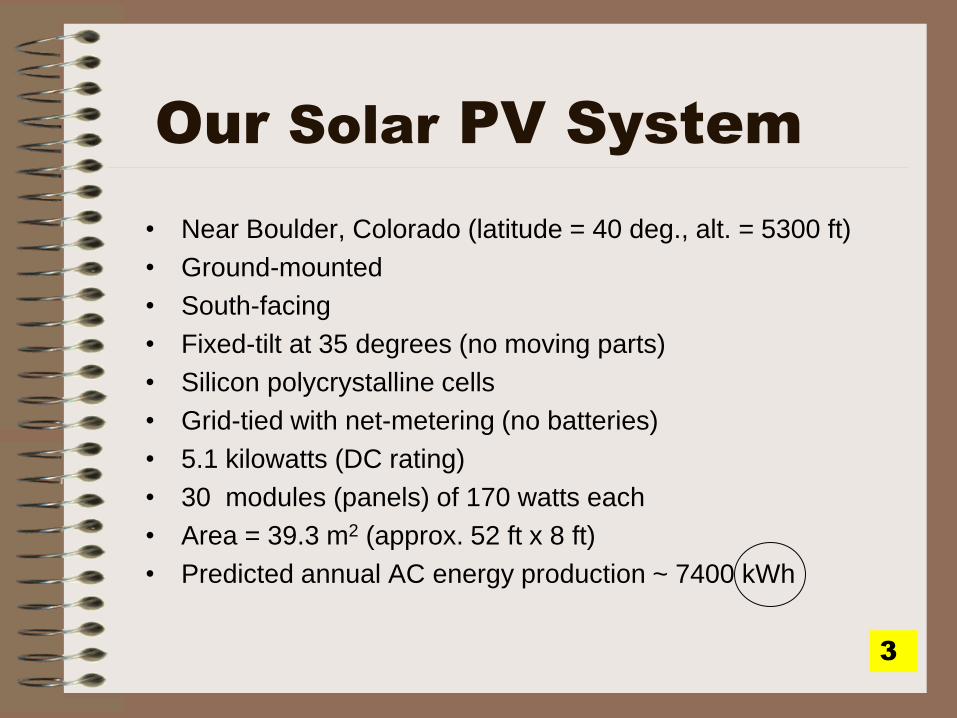
Our Solar PV System
• Near Boulder, Colorado (latitude = 40 deg., alt. = 5300 ft)
• Ground-mounted
• South-facing
• Fixed-tilt at 35 degrees (no moving parts)
• Silicon polycrystalline cells
• Grid-tied with net-metering (no batteries)
• 5.1 kilowatts (DC rating)
• 30 modules (panels) of 170 watts each
• Area = 39.3 m2 (approx. 52 ft x 8 ft)
• Predicted annual AC energy production ~ 7400 kWh
3

4

What Do You Do for Electricity
When the Sun Isn’t Shining (like at night)?
With a “grid-tied” PV system, your back-up is already
in place in the form of the utility company’s grid.
nights & cloudy days
daytime
NREL
5
Net meter

Jump-Starting the Arrival
of Renewable Energy
• Colorado – It’s the law:
30% Renewables by 2020*
* applies to investor-owned utilities,
10% renewables for municipal and co-op utilities
• Ohio – It’s the law:
12.5% Renewables by 2024
including 0.5% from solar.
Renewable Portfolio Standards
6
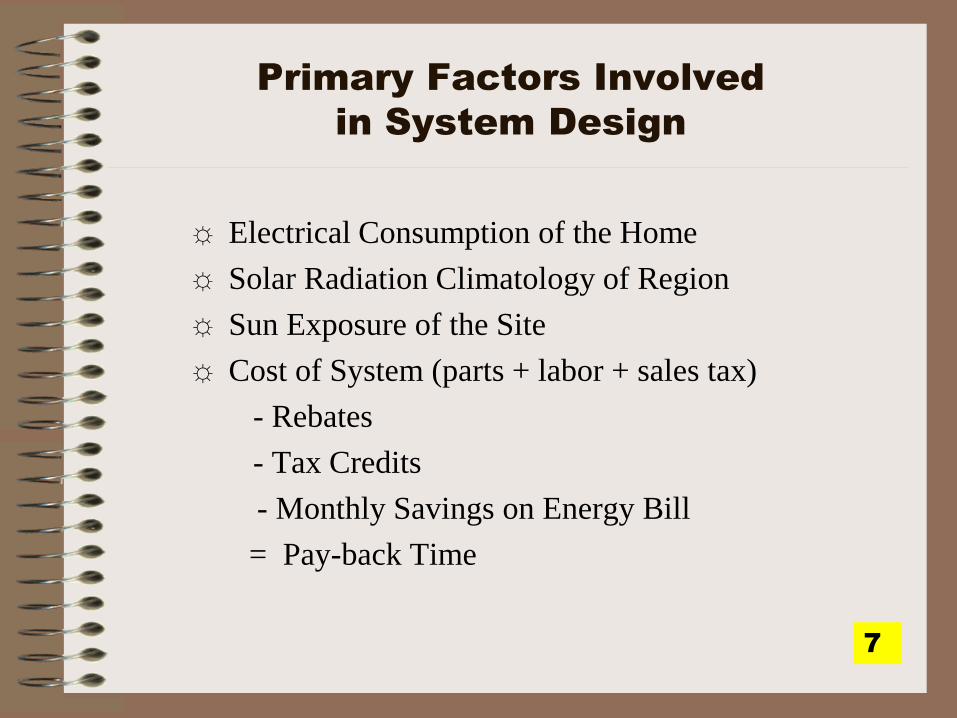
Primary Factors Involved
in System Design
☼ Electrical Consumption of the Home
☼ Solar Radiation Climatology of Region
☼ Sun Exposure of the Site
☼ Cost of System (parts + labor + sales tax)
- Rebates
- Tax Credits
- Monthly Savings on Energy Bill
= Pay-back Time
7

Electrical
Consumption
8
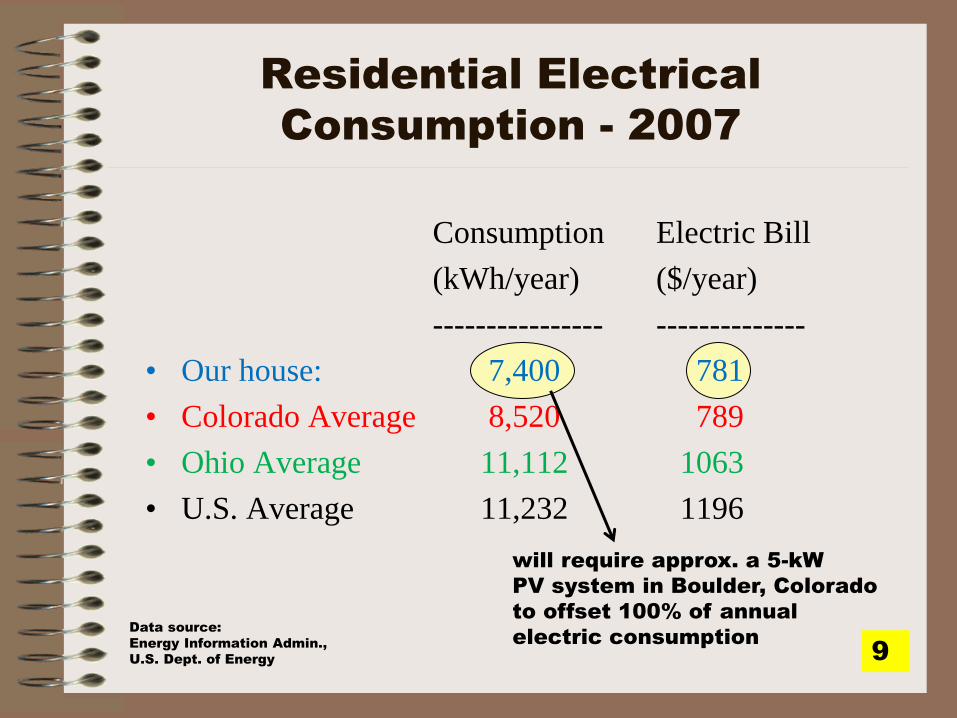
Residential Electrical
Consumption - 2007
Consumption Electric Bill
(kWh/year) ($/year)
---------------- --------------
• Our house: 7,400 781
• Colorado Average 8,520 789
• Ohio Average 11,112 1063
• U.S. Average 11,232 1196
will require approx. a 5-kW
PV system in Boulder, Colorado
to offset 100% of annual
electric consumption Data source:
Energy Information Admin.,
U.S. Dept. of Energy 9

Climatology of Sunshine
10

Solar Radiation Measurements:
Long-term, hourly
measurements
at 44 National
Weather Service
(NWS) sites
ended 1990.
New-site
measurements
in progress by
various agencies,
especially DOE.
Interpolated-modeled
hourly data are now
available for
222 U.S. locations.
11

http://www.nrel.gov/gis/solar.html
12

13

Calculating a PV System’s
Expected Electrical Production
Using NREL’s PV-Watts on-line calculator
http://rredc.nrel.gov/solar/calculators/PVWATTS/version1/
Input:
Geographic location
DC rating of array
Type of array
Tilt
Orientation
Output:
Avg. electric production for each month of the year:
Boulder, Colorado
5.1 kW
fixed tilt
35 deg.
south
Jan = 523 kWh, Feb = 519 kWh, Mar = 713 kWh, … etc.
14

81%
114%
100%
15
assumes no shadowing of panels

Sun Exposure of Site
Selecting a site that has little of no shading year-long
16

House roof
heavily shaded
by trees
Pasture has
no shade
Weather
station
17
18

Financial: Costs Colorado - 2008
• PV system equipment costs:
Solar panels (30 Sharp 170-watt) $24,097
Inverter (5-kW Sunny Boy) 3,008
Rack for ground-mounting panels (ULA) 1,837
Other electrical components 165
• Civil works (pylon & trench digging, concrete) 3,663
• Installation labor 8,198
• County sales tax 1,382
• Total Value $42,350
19

Financial: Rebates, etc.
• Utility company rebate + RE credit ($4.50/watt) -$22,950
• State sales tax rebate - 699
• Federal income tax credit - 2,000
• Total incentives -$25,649
In 2008:
20
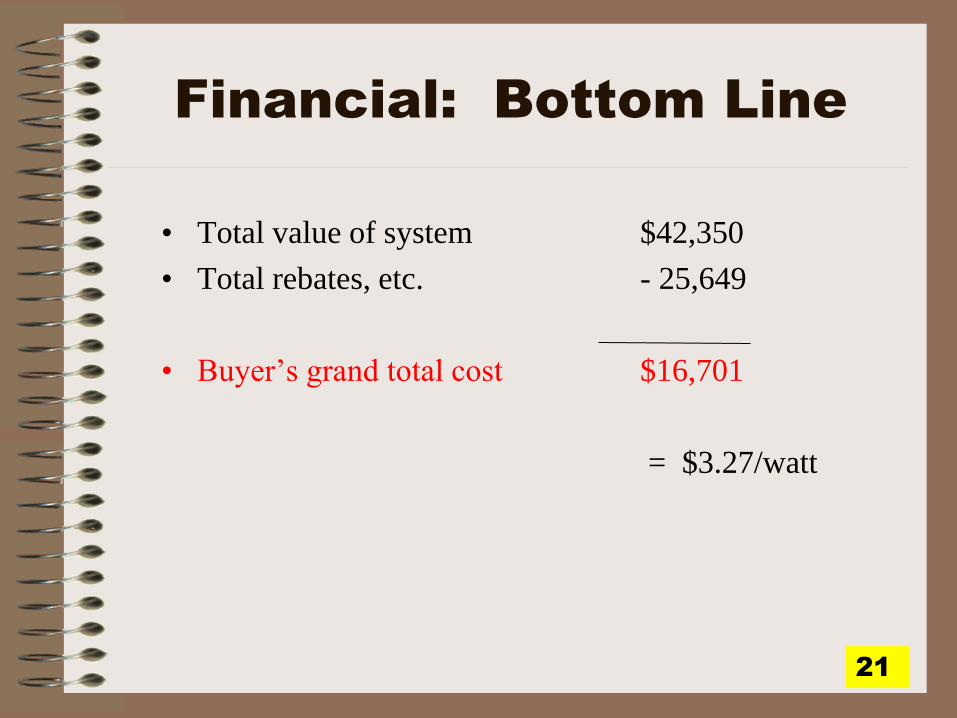
Financial: Bottom Line
• Total value of system $42,350
• Total rebates, etc. - 25,649
• Buyer’s grand total cost $16,701
= $3.27/watt
21

Estimated Energy-Bill Savings
and Pay-Back Period
Assuming:
☼ Initial cost = $16,700
☼ Solar production = 7446 kWh per year
☼ Initial electric rate = $0.10 per kWh
☼ Average annual increase (expected)
in the utility company’s
price for electricity
0% 22 years $1,900
5% 15 years $18,800
10% 12 years $56,500
15 % 10½ years $141,700
Pay-back
in:
Net savings
in 25 years:
~ 14 years
22

Estimated “Eco-Karma” Benefits
Every year:
Clean energy production 7440 kWh
CO2 emissions averted* 7 tons
* = compared with coal-fired electric plant
23
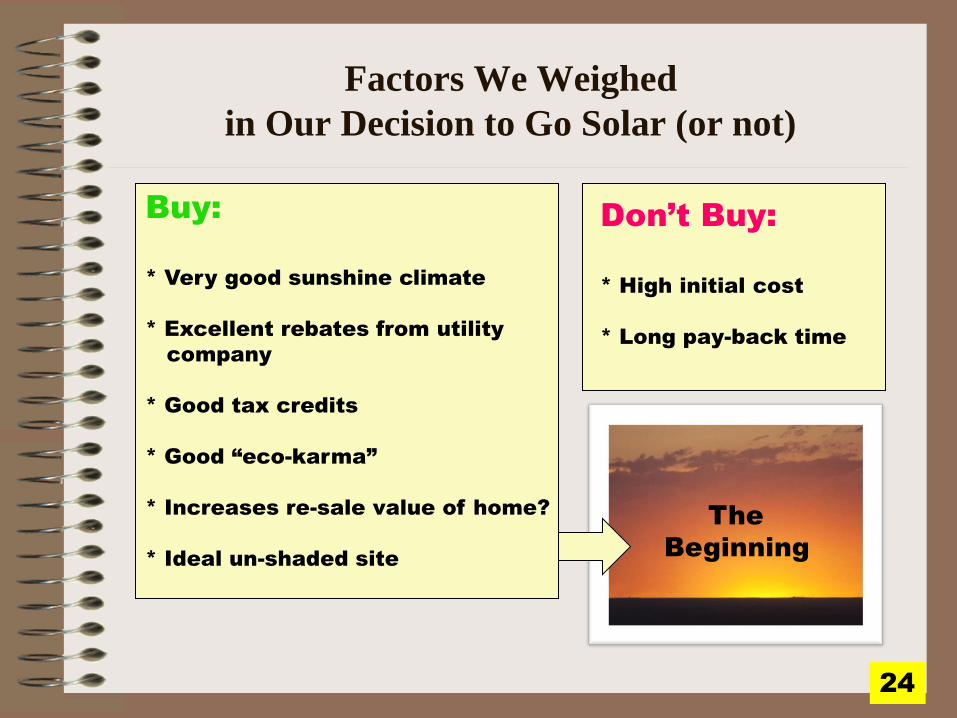
Factors We Weighed
in Our Decision to Go Solar (or not)
Buy:
* Very good sunshine climate
* Excellent rebates from utility
company
* Good tax credits
* Good “eco-karma”
* Increases re-sale value of home?
* Ideal un-shaded site
Don’t Buy:
* High initial cost
* Long pay-back time
The
Beginning
24
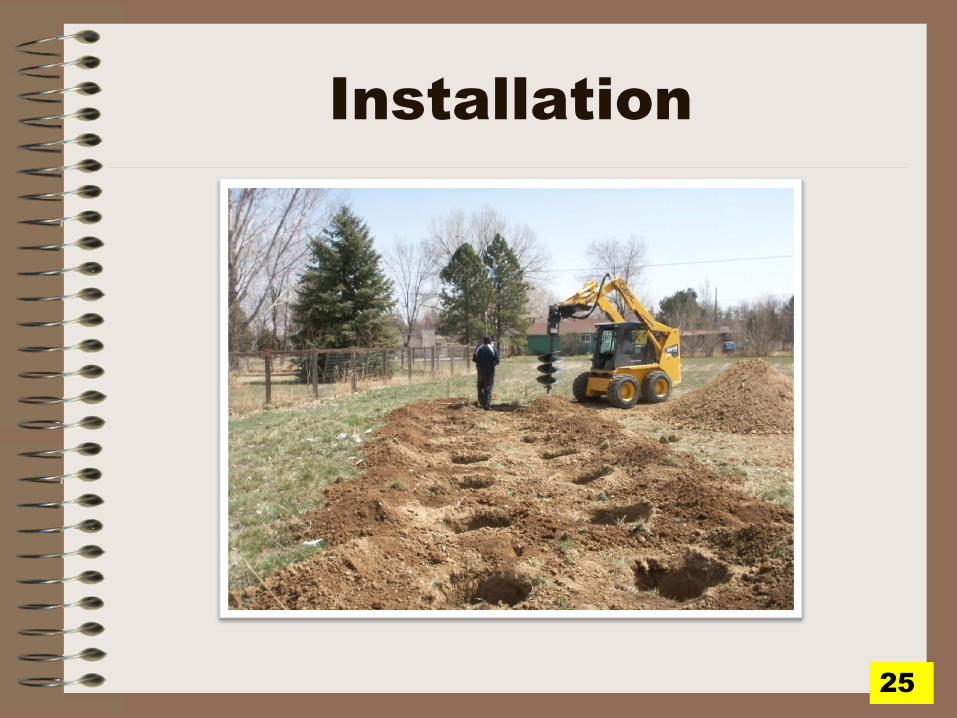
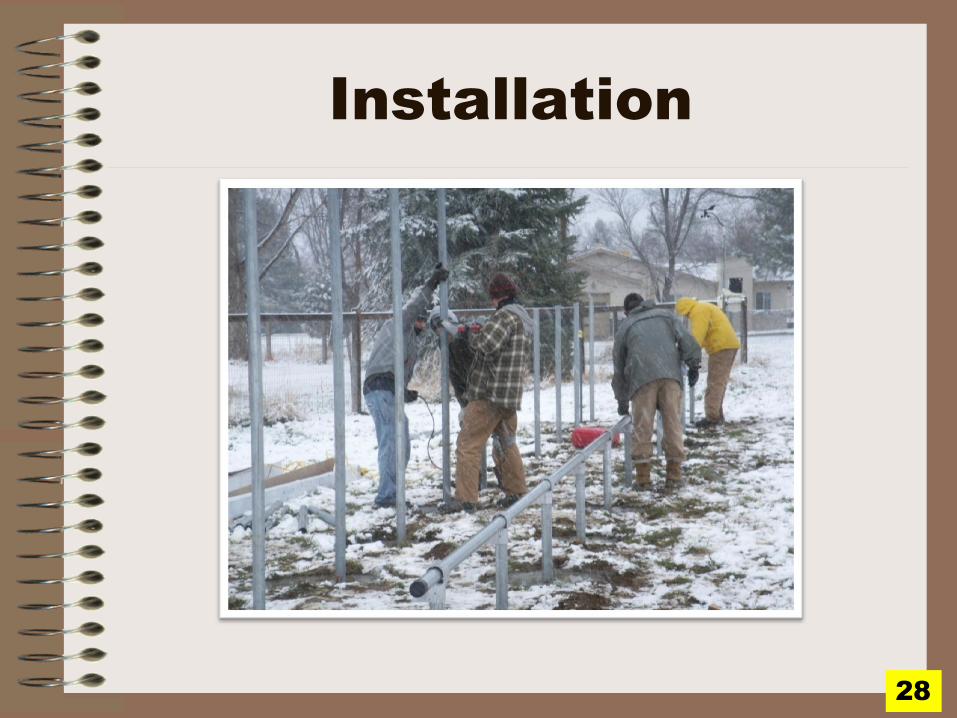
Installation
25
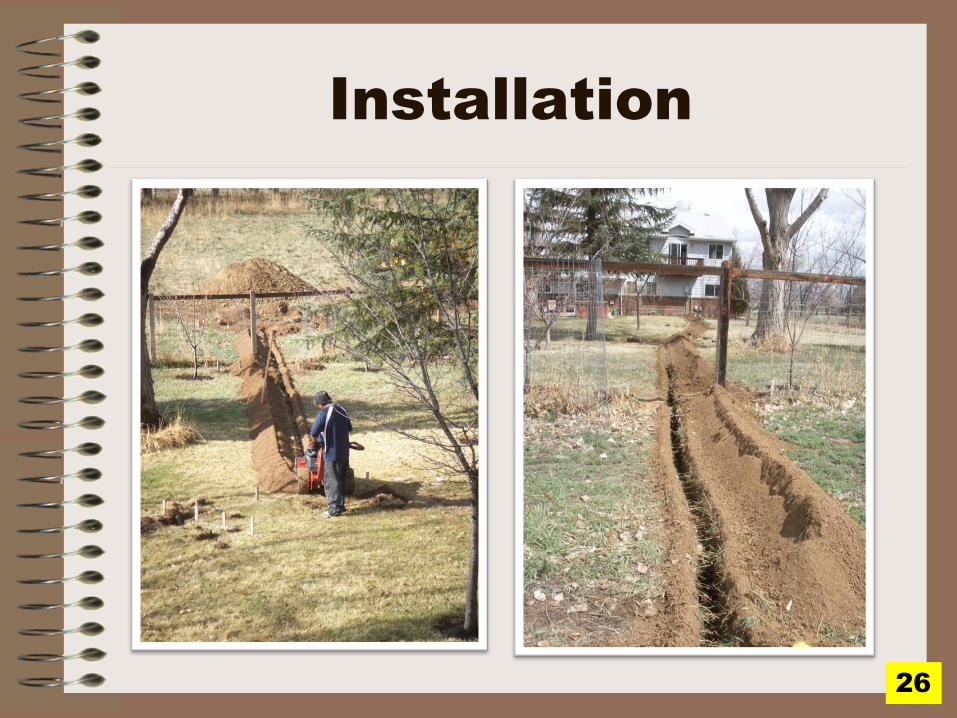
Installation
26

Installation
27
Installation
28

Installation
29

Installation
30

Installation
31

Installation
32

Installation
inverter
33

Installation
inverter
disconnect
switches:
DC AC
fuse
box
meter
box
display
shows:
watts
kwh
volts
hours
etc.
34

Installation
Start-up
date:
9MAY08
35
The
Net
Meter
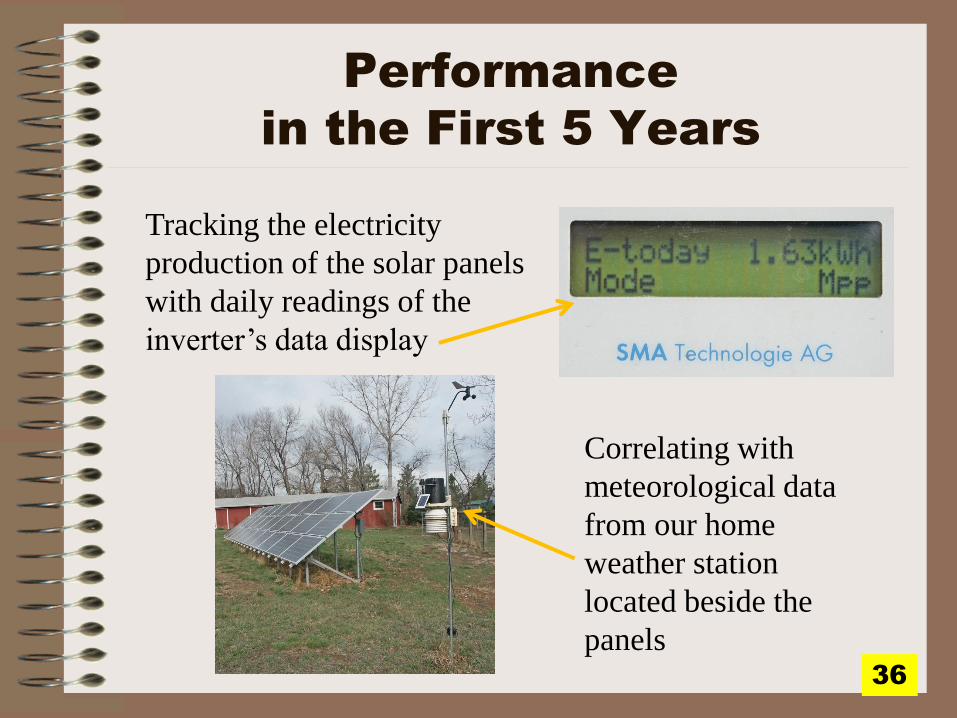
Performance
in the First 5 Years
Tracking the electricity
production of the solar panels
with daily readings of the
inverter’s data display
Correlating with
meteorological data
from our home
weather station
located beside the
panels 36

37

predicted
actual
38

$65/month
$7/month
39

Three Example Days
Solar Electric
Production: 35.5 kWh 22.4 kWh 4.1 kWh
The Effect of Clouds
40

sp
rin
g
su
mm
er
fa
ll
win
te
r
sp
rin
g
su
mm
er
41

sp
rin
g
su
mm
er
fa
ll
win
te
r
sp
rin
g
su
mm
er
42

Tmax ≥ 90F
Tmax ≤ 45F
43
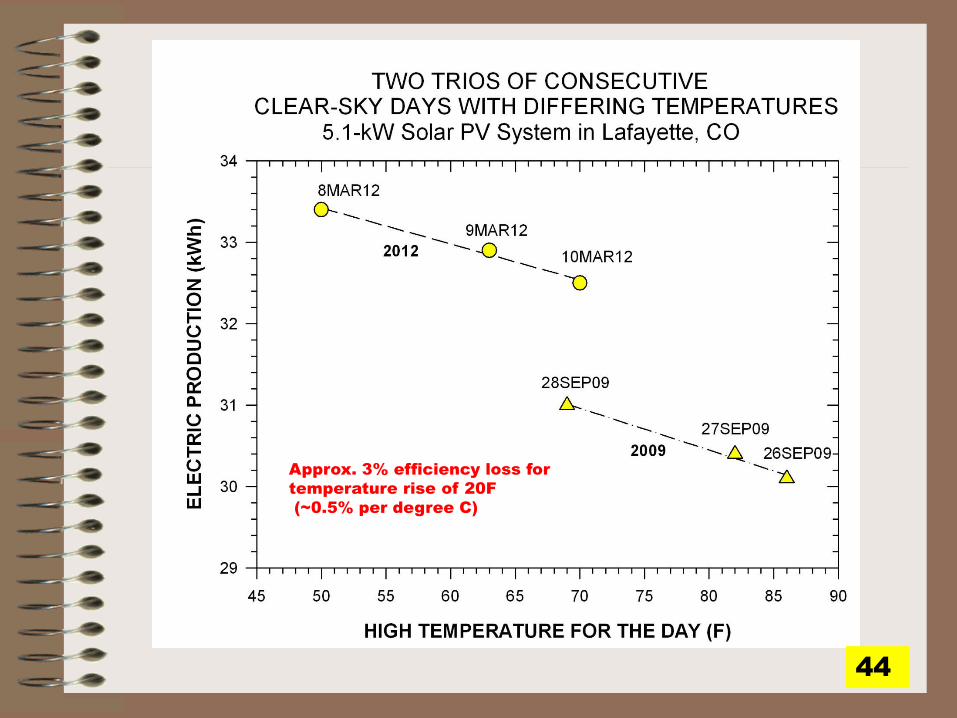
Approx. 3% efficiency loss for
temperature rise of 20F
(~0.5% per degree C)
44
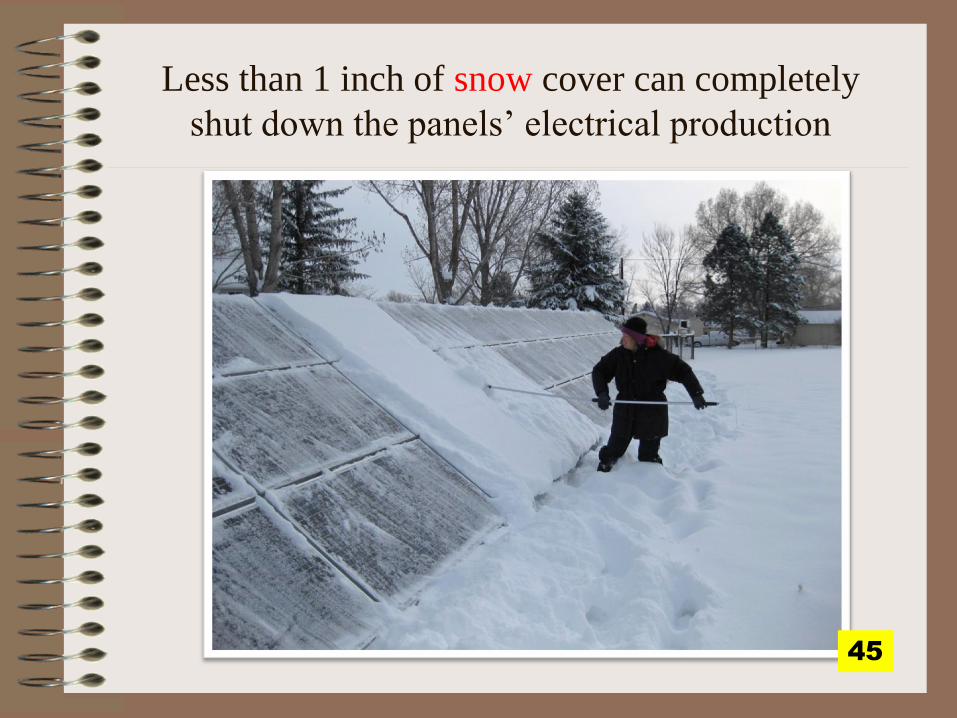
Less than 1 inch of snow cover can completely
shut down the panels’ electrical production
45

Summary of Primary Environmental Factors
(Weather and Sun-Geometry)
that Reduce Our Solar-Panel Electrical Production
☼ Cloudiness
– sky coverage
– thickness
– timing
☼ Sun angle departure from perpendicular
☼ Short daylight period
☼ Snow cover
☼ Hot days
de
cre
asin
g im
po
rta
nc
e
46

Our Solar-PV Experience So Far?
☼ Zero problems with the system.
☼ Our typical monthly electric bill is 85-90% lower now.
☼ We have produced almost 40 Megawatt-hours
of clean electricity.
☼ We have elevated our “eco-karma”
and reduced our carbon footprint by:
32 tons of CO2 emissions
= 85,000 fewer miles driven
= 3,000 trees planted.
☼ The sun-scorched Colorado drought is not all bad.
47

www.cloudphotos.net
The dawn of solar ?
48