running head: evaluating comparative judgment …€¦ · evaluating comparative judgment as ......
TRANSCRIPT

Running head: EVALUATING COMPARATIVE JUDGMENT 1
Evaluating Comparative Judgment as an Approach to Essay Scoring
Jeffrey T. Steedle and Steve Ferrara
Pearson
DRAFT: DO NOT CITE OR QUOTE
Author Note
The authors work in the Center for Next Generation Learning and Assessment in
Pearson’s Research and Innovation Network. Jeffrey Steedle is a Research Scientist. Steve
Ferrara is Vice President, Performance Assessment and Head, Center for Next Generation
Learning and Assessment.
Correspondence concerning this article should be addressed to Jeffrey Steedle, Pearson,
400 Center Ridge Drive, Austin, TX 78753. Contact: [email protected]

EVALUATING COMPARATIVE JUDGMENT 2
Abstract
As an alternative to rubric scoring, comparative judgment generates essay scores by aggregating
decisions about the relative quality of the essays. Comparative judgment eliminates certain
scorer biases and potentially reduces training requirements, thereby allowing a large number of
judges, including teachers, to participate in essay evaluation. The purpose of this study was to
assess the validity, labor costs, and efficiency of comparative judgments as a potential substitute
for rubric scoring. An analysis of two essay prompts revealed that comparative judgment
measures were comparable to rubric scores at a level similar to that expected of two professional
scorers. The comparative judgment measures correlated slightly higher than rubric scores with a
multiple-choice writing test. Score reliability exceeding .80 was achieved with approximately
nine judgments per response. The average judgment time was 94 seconds, which compared
favorably to 119 seconds per rubric score. Practical challenges and recommendations for future
research are discussed.
Keywords: essay scoring, comparative judgment, achievement testing

EVALUATING COMPARATIVE JUDGMENT 3
Evaluating Comparative Judgment as an Approach to Essay Scoring
In large-scale assessment programs that administer constructed-response items and tasks,
the process of training, calibrating, and monitoring scorers is lengthy and resource intensive.
Over one or two days of training, scorers become familiar with each score point on a rubric and
learn to identify important features of student responses in a manner consistent with the expert
scorer-trainer and with exemplars known as “anchor papers.” Scorers who pass qualification
tests are monitored throughout operational scoring to ensure continued scoring accuracy.
Despite these rigorous procedures, which are consistent with the recommendations of the
Standards for Educational and Psychological Testing (AERA, APA, & NCME, 2014),
measurement error associated with “rater effects” is expected (Wolfe & McVay, 2012).
Comparative judgment is a possible alternative to rubric scoring. Generally, the process
requires judges to compare objects and make decisions about their relative qualities (e.g., Essay
A is higher quality or Essay B is higher quality). Comparative judgment is viewed as a pure
form of expert judgment because it involves comparing two like objects, rather than comparing
an object to an internalized standard (Gill, Bramley, & Black, 2007). The aggregation of
numerous judgments yields estimated locations along a continuum or perceived quality. If
desired, these estimates can be anchored to a rubric scale by including anchor papers with fixed
scores in the judgment and estimation processes.
Compared to rubric scoring, comparative judgment offers several potential advantages.
Judges make relative decisions in comparative judgment, and this eliminates the possibility of
exhibiting several common scorer biases (i.e., strictness or lenience, central or extreme
tendencies). That is, scorers may disagree about the rubric scores for two essay responses, but
they may still agree about which response reflects higher quality. Consequently, it is

EVALUATING COMPARATIVE JUDGMENT 4
unnecessary to train judges to agree exactly with scoring trainers and anchor paper scores, and
this could reduce training, qualification, and monitoring requirements. Moreover, relative
judgments of academic performance tend to be more accurate than absolute judgments (e.g., Gill
& Bramley, 2008), and this could lead to more valid inferences about student proficiency.
Finally, relative judgments may be less cognitively demanding and less time consuming, and this
could reduce fatigue and allow for collecting more judgments in a given period.
If empirical research supports these advantages, comparative judgment may be an
appealing way to involve more teachers in essay evaluation as professional development. When
teachers participate in scoring, their productivity is often lower because the scoring is added to
regular teaching responsibilities. Moreover, teachers report maximum professional development
benefits after scoring approximately 50 student responses (M. Jones, 2014), which is many fewer
than would be expected of professional scorers. So, if comparative judgment reduces the barriers
to entry to scoring projects, more teachers could engage in evaluating student responses (even for
a brief time), thereby increasing the reach of scoring as professional development.
Although some have proposed replacing traditional scoring with comparative judgment
(e.g., Pollitt & Elliott, 2003), Bramley and Oates (2011) asserted, “The issue for its deployment
depends not least on reaching a judgment regarding its benefit-effort ratio in a specific context”
(p. 33). To that end, this study examined the validity, labor costs, and efficiency of comparative
judgment scoring. In this study, trained teachers made comparative judgments of essay
responses from a state achievement testing program. The analysis estimated comparative
judgment measures of essay quality and compared them to rubric scores from professional
scorers. The approaches were also compared in terms of time on task and correlation with
another measure of writing ability. Additional analyses evaluated the relationship between

EVALUATING COMPARATIVE JUDGMENT 5
reliability estimates and the number of judgments per essay response. In all, results provide
insight about the feasibility of offering comparative judgment scoring as an alternative to rubric
scoring for large-scale assessment programs.
Comparative Judgment in Educational Research
Thurstone’s (1927) law of comparative judgment first provided a method for analyzing
comparative judgment data to estimate the distances between objects on a latent measurement
scale. Later, Bradley and Terry (1952) and Luce (1959) demonstrated the application of logistic
functions to the analysis of comparative judgment data, and Andrich (1978b) showed that
Thurstone’s model was equivalent to a Rasch logistic model.
Although Thurstone (1927) asserted that comparative judgment could be applied to the
measurement of “excellence of specimens in an educational scale” (p .1), early applications of
comparative judgment often involved psychophysical phenomena (e.g., light or sound intensity),
attitudes, or preferences (Pollitt & Elliott, 2003). More recently, however, comparative
judgment has been applied to educational assessment, in particular the maintenance of
performance standards in the U.K. (Bramley & Oates, 2011). In such studies, experienced
examiners compare the relative quality of scripts from different administrations of an
examination (a “script” is the body of a student’s responses to an exam). The result is a common
scale of perceived quality for scripts from both examinations, which provides information about
the consistency of passing standards across forms and over time (e.g., Black, 2008; Bramley,
Bell, & Pollitt, 1998).
Comparative Judgment versus Traditional Scoring
For comparative judgment to be seriously considered as an alternative to traditional
scoring methods, it would be helpful to demonstrate that comparative judgment measures are

EVALUATING COMPARATIVE JUDGMENT 6
similar to rubric scores. Most prior studies of maintaining performance standards reported a
correlation between comparative judgment measures and rubric scores or grades (Table 1), and
these correlations ranged from nearly zero or non-significant (e.g., Bramley et al., 1998; Forster,
2005) to nearly 1.00 (e.g., Bramley, 2005; Raikes, Scorey, & Shiell, 2008). In those studies,
judges must compare exams that are unequally difficult, and this may reduce judgment accuracy
(Black, 2008; Yim & Shaw, 2009). Besides judgment accuracy, these correlations also depend
on factors such as the number of judgments and variance in quality of the objects.
======Table 1======
Several studies focused on using comparative judgment as a tool for evaluating student
work. For example, comparative judgment has been used to evaluate electronic portfolios
(Kimbell et al., 2009), narrative writing samples (Heldsinger & Humphry, 2010), geography
essays (Whitehouse & Pollitt, 2012), samples of early writing (Heldsinger & Humphry, 2013),
mathematics exam performance (I. Jones & Alcock, 2014; I. Jones, Swan, & Pollitt, 2015), and
responses to brief writing tasks (Attali, 2014). In these studies, correlations between
comparative judgment measures and rubric scores or grades ranged from .38 to .92 (Table 1).
Overall, prior research indicates that, in certain circumstances, comparative judgment measures
replicate the relative standings of students based on rubric scores.
Reliability of Comparative Judgment Measures
In general, reliability reflects consistency in scores across testing conditions or,
equivalently, the precision of test scores. Some reliability coefficients estimate correspondence
between observed scores and “true” or expected scores. However, in comparative judgment
studies, where student performance is observed only once and multiple judges evaluate each
observation, reliability coefficients reflect consistency between judges’ perceptions of relative

EVALUATING COMPARATIVE JUDGMENT 7
quality (i.e., the ratio of “true” to variance in perceived quality to observed variance in perceived
quality). Reliability is expected to increase as judge agreement increases, as the number of
judgments increases, and as variance in the perceived quality of the objects increases.
In general, reliability coefficients from prior comparative judgments studies exceeded .90
(Table 1), suggesting strong agreement among judges and precise measures of perceived quality.
Based on experience, Pollitt (2004) estimated that 25 comparisons per object would provide
sufficient reliability, though studies of maintaining performance standards typically used twice
that number of comparisons “to carry out the fairly strict checks on quality that a politically
sensitive study of this kind needs” (p. 16). The process can be made more efficient with
adaptive comparative judgment, in which an adaptive algorithm uses prior judgments to pair
objects of similar quality because such comparisons provide the most information about
perceived quality (Pollitt, 2012).
Validity
In educational assessment contexts, the elimination of certain scorer biases is one of the
major appeals of comparative judgment (Pollitt, 2004). This elimination gives rise to the
possibility that relative judgments are more accurate than absolute judgments of student
performance. If true, the aggregation of more accurate judgments could potentially result in
more accurate measures of student performance, thereby improving the validity of score
interpretations.
Psychological research suggests that relative judgments tend to be more accurate than
absolute judgments of the intensity of psychophysical phenomena such as light or sound
(Stewart, Brown, & Chater, 2005) and in other judgment tasks such as estimating distances and
counting spelling errors (Shah et al., 2014). A limited body of educational research also supports

EVALUATING COMPARATIVE JUDGMENT 8
this notion. In one study, experienced examiners applied A, B, or C grades to history and
physics exam performance with accuracy rates of 39% and 25%, respectively (Gill & Bramley,
2008). Their corresponding relative judgment accuracies were 66% and 78%, and judges
expressed higher levels of confidence in their relative judgments.
Comparative Judgment Demands
Comparative judgment studies often gather a large number of judgments, so researchers
warn about the effects of fatigue and boredom (Gill & Bramley, 2008). Modifications such as
ranking and chaining responses may help reduce physical and cognitive burdens. Bramley and
his colleagues (1998) suggested replacing pairwise judgments with rank ordering because, for
example, rank ordering 10 objects provides 45 pairwise judgments (via the transitive property).
Pollitt (2012) proposed “chaining” responses so that judges would only read one new response
for each judgment.
Reduction in training time relative to traditional scoring is one possible efficiency of
comparative judgment. Comparative judgment studies have been conducted with as little as 30
minutes of training (Heldsinger & Humphry, 2010), and some prior studies provided only written
instructions. However, in most cases, the judges were experienced scorers who were familiar
with the materials. One study demonstrated that comparative judgment results were very similar
regardless of whether the exercise was carried out through the mail or with face-to-face meetings
(Black & Bramley, 2008).
With regard to time on task, Pollitt estimated that judges could make 10 comparisons per
exam in the time it would take them to score using traditional methods (Pollitt, 2004). In other
research, judges reported that comparative judgment was a much faster method of evaluation
(Kimbell et al., 2009). Judges in another study rated the process of ranking three exams as

EVALUATING COMPARATIVE JUDGMENT 9
“fairly easy,” and they reported that the process became easier and faster with experience (Black,
2008).
In contrast, judges in a different study reported difficulty rank ordering 12 responses to
several different exams (Yim & Shaw, 2009). Likewise, judges have reported stress and
difficulty with the task of comparing very long responses (up to 47 pages) from different exams
(I. Jones et al., 2015). One study compared judges who rank ordered 10 sets of 5 responses and
scorers who evaluated 50 responses using traditional methods (Attali, 2014). There were no
significant differences between the judges and scorers in terms of perceived task difficulty, task
enjoyment, or time on task. So, prior research suggests that comparative judgments may be
faster and easier, but possibly only when comparing a small number of brief responses to a
common exam.
Research Questions
To investigate comparative judgment as a possible substitute for rubric scoring, this study
was designed to gather evidence to address the following research questions:
1. How closely do comparative judgment measures correspond to rubric scores?
2. Do comparative judgments take less time than rubric scoring decisions?
3. How do comparative judgment measures and rubric scores compare in terms of validity
coefficients?
4. How is the reliability of comparative judgment measures associated with the number of
judgments per essay response?
In all, results from this study can help inform decisions about future uses of comparative
judgment for large-scale achievement testing programs, including the possible use of teachers in
the comparative judgment process.

EVALUATING COMPARATIVE JUDGMENT 10
Method
Essay Prompts
This study was conducted using data from two essay prompts administered as part of a
state English language arts test for students at grade 11. At least two professionally trained
scorers scored essay responses on a holistic 1–4 scale reflecting the following writing qualities:
organization, focus and coherence, development of ideas, voice, and conventions of Standard
English. The testing program required exact scorer agreement, so additional resolution scores
were collected when needed.
Study Judges and Training
The nine judges recruited for this study were secondary school English teachers, none of
whom had ever worked as a professional scorer. Four or five judges were assigned to each
prompt. A scoring trainer conducted one training session for each prompt via web conference,
and the teachers participated from their homes. The training included a discussion of essay
quality as defined by the rubric, but at no time was a score point or rubric referenced. Next, the
trainer introduced the concept of comparative judgment and discussed judging biases they should
avoid (e.g., judging an essay on its content rather than its writing quality).
The trainer used the anchor papers from the original rubric scorer training to generate
“anchor pairs.” Following discussions about how different responses compared in quality, the
judges independently judged 10 pairs in the online judgment interface (described below). After a
discussion of each pair, the judges independently judged another 15 pairs, and the trainer
discussed pairs that were judged incorrectly. Based on judgment accuracy, which ranged from
11 to 15 out of 15 correct judgments, all judges qualified for this study. The first training lasted
three hours and forty minutes, and the second lasted three hours.
EVALUATING COMPARATIVE JUDGMENT 11
Data Selection and Essay Pairing
A sample of 200 responses was drawn from the pool of available responses for each
prompt. To mirror the empirical score distribution, sampling was conducted such that the scores
1, 2, 3, and 4 represented 25%, 40%, 25%, and 10% of the responses, respectively. On these
samples of responses, the first and second rubric scorers agreed exactly on approximately 70% of
responses. A resolution scorer provided a third score when needed, and this became the recorded
score. The first and second scorers correlated .81 and .85 on prompts 1 and 2, respectively.
Note that such correlations tend to be inflated because essays are randomly assigned to scorers
(i.e., “scorer 1” and “scorer 2” are not unique; each scorer contributes to both “scorer 1” and
“scorer 2”).
An automated algorithm paired each response with approximately 16 other responses and
with two anchor papers, which amounted to approximately 2,000 comparisons per prompt. The
pairing process was designed to pair responses of similar quality using score estimates provided
by the Generalized Grading Model (GGM), an automated essay scoring program developed by
Knowledge Technologies (kt.pearsonassessments.com). The pairing algorithm paired responses
having the same or adjacent GGM scores. For reference, GGM scores correlated .55 with the
rubric scores. The GGM tended to overestimate scores because some long, well-written essays
received low rubric scores for reasons unknown to the GGM, which focuses on readability,
coherence, length, spelling, and vocabulary.
Data Collection
The online comparative judgment interface presented judges with two typed responses,
side by side, and they were given the following options: “Response A is Better,” “Similar
Quality,” and “Response B is Better.” As suggested by Pollitt (2012), response pairs were

EVALUATING COMPARATIVE JUDGMENT 12
“chained” such that each judgment involved reading only one new response when possible. The
judges were limited to judging approximately equal shares of the available pairs, and the
judgment interface recorded the duration of each judgment.
Analysis
This section describes how the judgment data were analyzed to estimate the comparative
judgment measures of perceived essay quality and how the comparative judgment measures were
compared to rubric scores.
Statistical model fitting. The judgment data were modeled using a multivariate
generalization of the Bradley-Terry model (Bradley & Terry, 1952) akin to the Rating Scale
Model (Andrich, 1978a):
𝑃(𝑌𝐴𝐵 = 𝑗|𝜇𝐴, 𝜇𝐵, 𝜏) = 𝜋𝐴𝐵𝑗 =exp(∑ [𝜇𝐴 − (𝜇𝐵 + 𝜏𝑠)]
𝑗𝑠=1 )
∑ exp(∑ [𝜇𝐴 − (𝜇𝐵 + 𝜏𝑠)]𝑦𝑠=1 )𝐽
𝑦=1
∑ [𝜇𝐴 − (𝜇𝐵 + 𝜏𝑠)]1
𝑠=1≡ 0
In this model, µA is the location of response A along a continuum of perceived writing quality,
and µB is the location of response B. There are J = 3 possible response options: prefers B,
options equal, and prefers A. The τs values are location adjustment parameters reflecting the
“distance” between response options along the score scale. The distance between “Response A
is Better” and “Similar Quality” is assumed to be the same as the distance between “Similar
Quality” and “Response B is Better” (i.e., τ2 = - τ3).
The judgment data served as input to OpenBUGS, the open-source version of WinBUGS
(Lunn, Thomas, Best, & Spiegelhalter, 2000). This software package implemented Markov
Chain Monte Carlo (MCMC) estimation of model parameters. The µ parameters were assumed
to be normally distributed with a prior distribution having a mean of 2.2 and standard deviation

EVALUATING COMPARATIVE JUDGMENT 13
of 0.93, which reflected the distribution of scores in the sample of 200. The scores of the anchor
papers were fixed at 1.0, 2.0, 3.0, or 4.0 so that the estimation procedure would generate scores
approximately on the 1–4 rubric scale. The posterior distributions of the µ and τ parameters each
included 400 values (that followed 100 “burn-in” iterations), and the means of the posterior
distributions served as parameter estimates.
Statistical model evaluation. A reliability coefficient, which estimates the ratio of true
score variance to observed score variance in the measures of perceived essay quality, was
calculated for the posterior means of the µ parameters (Linacre, 2014). INFIT and OUTFIT
statistics were used to examine how well observed data fit with model expectations for each
judge and for each student response. INFIT statistics indicate how accurately the model predicts
judgments when comparing responses of similar quality, and OUTFIT statistics reflect the
predictability of judgments when comparing responses of very different quality. Both statistics
have an expected value of 1.0, and values between 0.5 to 1.5 are considered acceptable (Wright
& Linacre, 1989). Values greater than 1.5 reflect poor fit, and values less than 0.5 suggest
overfitting, which does not distort measurement but may inflate reliability.
Comparing approaches. The estimation procedure generated comparative judgment
measures along a continuous scale of perceived essay quality. To facilitate direct comparisons to
the rubric scores, the comparative judgment measures were rounded to the nearest integer and
bounded by 1 and 4. The comparative judgment measures and the rubric scores were compared
in terms of means and standard deviations, and agreement was evaluated using agreement rates
and correlations.
Rubric scoring and comparative judgment are also compared in terms of mean time on
task. Finally, to compare the approaches in terms of validity coefficients, the comparative

EVALUATING COMPARATIVE JUDGMENT 14
judgment measures and the rubric scores are each correlated with Rasch estimates of writing
ability based on the 20-item multiple-choice section of the same writing assessment that included
the essays prompts.
Reliability versus number of judgments. A series of random samples were removed
from the full data sets to examine the relationship between number of judgments and the
reliability of the comparative judgment measures. For each random sample (10% reduction
through 80% reduction), the comparative judgment model was refit, and reliability was
recalculated. A plot of reliability versus number of judgments indicates how many judgments
would be needed to obtain various levels of reliability.
Results
OpenBUGS Output and Fit Statistics
For prompt 1, the comparative judgment measures of perceived writing quality ranged
from 0.34 to 4.65 with a mean of 2.40. For prompt 2, the measures ranged from -0.13 to 4.80
with a mean of 2.13. As expected, these values fell roughly within the 1–4 range due to fixing
the anchor paper scores. The mean posterior standard deviation, which indicated measurement
precision (like the standard error of measurement), was 0.34 for prompt 1 and 0.35 for prompt 2.
The reliability of the measures was 0.89 for prompt 1 and .90 for the prompt 2.
The tau parameters for prompt 1 and prompt 2 were (0, 1.31, -1.31) and (0, 1.20, -1.20),
respectively. Judges used the middle response category (“Options Equal”) on only 8% of
judgments, and it was never the most probable response according to the model.
The INFIT statistics for all judges on both prompts were in the acceptable 0.5–1.5 range.
All four prompt 1 judges had OUTFIT statistics in the acceptable range. Three out of five
prompt 2 judges had OUTFIT statistics in the acceptable range, and two had OUTFIT statistics

EVALUATING COMPARATIVE JUDGMENT 15
below 0.5. In all, results suggested that none of the judges behaved in a manner inconsistent
with consensus views of response quality.
OUTFIT statistics for responses were often below 0.5, which indicated possible
overfitting. This was especially true for responses having low or high comparative judgment
measures (i.e., around 1.0 or 4.0), and this result might be expected since comparisons between
responses of notably different quality should be relatively easy. For prompt 1, 55% of responses
had OUTFIT statistics in the acceptable range, and 39% were below 0.5. Of the prompt 2
responses, 49% of OUTFIT statistics were between 0.5 and 1.5, and 49% fell below 0.5. For
prompts 1 and 2, 85% and 76% of INFIT statistics were between 0.5 and 1.5, respectively, and
nearly all others were below 0.5. A small percentage of responses (1.5–3.5%) had fit statistics
between 1.5 and 2.0, and fewer (0–3%) had fit statistics exceeding 2.0. Such responses may
have been difficult to judge.
Comparing Approaches
The posterior means were rounded to the nearest integer and restricted to the 1–4 range to
make them directly comparable to the rubric scores. Rubric scores and comparative judgment
measures agreed exactly on 60.0% of the prompt 1 responses, and they disagreed by one point on
38.5% of responses (Table 2). The correlation between rubric scores and comparative judgment
measures was .78. As indicated by the means in Table 2 (2.20 and 2.40), comparative judgment
measures tended to be higher than rubric scores for prompt 1. The standard deviations of the
score distributions were similar (0.93 and 0.97).
For prompt 2, the exact agreement rate was 64.0%, and the adjacent agreement rate was
33.5%. The scores from the two approaches correlated .76. On prompt 2, the distributions were

EVALUATING COMPARATIVE JUDGMENT 16
quite similar for the rubric scores (mean of 2.20, standard deviation of 0.93) and the comparative
judgment measures (mean of 2.21, standard deviation of .98).
======Table 2======
Table 3 summarizes time on task for rubric scoring and comparative judgments. Across
both prompts, the mean rubric scoring time was nearly two minutes, and the mean comparative
judgment time was approximately one and a half minutes. While this result appears to favor
comparative judgment, the time on task measures must be interpreted with several caveats. Only
certain aggregate statistics were available for the rubric scoring, so the rubric scoring means
reflect all student responses, not just the 200 sampled for this study. The comparative judgment
means were strongly influenced by outliers (as high as 46 minutes) because the comparative
judgment interface did not time out while judges took breaks. Thus, the median time of 62.0
seconds likely provides a better reflection of typical judgment time. In all, results are consistent
with the notion that comparative judgments take less time than assigning rubric scores, but the
apparent difference could, in part, be explained by variation among the scorers and judges.
Mean time on task was calculated for each scorer and each judge, and there were substantial
differences among them (see Min and Max in Table 3).
======Table 3======
Rubric scores and comparative judgment measures were also compared in terms of
validity coefficients. Comparative judgment measures might be expected to correlate more
highly with another measure of writing ability simply because the measures are continuous and
therefore have greater variance than integer rubric scores. Indeed, the comparative judgment
measures correlated .67 and .72 with multiple-choice writing scores for prompts 1 and 2,
respectively, whereas the rubric scores correlated .63 and .69 with the multiple-choice test.

EVALUATING COMPARATIVE JUDGMENT 17
Correlations using the rounded comparative judgment measures provide a fairer comparison, and
those correlations were still slightly higher (.66 and .71). The differences in the correlations
were small (.02–.03), but experience suggests that the correlation between an essay and a
multiple-choice test is unlikely to exceed .75, so large increases would have been surprising.
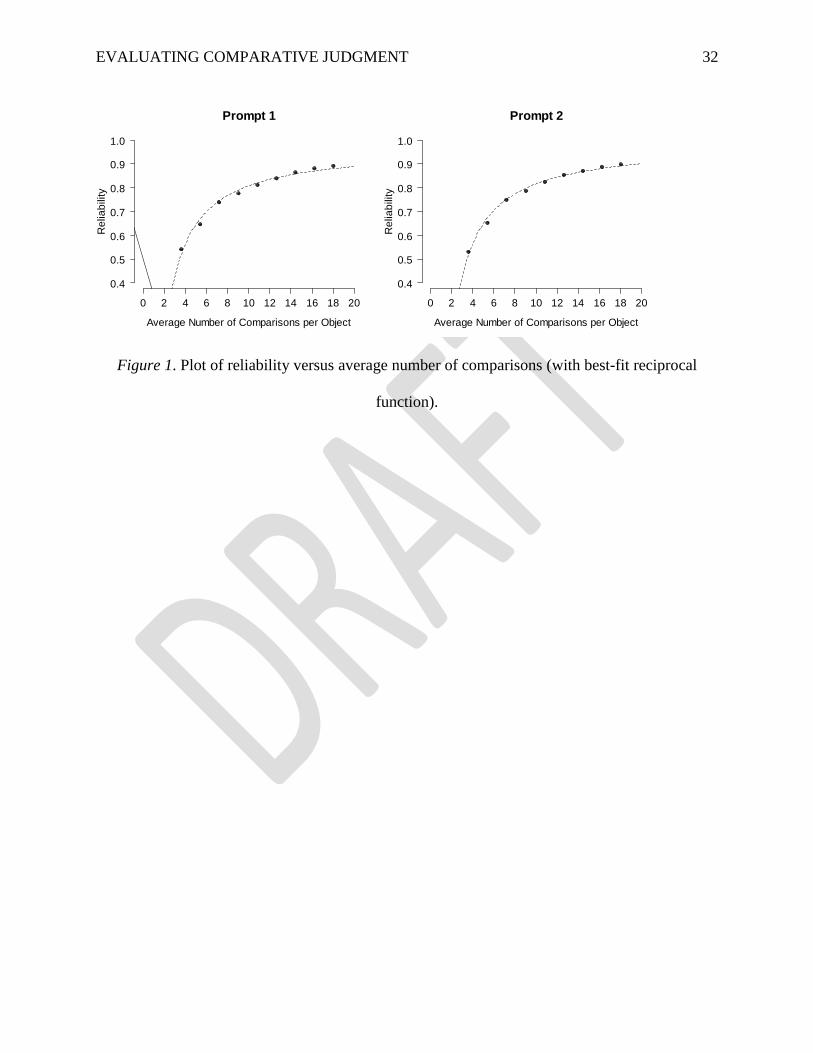
Reliability versus Number of Judgments
To study the relationship between reliability and the number of judgments, random
samples of judgments were removed from the data set (10%, 20%,…, 80% reductions while still
including all 200 responses), the model was refit, and reliability was re-estimated. Reliability
was .89 with 18 judgments per response for prompt 1 (Figure 1), and reliability remained greater
than .80 until the average number of judgments was reduced by 50% (nine judgments per
response). Results were nearly identical for prompt 2, with .90 reliability using all judgments
and reliability of .79 with a 50% reduction. Reliability decreased more rapidly with additional
reductions, but it remained above .50 with only three to four judgments per response. Note that a
single judgment provides information about two responses, so, if nine judgments per response
are needed to obtain reliability of .80, this amounts to approximately 900 judgments for 200
responses (200×9/2).
======Figure 1======
Follow-Up Analysis Focused on Scaling
The method of this study reflected two assumptions: the anchor response scores were
accurate and the 1–4 rubric scale could be considered an equal-interval scale. A follow-up
analysis tested these assumptions by freely estimating the comparative judgment measures of the
anchor responses. The freely-estimated measures generally followed the expected pattern, with
anchor 1s having the lowest measures and anchor 4s having the highest measures, but there were

EVALUATING COMPARATIVE JUDGMENT 18
some notable deviations. For example, the prompt 1 anchor response with the lowest measure
was considered a “high 1” by expert scorers, and the “middle 1” anchor had a higher measure
than the “low 2” anchor. With prompt 2, the “high 2” had a higher measure than the “middle 3,”
and the “low 3” was judged to be better than the “high 3.” Such results are not consistent with
the assumption that the anchor scores are accurate, but some of the differences would not be
considered statistically significant. Moreover, the judges were not trained by the expert scorer-
trainers who selected the anchor papers, so their emphases on different evaluation criteria may
have varied. In addition, it may be unreasonable to expect perfect accuracy when sorting
responses into twelve categories.
One result was clear: the anchor 4s were consistently judged to reflect the highest quality
writing. The separation between the anchor 3s and the 4s was notably greater than the separation
between the 1s and 2s and the 2s and 3s. This finding is inconsistent with the assumption that
the 1–4 rubric is interval scaled. Still, possible violations of assumptions did not appear to
impact results. The comparative judgment measures from the anchored and unanchored
calibrations correlated .998 for prompt 1 and .997 for prompt 2.
Follow-Up Analyses Focused on Score Agreement
Agreement between the comparative judgment measures and the rubric scores was in the
general range of what is typically expected between two scorers on operational scoring projects,
but several factors may have negatively affected agreement in this study. For one, inaccurate
GGM scores may have led to poor pairings. For example, if a response with a rubric score of 3
was scored a 2 by the GGM, this response would get paired with few 3s and no 4s. This
potential problem was investigated by filtering results to include only responses that were scored

EVALUATING COMPARATIVE JUDGMENT 19
accurately by the GGM. The exact agreement rate for prompt 1 increased from .60 to .66 (based
on 43% of responses), but there was no improvement for prompt 2.
Another potential detriment to agreement was a pairing algorithm constraint on the
number of possible pairings for each response. Combined with the non-uniform distribution of
scores (especially the small number of responses with a score of 4), some responses were not
paired with a set of responses having the same and adjacent scores in both directions. To test
this hypothesis, “well paired” responses were identified as those with pairings that included at
least six comparisons to responses with the same score and at least three comparisons responses
with each adjacent score. When examining only these subsamples of responses, agreement
increased from .60 to .67 for prompt 1 (based on 40% of responses), but it did not increase for
prompt 2.
Discussion
The primary goal of this study was to examine correspondence between evaluations of
student writing quality based on traditional rubric scoring and comparative judgment. Exact
agreement rates on writing assessments with four-point rubrics are typically 60–70% (Ferrara &
DeMauro, 2006), and results from this study fell within that range. Follow-up analyses revealed
that agreement might have been higher if responses had been paired more optimally. Perfect
agreement, however, is not necessarily a desirable outcome. Indeed, differences allow one
method to potentially support more valid inferences about writing ability. In this study, the
comparative judgment measures correlated slightly higher than rubric scores with performance
on a multiple-choice writing test.
The English teachers who participated in this study appear to have been successful judges
as indicated by their qualification test results, their fit statistics, high reliability coefficients,

EVALUATING COMPARATIVE JUDGMENT 20
agreement between comparative judgment measures and rubric scores, and validity coefficients
for the comparative judgment measures. This finding is consistent with a previous study in
which comparative judgment measures from teachers and experienced scorers correlated highly
(Raikes et al., 2008), and it supports the notion that educators could serve as judges in future
implementations and possibly benefit from the experience as professional development.
In terms of time on task, results from this study suggest that an individual comparative
judgment takes less time to generate than a rubric score. Of course, comparative judgment
requires multiple judgments, and in this study, each essay needed approximately 9 judgments in
order to attain reliability of .80. Assuming nine judgments per response, comparative judgment
for a single response would require an average of 420.8 seconds (93.5 × 9 / 2), which is 76%
more time that rubric scoring. Using the median judgment time, the average comparative
judgment time would be 279 seconds, which is a 17% increase over rubric scoring.
Though the time required to evaluate each response may be longer, comparative
judgment may offer greater overall efficiency by reducing training requirements. Training
sessions lasted three to four hours in this study, but other comparative judgment studies attained
reliable measures of perceived quality with substantially less training. For reference, rubric
scorer training for prompts like those used in this study typically lasts between 8 and 12 hours.
Reductions in training time could provide enormous efficiency in field-test scoring, wherein a
small number of responses to a large number of essay prompts must be scored. The judgments
might take longer than rubric scoring, but a large number of lengthy trainings would be avoided.
To replicate this study and to examine other potential uses, a future study will apply
comparative judgment in parallel to the operational scoring of a field-test essay prompt. That is,
range-finding panelists will use paired comparative judgment to generate a rank ordering of

EVALUATING COMPARATIVE JUDGMENT 21
responses for selecting anchor papers, judges will compare responses to generate measures of
student performance, and those measures will possibly serve as input for the training of an
automated essay scoring engine. If teachers serve as judges, they will be surveyed about the
professional development benefits of participation. This next study will likely apply adaptive
comparative judgment (Pollitt, 2012) to improve the efficiency and effectiveness of the pairing
process.
In all, comparative judgment shows promise as a methodological component of large-
scale assessment programs, but gaining acceptance will be challenging. Test consumers view
current scoring procedures as trustworthy (and legally defensible), so any new procedure will
need to demonstrate ample validity evidence. In addition, the comparative judgment process
runs contrary to current assessment trends toward transparency and criterion referencing. That
is, the process of making comparative judgments may be intuitive, but it will be challenging to
explain the estimation of comparative judgment measures (as is explaining item response theory
ability estimates). In addition, comparative judgment measures are inherently norm-referenced,
so unless they are anchored to some criterion-referenced scale, results will not provide actionable
feedback to teachers and students. Initially, comparative judgment is likely to gain the most
traction in low-stakes assessment contexts such as field-test scoring.
EVALUATING COMPARATIVE JUDGMENT 22
References
AERA, APA, & NCME. (2014). Standards for educational and psychological testing.
Washington, DC: American Educational Research Association.
Andrich, D.A. (1978a). A rating formulation for ordered response categories. Psychometrika,
43(4), 561-573. doi: 10.1007/BF02293814
Andrich, D.A. (1978b). Relationships between the thurstone and Rasch approaches to item
scaling. Applied Psychological Measurement, 2(3), 449-460. doi:
10.1177/014662167800200319
Attali, Y. (2014). A ranking method for evaluating constructed responses. Educational and
Psychological Measurement, Online First, 1-14. doi: 10.1177/0013164414527450
Black, B. (2008). Using an adapted rank-ordering method to investigate january versus june
awarding standards. Paper presented at the Fourth Biennial EARLI/Northumbria
Assessment Conference, Berlin, Germany. Retrieved from
http://www.cambridgeassessment.org.uk/Images/109767-using-an-adapted-rank-
ordering-method-to-investigate-january-versus-june-awarding-standards.pdf
Black, B., & Bramley, T. (2008). Investigating a judgemental rank-ordering method for
maintaining standards in uk examinations. Research Papers in Education, 23(3), 357-
373. doi: 10.1080/02671520701755440
Bradley, R.A., & Terry, M.E. (1952). Rank analysis of incomplete block designs: The method of
paired comparisons. Biometrika, 39, 324-345. doi: 10.2307/2527550
Bramley, T. (2005). A rank-ordering method for equating tests by expert judgment. Journal of
Applied Measurement, 6(2), 202-223.

EVALUATING COMPARATIVE JUDGMENT 23
Bramley, T., Bell, J.F., & Pollitt, A. (1998). Assessing changes in standards over time using
thurstone paired comparisons. Education Research and Perspectives, 25(2), 1-24.
Bramley, T., & Oates, T. (2011). Rank ordering and paired comparisons – the way cambridge
assessment is using them in operational and experimental work. Research Matters(11),
32-35.
Ferrara, S., & DeMauro, G.E. (2006). Standardized assessment of individual achievement in k-
12. In R. L. Brennan (Ed.), Educational measurement (4th ed., pp. 579-621). Westport,
CT: Praeger.
Forster, M. (2005). Can examiners successfully distinguish between scripts that vary by only a
small range on marks? Unpublished internal paper, Oxford Cambridge and RSA
Examinations.
Gill, T., & Bramley, T. (2008). How accurate are examiners’ judgments of script quality? An
investigation of absolute and relative judgments in two units, one with a wide and one
with a narrow ‘zone of uncertainty’. Paper presented at the British Educational Research
Association Annual Conference, Edinburgh, Scotland. Retrieved from
http://www.cambridgeassessment.org.uk/Images/111249-how-accurate-are-examiners-
judgments-of-script-quality-.pdf
Gill, T., Bramley, T., & Black, B. (2007). An investigation of standard maintaining in gcse
english using a rank-ordering method. Paper presented at the British Educational
Research Association Annual Conference, London, England. Retrieved from
http://www.cambridgeassessment.org.uk/Images/109760-an-investigation-of-standard-
maintaining-in-gcse-english-using-a-rank-ordering-method.pdf

EVALUATING COMPARATIVE JUDGMENT 24
Heldsinger, S.A., & Humphry, S.M. (2010). Using the method of pairwise comparison to obtain
reliable teacher assessments. The Australian Educational Researcher, 37(2), 1-19. doi:
10.1007/BF03216919
Heldsinger, S.A., & Humphry, S.M. (2013). Using calibrated exemplars in the teacher-
assessment of writing: An empirical study. Educational Research, 55(3), 219-235. doi:
10.1080/00131881.2013.825159
Jones, I., & Alcock, L. (2014). Peer assessment without assessment criteria. Studies in Higher
Education, 39(10), 1774-1787. doi: 10.1080/03075079.2013.821974
Jones, I., Swan, M., & Pollitt, A. (2015). Assessing mathematical problem solving using
comparative judgment. International Journal of Science and Mathematics Education,
13(1), 151-177. doi: 10.1007/s10763-013-9497-6
Jones, M. (2014). Teacher scoring as professional development. Panel Discussion at the
California Educational Research Association Annual Conference. San Diego, CA.
Kimbell, R., Wheeler, T., Stables, K., Shepard, T., Martin, F., Davies, D., . . . Whitehouse, G.
(2009). E-scape portfolio assessment: Phase 3 report. from Technology Education
Research Unit, Goldsmiths College, University of London Retrieved from
https://www.gold.ac.uk/media/e-scape_phase3_report.pdf
Linacre, J.M. (2014). A user's guide to FACETS: Rasch-model computer programs. Chicago, IL:
MESA Press.
Luce, R. (1959). Individual choice behavior. New York, NY: Wiley.
Lunn, D.J., Thomas, A., Best, N., & Spiegelhalter, D. (2000). WinBUGS – a Bayesian modelling
framework: Concepts, structure, and extensibility. Statistics and Computing, 10, 325-337.
doi: 10.1023/A:1008929526011

EVALUATING COMPARATIVE JUDGMENT 25
Pollitt, A. (2004). Let’s stop marking exams. Paper presented at the IAEA Conference,
Philadelphia, PA. Retrieved from
http://www.cambridgeassessment.org.uk/Images/109719-let-s-stop-marking-exams.pdf
Pollitt, A. (2012). The method of adaptive comparative judgement. Assessment in Education:
Principles, Policy & Practice, 19(3), 281-300. doi: 10.1080/0969594X.2012.665354
Pollitt, A., & Crisp, V. (2004). Could comparative judgements of script quality replace
traditional marking and improve the validity of exam questions? Paper presented at the
British Educational Research Association Annual Conference, Manchester, England.
Retrieved from http://www.cambridgeassessment.org.uk/Images/109724-could-
comparative-judgements-of-script-quality-replace-traditional-marking-and-improve-the-
validity-of-exam-questions-.pdf
Pollitt, A., & Elliott, G. (2003). Finding a proper role for human judgement in the examination
system. Paper presented at the Qualifications and Curriculum Authority Seminar on
‘Standards and Comparability’. Retrieved from
http://www.cambridgeassessment.org.uk/Images/109706-finding-a-proper-role-for-
human-judgement-in-the-examination-system..pdf
Raikes, N., Scorey, S., & Shiell, H. (2008). Grading examinations using expert judgements from
a diverse pool of judges. Paper presented at the Annual Conference of the International
Association for Educational Assessment, Cambridge, England. Retrieved from
http://www.cambridgeassessment.org.uk/Images/109766-grading-examinations-using-
expert-judgements-from-a-diverse-pool-of-judges.pdf

EVALUATING COMPARATIVE JUDGMENT 26
Shah, N.B., Balakrishnan, S., Bradley, J., Parekh, A., Ramchandran, K., & Wainwright, M.
(Producer). (2014). When is it better to compare than to score? arXiv. Retrieved from
http://arxiv.org/abs/1406.6618
Stewart, N., Brown, G.D.A., & Chater, N. (2005). Absolute identification by relative judgment.
Psychological Review, 112(4), 881-911. doi: 10.1037/0033-295X.112.4.881
Thurstone, L.L. (1927). A law of comparative judgment. Psychological Review, 34(4), 273-286.
doi: 10.1037/h0070288
Whitehouse, C., & Pollitt, A. (Producer). (2012). Using adaptive comparative judgement to
obtain a highly reliable rank order in summative assessment. Retrieved from
https://cerp.aqa.org.uk/sites/default/files/pdf_upload/CERP_RP_CW_20062012_2.pdf
Wolfe, E.W., & McVay, A. (2012). Application of latent trait models to identifying substantively
interesting raters. Educational Measurement: Issues and Practice, 31(3), 31-37. doi:
10.1111/j.1745-3992.2012.00241.x
Wright, B.D., & Linacre, J.M. (1989). Observations are always ordinal: Measurement, however,
must be interval. Archives of Physical Measurement and Rehabilitation, 70(12), 857-860.
Yim, L.W.K., & Shaw, S. (2009). A comparability study using a rank-ordering methodology at
syllabus level between examination boards. Paper presented at the International
Association for Educational Assessment Annual Conference, Brisbane, Australia.
Retrieved from http://www.iaea.info/documents/paper_4d722c4f.PDF

EVALUATING COMPARATIVE JUDGMENT 27
Table 1
Prior Studies involving Comparative Judgments of Student Performance
Study Use Study Description Reliability Validity
Bramley et al.
(1998)
Maintaining
standards
Judges compared mathematics and
English exam from different years
"a [mathematics] scale consistent with the raw
mark scale was produced", "little relationship
between [English] rater measure and the mark"
Pollitt and
Crisp (2004)
Evaluate
performance
Judges compared geography exams .86 correlation with ranks based on traditional
marks
Bramley
(2005)
Maintaining
standards
Judges each rank ordered 4 sets of
10 reading exams from different
years
.97 .92 correlation to 2003 test scores, .95
correlation to 2004 test scores
Forster (2005) Maintaining
standards
Judges compared English, business,
and geography exams
.98–.99 5 out of 6 correlations were non-significant
Gill et al.
(2007)
Maintaining
standards
Judges rank ordered sets of 10
English exams
.98 .83–.94 correlation with exam marks
Black (2008) Maintaining Judges rank ordered sets of 3 > .75

EVALUATING COMPARATIVE JUDGMENT 28
standards economics exams
Black and
Bramley
(2008)
Maintaining
standards
Judges rank ordered sets of 10
exams
.81–.92 correlation with exam marks
Raikes et al.
(2008)
Maintaining
standards
Judges rank ordered sets of 3
biology exams from 2007 and 2008
.95–.97 .91–.96 correlation with exam scores
Kimbell et al.
(2009)
Evaluate
performance
Teachers compared design &
technology, science, and geography
portfolios in an online interface
.95, .96 .507 correlation with science exam scores
Yim and
Shaw (2009)
Maintaining
standards
Judges rank ordered packs of 12
exams administered by different
examination boards
.98 .98, .99 correlation with syllabus %
Heldsinger
and Humphry
(2010)
Evaluate
performance
Teachers compared narrative essays
across 7 grade levels
.98 .92 correlation with rubric scores

EVALUATING COMPARATIVE JUDGMENT 29
Whitehouse
and Pollitt
(2012)
Evaluate
performance
Judges compared geography essays .97 .63 correlation with traditional marks
Heldsinger
and Humphry
(2013)
Evaluate
performance
Teachers compared samples of
student writing
.99
I. Jones and
Alcock (2014)
Evaluate
performance
Students compared each other’s
mathematics exams, and results
were compared to 20 experts
.73–.97 .20 (students) and .31 (expert) correlation with
a calculus test
Attali (2014) Evaluate
performance
Judges ranked sets of 5 responses to
reading and writing short-answer
questions
.38–.60 correlation with rubric scores
I. Jones et al.
(2015)
Evaluate
performance
Judges compared mathematics and
mathematical problem solving
exams
.80, .93
.85, .93
.91 correlation with grades, .88 correlation with
exam scores

Running head: EVALUATING COMPARATIVE JUDGMENT 30
Table 2
Correspondence between Rubric Scores and Comparative Judgment (CJ) Measures
Prompt 1
Prompt 2
Rubric CJ (rounded) Rubric CJ (rounded)
Mean 2.20 2.40
2.20 2.21
SD 0.93 0.97
0.93 0.98
Exact Agreement 60.0%
64.0%
Adjacent Agreement 38.5%
33.5%
Correlation .78 .76

EVALUATING COMPARATIVE JUDGMENT 31
Table 3
Summary of Time on Task in Seconds
Prompt 1
Prompt 2
Both
Overall Min Max Overall Min Max Overall
Rubric Mean 121.2 88.5 190.5
116.4 73.2 307.7
119.4
CJ Mean 116.7 56.1 156.5
70.5 35.0 99.4
93.5
CJ Median 83.0 48.0 129.5 45.0 26.0 80.0 62.0
EVALUATING COMPARATIVE JUDGMENT 32
Figure 1. Plot of reliability versus average number of comparisons (with best-fit reciprocal
function).
Prompt 1
Average Number of Comparisons per Object
Re
lia
bility
0 2 4 6 8 10 12 14 16 18 20
0.4
0.5
0.6
0.7
0.8
0.9
1.0
Prompt 2
Average Number of Comparisons per Object
Re
lia
bility
0 2 4 6 8 10 12 14 16 18 20
0.4
0.5
0.6
0.7
0.8
0.9
1.0