running head: characterization of gapc-1 deficiency in ... · many organisms including plants...
TRANSCRIPT

1
Running head: Characterization of GAPC-1 deficiency in Arabidopsis
Author to whom all correspondence should be sent:
Diego Gomez-Casati
Instituto de Investigaciones Biotecnológicas-Instituto Tecnológico de Chascomús (IIB-
INTECH) CONICET/UNSAM, Camino Circunvalación Km 6, 7130, Chascomús,
Argentina.
Phone: +54 2241 430323
Fax: +54 2241 424048
e-mail: [email protected]
Plant Physiology Preview. Published on September 26, 2008, as DOI:10.1104/pp.108.128769
Copyright 2008 by the American Society of Plant Biologists
www.plantphysiol.orgon December 26, 2019 - Published by Downloaded from Copyright © 2008 American Society of Plant Biologists. All rights reserved.

2
Characterization of Arabidopsis thaliana lines deficient in GAPC-1, a cytosolic
NAD-dependent glyceraldehyde 3-phosphate dehydrogenase
Sebastián P. Rius1, Paula Casati2, Alberto A. Iglesias3, and Diego F. Gomez-Casati1
1Instituto de Investigaciones Biotecnológicas-Instituto Tecnológico de Chascomús (IIB-
INTECH) CONICET/UNSAM, Camino Circunvalación Km 6, 7130, Chascomús,
Argentina. 2Centro de Estudios Fotosintéticos y Bioquímicos (CEFOBI), Universidad Nacional de
Rosario, Argentina. 3Laboratorio de Enzimología Molecular, Facultad de Bioquímica y Ciencias Biológicas,
UNL, Santa Fe, Argentina
www.plantphysiol.orgon December 26, 2019 - Published by Downloaded from Copyright © 2008 American Society of Plant Biologists. All rights reserved.

3
Footnotes:
This work was supported by grants from CONICET (PIP-6241) and ANPCyT
(PICT’06-00614) to DFGC, ANPCyT (PICTO03-13241 and 05-13129, PICT’03-14733,
PAV’03-137) CONICET (PIP-6357) and CAI+D’06 to AAI, and ANPCyT (PICT’03-
13278) and Fundación Antorchas (4306-5) to PC.
Corresponding author: Diego Gomez-Casati
e-mail: [email protected]
www.plantphysiol.orgon December 26, 2019 - Published by Downloaded from Copyright © 2008 American Society of Plant Biologists. All rights reserved.

4
ABSTRACT
Phosphorylating glyceraldehyde 3-phosphate dehydrogenase (GAPC-1) is a
highly conserved cytosolic enzyme that catalyzes the conversion of glyceraldehyde-3-P
to 1,3-bis-phosphoglycerate; besides its participation in glycolysis, it is thought to be
involved in additional cellular functions. To reach an integrative view on the many roles
played by this enzyme, we characterized a homozygous gapc-1 null mutant and an as-
GAPC1 line of Arabidopsis thaliana. Both mutant plant lines show a delay in growth,
morphological alterations in siliques and low seed number. Embryo development was
altered showing abortions and empty embryonic sacs in basal and apical siliques,
respectively. gapc-1 line shows a decrease in ATP levels and reduced respiratory rate.
Furthermore, both lines exhibit a decrease in the expression and activity of aconitase
and succinate dehydrogenase and reduced levels of pyruvate and several Krebs cycle
intermediates, as well as increased reactive oxygen species levels. Transcriptome
analysis of the gapc-1 mutants unveil a differential accumulation of transcripts encoding
for enzymes involved in carbon partitioning. According to these studies, some enzymes
involved in carbon flux decreased (phosphoenolpyruvate carboxylase, NAD-malic
enzyme, glucose-6-P dehydrogenase) or increased (NAD-malate dehydrogenase) their
activities compared to the wt line. Taken together, our data indicate that a deficiency in
the cytosolic GAPC activity results in modifications of carbon flux and mitochondrial
dysfunction, leading to an alteration of plant and embryo development with decreased
number of seeds, indicating that GAPC-1 is essential for normal fertility in Arabidopsis
plants.
www.plantphysiol.orgon December 26, 2019 - Published by Downloaded from Copyright © 2008 American Society of Plant Biologists. All rights reserved.

5
INTRODUCTION
Glyceraldehyde 3-phosphate dehydrogenases (GAPDHs) are enzymes conserved
in all living organisms, where they play a central role in the carbon economy of the
cells. Higher plants possess four distinct isoforms of GAPDHs: (i) GAPC, a cytosolic
phosphorylating NAD-specific GAPDH catalyzing the conversion of glyceraldehyde 3-
phosphate (Ga3P) to 1,3-bisphosphoglycerate, (ii) NP-GAPDH, a cytosolic non-
phosphorylating NADP-dependent GAPDH which catalyzes the oxidation of Ga3P to 3-
phosphoglycerate (3PGA) (Valverde et al., 2005), (iii) GAPA/B, a phosphorylating
NADP-specific GAPDH involved in photosynthetic CO2 fixation in chloroplasts (Cerff
and Chambers, 1979) and (iv) GAPCp, involved in glycolytic energy production in non-
green plastids (Petersen et al., 2003).
Much is known concerning the gene structure, evolution, and functional
properties of GAPDHs in algal systems (Koksharova et al., 1998; Fillinger et al., 2000;
Perusse and Schoen, 2004; Valverde et al., 2005); whereas in higher plants, the
characterization of GAPDHs was mainly performed on the chloroplastic isoforms which
are activated by thioredoxins (Wolosiuk and Buchanan, 1978; Fermani et al., 2007).
In the recent years detailed studies have been carried out on structure–function
relationships (Mateos and Serrano, 1992; Habenicht et al., 1994; Michels et al., 1994;
Petersen et al., 2003; Anderson et al., 2004; Hancock et al., 2005) and kinetic properties
(Gomez Casati et al., 2000; Bustos and Iglesias, 2002; Iglesias et al., 2002; Bustos and
Iglesias, 2003) of the cytosolic GAPDHs. However, only few reports have been focused
on their in vivo functions (Hajirezaei et al., 2006; Rius et al., 2006; Wang et al., 2007).
It has been proposed that the NP-GAPDH isoform plays a central role in a shuttle
system mechanism for the transport of the NADPH generated by photosynthesis from
the chloroplast to the cytosol and in providing NADPH for gluconeogenesis (Kelly and
Gibbs, 1973; Rumpho et al., 1983; Habenicht, 1997). Recently, we reported that NP-
GAPDH could be important in fruit development and energetic metabolism.
Interestingly, a mutation in the NP-GAPDH gene induced the expression of the
cytosolic GAPC-1 isoform (Rius et al., 2006).
It has been largely described the importance of GAPC in photosynthetic tissues,
however, only few reports described its function in heterotrophic tissues (Fernie et al.,
2004; Hajirezaei et al., 2006). Furthermore, GAPC-1 is cytoskeletally-associated in
many organisms including plants (Chuong et al., 2004). Additionally, it was found
www.plantphysiol.orgon December 26, 2019 - Published by Downloaded from Copyright © 2008 American Society of Plant Biologists. All rights reserved.

6
associated to other glycolytic enzymes, both in the cytoskeleton and in the mitochondria
of Arabidopsis (Giege et al., 2003; Holtgrawe et al., 2005). Thus, it was postulated that
glycolytic proteins may be important in mitochondrial energetic metabolism and in
regulating mitochondrial functions (Giege et al., 2003). Additionaly, the coexistence of
GAPC and NP-GAPDH in the cytosol establishes a bypass of carbon flux during the
glycolysis, which very likely improves the flexibility to respond to environmental
stresses. However, the precise consequences of these alternative pathways on the carbon
economy and the growth and development of plants have not been explored.
In this work we isolated and characterized two lines exhibiting a GAPC-1
deficiency: a null mutant line of A. thaliana deficient in GAPC-1 expression (gapc-1,
SALK_010839) and a transgenic line expressing the antisense version of the GAPC-1
gene (At3g04120, as-GAPC1). Both lines exhibited defects in fertility, with alterations
in seed and fruit development, suggesting that GAPC-1 is essential in these organs. The
molecular, biochemical and physiological study of these lines indicate that this enzyme
plays critical and pleiotropic roles, being essential for the maintenance of cellular ATP
levels and carbohydrate metabolism and required for full fertility in Arabidopsis.
www.plantphysiol.orgon December 26, 2019 - Published by Downloaded from Copyright © 2008 American Society of Plant Biologists. All rights reserved.

7
RESULTS
Identification of a gapc-1 mutant and construction of the antisense as-GAPC1 line
To evaluate the possible(s) function(s) of the GAPC-1 gene in A. thaliana, we
selected a T-DNA insertion mutant from the ABRC seed stock (SALK_010839, gapc-
1). GAPC-1 (At3g04120, 1017 bp) is composed by 9 exons and 8 introns and, in gapc-1
plants, the T-DNA is inserted in the ninth exon (Figure 1A). gapc-1 homozygous plants
were isolated using PCR screening and segregation analysis and DNA gel blot
hybridization indicate that the mutant plants contained only one copy of T-DNA (data
not shown).
To obtain a second GAPC-1 deficient line, we constructed a transgenic antisense
line (as-GAPC1) by transformation with pCambia 2200 plasmid (Hajdukiewiez et al.,
1994) (Figure 1B). The expression of GAPC-1 in null mutants and as-GAPC1 plants
verified by RT-PCR analysis show that GAPC-1 mRNA is absent in gapc-1 plants,
confirming that the T-DNA insertion impairs GAPC expression (Figure 1C). In the as-
GAPC1 line, there is a 30% decrease in GAPC-1 transcripts compared to wt plants
(Figure 1C). The GAPC protein levels determined by western blot using specific
antibodies show a decrease of 23 ± 5 % and 27 ± 8 % in gapc-1 and as-GAPC1 plants,
respectively (Figure 2A). Moreover, we determined that total GAPC activity is 50%
decreased in leaves and flowers of both lines (Figure 2B). Although we observed a
complete absence of the GAPC-1 transcript in the gapc-1 line, the amount of protein
was reduced in a way that the decrease in GAPC total activity was only about 50% of
that determined for wt plants; which very likely results from the activity of: (i) other
GAPC isoforms encoded by GAPC-2 (At1g13440), GAPCp-1 (At1g16300) or GAPCp-
2 (At1g79530) in the Arabidopsis genome, or (ii) the GAPA/B isoform, which use
preferentially NADPH, but it is also active in the presence of NADH (Sparla et al.,
2004).
Phenotypic characterization of gapc-1 and as-GAPC1 plants
Under normal growth conditions, gapc-1 and as-GAPC1 plants exhibited
retarded growth at different developmental stages compared to wt plants (Figure 3A and
B). While we did not observe differences in the morphology of roots and leaves, flowers
and fruits were severely affected in their morphology, with fruits displaying alterations
in their size and weight (Figure 3C). Wt plants have normal amounts of seeds per
www.plantphysiol.orgon December 26, 2019 - Published by Downloaded from Copyright © 2008 American Society of Plant Biologists. All rights reserved.

8
silique (45 ± 5) and normal morphology (Figure 3D), whereas gapc-1 and as-GAPC1
plants showed aberrant seed development and seed number deficiency (Figure 3E and
F). The reduced number of seeds (about 12% and 6% for gapc-1 and as-GAPC1 plants,
respectively) was frequently accompanied by empty embryo sacs (Table 1). These
results suggest that GAPC activity is essential for zygotic and/or early embryo
development. Because GAPC-1 deficient plants have abnormal fruit development, we
investigated whether or not pollen viability and/or pollen tube elongation was affected
in post-anthesis flowers of these plants. Pollen grains from gapc-1 and as-GAPC1 lines
showed apparently normal morphology. However, they were not fertile and showed
defects in pollen tube germination in vitro. We observed 23% and 21% viable pollen
grains in gapc-1 and as-GAPC1 lines, respectively compared to more than 95% of
germinated pollen in wt plants (Figure 4).
When the gapc-1 plants were fertilized with wt pollen, the resulting F1 plants
exhibited a silique morphology and seed production similar to the wt phenotype with 43
± 6 seeds/silique, and the absence of empty sacs or aborted seeds observed in the mutant
line (Figure 5 A and B). This result suggests that the reduced fertility of the mutant was
due to defects in male organs and the female fertility was unaffected.
Analysis of gapc-1 plants
To have a better assessment of the way by which GAPC-activity changes
determine the observed phenotype, we next compared the transcriptome of gapc-1 and
wt plants. Results were analyzed to state a primary relationship between transcript
levels and changes in enzyme activities and/or protein function. In addition, we also
sought for further evidence of changes determining levels of protein and/or activity for
many of the implied enzymes.
Microarray analysis revealed alterations in the expression of genes encoding for
glycolytic and Krebs cycle enzymes in gapc-1 plants. As shown in Table 2, we
observed a down-regulation of several genes involved in these pathways: GAPC-2, NP-
GAPDH, two phosphofructokinases (PFK) genes, two pyruvate kinase (PK) genes and
triosephosphate isomerase (TPI). Conversely, we observed an up-regulation of two
malate dehydrogenases (NAD-MDH). As shown in Table 2, there is also an alteration in
the transcript levels of several genes related to photosynthesis, such as RubisCO SSU
(At1g67090), RubisCO LSU (At1g14030 and At4g20130) and RCA (RubisCO activase:
At2g39730). Furthermore, several genes involved in the TCA cycle showed decreased
www.plantphysiol.orgon December 26, 2019 - Published by Downloaded from Copyright © 2008 American Society of Plant Biologists. All rights reserved.

9
expression: citrate synthase (At3g60100), SDH (At3g27380) and aconitase (At2g05710
and At4g26970). Also, several genes encoding for enzymes related to stress responses
showed altered expression, such as different peroxidase isoforms, peroxiredoxin
(At1g65970), alternative oxidase (At5g64210) and three isoforms of catalase. Thus,
microarray results suggest that mutants have an altered metabolism, which can induce a
stress situation that could account for the delayed growth observed in the GAPC-
deficient plants.
As described above, GAPC and NP-GAPDH participate in a bypass step of the
glycolysis in plants, catalyzing the production of 3PGA, NADH and ATP or 3PGA and
NADPH, respectively. To further characterize the regulation of this bypass, we analyzed
the expression of NP-GAPDH in gapc-1 and as-GAPC1 plants. A decrease of 25% and
92% in the expression of NP-GAPDH in gapc-1 and as-GAPC1, respectively was
observed (Figure 6); in agreement with the decrease determined by microarray analysis
(Table 2), and also with the decrease in NP-GAPDH specific activity (Figure 7A). This
is in contrast to the results obtained with np-gapdh mutant plants where the expression
of GAPC-1 is induced in the absence of NP-GAPDH. In addition, we did not observe an
up-regulation of genes encoding for Glc-6-phosphate dehydrogenase (G6PDH) isoforms
either by microarrays or RT-PCR experiments as was observed in the np-gapdh plants
(Rius et al., 2006). These data suggest that differences in the regulation or in the
compensatory responses of GAPC-1 and NP-GAPDH genes exist in np-gapdh and
gapc-1 mutant lines. In addition to GAPC-1, other cytosolic GAPDH isoforms could
contribute in the maintenance of the carbon flux through the glycolytic pathway, such as
GAPC-2. Therefore, the expression of GAPC-2 was analyzed. As shown in Figure 6, we
found 48% and 37% decrease of GAPC-2 mRNA levels in gapc-1 and as-GAPC1 lines,
respectively.
As mentioned above, microarray data from gapc-1 plants show an alteration in
the level of transcripts encoding for glycolytic and energy metabolism enzymes (Table
2). To assess the impact of alterations in gene expression observed in microarrays, we
evaluated the activity of several enzymes involved in both pathways (Figure 7A). A
25% decrease in PK activity was detected in gapc-1 plants. This correlates with the 74%
and 57% decrease in the two PK genes expression determined by RT-PCR for gapc-1
and as-GAPC1 plants (Figure 7B) and microarray experiments with gapc-1 mutants
(Table 2). We also observed decreases in the activity of other enzymes in the mutant
plants: 49% for phosphoenolpyruvate carboxylase (PEPC), 24% for NAD-malic
www.plantphysiol.orgon December 26, 2019 - Published by Downloaded from Copyright © 2008 American Society of Plant Biologists. All rights reserved.

10
enzyme (NAD-ME), and 39% for G6PDH (Figure 7A). The decrease in several
glycolytic transcripts such as the two PK genes and the inhibition of PK activity (the
primary point of regulation of plant glycolysis), as well as the inhibition of other
glycolytic enzymes give a strong support that GAPC-1 deficiency lead to an inhibition
of carbohydrate metabolism.
Russell and Sachs (1989) and Yang et al. (1993) have shown that glycolytic
genes, whose functions are required for both glycolysis and fermentation, were
expressed at high levels under normoxia, but could be induced further by anoxia or
hypoxia. The pyruvate decarboxylase (PDC), a gene that function in alcoholic
fermentation, is expressed at extremely low levels in plant cells under normal growth
conditions and its expression is strongly induced by hypoxia or anoxia (Conley et al.,
1999). A study on the expression of PDC-2 in leaves from wt, gapc-1 and as-GAPC1
plants by RT-PCR shows that PDC-2 transcript is accumulated at lower levels in
GAPC-deficient plants than in wt plants (Figure 7B).
As described above, some genes related to photosynthesis were decreased in
microarray analysis; for example, RubisCO SSU and RCA. We confirm the decrease in
RCA transcript levels (about 50%) by RT-PCR analysis. However, a slight increase of
RubisCO SSU mRNA expression was observed (Figure 7B). Furthermore, transcription
of many genes encoding for enzymes related to stress responses such as the three
catalases were repressed (Figure 7B, see also Table 2). Thus, microarray and RT-PCR
results suggest that mutants have an altered photosynthetic and carbon metabolism,
which can induce a stress situation that could account in a delayed growth.
gapc-1 and as-GAPC1 plants showed changes in the levels of glycolytic and TCA
intermediates
To evaluate the effect of the GAPC deficiency in glycolytic or TCA
intermediates, we quantified the levels of pyruvate, the end product of the glycolysis,
and malate, the product of the alternative glycolytic pathway. Furthermore, we
determined the levels of two metabolites of the TCA cycle, citrate and isocitrate.
The gapc-1 and as-GAPC1 plants accumulate 31% and 22%, respectively, of the
pyruvate levels compared to wt, whereas there is an increase of about 1.7-fold in the
accumulation of malate in both lines. Indeed, gapc-1 and as-GAPC1 plants showed a
reduction in TCA intermediates levels such as citrate (40 and 32%, respectively) and
isocitrate (54 and 27 %, respectively) (Table 3).
www.plantphysiol.orgon December 26, 2019 - Published by Downloaded from Copyright © 2008 American Society of Plant Biologists. All rights reserved.

11
gapc-1 plants show reduced levels of oxygen uptake, ATP and reduced expression
and activity TCA cycle enzymes
It has been demonstrated that GAPC-1 and other glycolytic enzymes are
associated to the mitochondrial outer membrane in Arabidopsis (Giege et al., 2003). The
respiratory pathways of glycolysis, TCA cycle and the mitochondrial electron transport
chain are ubiquitous throughout nature. Although the series of enzymes and proteins
that participate in these pathways have long been known, their regulation and control
are much less well understood (Fernie et al., 2004). GAPC-1 deficiency in mutant plants
could be affecting the carbon flux units destined to the TCA cycle. This would affect the
respiratory chain function and O2 uptake, with consequences on the ATP produced
during oxidative phosphorylation in the mitochondria. To determine the effect of
GAPC-1 deficiency on mitochondrial function, we measured the oxygen uptake in
mature rosette leaves (6-weeks old) and flowers. Our results show a decrease of 39.5%
in leaf respiration in gapc-1 mutants compared to wt plants (Figure 8A). Furthermore,
flowers also showed a decrease of 23% in oxygen uptake compared to wt.
The energetic status of the gapc-1 line was evaluated by measuring total ATP
levels. We found a 38% and 29.4% decrease of ATP concentration in mutant leaves and
flowers, respectively (Figure 8B). The results suggest that GAPC-1 deficiency has an
important effect on ATP levels, in correlation with the decrease in the respiration rate
observed in the mutant plants (Figure 8A).
The decrease in ATP pools and the reduction of the respiration rate in mutant
plants correlate with a reduced expression of genes involved in the TCA cycle such as
aconitase and succinate dehydrogenase determined by RT-PCR (Figure 8C). This is in
agreement with the observed decrease in aconitase (15% and 20% in gapc-1 and as-
GAPC1 plants, respectively) and SDH activity (about 20% in both lines, Figure 8C).
Taken together, our results suggest that the GAPC-1 deficiency affects not only the
glycolysis, but also the function of other respiratory pathways, and that this metabolic
deficit could be the cause of the phenotypes observed in reproductive tissues, which
depend mainly on respiration to obtain energy.
gapc-1 and as-GAPC1 plants exhibit increase reactive oxygen species (ROS)
accumulation and higher density of trichomes
Recently, it has been suggested that GAPC plays a regulatory role in ROS
signaling in plants (Hancock et al., 2005). To evaluate the consequences of GAPC-1
www.plantphysiol.orgon December 26, 2019 - Published by Downloaded from Copyright © 2008 American Society of Plant Biologists. All rights reserved.

12
deficiency, we determined ROS levels in gapc-1 and as-GAPC1 lines by histochemical
detection using H2DCFDA. We found an increase in ROS accumulation, as the
fluorescence in trichomes is higher in both lines compared to wt plants (Figure 9A).
Furthermore, an increase in the trichome density was observed in null mutants and
antisense lines (Figure 9B). A special role in detoxification has been assigned to
trichomes of Brassica juncea that accumulate cadmium (Salt et al., 1995). Also, it has
been proposed that Arabidopsis trichome cells have a role in GSH biosynthesis, and
they may also function as a sink during detoxification processes, suggesting that
trichomes may have a role in xenobiotic conjugation (Gutierrez-Alcala et al., 2000).
Microarray data also show that transcripts levels for several genes encoding
proteins that participate in oxidative stress response such as peroxidases (PER62,
PER41, PER52, PER9 and PER2) and superoxide dismutase [Cu-Zn] show increased
levels in gapc-1 plants. In addition, we measured by RT-PCR the mRNA levels of other
genes encoding for proteins involved in stress responses such as peroxiredoxin and
alternative oxidase (Sweetlove et al., 2002) which showed a slight change in expression
(Figure 9C). All together, these data support the existence of increased oxidative stress
in GAPC-1 deficient plants.
www.plantphysiol.orgon December 26, 2019 - Published by Downloaded from Copyright © 2008 American Society of Plant Biologists. All rights reserved.

13
DISCUSSION
To investigate other possible physiological functions of GAPC-1, we
characterized two GAPC deficient lines: a T-DNA insertional mutant (SALK_010839,
gapc-1) and an antisense line, as-GAPC1. We found evidence that GAPC-1 plays an
important role and is required for full fertility in Arabidopsis plants. The knockout
mutant gapc-1 is null in terms of GAPC-1 expression and the as-GAPC1 line displayed
a decrease in the expression of GAPC-1 transcript. Accordingly, both lines showed
lower levels of GAPC protein by western blot analysis (Figures 1 and 2) and reduced
activity in leaves and flowers (Figure 2 B). Western blot analysis performed in gapc-1
and as-GAPC1 plants revealed the presence of a protein band that reacts with a-GAPC
antibodies. This can be due to the expression of GAPC-2, a cytosolic isoform of GAPC
having high structural similarity with GAPC-1; whereas GAPC-2, GAPCp and/or
GAPA/B isoforms could contribute to the NADH-dependent residual activity observed
in the two lines.
Both gapc-1 and as-GAPC1 plants exhibited a delay in growth. Indeed, both
lines presented an alteration in siliques morphology and seed production. The defect in
pollen tube germination and the restoration of viable seed production after crossing
experiments using wt pollen indicate that GAPC-1 function is important in male organs
and suggest that the decrease in GAPC-1 activity impairs the mitochondrial function
required for normal pollen production (Heiser et al., 1997). The phenotypes obtained
showed that GAPC activity is essential in reproductive tissues and revealed the
importance of GAPC-1 gene in plant development and fructification. In order to link
this phenotype with the underlying mechanisms determining it, we investigated the
effects of the mutation on the GAPC-1 gene in the glycolysis by transcriptome analysis
of gapc-1 plants. Our results demonstrate that this line exhibited a down-regulation of
several genes involved in glycolysis: NP-GAPDH, GAPC-2, TPI, PFKs and PK.
Furthermore, we confirmed that the glycolytic pathway is altered in the GAPC deficient
plants by measuring the activity of some of the enzymes of this pathway. It has been
reported that PK is the primary point of regulation of glycolysis (Plaxton, 1996; Plaxton
and Podestá, 2006). Our results indicate that there is a downregulation of two genes
encoding for cytosolic PKs, and also a decrease in PK activity, strongly suggesting a
reduction in the glycolytic flux after GAPC-1 reaction. These results are in agreement
with previous works (Siddiquee et al., 2004; Rius et al., 2006) which illustrate that
www.plantphysiol.orgon December 26, 2019 - Published by Downloaded from Copyright © 2008 American Society of Plant Biologists. All rights reserved.

14
blocking the glycolytic pathway at the level of PK or NP-GADPH, leads to a down-
regulation of several glycolytic genes.
In a previous work, Hajirezaei et al. (2006), demonstrated that the inhibition of
phosphorylating GAPC in potato plants does not greatly affect sugar metabolism in
leaves or tubers; however there was an alteration in the levels of several glycolytic
intermediates. It has been suggested that the lack of phosphorylating GAPC can be
compensated by other isoforms, such as NP-GAPDH. To investigate this hypothesis, we
analyzed the expression of NP-GAPDH and GAPC-2 in gapc-1 and as-GAPC1 plants.
Interestingly, the mutation in the GAPC-1 gene did not induce the expression of other
cytosolic GAPC isoforms. In contrast to what we observed previously in np-gapdh
plants (Rius et al., 2006), the mutation on GAPC-1 produced a decrease in NP-GAPDH
and GAPC-2 mRNA levels in both, gapc-1 and as-GAPC1 lines.
In plants, the glycolytic carbon flux can pass through the GAPC enzyme
producing 3PGA, NADH and ATP or through a metabolic bypass catalyzed by NP-
GAPDH producing 3PGA and NADPH, but not ATP. This alternative pathway has
energetic and metabolic consequences, it has been proposed to participate in a shuttle of
triose-phosphate/phosphate that indirectly transfer photosynthetically reduced NADP+
from chloroplast to cytoplasm during photosynthesis (Kelly and Gibbs, 1973) but its
regulation is not yet completely understood. A recent study has shown that the non-
phosphorylating NP-GAPDH is up-regulated during Pi starvation in Arabidopsis; while
other genes, including GAPC-1 are down-regulated (Wu et al., 2003). It is interesting to
note that GAPC-2 has been suggested to play an important role in responses to low-Pi
stress, possibly through the regulation of a glycolysis-associated “Pi-pool” and
accumulation of anthocyanin pigments in Arabidopsis (Wang et al., 2007). Our previous
work demonstrates the up-regulation of GAPC-1 in np-gapdh null mutant plants (Rius
et al., 2006). Thus, it is possible that a coordinated regulation of the expression of both
genes exists, although not reciprocally GAPC-1 to NP-GAPDH. However, the specific
regulation of this bypass is far from complete.
The deficiency of GAPC-1 activity shows a direct effect on the production of
energy as we measured a decrease in ATP cellular levels in flowers and leaves of the
gapc-1 plants. Indeed, the decrease of pyruvate levels and TCA cycle intermediates
suggest a decrease in the carbon flux through the glycolytic pathway to the
mitochondria. Pollen development in the anther and the growth of the pollen tube are
highly energy demanding processes. It has been reported that pollen granules contain 20
www.plantphysiol.orgon December 26, 2019 - Published by Downloaded from Copyright © 2008 American Society of Plant Biologists. All rights reserved.

15
times more mitochondria per cell than normal vegetative tissues in maize (Gass et al.,
2005). Thus, an intense mitochondrial activity occurs during sporogenesis. As described
by Giege et al. (2003), GAPC-1 as well as other glycolytic enzymes are physically
associated to the external mitochondrial membrane in A. thaliana. Indeed, the existence
of substrate channeling restricts the use of intermediates by competing metabolic
pathways and enhances the direct entrance of carbon to respiration, resulting in an
increase of ATP production (Graham et al., 2007). In the present work, the consequence
of GAPC deficiency in gapc-1 mutants has an important incidence on the respiration
rate, and in ATP, pyruvate, malate and other TCA cycle metabolite levels, which
suggests that the alteration in the glycolysis can affect the carbon flux and oxidative
phosphorylation in the mitochondria. It is important to note that oxidative
phosphorylation is more efficient than glycolysis for ATP production and the
mitochondria is the major supplier of the ATP used in the cytosol (Igamberdiev et al.,
1998).
It has been reported the existence of two major sites of ROS production in plant
cells, one in the chloroplast, where ROS is produced in the photosynthetic electron
transport chain and the other in the mitochondria (Millar et al., 2001; Moller, 2001;
Moller and Kristensen, 2004). The null mutants and the as-GAPC1 lines showed
increased ROS accumulation and trichome density and induction of genes involved in
stress responses, supporting the existence of increase oxidative stress in both lines.
Thus, the increased trichome density observed could be a response to higher levels of
ROS. In Arabidopsis, an increment in trichome number after stress treatments or
exposure to ionizing radiations was described to be mediated by ROS (Nagata et al.,
1999). Indeed, our results are in agreement with the proposed role of GAPC in the
control of H2O2 production (Baek et al., 2008) and in the regulation of ROS signaling in
plants (Hancock et al., 2005).
In conclusion, in the present work, we studied the effect of the disruption of
GAPC-1 gene in Arabidopsis plants using gapc-1 null mutants and antisense lines
deficient in GAPC-1 expression. Both lines showed defects in fertility, with alterations
of seed and fruit development, suggesting that GAPC-1 and the presence of a full
glycolytic pathway are essential in these organs and have an important role in fertility in
Arabidopsis. Analysis by microarrays, RT-PCR and activity suggest that a deficiency in
GAPC-1 results in an inhibition of glycolysis, mitochondrial dysfunction and increase
of oxidative stress.
www.plantphysiol.orgon December 26, 2019 - Published by Downloaded from Copyright © 2008 American Society of Plant Biologists. All rights reserved.
16
MATERIALS AND METHODS
Plant material and growth conditions
A. thaliana (var. Columbia Col-0) was used as the wt. The gapc-1 mutant plant
contains a T-DNA insertion in the ninth exon of the GAPC-1 gene At3g04120
(SALK_010839; Figure 1A). The gapc-1 mutant seeds were obtained from the T-DNA
Express Collection at the Salk Institute (http://signal.salk.edu/cgi-bin/tdnaexpress).
Seeds were germinated directly in soil and kept at 4ºC for at least 72 h before light
treatment. Plants were grown in greenhouse conditions at 25 ºC under fluorescent lamps
(Grolux, Sylvania and Cool White, Philips) with an intensity of 150 μmol m-2 s-1 using a
16 h light/8 h dark photoperiod.
Identification of insertional gapc-1 mutants
The position of the T-DNA insert was determined by PCR using the following
primers: LBb1: GCGTGGACCGCTTGCTGCAACT (http://signal.salk.edu) and
GAPC-1 (Table 4). Genomic DNA was extracted from leaves using the cetyl-trimethyl-
ammonium bromide (CTAB) method described by Sambrook et al. (1989). The
genotype was determined by PCR on genomic DNA using primers flanking the
insertion point for wt plants (GAPC-1 fw and rev, Table 4) and LBb1 and GAPC-1 fw
primer pair for the gapc-1 mutant.
Isolation of RNA and RT-PCR analysis
Total RNA from 6-week-old fully expanded rosette leaves collected from pools of 6
plants was extracted using TRI Reagent (Sigma-Aldrich, St. Louis, MO, USA). First,
cDNA synthesis was obtained using total RNA (3 μg) in the presence of random
hexamers and MMLV reverse transcriptase (USB Corp. Cleveland, OH, USA)
according to the manufacturers’ instructions. An aliquot (1 μl) from the RT reaction was
used as template in PCR reactions with the corresponding oligonucleotides (Table 4).
Semi-quantitative RT-PCR analysis was performed on the amplification of products
after 16, 20, 24 and 28 PCR cycles using (at least) three independent samples.
Appropriate number of cycles was determined for each cDNA to obtain data during the
exponential phase of the PCR reaction. β-actin was used as internal control. Specific
primer pairs were designed based on the cDNA sequence reported on GenBank for the
www.plantphysiol.orgon December 26, 2019 - Published by Downloaded from Copyright © 2008 American Society of Plant Biologists. All rights reserved.

17
desired genes. PCR products were analyzed on agarose gels and visualized using
ethidium bromide staining and/or transferred onto Hybond N+ membranes (Amersham
Biosciences, UK). Probe labeling and membrane hybridization were performed
according to the ECL Direct Nucleic Acid Labeling and Detection System protocol
(Amersham Biosciences, UK).
Microarray experiments and data analysis
Arabidopsis oligonucleotide microarrays were fabricated by the University of
Arizona and contain 26,000 oligonucleotides (http://www.ag.arizona.edu/microarray/).
All analyses were completed as described previously (Rius et al., 2006). Briefly, RNA
was isolated from 6-week-old rosette leaves obtained from pools of 8 plants, both
mutant and wt plants, grown as described above. The experimental (mutant) and
reference (wild type) RNA samples were reverse-transcribed and directly labeled with
either Cy5-dUTP or Cy3-dUTP fluorescent dye (Amersham Pharmacia Biotech,
Piscataway, NJ), using random hexamer primers (Invitrogen). After that, labeled
samples were mixed and hybridized to the microarrays. The slides were scanned with a
GenePix 4000B Scanner (Axon Instruments Inc., Union City, CA). Results were
obtained by triplicates and using samples from different experiments as biological
replicates. Data from multiple experiments were normalized (Bolstad et al., 2003) and
signals from spots from different experiments were statistically analyzed using
Significance Analysis of Microarrays employing the one class response (SAM,
http://www-stat.stanford.edu/~tibs/SAM/, Tusher et al., 2001), cut at a false discovery
rate < 10%. The microarray data are accessible through
http://www.ncbi.nlm.nih.gov/geo/ with accession number GSE3540.
Bioinformatic methods
The relative levels of mRNA transcripts for the different genes were determined by
densitometric analysis using the Gel Pro Analyzer program (Media Cybernetics, Silver
Spring, MD, USA).
Respiration measurements
Oxygen consumption was measured at 25 °C using an air-tight chamber fitted with a
Clark type electrode (Hansatech Leaf Disc Electrode Unit, Hansatech, UK). Calibration
was achieved by a simple 2-point calibration between air (21% O2) and the injection or
www.plantphysiol.orgon December 26, 2019 - Published by Downloaded from Copyright © 2008 American Society of Plant Biologists. All rights reserved.

18
removal of a known volume of air from the chamber. Zero oxygen was achieved by
equilibration with N2 to displace all the O2 present in the chamber. Plants were kept in
the dark for 15 min before measurement. Detached Arabidopsis leaves and bud flowers
(200 to 300 mg) were placed in the oxygen electrode chamber. Oxygen concentration
was monitored for 15 min.
Immunobloting
Leaf extracts obtained from pools of 6 plants were electrophoresed on 12%
SDS-polyacrylamide gels and electro-blotted onto a nitrocellulose membrane.
Immunoblotting was revealed using affinity-purified antibodies raised against
recombinant GAPC of Triticum aestivum and antigenic polypeptides were detected
using an alkaline-phosphatase-conjugated secondary antibody (dilution 1:10000), as
described previously (Plaxton, 1989; Bollag et al., 1996). The western blot experiments
were performed by triplicate and the average values ± SD are reported.
In vitro pollen germination
In vitro pollen germination was determined by incubating released pollen with
medium containing 17% (w/v) sucrose, 2 mM CaCl2, 1.65 mM H3BO3, 0.6% (w/v) agar
and 5 mM MES (pH 5.8) as described previously (Busi et al., 2006). Only freshly
anther-dehisced flowers were used for in vitro pollen germination experiments since
pollen grains at this developmental stage show the highest germination percentage. For
each experiment flowers were randomly collected from different plants. Total and
germinated pollen grains were counted under a microscope after 6 h of incubation at
25ºC with 100% relative humidity (Schnurr et al., 2006).
Measurement of ATP pool
Six week-old rosette leaves and bud flowers from wt and gapc-1 plants frozen with
liquid nitrogen were ground to a powder using a chilled mortar and pestle. The powder
(20 mg) was homogenized with 60 µl of 0.1 M HCl in a 1.5 ml microtube. The
homogenate was centrifuged at 20,000 x g for 10 min at 4 °C. The supernatant was
filtered through a micro-concentrator Microcon YM-3 (Amicon, Inc., Beverly, MA,
USA) at 14,000 x g at 4 °C. After neutralization with 1 M Tris-HCl pH 7.4, the filtrates
were used for the measurement of ATP levels. Total cellular ATP content was
determined with an ATP bioluminescent assay kit (Sigma-Aldrich, St. Louis, MO,
www.plantphysiol.orgon December 26, 2019 - Published by Downloaded from Copyright © 2008 American Society of Plant Biologists. All rights reserved.

19
USA) and a LD-400 Luminescence detector (Beckman-Coulter, Inc. Fullerton, CA,
USA) (Wulff and Döppen, 1985). ATP levels are expressed in nmol .g–1 FW. All data
were subjected to regression analysis or the Student t-test. The standard curve of ATP
concentration was prepared from a known amount. Means ± SD (n=4) are significantly
different at the P <0.05 probability level.
Determination of metabolite levels
Metabolite levels were assayed spectrophotometrically as described previously
(Chen et al., 2002) with minor modifications. Leaves (about 300-500 mg) were
harvested at the end of the light period, immediately placed in liquid nitrogen and
ground to a powder. Two ml of ice-cold 4% (v/v) HClO4 was added to the powder. The
suspension was kept on ice about 30 min and then centrifuged 15 min at 20,000 x g. The
mixture was neutralized with 5M K2CO3 and treated with activated charcoal (washed
with HCl). The supernatant was used for the measurement of metabolites (Chen et al.,
2002). Reported values are the means of at least four independent measurements ± SE.
Histochemical detection of ROS in Arabidopsis leaves by fluorometric assay
The histochemical detection of ROS was performed according to Hempel and col.
(Hempel et al., 1999). Briefly, freshly cut Arabidopsis 6 week-old rosette leaves were
incubated with a solution containing phosphate buffer saline (PBS) 1X and 5 μM 2’,7’-
dichlorofluorescein diacetate (H2DCFDA). The tissues were incubated for 2 min at
room temperature in the dark, and then washed for 3 min twice in PBS 1X.
Fluorescence was immediately visualized using a Nikon fluorescence microscope,
Eclipse E800.
Enzyme assays
Homogenates used to determine enzyme activity were prepared as described
(Eastmond et al., 2000). Cell-free preparations were obtained from 6-week-old rosette
leaves. Leaves (200 mg) were washed, frozen under liquid nitrogen and ground to a
powder. The powdered material was homogenized with 600 μl of buffer containing 50
mM Tris–HCl (pH 8.0), 5 mM EDTA, 1 mM PMSF and 40 mM 2-mercaptoethanol.
The homogenate was centrifuged at 12,000 x g for 20 min at 4 ºC, and the supernatant
was collected. NP-GAPDH, PK, PEPC, G6Pdh, NAD-ME and NAD-MDH were
assayed spectrophotometrically at 340 nm at 30 ºC as described previously (Gomez
www.plantphysiol.orgon December 26, 2019 - Published by Downloaded from Copyright © 2008 American Society of Plant Biologists. All rights reserved.

20
Casati et al., 2000; Rius et al., 2006). GAPC activity was measured by following the
reduction of NAD+. The medium contained 50 mM triethanolamine-HCl (pH 8.5), 4
mM NAD+, 10 mM Na3AsO4, 1.2 μmol D-Ga3P and 3 mM DTT. Reactions were
initiated by the addition of Ga3P and the rate of increase in absorbance was linear for at
least 3 to 5 min. Activity increased linearly with increasing enzyme concentration. One
unit (U) is defined as the amount of enzyme that catalyzes the formation or
consumption of 1 μmol min-1 NADPH or NADH under each specified assay condition.
SDH activity was measured in mitochondrial fraction with the 2,6-
dichlorophenolindophenol (DCPIP) method as described previously (Busi et al., 2006)
and aconitase activity was monitored by measuring the formation of cis-aconitate at 240
nm (Li et al., 1999). All the determinations were performed at least by triplicate and the
average values ± SD are reported.
Protein measurements
Protein concentration was determined by the modified Bradford assay (Bollag et al.,
1996) using BSA as a standard.
Cloning of the GAPC-1 gene and production of transgenic plants
General molecular techniques such as plasmid DNA isolation, restriction digestion,
modification and ligation of DNA, PCR, agarose gel electrophoresis, northern blots,
transformation and culture of E. coli were carried out according to standards protocols
(Sambrook et al., 1989). To prepare the antisense construct of GAPC-1, a PstI/XhoI
fragment (418 bp) containing the Arabidopsis GAPC-1 coding sequence was isolated,
purified and cloned downstream from the cauliflower mosaic virus 35S (CaMV35S)
promoter into pDH51 vector (Pietrzak et al., 1986) previously digested with SalI and
PstI. After verifying the correct orientation of the insert, the resulting 35S:GAPC-AS
expression cassette was excised as EcoRI restriction fragments and subcloned into
pCAMBIA 2200 (Hajdukiewiez et al., 1994). The recombinant plasmids were
introduced into A. tumefaciens GV3101 strain by the freeze-thaw method (Weigel and
Glazebrook, 2006). Arabidopsis were transformed using the floral dip method (Clough
and Bent, 1998). Transgenic plants were selected on Murashige and Skoog solid media
containing 40 mg L-1 of kanamycin and finally, transferred to soil. The expression of the
antisense version of GAPC-1 gene was verified by RT-PCR.
www.plantphysiol.orgon December 26, 2019 - Published by Downloaded from Copyright © 2008 American Society of Plant Biologists. All rights reserved.

21
ACKNOWLEDGEMENTS
We are grateful to Jose Luis Burgos (CIC) for excellent technical assistance and
the Arabidopsis Biological Resource Center and the stock donor(s). We thank Drs.
María Victoria Busi, Guillermo Santa María and Alejandro Araya for helpful
discussions and critical reading of the manuscript and Dr. Carlos Bartoli for helping
with the respiration measurements. SPR is a doctoral fellow from CONICET; PC, AAI
and DFGC are research members from CONICET.
www.plantphysiol.orgon December 26, 2019 - Published by Downloaded from Copyright © 2008 American Society of Plant Biologists. All rights reserved.

22
TABLES
Table 1. Weight, length and seed number from wt, gapc-1 and as-GAPC1 siliques
obtained from 6-week-old plants.
Variable wt gapc-1 as-GAPC1
(n = 20)
Silique length (mm) 12.4 ± 0.8 3.5 ± 0.8 2.1 ± 1.0
Silique weight (mg) 4.62 ± 0.51 0.36 ± 0.13 0.22 ± 0.12
Seeds/silique 45 ± 5 7 ± 3 3 ± 1
www.plantphysiol.orgon December 26, 2019 - Published by Downloaded from Copyright © 2008 American Society of Plant Biologists. All rights reserved.

23
Table 2. List of selected genes differentially expressed in gapc-1 null mutants in comparison to
wild type plants
_____________________________________________________________________________
Functiona At locus Relative fold Localization
(arithmetic) _____________________________________________________________________________ NAD-dependent glyceraldehyde- At3g04120 0.05 cytosol
3-phosphate dehydrogenase (GAPC-1)
NAD-dependent glyceraldehyde- At1g13440 0.29 cytosol
3-phosphate dehydrogenase (GAPC-2)
NADP-dependent glyceraldehyde- At2g24270 0.06 cytosol
3-phosphate dehydrogenase
(non-phosphorylating) (NP-GAPDH)
Phosphofructokinase At4g26270 0.19 cytosol
At5g61580 0.30 cytosol
Pyruvate kinase At3g25960 0.32 cytosol
At3g52990 0.32 cytosol
Triosephosphate isomerase At3g55440 0.14 cytosol
Malate dehydrogenase (NAD-dependent) At3g53910 3.0 glycosomal-
mitochondria
Malate dehydrogenase (NAD-dependent) At5g56720 2.4 cytosol
PEP carboxylase At3g14940 0.25 unknown
At2g42600 0.5 unknown
Glucose-6-P dehydrogenase At5g13110 0.7 chloroplast
At1g24280 0.6 chloroplast
NAD-malic enzyme At2g13560 0.7 mitochondria
Citrate synthase At3g60100 0.4 mitochondria
Succinate dehydrogenase-Fe-S subunit At3g27380 0.2 mitochondria
Aconitase At2g05710 0.4 mitochondria
At4g26970 0.3 mitochondria
Pyruvate decarboxylase At5g54960 0.22 cytosol
RuBisCO small subunit At1g67090 0.28 plastid
RuBisCO large subunit At1g14030 3.1 plastid
At4g20130 2.9 plastid
RuBisCO activase At2g39730 0.16 plastid
_____________________________________________________________________________
www.plantphysiol.orgon December 26, 2019 - Published by Downloaded from Copyright © 2008 American Society of Plant Biologists. All rights reserved.

24
Table 2 (cont.) _____________________________________________________________________________ Functiona At locus Relative fold Localization
(arithmetic) _____________________________________________________________________________ Peroxiredoxin thioredoxin At1g65970 5.8 mitochondria-
-dependent peroxidase 2 (TPX2) peroxisome
cytosol
Peroxidase (PER62) At5g39580 5.2 endomembrane
(PER41) At5g05340 3.2 endomembrane
(PER52) At4g17690 6.5 endomembrane
(PER9) At1g44970 3.3 endomembrane
(PER2) At1g05250 8.2 endomembrane
(PER31) At3g28200 0.39 extracellular
Catalase 1 At1g20630 0.71 mitochondria-
peroxisome
Catalase 2 At4g35090 0.5 mitochondria-
peroxisome
Catalase 3 At1g20620 0.37 mitochondria-
peroxisome
Alternative oxidase 2 At5g64210 2.6 mitochondria
Peroxiredoxin At3g06050 0.95 mitochondria
Superoxide dismutase [Cu-Zn] At5g18100 4.0 peroxisome
Superoxide dismutase B [Fe] At4g25100 0.44 plastid
Superoxide dismutase A [Mn] At3g10920 0.43 mitochondria
Glutathione S-transferase 6 At2g47730 0.42 plastid
The expression ratio relative to the control is indicated. The full list of expressed genes can be downloaded from GEO (Accession number GSE3540). a Results of BLASTN query of Arabidopsis genome sequence.
www.plantphysiol.orgon December 26, 2019 - Published by Downloaded from Copyright © 2008 American Society of Plant Biologists. All rights reserved.

25
Table 3. Determination of metabolite levels in wt, gapc-1 and as-GAPC1 plants
______________________________________________________________________
compound* wt gapc-1 as-GAPC1
______________________________________________________________________
pyruvate 8.6 ± 1.4 2.7 ± 0.6 1.9 ± 0.4
malate 4.3 ± 0.9 7.6 ± 1.2 6.8 ± 1.0
citrate 9.4 ± 1.5 3.7 ± 0.5 3.2 ± 0.6
isocitrate 1.1 ± 0.2 0.6 ± 0.2 0.3 ± 0.1
______________________________________________________________________
* pyruvate levels are expressed in nmol. g-1 FW. Malate, citrate and isocitrate levels are
expressed in µmol. g-1 FW.
www.plantphysiol.orgon December 26, 2019 - Published by Downloaded from Copyright © 2008 American Society of Plant Biologists. All rights reserved.

26
Table 4. List of primers used in RT-PCR and mutant analysis
____________________________________________________________
Gene (At locus) Primers Forward/Reverse
_______________________________________________________________________
GAPC-1 (At3g04120) TCTCATATGCTGACAAGAAGAT
CACTCCCTATCATTCGAGATCTGCTTC
GAPC-2 (At1g13440) GAGTACATGACCTACATG
TCAACCACACACAAACTCGAGCCGGTG
NP-GAPDH (At2g24270) AGACATATGGCCGGGACTGGATTGTTT
ACCCTCGAGCTAACCCATAGAGTAAGAAGGT
RBCS-1 (At1g67090) AAAGGTACCATGGCTTCCTCTATGCTC
AAACATATGAAGGTCAGGAGGTAAGA
CAT1 (At1g20630) GATAAGCTACTCCAGACCCGGA
CTGAGACCAGTAAGAGATCCA
CAT2 (At4g35090) GATAAGCTGCTTCAAACCCGTG
CTGAGACCAGTAAGAGATCCA
CAT3 (At1g20620) ACGACAAGCTGCTCCAGTGTA
CTGAGACCAGTAAGAGATCCA
PK (At3g25960) ATGCATTCCAGTCATCTCC
TGGTGTCTCCTTTCTTCAC
PK (At3g25960) ATGGAGATGTTACTTGGTG
TCCTTGTATCTTGTAATCAAT
RCA (At2g39730) ATGGCCGCCGCAGTTTCCAC
TAGGAGCTTGGAAGACAGAG
PDC-2 (At5g54960) AGATCGGATCTATCGACGCG
GGTTTGGTTCGGCGATTAGG
AOX (At5g64210) ATTTTTTCAGAGACGATA
GCGAATGTCAGAAGCAAA
PEROX (At3g06050) ATCTTCAAGGGGAAGAAA
GCCGACCATCTCTCAGAC
SDH (At3g27380) AAACATATGGCGGAGGCGGAAACAAAA
AAACTCGAGACGCTGAAGTTGCTTGAT
_______________________________________________________________________
www.plantphysiol.orgon December 26, 2019 - Published by Downloaded from Copyright © 2008 American Society of Plant Biologists. All rights reserved.

27
FIGURE LEGENDS
Figure 1. Schemes of gapc-1 null mutant and the antisense construction as-GAPC1
(A) Intron–exon organization of GAPC-1 gene of an Arabidopsis T-DNA insertional
mutant line (SALK_010839). Arrows show the locations and directions of primers used
to screen for gapc-1 mutant (GAPC-1 5’, GAPC-1 3’). The structure of the T-DNA is
not drawn to scale. The GAPC-1 gene contains 9 exons and 8 introns. The open triangle
shows the T-DNA position in the ninth exon region of GAPC-1.
(B) Schematic representation of the antisense gene (as-GAPC1) used to generate
transgenic plants expressing a fragment (418 pb) of GAPC-1 in antisense orientation.
The coding sequence of Arabidopsis GAPC-1 was cloned under the control of
cauliflower mosaic virus 35S (CaMV35S) promoter from pDH51 vector and then
subcloned on pCAMBIA 2200 multiple cloning site (EcoRI site). MCS: multiple
cloning site; CaMV35S: promoter CaMV35S; t-35S: 35S terminator; NPTII: kanamicyn
resistance gene.
(C) Steady state levels of GAPC-1 mRNA in wt, mutant gapc-1 and transgenic as-
GAPC1 plants. Total RNA was extracted from 42-day old leaves and reversed
transcribed using random hexamers and then amplified with GAPC-1 specific primers.
The housekeeping gene β-ACTIN (At3g18780) was used as internal control.
Figure 2. Analysis of GAPC by western blot and enzyme activity
(A) Western blot detection of GAPC protein in wt, gapc-1 mutants and transgenic as-
GAPC1 from leaves extracts, using serum anti-GAPC from Triticum aestivum.
(B) NAD-GAPDH activity determined in leaves and flowers crude extracts from wt
(white bars), gapc-1 (black bars) and as-GAPC1 (grey bars) plants. 1.0 of relative
activity represents 22.4 mU. mg protein-1. Values are the mean ± SD of four
independent replicates.
Figure 3. Phenotypic analysis of gapc-1 and as-GAPC1 plants
Phenotype comparison of wt, gapc-1 and as-GAPC1 plants of A. thaliana at different
stages of development: 28 (A) and 35 (B) days old growth plants. Bar: 1.0 cm. (C)
Morphology of siliques from wt, gapc-1 and as-GAPC1 plants: closed siliques (right
www.plantphysiol.orgon December 26, 2019 - Published by Downloaded from Copyright © 2008 American Society of Plant Biologists. All rights reserved.

28
panel); opened siliques (left panel). Siliques were from 8-9 DPA plants. Bar: 0.2 cm.
Siliques from wt (D), gapc-1 (E) and as-GAPC1 (F) plants (8-9 DPA, immature siliques
(left column) or 12-13 DPA mature siliques (right column). White arrows: aborted
seeds; black arrow: empty embryonic sacs; gray arrows: empty seeds. Bar: 0.1 cm.
DPA: days post anthesis.
Figure 4. In vitro determination of pollen tube formation
Determination of the ability of pollen grains to germinate in vitro. Pollen was obtained
from wt, gapc-1 as-GAPC1 plants. Left panel correspond to 10X detail of right panel
for the same pollen line. The scale bar shown on bottom is the same for all the lines.
Figure 5. Morphology of the siliques from plants after crossing gapc-1 (♀) × wt (♂)
compared with wt and homozygous mutant gapc-1
Silique size and seed production restoration of homozygous gapc-1 after pollination
with pollen wt. Panel A, siliques from wt (top), gapc-1 (bottom) and cross gapc-1 × wt
(middle). Panel B, zoom from panel A.
Figure 6. Analysis of GAPC-2 and NP-GAPDH transcripts by RT-PCR
Steady state levels of GAPC-2 and NP-GAPDH transcripts from wt, gapc-1 and as-
GAPC1 plants. Total RNA was reversed transcribed and then amplified using specific
primers. The housekeeping β-actin was used as internal control.
Figure 7. Enzyme activity and RT-PCR of oxidative stress and carbon metabolism
enzymes
(A) Specific activity of enzymes involved in carbohydrate metabolism. NP-GAPDH,
PK, PEPC, G6PDH, NAD-ME and NAD-MDH activity determined in wt and gapc-1
leaf extracts. One unit (U) is defined as quantity of μmol of NADH or NADPH
produced or consumed per minute at the temperature specified in the Methods section
for each enzyme.
(B) RT-PCR analysis of genes involved in oxidative stress and carbon metabolism from
wt, gapc-1 and as-GAPC1 plants. Total RNA was reversed transcribed and then
amplified using specific primers. The housekeeping β-ACTIN was used as internal
control. PDC-2: pyruvate decarboxylase 2; RCA: RubisCO activase; SS: small subunit;
CAT: catalase.
www.plantphysiol.orgon December 26, 2019 - Published by Downloaded from Copyright © 2008 American Society of Plant Biologists. All rights reserved.

29
Figure 8. Measurement of oxygen uptake, ATP levels and analysis of the
expression and activity of TCA cycle enzymes
(A) Determination of O2 evolution (µmol O2. min-1.mg-1 DW) in detached leaves and
flowers from wt (white bars) and gapc-1 plants (black bars). DW, dried weight
(B) ATP levels determined in wt (white bars) and gapc-1 (black bars) Arabidopsis
rosettes leaves and flowers. FW: fresh weight.
(C, left) RT-PCR analysis of aconitase (ACO; At2g05710) and succinate
dehydrogenase (SDH; At3g27380) transcripts involved in TCA cycle determined in wt,
gapc-1 and as-GAPC1 plants. Total RNA was reversed transcribed and then amplified
using specific primers. The housekeeping β-actin was used as internal control. (C, right)
Enzymatic activity of aconitase and SDH in wt (with bars), gapc-1 (grey bars) and as-
GAPC1 plants (black bars). Each enzymatic assay was performed using 10 µg total
proteins from isolated mitochondrial fraction. The activity of each enzyme in wt plants
was used as a reference value.
Figure 9. Determination of ROS, trichome density and RT-PCR analysis of genes
involved in ROS responses
(A) Histochemical detection of ROS by H2DCFA. Fluorescence was visualized by
microscopy after incubation of leaves from wt gapc-1 and as-GAPC1 lines with
H2DCFDA. Figures show the fluorescence of two representative trichomes from each
line.
(B) Trichome distribution on adult rosettes leaves of wt, gapc-1 mutant and as-GAPC1
transgenic line.
(C) RT-PCR analysis of PEROX and AOX genes involved in ROS metabolism from wt,
gapc-1 and as-GAPC1 plants. Total RNA was reversed transcribed and then amplified
using specific primers. The housekeeping β-ACTIN was used as internal control.
www.plantphysiol.orgon December 26, 2019 - Published by Downloaded from Copyright © 2008 American Society of Plant Biologists. All rights reserved.

30
References
Anderson LE, Ringenberg MR, Carol AA (2004) Cytosolic glyceraldehyde-3-P dehydrogenase and the B subunit of the chloroplast enzyme are present in the pea leaf nucleus. Protoplasma 223: 33-43
Baek D, Jin Y, Jeong JC, Lee HJ, Moon H, Lee J, Shin D, Kang CH, Kim DH, Nam J, Lee SY, Yun DJ (2008) Suppression of reactive oxygen species by glyceraldehyde-3-phosphate dehydrogenase. Phytochemistry 69: 333-338
Bollag DM, Rozycki MD, Edelstein SJ (1996) Protein methods, Ed 2nd. Wiley-Liss, New York
Bolstad DM, Irizarry RA, Astrand M, Speed TP (2003) A comparison of normalization methods for high density oligonucleotide array data based on bias and variance. Bioinformatics 19: 185-193
Busi MV, Gomez-Casati DF, Perales M, Araya A, Zabaleta E (2006) Nuclear-encoded mitochondrial complex I gene expression is restored to normal levels by inhibition of unedited ATP9 transgene expression in Arabidopsis thaliana. Plant Physiol Biochem 44: 1-6
Busi MV, Maliandi MV, Valdez H, Clemente M, Zabaleta EJ, Araya A, Gomez-Casati DF (2006) Deficiency of Arabidopsis thaliana frataxin alters activity of mitochondrial Fe-S proteins and induces oxidative stress. Plant J 48: 873-882
Bustos DM, Iglesias AA (2002) Non-phosphorylating glyceraldehyde-3-phosphate dehydrogenase is post-translationally phosphorylated in heterotrophic cells of wheat (Triticum aestivum). FEBS Lett 530: 169-173
Bustos DM, Iglesias AA (2003) Phosphorylated non-phosphorylating glyceraldehyde-3-phosphate dehydrogenase from heterotrophic cells of wheat interacts with 14-3-3 proteins. Plant Physiol 133: 2081-2088
Cerff R, Chambers SE (1979) Subunit structure of higher plant glyceraldehyde-3-phosphate dehydrogenases (EC 1.2.1.12 and EC 1.2.1.13). J Biol Chem 254: 6094-6098
Chen LS, Lin Q, Nose A (2002) A comparative study on diurnal changes in metabolite levels in the leaves of three crassulacean acid metabolism (CAM) species, Ananas comosus, Kalanchoe daigremontiana and K. pinnata. J Exp Bot 53: 341-350
Chuong SD, Good AG, Taylor GJ, Freeman MC, Moorhead GB, Muench DG (2004) Large-scale identification of tubulin-binding proteins provides insight on subcellular trafficking, metabolic channeling, and signaling in plant cells. Mol Cell Proteomics 3: 970-983
Clough SJ, Bent AF (1998) Floral dip: a simplified method for Agrobacterium-mediated transformation of Arabidopsis thaliana. Plant J 16: 735-743
Conley TR, Peng HP, Shih MC (1999) Mutations affecting induction of glycolytic and fermentative genes during germination and environmental stresses in Arabidopsis. Plant Physiol 119: 599-608
Eastmond PJ, Germain V, Lange PR, Bryce JH, Smith SM, Graham IA (2000) Postgerminative growth and lipid catabolism in oilseeds lacking the glyoxylate cycle. Proc Natl Acad Sci U S A 97: 5669-5674
Fermani S, Sparla F, Falini G, Martelli PL, Casadio R, Pupillo P, Ripamonti A, Trost P (2007) Molecular mechanism of thioredoxin regulation in photosynthetic A2B2-
www.plantphysiol.orgon December 26, 2019 - Published by Downloaded from Copyright © 2008 American Society of Plant Biologists. All rights reserved.

31
glyceraldehyde-3-phosphate dehydrogenase. Proc Natl Acad Sci U S A 104: 11109-11114
Fernie AR, Carrari F, Sweetlove LJ (2004) Respiratory metabolism: glycolysis, the TCA cycle and mitochondrial electron transport. Curr Opin Plant Biol 7: 254-261
Fillinger S, Boschi-Muller S, Azza S, Dervyn E, Branlant G, Aymerich S (2000) Two glyceraldehyde-3-phosphate dehydrogenases with opposite physiological roles in a nonphotosynthetic bacterium. J Biol Chem 275: 14031-14037
Gass N, Glagotskaia T, Mellema S, Stuurman J, Barone M, Mandel T, Roessner-Tunali U, Kuhlemeier C (2005) Pyruvate decarboxylase provides growing pollen tubes with a competitive advantage in petunia. Plant Cell 17: 2355-2368
Giege P, Heazlewood JL, Roessner-Tunali U, Millar AH, Fernie AR, Leaver CJ, Sweetlove LJ (2003) Enzymes of glycolysis are functionally associated with the mitochondrion in Arabidopsis cells. Plant Cell 15: 2140-2151
Gomez Casati DF, Sesma JI, Iglesias AA (2000) Structural and kinetic characterization of NADP-dependent, non-phosphorylating glyceraldehyde-3-phosphate dehydrogenase from celery leaves. Plant Sci 154: 107-115
Graham JW, Williams TC, Morgan M, Fernie AR, Ratcliffe RG, Sweetlove LJ (2007) Glycolytic enzymes associate dynamically with mitochondria in response to respiratory demand and support substrate channeling. Plant Cell 19: 3723-3738
Gutierrez-Alcala G, Gotor C, Meyer AJ, Fricker M, Vega JM, Romero LC (2000) Glutathione biosynthesis in Arabidopsis trichome cells. Proc Natl Acad Sci U S A 97: 11108-11113
Habenicht A (1997) The non-phosphorylating glyceraldehyde-3-phosphate dehydrogenase: biochemistry, structure, occurrence and evolution. Biol Chem 378: 1413-1419
Habenicht A, Hellman U, Cerff R (1994) Non-phosphorylating GAPDH of higher plants is a member of the aldehyde dehydrogenase superfamily with no sequence homology to phosphorylating GAPDH. J Mol Biol 237: 165-171
Hajdukiewiez P, Svab Z, Maliga P (1994) The small, versatile pPZP family of Agrobacterium binary vectors for plant transformation. Plant Mol Biol 25: 989-994
Hajirezaei MR, Biemelt S, Peisker M, Lytovchenko A, Fernie AR, Sonnewald U (2006) The influence of cytosolic phosphorylating glyceraldehyde 3-phosphate dehydrogenase (GAPC) on potato tuber metabolism. J Exp Bot 57: 2363-2377
Hancock JT, Henson D, Nyirenda M, Desikan R, Harrison J, Lewis M, Hughes J, Neill SJ (2005) Proteomic identification of glyceraldehyde 3-phosphate dehydrogenase as an inhibitory target of hydrogen peroxide in Arabidopsis. Plant Physiol Biochem 43: 828-835
Heiser V, Rasmusson A, Thieck O, Brennicke A, Grohmann L (1997) Antisense repression of the mitochondrial NADH-binding subunit of complex I in transgenic potato plants induces male sterility. Plant Sci 127: 61-69
Hempel SL, Buettner GR, O'Malley YQ, Wessels DA, Flaherty DM (1999) Dihydrofluorescein diacetate is superior for detecting intracellular oxidants: comparison with 2',7'-dichlorodihydrofluorescein diacetate, 5(and 6)-carboxy-2',7'-dichlorodihydrofluorescein diacetate, and dihydrorhodamine 123. Free Radic Biol Med 27: 146-159
Holtgrawe D, Scholz A, Altmann B, Scheibe R (2005) Cytoskeleton-associated, carbohydrate-metabolizing enzymes in maize identified by yeast two-hybrid screening. Physiol Plantarum 125: 141-156
www.plantphysiol.orgon December 26, 2019 - Published by Downloaded from Copyright © 2008 American Society of Plant Biologists. All rights reserved.
32
Igamberdiev AU, Hurry V, Kromer S, Gardestrom P (1998) The role of mitochondrial electron transport during photosynthetic induction. A study with barley (Hordeum vulgare) protoplasts incubated with rotenone and oligomycin. Physiol Plantarum 104: 431-439
Iglesias AA, Vicario LR, Gómez-Casati DF, Sesma JI, Gómez-Casati ME, Bustos DM, Podestá FE (2002) On the interaction of substrate analogues with non-phosphorylating glyceraldehydes 3-phosphate dehydrogenase from celery leaves. Plant Sci 162: 689-696
Kelly GJ, Gibbs M (1973) A Mechanism for the Indirect Transfer of Photosynthetically Reduced Nicotinamide Adenine Dinucleotide Phosphate from Chloroplasts to the Cytoplasm. Plant Physiol 52: 674-676
Kelly GJ, Gibbs M (1973) Nonreversible d-Glyceraldehyde 3-Phosphate Dehydrogenase of Plant Tissues. Plant Physiol 52: 111-118
Koksharova O, Schubert M, Shestakov S, Cerff R (1998) Genetic and biochemical evidence for distinct key functions of two highly divergent GAPDH genes in catabolic and anabolic carbon flow of the cyanobacterium Synechocystis sp. PCC 6803. Plant Mol Biol 36: 183-194
Li J, Kogan M, Knight SA, Pain D, Dancis A (1999) Yeast mitochondrial protein, Nfs1p, coordinately regulates iron-sulfur cluster proteins, cellular iron uptake, and iron distribution. J Biol Chem 274: 33025-33034
Mateos ML, Serrano A (1992) Occurrence of phosphorylating and nonphosphorylating NADP+-dependent gylceraldehyde 3-phosphate dehydrogenases in photosynthetic organisms. Plant Sci 84: 163-170
Michels S, Scagliarini S, Della Seta F, Carles C, Riva M, Trost P, Branlant G (1994) Arguments against a close relationship between non-phosphorylating and phosphorylating glyceraldehyde-3-phosphate dehydrogenases. FEBS Lett 339: 97-100
Millar AH, Considine MJ, Day DA, Whelan J (2001) Unravelling the role of mitochondria during oxidative stress in plants. IUBMB Life 51: 201-205
Moller IM (2001) PLANT MITOCHONDRIA AND OXIDATIVE STRESS: Electron Transport, NADPH Turnover, and Metabolism of Reactive Oxygen Species. Annu Rev Plant Physiol Plant Mol Biol 52: 561-591
Moller IM, Kristensen BK (2004) Protein oxidation in plant mitochondria as a stress indicator. Photochem Photobiol Sci 3: 730-735
Nagata T, Todoriki S, Hayashi T, Shibata Y, Mori M, Kanegae H, Kikuchi S (1999) Gamma-radiation induces leaf trichome formation in Arabidopsis. Plant Physiol 120: 113-120
Perusse JR, Schoen DJ (2004) Molecular evolution of the GapC gene family in Amsinckia spectabilis populations that differ in outcrossing rate. J Mol Evol 59: 427-436
Petersen J, Brinkmann H, Cerff R (2003) Origin, evolution, and metabolic role of a novel glycolytic GAPDH enzyme recruited by land plant plastids. J Mol Evol 57: 16-26
Pietrzak M, Shillito RD, Hohn T, Potrykus I (1986) Expression in plants of two bacterial antibiotic resistance genes after protoplast transformation with a new plant expression vector. Nucl Acids Res 14: 5857-5868
Plaxton WC (1989) Molecular and immunological characterization of plastid and cytosolic pyruvate kinase isozymes from castor oil endosperm and leaf. Eur J Biochem 181: 443-451
www.plantphysiol.orgon December 26, 2019 - Published by Downloaded from Copyright © 2008 American Society of Plant Biologists. All rights reserved.
33
Plaxton WC (1996) The Organization and Regulation of Plant Glycolysis. Annu Rev Plant Physiol Plant Mol Biol 47: 185-214
Plaxton WC, Podestá FE (2006) The functional organization and control of plant respiration. Crit Rev Plant Sci 25: 159-198
Rius SP, Casati P, Iglesias AA, Gomez-Casati DF (2006) Characterization of an Arabidopsis thaliana mutant lacking a cytosolic non-phosphorylating glyceraldehyde-3-phosphate dehydrogenase. Plant Mol Biol 61: 945-957
Rumpho ME, Edwards GE, Loescher WH (1983) A Pathway for Photosynthetic Carbon Flow to Mannitol in Celery Leaves : Activity and Localization of Key Enzymes. Plant Physiol 73: 869-873
Russell DA, Sachs MM (1989) Differential expression and sequence analysis of the maize glyceraldehyde-3-phosphate dehydrogenase gene family. Plant Cell 1: 793-803
Salt DE, Prince RC, Pickering IJ, Raskin I (1995) Mechanisms of Cadmium Mobility and Accumulation in Indian Mustard. Plant Physiol 109: 1427-1433
Sambrook J, Maniatis T, Fritsch EF (1989) Molecular cloning : a laboratory manual, Ed 2nd. Cold Spring Harbor Laboratory, Cold Spring Harbor, N.Y.
Schnurr JA, Storey KK, Jung HJ, Somers DA, Gronwald JW (2006) UDP-sugar pyrophosphorylase is essential for pollen development in Arabidopsis. Planta 224: 520-532
Siddiquee KA, Arauzo-Bravo MJ, Shimizu K (2004) Effect of a pyruvate kinase (pykF-gene) knockout mutation on the control of gene expression and metabolic fluxes in Escherichia coli. FEMS Microbiol Lett 235: 25-33
Sparla F, Fermani S, Falini G, Zaffagnini M, Ripamonti A, Sabatino P, Pupillo P, Trost P (2004) Coenzyme site-directed mutants of photosynthetic A4-GAPDH show selectively reduced NADPH-dependent catalysis, similar to regulatory AB-GAPDH inhibited by oxidized thioredoxin. J Mol Biol 340: 1025-1037
Sweetlove LJ, Heazlewood JL, Herald V, Holtzapffel R, Day DA, Leaver CJ, Millar AH (2002) The impact of oxidative stress on Arabidopsis mitochondria. Plant J 32: 891-904
Tusher V, Tibshirani R, Chu G (2001) Significance analysis of microarrays applied to the ionizing radiation response. Proc Natl Acad Sci U S A 98: 5116-5121
Valverde F, Ortega JM, Losada M, Serrano A (2005) Sugar-mediated transcriptional regulation of the Gap gene system and concerted photosystem II functional modulation in the microalga Scenedesmus vacuolatus. Planta 221: 937-952
Wang X, Chen Y, Zou J, Wu W (2007) Involvement of a cytoplasmic glyceraldehyde-3-phosphate dehydrogenase GapC-2 in low-phosphate-induced anthocyanin accumulation in Arabidopsis. Chinese Sci Bull 52: 1764-1770
Weigel D, Glazebrook J (2006) Transformation of Agrobacterium using the freeze-thaw method. Cold Spring Harbor Protocols: pdb.prot 4666
Wolosiuk RA, Buchanan BB (1978) Activation of Chloroplast NADP-linked Glyceraldehyde-3-Phosphate Dehydrogenase by the Ferredoxin/Thioredoxin System. Plant Physiol 61: 669-671
Wu P, Ma L, Hou X, Wang M, Wu Y, Liu F, Deng XW (2003) Phosphate starvation triggers distinct alterations of genome expression in Arabidopsis roots and leaves. Plant Physiol 132: 1260-1271
Wulff K, Döppen W (1985) In: Bergmeyer HU. (ed). Methods of Enzymatic Analysis. Verlag Chemie: Weinheim 7: 357-364
www.plantphysiol.orgon December 26, 2019 - Published by Downloaded from Copyright © 2008 American Society of Plant Biologists. All rights reserved.

34
Yang Y, Kwon HB, Peng HP, Shih MC (1993) Stress responses and metabolic regulation of glyceraldehyde-3-phosphate dehydrogenase genes in Arabidopsis. Plant Physiol 101: 209-216
www.plantphysiol.orgon December 26, 2019 - Published by Downloaded from Copyright © 2008 American Society of Plant Biologists. All rights reserved.
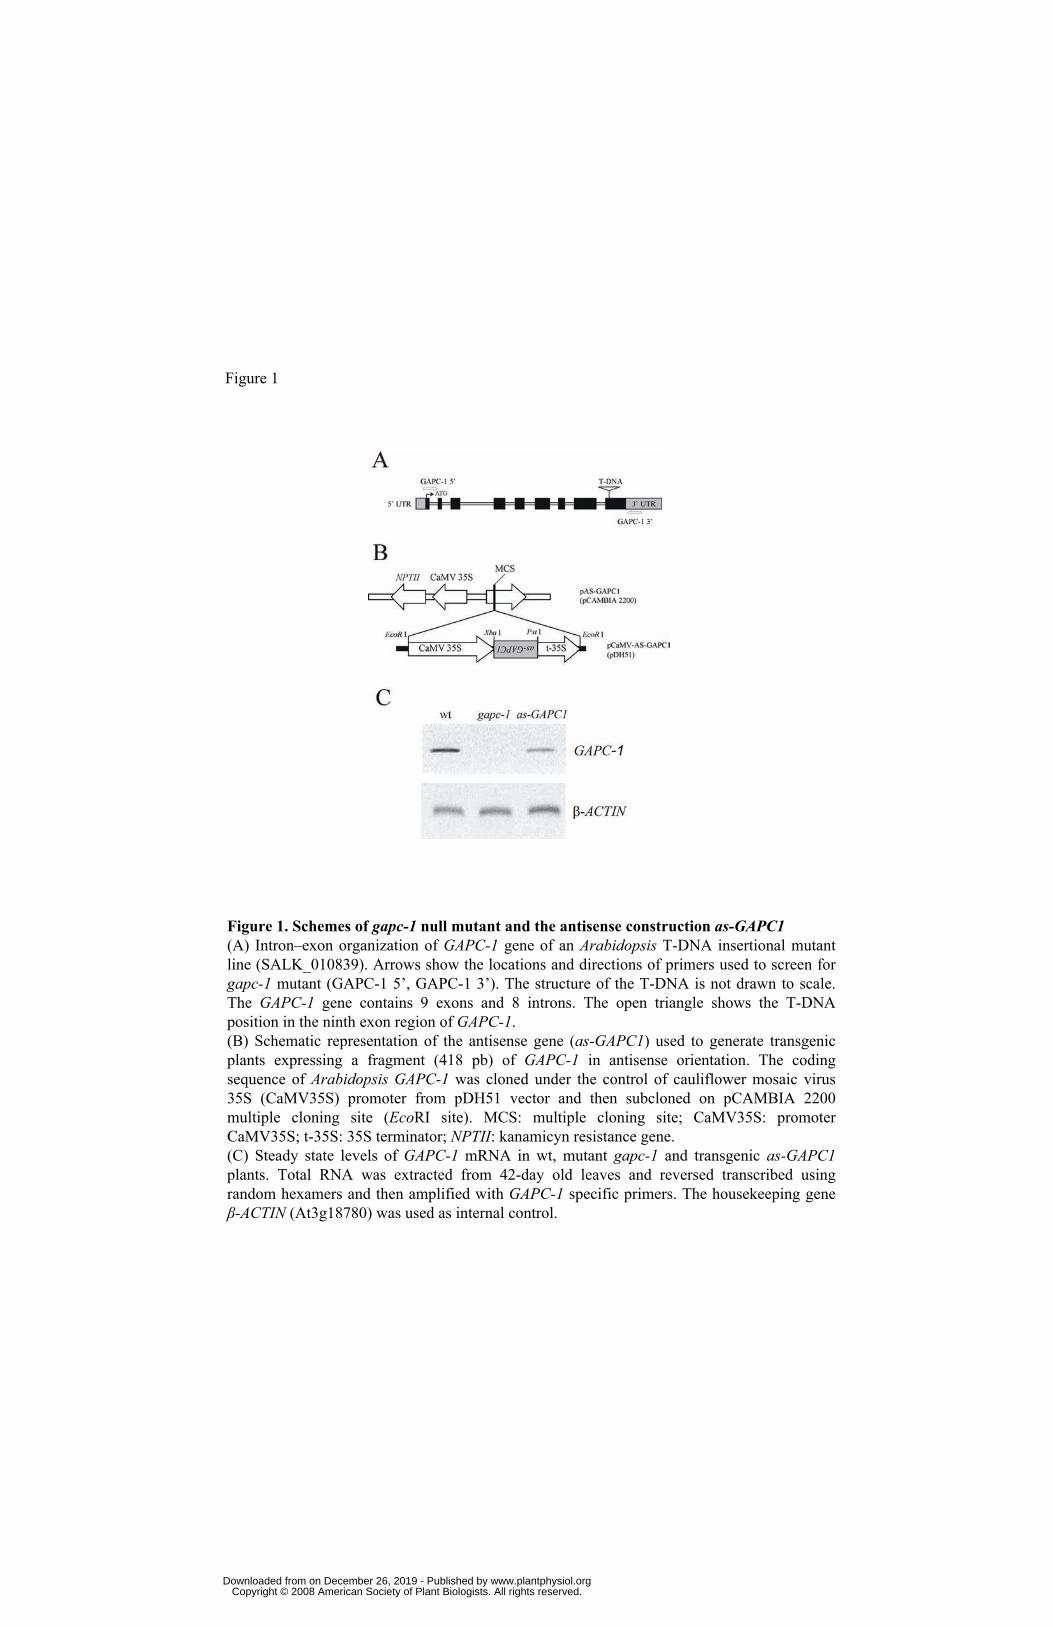
Figure 1. Schemes of gapc-1 null mutant and the antisense construction as-GAPC1(A) Intron–exon organization of GAPC-1 gene of an Arabidopsis T-DNA insertional mutant line (SALK_010839). Arrows show the locations and directions of primers used to screen for gapc-1 mutant (GAPC-1 5’, GAPC-1 3’). The structure of the T-DNA is not drawn to scale. The GAPC-1 gene contains 9 exons and 8 introns. The open triangle shows the T-DNA position in the ninth exon region of GAPC-1. (B) Schematic representation of the antisense gene (as-GAPC1) used to generate transgenic plants expressing a fragment (418 pb) of GAPC-1 in antisense orientation. The coding sequence of Arabidopsis GAPC-1 was cloned under the control of cauliflower mosaic virus 35S (CaMV35S) promoter from pDH51 vector and then subcloned on pCAMBIA 2200 multiple cloning site (EcoRI site). MCS: multiple cloning site; CaMV35S: promoter CaMV35S; t-35S: 35S terminator; NPTII: kanamicyn resistance gene.(C) Steady state levels of GAPC-1 mRNA in wt, mutant gapc-1 and transgenic as-GAPC1plants. Total RNA was extracted from 42-day old leaves and reversed transcribed using random hexamers and then amplified with GAPC-1 specific primers. The housekeeping gene β-ACTIN (At3g18780) was used as internal control.
Figure 1
www.plantphysiol.orgon December 26, 2019 - Published by Downloaded from Copyright © 2008 American Society of Plant Biologists. All rights reserved.

Figure 2
Figure 2. Analysis of GAPC by western blot and enzyme activity (A) Western blot detection of GAPC protein in wt, gapc-1 mutants and transgenic as-GAPC1 from leaves extracts, using serum anti-GAPC from Triticum aestivum. (B) NAD-GAPDH activity determined in leaves and flowers crude extracts from wt (white bars), gapc-1 (black bars) and as-GAPC1 (grey bars) plants. 1.0 of relative activity represents 22.4 mU. mg protein-1. Values are the mean ± SD of four independent replicates.
www.plantphysiol.orgon December 26, 2019 - Published by Downloaded from Copyright © 2008 American Society of Plant Biologists. All rights reserved.

Figure 3
Figure 3. Phenotypic analysis of gapc-1 and as-GAPC1 plantsPhenotype comparison of wt, gapc-1 and as-GAPC1 plants of A. thaliana at different stages of development: 28 (A) and 35 (B) days old growth plants. Bar: 1.0 cm.(C) Morphology of siliques from wt, gapc-1 and as-GAPC1 plants: closed siliques (right panel); opened siliques (left panel). Siliques were from 8-9 DPA plants. Bar: 0.2 cm.Siliques from wt (D), gapc-1 (E) and as-GAPC1 (F) plants (8-9 DPA, immature siliques (left column) or 12-13 DPA mature siliques (right column). White arrows: aborted seeds; black arrow: empty embryonic sacs; gray arrows: empty seeds. Bar: 0.1 cm. DPA: days post anthesis.
www.plantphysiol.orgon December 26, 2019 - Published by Downloaded from Copyright © 2008 American Society of Plant Biologists. All rights reserved.

Figure 4
Figure 4. In vitro determination of pollen tube formationDetermination of the ability of pollen grains to germinate in vitro. Pollen was obtained from wt, gapc-1 as-GAPC1 plants. Left panel correspond to 10X detail of right panel for the same pollen line. The scale bar shown on bottom is the same for all the lines.
www.plantphysiol.orgon December 26, 2019 - Published by Downloaded from Copyright © 2008 American Society of Plant Biologists. All rights reserved.
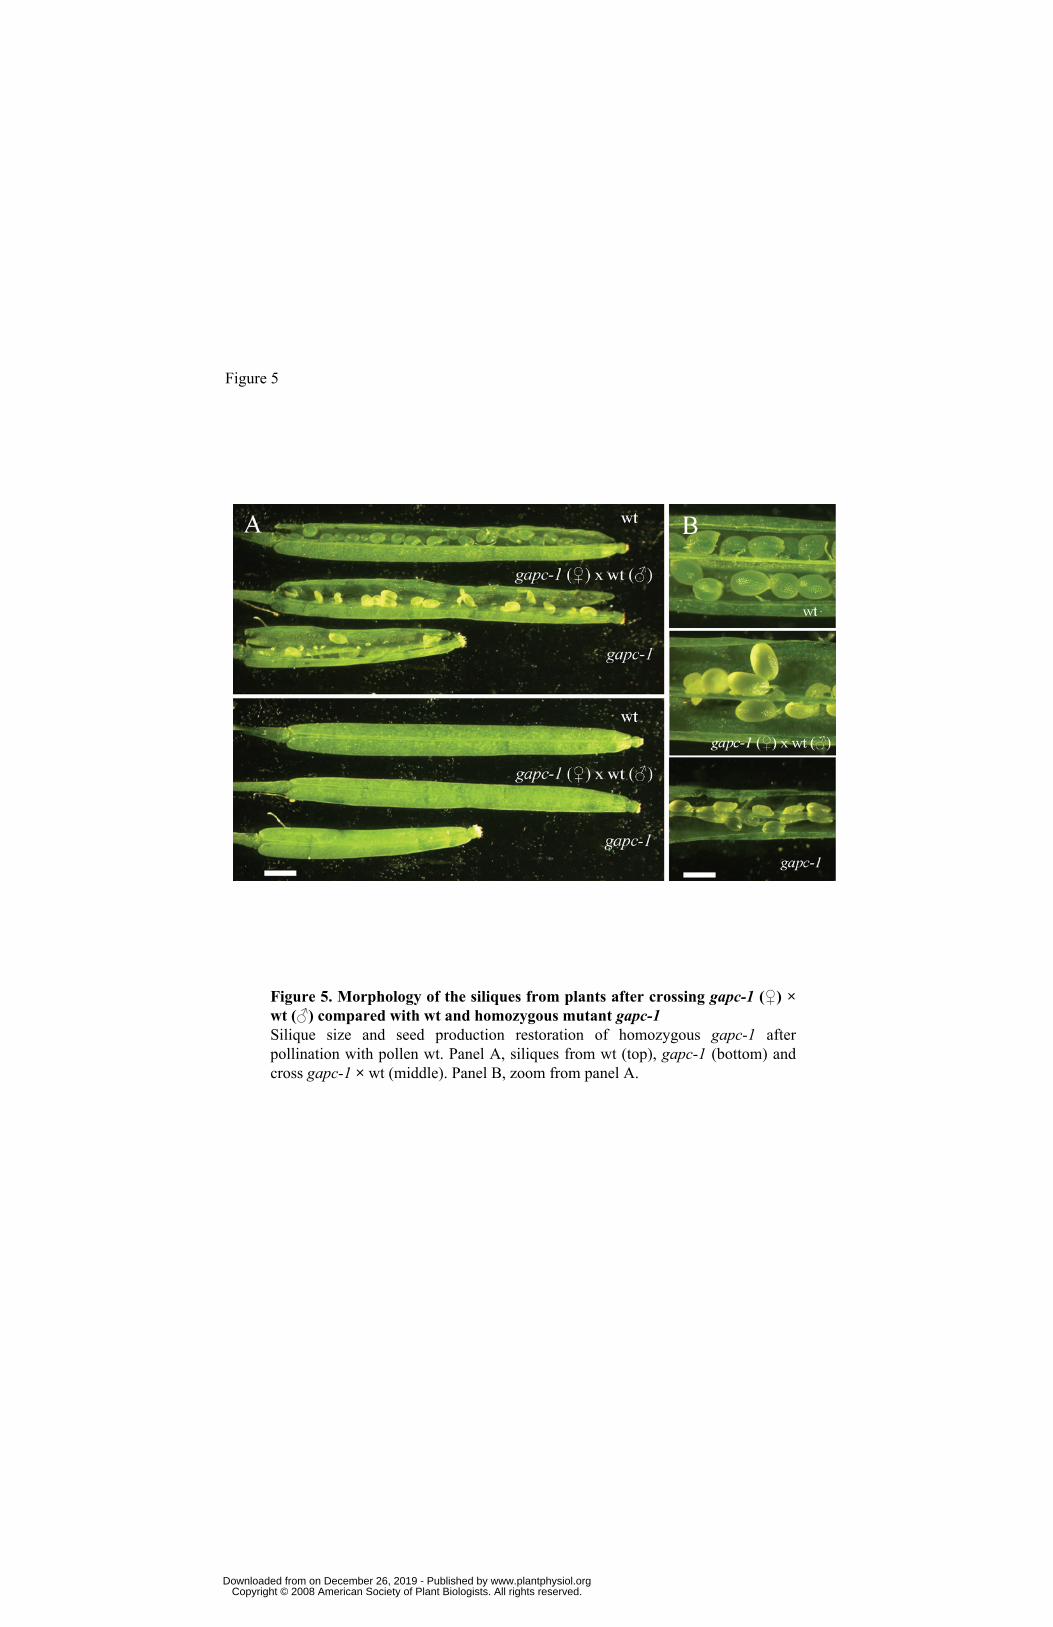
Figure 5
Figure 5. Morphology of the siliques from plants after crossing gapc-1 (♀) × wt (♂) compared with wt and homozygous mutant gapc-1Silique size and seed production restoration of homozygous gapc-1 after pollination with pollen wt. Panel A, siliques from wt (top), gapc-1 (bottom) and cross gapc-1 × wt (middle). Panel B, zoom from panel A.
www.plantphysiol.orgon December 26, 2019 - Published by Downloaded from Copyright © 2008 American Society of Plant Biologists. All rights reserved.

Figure 6
Figure 6. Analysis of GAPC-2 and NP-GAPDH transcripts by RT-PCRSteady state levels of GAPC-2 and NP-GAPDH transcripts from wt, gapc-1 and as-GAPC1 plants. Total RNA was reversed transcribed and then amplified using specific primers. The housekeeping β-actin was used as internal control.
www.plantphysiol.orgon December 26, 2019 - Published by Downloaded from Copyright © 2008 American Society of Plant Biologists. All rights reserved.

Figure 7
Figure 7. Enzyme activity and RT-PCR of oxidative stress and carbon metabolism enzymes(A) Specific activity of enzymes involved in carbohydrate metabolism. NP-GAPDH, PK,
PEPC, G6PDH, NAD-ME and MDH-NAD activity determined in wt and gapc-1 leaf extracts. One unit (U) is defined as quantity of mmol of NADH or NADPH produced or consumed per minute at the temperature specified in the Methods section for each enzyme.(B) RT-PCR analysis of genes involved in oxidative stress and carbon metabolism from wt, gapc-1 and as-GAPC1 plants. Total RNA was reversed transcribed and then amplified using specific primers. The housekeeping β-ACTIN was used as internal control. PDC-2: pyruvate decarboxylase 2; RCA: RubisCO activase; SS: small subunit; CAT: catalase.
www.plantphysiol.orgon December 26, 2019 - Published by Downloaded from Copyright © 2008 American Society of Plant Biologists. All rights reserved.

Figure 8
Figure 8. Measurement of oxygen uptake, ATP levels and analysis of the expression and activity of TCA cycle enzymes(A) Determination of O2 evolution (µmol O2. min-1.mg-1 DW) in detached leaves and flowers from wt (white bars) and gapc-1 plants (black bars). DW, dried weight(B) ATP levels determined in wt (white bars) and gapc-1 (black bars) Arabidopsis rosettes leaves and flowers. FW: fresh weight.(C, left) RT-PCR analysis of aconitase (ACO; At2g05710) and succinate dehydrogenase(SDH; At3g27380) transcripts involved in TCA cycle determined in wt, gapc-1 and as-GAPC1 plants. Total RNA was reversed transcribed and then amplified using specific primers. The housekeeping β-actin was used as internal control. (C, right) Enzymatic activity of aconitase and SDH in wt (with bars), gapc-1 (grey bars) and as-GAPC1 plants (black bars). Each enzymatic assay was performed using 10 µg total proteins from isolated mitochondrial fraction. The activity of each enzyme in wt plants was used as a reference value.
www.plantphysiol.orgon December 26, 2019 - Published by Downloaded from Copyright © 2008 American Society of Plant Biologists. All rights reserved.

Figure 9
Figure 9. Determination of ROS, trichome density and RT-PCR analysis of genes involved in ROS responses(A) Histochemical detection of ROS by H2DCFA. Fluorescence was visualized by microscopy after incubation of leaves from wt gapc-1 and as-GAPC1 lines with H2DCFDA. Figures show the fluorescence of two representative trichomes from each line. (B) Trichome distribution on adult rosettes leaves of wt, gapc-1 mutant and as-GAPC1transgenic line. (C) RT-PCR analysis of PEROX and AOX genes involved in ROS metabolism from wt, gapc-1 and as-GAPC1 plants. Total RNA was reversed transcribed and then amplified using specific primers. The housekeeping β-ACTIN was used as internal control.
www.plantphysiol.orgon December 26, 2019 - Published by Downloaded from Copyright © 2008 American Society of Plant Biologists. All rights reserved.