running & science - nexs.ku.dk
TRANSCRIPT

EDITOR: Jens Bangsbo & Henrik B. Larsen
ISBN 87 16 12349-9Institute of Exercise and Sport SciencesUniversity of Copenhagen
This book gathers a number of disciplinesrelevant to science of running. Several chap-ters focus on the various aspects of perfor-mance in running, whereas others deal withhow to train to improve performance in run-ning with specific descriptions of the trainingperformed by top-class runners. The aspectof how to avoid injuries is also thoroughlycovered. All chapters provide up-to-dateknowledge about running presented by worldleading experts within running. The book is auseful tool for researches, teachers, coachesand runners to understand how to optimiseperformance in running.
Other books in the series:
• Sailing & Science
• Soccer & Science
• European Diversity in Sportand Physical Activity
Running & Science– in an Interdisciplinary Perspective
Running
&
Science
– in
an Interdisciplinary
Perspective
MUNKSGAARD
MU
NK
SG
AA
RD

1
PREFACE
Running & Science

2
RUNNING & SCIENCE

3
PREFACE
Running & Science
EditorsJens Bangsbo &
Henrik B. Larsen
Series editorJens Bangsbo
Munksgaard
Institute of Exercise and Sport SciencesUniversity of Copenhagen
Copenhagen 2000

4
RUNNING & SCIENCE
RRRRRUNNINGUNNINGUNNINGUNNINGUNNING & S & S & S & S & SCIENCECIENCECIENCECIENCECIENCE
Copyright © 2001 Institute of Exercise and Sport Sciences,University of Copenhagen
Editors: Jens Bangsbo & Henrik B. LarsenSeries editor: Jens BangsboDesign and layout: Allis Skovbjerg JepsenFront page: Robert Delaunay: Løberne, 1926.Fotos: p. 18, 48, 66, 108, 119: Sports Foto.p. 84: Sparta Archive.p. 122, 137, 148: Private.
ISBN 87 16 12349-9
All rights reserved. The reproduction or utilization of this work in any form orby any electronic, mechanical, or other means, now known or hereafter invented,including xerography, photocopying and recording, and in any informationretrieval system, is forbidden without the written permission of the publisher.
Printed in Denmark 2001.
Institute of Exercise and Sport SciencesInstitute of Exercise and Sport SciencesInstitute of Exercise and Sport SciencesInstitute of Exercise and Sport SciencesInstitute of Exercise and Sport SciencesUniversity of CopenhagenNørre Allé 51DK-2200 Copenhagen
Phone: +45 35 32 08 29Fax: +45 35 32 08 70e-mail: [email protected]: www.ifi.ku.dk

5
PREFACE
Content
Preface ........................................................................................................ 7
Preword ...................................................................................................... 9
List of editors and authors ...................................................................... 11
About the editors ..................................................................................... 13
About the authors .................................................................................... 15
Physiological capacity of the elite runner ............................................ 19Tim Noakes
Muscle fibre type characteristics of the runner .................................. 49Jesper L. Andersen
Physiological factors affecting running performance ........................ 67Carlo Capelli & Pietro E. di Prampero
Running economy ................................................................................. 85Jan Svedenhag
Prevention of overuse injuries in running ........................................ 109Albert Gollhofer
Training principles in distance running ............................................ 123Henrik B. Larsen
Training volume and intensity ............................................................ 149Leif Inge Tjelta and Eystein Enoksen

6
RUNNING & SCIENCE

7
PREFACE
Preface
In August 1997 the 2nd “European Congress of Sport and ExerciseScience” was held in Copenhagen with more than 800 participants.The scientific programme covered all aspects of exercise and sportsciences with more than 100 invited speakers and 400 presentations.Within the theme “Science and Sport” a number of symposia coveredsports from a multidiciplinary perspective. As many people have ex-pressed an interest in this multidisciplinary approach of sport we havedecided to produce a series of books on „soccer“, „sailing“, „running“and „European diversity in sport and physical activity“, respectively.We have been fortunate that so many experts have agreed to contributeto the books allowing for an integration of physiological, psychological,historical and social aspects of the sport. Each chapter in the booksprovides up-to-date knowledge about the topic and includes a highnumber of references to allow the reader to go further into depth withthe subject area. It is anticipated and hoped that the books will be usefulfor university researchers, teachers and students as well as for interestedcoaches.
We will like to express our appreciation to the authors and reviewersas well as the editors for their great effort, which has enabled us toproduce these informative books.
Jens BangsboSeries Editor

8
RUNNING & SCIENCE

9
PREWORD
Preword
This book gathers a number of disciplines relevant to science of running.A number of chapters focus on the various aspects of performance inrunning, whereas others deal with how to train to improve performancein running with specific descriptions of the training performed by formertop-class runners. The aspect of how to avoid injuries is also thoroughlycovered. All chapters provide up-to-date knowledge about running.Any scientific approach has to have its foundation in practicalexperiences with running and the authors of this book are duly selectedby their combined scientific expertise and long-term practicalexperience with running. Thus, the book is a useful tool for researches,teachers, coaches and runners to understand how to optimise perfor-mance in running.
We will take this opportunity to extend our gratitude to the authorsand the individuals who have been involved in the reviewing of chaptersin this book, Preben K. Pedersen, Jean-René Lacour, Jan Svedenhag,Erik B. Simonsen, A. Lennart Julin, Gustav Schwenk and MichaelKjær.
We hope you will find the book interesting and enjoy your reading.
Jens Bangsbo & Henrik B. LarsenEditors

10
RUNNING & SCIENCE

11
ABOUT THE AUTHORS
List of Editors and Authors
JESPER L. ANDERSEN, Copenhagen Muscle Research Centre,Department of Molecular Muscle Biology, Rigshospitalet, Section9312, Juliane Mariesvej 20, 1.th., 2100 Copenhagen Ø, Denmark.Telephone: (+45) 3545 6501 Fax: (+45) 3545 6500 E-mail:[email protected]
JENS BANGSBO, Institute of Exercise and Sport Sciences, Universityof Copenhagen, Universitetsparken 13, 2100 Copenhagen Ø, Den-mark. Telephone: (+45) 3532 1623 Fax: (+45) 3532 1600E-mail: [email protected]
CARLO CAPELLI, Dipartimento di Scienze e Tecnologie Biomediche,School of Medicine, University of Udine, Via Gervasutta 48, 33100,Udine, Italy. Telephone: (+39) 432 520188 Fax: (+39) 432 600828E-mail:[email protected]
EYSTEIN ENOKSEN, Department of Sport and Biology, NorwegianUniversity of Sport and Physical Education, P.B. 4014, U.S., 0806Oslo, Norway. Telephone: (+47) 2326 2310 Fax: (+47) 2326 2451E-mail: [email protected]
ALBERT GOLLHOFER, Department of Sport Science, Allmandring28, 70569 Stuttgart. Telephone: (+49) 6853186E-mail: [email protected]
HENRIK B. LARSEN, Institute of Exercise and Sports Sciences,University of Copenhagen, Universitetsparken 13, 2100 CopenhagenØ, Denmark. Telephone: (+45) 3675 5317E-mail: [email protected]
T. D. NOAKES, Bioenergetics of Exercise Research Unit, Universityof Cape Town, Sports Science Institute of South Africa, BoundaryRoad Newlands, 7700, South Africa. Telephone: (021) 6867330Fax: (021) 6867530 E-mail: [email protected]

12
RUNNING & SCIENCE
JAN SVEDENHAG, Department of Clinical Physiology, KarolinskaInstitute, S:t Göran Hospital, 112 81 Stockholm, Sweden. Telephone:(+46) 8 5870 1515 Fax: (+46) 8 5870 1928E-mail: [email protected]
PIETRO E. DI PRAMPERO, Dipartimento di Scienze e TecnologieBiomediche, School of Medicine, University of Udine, ViaGervasutta 48, 33100, Udine, Italy. Telephone: (+39) 432 520188Fax: (+39) 432 600828
LEIF INGE TJELTA, Institute of Physical Education, StavangerUniversity College, P.O.Box 2557, Ullandhaug, 4091 Stavanger,Norway. Telephone: (+47) 5183 3523 Fax: (+47) 5183-3540E-mail: [email protected]

13
ABOUT THE AUTHORS
Jens Bangsbo Jens Bangsbo Jens Bangsbo Jens Bangsbo Jens Bangsbo is associate professor at the Institute of Exercise andSport Sciences, University of Copenhagen, where he achieved hisdoctoral degree with the thesis „Physiology of Soccer – with a specialreference to high intensity intermittent exercise“. He has written morethan one hundred original papers and reviews. He is the author of 12books published in a number of different languages. He is a memberof the Copenhagen Muscle Research Centre. He has received the „Bio-chemistry of Exercise“ award. He is a member of the InternationalSteering Group on Science and Football.
Henrik B. LarsenHenrik B. LarsenHenrik B. LarsenHenrik B. LarsenHenrik B. Larsen is a researcher at the August Krogh Institute, Uni-versity of Copenhagen, where he has studied the physiology of running.He is author of many articles on different topics of sports physiology.He is a former 400 m runner and has represented Denmark on thejunior national team. Furthermore, he is former national coach (1987-1995) for the Danish middle- and long distance runners. He is currentlyperforming a number of scientific investigations attempting to revealthe reasons for the Kenyan superiority in middle- and long distancerunning.
About the Editors

14
RUNNING & SCIENCE

15
ABOUT THE AUTHORS
Tim Noakes Tim Noakes Tim Noakes Tim Noakes Tim Noakes is professor of exercise and sports science at the Univer-sity of Cape Town and the Sports Science Institute of South Africa. Hehas been an active runner for the past 30 years and completed morethan 70 marathon or ultramarathon races including seven 90 kmComrades Marathon with a best time in 1973 of 06:49. He is author ofthe book ”Lore of Running”. His research interests include the natureof fatigue during exercise and factors that determine elite performancein sports like running, and in skill sports like cricket.
Jesper L. Andersen Jesper L. Andersen Jesper L. Andersen Jesper L. Andersen Jesper L. Andersen is a researcher at the Copenhagen Muscle Re-search Centre in the Department of Molecular Muscle Biology at theCopenhagen University Hospital in Copenhagen, Denmark. He didhis PhD at the August Krogh Institute at the University of Copenhagen.He is the author of a number scientific articles published in internatio-nal journals. Furthermore, he is former coach for the Danish Nationaltrack and field team (sprinters).
Carlo Capelli Carlo Capelli Carlo Capelli Carlo Capelli Carlo Capelli is associate professor of human physiology at theSchool of Medicine of Udine, Italy. He is a medical doctor with a postdoctorate education in Sports Medicine. He is the author of severalpapers dealing with the energy cost of human locomotion and has aparticular interest in models utilised to predict best performances insport.
About the Authors

16
RUNNING & SCIENCE
Pietro Enrico di Prampero Pietro Enrico di Prampero Pietro Enrico di Prampero Pietro Enrico di Prampero Pietro Enrico di Prampero is professor of human physiology at theSchool of Medicine of Udine, Italy. He is author of several paperspublished on international journals of exercise and respiratoryphysiology and of one book on biomechanics and bioenergetics ofhuman locomotion. He has been member of the Life Science WorkingGroup and of the Microgravity Advisory Board of the European SpaceAgency. He is presently the editor-in-chief of the European Journal ofApplied Physiology. He has particular interests in the exercise andrespiratory physiology, in the physiology of the adaptation tomicrogravity in humans and in the bioenergetics applied to recordperformances in human locomotion.
Jan Svedenhag Jan Svedenhag Jan Svedenhag Jan Svedenhag Jan Svedenhag is associate professor in exercise physiology at theKarolinska Institute, Stockholm, Sweden. He is presently working atthe Department of Clinical Physiology, S:t Görans Hospital, Stock-holm. As a devoted long- distance runner (best marathon time 2:22)he became interested in the secrets of running. He has worked withthe Swedish National Teams in middle- and long-distance running andtriathlon as well as in cross-country skiing. Apart from exercisephysiology, he has also particular interest in environmental physiology,such as the effect of altitude.
Albert GollhoferAlbert GollhoferAlbert GollhoferAlbert GollhoferAlbert Gollhofer is professor of biomechanics of the Department ofSport Science at the University of Stuttgart, Germany. He is presidentof the German Society of Biomechanics and serves as the head of thescientific committee of the European College of Sport Science. Hisengagements comprise several memberships in national and interna-tional editorial boards. The main research interest is related to neuro-muscular control mechanisms and their functional adaptations totraining and exercise. In several research projects he investigates thebiomechanics of joint stabilization of the ankle and knee joint com-plexes. He is author and co-author of numerous publications in thisarea.
17
ABOUT THE AUTHORS
Henrik B. LarsenHenrik B. LarsenHenrik B. LarsenHenrik B. LarsenHenrik B. Larsen is a researcher at the August Krogh Institute, Uni-versity of Copenhagen, where he has studied the physiology of running.He is author of many articles on different topics of sports physiology.He is a former 400 m runner and has represented Denmark on thejunior national team. Furthermore, he is former national coach (1987-1995) for the Danish middle- and long distance runners. He is currentlyperforming a number of scientific investigations attempting to revealthe reasons for the Kenyan superiority in middle- and long distancerunning.
Leif Inge Tjelta Leif Inge Tjelta Leif Inge Tjelta Leif Inge Tjelta Leif Inge Tjelta is assistant professor in sport at Institute of PhysicalEducation at Stavanger University College. He has been coachingdistance runners for 20 years and have been National coach in Norway.He has competed international for Norway on 1500 m and was a distancerunner of national standard until his late thirties. As member of theboard in the Norwegian Association for Athletic Coaches, he has writtenmany articles conserning distance running.
Eystein Enoksen Eystein Enoksen Eystein Enoksen Eystein Enoksen Eystein Enoksen is associate professor at the Norwegian Universityof Sport, Oslo, Norway. He is the leader of the department of trackand field as well as the coaching education at the university. In addi-tion, he has been consultant for the national association for coaches intrack and field for ten years. He has 30 years of teaching and coachingexperience in middle- and long distance training. He has writtenextensively in the fields of physical education, track and field, trainingtheory/conditioning, recreation and health.

RUNNING & SCIENCE
18

19
PHYSIOLOGICAL CAPACITY OF THE ELITE RUNNER
Physiological Capacityof the Elite Runner
Tim Noakes
SynopsisThe importance of conceptual models is that they indicate thatdifferent physiological systems may contribute to the success ofelite athletes at different racing distances. In the past there has,perhaps, been an excessive focus on the exclusive role of cardiovas-cular function and oxygen transport in determining superior run-ning performance. Rather this review suggests that multiplephysiological systems likely contribute to superior running ability.The challenge for the coming generation of exercise physiologists isbetter to define the separate contributions of these different systems.
IntroductionThe essential characteristics of the elite distance runner is the ability tosustain a high rate of energy expenditure (running speed) for unusuallylong. Indeed the most successful athletes are those who maintain thisoptimum rate of energy production for the entire duration of any race,seemingly without apparent fatigue. The range of these performancesis also quite astonishing. Thus whereas the average human might beespecially proud to run at 12 km•h-1 (5 min•km-1) for 60 or so minutes,the best athletes in the world can run at better than 21 km•h-1 for 21km, 20 km•h-1 for 42 km and 16.5 km•h-1 for 90 km, the latter lastingfor close to 5½ hours. When it is appreciated that few humans, excepttrained athletes, can sustain a running speed of 16 km•h-1 for more

RUNNING & SCIENCE
20
than a few minutes, the unique ability of these elite athletes begins tobecome apparent.
In addition, any analysis of the world’s best runners at distancesfrom 5-42 km shows that all are also very fast over short distances of800 m to the mile. For example, current 10000 m world record hol-der, Ethiopian Haile Gebrselassie has current (1999) fastest 800 and1500 m times of 1:49.51 and 3:31.76 min, respectively. His closestrival at distances from 3000-10000 m, Kenyan Daniel Komen hasalready run the mile 1 second faster than one of the greatest milers ofall time, former world record holder and double Olympic champion,Sebastian Coe. Yet when their respective best performances over 5000m are compared, Komen’s best current time is more than 80 seconds,or 10% faster than Coe’s best at that distance (53).
It is rumoured that when Gebrselassie retires from competitive trackrunning, he plans to be the first human to run the 42.2 km marathon inless than 2hrs, an improvement of more than 5 minutes on the currentworld record. Few knowledgeable in the sport would be prepared tobet against the possibility that either of these two athletes, unquestiona-bly the most physiologically gifted runners of all time, will achievethis and other athletic records considered unattainable even quite recently.
In summary, an analysis of the physiological factors explainingsuperior running ability must explain both characteristics of the eliterunners; the ability to run very fast in shorter distance races lastingfrom 90 seconds to 4 minutes, and the ability to run at a high percent-age of that maximum speed for up to 2 or more hours. These twoabilities may be caused by the same physiological variables, or theymay be entirely different. We begin this analysis of these variables byevaluating the traditional physiological explanation for superior runningability before speculating on a more modern interpretation.
Maximum oxygen consumptionas a predictor of running ability
A fundamental physiological principle is that the best predictor of aspecific competitive performance is a laboratory or field test that closelymimics the duration of the actual competitive performance.

21
PHYSIOLOGICAL CAPACITY OF THE ELITE RUNNER
The original and still the most popular test to predict running ability isthe measurement of maximum oxygen consumption (V
.O2
-max). This testtypically lasts less than 20 minutes for about the last quarter (2-5 minutes)of which the athlete is running under the duress similar to that experiencedin competitions lasting a few minutes, such as races of 800-1500 m. Thephysiological logic for this test has been inherited from the studies of Hillet al. (30, 32) as interpreted by Taylor et al. (75).
It was originally assumed, since questioned by Noakes (48, 50, 51), thatHill and his colleagues had established that during progressive exercise toexhaustion, humans reached a “plateau” in oxygen consumption so thatoxygen consumption failed to rise further despite further increases inrunning speed (Figure 1). As a result, continued running beyond the pla-teau was said to cause the muscles to contract anaerobically with productionof lactic acid that ultimately prevented further muscle contraction, causingexhaustion and termination of exercise. Hence the assumption has beenthat a greater capacity to transport oxygen to the active muscles woulddelay the onset of anaerobic conditions in the active muscles, therebyallowing the athlete to continuing running for longer. As a result, a highcapacity to transport oxygen would (a) be measured as a high VO2-maxvalue; (b) would allow the athlete to achieve a high running speed duringthe VO2-max test, and (c) would be an excellent predictor of running abilityat any running distance. There is now sufficient experience that the promiseand pitfalls of the VO2
-max test for predicting running ability are relativelywell defined.
In the first place, it is established that those elite athletes who have theability to achieve the fastest running speeds in competitions lasting morethan 2 minutes have much higher VO2-max values, than do recreationalathletes or untrained subjects (65). Given the linear relationship betweenoxygen consumption and running speed (Figure 1), it is to be expectedthat the best runners would reach higher running speeds and hence higherVO2-max values than less good athletes. Table 1 shows the range of VO2-maxvalues recorded in some elite athletes.
One of the highest reported VO2-max value in a male runner is that offormer 10000 m world record holder Dave Bedford (85 ml O2•kg-1 •min-1)and in a female runner, 78 ml O
2 •kg-1•min-1 in Joan Benoit, winner of
the inaugural 1984 Womens Olympic Marathon. The highest value yetreported in any athlete is a value of 93 ml O2•kg-1•min-1 in a Scandinaviancross-country skier. In contrast, VO2
-max values measured in otherwisehealthy young men are much lower, usually between 45 to 55 ml

RUNNING & SCIENCE
22
O2•kg-1•min-1, or about 40 percent lower than in elite athletes. As theVO2-max can be improved by up to a maximum of 20-25 percent evenwith intensive training, it is clear that the average healthy individual cantrain as much as he or she likes, yet will never achieve a VO2-max valueanywhere near that of the elite athletes. Therefore, in as much as VO2-maxis an (indirect) measure of potential for success in endurance activities, it isclear that hereditary factors must play an important role in determiningthose who will become champions.
But it is interesting that even among elite athletes with quite similarperformances, VO2-max values may vary quite dramatically. For example,American runners Steve Prefontaine and Frank Shorter (Table 1), twoathletes whose VO2
-max values differed substantially (by 16 percent), hadbest mile times that differed by less than 8 seconds (3.4 percent) and best3 mile (4.8 km) times that differed by even less (0.2 seconds). If VO2-maxis the sole explanation for differences in running performance, thenPrefontaine should have been much better at all running distances. Similarly,despite a substantially higher VO2-max value, Joan Benoit’s marathon ti-mes were not faster than that of Derek Clayton, who held the worldmarathon record despite a relatively poor VO2-max value of 69 ml
Figure 1. A popular graphic depicting how the original studies of Hill et al. wereinterpreted to indicate the development of a “plateau” that defined the maximumoxygen consumption (V
.O2
-max).Redrawn from 41.

23
PHYSIOLOGICAL CAPACITY OF THE ELITE RUNNER
O2•kg-1•min-1. These examples suggest that the VO2-max becomes a lessgood predictor of elite athletic performances as the distance of the eventincreases although this has not been scientifically evaluated. This too canbe inferred from the comparison of the respective 5000 m performance ofSebastian Coe (VO2
-max = 78 ml O2•kg-1•min-1) and Daniel Komen whose
VO2-max has not been reported. It seem improbable that Komen’s 10%
faster time over 5000 m but similar 1500 m time as Coe could be due to asubstantially higher VO2
-max than that of Coe.The alternate paradox is that some athletes with quite similar VO2
-maxvalues have quite different running performances. Compare, for example,the performances of the American, Alberto Salazar, the Norwegian, GreteWaitz and the Briton, Cavin Woodward, whose best marathon times of2:08:13; 2:25:29 and 2:19:50 hr:min:s, respectively, were greatly differentdespite similar VO2
-max values (Table 1).In summary, the VO2
-max test, long considered the ultimate predictorof running performance has been shown to have limitations. First, the testis an excellent predictor of performance in groups of athletes of quite
Table 1. Maximum oxygen consumption (VO2-max) and performancevalues of some elite runners
Athlete Country Major performance VO2-max(ml•kg-1•min-1)
David Bedford UK 10000 m WR (1973) 85Steve Prefontaine USA 1 mile 03:54.6 84Craig Virgin USA 2:10:26 Marathon 81Joan Benoit USA 1984 Olympic Marathon
gold medal 78Sebastian Coe UK 1980 and 1984 1500 m
Olympic Gold medals 78Alberto Salazar USA Marathon WR (1981) 76Cavin Woodward UK 100 km WR (1976) 74Grete Waitz Norway Marathon WR (1980) 73Frank Shorter USA 1972 Olympic Marathon
gold medal 71Derek Clayton Australia Marathon WR (1969) 69
WR = World Record

RUNNING & SCIENCE
24
different abilities including the very good and the very bad. When thisapproach is used, the results are as expected. The slow athletes have lowVO2
-max values, the fast runners much higher O2-max values (2, 13, 14,
17, 23, 24, 39, 42, 77).However, when groups of athletes with very similar running performan-
ces are studied, for example, the athletes listed in Table 1, then, it isfound that the VO2-max becomes a far less sensitive predictor ofperformance (9, 10, 11, 12, 54, 59, 65, 69).
Furthermore, the predictive ability of the VO2-max test becomes less
the longer the duration of the competitive event. This however shouldnot be surprising. For the reason that the VO2
-max test is of relativelyshort duration and, in essence, involves running at close to maximumspeed for a few minutes, similar to the demands of racing 800-2000 m.According to the concept of specificity of testing, it would be likely thatthis test would predict performance more accurately in short-duration eventsof high intensity than it would during more prolonged exercise when fac-tors other than the maximum capacity to transport oxygen, might determineperformance. These factors could relate to skeletal muscle or perhaps evencentral (brain) function (53).
Why the VO2-max test is not a flawlesspredictor of running ability
Running economy and peak treadmill running speed
The first reason why the VO2-max test alone is a relatively less good predictorof running performance is because athletes differ (i) in their rate of oxygenconsumption (VO2 ) at any running speed and (ii) in the peak runningspeed they reach during the maximal treadmill test. David Dill and hiscolleagues (20) and later David Costill’s group (12, 15) were probably thefirst scientists to suggest that there may be differences in the amount ofoxygen different athletes actually require when running at the same speeds.These individual differences in running economy and in peak treadmillrunning velocity could be the factors explaining different runningperformance in athletes with similar VO2-max values or conversely similarrunning performance in athletes with very dissimilar VO2
-max values (48).Figure 2 which compares the VO2 at submaximal running speeds (running

25
PHYSIOLOGICAL CAPACITY OF THE ELITE RUNNER
economy) and the maximal running velocity, as well as the VO2-max in 3idealised runners A, B and C, explains this phenomenon.
The first difference between the three runners is their oxygen consump-tion at any submaximal running speed. Hence, as shown in Figure 2, runnerC is the most economical runner as his VO2 at 18 km•h-1 is about 55 mlO
2•kg-1•min-1 whereas B and A are less economical with VO2
’s of about60 ml O2•kg-1•min-1 and 65 ml O2•kg-1•min-1 respectively. The first resultis that when runners A and B reach their peak treadmill running speeds at20 km•h-1, the least economical runner, runner A, has a higher VO2
-maxvalue than does runner B. Yet the most economical runner, runner C,reaches a higher peak treadmill running velocity than both runners A andB, yet his VO2
-max is equal to that of B but lower than that of A. Butwhich of these runners would likely run the fastest in races of 3-21 km?
Figure 2. Comparison of running economy, peak treadmill running speed andVO2-max in three theoretical runners (A, B and C) who differ in their runningeconomy and peak treadmill running velocity, defined as the peak treadmill velocityachieved during the progressive exercise test for measurement of VO2-max.
Note that the least economical runner A achieves the same peak treadmill velocityas runner B but has the highest VO2-max; the more economical runner B achievesthe same peak treadmill velocity and hence a lower VO2-max than runner A;whereas the most economical runner C achieves the highest peak treadmill velocitywith a VO2-max only equal to that of runner B and lower than that of runner A.

RUNNING & SCIENCE
26
In general, it has been shown that the best athletes are usually the mosteconomical (48) corresponding to runner C in Figure 2. This finding hasbeen most clearly shown by Conley and Krahenbuhl (10), who studied agroup of 12 runners whose best 10 km times were closely bunched between30:31 and 33:33 min. They found that the runners’ VO2
-max values, whichranged from 67 to 78 ml O
2•kg-1•min-1, could not be used to predict their
10 km times. For example, the second-fastest runner had the second-lowestVO2
-max value. However, there was an excellent correlation between theVO2
of each runner at each of three submaximal running speeds (14.5,16.1 and 17.7 km•h-1) and their best time for the 10 km race. Thus therunners who used the least oxygen at each of these running speeds andwere therefore the most economical, had the fastest 10 km running times.
The authors concluded that a high VO2-max (above 67 ml O2•kg-1 •min-1)helped each athlete gain membership of this elite performance group, butwithin this select group, running economy and not VO2
-max was the factorcontrolling success in the 10 km race.
But I would interpret these data somewhat differently. For according toFigure 2, athletes with different running economies and similar VO2
-maxvalues must differ in the peak treadmill speed that they achieve during theVO2
-max test (compare runners B and C). Or else their VO2-max values
must be different (compare runners A and B). Thus the crucial, butunreported physiological data, necessary for a full analysis of the study ofConley and Krahenbuhl (10), was the peak treadmill running velocitiesachieved by their subjects during the maximal exercise test. We have definedthis as the peak running velocity achieved during the progressive exercisetest used for the measurement of the VO2
-max (48, 54).For there are now a number of studies showing that the peak treadmill
running velocity is at least as good as any other variable and substan-tially superior to the VO2
-max, for predicting running performance at arange of distances (4, 28, 34, 36, 37, 38, 43, 54, 57, 69, 70, 78).
Thus, according to these predictions, Runner C in Figure 2 would bethe fastest runner at any distance despite having a lower VO2
-max valuethan Runner A. The low VO2-max is a reflection of a superior runningeconomy; his superior performance is related to his ability to achieve thehighest peak treadmill running speed. The runner in Table 1 who mostclosely fits this description would be Derek Clayton, who is known to havebeen one of the most economical runners yet studied, who had a relativelylow VO2
-max (Table 1) but who nevertheless held the world record forthe 42 km standard marathon.
27
PHYSIOLOGICAL CAPACITY OF THE ELITE RUNNER
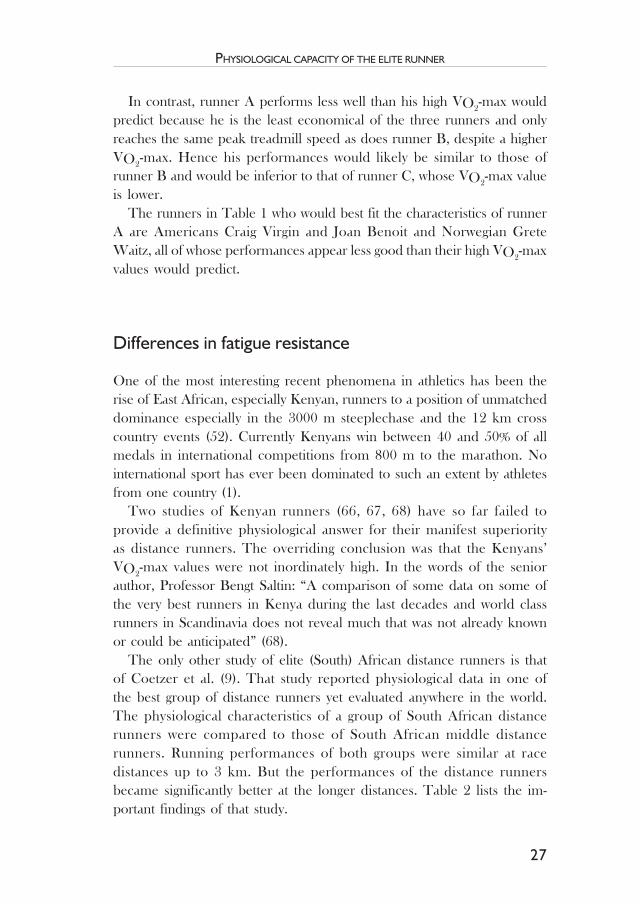
In contrast, runner A performs less well than his high VO2-max wouldpredict because he is the least economical of the three runners and onlyreaches the same peak treadmill speed as does runner B, despite a higherVO2-max. Hence his performances would likely be similar to those ofrunner B and would be inferior to that of runner C, whose VO2
-max valueis lower.
The runners in Table 1 who would best fit the characteristics of runnerA are Americans Craig Virgin and Joan Benoit and Norwegian GreteWaitz, all of whose performances appear less good than their high VO2
-maxvalues would predict.
Differences in fatigue resistance
One of the most interesting recent phenomena in athletics has been therise of East African, especially Kenyan, runners to a position of unmatcheddominance especially in the 3000 m steeplechase and the 12 km crosscountry events (52). Currently Kenyans win between 40 and 50% of allmedals in international competitions from 800 m to the marathon. Nointernational sport has ever been dominated to such an extent by athletesfrom one country (1).
Two studies of Kenyan runners (66, 67, 68) have so far failed toprovide a definitive physiological answer for their manifest superiorityas distance runners. The overriding conclusion was that the Kenyans’VO2
-max values were not inordinately high. In the words of the seniorauthor, Professor Bengt Saltin: “A comparison of some data on some ofthe very best runners in Kenya during the last decades and world classrunners in Scandinavia does not reveal much that was not already knownor could be anticipated” (68).
The only other study of elite (South) African distance runners is thatof Coetzer et al. (9). That study reported physiological data in one ofthe best group of distance runners yet evaluated anywhere in the world.The physiological characteristics of a group of South African distancerunners were compared to those of South African middle distancerunners. Running performances of both groups were similar at racedistances up to 3 km. But the performances of the distance runnersbecame significantly better at the longer distances. Table 2 lists the im-portant findings of that study.
RUNNING & SCIENCE
28
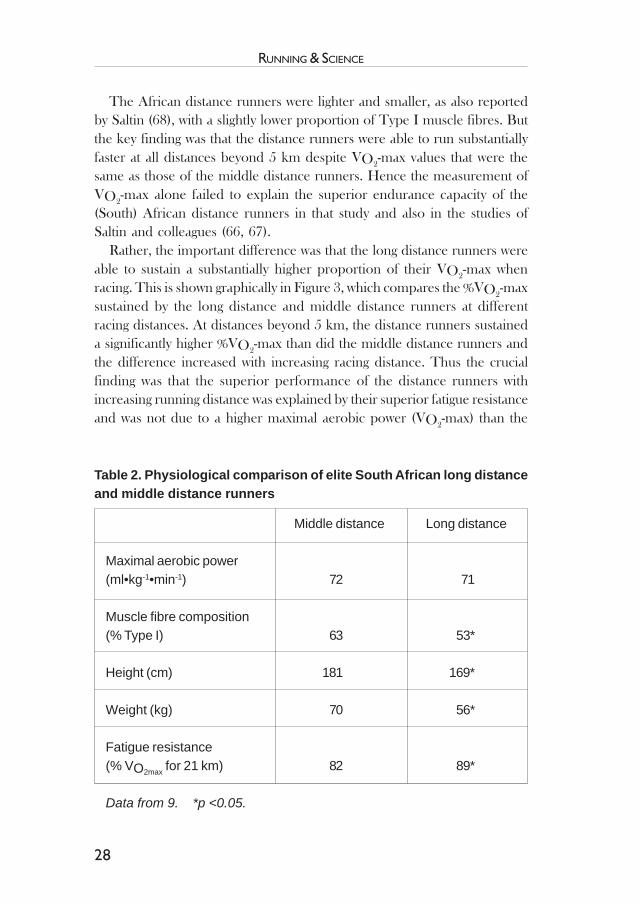
The African distance runners were lighter and smaller, as also reportedby Saltin (68), with a slightly lower proportion of Type I muscle fibres. Butthe key finding was that the distance runners were able to run substantiallyfaster at all distances beyond 5 km despite VO2-max values that were thesame as those of the middle distance runners. Hence the measurement ofVO2
-max alone failed to explain the superior endurance capacity of the(South) African distance runners in that study and also in the studies ofSaltin and colleagues (66, 67).
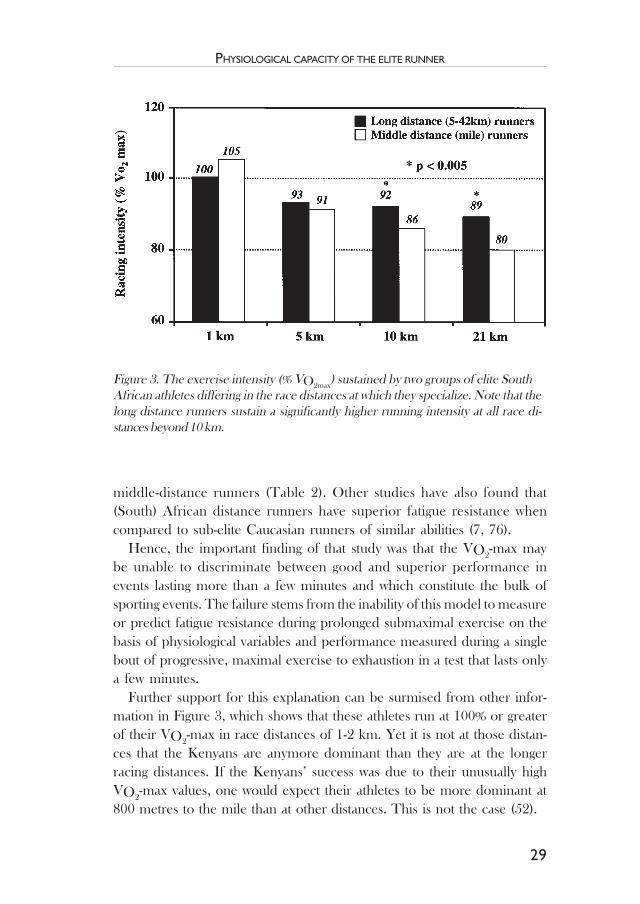
Rather, the important difference was that the long distance runners wereable to sustain a substantially higher proportion of their VO2-max whenracing. This is shown graphically in Figure 3, which compares the %VO2
-maxsustained by the long distance and middle distance runners at differentracing distances. At distances beyond 5 km, the distance runners sustaineda significantly higher %VO2
-max than did the middle distance runners andthe difference increased with increasing racing distance. Thus the crucialfinding was that the superior performance of the distance runners withincreasing running distance was explained by their superior fatigue resistanceand was not due to a higher maximal aerobic power (VO2
-max) than the
Middle distance Long distance
Maximal aerobic power(ml•kg-1•min-1) 72 71
Muscle fibre composition(% Type I) 63 53*
Height (cm) 181 169*
Weight (kg) 70 56*
Fatigue resistance(% VO2max for 21 km) 82 89*
Data from 9. *p <0.05.
Table 2. Physiological comparison of elite South African long distanceand middle distance runners
29
PHYSIOLOGICAL CAPACITY OF THE ELITE RUNNER
middle-distance runners (Table 2). Other studies have also found that(South) African distance runners have superior fatigue resistance whencompared to sub-elite Caucasian runners of similar abilities (7, 76).
Hence, the important finding of that study was that the VO2-max maybe unable to discriminate between good and superior performance inevents lasting more than a few minutes and which constitute the bulk ofsporting events. The failure stems from the inability of this model to measureor predict fatigue resistance during prolonged submaximal exercise on thebasis of physiological variables and performance measured during a singlebout of progressive, maximal exercise to exhaustion in a test that lasts onlya few minutes.
Further support for this explanation can be surmised from other infor-mation in Figure 3, which shows that these athletes run at 100% or greaterof their VO2
-max in race distances of 1-2 km. Yet it is not at those distan-ces that the Kenyans are anymore dominant than they are at the longerracing distances. If the Kenyans’ success was due to their unusually highVO2
-max values, one would expect their athletes to be more dominant at800 metres to the mile than at other distances. This is not the case (52).
Figure 3. The exercise intensity (% VO2max) sustained by two groups of elite South
African athletes differing in the race distances at which they specialize. Note that thelong distance runners sustain a significantly higher running intensity at all race di-stances beyond 10 km.

RUNNING & SCIENCE
30
In summary, the concept that endurance athletes differ in their fatigueresistance is not new; a number of studies have shown that athletes differin the exercise intensity expresses as a %VO2
-max, that each can sustainduring more prolonged exercise (13, 17) and that this variable also predictsendurance performance.
What has perhaps not always been appreciated is that physiological fac-tors determining the VO2-max and the %VO2-max that can be sustainedduring prolonged exercise might be quite different so that a high VO2
-maxvalue does not guarantee the capacity to sustain a high VO2
-max duringmore prolonged exercise, and vice versa.
Hence another possible explanation for the differences in running per-formance of athletes with different or similar VO2
-max values (Table 1) is likelyto be differences in the %VO2-max that each can sustain during prolongedexercise. Some possible explanations for this are described subsequently.
Concerns with the VO2-max modelfor predicting athletic ability
A final reason why the VO2-max may be a relatively poor predictor ofathletic ability in runners with similar abilities could possibly be becauseperformance may not actually be determined by the rate of oxygendelivery to the active muscles and the prevention of anaerobic skeletalmuscle metabolism, as is usually assumed. The arguments against thistheory have been detailed (48; 50, 51, 53) and only the salient pointswill be reviewed here.
The theoretical basis for the model which uses the VO2-max to predictrunning performance, holds that the “plateau” in oxygen consumptionduring the VO2-max test occurs when the heart is unable to increase thecardiac output. As a result, blood flow to the exercising muscles reaches amaximum value. Hence any further increase in work output by theexercising muscles can only be achieved by an increase in anaerobicmetabolism with the production of lactate and hydrogen ions (H+).Accumulation of lactate and H+ are then thought to inhibit muscularcontraction causing the termination of exercise.
Perhaps the major but overlooked limitation of this model is that, ifthe pumping capacity of the heart does indeed limit oxygen utilizationby the exercising skeletal muscle, then the heart itself will be the first

31
PHYSIOLOGICAL CAPACITY OF THE ELITE RUNNER
organ affected by any postulated oxygen deficiency (51, 53). This was firstrecognized by Hill and his colleagues as early as 1924 (32) yet was lost toposterity until recently re-discovered (51, 53).
For the interpretation of Hill and his colleagues was unequivocal: “Certainit is that the capacity of the body for muscular exercise depends largely, ifnot mainly, on the capacity and output of the heart. It would obviously bevery dangerous for the organ to be able, as the skeletal muscle is able, toexhaust itself very completely and rapidly, to take exercise far in excess ofit capacity for recovery. …When the oxygen supply becomes inadequate,it is probable that the heart rapidly begins to diminish its output, so avoidingexhaustion…” (32).
The point identified by Hill and his colleagues and since seems to beoverlooked by subsequent generations of exercise physiologists, is thatthe heart is also a muscle, dependant for its function on an adequateblood and oxygen supply. But, unlike skeletal muscle, the heart isdependent for its blood supply on its own pumping capacity. Henceany intervention that reduces the pumping capacity of the heart, ordemands the heart somehow to sustain an increased work output bythe exercising muscles without any increase in cardiac output andcoronary flow (as theoretically occurs when the “plateau phenomenon”develops), must imperil the heart’s own blood supply. Any reductionin coronary blood flow will consequently reduce the heart’s pumpingcapacity, thereby inducing a vicious cycle of progressive andirreversible myocardial ischaemia. It would seem logical that humandesign should include controls to protect the heart from ever enteringthis vicious circle.
Hence if (skeletal) muscle function fails when its oxygen demand exceedssupply then, for logical consistency, the inability of the pumping capacityof the heart to increase the cardiac output at the supposed VO2
-max pla-teau, must also result from an inadequate (myocardial) oxygen supply causedby a plateau in coronary flow. This limiting coronary blood flow inducesmyocardial “fatigue”, causing the plateau in cardiac output and hence inthe VO2-max leading, finally, to skeletal muscle anaerobiosis. Thus, bythis logic, the coronary blood flow must be the first physiological functionto show a “plateau phenomenon” during progressive exercise to exhaustion.All subsequent physiological “plateaus” must result from this limitingcoronary flow.
Perhaps the reluctance of modern physiologists to embrace theseconcepts stems from the current appreciation that progressive myocardial

RUNNING & SCIENCE
32
ischaemia does not occur during maximal exercise in healthy athletes (60),even though there is good evidence that it is a limiting cardiac output thatprobably determines the VO2
-max (64). Thus one postulate might be thateven if cardiac output limits maximal exercise as seems likely, terminationof exercise must occur before the heart actually reaches that maximumand hence well before skeletal muscle anaerobiosis can develop. Hencefor 75 years, exercise physiologists may have focused on the incorrect or-gan as the site of any potential anaerobiosis that may develop during maxi-mal exercise (32).
In summary, there may be a fundamental physiological flaw in themodel which holds that anaerobic metabolism occurs in skeletal muscleduring maximal exercise when the oxygen demands of the musclesexceed the heart’s maximum capacity to match that demand. Not leastbecause the model predicts that a “plateau” in cardiac output mustdevelop before skeletal muscle anaerobiosis can begin to occur. Butany “plateau” in cardiac output requires that myocardial ischaemia bepresent either to cause that plateau, according to the theory that anaero-biosis limits muscle function, or as a result of it, as the cardiac outputdetermines both coronary and skeletal muscle blood flow. As myocar-dial ischaemia has never been shown to develop during maximalexercise in healthy humans, so would it seem unlikely that skeletalmuscle anaerobiosis can develop during progressive exercise toexhaustion. Indeed no study has yet conclusively shown convincingbiochemical or other evidence for skeletal muscle anaerobiosis duringmaximum exercise (27, 62). Rather skeletal muscle oxygenation doesnot appear to alter in the transition from rest to maximum exercise(33, 62), a finding that severely taxes any theory that skeletal muscleanaerobiosis develops during exercise or that the products of anaerobicmetabolism limit maximum exercise. Rather I have argued that theremay be a neural (brain) mechanism that terminates exercise before theonset of either skeletal muscle or myocardial anaerobiosis.
Whilst this mechanism is designed to protect the heart from myo-cardial ischaemia, only indirectly does it determine the actual peakwork rate achieved during maximal exercise (Figure 4). For the actualpeak work rate achieved will depend on the “quality” of the skeletaland cardiac muscle. Superior myocardial contractility and efficiencyof oxygen use would increase the maximum cardiac output achievedat any maximum (limiting) coronary flow. Similarly at any maximum skele-tal muscle blood flow, superior contractility and efficiency of skeletal muscle

33
PHYSIOLOGICAL CAPACITY OF THE ELITE RUNNER
contraction would increase the peak work rate or running velocity (Figure2) achieved at that maximum cardiac output.
Thus this analysis of what I have termed the traditional Cardiovascular/Anaerobic Model of Exercise Physiology and Athletic Performance (53)leads to the alternate hypothesis that superior fatigue resistance, determinedperhaps by the central nervous system, or by skeletal muscle contractilefunction, might explain superior performance in events lasting more thana few minutes. This superior fatigue resistance cannot be predicted by theCardiovascular/Anaerobic Model which uses exercise tests of short durationand in which the fatigue resistance component of endurance performanceis not measured. By extension, it would seem that fatigue resistance is notcausally determined by the magnitude of the athlete’s cardiovascular capacity,although maximum exercise capacity in events of 2-15 minutes is very likelyto be influenced predominantly by cardiovascular function and, especially,the peak coronary blood flow (Figure 4). There is also no logical reason tobelieve that fatigue resistance during submaximal exercise is determinedby either the presence or absence of skeletal muscle anaerobiosis (62).
Figure 4. Postulated physiological factors that may limit maximal exercise perfor-mance.
Note that this model predicts that a peak coronary blood flow may limit exerciseby activating a neural (brain) reflex which prevents any further increase in skeletalmuscle recruitment in the active muscles. The peak running velocity (Figure 2) atthat maximal coronary blood flow will, in turn, be determined by the efficiency andcontractility of both the heart and the active skeletal muscles.

RUNNING & SCIENCE
34
Accordingly differences in endurance capacity in events lasting morethan about 15 minutes are unlikely to be determined solely by differencesin cardiovascular function. With the exception that high rates of maximumcoronary blood flow would likely be crucial to sustain the very high maxi-mal cardiac outputs and hence high VO2
-max values achieved duringexercise lasting less than 10-15 minutes.
Thus, this analysis suggests that the very best athletes have very highexercise capacities not primarily because they are able to increase oxygensupply to their exercising muscles but because of a high capacity to increaseblood flow to their hearts. In addition, superior efficiency and contractilityof their hearts and skeletal muscles would ensure that very high runningspeeds are achieved at that limiting rate of blood flow to the heart.
For further consideration regarding this hypothesis please see Bassett &Howley (2a) and Bergh et al. (2b).
Models to evaluate differences in fatigueresistance between athletes
Since it has been assumed for the past 75 years that differences in run-ning ability must result solely from differences in their maximum abilityto transport and utilise oxygen, so the possibility that other factorsmay influence performance have been somewhat ignored. Currently,there are at least three other possible explanations for superior exercisecapacity and fatigue resistance during more prolonged exercise.
The energy depletion model to explain superiorperformance in marathon and ultramarathon running events
There is good evidence that fatigue during prolonged exercise developscoincidentally with the achievement of very low liver and muscle glyco-gen concentrations, the former causing a low blood glucose concen-tration (hypoglycaemia) (3, 16). Ingestion of carbohydrate duringexercise enhances performance, perhaps by delaying the onset of hypogly-caemia (53).

35
PHYSIOLOGICAL CAPACITY OF THE ELITE RUNNER
Thus one possibility is that superior fatigue resistance in events lastingmore than 90-120 minutes and in which either liver or muscle glycogendepletion might cause fatigue, could result from a greater capacity of someathletes either (i) to store more muscle and liver glycogen before exercise,or (ii) to produce glucose more readily in the liver during exercise, or (iii)to slow the rate of muscle or liver glycogen use during exercise. There islittle scientific evidence that any or all of these adaptations can specificallyexplain the superior performances of elite athletes and any conclusions inthis regard are currently speculative.
But during very prolonged competitive exercise lasting more than6 hours, depletion of body carbohydrate stores must occur regardlessof any metabolic adaptations that may have occurred in the athlete’scarbohydrate metabolism.
For example, it is currently difficult to explain performance in ultra-endurance events, especially the final 42 km running leg of 226 kmironman triathlon events according to a model which holds thatexercise of moderately-high intensity (> 65% VO2
-max) is not possible oncethere is marked muscle glycogen depletion. After cycling at 40 km•h-1 for4.5 h, the elite triathletes, the best of whom are also exceptional runners,would be expected to have near total muscle glycogen depletion accordingto data from laboratory studies (6, 8). The studies of Rauch et al. (61) andO’Brien et al. (56) suggest that total carbohydrate oxidation during veryprolonged exercise of up to 6 hrs duration exceeds the estimatedcarbohydrate stores in liver and active muscle by up to 100%. Yet the bestperformers in that event are still able to run at close to 16 km•h-1 for afurther 160 minutes. This probably represents an exercise intensity of >66% VO2-max. Either these calculations are incorrect, or other sources ofcarbohydrate, in addition to those in the active muscles and liver, mustcontribute to fuel oxidation in events lasting more than 4-6 hours.
However the equally plausible alternate theory postulates that superiorendurance capacity may be determined by the exact opposite; by a superiorcapacity to oxidise fat and hence maintain a lower respiratory quotient(RQ) during prolonged exercise. The latter possibility is supported by atleast some evidence. In the studies of Bosch et.al. (8), those athletes unableto complete 3 hours of exercise at 70% VO2
-max after carbohydrate-loadinghad significantly higher RQ during exercise and were thereforecharacterised by an inability to sustain high rates of fat oxidation duringprolonged exercise. Indeed simulated metabolic balance studies for the226 km Hawaiian Ironman triathlon suggest it to be very likely that the

RUNNING & SCIENCE
36
capacity to oxidise fat at high rates will influence running speed late inevents lasting more than 4-6 hours when muscle glycogen stores are likelyto be depleted (53).
For example, our calculations suggest that an athlete cycling at 40 km•h-
1 for 4.5 hours during the Ironman Triathlon would exercise at a VO2 of 57
ml•kg-1•min-1. To maintain this speed for 4.5 hrs of cycling, would requirean elite male Ironman triathlete to oxidise about 700 g of carbohydrateand 175 g of fat. This compares to predicted whole body carbohydrate andfat stores of 520 g and 5000 g respectively. Hence this model predicts that,at the end of the cycle leg, an elite athlete would have depleted his bodycarbohydrate stores, yet must still run 42.2 km at close to 16 km•h-1, if hewishes to be successful.
Our other laboratory data suggest that after 4.5 hrs of such exercise,the carbohydrate contribution to whole body energy metabolism wouldcomprise a blood glucose oxidation rate of 1.2 g•min-1 (21 kJ•min-1)and a lactate oxidation rate of 0.6 g•min-1 (10.5 kJ•min-1). Togetherwith the average maximum rate of fat oxidation that we have measuredafter 6 hours of laboratory cycling (0.76 g•min-1; 28 kJ•min-1), this pro-vides a total rate of energy production of 59.5 kJ•min-1. This wouldprovide energy at a rate sufficient to sustain a running speed ofapproximately 12 km•h-1, sufficient to complete the 42 km marathonleg of the Ironman Triathlon in 3 hr 30 mins. To equal the best marathontime yet run in that race, the athlete would be required to oxidize fat ata rate of 1.15 g•min-1. This rate is approximately 50% faster than wehave measured in cyclists in our laboratory.
Accordingly if this model of performance in very prolonged exercise iscorrect, then the difference between running the final 42 km marathon legof an ironman triathlon in 2 hr 40 min versus 3 hr 30 min may simply be a51% (0.4 g•min-1) greater capacity to oxidize fat when body carbohydrateand, especially, muscle glycogen stores are depleted. By extension, thesame adaptation could explain the superior running ability of ultramarathonracers.
The biomechanical model to explain superior runningability in middle to long distance running events
There is growing interest in the role of muscles as elastic energy returnsystems which function both as springs and torque producers during

37
PHYSIOLOGICAL CAPACITY OF THE ELITE RUNNER
exercise (57, 63). Central to this model is the prediction that the greaterthe muscle’s capacity to act as a spring, the less torque it must produce andhence the more efficient it is. The more efficient, more elastic muscle willenhance exercise performance, especially in weight-bearing activities likerunning, by slowing (i) the rate of accumulation of those metabolites thatmay cause fatigue during exercise and (ii) the rate of rise of body tempera-ture thereby slowing the rate at which the core body temperature risesduring exercise and (iii) by reducing the extent of muscle damage inducedby repetitive eccentric muscle contraction especially of the quadriceps andcalf muscles.
This new information underscores another important logicalweakness of the Cardiovascular/Anaerobic Model for explainingenhanced endurance performance. For that model predicts that superiorperformance during prolonged exercise results from an increasedoxygen delivery to muscle and an increased rate of energy and henceheat production. Thus according to that model, the price of runningfaster is that more heat must be produced. But a higher rate of heatproduction would induce fatigue prematurely due to excessive heataccumulation, according to the findings of Nielsen and her colleagues(26, 45, 46, 47). A more logical biological adaptation would be to reducethe rate of oxygen consumption and hence the rate of heat productionby increasing the athlete’s efficiency (economy) of movement. We havealready noted that the best distance runners are usually those who arethe most economical (Figure 2) so that this theory has some theoreticalsupport.
Indeed, if the rate of heat accumulation limits exercise performanceunder specific conditions, then factors that slow the rate at which heataccumulates when running fast should enhance performance. Two suchfactors are small size (19) and superior running economy. A smallersize reduces the amount of heat produced when running at any speed.When environmental conditions limit the capacity for heat loss, smal-ler runners will be favoured (19). Indeed it is of interest that the ave-rage height and mass of the winners of the Boston (USA) marathonhas not changed over the past 100 years despite an average increase inheight of 1 cm per decade in Americans during the same time (55).
Further evidence supporting this argument that heat accumulation is afactor limiting endurance performance, is the finding that race times inboth the marathon (49) and the longer distance track races including the3000 m steeplechase and the 10000 m (40) deteriorate as the environmental

RUNNING & SCIENCE
38
heat load increases. Thus there is an inverse relationship between theenvironmental heat load, measured as the Wet Bulb Globe TemperatureIndex, and the reduction in race performance. It is well established thatthe ability to exercise in the laboratory is dependent on the environmentalheat load (25). Furthermore, pre-cooling, so that athletes begin exercisewith lower body temperatures, enhances exercise performance (5).
Therefore, according to this model, the more economical the athlete,the faster he or she will be able to run before reaching a limiting bodytemperature. A number of studies indicate that the best enduranceathletes are also frequently the most economical (49). Indeed mosttraining studies show that improvements in running economy are per-haps the most likely response to training especially in those who arealready well-trained (71). This adaptation allows the athlete to run fasterat the same oxygen consumption; thus he or she completes a givendistance more rapidly for the same average rate of heat accumulationbut a reduced overall heat expenditure. This would be advantageousunder conditions in which the heat load on the athlete increases, forexample in marathon or longer races that continue into the mid- orlate morning heat.
In contrast, a high maximum aerobic capacity, often a marker of poorrunning economy (49), would likely cause more rapid rates of heataccumulation and hence the more rapid onset of fatigue during prolongedexercise. This finding alone could explain why the best marathon runnersusually have VO2-max values in the range of 69-74 ml•O2•kg-1•min-1.Less economical runners with higher VO2-max values (48) have notnecessarily been more successful (49). Figure 2 again offers the visualexplanation for this phenomenon.
Thus this model predicts that success in endurance events is not likelyto result from training that makes the athlete ever more powerful with alarger muscle mass and greater VO2-max. A more likely adaptation wouldbe to reduce the athlete’s size and increase his or her running efficiency.That runners believe they run better when lighter, is well known.
Another African analogy for this prediction is provided by thephysiological strategy that the cheetah has evolved to survive as a successfulpredator. The cheetah, whose chase is terminated by an elevated rectaltemperature after running at up to 100 km•h-1 for less than a minute (74),succeeds because of the animal’s small size and probably a high degree ofrunning economy (due to elasticity provided by the flexible spine). Thuslaboratory experiments showed that when the cheetah’s rectal tempera-

39
PHYSIOLOGICAL CAPACITY OF THE ELITE RUNNER
ture reached between 40.5 to 41oC, the cheetahs refused to run. Theywould simply turn over with their feet in the air and slide on the tread(mill)surface (74). This is analogous to humans who terminate exercise when acertain rectal temperature is achieved (26, 47).
The small size of the cheetah and its likely high running economy slowsits rate of heat accumulation just sufficiently for it to outrun the smallergazelles (∼ 25 kg) on which it preys and whose escape is also restrained bya rising body temperature (73). Thus the chase between the gazelle andthe cheetah is probably decided by which individual animal accumulatesheat more slowly during the chase. In contrast, the heavier, more muscularlion has evolved a different, co-operative, hunting strategy, targeting largerbut slower mammals.
Perhaps the point is that smallness and greater running economywould seem to be a technique used to increase endurance capacity inone animal, the cheetah. Logic suggests that this technique may alsobe applicable to elite human athletes.
A second component of the biomechanical models stems from theaccumulating evidence that repeated high velocity, short durationeccentric muscle contractions, as occur during running, induce aspecific form of fatigue that develops during running races and ismeasurable for at least 7 days after a marathon race (35, 44).
Characteristics of this fatigue are a failure of the contractile capacityof the exercised muscles with a reduced tolerance to muscle stretchand a delayed transfer from muscle stretch to muscle shortening in thestretch/shortening cycle. As a result, the durations of both the brakingand push-off phases in the running stride are increased, leading tomechanical changes in the stride with landing occurring on a moreextended leg but with greater subsequent knee flexion at the onset ofweight bearing.
As these abnormalities persists for many days after the race, theycannot be explained by acute changes in oxygen or substrate deliveryto the muscles, or by the elevated body temperature during exercise, asrequired by the other models of fatigue presented here. Rather Komi andNicol (35) conclude that: “Stretch shortening fatigue results usually in areversible muscle damage process and has considerable influence on musclemechanics, joint and muscle stiffness as well as on reflex intervention.”Thus any evaluation of fatigue resistance, especially in weight-bearingactivities like running, needs to consider this specific form of stretch/shortening cycle fatigue.

RUNNING & SCIENCE
40
To return to the African analogy, empirical observation of the runningstride and the anatomical structure of the lower limb of Kenyan runnerssuggests, at least to this author, that an evaluation of the elastic elementsof the legs of elite Kenyan runners and their resistance to stretch/shorte-ning cycle fatigue would likely be very rewarding.
For example, it appears that African athletes generally train harder thando Caucasian runners (9, 72). Especially the training volumes and intensitiesof the Kenyan runners (72) are unmatched by other athletes. But to achievesuch training volumes, there must be superior resistance to the stretch/shortening cycle damage proposed by Komi and Nicol (35), both in trainingand in marathon racing.
Hence another possibility is that the more elastic muscles of elitedistance runners are better able to resist eccentrically-induced dam-age in training. This may allow more intensive daily training and hencesuperior adaptations to training. That same superiority would alsoenhance performance during competitive racing by delaying the onsetof this stretch/shortening cycle fatigue that is an inevitable consequenceof repeated eccentric muscle contractions.
In summary, the biomechanical model predicts that superiorperformance especially in a weight-bearing activity like running, maybe influenced by the capacity of the muscles to act as elastic energy-return systems. Changes in the efficiency and durability of this processwould (i) enhance movement economy and reduce the rate of heatproduction during exercise, thereby enhancing exercise capacity byslowing the rate at which the body temperature rises when environ-mental conditions are severe; (ii) enhance the quality of training byallowing more rapid recovery from stretch/shortening cycle fatigueso that more frequent bouts of intensive training can be undertakenand (iii) enhance fatigue resistance during competition by increasingresistance to that form of muscle damage that develops during repeatedcycles of stretch/shortening contractions.
The psychological/motivational model to explain superiorrunning ability
This model holds that the ability to sustain exercise performance resultsfrom a conscious effort so that central (brain) fatigue (18) may contribute tothe fatigue experienced during prolonged exercise. This interpretation

41
PHYSIOLOGICAL CAPACITY OF THE ELITE RUNNER
conflicts with the other models which hold that exercise performance isregulated at a subconscious level and that such controls exist, in part, toprevent conscious override that might damage the human.
It would seem that exercise performance must include at least somecomponent that can be influenced by conscious effort. The dichotomy ofphysiology and psychology has generally prevented adequate laboratoryevaluation of this model. Any studies showing an ergogenic effect of anyplacebo intervention on exercise performance would prove that this mo-del contributes, in part, to athletic performance. This is an area requiringa heightened research effort. For example, some suggest that the moredemanding lifestyle of the Kenyan youth, including initiation rites andcircumcision without anaesthesia, induce a different approach to pain thanis perhaps present in populations without such rituals.
ConclusionThis chapter has reviewed some of the models currently promoted topredict the physiological variables that determine superior athleticability. It has extended that analysis beyond a simple analysis of oxy-gen transport capacity. The insights offered by that broader viewsuggests that the following are likely to contribute to the superiorexercise capacity of elite runners.
Cardiovascular system
Relevant physiological adaptations would be those that result in anincreased VO2
-max and skeletal muscle blood flow during both maximalexercise and increased muscle blood flow during prolonged submaximalexercise.
According to the model I have presented here, a plateau in coronaryflow would appear to be the factor that would ultimately limit the cardiacoutput and hence the VO2-max. Thus an essential physiological attributeof the elite runner would be a very large maximal coronary flow. As thepeak coronary blood flow is likely related to the mass of the heart, thiswould also explain why the hearts of the elite athletes are likely to be largeand, because of the greater peak coronary blood flow rates, also capable ofvery high cardiac outputs.

RUNNING & SCIENCE
42
However, even if elite athletes have a greater coronary flow, the actualpeak work rate or peak VO2
-max that each achieves will depend on thecontractile state of the myocardium and the efficiency with which the heartis able to convert that maximum coronary flow into a peak cardiac output.Similarly the actual maximum work rate or running velocity achieved atthe VO2
-max, will equally depend on the economy and contractility of theskeletal muscles (Figure 4).
Thus the very best athletes would not only have very high rates ofcoronary flow but also superior efficiency and contractility of both theheart and skeletal muscles. Indeed there is a need better to understandthe contractile characteristics of the skeletal muscles of superior athletes(22). Too often it has been assumed that skeletal muscle contractility isthe same in all humans including athletes, an unlikely assumption (21,22).
Energy depletion model
A reduced rate of carbohydrate utilization during prolonged exercisewould enhance performance by delaying the onset of whole bodycarbohydrate depletion. This model predicts why an increased capacityto burn fat during prolonged exercise would enhance enduranceperformance during very prolonged exercise when depletion of bodycarbohydrate stores must develop (53).
The biomechanical model
A key predictor of the biomechanical model is that increased movementeconomy would improve performance by reducing the rate of heataccumulation during exercise. This model also explains that a reducedbody mass would improve performance during prolonged exercise as itslows the rate of heat accumulation during more vigorous exercise especiallywhen the environmental conditions are severe (19).
The importance of elastic return energy, especially in weight-bearingsports, and the identification of stretch/shortening cycle fatigue suggeststhat training may improve elasticity and delay stretch/shortening cyclefatigue, perhaps by altering the elastic component of skeletal muscle,tendons and ligaments.

43
PHYSIOLOGICAL CAPACITY OF THE ELITE RUNNER
References
1. Bale J, Sang J. Kenyan running. Frank Cass, London, U.K., pp. 1-209, 1996.2. Bassett DR, Howley ET. Maximal oxygen uptake: “classical” versus
“contemporary” viewpoints. Med Sci Sports Exerc 29: 591-603, 1997.2a. Bassett DR, Howley ET. Limiting factors for maximum oxygen uptake: and
determinants of endurance performance. Med Sci Sports Exerc 32: 70-84, 2000.2b. Bergh UB, Ekblom B, Åstrand P.-O. Maximal oxygen uptake: “classical”
versus “contemporary” viewpoints. Med Sci Sports Exerc 32: 85-88, 2000.3. Bergstrom JB, Hermansen L, Hultman E, Saltin B. Diet, muscle glycogen
and physical performance. Acta Physiol Scand 71: 140-150, 1967.4. Berthon, P., Fellmann, N., Bedu, M., Beaune, B., Dabonneville, M., Coudert,
J., Chamoux, A. A 5-min running field test as a measurement of maximalaerobic velocity. Eur. J Appl Physiol 75: 233-238, 1997.
5. Booth J, Marino F, Ward JJ. Improved running performance in hot humidconditions following whole body precooling. Med Sci Sports Exerc 29: 943-949, 1997.
6. Bosch AN, Dennis SC, Noakes TD. Influence of carbohydrate loading onfuel substrate turnover and oxidation during prolonged exercise. J Appl Physiol74: 1921-1927, 1993.
7. Bosch AN, Goslin BR, Noakes TD, Dennis SC. Physiological differencesbetween black and white runners during a treadmill marathon. Europ J ApplPhysiol 61: 68-72, 1990.
8. Bosch AN, Weltan SM, Dennis SC, Noakes TD.: Fuel substrate kinetics ofcarbohydrate loading differs from that of carbohydrate ingestion duringprolonged exercise. Metabolism 45: 415-423, 1996.
9. Coetzer P, Noakes TD, Sanders B, Lambert MI, Bosch AN, Wiggins T,Dennis SC. Superior fatigue resistance of elite black South African distancerunners. J Appl Physiol 75: 1822-1827. 1993.
10. Conley DL, Krahenbuhl GS. Running economy and distance runningperformance of highly trained athletes. Med Sci Sports Exerc 12: 357-360.1980.
11. Costill DL, Winrow E. Maximal oxygen intake among marathon runners.Arch Phys Med Rehab 51: 317-320. 1970a.
12. Costill DL, Winrow E. A comparison of two middle-aged ultramarathon runners.Res Quart 41: 135-139. 1970b.
13. Costill DL, Thomason H, Roberts E. Fractional utilization of the aerobic capacityduring distance running. Med Sci Sports Exerc 5: 248-252. 1973.
14. Costill DL. The relationship between selected physiological variables anddistance running performance. J Sports Med Physical Fitness 7: 61-66. 1967.
15. Costill DL. A scientific approach to distance running. Track and Field News,Los Altos, California, 1979.
16. Coyle EF, Coggan AR, Hemmert MK, Ivy JL. Muscle glycogen utilizationduring prolonged strenuous exercise when fed carbohydrate. J Appl Physiol61: 165-172. 1986.

RUNNING & SCIENCE
44
17. Davies CTM, Thompson MW. Aerobic performance of female marathon andmale ultramarathon athletes. Europ J Appl Physiol 61: 611-617. 1979.
18. Davis JM, Bailey SP. Possible mechanisms of central nervous system fatigueduring exercise. Med Sci Sports Exerc 29(1): 45-57. 1997.
19. Dennis SC, Noakes TD. Advantages of smaller body mass for distance runningperformances in warm, humid conditions. Eur J Appl Physiol 79: 280-284.1999.
20. Dill DB, Talbot JH, Edwards HT. Studies in muscular activity. VI: Responseof several individuals to a fixed task. J Physiol 69: 267-305. 1930.
21. Fitts RH, Costill DL, Gardetto PR. Effect of swim exercise training onhuman muscle fiber function. J Appl Physiol 66: 465-475. 1989.
22. Fitts RH, Widrick JJ. Muscle mechanics: adaptations with exercise-training.Exerc Sports Sci Rev 24: 427-473. 1996.
23. Foster C. O2-max and training indices as determinants of competitiverunning performance. J Sports Sci 1: 13-22. 1983.
24. Foster C, Costill DL, Daniels JT, Fink WJ. Skeletal muscle enzyme activity,fiber composition and O2-max in relation to distance running performance.Europ J Appl Physiol 39: 73-80. 1978.
25. Galloway SD, Maughan RJ. Effects of ambient temperature on the capacityto perform prolonged cycle exercise in man. Med Sci Sports Exerc 29: 1240-1249. 1997.
26. González-Alonso J, Teller C, Andersen SL, Jensen FB, Hyldig T, Nielsen B.Influence of body temperature on the development of fatigue duringprolonged exercise in the heat. J Appl Physiol 86: 1032-1039. 1999.
27. Graham TE, Saltin B. Estimation of the mitochondrial redox state in humanskeletal muscle during exercise. J Appl Physiol 66: 561-566. 1989.
28. Grant S, Craig I, Wilson J, Aitchison T. The relationship between 3 kmrunning performance and selected physiological variables. J Sports Sci 15:403-410, 1997.
29. Hill AV. Living machinery. G Dell and Sons Ltd, London, pp. 1-241, 1927.30. Hill AV, Long CNH, Lupton H. Muscular exercise, lactic acid, and the
supply and utilization of oxygen: parts I-III. Proc Royal Soc Bri 96: 438-475,1924a.
31. Hill AV, Long CNH, Lupton H. Muscular exercise, lactic acid, and the supply andutilization of oxygen: parts IV-VI. Proc Royal Soc Br 97: 84-138, 1924b.
32. Hill, AV, Long CNH, Lupton H. Muscular exercise, lactic acid, and the supplyand utilization of oxygen: parts VII-VIII. Proc Roy Soc B 97: 155-176, 1924c.
33. Hochochka, PW. The metabolic implications of intracellular circulation. ProcNatl Acad Sci 96: 12233-12239, 1999.
34. Jones AM, Doust JH. The validity of the lactate minimum test for determi-nation of the maximal lactate steady state. Med Sci Sports Exerc 30: 1304-1313, 1998.
35. Komi PV, Nicol C. Stretch-shortening cycle fatigue. Biomechanics and Biologyof Movement. 1998.
36. Krahenbuhl GS, Pangrazi RP. Characteristics associated with runningperformance in young boys. Med Sci Sports Exerc 5: 486-490, 1983.

45
PHYSIOLOGICAL CAPACITY OF THE ELITE RUNNER
37. Lacour JR, Padilla S, Barthelemy JC, Dormois D. The energetics of middle-di-stance running. Eur J Appl Physiol 60: 38-43, 1990.
38. Lacour JR, Padilla S, Chatard JCm Arsac L, Barthelemy JC. Assessment ofrunning velocity at maximal oxygen uptake. Eur J Appl Physiol 62: 77-82,1991.
39. Matsui H, Miyashita M, Kiura M, Kabayshi K, Hoshikawa T, Kamei S.Maximum oxygen intake and its relationship to body weight of Japaneseadolescents. Med Sci Sports 3: 170-175, 1972.
40. McCann DJ, Adams WC. Wet bulb globe temperature index and performancein competitive distance runners. Med Sci Sports Exerc 29: 955-961, 1997.
41. Mitchell JH, Blomqvist G. Maximal oxygen uptake. New Engl J Med 284:1018-1022, 1971.
42. Miyashita M, Miura M, Murase Y, Yamaji K. Running performance fromthe viewpoint of aerobic power. In: Folinsbee LJ, Wagner JA, Borgia JF,Drinkwater BL, Gliner JA, Bedi JF (eds). Environmental stress: Individualhuman adaptations, Academic Press, New York 183-194, 1978.
43. Morgan DW, Baldini FD, Martin PE, Kohrt WM. Ten kilometer performanceand predicted velocity at
V.
O2-max among well-trained male runners. MedSci Sports Exerc 21: 78-83, 1989.
44. Nicol C, Komi PV, Marconnet P. Fatigue effects of marathon running onneuromuscular performance. I. Changes in muscle force and stiffnesscharacteristics. Scand J Med Sci Sports 1: 10-17, 1991.
45. Nielsen B, Hales JRS, Strange S, Christensen NJ, Warberg J, Saltin BN.Human circulatory and thermoregulatory adaptations with heat acclima-tization and exercise in a hot, dry environment. J Physiol 460: 467-485, 1993.
46. Nielsen B, Savard G, Richter EA, Hargreaves M, Saltin B. Muscle bloodflow and muscle metabolism during exercise and heat stress. J Appl Physiol69: 1040-1046, 1990.
47. Nielsen B, Strange S, Christensen NJ, Warberg J, Saltin B. Acute and adap-tive responses in humans to exercise in a warm, humid environment. PflügersArch 434: 49-56, 1997.
48. Noakes TD. Implications of exercise testing for prediction of athletic performance:a contemporary perspective. Med Sci Sports Exerc 20: 319-330, 1988.
49. Noakes TD. Lore of Running. Oxford University Press, Cape Town, 3rd Edition,pp. 1-535, 1992.
50. Noakes TD. Challenging beliefs: ex Africa semper aliquid novi. Med SciSports Exerc 29: 571-590, 1997.
51. Noakes TD. Maximal oxygen uptake: “classical” versus “contemporary” viewpoints.A rebuttal. Med Sci Sports Exerc 30(9): 1381-1398, 1998a.
52. Noakes TD. Why do Africans run so swiftly? A research challenge for Africanscientists. S Afr J Sci 94: 531-535, 1998b.
53. Noakes TD. Physiological models to understand exercise fatigue and theadaptations that predict or enhance athletic performance. Scand J Exerc SciSports Med 10: 123-145, 2000.
54. Noakes TD, Myburgh KH, Schall R. Peak treadmill running velocity duringthe
V.
O2-max test predicts running performance. J Sports Sci 8: 35-45, 1990.
RUNNING & SCIENCE
46
55. Norton K, Olds T, Olive S, Craig N. Anthropometry and Sports Performance. In:K. Norton and T. Olds. Anthropometrica, University of New South Wales Press,pp. 289-364, 1996.
56. O’Brien MJ, Viguie CA, Mazzeo RS, Brooks GA. Carbohydrate dependenceduring marathon running. Med Sci Sports Exerc 25: 1009-1017, 1993.
57. Padilla S, Bourdin M, Barthélémy JC, Lacour JR. Physiological correlatesof middle-distance running performance. Eur J Appl Physiol 65: 561-566,1992.
58. Pennisi E. A new view of how leg muscles operate on the run. Science 275:1067, 1997.
59. Pollock ML. Submaximal and maximal working capacity of elite distancerunners, Part I: Cardiorespiratory aspects. Ann NY Acad Sci 301: 310-321,1977.
60. Raskoff WJ, Goldman S, Cohn K. The “Athletic Heart”. Prevalence andphysiological significance of left ventricular enlargement in distance runners.JAMA 236: 158-162, 1976.
61. Rauch LHG, Hawley JA, Noakes TD, Dennis SC. Fuel metabolism duringultra-endurance exercise. Pflügers Arch 436: 211-219, 1998.
62. Richardson RS, Noyszewski EA, Leigh JS, Wagner PD. Lactate efflux fromexercising human skeletal muscle: role of intracellular P. J Appl Physiol 85:627-634, 1998.
63. Roberts JR, Marsh RL, Weyand PG, Taylor CR. Muscular force in runningturkeys: The economy of minimizing work. Science 275: 1113-1115, 1997.
64. Rowell LB. Human cardiovascular control. Oxford University Press, New York,pp. 1-500, 1993.
65. Saltin B, Astrand P-O. Maximal oxygen uptake in athletes. J. Appl. Physiol.23: 353-358, 1967.
66. Saltin B, Kim CK, Terrados N, Larsen H, Svedenhag J, Rolf C. Morphology,enzyme activities and buffer capacity in leg muscles of Kenyan andScandinavian runners. Scand J Med Sci Sports 5: 222-230, 1995a.
67. Saltin B, Larsen H, Terrados N, Bangsbo J, Bak T, Kim CK, Svedenhag J, Rolf CJ.Aerobic exercise capacity at sea level and at altitude in Kenyan boys, junior andsenior runners compared with Scandinavian runners. Scand J Med Sci Sports 5:209-221, 1995b.
68. Saltin B. Adaptive responses to training at medium altitude; with a note onKenyan runners and a proposal for a multi-centre study. Revised and extendedversion of Saltin B. Exercise and the Environment: focus on altitude. Res QuartExerc Sport 67: 1-10, 1996.
69. Scott BK, Houmard JA. Peak running velocity is highly related to distance runningperformance. Int J Sports Med 15: 504-507, 1994.
70. Scrimgeour AG, Noakes TD, Adams B, Myburgh K. The influence of weeklytraining distance on fractional utilization of maximum aerobic capacity inmarathon and ultramarathon runners. Eur J Appl Physiol 55: 202-209, 1986.
71. Svedenhag J, Sjodin B. Physiological characteristics of elite male runners inand of season. Can J Appl Sport Sci 10: 127-133, 1985.
72. Tanser T. Train hard, Win Easy. Tafnews Press Inc., USA, pp. 1-198, 1997.

47
PHYSIOLOGICAL CAPACITY OF THE ELITE RUNNER
73. Taylor CR, Lyman CP. Heat storage in running antelopes: independence of brainand body temperatures. Am J Physiol 22: 114-117, 1972.
74. Taylor CR, Rowntree VJ. Temperature regulation and heat balance in runningcheetahs: a strategy for sprinters? Amer J Physiol 224: 848-851, 1973.
75. Taylor HL, Buskirk E, Henschel A. Maximal oxygen intake as an objectivemeasure of cardio-respiratory performance. J Appl Physiol 8: 73-80, 1955.
76. Weston A.R., Karamizrak, O., Smith, A., Noakes, T.D., Myburgh K.H. Africanrunners exhibit greater fatigue resistance, lower lactate accumulation, andhigher oxidative enzyme activity. J. Appl. Physiol. 86: 915-923, 1999.
77. Wyndham CH, Strydom NB, van Rensburg AJ, Benade AJS. Physiologicalrequirements for world-class performances in endurance running. S Afr MedJ 43: 996-1002, 1969.
78. Yoshida T, Udo M, Iwai K, Yamaguchi T. Physiological characteristics relatedto endurance running performance in female distance runners. J. Sports Sci11L 57-62, 1993.

48
RUNNING & SCIENCE

49
MUSCLE FIBRE TYPE CHARACTERISTICS OF THE RUNNER
Muscle Fibre Type Characteristicsof the Runner
Jesper L. Andersen
Synopsis
This chapter reviews the fibre type composition in skeletal musclesof elite endurance-, middle distance-, and sprint-runners. Thepossible significance of the fibre type composition for optimal per-formance in endurance- and sprint-running is evaluated.Furthermore, based on a number of new exercise-training studies,a hypothetical proposal of how the fibre type (myosin heavy chainisoform) composition may change during a yearly training circlein the skeletal muscles of an elite sprinter is provided.
IntroductionRunners are as different as humans are in general, ranging from theskinny marathon-runner to the brawny sprinter. Consequently, adescription of the muscle fibre type characteristics of a runner is notan unambiguous deed, but rather a summation of different musclecompositions reflecting the distinct specialisation seen in today's toprunners.
The term „runner“ is most often associated with more endurance-like performance. Likewise, data on middle- and long-distance runnersare much more numerous than data on sprint-runners. In the followingI will review differences in muscle fibre type composition betweendifferent categories of runners and, in addition, focus on the musclefibre composition of sprinters and the ability of specific training para-

50
RUNNING & SCIENCE
Table 1. Summary of published values of fibre type distribution in m.vastus lateralis and gastrocnemius of middle- and long-distance runners
digms to alter the muscle fibre composition towards a compositionthat favours short-distance sprint-running.
Based on traditional ATPase histochemistry human skeletal musclefibres can be divided into the slow type 1, and the fast type 2a and 2bfibres (9). The literature reveals that the human skeletal muscle mostcommonly examined – the vastus lateralis – in long-distance runners

51
MUSCLE FIBRE TYPE CHARACTERISTICS OF THE RUNNER
contains approximately 75% type 1, 25% type 2a, and no or only a fewpercent type 2b fibres (Table 1). In comparison, middle-distance runnersdemonstrate somewhat less type 1, and more type 2a and to someextent also type 2b fibres (11, 18, 35, 37) (Table 1). The average fibretype composition of successful sprinters seems to be opposite of that ofthe long-distance runners, i.e. 30% type 1, 50% type 2a and 20% type2b fibres (Table 2). It should be emphasised that large variations canbe observed between individuals in the three categories.
Recent findings indicate that the separation into three different fibretypes on the basis of ATPase histochemistry may be too simplistic,and also to some extent misleading, at least when certain groups ofathletes are concerned (4, 5, 20). Myosin, the contractile protein of thethick filament, has been shown to be the key determinant regulatingthe shortening properties of the skeletal muscle fibres (20, 38). Further-more, besides being directly linked to the shortening properties of theskeletal muscle fibre, the presence of a specific myosin isoform is alsoa valuable marker for other fibre type-specific features such as meta-bolic profile and fatigue characteristics (31, 32). Under steady-stateconditions certain metabolic properties including the relative amountof myoglobin and number of mitochondria as well as activity of a num-

52
RUNNING & SCIENCE
ber of glycolytic (e.g. lactate dehydrogenase) and oxidative (e.g. malatedehydrogenase) enzymes can be assigned to the different MHC-basedfibre type populations (32) (Table 3). Although, during shifts in trainingpattern or intensity this close coupling might be altered (32). Forexample, enzyme activities of aerobic-oxidative metabolic pathwaysmay increase in exercising muscle without noticeable MHC-based fi-bre type transitions (31). The adult human skeletal muscles expressesthree different isoforms of the MMMMMyosin HHHHHeavy CCCCChain protein; MHC I,MHC IIA and MHC IIX (38). Ideally, type 1 fibres contain MHC I,type 2a fibres MHC IIA and type 2b fibres MHC IIX (Table 3), but
Table 2. Summary of some published values of fibre type distributionin m. vastus lateralis of sprint-runners

53
MUSCLE FIBRE TYPE CHARACTERISTICS OF THE RUNNER
thorough examination of the MHC content of single human skeletalmuscle fibres has revealed that a considerable number of fibres in factcontain two different MHC isoforms (3, 4, 5, 27, 28). This phenomenon;the MHC isoform co-expression, may be especially pronounced inmuscles from certain athletes, or in athletes markedly increasing ordecreasing their amount/type of training (3, 5). Thus, a group of elitesprint-runners had 15% type 2b fibres as determined by ATPasehistochemistry, whereas the single fibres analysis of the same biopsiesrevealed that only 0.1% of the fibres contained solely MHC IIX.Consequently, in the vastus laterlis muscle of these sprint-runners only1 out of each 150 histochemically determined type 2b fibres containedsolely MHC IIX, the remaining 149 „type 2b“ fibres co-expressedvarying amounts of MHC IIX and MHC IIA (3, 5).
Although training for long-distance running utilises both long andshort training-cycles, it requires a training-schedule with a constantlyhigh amount of fairly uniform endurance-like running. Training forsprint-distances does, on a yearly basis, include much greater varia-tion in the amount and types of training. Therefore, when a long-distance runner after years of conducting endurance-like running, hasreached a certain high level of training intensity and cannot tolerate afurther addition in the amount of training conducted, it is likely that heor she will not show great variations in muscle MHC isoform expres-
Table 3. Functional and metabolic characteristics of human skeletalmuscle fibre types

54
RUNNING & SCIENCE
sion on a yearly basis. Recent results seem to indicate that this is notthe case for elite sprint-runners (5).
All kinds of physical activity seem to reduce the expression of thefastest MHC isoform (2, 5, 15), whereas detraining has the oppositeeffect (3, 41), suggesting that the MHC IIX constitutes the „default“MHC gene (3, 6, 15, 20). When planning a sprinter’s training-schedulethis notion would favour a period of reduced training leading up to amajor competition event. In fact, a typical sprinter has a long prepara-tion period including large amounts of heavy resistance-training definedas relatively few near-maximal muscle contractions against a heavyexternal load and short interval-running, whereas in the competitionperiod only limited amounts of short fast-running, explosive and dy-namic training exercises, and technical drills will be engaged. We haveevidence that a period of increased heavy-resistance training (asconducted by sprinters) will decrease the expression of MHC IIX, butmore interestingly, if this is followed by a period of detraining, theexpression of MHC IIX will be boosted to levels even higher thanthose observed prior to heavy-resistance training (3). Furthermore,we have examined muscle biopsies from a group of elite sprintersbefore and after a 3 month period of combined heavy-resistance trainingand short interval-running. Results from this study have lead to thesuggestion of the so-called bi-directional switch in MHC expression(MHC I → MHC IIA ← MHC IIX) (Figure 1). These data suggestthe possibility of the complex activity pattern conducted in sprint-training resulting in, not only a significant shift in expression betweenMHC IIA and MHC IIX but also a shift in expression between MHCI and MHC IIA.
If, on the other hand, it is hypothesised that all types of physicalactivity reduce expression of the MHC IIX isoform and that all muscleactivity pushes the MHC expression, not only in the direction: MHCIIX → MHC IIA, but also in the direction: MHC IIA → MHC I (40),it becomes very difficult to conduct physical exercise training that leadstowards a decrease in the proportion of type 1 fibres. Therefore, anotherstrategy for the sprint athlete to obtain a relatively high amount of fastMHC in his or her muscles, could be to increase the cross-sectionalarea of the already existing type 2 fibres, without affecting the type 1fibres (at least to the same extend), leading to a faster contracting muscle(1). This is actually what happens with heavy-resistance training, type2 fibres hypertrophy more than type 1 fibres (3, 19, 21, 23, 35, 42, 44).
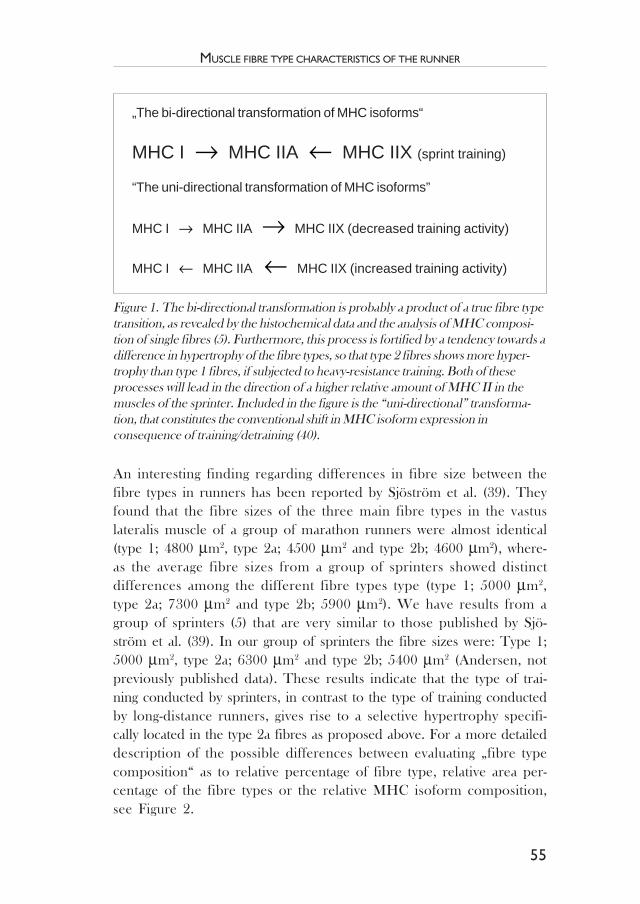
55
MUSCLE FIBRE TYPE CHARACTERISTICS OF THE RUNNER
An interesting finding regarding differences in fibre size between thefibre types in runners has been reported by Sjöström et al. (39). Theyfound that the fibre sizes of the three main fibre types in the vastuslateralis muscle of a group of marathon runners were almost identical(type 1; 4800 µm2, type 2a; 4500 µm2 and type 2b; 4600 µm2), where-as the average fibre sizes from a group of sprinters showed distinctdifferences among the different fibre types type (type 1; 5000 µm2,type 2a; 7300 µm2 and type 2b; 5900 µm2). We have results from agroup of sprinters (5) that are very similar to those published by Sjö-ström et al. (39). In our group of sprinters the fibre sizes were: Type 1;5000 µm2, type 2a; 6300 µm2 and type 2b; 5400 µm2 (Andersen, notpreviously published data). These results indicate that the type of trai-ning conducted by sprinters, in contrast to the type of training conductedby long-distance runners, gives rise to a selective hypertrophy specifi-cally located in the type 2a fibres as proposed above. For a more detaileddescription of the possible differences between evaluating „fibre typecomposition“ as to relative percentage of fibre type, relative area per-centage of the fibre types or the relative MHC isoform composition,see Figure 2.
„The bi-directional transformation of MHC isoforms“
MHC I → MHC IIA ← MHC IIX (sprint training)
“The uni-directional transformation of MHC isoforms”
MHC I → MHC IIA → MHC IIX (decreased training activity)
MHC I ← MHC IIA ← MHC IIX (increased training activity)
Figure 1. The bi-directional transformation is probably a product of a true fibre typetransition, as revealed by the histochemical data and the analysis of MHC composi-tion of single fibres (5). Furthermore, this process is fortified by a tendency towards adifference in hypertrophy of the fibre types, so that type 2 fibres shows more hyper-trophy than type 1 fibres, if subjected to heavy-resistance training. Both of theseprocesses will lead in the direction of a higher relative amount of MHC II in themuscles of the sprinter. Included in the figure is the “uni-directional” transforma-tion, that constitutes the conventional shift in MHC isoform expression inconsequence of training/detraining (40).
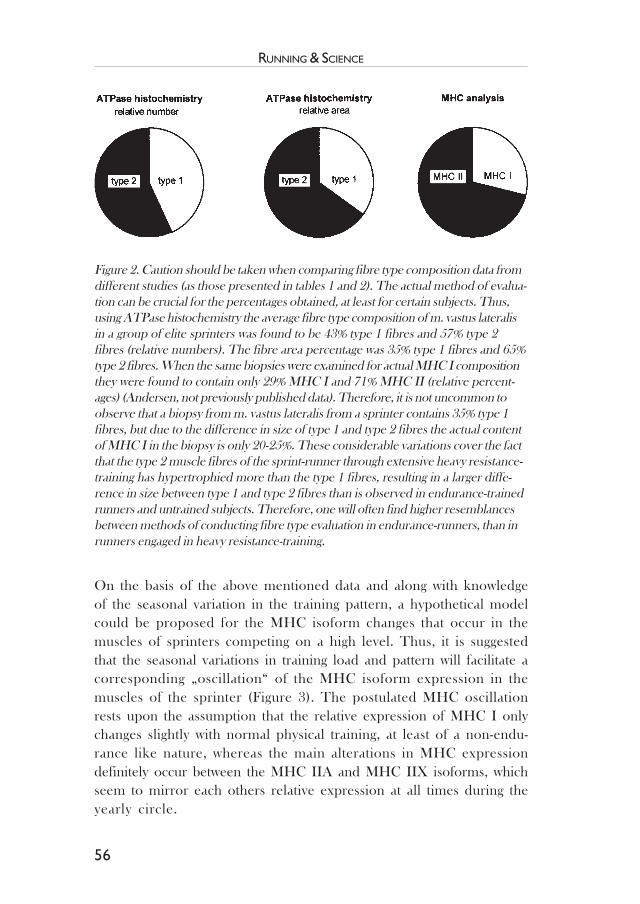
56
RUNNING & SCIENCE
On the basis of the above mentioned data and along with knowledgeof the seasonal variation in the training pattern, a hypothetical modelcould be proposed for the MHC isoform changes that occur in themuscles of sprinters competing on a high level. Thus, it is suggestedthat the seasonal variations in training load and pattern will facilitate acorresponding „oscillation“ of the MHC isoform expression in themuscles of the sprinter (Figure 3). The postulated MHC oscillationrests upon the assumption that the relative expression of MHC I onlychanges slightly with normal physical training, at least of a non-endu-rance like nature, whereas the main alterations in MHC expressiondefinitely occur between the MHC IIA and MHC IIX isoforms, whichseem to mirror each others relative expression at all times during theyearly circle.
Figure 2. Caution should be taken when comparing fibre type composition data fromdifferent studies (as those presented in tables 1 and 2). The actual method of evalua-tion can be crucial for the percentages obtained, at least for certain subjects. Thus,using ATPase histochemistry the average fibre type composition of m. vastus lateralisin a group of elite sprinters was found to be 43% type 1 fibres and 57% type 2fibres (relative numbers). The fibre area percentage was 35% type 1 fibres and 65%type 2 fibres. When the same biopsies were examined for actual MHC I compositionthey were found to contain only 29% MHC I and 71% MHC II (relative percent-ages) (Andersen, not previously published data). Therefore, it is not uncommon toobserve that a biopsy from m. vastus lateralis from a sprinter contains 35% type 1fibres, but due to the difference in size of type 1 and type 2 fibres the actual contentof MHC I in the biopsy is only 20-25%. These considerable variations cover the factthat the type 2 muscle fibres of the sprint-runner through extensive heavy resistance-training has hypertrophied more than the type 1 fibres, resulting in a larger diffe-rence in size between type 1 and type 2 fibres than is observed in endurance-trainedrunners and untrained subjects. Therefore, one will often find higher resemblancesbetween methods of conducting fibre type evaluation in endurance-runners, than inrunners engaged in heavy resistance-training.
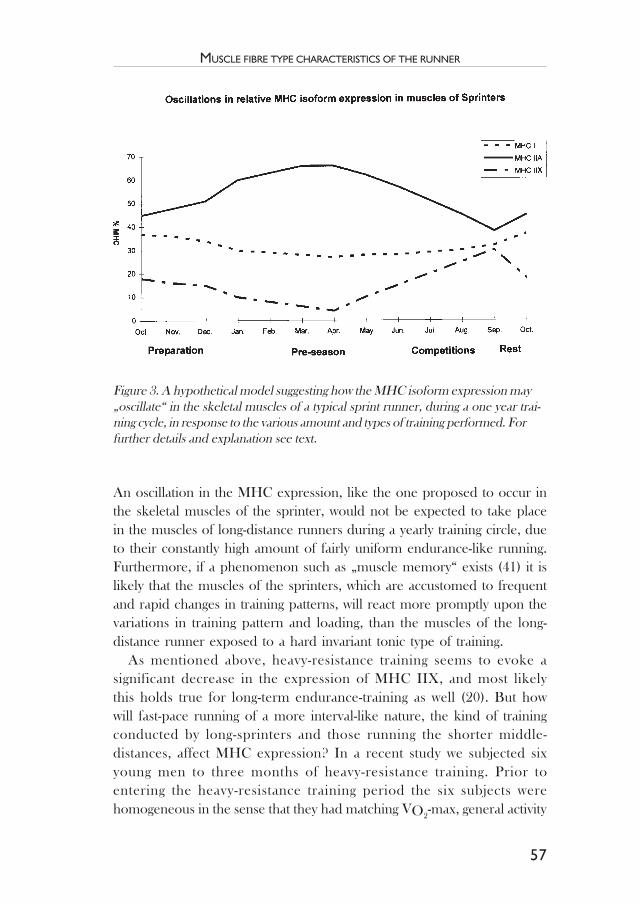
57
MUSCLE FIBRE TYPE CHARACTERISTICS OF THE RUNNER
An oscillation in the MHC expression, like the one proposed to occur inthe skeletal muscles of the sprinter, would not be expected to take placein the muscles of long-distance runners during a yearly training circle, dueto their constantly high amount of fairly uniform endurance-like running.Furthermore, if a phenomenon such as „muscle memory“ exists (41) it islikely that the muscles of the sprinters, which are accustomed to frequentand rapid changes in training patterns, will react more promptly upon thevariations in training pattern and loading, than the muscles of the long-distance runner exposed to a hard invariant tonic type of training.
As mentioned above, heavy-resistance training seems to evoke asignificant decrease in the expression of MHC IIX, and most likelythis holds true for long-term endurance-training as well (20). But howwill fast-pace running of a more interval-like nature, the kind of trainingconducted by long-sprinters and those running the shorter middle-distances, affect MHC expression? In a recent study we subjected sixyoung men to three months of heavy-resistance training. Prior toentering the heavy-resistance training period the six subjects werehomogeneous in the sense that they had matching VO2-max, general activity
Figure 3. A hypothetical model suggesting how the MHC isoform expression may„oscillate“ in the skeletal muscles of a typical sprint runner, during a one year trai-ning cycle, in response to the various amount and types of training performed. Forfurther details and explanation see text.

58
RUNNING & SCIENCE
level, and performed equally well in a number of strength-related tests,but three subjects had a „naturally“ low relative expression of MHC IIX intheir vastus lateralis muscle, and three of the subjects had a „naturally“high relative expression of MHC IIX in their vastus lateralis muscle. In allsubjects, whether they had a high or a low relative expression of MHC IIXto begin with, the heavy-resistance training resulted in an almost completedisappearance of MHC IIX expression in the trained muscles. After thisperiod of resistance-training the subjects abruptly switched exercise pat-tern and performed two months of training consisting of only short inter-val-running, corresponding to the training conducted by sprinters in theirpre-season preparation. Interestingly, the individual subgroups of subjectsresponded differently to this shift in activity pattern (Figure 4). The subjects,who had small amounts of MHC IIX expression prior to entering theheavy-resistance training period, showed only minor variations, in the MHCIIX expression, from the untrained state, in response to the heavy-resistancetraining and interval-running periods (Figure 4). On the contrary, thesubjects who had a high relative proportion of MHC IIX prior toresistance training, experienced an almost total disappearance of theMHC IIX expression in the trained muscle, or in other terms; theMHC IIX was „trained away“. But interestingly, following the ratherhard and exhausting interval-running program, their muscles werenot able to „maintain“ the very low MHC IIX expression that hadappeared as a consequence of the heavy-resistance training. Thus,during the interval-running period, the expression of MHC IIX in thevastus lateralis muscle of these three subjects almost returned to thepre-resistance training level. A conclusion from this experiment is,that apparently heavy-resistance training is a more potent stimulus thanshort interval-running for suppressing MHC IIX expression. Basedon the different responses to the training, the subjects could be dividedinto two distinct subgroups; the „responders“ and the „non-responders“(Figure 4). This suggestion of potential „responders“ and „non-responders“ may also, at least in part explain why some athletes tendto respond well to interval training, whereas others do not respond sowell.
Bearing the above in mind, it is reasonable to suggest that the initial(probably inherited) MHC isoform composition of an adult individual'smuscles could be important for the response to a given training stimu-lus. Further along this chain of thought, it would seem difficult to expectthat a person with a „naturally“ high MHC I expression and low MHC IIX
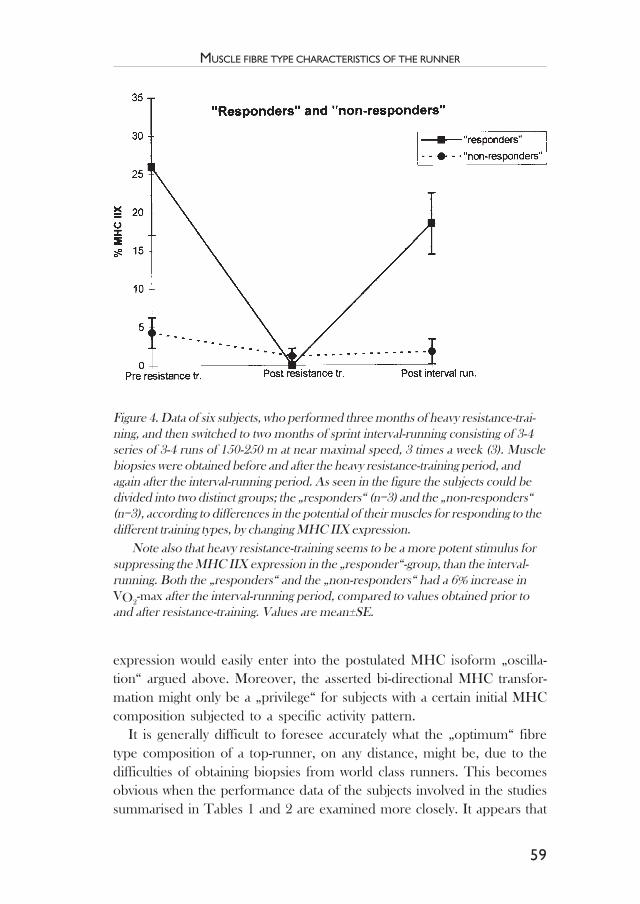
59
MUSCLE FIBRE TYPE CHARACTERISTICS OF THE RUNNER
expression would easily enter into the postulated MHC isoform „oscilla-tion“ argued above. Moreover, the asserted bi-directional MHC transfor-mation might only be a „privilege“ for subjects with a certain initial MHCcomposition subjected to a specific activity pattern.
It is generally difficult to foresee accurately what the „optimum“ fibretype composition of a top-runner, on any distance, might be, due to thedifficulties of obtaining biopsies from world class runners. This becomesobvious when the performance data of the subjects involved in the studiessummarised in Tables 1 and 2 are examined more closely. It appears that
Figure 4. Data of six subjects, who performed three months of heavy resistance-trai-ning, and then switched to two months of sprint interval-running consisting of 3-4series of 3-4 runs of 150-250 m at near maximal speed, 3 times a week (3). Musclebiopsies were obtained before and after the heavy resistance-training period, andagain after the interval-running period. As seen in the figure the subjects could bedivided into two distinct groups; the „responders“ (n=3) and the „non-responders“(n=3), according to differences in the potential of their muscles for responding to thedifferent training types, by changing MHC IIX expression.
Note also that heavy resistance-training seems to be a more potent stimulus forsuppressing the MHC IIX expression in the „responder“-group, than the interval-running. Both the „responders“ and the „non-responders“ had a 6% increase inVO2-max after the interval-running period, compared to values obtained prior toand after resistance-training. Values are mean±SE.

60
RUNNING & SCIENCE
some of the subjects are unable, or only just able, to be part of theircountries national elite in the distance in which they are competing.However, on a number of occasions it has been possible to obtain biopsiesfrom runners of, or close to, world class standard (16, 37), but these sparsebiopsies were nearly always obtained off-season, or during periods in whichthe runners were preparing for the competition season, and not within thenarrow time range during which the world class runners were actuallypeaking. This means that we have limited knowledge of the fibre typecomposition of world class runners at their best.
A correlation between high amount of type 2 fibres and personal besttime on the 100 m distance has been shown in a group of well-trainedFinnish sprinters (29), but just how important the fibre type compositionis for the performance of a runner we do not know. What we do know is,that the MHC composition of human skeletal muscle relates to the forceand torque generation during fast joint movements (1). On the other hand,it would probably be a gross overstatement to claim that there is a straightforward correlation between the MHC composition of a runner's musclesand his or her running performance. Nevertheless, the MHC compositionof e.g. m. vastus lateralis of a normal „untrained“ person might give someindications of whether this person should pursue a career as a sprinter, amiddle-distance, or a long-distance runner (Figure 5). A closer examinationof Tables 1 and 2 reveals that top performance in a certain distance seemsto require a fibre type composition within certain limits. It may be difficultto define exactly what the optimal MHC composition is for a sprinter, butundoubtfully a high amount of MHC II seems essential in the developmentof a world class sprinter. In broad terms a muscle composition of morethan 65-75% type II fibres in m. vastus lateralis seems a necessity for a topsprinter. It is more unclear what the „optimal“ MHC IIA/MHC IIX ratiois. Furthermore, as suggested earlier, the MHC IIA/IIX ratio is probablyvery sensitive to muscle activity and probably „oscillates“ on a yearly basis,at least in some subjects. Apparently, a high class middle-distance runnermust have a fibre type composition with slightly more MHC I than MHCIIA, and only small amounts of MHC IIX. An elite marathon runner shouldprobably have a fibre type composition with a high amount of MHC I(>70%) and very little or no MHC IIX expression.In conclusion, it is reasonable to claim that the long distance runner wouldbenefit from a high amount of type 1 fibres, whereas the sprint-runnerwould benefit from a high amount of type 2 fibres. Today, the generalbelief is that training within a „normal“ physical set-up only to some extent
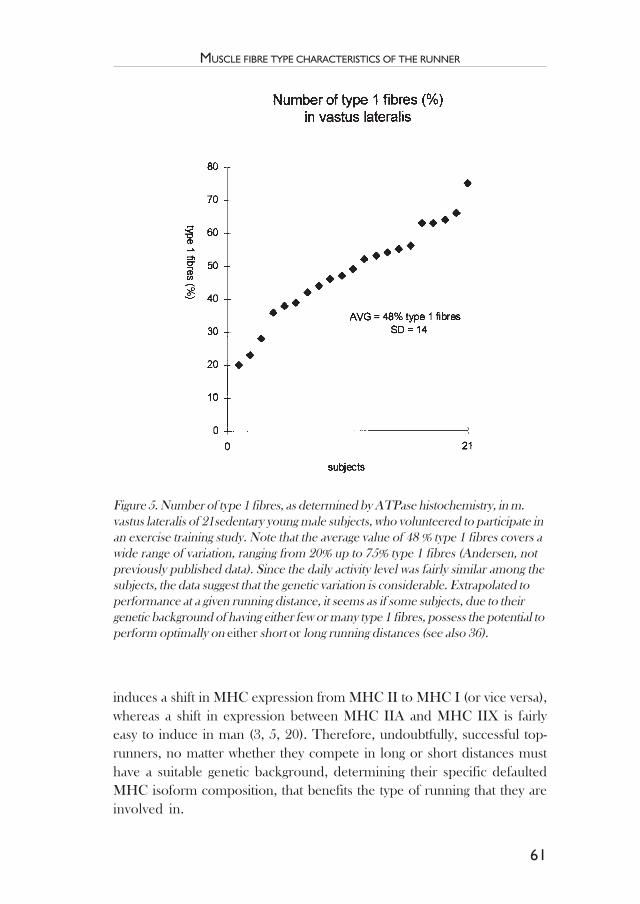
61
MUSCLE FIBRE TYPE CHARACTERISTICS OF THE RUNNER
induces a shift in MHC expression from MHC II to MHC I (or vice versa),whereas a shift in expression between MHC IIA and MHC IIX is fairlyeasy to induce in man (3, 5, 20). Therefore, undoubtfully, successful top-runners, no matter whether they compete in long or short distances musthave a suitable genetic background, determining their specific defaultedMHC isoform composition, that benefits the type of running that they areinvolved in.
Figure 5. Number of type 1 fibres, as determined by ATPase histochemistry, in m.vastus lateralis of 21sedentary young male subjects, who volunteered to participate inan exercise training study. Note that the average value of 48 % type 1 fibres covers awide range of variation, ranging from 20% up to 75% type 1 fibres (Andersen, notpreviously published data). Since the daily activity level was fairly similar among thesubjects, the data suggest that the genetic variation is considerable. Extrapolated toperformance at a given running distance, it seems as if some subjects, due to theirgenetic background of having either few or many type 1 fibres, possess the potential toperform optimally on either short or long running distances (see also 36).

62
RUNNING & SCIENCE
References
1. Aagaard, P., and Andersen, J.L. Correlation between contractile strength andmyosin heavy chain isoform composition in human skeletal muscle. Med. Sci.Sports Exerc., 30, 1217-1222, 1998.
2. Adams, G.R., Hather, B.M., Baldwin, K.M., and Dudley, G.A. Skeletal musclemyosin heavy chain composition and resistance training. J. Appl. Physiol. 74,911-915, 1993.
3. Andersen, J.L. Plasticity of myosin heavy chain isoforms in human skeletalmuscle, Effects of training and detraining. Ph.D. -thesis, Dept. Human Physiol.August Krogh Inst., Copenhagen Muscle Research Centre, University ofCopenhagen, Denmark, 1997.
4. Andersen, J.L., Klitgaard, H. Bangsbo, J., and Saltin B. Myosin heavy chainisoforms in single fibres from m. vastus lateralis of soccer players: Effectsof strength-training. Acta Physiol. Scand. 150, 21-26, 1994.
5. Andersen, J.L., Klitgaard, H., and Saltin B. Myosin heavy chain isoforms insingle fibres from m. vastus lateralis of sprinters: Influence of training. ActaPhysiol. Scand. 151, 135-142, 1994.
6. Andersen, J.L., Mohr, T., Biering-Sørensen, F., Galbo H., and Kjær, M. Myosinheavy chain isoform transformation in single fibres from m. vastus lateralisin spinal cord injured individuals: effects of long-term functional electricalstimulation (FES). Pflügers Arch. 431, 513-518, 1996.
7. Baumann, H., Jäggi, M., Soland, F., Howald, H., and Schaub, M.C. Exercisetraining induces transitions of myosin isoforms subunits within histoche-mically typed human muscle fibres. Pflügers Arch., 409, 349-360, 1987.
8. Boros-Hatfaludy, S., Fekete, G., and Apor, P. Metabolic enzyme activitypatterns in muscle biopsy samples in different athletes. Eur. J. Appl. Physiol.55, 334-338, 1986.
9. Brook, M.H., and Kaiser, K.K.. Three 'myosin ATPase' systems: The natureof their pH lability and sulfhydryl dependence. J. Histochem. Cytochem. 18,670-672, 1970.
10. Costill, D.L., Daniels, J., Evans, W., Fink, W., Krahenbuhl, G. and Saltin, B.Skeletal muscle enzymes and fiber composition in male and female trackathletes. J. Appl. Physiol., 40, 149-154, 1976.
11. Denis, C., Linossier, M.T., Dormois, D., Padilla, S., Geyssant, A., Lacour,J.R., and Inbar, O. Power and metabolic responses during supramaximalexercise in 100-m and 800-m runners. Scand. J. Med. Sci. Sports, 2, 62-69,1992.
12. Farrell, P.A., Wilmore, J.H., Coyle, E.F., Billing, J.E., and Costill, D.L. Plasmalactate accumulation and distance running performance. Med. Sci. Sports, 11,388-344, 1979.
13. Fink, W.J., Costill, D.L., and Pollock, M.L. Submaximal and maximal workingcapacity of elite distance runners. Part II. Muscle fiber composition andenzyme activities. Ann. NY Acad. Sci. 301, 323-327, 1977.
63
MUSCLE FIBRE TYPE CHARACTERISTICS OF THE RUNNER
14. Fridén, J., Seger, J, and Ekblom, B. Sublethal muscle fibre injuries after high-tension anaerobic exercise. Eur. J. Appl. Physiol. 57, 360-368, 1988.
15. Goldspink, G., Scutt, A., Martindale, J., Jaenicke, T., Turay, L., and Garlach,G.F. Stretch and force generation induce rapid hypertrophy and myosinisoform gene switching in adult skeletal muscle. Biochem. Soc. Trans. 19, 368-373, 1991.
16. Gollnick, P.D., Armstrong, R.B., Saubert, C.W., Piehl, K., and Saltin, B.Enzyme activity and fiber composition in skeletal muscle of untrained andtrained men. J. Appl. Physiol. 33, 312-319, 1972.
17. Gregor, R.J., Edgerton, V.R., Perrine, J.J., Campion, D.S., and DeBus, C.Torque-velocity relationship and muscle fiber composition in elite femaleathletes. J. Appl. Physiol. 47, 388-392, 1979.
18. Gregor, R.J., Edgerton, V.R., Rozenek, R, and, Castleman, K.R. Skeletalmuscle properties and performance in elite female track athletes. Eur. J.Appl. Physiol. 47, 355-364, 1981.
19. Häkkinen, K., Alén, M., and Komi, P.V. Changes in isometric force- andrelaxation-time, electromyographic and muscle fibre characteristics of hu-man skeletal muscle during strength training and detraining. Acta Physiol.Scand. 125, 573-585, 1985.
20. Harridge, S.D.R. The muscle contractile system and its adaptation to training.In; Human muscular function during dynamic exercise. Ed; P. Marconnet,B. Saltin, P. Komi, and J. Poortmans. Med. Sports Sci. Basel. 41, 82-94, 1996.
21. Hather, B.M., Tesch, P.A., Buchanan, P., and, Dudley, G.A. Influence ofeccentric actions on skeletal muscle adaptations to resistance training. ActaPhysiol. Scand. 143, 177-185, 1991.
22. Hirvonen, J., Rehunen, S., Rusko, H., and Härkönen, M. Breakdown of high-energy phosphate compounds and lactate accumulation during short supramaximal exercise. Eur. J. Appl. Physiol. 56, 253-259, 1987.
23. Houston, M.E., Froese, E.A., Valeriote, St.P., Green, H.J. and, Ranney, D.A.Muscle performance, morphology and metabolic capacity during strengthtraining and detraining: a one leg model. Eur. J. Appl. Physiol. 51, 25-35,1983.
24. Howald, H. Training-induced morphological and functional changes in skele-tal muscle. Int. J. Sports Med. 3, 1-12, 1982
25. Jansson, E. and Kaijser, L. Muscle adaptation to extreme endurance trainingin man. Acta Physiol. Scand. 100, 315-324, 1977.
26. Johansson, C., Lorentzon, R., Sjöström, M., Fagerlund, M., and Fugl-Meyer,A.R. Sprinters and marathon runners. Does isokinetic knee extensorperformance reflect muscle size and structure? Acta Physiol. Scand., 130, 663-669, 1987.
27. Klitgaard, H., Bergman, O., Betto, R., Salviati, G., Schiaffino, S., Clausen,T., and Saltin, B. Co-existence of myosin heavy chain I and IIa isoforms inhuman skeletal muscle fibres with endurance training. Pflügers Arch. 416, 470-472,1990.

64
RUNNING & SCIENCE
28. Kiltgaard, H., Zhou, M., Schiaffino, S., Betto, R., Salviati, G., and Saltin, B. Ageingalters the myosin heavy chain composition of single fibres from human skeletalmuscle. Acta Physiol. Scand. 140, 55-62, 1990.
29. Mero, A., Luhtanen, P., Viitasalo, J.T., and Komi, P.V. Relationships between themaximal running velocity, muscle fiber characteristics, force production and forcerelaxation of sprinters. Scand. J. Sports Sci. 3, 16-22, 1981.
30. Parkhouse, W.S., McKenzie, D.C., Hochachka, P.W., and Ovalle, W.K. Buf-fering capacity of deproteinized human vastus lateralis muscle. J. Appl. Physiol.,58, 14-17, 1985.
31. Pette, D. Training effects on the contractile apparatus. Acta Physiol. Scand.162, 367-376, 1998.
32. Pette, D. and Staron, R.S. Mammalian skeletal muscle fiber type transitions.Int. Rev. Cytol. 170, 143-223, 1997.
33. Rolf, C., Andersson, G., Westblad, P., and Saltin, B. Aerobic and anaerobicwork capacities and leg muscle characteristics in elite orienteers. Scand. J.Med. Sci. Sports, 7, 20-24, 1997.
34. Sadoyama, T., Masuda, T., Miyata, H., and Katsuta, S. Fibre conductionvelocity and fibre composition in human vastus lateralis. Eur. J. Appl. Physiol.,57, 767-771, 1988.
35. Saltin, B., and Gollnick, P.D. Skeletal muscle adaptability: Significance formetabolism and performance. In; Handbook of Physiology. Section 10:Skeletal muscle. Ed; L.D. Peachey. Bethesda. Am. Physiol. Soc. 555-631, 1983.
36. Saltin, B., Henriksson, J., Nygaard, E., Andersen, P., and Jansson, E. Fibertypes and metabolic potentials of skeletal muscles in sedentary man andendurance runners. Ann. NY Acad. Sci. 301, 3-29, 1977.
37. Saltin , B., Kim, C.K., Terrados, N., Larsen, H., Svedenhag, J., and Rolf, C.J.Morphology, enzyme activities and buffer capacity in leg muscles of Kenyanand Scandinavian runners. Scand. J. Med. Sci. Sports, 5, 222-230, 1995.
38. Schiaffino, S. and Reggiani, C. Molecular diversity of myofibrillar proteins:Gene regulation and functional significance. Physiol. Rev. 76, 371-423, 1996.
39. Sjöström, M., Johansson, C., and Lorentzon, R. Muscle pathmorphology inm. quadriceps of marathon runners. Early signs of stain disease or functionaladaptation? Acta Physiol. Scand. 132, 537-542, 1988.
40. Staron, R.S., and Johnson, P. Myosin polymorphism and differentialexpression in adult human skeletal muscle. Comp. Biochem. Physiol. 106,463-475, 1993
41. Staron, R.S., Leonardi, M.J., Karapondo, D.L., Malicky, E.S., Falkel, J.E.,Hagerman, F.C., and Hikida, R.S. Strength and skeletal muscle adaptationsin heavy-resistance-trained women after detraining and retraining. J.Appl.Physiol. 70, 631-640, 1991.
42. Staron, R.S., Malicky, E.S., Leonardi, M.J., Falkel, J.E., Hagerman, F.C., and,Dudley, G.A. Muscle hypertrophy and fast fiber type conversions in heavyresistance-trained woman. Eur. J. Appl. Physiol. 60, 71-79, 1990.
43. Tesch, P.A., and Karlsson, J. Muscle fiber types and size in trained and untrainedmuscles of elite athletes. J. Appl. Physiol. 59, 1716-1720, 1985.
65
MUSCLE FIBRE TYPE CHARACTERISTICS OF THE RUNNER
44. Tesch, P.A., Komi, P.V. and, Häkkinen, K. Enzymatic adaptations consequent tolong-term strength training. Int. J. Sports Med. 8, 66-69, 1987.
45. Thorstensson, A., Larsson, L., Tesch, P., and Karlsson, J. Muscle strengthand fiber composition in athletes and sedentary men. Med. Sci. Sports, 9, 26-30, 1977.
46. Torok, D.J., Duey, W.J., Bassett, D.R., Howley, E.T., and Mancuso, P. Car-diovascular responses to exercise in sprinters and distance runners. Med. Sci.Sports. Exerc., 27, 1050-1056, 1995.

RUNNING & SCIENCE
66

67
PHYSIOLOGICAL FACTORS AFFECTING RUNNING PERFORMANCE
Physiological Factors AffectingRunning Performance
Carlo Capelli & Pietro E. di Prampero
SynopsisThe present paper shows that by utilising a model based onthe present physiological knowledge it is possible to predictfairly well theoretical best performance times and speeds inrunning provided that the following physiological variables ofthe subjects are known: maximal aerobic power (MAP),anaerobic lactic capacity (AnL), anaerobic alactic capacity(AnAl) and energy cost of running (Cr). Further manipulationsof the model make it possible to quantify the impact of the samevariables on performances. This showed that, among all the con-sidered variables, the energy cost of running is the major deter-minant of the maximal speeds attained in running.
IntroductionThe metabolic power required (E
r) to run a given distance d in the time t
is set by the product of the energy cost of running (Cr) and the speed (v =d•t--1):
Er = C
r•v = C
r•d•t-1 1)
where Cr is the amount of metabolic energy spent to run over one unit of
distance (15). Since Cr is constant or increases slightly with v, it necessarily
follows that Er is larger the smaller t. Thus, for any given distance andsubject, the shortest time will be achieved when E
r is equal to the individual
maximal metabolic power (Emax
). In turn, Emax
is a known decreasing

RUNNING & SCIENCE
68
function of t: it depends on the subject’s Maximal Aerobic Power (MAP)and on the maximal amount of energy derived from full utilisation ofAnaerobic energy Stores (AnS) (16). So, if the relationship between C
r and
v, together with the subject’s MAP and AnS, are known, his or her BestPerformance Time (BPT) over any given distance d can be obtained fin-ding the time value which solves the equality E
max (t) = E
r (t).
The paragraphs that follow will be devoted to illustrate that individualBPTs in track running can be predicted with satisfactory accuracy (16)utilising this approach. In addition, it will be shown that the same ap-proach can be used also to quantify the role of the energy cost of running(C
r), of the Maximal Aerobic Power (MAP) and of the Anaerobic energy
Stores (AnS) in determining BPTs in running.
Metabolic Power Requirement in RunningThe overall energy cost per unit of distance of track running (C
r ) from a
stationary start on flat terrain is given by (16):
Cr = Cr, na + k’•v2 + (0.5 v2•d-1•η-1) 2)
where: i) Cr, na (J•m-1•kg-1) is the metabolic energy spent per unit ofdistance against non aerodynamic forces: in élite middle-distancerunners it amounts, on the average, to 3.8 J•m-1•kg-1 (8); ii) k’ is theproportionality constant between the energy cost against air drag andthe square of the air speed: it amounts to ∼ 0.40 J•s2•m-3 per m2 of bodysurface for a barometric pressure of 760 mmHg and an air temperature of20°C (16); iii) the third term is the metabolic energy spent, over a unit ofdistance, to accelerate 1 kg body mass from zero to the final speed v: it isgiven by the kinetic energy per unit of distance and unit of body mass (0.5v2•d-1) divided by the overall efficiency of running (η) {eta}. As a firstapproximation, η {eta} can be assumed equal to 0.25 since, in the initialacceleration phase, no (or only very small) recovery of elastic energy cantake place: hence the mechanical efficiency approaches that of theconcentric muscular contraction (5). Substituting these values into Eq. 2,the overall metabolic energy spent per unit distance (J•m-1) for an éliterunner of standard anthropometric characteristics (70 kg, 175 cm) can bedescribed as:
Cr = 264.6 + 0.74 v 2 + 140 v2•d
tot-1 3)

69
PHYSIOLOGICAL FACTORS AFFECTING RUNNING PERFORMANCE
This equation shows that, over the shorter distances and the faster speeds,the kinetic term (third term of Equation 3) is a substantial fraction of C
r.
Indeed, for a 400 m run at speeds close to the absolute best performance(9.3 m•s-1), the kinetic term amounts to about 7.5% of the overall energycost. However, for longer distances and slower speeds, its weight becomesprogressively smaller: at world record speeds it amounts to less than 1% inthe 5000 m distance.
The overall metabolic power output necessary to run at speed v is givenby the product of C
r and v (Equation 1). Once again, since in track running
the distance of each competition is fixed and known, d t--1 can be substitutedfor v. Equation 3 becomes then:
Er = 264.6 d•t -1 + 0.74 d3•t-3 + 140 d2•t-3 4)
The total metabolic power required (Er,) for covering 0.8 km in a time
interval ranging from 80 to 120 s, for an élite athlete of 70 kg body massand 175 cm height, as calculated from Equation 4, is shown in Figure 1A.
It goes without saying that equation 4 may yield Er of any given subject
over any given distance provided the individual value of Cr, na
is known,together with his/her anthropometric characteristics.
Maximal Metabolic Power
The maximal metabolic power (Emax, kW) a given subject can sustain at asteady level throughout the effort is a decreasing function of the exhaustiontime (t
e) (4, 16, 19); it can be appropriately described by:
Emax
= AnS•te
-1 + [F•MAP - (F•MAP•τ•(1 - e-te•τ−1))•te-1] 5)
where:i) AnS is the total metabolic energy obtained from complete utilisation
of anaerobic sources, i.e. from anaerobic glycolysis and from nethigh energy phosphates splitting.
ii) MAP (Maximal Aerobic Power) is the equivalent in kW of theindividual maximal oxygen consumption (VO2-max) measured abovethe oxygen consumption at rest;
iii) τ {tau} is the time constant with which MAP is attained at the onsetof the effort;
iv) F is the fraction of MAP which can be sustained throughout theeffort.

RUNNING & SCIENCE
70
Figure 1. Metabolic power requirement (E2, kW) to run 0.8 km in the time indicatedon the abscissa (A) and maximal available metabolic power (Emax, kW) (B) over thesame time interval. Data were calculated for a hypothetical élite athlete whosecharacteristics are as follows: body mass = 70 kg; gross VO2-max = 5.0 l • min-1;Overall anaerobic capacity = 100 kJ. The time value at which the two functions E2
and Emax cross yields the best performance time (BPT) of this hypothetical athleteover this distance (C) see text for details.
A
B
C

71
PHYSIOLOGICAL FACTORS AFFECTING RUNNING PERFORMANCE
The third term is due to the fact that VO2-max at the onset of exercise isnot attained instantaneously, but with a time constant τ. Hence, the ave-rage aerobic power up to the time t
e is given by the quantity in square
brackets, i.e. it is reduced below F•MAP by an amount equal to the O2
deficit incurred to te (F•MAP•τ•(1 - e-te•τ−1)) divided by the time t
e itself.
The first and third terms of equation 5 become progressively smaller withincreasing te. So, equation 5 shows that, for long term exercise, the maxi-mal sustainable metabolic power is essentially set by the subjects VO2
-maxand by the fraction of it which can be maintained throughout the effort. Asthe time of the exercise becomes shorter, the contribution of the anaerobicenergy stores to the overall metabolic power becomes progressively greater.Indeed, with decreasing t
e, the first and third term of equation 5 become
larger. Hence, not only does the anaerobic power becomes larger, butalso the effective aerobic power is eroded by the increasing weight of theO
2 deficit.Equation 5 shows that the time course of Emax can be described as a
function of te for any given subject, provided the variables mentioned
above are known. We will therefore proceed identifying the appropriatevalues of these variables for a „standard“ élite athlete.
As mentioned above, AnS is the sum of the amount of energy deri-ved from full exploitation of the anaerobic glycolytic pathway (anaerobiclactic capacity, AnL) plus that provided by maximal depletion of phos-phocreatine and adenosine triphosphate (anaerobic alactic capacity,AnAl) in the working muscles. The former can be set equal to 1 kJ kg-1
(14), and the latter increases with the duration of exhausting exercisewith a time constant (τ
al) of 23.4 s to attain an asymptotic value of 0.42
kJ kg-1 for exercises longer than 120 s (10). Hence, the overall anaero-bic capacity of a 70 kg body mass subject (AnS, kJ) is described by:
AnS = (0.42•(1-e -te/τal) + 1.0)•70 6)
Assuming a gross VO2-max of 5.0 l min-1, a value typical for élite athletes
(15), and an oxygen consumption at rest of 3.5 ml O2 min-1 kg-1, the maximalmetabolic power (MAP) turns out to be 1.66 kW for a subject of 70 kg.
The time constant of the simple exponential function describing theincrease of VO2 at muscular level at the onset of the maximal exercise (τ),as measured by means of 31P nuclear magnetic resonance spectroscopy (1),is on the order of 24 s. So, for the values of MAP and of AnS mentionedabove, the weight of the third term of equation 5 decreases with increasing

RUNNING & SCIENCE
72
te from about 20% of Emax for te = 40 s to less than 4% for te = 10 minutes.The fraction of MAP sustainable throughout the effort (F) depends on theduration of the exercise. For t
e longer than 7 minutes, it can be assumed to
decrease linearly with the logarithm of te (13). Accordingly, F in Eq. 5 takesthe following values:
7)
The values reported above allowed us to calculate the maximal availablemetabolic power (E
max) for a hypothetical élite athlete; it is represented in
Figure 1B as a function of te over the same time range as in Figure 1A.It also goes without saying that the knowledge of the individual values of
MAP and AnS, together with the subject’s anthropometric features, wouldallow us to describe Emax as function of te in any given individual.
Best Performance TimesFigure 1C shows that for a certain range of t values, Emax is below thefunction describing the metabolic power requirement (Er). These timeswill therefore be unattainable by this subject. For longer t values, E
max is
above Er. Therefore, this hypothetical athlete could have covered the di-stance at stake in a shorter time. It seems therefore reasonable to assumethat the theoretical best time of performance (t
theor) is given by the abscissa
at which the two functions cross. In practice, the time value solving theequalities Emax (te) = Er (t); i.e. ttheor, can be obtained graphically, as in Figure1C, or by means of a computerised iterative procedure on the basis of thevalues of AnS, MAP and Cr and assuming a value of τ.
The approach described above was tested in a group of 16 male andfemale runners of intermediate level competing in middle distancerunning (age: 18.2±2.7 yrs; body mass: 60.0±8.7 kg; height: 173.8±7.4 cm; VO2-max: 55.2±7.6 ml min-1 kg-1) in whom steady-state oxygenconsumption (VO2
, ml min-1 kg-1) and blood lactate concentration ([La]b,
mM) were determined during constant speed track running (speed range:3.66—6.00 m s-1) (16). Energy cost of running was calculated from the ratioof VO2
above resting to speed and expressed in joules per kilogram ofbody mass per meter assuming an energetic equivalent of 20.9 J per ml O2

73
PHYSIOLOGICAL FACTORS AFFECTING RUNNING PERFORMANCE
(16). When [La ]b at the end of the run exceeded 2.0 mM, the energy costwas corrected for the amount of metabolic energy derived from glycolysis.This was accomplished assuming that the net increase of one mmol/l oflactate (L[La ]b) above the value prevailing before the trial is equal to 60 J permM per kilogram of body mass (3 ml O
2 kg-1 mM-1) (15) in terms of metabolic
energy yield. The energy cost of running turned out to be essentially indepen-dent of the speed and amounted, on the average, to 3.72±0.24 J m-1 kg-1.
Since in this study the energy cost was determined during track running,it included the amount of energy spent per meter against air drag. Hence,Equation 2 reduced to:
Cr = C
+ (0.5 v2•d-1•η-1)
where C corresponded to the individual energy cost of running assessedon the track as described above. This made it possible to calculate E
r of
each subject over a set of running distances on which the subjects hadbeen competing in the same season and over time ranges including, foreach subject and distance, his/her BPT.
Emax of each subject was obtained inserting the individual value ofVO2-max in Equation 5, together with the appropriate values of AnS. Thislast was assumed to amount to 1.42 kJ per kilogram of body mass in a 25-yrs old male athlete and to be smaller in younger subjects (83% of theabove at 16 yrs and 94% at 19 yrs) (6).
So, the individual Er and E
max functions could be described analytically
for each subject and distance as shown above (see Figure 1C), thus allowingus to calculate the theoretical BPTs and to compare them with the actualseasonal BPTs over the very same distances.The same set of calculations was then applied to a similar set of datareported by Lacour et al. (8) for French elite athletes.
For both groups of subjects theoretical and actual BPTs are plottedagainst each other in Figure 2 and theoretical and actual best perfor-mance speeds in Figure 3. In all cases, the experimental relationshipsbetween theoretical and actual values showed rather high determina-tion coefficients and were rather close to the identity line, thus showingthat the model could predict actual performances fairly well. This isalso shown in Figure 4 where the differences of the logarithms of the actualand theoretical BPTs are plotted as a function of the logarithm of theirmean: the differences lay generally between the values of the overall meanof the differences plus or minus two standard deviations, thus confirmingthe satisfactory precision of the prediction.

RUNNING & SCIENCE
74
In summary, the proposed model allowed us to predict with fairly goodaccuracy best performance times in different groups of runners over di-stances from 0.8 to 5.0 km. A possible source of error was probably due tothe fact that the time constant t and the maximal capacity of the anaerobicenergy sources (AnS) were assumed averages rather than individual values.
Figure 2. Theoretical best performance times are plotted as a function of actualseasonal records for young runners (left diagram) and for French élite athletes (from8, right diagram).
Figure 3. Theoretical best performance speeds are plotted as a function of the actualseasonal records for young runners (left diagram) and for French élite athletes (from8, right diagram).
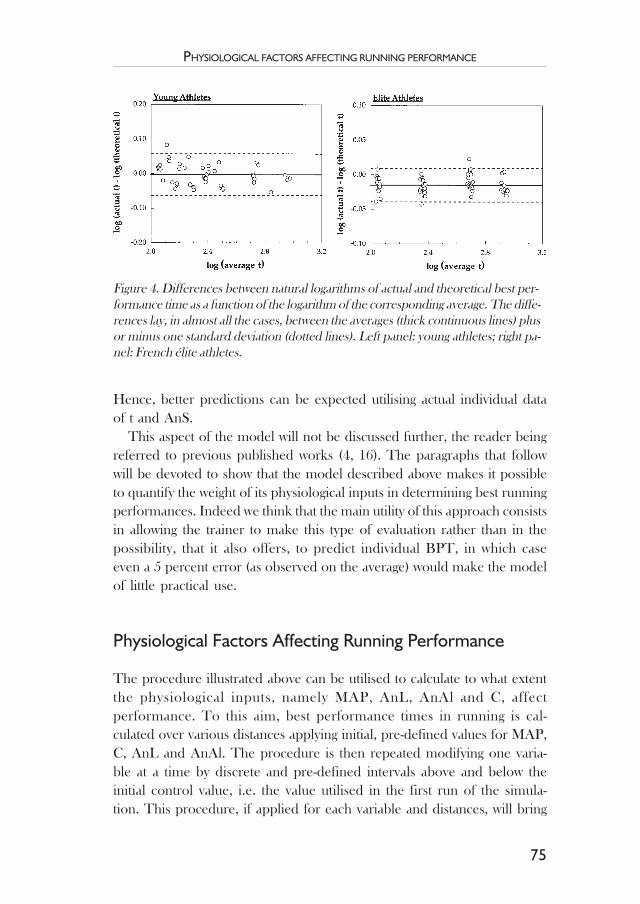
75
PHYSIOLOGICAL FACTORS AFFECTING RUNNING PERFORMANCE
Hence, better predictions can be expected utilising actual individual dataof t and AnS.
This aspect of the model will not be discussed further, the reader beingreferred to previous published works (4, 16). The paragraphs that followwill be devoted to show that the model described above makes it possibleto quantify the weight of its physiological inputs in determining best runningperformances. Indeed we think that the main utility of this approach consistsin allowing the trainer to make this type of evaluation rather than in thepossibility, that it also offers, to predict individual BPT, in which caseeven a 5 percent error (as observed on the average) would make the modelof little practical use.
Physiological Factors Affecting Running Performance
The procedure illustrated above can be utilised to calculate to what extentthe physiological inputs, namely MAP, AnL, AnAl and C, affectperformance. To this aim, best performance times in running is cal-culated over various distances applying initial, pre-defined values for MAP,C, AnL and AnAl. The procedure is then repeated modifying one varia-ble at a time by discrete and pre-defined intervals above and below theinitial control value, i.e. the value utilised in the first run of the simula-tion. This procedure, if applied for each variable and distances, will bring
Figure 4. Differences between natural logarithms of actual and theoretical best per-formance time as a function of the logarithm of the corresponding average. The diffe-rences lay, in almost all the cases, between the averages (thick continuous lines) plusor minus one standard deviation (dotted lines). Left panel: young athletes; right pa-nel: French élite athletes.

RUNNING & SCIENCE
76
about calculated percent increases (or decreases) of best performance ti-mes.
The simulation illustrated above will now be applied to a standard éliteathlete running over the distance of 1.5 km from a stationary start. Thefour input variables will be varied by 2.5% steps over an interval rangingfrom 90 to 100% of the following control values: MAP, C
r, AnL and AnaL.
For the overall energy cost of running, the 2.5% changes will be applied toits non aerodynamic fraction (C
r, na in equation 2). The results obtained
when changing only MAP are reported in Figure 5. The nine thin curvesdescribe Emax as a function of te. The abscissa values at which these ninecurves cross the dashed thick E
r, tot function form the set of the best
performance times obtained when MAP was changed from 90 to 110% ofthe initial values, while the other three variables remained constant.Obviously enough, three other sets of BPTs are obtained when the otherthree variables (AnL, AnAl and C
r) are changed as described.
The percent improvements of the initial best performance times inrunning are summarised in Figure 6 as a function of the distancecovered (d, km) and for 2.5, 5.0, 7.5 and 10.0% changes of the fourvariables. Each curve describes the results obtained when only the indicatedvariable was modified. Each curve was drawn by eye interpolating the data
Figure 5. Metabolic power requirement E.
2 (dashed thick line) to run 1.5 km in thetime indicated on the abscissa. Maximal available metabolic power max is also indi-cated (continuous thick curve) on the same time axis. Data apply to an élite athletewhose characteristics are as follows: body mass = 70 kg; gross O2
-max = 5.0 l•min-1;Overall anaerobic capacity = 100 kJ. Thin curves correspond to the maximalmetabolic power available when MAP above the value at rest is smaller or largerthan 1.66 kW. Best performance times becomes shorter as MAP increases from 90%to 110% of 1.66 kW. See text for details.

77
PHYSIOLOGICAL FACTORS AFFECTING RUNNING PERFORMANCE
only for the sake of description. These diagrams give an immediaterepresentation of the weight of each of the four variables in determiningthe performance in running. For instance, the improvement achieved bymodifying either the maximal aerobic power or the overall anaerobiccapacity depends on the distance (and hence on the time of performance).On the contrary, the improvement achieved by modifying only C
r remains
essentially constant regardless of the distance (and time) indicating that the
Figure 6. Percent improvement of the initial best performance time in running as afunction of the distance when the four indicated variables of the model (AnL; AnAl;MAP; Cr) are changed by 2.5, 5, 7.5 and 10%.
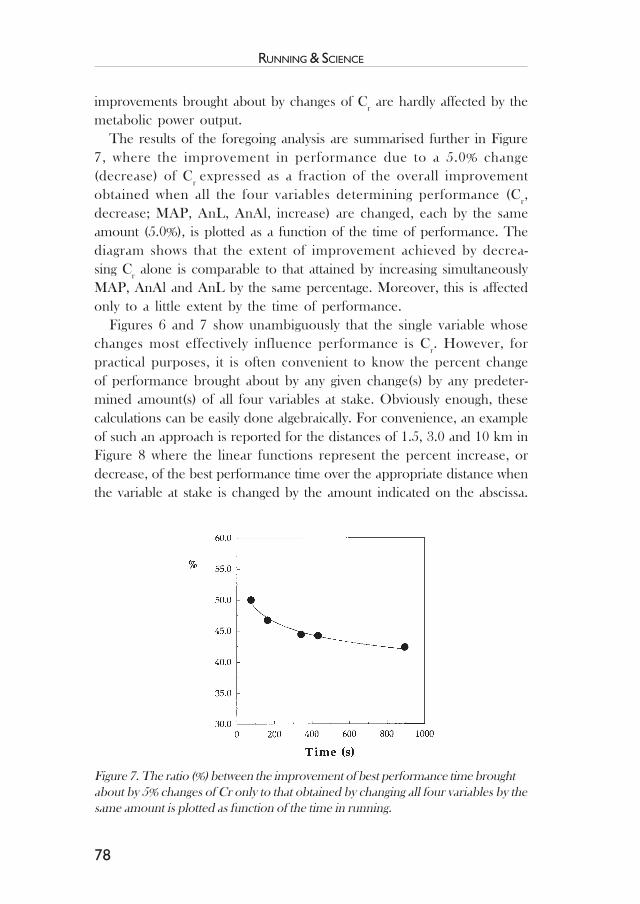
RUNNING & SCIENCE
78
improvements brought about by changes of Cr are hardly affected by themetabolic power output.
The results of the foregoing analysis are summarised further in Figure7, where the improvement in performance due to a 5.0% change(decrease) of C
r expressed as a fraction of the overall improvement
obtained when all the four variables determining performance (Cr,
decrease; MAP, AnL, AnAl, increase) are changed, each by the sameamount (5.0%), is plotted as a function of the time of performance. Thediagram shows that the extent of improvement achieved by decrea-sing Cr alone is comparable to that attained by increasing simultaneouslyMAP, AnAl and AnL by the same percentage. Moreover, this is affectedonly to a little extent by the time of performance.
Figures 6 and 7 show unambiguously that the single variable whosechanges most effectively influence performance is C
r. However, for
practical purposes, it is often convenient to know the percent changeof performance brought about by any given change(s) by any predeter-mined amount(s) of all four variables at stake. Obviously enough, thesecalculations can be easily done algebraically. For convenience, an exampleof such an approach is reported for the distances of 1.5, 3.0 and 10 km inFigure 8 where the linear functions represent the percent increase, ordecrease, of the best performance time over the appropriate distance whenthe variable at stake is changed by the amount indicated on the abscissa.
Figure 7. The ratio (%) between the improvement of best performance time broughtabout by 5% changes of Cr only to that obtained by changing all four variables by thesame amount is plotted as function of the time in running.

79
PHYSIOLOGICAL FACTORS AFFECTING RUNNING PERFORMANCE
The point upon which all lines pivot corresponds to the theoretical besttime of performance when all variables are set at their initial control value.In Figure 8, the relationships between the percent increase or decrease ofthe performance time and the percent change of the independent variablewere assumed to be linear. However, since neither E
r nor E
max are linear
functions of the performance time, the above assumption is an obviousoversimplification. Nevertheless, within the range of the independent va-riable reported in Figure 8, these relationships can be approximated bylinear regressions whose slopes are reported in Table 1 (mean r2 = 0.997±0.0019, range: 1.000—0.993).The advantage of this oversimplification is thatlinear effects can be easily added. For instance, the effects deriving from a5.0% increase of MAP and from a 3.0% increase of AnL can be added toyield the overall percent decrease of the theoretical best time ofperformance. Table 1 makes it possible to apply this type of theoreticalanalysis to all the running distances considered.
General DiscussionThe results of the above analysis depend on several assumptions, particularlyas far as the form of the equations is concerned. Hence, the few paragraphsthat follow will be devoted to discuss the dependence of the results on theassumptions made.
Table 1. Percent decrease or increase of theoretical best times of per-formance obtained changing by one percent MAP, AnAl, AnL and C inrunning. Time values in seconds indicate best times of performanceobtained utilising the initial values of MAP, AnAl, AnL and C represen-ting the physiological characteristics of a hypothetical élite athlete.
Distance Time t t / MAP, % t / AnAl, % t / Anl, % t / C, %m sec
400 39.5 -0.288 -0.202 -0.613 0.927800 109.7 -0.622 -0.128 -0.310 0.9331500 237.5 -0.784 -0.065 -0.158 0.8863000 519 -0.897 -0.034 -0.080 0.9025000 919.2 -0.897 -0.020 -0.048 0.90110000 1963.4 -0.997 -0.010 -0.024 0.907

RUNNING & SCIENCE
80
Figure 8. The percent increase or decrease of the initial best performance time isplotted as a function of the percent change of MAP, AnAl, AnL or overall Cr for thethree indicated distances.

81
PHYSIOLOGICAL FACTORS AFFECTING RUNNING PERFORMANCE
Equations similar to that yielding Emax as function of te (Equation 5) havebeen applied in the past to calculate theoretical best performance times inrunners (see above and in reference 4) and in élite cyclists over severaldistances (4, 16). Theoretical and actual times agreed well, and allassumptions on which Equation 5 is based have been extensively discussedin the quoted papers to which the reader is referred. Equation 5 has beenalso recently utilised to estimate the energy cost of swimming (3) and running(7) at supramaximal speeds. Hence, we are fairly confident that thephysiological premises on which Equation 5 is based are sufficiently solidto allow us to obtain an accurate description of the individual Emax as afunction of t
e.
Maximal aerobic power has been reported to be significantly larger afterhigh intensity training both in moderately active subjects and in élite athletes.For instance, VO2
-max increased by 13% after six weeks of high-intensityintermittent exercise in a group of 7 physical education students (18) and itrose significantly from winter to the competitive mid-year season (+4.5%)in a group of well-trained high level track runners (17). Also anaerobiccapacity can be substantially increased by high intensity raining. This wasshown to occur, for instance, in moderately active, young male subjects inwhom anaerobic capacity rose by 28% at the end of 6 weeks of intense,intermittent cycle ergometric exercise and in sprint — trained subjects whoseanaerobic capacity was 10% larger at the end of six weeks of high intensityrunning training (11). Therefore, the percent changes imposed to MAPand to anaerobic capacities in the simulations reported above (see Figure6) reproduce fairly well those brought about by the training or detrainingin élite athletes.At variance with VO2-max and anaerobic capacity, there is far from a con-sensus as to the effects of training on running economy (2, 9), even thoughcross-sectional studies have often revealed that C
r is lower in long-distance
runners and in adult subjects than in sprint runners and in children (12).Moreover Cr seems to be identical between similarly trained male andfemale athletes (2). More recently, a retrospective analysis of sevenpublications spanning a period of twenty years re-examined the differencesin the cost of running among three groups of runners who were stratifiedaccording to the different performance level (12). The study revealed thatélite runners were more economical than the less talented ones and that,on the average, trained subjects had a better running economy thanuntrained controls. However, within-group variability was high in all thegroups and there was also a substantial overlap of minimum, mean and

RUNNING & SCIENCE
82
maximal value of running economy over the categories. Hence, it is notclear whether long distance training does improve running economy orwhether long distance runners naturally select endurance events becauseof their innate economy which can be maximally exploited over the longestdistances rather than during sprint events. In spite of these uncertainties,the analysis presented in this paper suggests that C
r should be always assessed
in runners.
SummaryIn conclusion, the analysis illustrated in the present paper showed that atheoretical model based on present physiological knowledge can predictfairly well theoretical best performance times and speeds in running,provided some physiological variables (C
r, MAP, AnL and AnAl) of the
subjects are known. In addition, further manipulations of the sametheoretical model make it possible to quantify the impact of the samephysiological variables on performances. The analysis showed that, amongthe considered variables, Cr turned out to be the major determinant of themaximal speeds attained in running when all the distances were conside-red. We think that the approach illustrated here above might be fruitfullyextended to animal physiology so as to investigate the physiologicaldeterminants of maximal speeds in several forms of animal locomotion.
References
1. Binzoni, T, Ferretti, G., Shenker, K. et al Phosphocreatine hydrolysis by 31P -NMR at the onset of constant---load exercise in humans. J. Appl. Physiol. 73, 1644--1649, 1992.
2. Bourdin, M., Pastene, J., Germain, M. et al Influence of training, sex, age andbody mass on the energy cost of running. Eur. J. Appl. Physiol. 66, 439-444 1993.
3. Capelli, C, Pendergast, D. R. and Termin, B. Energetics of swimming at maximalspeeds. Eur. J. Appl. Physiol. 78, 385-393 1998.
4. Capelli, C., Schena, F., Zamparo, P. et al Energetics of best performances intrack cycling. Med Sci Sports Exerc. 30: 614-624, 1998.
5. Cavagna, G., Komarek, L. and Mazzoleni, S. The mechanics of sprint running.J. Physiol (London) 217, 709-721, 1971.
6. Cerretelli, P., Aghemo, P. and Rovelli, E. Aspetti fisiologici dell'adolescente inrelazione alla pratica dell'esercizio fisico. Med. Sport Turin 21: 731-734, 1968.

83
PHYSIOLOGICAL FACTORS AFFECTING RUNNING PERFORMANCE
7. Hautier, C.A., Wouassi, D., Arsac, L.M. et al Relationships betweenpostcompetition blood lactate concentration and average runing velocityover 100---m and 200---m races. Eur. J. Appl. Physiol. 68, 508-513, 1994.
8. Lacour, J.R., Padilla-Magunacelaya, S., Barthélémy, J. C. et al The energeticsof middle---distance running. Eur. J. Appl. Physiol. 60, 38-43, 1990.
9. Lake, M. J. and Cavanagh, P. R. Six weeks of training does not changerunning mechanics or improve running economy. Med. Sci. Sports Exerc. 28,860-869, 1996.
10. Medbø, J. I. and Tabata, I. Anaerobic energy release in working muscle during30 s to 3 min of exhausting bicycling. J. Appl. Physiol. 75, 1654-1660, 1993.
11. Medbø, J.I. and Burgers, S. Effect of training on the anaerobic capacity. Med.Sci. Sports Exerc. 22: 501-507, 1990.
12. Morgan, D.W., Brannsford, D.R., Costill, D.L., et al Variation in the aerobicdemand of running among trained and untrained subjects. Med. Sci. SportsExerc. 27, 404-409, 1995.
13. Péronnet, F. and Thibault, G. Mathematical analysis of running performanceand world running records. J. Appl. Physiol. 67, 453-465, 1989.
14. Prampero di, P. E. Energetics of muscular exercise. Rev. Physiol. Biochem.Pharmacol. 89, 143-222, 1981.
15. Prampero di, P.E. The energy cost of human locomotion on land and inwater. Int. J. Sports Med. 7, 55-72, 1986.
16. Prampero di, P.E., Capelli, C., Pagliaro, P. et al Energetics of best perfor-mances in middle-distance running. J. Appl. Physiol. 74, 2318-2324, 1993.
17. Svedenhag, J. and Sjödin, B. Physical characteristics of elite male runners inand off-season. Can. J. Appl. Sport Sci. 10, 127-133, 1985.
18. Tabata, I., Nishimura, K., Kouzaki, M. et al Effects of moderate---intensityendurance and high---intensity intermittent training on anaerobic capacityand VO
2-max. J. Appl. Physiol. 28, 1327-1330, 1996.
19. Wilkie, D. R. Equations describing power input by humans as a function ofduration of exercise; In Exercise Bioenergetics and Gas Exchange, P. Cerretelliand B. J. Whipp eds, Elsevier, Amsterdam, The Netherlands, pp 75-80, 1980.

RUNNING & SCIENCE
84
85
RUNNING ECONOMY
Running Economy
Jan Svedenhag
SynopsisRunning economy is one important factor determining runningcapacity in endurance events, but it should be expressed in a pro-per way, preferably in ml•kg-O.75•min-1. Given test conditions arewell controlled, running economy seems to be a quite robustmeasure. It may, however, change within a single exercise bout orwith long-term training. Of the many factors that may determinerunning economy, the ability to store/use elastic energy in therunning musculature and tendons may be especially important.
IntroductionThe increased interest during the last decades in endurance trainingand especially long-distance running has created unique opportunitiesfor more thorough studies on the physiology of racing performancesin endurance events. This has led to a better understanding of the fac-tors determining endurance capacity. One such important factor is thesteady-state submaximal oxygen uptake at given running velocities,i.e. the running economy.
In the present chapter, different aspects of running economy will bepresented. But before we turn to discuss these matters any further, letme first give a background on how oxygen uptake during running isthought to be related to performance in human subjects.

RUNNING & SCIENCE
86
Oxygen uptake related to endurancerunning performance
Maximal oxygen uptake
Since the 1930s it has been known that the maximal oxygen uptake(VO2
-max) is exceptionally high in elite endurance event athletes. Thesehigh values are thought to be due to a combination of training effort andnatural endowment. Early studies of elite runners (3, 60) measured valuesof up to 81.5 ml•kg-1•min-1 in champion athletes. This is comparable tothe VO2
-max observed in elite runners of today; for example mean for a5000-10000 m group of Swedish elite runners 78.7 ml•kg-1•min-1 (66).Thus, improvements in competitive results for middle and long distancesseen over the last 50 years cannot be ascribed to a higher VO2
-max oftoday’s elite runners. Although evidently important, the maximal oxygenuptake is only one of the factors that determines success in middle- andlong-distance events. This is illustrated by the large variation in performancebetween marathon runners of equal VO2-max and vice versa (see 61).
Running economy
Since the early 1970s, there has been growing interest in how to utilisebest the maximal aerobic capacity in endurance events. During running,the submaximal oxygen uptake of an individual is directly and linearlyrelated to his/her running velocity. However, at a given running speed,the submaximal oxygen requirement (in ml•kg-1•min-1) may varyconsiderably between subjects (18, 66). The lower the VO2
-submax at agiven running speed the better the running economy. In elite distancerunners with a relatively narrow range in VO2-max, the running economyat different speeds has been found to be significantly correlated (r = 0.79-0.83) with performance at a 10-km race (16). A low VO2-submax (i.e. goodrunning economy) is thus truly beneficial. There is also a surprisingly wide(up to 20%) individual variation in running economy (ml•kg-1•min-1) at 15km•h-1 between marathon runners of the good or elite level (61). Incontrast, the differences may be small or non-existent when groups of eliterunners from different distances are compared (66). Furthermore, in aheterogeneous material, there may be a relatively poor correlation between

87
RUNNING ECONOMY
the VO2-submax during running and endurance performance at a specificdistance, e.g. r = -0.55 in a marathon with a large variation in performance(61). Also, within a narrower performance range (2:30-3:00 Marathon) nosignificant correlation between running economy and performance (r =0.25, n = 16; 24) seems to be typical.
It has been recognised that both VO2-max and running economy has to
be taken into account for the prediction of running performance (52, 66).A given performance at an endurance event, such as running, can also beattained in different ways. Two kinds of elite runners with differentphysiological characteristics can be distinguished. One category of runnersis characterised by a high maximal oxygen uptake (VO2
-max) but a relativelypoor running economy. The second category of runners has an excellentrunning economy, but a relatively low VO2-max. In many cases the overallresult of these differences is a fairly even performance level (53, 66). Boththe accomplished training and various natural abilities may contribute tothese differences in running economy (see below) and in VO2-max. Onlyan outstanding runner may have good or excellent values in both runningeconomy and VO2
-max.
Running economy related to VO2-max
In order to help in accounting for individual differences in running eco-nomy and VO2-max in relation to performance, the fractional utilisationof VO2-max when running at a specific speed (e.g. 15 km•h-1 or 18 km•h-1)can be calculated. The % VO2
-max value calculated in this way has beenfound to be significantly correlated to performance at various long distan-ces. This value can be regarded as an aerobic running capacity of a runner.For instance, in the heterogeneous group of marathon runners mentionedabove (61), the relationship between fractional utilisation of VO2-max at asubmaximal speed of 15 km•h-1 and performance was very good (r = -0.94,n=35). This is because the % VO2
-max value expresses the combined effectsof VO2-max and of running economy, both of which may be separatelyrelated to performance.
In recent years, another way of expressing the combined effect of runningeconomy and VO2-max has gained popularity. This refers to the so calledpredicted velocity at VO2-max (vVO2-max; 43). In this approach the linearrelationship between running speed and submaximal oxygen utilisation ofan individual is extrapolated up to his/her VO2-max value and the running

RUNNING & SCIENCE
88
velocity at which this would be attained is employed. If the running economyextrapolation can be accepted, this may be the preferred way of expression,particularly for middle-distance runners with high racing velocities.
Methodological considerationsVariability
During running at submaximal velocities, steady-state energy condition isthought to be attained in about 3 min (42). Thus, for appropriatemeasurements to be done, each submaximal level should be at least 4min long. With this in mind, several authors have investigated the intra-individual variation in VO2
-submax during running on the treadmill. Most
studies have yielded low coefficients of variation of 1.3 - 4.6% (12, 45, 57,69, 76) under conditions in which time of day, training activity, footwearand treadmill accommodation were controlled to some extent. Of thiserror in running economy in repeated measurements, biological variationis thought to play a large role (57). Furthermore, measurements of runningeconomy seem to be quite robust in that 30 min maximal runs inmoderately to well-trained runners did not produce any significant changesin running economy when tested 1, 2 and 4 days after the run (44, 49).
Scaling factors
BackgroundWhen comparing biologic functions between animals or humans ofdifferent sizes, or within individuals with changing body masses, astrictly dimensional thinking is often enlightening. In these comparisonsstatic and dynamic functions are expressed as being proportional tomultiples of the linear dimension (L). In this way, the effect of bodydimensions on several performance and/or capacity measures can becalculated (4). For example, the oxygen uptake (VO2, l•min-1) has beenshown to be proportional to L2. Therefore, VO2
(l•min-1) should be pro-portional to the body mass raised to the 2/3 power (see also 65)and not as most commonly done to body mass in the first power.
In studying the relationship between resting as well as maximal oxygenuptake and body mass in mammals (from the mouse or dwarf mangoose to

89
RUNNING ECONOMY
the elephant or eland), power values of 0.73 - 0.79 have been found (forreferences see 65). Obviously this differs considerably from body mass tothe 1.0 power but also, albeit less, from the 2/3 power of body mass froma strictly dimensional aspect as outlined above. However, based oncalculated limitations imposed by elastic components of biological material,metabolic rates have been suggested to be proportional to the 3/4 powerof the body mass (40). Another proposed explanation is related to the factthat larger mammals have a greater proportion of proximal leg musclemass in relation to their body mass (5, 51). In line with this, it has beenhypothesised that an individual who possesses a relatively greater amountof his/her body mass in the extremities would thereby have to perform arelatively greater amount of work moving body segments during runningthan an individual with relatively lesser amount of body mass in the legs(50). This latter hypothesis has also been supported by several loadingstudies (see 42).
Regarding power values in human studies, von Döbeln (25) found thatVO2
-max was related to fat-free body mass raised to the power of 0.71 in amixed population (both sexes). From calculations based on a large seriesof tests on adult humans, Bergh et al. (9) found that submaximal and maxi-mal VO2
attained during running were related to the body mass raised tothe powers of 0.76 and 0.71, respectively, and suggested that VO2 duringrunning is better related to kg2/3 or kg3/4 than to kg1. Furthermore, Sjödin &Svedenhag (62) suggested that changes in running economy and VO2
-max(ml•kg-1•min-1) in adolescent boys during growth may be largely due to anoverestimation of the VO2 dependence on body mass during running andfavoured oxygen uptake being expressed per kg3/4. Earlier as well as recentreports of an inverse relationship between body mass and VO2-submax orVO2-max during running (11, 31, 53, 56, 75) provide further support tothis conception. For example, Bourdin et al (11) found correlationcoefficients of r = -0.47_ -0.76 between energy cost of running and bodymass in different groups. Thus, several lines of evidence suggest that oxy-gen uptake determined during submaximal or maximal treadmill runningshould be related to kg0.75 rather than to kg -1.
Implications for the evaluation of the athleteIn Table 1, the effect of body-mass-normalisation on running economyand VO2-max in two athletes of clearly differing body masses are exem-plified. The two elite runners have equal total aerobic running capacity(see above) and similar racing performance levels. Judged from their

RUNNING & SCIENCE
90
Tabl
e 1.
Run
ning
eco
nom
y (V
O2-1
8) a
nd a
erob
ic ru
nnin
g ca
paci
ty (V
O2-1
8/V O
2-max
) at 1
8 km
•h-1 (=
5.0
m•s
-1) t
oget
her
with
max
imal
oxy
gen
upta
ke (V
O2-m
ax) i
n tw
o el
ite ru
nner
s w
ith d
iffer
ent b
ody
mas
s. T
he in
terp
reta
tion
of th
e ru
nnin
gec
onom
y an
d V O
2-max
resu
lts a
re c
lear
ly a
ltere
d if
rela
ted
to k
g-0.7
5 ins
tead
of k
g-1. F
or fu
rther
exp
lana
tion
see
text
.
Bod
y m
ass
V O2-1
8/V O
2-max
V O2-1
8V O
2-max
(kg)
(%)
(ml•k
g-1•m
in-1)
(ml•k
g-0.7
5 •min
-1)
(ml•k
g-1•m
in-1)
(ml•k
g-0.7
5 •min
-1)
Run
ner A
8075
55.5
166
74.0
221
Run
ner B
5075
61.5
164
82.0
218
VO2-submax values (ml•kg-1•min-1)at 18 km•h-1 (VO2
-18), the lighterrunner B is having a clearly higherVO2-18 and thus would be regardedas having a worse running economythan the heavier runner A (Table 1).In evaluating the athletes’ test results,runner B would be advised accor-dingly to concentrate more on trai-ning that improves the running eco-nomy. However, when expressed asml•kg-0.75•min-1, the running econo-my (VO2-max- 18 ) of these tworunners were similar, if anything, withrunner B having a better value.
A reverse pattern is seen forVO2
-max (Table 1). Here the heavier
runner A is having a clearly lesservalue when expressed as ml•kg-1
•min-1; he would accordingly beadvised to concentrate more on trai-ning that may improve the aerobicpower. However, when expressed asml•kg-0.75•min-1, the VO2-max ofthese two runners were similar, ifanything, with runner A having a bet-ter value. Hence, the examplesillustrate well how important it is toexpress properly the oxygen uptakeduring running for correct evaluationof athletes and other test subjects.Also, when comparing groups ofindividuals with differing bodyweights or in longitudinal studies ofsubjects with changing body massesis this new and “body-mass-modi-fied” approach to running economyand VO2
-max of great importance.
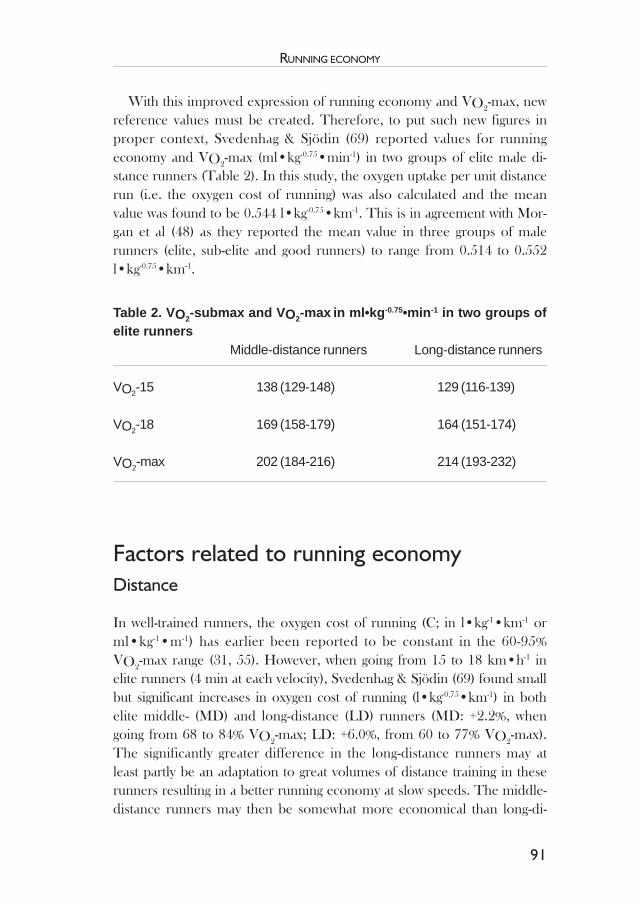
91
RUNNING ECONOMY
With this improved expression of running economy and VO2-max, newreference values must be created. Therefore, to put such new figures inproper context, Svedenhag & Sjödin (69) reported values for runningeconomy and VO2-max (ml•kg-0.75•min-1) in two groups of elite male di-stance runners (Table 2). In this study, the oxygen uptake per unit distancerun (i.e. the oxygen cost of running) was also calculated and the meanvalue was found to be 0.544 l•kg-0.75•km-1. This is in agreement with Mor-gan et al (48) as they reported the mean value in three groups of malerunners (elite, sub-elite and good runners) to range from 0.514 to 0.552l•kg-0.75•km-1.
Factors related to running economyDistance
In well-trained runners, the oxygen cost of running (C; in l•kg-1•km-1 orml•kg-1•m-1) has earlier been reported to be constant in the 60-95%VO2-max range (31, 55). However, when going from 15 to 18 km•h-1 inelite runners (4 min at each velocity), Svedenhag & Sjödin (69) found smallbut significant increases in oxygen cost of running (l•kg-0.75•km-1) in bothelite middle- (MD) and long-distance (LD) runners (MD: +2.2%, whengoing from 68 to 84% VO2
-max; LD: +6.0%, from 60 to 77% VO2-max).
The significantly greater difference in the long-distance runners may atleast partly be an adaptation to great volumes of distance training in theserunners resulting in a better running economy at slow speeds. The middle-distance runners may then be somewhat more economical than long-di-
Table 2. VO2-submax and VO2-max in ml•kg-0.75•min-1 in two groups ofelite runners
Middle-distance runners Long-distance runners
VO2-15 138 (129-148) 129 (116-139)
VO2-18 169 (158-179) 164 (151-174)
VO2-max 202 (184-216) 214 (193-232)

RUNNING & SCIENCE
92
stance runners at higher running velocities, a finding also reported byDaniels & Daniels (22) when comparing running economy (inml•kg-1•min-1, 6 min at each velocity) of 800/1500 m runners (male andfemale) to marathon runners of similar body masses. On the other hand,when running at high velocities with the submaximal oxygen uptake beingclose to VO2
-max, the VO2 obtained may slightly underestimate total energy
demand. This is based on studies using one-legged knee-extensor exercise,in which the anaerobic energy contribution at demanding submaximalexercise may be up to 10% above that produced by aerobic metabolism(8).
Training & tapering
Morgan et al. (48) analysed the oxygen cost of running (both as ml•kg-1•km-
1 and as ml•kg-0.75•km-1) in three groups of trained distance runners (elite,sub-elite and good runners, n= 16-41) and in a group of untrained subjects(n=10). They concluded that 1) trained subjects are more economical thanuntrained subjects, 2) elite runners display better running economycompared to less talented counterparts, and that 3) economical anduneconomical runners can be found in all performance categories.Qualitatively, this is very much in line with findings earlier presented bySjödin & Svedenhag (61) in different groups of marathon runners (elite,good and slow runners; see also above).
The question then arises if these differences in running economyare due just to effects of the performed training per se or to differentinherent capacities in different individuals followed by a selection pro-cess (of those that continue being devoted). Or it may be a combinationof the two possibilities.
A few studies have looked into this in adult subjects. From the results,it would seem that running economy is not readily trainable. Thus,studies on recreational and collegiate runners (21, 73) as well as on untrainedvolunteers (35) have not found any change in running economy after 6-8weeks of running training (long-distance running and for the former twostudies also interval training). On the other hand, a 14 week program ofonce a week anaerobic threshold training (20 min at 4 mmol•l-1 of bloodlactate) added to the normal training program has been shown to increasethe anaerobic threshold in 8 competitive middle- and long-distance runners,an effect which was partially mediated by an improvement in running

93
RUNNING ECONOMY
economy (3%; 63). This is compatible with the improved running economyreported in a world class middle-distance athlete after 9 months of addedtraining (5%, 17) but also with the improved running economy in a largegroup of subjects with different training backgrounds after a 6 monthstraining program of long-distance running (10%; 54). Furthermore, Franchet al. (26) have reported significant improvements in running economy(3.0-3.1%) after 6 weeks of either exhaustive distance training or long-inter-val training 3 times/week in recreational runners, but not after short-inter-val training.
It may take more years of serious training to develop a good runningeconomy than to attain each individual’s maximal level of VO2
-max. In astudy by Svedenhag & Sjödin (67), ten young and well-trained elite runners(belonging to the Swedish National Team) with judged capacity forperformance improvements were followed with regular treadmill tests duringone year (January to next January). Of these, 5 were middle-distance runners(mean age 21.2 yrs) and 5 long-distance runners (22.6 yrs). From thecompetitive season preceding to the one following this test year, the 1500m time improved from 3:45.0 to 3:40.8 min:s, but 800 m time was essentiallyunchanged (1:50) (middle-distance runners), and 5000 m time improvedfrom 14:11 to 13:43 min:s (long-distance runners). The VO2
-max significantlyrose from winter to the competitive summer season (74.2 to 77.4 ml•kg-
1•min-1; +4.5%). To some part (+1.3%) this was due to a slightly lower bodymass during the competitive season. Following winter, the VO2
-max wasalmost back to the starting level. In this study running economy at 15 and20 km/h were determined. A different training response than for VO2-maxwas obtained. The running economy (ml•kg-1•min-1) successively improvedduring the test year and was between 3-4% lower at the last compared tothe first test occasion (specified running velocities). For VO2 at 20 km/h(VO2
-20), this improvement in running economy was significant. Therewas no change in body mass from a year-to-year basis. Furthermore, in alarger group of elite runners who were followed for 22 months, successiveand significant improvements in both VO2
-15 and VO2
-20 were found (67).All runners had been familiarised with and tested on the treadmill at leastonce before commencing the study. Thus, these data suggest a slow butsuccessive improvement in running economy in these elite runners. Atthe same time, the VO2-max was unchanged from year to year (comparisonsfor the same month). This suggests that it may take longer time to improvethe running economy than it takes to reach each individual´s maximalobtainable level of VO2-max (which in itself may take several years of hard

RUNNING & SCIENCE
94
rational training). This could at least partly explain improving performancelevels in runners who already have been training for many years.
Thus, even though conclusive scientific data in this area is lacking, itwould seem that the differences in running economy between individualsas discussed above is both being due to long-term training effects and toinherent capacities in the first place.
Regarding tapering, Houmard et al. (33) found that a 7-day high-intensitytaper improved 5-km performance by 3% and running economy by 6% ina group of 8 highly trained distance runners. The tapering involved an85% reduction in weekly training volume and daily high-intensity intervalworkouts at about 100% VO2
-max. This is in contrast to 1-4 weeks of low-intensity tapering which in earlier studies was unable to improve the runningeconomy (32, 39).
Up/downhill running
The statements above regarding the proper mode of relating VO2 to body
mass during running preferentially relate to the near level running situa-tion. With steep uphill running, during which the body mass is moreactively transported against the gravitation, the oxygen uptake may at leasttheoretically be more closely related to kg1 than to kg0.75. In contrast, duringdownhill running the VO2
-submax is lower than for level running and mayusually not be a limiting factor (36, 59). Instead, biomechanical factors maybe more important as both the maximal speed and maximal stride lengthmay be higher with downhill running at modest negative grades (36). Comingback to power functions, it may thus be seen that the relationship of VO2
to body mass may be altered in a rather complicated manner duringdifferent parts of a hilly terrain or road racing course. Consequently, thiscould partly explain the smaller but nonetheless clear performancefluctuations which are known to occur between athletes within such races.
Temperature
The effects of environmental temperature on exercise VO2-submax (notproperly studied on just running economy) is a complex matter and withdifferent results in the literature. Principally, there may be two opposingeffects with an increased core temperature causing 1) increased energy

95
RUNNING ECONOMY
requirements for peripheral circulation, increased sweat gland activity andhyperventilation as well as 2) possible increases in mechanical and/ormetabolic efficiency in the musculature (for ref, see 7, 42). It is thereforepossible that VO2-submax is reduced slightly as muscle temperature ismoderately increased but eventually increases as the mechanisms involvedin heat dissipation are activated to a greater extent, as discussed by Bailey& Pate (7). It is also conceivable that the running economy may improvewith heat acclimatisation due to the corresponding increase in plasmavolume.
Air & wind
Obviously, running economy is dependent on air resistance and on wind.On a calm day, the added
VO2
-max due to the air resistance should increase
with the cube of the running velocity (58). The actual figures differ somewhatbut it has been calculated that the air resistance amounts to 8% of the totalenergy cost of running when performing a 5000 m run (58) or to 4 and 2%of the VO2-max in middle-distance and marathon running, respectively(23). That may explain why only the superior runner may choose an offen-sive tactic of being a front runner for a whole race and still can be expectedto succeed in winning.
Fatigue
As indicated earlier in the variability section, 30 min maximal runs (levelrunning) in at least moderately trained runners have not been shown toproduce any significant changes in running economy when tested 1, 2 and4 days after the run (44, 49). Thus, fatigue in the days following a singleexhaustive run may not include changes in the running economy. On theother hand, there are now several studies that have indicated an impairedrunning economy within a single long exercise bout (28, 29, 79). Xu &Montgomery (79) studied the running economy at 3.13 and 3.80 m•s-1 in14 long-distance runners before and after 90-min runs at either 65 or 80%of VO2-max. They found increases in VO2-submax expressed both asl•min-1 and ml•kg-1•min-1 after the 90-min runs (recalculated asml•kg-0.75•min-1 the increase was 3.7-4.3% after the 65% VO2
-max run and5.7-7.8% after the 80% VO2-max run). Guezennec et al. (28) compared the

RUNNING & SCIENCE
96
running economy at race pace in 11 athletes during a 10-km run in a triathlon(i.e. after 1.5-km swimming and 40-km cycling) with the running economyduring a single 10-km control run at the same pace. The running economywas significantly impaired in the 10-km triathlon run with a 7% higherVO2
-submax (in ml•kg-1•min-1). Due to a greater loss in body mass during
the triathlon, the corresponding difference in ml•kg-0.75•min-1 was 6%. Lastly,Hausswirth et al. (29) studied 7 athletes performing 3 experimental trials; a2h 15 min triathlon, a 2 h 15 min marathon where the athletes ran the last45 min at the same speed as during the triathlon run, and a 45 min isolatedrun at the same speed. They found higher energy cost of running duringmarathon than during the triathlon run (3.2%) (equal body mass losses inthese two exercise modes). The energy cost of running during the latterpart of the marathon and during the triathlon was also clearly higher thanduring the isolated run (about 12% higher cost during the marathon).
The reason for this fatigue effect on the running economy is likelymultifactorial. For example, altered biomechanical factors (such as adecreased stride length), increased motor unit recruitment due to gly-cogen depletion and/or muscle damage, and increased ventilation couldall have contributed to the increase in VO2-submax in the studies citedabove. Also metabolic events have been suggested to play a role, such asan increased fat oxidation with a resultant supposed increase in VO2.However, in one study by Morgan et al. (44), the respiratory exchangeratio was slightly but significantly lowered 1 and 2 days after an exhaustiverun without any change in running economy. The role of increased fatoxidation for VO2-submax thus does not seem to be a major factor in thisregard.
Ventilation
Ventilation may be speculated to influence running economy. Thus, thework of ventilation has been found to constitute to up to 6-7% of the totaloxygen cost of exercise (41). Furthermore, voluntary hyperpnoea at rest,which increases VE from 70 to 100 l•min-1, has been found to enhanceVO2
by 122 ml•min-1 (15). If training is able to decrease the work ofbreathing at a specific running velocity, for instance due to a decreasedmuscle lactic acid production, this could at least theoretically contributeto an improved running economy (7). Franch et al. (26) also reported acorrelation between improvements in running economy and reductions

97
RUNNING ECONOMY
in pulmonary ventilation after an intense run training program inrecreational runners. However, more studies are needed before any goodestimations on the importance of ventilation can be made.
Step length
With increasing running velocity, there is both an increased step lengthand an increased step frequency. In elite runners, at least in the 15-18km•h-1 velocity range, the increase in step length may be much morepronounced (15-16%) than the corresponding increase in step frequency(3-4%; 69). For a given running velocity, there is for every individual aU-shaped relationship between step length and running economy andthus an optimal combination range of step length/step frequency atwhich the
V.
O2-submax is at its lowest (34). This optimal combination
range, which does not seem to be readily altered with short-termtraining (6), is mostly self-selected by the runner (13, 34). However,uneconomical freely chosen step lengths in recreational runners havealso been shown (47). This self-selection of step lengths may at leastpartly be related to elastic components (see below) since Taylor (70)has indicated that the speeds and step frequencies selected by animals(and presumably humans) during locomotion are those where storage andrecovery of elastic energy are maximised.
In contrast, across different individuals, there is no relationship be-tween step length and running economy (at 3.6 m•s-1; 74), not evenwhen expressed as ml•kg-0.75•min-1 (69). Anthropometric variables maynot at all (recreational runners; 14) or to a very small extent contributeto the chosen step length (positive relationship of step length to bodymass and stature, and negative relationship to the leg length/staturequotient in elite runners; 69).
Inflexibility/elastic components
Training of flexibility is often advocated in athletes as a means to reducethe risk of injury and to improve performance and/or recovery. Re-garding the effect on performance, this may be a truth with modification ashas been indicated in some studies. Thus, Gleim et al. (27) studied 11measures of trunk and lower limb flexibility in a mixed group of 100 subjects

RUNNING & SCIENCE
98
and related the combined score of these measures to the economy of walkingand running (VO2
-submax; in ml•kg-1•min-1). They found that the ”tightest”third had significantly lower O2
-submax than the ”loosest” third, over
velocities from 1.79 to 3.13 m•s-1. Craib et al. (19) studied the associationbetween nine measures of limb and trunk flexibility and running economyat 4.13 m•s-1 (in ml•kg-1•min-1) in 19 well-trained male sub-elite distancerunners who were properly accommodated to treadmill running. The resultssuggested that inflexibility in hip (standing external hip rotation) and calfregions (dorsiflexion) of the musculoskeletal system was associated with animproved running economy (R2 when both factors were included was 0.47).This may be in line with the findings of Williams & Cavanagh (74) whonoted that runners with the poorest running economy had a significantlyless mechanical energy transfer between the legs and the trunk when runningat 3.6 m•s-1 than runners with better running economy. Also, Heise et al.(30) found a trend towards greater leg muscle coactivation during the stancephase in more economical runners. This was thought to be directly relatedto joint stiffness, which in turn may be translated to a greater elastic energyreturn from muscle and tendons contributing to the propulsive stage ofthe stance phase.
It may thus be hypothesised that besides the observable mechanicalwork (see below), the elastic components in the running musculature maybe of importance (10). As a further example, a 12-week period of additionalhill training with “bounce” running was found to improve the runningeconomy in a group of 11 well-trained marathon runners, an effect thatwas suggested to be related to the development of elastic components withincreased storage and return of elastic energy (68). Another interestingstudy in this context is that of Westblad et al. (72). They had nine maleelite 800-5000 m runners completing a test of 100 repetitive maximaleccentric and 100 concentric knee extensor actions (at 90o•s-1) were peaktorque and work were measured.
This was compared with the running economy (in ml•kg-0.75•min-1 aswell as ml•kg-1•min-1) at three different submaximal running velocities.Eccentric total work was found to be inversely related to VO2-submax at allthree running velocities investigated, with R2 values for ml•kg-0.75•min-1
ranging between 0.48 to 0.59. Thus, the greater eccentric total work in thequadriceps femoris muscle, the better the running economy. Although itis a small study, this effect of the eccentric total work capacity may bespeculated to be due to a better ability to store elastic energy.
99
RUNNING ECONOMY
Thus, from several different studies with different approaches it seemsthat the elastic components in the running musculature and tendonsmay be of great importance for the running economy.
Other biomechanical factors
The running economy may be related to the sum of several individualfactors related primarily to body structure or running mechanics. Thus,in an extensive investigation by Williams & Cavanagh (74) of 31recreational runners (running speed 3.6 m•s-1), the most economicalgroup of runners were found to have lower force peak at heel strike,greater shank angle with vertical at foot strike (i.e. a more rearfootstriking pattern), smaller maximal plantar flexion angle following thetoe off, greater forward trunk lean, and lower minimum velocity of apoint on the knee during foot contact. A multiple linear regressionmodel could account for 54% of the variation in aerobic demand. Inanother study in 14 elite female runners (75; running speed 3.83 and4.13 m•s-1) significant correlations were found between runningeconomy and angle at maximal knee extension near toe-off, maximal kneeflexion velocity, maximal dorsiflexion angle and maximal dorsiflexionvelocity. Heise et al. (30) studied nine well-trained runners with EMGcharacteristics of bi-articular leg muscles at a running velocity of 4.13 m•s-
1. They found runners with better running economy to have a significantlyearlier onset of m. rectus femoris activation and a shorter coactivation ofhamstring - m. gastrocnemius during the swing phase.
In reviewing the field, Anderson (1) concluded that several biomecha-nical factors and anthropometric dimensions may be related to a bet-ter running economy, including those listed in Table 3. However,relationships have generally been found to be weak and to some extentinconsistent (e.g. 37). Furthermore, the relative importance of specificfactors is very difficult to study/quantitate; the sum of many factorsmay on the other hand be difficult to interpret. It may well be that eachrunner has adapted rather optimally to his/her specific/unique combinationof biomechanical set-up. Making inter-individual comparisons, especiallywhen many biomechanical factors are added together, could thereforepotentially be misleading. Earlier studies have also expressed runningeconomy as ml•kg-1•min-1 which, according to the discussion above, maynot be the proper way to do. Further studies are therefore needed.

RUNNING & SCIENCE
100
GenderIn a substantial part of studies comparing running economy (ml•kg-1 •min-
1) between the sexes, better values in men than in women have beenreported (46). Biomechanical gender differences have been put forward asa possible cause of such a difference in running economy. However, thedifference in running economy may to a great extent, or perhaps evenfully, be explained by body mass differences between the sexes. Thus, thegreater body masses of male runners will in a relatively way decrease
O2-submax expressed as ml•kg-1•min-1, but not as ml•kg-0.75•min-1. Infact, when looking at performance-matched male and female marathonrunners, the women were actually found to have a better running economy(in ml•kg-0.75•min-1) than the men (31). In terms of performance, this partlycompensated for the lower VO2
-max (also in ml•kg-0.75•min-1) in this groupof female runners.
Table 3. Some factors related to better running economy in runners.From 1.
Biomechanical factors• Low vertical oscillation of body centre of mass• More acute knee angle during swing• Less range of motion but greater angular velocity of plantar flexion during
toe-off• Arm motion of smaller amplitude• Low peak ground reaction forces• Faster rotation of shoulders in the transverse plane• Greater angular excursion of the hips and shoulders about the polar axis in
the transverse plane.
Anthropometric dimensions• Average or slightly smaller height for men but slightly greater than average
height for women• High ponderal index and ectomorphic or ectomesomorphic physique• Low percentage body fat• Leg morphology which distributes mass closer to the hip joint• Narrow pelvis• Smaller than average feet.

101
RUNNING ECONOMY
Another gender aspect is what happens to the running economy duringthe menstrual cycle phase. Williams & Krahenbuhl (78) studied eighteumenorrheic moderately-trained female runners while running at treadmillspeeds initially corresponding to 55 and 80% of VO2-max. They foundrunning economy at 80% VO2
-max to be significantly poorer (higherVO2
-submax) during the mid-luteal than during the early follicular phase,while no significant difference was seen at 55% VO2-max. This effect wasthought to be independent of changes in ventilatory drive or mood state.
Age
For more than 40 years it has been known that with increasing age andbody mass during growth, both VO2
-submax and VO2-max (in
ml•kg-1•min-1) will decrease (2). The reasons for this were earlier not wellunderstood. Regarding the VO2-submax, several factors have been suggestedto explain the lower running economy in children, including higher stridefrequency, immature running biomechanics, lesser utilisation of muscleelastic energy, a different substrate utilisation and less efficient ventilation.However, calculations made in the above mentioned longitudinal study ofSjödin & Svedenhag (62) favoured oxygen uptake being related to kg-0.75
instead of kg-1 and in this case the VO2-submax will remain unchanged inboth the untrained and trained boys during growth. For the untrainedboys also the VO2-max will be unchanged but in trained boys it will increase(as would be expected in adults). Further support for the use of body masspower functions of 0.67 – 0.80 has come from studies of peak VO2
indifferent groups of prepubertal, circumpubertal and adult males andfemales (71).
Psychological/ mood state
The psychological state may be related to the running economy, at least inan indirect way. Williams et al. (77) studied ten runners five times a weekfor 4 weeks and correlated the running economy to the total score anddifferent measures of the Profile of Mood States (POMS). They found norelations in the whole group of runners but a significant within-subjectcorrelation of r=0.88, mainly related to the tension score. Thus, in theweeks with lower scores, there was a better running economy. In reviewing

RUNNING & SCIENCE
102
the few studies done at that time, Crews (20) concluded that relaxationtechniques, especially stress management techniques, appear to improverunning economy but that biofeedback procedures that may change heartrate or ventilatory responses do not change running economy. Since thensome more studies have been added. When investigating 18 competitivemale distance runners at 4.13 m•s-1, Martin et al. (38) found the mosteconomical runners to be the ones that habitually directed attention inwards.It was hypothesised that this could reduce anxiety which, in turn, couldcontribute to a better running economy. Lastly, Smith et al. (64) studied36 distance runners and found that the most economical runners reportedless dissociation use and more use of relaxation than did the leasteconomical runners. While all these findings are intriguing, longitu-dinal studies aiming at changing psychological strategies duringrunning and their effect on running economy are still missing.
Miscellaneous
Other factors such as muscle strength in the running musculature and torso(for more effective muscle stabilisation during running) and factors relatedto muscle energy production and oxidative capacity may, at least in theory,also contribute to the described variation in running economy.
Concluding remarksRunning economy is obviously one important factor determining runningcapacity in endurance events, but it should be expressed in a proper way,i.e. in ml•kg-0.75•min-1. Given test conditions are well controlled, runningeconomy seems to be a quite robust measure. It may, however, changewithin a single exercise bout or with long-term training. Of the many fac-tors that may determine running economy, the ability to store/use elasticenergy in the running musculature and tendons may be especially important.
103
RUNNING ECONOMY
References
1. Anderson T. Biomechanics and running economy. Sports Med. 22:76-89, 1996.2. Åstrand P-O. Experimental studies of physical working capacity in relation to sex
and age. Thesis, Munksgaard, Copenhagen. 1952.3. Åstrand P-O. New records in human power. Nature 176: 922-923, 1955.4. Åstrand P-O, Rodahl K. Textbook of Work Physiology. Chapter 9: Body
dimensions and muscular exercise. New York, McGraw-Hill, 1986.5. Alexander RM, Jayes AS, Maloiy GMO, Wathuta EM. Allometry of the leg
muscles of mammals. J Zool Lond 194: 539-552, 1981.6. Bailey SP, Messier SP. Variations in stride length and running economy in
male novice runners subsequent to a seven-week training program. Int JSports Med 12: 299-304, 1991.
7. Bailey SP, Pate RR. Feasibility of improving running economy. Sports Med12:228-236, 1991.
8. Bangsbo J, Gollnick P D, Graham T E, Juel C, Kiens B, Mizuno M, Saltin B.Anaerobic energy production and O
2 deficit-debt relationship during
exhaustive exercise in humans. J Physiol 422: 539-559, 1990.9. Bergh U, Sjödin B, Forsberg A, Svedenhag J. The relationship between body
mass and oxygen uptake during running in humans. Med Sci Sports Exerc 23:205-211, 1991.
10. Bosco G, Montanari R, Ribacchi P et al. Relationship between the efficiency ofmuscular work during jumping and the energetics or running. Eur J Appl Physiol56: 138-143, 1987.
11. Bourdin M, Pastene J, Germain M, Lacour JR. Influence of training, sex,age and body mass on the energy cost of running. Eur J Appl Physiol 66: 439-444, 1993.
12. Brisswalter J, Legros P. Daily stability in energy cost of running, respiratoryparameters and stride rate among well-trained middle distance runners. IntJ Sports Med 15:238-241, 1994.
13. Cavanagh PR, Williams KR. The effect of stride length variation on oxy-gen uptake during distance running. Med Sci Sports Exerc 14:30-35, 1982.
14. Cavanagh PR, Kram R. Stride length in distance running: velocity, bodydimensions, and added mass effects. Med Sci Sports Exerc 21:467-479, 1989.
15. Coast JR, Krause KM. Relationship of oxygen consumption and cardiacoutput to work of breathing. Med Sci Sports Exerc 25:335-340, 1993.
16. Conley DL, Krahenbuhl GS. Running economy and distance running per-formance of highly trained athletes. Med Sci Sports Exerc 12: 357-360, 1980.
17. Conley DL, Krahenbuhl GS, Burkett LN, Millar AL. Following Steve Scott:Physiological changes accompanying training. Physician and Sports Med 12:103-106, 1984.
18. Costill DL, Thomason H, Roberts E. Fractional utilization of the aerobiccapacity during distance running. Med Sci Sports 5: 248-252, 1973.

RUNNING & SCIENCE
104
19. Craib MW, Mitchell VA, Fields KB, Cooper TR, Hopewell R, Morgan DW.The association between flexibility and running economy in sub-elite male di-stance runners. Med Sci Sports Exerc 28:737-743, 1996.
20. Crews DJ. Psychological state and running economy. Med Sci Sports Exerc24:475-482, 1992.
21. Daniels JT, Yarbrough RA, Foster C. Changes in O2-max and running per-formance with training. Eur J Appl Physiol 39:249-254, 1978.
22. Daniels J, Daniels N. Running economy of elite male and elite female runners.Med Sci Sports Exerc 24:483-489, 1992.
23. Davies CTM. Effects of wind assistance and resistance on the forward mo-tion of a runner. J Appl Physiol 48:702-709, 1980.
24. Davies CTM, Thompson MW. Aerobic performance of female marathonand male ultramarathon athletes. Eur J Appl Physiol 41:233-245, 1979.
25. von Döbeln W. Maximal oxygen intake, body size, and total hemoglobin innormal man. Acta Physiol Scand 38: 193-199, 1956.
26. Franch J, Madsen K, Djurhuus MS, Pedersen PK. Improved running economyfollowing intensified training correlates with reduced ventilatory demands.Med Sci Sports Exerc 30:1250-1256, 1998.
27. Gleim GW, Stachenfeld NS, Nicholas JA. The influence of flexibility onthe economy of walking and jogging. J Orthopaedic Res 8:814-823, 1990.
28. Guezennec CY, Vallier JM, Bigard AX, Durey A. Increase in energy cost ofrunning at the end of a triathlon. Eur J Appl Physiol 73:440-445, 1996.
29. Hausswirth C, Bigard AX, Guezennec CY. Relationships between runningmechanics and energy cost of running at the end of a triathlon and a marathon.Int J Sports Med 18:330-339, 1997.
30. Heise GD, Morgan DW, Hough H, Craib M. Relationships between runningeconomy and temporal EMG characteristics of bi-articular leg muscles. IntJ Sports Med 17:128-133, 1996.
31. Helgerud J. Maximal oxygen uptake, anaerobic threshold and runningeconomy in women and men with similar performances level in marathons.Eur J Appl Physiol 68: 155-161, 1994.
32. Houmard JA, Kirwan JP, Flynn MG, Mitchell JB. Effects of reduced trainingon submaximal and maximal running responses. In J Sports Med 10:30-33,1989.
33. Houmard JA, Scott BK, Justice CL, Chenier TC. The effects of taper onperformance in distance runners. Med Sci Sports Exerc 26:624-631, 1994.
34. Högberg P. How do stride length and stride frequency influence the energy-output during running? Arbeitsphysiologie 14:437-441, 1952.
35. Lake MJ, Cavanagh PR. Six weeks of training does not change running mechanicsor improve running economy. Med Sci Sports Exerc 28:860-869, 1996.
36. Liefeldt G, Noakes TD, Dennis SC. Oxygen delivery does not limit peak runningspeed during incremental downhill running to exhaustion. Eur J Appl Physiol64:493-496, 1992.

105
RUNNING ECONOMY
37. Martin PE, Heise GD, Morgan DW. Interrelationships between mechanical power,energy transfers, and walking and running economy. Med Sci Sports Exerc 25:508-515, 1993.
38. Martin JJ, Craib M, Mitchell V. The relationships of anxiety and self-attention torunning economy in competitive male distance runners. J Sports Sci 13:371-376,1995.
39. McConell GK, Costill DL, Widrick JJ, Hickey MS, Tanaka H, Gastin PB.Reduced training volume and intensity maintain aerobic capacity but notperformance in distance runners. Int J Sports Med 14:33-37, 1993.
40. McMahon T. Size and shape in biology. Elastic criteria impose limits onbiological proportions, and consequently on metabolic rates. Science 174:1201-1204, 1973.
41. Milic-Emili G, Petit JM, Deroanne R. Mechanical work of breathing duringexercise in trained and untrained subjects. J Appl Physiol 17:43-46, 1962.
42. Morgan DW, Martin PE, Krahenbuhl GS. Factors affecting running econo-my. Sports Med 7:310-330, 1989a.
43. Morgan DW, Baldini FD, Martin PE, Kohrt WM. Ten kilometer performanceand predicted velocity at VO2-max among well-trained male runners. Med SciSports Exerc 21: 78-83, 1989b.
44. Morgan DW, Martin PE, Baldini FD, Krahenbuhl GS. Effects of a prolongedmaximal run on running economy and running mechanics. Med Sci SportsExerc 22:834-840, 1990.
45. Morgan DW, Martin PE, Krahenbuhl GS, Baldini FD. Variability in runningeconomy and mechanics among trained male runners. Med Sci Sports Exerc23:378-383, 1991.
46. Morgan DW, Craib M. Physiological aspects of running economy. Med Sci SportsExerc 24: 456-461, 1992.
47. Morgan D, Martin P, Craib M, Caruso C, Clifton R, Hopewell R. Effect ofstep length optimization on the aerobic demand of running. J Appl Physiol77: 245-251, 1994.
48. Morgan DW, Bransford DR, Costill DL, Daniels JT, Howley ET, KrahenbuhlGS. Variation in the aerobic demand of running among trained and untrainedsubjects. Med Sci Sports Exerc 27:404-409, 1995.
49. Morgan DW, Strohmeyer HS, Daniels JT, Beaudoin CC, Craib MW, Bor-den RA, Greer PJ, Burleson CL. Short-term changes in 10-km race paceaerobic demand and gait mechanics following a bout of high-intensity di-stance running. Eur J Appl Physiol 73:267-272, 1996.
50. Myers M, Steudel K. Effect of limb mass and its distribution on the energeticcost of running. J Exp Biol 116:363-373, 1985.
51. Nevill AM. The need to scale for differences in body size and mass: anexplanation of Kleiber’s 0.75 mass exponent. J Appl Physiol 77: 2870-2873,1994.
52. Noakes TD. Implications of exercise testing for prediction of athletic performance:a contemporary perspective. Med Sci Sports Exerc 20: 319-330,1988.
RUNNING & SCIENCE
106
53. Padilla S, Bourdin M, Barthélémy JC, Lacour JR. Physiological correlates of middle-distance running performance. A comparative study between men and women.Eur J Appl Physiol 65: 561-566, 1992.
54. Patton JF, Vogel JA. Cross-sectional and longitudinal evaluations of an endurancetraining program. Med Sci Sports 9:100-103, 1977.
55. di Prampero PE, Atchou G, Brückner J-C, Moia C. The energetics of endurancerunning. Eur J Appl Physiol 55: 259-266, 1986.
56. Pate RR, Macera CA, Bailey SP, Bartoli WP, Power KE. Physiological,anthropometric and training correlates of running economy. Med Sci SportsExerc 24: 1128-1133, 1992.
57. Pereira MA, Freedson PS. Intraindividual variation of running economy inhighly trained and moderately trained males. Int J Sports Med 18:118-124,1997.
58. Pugh LGCE. Oxygen intake in track and treadmill running with observationson the effect of air resistance. J Physiol 207:823-835, 1970.
59. Robergs RA, Wagner DR, Skemp KM. Oxygen consumption and energyexpenditure of level versus downhill running. J Sports Med Phys Fitness 37:168-174, 1997.
60. Robinson S, Edwards HT, Dill DB. New records in human power. Science83: 409-410, 1937.
61. Sjödin B, Svedenhag J. Applied physiology of marathon running. Sports Med2: 83-99, 1985.
62. Sjödin B, Svedenhag J. Oxygen uptake during running as related to bodymass in circumpubertal boys: a longitudinal study. Eur J Appl Physiol 65:150-157, 1992.
63. Sjödin B, Jacobs I, Svedenhag J. Changes in onset of blood lactate accumulation(OBLA) and muscle enzymes after training at OBLA. Eur J Appl Physiol 49:45-57,1982.
64. Smith AL, Gill DL, Crews DJ, Hopewell R, Morgan DW. Attentional strategyuse by experienced distance runners: physiological and psychological effects.Res Quart Exer Sport 66:142-150, 1995.
65. Svedenhag J. Maximal and submaximal oxygen uptake during running:how should body mass be accounted for? Scand J Med Sci Sports 5:175-180,1995.
66. Svedenhag J, Sjödin B. Maximal and submaximal oxygen uptakes and bloodlactate levels in elite male middle- and long-distance runners. Int J SportsMed 5: 255-261, 1984.
67. Svedenhag J, Sjödin B. Physiological characteristics of elite male runners inand off season. Can J Appl Spt Sci 10: 127-133, 1985.
68. Svedenhag J. Endurance conditioning. In: Endurance in Sport. Vol II of theEncyclopaedia of Sports Medicine, an IOC. Medical Commission Publication, (eds.J. Shephard & P-O Åstrand). Blackwell Scientific Publications, Oxford 1992:pp 290-297.
69. Svedenhag J, Sjödin B. Body-mass-modified running economy and step length inelite male middle- and long-distance runners. Int J Sports Med 15: 305-310, 1994.

107
RUNNING ECONOMY
70.Taylor R. Force development during sustained locomotion: a determinant of gait,speed and metabolic power. J Exp Biol 115:253-262, 1985.
71. Welsman JR, Armstrong N, Nevill AM, Winter EM, Kirby BJ. Scaling peak VO2
for differences in body size. Med Sci Sports Exerc 28:259-265, 1996.72. Westblad P, Svedenhag J, Rolf C. The validity of isokinetic knee extensor endurance
measurements with reference to treadmill running capacities. Int J Sports Med17:134-139, 1996.
73. Wilcox AR, Bulbulian R. Changes in running economy relative to
V.
O2-max
during a cross-country season. J Sports Med 24:321-326, 1984.74. Williams KR, Cavanagh PR. Relationship between distande running
mechanics, running economy, and performance. J Appl Physiol 63: 1236-1245, 1987.
75. Williams KR, Cavanagh PR, Ziff JL. Biomechanical studies of elite femaledistance runners. Int J Sports Med 8: S107-S118, 1987.
76. Williams TJ, Krahenbuhl GS, Morgan DW. Daily variation in runningeconomy of moderately trained male runners. Med Sci Sports Exerc 23:944-948, 1991a.
77. Williams TJ, Krahenbuhl GS, Morgan DW. Mood state and running economyin moderately trained male runners. Med Sci Sports Exerc 23:727-731, 1991b.
78. Williams TJ, Krahenbuhl GS. Menstrual cycle phase and running economy.Med Sci Sports Exerc 29:1609-1618, 1997.
79. Xu F, Montgomery DL. Effect of prolonged exercise at 65 and 80% of VO2-max
on running economy. Int J Sports Med 16:309-315, 1995.

RUNNING & SCIENCE
108

109
PREVENTION OF OVERUSE INJURIES IN RUNNING
Prevention of overuseinjuries in running
Albert Gollhofer
SynopsisLarge epidemiological surveys have indicated that in running thevast majority of overuse injuries is related to the lower limb. Inliterature most of the problems occurring with overuse injuries inrunning are attributed to either intrinsic or extrinsic factors. In a„top-down-approach“ a brief overview about the most potentialrisk factors and their possible prophylactic counteracts is given. Inorder to motivate the physiological implication of the entire systemin a „bottom-up-approach“ the interaction of man-shoe-surfaceis described.
IntroductionDuring the 1970’s and 80’s running and jogging has developed tobecome one of the most popular sports disciplines in the world. In linewith this trend the number of injuries has increased. Despite the factthat running is considered to be beneficial in lowering the main riskfactors of cardio-vascular disease (7), obesity and hypertension (3) thenumber of orthopaedic problems associated with running gives rise tothe question whether or not this type of physical activity is still recom-mendable or even harmful.
An understanding of the mechanisms through which the mostfrequent injuries are caused is essential in the evaluation of preventiveprovisions. Studying the aetiology of running injuries leads to adequate

RUNNING & SCIENCE
110
knowledge to reduce the major and most common risk factors.However, with respect to the literature already the attempt to definethe basic terms – “overuse”, “prevention”, and even “running” and“injury” –produces more questions than answers.
Prevention cannot be related to one single, monocausal aspect.Prevention must consider the entire complex of the kinetic chain. Thehistory of individual predisposition has to be recognised and preventionneeds to be based on a physical examination of the athletes or partici-pants (8). There is an ongoing extensive debate about the validationcriteria of such examinations. Static versus dynamic testing, treadmillversus free running, inter– versus intraindividual comparison, all thesemethodological aspects are debated in the literature with respect totheir apparent advantage.
Overuse is not a unique occurrence. Overuse appears largely dif-ferent in highly trained athletes and in occasionally jogging overweights.Overuse injuries may be characterised as a chronic dysfunction as theresult of a cumulative microtraumatic loading of the tissue; or theymay happen as an acute type, especially in high intensity running.
A further aspect in the existing discrepancy can be seen in the variousdefinitions of “injury”. Regarding the epidemiological reports in theliterature running injuries are summarised as those “serious enoughfor training reduction” or for “training stop” or “work time loss” or“even pain for more than 10 days”. Moreover there exits a highinterrelation between the location, the severity of injury and the runnersexperience (15).
The final problem is the definition of a “runner”. In the literaturerunning injuries are assigned to each type of problem occurring duringlocomotion. A runner may be an orienteer, a marathon runner, a sprin-ter or even an elite hurdle specialist, he may be experienced or not,young or old.
The purpose of this contribution is to describe potential preventivemeasures that are effective enough to reduce or avoid overuse injuriesin running. On the basis of the published material, two strategies canbe distinguished:a) in a “top-down approach” the incidence of injuries is examined
statistically, reflecting the potential risk of the runner, the runningand the environmental situation (13).
b) in a “bottom-up model” the physiological implication of an individualrunner is reflected in the interaction of the man, the shoe and thesurface (5).

111
PREVENTION OF OVERUSE INJURIES IN RUNNING
Epidemiology – incidence of injuriesLarge epidemiological surveys about running injuries have been pub-lished in the last decade.
Analysing a total number of 15212 injuries Steinbrück (20) demon-strated that the lower extremity is the most injured body area in sports.More than two third of all injuries are injuries of the knee or anklejoint (Figure 1).
A direct comparison of the incidence of injuries in running and inball sports from Segesser (19) reveals that in running, the tendineousstructures are much more affected than in ball sports. This high rate,observed especially in the lower leg, is a result mainly due to Achillestendon problems. Based on a statistical survey from 1903 injuries fromrunning and from 1664 injuries from ballsports, the shank and kneeproblems due to ligamentous and tendineous deficits or obvious.Whereas in ball sport injuries the tendon injuries of the shank area arerather rare this source of incidence is most frequent in running.
Figure 1. Distributed frequency of sport injuries. Data from 20.

RUNNING & SCIENCE
112
Results from two Dutch studies suggested that the total risk in runningis between 3.5 and 5.5 incidences per 1000h of running (4, 16). Thus,on the basis of the Marti et al (15) study running injuries occur about 2-2,5 times less frequent than do injuries in all others sports, and evenabout 6 times less than ski injuries.
Approaches – Aetiology of injuriesIt has been claimed (13) that the majority of overuse injuries are causedby intrinsic (age, gender, body alignment, muscular system, etc.) andextrinsic (footware, training, heat, cold, etc.) factors. The multifactorialcausation is analysed statistically based on the assumptions that intrinsic(i.e. primary and secondary) dysfunctions and extrinsic (i.e. environ-mental) factors are both important.
In a significant contribution van Mechelen (16) reviewed the currentliterature to analyse whether the runner – the running or the environ-ment have potential influence to explain overuse injuries. By means ofmultiple analysis of variance, factor regression and other statisticalapproaches, the assessment of the risk potential of those intrinsic factorshas been investigated. In order to discuss the relative importance aspotential source of injury a short summary is given in the followingchapters for the most important factors.
The runner
Depending on methodological peculiarities and on the statistical modelthere are reports demonstrating an increasing and a decreasing effectof age on the injury rate. If age is analysed in a multiple step-wiseregression, however, it turns out that age is a rather independent fac-tor. Neither age alone nor age associated with experience or withweekly running distance is associated with injury (16).
With respect to running Macintyre et al (14) showed that the mostfrequent injury in running is related to the knee joint complex,independent of the gender of the subjects.
Gender per se does not represent an important risk factor. It couldbe hypothesised that body weight has an considerable impact on theincidence rate. If body mass is normalised with body height the body

113
PREVENTION OF OVERUSE INJURIES IN RUNNING
mass index (BMI) should be high in those people, who are subjectedmore frequently injury. The study, however, produced no statisticaleffects of BMI and the incidence rate. It must be conceded, however,that the number of runners with an BMI index greater than 30 is pro-bably rather rare!
Malalignments such as different limb length, knee anomalies (knock-knees; bow-legs; patellar deformities) or foot anomalies (varus/valgusetc.) seem in 40% of retrospectively analysed injuries to be one of theinjury causes (12). It must be pointed out that the hypothesis thatabnormalities are potential risk factors for injury is also reasonable.The question is whether statistical or individual analysis will give theappropriate solution.
Running experience seems to be one of the major factors. It is sug-gested that long term adaptation of the tissue and of the biomechanicsof running leads to a significant reduction of injury rates although biasto the selective problems of the healthier runner must be considered.
The classification of “previous injuries” is not unique in literature.“Old injury” or “repaired tissue failed” is also summarised as well asinsufficient rehabilitation. However, it seems that previous injuries area major factor for running injuries. Therefore prevention must startwith management to avoid recurrence of that specific problem.
The running
Running distance or mileage expressed either per week, month oryear has only a positive influence on incidence rate if taken absolutely.The relative risk (risk per exposure time), however, is decreased (6,11). Several authors comment that the frequency of running has a stronginfluence on injury rate. Although running distance and frequency isstrongly interrelated, the study of Marti et al (15) indicated, that insubjects running the same distance either in two, three or four sessionsper week, frequency has no significant effect on the probability gettinginjured.
A classical parameter characterising overuse represents the trainingerror (1) and change of training habits. Powell et al (18) stated that asudden change in running or training habits increases the incidencerate of injury because of a lack of capacity of the tissue to adapt. Trainingerrors (running too fast, too long or too often) are strong indicators for

RUNNING & SCIENCE
114
increased injury probability. Lysholm/Wiklander (12) found thattraining errors are associated with 60% of all running injuries! Foreffective prevention the key–question remains to be solved individually:How much is too much?
Environmental systems
There is an ongoing debate about the principal capability of sport orrunning shoes to influence injury rate. Extensive industrial and scientificprojects have been conducted in order to develop the appropriate shoe:shock absorption in the rear part for the heel strikers as well as in thefront for the mid or fore foot strikers have been promoted.
On the basis of biomechanical calculations, a single leg is subjectedto 60 t per km assuming a strike length of 1,5 m, a contact rate of 670times per km a body weight 70kg and an average impact loading of2.5 times body weight. It is evident that a running shoe plays a significantrole in shock absorption providing cushioning, support and stability.The construction of a running shoe with these qualities is seen as amajor contribution in injury prevention.
Malalignments of the human locomotor system is thought to becorrectable by orthodic devices. By means of tape or in-shoe devices ithas been demonstrated that the injury rate can be reduced by a factorof two. This effect, however, is most probably biased by the actualitythat those runners who a prone to possible injuries tend to apply fororthodics.
In general, cushioning, support and stability are necessary qualitiesof the shoe material. Injury reduction can be effectively achieved withadditional equipment known as orthodic devices. It must, however,be kept in mind, that even the best quality shoe will loose 30-50% of itsprevention properties after few hundred kilometres of running (2).
It must be pointed out that this conclusion is the outcome of statisticalcalculations, expressing the probability of a group or subgroup gettinginjured. The fact that some of these factors are unclear or even irrele-vant for injuries does not mean that they are not unimportant. Epide-miological research is necessary to get an over-all information aboutthat issue. Statistical analysis has some implications for the majority ofa group or subgroup of runners.

115
PREVENTION OF OVERUSE INJURIES IN RUNNING
Man-Shoe-Surface – InteractionIn a “bottom up” strategy some research is focused on the complexentity of the man-the shoe and the surface, in order to investigate theindividual responses.
One of the most powerful tools in overuse prevention is a carefuland comprehensive screening and testing of the athletes themselves.Whereas in top athletes individual gait analysis and physiologicalexamination should not be a great problem, the situation in lower le-vel runners is controversial. Most of the ligamentous and tendineousproblems could be avoided if the runner is inspected carefully beforeinitiation of training. There is, however, not enough data available thatgives a clearly indication of what is dangerous or harmful and what iswithin the physiological limits. There are only few anatomical andbiomechanical factors that can be extracted to explain increased injuryrisks mainly because of the individual variability and because of theflexible adaptability of the locomotor system.
Excessive pronation (hyperpronation) is one of the most frequentproblems that is associated with a series of different potentials to causeoveruse injuries: Tendinitis at the Achilles tendon, fasciitis on theplantaris as well as lateralisation of the patellar alignment (runners knee)and even shin splints are possible consequences (13).
Therefore, a careful inspection of possible pronation (b-angle) testedeither in static or in dynamic situation or is a necessity for everybodyprior to training.
In the field of locomotion one assumption is made that there existsan interaction between all components which interfere in generationand control of locomotion (9, 10). Therefore the dependency and interac-tion of man, shoe and surface is assumed to play an important rolewhich cannot be neglected in a comprehensive study of locomotion.
Man as a biological system utilises all the possibilities for action andreaction to environmental influences. The human neuromuscular sy-stem is, however, adaptive with a range of flexibility and variability toachieve appropriate movement pattern. In this respect it should beassumed that not only the intraindividual behaviour is flexible whenthe conditions are changed, but also the differences in intraindividualcomparison should be taken into consideration. A well trained athletein running, for example, would respond to changes in running condit-

RUNNING & SCIENCE
116
ions in a different manner than a subject with less skill and lower trainingstatus.
The neuromuscular system is not only responsible for the regulationof the exertion of forces to produce posture and /or locomotion; additio-nally it is a control system via several sensory mechanisms which arecapable to react through feedback to small disturbances in runningcycles or running conditions. Facilitation or reduction of these feed-back mechanisms makes it possible for the human locomotor systemto meet a great variety of movement conditions by supplying the muscu-lature with adequate contractile and stiffness properties.
The function of the shoes which represent the second component inthe chain of interaction, can be explained in two ways. On one handthe shoes transfer the action forces to the ground and on the otherhand they mediate the reaction forces from the ground back to thebody. Therefore the shoe construction must be oriented on both thephysical and physiological requirements of running.
The physical properties of running shoes can also be described intwo other ways. First, the shoes should have cushioning propertieswhich suppress high impact forces especially in the early impact phaseto protect the skeleton and tendon from extreme loading. Secondly,the characteristics of the shoe should provide support in the variousstrides under a large number of different running situations. Supportcombines both the reduction of unphysiological supination and pro-nation in the stride phases (17), as well as the task to act during thestance phase to overcome the individual load and to help actively inthe running cycles. The latter argument, however, can be interpretedin terms of running economy, running performance or even perfor-mance potentiation.
The qualities and elasticity characteristics or the running surfacemay play an important role and may influence to a great deal not onlythe running technique and running comfort but also the physiologicaldemands to the runner. The variability may range from very hardsurfaces, such as asphalt conditions which represent the surface con-dition in marathon running, to a very soft ground which is mostlyfound in jogging tracks, consisting of pure soil and sawdust.
Examination of the qualities of running must therefore take into con-sideration the entire system “man-shoe-surface”. All of these threecomponents have their own physical resonance characteristics, but

117
PREVENTION OF OVERUSE INJURIES IN RUNNING
Figure 2. Vertical ground reaction forces and EMG–pattern of m. Gastrocnemius(GAS) of one subject running (5m•s-1) with 7 shoes. From top: the stiffness of thesole construction is decreased. In line with the stiffness characteristics of the shoes theinitial peak of the force record emerges. Comparison of the EMG-pattern reveal largealterations in amplitude right after ground contact (vertical line).
when acting together the “man” must respond physiologically to makethe best out of the combination.
All these components which contribute the man-shoe-surfaceinteraction, have their own qualities and quantitative contributions inrunning. Only a positive interference of all three components will leadto an effective and efficient running pattern.
In the example demonstrated in Figure 2, the comparison of theforce and EMG pattern of the same subject running is presented withdifferent shoes. Shoe qualities have a considerable impact on physiolo-gical demands: In figure 2, it is shown that with seven different shoes,ranging from very soft to very hard, a considerable alteration in theEMG profile of the lower leg muscle is concommitant. This segmen-tation of the EMG pattern during the breaking phase is clear and consi-stent with respect to timing. The individual amplitudes, however, areconsiderably changed in different conditions.

RUNNING & SCIENCE
118
In a comprehensive comparison (Figure 3), the differences of 22 shoeswere evaluated in one subject running with 5 m•s-1 over a long plat-form (5). The figures were composed using a statistical method for thegrand mean calculation. The individual averages were matched withrespect to the onset of ground contact. The dark line represented themean curve, the thin line the +1 standard deviation of all tested perfor-mances. The vertical force component shows variability primarilyduring the early impact. The variation in the force record can only beexpressed in terms of amplitudes and not of time. The activation patternsshow little variation in timing of the onset of preactivation, and in therate of rise of activation. The total amount of electrical input to themuscle however, varied substantially with 30% of the mean value.
Figure 3. Ground reaction forces and EMG-pattern of leg muscles represented as thegrand mean curves (mean (thick line) and standard deviation curve (thin line) ofone subject running with constant velocity of 5 m•s-1 with 22 shoes with differentstiffness properties. Note that there is a considerable variance in the EMG-patternswhereas in the force records only small variations exist.
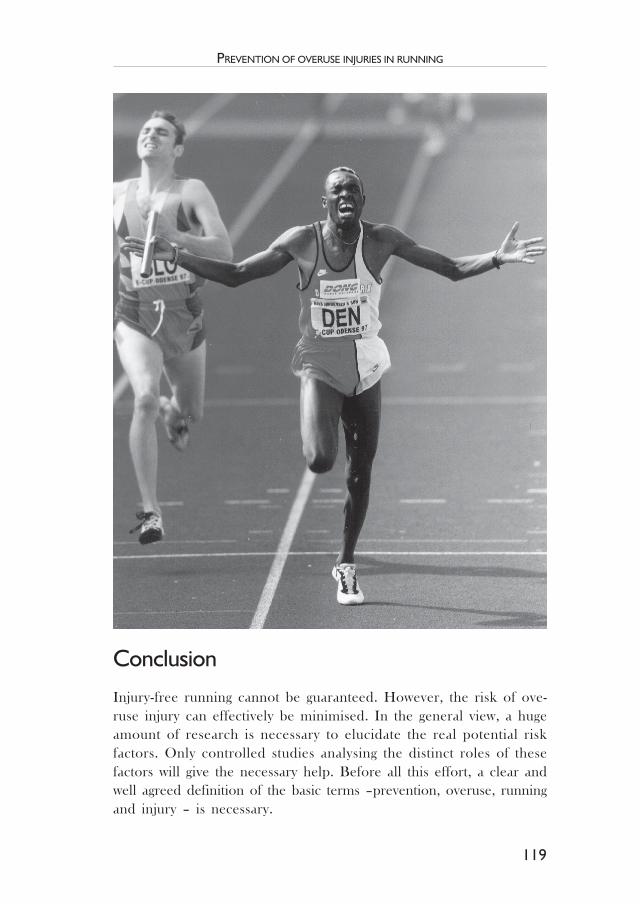
119
PREVENTION OF OVERUSE INJURIES IN RUNNING
ConclusionInjury-free running cannot be guaranteed. However, the risk of ove-ruse injury can effectively be minimised. In the general view, a hugeamount of research is necessary to elucidate the real potential riskfactors. Only controlled studies analysing the distinct roles of thesefactors will give the necessary help. Before all this effort, a clear andwell agreed definition of the basic terms –prevention, overuse, runningand injury – is necessary.
RUNNING & SCIENCE
120
In accordance with this, a detailed individual analysis of the entirecomplex – the man, the shoe and the surface – is an evident prerequisiteto assess the biomechanical and physiological adaptability.
Methodologically, a reference frame with clear defined standards ismissing to judge positive, non relevant or even harmful influences onan individual basis.
A competent screening of the athlete, adequate training parameters,especially with respect to duration and intensity of the running exercises,are certainly the most powerful preventive measures in reducing ove-ruse injury in running.
In general, it can be recognised that the muscle specific pattern isreproducible in its shape throughout all conditions. This reflects, thatthe individual pattern is quite stable and that the magnitude is drasticallychanged in different running conditions with different compliancecharacteristic.
References
1. Clement, D. B.; Tauton, J. E.; Smart, G. W. & Nicol, K. L. : A survey ofoveruse running injuries. Phys. Sports Med. 9 (5), 47-58, 1981.
2. Cook, S. D.; Brinker, M. R. & Mahlon, P. : Running shoes. Their relation torunning injuries. Sports Med. 10 (1), 1-8, 1990.
3. Eichner, E. R. : Exercise and heart disease. Epidemiology of the ‘exercisehypothesis’. Am. J. Med. 75, 1008-23, 1983.
4. Galen van, W.; Diederiks van, J. : Sportblessures Breed Uitgemeten (A Popula-tion Study on Sport Injuries). De Vrieseborch, Haarlem, The Netherlands,1990.
5. Gollhofer, A.; Komi, P. V. : Measurement of man-shoe-surface interactionduring locomotion. In: Med. and Sport Science 26: Karger, Basel, 187-199,1987.
6. Jacobs, S. J., Berson, B. L. : Injuries to runners: A study of entrants to a10000 meter race. Am. J. Sports Med. 14 (2), 151-5, 1986.
7. Jesse, J. : Hidden Causes of Injury, Prevention and Correction for RunningAthletes and Joggers. The Athletic Press, Pasadena, CA. 1977
8. Kibler, W. B. : The Sport Preparticipation Fitness Examination. HumanKinetics, Illinois, 1990.
9. Komi, P.V.: Physiological and biomechanical correlates of muscle functioneffects of muscle structure and stretch-shortening cycle on force and speed.Exercise and Sort Sciences Reviews, 12, 81-121,1984

121
PREVENTION OF OVERUSE INJURIES IN RUNNING
10. Komi, P.V.; Hyvärinen,T.; Gollhofer, A.: Man-shoe-surface interaction.Special problems during marathon running. Special problems duringmarathon running. Acta Uni. Oul. 179, 69-72, 1986
11. Koplan, J. P.; Powell, K. E.; Sikes, P. K.; Shirley, R. W. & Campell, C. C. :An epidemiologic study of the benefits and risks of running. JAMA 248 (23),3118-21, 1982.
12. Lysholm, J.; Wiklander, J. : Injuries in runners. Am. J. Sports Med. 15 (2), 168-71, 1987.
13. Macintyre, J.; Lloyd-Smith, R. : Overuse Running Injuries. Renström, P. A.F. H. (Ed.): Sports Injuries. Basic Principles of Prevention and Care. BlackwellScientific Publications. 139-160, 1993
14. Macintyre, J. G.; Tauton, J. E.; Clement, D. B.; Lloyd-Smith, D. R.; McKenzie,D. C. & Morrell, R. W. : Running injuries: A clinical surveys of 4173 cases.Clin. J. Sports Med. 1 (2), 81-7, 1991.
15. Marti, B.; Vader, J. P.; Minder, E. C. & Abelin, T. : On the epidemiology ofrunning injuries : The 1984 Bern Grand Prix Study. Am. J. Sports Med. 16,285-94, 1988.
16. Mechelen van, W. : Aetiology and prevention of running injuries. Thesis, VrijeUniversiteit, Amsterdam, 1992.
17. Nigg, B.M.: Biomechanical analysis of ankle and foot movement. Med. andScience in Sports and Exercise, 23, 22-29, 1987.
18. Powell, K. E.; Kohl, H. W.; Caspersen, C. J. & Blair, S. N. : An epedimiologicalperspective on the causes of running injuries. Phys. Sports Med. 14 (6), 100-14, 1986.
19. Segesser, B. : Sportschuhe. In: GOTS-MANUAL Sporttraumatologie. VerlagHans Huber, 1997.
20. Steinbrück, K. : Epidemiologie. GOTS-MANUAL Sporttraumatologie. VerlagHans Huber, 1997.
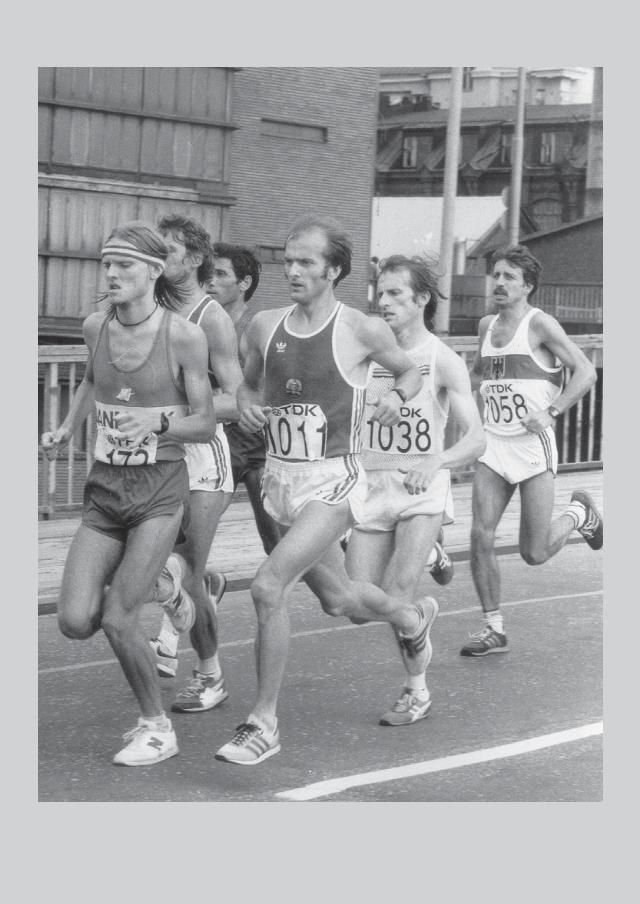
RUNNING & SCIENCE
122
123
TRAINING PRINCIPLES IN DISTANCE RUNNING
Training principlesin distance running
Henrik Larsen
SynopsisThis chapter reviews the significance of intensity, frequency,duration and volume of training on performance and physiologicaladaptations to endurance training with special emphasis ondistance running. The role of each of these factors is describedprimarily on the basis of knowledge derived from scientific trainingstudies performed on initially untrained subjects but also fromtraining studies exploring well-trained subjects including eliteathletes. Furthermore, based on some case studies linkage is madebetween knowledge derived from studies of training performed byelite runners and knowledge derived from science.
IntroductionOver the last several decades many attempts have been made to elucidatethe exact nature of the endurance-training stimulus and the most efficientprocedure by which it may be elicited. The question as to what is theoptimal stimulus for adaptation to endurance training including long-distance running and with that improved performance has constantlychallenged researchers. Intensive research has led to a better understan-ding of the different factors of importance for optimal improvementalthough many questions still remains unsolved.
Crucial factors determining success in middle- and long distance runningevents include the functional capacity of the cardiovascular system, the

RUNNING & SCIENCE
124
capacity for aerobic and anaerobic energy turnover, muscular strength,running economy, skeletal muscle fibre composition, mitochondrialoxidative capacity, motivation and tactics. Outstanding performance in longdistance running primarily requires an optimal combination of high maxi-mal aerobic power, good running economy and a high fractional utilisationof VO2
-max during competition. The significance of these factors havebeen expressed in the following equation by di Prampero and collaborators(9):
vEND = F • VO2-max
C
where vEND is the maximal speed sustainable during endurance running,F the maximal fraction of VO2-max that can be maintained throughout theduration of the effort in question, and C the energy spent per unit di-stance. Capelli & di Prampero (see page 67) and Svedenhag (see page 85)carefully describes the significance of C (running economy). Therefore, anessential focus in the present chapter is on crucial physiological variablesrequired for reaching and maintaining a high maximal energy turnover,and to describe how these variables adapt to training.
Many physiological variables have been identified as important for trans-port of oxygen from the atmosphere to the working muscles and thus forenergy production.
The lung diffusion capacity is not considered to be a primary limitingfactor for VO2-max except in well-trained elite athletes (8).
Cardiac output is determined by heart rate multiplied by stroke volume.Heart volume is essential for stroke volume and thus minute volume,which in turn has been shown to be a major determinant of VO2-max. Alowered heart rate at a constant work rate caused by endurance training isa classical finding within the scientific physiological literature.
Blood volume and particularly the total volume of haemoglobin hasbeen shown to be of major importance for VO2-max (e.g. 11). Additional-ly, VO2
-max depends on the arteriovenous oxygen difference.Capillarisation is one of the factors determining the oxidative profile
of the musculature. The capillary density has been shown to correlatepositively with the running velocity at which blood lactate begins toaccumulate (49), which in turn has been found to correlate with runningvelocity during competitions of various distances (e.g. 14).
The activity of oxidative enzymes in the muscles has been shown to beessential for the respiratory capacity of the muscle tissue (23). This has in
125
TRAINING PRINCIPLES IN DISTANCE RUNNING
turn been shown to be significantly related to the level of blood lactate atgiven work rates (27). This implies, that running speed at a given bloodlactate level as well as oxygen uptake per minute per kg of body weight ata given blood lactate level is highly related to performance in running.
Adaptations to training of the enumerated physiological variables havebeen investigated in numerous scientific investigations. Most of these varia-bles have been shown to be dependent upon the training stimulus and thetraining principles.
In the present chapter the role of some of the most important factorsfor reaching an optimal physiological training stimulus will be presentedwith the main focus on distance running. However when suitable re-search derived from other endurance sports and general enduranceexercise will be included. Additionally some case studies will bepresented. Important factors to be highlighted are training intensity,frequency, duration and volume.
Training intensityThe significance of training intensity has been studied extensively butalthough an optimal intensity has not yet been identified it is almostgenerally accepted that the intensity is of great importance for thetraining response. Numerous studies performed at training intensitiesbetween 36 and 170% of VO2-max have shown a positive training response.
Training threshold
Several studies have noted the existence of a training threshold, in termsof intensity, below which no training response is seen. This minimal sti-mulus necessary to evoke training adaptations has been reported to be atabout 50% of VO2
-max (6), 75% of maximal heart rate (2), slightly abovethe 60% training level (max. heart rate-resting heart rate) (28) or a heart rateof 140-150 beats • min-1 (13, 53). Indeed one study performed at intensitiesfrom 35 to 55% of VO2
-max in subjects previously training 3 x 45 min •week-1 showed no additional training effect at all, even if the subjectsexercised 5.5 hours • day-1, 6 days • week-1 for 8 weeks (45). However, ina study by Nordesjö (39) adaptation to training was observed after exerciseat 36% of VO2-max while other investigations have shown adaptations after

RUNNING & SCIENCE
126
training at 45% of VO2-max (19, 24). In addition, it has been suggested thatadaptation to training can occur at exercise intensity producing a heart rateof 110-120 beats • min-1 in sedentary population with low levels of habitualactivity (48). The difficulty of identifying the lower limit of adaptation totraining may be due to the fact that many studies have shown that thetraining response is dependent upon the initial physical condition of theindividual (e.g. 44, 57).
Significance of exercise above the training threshold
Several studies on previously untrained subjects have shown that a highertraining response measured either by work capacity (39), work capacity andVO2
-max (57), VO2-max (48), VO2
-max and oxygen consumption at fixedblood lactate
concentrations (56), VO2
at lactate threshold (24) orarteriovenous oxygen difference (32) is achieved in subjects training at thehighest intensities. Other investigations have shown identical trainingresponse in subjects training at different intensities above the trainingthreshold (2, 19, 21, 47, 53). However the lack of difference in trainingresponse in some of these studies may be due to the fact that some ofthem were performed with a limited training period (10 days to 6 weeks).One study demonstrated that the length of the study period is critical forsignificant adaptations to occur (41). In this investigation no differences incardiorespiratory response to training were observed between groups jog-ging either 2 or 4 days • week-1 after 10 weeks. However significant differencesin several variables were seen after completing 20 weeks of training. A fewstudies comparing groups training at different intensities and quantitieshave demonstrated that the same improvement in either performance andactivities of hexokinase, phosphorylase, phosphofructokinase, succinatedehydrogenase, and 3-hydroxyacyl CoA dehydrogenase enzymes (26),VO2-max (43) or submaximal heart rate/VO2-max (17) can be achievedwhen training at higher intensities but smaller quantities. Equal improve-ments in VO2-max were also seen in a study comparing training 5 hours •week-1 at 70% of VO2-max with very short (20 s) high-intensity intermittenttraining sessions performed at
170% of VO2
-max (55). In addition, thislatter study showed a significant increase in anaerobic capacity in the highintensity-training group. Furthermore a detraining study examining theeffect of a reduction in training intensity, while maintaining training

127
TRAINING PRINCIPLES IN DISTANCE RUNNING
frequency and duration, showed losses in VO2-max, left ventricular massand endurance performance within 5 to 15 weeks (25).
Effect of adding short intensive training to moderatetraining
Six studies on well-trained athletes have demonstrated increased trainingresponses when short intensive training sessions either were added orpartly/fully replaced the normal training at moderate intensity. Thus,adding one intensive 20 min treadmill run • week-1 to the normal 5.7hours of running • week-1 at low intensity resulted in an increase inrunning speed eliciting a blood lactate concentration of 4 mmol • l-1
(50). In addition high intensity (90-95% of VO2-max) interval training (3 d
• week-1) improved both 10-km race performance and exercise time tofatigue at supramaximal running speed and decreased plasma lactate con-centration at 85 and 90% of VO2
-max in competitive runners (1). In anotherstudy replacing 82 km • week-1 of running at moderate intensity with highintensity running and cycling 6 d • week-1 (40 min running, HR of ~190beats • min-1, 3 days • week-1 and 5 x 5 min on cycle ergometer, HR of~180, 3 days • week-1) improved the 10-km run time despite of a markeddecrease in training volume (35). Furthermore replacing 15% of the nor-mal 300 km • week-1 of endurance cycle training with high-intensity inter-val training in three different studies increased the peak power output andthe 40-km time-trial performance (30, 58, 59). Moreover, in two of theseinvestigations an enhancement of the “anaerobic performance” (time tofatigue at 150% of peak power output) was observed (30, 59) along with anincrease in skeletal muscle buffering capacity in one of these studies (59).Additionally, the study by Westgart-Taylor and collaborators (58)demonstrated decreases in carbohydrate oxidation, plasma lactate concent-ration and ventilation when the cyclists rode at the same absolute workrates of 60, 70 and 80% of initial peak power output after completion ofthe high intensity training period.

RUNNING & SCIENCE
128
Response to increased training intensityof entire training performed
Two studies have examined the physiological response to an increase intraining intensity of all the training performed. One study in which normaltraining of 2.2 h • week-1 with a mean training intensity of 65% of maximumheart rate (HRmax) was increased to 2.7 h • week-1 and an average intensityof 78% of HR
max revealed significant increases in VO2
-max and exercisetime to exhaustion at 86% of pre-training VO2
-max (31). It is true that atleast some of the improvement may be due to the fact that the trainingvolume was increased, but since even a large training volume increase hasshown relatively minor improvement of performance time (4) the increasein performance time (74%) in the present study cannot be explained by anelevation of training volume alone. This view is supported by cross-sectionalstudies investigating performance and training volume (e.g. 16, 33). Anotherstudy comparing two groups of elite junior cross-country skiers who trainedat either moderate intensity (60-70% of VO2
-max) or high intensity (80-90% of VO2
-max), 12-15 hours • week-1 for 5 months, showed a moreprofound training response (performance in a 20-min run test) in the high,than in the moderate intensity training group (12). Additionally, the activityof the mitochondrial enzyme succinate dehydrogenase (SDH) rose by 6%and the phosphofructokinase (PFK) activity fell by 10% in the high intensity-training group, while no changes were observed in the group training atmoderate intensity. Furthermore, positive correlations between the activityof CS, SDH and GPHD enzymes and performance were found.
In a study of elite runners in and off-season, a small but significantenhancement in VO2-max was observed in season compared to off-season.This change seemed to be due to the higher training intensity performedduring the preparation period prior to the competitive season (54). More-over a minor but significant improvement in running economy was foundin this study during one year of continuous training.
Athletes studied during three successivesummer training periods
In a study by Rusko (42), performed on young cross-country skiers duringa three-year period, two different groups of skiers were compared. Onegroup trained at a relatively low total training volume, but with a relatively
129
TRAINING PRINCIPLES IN DISTANCE RUNNING
high volume and frequency of interval type training performed at highintensity, while another group trained at a relatively large total trainingvolume but with a relatively small volume of intensive training. The studyrevealed that training at high intensity/low total volume resulted in asignificant increase in VO2
-max, while no change was seen after training atlow intensity, despite the fact that a significantly greater total training volumewas performed.
Cross-sectional studies
Two cross-sectional studies performed on marathon runners examiningthe relationship between marathon performance and various trainingcomponents revealed a significant correlation between average trainingpace (intensity) and performance (22, 38). In line with this, Foster (16)investigated the relationship between performance in 1.0; 2.0; 3.0; 6.0;10.0 and 26.2 mile races and training intensity in another cross-sectionalstudy and found significant correlations between training speed andperformance in the different distances. The correlations were not strong,and the strength of the correlations tended to decrease as the competitiondistance decreased. However these large-scale correlate studies do sup-port the importance of training intensity.
Training at the individual anaerobic threshold
It has been hypothesised that training at the individual lactate thresholdoften named anaerobic threshold is beneficial for the training response(e.g. 50). This threshold has been defined either as the intensity elicitinga given concentration of lactate in the venous blood (e.g. 4 mmol • l-1) orthe intensity where a non-linear increase in lactate concentration isobserved. However, an investigation comparing groups training either30 min at the individual anaerobic threshold (IAT) or four times 7.5min at intensities which alternated between being below (IAT – 30 % ofthe difference between VO2
-max and IAT) and above the IAT (IAT + 30% of the difference between VO2-max and IAT) demonstrated nodifferences in physiological adaptations between groups (29). In additionto the finding that training at IAT does not seem to be crucial, the studyindicates that the physiological adaptations are independent of whether

RUNNING & SCIENCE
130
the exercise is performed intermittently or continuously. It is true thatexercising at IAT (4 mmol • l-1) is effective (50). However, this is notsurprising since a relatively high training intensity is crucial for the trainingresponse. Based on the investigations described above (12, 31, 56) trainingat IAT – 30 % of the difference between VO2
-max and IAT is hardly aneffective training intensity because the stimulus probably is too low. Sinceidentical adaptations were observed in the two training groups exercisingeither at or above/below IAT, it can be argued that training at IAT + 30 %of the difference between O2
-max and IAT is advantageous comparedto training at IAT. It is obvious to conclude that there is no scientificevidence that exercise at IAT is the optimal training intensity. Furthermore,the scientific literature on this topic has revealed that it is difficult to identifyIAT and to perform training exactly at IAT (50). In addition the term“anaerobic threshold” is misleading because lactate is normally producedunder fully aerobic conditions in the muscle. Moreover, training at IATcannot be recommended because it causes a lot of practical implications.
Training frequencyFrequency of endurance training defined as the number of training boutsduring a given time has been shown to be important determinants forimproving various physiological functions and performance.
Four different kind of study design has been used in order to investi-gate training frequency.1. Investigations examining the effect of increased number of training
sessions • week-1 with a fixed duration of each single bout, therebyreflecting increased training volume.
2. Cross-sectional studies.3. Studies exploring training frequency with a fixed training volume.4. Investigations examining the timing of the training sessions during
the training week.
Studies examining training frequencyand increased training volume
The vast majority of studies have focused on the role of the weekly numberof training bouts performed with a fixed duration of each bout and the

131
TRAINING PRINCIPLES IN DISTANCE RUNNING
existence of a direct relationship between frequency of training and theadaptation of different physiological variables and performance is almostgenerally accepted. Some of these studies have shown that the improvementof VO2-max increases in proportion to frequency of training (6, 20, 40, 41,48). Likewise, improvement of work capacity/performance has been shownto occur in proportion to training frequency (20, 39). Additionally, somestudies have shown reduction in body weight and percent body fat (40),total body and fat weight (41) and reduction in percent body fat (20) ingroups training 4-5 times • week-1 compared to groups training 2 times •week-1. Moreover, training 4 times • week-1 compared to 2 times • week-1
has shown superior improvements in VO2-max and submaximal HR during
a standard treadmill run, as well as a more rapid decrease in HR duringrecovery and a lower resting HR (20, 41). Although significantly higherphysiological adaptations were registered in the group training with thehighest frequency in the study by Pollock and colleagues (40) no diffe-rence were observed between groups in a 2-mile run.
In one study comparing the training response in groups performinginterval run training either 2 or 4 times per week for 7 and 13 weeks,respectively, no differences in elevation of VO2-max were observed (18).However the lack of difference in response between groups may be due tothe fact that the VO2-max-tests were performed on bicycle ergometer, whichdo not fully reflect changes in running VO2-max. Even though theenhancement of VO2
-max was identical between groups, differentadaptations in submaximal heart rates measured during work loadsdemanding 80-85% of VO2-max was registered.
Thus the decrease in heart rate was significantly greater in the 4days • week-1 groups than in the 2 days • week-1 groups for both the 7-and 13-week training programs. In addition, the decrease in submaximalheart rate was significantly greater in the group training twice per weekfor 13 weeks compared to the group training twice per week for 7weeks. However, no differences were observed between groups training4 days • week-1 for 7 or 13 weeks.
Cross-sectional studies
The notion that training frequency is important for the training responseis supported by a cross-sectional study performed by Hagan andcolleagues (22) on marathon runners. In this investigation the total

RUNNING & SCIENCE
132
number of training sessions in the preparation period (9 weeks) prior to amarathon race showed to be very important for the performance time.Thus, a highly significant correlation of –0.62 between training frequencyand marathon time was found. This is in agreement with the findings byMarti and collaborators (33), who showed a significant association between16-km running time and weekly training frequency.
Studies examining frequency with a fixed training volume
One very relevant question that arises concerning the above mentionedinvestigations, is the degree to which the observed physiologicaladaptations is the result of an increased number of training bouts perse, or rather that training frequency results in a proportional increasein training volume.
A few studies have evaluated the effect of training with differenttraining frequencies but kept the weekly training volume at a fixedlevel (7, 37). This design implies that the duration of the single trainingbout varies in direct proportion to the weekly number of training bouts.Thus, these studies evaluate the effect of the number of training sessionsand the role of the duration of each single training session at the sametime. In one study using this design one group jogged 30 min • day-1 at65-75% of peak heart rate while another group completed three 10-min jogging bouts daily at the same training intensity separated by atleast 4 hours (7). The training caused a significant increase in maximaloxygen uptake in both training groups but the increase was significantlygreater in the group training continuous 30 min • day-1. However, theincrease in exercise test duration as well as the decrease in heart rate atsubmaximal exercise was similar in both groups. In another studyusing the same kind of design two groups of women completed eitherthree 10-min training bouts or one 30-min bout per day, 5 days • week-1
for 10 weeks (37). The training consisted of brisk walking at 70 to 80%of maximal heart rate. The training resulted in significant increases inVO2-max and VO2 at blood lactate concentration of 2 mmol • l-1 in bothtraining groups but no differences were observed between groups. Theview that the response to training is independent of training frequency andthus duration if the training volume is fixed gets support by a study fromMarti and collaborators (33).

133
TRAINING PRINCIPLES IN DISTANCE RUNNING
These researchers compared 414 runners all taking part in a 16 kmcompetition who had the same training background in terms of trainingvolume (20-25 km • week-1), but who had achieved this volume byperforming either 2, 3 or 4 training sessions • week-1. Despite the conside-rable difference in training frequency and duration of the single trainingbout no significant differences in performance were observed.
Placement of training bouts during the week
One study using a different design was undertaken in order to investigatethe effect of “placement” of training sessions during the week (36). In thisstudy one group of subjects performed high intensity type running (five 3-min exercise bouts) on Monday, Tuesday, and Wednesday for 10 weeks.Another group of subjects performed a similar training protocol with theexception that training sessions were conducted on Monday, Wednesday,and Friday. Both groups improved VO2
-max significantly following theten weeks of training. In addition the heart rate at a given submaximalworkload was lowered significantly in both groups. However no significantphysiological differences were found between the groups. Even if all testswere performed on a bicycle ergometer the results indicate that a specificplacement of tri-weekly training sessions of running is not critical withrespect to enhancement of aerobic capacity.
Training durationNumerous studies have shown that duration of the single training sessionis an important stimulus for eliciting a training response. Increased trainingduration has resulted in significant improvement in VO2-max (6, 48), workcapacity (39), cardiovascular capacity/work capacity (60) and VO2-max/performance (34). However, training duration does not in itself seem tostimulate the training response. As mentioned earlier, the study perfor-med at intensities from 35 to 55% of VO2-max on moderately trainedsubjects
showed no training effect at all, even if the subjects exercised 5.5
hours per day, 6 days per week for 8 weeks (45).

RUNNING & SCIENCE
134
Cross-sectional studies
The studies mentioned earlier (22, 38) performed on marathon runnersduring the preparation period prior to a marathon race supports theview that distance/duration of the single training bout is important for thetraining response. Thus, Hagan and collaborators (22) found a significantcorrelation between marathon performance time and average km • workout-
1. In addition, Murray and colleagues (38) showed a significant correlationbetween the number of training runs longer than 15 miles and performancein marathon.
As described in regards to training frequency the same kind of questionarises concerning some of the above-enumerated investigations. To whatextend are the observed physiological adaptations due to the increasedtraining duration per se or by the fact that training volume increases indirect proportion to training duration? The three studies mentioned earlier(7, 33, 37) comparing different groups training with identical weekly trainingvolume but with different training frequency/duration show that trainingduration is not of any major importance for the training response. However,one of these studies indicates that duration may be important for the increasein VO2
-max (7).Two studies having compared training programs keeping the total work
amount at a constant level have shown that a higher VO2-max and increasedwork capacity can be achieved if the training is performed at high intensityand short duration of the single training session (57) or that identicalimprovements in VO2-max can be achieved using a shorter duration of thesingle training bout performed with higher training intensity (47).
Training volumeSurveys through the scientific literature reveal that training volume isessential for the training response and the adaptations of numerousphysiological variables. This is well in line with the view taken by coachesand runners, and often carried to extremes. The view that training volumeis of major significance at least up to a certain upper limit, is true. Whetherthere exists an upper ceiling for adaptation to training, is not known, butlikely depends on the adaptive potential of the individual athlete.
The majority of physiological investigations examining training volumeare made on marathon running and without exception these studies have

135
TRAINING PRINCIPLES IN DISTANCE RUNNING
shown training volume to be of major importance for success at this di-stance. In addition, the training volume in the last two months precedingthe event appears to be an essential part of the preparation for the race (10,15, 16, 22, 38, 49, 51, 52). Furthermore, not only the training volumeduring the last two months prior to the competition, but the volume ofthe total distance covered during the last year before the marathon, hasbeen shown to be of equally great importance (10). However almost allinvestigations concerning marathon performance have been based on cross-sectional samples, and may presumably be confounded by the tendencyfor runners having the right genetic “make up” to train harder and performhigher training volume than less talented runners. In addition highcorrelations are to be expected in studies of runners with very wide rangesof performance capacities. Therefore, the significance of the observedrelationship between training volume and performance is difficult toevaluate. However, in one study examining the effect of an increase intraining volume from 76 to 91 km • week-1 (20%), experienced runnersimproved marathon performance time significantly from 3 h 20.7 min to 3h 10.8 min (5%) (15).
The investigation mentioned above by Foster (16) demonstrated notonly a significant relationship between marathon performance andtraining volume, but also significant correlations between trainingvolume and performance in 1, 2, 3, 6 and 10 miles races were revealed.
In agreement with this, Marti and colleagues (33) demonstrated that theweekly training distance calculated during the last year prior to thecompetition was significantly associated to performance in a 16 km-run. Moreover, this investigation showed that the regression linereflecting the mean relation between habitual mileage and running timeis not linear but levels off in the range of 80 to 100 km • week-1. Thisobservation is in line with observations by Costill (3) in an investigationof two runners, who following a six-month layoff gradually increasedtheir weekly mileage.
V.
O2-max increased when the mileage increased to50 and also 75 miles • week-1. Beyond that level no additional gains inVO2-max were seen, even if the subjects continued training and reached225 miles • week-1 on the average during a one-month period.
In addition to the above-enumerated investigations studying relation-ship between training volume and marathon performance in largegroups of runners with a wide range of performance capacities, Sjödin& Svedenhag (51) examined the same relationship within 3 differentcategories of runners. The subgroups consisted of elite runners with

RUNNING & SCIENCE
136
personal record (PR) below 2 hour 30 minutes, good runners with PRbetween 2 hours 30 minutes and 3 hours and slow runners with PRabove 3 hours. The average weekly number of kilometres of these runnerswere 57, 115 and 145 km • week-1, respectively, and significant correlation’sbetween training volume and performance were found within each of thesesubgroups. In addition, significant differences in VO2
-max were observedbetween all three subgroups. The percentage of VO2-max utilised during

137
TRAINING PRINCIPLES IN DISTANCE RUNNING
the marathon was also found to be significantly lower in the groupperforming the lowest weekly training volume compared to the two othertraining groups. No difference in % of VO2
-max was observed between thetwo groups running 115 and 145 km • week-1, respectively. Therefore theauthors speculate, whether there may be an upper limit of training di-stance, above which there is no further increase in the percentage ofVO2-max sustained during a marathon race. However, the authors suggestthat a huge training volume may shorten the recovery period after racesand may preserve good form for subsequent performances.
Another reason for performing high training volume may be that thehigher training volume improves running economy which has beensuggested by Scrimgeour and colleagues (46) in a cross-sectional study,and which is in line with Daniels (5) and colleagues who have suggestedthat a certain threshold of training may be needed for inducing asignificant change in running economy. In the study by Scrimgeourand colleagues (46) three groups of runners, competing in various ra-cing distances from 10 to 90 km and training either less than 60 km •week-1, 60-100 km • week-1 or more than 100 km • week-1 werecompared. The results showed that runners training more than 100km • week-1 had significantly faster running times at all distances (ave-rage 19,2%) than those with less than 100 km • week-1. Additionally,the study revealed that neither VO2-max nor %VO2-max sustained duringcompetition was different between groups. On the other hand, the findingsshowed that the faster speed of the more trained runners was due to superiorrunning economy (20%). Therefore, the group differences could beexplained on the basis of differences in running economy alone, whichsuggests that the main effect of training more than 100 km • week-1 may bean improvement of running economy, or alternatively that runners trainingmore than 100 km • week-1 may have superior running economy due togenetic reasons.
Case studiesThere seems to be a close relationship between knowledge derived fromscientific investigations and knowledge based on selected case studies oftraining performed by elite runners. In order to demonstrate this specificrelationship three case studies will be presented. Elite runners who haveall used different training methods and changed their training strategy

RUNNING & SCIENCE
138
radically during their career are selected. Studies of these runners reveal aunique possibility to compare the impact of the different training princip-les. Characteristic years representing different training principles arehighlighted. The described data are primarily derived from studies oftraining logbooks but also from personal communication.
Flemming Jensen (FJ) Danish record holder in 3000 msteeplechase
1978-1980The training performed by FJ was sparse and not well organised. Hetrained for and competed in various distances on track during the sum-mer and practised orienteering during the winter. During 1980 thetraining volume exceeded 100 km • week-1.
1981During the preparation period (17 weeks) the average weekly trainingperformed encompassed the following:Training: Volume: 160 km • week-1
Intensity of 150 km • week-1: 4 min • km-1
Interval: 10 km • week-1, (e.g. 10 x 400 m, 1 min rest betweenrepetitions)One weekly training session longer than 20 km
Based on this training, FJ achieved the following results:3000 m steeplechase: 8 min 56 s10000 m: 29 min 55 s15 km: 46 min 35 s
1983FJ changed his training radically. The total training volume was decreased,while the average intensity was increased considerably. Moreover, thevolume of intervals was increased and longer intervals were introducedbecause of the probable positive effect on O2-max of these intervals.There was a complete lack of this kind of interval training in 1981.
During the preparation period (17 weeks) the average weekly trainingperformed encompassed the following:

139
TRAINING PRINCIPLES IN DISTANCE RUNNING
Training: Volume: 100 km • week-1
Intensity of 85 km • week-1: 3 min 35 s • km-1
Interval training: 15 km • week-1, (e.g. 6 x 1000 m or 3 x 1000m, 3 x 600 m, 3 x 400 m, with 3 min rest between allrepetitions)No training sessions longer than 15 km
On the basis of this training, the following results were achieved:3000 m steeplechase: 8 min 31 s5000 m: 14 min 19 s10000 m: 29 min 45 s15 km: 47 min 25 s
It appears that the steeplechase time improved significantly, while the 15-km time decreased slightly.
1987The total training volume was enhanced slightly, but was still belowthe magnitude achieved in 1981. The average intensity was also furtherincreased while the interval training was unchanged, compared to whatwas performed in 1983.Training: Volume: 120 km • week-1
Intensity of the entire training performed: 3 min 17 s • km-1
Interval training: 15 km • week-1, (e.g. 3 x 1000 m, 3 x 600 mand 3 x 400 m, 3 min rest or 6 x 1000 m, 3 min rest betweenrepetitions)No sessions longer than 15 km
After performing this training, FJ achieved the following results:3000 m steeplechase: 8 min 23 s5000 m: 13 min 36 s10-km road race: 28 min 46 s15 km: 44 min 45 s
The above enumerated data supports the view that training intensity is ofgreat importance, not only when it comes to intensity and volume of inter-val training, but also – the intensity of the distance training performedbetween the interval-days seems to be crucial, at least as long as the totaltraining volume is relatively small. It is true that the training volume per-

RUNNING & SCIENCE
140
formed by FJ was sparse prior to 1981 and that it probably takes years ofhard training to approach the upper limit of adaptation to training. Thereforeit can be argued that FJ probably would have improved performance after1981 even without the described change in training principles. However,improved performance results achieved by FJ due to an increased trainingintensity is very much in agreement with findings from several scientificstudies (e.g. 1, 12, 56).
Henrik Jørgensen (HJ) – Scandinavian record holder inmarathon and winner of the London Marathon (1988)
1978-1985HJ based his training primarily on long, relatively slow (∼4 min 5 s • km-1)distance runs. In addition he performed various forms of interval training.The total average weekly training distance during these years was 164 (range129-185) km • week-1. Included in this training HJ performed various kindof interval training, which averaged 13.3 (9.6 -16.2) km • week-1.
1985During the last 16 weeks prior to the London Marathon, the averageweekly training performed encompassed the following:
Training: Volume: 205 km • week-1
Frequency: 13 sessions • week-1
Intensity of 193 km: 4 min • km-1
Interval: 12 km • week-1, < 3 min • km-1
One weekly session longer than 24 km
Based on this training Henrik finished third in the London Marathon in 2h 9 min 43 s.
1986-87HJ continued training using the same concept without achieving any re-markable results. After failing in the London Marathon in 1987, HJchanged his training to a large extent. Both the speed of his distanceruns and the volume of interval training increased considerably.
During the last 12 weeks prior to the world championships in Rome(1987) the average week had the following content:

141
TRAINING PRINCIPLES IN DISTANCE RUNNING
Training: Volume: 167 (152-182) km • week-1
Frequency: 15 (13-16) sessions • week-1
Intensity of the entire training performed: 3 min 23 s (3:20-3:26)• km-1.Interval: 23 km • week-1 (< 3 min • km-1) (e.g. 4 x 2 km or 3 x 4km)No sessions longer than 15 km
After performing this kind of training Henrik finished 9th in marathon atthe world championships. Due to very high temperatures for marathonrunning the finishing time was 2 h 14 min 58 s.
1987-88After a couple of weeks without training due to illness HJ started trainingfor the London Marathon 1988. He tried to continue training in thesame way, but failed to reach the intended volume.
The content of the average weekly training during the last 14 weeksprior to the London Marathon is described below:
Training: Volume: 136 (115-170) km • week-1
Frequency: 14 (13-16) sessions • week-1
Intensity of the entire training performed: 3 min 29 s (3:26-3:31)• km-1
Interval: 13 km • week-1, < 3 min • km-1 (e.g. 4 x 2 km; 3 x 4km)No sessions longer than 15 km
Rather surprisingly, based on this training HJ won the London Marathon.Despite bad weather conditions and the fact that HJ was running the last 7km alone he won in 2 h 10 min 20 s. The above described training andresults seem to confirm the findings described in different scientific papers(e.g. 39), namely that the same work capacity (performance) can be achievedafter completion of a relatively small training volume performed at highintensity instead of performing a great training volume at a relatively lowintensity.

RUNNING & SCIENCE
142
Gert Kærlin (GK) – Danish record holder in 5000 m(1973-1982)
In contrast to the change in training principles described above for HJ andFJ, respectively, the training performed by GK changed from a relativelysmall volume with high intensity to a considerably greater training volumewith relatively low intensity during the preparation period for competition.During many years before 1976, GK based his training on a relatively smalltraining volume during the winter and an even smaller training volumeduring the summer. In addition, various intervals of high intensity wereperformed each second day during the summer period.1973A typical training week during the preparation period consisted of thefollowing:
Training: Volume: 110 km • week-1
Frequency: 7-9 sessions • week-1
Intensity: Not exactly knownInterval: 2 times • week-1 (e.g. 20 x 400 m, ∼1 min rest betweenrepetitions or 6 x 1000 m, 2 min rest between repetitions).No sessions longer than 18 km
Based on this training GK improved the Danish record in 5000 m byrunning 13 min 40 s.
The same kind of training as described above continued until thewinter 1975/76. During this period the total volume increasedconsiderably, while the training intensity decreased.
1976A typical training week included the following:
Training: Volume: 200 km • week-1
Frequency: 10-11 sessions • week-1
Intensity: Not exactly knownInterval: Mainly anaerobic of “fartlek”-typeAt least two weekly sessions longer than 22 km
After performing this kind of training GK broke his own Danish record in5000 m by running 13 min 39 s but since the improvement was extremely

143
TRAINING PRINCIPLES IN DISTANCE RUNNING
small, it is obvious to conclude, that the same performance level can beachieved after completion of a relatively small training volume performedat high intensity compared to a great training volume performed at arelatively low intensity.
Additionally, the training performed and the results achieved by HJand GK indicate that the same performance level is reached regardlessof whether a large total training volume performed at relatively lowintensities is exchanged with a relatively smaller total training volumeperformed at relatively high intensities, or that these different trainingprograms are performed in reverse order.
Furthermore, since both HJ and GK seem to have reached or havebeen very close to an upper limit of adaptation to training, the presentedcase studies support the view that there exists an upper limit beyond whichno adaptation to training take place.
Concluding remarks• The intensity of training is of extreme significance for physiological
adaptations as well as performance.• Training frequency and duration of a single training session are
important for the training response, if an increase of these factorsimplies increased training volume. However, evidence that trainingfrequency vs. training duration is of any significance if the trainingvolume is fixed is weak.
• Training volume is essential for physiological adaptations andperformance. Whether there may be an upper training limit beyondwhich no improvement in physiological adaptations and performanceis seen with increased training is still not clear, but it is likely todepend on the individual’s capacity to adapt as well as to toleratevarying volumes of high intensity training.

RUNNING & SCIENCE
144
References
1. Acevedo, E.O. and Goldfarb, A.H. Increased training intensity effects on plasmalactate, ventilatory threshold, and endurance. Med Sci Sports Exerc, 21(5), 563-568, 1989.
2. Burke, E.J. and Franks, B.D. Changes in VO2-max resulting from bicycle training
at different intensities holding total mechanical work constant. Res Q, 46, 31-37,1975.
3. Costill, D.L. Training: The Price for Success. In: Inside Running: Basics of sportsphysiology. Benchmark Press, Inc. ISBN: 0-93615700-3, 85-121, 1986.
4. Daniels, J.T., Yarbrough, R.A. and Foster, C. Changes in O2-max and
running performance with training. Eur J Appl Physiol, 39, 249-254, 1978.5. Daniels, J.T. A physiologist’s view of running economy. Med Sci Sports Exerc,
17, 332-338, 1985.6. Davies, C.T.M. and Knibbs, A.V. The training stimulus: the effects of intensity,
duration and frequency of effort on maximum aerobic power output. Int ZAngew, 29, 299-305, 1971.
7. DeBusk, R.F., Stenestrand, U., Sheehan, M. and Haskell, W.L. Training effectsof long versus short bouts of exercise in healthy subjects. Am J Cardiol, 65,1010-1013, 1990.
8. Dempsey, J.A., Hansson, P.G. and Henderson, K.S. Exercise-induced arterialhypoxaemia in healthy human subjects at sea level. J Physiol, 355, 161-175,1984.
9. di Prampero, P.E., Atchou, G., Brückner, J.-C. and Moia, C. The energeticsof endurance running. Eur J Appl Physiol, 55, 259-266, 1986.
10. Dotan, R., Rotstein, R., Dlin, R., Inbar, O., Kofman, H. and Kaplansky, Y.Relationships of marathon running to physiological, anthropometric andtraining indices. Eur J Appl Physiol, 51, 281-293, 1983.
11. Ekblom, B., Goldbarg, A.N. and Gullbring, B. Response to exercise afterblood loss and reinfusion. J Appl Physiol, 33(2), 175-80, 1972.
12. Evertsen, F., Medbo, J.I., Jebens, E. and Gjovaag, T.F. Effect of training onthe activity of five muscle enzymes studied on elite cross-country skiers.Acta Physiol Scand, 167(3), 247-57, 1999.
13. Faria, E.F. Cardiovascular response to exercise as influenced by training ofvarious intensities. Res Q, 41(1), 44-50, 1970.
14. Farrell, P.A., Wilmore, J.H., Coyle, E.F., Billing, J.E. and Costill, D.L. Plasmalactate accumulation and distance running performance. Med Sci Sports, 11(4),338-344, 1979.
15. Foster, C., Daniels, J.T. and Yarbrough, R.A. Physiological and trainingcorrelates of marathon running performance. Aust J Sports Med, 9, 58-61,1977.
16. Foster, C. VO2-max and training indices as determinants of competitive running
performance. J Sports Sci, 1, 13-22, 1983.

145
TRAINING PRINCIPLES IN DISTANCE RUNNING
17. Fox, E.L., Bartels, R.L., Billings, C.E., Mathews, D.K., Bason, R. and Webb,W.M. Intensity and distance of interval training programs and change inaerobic power. Med Sci Sports, 5(1), 18-22, 1973.
18. Fox, E.L., Bartels, R.L., Billings, C.E., O’brian, R., Bason, R. and Mathews, D.K.Frequency and duration of interval training programs and change in aerobic power.J Appl Physiol, 38(3), 481-484, 1975.
19. Gaesser, G.A. and Rich, R.G. Effects of high- and low- intensity exercise trainingon aerobic capacity and blood lipids. Med Sci Sports Exerc, 16(3), 269-274, 1984.
20. Gettman, L.R., Pollock, M.L., Durstine, J.L., Ward, A., Ayres, J. and Linnerud,A.C. Physiological responses of men to 1, 3, and 5 day per week trainingprograms. Res Q, 47(4), 638-646, 1976.
21. Gregory, L.W. The development of aerobic capacity: A comparison ofcontinuous and interval training. Res Q, 50(2), 199-206, 1979.
22. Hagan, R.D., Smith, M.G. and Gettman, L.R. Marathon performance in re-lation to maximal aerobic power and training indices. Med Sci Sports Exerc,13(3), 185-189, 1981.
23. Henriksson, J. Training induced adaptation of skeletal muscle and metabolismduring submaximal exercise. J Physiol (Lond), 270(3), 661-75, 1977.
24. Henritze, J., Weltman, A., Schurrer, R.L. and Barlow, K. Effects of training at andabove the lactate threshold on the lactate threshold and maximal oxygen uptake.Eur J Appl Physiol, 54, 84-88, 1985.
25. Hickson, R.C., Foster, C., Pollock, M.L., Galassi, T.M. and Rich, S. Reducedtraining intensities and loss of aerobic power, endurance and cardiac growth.J Appl Physiol, 58(2), 492-499, 1985.
26. Houston, M.E., Wilson, D.M., Green, H.J., Thomson, J.A. and Ranney, D.A.Physiological and muscle enzyme adaptations to different intensities of swimtraining. Eur J Appl Physiol, 46, 283-291, 1981.
27. Ivy, J.L., Withers, R.T., van Handel, P.J., Elger, D.H. and Costill, D.L. Musclerespiratory capacity and fiber type as determinants of the lactate threshold.JAppl Physiol: Respirat. Environ. Exercise Physiol, 48(3), 523-527, 1980.
28. Karvonen, M.J., Kentala, E. and Mustala, O. The effects of training on heartrate. A “longitudinal” study. Ann Med Exper Biol Fenn 35, 307-315, 1957.
29. Keith, S.P., Jacobs, I. and McLellan, T.M. Adaptations to training at theindividual anaerobic threshold. Eur J Appl Physiol, 65, 316-323, 1992.
30. Lindsay, F.H., Hawley, J.A., Myburgh, K.H., Schomer, H.H., Noakes, T.D.,Dennis, S.C. Improved athletic performance in highly trained cyclists afterinterval training. Med Sci Sports Exer, 28(11), 1427-1434, 1996.
31. Madsen, K., Franch, J. and Clausen, T. Effects of intensified endurance trainingon the concentration of Na, K-ATPase and Ca-ATPase in human skeletalmuscle. Acta Physiol Scand, 150, 251-258, 1994.
32. Massicotte, D.R. and Avon, G. Cardiovascular adaptation as a function ofthe intensity and duration of training of young women. Can J Appl Sport Sci,8(4), 260-265, 1983.
33. Marti, B., Abelin, T. and Minder, C.E. Relationship of training and life-styleto 16-km running time of 4000 joggers. Int J Sports Med, 9, 85-91, 1988.
RUNNING & SCIENCE
146
34. Milesis, C.A., Pollock, M.L., Bah, M.D., Ayres, J.J., Ward, A. and Linnerud, A.C.Effects of different duration’s of physical training on cardiorespiratory function,body composition, and serum lipids. Res Q, 47, 716-725, 1976.
35. Mikesell, K.A., Dudley, G.A. Influence of intense endurance training onaerobic power of competitive distance runners. Med Sci Sports Exerc, 16(4),371-375, 1984.
36. Moffatt, J.R., Stamford, B.A. and Neill, R.D. Placement of tri-weekly trainingsessions: importance regarding enhancement of aerobic capacity. Res Q, 48(3),583-591, 1977.
37. Murphy, M.H. and Hardman, A.E. Training effects of short and long bouts ofbrisk walking in sedentary women. Med Sci Sports Exerc, 30(1), 152-157, 1998.
38. Murrey, T.D., Zingraf, S.A. and Shea, C. The relationship of selected trainingvariables on performance in marathon running. Med Sci Sports Exerc (Abstract),12, 81, 1980.
39. Nordesjö, L.O. The effect of quantified training of the capacity for short andprolonged work. Acta Physiol Scand 90, Suppl. 405, 1974.
40. Pollock, M.L., Cureton, T.K. and Greninger, L. Effects of frequency of trainingon working capacity, cardiovascular function, and body composition of adultmen. Med Sci Sports, 1(2), 70-74, 1969.
41. Pollock, M.L., Miller, H.S., Linnerud, A.C. and Cooper, K.H. Frequency oftraining as a determinant for improvement in cardiovascular function andbody composition of middle-aged men. Arch Phys Med Rehabil, 56, 141-145,1975.
42. Rusko, H. The effect of training on aerobic power characteristics of youngcross-country skiers. J Sports Sci, 5, 273-286, 1987.
43. Rusko, H., Rahkila, P. Effect of increased intensity of training on maximumoxygen uptake and muscular performance of young female cross-countryskiers. Med Sport, 14, 187-194, 1981.
44. Saltin, B., Blomqvist, G., Mitchell, J.H., Johnson, R.L.Jr., Wildenthal, K. andChapman, C.B. Response to exercise after bed rest and after training.Circulation, 38(5 Suppl.), VII, 1-78, 1968.
45. Schantz, P., Henriksson, J. and Jansson, E. Adaptation of human skeletalmuscle to endurance training of long duration. Clin Physiol 3, 141-151, 1983.
46. Scrimgeour, A.G., Noakes, T.D., Adams, B. and Myburgh, K. The influenceof weekly training distance on fractional utilization of maximum aerobiccapacity in marathon and ultramarathon runners. Eur J Appl Physiol, 55, 202-209, 1986.
47. Sharkey, B.J. Intensity and duration of training and the development ofcardiorespiratory endurance. Med Sci Sports, 2(4), 197-202, 1970.
48. Shephard, R. Intensity, duration and frequency of exercise as determinantsof the response to a training regime. Int Z angew Physiol einschl Arbeitsphysiol,26, 272-278, 1968.
49. Sjödin, B. and Jacobs, B. Onset of blood lactate accumulation and marathonrunning performance. Int J Sports Medicine, 2, 23-26, 1981.

147
TRAINING PRINCIPLES IN DISTANCE RUNNING
50. Sjödin, B., Jacobs I. and Svedenhag, J. Changes in blood lactate accumulation(OBLA) and enzymes after training at OBLA. Eur J Appl Physiol, 49, 45-57,1982.
51. Sjödin, B. and Svedenhag J. Applied Physiology of marathon running. SportsMed, 2, 83-99, 1985.
52. Slovic, P. Empirical study of training and performance in the marathon. ResQ, 48, 769-777, 1977.
53. Smith, D.J. and Wenger, H.A. The 10-day aerobic mini-cycle: The effects of inter-val or continuous training at two different intensities. J Sports Med, 21, 390-394,1981.
54. Svedenhag, J. and Sjödin, B. Physiological characteristics of elite male runners inan off season. Can J Appl Spt Sci, 10(3), 127-133, 1985.
55. Tabata, I., Nishimura, K., Kauzaki, M., Hirai, Y., Ogita, F., Miyachi, M. andYamamoto, K. Effects of moderate-intensity endurance and high-intensityintermittent training on anaerobic capacity and VO2-max. Med Sci Sports Exerc,28 (10), 1327-1330, 1996.
56. Weltman, A., Weltman, J.Y., Schurrer, R., Evans, W.S., Veldhuis, D. and Rogol,A.D. Endurance training amplifies the pulsatile release of growth hormone:effects of training intensity. J Appl Physiol, 72(6), 2188-2196, 1992.
57. Wenger, H.A. and Macnab, R.B.J. Endurance training: The effects of intensity,total work, duration and initial fitness. J. Sports Med, 15, 199-211, 1975.
58. Westgarth-Taylor, C., Hawley, J.A., Rickard, S., Myburgh, K.H., Noakes, T.D.and Dennis, S.C. Metabolic and performance adaptations to interval training inendurance-trained cyclists. Eur J Appl Physiol, 75, 298-304, 1997.
59. Weston, A.R., Myburgh, K.H., Lindsay, F.H., Dennis, S.C., Noakes, T.D. andHawley, J.A. Skeletal muscle buffering capacity and endurance performanceafter high-intensity training by well-trained cyclists. Eur J Appl Physiol, 75, 7-13, 1997.
60. Yeager, S.A. and Brynteson, P. Effects of varying training periods on thedevelopment of cardiovascular efficiency of college women. Res Q, 41(4),589-592, 1970.

RUNNING & SCIENCE
148

149
TRAINING VOLUME AND INTENSITY
Training volume and intensity
Leif Inge Tjelta and Eystein Enoksen
SynopsisA review of relevant literature, current research and experience offamous coaches and athletes show that: The most successful longdistance runners through the last 30 years run between 140-250 km per week. 5000 m and 10000 m runners do work loadsbetween 160-200 km, while marathon runners in certain weekshave training volume up to 250 km per week. The best femalelong distance runners run the same amount of kilometre per weekas the international elite for men. Several world class long distancerunners claim that training intensity is equally important astraining volume. However, athletes are responding differently totraining and only a few athletes have got the genetic dispositionsto become world class runners.
IntroductionIn this article we will venture to give a survey of characteristics in thedevelopment of some training theories, theories which are at the basisof successful long distance runners in this century. Thereupon we willdefine the terms training volume and training intensity. In the paragraphon training volume we will try to show the amount of training done bysome successful runners.

RUNNING & SCIENCE
150
In conjunction with the term training intensity we will discuss in whichway certain coaches and physiologists subdivide training zones as wellas the effect of training in the various zones.
Finally, we will concentrate on the training of three female long di-stance runners, namely Grete Waitz, Ingrid Kristiansen and SoniaO’Sullivan. We will try to compare training volume as well as trainingintensity for these outstanding runners.
Historical review of training theoriesThe theories which form the basis for the training of long distancerunners have undergone some changes over the last 70 years. Thesetheories have been influenced as well by the ideas of some acknowledgedcoaches as by physiological research.
Coaches who have been associated with good athletes tend tobecome trend-setters for other contemporary coaches and athletes.Consequently, a historical review of the main development in trainingtheory can thus be exemplified by the following coach athlete rela-tions:• 1920s - 1930s: Lauri Pikhala - Paavo Nurmi (Finland). They deve-
loped a system which was a precursor of interval training (6).• 1930s: Woldemar Gerschler - Rudolf Harbig (Germany). Gerschler
introduced the term „interval training“ (6).• 1940s - 1950s: Gøsta Holmer - Gunder Hägg and Arne Anderson
(Sweden). These legendary Swedes developed „fartlek“ as a trainingmethod (6).
• 1950s: Miholov Igloi - Sandor Iharos, Laszlo Tabori and SandorRozsnyi (Hungary). The Hungarian based his ideas on Gerschler’sprinciples on interval training, but he differed from Gerschler byalso using a higher training intensity. Igloi held the idea that therunner should train twice a day (6).
• 1960’s: Ernest Van Aaken - Harold Norpoth (West Germany) builttheir training principles on the idea that long steady running oughtto be the basis of efficient long distance training (42).
• 1960s: Arthur Lydiard - Peter Snell (New Zealand). The New Zea-lander had the philosophy that 800 m runners as well as marathonrunners must have a basic training period rooted on long distance

151
TRAINING VOLUME AND INTENSITY
running. During this period they were to run 160 km per week.Thereupon followed a period of hill running (6-8 weeks) and a periodof 10-12 weeks of track training leading up to that „year’s run“ (25).
Several coaches have also been influenced by physiologists and re-search. Woldemar Gerschler is an example of this in close cooperationwith the physiologist Herbert Reindell (6). Norpoth’s coach Van Aakenhad a background as a researcher (6). The research done by the Italianphysiologist Conconi, who determined the anaerobic threshold by non-invasive field tests (7), is one of many examples of how physiologicalresearch was used by coaches and athletes.
Some athletes had also developed their training theories based ontheir own experience, without any strong influence of coaches andphysiologists. The four-time Olympic champion Emil Zatopek mayserve as an example of this. Zatopek would run more kilometres perweek than top runners had done before him (21). Zatokpek, on oneoccasion, when pursuing a theory that running whilst holding his breathwould enhance his competitive performance, he was found unconsciousat the side of the road. He had been trying to beat his own record forthe number of telephone poles he could pass.
With a basis in the examples above we will use the term experts forcoaches and physiologists who have introduced theories and trainingmethods in long distance running. These theories may be founded onpractical experience as well as research.
Let us now have a closer look at what kind of training some recog-nised experts have advocated for long distance runners over the lasttwo decades. We have chosen the following: Martin, D.E. USA andCoe, P., England (26); Gambetta, V., USA (12); Pisuke, A. andNurmekivi, A., The Soviet Union (34); Karikosk, O., The Soviet Union(21); Bernard, A., Canada (2); Nurmekivi, A., The Soviet Union (31);van Dam, B., West Germany (43); van den Eynde. Belgium (44) andSteffney, M., West Germany (39).
Martin and Coe (26) refer to the book: „Training Distance Runners“which was written by the American physiologist David E. Martin andthe English trainer Peter N. Coe, the father and coach of SebastianCoe. The other experts have stated their views on long distance runningin various articles in international periodicals.
We shall also be referring to some other experts.

RUNNING & SCIENCE
152
To be able to evaluate differing theories and views on long distancerunning we consider it important to clarify what we as well as theexperts understand with the very central terms: training volume andtraining intensity.
Training volumeThe term training volume may have two meanings in training theory(13):A.The totality of training effort or work done per time unit (day, week, month,
year) Based on the principles of mechanics this means thatwork = efficiency x time or: work = intensity x time.
B. The duration, the extent or the totality of measured in for instance thenumber of kilometres or miles per time unit (day, week, month oryear).
The meaning in B is the one most widely used in international literat-ure on running. This is also the meaning used by the above mentionedexperts and as a basis for what is here mentioned about training volume.When we use the term training volume we will take it in meaning B.Nevertheless, the connection between intensity and time is alwaysimportant, and there is no doubt that the amount of work is greaterwhen you run a certain distance (e.g. 10 km) at a speed of 16 km perhour instead of at a speed of 14 km per hour.
The Estonian Olav Karikosk (21), who is particularly preoccupiedwith the relation between training volume and achievements, hascollected such data for many of the world’s best long distance runners.One of the most striking traits in the development in long distancetraining these last 50 years has been the sheer volume in training. Theone responsible for the first big increase in training volume was EmilZatopek. When Zatopek improved Gunder Hägg’s world record byone second, from 13:58.2 to 13:57.2 min:s, he annually ran three tofour times as many kilometres as Hägg had done. When Zatopek sethis last world record in the 10000 m (28:54.2 min:s) in 1954, his annualtraining volume was 8086 kilometres.
Zatopek’s record was beaten by the double Olympic champion fromMelbourne in 1956, Vladimir Kuts, who, compared to Zatopek, re-duced the training volume considerably and increased training intensity.

153
TRAINING VOLUME AND INTENSITY
Kuts would run 5000-6000 kilometres per year when he was at his best.Pyotor Bolotnikov had similar training volumes the year he set his twoworld records on 10000 m: 28:18.8 (5700 km/year) and 28:18.2 min:s (6000km/year).
Ron Clarke, who pushed Kuts and Bolotnikov out of the result lists,states that he was preoccupied neither with counting kilometres norwith filling in log books for his training. Clarke estimates that heaveraged 160 kilometres per week in 1963 when he set his first 10000 mworld record (28.15.6 min:s). Later on, however, he reduced the trainingvolume and increased the intensity. Clarke emphasises that intensity ismore important than volume, and that the achievements are improvedthrough intense training, not through steady speed over innumerablekilometres.
The Kenyan top class runner Henry Rono, who set records in 3000(7:32.1 min:s), 5000 (13:08.4), 10000 (27:22.4) and 3000 m steeple-chase (8:05.4) in 1978, averaged 150-170 km/ week, which also goesfor the Ethiopian Miruts Yifter (Olympic gold in the 5000 metre andthe 10000 m in 1980). The Englishman David Moorcroft, who ran the5000 m in 13:00.41 min:s (world record) in 1982, on the averagecovered 150-160 km per week during the years 1981 and 1982. TheEuropean champion of 1982, the German Thomas Wessinghage, ran130-140 km with intensive training per week (the article by Karikoskdoes not express what he means by “intensive”).
Karikosk maintains that the results of his survey suggest that topresults have been achieved with varying training volumes, and thatthe runners with the highest training volume frequently have sufferedinjuries. The Finns Juha Vaatainen (European champion in the 5000and the 10000 m in 1971) and Kaarlo Maaninka (bronze – in the 5000and silver medallist 10000 m in 1980) could be cited as examples ofthis. These two runners respectively covered 10000 km and 12000km per year the years they took their medals. Lasse Viren ran 7390km per year when he won the Olympic gold medal in 1972. When herepeated the feat four years later his annual training volume was nearlythe same (7300 km), but the intensity was higher.
The Soviet runner Valery Abramov is mentioned in connection withthose who run fast but with a relatively low kilometer volume; in 1981he did 13:11.99 min:s on the 5000 m with a yearly training volume of5900 kilometers.

RUNNING & SCIENCE
154
Four Norwegian male long distance runners, Knut Kvalheim, Per Halle,Knut Børø and Arne Kvalheim, were competing at an international levelin the seventies. They would run between 160 and 190 km in weekly ave-rage for the preparation period (November – April) during the years theyachieved their best results in the 3000, 5000 and 10000 m. During thecompetition period (May – the end of August) the average training di-stance was lowered to 142-158 km per week (15).
Noakes (30) has also studied the training volume of some of the all-timetop long distance runners. He concludes that the best runs were done byathletes who covered between 150-200 km per week. He further maintainsthat the best marathon runners as Kohlemainen, Nurmi, Zatopek, Peters,Edelen, Clayton, Shorter, de Castella, Salazar, Jones and Lopes were ex-cellent track or cross country runners before having success in marathons.
With a basis in his survey Karikosk (21) claims that an increase in trainingvolume will not necessarily lead to better achievements. Noakes (30) holdsthe same opinion. There are also other sides to training that should beemphasised. Training intensity is one of them. Karikosk and Noakes do,however, not have adequate data on the training intensity of their runnersto make comparisons, or for that sake, draw any conclusions. Klemm (22)maintains that the training volume of a 10000 m elite runner should bebetween 150-200 km per week. For a marathon runner of internationalstanding it ought to be somewhat higher (200-250 kilometres per week).
Steffney (39) states that the training volume for a long distance runnermust be increased according to the improvements made by the athlete.Steffney recommends that the athletes who have realistic hopes ofrunning the 10000 m in 28 minutes should run 180 km per week duringthe preparation period (October - March). Athletes who aim to do it inapproximately 30 minutes should run 140 km per week. Steffneysubstantiates his training theories by listing athletes who have beentraining according to the directions he is outlining.
The last two decades international long distance runners have beengreatly dominated by African runners. The Kenyan runners on a se-nior level run between 160-200 km per week (9), and the trainingvolume of Moroccan runners (38) is about the same level. Kenyan aswell as Moroccan long distance runners are recognised by the qualityof their aerobic training. Moroccan runners do five sessions each weekwith hill running, interval running or fartlek during the winter season.The remaining nine weekly running sessions are 50-60 minutes di-stance running (38). The Kenyans mostly do distance running during the

155
TRAINING VOLUME AND INTENSITY
winter season (November – February). The intensity of the distance runsare very often close to the anaerobic threshold (9). The anaerobic thresholdis the highest level of exercise where the energy needs for the organismcan be covered exclusively by aerobic metabolism (26).
All long distance runners mentioned by Karikosk (21) and Noakes(30) in connection with the discussion on efficient training volume aremen. Then we may apply question if this training volume should alsobe recommended for the best female runners. The British middle andlong distance coach Norman Brook (6) maintains that female runnerswho want to make it to the top in long distance running must train justas much as the best men. Any differences in training volume shouldbe related to training and achievement, not to differences in sex. TheItalian long distance coach Giampaolo Lenzi (23) who was the coachof Laura Fogli, the silver medallist in the marathon in the EuropeanChampionship in Ahtens in 1982, holds the same opinion. TheOlympic champion at the 10000 m in 1988, Olga Bondarenko, wouldrun 160-180 km for two out of three weeks during her basic trainingperiod. The third week she would reduce the training volume to 100-110 km (5).
According to the Portuguese long distance coach Pompilio Ferreira(11) Rosa Mota who was European champion in marathon in 1982,would run an average of 150 km per week in 1981-1982.
It has been claimed that the Chinese female long distance runnerswho in 1992 set world records in the 3000, 5000 and 10000 m, wouldrun a marathon distance daily (42195 m) during their basic trainingperiod (24). This would correspond to approximately 295 km per week,a training volume which is considerably higher than what isrecommended by the above mentioned experts.
To Van Dam (43) there does not seem to be any fundamental diffe-rence in the training of men and women. He does however underlinethe fact that the increased production of the female sex hormone in theweek preceding the menstruation may result in lower achievements inthis period. Jansson (17) states that opinions differ as to whether thepotential for achievement fluctuates during the various phases of themenstrual period. According to Jansson (17) some studies show nodifference. Jurkowski (18) on the other hand showed that the achieve-ments were better and the level of blood lactate was lower during thelast part of the menstrual period than during the first part.
RUNNING & SCIENCE
156
Several studies have shown that there is a correlation between the degreeand the frequency of menstrual irregularities and the training volumemeasured in kilometres per week (30). In a study (10) it was discovered that43% of female athletes who ran more than 128 km per week had irregularmenstruation. Furthermore there was a parallel relationship between lackingmenstruation and weekly training volume. There is, however, no indicationof an absolute kilometre level above which training will lead to a loss ofmenstruation. Which again means that there is great individual variationin the adaptation to training volume (30). Consequently, the mechanismswhich cause great training volumes to influence the regularity of menstrua-tion seem to be a combination of several factors (30).
Tomten (41) who has been doing research on osteoporosis among femalelong distance runners, found that menstrual irregularities are commonwith young female runners who develop osteoporosis. She also discoveredan overrepresentation of menstrual irregularities among the best runners.
Several studies conclude that there is no connection between trainingand menstrual status for female runners (27, 36, 37, 45).
Training intensityThere are two ways to express training intensity (13):
A:As an absolute entity. In endurance sports training intensity will thusbe defined as meters per second, kilometres per hour or VO2 per minute
B: As a relative entity. The work done is expressed in a percentage of whatthe athlete could achieve at the maximum of his or her training condit-ion. In endurance sports it is usual to express training intensity in apercentage of: VO2
-max, maximum HR (heart rate) speed and HR atthe anaerobic threshold or at competition speed.
For the further discussion we shall be using Figure 1 as a point ofdeparture in order to have an adequate system of reference. Figure 1shows examples of a scale of intensity, and also how some parametersand training methods vary when the intensity increases. Figure 1describes training intensity as a relative entity.

157
TRAINING VOLUME AND INTENSITY
Figure 1. An example of a scale of intensity for endurance training for a welltrained athlete with a maximum heart frequency of 190 beats • min-1 and a restfrequency of 50 beats • min-1. The figure generally illustrates how certain physio-logical parameters and training methods vary when intensity increases (13).
(mmol•l-1)

RUNNING & SCIENCE
158
Most experts mentioned above divide long distance training into threezones of intensity, namely:• Aerobic intensity zone, which corresponds to what we in Figure 1 have
classified as very low, low and moderate work load. Exertions withmoderate work load (70-80% of VO2
-max) are however classified as aerobic/anaerobic training by experts like Pisuke and Nurmekivi (35).
• Aerobic/anaerobic intensity zone, which corresponds to high or veryhigh work load (Figure 1).
• Anaerobic intensity zone, which corresponds to an area of intensitywhich in Figure 1 is classified as maximal work intensity. Someexperts also place work intensities which in Figure 1 appear as veryhigh, under the label anaerobic (33, 44).
Martin and Coe (26) divide efficient training into four zones of intensity.They also use different terms for these zones than the other authors.We will return to this later on.
Aerobic intensity zone
In this intensity zone the strain is 50-70/80% of the strain at O2-max.This corresponds to figure 1 where low work load is defined as 50/55-65/70% of the strain at VO2
-max, and that moderate work intensity is 65/70-80 of VO2-max. The concentration of blood lactate is below the anaerobicthreshold (AT). With a reference to Figure 1 we see that the blood lactateconcentration is estimated to be 1-2 mmol•l-1 at these levels of strain.Several experts quote higher values of lactate in this intensity zone. Thiscan be ascribed to the fact that different testing procedures give differentvalues of lactate (14).
Most training for long distance runners should be done in this zoneof intensity according to the above mentioned experts. The length ofthe training sessions in the aerobic intensity zone are usually between8 and 35 km. The training is most often in the form of continuouswork over long distances. Training in this zone is frequently referredto as „basic training“ or „conversational training“ because it is steadyenough to allow conversation while running. If the heart rate (HR) istaken as a measure of training intensity the heart rate is around 70-80% of maximum heart rate. This training will, according to Martinand Coe (26) have the following effects:

159
TRAINING VOLUME AND INTENSITY
• It will serve to improve oxidative metabolic capabilities in cardiac muscleand those skeletal muscle cells that are activated (type 1 fibres).
• It provides a stimulus for improving joint and tendon strength withoutexcessive impact stress, which would be the result at faster paces.
• Increases occur in the quantity of stored fuels (carbohydrates and fattyacids).
• It will lead to increase as well in number as in size of mitochondriain the stimulated muscle cells.
• Increasing blood volume and capillary density in trained musclewill improve O2 delivery and CO2 removal.
• The sustained increased venous return to the heart, particularly du-ring longer runs, provides an initial stimulus toward enlarging ven-tricular chambers, eventually increasing stroke volume and permit-ting a given volume to be pumped at lower heart rate. This will leadto lower resting heart rate.
Martin and Coe maintain that running at a speed slower than 55% of thespeed at VO2
-max has little aerobic value. Pisuke and Nurmekivi (34) termtraining below 50% of VO2-max speeds as restitution training. Figure 1defines training where the intensity is below 55% at the effort at vO2
-maxas restitution or training at very low intensity.
Aerobic / anaerobic intensity zone
Training in this intensity zone produces increased stimulation of heartand the cardiovascular system (26) Training in the aerobic / anaerobicintensity zone is also important as concerns the effect of training ofthose muscle cells that are above the strain level in the aerobic intensityzone (26). Running intensity in this zone covers speeds from somewhatlower to somewhat faster than the running speeds for the anaerobicthreshold. (2, 26, 31, 34, 39, 43).
By applying the measuring method which is usually used in Norwaytoday in order to determine the anaerobic threshold (AT), it wasdiscovered that the eight best female long distance runners in Norwayin 1994-1995 had an oxygen uptake at AT which was from 83-89% of VO2-max (40). The test is organised as a progressive running proceedure overfive steps, where lactate, oxygen uptake and heart rate are measured at theend of each working load. Lactate measured at loads lower than AT are

RUNNING & SCIENCE
160
stable after 2-5 minutes. 5 minutes are chosen as working time. The firstload is approximately 60% of the VO2
-max load. For each increase in workload the oxygen uptake will be 6-7% higher and the heart frequency willincrease with approximately ten beats per minute. The test contains of fivedifferent working loads. AT is set to be the running speed (km per hour),oxygen uptake and heart frequency which correlates to a lactate concent-ration in blood which is 1.5 mmol•l-1 above the lovest measured test value(1). Bompa (4), Martin and Coe (26) and Nurmekivi (32) also claim thatAT lies in this percentage area of VO2
-max.In Figure 1 we also see that the lactate value at AT is approximately 2.5
mmol•l-1. Frequent measurements of the best female long distance runnersin Norway during 1994-95 showed that their AT, measured by themeasurement methods used in Norway today (1), lay about 2.05 and 2.72mmol•l-1 (40). Measurements for male runners generally show similarvalues. Some literature refers to other methods of measurements, whichby using the same percentage of exertion, would have given an AT about4 mmol•l-1 (12, 26).
Martin and Coe (26) characterise training in the zone around AT as:anaerobic conditioning because training at speeds above the anaerobicthreshold will result in a rapid concentration of lactate in the blood.
While Pisuke and Nurmekivi (34) say that speeds between 70-100% ofVO2-max lie in this zone, this covers two of the zones in Coe and Martin’s(26) system. In figure 1 this spans the three intensity zones; moderate, highand very high workload. All experts agree that training in the intensityzone 70-100% of the speed at VO2-max should contain continuous workas well as interval training.
Continuous work is an efficient form of training which corresponds to70/75-85/90% of the speed at VO2-max. Other experts recommend bothcontinuous work and long interval training in this intensity zone. (2, 13,34, 39).
There is general agreement that interval training is an efficient form oftraining when the intensity of the training is between 90-100% of the speedat VO2-max. According to Martin and Coe (26) these are speeds thatcorrespond to the speed of the distances 1000-3000 m. They call trainingin this training zone aerobic capacity training and recommend long inter-val training (distances from 800-3000 m). The total running distances shouldbe from 6-8 km. This corresponds well with Bernard (2) who says that 8-9x 800 m with 2-3 minute recovery is what he recommends for training at

161
TRAINING VOLUME AND INTENSITY
10000 speed. Steffney (39) also recommends forms of training at a level ofintensity which corresponds to this.
Coe and Martin (26) list the following training effects in the intensityzone close to the anaerobic threshold corresponding to 75-90% of thespeed at VO2
-max:• It will develop stamina.• ST fibres and some FT fibres (Type IIa) will be developed.• Increased heart chamber size.• Increased stroke volume.• Increased oxidative/glycolytic enzymes.• Increased blood volume.
Nurmekivi (31) states that continuous running at steady state pace inthe area close to the athlete’s anaerobic threshold has the followingeffects:• The improvement of blood supply through the development of capil-
laries.• An increase in the number of capillaries.• The capacity to eliminate accumulated lactate faster during work.• An increase in the contraction capacity of the heart muscle.
If the effect of the training is in the area from 90-100% of the speed at VO2-max Martin and Coe (26) claim that the physiological adaptations resultingfrom this kind of training include:• Increased glycolytic enzymes in working muscles.• Some increase in blood buffering ability.• Some increase in neurological recruitment.• ST and FT fibre development.• Development of speed.
Anaerobic intensity zone
Training with an intensity of 100% or more of the speed at VO2-max isdefined as anaerobic training by all experts. In Figure 1 this is classifiedas training which gives the highest strain in this area; very high workintensity as well as maximum work intensity. There is, however, somedisagreement concerning the extent as well as the actual exaction of suchtraining for long distance runners.

RUNNING & SCIENCE
162
Gambetta (12) calls anaerobic training „repetition training“. This is notto be confused with interval training. The training distances should beabout ½ to ¾ of the competition distances. Between the repetitions thereshould be long breaks and good restitution. Van den Eynde (44) on theother hand recommends high intensity and short breaks to developanaerobic endurance. As examples of such training he mentions:• Speed running from 200-1000 m with short breaks (100-200 m jogging)• Variations in speed (ins and outs) for 1000-2000 m in one or two series
with 4-6 minute serial pauses.• Several repetitions with hill running from 200-800 m, where running
down the hill again to the starting point constitutes the pause.• Speed training after a spell of aerobic training, or separate speed
training. 80-150 m sprint with short pauses between are thoserecommended.
Pisuke (33) holds the opinion that anaerobic training should constituteabout 5-10% of the annual total training volume of a senior athlete. Butthen Pisuke also considers training intensities from 95-100% of VO2
-maxas anaerobic training. Junior runners should hold a lower percentage.Together with Gambetta he also recommends repetitions. In addition hebelieves that interval training, hill running, and several variations of jumpsare potentially efficient forms of training.
Bernard (2) also underlines that training in speeds which are 10-15%higher than competitive speeds must be included in the training. Ber-nard quotes no specific percentage of training as a recommended le-vel of intensity.
Nurmekivi (31) claims that anaerobic training must be related towhether the runner has speed (has a large percentage of fast musclefibres (FT)) or endurance (a majority of slow muscle fibres (ST)). En-durance runners can use longer distances in interval as well as repeti-tion training, but they should be careful about intensive interval training.Nurmekivi (31) recommends one to three track sessions per week. Weshould also be aware that training repetition on grass or trail is lesspsychologically stressing than track training.
van Dam (43) maintains the importance of training one weekly sessionwith high intensity all through the winter. In this way you avoid having todo a great number of intensive 200 and 300 meters just before the trackseason.

163
TRAINING VOLUME AND INTENSITY
Steffney (39) believes that particularly 10000 m runners should be carefulabout intensive track training during the season of competitions. The dangerlies in the emphasis on developing speed to the detriment of endurance.Steffney suggests speed alternations (20 x 50 m) as well as sessions atcompetitive speed for 1500, 3000, 5000 and 10000 m as forms of anaerobictraining.
Martin and Coe (26) say that the purpose of anaerobic capacity trainingis to improve speed and strength. Furthermore such training improves theability to take speed changes and the ability to finish a race well. The 1500m as well as the 3000 m are run with over 100% of the speed at VO2-max,and consequently it is important to develop the ability to perform with asteadily growing level of blood lactate in the muscles that are being strained.Martin and Coe (26) also maintain that the distances 5000 and 10000 mwill be run most successfully by the runners who in addition to maintaininga high speed and a low production of blood lactate at the final stages of therun, can add an anaerobic element the last stretch before the finish.
Training sessions which are intended to increase the anaerobic capacitymust be executed at great speed over relatively short distances. Coe andMartin (26) recommend running distances of 200-800 m and a total trainingvolume per session of 2400-4000 m.
Case studiesAt the end of this article we will analyse the training done by Grete Waitzand Ingrid Kristiansen when they were the best long distance runners inthe world. Furthermore we will discuss the training of Sonia O’Sullivanwho was the best long distance runner in 1995 and the world champion onthe 5000 m. She had a set-back in 1997 and then she managed to get aformidable comeback as the double world champion in cross country aswell as winner of 5000 m and 10000 m in the European championship in1998. We will try to evaluate the training of each runner individually duringone of the seasons she was at the top. As for Ingrid and Grete we will try tocomment on their training the years leading up to the year we have chosento concentrate on. We will also compare the training of these runners, aswell as compare it to the long distance training which is recommended bytoday’s experts.
Our information concerning Grete Waitz’ training is from her traininglog from 1973/74, from telephone conversations with her and from the

RUNNING & SCIENCE
164
previous Norwegian national coach Kai Møller (28, 29). With a basis inGrete’s training logs he has established a system of the training that Gretedid when she was a track runner. We have gained much of our knowledgeconcerning Grete’s training prior to being a senior during conversationswith Grete.
Johan Kaggestad has let us study Ingrid Kristiansen’s log book from1985/86. When he was a national coach he systematised Ingrid’straining between 18 November 1985 and 26 October 1986 (19, 20).Further information about Ingrid’s training in the years preceding the1986 season have been gained during conversations with her.
Sonia O’Sullivan was Grete Waitz’ neighbour and friend in Gaines-ville, USA. The information we have on Sonia O’Sullivan has beenrelayed to us by Grete Waitz.
Grete Waitz
Grete Waitz started athletics at the age of 12. She would compete insprint, jumping and throwing events up till the age of 14. At the age of15 she for the first time took part in races over 200 m. She ran her first800 m at the age of 16. At this age she would train 5 times a week. Shedid interval training and steady long runs up to 8-10 km. Grete saysshe trained a lot with the boys and that training intensity was relativelyhigh already at the age of 17-19. „I was able to do a kilometre in fourminutes sharp at an age of 18-19 years without making much of aneffort.“ As a 19 year old girl Grete held the following personal records:800 m 2:05.7 min:s, 1500 m 4:17.0 min:s, and 1.61 m in high jump.
„I believe the reason why I was able to take a lot of tough training asan adult without the support of a medical team was that I had establisheda sound basis through all-round training during my youth“.
Training volume and training intensity as a senior athleteFrom the autumn of 1973 Grete’s training changed. The total volume wasincreased. The percentage of her intensive sessions was very much lowered,and sprint training was dropped. Two-three times a week she would runtwice a day, thus contributing to the increase in the total number ofkilometres (28). Kai Møller (28) says that the training in 1973/74 representsthe shift to long distance training. Her training prior to 73/74 is characterisedas 800 m training (28). Eight of September 1974 Grete was number three

165
TRAINING VOLUME AND INTENSITY
in the 1500 m in the European championship. There is a comparison ofGrete’s training frequency (number of sessions) in 1971/72 and 1973/74 inTable 1, and the various types of training for the years 1971/72 and 1973/74are shown in Table 2. Møller comments: „In the season 1971/72 Grete didmainly intensive training all through the year. The training is particularlyintensive during the season of competitions. A great number ofcompetitions are not included in the table.
In 1973/74 all the year is dominated by long steady training Table 2.Note in particular the month of September with important competitions,where as much as 78% is long runs. Both July and August have 68% longruns“.
By surveying Grete’s training diary for 1973/74 we find that herweekly training volume is between 80 and 116 km. The volume issomewhat higher during the summer season than in the winter. This isdue to the fact that she during May-September more frequently runs twicea day than what she did during the period November 1973 till April 1974.The volume was reduced to 58.5 km the week before the EuropeanChampionship.
During 27 consecutive weeks from 1 January 1974 she runs an ave-rage of 90 km per week. During the same time span in 1973 she wouldrun 73.8 km per week.
Grete’s training diaries reveal that 1974 was the year she hit uponher particular form of training. The ensuing years she increased thetraining gradually. In 1975 her average training volume for the 25 weeksafter 1 January was 132 km per week. This season Grete achieved: 3000 min 8:46.6 min:s and the 1500 m in 4:07.5 min:s. From 1 January 1976 sheaveraged 160 km per week during the first 25 weeks of the year (29).
Table 1. Grete Waitz’ training frequency during the seasons 1971/72and 1973/74.
Selected months November February April July AugustNo. of sessions 1971/72: 28 32 30 21 31No. of sessions 1973/74: 40 38 36 41 42
Data from 28.

RUNNING & SCIENCE
166
This was to remain her training volume until 1978/79, the year she hadher best track runs; 4:00.6 min:s at the 1500 m in 1978 and 8:31.75 min:sat the 3000 m in 1979. She maintains that her speed during the long runswas relatively high. Grete’s training diaries do, however, not contain anyinformation about kilometre speed nor heart frequency during the longruns.
Grete tells that during the years as a marathon runner she did nothave any noticeable increase in the training volume. Some of the longruns would however be very long and calm. This is confirmed by KaiMøller (28). Her training rhythm is exemplified by the following sessionsfrom her diary for 1974 shown in Table 3.
Table 2. Types of training during the seasons 1971/72 and 1973/74 inpercentage of total training.
Data from 28.

167
TRAINING VOLUME AND INTENSITY
Table 3. Different training weeks for Grete Waitz in 1974.
One training week in February 1974Monday 4 February Long run 14 kmTuesday 5 February Long run 14 kmWednesday 6 February Long run/with speed inkrease 14 kmThursday 7 February Long run 14 kmFriday 8 February a) 4 x 1000 m, recovery 1 min
b) Long run 6 kmSaturday 9 February Intervals 25 x 300 m, recovery 15 sSunday 10 February a) Long run 10 km
b) Long run 10 km
One week of training in August 1974Thursday 1 August a) Long run 30 min
b) Fartlek 12 kmFriday 2 August a) Long run 6 km
b) Long run (last 5 km fast) 11 kmSaturday 3 August a) Long run 7 km
b) Short intervals 2 x 15 x 200 m,recovery 10-15 s.
Sunday 4 August a) Long run 7 kmb) Long run 12 km
Monday 5 August Tempo/distance at track: 1000 m(2:50), 600 m (1:37), 300 m (43.2)recovery 7:30 min.
Tuesday 6 August Long run 14 kmWednesday 7 August Short interval 2 x 12 x 150 m,
recovery 10-15 s. Serial pause 5 min
The last 2 weeks before the European Championship in Rome 1974Friday 23 August a) Long run 7 km
b) Long run 13 kmSaturday 24 August a) Long run 7 km
b) Long run 13 kmSunday 25 August a) Long run 7 km
b) Long run 13 km

RUNNING & SCIENCE
168
Monday 26 August a) Track:1000 m (2:47.5 min:s) 600 m (1:36.1 min:s),300 m 43.6 s), recovery 7:30 min.
Tuesday 27 August a) Long run 7 kmb) Long run 13 km
Wednesday 28 August No training due to infection of right legThursday 29 August Jogging for 20 minFriday 30 August Long run 13 kmSaturday 31 August Track: 1000 m (2:42.6 min:s)
600 m (1:34.9 min:s) 300 m (43.1 s)recovery 7.30 min.
Sunday 1 Septmber Long run 8 kmMonday 2 Septmber Fartlek 11 kmTuesday 3 Septmber Long run 8 kmWednesday 4 Septmber Short interval: 12 x 150 m + 10 x
100 m, recovery 10-15 s. Serialpause 5 min.
Thursday 5 Septmber 25 min jogging + couple of hillsFriday 6 Septmber a) 4-5 km jogging
b) European Championship 1500 mheat 4:11.5 min:s
Saturday 7 Septmber 25 min jogging + couple of extra turnsSunday 8 Septmber European Championship 1500 m final,
number 3. 4:05.2 min:sMonday 9 Septmber Long run 8 km
Ingrid Kristiansen
Ingrid who was born in 1956 tells that she already in pre-school agewould run and go for long walks in the fields, on foot as well as on skis.She continued doing this until she was 15/16 yr. She says that whenshe at an age of 15 yr took part in the first athletics training sheexperienced interval training emphasising time as very stressing. As a15 yr old she did the 1500 m in 4:22.0 min:s. Her basis was variedaerobic training. Ingrid took part in competitions for a long time, at ahigh level, both in cross country skiing and in running. She won severalnational championships in skiing relay. She was also a member of thenational team.
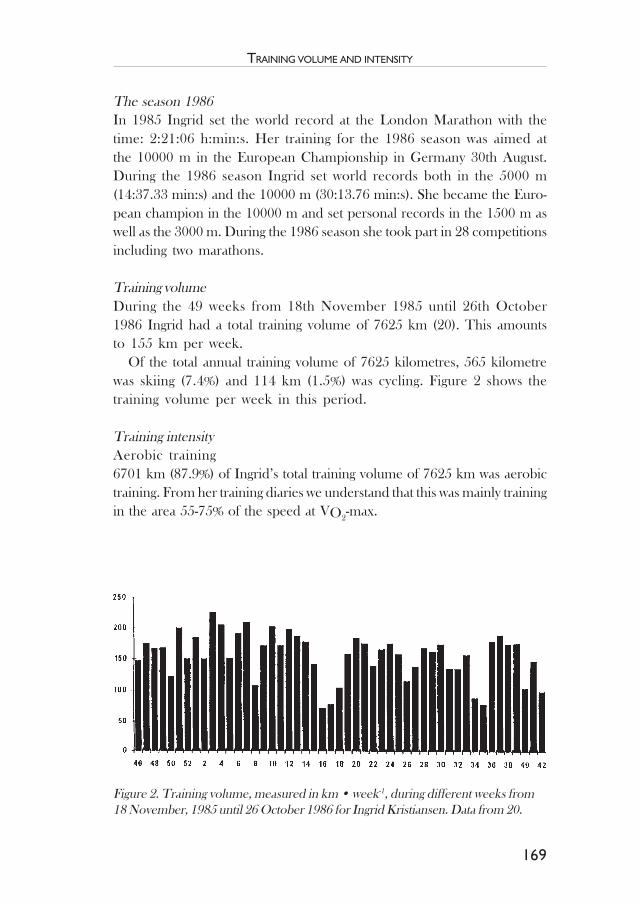
169
TRAINING VOLUME AND INTENSITY
The season 1986In 1985 Ingrid set the world record at the London Marathon with thetime: 2:21:06 h:min:s. Her training for the 1986 season was aimed atthe 10000 m in the European Championship in Germany 30th August.During the 1986 season Ingrid set world records both in the 5000 m(14:37.33 min:s) and the 10000 m (30:13.76 min:s). She became the Euro-pean champion in the 10000 m and set personal records in the 1500 m aswell as the 3000 m. During the 1986 season she took part in 28 competitionsincluding two marathons.
Training volumeDuring the 49 weeks from 18th November 1985 until 26th October1986 Ingrid had a total training volume of 7625 km (20). This amountsto 155 km per week.
Of the total annual training volume of 7625 kilometres, 565 kilometrewas skiing (7.4%) and 114 km (1.5%) was cycling. Figure 2 shows thetraining volume per week in this period.
Training intensityAerobic training6701 km (87.9%) of Ingrid’s total training volume of 7625 km was aerobictraining. From her training diaries we understand that this was mainly trainingin the area 55-75% of the speed at VO2
-max.
Figure 2. Training volume, measured in km • week-1, during different weeks from18 November, 1985 until 26 October 1986 for Ingrid Kristiansen. Data from 20.
RUNNING & SCIENCE
170
Aerobic/anaerobic training357 km (4.7%) was run in 39 sessions with a speed between 3:10 and 3:40min:s per km. These sessions were executed with continuous work overdistances of 3-23 km. Johan Kaggestad classifies this training as anaerobicthreshold training. This corresponds well with the terminology used byMartin and Coe (26). Our interpretation of Martin and Coe gives us reasonto classify this training as 70-85/90% of the speed at VO2-max. Figure 1classifies this training as moderate and high work intensity. Most coachesand physiologist would classify this as aerobic/anaerobic training.
265 km(3.5%) in 45 sessions are classified as aerobic quality training byKaggestad (aerobic capacity training; 26). This training was executed asvarious forms of interval training. It can be classified as in the upper part ofaerobic/anaerobic zone of intensity. The speed was 85/90-100% at the speedof O2
-max. According to Figure 1 this is training with high and very highwork intensity. These are speeds which correspond to the competitionspeed of the distances from 3000 m to ½ marathon (26) The total trainingin the aerobic/anaerobic intensity zone is then 622 km (8.2%).
Anaerobic trainingOnly a relatively low part, 28.3 km (0.37%) in 10 running sessions,was executed as anaerobic training, i.e. training where the speed ishigher than the speed at O2-max. In addition Ingrid would be runningsprint strides of 60-100 m at high speed after having ended her otherforms of training. She ran 166 sessions with a total of 1162 strides.This constitutes 9.3 km (0.12%). These 9.3 km with strides are classifiedas alactic anaerobic training (16).
CompetitionsIngrid took part in 28 competitions. The length varied from 1500 m tomarathon. The total length of the competitions was 273.8 km whichconstitute 3.6% of her total kilometre volume.
Strength trainingBetween 18 November 1985 and 9 June 1986 Ingrid executed 37 sessionsof strength training. These were sessions from 10 to 15 minutes with gene-ral strength training to one weekly session with aerobics lasting 70-80 min.

171
TRAINING VOLUME AND INTENSITY
Training supplenessDuring the period 18 November 1985 and 3 August 1986 Ingrid did 65sessions of training, variations of jumps. They lasted from 10 to 15 min.
Hill runningIngrid did 5 sessions of hill running over the mentioned 49 weeks. Thesesessions have already been included under the heading aerobic/ anaerobictraining.
Sonia O’Sullivan
Sonia O’Sullivan became the 1995 world champion on the 5000 m andshe won the world cup. As previously mentioned she won the short as wellas the long cross country distances in the world championship in 1998, shealso won 5000 m and 10.000 m in the European championship this year.The training data presented in Table 4 are three representative weeks of1994/95.
Table 4. Training of Sonia O’Sullivan 1994-1995.
End of November (London Base, Teddington)Sunday long steady run 1 hour 45 min, appr. 15-16 milesMonday Session 1 10 miles steady
Session 2 5 miles steady + circular trainingTuesday Session 1 10 x hill runs (appr. 1 min duration)
Session 2 7 miles + weightsWednesday Session 1 10 miles steady
Session 2 5 miles steadyThursday Session 1 6 miles steady
Session 2 Cricket field session. (1/2 mile + 1 mile) x 2with 1 min recovery
Friday Session 1 11miles steadySession 2 5 miles steady
Saturday Session 1 7 miles fast, time 39:12 min:s (3:32 min•km-1)run in a park.
Total weekly volume: 100 miles

RUNNING & SCIENCE
172
February/March (Australia)Sunday Long steady run 1 hour 50 min, 15-16 milesMonday Session 1 10 miles
Session 2 5-6 miles + weightsTuesday Session 1 3 miles steady
Session 2 track session: 5 x 1000 m. Time 2:50 min:s.Recovery: 120 s.
Session 3 5-6 miles steadyWednesday Session 1 9 miles steady
Session 2 5-6 miles steadyThursday Session 1 Hill runs. 10 x 65 s.
Session 2 6 miles steadyFriday Session 1 9 miles steady
Session 2 5-6 miles steady + weight trainingSaturday Session 1 3 miles steady
Session 2 Track session. 3 x (4x400 m). Time 62-65 s.Recovery: 1 min
Session 3 5 miles steady
July /August (Teddington London)Sunday Session 1 From 45 to 60 min steady runsMonday Session 1 6 miles steady
Session 2 6 miles steadyTuesday Session 1 15 to 20 min steady runs
Session 2 Track session. 1200 m (3:15 min:s) 1000 m (2:45),800 m (2:08), 600 m (1:35), 400 m (1:00),200 m (0:28) (recovery are not quoted)
Session 3 4 miles steadyWednesday Session 1 6 miles steady
Session 2 5-6 milesThursday Session 1 15 to 20 min steady run
Session 2 Track session. 2 x (4x300 m). Time 46-47 s.Recovery: 1 min
Session 3 4 miles steadyFriday Session 1 20 min steady
Session 2 20-30 min jogging + some hill runsSaturday Session 1 3-4 miles steady
Session 2 Competition (1500, 3000 or 5000 m).
173
TRAINING VOLUME AND INTENSITY
Training volumeDuring the period November until the beginning of May O’Sullivan wouldusually run 100 miles (160 km) per week. The highest distance that SoniaO’Sullivan covered during one week of 1995 was 112 miles (180 km). Duringthe competition period she ran 72-75 miles (115-120 km) per week.
Training intensityAccording to Grete Waitz (1995) O’Sullivan does her steady long runswith a speed of about 3:45 and 3:50 min•km-1. To O’Sullivan thesewould constitute training in the boarder area between low and mode-rate work intensity (Figure 1). The longest trips on Sundays duringbasic training periods are calmer; 4:00-4:10 min•km-1. This is training withlow work intensity (Figure 1).
Winter training 1994-1995The Saturday sessions that O’Sullivan does in her winter training arewith high work intensity.Session 1 Tuesday (10 x hill runs) and session 2 Thursday ((½ miles +1mile) x 2) we would estimate to be training in the boarder area betweenhigh and very high work intensity (Figure 1).
Training during the spring of 1995Two weekly sessions during the period February/March were executedwith very high work intensity. These sessions are the session 2 onTuesday (5x1000 m, Time: 2:50 min:s) and the session 2 on Saturday(track session 3 x (4x400 m), time: 62-65 min:s). Session 1 on Thursday(Hill session 10 x 65 s) is training in the boarder area between high andvery high work intensity (Figure1).
Summer training 1995In addition to one weekly competition during the summer of 1995O’Sullivan trained two sessions per week with very high work intensity.These were done on the track Tuesday and Wednesday in July/August.
RUNNING & SCIENCE
174
Similarities and differences in the training of Grete Waitz,Ingrid Kristiansen and Sonia O’Sullivan
Training volumeWe find the highest weekly training volumes with Ingrid Kristiansenwho competed in the longest distances. During the one week 13th -19th January 1986 she had a total training volume of 225 km. It shouldbe mentioned that 80 of these 225 km were performed on skis. Inaddition to the fact that Ingrid did great parts of her aerobic wintertraining on skis she would also do much training on the treadmill;over a period of 49 weeks she did 110 training sessions on the treadmill.
Sonia O’Sullivan (1995) and Grete Waitz (1976) had 180 km as theirhighest weekly training volumes. There is little difference in the averageweekly training volume of these three athletes: Ingrid held an average of155 km (average for 49 weeks), Grete had 160 km (average for 25 weeks)and Sonia O’Sullivan did 140-150 km per week. When you compare thetraining volume of these three female runners with that of the best malelong distance runners, it corresponds to the volume that Karikosk (21),Noakes (30) and Klemm (22) maintain is the efficient level. Ingrid’s totalannual volume, 7625 km, is very close to that of Lasse Virén who in 1972and 1976 covered 7390 km and 7300 km. In other words, there do notseem to be any substantial differences in the training volumes of men andwomen at the top international level.
Training intensityWhen you compare the training of Grete Waitz (1976), Ingrid Kristian-sen (1986) and Sonia O’Sullivan (1995) several similarities are apparent:
They all did 2 daily sessions and they all had 2-3 weekly trainingsessions in the aerobic/anaerobic zone of intensity. Further, their aerobictraining, which constituted 80-90% of their total training, was of a highquality. Ingrid’s training, however, contained less track training thanthat of the other two. They all three did strength training, but Soniawas the only one to use weights.
The distribution of training in the various zones of intensity corre-sponds well with what is recommended by van den Eynde (44), Steffney(39), Nurmekivi (31) and Pisuke (33).
With Grete and Ingrid we find similarities in training influencesduring their adolescence. They both did an extensive range of sports.Grete did sprint, jumping and throwing, and she played handball during

175
TRAINING VOLUME AND INTENSITY
her early youth. Ingrid trained skiing and running. There is one differencebetween the two in the fact that up till senior level Grete did more anaerobictraining than Ingrid. The latter got her basic training through aerobics, skitraining and runs in the forests. Grete achieved her best times on the 1500m and the 3000 m. She was also best on the 400 m and the 800 m. Ingridwas the best on the longest distances. These are differences which may beascribed to the differences in training during their teens and/or „geneticdifferences“. It is however important to underline the fact that both Ingridand Grete did 150-160 km in weekly average during the years they weredoing their best 1500 and 3000 m runs.
References
1. Bahr, R., Hallen, J. & Medbø, J.I. Testing av idrettsutøvere. Oslo: Universitets-forlaget 1991.
2. Bernard, A.: Training for Aerobic Fitness. Track and Field Journal, 20, April,1983.
3. Bouchard, C., Boulay, M.R., Simoneau, J.A., Lortie, G. & Perusse, L.: Heredityand trainability of aerobic and anaerobic performances. An update. SportsMed. 5: 69-73, 1986.
4. Bompa, T.O.: Physiological intensity values employed to plan endurancetraining. New Studies in Athletics, Vol. 4, No. 1., 1989.
5. Bondarenko, V.: How to win olympic gold medal in women’s 10000 m.XVIth E.A.C.A. Congress. Endurance running 17.-21.01.1991. Finnish SportsInstitute, Vierumaki, Finland, 1991.
6. Brook, N.: Endurance Running Events. British Athletic Federation, 1992.7. Conconi, F., Ferrari, M., Ziglio, P. G., Drogetti, P. and Codeca, L.: Determi-
nation of the anaerobic threshold by non-invasive field test in runners. J.Appl. Physiol. vol.52, no 4: 869-873, 1982.
8. Evertsen, F.: Kilometersankerne, en saga blott? Kondis nr.3, mai/juni. 1995.9. Evertsen, F.: Kenyansk langdistansetrening. Idrettsmagasinet nr.1, august 1998.10. Feicht, C. B., Johnson, T. S., Martin, B. J., Sparkes, K. E. and Wagner, W. W.:
Secondary amenorrhoea in athletes. Lancet. 2: 1145-1146, 1978.11. Ferreira, P.: Experience in Oporto. XII European Coaches Association. Acoteias
Portugal, 22.01-25.01, 1983.12. Gambetta, V.: Distance Running Training. Track and Field Quarterly Rev.,
Vol.79, No.3., 1979.13. Gjerset, A. (red.): Idrettens Treningslære. Universitetsforlaget, Oslo, 1992.14. Gjerset, A.; Johansen, E. og Moser T.: Aerobe og anaerobe arbeidskrav i
kortidsorientering. Idrettsmagasinet nr. 1. august, 1998.15. Husby, S. R.: En analyse av treningsarbeidet til fire norske langdistanseløpere:
Knut Kvalheim, Per Halle, Knut Børø og Arne Kvalheim. Fordypningsopp-

RUNNING & SCIENCE
176
gave (Friidrett) våren 1982. 1. årig mellomfagstillegg i idrett. Norges Idrettshøg-skole, 1982.
16. Janssen, P. G. J. M.: Trening, melkesyre, hjertefrekvens. Universitetsforlaget,Oslo, 1993.
17. Jansson, E.: Kvinnor och aerob arbeidsførmåga. Konditionsträning. Red.:Forsberg, A. og Saltin, B. Idrottens Forskningsråd / Sveriges Riksidrottsfør-bund, 1988.
18. Jurkowski et al.: Can. Journal of Applied Sports Science. 7: 85-88, 1982.19. Kaggestad, J.: So trainiert Ingrid Kristiansen 1986. Leichtathletik. 38: 831-
834, 1987a.20. Kaggestad, J.: En systematisering av treninga til Ingrid Kristiansen i sesongen
1986. Upublisert materiale, 1987b.21. Karikosk, O.: Training Volume in Distance Running. Modern Athlete and
Coach. Vol.23, No.2, April, 1985.22. Klemm, W.: Energy Supply Differences in 10000 m and Marathon Runs. Long
Distances. Edited by Jarver, J. Tafnews Press, 1989.23. Lenzi, G.: The Womens Marathon: Preparing for an important event in the
season. XII Congress European Coaches Association. Acoteias Portugal. 22/1-25/1, 1983.
24. Lier, A.: Trening av toppidrettsutøvere i Kina. Friidrettens Trenerforening ogN.F.I.F.s trener og utøver seminar. Forelesning N.I.H. november, 1993.
25. Lydiard, A. and Gilmour, G.: Running The Lydiard Way. World Publications,Mountain View, California, 1978.
26. Martin, D. E. and Coe, P. N.: Training Distance Runners. Leisure Press.Champaign. Illonois, 1991.
27. Mc. Arthur, J.W.: Influence of body mass, body composition and exercise.In The Gonadotropins: Basic Science and Clinical Aspects in Females. Editors:Flamigni,C. and Givens, J. R. Serona Symposium No. 42: 203-215. AcademicPress, New York, 1982.
28. Møller, K.: Slik trente Grete som baneløper. Friidrett, nr. 9, september, 1985a.29. Møller, K.: Systematisering av treningen til Grete Waitz. Upublisert mate-
riale. 1985b.30. Noakes, T.: Lore of running. Oxford University Press, Cape Town, 1986.31. Nurmekivi, A.: Specifisity and Individuality in Distance Running Training.
Modern Athlete and Coach, Vol. 24, No.4, October, 1986.32. Nurmekivi, A.: Some Basic Factors of Endurance Training in a Nuttshell,
in: Long Distances. Contemporary Theory, Technique and Training. Editedby Jarver, J. Tafnews Press: 83-86, 1995.
33. Pisuke, A.: Planning of Endurance Training. Modern athlete and coach.(Athelstone, Aust.) Vol. 22. No 1., 1984.
34. Pisuke, A. and Nurmekivi, A.: Classification of Distance Running TrainingMethods, in Long Distances, editor: Jarver, J. Tafnews Press: 55-58, 1989.
35. Pisuke, A. and Nurmekivi, A.: Middle Distance Running Training Metods, inMiddle Distances. Contemporary Theory, Technique and Training. Edited byJarver, J. Tafnews Press: 67-70, 1991.

177
TRAINING VOLUME AND INTENSITY
36. Schwarts, B., Cumming, D.C., Riordan, E., Selye, M., Yen, S.S.C. and Rebar,R.W.: Exercise-induced amenorrhea: a distinct entity? American Journal ofObstetrics and Gynecology 141: 662-670, 1981.
37. Shangold, M.M.: Sports and menstrual function. Physician and Sportsmedicine8 (August): 66-71, 1980.
38. Skah, K.: Long Distance Training in Marokko. Coach Conferance. Norgesidrettshøgskole, Oslo, November 9th, 1997.
39. Steffney, M.: The Training of a 10000 m Runner. Die Lehre der Leichtathlick,Vol 34, No. 26, 1983.
40. Tjelta, L.I.: En kartlegging og analyse av treningen til kvinnelige eliteløperepå langdistanse, sett i sammenheng med endringer i løpshastigheten vedanaerob terskel. Hovedfagsoppgave i idrett. Norges idrettshøgskole, Oslo, 1996.
41. Tomten, S.: Jenter og langdistansetrening sett i relasjon til risiko forbenskjørhet. Friidrettens Trenerforening og N.F.I.F.s trener og utøver-seminar.Forelesning N.I.H.: 11.november 1995.
42. Van Aaken, E.: Van Aaken Method. World Publications, Mountain View,California, 1976.
43. van Dam, B.: Considerations in the Planning of Womens Distance RunningTraining. Die Lehre der Leichtathletik, Vol. 34, No. 26, 1983.
44. van den Eynde, E.: Training of Long Distance Runners. Die Lehre derLeichtathletik, Vol. 34, No 22, 1983.
45. Wakat, D.K., Sweeney, K.A. and Rogol, A.D.: Reproductive system functionin women cross-country runners. Medicine and Science in Sports and Exercise14: 263-269, 1982.