rumba: runtime monitoring and behavioral analysis ... · pdf filerumba: runtime monitoring and...
TRANSCRIPT

RUMBA: Runtime Monitoring and Behavioral Analysis
Framework for Java Software Systems
by
Azin Ashkan
A thesis
presented to the University of Waterloo
in fulfilment of the
thesis requirement for the degree of
Master of Applied Science
in
Electrical and Computer Engineering
Waterloo, Ontario, Canada, 2007
c©Azin Ashkan 2007

I hereby declare that I am the sole author of this thesis. This is a true copy of the thesis,
including any required final revisions, as accepted by my examiners.
I understand that my thesis may be made electronically available to the public.
ii

Abstract
A goal of runtime monitoring is to observe software execution to determine whether it
complies with its intended behavior. Monitoring allows one to analyze and recover from
detected faults, providing prevention activities against catastrophic failure. Although
runtime monitoring has been in use for so many years, there is renewed interest in its
application largely because of the increasing complexity and ubiquitous nature of software
systems.
To address such a demand for runtime monitoring and behavioral analysis of software
systems, we present RUMBA framework. It utilizes a synergy between static and dynamic
analyses to evaluate whether a program behavior complies with specified properties dur-
ing its execution. The framework is comprised of three steps, namely: i) Extracting
Architecture where reverse engineering techniques are used to extract two meta-models
of a Java system by utilizing UML-compliant and graph representations of the system
model, ii) Seeding Objectives in which information required for filtering runtime events
is obtained based on properties that are defined in OCL (Object Constraint Language)
as specifications for the behavioral analysis, and iii) Runtime Monitoring and Analysis
where behavior of the system is monitored according to the output of the previous stages,
and then is analyzed based on the objective properties. The first and the second stages
are static while the third one is dynamic.
A prototype of our framework has been developed in Java programming language.
We have performed a set of empirical studies on the proposed framework to assess the
techniques introduced in this thesis. We have also evaluated the efficiency of the RUMBA
framework in terms of processor and memory utilization for the case study applications.
iii

Acknowledgments
I would like to express my sincere gratitude to Professor Ladan Tahvildari for all her
guidance and support over these years not only as a supervisor but also as a friend. Her
advice and encouragement helped me in all the time of research and writing of this thesis.
Beside my supervisor, I would like to thank the rest of my thesis committee, Professor
Kostas Kontogiannis and Professor Paul P. Dasiewicz, for attending in my seminar and
accepting to read my thesis. Without their encouragement, questions, and insightful
comments, this thesis would not be what it is today.
Sincere appreciation goes to Professor Hausi Muller for his kind and encouraging
attitude towards me. His valuable comments improved the quality of this work.
I would also like to thank the members of Software Technologies Applied Research
Group for their valuable feedbacks about my thesis.
I hereby want to thank my dear family, specially my parents, for all they have done
for me. My love and gratitude go to my Mom for all her sacrifices in every stage of my
life, being always there for me full of knowledge, experience, and support. My love and
respect go to my Dad for all his supports and the passion of taking me to the world of
mathematics and physics when I was only a child.
Last but not least, I would like to give my deepest appreciation to my beloved husband,
Ali, whose patient love enabled me to complete this work. My love and passion for him
go far beyond the expressive power of words. I dedicate this thesis to him with love.
iv

Contents
1 Introduction 1
1.1 Problem Description . . . . . . . . . . . . . . . . . . . . . . . . . . . . . . 4
1.2 Thesis Contributions . . . . . . . . . . . . . . . . . . . . . . . . . . . . . . 5
1.3 Thesis Organization . . . . . . . . . . . . . . . . . . . . . . . . . . . . . . 6
2 Related Works 8
2.1 Specification Language . . . . . . . . . . . . . . . . . . . . . . . . . . . . . 10
2.2 Runtime Monitor . . . . . . . . . . . . . . . . . . . . . . . . . . . . . . . . 11
2.3 State of the Art in Software Systems Monitoring . . . . . . . . . . . . . . 13
2.4 Summary . . . . . . . . . . . . . . . . . . . . . . . . . . . . . . . . . . . . 22
3 A Runtime Monitoring and Behavioral Analysis Framework 23
3.1 The RUMBA Framework . . . . . . . . . . . . . . . . . . . . . . . . . . . 24
3.2 Architecture Recovery . . . . . . . . . . . . . . . . . . . . . . . . . . . . . 26
3.3 Seeding Objectives . . . . . . . . . . . . . . . . . . . . . . . . . . . . . . . 27
3.4 Runtime Monitoring and Analysis . . . . . . . . . . . . . . . . . . . . . . 29
3.5 An Example: Trading System . . . . . . . . . . . . . . . . . . . . . . . . . 30
3.6 Summary . . . . . . . . . . . . . . . . . . . . . . . . . . . . . . . . . . . . 31
v

4 Architecture Recovery 32
4.1 Extracting Facts . . . . . . . . . . . . . . . . . . . . . . . . . . . . . . . . 34
4.2 Modeling Source Code . . . . . . . . . . . . . . . . . . . . . . . . . . . . . 36
4.2.1 The Class Model . . . . . . . . . . . . . . . . . . . . . . . . . . . . 36
4.2.2 The SAIG Model . . . . . . . . . . . . . . . . . . . . . . . . . . . 38
4.3 Summary . . . . . . . . . . . . . . . . . . . . . . . . . . . . . . . . . . . . 43
5 Seeding Objectives 44
5.1 Adding OCL Constraints . . . . . . . . . . . . . . . . . . . . . . . . . . . 45
5.2 Tailoring Objectives . . . . . . . . . . . . . . . . . . . . . . . . . . . . . . 47
5.3 Extracting Event Patterns . . . . . . . . . . . . . . . . . . . . . . . . . . . 50
5.4 Summary . . . . . . . . . . . . . . . . . . . . . . . . . . . . . . . . . . . . 54
6 Runtime Monitoring and Analysis 55
6.1 Monitoring Process . . . . . . . . . . . . . . . . . . . . . . . . . . . . . . . 56
6.1.1 Observing Events . . . . . . . . . . . . . . . . . . . . . . . . . . . . 58
6.1.2 Producing Runtime States . . . . . . . . . . . . . . . . . . . . . . . 60
6.2 Constraint Based Analysis . . . . . . . . . . . . . . . . . . . . . . . . . . . 61
6.3 Summary . . . . . . . . . . . . . . . . . . . . . . . . . . . . . . . . . . . . 64
7 Experimental Studies 65
7.1 A Prototype for RUMBA . . . . . . . . . . . . . . . . . . . . . . . . . . . 66
7.2 Case Study: Rapla . . . . . . . . . . . . . . . . . . . . . . . . . . . . . . . 68
7.2.1 Rapla: Architecture Recovery . . . . . . . . . . . . . . . . . . . . . 69
7.2.2 Rapla: Seeding Objectives . . . . . . . . . . . . . . . . . . . . . . . 70
7.2.3 Rapla: Runtime Monitoring and Analysis . . . . . . . . . . . . . . 72
7.3 Case Study: JHotDraw . . . . . . . . . . . . . . . . . . . . . . . . . . . . 73
vi

7.3.1 JHotDraw: Architecture Recovery . . . . . . . . . . . . . . . . . . 74
7.3.2 JHotDraw: Seeding Objectives . . . . . . . . . . . . . . . . . . . . 75
7.3.3 JHotDraw: Runtime Monitoring and Analysis . . . . . . . . . . . . 77
7.4 Evaluation . . . . . . . . . . . . . . . . . . . . . . . . . . . . . . . . . . . . 79
7.4.1 Processor Utilization . . . . . . . . . . . . . . . . . . . . . . . . . . 79
7.4.2 Memory Consumption . . . . . . . . . . . . . . . . . . . . . . . . . 82
7.5 Summary . . . . . . . . . . . . . . . . . . . . . . . . . . . . . . . . . . . . 83
8 Conclusion and Future Directions 84
8.1 Contributions . . . . . . . . . . . . . . . . . . . . . . . . . . . . . . . . . . 84
8.2 Future Work . . . . . . . . . . . . . . . . . . . . . . . . . . . . . . . . . . 86
8.2.1 Automatic Generation of Monitoring Scenarios . . . . . . . . . . . 86
8.2.2 Various Objective Domains . . . . . . . . . . . . . . . . . . . . . . 87
8.2.3 Steering and Diagnosis . . . . . . . . . . . . . . . . . . . . . . . . . 88
8.3 Conclusion . . . . . . . . . . . . . . . . . . . . . . . . . . . . . . . . . . . 89
Bibliography 90
vii

List of Figures
2.1 Runtime Monitoring Taxonomy . . . . . . . . . . . . . . . . . . . . . . . . 9
3.1 The RUMBA Architecture . . . . . . . . . . . . . . . . . . . . . . . . . . . 25
4.1 Architecture Recovey . . . . . . . . . . . . . . . . . . . . . . . . . . . . . . 33
4.2 A Class Model Example - The Trading System . . . . . . . . . . . . . . . 37
4.3 XML Schema for the SAIG Model . . . . . . . . . . . . . . . . . . . . . . 41
4.4 A SAIG Model Example - The Trading System . . . . . . . . . . . . . . . 42
5.1 Seeding Objectives . . . . . . . . . . . . . . . . . . . . . . . . . . . . . . . 45
5.2 The Class Model of the Example Trading System with the Added OCL
Constraint . . . . . . . . . . . . . . . . . . . . . . . . . . . . . . . . . . . . 48
5.3 XML Schema for the Objective Dependency Graph (ODG) . . . . . . . . 49
5.4 An Example of ODG - The Trading System . . . . . . . . . . . . . . . . . 50
5.5 XML Schema for the Pattern of Required Events (PRE) . . . . . . . . . . 53
5.6 An Example of PRE - The Trading System . . . . . . . . . . . . . . . . . 53
6.1 The Structure of the Runtime Monitoring . . . . . . . . . . . . . . . . . . 56
6.2 An Example Result of the Constraint Based Analysis for the Trading System 63
7.1 A Snapshot of the RUMBA in NetBeans . . . . . . . . . . . . . . . . . . . 67
viii

7.2 A Snapshot of the Rapla System . . . . . . . . . . . . . . . . . . . . . . . 69
7.3 Part of the SAIG Model of Rapla . . . . . . . . . . . . . . . . . . . . . . 70
7.4 An Example of an OCL-Based Objective and the Corresponding ODG for
Rapla . . . . . . . . . . . . . . . . . . . . . . . . . . . . . . . . . . . . . . 71
7.5 Part of the PRE Corresponding to the Example Objective for Rapla . . . 72
7.6 Part of the Result of the Constraint Based Analysis for Rapla . . . . . . . 73
7.7 A Snapshot of the JHotDraw System . . . . . . . . . . . . . . . . . . . . . 74
7.8 Part of the SAIG Model of JHotDraw . . . . . . . . . . . . . . . . . . . . 75
7.9 An Example of an OCL-Based Objective and the Corresponding ODG for
JHotDraw . . . . . . . . . . . . . . . . . . . . . . . . . . . . . . . . . . . . 76
7.10 Part of the PRE Corresponding to the Example Objective for JHotDraw 77
7.11 Part of the Result of the Constraint Based Analysis for JHotDraw . . . . 78
7.12 Processor Utilization for Rapla . . . . . . . . . . . . . . . . . . . . . . . . 80
7.13 Processor Utilization for JHotDraw . . . . . . . . . . . . . . . . . . . . . . 81
7.14 Memory Consumption . . . . . . . . . . . . . . . . . . . . . . . . . . . . . 82
ix

Chapter 1
Introduction
Software systems play an important role in our economy, government, and military. This
requires a constant need to understand a program’s behavior by exploring its correctness
during the runtime. Traditional methods, testing and verification [8], are not enough to
guarantee that the current execution of a running system is correct. There are possibilities
to introduce errors into an implementation of the design that has been verified. Testing
may scale well and check implementation directly, but it is mostly informal and it does not
guarantee completeness. Verification is formal and may guarantee completeness, but it
does not scale well and deals mostly with design instead of implementation. An approach
of continuously monitoring and checking a running system with respect to particular
specifications is required to use for filling the gap between these two approaches.
Runtime software monitoring has been used for profiling, performance analysis, soft-
ware optimization as well as software fault-detection, diagnosis, and recovery. Software
fault detection provides evidence whether a program behavior complies with specified
properties during program execution. Following the standard [55], software failure is a
deviation between the observed and the required behavior of a software system. A fault
1
CHAPTER 1. INTRODUCTION 2
occurs during the execution of software and results in an incorrect state that may or
may not lead to a failure. An error is a mistake made by a human that leads to a fault
that may result in a failure. Many tools have been proposed for runtime monitoring to
detect, diagnose, and recover from software faults [6, 22, 31, 37, 47, 52]. There are various
definitions for runtime software-fault monitors in the literature. The definition most in
agreement with the interpretation considered in this thesis is “A monitor is a system that
observes the behavior of a target program and determines if it is consistent with a given
specification” [20]. A monitor takes an executing software system and a specification of
software properties. It checks that the execution meets the properties, i.e., that the prop-
erties hold for the given execution. In this regard, the monitor requires an understanding
of the target system regarding the information which is going to be observed.
Program understanding has been increasingly used in software engineering tasks such
as auditing programs for security vulnerabilities and finding errors in general. Such tools
often require much more sophisticated analysis than those traditionally used in compiler
optimizations. Generally, to understand a program, three actions can be taken [18]:
reading documentation, reading source code, and running the program (e.g., watching
execution, getting trace data, examining dynamic storage, etc.). Documentation can
be excellent or it can be misleading. Studying the dynamic behavior of an executing
program can be very useful and can dramatically improve understanding by revealing
program characteristics which cannot be assimilated from reading the source code alone.
However, the source code is usually the primary source of information. There are three
approaches that can be taken into account for the program understanding:
• Static Analysis examines program code and reasons over all possible behaviors
that might arise at runtime. Compiler optimizations [15, 62] are standard static
analysis. Typically, static analysis is sound and conservative [27]. Soundness guar-

CHAPTER 1. INTRODUCTION 3
antees that the analysis result is an accurate description of the program’s behavior,
no matter on what inputs or in which environment the program is run. Conser-
vatism means reporting weaker properties than may actually be true. The weak
properties are guaranteed to be true, preserving soundness, however may not be
strong enough to be useful. Static analysis usually uses an abstracted model of a
program state. On one hand, such an abstraction may cause loosing some informa-
tion. On the other hand, it provides a model which is compact and straightforward
for manipulation.
• Dynamic Analysis operates by executing a program and observing the execu-
tions. Standard dynamic analysis includes testing and profiling [59]. Dynamic
analysis is precise because no approximation or abstraction need to be done [27].
In other words, the analysis can examine the actual and exact runtime behavior of
a program. Dynamic analysis can be as fast as program execution. Some dynamic
analyses run quite fast, but in general, obtaining accurate results entails a great deal
of computation, especially when large programs are analyzed. The disadvantage of
dynamic analysis is that its results may not be applicable for future executions.
There is no guarantee that the test suite, over which the program is run, can cover
all possible program executions.
• Hybrid Analysis is the combination of the two approaches that can be applied
to a single problem, producing results that are useful in different contexts. It
sacrifices a small amount of the soundness of static analysis and a small amount
of the accuracy of dynamic analysis. Static analysis is typically used for proofs of
correctness, type safety, or other properties. Dynamic analysis demonstrates the
presence (not the absence) of errors and increases confidence in a system. In this
way, new techniques are obtained whose properties are better-suited for particular

CHAPTER 1. INTRODUCTION 4
usage than either static or dynamic solely. The hybrid analysis replaces the (large)
gap between static and dynamic analyses with a continuum. Users would select
a particular analysis fitted to their needs. In principle, they would turn the knob
between soundness and accuracy. For instance, hybrid analyses are used for program
verification.
Most of the research works provide mechanisms utilizing only the static analysis to know
where to collect the required information in a target program for runtime monitoring.
Moreover, most of them use instrumentation and modification of the target program
which aggregates low-level monitoring information with the program code directly and
increases monitoring overhead. In this context, our goal is to develop a framework utilizing
a synergy between static and dynamic analyses without any modifications on the source
code of a target system.
1.1 Problem Description
A runtime state of a program uniquely identifies an execution trace in the system. The
execution trace of a target program P is a sequence of program states which belongs to
a set of state space SP . The state space SP is discrete and hence finite or countably
infinite. Monitoring is considered with actual transitions between states, not only the
possible ones. A monitor takes an execution trace and a property and checks whether
the execution trace meets the property. In other words, the property is verified while the
target system is executing. A property is defined according to the objective of the user who
intends to run the monitoring process on the target program. The objective is considered
as the intention to detect faults in the system or to keep track of specific resources of the
system. A property often has the form µ → α, where µ is some condition on SP , and
it identifies those states of SP in which α must hold. The set of such states is denoted

CHAPTER 1. INTRODUCTION 5
by Sα|µ where Sα|µ ⊂ SP . In any state s ∈ SP , if µ is true, then α must also be true,
which indicates that s ∈ Sα|µ. If α evaluates to be false for s, then s is a state the current
execution has reached (s 6∈ Sα|µ). This is a point where the defined property is violated
while the system runs in its environment. Such a violation is reported by the monitoring
system. Furthermore, a monitoring system may extend this capability by diagnosing
faults using the obtained information about the target program. As an example, if the
objective of the monitoring is to detect faults, a property can be defined accordingly in
which a violation means a fault. As soon as a fault is detected, the user will be provided
with appropriate information. Such an information will aid her/him in understanding the
cause of the fault to assist the system in recovering. The recovery can be done by directing
the system to a correct state (forward recovery) or by reverting to a state known to be
correct (backward recovery) [75]. At the time being, our work focuses only on monitors
that are used to detect violations or report about specific behaviors of different resources
of a system. In this way, monitoring of evolving systems to unprecedented levels can
help us to observe and possibly orchestrate their continuous evolution in a complex and
changing environment [57].
1.2 Thesis Contributions
The major contribution of the thesis is to address the problem of runtime monitoring and
behavioral analysis of Java software systems. Our framework proposes a semi-automated
process which receives the Java source code of a target program. During the execution of
the program, the framework reports whether there is any violation in the behavior of the
program with respect to the specifications of certain properties. Specifically, the major
contributions of the proposed framework are as follows:
• The framework utilizes a synergy between static and dynamic analyses to do the

CHAPTER 1. INTRODUCTION 6
runtime monitoring and analysis.
• By using the hybrid analysis, the source code of a target system is not modified
during the processes of the framework.
• Two models of a target system are created using reverse engineering techniques
through the static analysis.
• The objectives of runtime monitoring and analysis are specified utilizing Object
Constraint Language (OCL) [65, 69]. They are actually the properties defined on
the behavior of the system which are described as OCL rules.
• By using the capabilities of Java Platform Debug Architecture (JPDA) [39], we
have implemented a monitoring technique that finds the locations of the required
attributes for the analysis process.
1.3 Thesis Organization
The rest of the thesis is organized as follows:
• Chapter 2 presents a survey on the related works. It describes four elements of
the runtime monitoring techniques, mostly focusing on two of them which are main
concerns of this thesis: the specification language and the runtime monitor. A
review of the state of the art in runtime monitoring is also presented followed by
putting this thesis in the context.
• Chapter 3 proposes a runtime monitoring framework which utilizes a synergy be-
tween static and dynamic analyses. The framework is composed of three major
stages: Architecture Recovery, Seeding Objectives, and Runtime Monitoring and
Analysis. The first and the second stages are static while the third one is dynamic.

CHAPTER 1. INTRODUCTION 7
• Chapter 4 discusses reverse engineering techniques used within the first stage of
the framework, Architecture Recovery. Two models are built for an existing object-
oriented software system in this stage: a UML-compliant model, called class model
and a graph-based model, called SAIG model.
• Chapter 5 discusses the processes within the second stage of the framework, Seeding
Objectives. In this stage, OCL-based safety properties are identified and then added
to the class model of the system. A pattern of required events is also generated to
reduce and filter event traces during the runtime monitoring.
• Chapter 6 describes the processes within the third stage of the framework, Runtime
Monitoring and Analysis. The runtime event traces of the system are generated
while no instrumentation is performed on the source code of the system. Afterwards,
the processing of the generated traces is carried out with respect to the OCL based
properties identified in the previous stage.
• Chapter 7 shows the application of the proposed framework on two open source
Java software systems. The prototype of the framework is described as well. Case
studies will be explained and the efficiency of the framework will be discussed.
• Chapter 8 presents the contributions of the thesis, and explains the potential future
research directions.

Chapter 2
Related Works
Runtime monitoring helps users of a system to detect specific anomalies which may exist
in the way that the system behaves in its environment. Delgado et al. [20] presented a
thorough survey of the current literature on runtime monitoring and identified a wide
spectrum of tools that have monitoring capabilities. We use this reference as our main
source for reviewing the major directions of runtime monitoring in literature which are
also related to the proposed framework in this thesis.
Figure 2.1 is adopted from [20] which depicts a taxonomy of runtime monitoring
systems. As the figure shows, there are four major elements used for classifying the
state of the art in monitoring approaches and techniques. The first three of them are
the most common elements of monitoring systems: the Specification Language used to
define properties as the relations within and among runtime states of a target system,
the Runtime Monitor that overseas the execution of a target program, and the Event
Handler that captures and communicates monitoring results. In addition to these three
elements, the fourth one considers the Operational Issues which mostly deal with the
external environment rather than the monitor itself.
8

CHAPTER 2. RELATED WORKS 9
In this chapter, we focus on the two elements which are main concerns of the thesis: the
specification language and the runtime monitor. While these two categories are explained
in more detail in the rest of this chapter, we summarize for the other two categories here.
Specification Language
Elements of Runtime
Monitoring
RuntimeMonitor
Operational Issues
EventHandler
Type of Programs
Platform Dependencies
Level of Maturity
ControlLevel
Response Effect
Placement Platform ImplementationInstrumentation
Abstraction Level
Property Type
Monitoring Level
Language Type
Automata
Logic
Other
Algebra
Domain
Design
Implementation
Safety
Temporal
Module
Statement
Event
Program
Manual
Automatic
None
Inline
Offline
Software
Hardware
SingleProcess
MultiProgramming
MultiProcessor
General Purpose
DomainSpecific
Category Specific
Hardware
Operating System
Language
Research
Production
Universal Application
Individual Application
No Effect
User Control
Automated
Figure 2.1: Runtime Monitoring Taxonomy
The event handler refers to how the monitor reacts to a violation of a specification in a
particular state. Response actions can alter the application state space, report applica-
tion behavior, or start up another process. At the control-level category, monitors that
react universally to a violation are separated from those that permit the user to individ-

CHAPTER 2. RELATED WORKS 10
ually specify the actions of the monitor or the target program. Response effect reflects
the extent to which the monitor’s response to a violation can affect program behavior.
According to this category, a monitor may i) have no effect on the behavior of a target
program, ii) use the user’s interactions, or iii) be an automated system.
On the other hand, the operational issues consider a monitoring system from three
points of view: i) the type of programs targeted by the monitoring system, ii) platform
dependencies, and iii) the level of maturity of the system. A target program may be
general-purpose, domain-specific, or category-specific. Platform dependencies capture
restrictions on monitoring systems. Some monitors can only operate on certain hard-
ware, operating systems, or programs written in a specific language. Level of maturity
identifies the purpose of the development of the monitoring systems which can be research
prototypes or tools available for public.
The rest of the chapter addresses the first two categories of the taxonomy and the state
of the art in this field. Section 2.1 describes the specification language while Section 2.2
discuses issues about the runtime monitor. In Section 2.3, we review the state of the art
in software systems monitoring. Finally, Section 2.4 summarizes the material presented
in this chapter.
2.1 Specification Language
A specification language in a monitoring system is classified based on: i) the language type
that is used to define the monitored properties, ii) the abstraction level of the specification,
iii) the property type, and iv) the monitoring level. More details about each of these four
directions in the specification language are as follow:
• Language Type may be algebra, automata, logic, or other. Another orthogonal
category (other) denotes that the specification language is a functional, object-

CHAPTER 2. RELATED WORKS 11
oriented, or imperative language or it is an extension of the source language.
• Abstraction Level determines how the language provides support for specifying
properties. It can be at domain, design, or implementation levels. At the domain
level, a language expresses properties in a particular domain or supports capture
of knowledge about a specific problem domain. At the design level, the specifica-
tion concerns software design at a level that is independent of implementation. A
language that supports specification of properties about the implementation of a
program is classified in the implementation level.
• Property Type may be safety or temporal. A safety property expresses that
something (bad) never occurs. The temporal category includes properties related
to progress and bounded liveness as well as timing properties.
• Monitoring Level determines the level at which a property can be evaluated
within a program. It can be at program-level, module-level, statement-level, or
event-level. At the program-level, properties are specified on threads or on rela-
tions between threads. At the module-level, properties are specified on functions,
procedures, methods, or components, such as abstract data types or classes. Prop-
erties are specified for a particular statement at the statement-level specifications.
Event-level specifications define properties based on a state change or sequence of
state changes.
2.2 Runtime Monitor
A monitor observes and analyzes the states of a system. The monitor checks correctness
by comparing an observed state of the system with an expected state of the system.
There are various approaches for implementing monitors. Instrumentation, placement,

CHAPTER 2. RELATED WORKS 12
platform, and implementation are among the implementation strategies for a monitor,
which are elaborated furthers as follows:
• Instrumentation refers to the points in a target program at which execution of
monitoring code will be initiated. It can be manual, automatic, or none. In the
manual one, instrumentation of the target program is performed manually at the
source code level, byte code level, or any level of the intermediate code. In the
automatic instrumentation, points of instrumentation are detected automatically,
which can be achieved through dynamic analysis, static analysis, or a combination
of both. In the third category, it is not required to consider any physical point in
the program to run a monitoring code and hence no instrumentation is required.
• Placement refers to where the monitoring code executes. It can be inline in which
the monitoring code is embedded in the target code (including calls to subroutines).
On the other hand, the monitoring can be performed offline, meaning that the
monitor executes as a separate thread or process, possibly on a separate machine.
The monitor is classified as asynchronous offline in two ways: i) the application can
continue to execute without waiting for the analyzer to complete, or ii) the monitor
uses an execution trace that is analyzed after execution. If the application must
wait until the check is complete, the monitor is classified as synchronous offline.
• Platform differentiates monitors as software or hardware ones. A software moni-
tor uses code to observe and analyze the values of monitored variables. A hardware
monitor may be a microprocessor attached to a system with connectors or a hard-
ware device connected to the buses of the target system that allows it to detect
events of interest or collect relevant data.

CHAPTER 2. RELATED WORKS 13
• Implementation refers to the way a monitor can execute which can be single
process, multiprogramming, or multiprocessor. In the single process, the monitor
executes in the same process as the target program. In the multiprogramming
way, the monitor and the target program execute as separate processes or threads
on the same processor. The monitor and the target program execute on different
processors in the multiprocessor case.
2.3 State of the Art in Software Systems Monitoring
In this section, we review the state-of-the-art about existing monitoring systems from the
specification language and the monitor points of view. Afterwards, we compare specific
features of our framework with what are contributed by other systems.
• Alamo (A Lightweight Architecture for Monitoring) [41, 42] has been developed for
C and Icon programs. The Icon programming language is used to specify assertions
as the safety properties for monitoring. The Alamo monitoring architecture utilizes
CCI, a Configurable C Instrumentation tool [72], as a preprocessor. It uses parse
trees to identify monitoring points and inserts events into the source code of a target
program. There is an Execution Monitor (EM) which executes the Target Program
(TP). Then the control is returned to the EM with information in the form of an
event report. The EM can query the TP for additional information, such as the
values of program variables and keywords.
• Annalyzer [53, 54] uses ANNA (ANNotated Ada), an extension of Ada, to specify
properties as annotations. The annotations are converted into code that checks the
properties at runtime. The Annalyzer compares the runtime behavior of an appli-
cation with properties that are specified at different levels of abstraction (package,

CHAPTER 2. RELATED WORKS 14
subprogram, data structures, or statement level). A monitor is used to pinpoint and
analyze errors by using a two-dimensional pinpointing approach in which the Anna-
lyzer initially finds errors using properties specified at a higher level of abstraction.
Finally, an event handler notifies the user when a violation occurs.
• BEE++ [10] is an object-oriented application framework for the dynamic analysis
of distributed programs written in C or C++. It views the execution of a distributed
program as a stream of events. The monitor, referred as an event interpreter, sup-
ports specification of high-level events from low-level events by way of inheritance.
A sensor provides a placeholder for an event that is either user-defined or predefined
by BEE++. When a sensor is encountered, or triggered, runtime data is loaded
into the event and it is sent off to each analysis tool that has bound itself to that
sensor. The insertion of sensors in the application is the task of the programmer.
• DynaMICs (Dynamic Monitoring with Integrity Constraints) [31, 32] is a tool that
supports the elicitation of properties from domain experts, designers, and develop-
ers as well as their application to monitoring. Properties, expressed in logic, capture
relations on objects modeled by the application, design limitations, and implemen-
tation assumptions. These properties are specified as event-condition-action, where
the event defines the trigger for the check, the condition specifies the check, and
the action defines the response to a violation. The approach automatically inserts
constraint-checking and knowledge-generating codes by analysis of a program’s path
expression. The control-flow graph of the program’s intermediate code generates
the path expression. Monitoring code automatically generated from specifications
triggers the execution of monitoring code by another process or processor [71].
• Edit Automata [52] analyzes the space of security policies that can be enforced by
monitoring and modifying programs at run time. Program monitors in this system,

CHAPTER 2. RELATED WORKS 15
called edit automata, are abstract machines that examine the sequence of applica-
tion program actions and transform the sequence when it deviates from a specified
policy. It uses the general term security automaton to refer to any automaton that
is used to model a program monitor. Edit automata has a set of transformational
powers which: i) may terminate the application, thereby truncating the program
action stream, ii) may suppress undesired or dangerous actions without necessar-
ily terminating the program, and iii) may insert additional actions into the event
stream.
• Falcon [35] provides online monitoring and steering of large-scale parallel programs.
A monitoring specification consists of low-level sensor specification constructs and
higher-level view specification constructs. Using a semi IDL (Interface Description
Language) language, programmers define: i) the application-specific sensors and
probes for capturing the program and performance behaviors during runtime, and
ii) the program attributes that direct steering. Probes update program attributes
asynchronously to the program’s execution. Actuators may also execute additional
functions to ensure that modifications of program state do not violate program
correctness criteria. Monitoring is accomplished through the use of runtime libraries
for information capture, collection, filtering, and analysis.
• Jass (Java with assertions) [6] is a general-purpose monitoring approach that is
implemented for sequential, concurrent, and reactive systems written in Java. A
precomplier translates annotations to programs written in Java into pure Java code.
Compliance with the specified annotations is dynamically tested during runtime.
Trace assertions, based on the process algebra CSP (Communicating Sequential
Process), describe the observable behavior of a class and they are used to monitor
the correct invocation of a method as well as the order and timing of method
CHAPTER 2. RELATED WORKS 16
invocations. The generated code will check that the trace of the current program
execution is included in the traces of the main process; otherwise, a trace exception
is thrown that can trigger a user-defined rescue block.
• JassDA (Jass with Debug Architecture) [9] is the later version of Jass. JassDA
has been also designed to provide a trace assertion facility, but in contrast to Jass,
trace assertions are not precompiled into the source code but are checked at runtime
via the Java Platform Debug Architecture (JPDA) [39].
• JPaX (Java PathExplorer) [6, 37] is a general-purpose monitoring approach for se-
quential and concurrent Java programs. This technique facilitates logic-based mon-
itoring and error pattern analysis. Formal requirement specifications are written in
a linear temporal logic [68] or in the algebraic specification language Maude [16, 17].
JPaX instruments Java byte code to transmit a stream of relevant events to the
observation module that performs two kinds of analysis: i) logic-based monitor-
ing that checks events against high-level requirements specifications, and ii) error
pattern analysis that searches for low-level programming errors. Maude’s rewriting
engineMaude [16, 17] is used to compare the execution trace to the specifications.
Error pattern runtime analysis explores an execution trace to detect potential er-
rors, including data races and deadlocks, even if these errors do not explicitly occur
in the trace.
• JRTM (Java Runtime Timing-Constraint Monitor) [61] targets timing properties
of distributed, real-time systems written in Java. The timing properties express as-
sertions that specify the occurrences of different events in a language based on Real
Time Logic (RTL). Java programmers insert the event triggering method calls in
their Java programs where event instances occur. JRTM can detect some property
violations statically through constraint graphs. Whenever an event is triggered at

CHAPTER 2. RELATED WORKS 17
runtime, the application sends a message to the monitor reporting the occurrence
time of the event instance and the event name. The monitor keeps these event occur-
rence messages in a sorted queue with the earliest event message at the head of the
queue. The constraints are checked for violation and synchronization is enforced.
• Mac (Monitoring and Checking) [45, 46, 47, 48, 49, 70] provides a framework for
runtime monitoring of real-time systems written in Java. Requirement specifications
are written in MEDL (Meta Event Definition Language). MEDL allows the user to
define auxiliary variables which store values. Such values are used to identify events
and conditions as well as guarded statements that assign them to auxiliary variables
for encoding information on past states. A monitoring script, written by the user
in PEDL (Primitive Event Definition Language), is used to monitor objects and
methods. PEDL can look at local and global variables and can detect alias variable
names. A filter maintains a table that contains names of monitored variables and
addresses of the corresponding objects. It acts as an observer which communicates
the information that is to be checked by the runtime monitor. Monitoring points
are inserted automatically since the monitoring script specifies which information
needs to be extracted, not where in the code extraction should occur. Static analysis
is used to determine monitoring points and dynamic analysis is used to reduce
monitoring overhead without evaluating new program state.
• PMMS (Program Monitoring and Measuring System) [51] is an approach that au-
tomatically collects information about the execution characteristics of a program.
The user can specify objects and relations at the program, event, or statement-level.
PMMS accepts the original program and properties given in a formal specification
language. It installs instrumentation code in the program, determines what data
must be collected, and inserts code to collect and process that data. The imple-

CHAPTER 2. RELATED WORKS 18
mentation uses temporal dependency among events to filter out irrelevant data at
runtime and uses a main memory active database to facilitate the collection, com-
putation, and access to results. PMMS handles events by installing code that reacts
whenever relevant events occur.
• RAC (Runtime Assertion Checker for the Java Modeling Language) [11, 13] assists
in the generation of test oracles and identifies errors during testing of Java programs.
Programmers write pre and post conditions for class methods using a side-effect-
free subset of the Java Modeling Language. It is also possible to check class-level
post-state assertions such as invariants. These annotations are translated into Java
code embedded in the source code. When violations of pre or post-conditions occur,
exceptions are thrown.
• ReqMon (Requirements Monitor for executing software) [66, 67] provides a frame-
work and tool for monitoring requirements at runtime. The high-level requirements
are translated into a Unified Modeling Language (UML) design model from which
a Java program is generated. ReqMon generates a Promela model [38] from the
program source code and a monitored program event log from instrumented com-
piled Java classes. The model is checked using Spin [38] to determine if the current
execution is on a path that can lead to a requirement failure. ReqMon has been
applied to distributed web services. ReqMon automates the translation of monitor
specifications into a monitor implementation. Templates for monitor specifications
are specialized through the selection of appropriate parameters. At runtime, the
monitors track web service traffic at the transport protocol, routers, and gateways.
Integrative monitors combine information from individual monitors, and alerts are
reported.

CHAPTER 2. RELATED WORKS 19
• Sentry [14] is a monitoring approach designed for sequential and concurrent C
programs. The Sentry is an observer that is implemented as a separate process to
concurrently monitor the execution of a target program and issue a warning if it
does not behave correctly with respect to a given set of properties. The properties
are specified in a propositional calculus that is extended to include integer arith-
metic operators and relations using C syntax. Universal and existential quantifiers
are permitted, as well as summation over a fully instantiated subrange. Annotations
are written within specially formatted comments in the places where the properties
should be evaluated. The original source file with the annotations is replaced by
calls to macros. Properties observed by the global sentry are invariants that are
maintained throughout the entire program execution. The local sentry checks prop-
erties at a particular point in the execution process and runs in parallel with the
source program. The source program sends its variables to the sentry as it executes.
The global sentry continuously observes and evaluates the global properties of the
source program, waiting until a process writes new state information. The sentry
then reads new variables from their buffers, preserving mutual exclusion with the
processes, and enables the checking of any property involving those variables. After
the sentry has read the available state information from all processes, it checks the
enabled properties. Detected violations are reported by sending a signal to the pro-
gram, and the program initiates a user-defined recovery action based on the type
of fault.
• Temporal Rover [21] is a specification-based verification tool that uses Linear-
Time Temporal Logic (LTL) and Metric Temporal Logic (MTL), allowing the user
to specify future time temporal formulae as well as lower and upper bounds, and
ranges for relative-time and real-time properties. In Temporal Rover, the user de-

CHAPTER 2. RELATED WORKS 20
termines the point at which a property should be checked and inserts an annotation
of the property. The Temporal Rover parser converts an annotated program into
an identical program with the properties implemented in the source code. During
application execution, the generated code validates the executing program against
the formal specifications. Temporal Rover takes a Java, C, C++, Verilog, or VHDL
source code program as input and it enables customizable actions for the program
domain.
• TPTP (Test and Performance Tools Platform) [73] is an open source project of
the Eclipse foundation. TPTP is divided into four projects. One of them is the
monitoring tools project that addresses the monitoring and logging phases of an
application lifecycle. The monitoring tools project provides frameworks for build-
ing monitoring tools by extending the TPTP platform for collecting, analyzing,
aggregating, and visualizing data that can be captured in the log and statistical
models. The framework has the capability of collecting and analyzing system and
application resources. It provides statistical agents to monitor and collect Windows
and Linux systems, JBoss and JOnAS application server JMX data, Apache HTTP
server status data, and MySQL database table and variable data. It is also able
to instrument Java applications so they can be monitored. The log analysis tools
can correlate disparate logs from multiple points across an environment. It also
includes tools for monitoring application servers and system performance, such as
CPU and memory utilization.
Runtime monitoring requires an understanding of the target system regarding the in-
formation which is going to be monitored. Several works address this problem through
static analysis. DynaMICs [31] automatically inserts monitoring-related information to a
target program by analysis of the program’s path expression. Such a path expression is

CHAPTER 2. RELATED WORKS 21
generated from the control-flow graph of the intermediate code of the program through
static analysis. Jass [6] has a precompiler to translate the monitoring information into
Java code and insert it to the target program source code. The resulted compliance with
the specified information is tested during the runtime. To the best of our knowledge,
Mac [47] is the only system that uses the benefits of combined static and dynamic anal-
yses. In this system, static analysis is used to determine monitoring points and dynamic
analysis is used to reduce monitoring overhead by not evaluating new program state. Our
work also addresses this issue using a synergy between static and dynamic analyses.
Programming analysis techniques are useful for runtime monitoring to know what to
collect and where to locate the required information in a target program. However, there
is still required to know how such information can be collected from the target program.
Generally, runtime monitoring approaches track the execution of a target program by
generating and processing execution events. Such a task is usually performed by modify-
ing the target program at the source code level prior to the compilation [6, 22, 31, 52] or
at the intermediate code level before running the program [37, 47]. This is called instru-
mentation of the target program which aggregates low-level monitoring information with
the program code directly. New techniques are needed to reduce the monitoring over-
head resulted from the instrumentation and modification of different levels of a target
program. To the best of our knowledge, the JassDA [9] framework is the only moni-
toring system that generates monitoring events at runtime without any modifications to
the target program. JassDA has become our motivation to address this issue in runtime
monitoring by utilizing reverse engineering techniques and the capabilities of JPDA [39]
so that the source code would not be modified. Following chapters will elaborate further
on our approach and its contributions.

CHAPTER 2. RELATED WORKS 22
2.4 Summary
This chapter presents a survey of related works. A taxonomy of runtime monitoring
systems, based on four elements, has been presented in this chapter. The first three
of them are the most common elements of monitoring systems: Specification Language,
Runtime Monitor, and Event Handler. In addition to these three elements, the fourth
one considers the Operational Issues rather than the monitor itself. The main goal of
the chapter is to provide a background knowledge of the existing and ongoing projects
related to this area. Moreover, we review the state of the art in this chapter and compare
specific features of our framework with what are contributed by other works.

Chapter 3
A Runtime Monitoring and
Behavioral Analysis Framework
Software engineering strives enabling the economic construction of software systems in
order to behave correctly and reliably in their environment. In other engineering disci-
plines, correctness is assured in part by a detailed monitoring of processes. In software,
we can address this issue in the behavior of programs by monitoring their execution.
Runtime software monitoring has been used for profiling, performance analysis, software
optimization as well as software fault-detection, diagnosis, and recovery. Studying the dy-
namic behavior of an executing program can be very useful and can dramatically improve
understanding by revealing program characteristics. Although this can not be assimilated
from reading the source code alone, it is usually the primary source of information.
In this thesis, we propose a framework, namely RUMBA, to address the runtime
monitoring and the behavioral analysis of Java software systems. RUMBA integrates
concepts of reverse engineering and runtime monitoring and it is a synergy between static
and dynamic analyses. It confirms whether a program behavior complies with OCL-based
23

CHAPTER 3. A RUNTIME MONITORING AND BEHAVIORAL ANALYSIS
FRAMEWORK 24
specification of certain properties during its execution. The properties are defined based
on the objectives of the user who intends to monitor the execution of a target program.
Runtime monitoring and analysis require certain information about a target system.
In our framework, such information is obtained through hybrid analysis in such a way that
does not require to modify the source code. Three key features of the RUMBA framework
are: i) the theory defined for static analysis part of RUMBA is fully extendable at different
granularity levels, for example towards monitoring information about the methods of a
system, ii) the source code of a target system is not modified, and iii) the most processes
of the framework are automated. Using the help of reverse engineering techniques through
static analysis, we can reduce the large size of runtime information in dynamic analysis.
We filter the information to what is required for the analysis.
This chapter outlines the proposed framework, while the details are discussed fur-
ther in subsequent chapters. Section 3.1 presents the architecture of the framework and
introduces the different stages of it. The two stages, performing static analysis, are de-
scribed in Sections 3.2 and 3.3 respectively. Section 3.4 presents the third stage of the
framework which performs dynamic analysis. We introduce an example target program
in Section 3.5 which will be used further in subsequent chapters to understand the details
of each process included in the framework. Finally, Section 3.6 summarizes the chapter.
3.1 The RUMBA Framework
The RUMBA framework is comprised of three stages namely: i) Architecture Recovery,
ii) Seeding Objectives, and iii) Runtime Monitoring and Analysis. The first and the second
stages are static while the third one is dynamic. Figure 3.1 illustrates the architecture of
the framework.

CHAPTER 3. A RUNTIME MONITORING AND BEHAVIORAL ANALYSIS
FRAMEWORK 25
As depicted in Figure 3.1, the main input of the RUMBA framework, which goes
into the first stage, is the source code of the target system. At this time, the framework
works for Java based systems. However, the modular architecture of RUMBA allows to
replace or equip appropriate components in the future work, in such a way that other
OO languages can be supported.
Running
System
S e e d i n g O b j e c t i v e sArchitecture Recovery
Extracting Facts
Modeling Source
Code
Facts
R u n t i m e M o n i t o r i n g
a n d A n a l y s i s
PRE
Extracting Events
Pattern
Producing Runtime
States
Observing Events
Sequence
of Events
Adding OCL
Constraints
OCL Based
Objectives
Tailoring
Objectives
Objective
PropertiesSource
Code
Class
Model
Class Model
+ OCL
Current State
of the System
ODGSAIG
Model
JDI Events
JVM
JPDA
Constraint Based
Analysis
Reports
Legend
Data Input Data Output Control Flow Data FlowProcess
Used
Technology
Figure 3.1: The RUMBA Architecture
The input of the second stage is provided based on the assumption that the user of
the framework has some information about the domain of the target system. Particular
OCL-based constrains are defined according to such information and the objectives of
the runtime monitoring and analysis. Such constraints are utilized as the main input

CHAPTER 3. A RUNTIME MONITORING AND BEHAVIORAL ANALYSIS
FRAMEWORK 26
of the stage. The structural models obtained from the first stage are also passed as the
inputs of the second one. One of the inputs of the third stage is a structural model of
the target system plus the defined objectives in OCL. As another input, a pattern of the
required information for runtime monitoring, generated in the second stage, is passed
to the third one. The output of RUMBA is actually the output of the last stage which
is a list of sucesses/failurs of each constraint per state. The output can be considered
as a repository which represents the results of analyzing some particular points of the
behavior of the target system during runtime. Further explanations about each stage of
the RUMBA framework can be found in the following subsections.
3.2 Architecture Recovery
Software architecture recovery aims at reconstructing views on the architecture as-built.
Reverse engineering techniques have claimed to offer great contributions to Architecture
recovery from legacy systems through static analysis. In the first step of our frame-
work, such techniques are used to extract a meta-model of the system by utilizing graph
representation of the system model.
We have two goals in this stage: i) modelling the structure of the system, and ii)
describing the model in two representations: a UML-compliant model and a graph based
model. Indeed, there are two main processes in this stage, extracting facts and modeling
source code, to achieve the two aforementioned goals.
The Java Compiler (JavaCC) [74] is utilized in the “extracting fact” process. JavaCC
is one of the most popular parser generators for use with Java applications. Its top-down
nature allows it to be used with a wider variety of grammars than other traditional pars-
ing tools. The JavaCC based extractor has been implemented in Java to automatically
extract the information from a target system. However, the modular architecture of the

CHAPTER 3. A RUNTIME MONITORING AND BEHAVIORAL ANALYSIS
FRAMEWORK 27
framework enables us to extend the work for future for other types of OO languages.
The “modeling source code” process utilizes graph-based structures, since graphs are
very versatile data structures and can be applied for various computer vision problems.
They are good for modeling, traversing, and transformation purposes. In our framework,
attributed graphs [26] are used to model the system structure. The graph-based structure
facilitates the extendibility of the model for future work. Such a graph based model is
then traversed in other part of the static analysis. Finally, the graph based artifacts are
exported as XML documents and transformed between different stages of the framework.
The details of the two processes involved in this stage are elaborated further in Chapter 4.
3.3 Seeding Objectives
The Object Constraint Language (OCL) [65, 69] is a formal notation for analysis and
design of OO systems. It is a subset of the industry standard Unified Modeling Language
(UML) [1] that allows software developers to write constraints and queries over object
models. A constraint can be seen as a restriction on a model or a system. OCL plays
an important role in the analysis phase of the software lifecycle as a formal language
to express constraints. It can be used for specifying constraints on a model in order to
restrict possible system states [34]. Users of UML and other languages can use OCL to
specify constraints and other expressions attached to their models.
OCL is an expression language. Therefore, an OCL expression is guaranteed to be
without side effect; it cannot change anything in the model. This means that the state
of the system will never change because of an OCL expression, even though an OCL
expression can be used to specify a state change, e.g. in a post-condition. The values
for all objects, including all links, will not be changed. Whenever an OCL expression is
evaluated, it simply delivers a value. OCL is not a programming language, so it is not

CHAPTER 3. A RUNTIME MONITORING AND BEHAVIORAL ANALYSIS
FRAMEWORK 28
possible to write program logic or flow control in OCL. It is not possible to invoke processes
or activate non-query operations within OCL. Since OCL is a modeling language in the
first place, nothing in it is promised to be directly executable. OCL is a typed language,
hence each OCL expression has a type. In a correct OCL expression, all types used must
be type conformant. For example, it is not possible to compare an Integer with a String.
Types within OCL can be in any kind of classifier within UML. As a modeling language,
all implementation issues are out of scope and cannot be expressed in OCL. Each OCL
expression is conceptually atomic and the state of the objects in the system cannot change
during the evaluation.
We use OCL in this stage of RUMBA to define particular properties as objectives
of the behavioral analysis. We consider an objective as a property that constrains the
permitted actions, and, therefore, the permitted state changes of a system [60]. A specific
set of rules can be defined to formalize our expectation about the runtime of a system
that actually determine the objectives of evaluating the behavior of the system.
The properties are particularly useful, as they allow us to create a specific set of rules.
Such rules can govern some aspects of the objects of our interest. The objects and some of
their attributes are our points of interest, since their changes determine our expectation
about the runtime of the system. However, the domain of the available information
about these objects is limited to their names and some of their attributes involved in the
definition of the OCL rules. We need more information to be able to track them and
filter the events during the runtime of a program. For that reason, information required
for filtering runtime events is also obtained in this stage.
In summary, we have two main goals in this stage: i) identifying properties as OCL
rules on the class model of the target program, and ii) extracting patterns of required
events to reduce and filter generated events during monitoring the runtime. There are
three main processes in this stage which are explained further in Chapter 5.

CHAPTER 3. A RUNTIME MONITORING AND BEHAVIORAL ANALYSIS
FRAMEWORK 29
3.4 Runtime Monitoring and Analysis
In this stage, the runtime execution of the target system is monitored according to the
output of the previous stages. Afterwards, the obtained runtime information is analyzed
and verified. The analysis is constraint based and is performed based on the the properties
defined in the second stage.
Approaches to runtime monitoring and analysis have to track the execution of a sys-
tem and therefore have to deal with generating and processing event traces. However,
these techniques are mostly applied at the code level (so-called instrumentation). Such an
instrumentation can be done either by inserting new source code prior to the compilation
or by modifying the target code, e.g. Java byte code, before running the program. Our
framework does not modify the source code. We use Java Platform Debug Architecture
(JPDA) [39] for monitoring purpose to generate event traces. JPDA is a multi-tiered
debugging architecture contained first within Sun Microsystem Java 2 SDK version 1.4.0.
It consists of a Java Virtual Machine Debug Interface (JVMDI), and a Java Debug Inter-
face (JDI), as well as a protocol, Java Debug Wire Protocol (JDWP). We have used the
JDI, which defines and requests information at the user code level, in order to implement
our monitoring component
On the other hand, a back-end analysis component carries out the processing of the
generated traces with respect to the properties. We have used an open source tool called
USE (UML-based Specification Environment) developed in Bremen University [3]. We
have adopted some parts of the source code of USE to be incorporated into our framework
as a part of the design and the implementation of the analysis component.
Totally, there are three processes included in this stage. Two of them are responsible
for monitoring the execution traces of a target program. They specify the traces of the
runtime states of the program. The third process is responsible for OCL-based constraint

CHAPTER 3. A RUNTIME MONITORING AND BEHAVIORAL ANALYSIS
FRAMEWORK 30
analysis on the generated states coming from the other two. These three processes are
elaborated further in Chapter 6.
3.5 An Example: Trading System
This section introduces a Trading system as an example to understand the details of each
process included in the framework. Sample artifacts generated from different stages of
the framework are elaborated on this simple example in subsequent chapters.
Consider a trading system with two major classes, namely Stock and Trader. In
this system, some traders instantiated from the Trader subscribe in a stock instantiated
from the Stock. The stock has some items to sell and provides traders with information
about each item, including its price, whenever it is ready for market. Each trader decides
whether she/he wants to buy the item or not, based on her/his trading policy. If yes,
she/he lets the stock know about her/his decision so that nobody else can buy that item.
We study a transaction based property in this system in subsequent chapters. Such
a property may be violated due to the interference caused by making access to critical
sections mutually exclusive [60]. It means that at least two traders are able to buy
the same item with the stock at the same time. Since there is no support to handle
transactional issues in our example system, there are states during the runtime where at
least two traders have bought the same item. This is a behavior that is unwanted and
unexpected from the user’s point of view. According to the definition of an objective,
there must be something that constrains the permitted actions of this system. It is a
constraint that must be defined to check whether the system respects the transactional
access. We define such a constraint as the objective for the behavioral analysis. Indeed,
we monitor the runtime of the system to detect the points at which there is a violation
in the behavior of the system with the specified objective.

CHAPTER 3. A RUNTIME MONITORING AND BEHAVIORAL ANALYSIS
FRAMEWORK 31
3.6 Summary
In this chapter, we have outlined the proposed framework which utilizes hybrid analysis
to confirm whether a program behavior complies with specified properties during its exe-
cution. The framework is comprised of three stages: i) Architecture Recovery, ii) Seeding
Objectives, and iii) Runtime Monitoring and Analysis. There are some processes included
in each stage of the framework which have been briefly explained in the chapter. The
role of each stage of the framework has been addressed in this chapter. In the subsequent
chapters, we will elaborate further on the processes involved in each stage. We will de-
scribe how each process works with respect to its input(s) coming from other processes
and the output(s) which will be generated.

Chapter 4
Architecture Recovery
The ability to recover up-to-date architectural information from existing software artifacts
is a key to have effective software maintenance, reengineering and reuse. This informa-
tion is beneficial to the engineer who is trying to understand a software system. An
architecture recovery system extracts facts from a system implementation, then combines
these facts into higher level of abstractions (for example, modules and subsystems). The
extracted facts may be in many forms. Researchers have extracted information about
function calls, data accesses, and file operations to help reconstruct views of an architec-
ture [28, 29, 33, 44, 56, 58, 63].
In contrast to several monitoring systems that need to do some modifications at the
source code or byte code levels [6, 22, 37, 47, 52] of their target system through the
instrumentation, we do not require any instrumentation. For achieving such a goal, our
framework needs some structural information about the target system. This information,
which is obtained through the architecture recovery in the static analysis, helps our
monitor to track the location of required information during the runtime.
Therefore, the first stage of RUMBA is the architecture recovery stage. We have two
32

CHAPTER 4. ARCHITECTURE RECOVERY 33
goals in this stage: i) modeling the structure of the system that is the target of runtime
monitoring, and ii) describing the model in two representations: a UML-compliant model
and a graph based model. To achieve these goals, as Figure 4.1 illustrates, two main
processes are performed in this stage. First, we parse the source code of the target
system to extract facts from its implementation. Then, we model the facts into the forms
which will be useful for the next stages of RUMBA. This chapter describes these two
processes: extracting facts and modeling source code. In Section 4.1, we discuss about
the fact extraction process in more details. We explain the source code modeling process
in Section 4.2 including details and examples about two generated models during the
process. Finally, Section 4.3 summarizes the chapter.
Extracting Facts
Modeling So urce Code
Interpreter
Modeler
JavaCC
Grammar
Source
Code
Class
Model
SAIG
Model
<generates>
FactsLegend
Module
Process
Data Flow
Control Flow
Data Input
Java Compiler Compiler (JavaCC)
Figure 4.1: Architecture Recovey

CHAPTER 4. ARCHITECTURE RECOVERY 34
4.1 Extracting Facts
The fact extraction is an automated process which extracts facts from the source code of
a target system. One group of the facts that we extract from a target system are classes of
the system, their attributes, and data type of each attribute. The following terminology
can formulate our desired notation for these facts:
Terminology 4.1 Consider set of all languages in the world as L and set of all data
types of these languages as TL. An object-oriented software system S is implemented in
a language l, where l ∈ L. We denote any class type and class attribute of the language
l with ct and ca classifiers respectively. Tl is the set of all data types of l where Tl ⊂ TL.
For example, TJava = {int, short, long, double, float, boolean, byte, char, string}.
The other group of facts extracted from the system is a set of relations. Our interested
relations can be classified in three forms: i) a class has a relationship with the attribute
that it owns, ii) an attribute has a relation with its data type, and iii) a class may have
a relation with another class. For the third one, we consider the association relationship
according to the UML 2.0 specification [1]. UML specifies that the association between
two classes represents the ability of an instance of the first class to send a message to
an instance of the second one. This is typically implemented with a pointer or reference
instance variable, a method parameter, or a creation of a local variable. We formalize
the three types of relations as follows:
Definition 4.1 A set of relations R over the system S in the language l is defined on a
set D, where D = {ct, ca} ∪ Tl.
Considering ti is a data type of language l where ti ∈ Tl and i ∈ {1, ..., |Tl|}, R includes:
• has-attr: the attribute ownership of a class. It is denoted as ct has-attr ca
CHAPTER 4. ARCHITECTURE RECOVERY 35
• has-type: the relation between a data type and an attribute defined over that type.
It is denoted as ca has-type tl
• depends-on: the association relation between any two class entities of S. It is
denoted as ct depends-on ct
Extracting facts can be facilitated with the help of reverse engineering techniques and
tools. Source code parsers have been used for several years. The best known of them
are Yacc [76] and Lex [50] from the Unix domain or their GNU version, Bison [7] and
Flex [30]. Lex is a lexical analyzer generator and Yacc is a parser generator. In combina-
tion, they can be used as the front end of a language translator. Lex program recognizes
regular expressions and yacc generates parsers that accept a large class of context-free
grammars [19]. Our automated fact extraction process uses JavaCC [74] to extract re-
quired facts. JavaCC is one of the most popular parser generators for use with Java
applications. It generates top-down, recursive descent parsers. The top-down nature of
JavaCC allows it to be used with a wider variety of grammars than other traditional
tools, such as Yacc and Lex. Another difference between JavaCC and Yacc/Lex is that
JavaCC contains all parsing information in one file. The convention is to name this file
with a .jj extension.
Our target systems are limited to the Java based systems in the current version of
the RUMBA framework. Therefore, our automated fact extraction process uses JavaCC
and extracts required facts from a Java based system. However, as mentioned before,
the modular architecture of RUMBA makes it possible to extend the work for future and
work with other types of OO languages.
In a nutshell, the target Java program is parsed in the first process of the architecture
recovery to extract information about its classes (and the packages which contains them),
attributes, data types, and relations as described earlier. These facts are essential for

CHAPTER 4. ARCHITECTURE RECOVERY 36
representing the system as two models in the next process of the architecture recovery
stage.
4.2 Modeling Source Code
The source code modeling process forms the extracted facts from the previous process into
two models: a UML-compliant model and a graph based model of the system structure.
The following sections elaborate further on these two models.
4.2.1 The Class Model
The UML-compliant model is used later for the analysis part of the RUMBA framework.
The specification of this model is based on the USE specification [3]. USE (UML-Based
Specification Environment) is a tool for the specification of information systems. We
have adopted some parts of the source code of this tool to be incorporated into RUMBA
as the analysis component which will be discussed further in later chapters. The USE
specification language is based on UML and OCL. It contains a textual description of a
model using features found in UML class diagrams (classes, relations, etc).
From now on, we call the UML-compliant model as Class Model of the system. Ex-
pressions written in the Object Constraint Language (OCL) are used to specify additional
integrity constraints on the class model. This model is generated automatically during
the modeling process. Later, the OCL based rules are added to it as the objectives of
the runtime analysis. For each snapshot of the runtime traces of the system, the OCL
constraints are automatically checked on this model.
The class model has three major sections:
• Classes Section lists the classes of the system. Each subsection includes name of
a class and its attributes names followed by the data type of each attribute.

CHAPTER 4. ARCHITECTURE RECOVERY 37
• Associations Section lists the association relations which exist among the classes.
Each subsection specifies a name to an association and contains the name of two
involved classes and the degree in which they depend on each other.
• Constraints Section lists the OCL based constraints on the class model. This
section is not generated during the modeling process. It is later added to the class
model in subsequent stages of the framework.
model Trading
-- classes
class Trader
attributes
name: String
itemID: Integer
basePrice: Integer
tradePrice: Integer
end
class Stock
attributes
name: String
item: Integer
currentPrice: Integer
end
-- associations
association depend_1 between
Trader[0..*]
Stock[1]
end
-- constraints
-- will be added later in
-- subsequent stages
Figure 4.2: A Class Model Example - The Trading System
As an example, the class model resulted from the source code modeling process on our

CHAPTER 4. ARCHITECTURE RECOVERY 38
example trading system is depicted in Figure 4.2 in USE specification.
4.2.2 The SAIG Model
The source code modeling process also generates another model of the system automati-
cally. This model is graph based and is called SAIG (Schema Attributed Instance Graph)
of the system. This graph is our extension to the attributed graphs [26]. We export the
SAIG as XML documents that can be easily queried and traversed in subsequent stages.
Before going into more details, formal definitions of the attributed graphs and related
concepts need to be given.
Definition 4.2 An Attributed Graph is a directed graph AG(V, E) in which:
• V = Vm ∪ Vd that Vm and Vd are called main and data nodes respectively
• E = El ∪ Ea that El and Ea are called link and attribute edges respectively such
that:
? El = {(u, v) | u, v ∈ Vm}
? Ea = {(u, v) | (u ∈ Vm) ∧ (v ∈ Vd)}
Attributed graphs can be categorized at two levels:
• Abstract Level for modelling a schema or class diagram which is called Attributed
Abstract Graph (AAG)
• Instance Level for modelling an individual system structure which is called At-
tributed Instance Graph (AIG)
Definition 4.3 An Attributed Abstract Graph AAG = 〈AG,TL〉 is an AG over the
set of data types TL such that: Vd ⊆ TL.
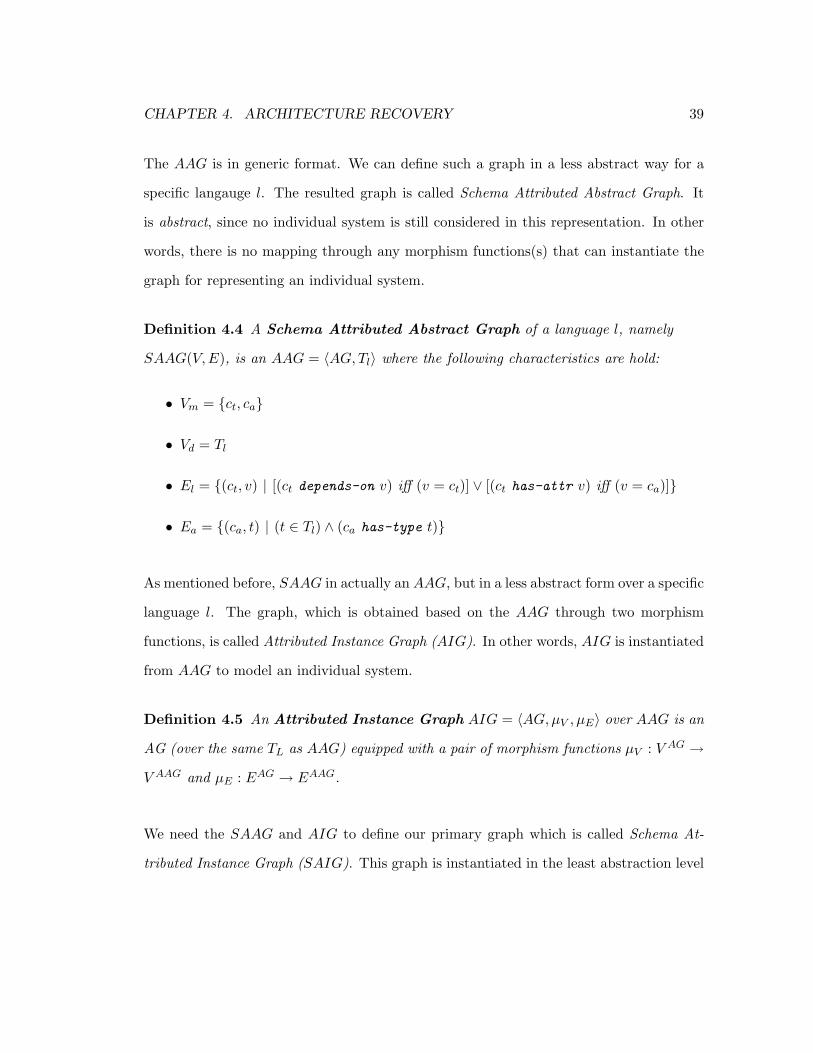
CHAPTER 4. ARCHITECTURE RECOVERY 39
The AAG is in generic format. We can define such a graph in a less abstract way for a
specific langauge l. The resulted graph is called Schema Attributed Abstract Graph. It
is abstract, since no individual system is still considered in this representation. In other
words, there is no mapping through any morphism functions(s) that can instantiate the
graph for representing an individual system.
Definition 4.4 A Schema Attributed Abstract Graph of a language l, namely
SAAG(V, E), is an AAG = 〈AG,Tl〉 where the following characteristics are hold:
• Vm = {ct, ca}
• Vd = Tl
• El = {(ct, v) | [(ct depends-on v) iff (v = ct)] ∨ [(ct has-attr v) iff (v = ca)]}
• Ea = {(ca, t) | (t ∈ Tl) ∧ (ca has-type t)}
As mentioned before, SAAG in actually an AAG, but in a less abstract form over a specific
language l. The graph, which is obtained based on the AAG through two morphism
functions, is called Attributed Instance Graph (AIG). In other words, AIG is instantiated
from AAG to model an individual system.
Definition 4.5 An Attributed Instance Graph AIG = 〈AG,µV , µE〉 over AAG is an
AG (over the same TL as AAG) equipped with a pair of morphism functions µV : V AG →V AAG and µE : EAG → EAAG.
We need the SAAG and AIG to define our primary graph which is called Schema At-
tributed Instance Graph (SAIG). This graph is instantiated in the least abstraction level

CHAPTER 4. ARCHITECTURE RECOVERY 40
than the previous ones and is instantiated from SAAG. It is used for modeling the struc-
ture of an individual system S implemented in a specific language l. The formal definition
of SAIG is as follows:
Definition 4.6 A Schema Attributed Instance Graph of the system S, namely
SAIG(V, E), is defined over the SAAG where S is implemented in the same language l.
The SAIG(V, E) is an AIG = 〈AG,µV , µE〉, where:
• Vm is the set of all classes or the attributes of the classes
• Vd ⊆ VdSAAG
• El ⊆ ElSAAG
• Ea ⊆ EaSAAG
• We know that for an AG(V, E), V = Vm ∪ Vd and E = El ∪Ea. While any SAIG
is considered as AG, morphism functions µV and µE can be defined as follows:
? ∀ v ∈ V :
¦ if v ∈ Vm and v is a class of the system S, then µV (v) = ct where ct ∈V SAAG
¦ if v ∈ Vm and v is a class attribute of the system S, then µV (v) = ca where
ca ∈ V SAAG
¦ if v ∈ Vd, then µV (v) = v where Vd ⊆ VdSAAG and v ∈ V SAAG
? ∀ e ∈ E : µE(e) = e where E ⊆ ESAAG and e ∈ ESAAG
We export the SAIG of the target system as an XML document to be used as the input
for other process of RUMBA. The XML schema for this graph is depicted in Figure 4.3.
The XML schema shows that three types of information are captured in the SAIG:

CHAPTER 4. ARCHITECTURE RECOVERY 41
Figure 4.3: XML Schema for the SAIG Model
• Class Details Field , namely class-details, records the name of each class of the
given system and the package in which the class is located. They are denoted by
className and classPackage respectively in the schema. There are also some other
fields contained by this one which are explained in below.
• Dependency Field , namely depends-on, is contained by the class-details field. It
records all classes of the system with which the corresponding class has association
relation followed by the package in which they are located. The name and package
of such classes are denoted by className and classPackage respectively.
• Attribute Ownership Field , namely has-attr, is contained by class-details field.
It records all the attributes of the corresponding class followed by the type of that
attribute. The name and the type of such attribute are denoted by attrName and
has-type respectively.
An example of the SAIG model resulted from the modeling process is depicted in Fig-
ure 4.4. This SAIG corresponds to our example Trading system.

CHAPTER 4. ARCHITECTURE RECOVERY 42
<SAIG>
<class-details>
<className>Trader</className>
<classPackage>org.atrade</classPackage>
<depends-on>
<className>Stock</className>
<classPackage>org.atrade</classPackage>
</depends-on>
<has-attr>
<attrName>name</attrName>
<has-type>String</has-type>
</has-attr>
<has-attr>
<attrName>itemID</attrName>
<has-type>int</has-type>
</has-attr>
<has-attr>
<attrName>basePrice</attrName>
<has-type>int</has-type>
</has-attr>
<has-attr>
<attrName>tradePrice</attrName>
<has-type>int</has-type>
</has-attr>
</class-details>
<class-details>
<className>Stock</className>
<classPackage>org.atrade</classPackage>
<has-attr>
<attrName>name</attrName>
<has-type>String</has-type>
</has-attr>
<has-attr>
<attrName>item</attrName>
<has-type>int</has-type>
</has-attr>
<has-attr>
<attrName>currentPrice</attrName>
<has-type>int</has-type>
</has-attr>
</class-details>
</SAIG>
Figure 4.4: A SAIG Model Example - The Trading System

CHAPTER 4. ARCHITECTURE RECOVERY 43
It is worth mentioning that, by modeling the SAIG of a system, we are actually able
to keep track of the location (package) of each class of the system. We also record the
location (class) of the attributes of each object in the system. This information is useful
since our objective constraints are constructed based upon the attributes of the runtime
objects of the system and their dependencies. We can not track the location of those
attributes unless we instrument specific parts of the code. However, using the SAIG that
records the structural information of the system, we can avoid such an instrumentation.
More details about the benefits of SAIG and the algorithm through which we map our
objectives over this model are further discussed in Chapter 5.
4.3 Summary
We have discussed the fact extraction and source code modeling processes which are
contained in the architecture recovery stage of the RUMBA framework. The first process
automatically extracts facts from the source code of a target system in the forms of classes,
their attributes, data type of each attribute, and some relations (attributes ownership
of classes, relation of an attribute with its corresponding data type, and association
relations among classes). The modeling process automatically generates two models from
the extracted facts: a UML-compliant model, called the class model, and a graph based
model of the system structure, called the SAIG model. Next stage of the framework will
use these two models for different purposes which will be explained further in the next
chapter.

Chapter 5
Seeding Objectives
In this stage of the RUMBA framework, there are two models available from the previous
stage. The first one, the class model is updated by adding the OCL constraints to it.
The second one, the SAIG model, is not modified but is used to track the locations of
those attributes which are involved in the OCL constraints. Based on this tracking, a
pattern of all required attributes for runtime monitoring is generated. This pattern is
called Pattern of Required Events (PRE).
Therefore, we have two goals in this stage: i) identifying objective properties as OCL
rules on the class model of the system, and ii) extracting pattern of required events to
reduce and filter generated events during monitoring the runtime. To address these goals,
three main processes are performed in this stage as shown in Figure 5.1. First, we identify
some OCL-based constraints as specifications for the behavioral analysis and add them to
the class model of the system. Then, a dependency graph, namely Objective Dependency
Graph (ODG), is obtained from tailoring the OCL-based properties. Finally, a pattern
of required events for runtime monitoring is generated by traversing through the SAIG
model of the system based on the ODG.
44

CHAPTER 5. SEEDING OBJECTIVES 45
The three aforementioned processes of this stage are described through Sections 5.1,
5.2, and 5.3 respectively. Afterwards, Section 5.4 summarizes the chapter.
Tailoring Objectives
Extracting E vent Patterns
Adding OCL Constraints
Objective Dependency Graph Generator
Pattern Extractor
SafetyProperties
PRE
SAIG Model
from the
Previous Stage
ODG
Legend
Module
Process
Data Flow
Control Flow
Identifying OCL-Based Rules
Updating Class Model with OCL Rules
OCL Rules
OCL-Based
Objectives
Data Input
Class Model
from the
Previous Stage Class Model
+ OCL
Figure 5.1: Seeding Objectives
5.1 Adding OCL Constraints
At this stage, the objectives of the behavioral analysis are specified. They are certain
properties on the behavior of the system which are described as OCL rules and added to
the class model. This process is performed manually. User has to have some knowledge
about the domain of the target system. Based on this information, the behavioral ex-
pectation of the system will be defined as OCL rules. Such rules are defined on the class
model of the system based on its class objects and their attributes.
We use an example to explain the usage of OCL in identifying the properties. Back

CHAPTER 5. SEEDING OBJECTIVES 46
to our example Trading system from the previous chapters, we know from our knowledge
about the system that there are some traders subscribed in a stock. These traders are in
trade with the stock on some items offered by the stock. What happens if at a particular
time, two traders trade the same item with the stock? This means that, there are states
during the runtime where at least two traders have bought the same item due to a
transactional problem. This is a behavior that is unwanted and unexpected from the user
point of view. The reason for such a transactional problem is the interference caused
by making access to critical sections mutually exclusive [60]. In other words, according
to the definition of an objective, there must be something that constrains the permitted
actions of this system. It is a constraint that must be defined to check whether the
system respects the transactional access or not. We define such an objective using OCL
as follows:
Whatever we write as OCL constraints will be checked on the sequence of states
coming from the runtime monitoring of the system. Anytime a new item is traded, the
monitor will generate the corresponding state trace for that change. Therefore, we check
if there exists any two traders which have the same itemID. It means that, they have
bought same item from the stock which is not allowed according to our expectation from
the behavior of the system. Such a constraint in OCL will be as shown in below:
context Trader inv Transaction:
Trader.allInstances → forAll (t1, t2: Trader | (t1 <> t2)
implies (t1.itemID <> t2.itemID)
The constraint indicates that for every two traders in the system, they are not allowed
to buy the same item. However, this constraint has a problem. When at the first time
it becomes false, it will stay false for the rest of the states. We have to include timing

CHAPTER 5. SEEDING OBJECTIVES 47
in this rule. Here, our clocking system helps to keep track of the latest changes in the
traders’ attributes. The variable myClock is a time stamp which we can add to each class
object during the monitoring process. When the status of an object changes, i.e. the
value of any of its attributes is updated, this time stamp will be updated (increased by
one) and assigned to the recent change of that object. When such a change is specified
as the current state of the system, the myClock time stamp has the greatest value among
time stamps of other states. It means that this state shows the recent change to the
corresponding object.
Therefore, the Transaction objective will check the itemID value of the last updated
trader object with all the previous traders in the system. In this way, myClock of such
a trader must be greater than all other traders. Moreover, its itemID attribute must be
different from all other traders in the system. Otherwise, such a trader has bought an
item which is the same as at least one of the other traders in the system, and that is
a conflict with our objective. Therefore, the above OCL rule is corrected and added to
the class model of the trading system. The updated class model of the trading system
resulted from this process is depicted in Figure 5.2 in USE specification. Generally, after
identifying OCL constraints, we add them to the class model of the system generated
from the architecture recovery stage of RUMBA.
5.2 Tailoring Objectives
The OCL-based objective, identified in the previous process, are checked at this point to
extract class objects and attributes on which they depend. The extracted information
is represented in a simple dependency graph called the Objective Dependency Graph
(ODG). We export the ODG of the target system as an XML document to be used as
the input for other processes of RUMBA. This graph records the names of classes and

CHAPTER 5. SEEDING OBJECTIVES 48
model Trading
-- classes
class Trader
attributes
name: String
itemID: Integer
basePrice: Integer
tradePrice: Integer
myClock: Integer
end
class Stock
attributes
name: String
item: Integer
currentPrice: Integer
myClock: Integer
end
-- associations
association depend_1 between
Trader[0..*]
Stock[1]
end
-- constraints
context Trader
inv Transaction:
Trader.allInstances->exists (
t1: Trader | (
Trader.allInstances->
forAll(t2 : Trader |
(t1 <> t2) implies (
(t1.myClock > t2.myClock)
and
(t1.itemID <> t2.itemID)
))
)
)
Figure 5.2: The Class Model of the Example Trading System with the Added OCLConstraint

CHAPTER 5. SEEDING OBJECTIVES 49
attributes of the system that particular properties depend on. The XML schema for this
graph is depicted in Figure 5.3. The XML schema shows that three types of information
are recorded in the ODG:
Figure 5.3: XML Schema for the Objective Dependency Graph (ODG)
• Objective Field , namely objective, records the name of each objective (OCL-
based property) added to the class model of the system. The name of this objective
is denoted by name in the schema. There are also some other fields contained by
this one which are explained in below.
• Class Field , namely class, is contained by the objective field. It records the name
of the class of the system on whose context the corresponding objective is defined.
• Dependencies Field , namely dependencies, is contained by the objective field. It
records names of attributes of the context class on which the corresponding objective
depends.
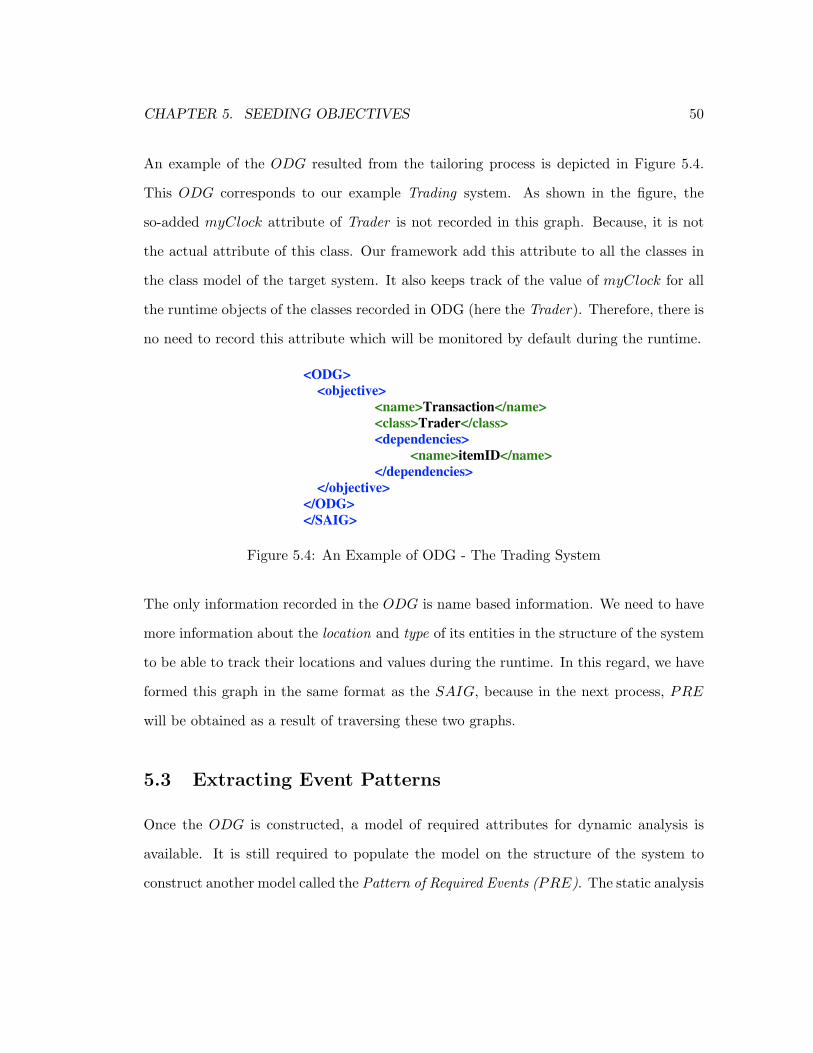
CHAPTER 5. SEEDING OBJECTIVES 50
An example of the ODG resulted from the tailoring process is depicted in Figure 5.4.
This ODG corresponds to our example Trading system. As shown in the figure, the
so-added myClock attribute of Trader is not recorded in this graph. Because, it is not
the actual attribute of this class. Our framework add this attribute to all the classes in
the class model of the target system. It also keeps track of the value of myClock for all
the runtime objects of the classes recorded in ODG (here the Trader). Therefore, there is
no need to record this attribute which will be monitored by default during the runtime.
<ODG>
<objective>
<name>Transaction</name>
<class>Trader</class>
<dependencies>
<name>itemID</name>
</dependencies>
</objective>
</ODG>
</SAIG>
Figure 5.4: An Example of ODG - The Trading System
The only information recorded in the ODG is name based information. We need to have
more information about the location and type of its entities in the structure of the system
to be able to track their locations and values during the runtime. In this regard, we have
formed this graph in the same format as the SAIG, because in the next process, PRE
will be obtained as a result of traversing these two graphs.
5.3 Extracting Event Patterns
Once the ODG is constructed, a model of required attributes for dynamic analysis is
available. It is still required to populate the model on the structure of the system to
construct another model called the Pattern of Required Events (PRE). The static analysis

CHAPTER 5. SEEDING OBJECTIVES 51
creates the PRE while it is utilized by dynamic analysis. It helps to filter generated event
traces during monitoring the runtime and reduce them to what is needed by the analysis
component.
Before presenting the algorithm through which the PRE is generated, we need to give
a formal definition for Adjacency Function of a directed graph. This concept is used in
the algorithm.
Definition 5.1 An Adjacency Function of a directed graph G(V,E), namely AdjG :
V → P (V ), returns the set of out-edge nodes for each node of G where P (V ) or 2V ,
namely power set of V , is the set of all subsets of V .
Algorithm 5.1: Extracting Event Patterns1 Input: SAIG , AdjSAIG, and ODG of an OO system S
2 Output: PRE to monitor the behavior of S
3 PRE ← Ø4 foreach v ∈ V SAIG do5 flag2V isitingNode(v) ← false
6 while (∃u ∈ VmSAIG) & (∼ flag2V isitingNode(u)) do
7 traverse(u)
8 Procedure traverse(v)begin
9 flag2V isitingNode(v) ← true10 if v ∈ V ODG then11 foreach v′ ∈ AdjSAIG(v) do12 if ∼ flag2V isitingNode(v′) then13 if v′ ∈ Vd
SAIG then14 PRE ← PRE ∪ {(v, v′)}15 flag2V isitingNode(v′) ← true16 else17 if v′ ∈ V ODG then18 PRE ← PRE ∪ {(v, v′)}19 traverse(v′)20 else21 flag2V isitingNode(v′) ← true
end

CHAPTER 5. SEEDING OBJECTIVES 52
Algorithm 5.1 describes the process through which PRE is generated from traversing the
SAIG and the ODG. In this algorithm, SAIG is traversed in depth-first order based on
the ODG to build the attributes of the PRE. For each common node v between the ODG
and the SAIG (line 10), any out-edge neighbor (v′) of v in the SAIG, that has not been
traversed yet (lines 12), will be considered for further traverse. If v′ is a data node, its
relation with v (including the two nodes) is added to the PRE (line14) in order to record
the information about the data type of v. If v′ is a main node included by the ODG, its
information is added to the PRE (lines 16 to 18). Also, v′ is traversed further (line 19)
to obtain its dependencies information. Because, according to the ODG, the definitions
of some objectives depend on the entity (class type or class attribute) corresponding to
this node. Finally, if v′, as a main node, is not included by the ODG (line 20), there is
no need to traverse it to obtain more details. Therefore, the flag2V isitingNode for this
node is set as true. The PRE is exported as an XML document to be used as the input
for the runtime monitoring component. The XML schema for this graph is depicted in
Figure 5.5.
The XML schema shows that two types of information are captured in the PRE:
• Class Information Field , namely className, records the information about each
class of the system which is point of our interest for monitoring. The name of such
a class and the package in which it is located are denoted by name and package
respectively in the schema. There is also a classAttr field contained by this one
which is explained in below.
• Class Attribute Field , namely classAttr, is contained by the className field. It
records those attributes of the corresponding class which are points of interest for
monitoring. The name and the type of such attributes are denoted by name and
type respectively.
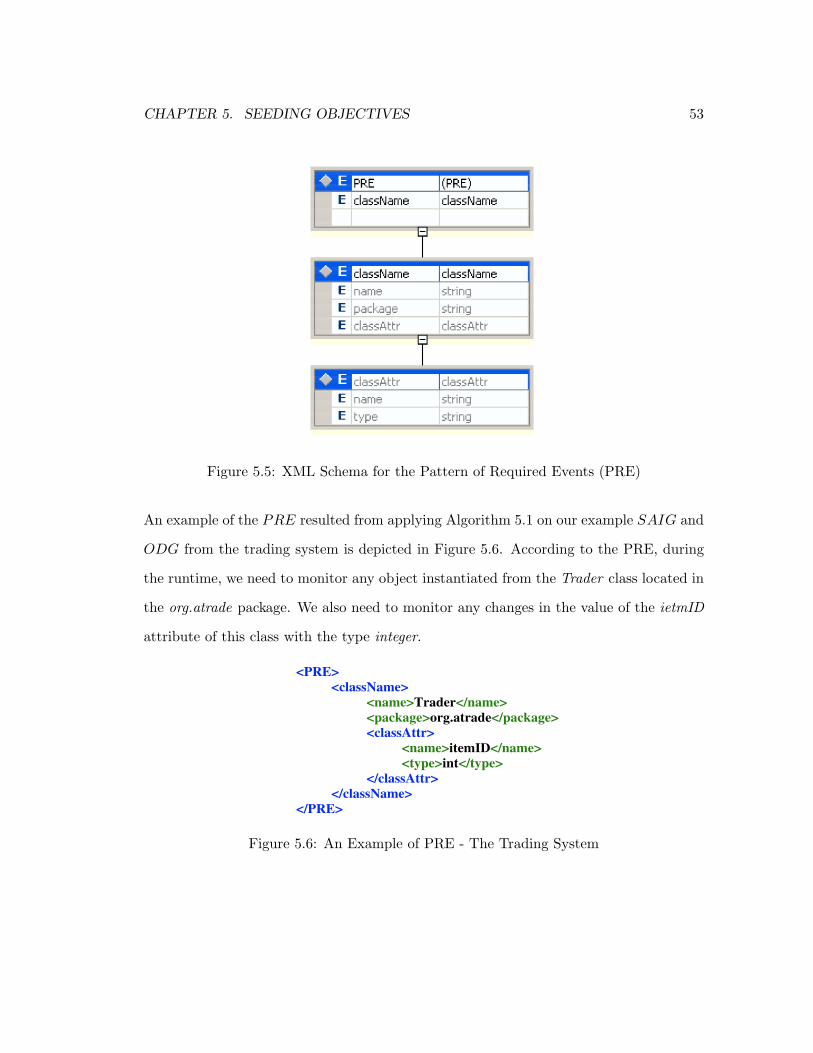
CHAPTER 5. SEEDING OBJECTIVES 53
Figure 5.5: XML Schema for the Pattern of Required Events (PRE)
An example of the PRE resulted from applying Algorithm 5.1 on our example SAIG and
ODG from the trading system is depicted in Figure 5.6. According to the PRE, during
the runtime, we need to monitor any object instantiated from the Trader class located in
the org.atrade package. We also need to monitor any changes in the value of the ietmID
attribute of this class with the type integer.
<PRE>
<className>
<name>Trader</name>
<package>org.atrade</package>
<classAttr>
<name>itemID</name>
<type>int</type>
</classAttr>
</className>
</PRE>
Figure 5.6: An Example of PRE - The Trading System

CHAPTER 5. SEEDING OBJECTIVES 54
5.4 Summary
We have discussed about the three main processes involved in the second stage of the
RUMBA framework, Seeding Objectives. First, objectives are defined in OCL (Object
Constraint Language) as specifications for the behavioral analysis. They are added to
the class model of the system. Second, the identified OCL-based properties are tailored to
extract their dependencies to the classes and attributes of the target system. The resulted
artifact is the ODG of the properties. Third, information required for filtering runtime
events is obtained. This process is done by traversing through the SAIG of the system
based on the obtained ODG from the previous process. Next stage of the RUMBA will
use the PRE and the class model to respectively do the monitoring and the analysis on
the behavior of the target system based upon them.

Chapter 6
Runtime Monitoring and Analysis
There is renewed interest in the field of dynamic software fault-monitoring largely be-
cause software systems are becoming more difficult to verify due to increases in size and
complexity. Runtime monitoring is a lightweight formal technique that checks only the
current execution of a target program against the specification. It does not consider the
possible transitions of the runtime states, however only the actual transitions are counted
into the account. Many tools have been proposed for runtime monitoring with the pur-
pose of detecting, diagnosing, and recovering from software faults. However, most of
them address this issue by modifying their target program utilizing the instrumentation
techniques.
In this stage of RUMBA, as depicted in Figure 6.1, the runtime monitoring and
analysis of the behavior of a target system is performed dynamically while no modification
of the target program is required. There are three processes in this stage. Two of
them, Observing Events and Producing Runtime States, are responsible for monitoring.
Afterwards, the third one, Constraint Based Analysis, carries out the processing of the
generated traces with respect to the objective properties identified in the previous stage.
55

CHAPTER 6. RUNTIME MONITORING AND ANALYSIS 56
The monitoring technique and the two processes responsible for monitoring are de-
scribed in Section 6.1. In Section 6.2, we discuss about the process of constraint based
analysis. Finally, Section 6.3 summarizes the chapter.
Runtime Monitoring & Analysis
JVMDI
Back-end
JD
WP
Front-end
Observing Events
Running Program
JVM
JDI
Current State
of the System
Sequence
of Events
ProducingRuntime States
Legend
Module
JPDA
Components
Used
Technology
Communication
channel
Data Flow
Control Flow
Process
ConstraintBased Analysis Reports
JDI Events
PRE from
the Previous
Stage
Class Model + OCL
From the Previous Stage
Data Output
Figure 6.1: The Structure of the Runtime Monitoring
6.1 Monitoring Process
To avoid any modifications in a target program for the runtime monitoring, it is desirable
to monitor a program by listening to the runtime events of the program dynamically.
One way is to invoke a system from another program and listen to all the event traces
during the runtime. In such a case, the target program is being debugged by a part of

CHAPTER 6. RUNTIME MONITORING AND ANALYSIS 57
the monitor. We also need a means of filtering traces and events so that only required
properties would be monitored. Required properties and attributes can be constructed
statically, and events which match with those properties will be chosen during the runtime.
JPDA (Java Platform Debugging Architecture) [39] is a multi-tiered debugging ar-
chitecture deployed first within Sun Microsystems Java 2 SDK 1.4.0. It consists of two
interfaces (JVMDI and JDI), a protocol (JDWP), and two software components which
tie them together (back-end and front-end). Figure 6.1 illustrates how we utilize JPDA
for monitoring a target Java system. As shown in the figure, JVMDI (Java Virtual Ma-
chine Debug Interface) comes between the JVM and the back-end program. It describes
the requests to the JVM for information (e.g., current stack frame), actions (e.g., set-
ting a breakpoint), and notification (e.g., when a breakpoint has been hit). The JDWP
(Java Debug Wired Protocol) defines the format of information and requests transferred
between the target program and the front-end, which implements JDI (Java Debug Inter-
face). The back-end receives JDWP packets from the front-end, and executes the com-
mands received over the JDWP. Results are returned back to the front-end via JDWP.
The JDI provides a pure Java programming language interface to access and control
the state of a virtual machine. It is implemented by the front-end while a debugger-like
application (IDE, debugger, tracer, monitoring tool like in our case, and so on) is the
client. The JDI defines information and requests at the user code level. It provides
introspective access to a running virtual machine’s state, class, array, interface, primi-
tive types, and instances of those types. It also provides explicit control over a virtual
machine’s execution.
Utilizing JDI capabilities, two processes, Observing Events and Producing Runtime
States, are responsible for runtime monitoring. The runtime event traces of a target
system are generated within these processes while no instrumentation is performed on
the source code of the system.

CHAPTER 6. RUNTIME MONITORING AND ANALYSIS 58
6.1.1 Observing Events
This process is a Java based program that has been implemented using the JDI specifi-
cations. It invokes the main class of a target Java program that has been passed to it.
This process helps us to generate a trace of the program’s execution by listening to the
VM (Virtual Machine) events and making access to its dynamic information.
An event is considered as an occurrence in the target VM that is of interest to this
process. The event can be in different types. When a specific type of event occurs, an
instance of Event as a component of an event set is enqueued in the virtual machine’s
event queue. Our interested types of events which are captured by this process using the
JDI capabilities are as follows:
• VM Start Event : It notifies about the initialization of the target VM. This event
is received before the main thread is started and before any application code has
been executed.
• Step Event : It notifies about completing a step in the target VM. The step event
is generated immediately before the code at its location is executed; thus, if the
step is entering a new method the location of the event is the first instruction of
the method. When a step leaves a method, the location of the event will be the
first instruction after the call in the calling method.
• Method Entry Event : It notifies about a method invocation in the target VM.
This event occurs after entering into the invoked method and before executing any
code. Method entry events are generated for both native and non-native methods.
• Method Exit Event : It notifies about a method return in the target VM. This
event is generated after all code in the method has executed, but the location of this
event is the last executed location in the method. Method exit events are generated

CHAPTER 6. RUNTIME MONITORING AND ANALYSIS 59
for both native and non-native methods. Method exit events are not generated if
the method terminates with a thrown exception.
• Class Preparation Event : It notifies about a class preparation in the target VM.
Class preparation involves creating the attributes (class variables and constants) for
a class or interface and initializing such attributes to the standard default values.
This does not require the execution of any Java code; explicit initializers for at-
tributes are executed as part of initialization, not preparation. Class prepare events
are not generated for primitive classes (for example, java.lang.Integer.TYPE).
• Field Modification Event : It notifies about the modification of a class attribute
in the target VM.
For the time being, we do not do any action upon receiving method entry and exit events.
The current version of the RUMBA framework monitors the values of attributes and the
local variables of primitive types. The reason is that the state of a program is ultimately
contained in the attributes and variables of primitive types. As a future direction, the
theory of the SAIG model can be extended to define and model a method as an entity
of a target system. In such a case, specific actions can be done regarding monitoring the
method invocations and exits and also analyzing the behavior of the system based on the
methods behavior.
When a new event arrives, it will be checked to determine its type. It will be then
dispatched to the corresponding handler to perform certain procedures based on its con-
tents. The PRE from the previous stage is utilized by this process to filter monitored
event traces. Therefore, only those event traces, which match with the specifications of
the PRE, are passed to the next process. As an example on our Trading system, the
information included by the PRE, depicted in Figure 5.6, directs this process of RUMBA
to read the contents of any Class Preparation Event regarding loading a new Trader class

CHAPTER 6. RUNTIME MONITORING AND ANALYSIS 60
object. The itemID attribute of this class object will be monitored to check whether its
value changes during the runtime. If it changes, a Field Modification Event will be trig-
gered for this attribute. The recent updated value will be obtained based on the contents
of such an event to create a snapshot of the system state according to the recent change.
6.1.2 Producing Runtime States
This process receives the runtime information from the previous process. It will form the
information as a sequence of system states for the analysis component. As mentioned
before, the analysis component uses part of the USE tool [3] to perform constraint based
analysis on the class model of the system. The set of data which are analyzed over this
model are the sequence of runtime states of the system. Therefore, in this process, the
sequence of generated traces is formed in the USE specification format which is acceptable
by the analysis component. Each event represents a state of the system at the time that
it was extracted from the running program. To specify the events information into the
USE format, some commands are used. Three types of commands that we use are as
follows:
• create command specifies a new created object of the system. The content of a
class preparation event contains the name of the new object and its class type. The
format of the create command is as follows:
¦ !create [objectname] : [classname]
For example, when a new object of the Trader class is created and loaded into the
Trading system, the state that shows this change in the system would be as follows:
¦ !create trader1 : Trader
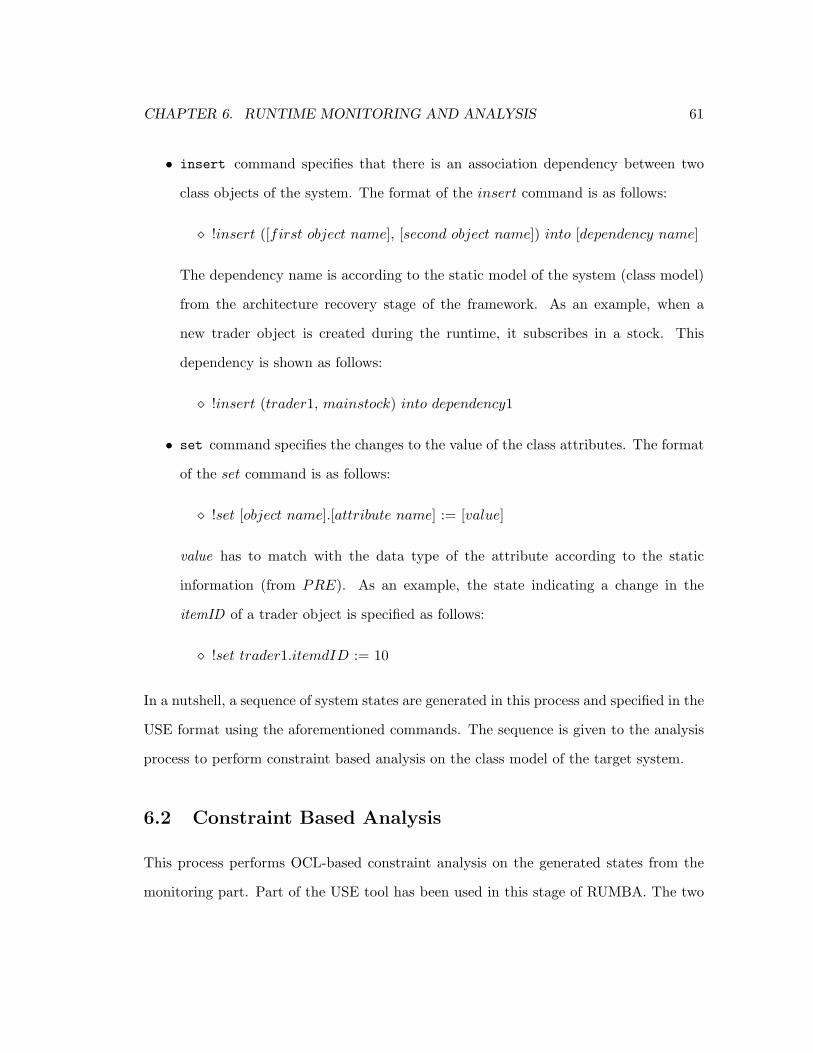
CHAPTER 6. RUNTIME MONITORING AND ANALYSIS 61
• insert command specifies that there is an association dependency between two
class objects of the system. The format of the insert command is as follows:
¦ !insert ([first object name], [second object name]) into [dependency name]
The dependency name is according to the static model of the system (class model)
from the architecture recovery stage of the framework. As an example, when a
new trader object is created during the runtime, it subscribes in a stock. This
dependency is shown as follows:
¦ !insert (trader1, mainstock) into dependency1
• set command specifies the changes to the value of the class attributes. The format
of the set command is as follows:
¦ !set [object name].[attribute name] := [value]
value has to match with the data type of the attribute according to the static
information (from PRE). As an example, the state indicating a change in the
itemID of a trader object is specified as follows:
¦ !set trader1.itemdID := 10
In a nutshell, a sequence of system states are generated in this process and specified in the
USE format using the aforementioned commands. The sequence is given to the analysis
process to perform constraint based analysis on the class model of the target system.
6.2 Constraint Based Analysis
This process performs OCL-based constraint analysis on the generated states from the
monitoring part. Part of the USE tool has been used in this stage of RUMBA. The two

CHAPTER 6. RUNTIME MONITORING AND ANALYSIS 62
main components of this tool are an animator for simulating UML models and an OCL
interpreter for constraint checking. We have incorporated the later one into the RUMBA
framework to perform the analysis process. System states are snapshots of a running
system which are fed to the analysis process. We get the real data coming from the
monitoring component to make the snapshots of the running system.
During the running time of the RUMBA framework, the analysis process runs with the
specifications in terms of the class model with the OCL-based objectives. Hence, the first
part of the specifications contains a textual description (classes, associations, attributes,
and constraints) as the class model of the system. The second part is represented through
OCL constraints added to the class model, which can be evaluated and appraised during
the analysis.
The analysis process starts with an empty system state where no objects and associ-
ation links exist. Once the class model has been loaded to the process, we need to create
objects and initialize the attributes. The next step consists of establishing the associations
between objects. The monitoring component provides this information for the analysis
part in terms of the snapshots of the system states defined using the aforementioned
commands set from the previous process.
Each time a change occurs in the system, the monitor generates a new snapshot
of the system state and gives it to the analysis part. An automatic checking of the
specified rules will be carried out on the new generated state. For example, when a new
object is introduced, it is checked whether it fulfils the specification of the model and
the constraints. The analysis is constraint based as the OCL rules are evaluated on the
states. Either a constraint fails or succeeds for a system state, there will be a report for
it as the result of the analysis on that state.
Part of the reports of the constraint based analysis during the runtime monitoring of
the Trading system is depicted in Figure 6.2. Suppose that there are 4 traders instantiated
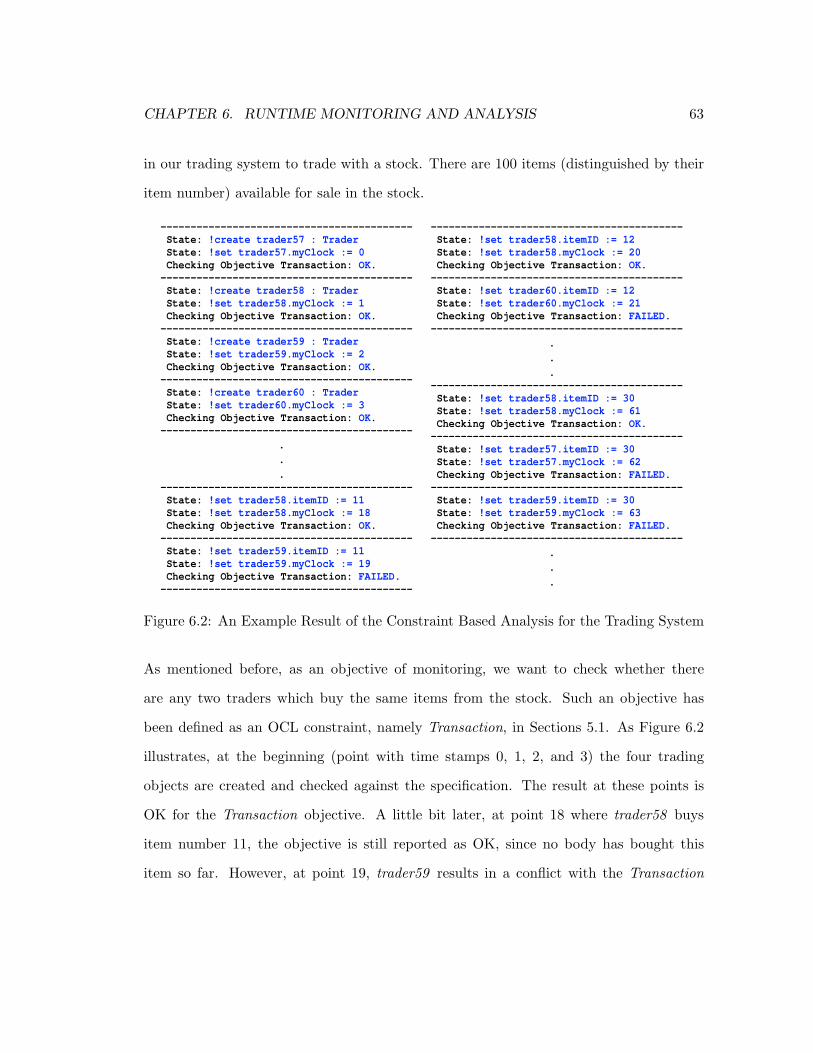
CHAPTER 6. RUNTIME MONITORING AND ANALYSIS 63
in our trading system to trade with a stock. There are 100 items (distinguished by their
item number) available for sale in the stock.
------------------------------------------
State: !create trader57 : Trader
State: !set trader57.myClock := 0
Checking Objective Transaction: OK.
------------------------------------------
State: !create trader58 : Trader
State: !set trader58.myClock := 1
Checking Objective Transaction: OK.
------------------------------------------
State: !create trader59 : Trader
State: !set trader59.myClock := 2
Checking Objective Transaction: OK.
------------------------------------------
State: !create trader60 : Trader
State: !set trader60.myClock := 3
Checking Objective Transaction: OK.
------------------------------------------
.
.
.
------------------------------------------
State: !set trader58.itemID := 11
State: !set trader58.myClock := 18
Checking Objective Transaction: OK.
------------------------------------------
State: !set trader59.itemID := 11
State: !set trader59.myClock := 19
Checking Objective Transaction: FAILED.
------------------------------------------
------------------------------------------
State: !set trader58.itemID := 12
State: !set trader58.myClock := 20
Checking Objective Transaction: OK.
------------------------------------------
State: !set trader60.itemID := 12
State: !set trader60.myClock := 21
Checking Objective Transaction: FAILED.
------------------------------------------
.
.
.
------------------------------------------
State: !set trader58.itemID := 30
State: !set trader58.myClock := 61
Checking Objective Transaction: OK.
------------------------------------------
State: !set trader57.itemID := 30
State: !set trader57.myClock := 62
Checking Objective Transaction: FAILED.
------------------------------------------
State: !set trader59.itemID := 30
State: !set trader59.myClock := 63
Checking Objective Transaction: FAILED.
------------------------------------------
.
.
.
Figure 6.2: An Example Result of the Constraint Based Analysis for the Trading System
As mentioned before, as an objective of monitoring, we want to check whether there
are any two traders which buy the same items from the stock. Such an objective has
been defined as an OCL constraint, namely Transaction, in Sections 5.1. As Figure 6.2
illustrates, at the beginning (point with time stamps 0, 1, 2, and 3) the four trading
objects are created and checked against the specification. The result at these points is
OK for the Transaction objective. A little bit later, at point 18 where trader58 buys
item number 11, the objective is still reported as OK, since no body has bought this
item so far. However, at point 19, trader59 results in a conflict with the Transaction

CHAPTER 6. RUNTIME MONITORING AND ANALYSIS 64
objective because of buying the same item as trader58. A similar scenario happens for
trader58 and trader60 at points 20 and 21 because of buying the same item (number 12).
Furthermore, there are reports of conflicts at points 62 and 63, because trader57 and
trader59 have bought the same item as trader58 at the corresponding points of time.
6.3 Summary
In this chapter, we have discussed about the three main processes involved in the third
stage of the RUMBA framework, Runtime Monitoring and Analysis. Two of them, Ob-
serving Events and Producing Runtime States, are responsible for monitoring. Using the
JDI capabilities (included in JPDA), the main class of a target Java system is invoked so
that the system starts running while the monitor is making access to its dynamic informa-
tion. The runtime event traces of the system are generated within these processes while
no instrumentation is performed on the source code of the system. Afterwards, the third
process of this stage, Constraint Based Analysis, carries out the processing of the gener-
ated traces with respect to the OCL based objectives identified in the previous stage. If a
constraint fails for a system state, there will be a report for that indicating the state and
the specific property corresponding to the constraint. We will show the effectiveness of
RUMBA in this regard by applying the aforementioned three stages on two open source
Java software systems in the next chapter. We will also evaluate the efficiency of our
framework on the two systems in terms of processor and memory utilization.

Chapter 7
Experimental Studies
In this chapter, we perform a set of empirical studies on the proposed RUMBA framework
to assess the techniques introduced in this thesis. The proposed framework has been
implemented in a prototype that aims to assess the behavior of a given Java software
system with respect to particular specifications. We have applied the preliminary version
of RUMBA on a small Java based trading system in our previous work [4]. At that time,
we checked two properties; a transaction-based property and a boundary-based one.
At the time being, that RUMBA has been fully developed as a semi-automated pro-
cess, we have applied it on two open source Java software systems. One of them is a
resource management system, namely Rapla, while the other one is a GUI framework
for technical and structured graphics, namely JHotDraw. The purpose of the empirical
study in this chapter is to test the effectiveness of the proposed RUMBA framework. We
also evaluate the efficiency of our runtime monitoring technique in this chapter.
We outline the implementation of the prototype for the RUMBA framework in Sec-
tion 7.1. We empirically evaluate the usefulness and the correctness of the framework on
two Java based case study systems in Sections 7.2 and 7.3. Section 7.2 includes informa-
65

CHAPTER 7. EXPERIMENTAL STUDIES 66
tion about a resource management case study system, Rapla, while Section 7.3 discusses
about a GUI based case study application, JHotDraw. In Section 7.4, we evaluate the
efficiency of our framework on the two case studies in terms of processor and memory
utilization. Finally, we summarize this chapter in Section 7.5.
7.1 A Prototype for RUMBA
A prototype has been developed in Java programming language on the Windows XP
platform to implement the RUMBA framework in a semi-automated manner. The pro-
totype provides functionality for: i) recovering the required structural information of a
target system, ii) modeling the structural information utilizing graph theory concepts,
iii) defining the objectives of the behavioral analysis in OCL specifications, iv) extracting
and modeling the required information for runtime monitoring based on the structural
information and OCL specifications, v) monitoring the runtime of the system with re-
spect to the model of the required information, and vi) evaluating the system behavior
at runtime with respect to the predefined objectives.
The prototype consists of two Java based applications. These applications construct
the automated parts of the framework. There is still required to manually define the
OCL based objectives and create the ODG based on them. The ODG is represented as
an XML document ready to be used as an input for one of the applications. The two
applications are as follows:
• The first application has been developed in Eclipse 3.1 [24] using JDK 1.5.0 and
JavaCC plugin [40]. It receives the source code of a Java based system and performs
the first stage of RUMBA fully automated. Two structural models of the system,
class model and SAIG model, are generated by this application. The class model is
in the format of USE and therefore it is generated as a “.use” document. The SAIG

CHAPTER 7. EXPERIMENTAL STUDIES 67
model is an XML document containing the graph representation of the SAIG.
Figure 7.1: A Snapshot of the RUMBA in NetBeans
• The second application has been developed in NetBeans 5.0 [64] environment using
JDK 1.5.0 and JPDA [39] capabilities. A snapshot of its GUI is depicted in Fig-
ure 7.1. This application receives four inputs: iii) the name of the class model of
the target Java based system, ii) the classpath of the system, iii) the required input
arguments for running the target system, if there exists any, and iv) the OCL-based
specifications of the objectives. Moreover, the application receives the “saig.xml”
and “odg.xml” from the classpath as the SAIG and ODG models respectively.
There are five initialization tasks performed as soon as the application runs: i) the
ODG and SAIG models are imported from their corresponding XML documents to

CHAPTER 7. EXPERIMENTAL STUDIES 68
appropriate dynamic data structures, ii) the PRE is generated based on the SAIG
and ODG using the algorithm presented in Chapter 5, iii) the OCL interpreter of
the USE tool is invoked in a separate thread (as the analysis process) by giving
the class model of the system to it, iv) a buffer is created for the communication
of the monitoring process and analysis process, and v) the main class of the tar-
get system is invoked by passing the appropriate arguments to it. Afterwards, the
target program starts running in the same way as it runs as a stand-alone applica-
tion. However, in this way, it is being monitored by the monitoring process of our
application. Each time an interesting change (according to the PRE) occurs in the
system, the monitor generates a new snapshot of the system state and gives it to
the analyzer via the communication buffer. An automatic checking of the specified
rules will be carried out on the new state.
It is worth mentioning that, the analysis process runs online with the monitor in the
above scenario. It is also possible to run it in an offline manner. In other words, instead
of transferring the sequence of generated traces to the communication buffer, they will be
stored in a repository during the monitoring process. The class model and the repository
of the traces can be given to the analyzer in a later time so that the OCL based checking
would be done on the traces.
7.2 Case Study: Rapla
Rapla [2] is a resource management system, written in Java. It has been developed at the
University of Bonn in Germany. Rapla allows coordination between the lectures and the
administration. It offers multiple ways to view the available resources and schedule the
events. A snapshot of the Rapla GUI is depicted in Figure 7.1. Rapla started as a simple
room booking software, but in the last five years it evolved into a configurable framework

CHAPTER 7. EXPERIMENTAL STUDIES 69
for event and resource-management.
Figure 7.2: A Snapshot of the Rapla System
In this section, we apply the processes of RUMBA on Rapla to empirically evaluate the
usefulness of the framework. The version we worked on is 0.12.4 that has 65K lines
of code. It consists of 438 Java source files that defines 467 classes and 101 interfaces
distributed in 43 packages.
7.2.1 Rapla: Architecture Recovery
To extract the class model and the SAIG model, we applied the architecture recovery
of the framework on Rapla. As mentioned before, this stage of the framework has been
developed in Eclipse 3.1 using JavaCC 1.5. This Java based application which includes

CHAPTER 7. EXPERIMENTAL STUDIES 70
our parser and modeler, has been run to build the system architectural models that are
represented by the class and SAIG models.
As mentioned before, the class model has been represented in USE format while we
exported the SAIG model as an XML document. The information in SAIG is included
by the predefined XML tags. Just to present a view of the Rapla’s SAIG model, a small
part of its XML document is depicted in Figure 7.3.
.
.
.
<class-details>
<className>PeriodImpl</className>
<classPackage>org.rapla.entities.impl</classPackage>
<depends-on>
<className>Calendar</className>
</depends-on>
<has-attr>
<attrName>serialVersionUID</attrName>
<has-type>long</has-type>
</has-attr>
<has-attr>
<attrName>name</attrName>
<has-type>String</has-type>
</has-attr> .
.
.
</class-details> .
.
.
Figure 7.3: Part of the SAIG Model of Rapla
7.2.2 Rapla: Seeding Objectives
In the second stage, Rapla 0.12.4 was manipulated to find out if there is any conceptual
anomaly in the system that can be used as a basis to check the validity of RUMBA. We
found that there is a conceptual anomaly in the way that a period of time is created
in the system. A period of time can be defined and added to the system by assigning
a start time and an end time to it, plus assigning a name to the period. However, it
is possible to define more than one period with the same name. Hence, whenever an

CHAPTER 7. EXPERIMENTAL STUDIES 71
event is scheduled for a period of time, there is an ambiguity in the periods selection.
Because, there is a list of various periods available for scheduling, possibly with the same
name. In this regard, we defined an OCL-based objective, so-called NameConflict, on
the context of “Period” class of Rapla. This objective defines a property on a class,
namely “PeriodImpl”, which implements a period in the system. This objective and its
corresponding ODG are depicted in Figure 7.4.
context PeriodImpl
inv NameConflict:
PeriodImpl.allInstances->exists (
p1:PeriodImpl | (
PeriodImpl.allInstances->
forAll(p2 : PeriodImpl |
(p1 <> p2) implies (
(p1.myClock > p2.myClock)
and
(p1.name <> p2.name)
))
)
)
(a) The OCL Constraint
<objective>
<name>NameConflict</name>
<class>PeriodImpl</class>
<dependencies>
<name>name</name>
</dependencies>
</objective>
(b) The Corresponding ODG
Figure 7.4: An Example of an OCL-Based Objective and the Corresponding ODG forRapla
The NameConflict objective will check any period, p1, recently created and added to the
system and will compare it with other periods in the system. If the assigned name to p1
is same as the name of any other period object in the system, like p2, the NameConflict

CHAPTER 7. EXPERIMENTAL STUDIES 72
will be reported as Failed for this recent state. Otherwise, it will be reported as OK.
After the ODG is constructed, Pattern Extractor, another Java based application, utilizes
algorithm 5.1, as discussed in Section 5.3, to generate the Pattern of Required Events
(PRE) based on the SAIG and the ODG. A part of PRE, corresponding to the required
information for the predefined OCL-based objective, is depicted in Figure 7.5. According
to the PRE, during the runtime, we need to monitor any object instantiated from the
PeriodImpl class located in the org.rapla.entities.imple package. We also need to monitor
any changes in the value of the name attribute of this class with the type String.
<classInfo>
<name>PeriodImpl</name>
<package>org.rapla.entities.impl</package>
<classAttr>
<name>name</name>
<type>String</type>
</classAttr>
</classInfo>
Figure 7.5: Part of the PRE Corresponding to the Example Objective for Rapla
7.2.3 Rapla: Runtime Monitoring and Analysis
Finally, we give the produced PRE and the path of Rapla source code to the monitoring
component. As mentioned before, this component has been developed within a Java
program in NetBeans 5.0 using JPDA 5.0 [39]. It invokes the main class of the Rapla
and generates event traces from the system based on the PRE. Any event regarding the
creation of an instance of the PeriodImpl class and any event about updating the value of
the name attribute of this class object, creates a snapshot of the system state. Produced
states are given to the next process which performs the constraint based analysis on
them. Part of the reports of the constraint based analysis during the runtime monitoring
of Rapla is depicted in Figure 7.6.

CHAPTER 7. EXPERIMENTAL STUDIES 73
-------------------------------------------------------------
State: !create periodimpl1786 : PeriodImpl
State: !set periodimpl1786.name := 'p24'
State: !set periodimpl1786.myClock := 481
Checking Objective NameConflict: OK.
-------------------------------------------------------------
State: !create periodimpl1794 : PeriodImpl
State: !set periodimpl1794.name := 'p24'
State: !set periodimpl1794.myClock := 490
Checking Objective NameConflict: FAILED.
-------------------------------------------------------------
State: !create periodimpl1805 : PeriodImpl
State: !set periodimpl1805.name := 'p25'
State: !set periodimpl1805.myClock := 492
Checking Objective NameConflict: OK.
-------------------------------------------------------------
Figure 7.6: Part of the Result of the Constraint Based Analysis for Rapla
As Figure 7.6 illustrates, at the point with a time stamp of 481, a new period object is
created, namely p24. It does not cause any conflict, since there is no period in the system
with name p24. However, at the point of time with the time stamp 490, NameConflict
raises a failure, because the new created period object has the same name as the previous
one. Furthermore, at the point with the time stamp 492, the current state is reported as
an OK state with respect to the NameConflict objective. Because, no period with the
name p25 exists in the system, and it does not cause any conflict.
7.3 Case Study: JHotDraw
JHotDraw [43] is a Java GUI framework for technical and structured graphics. It defines
a basic skeleton for a GUI-based editor with tools in a tool palette, different views, user-
defined graphical figures, and support for saving, loading, and printing drawings. The
framework can be customized using inheritance and combining components. Besides the
main drawing window, JHotDraw offers little support for different kinds of windows, such
as text editors. With some knowledge of JHotDraw’s structure, it can be extended to

CHAPTER 7. EXPERIMENTAL STUDIES 74
include missing functionalities.
Figure 7.7: A Snapshot of the JHotDraw System
In this section, we apply the processes of RUMBA on JHotDraw to empirically evaluate
the correctness of the framework. The version we worked on is 5.3 that has 14K lines
of code. It consists of 195 Java source files that defines 208 classes and 33 interfaces
distributed in 11 packages. We consider a sample application included in this version,
namely Java Draw Application. A snapshot of its GUI is depicted in Figure 7.7. This
application represents various standard tools and figures provided with JHotDraw. We
monitor the behavior of this application in our experiment.
7.3.1 JHotDraw: Architecture Recovery
Similar to what we did for the previous case study application, our Java based parser and
modeler have been run on the source code of JHotDraw to build the system architectural

CHAPTER 7. EXPERIMENTAL STUDIES 75
models in the architecture recovery stage. The results are the class model and the SAIG
model of JHotDraw. Just to present a view of the SAIG model of JHotDraw, a small
part of its XML document is depicted in Figure 7.8.
.
.
.
<class-details>
<className>DrawApplication</className>
<classPackage>CH.ifa.draw.application</classPackage>
<depends-on>
<className>Tool</className> .
.
.
</depends-on>
<has-attr>
<attrName>fTool</attrName>
<has-type>Tool</has-type>
</has-attr>
<has-attr>
<attrName>loadName</attrName>
<has-type>String</has-type>
</has-attr> .
.
.
</class-details> .
.
.
Figure 7.8: Part of the SAIG Model of JHotDraw
7.3.2 JHotDraw: Seeding Objectives
In the second stage, Java Draw Application in JHotDraw 5.3 was manipulated to find
out if there is any interesting point for dynamically monitoring the application. We
realized that there is a class in the system, namely DrawApplication, that is responsible
for storing or loading the graphic files into or from the memory. We intended to monitor
the behavior of the application regarding the file transactions through this class and its
attributes. It is worth mentioning that such an objective works not only for this specific
application but also for many other domains. For example, a system administrator may
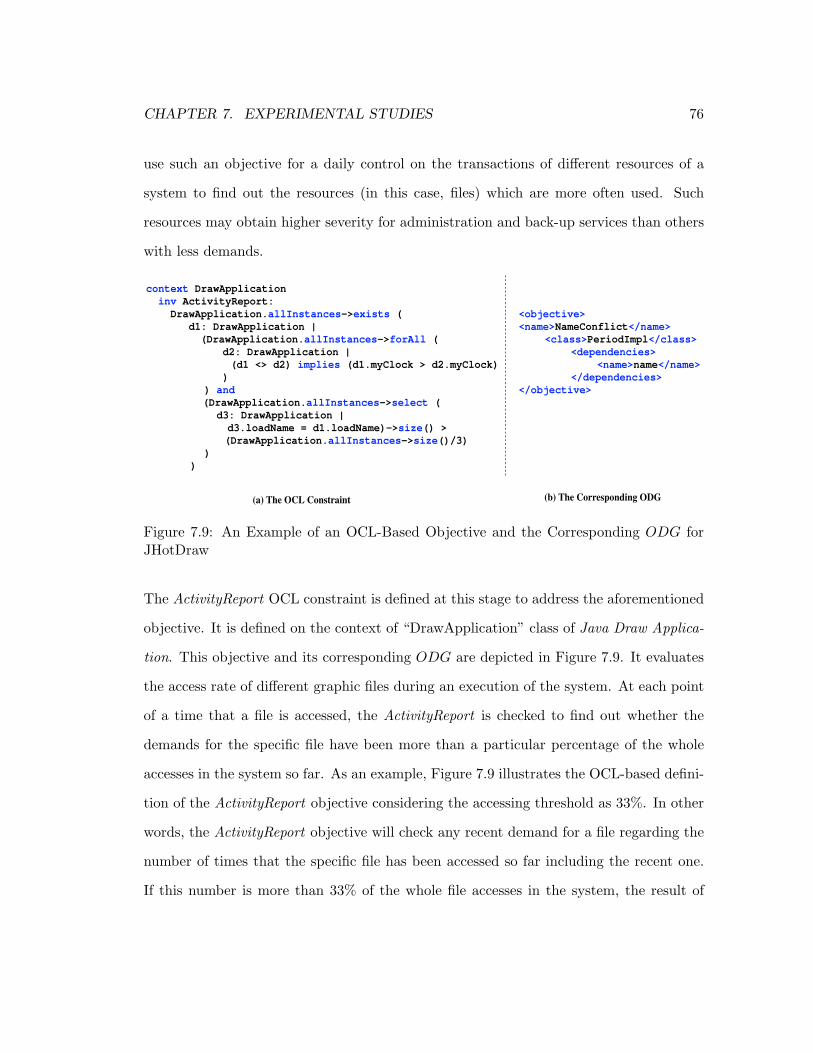
CHAPTER 7. EXPERIMENTAL STUDIES 76
use such an objective for a daily control on the transactions of different resources of a
system to find out the resources (in this case, files) which are more often used. Such
resources may obtain higher severity for administration and back-up services than others
with less demands.
context DrawApplication
inv ActivityReport:
DrawApplication.allInstances->exists (
d1: DrawApplication |
(DrawApplication.allInstances->forAll (
d2: DrawApplication |
(d1 <> d2) implies (d1.myClock > d2.myClock)
)
) and
(DrawApplication.allInstances->select (
d3: DrawApplication |
d3.loadName = d1.loadName)->size() >
(DrawApplication.allInstances->size()/3)
)
)
(a) The OCL Constraint
<objective>
<name>NameConflict</name>
<class>PeriodImpl</class>
<dependencies>
<name>name</name>
</dependencies>
</objective>
(b) The Corresponding ODG
Figure 7.9: An Example of an OCL-Based Objective and the Corresponding ODG forJHotDraw
The ActivityReport OCL constraint is defined at this stage to address the aforementioned
objective. It is defined on the context of “DrawApplication” class of Java Draw Applica-
tion. This objective and its corresponding ODG are depicted in Figure 7.9. It evaluates
the access rate of different graphic files during an execution of the system. At each point
of a time that a file is accessed, the ActivityReport is checked to find out whether the
demands for the specific file have been more than a particular percentage of the whole
accesses in the system so far. As an example, Figure 7.9 illustrates the OCL-based defini-
tion of the ActivityReport objective considering the accessing threshold as 33%. In other
words, the ActivityReport objective will check any recent demand for a file regarding the
number of times that the specific file has been accessed so far including the recent one.
If this number is more than 33% of the whole file accesses in the system, the result of

CHAPTER 7. EXPERIMENTAL STUDIES 77
check will be reported as OK. Otherwise, it will be reported as Failed, meaning that the
demands for the file have been ignorable so far (according to the 33% policy).
<classInfo>
<name>DrawApplication</name>
<package>CH.ifa.draw.application</package>
<classAttr>
<name>loadName</name>
<type>String</type>
</classAttr>
</classInfo>
Figure 7.10: Part of the PRE Corresponding to the Example Objective for JHotDraw
After the ODG is constructed, the Pattern Extractor of RUMBA, utilizes algorithm 5.1,
as discussed in Section 5.3, to generate the Pattern of Required Events (PRE) based on
the SAIG and the ODG. A part of PRE, corresponding to the required information for
the ActivityReport objective, is depicted in Figure 7.10. According to the PRE, during
the runtime, we need to monitor any object instantiated from the DrawApplication class
located in the CH.ifa.draw.application package. We also need to monitor any changes in
the value of the loadName attribute of this class with the type String that records the
name of any accessed file.
7.3.3 JHotDraw: Runtime Monitoring and Analysis
Similar to what we did for Rapla, we give the produced PRE and the path of JHotDraw
source code to the monitoring component. It invokes the main class of the Java Draw
Application in JHotDraw and generates event traces from the system based on the PRE.
Any event regarding the creation of an instance of the DrawApplication class and any
event about updating the value of the loadName attribute of this class object, creates
a snapshot of the system state. Because, the name of each graphic file is recorded by
loadName in DrawApplication class. Produced states are given to the next process which

CHAPTER 7. EXPERIMENTAL STUDIES 78
performs the constraint based analysis on them. Part of the reports of the constraint
based analysis during the runtime monitoring of Java Draw Application is depicted in
Figure 7.11.
-----------------------------------------------------
State: !create drawapplication579 : DrawApplication
State: !set drawapplication579.loadName := ‘a01.draw'
State: !set drawapplication579.myClock := 0
Checking Objective ActivityReport: OK.
-----------------------------------------------------
State: !create drawapplication1752 : DrawApplication
State: !set drawapplication1752.loadName := ‘a02.draw'
State: !set drawapplication1752.myClock := 1
Checking Objective ActivityReport: OK.
-----------------------------------------------------
State: !create drawapplication2440 : DrawApplication
State: !set drawapplication2440.loadName := ‘a01.draw'
State: !set drawapplication2440.myClock := 2
Checking Objective ActivityReport: OK.
-----------------------------------------------------
State: !create drawapplication1841 : DrawApplication
State: !set drawapplication1841.loadName := ‘d21.draw'
State: !set drawapplication1841.myClock := 3
Checking Objective ActivityReport: FAILED.
-----------------------------------------------------
-----------------------------------------------------
State: !create drawapplication2090 : DrawApplication
State: !set drawapplication2090.loadName := ‘w5.draw'
State: !set drawapplication2090.myClock := 4
Checking Objective ActivityReport: FAILED.
-----------------------------------------------------
State: !create drawapplication1845 : DrawApplication
State: !set drawapplication1845.loadName := ‘a01.draw'
State: !set drawapplication1845.myClock := 5
Checking Objective ActivityReport: OK.
-----------------------------------------------------
State: !create drawapplication1388 : DrawApplication
State: !set drawapplication1388.loadName := ‘a02.draw'
State: !set drawapplication1388.myClock := 6
Checking Objective ActivityReport: FAILED.
-----------------------------------------------------
.
.
.
.
Figure 7.11: Part of the Result of the Constraint Based Analysis for JHotDraw
As Figure 7.11 illustrates, at the points with the time stamps of 0, 2, and 5, the Activ-
ityReport reports OK, meaning that file “a01.draw” is detected as a highly accessed file
so far. Because the number of accesses to this file is correspondingly 1 out of 1, 2 out
of 3, and 3 out of 6 at the mentioned points of time. It is obvious that for all of them,
the access number is more than 33% (the policy of the objective). On the other hand,
for file “a02.draw”, the report is OK at time 1 because it has been accessed once out
of 2 times up to that point. However, the ActivityReport reports Failed at time 6 for
the same file, since it has been accessed 2 times out of 7 which is less than 33%. If an
administrator has access to such an information as a result of a daily monitoring of the
target system, she/he can detect high demanding files and provide appropriate action on
them accordingly.

CHAPTER 7. EXPERIMENTAL STUDIES 79
7.4 Evaluation
The monitoring process of the RUMBA framework invokes the main class of the target
program and listens to all event traces during the runtime. Therefore, the evaluation
criteria need to address performance. We study this issue in terms of processor utilization
and memory consumption in the system. The evaluation was carried on a Windows
desktop with Intel Pentium IV CPU 3.4GHz, with 2GB memory.
7.4.1 Processor Utilization
The processor utilization indicates to what extent the CPU of a computer is occupied
with the process of a running application. We compare the processor utilization while
the case study applications are running in two different scenarios: i) without monitoring,
ii) with monitoring. Figure 7.12 illustrates the processor utilization for Rapla in the two
scenarios. For both, we consider a period of 100 seconds monitoring of the system with
the same set of interactions during this period. After that time, we stop the monitoring
to show a snapshot of changes from the beginning to the end of a monitoring process. A
longer period does not change the performance results, because as the systems passes its
initialization loads after the first few seconds, it gets stable for the rest of the time. We
further elaborate on this issues in the rest of this chapter.
The first graph of Figure 7.12 illustrates the percentage of CPU utilization for the
execution period of Rapla with our monitoring framework. On the other hand, in the
second graph, the same trend is shown but for the regular execution of the Rapla without
monitoring. It is obvious that there is almost a constant increase in CPU utilization,
about 30%, in the first graph against the second one. The reason behind such an increase
is that our monitoring technique hooks into the JVM and listens to all event traces during
the runtime. Hence, no matter what the running application would be, there is an expense

CHAPTER 7. EXPERIMENTAL STUDIES 80
(a) With Monitoring (b) Without Monitoring
Figure 7.12: Processor Utilization for Rapla
for such a hooking. This increase is about 24% for JHotDraw application according to
the corresponding graphs in Figure 7.13. We believe in a decrease in this expense for
our future case study applications which will be from different domains. Because, both
of the current applications are heavily user interactive systems. In such systems, there
are too many events generated because of the interaction of a user with the system GUI.
Therefore, our monitor collects such events at the first glance, but they will be ignored
after the monitor finds them unnecessary for the analysis.
In addition to the above expense, there is another one which we call it processing load
resulted from our monitoring. Back to Figure 7.12 for Rapla, there are a bunch of ripples
in both graphs. There are actually the major processing periods of the running system.
The peaks are mainly because of an access to the IO, a major computation load, and
etc. We can compare the maximum length of these ripples in both graphs. It can be
computed based on the distance of the two dashed lines in each graph. The distance is
about 30% and 25% for graphs a and b from Figure 7.12 respectively. We find this 5%
increase in graph a in comparison to graph b reasonable and because of the processing

CHAPTER 7. EXPERIMENTAL STUDIES 81
(a) With Monitoring (b) Without Monitoring
Figure 7.13: Processor Utilization for JHotDraw
load of our monitoring and analysis processes. The PRE is utilized by the monitor to
filter the event traces. Those event traces, which match with the specifications of the
PRE, are passed to the analysis process. Moreover, the analysis needs to be done on the
passed data. The maximum length of the ripples for JHotDraw is about 31% and 23%
for graphs a and b respectively in Figure 7.13. Thus, the processing load for JHotDraw is
8%. Our justification for a more load increase in JHotDraw than Rapla is that the type
of property that we monitor and analyze in JHotDraw is different from the one in Rapla.
For JHhotDraw, we monitor the IO accesses to the graphic resources and do the analysis
based on the changes in such resources.
It is worth mentioning that in both systems, there is a considerable amount of CPU
utilization at the beginning of the execution period. This is reasonable, since any appli-
cation requires a specific amount of initialization load when it starts running. However,
this amount is higher for both systems in case that they are running under the monitoring
framework. This is also reasonable, because at the beginning, our monitor needs to do
some extra initialization works which obviously require utilizing more CPU power.
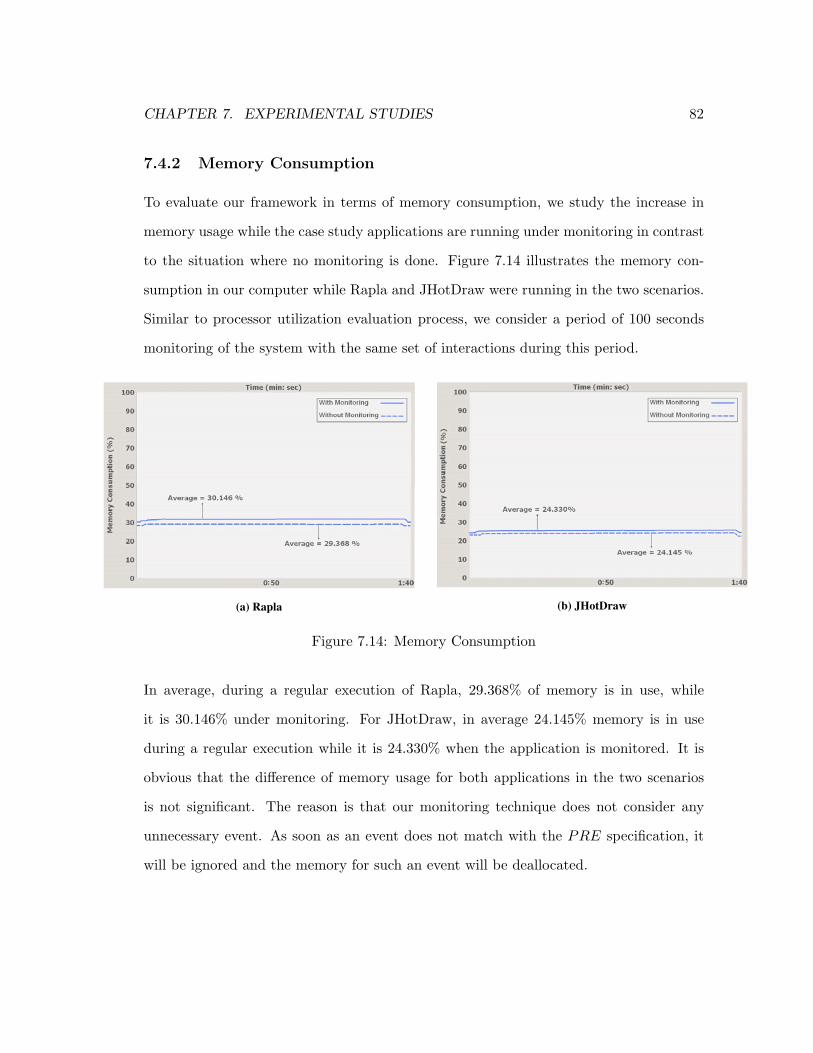
CHAPTER 7. EXPERIMENTAL STUDIES 82
7.4.2 Memory Consumption
To evaluate our framework in terms of memory consumption, we study the increase in
memory usage while the case study applications are running under monitoring in contrast
to the situation where no monitoring is done. Figure 7.14 illustrates the memory con-
sumption in our computer while Rapla and JHotDraw were running in the two scenarios.
Similar to processor utilization evaluation process, we consider a period of 100 seconds
monitoring of the system with the same set of interactions during this period.
(a) Rapla (b) JHotDraw
Figure 7.14: Memory Consumption
In average, during a regular execution of Rapla, 29.368% of memory is in use, while
it is 30.146% under monitoring. For JHotDraw, in average 24.145% memory is in use
during a regular execution while it is 24.330% when the application is monitored. It is
obvious that the difference of memory usage for both applications in the two scenarios
is not significant. The reason is that our monitoring technique does not consider any
unnecessary event. As soon as an event does not match with the PRE specification, it
will be ignored and the memory for such an event will be deallocated.

CHAPTER 7. EXPERIMENTAL STUDIES 83
7.5 Summary
In this chapter, we have outlined the implementation of the prototype for the RUMBA
framework. Afterwards, we explained about two case studies application used for evalu-
ating the effectiveness of our framework in runtime monitoring and behavioral analysis.
In both case studies, the specified properties have been monitored and the objective
changes have been reported correctly according to our expectation from the behavior of
the systems. We have also evaluated the efficiency of the RUMBA framework in terms
of processor and memory utilization for the two case study applications. We found that
there is a constant load in processor utilization, specially due to the nature of the moni-
toring technique. There has been also a processing load for both applications due to our
monitoring and analysis processes. In both case studies, we found that the increase of
memory usage for monitoring is not significant.

Chapter 8
Conclusion and Future Directions
In this chapter, we summarize the findings of the thesis and outline future research
directions that may arise from this research. In Section 8.1, we present the contributions
of the thesis, and in Section 8.2, we discuss some potential future work to be extended
from this research. Finally, we make some concluding remarks of the work in Section 8.3.
8.1 Contributions
The major contribution of the framework proposed in this thesis is that, it addresses
the problem of runtime monitoring and behavioral analysis of Java software systems.
Specifically, the principle contributions of this thesis were stated in Chapter 1. Based on
the material already presented, we discuss them in more details as follows:
• The framework utilizes a synergy between static and dynamic analyses to do the
runtime monitoring and analysis. By utilizing a synergy between these two ap-
proaches, our framework obtains an understanding of the target system to find out
where to locate and monitor the required information in the system. Such a hybrid
84
CHAPTER 8. CONCLUSION AND FUTURE DIRECTIONS 85
technique reduces the monitoring overhead that could be resulted from the instru-
mentation and modification of different levels of a target program. Because, the
information obtained from the static analysis helps the technique used in dynamic
analysis to consider only those VM (Virtual Machine) events which contain the
required information.
• Two models of a target system are created using reverse engineering techniques in
the static analysis. There is a UML-compliant model, class model, which is used
later by the analysis part of the framework. The specification for the constraint-
based analysis is added to this model. There is also a graph based model, SAIG
model, generated from the target system which is exported as XML documents
and transformed between different stages of the framework. We can not track the
location of runtime objects and attributes unless we instrument specific parts of the
code. By using the SAIG that records the structural information of the system, we
can avoid such an instrumentation
• Object Constraint Language (OCL) is utilized to specify the objectives of the be-
havioral analysis in our framework. They are certain properties on the behavior
of the system which can be described as OCL rules. These OCL rules are without
side effect since the OCL is an expression language. We add them to the specific
locations in the class model, and they cannot change anything in the model. This
means that the state of the system will never change because of an OCL expression.
All values for all objects, including all links, will not change. Whenever an OCL
expression is evaluated, it simply delivers a value.
• By using the capabilities of Java Platform Debug Architecture (JPDA) [39], we
have implemented a monitoring technique that finds the locations of the required
attributes according to the PRE (Pattern of Required Events) model. It invokes

CHAPTER 8. CONCLUSION AND FUTURE DIRECTIONS 86
the main class of a target Java program that has been passed to it. It generates a
trace of the program’s execution by listening to the VM events and making access
to its dynamic information.
• We have adopted an OCL based analysis environment to our system, called USE [3].
This tool has an OCL interpreter for constraint checking. We have incorporated
the COL interpreter of USE into the RUMBA framework to perform the analysis
process. It helps us to do a constraint based analysis on the class model of the
target system based on the generated event traces from the monitoring part of our
framework. Either a constraint fails or succeeds for a system state, there will be a
report for it as the result of the analysis on that state.
8.2 Future Work
Our current research focuses mostly on the automated monitoring and tracking of the
dynamic information at runtime based on the extracted static information. We believe
that some potential extensions can be made on some aspects of the RUMBA framework.
The framework can be extended to:
• Work as a fully automated process.
• Provide various domains of objectives for monitoring.
• Provide appropriate actions regarding the monitored behaviors.
Such future directions are listed in more details in this section.
8.2.1 Automatic Generation of Monitoring Scenarios
As mentioned before, the objectives of the behavioral analysis in RUMBA are defined and
specified manually. User has to have some knowledge about the domain of the target sys-

CHAPTER 8. CONCLUSION AND FUTURE DIRECTIONS 87
tem. Based on this information, the behavioral expectation of the system will be defined
as OCL rules. This approach is applicable for specific types of monitoring like the one we
did for Rapla and JHotDraw application. In such cases, the user is interested in moni-
toring particular objects and resources of a system. Hence, she/he defines the objectives
as specific OCL rules in the context of those objects and resources. However, when the
intention of the monitoring is to check the behavioral correctness of a system in general,
it is less expensive and more reliable to do it automatically. In other words, objective
scenarios can be constructed automatically from system requirements. In this regard,
Automatic Test Case Generation techniques [25] may be useful to extend the RUMBA’s
capabilities by generating the specifications (monitoring objectives) automatically.
8.2.2 Various Objective Domains
The current version of RUMBA can define specific types of objectives and is able to mon-
itor corresponding properties. They are mostly invariants, properties that check values
and boundaries of variables, and properties that generally deal with resource changes.
Such types of properties are classified as safety properties according to [20]. There is also
another type of property so-called temporal. It includes properties such as progress and
bounded liveness as well as timing properties. However, this category is not a disjoint
set with safety. For example, deadlock-freeness could be classified as a safety property
indicating that a system can never be in a situation in which no progress is possible.
Various types of properties can be studied to expand the domain of monitoring objec-
tives as future extensions to RUMBA. However, this depends on expressiveness of OCL
that how much it is able to define different types of properties. One way to find out
more about this issue is to apply RUMBA on other open source systems, possibly from
different domains. Such a broad domain can help us to provide a concrete evaluation
from comparing the obtained results from various case studies.
CHAPTER 8. CONCLUSION AND FUTURE DIRECTIONS 88
8.2.3 Steering and Diagnosis
The intent of program steering can be illustrated with the following quote from [5]:
“Scientists not only want to analyze data that results from super-computations, they also
want to interpret what is happening to the data during super-computations. Researchers
want to steer calculations in close-to-real-time; they want to be able to change parame-
ters, resolution or representation, and see the effects . They want to drive the scientific
discovery process; they want to interact with their data.”
In [36], the authors refer to the above statement and define program steering as the
capacity to control the execution of long-running, resource-intensive programs. Such
execution control includes modifying program state, managing data output, starting and
stalling program execution, altering resource allocations, etc . Dynamic program steering
consists of two separable tasks: i) monitoring program or system state (monitoring), and
then ii) enacting program changes made in response to observed state changes (steering).
Steering can be considered as the process of predicting the occurrence of violations
and preventing them by controlling a system execution [23, 70]. It can also be considered
as the process of correcting the execution of a target program when requirements are
violated [12]. What we consider as a possible future extension to RUMBA is the second
type of steering, where a monitoring tool can assure correctness during program execution.
To do so, specific handlers are required to not only report errors or throw exceptions, but
also execute appropriate actions, e.g. resetting states or rebooting the system.
At the time being, the analysis component of RUMBA detects if there is any conflict
with a property or reports about specific changes in the behavior of resources of a system.
It can be extended to diagnose/control the reported conflicts/specific changes (forward
recovery) or revert the system to a state known to be correct (backward recovery) [75].
It is obvious that such a recovery may not be feasible for all types of conflicts. This is an

CHAPTER 8. CONCLUSION AND FUTURE DIRECTIONS 89
important issue which needs further study to categorize specific types of properties based
on which the execution of a target system can be monitored and steered if necessary.
8.3 Conclusion
In this thesis, we have presented the RUMBA framework which addresses the demand of
runtime monitoring and behavioral analysis for Java software systems. We discuss how
RUMBA can facilitate the process of program comprehension from the behavioral point
of view. It utilizes a synergy between static and dynamic analyses to confirm whether a
program behavior complies with specified properties.
Three key features of the RUMBA framework are: i) the theory defined for static
analysis part of RUMBA is fully extendable at different granularity levels, for example
towards monitoring information about the methods of a system, ii) the source code of a
target system is not modified, and iii) the most processes of the framework are automated.
Using the help of reverse engineering techniques through static analysis (generating the
Pattern of Required Events (PRE)), we have reduced the large size of runtime information
in dynamic analysis. We have filtered the information to what is required for the analysis.
We have evaluated the effectiveness of RUMBA on two open source applications. The
reports of the objectives along the runtime states have been according to our expectation
from the behavior of the applications. The efficiency of the framework has been studied in
terms of processor and memory utilization. We have found that there is a constant load
in processor utilization, specially due to the nature of the monitoring technique. There
has been also a processing load for both applications due to our monitoring and analysis
processes. In both case studies, we have found that the increase of memory usage for
monitoring is not significant. As a future work, RUMBA can be applied on more case
studies from various domains to check different types of objectives on such systems.

Bibliography
[1] UML 2.0 Superstructure Specification. Object Management Group, Framingham,
Massachusetts, USA, 2004.
[2] A resource management system (Rapla), 2007. http://rapla.sourceforge.net/.
[3] A UML-Based Specification Environment (USE), 2007.
http://www.db.informatik.uni-bremen.de/projects/USE/.
[4] A. Ashkan and L. Tahvildari. A hybrid analysis framework to evaluate runtime be-
havior of OO systems. In Proceedings of the 2nd International Workshop on Program
Comprehension through Dynamic Analysis, pages 1–5, 2006.
[5] M. D. Brown B. H. McCormick, T. A. DeFanti. Visualization in scientific computing.
ACM SIGGRAPH Computer Graphics, 21(6):entire issue, 1987.
[6] D. Bartetzko, C. Fischer, M. Moller, and H. Wehrheim. Jass-Java with assertions.
Electronic Notes in Theoretical Computer Science, 55(2):1–15, 2001.
[7] Bison, the YACC-compatible parser generator, 2007.
http://dinosaur.compilertools.net/#bison.
[8] J. S. Bradbury, J. R. Cordy, and J. Dingel. An empirical framework for comparing
effectiveness of testing and property-based formal analysis. In Proceedings of the
90

BIBLIOGRAPHY 91
ACM SIGPLAN-SIGSOFT Workshop on Program Analysis For Software Tools and
Engineering, pages 2–5, 2005.
[9] M. Brorkens and M. Moller. JassDA trace assertions, runtime checking the dynamic
of Java programs. In Proceedings of the International Conference on Testing of
Communicating Systems, pages 39–48, 2002.
[10] B. Bruegge, T. Gottschalk, and B. Luo. A framework for dynamic program analyz-
ers. In Proceedings of the 8th Annual Conference on Object-Oriented Programming
Systems, Languages, and Applications, pages 65–82, 1993.
[11] L. Burdy, Y. Cheon, D. Cok, M. D. Ernst, J. Kiniry, G. T. Leavens, K. Ru. M.
Leino, and E. Poll. An overview of JML tools and applications. Software Tools for
Technology Transfer, 7(3):212–232, 2005.
[12] F. Chen and G. Rosu. Java-MOP: A monitoring oriented programming environment
for java. In Proceedings of the 11th International Conference on Tools and Algorithms
for the Construction and Analysis of Systems, pages 546–550, 2005.
[13] Y. Cheon. A runtime assertion checker for the Java modeling language. Technical
Report 03-09, Department of Computer Science, Iowa State University, 2003.
[14] S. Chodrow and M. Gouda. Implementation of the Sentry system. Software Practice
and Experience, 25(4):373–387, 1995.
[15] A. G. M. Cilio and H. Corporaal. Global program optimization: register allocation
of static scalar objects. In Proceedings of 5th Annual Conference of the Advanced
School for Computing and Imaging, pages 52–57, 1999.
[16] M. Clavel, F. Duran, S. Eker, P. Lincoln, N. Marti-Oliet, J. Meseguer, and J. Que-

BIBLIOGRAPHY 92
sada. Using Maude. In Proceedings of the 3rd International Conferenece on Funda-
mental Approaches to Software Engineering, pages 371–374, 2000.
[17] M. Clavel, S. Eker, P. Lincoln, and J. Meseguer. Principles of Maude. Electronic
Notes in Theoretical Computer Science, 4(1):65–89, 1996.
[18] T. A. Corbi. Program understanding: challenge for the 1990s. IBM Systems Journal,
18(2):294–306, 1989.
[19] J. Dassow. On contextual grammar forms. International Journal of Computer Math-
ematics, 17(1):37–52, 1985.
[20] N. Delgado, A. Q. Gates, and S. Roach. A taxonomy and catalog of runtime software-
fault monitoring tools. IEEE Transactions on Software Engineering, 30(2):859–872,
2004.
[21] D. Drusinsky. The Temporal Rover and the ATG Rover. In Proceedings of the 7th
International SPIN Workshop, pages 323–330, 2000.
[22] D. Drusinsky. Monitoring temporal rules combined with time series. In Proceedings
of Computer Aided Verification Conference, pages 114–117, 2003.
[23] A. Easwaran, S. Kannan, and O. Sokolsky. Steering of discrete event systems: control
theory approach. Electronic Notes in Theoretical Computer Science, 144(4):21–39,
2006.
[24] Eclipse - An open development platform, 2007. http://www.eclipse.org/.
[25] J. Edvardsson. A survey on automatic test data generation. In Proceedings of the 2nd
Conference on Computer Science and Engineering in Linkping, pages 21–28, 1999.

BIBLIOGRAPHY 93
[26] H. Ehrig, U. Prange, and G. Taentzer. Fundamental theory for typed attributed
graph transformation. In Proceedings of the 2nd International Conference on Graph
Transformation, pages 161–177, 2004.
[27] M. D. Ernst. Static and dynamic analysis: synergy and duality. In Proceedings of
the ICSE Workshop on Dynamic Analysis, pages 24–27, 2003.
[28] R. Ferenc, I. Siket, and T. Gyimothy. Extracting facts from open source software. In
Proceedings of the 20th IEEE International Conferenece on Software Maintenance,
pages 60–69, 2004.
[29] P. J. Finnigan, R. C. Holt, I. Kalas, S. Kerr, K. Kontogiannis, H. A. Muller, J. My-
lopoulos, S. G. Perelgut, M. Stanley, and K. Wong. The software bookshelf. IBM
Systems Journal, 36(4):564–593, 1997.
[30] Flex, a fast scanner generator, 2007. http://dinosaur.compilertools.net/#flex.
[31] A. Q. Gates, S. Roach, O. Mondragon, and N. Delgado. DynaMICs: comprehensive
support for runtime monitoring. Electronic Notes in Theoretical Computer Science,
55(2):1–17, 2001.
[32] A. Q. Gates and P. Teller. An integrated design of a dynamic software-fault moni-
toring system. Integrated Design and Process Science, 14(3):63–78, 2000.
[33] J. Girard and R. Koschke. Finding components in a hierarchy of modules: a step
towards architectural understanding. In Proceedings of the 13th International Con-
ference on Software Maintenance, pages 58–65, 1997.
[34] M. Gogolla and M. Richters. On constraints and queries in UML. In Proceedings of
the UML Workshop, pages 109–121, 1997.

BIBLIOGRAPHY 94
[35] W. Gu, G. Eisenhauer, E. Kraemer, K. Schwan, J. Stasko, and J. Vetter. Falcon:
onine monitoring and steering of large-scale parallel programs. Technical Report
GIT-CC-94-21, College of Computing, Georgia Institute of Technology, 1994.
[36] W. Gu, J. Vetter, and K. Schwan. An annotated bibliography of interactive program
steering. ACM SIGPLAN Notices, 29(9):140–148, 1994.
[37] Klaus Havelund and Grigore Rosu. Monitoring Java programs with Java PathEx-
plorer. Electronic Notes in Theoretical Computer Science, 55(2):97–114, 2001.
[38] G. J. Holzmann. The model checker Spin. IEEE Transactions on Software Engi-
neering, 23(5):279–295, 1997.
[39] Java Platform Debugger Architecture (JPDA), 2007.
http://java.sun.com/products/jpda/.
[40] JavaCC Eclipse plug-in for Eclipse 3.1 - 3.2, 2007. http://eclipse-
javacc.sourceforge.net/.
[41] C. L. Jeffery. Program monitoring and visualization: An exploratory approach.
Springer-Verlag, 1999.
[42] C. L. Jeffery, K. Templer W. Zhou, and M. Brazell. A lightweight architecture for
program execution monitoring. In Proceedings of the ACM SIGPLAN/SIGSOFT
Workshop Program Analysis for Software Tools and Engineering, pages 67–74, 1998.
[43] JHotDraw as open source project, 2007. http://www.jhotdraw.org/.
[44] R. Kazman and S. J. Carriere. View extraction and view fusion in architectural
understanding. In Proceedings of the 5th International Conference on Software Reuse,
pages 290–299, 1998.

BIBLIOGRAPHY 95
[45] M. Kim and M. Viswanathan. MaC: A framework for runtime correctness assurance
of realime systems. Technical Report MS-CIS-98-37, Deptartment of Computer and
Information Sciences, University of Pennsylvania, 1998.
[46] M. Kim and M. Viswanathan. Formally specified monitoring of temporal properties.
In Proceedings of the European Confernece on Realtime Systems, pages 114–122,
1999.
[47] M. Kim, M. Viswanathan, S. Kannan, I. Lee, and O. V. Sokolsky. Java-MaC: A
runtime assurance approach for Java programs. Journal of Formal Methods in System
Design, 24(2):129–155, 2004.
[48] I. Lee and H. Ben-Abdallah. A monitoring and checking framework for runtime
correctness assurance. In Proceedings of the Korea-U.S. Technical Conference on
Strategic Technologies, 1998.
[49] I. Lee and M. Kim. Runtime assurance based on formal specifications. In Proceedings
of the International Conference on Parallel and Distributed Processing Techniques
and Applications, pages 279–287, 1999.
[50] Lex, A lexical analyzer generator, 2007. http://dinosaur.compilertools.net/#lex.
[51] Y. Liao and D. Cohen. A specificational approach to high level program monitoring
and measuring. IEEE Transactions on Software Engineering, 18(11):969–978, 1992.
[52] J. Ligatti, L. Bauer, and D. Walker. Edit Automata: enforcement mechanisms for
runtime security policies. International Journal of Information Security, 4(1-2):2–16,
2005.
[53] D. Luckham and F. W. Von Henke. An overview of Anna specification language for
Ada. IEEE Software, 2(2):9–23, 1985.
BIBLIOGRAPHY 96
[54] D. Luckham, S. Sankar, and S. Takahashi. Two-dimensional pinpointing: debugging
with formal specifications. IEEE Software, 8(1):74–84, 1991.
[55] M. R. Lyu. Handbook of Software Reliability Engineering. IEEE Computer Society
Press and McGraw-Hill, 1996.
[56] S. Mancoridis, B. Mitchell, Y. Chen, and E. R. Gansner. Bunch: A clustering tool
for the recovery and maintenance of software system structures. In Proceedings of
the 15th International Conference on Software Maintenance, pages 50–62, 1999.
[57] H. A. Muller. Bits of history, challenges for the future and autonomic computing
technology. In Proceedings of the 13th IEEE Working Conference on Reverse Engi-
neering, pages 9–18, 2006.
[58] H. A. Muller, M. A. Orgun, Scott R. Tilley, and James S. Uhl. A reverse engineering
approach to subsystem structure identification. Journal of Software Maintenance:
Research and Practice, 5(4):181–204, 1993.
[59] A. M. Memon. Employing user profiles to test a new version of a GUI component in
its context of use. Software Quality Journal, 14(4):359–377, 2006.
[60] J. Misra. A logic for concurrent programming: Safety. Journal of Computer and
Software Engineering, 3(2):239–272, 1995.
[61] A. Mok and G. Liu. Efficient runtime monitoring of timing constraints. In Proceedings
of the 3rd IEEE Realtime Technology and Applications Symposium, pages 252–262,
1997.
[62] R. Morgan. Building an Optimizing Compiler. Butterworth-Heinemann, Boston,
Massachusetts, 1998.

BIBLIOGRAPHY 97
[63] G. C. Murphy, D. Notkin, and Kevin Sullivan. Software refexion models: bridging the
gap between source and high-level models. In Proceedings of the 3rd ACM SIGSOFT
Symposium on the Foundations of Software Engineering, pages 18–28, 1995.
[64] NetBeans IDE, 2007. http://www.netbeans.org/.
[65] OCL Center, 2007. http://www.klasse.nl/ocl/.
[66] W.N. Robinson. Monitoring software requirements using instrumented code. In
Proceedings of the Hawaii International Conference on System Sciences, pages 276–
287, 2002.
[67] W.N. Robinson. Monitoring web service requirements. In Proceedings of the 12th
IEEE International Conference on Requirements Engineering, pages 65–74, 2003.
[68] G. Rosu and K. Havelund. Synthesizing dynamic programming algorithms from
linear temporal logic formulae. Technical Report TR 01-15, RIACS, 2001.
[69] Bernd B. Schmid, T. Clark, and J. Warmer. Object Modeling With the OCL: the
Rationale Behind the Object Constraint Language. Springer, 2002.
[70] O. Sokolsky, S. Kannan, and M. Viswanathan. Steering of realtime systems based
on monitoring and checking. In Proceedings of the 5th International Workshop on
Object-Oriented Realtime Dependable Systems, pages 11–18, 1999.
[71] P. Teller, M. Maxwell, and A. Q. Gates. Towards the design of a snoopy coprocessor
for dynamic software-fault detection. In Proceedings of the 18th IEEE International
Performance, Computing, and Commuunication Conference, pages 310–317, 1999.
[72] K. Templer and C. Jeffery. A configurable automatic instrumentation tool for ANSI
C. In Proceedings of the 13th IEEE International Conference on Automated Software
Engineering, pages 249–258, 1998.

BIBLIOGRAPHY 98
[73] The Eclipse Test and Performance Tools Platform (TPTP) Project, 2007.
http://www.eclipse.org/tptp/.
[74] The Java parser generator, 2007. https://javacc.dev.java.net.
[75] J. M. Voas. Building software recovery assertions from a fault injection-based prop-
agation analysis. In Proceedings of the 21st International Computer Software and
Applications Conference, pages 505–510, 1997.
[76] Yacc, Yet another compiler-compiler, 2007. http://dinosaur.compilertools.net/#yacc.