rufford visitor survey 2015 - nottinghamshire
TRANSCRIPT

Visitor Survey August 2016
Rufford Abbey Country Park
1

Contents
PART 1 Survey Aims & Objectives
Methodology
Sample Size & Location
PART 2 Visitor Characteristics
PART 3 Visitor Experience
PART 4 Summary & Key Findings
2

Part 1 Survey Aims & Objectives
Methodology
Sample Size & Location
3

Survey Aims & Objectives
This survey was commissioned by Nottinghamshire County Council’s Country Park Service to gauge current visitor satisfaction at Rufford.
This is part of an annual programme of visitor insight research and includes:
• Demographic profile of visitors• Frequency of visits• Places visited once at the destination• Specific insights into ‘tourist’ visitors• Effectiveness of local promotion / visitor guides• Assessment of service delivery perceptions• Measurement of visitor satisfaction
Where possible comparisons will be drawn with previous surveys to identify improvement or decline but this will not be possible in all cases as survey questions and formats have changed over time.
4

MethodologyThe survey took place over seven days from Monday 8th August
– Sunday 14th August 2016.
It was conducted during August to mirror the dates of previous
visitor surveys and to provide clearer year-on-year
comparisons. (with the exception of 2015 which was
conducted during the October half term)
The busy Robin Hood Festival week was avoided as this is not
typical and brings thousands to visitors to the local area.
The survey was based on face-to-face interviews with visitors
and two researchers were involved in the project.
Researchers used IPad tablet devices to quickly capture
information. Questionnaires were programmed with icons,
images, sliders and radio buttons to illustrate points and
engage interviewees.
5

Methodology
The questionnaire consisted of 19 questions which
were designed and agreed in advance with the Park
Development Officer.
Surveys were timed and practiced in advance so that
each could be completed in around 5 minutes.
Researchers were given freedom to take more time if
respondents wanted to take longer.
A site visit was conducted in advance of the survey to
identify areas of greatest footfall and key locations
where people would be most receptive and not in a
hurry.
Researchers wore ‘Park Survey Team’ laminate
badges on lanyards so that they were not mistaken
for field sales or charity collection staff.
Weather permitting, researchers also wore ‘Park
Survey’ T-shirts for the same reason.
6

Sample Size, Location & Time
In total 337 parties were interviewed.
Surveys were conducted within three daytime segments as
follows
• 98 in the mornings (10am - 12pm)
• 99 over lunchtimes (12pm – 2pm)
• 140 during the afternoon (2pm-4pm)
Afternoons were the most responsive and in-depth as many
visitors had experienced the park facilities during the course
of the day.
7
Part 2
Visitor
Characteristics
8

Visitor Characteristics
The vast majority of visitors (88%) have visited the park
before. This is down from the last year (91%). In previous
surveys this figure averages around 86%
Currently repeat visitors are at the highest level they have
ever been since summer surveys began. But not as high as the
2015 autumn survey where visitors are less likely to be
travelling long distances
The number of first time visitors remains around the 12%
mark. This has been as high as 17% back in 2013.
9

Frequency of Visits
Most people (38%) surveyed said they visited Rufford three times a year. This was also the top answer in the previous survey.
26% said they came back once a month.
More people are coming
back to Rufford on a
regular basis than ever
before.
There is a core group of people who visit every day (2%). This is exactly in line with previous years.
10

Visitor OriginsMost people (42%) interviewed were local
residents who travelled directly from home.
25% of responders were meeting up with family
and friends.
15% were on a day trip
11% were holidaying in the area
3% mentioned they were on a Groupon offer.
These were all coming for Lunch.
Care workers and childminders were the
respondents who typically answered ‘other’ as
they came with the people they were looking
after. A few people came direct from work or
from a shopping trip. One group were on a golf
trip to a nearby course.
11

Visitor Postcode Map #1
National Visitor Clusters
This map shows UK wide ‘hotspot’ clusters of
visitors to Rufford.
It clearly shows that the highest concentration
of those surveyed at Rufford are clustered
around the Nottinghamshire and North
Nottinghamshire area.
Visitors were recorded from Manchester,
Tonbridge, Walsall, Harrogate, St Albans,
Islington (north London), Donnington, Berwick
upon Tweed and Oxford. (please note 2 coaches with visitors from Oxford explain an
unusually high concentration from this area)
Not shown on this map, we also interviewed
visitors from Australia, Belgium, Germany,
Ireland, Poland and South Africa.
12

Visitor Postcode
Map #2
Regional map showing
clustering
This map highlights regionalised
hotspots across North
Nottinghamshire and its
surrounding counties.
13

Tourist Accommodation
Most tourist visitors (27%) are staying in Self Catering Holiday Cottages. Last year this figure was 44% and also the top answer.
More people are using hotels and guest houses than in previous surveys. (Both 19%)
With 8% of visitors surveyed staying at Campsites / Caravan Parks, there has been a small decline in popularity. With this type of
accommodation. Those staying in holiday park chalets were almost exclusively staying at the Center Parcs in Sherwood.
Significantly, we have discovered that 14% of those holidaying in the area are staying with friends or family.
14
Note: This year we
have added the option
to select staying with
friends or family.

Tourist AreasAs in previous surveys the vast majority of tourist visitors
35% were staying in the North Nottinghamshire area.
More people (27%) were staying in Nottingham City centre
this year compared 22% in the previous survey. Coach trips
from Nottingham accounted for some of these visitor
groups.
In this survey, both Derbyshire and Lincolnshire were
mentioned by 11% of visitors. This shows an increase in
popularity for Lincolnshire which has typically been the
least represented tourist accommodation area.
Yorkshire, on the other, hand is less popular this year.
‘Other’ areas mentioned were Manchester and Leicester
15

Other Visit Locations
76% of respondents said that they intended to visit other towns, villages and attractions in the region during their stay.
This is typical when compared to previous summer surveys.
Clumber Park and Sherwood Forest were the two most mentioned alternative destinations locally. (Clumber was hosting a running event during the week of the survey and Sherwood had hosted the Robin Hood Festival the previous day prior to the survey)
Nottingham City Centre was also mentioned for shopping trips.
Others destinations included:
Go Ape Nottinghamshire, Retford in Bloom; Creswell Crags, Bolsover Castle; Peak District National Park and Alton Towers.
16

Disabled Visitors
This year, 16% of parties included someone who
considered themselves as disabled. This is about
average when looking back at past surveys over
the last 6 years.
The percentage range of parties who considered
themselves as disabled ranged from 18% in 2014
down to 11% in 2015. (Please note that the 2015
Survey was conducted in the Autumn and
therefore this seasonal variation may have
accounted for lower numbers of disabled visitors.
The vast majority of visitors to Rufford do not
consider themselves as disabled. This year’s figure
of 84% is typical.
17

Gender & Age
As in previous surveys, the percentage of women
visiting the park is greater than men. The difference has
increased this year to 16%. Last year the gap was 14%.
The most represented age group this year have been 65+. (20%)
Closely followed 5-12 year olds. (18%)
(see next page for full age breakdown)
18

Age & Party Composition
The 337 visitor groups interviewed comprised 1332 people in total.
That makes an average party size of 3.9 This is higher the historical average of 3.
In the 18-24, 25-34 and 35-44 age brackets, females significantly outnumber males. Typically these are mothers with
toddlers or young children.
In the 65+ age group the gender split is fairly even. This age group make up 20% of the visitors – the most common
group. The next most common age group are 5-12 year olds.
The only age group where males outnumber females is in the under 5 category.
19
Under 5 5-12 years 13-17 years 18-24 years 25-34 years 35-44 years 45-54 years 55-64 years 65+ years TOTALS
Male 103 114 39 7 37 51 44 39 122 556
Female 94 122 41 29 86 136 79 51 138 776
Totals 197 236 80 36 123 187 123 90 260
% 15 18 6 3 9 14 9 7 20

Ethnicity
Once again, as in previous surveys, ‘White
British’ is the most frequent answer given by
visitors when asked about their ethnic group.
This represents 97% of those interviewed. Last
year this figure was 96%.
All other ethnic groups were equal at just
under 1%
These figures are almost identical to last year
and previous surveys.
97% White
British
20
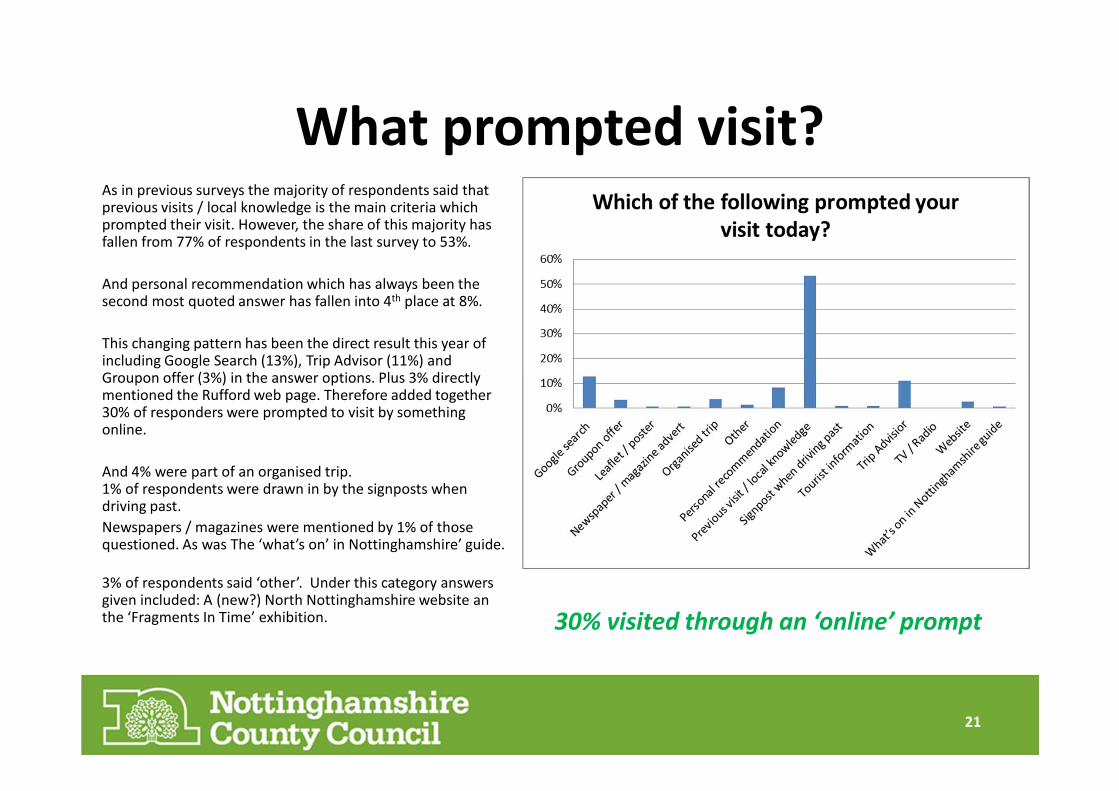
What prompted visit?As in previous surveys the majority of respondents said that previous visits / local knowledge is the main criteria which prompted their visit. However, the share of this majority has fallen from 77% of respondents in the last survey to 53%.
And personal recommendation which has always been the second most quoted answer has fallen into 4th place at 8%.
This changing pattern has been the direct result this year of including Google Search (13%), Trip Advisor (11%) and Groupon offer (3%) in the answer options. Plus 3% directly mentioned the Rufford web page. Therefore added together 30% of responders were prompted to visit by something online.
And 4% were part of an organised trip. 1% of respondents were drawn in by the signposts when driving past.
Newspapers / magazines were mentioned by 1% of those questioned. As was The ‘what’s on’ in Nottinghamshire’ guide.
3% of respondents said ‘other’. Under this category answers given included: A (new?) North Nottinghamshire website an the ‘Fragments In Time’ exhibition.
21
30% visited through an ‘online’ prompt

Information Sources60% of respondents said they would search Google if
they were planning a day out. This a slightly lower
than the last survey (68%). But on this survey we have
added a specific option of ‘Trip Advisor’. This was
specifically mentioned by 9% of responders.
Asking friends and relatives (23%) is still important.
This is similar to previous years.
Looking in a local newspaper (20%) comes next.
15% still like to use the County Council’s printed
‘What’s On’ Guide.
4% use a tourist information office. This continues a
downward trend for the use of such facilities. The
venue website is used by 2% of responders.
‘Other’ included local visitors who rely on display
boards and billboards around Rufford to tell them
what’s going on in the park and locally. People also
mentioned leaflets they pick up at hotels and B&Bs.
Also there is a new North Nottinghamshire website
mentioned by a few people.
22

Part 3
Rufford
Visitor
Experience
23

Places VisitedThe Lake is always the most visited place at
Rufford and this year 88% of all those surveyed
said they made a trip to the water.
The Café was the next most mentioned location
by 76% of those interviewed.
The children’s play facilities were the next most
visited place (56%) up from 55% last year
The Gardens (50%) saw fewer visitors than
normal. In past summer surveys this figures
averages around 72%. (Note: during the survey
several days of rain may have contributed to this
outcome)
32% of those surveyed had visited the shops.
Although this is higher than the last (autumn)
survey it continues a downward trend in recent
(summer) surveys.
Savile Restaurant was visited by 14% of
respondents. This is the highest percentage its
ever been.
24

Places Visited Comparison
The chart above shows percentage trends from 2004.
The Lake continues to be the most popular destination. While the Gardens showed a surprisingly low response.
Children’s play facilities are being used more than last year and the Savile Restaurant has recorded it’s highest ever percentage.
The Café is as popular as its ever been in the summer but the Shops, after a major leap forward in 2011, continue to fall back in
popularity.
Tourist Information / Visitor Information, after rallying last year have returned back to lower levels.
The craft centre and gallery have now closed.
% trends from 2004 - 2016
25
2004-10 2010 2011 2012 2013 2014 2015 2016
Gardens 62 77 74 80 66 72 54 50
Lake 0 0 0 81 86 75 91 88
Shops 30 34 64 57 47 42 20 32
Tea Shop / Café 77 65 73 72 71 64 80 76
Savile Restaurant 0 0 0 13 9 7 9 14
Craft Centre / Gallery 12 16 36 38 39 25 0 0
Children’s play facilities 30 30 57 36 41 43 55 56
Tourist / Visitor Information 9 12 24 20 17 16 31 20

Reasons to visit summaryThere has been an 4% increase in people
visiting for exercise, health, walking etc.
This is still the most common ‘single’
reason for coming to the park for adults
without children. 34% of visitors come for
this reason.
Taking children out (27%) was the next
most common reason for visiting the park.
In this survey only 2% of visitors said they
came for the events, displays and
entertainments organised in the park. This
is typically around 8%.
There are more dog walkers this year. Up
from 6% last year to 11% this year.
3% of responders mentioned organised
tours. 1% said they were on holiday and
3% came out to simply enjoy the weather.
Some people came for specific events. E.g.
brass band concert, poachers exhibition.
Note: This chart attempts to categorise some of the most common responses
Exercise, health, walking and fresh air are most common
reasons for adults without children.
26

A good value day out
during school
holidays
Organised trip
from Nottingham
Bring our three
dogs for two
circuits of the
lake. Then teas
Simply to
enjoy the nice
weather
We love the ford
splash
Working with a
disabled group
Brass
Concert
Brass
Band
Concert
Sculpture
garden
The best place I
know for easy
disabled accessGroupon
lunch
offer
Family
walk
Part of my
daily routine
For the advertised
exhibition
What is your main reason for
coming to the park today?
Hidden
treasure trail Check out
wedding
venue
27

Most Enjoyed ?
Note: This chart attempts to categorise some of the most common responses
More people said they enjoyed just going for a walk
around Rufford than any other aspect of their visit .
(29%).
The lake was enjoyed the most by 16% of respondents,
with feeding the ducks a popular activity.
Gardens were enjoyed most by 14% of respondents
while scenery, nature and just being outdoors was
enjoyed most by 11%.
The ford/ splash remains popular with children and
adults alike. 8% of respondents specifically mention this.
7% enjoyed the food /catering best of all. This includes a
high proportion who said “ice cream” or “tea” Some
referred specifically to “breakfast” or “lunch”. Sunday
Carvery Lunch seems to be poplar with regular visitors.
‘Other’ things mentioned were: Brass Band, treasure
trail, children's play facilities, sculptures , poachers
exhibition and good value of the entire visit.
28

Bird watching
and feeding
ducks
The old
Abbey ruins
Brass
Band
Walk around
lake with the
whole family
Outdoor
sculptures
and maze
Carvery
lunch
Watching cars
go through
ford splash
What’s been the most enjoyable part of
your visit today?
Fresh
exercise
Fresh
Air and
exercise
Learning
about local
history in
poachers
exhibition
Stunning
Grounds
29

Rufford - Overall Visit
Most People (64%) said their overall visit was “very good”. Last year this figure was 70% (the highest its ever been) so there has been a decrease in the top level of overall satisfaction. (Historically this top level figure has averaged 60% across all previous surveys so overall satisfaction is still comparatively high in 2016.
33% said their visit was “Good” overall. This was 30% last year.
“Thus, 97% thought their overall visit was “Good” or “Very Good”
3% said the visit was OK. Satisfaction was typically marked down due to long wait for food and general overcrowding. Also play facilities criticised by some parents.
No respondents said their overall visit was “poor “or “very poor”
A great family day
out. Something for
everyone of all ages.
The perfect
setting for a
picnic.
It’s like our second
home. Everyone is so
friendly and helpful.
You can ‘get lost’ for
hours on a nice day.
Responses %
Very Good 216 64%
Good 112 33%
OK 9 3%
Poor 0 0%
Very Poor 0 0%
N/A 0 0%
30

Rufford - Cleanliness of park in general
Most people 66% said cleanliness in general was “Very Good”. This was (72%) last year.
33% said cleanliness was “Good” overall. This was 28% last year.
1% thought it was “OK”, this was the same last year.
No visitors said cleanliness was poor or very poor.
Any negative comments received this year about cleanliness centred around the mess that other people had left after picnics etc. , not clearing up after themselves and allowing rubbish to fly around the site. Also occasional dog mess was mentioned.
It's all kept extremely tidy and
clean. There are at least 5 dog
bins which helps dog owners
Very clean
and child
friendly
I wish other people would
be more responsible and
take their rubbish home.
Responses %
Very Good 222 66%
Good 110 33%
OK 5 1%
Poor 0 0%
Very Poor 0 0%
N/A 0 0%
31

Rufford – Standard to which grounds are maintained
Most people (72%) said the standard to which
grounds are maintained was “Very Good”. Last year
this was 74%.
26% said the standard was “Good”. Last year this was
25%.
1% thought it was “OK”. Exactly the same as last
year. No respondents thought the grounds were
maintained to a poor standard. Although some
thought that the children’s area could be presented
better and that some areas looked a little tired.
Roses in full
bloom are
lovely
The gardens are
welcoming without
being too formal
and perfect.
New herb garden is
looking really good
Responses %
Very Good 244 72%
Good 88 26%
OK 5 1%
Poor 0 0%
Very Poor 0 0%
N/A 0 0%
32

Rufford – Range of facilities for children
Most people who were able to express an opinion (47%) said the range of facilities for children was “Very Good”. This is lower than the last survey (58%) because the seasonal Halloween Trail was very popular with childrenand parents alike. The current treasure trail doesn’t seem as popular. Or at least awareness is not as high.
33% said the standard was “Good”. Up from 27% last year. 8% thought it was “OK”.
1% thought the standard was “Poor”. This was down to a lack of activities for toddlers.
10% did not have a view because they did not have or come with children.
The facilities are in
keeping with the
surroundings.
Good that dogs
are not allowed
in this area
My kids can certainly burn of
a lot of energy here. They
love crawling through the
tunnels and climbing over
things.
Responses %
Very Good 159 47%
Good 112 33%
OK 28 8%
Poor 4 1%
Very Poor 0 0%
N/A 34 10%
Treasure trail
is a cool idea.
33

Rufford – Amenities for visitors with special
access or mobility requirements
Most people (39%) said the amenities were “Very Good”. Last year this figure was 42%.
23% said amenities were good. Last year this figure was 22%
4% thought amenities were “OK”. This was 5% last year.
1% of respondents thought amenities were “Poor”. The reasons were all to do with limited disabled parking.
34% did not feel able to comment.
Not enough disabled
car park spaces
Good that there are disabled
toilets at both ends of the park.
They’re good amenities too!
We made use
of the mobility
scooter pre-
booking
service
Responses %
Very Good 130 39%
Good 78 23%
OK 13 4%
Poor 2 1%
Very Poor 0 0%
N/A 114 34%
34
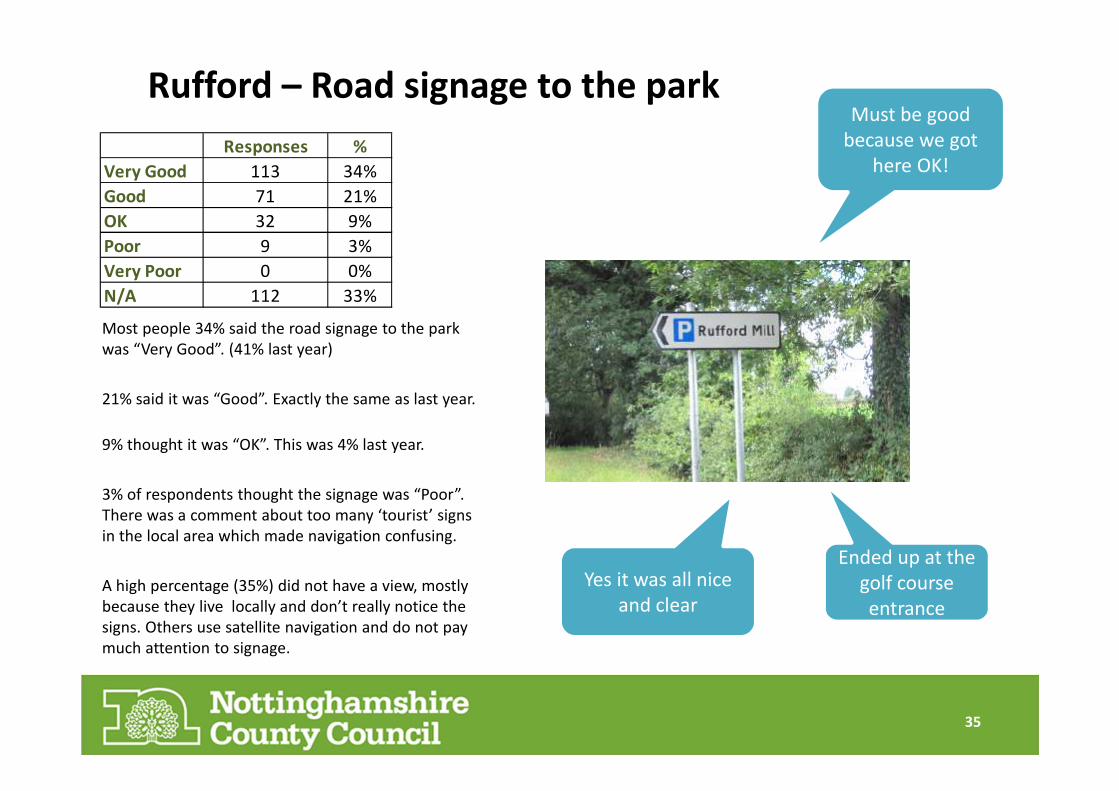
Rufford – Road signage to the park
Most people 34% said the road signage to the park
was “Very Good”. (41% last year)
21% said it was “Good”. Exactly the same as last year.
9% thought it was “OK”. This was 4% last year.
3% of respondents thought the signage was “Poor”.
There was a comment about too many ‘tourist’ signs
in the local area which made navigation confusing.
A high percentage (35%) did not have a view, mostly
because they live locally and don’t really notice the
signs. Others use satellite navigation and do not pay
much attention to signage.
Must be good
because we got
here OK!
Yes it was all nice
and clear
Ended up at the
golf course
entrance
Responses %
Very Good 113 34%
Good 71 21%
OK 32 9%
Poor 9 3%
Very Poor 0 0%
N/A 112 33%
35

Rufford – Quality of service from staff
Most people (53%) said the quality of service from staff was “Very Good”. This is down from 60% last year.
24% said it was “Good”. Last year this was 28%
3% thought it was “OK” . This was as 2% last year.
1% said staff service was “Poor”. Criticisms centred around slow service in the café.
20% did not have a view because they did not come into contact with a member or staff
Super friendly helpful
staff made a great day
even better
Attentive serving
staff at Saville
restaurant
Responses %
Very Good 177 53%
Good 81 24%
OK 9 3%
Poor 4 1%
Very Poor 0 0%
N/A 66 20%
Always have a
good laugh with
the car park man
36

Rufford – Staff contact / customer care evaluation
91% of those surveyed said they came
into contact with car parking staff.
78% came into contact with catering
staff.
Shop staff were encountered by 31% of
visitors and 17% met someone from
tourist information.
2% met someone in a green uniform.
(ranger, warden or grounds staff).
A few people said they came into
contact with a cleaner.
74%
Very Happy
25%
Fine Overall
1%
Disappointed
How did you feel about
their customer care?
37

Rufford – Quality of on-site catering
Most people (54%) said the quality of catering was “Very Good”. Last year this was 53%.
31% said it was “Good”. Last year this was 30%
5% thought it was “OK”. This was 6% last year.
2% respondents thought the catering was poor citing dry carvery meet and lack of healthy options.
9% did not have a view because they did not have anything to eat or drink.
Great value lunch
with family. Even
better with a
Groupon voucher.
The best in the area.
Ploughman's is
exceptionally
good
I was surprise they
catered for vegans.
Top marks!
Responses %
Very Good 181 54%
Good 105 31%
OK 16 5%
Poor 6 2%
Very Poor 0 0%
N/A 29 9%
38

Rufford – Quality of shops
Most people (42%) said the quality of shops was
“Very Good”. This was 44% last year.
25% said it was “Good” down from 28% last year.
6% thought it was “OK”. This was 7% last year.
No respondents thought the shops were “poor” or
“very poor”.
28 % did not have a view because they did not go
into the shops.
Good place if your
are stuck for
present ideas
Prices are reasonable
compared to National
Trust shops
Would like to see
more local artists
work for sale
Responses %
Very Good 141 42%
Good 84 25%
OK 19 6%
Poor 0 0%
Very Poor 0 0%
N/A 93 28%
39

Rufford – Cleanliness of toilets
Most people (52%) said the cleanliness of toilets
was “Very Good”. Last year this was 56%.
29% said it was “Good”. This was 20% last year.
8% thought it was “OK”. This was 4% last year.
11% did not have a view because they did not
use the facilities.
Many regular visitors commented on the
noticeable improvements year on year. And
disabled visitors were particularly impressed with
the facilities.
Baby change space is
perfectly adequate
and clean
I can’t fault the
facilities
Disabled toilet was
clean and tidy
Responses %
Very Good 176 52%
Good 98 29%
OK 26 8%
Poor 0 0%
Very Poor 0 0%
N/A 37 11%
40

Rufford – How safe and secure do you
feel when visiting the park?
Most people (80%) rated safety and security as “Very Good” This is up from 75% last year.
20% said it was “Good”. This was 25% last year.
No respondents gave an answer of OK or poor.
Some people mentioned the possibility of stray balls / kites hitting visitors as a potential danger.
100% of all respondents , when rating
haw safe they feel in the park said “Very
Good” or “Good”.
It’s safe to park, safe to
walk and safe to play for
children
I saw a rugby ball
land on a family
having a picnic.
The dogs on leads
policy is sensible
Responses %
Very Good 269 80%
Good 68 20%
OK 0 0%
Poor 0 0%
Very Poor 0 0%
N/A 0 0%
41

Rufford – We have a "Dogs on Leads" policy here.
Do you agree with it?
Most people (37%) said they agreed with the dogs
on leads policy. Closely followed by those who
thought that its right for the park to decide. (32%)
22% of responders were not bothered either way.
9% did not agree with the policy feeling that their
well behaved dogs should be allowed to roam
freely.
There are so many
larger outdoor spaces
nearby to let the dogs
roam free. Not here
please!
On a really busy day at Rufford it
would be total chaos (not to
mention dangerous) to have
dogs running around
Responses %
Yes - I prefer owners to keep dogs
on the lead in this park 126 37%No - I don't agree with it / don’t
like the policy 31 9%
It doesn't really bother me one
way or another 73 22%
I think it's up to the park to decide
what works best for everyone 108 32%
42

Rufford – Is the £3 car parking charge fair value?
Most people (86%) thought that the parking charge was “fair value” especially as entry to the park was free.
11% said value was “OK”.
A core 3% of mainly local people / dog walkers who want to visit everyday and remember when parking was free during the off season said that the parking charge was unreasonable. They were also unhappy about the £5 premium charged for certain special event days.
Also some blue badge holders thought that they should receive a concession.
Season ticket pricing for £30 was thought fair and reasonable by most local people. There was low awareness of the car park redemption when you spend £15 in the shops / café / restaurant.
Good value
compared to other
English Heritage sites
When we come for lunch we
always get our parking
money back. It’s a good deal.
Motorbikes are only £1
so that’s good for me
Responses %
Fair value 290 86%
OK 36 11%
Unreasonable 11 3%
43

Service Comparison Charts #1
44

Service Comparison Charts #2
45

A few more
disabled parking
spaces would
be nice
Do something
about road access
onto A614 on busy
days. Its so difficult
to pull out
Toilet facilities
near children’s
play area
More treasure hunts
and more events in
general for children
More responsible
signage asking people
not to feed bread to
the ducks
Regular
fun run
Strat a loyalty scheme
so frequent visitors get
rewarded
Keep doing
the Groupon
deals
Garden centre or
herb and plant
stalls
Comments & suggestions for improvement
More publicity about
redeeming the car
parking fee in shops
46

Comments & suggestions for improvement
Parking chap was
really friendly
More catering
staff during
busy periods
Clear outdoor
tables quicker to
stop the wasps
gathering
Outdoor cinema
events in
summer
Rangers should be
more visible
Rowing
boats on the
lake?
Could sell ready
made picnic
hampers
BBC could do
Antiques
Roadshow here?
Where
are the
hawks?
Open a deli with
local produce
Update and renovate
the children’s play
area. It’s all a bit
dated
47

Part 4Summary & Key Findings
48

Subject Comment
Methodology Using Ipads to conduct surveys continues to work very well because they speed up interviews,
provide visual interest and interactively engage respondents.
Lunchtimes and afternoons continue to be more productive for asking people about their visits as
they had a chance to experience the park.
Visitors 337 parties were interviewed. The average size of each visitor group is 3.9 people.
88% of those interviewed at Rufford are repeat visitors. Most visitors come three times each year.
More people are coming back to Rufford on a regular basis than ever before.
Most people (42%) interviewed were local residents who travelled directly from home.
Tourists 11% of those interviewed were holidaying in the area
These tourist visitors were mostly staying in self catering holiday cottages.
More people are using hotels and guest houses than in previous surveys.
Significantly, we have discovered that 14% of those holidaying in the area are staying with friends
or family.
The most popular local destinations to visit were Clumber Park, Sherwood Forest and
Nottingham City Centre. Also mentioned were Go Ape Nottinghamshire, Retford in Bloom;
Creswell Crags, Bolsover Castle; Peak District National Park and Alton Towers.
49

Subject Comment
Disability This year, 16% of parties included someone who considered themselves as disabled.
This is about average when looking back at past surveys over the last 6 years.
62% of visitors to Rufford (that have some direct experience or knowledge) thought
that the amenities for visitors with special access or mobility requirements were ‘very
good’ or ‘good’.
The park is used by a number of care groups on a regular basis.
Age, Gender &
Ethnicity
97% of all those surveyed were ‘White British’. This is typical compared to previous
surveys at Rufford and tends to reflect the prevailing ethnic make up of the rural
location.
As in previous surveys, the percentage of women visiting the park is greater than
men. The difference has increased this year to 16%. Last year the gap was 14%.
20% of visitors were 65+ this was the most common visiting group. The next most
common age group are 5-12 year olds. (18)
Once again, 18-24 year olds are the least represented visitor age group.
50

Subject Comment
Information sources 60% of respondents said they would search Google if they were planning a day out and
specifically 9% said they would use Trip Advisor.
Asking friends and relatives (23%) is still important. This is similar to previous years.
20% still check their local newspaper to find out what’s going on and 15% still like to use the
County Council’s printed ‘What’s On’ Guide.
Fewer people than ever (4%) are using tourist information offices. This continues a year-on-
year downward trend for the use of such facilities.
Many regular local visitors rely on the display boards and billboards around Rufford to tell
them what’s going on in the park and locally. People also mentioned leaflets they pick up at
hotels and B&Bs. Also there is a new North Nottinghamshire website mentioned by a few
people.
Park policy / rules and
entry fees
This year we measured public perception of the dogs on leads policy and standard the car
parking tariff.
Most people (37%) said they agreed with the dogs on leads policy. Closely followed by those
who thought that its right for the park to decide. (32%). There was a definite link between the
enforcement of this policy and the public’s perception of safety in the park which was equal to
record levels.
Most people (86%) thought that the parking charge was “fair value” especially as entry to the
park was free.
51

Subject Comment
Visitor Experience 97% of those surveyed thought their overall visit to Rufford was “Good” or “Very Good.
There has been an 4% increase in people visiting for exercise, health, walking etc. This is still the
most common ‘single’ reason for coming to the park for adults without children. 34% of visitors
come for this reason. Taking children out (27%) was the next most common reason for visiting the
park.
This year, the Lake (88%) was once again the most visited place at Rufford. However, the Gardens
(50%) saw fewer visitors than normal. The Café was mentioned by 76% of those interviewed. Savile
Restaurant was visited by 14% of respondents. This is the highest ever percentage with the Groupon
scheme a definite contributing factor. In contrast, the Shops continue to reduce in (summer) visitor
numbers.
The service comparison chars in this report show that compared to previous summer surveys the
standard of service provision is relatively high. However, when compared to the 2015 Autumn
survey, percentage scores are lower across the board. We can conclude that, the demands of busy
summer months, with a broader range of visitor types plus tourists, put more strain on Park
services.
Likes Positive things were said about: Brass band concert, treasure trail, facilities for children, the ford
‘splash’, beautiful surroundings, well maintained grounds, herb garden, rose garden, mobility
scooters, dogs on leads, service from staff and general good value. All catering continues to be
popular at Rufford with most saying its good value especially with a Groupon deal.
Dislikes Negative comments were said about: overcrowding, the need for more disabled parking spaces,
need for renovation work at children’s play area, dry carvery meat / food, awareness of car park fee
redemption scheme, enforcement of ‘dogs on leads’ rule, and not feeding bread to ducks. Pulling
out onto the A614 continues to be an issue on busy days.
52