rtia anaual report 2013 ne annual report 2013-590.pdf · mr bryan chaplog chairperson of the audit...
TRANSCRIPT

Justice in Adjudication
ROAD TRAFFICINFRINGEMENT AGENCY
Annual Report
ChangeAhead

ANNUAL REPORT 2012/13 ROAD TRAFFIC INFRINGEMENT AGENCY
ChangeAhead
1
Contents Page
Organisational overview ............................................................................................................................................ 4
Statement by Chairperson of the Board ..............................................................................................................10
Section 1: Strategic Overview ................................................................................................................................14
Section 2: Corporate Governance and Management ........................................................................................20
Section 3: Human Resource Overview .................................................................................................................30
Section 4: Infringements Performance Report ..................................................................................................40
Section 5: Highlights and Achievements ...........................................................................................................142
Section 6: Performance Information Report ....................................................................................................146
Section 7:
Company Secretary’s Certi cate of Assurance ........................................................................158
Approval and Statement of Responsibility ................................................................................159
Accounting Authority Report ....................................................................................................... 160
Audit Committee Report ...............................................................................................................163
Report of the Auditor-General ......................................................................................................166
Annual Financial Statements for the year ended 31 March 2013 ........................................157
Abbreviations and Acronyms ....................................................................................................................................206
ChangeAhead

ANNUAL REPORT 2012/13 ROAD TRAFFIC INFRINGEMENT AGENCY2
The VisionRTIA’s vision is to have an informed, compliant and safe road user community.
MissionThe Agency’s mission is to encourage compliance with road traf c laws in South Africa through:
• targeted road user and community education and communication programmes;
• promotion of procedurally fair, lawful and reasonable administrative adjudication;
• levying of penalties;
• imposing demerit points;
• effective administration and management of the suspension and cancellation of driving licences and operator cards; and
• rewarding compliant road users.
ValuesThe core values of the RTIA are:
• integrity;
• Transparency;
• fairness;
• Accessibility; and
• Accountability.
VisionThe RTIA’s vision is to have an informed, compliant and safe road user community.
MissionThe Agency’s mission is to encourage compliance with
road traffic laws in South Africa through:
• targeted road user and community education andcommunication programmes;
• promotion of procedurally fair, lawful andreasonable administrative adjudication;
• levying of penalties;
• imposing demerit points;
• effective administration and management of the suspensionand cancellation of driving licences and operator cards; and
• rewarding compliant road users.
ValuesThe core values of the RTIA are:
• Integrity• Transparency
• Fairness• Accessibility
• Accountability

ANNUAL REPORT 2012/13 ROAD TRAFFIC INFRINGEMENT AGENCY
ChangeAhead
3
Organisational Overview
ANNUAL REPORT 2012/13 ROAD TRAFFIC INFRINGEMENT AGENCY4
Organisational overviewFrom its founding Act, the Road Traf c Infringement Agency was envisaged to play a critical role in forging a closer, more effective and ef cient link between the enforcement role played by the various Issuing Authorities and adjudication processes. RTIA was set up to play the role of an independent adjudicator, overseeing and enforcing the provisions of the Act in compliance with road traf c laws, as well as inculcating a new habit of voluntary compliance through community educational and awareness programmes. In this regard, the Agency is mandated to ensure the implementation of an objective, transparent and fair administrative adjudication process.
Mandate and FunctionsThe RTIA derives its mandate and functions from the Administrative Adjudication of Road Traf c Offences Act, 1998 (Act No. 46 of 1998), herein-after referred to as the AARTO Act, which states that the objects of the Agency are, despite the Criminal Procedure Act, 1977 (Act No. 51 of 1977):
(a) to encourage compliance with the national and provincial laws and municipal by-laws relating to road traf c and to promote road traf c safety;
(b) to encourage the payment of penalties imposed for infringements and to allow alleged minor infringers to make representations;
(c) to establish a procedure for the effective and expeditious adjudication of infringements;
(d) to alleviate the burden on the courts of trying offenders for infringements;
(e) to penalise drivers and operators who are guilty of infringements or offences through the imposition of demerit points leading to the suspension and cancellation of driving licences, professional driving permits or operator cards;
(f) to reward law-abiding behaviour by reducing demerit points where they have been incurred if infringements or offences are not committed over speci ed periods;
(g) to establish an agency to support the law enforcement and judicial authorities and to undertake the administrative adjudication process; and
(h) strengthen co-operation between the prosecuting and law enforcement authorities by establishing a Board to govern the agency.
Whereas all matters related to traf c violations were previously dealt with under the CPA, the establishment of the Agency and the full implementation of the AARTO Act, means that most of the traf c violations will be dealt with administratively. This is expected to help free the courts and judicial authorities to deal with more serious criminal matters.

ANNUAL REPORT 2012/13 ROAD TRAFFIC INFRINGEMENT AGENCY 5
ChangeAhead
Ms Nomini Rapoo: Board ChairpersonMs Nomini Rapoo was appointed to the Board in August 2010. She holds an LLB degree from the University of Natal (Pietermaritzburg), a B Com (Law) degree from the University of the North and a Certi cate in Corporate Governance from the University of Johannesburg. She is an admitted attorney of the High Court and her extensive career spans from among others, the South African Maritime Safety Authority, Industrial Development Corporation, Airports Company South Africa before joining AECI Ltd as Group Company Secretary responsible for legal advisory, risk management, compliance and governance portfolios. Ms Rapoo specialises in corporate governance and has written a book on Black Economic Empowerment and contributed numerous articles on governance issues. Ms Rapoo serves as the chairperson of the RTIA Board.
Mr Japh Chuwe (Executive): RegistrarMr Chuwe has extensive experience in the transport industry both in private and government sectors. He holds a BA Law and Honours in Industrial Sociology from the University of the Witwatersrand, a Certi cat D’assiduite from the Institut International Des Droits De L’Homme, France and a Postgraduate Certi cate Programme in Project Management from the University of Pretoria. He has worked as Operations Manager for NaTIS and successfully implemented the NaTIS in the Kingdom of Lesotho pursuant to the standardisation of transport information systems espoused in the SADC Protocol, Project Manager that developed the Road Classi cation System and Best Practice Model in the Licensing Departments in Gauteng.
Adv. Thomas Dicker: Board memberAdv. Thomas Dicker was appointed to the Board in August 2010. He is a Deputy Director of Public Prosecutions for the South Gauteng High Court, Johannesburg. He holds an LLB degree from the University of Pretoria and has a long career in the legal fraternity as Senior Public Prosecutor, Senior State Advocate, Deputy Attorney-General to the current post. He has a wide range of experience and expertise in traf c law and related matters and was a previous Chairperson of the Technical Committee for Standards and Procedures for Traf c Control and Traf c Control Equipment.
Mr Christopher Manzini: Board memberMr Christopher Manzini was appointed to the Board in August 2010. He holds a B Iuris degree from the University of Durban Westville, an LLB degree from the University of Witwatersrand and Public Prosecutor Certi cate from the Justice College. Mr Manzini has held numerous positions in the legal eld, including being a Legal Consultant for Ntuli, Noble and Spoor Attorneys deployed to the Department of Land Affairs (Mpumalanga Province). He is a practicing attorney and currently the Director in Manzini - Mdladla Attorneys specializing in criminal and civil matters.
RTIA BOARD OF DIRECTORS

ANNUAL REPORT 2012/13 ROAD TRAFFIC INFRINGEMENT AGENCY6
Mr Bryan ChaplogChairperson of the Audit Committee
Ms Shelley ThomasMember of the Audit Committee
Mr Christopher ManziniMember of the Audit Committee
RTIA BOARD COMMITTEES (Audit Committee)

ANNUAL REPORT 2012/13 ROAD TRAFFIC INFRINGEMENT AGENCY 7
ChangeAhead
RTIA BOARD COMMITTEES (Technical Committee)Adv. Thomas Dicker
Chairperson of the Technical CommitteeMr Benedict Matinise
Member of the Technical Committee
Prof. Job MokgoroMember of the Technical Committee

ANNUAL REPORT 2012/13 ROAD TRAFFIC INFRINGEMENT AGENCY8
ANNUAL REPORT 2012/13 ROAD TRAFFIC INFRINGEMENT AGENCY
ChangeAhead
9
Statement by Chairpersonof the board

ANNUAL REPORT 2012/13 ROAD TRAFFIC INFRINGEMENT AGENCY10
Statement by Chairperson of the BoardBackgroundThe Road Traf c Infringement Agency was established by section 3 of the Administrative Adjudication of Road Traf c Offences Act, 1998 and in the continuation of its operations, sought to achieve its legislated mandate through the effective implementation of the AARTO Act, which is geared towards the increment of road safety and the goals of the “Decade of Action for Road Safety” targets.
The RTIA is now in its third year of operations and has made commendable progress towards full implementation of the AARTO Act. In addition to on-going work to establish its administrative support structures at head of ce in Midrand and hire suitable skills, the Agency has since taken over most of the interim functions previously carried out by Road Traf c Management Corporation (RTMC) and is in process to conclude service level agreements with the various Issuing Authorities. These agreements provide a critical link between the enforcement functions of the Issuing Authorities and the adjudication role of the Agency. This report elaborates on the activities of the Agency for the year.
Solvency and Going ConcernIt is pleasing to report that the Agency has obtained an unquali ed audit opinion for the second year running. The Board and management have worked hard to ensure that the control environment improves each year as this helps to lay a rm foundation on which to build a sustainable business.
Without qualifying his opinion, the Auditor-General repeated his concerns about the solvency and going concern status of the Agency. This concern is fully shared by the Board and management and stems from the chronic underfunding of the Agency from the beginning. The nancial statements that accompany this report show a signi cant impairment of accounts receivables. The main reason for this state of affairs is that it has taken unduly too long to regularise the transfer of revenue received through the RTMC managed bank accounts as well the problems that arise when reconciling these amounts. The impairment charge amounted to R 31 million and relates to disputed amounts due by the Issuing Authorities. The Agency cannot afford this level of impairment and were it not for the year end “virement” amounting to R 14 million by the Department of Transport, it would have reported a substantial loss. To prevent a recurrence of this situation, it is necessary to resolve the issue of the transfer of AARTO accounts so that these fall under the direct control of the RTIA without further delay. Management has committed to engaging with all parties in order to urgently resolve this matter.
The Board is still concerned about the future nancial sustainability of the Agency as its present funding levels fall far short of the approved business plan. Despite this, the Board believes that the strategies put together by management will provide a sound footing and should help to ensure the Agency operates viably over the short term. It is for this reason that the nancial statements of the Agency were prepared on a going concern basis.
Ms Nomini RapooChairperson: RTIA Board

ANNUAL REPORT 2012/13 ROAD TRAFFIC INFRINGEMENT AGENCY
ChangeAhead
11
The Board and management are committed to implementing plans to increase the collection of outstanding infringement revenue in order to ensure the future sustainability of the Agency. As part of these plans, the Agency has engaged National Treasury and the Department of Transport in discussions to resolve its short, medium and long-term funding requirements. Without suf cient funding, the Agency will take unduly too long to roll out its operations to the rest of the country.
The Board is con dent that Management is working hard to build the required capacity to enable the Agency to begin the much-anticipated roll-out of the AARTO to all provinces in the upcoming nancial year. Pursuant to this, the Agency remains committed to working very closely with all its stakeholders, including government departments, labour, business and the broader community in making its contribution towards ensuring a safe road transport environment in the current Medium Term Expenditure Framework (MTEF) period.
GovernanceThe Board, as the custodian of corporate governance is committed to sound governance principles and to ensuring an effective control environment. However for the past two years the Board has been operating under serious capacity challenges, where in terms of the AARTO Act it is supposed to be comprised of seven members but has instead been operating with four members for the majority of the period under review. This challenge meant that Board Members could not be distributed effectively to the sub committees. To address this, the Board has made use of non-member experts to augment its sub-committee membership.
In line with our commitment to continuous performance improvement, the Board commissioned a Board Evaluation process whose outcomes were used to implement various remedial interventions to ensure that we operate in line with best practice. Consequently, the RTIA has formed strategic partnerships with key stakeholders in preparation for a successful launch of road user and community education and awareness programmes in the upcoming nancial year. This programme is geared at ensuring that road users understand the AARTO and its objectives, as well as their obligations and rights as set out in the AARTO Act, towards ensuring a safe environment in the country. This undertaking and commitment is based on the conviction that the more educated and empowered the general community is about the AARTO and its objectives, the greater its contribution and active engagement towards achieving these objectives.
Challenges experiencedThe critical challenges faced during the period under review continued to relate to:
• inadequate funding which is cross-cutting on the Agency’s operations;
• mandate overlap with other entities, which negatively impacts the Agency’s ability to effectively implement its statutory functions; and
• lack of credible systems to ensure data integrity of all the entity’s operations.
The Board and management considered these challenges and implemented an intervention plan to address them effectively. Those challenges that were in the ambit of the Agency’s control were effectively dealt with, whereas those outside its scope were brought to the attention of the relevant role-players to assist in addressing them. The Board is optimistic that the remaining challenges will be effectively dealt with by the Shareholder in order to free the Agency to focus on delivering on its mandate.

ANNUAL REPORT 2012/13 ROAD TRAFFIC INFRINGEMENT AGENCY12
On behalf of the Board, I wish to thank the former Minister of Transport Mr Dikobe Ben Martins for his leadership and support. Allow me to also extend a warm welcome to our new Minister, Ms Dipuo Peters and assure her of our commitment to continued good performance. With her leadership and that of our Deputy Minister, Ms Sindisiwe Chikunga, we are assured of an excellent and dynamic team, who will lead the Agency and the whole transport sector to greater heights. My sincerest gratitude to the Registrar and his management team and staff of the Agency, who, in spite of these seemingly insurmountable challenges have kept their focus towards the Agency’s deliverables.
Ms Nomini Rapoo
Chairperson: RTIA Board

ANNUAL REPORT 2012/13 ROAD TRAFFIC INFRINGEMENT AGENCY
ChangeAhead
13
Strategic Overview

ANNUAL REPORT 2012/13 ROAD TRAFFIC INFRINGEMENT AGENCY14
Section 1: Strategic Overview
BackgroundThis being the third year of operations for the Agency, tremendous progress has been made in entrenching its operations from establishment, in spite of the continuing challenges experienced from inception and in particular, the insuf cient funding in terms of the government grant allocation of R5 million which falls far short of requirements.
As a direct result of under-funding and in a bid to contain escalating costs, the Board decided to suspend the South African Post Of ce account through which the Agency served courtesy letters and enforcement orders. Instead, management devoted more time to data cleaning so as to improve the integrity of the records on the National Contraventions Register (NCR), in respect of off-line payments that were not uploaded thereto.
This change of focus enabled the Agency to undertake the capturing of the payment records made and not updated. Without the updating on the NCR, courtesy letters and enforcement orders would have had to be processed and served on infringers who had already paid, thereby resulting in fruitless expenditure. At the beginning of the updating project, a total of 107 000 payments were made via the offline platforms (eg. Standard Bank account), with a value of R207 million and of these, a total of 79 440 transactions with a value of R149 million were updated onto the NCR, which represented a considerable improvement to the records system.
In order to fund its operations, the Agency relied on the revenue portion accruing to it from the road traf c infringement activities of the implementing authorities in the Tshwane and Johannesburg municipal jurisdictions. Having consistently engaged the Department for additional funding, the Agency was allocated a further R 14 million as a ‘virement’ at the end of the nancial year. This amount was critical and helped to offset a potential loss arising from an impairment charge that had to be made this year.
Audit PerformanceFor the second consecutive year, the Agency has achieved excellent performance with a resounding con rmation of this in the form of an unquali ed opinion from the Auditor-General. This tremendous achievement was a result of proactive measures in the form of establishing and implementing an internal system of control to ensure good governance and ef cient performance. The Board and management made a rm commitment to entrench the practise of fair, transparent and good governance in all its operations and sought to further entrench its excellent audit performance. This excellent performance was achieved through proactively engaging with the process of developing new measures to augment the internal system of control implemented.
Mr Japh R. ChuweRegistrar

ANNUAL REPORT 2012/13 ROAD TRAFFIC INFRINGEMENT AGENCY
ChangeAhead
15
Casting it’s eyes towards enhanced future performance, the Agency recognises that the NCR was developed as a module of the eNaTIS and is the preferred strategic system providing the backbone of the RTIA’s operations, however, given its system’s architecture, the information technology needs of the RTIA with respect to the NCR cannot be fully addressed through the NCR on eNaTIS and thus the Board is developing a long-term strategy of establishing its own independent NCR in order to fully and efficiently support the AARTO implementation and the connectivity of all stakeholders across the country. This will enable the Agency to be in complete control of its environment, as well as providing reliable, credible data on a real-time, on-line basis to be used as an effective decision support mechanism.
GovernanceThe Board operated for the majority of the period with inadequate membership. Whereas the Act provides for seven Board members, the Agency operated for the majority of the time with only four members. This led to a challenge in terms of the required skills and capacity for effective governance and stretched the remaining members to ensure effectiveness in the exercise of their duciary duties. Having brought this to the attention of the Shareholder, the Agency is hopeful to achieve its full complement of Board members in the upcoming nancial year.
Pursuant to good governance and in spite of the dif culties faced, the Board had implemented innovations to address the capacitation challenges it faced, by augmenting it’s support structures with the appointment of additional, highly skilled members of its sub-committees, thereby ensuring that the resultant gaps in governance structures were adequately addressed.
In addition, for effective performance, the Board and management have been engaging interactively in assessing the Agency’s operational environment and challenges and to that extent, submitted an amended Strategic Plan and Annual Performance Plan for approval by the Minister. These amended plans had taken due cognisance of the continuing challenges experienced and provided a practical estimation of performance and approved by the Minister. The related information is provided under section 6 on performance information.
State of Road User ComplianceThe statistics provided in Section 4: Infringements Performance Report, are in accordance with the data captured in the NCR provided by the eNaTIS contractor and uploaded thereto by the issuing authorities currently implementing AARTO. Some of these are briefly summarised below.
• The total number of AARTO Infringement Notices served in the Tshwane and Johannesburg jurisdictional areas increased by 2 052 508 (114.82%) from 1 787 517 in the previous year to 3 839 925 notices in the 2012-2013 period. These numbers include an increase of 86 595 (10.33%) in hand written AARTO 01 Notices to 924 629; an increase of 1 487 687 (244.14%) in AARTO 03 Notices to 2 097 043 and a decrease of 7 685 (7.68%) in Notices to operators to 92 433. The total value of the notices served amounted to R1 925 084 500.00.
• Of the total notices served, 58.73% were to drivers of light passenger vehicles; 7.46% to drivers of heavy passenger vehicles (including midi-buses and buses); 13.33% to drivers of light load vehicles (LDV’s) and 1.26% to truck drivers.
• Notices served for vehicle registration and licencing infringements increased by 53 175 (47%) from 112 413 during the previous year to 165 588 during the 2012-2013 nancial year. Notices served for vehicle tyre infringements increased by 6 177 (15%) from 40 481 to 46 658 and notices for general vehicle roadworthiness infringements increased by 15 243 (21%) from 71 367 to 86 610.

ANNUAL REPORT 2012/13 ROAD TRAFFIC INFRINGEMENT AGENCY16
• Notices for road sign, traf c signal and road marking infringements increased by 21 149 (10%) from 214 478 to 235 627 and for rules of the road and driving signal infringement by 151 828 (105%) from 144 077 to 295 905. Notices for speed infringement increased by 1 521 164 (232%) from 655 121 to 2 176 285.
• The number of Courtesy Letters served decreased from 1 039 426 the previous year to 469 466 during 2012-2013. This is as a direct result of the decision to curb the related expenditure, in part due to the lack of integrity in the address validations, as well as the lack of con rmation of service of infringement notices as provided for in the Act.
• The number of Enforcement Orders served increased from 9 826 to 90 214 during the rst four months of the 2012-2013 period. Due to the high cost to serve Courtesy Letters and Enforcement Orders by registered mail and very tight nancial constraints experienced by the Agency at the time, the RTIA Board at its meeting held on 25 July 2012 resolved that the serving of letters and orders be suspended until such time as the nancial situation of the Agency improved.
• The number of Representations adjudicated increased by 459 (1.33%) from 34 410 in 2011-2012 to 34 869 in 2012-2013 of which 15 261 (43.77%) were successful and 19 608 (56.23%) were un-successful and rejected.
• The total number of Elections submitted to be tried in court increased by 48 208 (209.52%) from a total of 23 009 during 2011-2012 to a total of 71 217 during 2012-2013.
• A total of 481 801 infringements were paid for an amount of R143 185 321.00. This shows a payment rate of 7.44% on the value of infringements captured. This rate of payment does not determine the compliance rate to road traf c laws, since the AARTO process entails 5 distinct options that can be exercised by infringers, including the payment of the infringement where applicable. Other options exercised by the infringer, such as submission of successful representations, means that the infringement is cancelled and the infringer is not held accountable, resulting in the infringement and the penalty value being nulli ed. Furthermore, the report shows a gradual decreased payment rate from 1.78% during Infringement Notice stage, 1.51% at Courtesy Letter stage, to an increased rate of 4.15% at Enforcement Order stage.
At this stage, it is dif cult to determine the actual level of compliance in terms of payments of outstanding infringement notices due to challenges related to systems’ interfaces with the NCR, and some platforms not uploading the payments thereto. Furthermore, the inability to automatically upload and update the NCR often results in Courtesy Letters and Enforcement Orders being issued for infringement notices that have already being paid. This negatively impacts on the Agency’s costs as the expenditure for the serving of Courtesy Letters and Enforcement Orders would have been incurred by the Agency but becomes irrecoverable. There is an additional reputational risk for the Agency and all role-players involved in the AARTO process itself which is being addressed through consultations with the critical stakeholders. In addition, there will be a full audit on the system so as to remedy shortcomings during the 2013/2014 nancial year.
Legislative FrameworkDuring the period under review, tremendous effort was put into nalising the amendments to the AARTO Act and the Regulations. The Amendment Bill was published in Government Gazette Number 36173 dated 20 February 2013, inviting comments from the public and interested stakeholders. After a 30 day period of publication, the comments were to be considered and the nal Amendment Bill submitted to Parliament for promulgation after approval by the Minister, which is now scheduled for the 2013/14 period.
ANNUAL REPORT 2012/13 ROAD TRAFFIC INFRINGEMENT AGENCY
ChangeAhead
17
The essential elements entailed in the Amendment Bill are geared at addressing operational challenges experienced, as well as curbing the exorbitant expenditure costs related to the service of documents and providing textual clarity to the administrative and judicial processes relating to offences and infringements. Some of the aspects envisaged in the Amendment bill include the following:
• deletion of the distinction between “minor” and “major” infringements;
• enabling the Agency to administer rehabilitation programmes for habitual infringers, including but not limited to driver retesting, compulsory community service at road accident trauma wards in public hospitals or state mortuaries for victims of road accidents;
• increase in the number of Board members;
• textual clarity in relation to the service of documents;
• amendment of certain sections to provide clarity between the administrative and judicial processes;
• the introduction of electronic service of documents in addition to the traditional methods of registered mail and personal service; and
• clari cation of the initiation process of serving documents for categorised offences.
The second process of the legislative framework entailed the development of the Regulations Amendments, which are aligned to the envisaged Amendment Bill and provides further details on their operational mechanisms.
ConclusionThe Agency’s excellent performance for the period under review came about in the face of tremendous challenges. The achievements that we report on could not have been attained were it not for the strong belief, conviction, dedication and an unrelenting focus by a multi-disciplinary team of competent people, who comprise of the Board, management and staff of the Agency. I wish to express my sincerest gratitude to all of you for your loyalty and commitment to make a positive contribution towards the attainment of the road safety goals and effective dispense of our mandate. My appreciation, deepest respect and admiration are to the Board of the RTIA, both present and past, for the sterling contribution to the Agency’s governance and continued critical inputs, guidance and leadership. In particular, my sincerest gratitude to the Chairperson of the Board, Ms Nomini Rapoo, for her leadership, sharp guidance and critical input. To the rest of the staff, indeed, we continue with our relentless focus and dedication to achieve the vision of a better future for our country and together, we shall succeed!
I wish to express my deepest respect, admiration and gratitude to our former Minister, Mr Ben Dikobe Martins for his sterling leadership and support. Having come at a time when the Agency’s morale was at its lowest, your interventions and support strengthened our resolve to continue dispensing our mandate effectively. I would be remiss not to express my appreciation to the Portfolio Committee on Transport for their support and empathy to the cause of the Agency in meeting its road safety mandate.

ANNUAL REPORT 2012/13 ROAD TRAFFIC INFRINGEMENT AGENCY18
Lastly I wish to express our excitement in welcoming the new Minister of Transport, Ms Dipuo Peters and assure her of our best cooperation and commitment to ef cient performance at all times. With the continued dynamic leadership, dedication and active support from you and Deputy Minister Ms Sindisiwe Chikunga, you can rest assured of the Agency’s tremendous improvement, ef cient performance and the successful achievement of the goals of “The Decade of Action for Road Safety 2011 – 2020” and beyond, to render a safe environment for all our road users.
Mr Japh R. Chuwe
Registrar

ANNUAL REPORT 2012/13 ROAD TRAFFIC INFRINGEMENT AGENCY
ChangeAhead
19
Corporate Governance andManagement

ANNUAL REPORT 2012/13 ROAD TRAFFIC INFRINGEMENT AGENCY20
Section 2: Corporate Governance and ManagementThe RTIA is a schedule 3A public entity as de ned in terms of the PFMA and is the Agency envisaged by the AARTO Act. It is a wholly state owned entity with the Minister of Transport acting as the political principal and shareholder and charged with the responsibility of overseeing the Agency.
The RTIA is committed to ensuring full compliance with the AARTO Act, King III Report on Corporate Governance, the provisions of the Public Finance Management Act, 1999, as well as governance and compliance directives from the Department of Transport and National Treasury.
The Board of the RTIA is responsible for directing the entity towards the achievement of the set vision and mission. The Board is therefore accountable for the development and execution of the Agency’s strategy, performance and nancial results as well as being the custodian of corporate governance.
The role of the members of the Board is to bring independent judgment and experience to the deliberations and decisions at the strategic level. In line with international best practice, the Chairperson is a non-executive director and is therefore not involved in the day-to-day management of the entity which is delegated to the executive team, led by the Registrar.
In terms of established governance processes, the Registrar and the Board develop strategic and performance plans for approval by the Minister in accordance with the PFMA and the AARTO Act. The strategic plan has key strategic objectives and deliverables. The Minister assesses the achievement of these objectives on a quarterly basis through the annual performance plan and this helps to keep the Minister fully informed of the progress, performance and the challenges the Agency encounters.
Governance StructuresBoard of Directors The Board of the Agency is the Accounting Authority. The current Board was appointed in August 2010 and is in its third year of existence.
In terms of AARTO Act, the Board is comprised of ve (5) non-executive directors, one (1) ex of cio member (Director of Public Prosecution) and the Registrar. The current Board comprises three (3) non-executive directors and one (1) executive director, namely the Registrar and has had a resignation of one (1) member. This means that there is a vacancy of three (3) members. As the Chairperson is not a member of any of the subcommittees, there is a problem of capacity when lling sub-committee positions from the present compliment of non-executive directors.
This issue is of concern and has been brought to the attention of the Shareholder and the Agency hope to achieve a full complement of directors without further delays which can be attributed to the appointment process.
The Board is responsible for governance and it’s duties include approving the strategic plan and presenting it to the Minster, monitoring and assessing management performance, and acting as a resource for management in matters of planning and policy. The duciary duties and other general duties of the Board are set out in the PFMA. The Board is governed by a formal written Board Charter which sets out its duties and responsibilities.
The Board has reserved, amongst others, the following powers for itself:
• approval and monitoring of the implementation of the strategic plan;
• determination of the overall policies and processes to ensure the integrity of RTIA’s management of risk and internal controls; and

ANNUAL REPORT 2012/13 ROAD TRAFFIC INFRINGEMENT AGENCY
ChangeAhead
21
• approval of all policies in the organisation, save for instances where it has delegated some of those approvals to management.
The Board has devolved the responsibility of running the day-to-day affairs of the Agency to the Registrar. This is done through written delegations of authority.
Board Members• Ms NE Rapoo - Non-Executive Chairperson
• Mr JR Chuwe - Registrar & Executive Director
• Adv. TE Dicker - Non-Executive Director
• Mr IS Jordaan - Non-Executive Director (resigned 26 July 2012)
• Mr CM Manzini - Non-Executive Director
Board Subcommittees Speci c responsibilities have been delegated to the committees of the Board, with full access to independent advice at the RTIA expense. The Board has two (2) subcommittees, namely: the Audit and Risk Committee and the Technical Committee. These subcommittees assist the Board in discharging its duties and responsibilities and they follow the guidelines of King III. There is full transparency of the subcommittees’ deliberations and their decisions are communicated to the Board through subcommittee reports to each Board meeting.
The work of the subcommittees was severely hampered for most of the year by the lack of a quorum and owing to delays in the appointments process which saw additional committee members being con rmed only after the AGM in November 2012.
The Audit and Risk Committee Committee members:
• Mr B Chaplog
• Ms S Thomas
• Mr C Manzini
This Committee is chaired by Mr Bryan Chaplog and it assists the Board in the discharge of its duties and responsibilities relating to the Audit and Risk functions.

ANNUAL REPORT 2012/13 ROAD TRAFFIC INFRINGEMENT AGENCY22
The Technical Committee Committee members:
• Adv. TE Dicker
• Prof. J Mokgoro
• Mr Benedict Matinise
• Mr IS Jordaan (resigned 26 July 2012)
This committee is chaired by Adv. Thomas Dicker and it assists the Board in discharging its duties and responsibilities on revenue management, IT issues, the National Contraventions Register (NCR), adjudications, education and legislative issues.
Company Secretary The Agency’s Company Secretary is Adv. MLT Bilikwana, who is empowered by the Board to perform his duties and directly or indirectly:
• assists the Chairperson and Registrar with the induction of new members;
• assists the Board with orientation, development and education;
• ensures that RTIA complies with all applicable legislation;
• monitors the legal and regulatory environment and communicates new legislation and any changes to existing legislation;
• provides the Board with a central source of guidance and assistance; and
• ensures that the proceedings and affairs of the Board and its committees are properly administered in accordance with relevant legislation.
All members of the Board have direct access to the Company Secretary at all times.
Board Remuneration The remuneration of Board members is determined by the Minister in consultation with the Minister of Finance.

ANNUAL REPORT 2012/13 ROAD TRAFFIC INFRINGEMENT AGENCY
ChangeAhead
23
Board MeetingsThe Board recognises and is committed to ensuring that it meets regularly, at least once every quarter in line with best practise as incorporated in the King Report. Details of the Board and Subcommittee meetings for the year under review are tabled below:
Board Meeting Audit & Risk Committee Technical Committee
25 May 2012 19 April 2012 09 May 2012
25 July 2012 18 May 2012 08 February 2013
26 October 2012 06 July 2012 20 March 2013
16 November 2012@ 20 July 2012
16 -17 January 2013 # 15 October 2012
30 January 2013 25 January 2013
Board Meetings AttendanceMember 25 May 2012 25 July 2012 26 October 2012 30 January 2013 Total Attendance
Ms NE Rapoo 4
Mr JR Chuwe 4
Adv. TE Dicker 4
Mr IS Jordaan O O 2
Mr CM Manzini 4
Mr B Chaplog 4
Audit & Risk Committee Meetings
Member 19 April 2012
18 May 2012
06 July 2012
20 July 2012
15 October 2012
25 January 2013
Total Attendance
Ms S Thomas 1
Mr CM Manzini 6
Mr BS Chaplog 6
Technical Committee MeetingsMember 09 May 2012 08 February 2013 20 March 2013 Total Attendance
Mr IS Jordaan O O 1
Adv. TE Dicker 3
Mr B Matinise 2
Prof TJ Mokgoro 2
Legend:Attended X Absent with apology O Resigned Board special advisor Not yet a member
@ Annual General Meeting # Board’s Strategic Session

ANNUAL REPORT 2012/13 ROAD TRAFFIC INFRINGEMENT AGENCY24
Board Evaluation ProcessDuring the nancial year under review, the Board introduced a formal evaluation of its effectiveness and to assist with the process, it appointed Cheziya Consulting to conduct an independent evaluation and to make recommendations for improvement. This task was completed on time and the results were presented to the Shareholder and major ndings were also used to assist the Board in addressing areas of weaknesses in its performance and to come up with remedial interventions where required. As such, the Board has implemented various remedial interventions during the period under review. These included ensuring that every Board Member is now fully registered with the Institute of Directors for enhancing its members’ development. The Agency will continue to identify areas requiring ongoing education and development for its existing and new members.
Executive ManagementMr JR Chuwe Registrar & Executive Director
Mr S Amos Deputy Registrar
Mr C Matjie Acting Chief Financial Of cer
Mr GJ Botha Specialist Technical Advisor to the Registrar
Adv. ML Bilikwana Company Secretary
Ms KF Pooe Senior Manager: Audit & Risk
Mr F Malindzisa Acting Head: Communication
Mr J Mmekoa Acting Head: Strategy & Reporting
Mr LV Masango Senior Manager: Information Technology
The RegistrarThe Registrar oversees the functions of the RTIA in accordance with the business plan as approved by the Board from time to time and in particular the:
• compilation and submission of the Strategic Plan, Annual Performance Plan and Annual Reports for consideration and approval by the Board;
• ef ciency of penalty collection and supporting administrative procedures;
• operational and organisational functioning of the RTIA; and
• full implementation of the Act through the introduction and entrenchment of effective management practices.

ANNUAL REPORT 2012/13 ROAD TRAFFIC INFRINGEMENT AGENCY
ChangeAhead
25
RTIA EXECUTIVE MANAGEMENT
Mr Japh ChuweRegistrar
Mr Sherman AmosDeputy Registrar
Mr Gerrie BothaSpecialist Technical Advisor to the Registrar
Mr Caiphus MatjieActing Chief Financial Of cer
Adv Mncedisi BilikwanaCompany Secretary (Ex Of cio Member of Exco)
Ms Keobakile PooeSenior Manager: Internal Audit and Risk
Management

ANNUAL REPORT 2012/13 ROAD TRAFFIC INFRINGEMENT AGENCY26
RTIA EXECUTIVE MANAGEMENT
Mr Jacob MmekoaActing Head: Corporate Strategy and Reporting
Mr Fakazi MalindzisaActing Head: Corporate Communication
Mr Leonard MasangoSenior Manager: Information Technology

ANNUAL REPORT 2012/13 ROAD TRAFFIC INFRINGEMENT AGENCY
ChangeAhead
27
Organisation StructureThe organisational structure of the Agency which is shown below was approved by the Shareholder along with the strategic plan and annual performance plan for the 2012/13 nancial year.
RTIA Board
Registrar
Snr Deputy Registrar Representations &
Demerit Points
Snr Exec ManagerInformation
Management
Infringement adjudication
Representation management
Demerit management
Human Resource Mngmt & Dev
Comp Secretary & Board Support Corporate Strategy
Facilities Mngmt & Office Services
Financial Accounting Management Accounting Procurement Asset Management
Administer courtesy notices Administer enforcement notices Administer warrants of execution
Administer representations Manage representations officers Amend infringements
Administer demerits Maintain demerit database Driving licence/Operator card suspend or cancel
Minister
Snr Deputy Registrar Infringements
PR & Corporate Communications
Snr Exec Manager Corporate Support
Legal Services
Internal Audit
Disbursement of Penalties
Head: Office of Registrar
Chief Financial Officer (CFO)
Electronic document management
Call Centre operations Interfaces to Banks, SAPO & LCMS’s
Dep Reg: WC & EC
Dep Reg: Gauteng
Dep Reg: NC & FS
Dep Reg: KZN & MP
Dep Reg: LP & NW
Snr Deputy Registrar Prov Operations
(COO)
Website & Internet processing
Liaise sheriffs
Data processing
Data mining & Reporting Registration & documentation IT Services
Risk Management
The structure when fully implemented should enable the Agency to roll out its services throughout the country over the MTEF funding cycle of three years. So far, the Agency has not received suf cient funding to enable it to open sub-of ces at provincial or regional level as is envisaged by the approved plan. As the Agency acquires the related budgetary support, it will be able to ll the approved positions in the structure, and anticipates achieving this by the 2014/15 period.

ANNUAL REPORT 2012/13 ROAD TRAFFIC INFRINGEMENT AGENCY28

ANNUAL REPORT 2012/13 ROAD TRAFFIC INFRINGEMENT AGENCY
ChangeAhead
29
Human Resource Overview

ANNUAL REPORT 2012/13 ROAD TRAFFIC INFRINGEMENT AGENCY30
Section 3: Human Resources OverviewFor the year under review, the Agency started with 22 staff and increased its complement by 16 (72%) to a total of 38. Due to budgetary constraints, a cautious but phased human capital acquisition approach was adopted. Eight staff was appointed on a short-term contract basis in order to deal with the data clean-up of the National Contravention Register (NCR) in relation to off-line payments that were not uploaded, as well as the debt collection of infringement amounts due to the Agency.
Two managers, whose duties are directly related to the Agency’s mandate, were transferred from the Road Traf c Management Corporation to the Agency, thereby increasing the Agency’s capacity to perform its functions. The total staff compliment of 38 at year end resulted in a total of 37 (49%) under-capacitation for the Agency when compared to the target of 75 as set out in the approved plans. The tables that follow present a breakdown of staff by race and gender in relation to a number of measures and perspectives as required by the Employment Equity Act.
Table 3.1: Staff Pro le by Race
Level African Coloured Indian White Total
Registrar 1 0 0 0 1
Deputy Registrar 0 1 0 0 1
Senior Management 6 0 0 1 7
Middle Management 4 0 0 1 5
Specialists 7 2 0 0 9
Junior staff 13 0 0 0 13
General workers 2 0 0 0 2
Total Staff 33 3 0 2 38
% 86.84% 7.89% 0.00% 5.26% 100.00%
Table 3.2: Staff Pro le by Gender
Level Male Female Total
Registrar 1 0 1
Deputy Registrar 1 0 1
Senior Management 6 1 7
Middle Management 3 2 5
Specialists 5 4 9
Junior staff 6 7 13
General worker 1 1 2
Total Staff 23 15 38
% 60.53% 39.47% 100%

ChangeAhead
ANNUAL REPORT 2012/13 ROAD TRAFFIC INFRINGEMENT AGENCY 31
The
info
rmat
ion
in th
e ta
ble
abov
e sh
ows
a st
aff c
ompl
imen
t of 6
0.53
% m
ales
and
39.
47%
fem
ales
.
Tabl
e 3.
3 : T
otal
num
ber o
f Em
ploy
ees
per O
ccup
atio
nal C
ateg
ory(
SASC
O) (i
nclu
ding
Em
ploy
ees
with
dis
abilit
ies)
Occ
upat
iona
l Ban
dsM
ale
Mal
e M
ale
Mal
eM
ale
Fem
ale
AFe
mal
e C
Fem
ale
I
Fem
ale
Fem
ale
WTo
tal
%A
C I
T B
WT
B
L13-
16 L
egis
lato
r / F
inan
ce, I
T Au
dit s
enio
r of
cia
ls a
nd M
anag
emen
t Per
man
ent
61
07
11
00
10
923
.68%
L11-
12 P
rofe
ssio
nals
20
02
12
00
20
513
.16%
L9-1
0 Pr
ofes
sion
als
41
05
03
10
40
923
.68%
L5-8
Cle
rks
Tech
nici
ans
60
06
07
00
70
1334
.21%
L2-4
Sem
i-Ski
lled
10
01
01
00
10
25.
26%
L1 E
lem
enta
ry o
ccup
atio
ns0
00
00
00
00
00
0.00
%
TOTA
L19
20
212
141
015
038
100.
00%
Mal
eM
ale
Mal
eM
ale
TBM
ale
Fem
ale
AFe
mal
e C
Fem
ale
IFe
mal
e T
BFe
mal
e W
Tota
lA
CI
W
Empl
oyee
s w
ith d
isab
ilitie
s0
00
00
00
00
00
The
info
rmat
ion
in th
e ta
ble
abov
e sh
ows
the
follo
win
g pe
rcen
tage
(%) p
erso
nnel
dis
trib
utio
n ac
ross
the
diffe
rent
sal
ary
leve
ls:
• Le
vel 1
3 - 1
6 :
23.
68%
• Le
vel 1
1 - 1
2 :
13.
16%
• Le
vel
9 -
10
: 23
.68%
• Le
vel
5 –
8
: 34
.21%
• Le
vel
2 –
4
: 5.
26%
• Le
vel 1
:
0.
00%

ANNUAL REPORT 2012/13 ROAD TRAFFIC INFRINGEMENT AGENCY32
Tabl
e 3.
4 : T
otal
num
ber o
f Em
ploy
ees
per O
ccup
atio
nal B
ands
(inc
ludi
ng E
mpl
oyee
s w
ith d
isab
ilitie
s)
Occ
upat
iona
l Ban
dsM
ale
Afric
anM
ale
Colo
ured
Mal
eIn
dian
Mal
eto
tal
Blac
ks
Mal
eW
hite
Fem
ale
Afric
ans
Fem
ale
Colo
ured
Fem
ale
Indi
ans
Fem
ale
Tota
l Bl
acks
Fem
ale
Whi
teTo
tal
L15-
16 T
op M
anag
emen
t Per
man
ent
21
03
10
00
00
4
L13-
14 S
enio
r Man
agem
ent P
erm
anen
t4
00
40
10
01
05
L9-1
2 Pr
ofes
sion
ally
qua
li e
d an
d ex
perie
nced
sp
ecia
lists
and
mid
-man
agem
ent P
erm
anen
t6
10
71
51
06
014
L5-8
Ski
lled
tech
nica
l and
aca
dem
ical
ly q
uali
ed
60
06
07
00
70
13
L2-4
Sem
i-Ski
lled
10
01
01
00
10
2
L1 E
lem
enta
ry o
ccup
atio
ns0
00
00
00
00
00
TOTA
L19
20
212
141
015
038
The
info
rmat
ion
in th
e ta
ble
abov
e sh
ows
the
follo
win
g pe
rcen
tage
(%) p
erso
nnel
dis
trib
utio
n ac
ross
the
diffe
rent
occ
upat
iona
l ban
d sa
lary
leve
ls fo
r bla
ck m
ales
and
fe
mal
es :
• Le
vel 1
5 - 1
6 :
Bla
ck m
ales
– 7
.89%
; Bl
ack
fem
ales
– 0
.00%
;
• Le
vel 1
3 - 1
4 :
Bla
ck m
ales
– 1
0.53
%; B
lack
fem
ales
– 2
.63%
;
• Le
vel
9 -
12
: Bl
ack
mal
es –
18.
42%
; Bla
ck fe
mal
es –
15.
79%
;
• Le
vel
5 –
8
: Bl
ack
mal
es –
15.
79%
; Bla
ck fe
mal
es –
18.
42%
;
• Le
vel
2 –
4
: Bl
ack
mal
es -
2.6
3%;
Bla
ck fe
mal
es –
2.6
3%;
• Le
vel 1
:
Bla
ck m
ales
– 0
.00%
; Bl
ack
fem
ales
0.0
0%
ChangeAhead
ANNUAL REPORT 2012/13 ROAD TRAFFIC INFRINGEMENT AGENCY 33
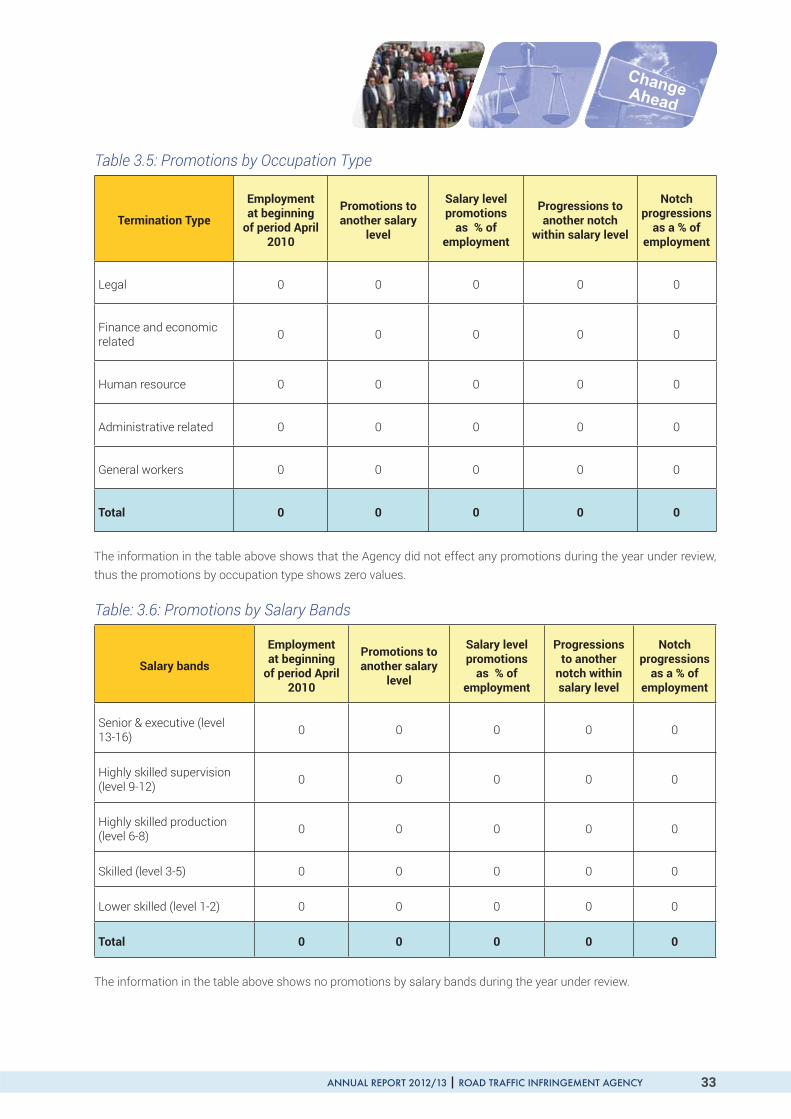
Table 3.5: Promotions by Occupation Type
Termination Type
Employment at beginning
of period April 2010
Promotions to another salary
level
Salary level promotions
as % of employment
Progressions to another notch
within salary level
Notchprogressions
as a % of employment
Legal 0 0 0 0 0
Finance and economic related 0 0 0 0 0
Human resource 0 0 0 0 0
Administrative related 0 0 0 0 0
General workers 0 0 0 0 0
Total 0 0 0 0 0
The information in the table above shows that the Agency did not effect any promotions during the year under review, thus the promotions by occupation type shows zero values.
Table: 3.6: Promotions by Salary Bands
Salary bands
Employment at beginning
of period April 2010
Promotions to another salary
level
Salary level promotions
as % of employment
Progressionsto another
notch within salary level
Notchprogressions
as a % of employment
Senior & executive (level 13-16) 0 0 0 0 0
Highly skilled supervision (level 9-12) 0 0 0 0 0
Highly skilled production (level 6-8) 0 0 0 0 0
Skilled (level 3-5) 0 0 0 0 0
Lower skilled (level 1-2) 0 0 0 0 0
Total 0 0 0 0 0
The information in the table above shows no promotions by salary bands during the year under review.

ANNUAL REPORT 2012/13 ROAD TRAFFIC INFRINGEMENT AGENCY34
Table 3.7: Performance Rewards by Race, Gender and Disability
Demographics Number of Bene ciaries
Total Employment
Percentage of Total
EmploymentCost (R’000) Average cost
per Bene ciary
African Female 0 0 0 0 0
African Male 0 0 0 0 0
Asian Female 0 0 0 0 0
Asian Male 0 0 0 0 0
Coloured Female 0 0 0 0 0
Coloured Male 0 0 0 0 0
Total Blacks Female 0 0 0 0 0
Total Blacks Male 0 0 0 0 0
White Female 0 0 0 0 0
White Male 0 0 0 0 0
Employment with disability 0 0 0 0 0
TOTAL 0 0 0 0 0
Given the serious nancial constraints experienced by the Agency during the year under review, there has not been any performance rewards whatsoever given to the staff, thus zero values are indicated on all categories above.
ChangeAhead
ANNUAL REPORT 2012/13 ROAD TRAFFIC INFRINGEMENT AGENCY 35
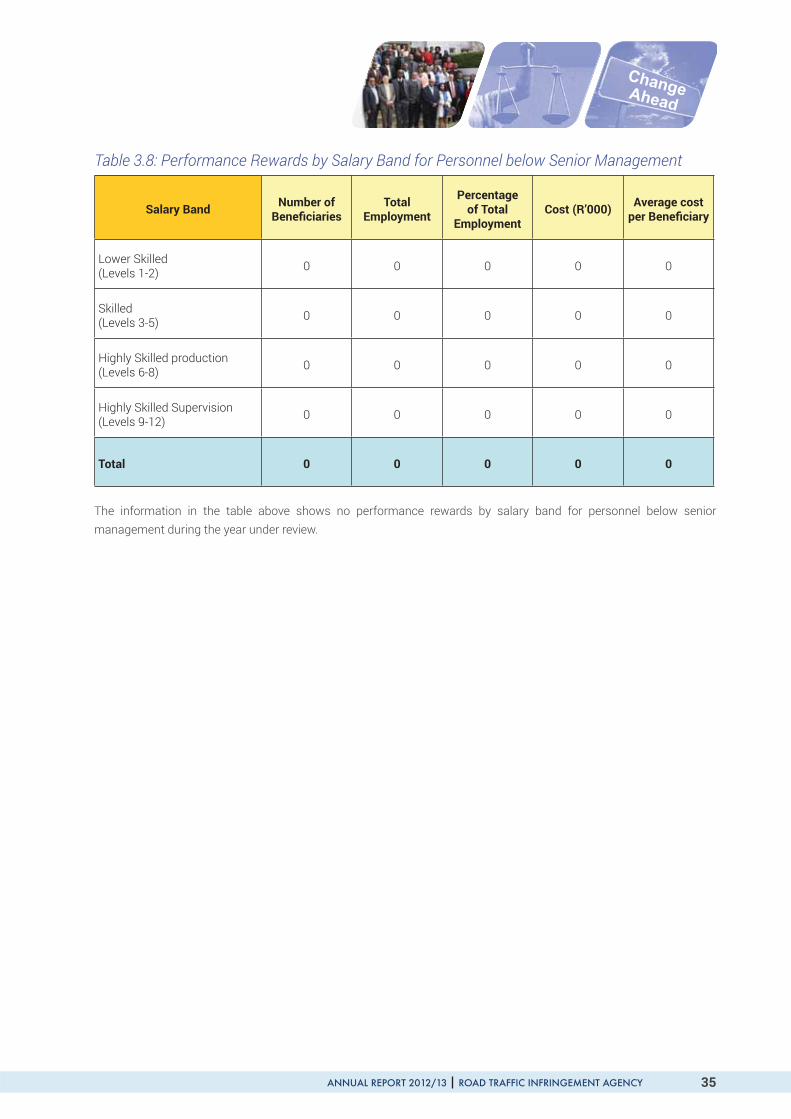
Table 3.8: Performance Rewards by Salary Band for Personnel below Senior Management
Salary Band Number of Bene ciaries
Total Employment
Percentage of Total
EmploymentCost (R’000) Average cost
per Bene ciary
Lower Skilled (Levels 1-2) 0 0 0 0 0
Skilled(Levels 3-5) 0 0 0 0 0
Highly Skilled production (Levels 6-8) 0 0 0 0 0
Highly Skilled Supervision (Levels 9-12) 0 0 0 0 0
Total 0 0 0 0 0
The information in the table above shows no performance rewards by salary band for personnel below senior management during the year under review.

ANNUAL REPORT 2012/13 ROAD TRAFFIC INFRINGEMENT AGENCY36
Tabl
e 3.
9: T
erm
inat
ions
Occ
upat
iona
l Ban
dsM
ale
Afric
anM
ale
Colo
ured
Mal
eIn
dian
Mal
eTB
Mal
eW
hite
Fem
ale
Afric
anFe
mal
eCo
lour
edFe
mal
eIn
dian
Fem
ale
Tota
l BFe
mal
eW
hite
Tota
l
L 15
-16
Top
Man
agem
ent P
erm
anen
t0
00
00
00
00
00
L13-
14 S
enio
r Man
agem
ent P
erm
anen
t0
00
00
00
00
00
L9-1
2 Pr
ofes
sion
ally
qua
li e
d an
d ex
perie
nced
sp
ecia
lists
and
mid
-man
agem
ent P
erm
anen
t0
00
00
10
01
01
L5-8
Ski
lled
tech
nica
l and
aca
dem
ical
ly q
uali
ed
wor
kers
, jun
ior m
anag
emen
t, su
perv
isor
s fo
rem
en p
erm
anen
t1
00
10
00
00
01
L2-4
Sem
i-ski
lled
and
disc
retio
nary
dec
isio
n m
akin
g Pe
rman
ent
00
00
00
00
00
0
L 1
Elem
enta
ry o
ccup
atio
ns0
00
00
00
00
00
Tota
l1
00
10
10
01
02
The
info
rmat
ion
in th
e ta
ble
abov
e sh
ows
a to
tal o
f 2 s
ervi
ce te
rmin
atio
ns, a
s fo
llow
s:
• Af
rican
mal
e:
1 a
t lev
el 5
– 8
; and
• Af
rican
fem
ale:
1 a
t lev
el 9
– 1
2.

ChangeAhead
ANNUAL REPORT 2012/13 ROAD TRAFFIC INFRINGEMENT AGENCY 37
Tabl
e 3.
10: R
easo
ns w
hy s
taff
is le
avin
g th
e Ag
ency
Term
inat
ion
type
Num
ber
Perc
enta
ge o
f Tot
al
Resi
gnat
ions
Perc
enta
ge o
f Tot
al
Empl
oym
ent
Tota
l sta
ff c
ompl
imen
t
Deat
h Pe
rman
ent
00
038
Resi
gnat
ion
Perm
anen
t2
100%
5.00
%38
Expi
ry o
f con
trac
t Per
man
ent
00
038
Tran
sfer
s Pe
rman
ent
00
038
Retir
emen
t Per
man
ent
00
038
TOTA
L2
100%
5.00
%38
The
info
rmat
ion
in th
e ta
ble
abov
e sh
ows
2 (5
.00%
) per
man
ent s
taff
resi
gnat
ions
dur
ing
the
year
und
er re
view
.

ANNUAL REPORT 2012/13 ROAD TRAFFIC INFRINGEMENT AGENCY38
Tabl
e 3.
11: G
rant
ing
of E
mpl
oyee
Initi
ated
Sev
eran
ce P
acka
ges
Term
inat
ion
type
Num
ber
Perc
enta
ge o
f Tot
al
Resi
gnat
ions
Perc
enta
ge o
f Tot
al
Empl
oym
ent
Tota
l
Low
er S
kille
d (S
alar
y Le
vel 1
-2)
00
00
Skill
ed(S
alar
y Le
vel 3
-5)
00
00
Hig
hly
Skill
ed P
rodu
ctio
n (S
alar
y Le
vel 6
-8)
00
00
Hig
hly
Skill
ed P
rodu
ctio
n (S
alar
y Le
vel 9
-12)
00
00
Seni
or M
anag
emen
t (S
alar
y Le
vel 1
3 an
d H
ighe
r0
00
0
TOTA
L0
00
0
The
info
rmat
ion
in th
e ta
ble
abov
e sh
ows
no g
rant
ing
of e
mpl
oyee
initi
ated
sev
eran
ce p
acka
ges
durin
g th
e ye
ar u
nder
revi
ew.
Ther
e w
ere
no la
bour
dis
pute
s ex
perie
nced
by
the
Agen
cy fo
r the
per
iod
unde
r rev
iew
and
the
Agen
cy u
ses
a pr
oact
ive
appr
oach
of e
ngag
ing
with
its
staf
f, th
us th
e le
vel
of s
taff
mor
ale
and
satis
fact
ion
is c
onsi
dere
d to
be
high
des
pite
the
nan
cial
con
stra
ints
.

ChangeAhead
ANNUAL REPORT 2012/13 ROAD TRAFFIC INFRINGEMENT AGENCY 39
Infringements Performance Report
ANNUAL REPORT 2012/13 ROAD TRAFFIC INFRINGEMENT AGENCY40
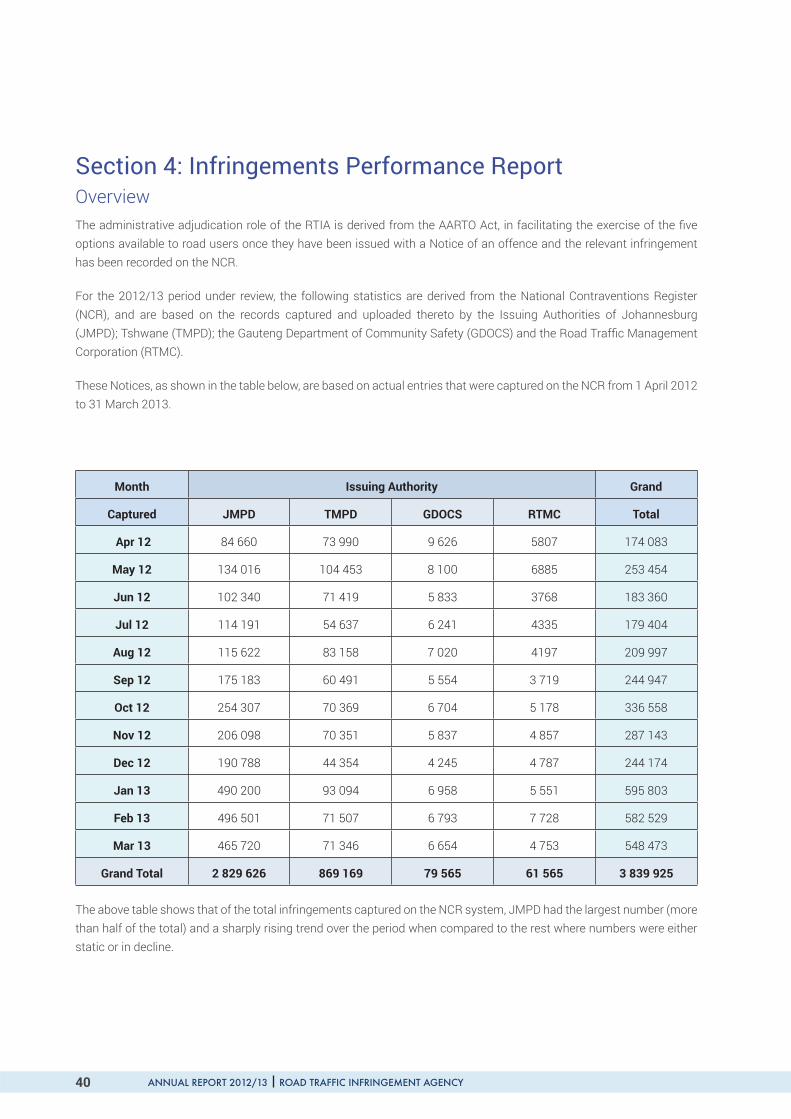
Section 4: Infringements Performance Report OverviewThe administrative adjudication role of the RTIA is derived from the AARTO Act, in facilitating the exercise of the ve options available to road users once they have been issued with a Notice of an offence and the relevant infringement has been recorded on the NCR.
For the 2012/13 period under review, the following statistics are derived from the National Contraventions Register (NCR), and are based on the records captured and uploaded thereto by the Issuing Authorities of Johannesburg (JMPD); Tshwane (TMPD); the Gauteng Department of Community Safety (GDOCS) and the Road Traf c Management Corporation (RTMC).
These Notices, as shown in the table below, are based on actual entries that were captured on the NCR from 1 April 2012 to 31 March 2013.
Number of All Notices captured per Issuing Authority 2012 -2013
Month Issuing Authority Grand
Captured JMPD TMPD GDOCS RTMC Total
Apr 12 84 660 73 990 9 626 5807 174 083
May 12 134 016 104 453 8 100 6885 253 454
Jun 12 102 340 71 419 5 833 3768 183 360
Jul 12 114 191 54 637 6 241 4335 179 404
Aug 12 115 622 83 158 7 020 4197 209 997
Sep 12 175 183 60 491 5 554 3 719 244 947
Oct 12 254 307 70 369 6 704 5 178 336 558
Nov 12 206 098 70 351 5 837 4 857 287 143
Dec 12 190 788 44 354 4 245 4 787 244 174
Jan 13 490 200 93 094 6 958 5 551 595 803
Feb 13 496 501 71 507 6 793 7 728 582 529
Mar 13 465 720 71 346 6 654 4 753 548 473
Grand Total 2 829 626 869 169 79 565 61 565 3 839 925
The above table shows that of the total infringements captured on the NCR system, JMPD had the largest number (more than half of the total) and a sharply rising trend over the period when compared to the rest where numbers were either static or in decline.

ChangeAhead
ANNUAL REPORT 2012/13 ROAD TRAFFIC INFRINGEMENT AGENCY 41
A schematic representation of the notices captured per Issuing Authority per month is given in the graph below.
The total number of Notices captured per month on the NCR by all the Issuing Authorities is reflected in the graph below.

ANNUAL REPORT 2012/13 ROAD TRAFFIC INFRINGEMENT AGENCY42
The number of all Notices and corresponding percentages captured per Issuing Authority are also reflected in the graph below.
The above pie-chart shows the percentage contribution by each Issuing Authority to the Notices captured on the NCR during the 2012/2013 nancial year and this information illustrates the dominant position of the JMPD in the total volume of transactions captured.
The change in the number of Notices captured per Issuing Authority from the 2011-2012 to the 2012-2013 nancial year is shown in the table and schematically reflected in the graph below.
Change in the Number of All Notices captured per Issuing Authority
Year Issuing Authority Grand
Captured JMPD TMPD GDOCS RTMC Total
2011-2012 870 886 799 168 72 386 45 077 1 787 517
2012-2013 2 829 626 869 169 79 565 61 565 3 839 925
Change 1 958 740 70 001 7 179 16 488 2 052 408
% Change 224.91% 8.76% 9.92% 36.58% 114.82%

ChangeAhead
ANNUAL REPORT 2012/13 ROAD TRAFFIC INFRINGEMENT AGENCY 43
The information in the table and pie chart above shows the following changes in the number of Notices captured per Issuing Authority from 2011-2012 to 2012-2013:
• JMPD: an increase of 224.91% from 870 886 to 2 829 626 Notices;
• TMPD: an increase of 8.76% from 799 168 to 869 169 Notices;
• GDoCS: an increase of 9.92% from 72 386 to 79 565 Notices;
• RTMC: an increase of 36.58% from 45 077 to 61 565 Notices; and
• All issuing Authorities: an increase of 2 052 508 (114.82%) from 1 787 517 to 3 839 925 notices.

ANNUAL REPORT 2012/13 ROAD TRAFFIC INFRINGEMENT AGENCY44
The number of AARTO 01 Infringement Notices captured per Issuing Authority is shown in the table and schematically reflected in the graphs below.
Number of AARTO 01 Notices captured per Issuing Authority
Month Issuing Authority Grand
Captured JMPD TMPD GDOCS RTMC Total
Apr 12 38 802 22 514 7 965 4777 74 058
May 12 44 229 35 605 6 766 5763 92 363
Jun 12 30 729 27 529 4 749 3223 66 230
Jul 12 46 115 21 876 5 012 3582 76 585
Aug 12 45 010 23 806 5 584 3364 77 764
Sep 12 50 916 18 429 4 436 3 091 76 872
Oct 12 56 601 19 755 5 441 4 420 86 217
Nov 12 50 296 27 969 5 057 4 143 87 465
Dec 12 32 077 14 628 3 765 4 088 54 558
Jan 13 47 179 35 537 5 887 4 652 93 255
Feb 13 35 227 23 575 5 686 6 581 71 069
Mar 13 35 464 23 193 5 628 3 908 68 193
Grand Total 512 645 294 416 65 976 51 592 924 629

ChangeAhead
ANNUAL REPORT 2012/13 ROAD TRAFFIC INFRINGEMENT AGENCY 45
The change in the number of AARTO 01 Notices captured per Issuing Authority from the 2011-2012 to the 2012-2013 nancial years is shown in the table and schematically reflected in the graph below.
Change in No. of AARTO 01 Notices captured per Issuing Authority
Year Issuing Authority Grand
Captured JMPD TMPD GDOCS RTMC Total
2011-2012 445 923 296 413 58 705 36 993 838 034
2012-2013 512 645 294 416 65 976 51 592 924 629
Change 66 722 -1 997 7 271 14 599 86 595
% Change 14.96% -0.67% 12.39% 39.46% 10.33%
The information above shows the following changes in the number of AARTO 01 Notices captured per Issuing Authority from 2011-2012 to 2012-2013:
• JMPD: an increase of 14.96% from 445 923 to 512 645 Notices;
• TMPD: a decrease of 0.67% from 296 413 to 294 416 Notices;
• GDoCS: an increase of 12.39% from 58 705 to 65 976 Notices; and
• RTMC: an increase of 39.46% from 36 993 to 51 592 Notices.
The number of AARTO 03 Infringement Notices captured per Issuing Authority is shown in the table and schematically reflected in the graphs below.

ANNUAL REPORT 2012/13 ROAD TRAFFIC INFRINGEMENT AGENCY46
Number of AARTO 03 Notices captured per Issuing Authority
Month Issuing Authority Grand
Captured JMPD TMPD GDOCS RTMC Total
Apr 12 35 082 30 045 70 0 65 197
May 12 63 517 40 289 74 0 103 880
Jun 12 47 224 26 634 41 0 73 899
Jul 12 45 506 16 116 85 0 61 707
Aug 12 47 213 40 860 99 0 88 172
Sep 12 71 291 22 629 66 0 93 986
Oct 12 120 901 26 249 59 0 147 209
Nov 12 103 807 11 512 55 0 115 374
Dec 12 116 263 12 759 37 0 129 059
Jan 13 396 750 24 867 95 0 421 712
Feb 13 388 362 25 327 100 0 413 789
Mar 13 370 865 12 108 86 0 383 059
Grand Total 1 806 781 289 395 867 0 2 097 043

ChangeAhead
ANNUAL REPORT 2012/13 ROAD TRAFFIC INFRINGEMENT AGENCY 47
The change in the number of AARTO 03 Notices captured per Issuing Authority from the 2011-2012 to the 2012-2013 nancial years is shown in the table and schematically reflected in the graph below.
Change in No. of AARTO 03 Notices captured per Issuing Authority
Year Issuing Authority Grand
Captured JMPD TMPD GDOCS RTMC Total
2011-2012 356 695 252 163 498 0 609 356
2012-2013 1 806 781 289 395 867 0 2 097 043
Change 1 450 086 37 232 369 0 1 487 687
% Change 406.53% 14.77% 74.10% - 244.14%

ANNUAL REPORT 2012/13 ROAD TRAFFIC INFRINGEMENT AGENCY48
The information above shows the following changes in the number of AARTO 03 Notices captured per Issuing Authority from 2011-2012 to 2012-2013:
• JMPD: an increase of 406.53% from 356 695 to 1 806 781 Notices;
• TMPD: an increase of 14.77% from 252 163 to 289 395 Notices; and
• GDOCS: an increase of 74.10% from 498 to 867 Notices
• RTMC: no AARTO 03 Notices captured.

ChangeAhead
ANNUAL REPORT 2012/13 ROAD TRAFFIC INFRINGEMENT AGENCY 49
Infringements Capturing Trends
Number of Notices captured per Issuing Authority - Excluding AARTO 03 Notices
Month Issuing Authority Grand
Captured JMPD TMPD GDOCS RTMC Total
Apr 12 49 578 43 945 9 556 5 807 108 886
May 12 70 499 64 164 8 026 6 885 149 574
Jun 12 55 116 44 785 5 792 3 768 109 461
Jul 12 68 685 38 521 6 156 4 335 117 697
Aug 12 68 409 42 298 6 921 4 197 121 825
Sep 12 103 892 37 862 5 488 3 719 150 961
Oct 12 133 406 44 120 6 645 5 178 189 349
Nov 12 102 291 58 839 5 782 4 857 171 769
Dec 12 74 525 31 595 4 208 4 787 115 115
Jan 13 93 450 68 227 6 863 5 551 174 091
Feb 13 108 139 46 180 6 693 7 728 168 740
Mar 13 94 855 59 238 6 568 4 753 165 414
Grand Total 1 022 845 579 774 78 698 61 565 1 742 882
The table and graph above shows the trends noticed in the capturing of the issued Infringement Notices, excluding AARTO 03 Notices:

ANNUAL REPORT 2012/13 ROAD TRAFFIC INFRINGEMENT AGENCY50
JMPD captured the highest number of Notices in October 2012 (133 406), followed by February 2013 (108 139). The lowest number of notices captured was in April (49 578) and June 2012 (55 116).
TMPD captured their highest number of Notices in January 2013 (68 227) followed by May 2012 (64 164). Their lowest numbers of Infringements captured were in September (37 862) and December 2012 (31 595).
GDOCS captured their highest number of Infringements in April (9 556) and May 2012 (8 026). Their lowest numbers of infringements captured were in September (5 488) and December 2012 (4 208).
RTMC captured their highest number of Infringements in February 2013 (7 728) and May 2012 (6 885). Their lowest numbers of Infringements were captured in June (3 768) and September 2012 (3 719).
The table on AARTO 01 Notices and the graph below shows the trends noticed in the capturing of the issued AARTO 01 Infringement Notices:
JMPD captured the highest number of Notices in September (50 916) and October 2013 (56 601). The lowest number of Notices captured was in June (30 729) and December 2012 (32 077). JMPD’s monthly average was 42 720 AARTO 01 Notices.
• TMPD captured their highest number of Notices in May 2012 (35 605) followed by January 2013 (35 537). Their lowest numbers of infringements captured were in September (18 429) and December 2012 (14 628). TMPD’s monthly average was 24 535 AARTO 01 Notices.
• GDOCS captured their highest number of Infringements in April (7 965) and May 2012 (6 766). Their lowest numbers of Infringements captured were in September (4 436) and December 2013 (3 765). Their monthly average was 5 498 AARTO 01 Notices.
• RTMC captured their highest number of Infringements in May 2012 (5 763) and February 2013 (6 581). Their lowest numbers of Infringements were captured in June (3 223) and September 2012 (3 091). RTMC’s monthly average was 4 299 AARTO 01 Notices.
ChangeAhead
ANNUAL REPORT 2012/13 ROAD TRAFFIC INFRINGEMENT AGENCY 51
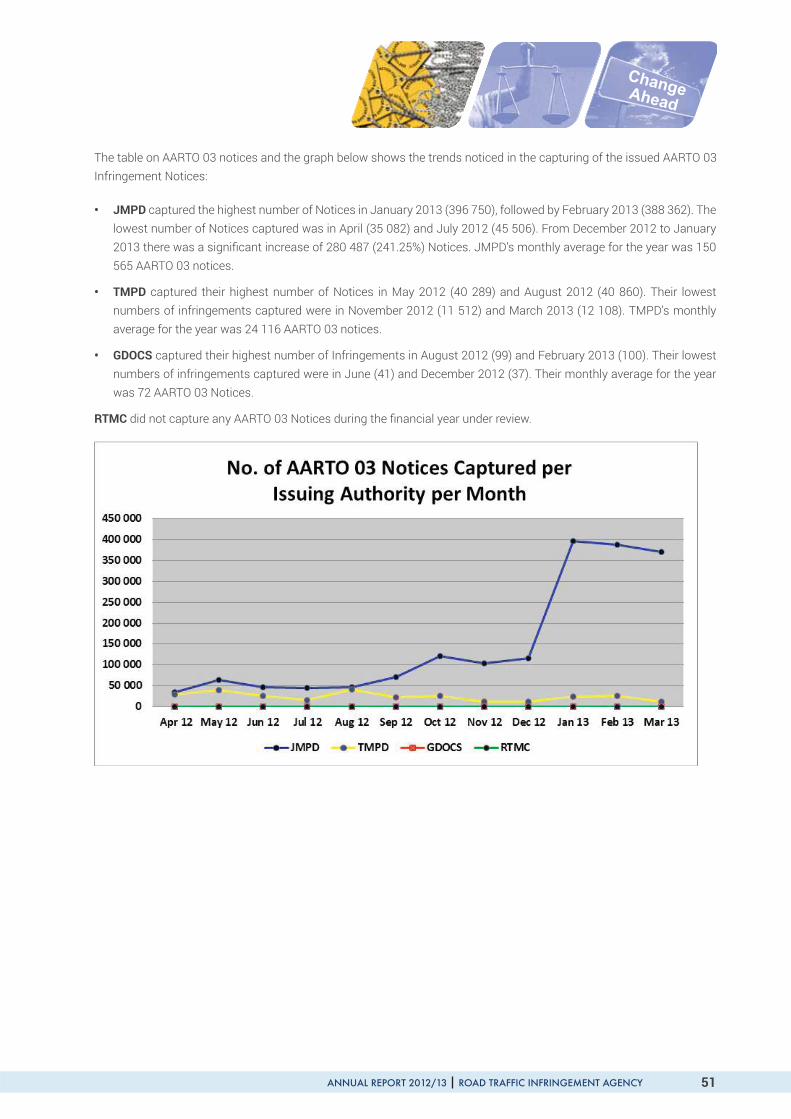
The table on AARTO 03 notices and the graph below shows the trends noticed in the capturing of the issued AARTO 03 Infringement Notices:
• JMPD captured the highest number of Notices in January 2013 (396 750), followed by February 2013 (388 362). The lowest number of Notices captured was in April (35 082) and July 2012 (45 506). From December 2012 to January 2013 there was a signi cant increase of 280 487 (241.25%) Notices. JMPD’s monthly average for the year was 150 565 AARTO 03 notices.
• TMPD captured their highest number of Notices in May 2012 (40 289) and August 2012 (40 860). Their lowest numbers of infringements captured were in November 2012 (11 512) and March 2013 (12 108). TMPD’s monthly average for the year was 24 116 AARTO 03 notices.
• GDOCS captured their highest number of Infringements in August 2012 (99) and February 2013 (100). Their lowest numbers of infringements captured were in June (41) and December 2012 (37). Their monthly average for the year was 72 AARTO 03 Notices.
RTMC did not capture any AARTO 03 Notices during the nancial year under review.

ANNUAL REPORT 2012/13 ROAD TRAFFIC INFRINGEMENT AGENCY52
Infringements Captured per type (All Issuing Authorities)In order to have a clearer picture of the performance of the various Issuing Authorities, infringements captured are disaggregated and tabulated below per type as follows: Handwritten, Camera, Operator, as well as other Notices processed. The tabulation and graph below represents the total number of Notices captured by all Issuing Authorities.
Number of Notices Captured by Type: All Issuing Authorities
MonthCaptured AARTO 01 AARTO 03 AARTO 31 Operator
infringementsNominations
Served Offences Total
Apr 12 74 058 65 197 24 291 8 486 2 012 39 174 083
May 12 92 363 103 880 43 724 10 002 3 395 90 253 454
Jun 12 66 230 73 899 33 742 7 212 2 220 57 183 360
Jul 12 76 585 61 707 30 268 8 382 2 398 64 179 404
Aug 12 77 764 88 172 33 337 8 477 2 202 45 209 997
Sep 12 76 872 93 986 62 342 7 991 3 651 105 244 947
Oct 12 86 217 147 209 90 942 7 614 4 517 59 336 558
Nov 12 87 465 115 374 70 513 7 698 6 063 30 287 143
Dec 12 54 558 129 059 50 755 4 982 4 801 19 244 174
Jan 13 93 255 421 712 69 069 7 723 3 980 64 595 803
Feb 13 71 069 413 789 85 969 7 341 4 260 101 582 529
Mar 13 68 193 383 059 86 661 6 525 3 978 57 548 473
Total 924 629 2 097 043 681 613 92 433 43 477 730 3 839 925
The table below shows the change from 2011-2012 to 2012-2013 in the total number of Notices captured by all Issuing Authorities.
Change in Number of all Notices Captured : All Issuing Authorities
Year Captured AARTO 01 AARTO 03 AARTO 31 Operator
infringementsNominations
Served Offences Total
2011-2012 838 034 609 356 228 960 100 118 10 962 87 1 787 517
2012-2013 924 629 2 097 043 681 613 92 433 43 477 730 3 839 925
Change 86 595 1 487 687 452 653 -7 685 32 515 643 2 052 408
% Change 10.33% 244.14% 197.70% -7.68% 296.62% 739.08% 114.82%
Infringements Captured per type (All Issuing Authorities)The information in table above indicates as follows:
• AARTO 01 Notices : increased by 86 595 (10.33%) to 924 629;
• AARTO 03 Notices : increased by 1 487 687 (244.14%) to 2 097 043;

ChangeAhead
ANNUAL REPORT 2012/13 ROAD TRAFFIC INFRINGEMENT AGENCY 53
• AARTO 31 Notices : increased by 452 653 (197.70%) to 681 613;
• Operator infringements : decreased by 7 685 (7.68%) to 92 433;
• Nominations served : increased by 32 515 (296.62%) to 43 477; and
• Offences: increased by 643 (739.08%) to 730.
The graph below represents the total number of Notices captured by all Issuing Authorities during 2012-2013.

ANNUAL REPORT 2012/13 ROAD TRAFFIC INFRINGEMENT AGENCY54
Johannesburg Metropolitan Police Department (JMPD)The table and graph below is a representation of the infringements captured by JMPD per infringement type.
Number of Notices Captured by Johannesburg Metropolitan Police Department (JMPD)
MonthCaptured AARTO 01 AARTO 03 AARTO 31 Operator
infringementsNominations
Served Offences Total
Apr 12 38 802 35 082 7 097 3 564 76 39 84 660
May 12 44 229 63 517 20 723 4 589 868 90 134 016
Jun 12 30 729 47 224 20 400 3 067 863 57 102 340
Jul 12 46 115 45 506 17 333 4 465 708 64 114 191
Aug 12 45 010 47 213 18 666 4 111 577 45 115 622
Sep 12 50 916 71 291 45 925 4 389 2557 105 175 183
Oct 12 56 601 120 901 70 471 3 826 2449 59 254 307
Nov 12 50 296 103 807 44 868 3 399 3698 30 206 098
Dec 12 32 077 116 263 36 769 2 236 3424 19 190 788
Jan 13 47 179 396 750 41 232 2 283 2692 64 490 200
Feb 13 35 227 388 362 66 857 2 590 3 364 101 496 501
Mar 13 35 464 370 865 53 351 2 467 3 516 57 465 720
Total 512 645 1 806 781 443 692 40 986 24 792 730 2 829 626
The table below shows the change from 2011-2012 to 2012-2013 in the total number of notices captured by JMPD.
Change in Number of all Notices Captured by JMPD
Year Captured AARTO 01 AARTO 03 AARTO 31 Operator
infringementsNominations
Served Offences Total
2011-2012 445 923 356 695 19 775 47 253 1 153 87 870 886
2012-2013 512 645 1 806 781 443 692 40 986 24 792 730 2 829 626
Change 66 722 1 450 086 423 917 -6 267 23 639 643 1 958 740
% Change 14.96% 406.53% 2143.70% -13.26% 2050.22% 739.08% 224.91%
The information in the table above indicates as follows:
• AARTO 01 Notices : increased by 66 722 (14.96%) to 512 645;
• AARTO 03 Notices : increased by 1 450 086 (406.53%) to 1 806 781;
• AARTO 31 Notices : increased by 423 917 (2 143.70%) to 443 692;
• Operator infringements : decreased by 6 267 (13.26%) to 40 986;

ChangeAhead
ANNUAL REPORT 2012/13 ROAD TRAFFIC INFRINGEMENT AGENCY 55
• Nominations served : increased by 23 639 (2 050.22%) to 24 792; and
• Offences: increased by 643 (739.08%) to 730.
The graph below represents the total number of Notices captured by JMPD during 2012-2013.
Based on the number of Notices captured against speci c of cers on the NCR, the table below shows the average number of Notices per type of notice, captured by JMPD per of cer per month.
Average No. of Notices Captured per O cer per Month : JMPD
Month capturedNumber of Notices
AARTO 01 AARTO 03 AARTO 01 & 03
Apr-12 25.80 128.04 41.55
May-12 28.76 218.27 58.91
Jun-12 19.72 178.88 42.78
Jul-12 28.79 177.76 49.31
Aug-12 27.89 187.35 49.42
Sep-12 30.65 271.07 63.52
Oct-12 34.43 436.47 92.40
Nov-12 31.95 387.34 83.66
Dec-12 21.43 435.44 84.09
Jan-13 31.79 1 401.94 251.23
Feb-13 22.80 1 454.54 233.77
Mar-13 23.00 1 437.46 225.74
Average 27.32 561.11 105.51

ANNUAL REPORT 2012/13 ROAD TRAFFIC INFRINGEMENT AGENCY56
The information in the table above indicates the following:
• AARTO 01 Notices: the highest number of Notices captured per Of cer per month was for October 2012 (average 34.43 Notices per Of cer). The lowest number of Notices captured per Of cer per month was for June 2012 (average 19.72 Notices per Of cer). The monthly average for the year was 27.32 Notices;
• AARTO 03 Notices: the highest number of Notices captured per Of cer per month was for February 2013 (average 1 454.54 Notices per Of cer). The lowest number of Notices captured per Of cer per month was for April 2012 (average 128.04 notices per of cer). The monthly average for the year was 561.11 notices; and
• AARTO 01 and 03 notices combined: the highest number of notices captured per of cer per month was for January 2013 (average 251.23 notices per of cer). The lowest number of notices captured per of cer per month was for April 2012 (average 41.55 notices per of cer).
The information in the table is also reflected in the graph below.

ChangeAhead
ANNUAL REPORT 2012/13 ROAD TRAFFIC INFRINGEMENT AGENCY 57
Tshwane Metropolitan Police Department (TMPD)The table and graph below is a representation of the infringements captured by TMPD per infringement type.
Number of Notices Captured by Tshwane Metropolitan Police Department (TMPD)
MonthCaptured AARTO 01 AARTO 03 AARTO 31 Operator
infringementsNominations
Served Offences Total
Apr 12 22 514 30 045 17 194 2 301 1936 0 73 990
May 12 35 605 40 289 23 001 3 031 2 527 0 104 453
Jun 12 27 529 26 634 13 342 2 557 1357 0 71 419
Jul 12 21 876 16 116 12 935 2 020 1690 0 54 637
Aug 12 23 806 40 860 14 671 2 196 1 625 0 83 158
Sep 12 18 429 22 629 16 417 1 922 1094 0 60 491
Oct 12 19 755 26 249 20 471 1 826 2068 0 70 369
Nov 12 27 969 11 512 25 645 2 860 2365 0 70 351
Dec 12 14 628 12 759 13 986 1 604 1377 0 44 354
Jan 13 35 537 24 867 27 837 3 565 1288 0 93 094
Feb 13 23 575 25 327 19 112 2 597 896 0 71 507
Mar 13 23 193 12 108 33 310 2 273 462 0 71 346
Total 294 416 289 395 237 921 28 752 18 685 0 869 169
The table below shows the change from 2011-2012 to 2012-2013 in the total number of notices captured by TMPD.
Change in Number of all Notices Captured by TMPD
Year Cap-tured AARTO 01 AARTO 03 AARTO 31 Operator in-
fringementsNominations
Served Offences Total
2011-2012 296 413 252 163 209 185 31 598 9 809 0 799 168
2012-2013 294 416 289 395 237 921 28 752 18 685 0 869 169
Change -1 997 37 232 28 736 -2 846 8 876 0 70 001
% Change -0.67% 14.77% 13.74% -9.01% 90.49% - 8.76%
The information in the table above indicates as follows:
• AARTO 01 notices : decreased by 1 997 (0.67%) to 294 416;
• AARTO 03 notices : increased by 37 232 (14.77%) to 289 395;
• AARTO 31 notices : increased by 28 736 (13.74%) to 237 921;
• Operator infringements : decreased by 2 846 (9.01%) to 28 752;
• Nominations served : increased by 8 876 (90.49%) to 18 685; and
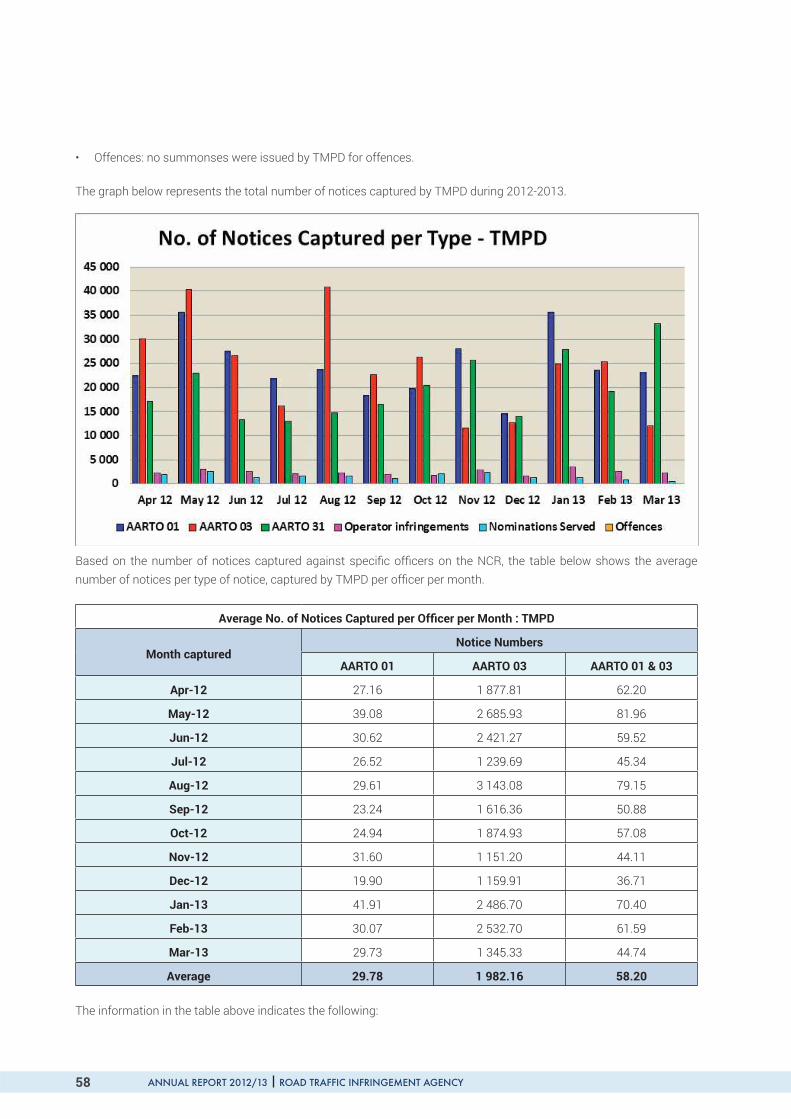
ANNUAL REPORT 2012/13 ROAD TRAFFIC INFRINGEMENT AGENCY58
• Offences: no summonses were issued by TMPD for offences.
The graph below represents the total number of notices captured by TMPD during 2012-2013.
Based on the number of notices captured against speci c of cers on the NCR, the table below shows the average number of notices per type of notice, captured by TMPD per of cer per month.
Average No. of Notices Captured per O cer per Month : TMPD
Month capturedNotice Numbers
AARTO 01 AARTO 03 AARTO 01 & 03
Apr-12 27.16 1 877.81 62.20
May-12 39.08 2 685.93 81.96
Jun-12 30.62 2 421.27 59.52
Jul-12 26.52 1 239.69 45.34
Aug-12 29.61 3 143.08 79.15
Sep-12 23.24 1 616.36 50.88
Oct-12 24.94 1 874.93 57.08
Nov-12 31.60 1 151.20 44.11
Dec-12 19.90 1 159.91 36.71
Jan-13 41.91 2 486.70 70.40
Feb-13 30.07 2 532.70 61.59
Mar-13 29.73 1 345.33 44.74
Average 29.78 1 982.16 58.20
The information in the table above indicates the following:

ChangeAhead
ANNUAL REPORT 2012/13 ROAD TRAFFIC INFRINGEMENT AGENCY 59
• AARTO 01 Notices: the highest number of Notices captured per Of cer per month was for January 2013 (average 41.91 Notices per Of cer). The lowest number of Notices captured per Of cer per month was for December 2012 (on average 19.90 Notices per Of cer). The monthly average for the year was 29.78 Notices;
• AARTO 03 Notices: the highest number of Notices captured per Of cer per month was for August 2012 (average 3 143.08 Notices per Of cer). The lowest number of Notices captured per Of cer per month was for November 2012 (average 1 151.20 Notices per Of cer). The monthly average for the year was 1 982.16 Notices per Of cer; and
• AARTO 01 and 03 Notices combined: the highest number of Notices captured per Of cer per month was for May 2012 (average 81.96 Notices per Of cer). The lowest number of Notices captured per Of cer per month was for December 2012 (average 36.71 Notices per Of cer).
The information in the table is also reflected in the graph below.

ANNUAL REPORT 2012/13 ROAD TRAFFIC INFRINGEMENT AGENCY60
Gauteng Department of Community Safety (GDoCS)The table and graph below is a representation of the infringements captured by GDoCS per infringement type.
Number of Notices Captured by Gauteng Department of Community Safety (GDoCS)
MonthCaptured AARTO 01 AARTO 03 AARTO 31 Operator in-
fringementsNominations
Served Offences Total
Apr 12 7 965 70 0 1 591 0 0 9 626
May 12 6 766 74 0 1 260 0 0 8 100
Jun 12 4 749 41 0 1 043 0 0 5 833
Jul 12 5 012 85 0 1 144 0 0 6 241
Aug 12 5 584 99 0 1 337 0 0 7 020
Sep 12 4 436 66 0 1 052 0 0 5 554
Oct 12 5 441 59 0 1 204 0 0 6 704
Nov 12 5 057 55 0 725 0 0 5 837
Dec 12 3 765 37 0 443 0 0 4 245
Jan 13 5 887 95 0 976 0 0 6 958
Feb 13 5 686 100 0 1 007 0 0 6 793
Mar 13 5 628 86 0 940 0 0 6 654
Total 65 976 867 0 12 722 0 0 79 565
The table below shows the change from 2011-2012 to 2012-2013 in the total number of notices captured by GDoCS.
Change in Number of all Notices Captured by GDoCS
Year Captured AARTO 01 AARTO 03 AARTO 31 Operator
infringementsNominations
Served Offences Total
2011-2012 58 705 498 0 13 183 0 0 72 386
2012-2013 65 976 867 0 12 722 0 0 79 565
Change 7 271 369 0 -461 0 0 7 179
% Change 12.39% 74.10% - -3.50% - - 9.92%
The information in the table above indicates as follows:
• AARTO 01 notices : increased by 7 271 (12.39%) to 65 976;
• AARTO 03 notices : increased by 369 (74.10%) to 867;
• AARTO 31 notices : no notices were captured;
• Operator infringements : decreased by 461 (3.50%) to 12 722;

ChangeAhead
ANNUAL REPORT 2012/13 ROAD TRAFFIC INFRINGEMENT AGENCY 61
• Nominations served : no nominations were captured; and
• Offences: no offences were captured.
The graph below represents the total number of notices captured by GDoCS during 2012-2013.
Based on the number of notices captured against speci c of cers on the NCR, the table below shows the average number of notices per type of notice, captured by GDoCS per of cer per month.
Average No. of Notices Captured per O cer per Month : GDoCS
Month capturedNotice Numbers
AARTO 01 AARTO 03 AARTO 01 & 03
Apr-12 46.58 6.36 44.15
May-12 41.26 10.57 40.00
Jun-12 31.24 5.86 30.13
Jul-12 32.76 8.50 31.27
Aug-12 34.90 9.00 33.23
Sep-12 28.25 7.33 27.12
Oct-12 34.01 6.56 32.54
Nov-12 31.61 7.86 30.61
Dec-12 25.97 4.11 24.69
Jan-13 34.43 10.56 33.23
Feb-13 35.32 12.50 34.24
Mar-13 34.96 8.60 33.42
Average 34.45 8.10 33.06
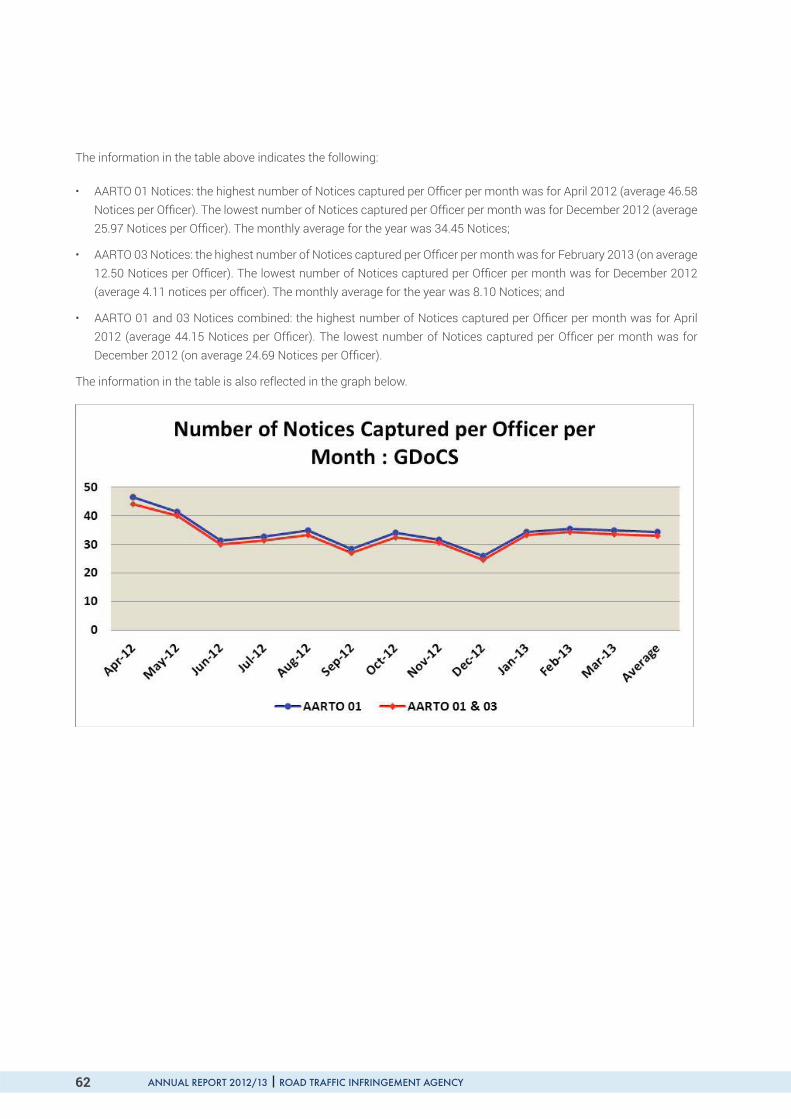
ANNUAL REPORT 2012/13 ROAD TRAFFIC INFRINGEMENT AGENCY62
The information in the table above indicates the following:
• AARTO 01 Notices: the highest number of Notices captured per Of cer per month was for April 2012 (average 46.58 Notices per Of cer). The lowest number of Notices captured per Of cer per month was for December 2012 (average 25.97 Notices per Of cer). The monthly average for the year was 34.45 Notices;
• AARTO 03 Notices: the highest number of Notices captured per Of cer per month was for February 2013 (on average 12.50 Notices per Of cer). The lowest number of Notices captured per Of cer per month was for December 2012 (average 4.11 notices per of cer). The monthly average for the year was 8.10 Notices; and
• AARTO 01 and 03 Notices combined: the highest number of Notices captured per Of cer per month was for April 2012 (average 44.15 Notices per Of cer). The lowest number of Notices captured per Of cer per month was for December 2012 (on average 24.69 Notices per Of cer).
The information in the table is also reflected in the graph below.

ChangeAhead
ANNUAL REPORT 2012/13 ROAD TRAFFIC INFRINGEMENT AGENCY 63
Road Traf c Management Corporation (RTMC)The table and graph below is a representation of the infringements captured by the RTMC per infringement notice type.
Number of Notices Captured by Road Tra c Management Corporation (RTMC)
MonthCaptured AARTO 01 AARTO 03 AARTO 31 Operator in-
fringementsNominations
Served Offences Total
Apr 12 4 777 0 0 1 030 0 0 5 807
May 12 5 763 0 0 1 122 0 0 6 885
Jun 12 3 223 0 0 545 0 0 3 768
Jul 12 3 582 0 0 753 0 0 4 335
Aug 12 3 364 0 0 833 0 0 4 197
Sep 12 3 091 0 0 628 0 0 3 719
Oct 12 4 420 0 0 758 0 0 5 178
Nov 12 4 143 0 0 714 0 0 4 857
Dec 12 4 088 0 0 699 0 0 4 787
Jan 13 4 652 0 0 899 0 0 5 551
Feb 13 6 581 0 0 1 147 0 0 7 728
Mar 13 3 908 0 0 845 0 0 4 753
Total 51 592 0 0 9 973 0 0 61 565
The table below shows the change from 2011-2012 to 2012-2013 in the total number of notices captured by RTMC.
Change in Number of all Notices Captured by RTMC
Year Captured AARTO 01 AARTO 03 AARTO 31 Operator
infringementsNominations
Served Offences Total
2011-2012 36 993 0 0 8 084 0 0 45 077
2012-2013 51 592 0 0 9 973 0 0 61 565
Change 14 599 0 0 1 889 0 0 16 488
% Change 39.46% - - 23.37% - - 36.58%
Note : It should be noted that the National Traf c Police unit of the RTMC only commenced with enforcement operations during September 2011.
The information in the table above indicates as follows:
• AARTO 01 Notices : increased by 14 599 (39.46%) to 51 592;
• AARTO 03 Notices : no notices were captured;
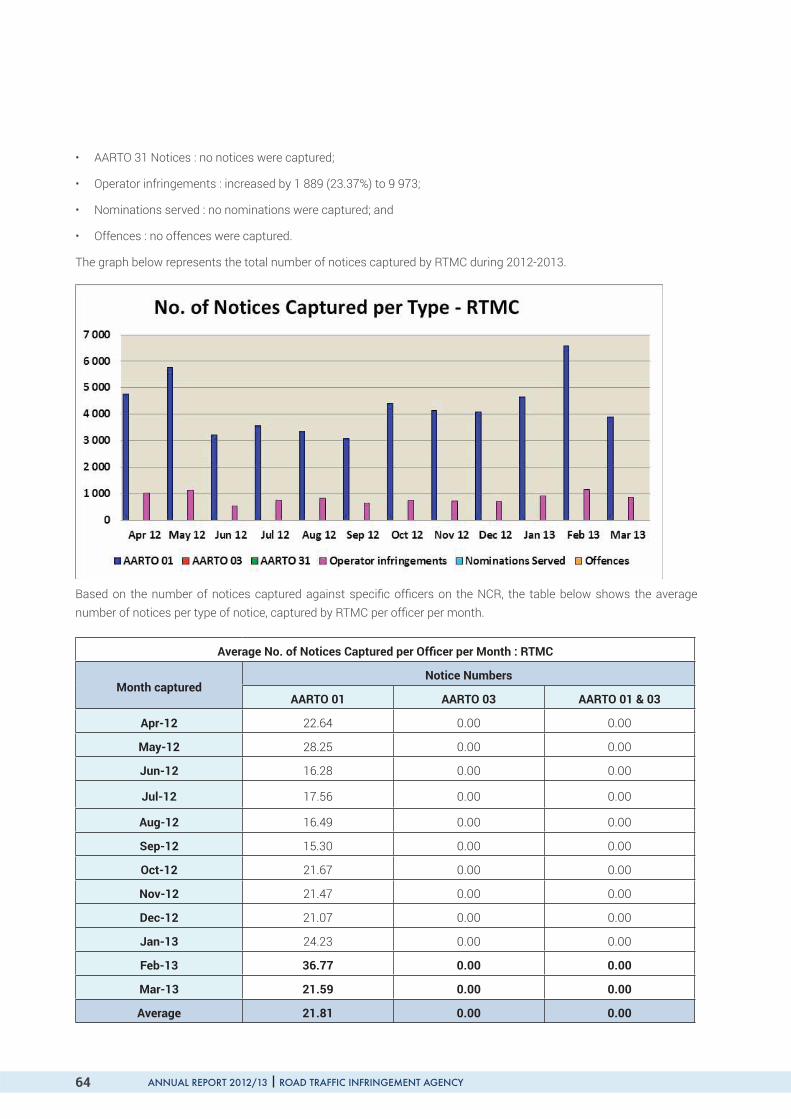
ANNUAL REPORT 2012/13 ROAD TRAFFIC INFRINGEMENT AGENCY64
• AARTO 31 Notices : no notices were captured;
• Operator infringements : increased by 1 889 (23.37%) to 9 973;
• Nominations served : no nominations were captured; and
• Offences : no offences were captured.
The graph below represents the total number of notices captured by RTMC during 2012-2013.
Based on the number of notices captured against speci c of cers on the NCR, the table below shows the average number of notices per type of notice, captured by RTMC per of cer per month.
Average No. of Notices Captured per O cer per Month : RTMC
Month capturedNotice Numbers
AARTO 01 AARTO 03 AARTO 01 & 03
Apr-12 22.64 0.00 0.00
May-12 28.25 0.00 0.00
Jun-12 16.28 0.00 0.00
Jul-12 17.56 0.00 0.00
Aug-12 16.49 0.00 0.00
Sep-12 15.30 0.00 0.00
Oct-12 21.67 0.00 0.00
Nov-12 21.47 0.00 0.00
Dec-12 21.07 0.00 0.00
Jan-13 24.23 0.00 0.00
Feb-13 36.77 0.00 0.00
Mar-13 21.59 0.00 0.00
Average 21.81 0.00 0.00

ChangeAhead
ANNUAL REPORT 2012/13 ROAD TRAFFIC INFRINGEMENT AGENCY 65
The information in the table above indicates the following:
• AARTO 01 Notices: the highest number of Notices captured per Of cer per month was for February 2013 (average 36.77 Notices per Of cer). The lowest number of Notices captured per Of cer per month was for September 2012 (average 15.30 Notices per Of cer). The monthly average for the year was 21.81 Notices per Of cer; and
• AARTO 03 Notices: no Notices were captured.
The information in the table is also reflected in the graph below.
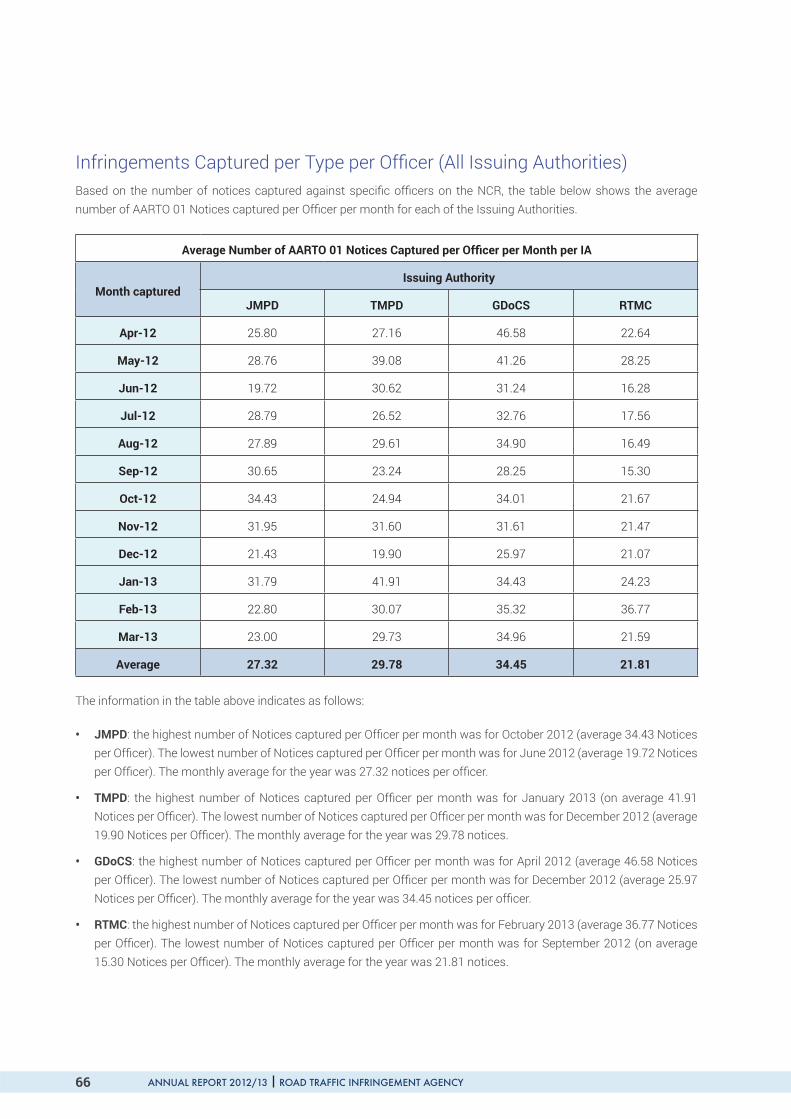
ANNUAL REPORT 2012/13 ROAD TRAFFIC INFRINGEMENT AGENCY66
Infringements Captured per Type per Of cer (All Issuing Authorities)Based on the number of notices captured against speci c of cers on the NCR, the table below shows the average number of AARTO 01 Notices captured per Of cer per month for each of the Issuing Authorities.
Average Number of AARTO 01 Notices Captured per O cer per Month per IA
Month capturedIssuing Authority
JMPD TMPD GDoCS RTMC
Apr-12 25.80 27.16 46.58 22.64
May-12 28.76 39.08 41.26 28.25
Jun-12 19.72 30.62 31.24 16.28
Jul-12 28.79 26.52 32.76 17.56
Aug-12 27.89 29.61 34.90 16.49
Sep-12 30.65 23.24 28.25 15.30
Oct-12 34.43 24.94 34.01 21.67
Nov-12 31.95 31.60 31.61 21.47
Dec-12 21.43 19.90 25.97 21.07
Jan-13 31.79 41.91 34.43 24.23
Feb-13 22.80 30.07 35.32 36.77
Mar-13 23.00 29.73 34.96 21.59
Average 27.32 29.78 34.45 21.81
The information in the table above indicates as follows:
• JMPD: the highest number of Notices captured per Of cer per month was for October 2012 (average 34.43 Notices per Of cer). The lowest number of Notices captured per Of cer per month was for June 2012 (average 19.72 Notices per Of cer). The monthly average for the year was 27.32 notices per of cer.
• TMPD: the highest number of Notices captured per Of cer per month was for January 2013 (on average 41.91 Notices per Of cer). The lowest number of Notices captured per Of cer per month was for December 2012 (average 19.90 Notices per Of cer). The monthly average for the year was 29.78 notices.
• GDoCS: the highest number of Notices captured per Of cer per month was for April 2012 (average 46.58 Notices per Of cer). The lowest number of Notices captured per Of cer per month was for December 2012 (average 25.97 Notices per Of cer). The monthly average for the year was 34.45 notices per of cer.
• RTMC: the highest number of Notices captured per Of cer per month was for February 2013 (average 36.77 Notices per Of cer). The lowest number of Notices captured per Of cer per month was for September 2012 (on average 15.30 Notices per Of cer). The monthly average for the year was 21.81 notices.

ChangeAhead
ANNUAL REPORT 2012/13 ROAD TRAFFIC INFRINGEMENT AGENCY 67
Infringements Captured per Type per Of cer (All Issuing Authorities)The information in the table above is also schematically shown in the graph below.
Based on the number of AARTO 01 Notices captured against speci c Of cers on the NCR, and assuming an average of 20 working days per of cer per month, the table below shows the average number of AARTO 01 Notices captured per of cer per day for the various Issuing Authorities.
Average No. of AARTO 01 Notices Captured per O cer per Day
Month capturedIssuing Authority
JMPD TMPD GDoCS RTMC
Apr-12 1.29 1.36 2.33 1.13
May-12 1.44 1.95 2.06 1.41
Jun-12 0.99 1.53 1.56 0.81
Jul-12 1.44 1.33 1.64 0.88
Aug-12 1.39 1.48 1.75 0.82
Sep-12 1.53 1.16 1.41 0.77
Oct-12 1.72 1.25 1.70 1.08
Nov-12 1.60 1.58 1.58 1.07
Dec-12 1.07 1.00 1.30 1.05
Jan-13 1.59 2.10 1.72 1.21
Feb-13 1.14 1.50 1.77 1.84
Mar-13 1.15 1.49 1.75 1.08
Average 1.37 1.49 1.72 1.09

ANNUAL REPORT 2012/13 ROAD TRAFFIC INFRINGEMENT AGENCY68
The information in the table above indicates as follows:
• JMPD: the highest number of Notices captured per Of cer per day was during October 2012 (average 1.72 Notices per Of cer). The lowest number of Notices captured per Of cer per day was during June 2012 (average 0.99 Notices per Of cer). The average for the year was 1.37 Notices per Of cer per day.
• TMPD: the highest number of Notices captured per Of cer per day was during January 2013 (on average 2.10 Notices per Of cer). The lowest number of Notices captured per Of cer per day was during December 2012 (average 1.00 Notices per Of cer). The average for the year was 1.49 notices per of cer per day.
• GDoCS: the highest number of Notices captured per Of cer per day was during May 2012 (average 2.06 Notices per Of cer). The lowest number of Notices captured per Of cer per day was during December 2012 (average 1.30 Notices per Of cer). The daily average for the year was 1.72 Notices per Of cer.
RTMC: the highest number of notices captured per of cer per day was for February 2013 (average 1.84 notices per of cer). The lowest number of notices captured per of cer per month was for September 2012 (on average 0.77 notices per of cer). The average for the year was 1.09 notices per of cer per day.
The information in the table above is also schematically shown in the graph below.

ChangeAhead
ANNUAL REPORT 2012/13 ROAD TRAFFIC INFRINGEMENT AGENCY 69
Based on the number of notices captured against speci c of cers on the NCR, the table below shows the average number of AARTO 01 and AARTO 03 Notices captured per Of cer per month for each of the Issuing Authorities.
Average Number of AARTO 01 & 03 Notices Captured per O cer per Month
Month capturedIssuing Authority
JMPD TMPD GDoCS
Apr-12 41.55 62.20 44.15
May-12 58.91 81.96 40.00
Jun-12 42.78 59.52 30.13
Jul-12 49.31 45.34 31.27
Aug-12 49.42 79.15 33.23
Sep-12 63.52 50.88 27.12
Oct-12 92.40 57.08 32.54
Nov-12 83.66 44.11 30.61
Dec-12 84.09 36.71 24.69
Jan-13 251.23 70.40 33.23
Feb-13 233.77 61.59 34.24
Mar-13 225.74 44.74 33.42
Average 105.51 58.20 33.06
The information in the table above indicates as follows:
• JMPD: the highest number of Notices captured per Of cer per month was for January 2013 (average 251.23 Notices per Of cer). The lowest number of Notices captured per Of cer per month was for April 2012 (average 41.55 Notices per Of cer). The monthly average for the year was 105.51 notices per of cer.
• TMPD: the highest number of Notices captured per Of cer per month was for May 2012 (on average 81.96 Notices per Of cer). The lowest number of Notices captured per Of cer per month was for December 2012 (average 36.71 Notices per Of cer). The monthly average for the year was 58.20 notices.
• GDoCS: the highest number of Notices captured per Of cer per month was for April 2012 (average 44.15 Notices per Of cer). The lowest number of Notices captured per Of cer per month was for December 2012 (average 24.69 Notices per Of cer). The monthly average for the year was 33.06 Notices per Of cer.
Because the RTMC did not issue AARTO 03 Notices, they were not included in the table above.

ANNUAL REPORT 2012/13 ROAD TRAFFIC INFRINGEMENT AGENCY70
The information in the table above is also schematically shown in the graph below.
Based on the number of Notices captured against speci c Of cers on the NCR, the table below shows the average number of AARTO 03 Notices captured per Of cer in the AARTO 03 team per month for each of the Issuing Authorities.
Average Number of AARTO 03 Notices Captured per AARTO 03 Team O cer per Month
Month capturedIssuing Authority
JMPD TMPD GDoCS
Apr-12 128.04 1 877.81 6.36
May-12 218.27 2 685.93 10.57
Jun-12 178.88 2 421.27 5.86
Jul-12 177.76 1 239.69 8.50
Aug-12 187.35 3 143.08 9.00
Sep-12 271.07 1 616.36 7.33
Oct-12 436.47 1 874.93 6.56
Nov-12 387.34 1 151.20 7.86
Dec-12 435.44 1 159.91 4.11
Jan-13 1 401.94 2 486.70 10.56
Feb-13 1 454.54 2 532.70 12.50
Mar-13 1 437.46 1 345.33 8.60
Average 561.11 1 982.16 8.10

ChangeAhead
ANNUAL REPORT 2012/13 ROAD TRAFFIC INFRINGEMENT AGENCY 71
The information in the table above indicates as follows:
• JMPD: the highest number of notices captured per of cer per month was for February 2013 (average 1 454.54 notices per of cer). The lowest number of notices captured per of cer per month was for April 2012 (average 128.04 notices per of cer). The monthly average for the year was 561.11 notices per of cer.
• TMPD: the highest number of notices captured per of cer per month was for August 2012 (on average 3 143.08 notices per of cer). The lowest number of notices captured per of cer per month was for November 2012 (average 1 151.20 notices per of cer). The monthly average for the year was 1 982.16 notices per of cer.
• GDoCS: the highest number of notices captured per of cer per month was for February 2013 (average 12.50 notices per of cer). The lowest number of notices captured per of cer per month was for December 2012 (average 4.11 notices per of cer). The monthly average for the year was 8.10 notices per of cer.
The information in the table above is also schematically shown in the graph below.

ANNUAL REPORT 2012/13 ROAD TRAFFIC INFRINGEMENT AGENCY72
The information in the table and graph below shows the % of of cers per Issuing Authority that issued the number of AARTO 01 Notices within the “number of notices” group per month for each authority.
Notice % O cers per Issuing Authority
Group JMPD TMPD GDoCS RTMC
1 - 10 39.14% 36.26% 25.12% 26.08%
11 - 20 21.71% 17.74% 18.17% 32.21%
21 - 30 12.81% 13.01% 15.56% 21.26%
31 - 40 8.36% 9.39% 10.34% 11.50%
41 - 50 5.37% 6.69% 8.62% 4.18%
51 - 60 3.50% 5.28% 5.74% 2.07%
61 - 70 2.71% 3.38% 4.18% 1.31%
71 - 80 1.80% 2.34% 2.87% 0.55%
81 - 90 1.40% 1.56% 1.88% 0.25%
91 - 100 0.98% 1.02% 1.93% 0.25%
>100 2.23% 3.34% 5.59% 0.34%
The information above indicates that:
• JMPD :
An average of 39.14% of cers issued between 1 and 10 AARTO 01 Notices per month;
An average of 12.81% of cers issued between 21 and 30 AARTO 01 Notices per month;
An average of 1.80% of cers issued between 71 and 80 AARTO 01 Notices per month.

ChangeAhead
ANNUAL REPORT 2012/13 ROAD TRAFFIC INFRINGEMENT AGENCY 73
• TMPD :
An average of 36.26% of cers issued between 1 and 10 AARTO 01 Notices per month;
An average of 13.01% of cers issued between 21 and 30 AARTO 01 Notices per month;
An average of 3.38% of cers issued between 61 and 70 AARTO 01 Notices per month.
• GDoCS :
An average of 25.12% of cers issued between 1 and 10 AARTO 01 Notices per month;
An average of 15.56% of cers issued between 21 and 30 AARTO 01 Notices per month;
An average of 2.87% of cers issued between 71 and 80 AARTO 01 Notices per month.
• RTMC :
An average of 26.08% of cers issued between 1 and 10 AARTO 01 Notices per month;
An average of 11.50% of cers issued between 31 and 0 AARTO 01 Notices per month;
An average of 0.55% of cers issued between 71 and 80 AARTO 01 Notices per month.
Infringements Captured per Vehicle Category (All Issuing Authorities)The table below is a representation of the infringements captured by all issuing authorities per vehicle category.
Number of Infringement Notices issued per Vehicle Category
MonthCaptured Li
ght
pass
enge
rve
hicl
es
Hea
vy
pass
enge
rve
hicl
es
Mot
orcy
cles
Ligh
t loa
d ve
hicl
es
Hea
vy lo
ad
vehi
cles
- dr
aw
Hea
vy lo
ad
vehi
cles
- no
t dra
w
Spec
ial,
unkn
own
& ot
her
vehi
cles
Tota
l N
otic
esCa
ptur
ed
Apr 12 68 882 6 145 450 14 107 580 271 83 648 174 083
May 12 111 055 7 647 662 24 160 994 458 108 478 253 454
Jun 12 81 671 5 835 543 15 950 740 310 78 311 183 360
Jul 12 81 127 10 732 628 18 111 1 818 859 66 129 179 404
Aug 12 127 807 25 191 1 039 34 541 4 798 2 049 14 572 209 997
Sep 12 130 851 24 225 1 308 40 620 5 213 2 115 40 615 244 947
Oct 12 192 540 25 855 1 492 53 307 5 807 2 569 54 988 336 558
Nov 12 162 928 26 033 1 538 48 287 6 183 2 672 39 502 287 143
Dec 12 145 900 21 168 1 110 37 969 4 429 1 768 31 830 244 174
Jan 13 403 905 48 641 3 015 76 356 6 107 2 699 55 080 595 803
Feb 13 379 738 46 038 2 985 77 635 6 323 2 612 67 198 582 529
Mar 13 368 939 38 963 2 841 70 861 5 364 2 419 59 086 548 473
Total 2 255 343 286 473 17 611 511 904 48 356 20 801 699 437 3 839 925
% 58.73% 7.46% 0.46% 13.33% 1.26% 0.54% 18.21% 100.00%

ANNUAL REPORT 2012/13 ROAD TRAFFIC INFRINGEMENT AGENCY74
The information in the table above indicates the following:
• A total of 2 255 343 (58.73% of all Notices) was issued for light passenger vehicles;
• 286 473 (7.46% of the Notices issued) was for heavy passenger vehicles; and
• 511 904 (13.33% of the Notices issued) was for light load vehicles; and
• 48 356 (1.26% of all Notices issued) was for heavy load vehicles – to draw (trucks).
The above information is also reflected in the graph below.
The table below shows the change from 2011-2012 to 2012-2013 in the total number of notices captured per vehicle category.
Number of Infringement Notices issued per Vehicle Category
MonthCaptured Li
ght
pass
enge
rve
hicl
es
Hea
vy
pass
enge
rve
hicl
es
Mot
orcy
cles
Ligh
t loa
d ve
hicl
es
Hea
vy lo
ad
vehi
cles
- dr
aw
Hea
vy lo
ad
vehi
cles
- no
t dr
aw
Spec
ial,
unkn
own
& ot
her v
ehic
les
Tota
l Not
ices
Ca
ptur
ed
2011-2012 687 407 121 143 3 512 181 432 13 847 7 304 772 872 1 787 517
2012-2013 2 255 343 286 473 17 611 511 904 48 356 20 801 699 437 3 839 925
Change 1 567 936 165 330 14 099 330 472 34 509 13 497 -73 435 2 052 408
% Change 228.09% 136.48% 401.45% 182.15% 249.22% 184.79% -9.50% 114.82%
The information in the table above shows that:
• The number of Notices for light passenger vehicles increased by 1 567 936 (228.09%) from a total of 687 407 during 2011-2012 to a total of 2 255 343 during 2012-2013;

ChangeAhead
ANNUAL REPORT 2012/13 ROAD TRAFFIC INFRINGEMENT AGENCY 75
• The number of Notices for heavy passenger vehicles increased by 165 330 (136.48%) from a total of 121 143 during 2011-2012 to a total of 286 473 during 2012-2013;
• The total number of Notices for motorcycles increased by 14 099 (401.45%) from a total of 3 512 during 2011-2012 to a total of 17 611 during 2012-2013;
• The number of notices for light load vehicles increased by 330 472 (182.15%) from a total of 181 432 during 2011-2012 to a total of 511 904 during 2012-2013; and
• The total number of Notices special, unknown and other vehicles decreased by 73 435 (9.50%) from a total of 772 872 during 2011-2012 to a total of 699 437 during 2012-2013. It also needs to be emphasised that in the 2011-2012 nancial year, this category of vehicles constituted 43.24% of the overall number of notices captured compared to
only 18.21% for 2012-2013.
The information in the table above is also schematically reflected in the graph below.
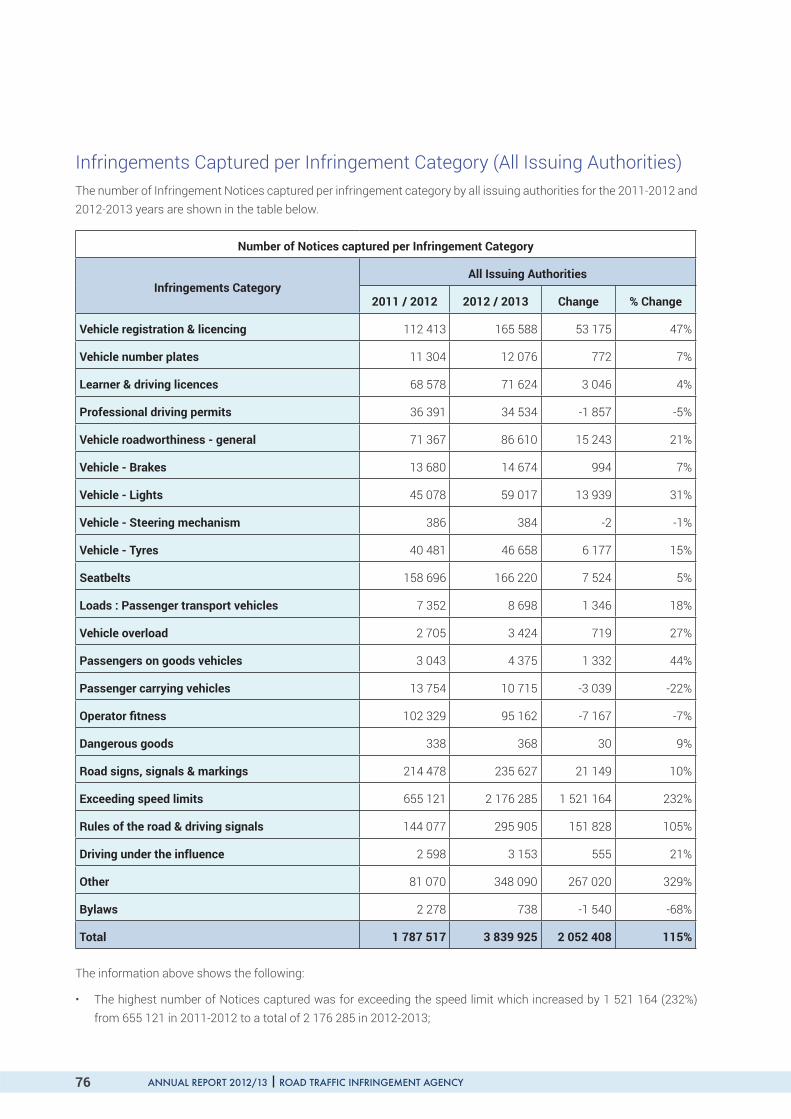
ANNUAL REPORT 2012/13 ROAD TRAFFIC INFRINGEMENT AGENCY76
Infringements Captured per Infringement Category (All Issuing Authorities)The number of Infringement Notices captured per infringement category by all issuing authorities for the 2011-2012 and 2012-2013 years are shown in the table below.
Number of Notices captured per Infringement Category
Infringements Category All Issuing Authorities
2011 / 2012 2012 / 2013 Change % Change
Vehicle registration & licencing 112 413 165 588 53 175 47%
Vehicle number plates 11 304 12 076 772 7%
Learner & driving licences 68 578 71 624 3 046 4%
Professional driving permits 36 391 34 534 -1 857 -5%
Vehicle roadworthiness - general 71 367 86 610 15 243 21%
Vehicle - Brakes 13 680 14 674 994 7%
Vehicle - Lights 45 078 59 017 13 939 31%
Vehicle - Steering mechanism 386 384 -2 -1%
Vehicle - Tyres 40 481 46 658 6 177 15%
Seatbelts 158 696 166 220 7 524 5%
Loads : Passenger transport vehicles 7 352 8 698 1 346 18%
Vehicle overload 2 705 3 424 719 27%
Passengers on goods vehicles 3 043 4 375 1 332 44%
Passenger carrying vehicles 13 754 10 715 -3 039 -22%
Operator tness 102 329 95 162 -7 167 -7%
Dangerous goods 338 368 30 9%
Road signs, signals & markings 214 478 235 627 21 149 10%
Exceeding speed limits 655 121 2 176 285 1 521 164 232%
Rules of the road & driving signals 144 077 295 905 151 828 105%
Driving under the in uence 2 598 3 153 555 21%
Other 81 070 348 090 267 020 329%
Bylaws 2 278 738 -1 540 -68%
Total 1 787 517 3 839 925 2 052 408 115%
The information above shows the following:
• The highest number of Notices captured was for exceeding the speed limit which increased by 1 521 164 (232%) from 655 121 in 2011-2012 to a total of 2 176 285 in 2012-2013;

ChangeAhead
ANNUAL REPORT 2012/13 ROAD TRAFFIC INFRINGEMENT AGENCY 77
• The number of Notices captured for rules of the road and driving signals increased by 151 828 (105%) from 144 077 in 2011-2012 to a total of 295 905 in 2012-2013; and
• The number of Notices captured for road signs, and signals and markings increased by 21 149 (10%) from 214 478 in 2011-2012 to a total of 235 627 in 2012-2013.
The percentage (%) of notices captured per infringement category for each of the 2011-2012 and 2012-2013 nancial years are reflected in the graph below, excluding notices for exceeding the speed limit.
The information in the graph above shows that, in terms of all notices captured:
• The % of Notices captured for road signs, signals and markings decreased from 18.94% in 2011-2012 to 14.16% in 2012-2013;
• The % of Notices captured for rules of the road and driving signals increased from 12.72% in 2011-2012 to 17.79% in 2012-2013; and
• The % of Notices captured for seatbelts decreased from 14.01% in 2011-2012 to 9.99% in 2012-2013.
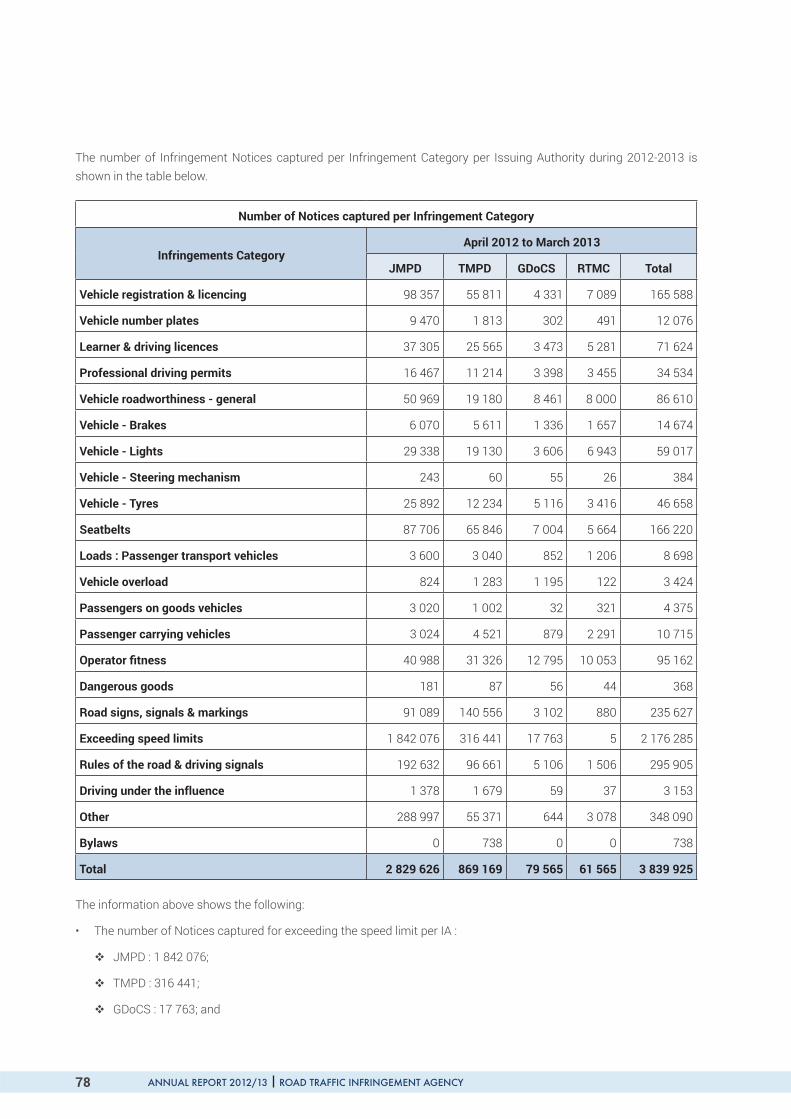
ANNUAL REPORT 2012/13 ROAD TRAFFIC INFRINGEMENT AGENCY78
The number of Infringement Notices captured per Infringement Category per Issuing Authority during 2012-2013 is shown in the table below.
Number of Notices captured per Infringement Category
Infringements Category April 2012 to March 2013
JMPD TMPD GDoCS RTMC Total
Vehicle registration & licencing 98 357 55 811 4 331 7 089 165 588
Vehicle number plates 9 470 1 813 302 491 12 076
Learner & driving licences 37 305 25 565 3 473 5 281 71 624
Professional driving permits 16 467 11 214 3 398 3 455 34 534
Vehicle roadworthiness - general 50 969 19 180 8 461 8 000 86 610
Vehicle - Brakes 6 070 5 611 1 336 1 657 14 674
Vehicle - Lights 29 338 19 130 3 606 6 943 59 017
Vehicle - Steering mechanism 243 60 55 26 384
Vehicle - Tyres 25 892 12 234 5 116 3 416 46 658
Seatbelts 87 706 65 846 7 004 5 664 166 220
Loads : Passenger transport vehicles 3 600 3 040 852 1 206 8 698
Vehicle overload 824 1 283 1 195 122 3 424
Passengers on goods vehicles 3 020 1 002 32 321 4 375
Passenger carrying vehicles 3 024 4 521 879 2 291 10 715
Operator tness 40 988 31 326 12 795 10 053 95 162
Dangerous goods 181 87 56 44 368
Road signs, signals & markings 91 089 140 556 3 102 880 235 627
Exceeding speed limits 1 842 076 316 441 17 763 5 2 176 285
Rules of the road & driving signals 192 632 96 661 5 106 1 506 295 905
Driving under the in uence 1 378 1 679 59 37 3 153
Other 288 997 55 371 644 3 078 348 090
Bylaws 0 738 0 0 738
Total 2 829 626 869 169 79 565 61 565 3 839 925
The information above shows the following:
• The number of Notices captured for exceeding the speed limit per IA :
JMPD : 1 842 076;
TMPD : 316 441;
GDoCS : 17 763; and

ChangeAhead
ANNUAL REPORT 2012/13 ROAD TRAFFIC INFRINGEMENT AGENCY 79
RTMC : 5.
• The number of Notices captured for vehicle tyres per IA :
JMPD : 25 892;
TMPD : 12 234;
GDoCS : 5 116; and
RTMC: 3 416.
The number of Infringement Notices captured per infringement category by JMPD is shown in the table below.
Number of Notices captured per Infringement Category
Infringements Category JMPD
2011 / 2012 2012 / 2013 Change % Change
Vehicle registration & licencing 47 810 98 357 50 547 106%
Vehicle number plates 7 807 9 470 1 663 21%
Learner & driving licences 33 516 37 305 3 789 11%
Professional driving permits 18 058 16 467 -1 591 -9%
Vehicle roadworthiness - general 40 200 50 969 10 769 27%
Vehicle - Brakes 5 525 6 070 545 10%
Vehicle - Lights 19 758 29 338 9 580 48%
Vehicle - Steering mechanism 294 243 -51 -17%
Vehicle - Tyres 20 753 25 892 5 139 25%
Seatbelts 80 303 87 706 7 403 9%
Loads : Passenger transport vehicles 2 844 3 600 756 27%
Vehicle overload 769 824 55 7%
Passengers on goods vehicles 1 999 3 020 1 021 51%
Passenger carrying vehicles 5 420 3 024 -2 396 -44%
Operator tness 47 240 40 988 -6 252 -13%
Dangerous goods 179 181 2 1%
Road signs, signals & markings 63 707 91 089 27 382 43%
Exceeding speed limits 370 271 1 842 076 1 471 805 397%
Rules of the road & driving signals 54 082 192 632 138 550 256%
Driving under the in uence 943 1 378 435 46%
Other 49 408 288 997 239 589 485%
Bylaws 0 0 0 -
Total 870 886 2 829 626 1 958 740 225%
The information above shows that:

ANNUAL REPORT 2012/13 ROAD TRAFFIC INFRINGEMENT AGENCY80
• The number of Notices captured for exceeding speed limits increased by 1 471 805 (397%) from 370 271 in 2011-2012 to 1 842 076 in 2012-2013;
• The number of Notices captured for rules of the road and driving signals increased by 138 550 (256%) from 54 082 in 2011-2012 to 192 632 in 2012-2013; and
• The number of Notices captured for vehicle registration and licencing increased by 50 547 (106%) from 47 810 in 2011-2012 to 98 357 in 2012-2013.
The information in the graph above shows that, in terms of all notices captured:
• The % of Notices captured for learner and driving licences decreased from 6.69% in 2011-2012 to 3.78% in 2012-2013;
• The % of Notices captured for professional driving permits decreased from 3.61% in 2011-2012 to 1.67% in 2012-2013; and
• The % of Notices captured for seatbelts decreased from 16.04% in 2011-2012 to 8.88% in 2012-2013.

ChangeAhead
ANNUAL REPORT 2012/13 ROAD TRAFFIC INFRINGEMENT AGENCY 81
Infringements Captured per Infringement Category Tshwane Metropolitan Police Department (TMPD)
Number of Notices captured per Infringement Category
Infringements Category TMPD
2011 / 2012 2012 / 2013 Change % Change
Vehicle registration & licencing 55 412 55 811 399 1%
Vehicle number plates 2 691 1 813 -878 -33%
Learner & driving licences 27 920 25 565 -2 355 -8%
Professional driving permits 12 140 11 214 -926 -8%
Vehicle roadworthiness - general 18 251 19 180 929 5%
Vehicle - Brakes 5 612 5 611 -1 0%
Vehicle - Lights 18 571 19 130 559 3%
Vehicle - Steering mechanism 35 60 25 71%
Vehicle - Tyres 13 164 12 234 -930 -7%
Seatbelts 66 111 65 846 -265 0%
Loads : Passenger transport vehicles 3 116 3 040 -76 -2%
Vehicle overload 786 1 283 497 63%
Passengers on goods vehicles 830 1 002 172 21%
Passenger carrying vehicles 4 944 4 521 -423 -9%
Operator tness 33 717 31 326 -2 391 -7%
Dangerous goods 90 87 -3 -3%
Road signs, signals & markings 147 309 140 556 -6 753 -5%
Exceeding speed limits 271 298 316 441 45 143 17%
Rules of the road & driving signals 84 703 96 661 11 958 14%
Driving under the in uence 1 601 1 679 78 5%
Other 28 589 55 371 26 782 94%
Bylaws 2 278 738 -1 540 -68%
Total 799 168 869 169 70 001 9%
The information above shows that:
• The number of Notices captured for exceeding speed limits increased by 45 143 (17%) from 271 298 in 2011-2012 to 316 441 in 2012-2013;

ANNUAL REPORT 2012/13 ROAD TRAFFIC INFRINGEMENT AGENCY82
• The number of Notices captured for rules of the road and driving signals increased by 11 958 (14%) from 84 703 in 2011-2012 to 96 661 in 2012-2013; and
• The number of Notices captured for vehicle registration and licencing increased by 399 (1%) from 55 412 in 2011-2012 to 55 811 in 2012-2013.
Infringements Captured per Infringement Category
The information in the graph above shows that, in terms of all notices captured:
• The % of Notices captured for road signs, signals and markings decreased from 27.91% in 2011-2012 to 25.43% in 2012-2013;
• The % of Notices captured for professional driving permits decreased from 2.30% in 2011-2012 to 2.03% in 2012-2013; and
• The % of Notices captured for seatbelts decreased from 12.52% in 2011-2012 to 11.91% in 2012-2013.

ChangeAhead
ANNUAL REPORT 2012/13 ROAD TRAFFIC INFRINGEMENT AGENCY 83
Gauteng Department of Community Safety (GDoCS)
Number of Notices captured per Infringement Category
Infringements Category GDoCS
2011 / 2012 2012 / 2013 Change % Change
Vehicle registration & licencing 3 697 4 331 634 17%
Vehicle number plates 301 302 1 0%
Learner & driving licences 2 961 3 473 512 17%
Professional driving permits 3 054 3 398 344 11%
Vehicle roadworthiness - general 8 407 8 461 54 1%
Vehicle - Brakes 1 237 1 336 99 8%
Vehicle - Lights 2 691 3 606 915 34%
Vehicle - Steering mechanism 50 55 5 10%
Vehicle - Tyres 5 128 5 116 -12 0%
Seatbelts 7 261 7 004 -257 -4%
Loads : Passenger transport vehicles 759 852 93 12%
Vehicle overload 1 085 1 195 110 10%
Passengers on goods vehicles 42 32 -10 -24%
Passenger carrying vehicles 1 338 879 -459 -34%
Operator tness 13 229 12 795 -434 -3%
Dangerous goods 36 56 20 56%
Road signs, signals & markings 2 556 3 102 546 21%
Exceeding speed limits 13 551 17 763 4 212 31%
Rules of the road & driving signals 3 975 5 106 1 131 28%
Driving under the in uence 32 59 27 84%
Other 996 644 -352 -35%
Bylaws 0 0 0 -
Total 72 386 79 565 7 179 10%
The information above shows that:
• The number of Notices captured for exceeding speed limits increased by 4 212 (31%) from 13 551 in 2011-2012 to 17 763 in 2012-2013;
• The number of Notices captured for rules of the road and driving signals increased by 1 131 (28%) from 3 975 in 2011-2012 to 5 106 in 2012-2013; and

ANNUAL REPORT 2012/13 ROAD TRAFFIC INFRINGEMENT AGENCY84
• The number of Notices captured for vehicle registration and licencing increased by 634 (17%) from 3 697 in 2011-2012 to 4 331 in 2012-2013.
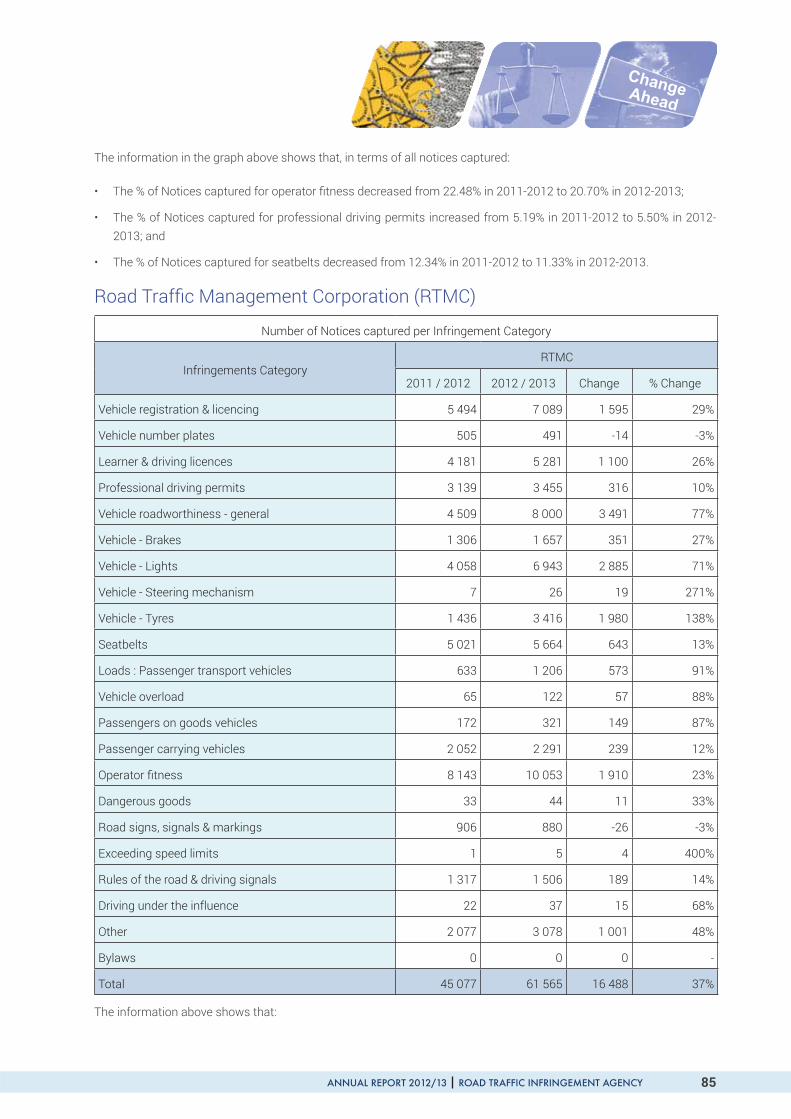
ChangeAhead
ANNUAL REPORT 2012/13 ROAD TRAFFIC INFRINGEMENT AGENCY 85
The information in the graph above shows that, in terms of all notices captured:
• The % of Notices captured for operator tness decreased from 22.48% in 2011-2012 to 20.70% in 2012-2013;
• The % of Notices captured for professional driving permits increased from 5.19% in 2011-2012 to 5.50% in 2012-2013; and
• The % of Notices captured for seatbelts decreased from 12.34% in 2011-2012 to 11.33% in 2012-2013.
Road Traf c Management Corporation (RTMC)
Number of Notices captured per Infringement Category
Infringements Category RTMC
2011 / 2012 2012 / 2013 Change % Change
Vehicle registration & licencing 5 494 7 089 1 595 29%
Vehicle number plates 505 491 -14 -3%
Learner & driving licences 4 181 5 281 1 100 26%
Professional driving permits 3 139 3 455 316 10%
Vehicle roadworthiness - general 4 509 8 000 3 491 77%
Vehicle - Brakes 1 306 1 657 351 27%
Vehicle - Lights 4 058 6 943 2 885 71%
Vehicle - Steering mechanism 7 26 19 271%
Vehicle - Tyres 1 436 3 416 1 980 138%
Seatbelts 5 021 5 664 643 13%
Loads : Passenger transport vehicles 633 1 206 573 91%
Vehicle overload 65 122 57 88%
Passengers on goods vehicles 172 321 149 87%
Passenger carrying vehicles 2 052 2 291 239 12%
Operator tness 8 143 10 053 1 910 23%
Dangerous goods 33 44 11 33%
Road signs, signals & markings 906 880 -26 -3%
Exceeding speed limits 1 5 4 400%
Rules of the road & driving signals 1 317 1 506 189 14%
Driving under the influence 22 37 15 68%
Other 2 077 3 078 1 001 48%
Bylaws 0 0 0 -
Total 45 077 61 565 16 488 37%
The information above shows that:

ANNUAL REPORT 2012/13 ROAD TRAFFIC INFRINGEMENT AGENCY86
• The number of Notices captured for vehicle tyres increased by 1 980 (138%) from 1 436 in 2011-2012 to 3 416 in 2012-2013;
• The number of Notices captured for rules of the road and driving signals increased by 189 (14%) from 1 317 in 2011-2012 to 1 506 in 2012-2013; and
• The number of Notices captured for vehicle registration and licencing increased by 1 595 (29%) from 5 494 in 2011-2012 to 7 089 in 2012-2013.
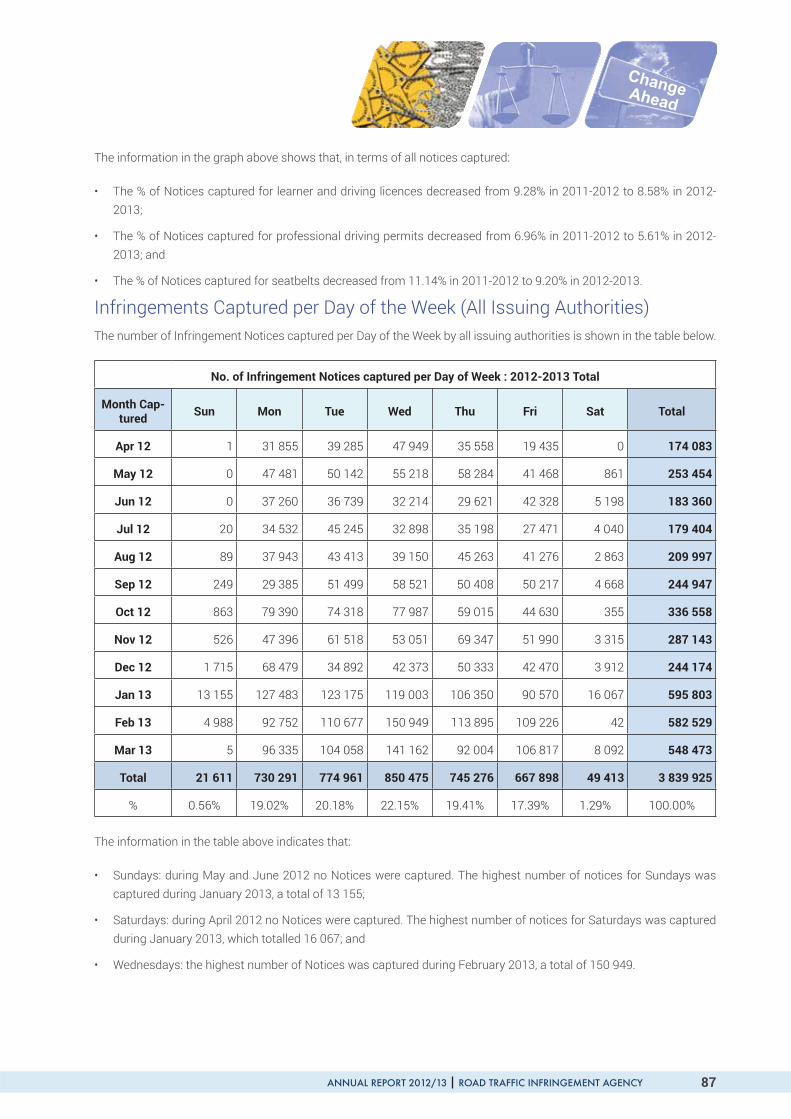
ChangeAhead
ANNUAL REPORT 2012/13 ROAD TRAFFIC INFRINGEMENT AGENCY 87
The information in the graph above shows that, in terms of all notices captured:
• The % of Notices captured for learner and driving licences decreased from 9.28% in 2011-2012 to 8.58% in 2012-2013;
• The % of Notices captured for professional driving permits decreased from 6.96% in 2011-2012 to 5.61% in 2012-2013; and
• The % of Notices captured for seatbelts decreased from 11.14% in 2011-2012 to 9.20% in 2012-2013.
Infringements Captured per Day of the Week (All Issuing Authorities)The number of Infringement Notices captured per Day of the Week by all issuing authorities is shown in the table below.
No. of Infringement Notices captured per Day of Week : 2012-2013 Total
Month Cap-tured Sun Mon Tue Wed Thu Fri Sat Total
Apr 12 1 31 855 39 285 47 949 35 558 19 435 0 174 083
May 12 0 47 481 50 142 55 218 58 284 41 468 861 253 454
Jun 12 0 37 260 36 739 32 214 29 621 42 328 5 198 183 360
Jul 12 20 34 532 45 245 32 898 35 198 27 471 4 040 179 404
Aug 12 89 37 943 43 413 39 150 45 263 41 276 2 863 209 997
Sep 12 249 29 385 51 499 58 521 50 408 50 217 4 668 244 947
Oct 12 863 79 390 74 318 77 987 59 015 44 630 355 336 558
Nov 12 526 47 396 61 518 53 051 69 347 51 990 3 315 287 143
Dec 12 1 715 68 479 34 892 42 373 50 333 42 470 3 912 244 174
Jan 13 13 155 127 483 123 175 119 003 106 350 90 570 16 067 595 803
Feb 13 4 988 92 752 110 677 150 949 113 895 109 226 42 582 529
Mar 13 5 96 335 104 058 141 162 92 004 106 817 8 092 548 473
Total 21 611 730 291 774 961 850 475 745 276 667 898 49 413 3 839 925
% 0.56% 19.02% 20.18% 22.15% 19.41% 17.39% 1.29% 100.00%
The information in the table above indicates that:
• Sundays: during May and June 2012 no Notices were captured. The highest number of notices for Sundays was captured during January 2013, a total of 13 155;
• Saturdays: during April 2012 no Notices were captured. The highest number of notices for Saturdays was captured during January 2013, which totalled 16 067; and
• Wednesdays: the highest number of Notices was captured during February 2013, a total of 150 949.
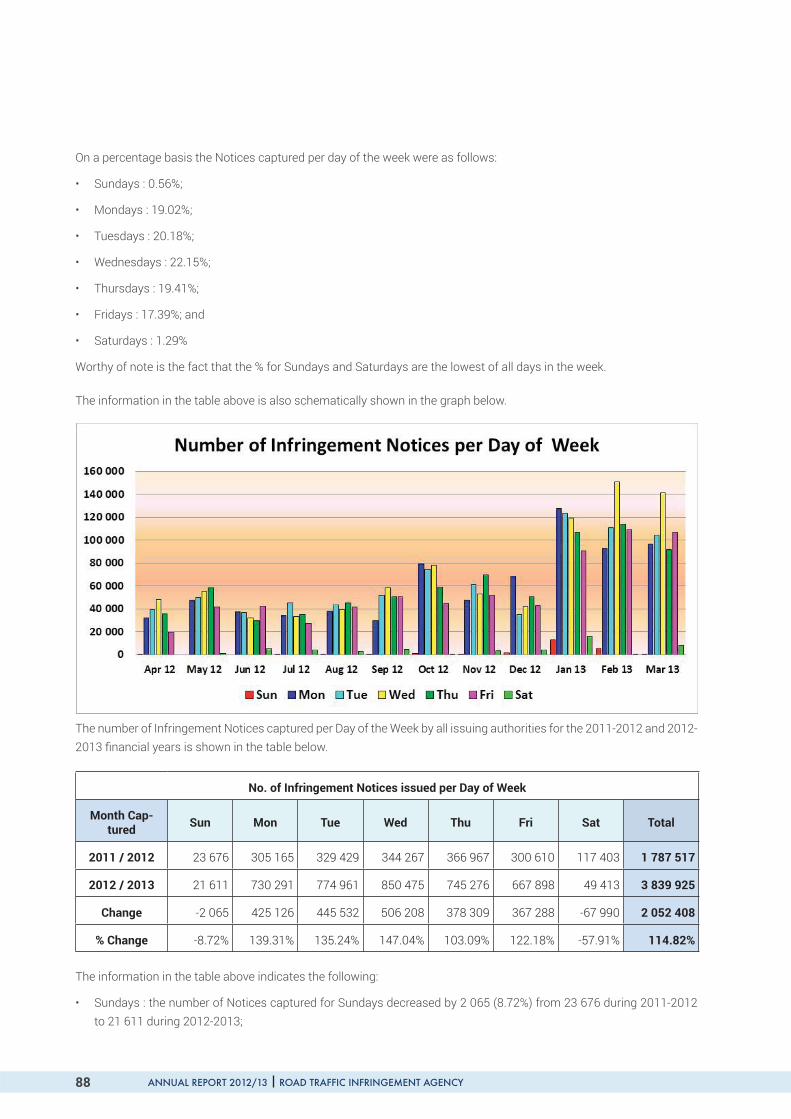
ANNUAL REPORT 2012/13 ROAD TRAFFIC INFRINGEMENT AGENCY88
On a percentage basis the Notices captured per day of the week were as follows:
• Sundays : 0.56%;
• Mondays : 19.02%;
• Tuesdays : 20.18%;
• Wednesdays : 22.15%;
• Thursdays : 19.41%;
• Fridays : 17.39%; and
• Saturdays : 1.29%
Worthy of note is the fact that the % for Sundays and Saturdays are the lowest of all days in the week.
The information in the table above is also schematically shown in the graph below.
The number of Infringement Notices captured per Day of the Week by all issuing authorities for the 2011-2012 and 2012-2013 nancial years is shown in the table below.
No. of Infringement Notices issued per Day of Week
Month Cap-tured Sun Mon Tue Wed Thu Fri Sat Total
2011 / 2012 23 676 305 165 329 429 344 267 366 967 300 610 117 403 1 787 517
2012 / 2013 21 611 730 291 774 961 850 475 745 276 667 898 49 413 3 839 925
Change -2 065 425 126 445 532 506 208 378 309 367 288 -67 990 2 052 408
% Change -8.72% 139.31% 135.24% 147.04% 103.09% 122.18% -57.91% 114.82%
The information in the table above indicates the following:
• Sundays : the number of Notices captured for Sundays decreased by 2 065 (8.72%) from 23 676 during 2011-2012 to 21 611 during 2012-2013;

ChangeAhead
ANNUAL REPORT 2012/13 ROAD TRAFFIC INFRINGEMENT AGENCY 89
• Saturdays : the number of Notices captured for Saturdays decreased by 67 990 (57.91%) from 117 403 in 2011-2012 to 49 413 during 2012-2013; and
• Wednesdays: the number of Notices captured for Wednesdays increased by 506 208 (147.04%) from 344 267 in 2011-2012 to 850 475 in 2012-2013.
The information in the table above is also schematically shown in the graph below.
The percentage (%) of Infringement Notices captured per Day of the Week per Issuing Authority during 2012-2013 is shown in the table below.
% of Infringement Notices issued per Day of Week : 2012-2013
Issuing Author-ity Sun Mon Tue Wed Thu Fri Sat Total
JMPD 0.73% 19.07% 20.05% 22.50% 19.16% 17.50% 0.99% 100.00%
TMPD 0.03% 18.73% 20.39% 21.10% 20.21% 17.12% 2.41% 100.00%
GDoCS 0.01% 18.77% 21.29% 21.54% 20.93% 17.39% 0.07% 100.00%
RTMC 0.84% 20.79% 21.97% 21.57% 17.83% 16.44% 0.55% 100.00%
All IA’s 0.56% 19.02% 20.18% 22.15% 19.41% 17.39% 1.29% 100.00%
The information in the table above indicates that:
• Sundays : the highest number of Notices for Sundays was captured by the RTMC, 0.84%;
• Saturdays : the highest number of Notices for Saturdays was captured by TMPD, 2.41%; and
• Wednesdays: the highest number of Notices for Wednesdays was captured by JMPD, 22.50%.
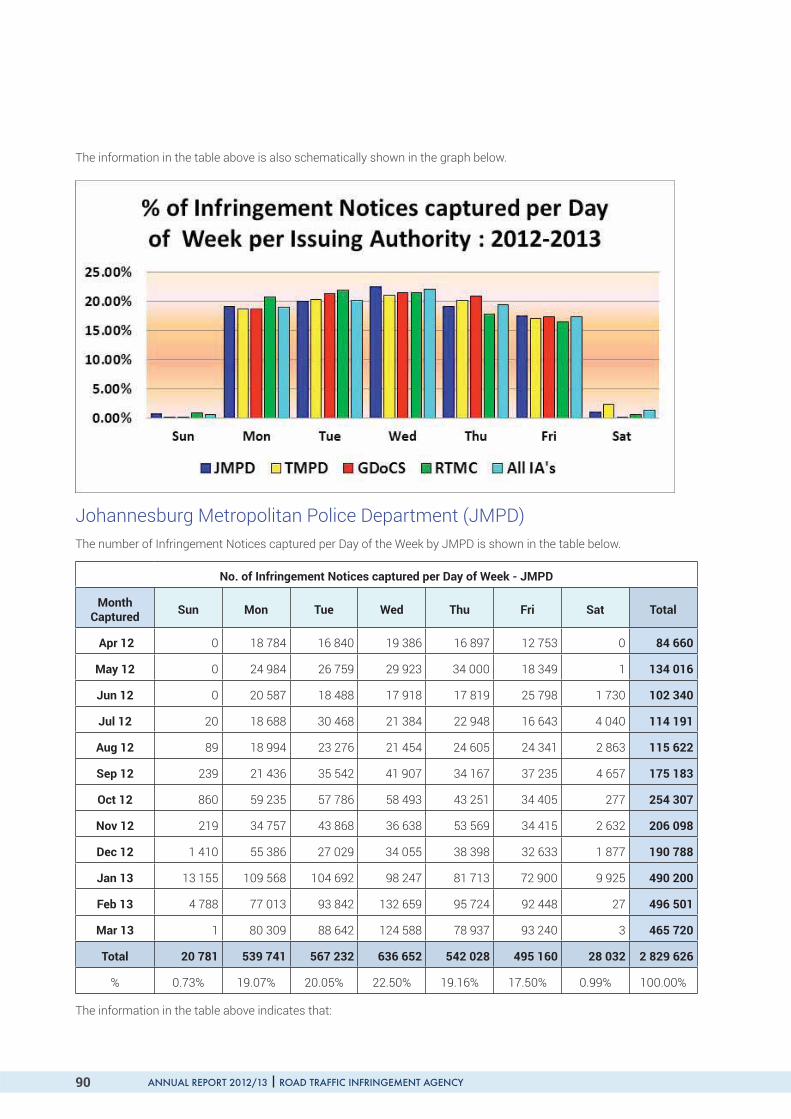
ANNUAL REPORT 2012/13 ROAD TRAFFIC INFRINGEMENT AGENCY90
The information in the table above is also schematically shown in the graph below.
Johannesburg Metropolitan Police Department (JMPD)The number of Infringement Notices captured per Day of the Week by JMPD is shown in the table below.
No. of Infringement Notices captured per Day of Week - JMPD
MonthCaptured Sun Mon Tue Wed Thu Fri Sat Total
Apr 12 0 18 784 16 840 19 386 16 897 12 753 0 84 660
May 12 0 24 984 26 759 29 923 34 000 18 349 1 134 016
Jun 12 0 20 587 18 488 17 918 17 819 25 798 1 730 102 340
Jul 12 20 18 688 30 468 21 384 22 948 16 643 4 040 114 191
Aug 12 89 18 994 23 276 21 454 24 605 24 341 2 863 115 622
Sep 12 239 21 436 35 542 41 907 34 167 37 235 4 657 175 183
Oct 12 860 59 235 57 786 58 493 43 251 34 405 277 254 307
Nov 12 219 34 757 43 868 36 638 53 569 34 415 2 632 206 098
Dec 12 1 410 55 386 27 029 34 055 38 398 32 633 1 877 190 788
Jan 13 13 155 109 568 104 692 98 247 81 713 72 900 9 925 490 200
Feb 13 4 788 77 013 93 842 132 659 95 724 92 448 27 496 501
Mar 13 1 80 309 88 642 124 588 78 937 93 240 3 465 720
Total 20 781 539 741 567 232 636 652 542 028 495 160 28 032 2 829 626
% 0.73% 19.07% 20.05% 22.50% 19.16% 17.50% 0.99% 100.00%
The information in the table above indicates that:

ChangeAhead
ANNUAL REPORT 2012/13 ROAD TRAFFIC INFRINGEMENT AGENCY 91
• Sundays: during April, May and June 2012 no Notices were captured. The highest number of notices for Sundays was captured during January 2013, a total of 13 155;
• Saturdays : The highest number of Notices for Saturdays was captured during January 2013, which totalled 9 925; and
• Wednesdays: the highest number of Notices was captured during February 2013, a total of 132 659.
On a percentage basis the Notices captured per day of the week were as follows:
• Sundays : 0.73%;
• Mondays : 19.07%;
• Tuesdays : 20.05%;
• Wednesdays : 22.50%;
• Thursdays : 19.16%;
• Fridays : 17.50%; and
• Saturdays : 0.99%.
The % for Sundays and Saturdays are the lowest of all days in the week.
Infringements Captured per Day of the Week The information in the table above is also schematically shown in the graphs below.

ANNUAL REPORT 2012/13 ROAD TRAFFIC INFRINGEMENT AGENCY92
Tshwane Metropolitan Police Department (TMPD)The number of Infringement Notices captured per Day of the Week by TMPD is shown in the table below.
No. of Infringement Notices captured per Day of Week - TMPD
Month Captured Sun Mon Tue Wed Thu Fri Sat Total
Apr 12 1 9 774 19 017 24 769 15 803 4 626 0 73 990
May 12 0 19 580 20 531 21 819 21 161 20 503 859 104 453
Jun 12 0 14 494 16 042 12 632 10 202 14 581 3 468 71 419
Jul 12 0 13 398 12 340 9 539 10 075 9 285 0 54 637
Aug 12 0 17 033 17 585 15 129 18 122 15 289 0 83 158
Sep 12 0 6 247 14 054 14 328 14 329 11 533 0 60 491
Oct 12 0 17 824 13 379 16 956 13 589 8 550 71 70 369
Nov 12 299 10 966 15 577 13 962 13 667 15 199 681 70 351
Dec 12 0 11 586 5 874 6 437 9 964 8 769 1 724 44 354
Jan 13 0 15 618 16 169 18 386 21 431 15 385 6 105 93 094
Feb 13 0 12 809 13 538 15 176 15 729 14 254 1 71 507
Mar 13 0 13 488 13 160 14 267 11 545 10 810 8 076 71 346
Total 300 162 817 177 266 183 400 175 617 148 784 20 985 869 169
% 0.03% 18.73% 20.39% 21.10% 20.21% 17.12% 2.41% 100.00%
The information in the table above indicates that:

ChangeAhead
ANNUAL REPORT 2012/13 ROAD TRAFFIC INFRINGEMENT AGENCY 93
Sundays: for ten (10) months no Notices were captured. The highest number of notices for Sundays was captured during November 2012, a total of 299;
Saturdays : The highest number of Notices for Saturdays was captured during March 2013, which totalled 8 076; which could be attributed to the Easter Weekend; and
Wednesdays: the highest number of Notices was captured during April 2012, a total of 24 769.
On a percentage basis the Notices captured per day of the week were as follows:
• Sundays : 0.03%;
• Mondays : 18.73%;
• Tuesdays : 20.39%;
• Wednesdays : 21.10%;
• Thursdays : 20.21%;
• Fridays : 17.12%; and
• Saturdays : 2.41%
The % for Sundays and Saturdays are the lowest of all days in the week.
The information in the table above is also schematically shown in the graphs below.

ANNUAL REPORT 2012/13 ROAD TRAFFIC INFRINGEMENT AGENCY94
Gauteng Department of Community Safety (GDoCS)The number of Infringement Notices captured per Day of the Week by GDoCS is shown in the table below.
No. of Infringement Notices captured per Day of Week - GDoCS
Month Captured Sun Mon Tue Wed Thu Fri Sat Total
Apr 12 0 1 818 2 009 2 488 1 880 1 431 0 9 626
May 12 0 1 552 1 524 1 842 1 719 1 462 1 8 100
Jun 12 0 1 223 1 297 1 154 954 1 205 0 5 833
Jul 12 0 1 394 1 398 1 257 1 330 862 0 6 241
Aug 12 0 1 229 1 429 1 629 1 771 962 0 7 020
Sep 12 2 1 116 1 263 1 414 882 875 2 5 554
Oct 12 3 1 364 1 751 1 326 1 414 839 7 6 704
Nov 12 0 1 024 1 279 927 1 324 1 281 2 5 837
Dec 12 0 668 857 1 132 1 124 458 6 4 245
Jan 13 0 1 291 1 344 1 182 1 752 1 379 10 6 958
Feb 13 1 1 269 1 368 1 445 1 340 1 356 14 6 793
Mar 13 4 983 1 417 1 346 1 166 1 725 13 6 654
Total 10 14 931 16 936 17 142 16 656 13 835 55 79 565
% 0.01% 18.77% 21.29% 21.54% 20.93% 17.39% 0.07% 100.00%
The information in the table above indicates that:
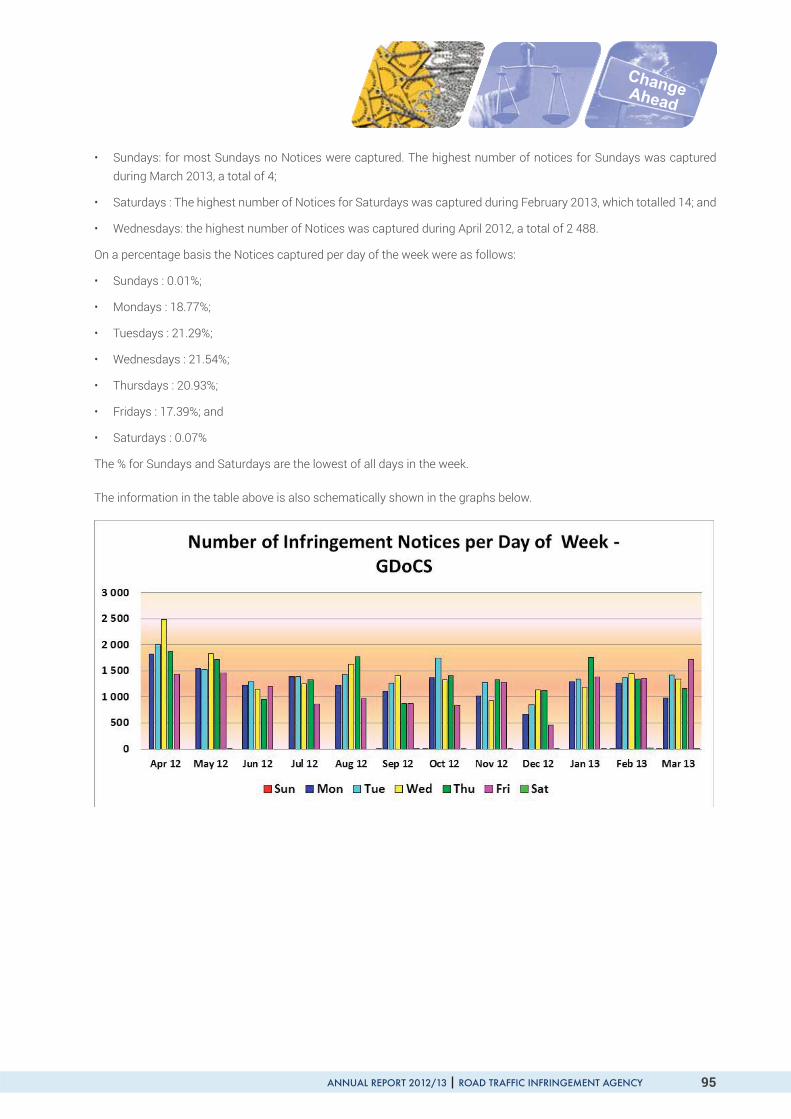
ChangeAhead
ANNUAL REPORT 2012/13 ROAD TRAFFIC INFRINGEMENT AGENCY 95
• Sundays: for most Sundays no Notices were captured. The highest number of notices for Sundays was captured during March 2013, a total of 4;
• Saturdays : The highest number of Notices for Saturdays was captured during February 2013, which totalled 14; and
• Wednesdays: the highest number of Notices was captured during April 2012, a total of 2 488.
On a percentage basis the Notices captured per day of the week were as follows:
• Sundays : 0.01%;
• Mondays : 18.77%;
• Tuesdays : 21.29%;
• Wednesdays : 21.54%;
• Thursdays : 20.93%;
• Fridays : 17.39%; and
• Saturdays : 0.07%
The % for Sundays and Saturdays are the lowest of all days in the week.
The information in the table above is also schematically shown in the graphs below.

ANNUAL REPORT 2012/13 ROAD TRAFFIC INFRINGEMENT AGENCY96
The number of Infringement Notices captured per Day of the Week by RTMC is shown in the table below.
No. of Infringement Notices captured per Day of Week - RTMC
Month Captured Sun Mon Tue Wed Thu Fri Sat Total
Apr 12 0 1 479 1 419 1 306 978 625 0 5 807
May 12 0 1 365 1 328 1 634 1 404 1 154 0 6 885
Jun 12 0 956 912 510 646 744 0 3 768
Jul 12 0 1 052 1 039 718 845 681 0 4 335
Aug 12 0 687 1 123 938 765 684 0 4 197
Sep 12 8 586 640 872 1 030 574 9 3 719
Oct 12 0 967 1 402 1 212 761 836 0 5 178
Nov 12 8 649 794 1 524 787 1 095 0 4 857
Dec 12 305 839 1 132 749 847 610 305 4 787
Jan 13 0 1 006 970 1 188 1 454 906 27 5 551
Feb 13 199 1 661 1 929 1 669 1 102 1 168 0 7 728
Mar 13 0 1 555 839 961 356 1 042 0 4 753
Total 520 12 802 13 527 13 281 10 975 10 119 341 61 565
% 0.84% 20.79% 21.97% 21.57% 17.83% 16.44% 0.55% 100.00%
The information in the table above indicates that:

ChangeAhead
ANNUAL REPORT 2012/13 ROAD TRAFFIC INFRINGEMENT AGENCY 97
• Sundays: for 8 months no Notices were captured. The highest number of notices for Sundays was captured during December 2012, a total of 305;
• Saturdays: for 9 months no Notices were captured. The highest number of notices for Saturdays was captured during December 2012, which totalled 305; and
• Wednesdays: the highest number of Notices was captured during February 2013, a total of 1 669.
On a percentage basis the Notices captured per day of the week were as follows:
• Sundays : 0.84%;
• Mondays : 20.79%;
• Tuesdays : 21.97%;
• Wednesdays : 21.57%;
• Thursdays : 17.83%;
• Fridays : 16.44%; and
• Saturdays : 0.55%
The % for Sundays and Saturdays are the lowest of all days in the week.
The information in the table above is also schematically shown in the graphs below.

ANNUAL REPORT 2012/13 ROAD TRAFFIC INFRINGEMENT AGENCY98
Courtesy LettersSection 19 of the principal Act provides for the issuing and service of Courtesy Letters after the infringer had failed to exercise any of the options provided for in the rst phase of 32 days from being served with an Infringement Notice by the Issuing Authorities. The table below represents the total number of Courtesy Letters that were created and served on infringers from 1 April 2012 to 31 March 2013 in comparison with the same period the previous nancial year. When reading this information, it is important to note that there is an over-flow of infringements from the previous year into the current and also into the next and this is due to a time lag of up to two months, between the event occurring and its subsequent capture on the system.
Number of Courtesy Letters Served
Month 2011-2012 2012-2013 Change % Change
Apr 163 557 121 629 -41 928 -25.64%
May 22 318 142 732 120 414 539.54%
Jun 71 721 143 562 71 841 100.17%
Jul 36 620 61 543 24 923 68.06%
Aug 38 613 0 - -
Sep 86 172 0 - -
Oct 97 972 0 - -
Nov 127 069 0 - -
Dec 98 579 0 - -
Jan 100 475 0 - -
Feb 83 867 0 - -
Mar 112 463 0 - -
Total 1 039 426 469 466 - -
The information in the table above indicates that:
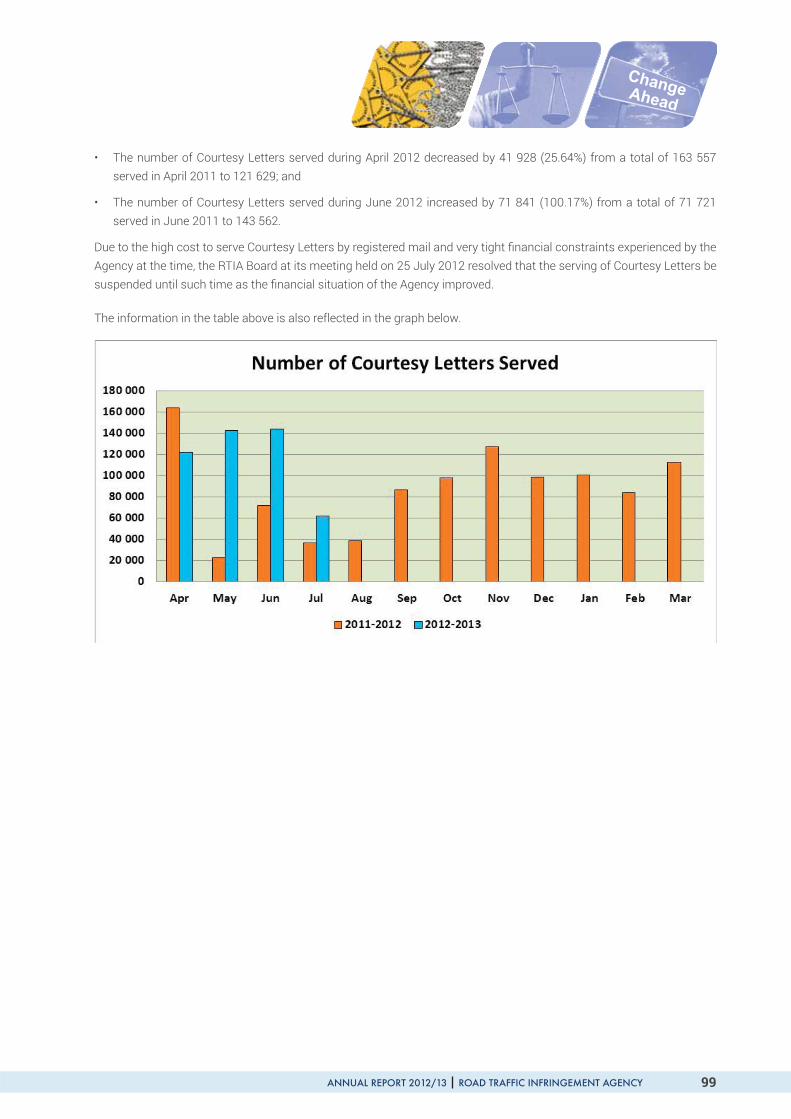
ChangeAhead
ANNUAL REPORT 2012/13 ROAD TRAFFIC INFRINGEMENT AGENCY 99
• The number of Courtesy Letters served during April 2012 decreased by 41 928 (25.64%) from a total of 163 557 served in April 2011 to 121 629; and
• The number of Courtesy Letters served during June 2012 increased by 71 841 (100.17%) from a total of 71 721 served in June 2011 to 143 562.
Due to the high cost to serve Courtesy Letters by registered mail and very tight nancial constraints experienced by the Agency at the time, the RTIA Board at its meeting held on 25 July 2012 resolved that the serving of Courtesy Letters be suspended until such time as the nancial situation of the Agency improved.
The information in the table above is also reflected in the graph below.

ANNUAL REPORT 2012/13 ROAD TRAFFIC INFRINGEMENT AGENCY100
Enforcement OrdersThe number of Enforcement Orders served by the Agency during the 2012-2013 nancial years in comparison with the same period the previous year is shown in the table below.
Number of Enforcement Orders Served
Month 2011-2012 2012-2013 Change % Change
Apr 0 0 0 -
May 0 19 233 19 233 -
Jun 0 58 389 58 389 -
Jul 0 12 589 12 589 -
Aug 0 0 - -
Sep 0 0 - -
Oct 0 0 - -
Nov 0 0 - -
Dec 0 0 - -
Jan 3 102 0 - -
Feb 6 724 0 - -
Mar 0 0 - -
Total 9 826 90 211 - -
The information in the table above shows that:
• During the 2011-2012 nancial year a total of 9 826 Enforcement Orders was served, 3 102 and 6 724 during the months of January 2012 and February 2012 respectively.
• During the 2012-2013 nancial year a total of 90 211 Enforcement Orders was served, the highest number being during the three month period from May to July 2012.
Due to nancial constraints and signi cant systems challenges experienced with the National Contraventions Register, insuf cient data quality and incorrect infringer address details, Courtesy Letters and Enforcement Orders were suspended during the latter part of the nancial period.
Due to the high cost to serve Enforcement Orders by registered mail and very tight nancial constraints experienced by the Agency at the time, the RTIA Board at its meeting held on 25 July 2012 resolved that the serving of Enforcement Orders be suspended until such time as the nancial situation of the Agency improved.

ChangeAhead
ANNUAL REPORT 2012/13 ROAD TRAFFIC INFRINGEMENT AGENCY 101
The information in the table above is also reflected in the graph below.
The number of applications received for the revocation of Enforcement Orders and the results of the revocation applications for the 2011-2012 and 2012-2013 nancial years respectively, are given in the tables below.
Application for revocation of Enforcement Order receipt Result of revocation application of Enforcement Order
Month 2011-2012 2012-2013 Month 2011-2012 2012-2013
Apr 1 Apr 1
May 5 May 4
Jun 60 Jun 60
Jul 103 Jul 80
Aug 5 0 Aug 5 0
Sep 0 Sep 0
Oct 0 Oct 0
Nov 0 Nov 0
Dec 0 Dec 0
Jan 6 0 Jan 3 0
Feb 4 0 Feb 7 0
Mar 6 0 Mar 3 0
Total 21 169 Total 18 145
Average 2 14 Average 2 12
The information in the table above shows:
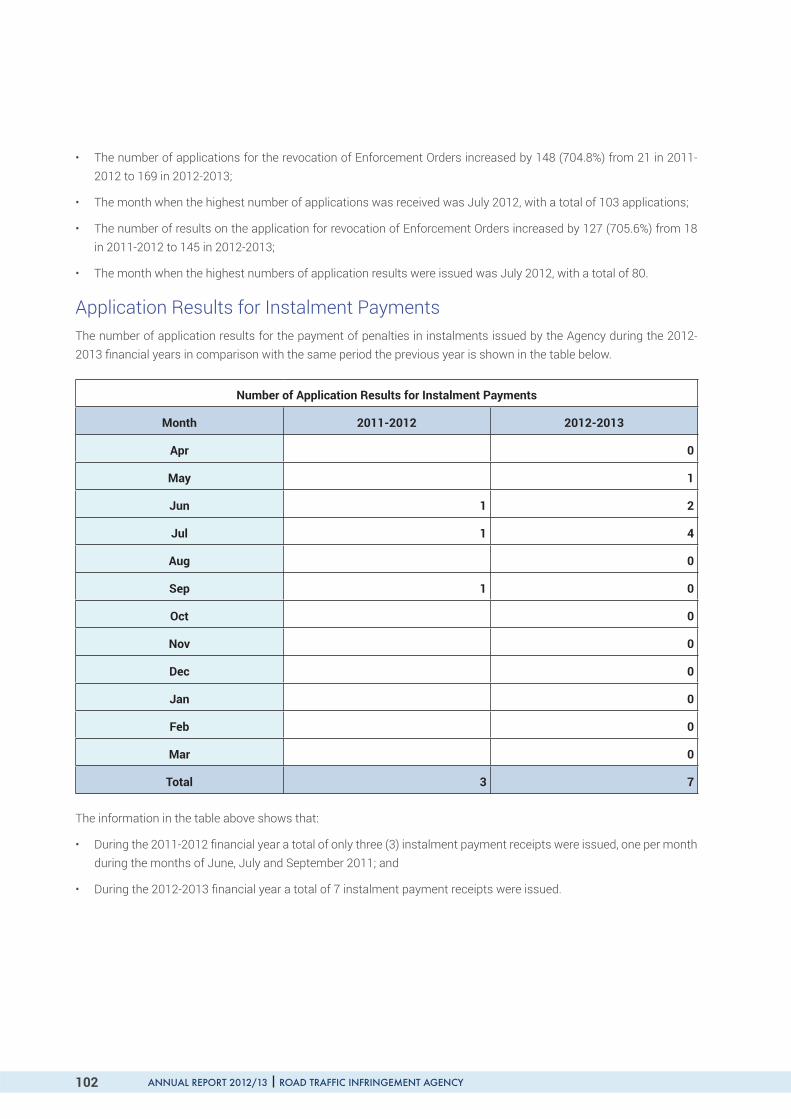
ANNUAL REPORT 2012/13 ROAD TRAFFIC INFRINGEMENT AGENCY102
• The number of applications for the revocation of Enforcement Orders increased by 148 (704.8%) from 21 in 2011-2012 to 169 in 2012-2013;
• The month when the highest number of applications was received was July 2012, with a total of 103 applications;
• The number of results on the application for revocation of Enforcement Orders increased by 127 (705.6%) from 18 in 2011-2012 to 145 in 2012-2013;
• The month when the highest numbers of application results were issued was July 2012, with a total of 80.
Application Results for Instalment PaymentsThe number of application results for the payment of penalties in instalments issued by the Agency during the 2012-2013 nancial years in comparison with the same period the previous year is shown in the table below.
Number of Application Results for Instalment Payments
Month 2011-2012 2012-2013
Apr 0
May 1
Jun 1 2
Jul 1 4
Aug 0
Sep 1 0
Oct 0
Nov 0
Dec 0
Jan 0
Feb 0
Mar 0
Total 3 7
The information in the table above shows that:
• During the 2011-2012 nancial year a total of only three (3) instalment payment receipts were issued, one per month during the months of June, July and September 2011; and
• During the 2012-2013 nancial year a total of 7 instalment payment receipts were issued.

ChangeAhead
ANNUAL REPORT 2012/13 ROAD TRAFFIC INFRINGEMENT AGENCY 103
The number of receipts for payment of penalties by infringers issued by the Agency during the 2012/2013 nancial year in comparison with the same period the previous year is shown in the table below.
Number of Receipts for Payments
Month 2011-2012 2012-2013
Apr 8 596 0
May 9 421 0
Jun 14 831 0
Jul 10 595 2
Aug 1 963 0
Sep 0 0
Oct 0 0
Nov 0 0
Dec 0 0
Jan 0 0
Feb 0 0
Mar 1 0
Total 45 407 2
The information in the table above shows:
• During 2011-2012 a total of 45 407 receipts for payments were issued and;
• During 2012-2013 a total of 2 receipts were issued.

ANNUAL REPORT 2012/13 ROAD TRAFFIC INFRINGEMENT AGENCY104
Other Notices Issued by the RTIAWhereas the Agency sends out notices as tabulated above, based on the actions it has taken in exercising its mandate, there are other notices that it sends out as a direct consequence of the transactions performed elsewhere. These are for example, acknowledgement of receipts for payments effected at agents other than the IAs, DLTCs or VTSs. Upon the uploading of the payment and capture thereof on the NCR, the con rmation receipts are sent out to infringers by the Agency.
The number of acknowledgement of receipt notices send out during the 2012-2013 nancial year in comparison with the same period the previous year is shown in the table below.
Acknowledgement of Receipt
Month 2011-2012 2012-2013
Apr 23 11
May 23 19
Jun 12 71
Jul 35 76
Aug 17 0
Sep 42 0
Oct 30 0
Nov 20 0
Dec 14 0
Jan 11 0
Feb 24 0
Mar 17 0
Total 268 177
The information in the table above shows that:
• A total of 268 acknowledgement of receipts were issued in 2011-2012; and
• During 2012-2013 a total of 177 were issued.

ChangeAhead
ANNUAL REPORT 2012/13 ROAD TRAFFIC INFRINGEMENT AGENCY 105
Percentage of Representations Captured per Infringement NoticeThe percentage (%) of representation applications captured per infringement notice during the 2012/2013 nancial year in comparison with the same period the previous year is shown in the table below.
% Representations/Notice
All Issuing Authorities
Month Captured 2011-2012 2012-2013 2-YearAverage
Apr 1.10% 1.35% 1.25%
May 0.82% 1.71% 1.29%
Jun 1.65% 1.73% 1.70%
Jul 1.52% 2.37% 1.95%
Aug 1.65% 2.27% 2.06%
Sep 2.73% 1.44% 1.85%
Oct 3.10% 1.16% 1.67%
Nov 2.95% 0.96% 1.73%
Dec 1.72% 0.01% 0.58%
Jan 2.02% 0.33% 0.70%
Feb 2.18% 0.46% 0.84%
Mar 1.94% 0.36% 0.75%
Total 1.91% 0.93% 1.24%
The information in the table above shows that:
• The % of applications for representations per infringement notice decreased from 1.91% in 2011-2012 to 0.93% in 2012-2013;
• The highest % captured per month during 2012-2013 was for July 2012 when 2.37% was captured followed by August with 2.27%; and
• The monthly average over the 2-year period from April 2011 to March 2013 is shown in the Total column, indicating that the average monthly % of representations per notices was 1.24%.

ANNUAL REPORT 2012/13 ROAD TRAFFIC INFRINGEMENT AGENCY106
The information in the table above is also reflected in the graphs below.
The % of all representations captured per issuing authority for the 2011-2012 and 2012-2013 nancial years respectively are shown in the graph below.

ChangeAhead
ANNUAL REPORT 2012/13 ROAD TRAFFIC INFRINGEMENT AGENCY 107
The 2-year average monthly % of infringement notices on which representations were submitted per issuing authority for the 2011-2012 and 2012-2013 nancial years respectively are shown in the table below.
% of Notices on which Representations were submitted
Month JMPD TMPD GDoCS RTMC All IA’s
Apr 0.65% 1.81% 1.23% 1.38% 1.25%
May 0.58% 2.36% 1.81% 1.82% 1.29%
Jun 1.10% 2.42% 1.63% 2.73% 1.70%
Jul 1.30% 3.02% 1.45% 2.70% 1.95%
Aug 1.82% 2.36% 1.28% 2.03% 2.06%
Sep 1.20% 2.86% 1.72% 1.29% 1.85%
Oct 1.26% 2.78% 1.50% 0.91% 1.67%
Nov 0.85% 3.94% 1.51% 0.98% 1.73%
Dec 0.22% 1.63% 1.13% 0.38% 0.58%
Jan 0.34% 1.90% 1.46% 0.95% 0.70%
Feb 0.37% 2.65% 1.11% 0.93% 0.84%
Mar 0.29% 2.39% 1.47% 1.09% 0.75%
Average 0.67% 2.51% 1.44% 1.19% 1.24%
The information in the table above shows as follows:
• Johannesburg Metropolitan Police Department (JMPD) :
The average % of infringement notices on which representation applications were submitted was 0.67%; and
The month with the highest percentage was August: 1.82%.
• Tshwane Metropolitan Police Department (TMPD) :
The average % of infringement notices on which representation applications were submitted was 2.51%; and
The month with the highest percentage was November: 3.94%.
• Gauteng Department of Community Safety (GDoCS):
The average % of Infringement Notices on which representation applications were submitted was 1.44%; and
The month with the highest percentage was May: 1.81%.
• Road Tra c Management Corporation (RTMC):
The average % of Infringement Notices on which representation applications were submitted was 1.19%; and
The month with the highest percentage was June: 2.73%.
• All Issuing Authorities:
The average % of Infringement Notices on which representation applications were submitted was 1.24%; and
The month with the highest percentage was August: 2.06%.
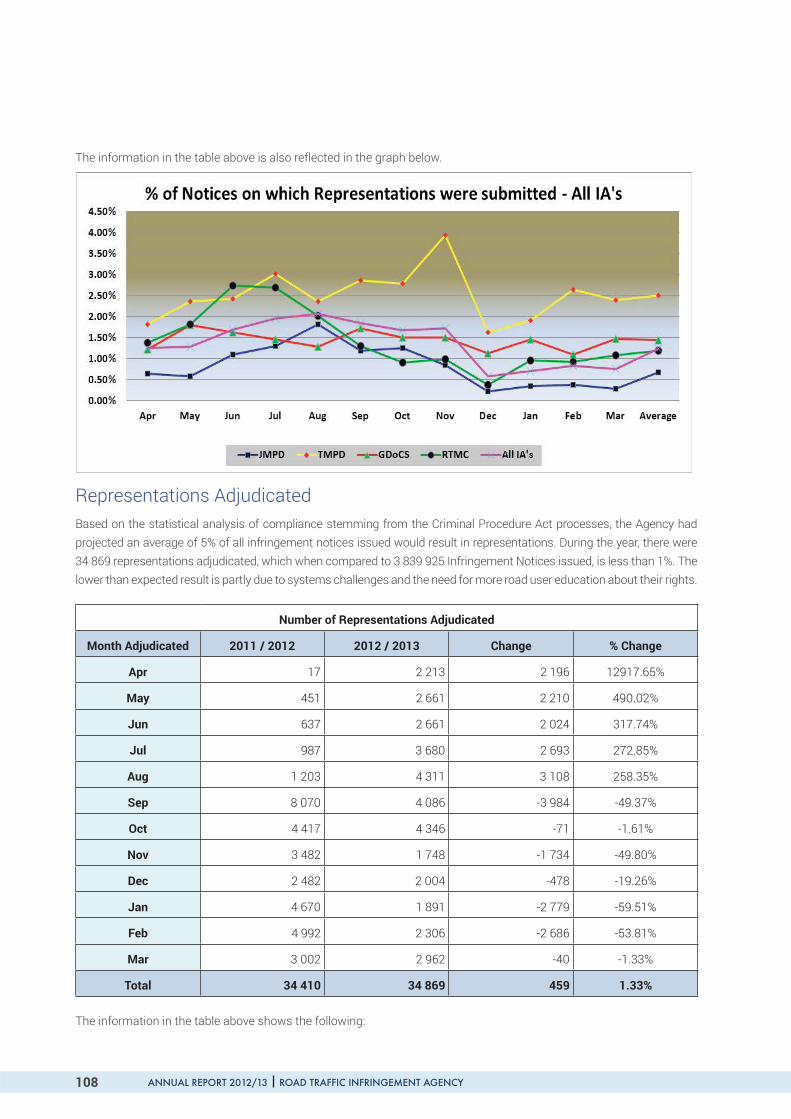
ANNUAL REPORT 2012/13 ROAD TRAFFIC INFRINGEMENT AGENCY108
The information in the table above is also reflected in the graph below.
Representations AdjudicatedBased on the statistical analysis of compliance stemming from the Criminal Procedure Act processes, the Agency had projected an average of 5% of all infringement notices issued would result in representations. During the year, there were 34 869 representations adjudicated, which when compared to 3 839 925 Infringement Notices issued, is less than 1%. The lower than expected result is partly due to systems challenges and the need for more road user education about their rights.
Number of Representations Adjudicated
Month Adjudicated 2011 / 2012 2012 / 2013 Change % Change
Apr 17 2 213 2 196 12917.65%
May 451 2 661 2 210 490.02%
Jun 637 2 661 2 024 317.74%
Jul 987 3 680 2 693 272.85%
Aug 1 203 4 311 3 108 258.35%
Sep 8 070 4 086 -3 984 -49.37%
Oct 4 417 4 346 -71 -1.61%
Nov 3 482 1 748 -1 734 -49.80%
Dec 2 482 2 004 -478 -19.26%
Jan 4 670 1 891 -2 779 -59.51%
Feb 4 992 2 306 -2 686 -53.81%
Mar 3 002 2 962 -40 -1.33%
Total 34 410 34 869 459 1.33%
The information in the table above shows the following:

ChangeAhead
ANNUAL REPORT 2012/13 ROAD TRAFFIC INFRINGEMENT AGENCY 109
• The number of representations adjudicated increased by 459 (1.33%) from 34 410 in 2011-2012 to 34 869 in 2012-2013;
• The monthly average number of representations adjudicated 2 868 and 2 906 in 2011-2012 and 2012-2013 respectively; and
• Although there were decreases in the monthly number adjudicated from September 2012 to March 2013, August 2012 shows an increase of 3 108 (258.35%) from 1 203 in August 2012 to 4 311.
The information in the table above is also reflected in the graph below.

ANNUAL REPORT 2012/13 ROAD TRAFFIC INFRINGEMENT AGENCY110
The information shown in the table below reflects the monthly number of representations that were adjudicated and the numbers and percentages respectively successful and unsuccessful.
Number of Representations Adjudicated
Month Adjudicated NumberAdjudicated
NumberSuccessful
%Successful
NumberUnsuccessful % Unsuccessful
Apr 12 2 213 822 37.14% 1 391 62.86%
May 12 2 661 1 172 44.04% 1 489 55.96%
Jun 12 2 661 1 123 42.20% 1 538 57.80%
Jul 12 3 680 1 512 41.09% 2 168 58.91%
Aug 12 4 311 1 537 35.65% 2 774 64.35%
Sep 12 4 086 1 889 46.23% 2 197 53.77%
Oct 12 4 346 2 043 47.01% 2 303 52.99%
Nov 12 1 748 560 32.04% 1 188 67.96%
Dec 12 2 004 1 121 55.94% 883 44.06%
Jan 13 1 891 916 48.44% 975 51.56%
Feb 13 2 306 1 088 47.18% 1 218 52.82%
Mar 13 2 962 1 478 49.90% 1 484 50.10%
Total 34 869 15 261 43.77% 19 608 56.23%
The information above indicates that:
• From the 34 869 Representations that were adjudicated, 15 261 (43.77%) was successful and19 608 (56.23%) was un-successful and rejected;
• On a percentage basis the highest number of successful Representations was during December 2012 when 1 121(55.94%) out of 2 004 were successful; and
• On a percentage basis the highest number of un-successful Representations was during November 2012 when 1 188 (67.96%) out of 1 748 were unsuccessful.
The information in the table above, comparing the percentage Representations that were successful and unsuccessful (rejected) during the previous nancial year is also reflected in the graphs below. The information in these graphs shows that:
• The average successful Representations were 43.77% during 2012-2013 in comparison with 73.50% during 2011-2012; and
• The average unsuccessful Representations were 56.23% during 2012-2013 in comparison with 26.50% during 2011-2012.

ChangeAhead
ANNUAL REPORT 2012/13 ROAD TRAFFIC INFRINGEMENT AGENCY 111
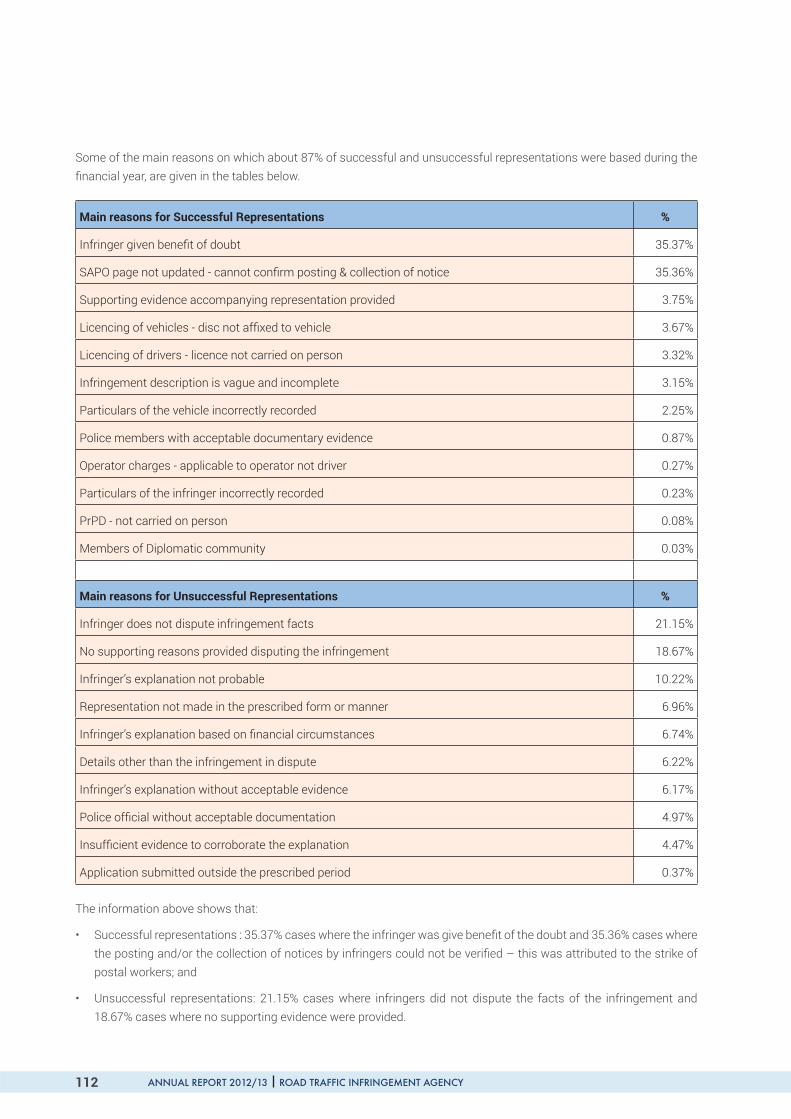
ANNUAL REPORT 2012/13 ROAD TRAFFIC INFRINGEMENT AGENCY112
Some of the main reasons on which about 87% of successful and unsuccessful representations were based during the nancial year, are given in the tables below.
Main reasons for Successful Representations %
Infringer given bene t of doubt 35.37%
SAPO page not updated - cannot con rm posting & collection of notice 35.36%
Supporting evidence accompanying representation provided 3.75%
Licencing of vehicles - disc not af xed to vehicle 3.67%
Licencing of drivers - licence not carried on person 3.32%
Infringement description is vague and incomplete 3.15%
Particulars of the vehicle incorrectly recorded 2.25%
Police members with acceptable documentary evidence 0.87%
Operator charges - applicable to operator not driver 0.27%
Particulars of the infringer incorrectly recorded 0.23%
PrPD - not carried on person 0.08%
Members of Diplomatic community 0.03%
Main reasons for Unsuccessful Representations %
Infringer does not dispute infringement facts 21.15%
No supporting reasons provided disputing the infringement 18.67%
Infringer’s explanation not probable 10.22%
Representation not made in the prescribed form or manner 6.96%
Infringer’s explanation based on nancial circumstances 6.74%
Details other than the infringement in dispute 6.22%
Infringer’s explanation without acceptable evidence 6.17%
Police of cial without acceptable documentation 4.97%
Insuf cient evidence to corroborate the explanation 4.47%
Application submitted outside the prescribed period 0.37%
The information above shows that:
• Successful representations : 35.37% cases where the infringer was give bene t of the doubt and 35.36% cases where the posting and/or the collection of notices by infringers could not be veri ed – this was attributed to the strike of postal workers; and
• Unsuccessful representations: 21.15% cases where infringers did not dispute the facts of the infringement and 18.67% cases where no supporting evidence were provided.

ChangeAhead
ANNUAL REPORT 2012/13 ROAD TRAFFIC INFRINGEMENT AGENCY 113
The year commenced with 7 Representation Of cers and slightly increased to a planned complement of 8 in May 2012 before returning to 7 during the last quarter of the nancial year following a resignation.
The average number of adjudications concluded per Representations Of cer per month during the year is shown in the table and represented in the graph below.
Number of Representations per Representations O cer
Month Adjudicated Number of Representation O cers
Number of Representations
Adjudicated
Average number of adjudications per O cer
per Month
Apr 12 7 2 213 316.14
May 12 8 2 661 332.63
Jun 12 8 2 661 332.63
Jul 12 8 3 680 460.00
Aug 12 8 4 311 538.88
Sep 12 8 4 086 510.75
Oct 12 8 4 346 543.25
Nov 12 8 1 748 218.50
Dec 12 8 2 004 250.50
Jan 13 7 1 891 270.14
Feb 13 7 2 306 329.43
Mar 13 7 2 962 423.14
Average 7.67 2 905.75 378.85
The information above shows that the highest average number of adjudications concluded per Representations Of cer per month was in October at 543.25 and the lowest in November 2012 at 218.50.

ANNUAL REPORT 2012/13 ROAD TRAFFIC INFRINGEMENT AGENCY114
The Agency experienced disruptions in the service of Infringement Notices following an outbreak of industrial action at SAPO during the year. The main effect of this action was to slow down the flow of mail and when this happens, there is an increase in the numbers of Representations received as well as wide fluctuations in the flow of work for the Representation Of cers. The Agency is putting together alternative arrangements to deal with this risk.
The NCR has undergone tremendous changes towards a seamless adjudication process. This includes timely status updates that improved the quality of adjudication. The adjudication framework was further developed in line with the AARTO Act and regulations and included aspects relating to various categories of outcomes.
It is expected that, with the national rollout of AARTO and the implementation of the Point Demerit System (PDS) during the next nancial year, the volumes of Representations will increase and appropriate measures will be put in place to cope with the workload.
Elections to be tried in CourtIn terms of sections 17(1)(f)(iv) or 18(7) of the principal Act, an infringer may elect to be tried in court on the charge of having committed the infringement(s) as stated on the Infringement Notice. These elections are submitted to the Issuing Authority who issued the Infringement Notice and are also captured on the NCR. The table below represents the total number of Elections to be Tried in Court that were captured on the NCR for the period 1 April 2012 to 31 March 2013 in comparison with the elections captured for the same months during the previous nancial year.
Due to the timeframes provided in the AARTO process, these elections are not all strictly applicable to the nancial year during which the Infringement Notices were issued. The elections submitted in the rst two months of a nancial year, could typically stem from Infringement Notices issued during the previous nancial year and similarly, elections submitted in the last two months of a nancial year may only be captured during the following nancial year.
Number of Elections to be Tried in Court - All Issuing Authorities
Monthcaptured
2011-2012 2012-2013 Change
No. of Driver
Elections
No. of OperatorElections
Total No. of
Elections
No. of Driver
Elections
No. of OperatorElections
Total No. of
Elections
No. of Driver
Elections
No. of OperatorElections
Total No. of
Elections
Apr 295 76 371 3 751 786 4 537 3 456 710 4 166
May 465 171 636 4 276 817 5 093 3 811 646 4 457
Jun 962 114 1 076 5 155 1 093 6 248 4 193 979 5 172
Jul 1 233 163 1 396 4 760 801 5 561 3 527 638 4 165
Aug 1 389 276 1 665 6 144 1 023 7 167 4 755 747 5 502
Sep 796 199 995 2 775 875 3 650 1 979 676 2 655
Oct 834 108 942 6 462 596 7 058 5 628 488 6 116
Nov 1 253 158 1 411 5 904 1 006 6 910 4 651 848 5 499
Dec 1 643 161 1 804 4 634 545 5 179 2 991 384 3 375
Jan 3 451 397 3 848 8 000 623 8 623 4 549 226 4 775
Feb 2 535 375 2 910 5 929 789 6 718 3 394 414 3 808
Mar 5 077 878 5 955 4 129 344 4 473 -948 -534 -1 482
Total 19 933 3 076 23 009 61 919 9 298 71 217 41 986 6 222 48 208
% 86.63% 13.37% 100.00% 86.94% 13.06% 100.00% 210.64% 202.28% 209.52%

ChangeAhead
ANNUAL REPORT 2012/13 ROAD TRAFFIC INFRINGEMENT AGENCY 115
The above information is also schematically reflected in the graph below.
The information above indicates the following:
The number of elections submitted by drivers increased by 41 986 (210.64%) from a total of 19 933 during 2011-2012 to a total of 61 919 during 2012-2013.
• The number of elections submitted by operators increased by 6 222 (202.28%) from a total of 3 076 during 2011-2012 to a total of 9 298 during 2012-2013.
• The total number of elections submitted increased by 48 208 (209.52%) from a total of 23 009 during 2011-2012 to a total of 71 217 during 2012-2013.
• Elections submitted by drivers during 2012-2013 comprised 86.94% of all elections in comparison with 86.63% the previous year.
• Elections submitted by operators during 2012-2013 comprised 13.06% of all elections in comparison with 13.37% the previous year.

ANNUAL REPORT 2012/13 ROAD TRAFFIC INFRINGEMENT AGENCY116
The number of driver, operator and total elections to be tried in court during the 2011-2012 and 2012-2013 nancial years are also schematically reflected in the graphs below.

ChangeAhead
ANNUAL REPORT 2012/13 ROAD TRAFFIC INFRINGEMENT AGENCY 117
The table and graph below shows the number of elections to be tried in court per Issuing Authority for the 2011-2012 and 2012-2013 nancial years respectively.
Number of Elections to be Tried in Court per Issuing Authority
Month captured2011-2012 2012-2013
JMPD TMPD GDoCS RTMC Total JMPD TMPD GDoCS RTMC Total
Apr 7 347 17 0 371 340 3 992 155 50 4 537
May 12 606 18 0 636 590 4 255 196 52 5 093
Jun 60 1 007 9 0 1 076 1 005 5 003 174 66 6 248
Jul 62 1 304 30 0 1 396 405 4 895 182 79 5 561
Aug 49 1 545 71 0 1 665 800 6 057 243 67 7 167
Sep 4 950 41 0 995 736 2 599 217 98 3 650
Oct 2 931 9 0 942 749 5 963 245 101 7 058
Nov 8 1 373 28 2 1 411 1 029 5 474 314 93 6 910
Dec 2 1 749 50 3 1 804 574 4 294 217 94 5 179
Jan 29 3 686 116 17 3 848 1 607 6 570 331 115 8 623
Feb 13 2 828 64 5 2 910 985 5 357 278 98 6 718
Mar 71 5 673 188 23 5 955 452 3 769 168 84 4 473
Total 319 21 999 641 50 23 009 9 272 58 228 2 720 997 71 217
% of Total 1.39% 95.61% 2.79% 0.22% 100.00% 13.02% 81.76% 3.82% 1.40% 100.00%
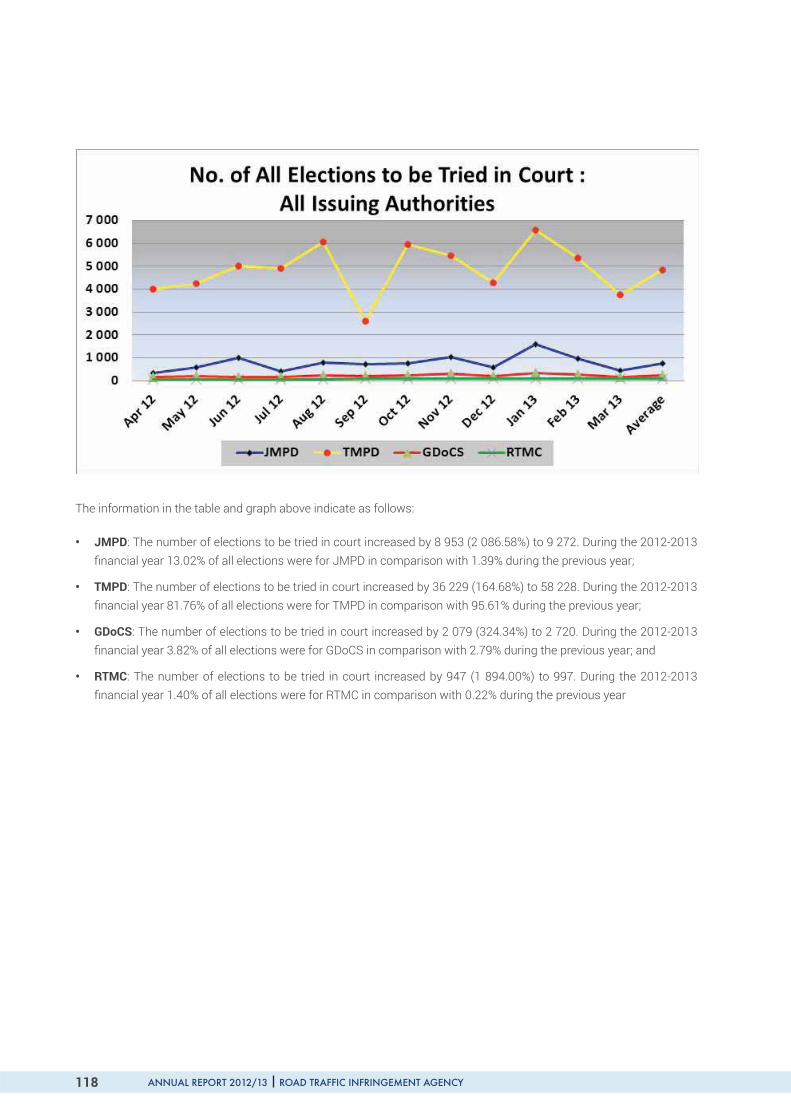
ANNUAL REPORT 2012/13 ROAD TRAFFIC INFRINGEMENT AGENCY118
The information in the table and graph above indicate as follows:
• JMPD: The number of elections to be tried in court increased by 8 953 (2 086.58%) to 9 272. During the 2012-2013 nancial year 13.02% of all elections were for JMPD in comparison with 1.39% during the previous year;
• TMPD: The number of elections to be tried in court increased by 36 229 (164.68%) to 58 228. During the 2012-2013 nancial year 81.76% of all elections were for TMPD in comparison with 95.61% during the previous year;
• GDoCS: The number of elections to be tried in court increased by 2 079 (324.34%) to 2 720. During the 2012-2013 nancial year 3.82% of all elections were for GDoCS in comparison with 2.79% during the previous year; and
• RTMC: The number of elections to be tried in court increased by 947 (1 894.00%) to 997. During the 2012-2013 nancial year 1.40% of all elections were for RTMC in comparison with 0.22% during the previous year

ChangeAhead
ANNUAL REPORT 2012/13 ROAD TRAFFIC INFRINGEMENT AGENCY 119
Tables and graphs with regard to driver and operator elections to be tried in court for the individual Issuing Authorities are given below.
Number of Elections to be Tried in Court - JMPD
Monthcaptured
2011-2012 2012-2013 Change
No. of Driver
Elections
No. of OperatorElections
Total No. of
Elections
No. of Driver
Elections
No. of OperatorElections
Total No. of
Elections
No. of Driver
Elections
No. of OperatorElections
Total No. of
Elections
Apr 7 0 7 181 159 340 174 159 333
May 12 0 12 327 263 590 315 263 578
Jun 60 0 60 558 447 1 005 498 447 945
Jul 60 2 62 121 284 405 61 282 343
Aug 49 0 49 551 249 800 502 249 751
Sep 3 1 4 513 223 736 510 222 732
Oct 2 0 2 666 83 749 664 83 747
Nov 7 1 8 649 380 1 029 642 379 1 021
Dec 2 0 2 434 140 574 432 140 572
Jan 28 1 29 1 583 24 1 607 1 555 23 1 578
Feb 13 0 13 954 31 985 941 31 972
Mar 59 12 71 430 22 452 371 10 381
Total 302 17 319 6 967 2 305 9 272 6 665 2 288 8 953

ANNUAL REPORT 2012/13 ROAD TRAFFIC INFRINGEMENT AGENCY120
Tshwane Metropolitan Police Department (TMPD)
Number of Elections to be Tried in Court - TMPD
Monthcaptured
2011-2012 2012-2013 Change
No. of Driver
Elections
No. of OperatorElections
Total No. of
Elections
No. of Driver
Elections
No. of OperatorElections
Total No. of
Elections
No. of Driver
Elections
No. of OperatorElections
Total No. of
Elections
Apr 287 60 347 3 507 485 3 992 3 220 425 3 645
May 453 153 606 3 839 416 4 255 3 386 263 3 649
Jun 902 105 1 007 4 521 482 5 003 3 619 377 3 996
Jul 1 173 131 1 304 4 541 354 4 895 3 368 223 3 591
Aug 1 338 207 1 545 5 434 623 6 057 4 096 416 4 512
Sep 792 158 950 2 092 507 2 599 1 300 349 1 649
Oct 832 99 931 5 567 396 5 963 4 735 297 5 032
Nov 1 245 128 1 373 5 042 432 5 474 3 797 304 4 101
Dec 1 613 136 1 749 4 009 285 4 294 2 396 149 2 545
Jan 3 337 349 3 686 6 113 457 6 570 2 776 108 2 884
Feb 2 478 350 2 828 4 735 622 5 357 2 257 272 2 529
Mar 4 918 755 5 673 3 514 255 3 769 -1 404 -500 -1 904
Total 19 368 2 631 21 999 52 914 5 314 58 228 33 546 2 683 36 229

ChangeAhead
ANNUAL REPORT 2012/13 ROAD TRAFFIC INFRINGEMENT AGENCY 121
Gauteng Department of Community Safety (GDoCS)
Number of Elections to be Tried in Court - GDoCS
Monthcaptured
2011-2012 2012-2013 Change
No. of Driver
Elections
No. of OperatorElections
Total No. of
Elections
No. of Driver
Elections
No. of OperatorElections
Total No. of
Elections
No. of Driver
Elections
No. of OperatorElections
Total No. of
Elections
Apr 1 16 17 55 100 155 54 84 138
May 0 18 18 91 105 196 91 87 178
Jun 0 9 9 65 109 174 65 100 165
Jul 0 30 30 83 99 182 83 69 152
Aug 2 69 71 130 113 243 128 44 172
Sep 1 40 41 120 97 217 119 57 176
Oct 0 9 9 167 78 245 167 69 236
Nov 1 27 28 171 143 314 170 116 286
Dec 26 24 50 143 74 217 117 50 167
Jan 76 40 116 224 107 331 148 67 215
Feb 40 24 64 174 104 278 134 80 214
Mar 89 99 188 121 47 168 32 -52 -20
Total 236 405 641 1 544 1 176 2 720 1 308 771 2 079

ANNUAL REPORT 2012/13 ROAD TRAFFIC INFRINGEMENT AGENCY122
Road Traf c Management Corporation (RTMC)
Number of Elections to be Tried in Court - RTMC
Monthcaptured
2011-2012 2012-2013 Change
No. of Driver
Elections
No. of OperatorElections
Total No. of
Elections
No. of Driver
Elections
No. of OperatorElections
Total No. of
Elections
No. of Driver
Elections
No. of OperatorElections
Total No. of
Elections
Apr 0 0 0 8 42 50 8 42 50
May 0 0 0 19 33 52 19 33 52
Jun 0 0 0 11 55 66 11 55 66
Jul 0 0 0 15 64 79 15 64 79
Aug 0 0 0 29 38 67 29 38 67
Sep 0 0 0 50 48 98 50 48 98
Oct 0 0 0 62 39 101 62 39 101
Nov 0 2 2 42 51 93 42 49 91
Dec 2 1 3 48 46 94 46 45 91
Jan 10 7 17 80 35 115 70 28 98
Feb 4 1 5 66 32 98 62 31 93
Mar 11 12 23 64 20 84 53 8 61
Total 27 23 50 494 503 997 467 480 947

ChangeAhead
ANNUAL REPORT 2012/13 ROAD TRAFFIC INFRINGEMENT AGENCY 123
Elections to be tried in CourtBased on the monthly average over the past two nancial years, the information in the table below shows the percentages (%) of Infringement Notices served by the various Issuing Authorities on which elections to be tried in court were submitted.
Average % of Notices on which Elections to be Tried in Court were submitted
Month JMPD TMPD GDoCS RTMC All IA’s
Apr 0.28% 3.21% 1.24% 0.86% 1.75%
May 0.22% 2.80% 1.75% 0.76% 1.22%
Jun 0.64% 4.51% 1.81% 1.75% 2.33%
Jul 0.23% 4.86% 1.86% 1.82% 2.00%
Aug 0.59% 5.01% 2.45% 1.60% 2.82%
Sep 0.38% 2.69% 1.69% 1.23% 1.32%
Oct 0.25% 5.52% 2.08% 0.77% 1.77%
Nov 0.34% 5.41% 2.64% 0.94% 1.82%
Dec 0.23% 7.23% 2.74% 0.97% 1.95%
Jan 0.29% 6.41% 3.07% 0.93% 1.64%
Feb 0.18% 5.73% 2.18% 0.68% 1.30%
Mar 0.09% 6.35% 3.23% 0.95% 1.44%
Average 0.26% 4.89% 2.21% 0.98% 1.69%
The information in the table above shows as follows:
• Johannesburg Metropolitan Police Department (JMPD) :
On average, elections to be tried in court stemmed from 0.26% of the infringement notices served by JMPD;
JMPD shows the lowest percentage of the four authorities : 0.26%; and
The highest percentage was for June: 0.64%.
• Tshwane Metropolitan Police Department (TMPD) :
On average, elections to be tried in court stemmed from 4.89% of the infringement notices served by TMPD;
TMPD shows the highest percentage of the four authorities : 4.89%; and
The highest percentage was for December: 7.23%.
• Gauteng Department of Community Safety (GDoCS) :
On average, elections to be tried in court stemmed from 2.21% of the infringement notices served by GDoCS;
GDoCS shows the second highest percentage of the four authorities : 2.21%; and

ANNUAL REPORT 2012/13 ROAD TRAFFIC INFRINGEMENT AGENCY124
The highest percentage was for March: 3.23%.
• Road Traf c Management Corporation (RTMC) :
On average, elections to be tried in court stemmed from 0.98% of the infringement notices served by RTMC;
RTMC shows the second lowest percentage of the four authorities : 0.98%; and
The highest percentage was for July: 1.82%.
• All four issuing authorities :
• On average, elections to be tried in court over the 2-year period stemmed from 1.69% of the infringement notices served by all four authorities; and
• The highest percentage was for August: 2.82%.
The information in the table above is also reflected in the graph below.

ChangeAhead
ANNUAL REPORT 2012/13 ROAD TRAFFIC INFRINGEMENT AGENCY 125
The percentage (%) of Infringement Notices served by the individual Issuing Authorities on which elections to be tried in court were submitted for the 2011-2012 and 2012-2013 nancial years respectively are reflected in the graphs below.
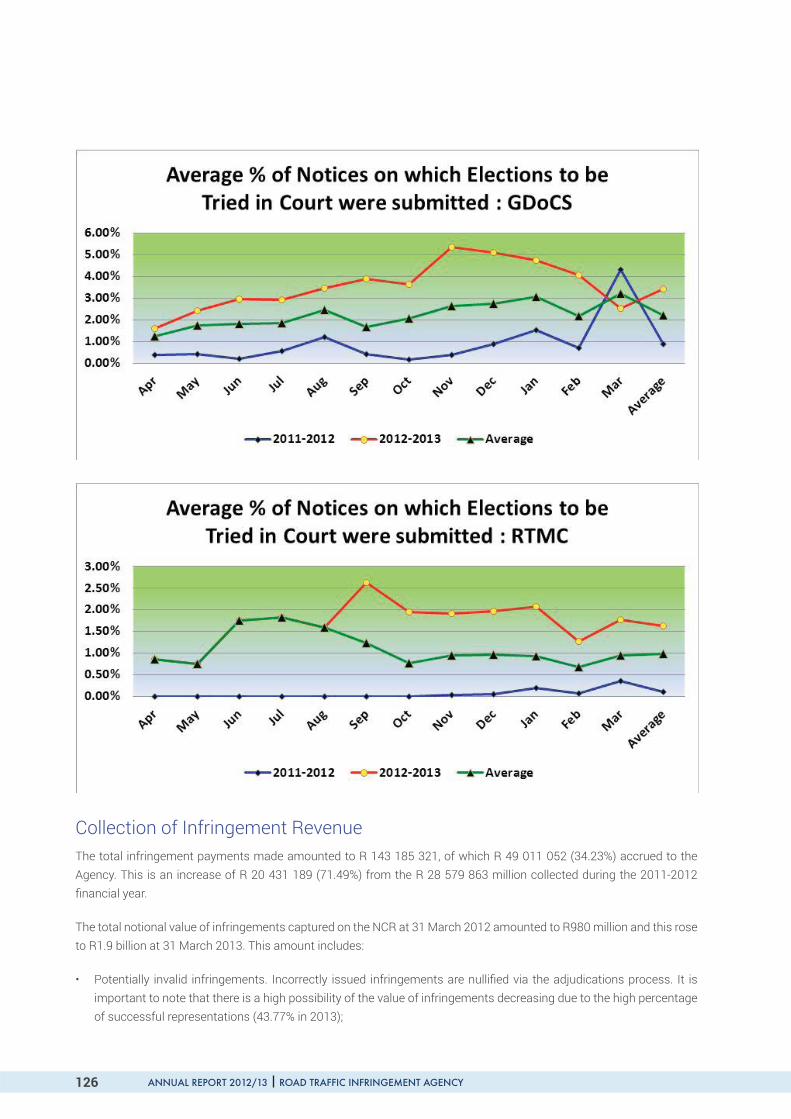
ANNUAL REPORT 2012/13 ROAD TRAFFIC INFRINGEMENT AGENCY126
Collection of Infringement RevenueThe total infringement payments made amounted to R 143 185 321, of which R 49 011 052 (34.23%) accrued to the Agency. This is an increase of R 20 431 189 (71.49%) from the R 28 579 863 million collected during the 2011-2012 nancial year.
The total notional value of infringements captured on the NCR at 31 March 2012 amounted to R980 million and this rose to R1.9 billion at 31 March 2013. This amount includes:
• Potentially invalid infringements. Incorrectly issued infringements are nulli ed via the adjudications process. It is important to note that there is a high possibility of the value of infringements decreasing due to the high percentage of successful representations (43.77% in 2013);

ChangeAhead
ANNUAL REPORT 2012/13 ROAD TRAFFIC INFRINGEMENT AGENCY 127
• Incomplete information is uploaded onto the NCR in some instances. As a result, the outstanding infringements are potentially overstated;
• Unmatched payments not uploaded onto the eNaTIS result in infringements being reflected as outstanding whereas they have already been settled; and
• Incorrect contact details of infringers on the eNaTIS can lead to the Agency not being able to contact the infringers. As a result the outstanding infringements will remain uncollected for a signi cant period.
Payments MadeThe table below represents the total number of infringements paid and uploaded onto the NCR, the amount paid as well as the month the payment was made in the nancial year 2012-2013, irrespective of when the infringements were captured onto the system.
Notices and Payments Captured
MonthCaptured
Number of Infringements
Captured
Penalty Value of Infringements
Captured (Rand)
Number of Infringements
Paid
Total Amount Paid (Rand)
Percentage of Infringements
Paid(Number)
Percentage of Infringements
Paid (Rand)
Apr 12 174 083 R 110 689 250.00 29 681 R 8 131 960.00 17.05% 7.35%
May 12 253 454 R 162 043 050.00 33 634 R 9 435 594.00 13.27% 5.82%
Jun 12 183 360 R 118 160 450.00 34 777 R 9 982 930.00 18.97% 8.45%
Jul 12 179 404 R 118 278 100.00 49 767 R 14 870 442.05 27.74% 12.57%
Aug 12 209 997 R 134 090 850.00 45 773 R 14 271 835.00 21.80% 10.64%
Sep 12 244 947 R 127 809 050.00 30 309 R 9 645 585.00 12.37% 7.55%
Oct 12 336 558 R 163 243 850.00 38 716 R 12 156 179.96 11.50% 7.45%
Nov 12 287 143 R 143 139 100.00 44 899 R 13 764 030.02 15.64% 9.62%
Dec 12 244 174 R 118 582 950.00 39 217 R 11 591 219.96 16.06% 9.77%
Jan 13 595 803 R 255 125 050.00 38 052 R 11 278 715.00 6.39% 4.42%
Feb 13 582 529 R 244 109 600.00 50 075 R 13 559 990.02 8.60% 5.55%
Mar 13 548 473 R 229 793 200.00 46 901 R 14 496 840.00 8.55% 6.31%
Total 3 839 925 R 1 925 064 500.00 481 801 R 143 185 321.01 12.55% 7.44%
The information above indicates that:
• A total number of 481 801 infringements was paid amounting to R143 185 321.00;
• The months with the highest number of infringements being paid was February 2013, when a total of 50 075infringements were paid, followed by July 2012 when a total of 49 767 infringements were paid; and
• The months with the highest value of infringements penalties being paid was July 2012, when a total amount of R14.870 million was paid, followed by March 2013 when a total of R14.496 million was paid.

ANNUAL REPORT 2012/13 ROAD TRAFFIC INFRINGEMENT AGENCY128
The amounts paid per month are also reflected in the graph below.
Payments Made
A comparison between the number of infringements paid and the total amounts paid per year for the 2011-2012 and 2012-2013 nancial years is given in the table below.
Notices and Payments Captured
Year Captured
Number of Infringements
Captured
Penalty Value of Infringements
Captured (Rand)
Number of Infringements
Paid
Total Amount Paid (Rand)
Percentage of InfringementsPaid (Number)
Percentage of Infringements
Paid (Rand)
2011-2012 1 787 517 R 980 500 950.00 251 125 R 86 553 514.98 14.05% 8.83%
2012-2013 3 839 925 R 1 925 064 500.00 481 801 R 143 185 321.01 12.55% 7.44%
Change 2 052 408 R 944 563 550.00 230 676 R 56 631 806.03 - -
% Change 114.82% 96.33% 91.86% 65.43% - -
The information in the table above shows that:
• The number of infringements captured increased by 2 052 408 (114.82%) from 1 787 517 in 2011-2012 to 3 839 925in 2012-2013;
• The penalty value of the infringements captured increased by R944 563 550.00 (96.33%) from R980 500 950.00 in 2011-2012 to R 1 925 064 500.00 in 2012-2013;
• The number of infringements paid increased by 230 676 (91.86%) from 251 125 to 481 801 in 2012-2013;
• The total penalty amount paid increased by R56 631 806.03 (65.43%) from R86 553 514.98 to R143 185 321.01 in 2012-2013; and
• The percentage of infringements paid (in Rand value) decreased from 8.83% in 2011-2012 to 7.44% in 2012-2013.

ChangeAhead
ANNUAL REPORT 2012/13 ROAD TRAFFIC INFRINGEMENT AGENCY 129
The percentage (%) of Notices paid per month during the 2011-2012 and 2012-2013 nancial years are also schematically reflected in the graph below.

ANNUAL REPORT 2012/13 ROAD TRAFFIC INFRINGEMENT AGENCY130
The information above shows that the average monthly number of notices paid decreased from 14.05% in 2011-2012 to 12.55% in 2012-2013.
Payments in Discount StageThe table below is a representation of the payments made whilst the infringements were still in the discounted stage (within the rst 32 days after the service of the notice). Payment of the infringement during this stage quali es the infringer to a 50% discount on the infringement penalty value and the total amount paid is disbursed to the IA that served the notice.
Notices and Payments made within 32 Days
MonthCaptured
Number of Infringements
Captured
Number of Infringements paid
within 32 days
Amount paid within 32 days
(Rand)
Percentage of Infringements paid
within 32 days (Number)
Percentage of Infringements paid
within 32 days (Rand)
Apr 12 174 083 8 824 R 2 060 250.00 5.07% 1.86%
May 12 253 454 10 063 R 2 549 515.00 3.97% 1.57%
Jun 12 183 360 9 578 R 2 516 580.00 5.22% 2.13%
Jul 12 179 404 10 522 R 2 866 620.00 5.86% 2.42%
Aug 12 209 997 10 282 R 2 806 225.00 4.90% 2.09%
Sep 12 244 947 8 492 R 2 460 500.00 3.47% 1.93%
Oct 12 336 558 11 360 R 2 875 650.00 3.38% 1.76%
Nov 12 287 143 13 993 R 3 386 425.00 4.87% 2.37%
Dec 12 244 174 11 244 R 2 685 225.00 4.60% 2.26%
Jan 13 595 803 12 494 R 2 759 075.00 2.10% 1.08%
Feb 13 582 529 20 369 R 4 231 500.00 3.50% 1.73%
Mar 13 548 473 14 175 R 3 075 550.00 2.58% 1.34%
Total 3 839 925 141 396 R 34 273 115.00 3.68% 1.78%
The information above indicates that:
• A total of 141 396 notices was paid within 32 days amounting to R34 273 115.00;
• The months with the highest number of infringements being paid was February 2013, when a total of 20 369 infringements were paid, followed by March 2013 when a total of 14 175 infringements were paid; and
• The months with the highest value of infringements penalties being paid was February 2013, when a total amount of R4.231 million was paid, followed by November 2012 when a total of R3.386 million was paid.

ChangeAhead
ANNUAL REPORT 2012/13 ROAD TRAFFIC INFRINGEMENT AGENCY 131
The amounts paid per month are also reflected in the graph below.
A comparison between the number of infringements paid within 32 days and the total amounts paid per year for the 2011-2012 and 2012-2013 nancial years is given in the table below.
Notices and Payments made within 32 Days
Year CapturedNumber of
InfringementsCaptured
Number of Infringementspaid within 32
days
Amount paid within 32 days
(Rand)
Percentage of Infringements paid
within 32 days (Number)
Percentage of Infringements paid
within 32 days (Rand)
2011-2012 1 787 517 72 148 R 24 371 500.00 4.04% 2.49%
2012-2013 3 839 925 141 396 R 34 273 115.00 3.68% 1.78%
Change 2 052 408 69 248 R 9 901 615.00 - -
% Change 114.82% 95.98% 40.63% - -
The information in the table above shows that:
• The number of infringements paid within 32 days increased by 69 248 (95.98%) from 72 148 in 2011-2012 to 141 396 in 2012-2013;
• The total penalty amount paid increased by R9 901 615.00 (40.63%) from R24 371 500.00 to R34 273 115.00 in 2012-2013;
• The percentage of infringements paid (in terms of number paid) decreased from 4.04% in 2011-2012 to 3.68% in 2012-2013; and
• The percentage of infringements paid (in terms of Rand value) decreased from 2.49% in 2011-2012 to 1.78% in 2012-2013.

ANNUAL REPORT 2012/13 ROAD TRAFFIC INFRINGEMENT AGENCY132
The percentage (%) of Notices paid per month within 32 days during the 2011-2012 and 2012-2013 nancial years are also schematically reflected in the graph below.
The information above shows that the average monthly number of notices paid decreased from 4.04% in 2011-2012 to 3.68% in 2012-2013.

ChangeAhead
ANNUAL REPORT 2012/13 ROAD TRAFFIC INFRINGEMENT AGENCY 133
Payments made in Courtesy Letter StageThe table below represents the payments made whilst the infringements were in the Courtesy Letter phase, which is from 33 days up to 64 days from the date that the Infringement Notice was served. At this stage the infringer no longer quali es for a 50% discount on the penalty value and the full penalty amount is applicable for payment.
Notices and Payments made from 33 to 64 Days
Month CapturedNumber of
InfringementsCaptured
Number of Infringements
paid from 33 to 64 days
Amount Paid from 33 to 64 days (Rand)
Percentage of Infringements
paid from 33 to 64 days (Number)
Percentage of Infringements
paid from 33 to 64 days (Rand)
Apr 12 174 083 5 024 R 1 279 635.00 2.89% 1.16%
May 12 253 454 6 842 R 1 773 110.00 2.70% 1.09%
Jun 12 183 360 7 232 R 2 124 635.00 3.94% 1.80%
Jul 12 179 404 9 583 R 3 301 315.00 5.34% 2.79%
Aug 12 209 997 6 316 R 2 563 820.00 3.01% 1.91%
Sep 12 244 947 3 738 R 1 551 700.00 1.53% 1.21%
Oct 12 336 558 6 924 R 2 654 600.00 2.06% 1.63%
Nov 12 287 143 8 809 R 2 874 600.00 3.07% 2.01%
Dec 12 244 174 7 499 R 2 338 750.00 3.07% 1.97%
Jan 13 595 803 7 530 R 2 424 775.00 1.26% 0.95%
Feb 13 582 529 10 843 R 2 805 900.00 1.86% 1.15%
Mar 13 548 473 11 893 R 3 294 575.00 2.17% 1.43%
Total 3 839 925 92 233 R 28 987 415.00 2.40% 1.51%
The information above indicates that:
• A total of 92 233 notices were paid from 33 to 64 days amounting to R28 987 415.00;
• The months with the highest number of infringements being paid was March 2013, when a total of 11 893 infringements were paid, followed by February 2013 when a total of 10 843 infringements were paid; and
• The months with the highest value of infringements penalties being paid was July 2012, when a total amount of R 3.301 million was paid, followed by March 2013 when a total of R3.294 million was paid.
The amounts paid per month are also reflected in the graph below.

ANNUAL REPORT 2012/13 ROAD TRAFFIC INFRINGEMENT AGENCY134
A comparison between the numbers of infringements paid from 33 to 64 days after the notices were served and the total amounts paid per year for the 2011-2012 and 2012-2013 nancial years respectively is given in the table below.
Notices and Payments made from 33 to 64 Days
Year Captured
Number of Infringements
Captured
Number of Infringements
paid from 33 to 64 days
Amount Paid from 33 to 64 days
(Rand)
Percentage of Infringements paid from 33 to 64 days
(Number)
Percentage of Infringements
paid from 33 to 64 days (Rand)
2011-2012 1 787 517 17 236 R 9 481 055.00 0.96% 0.97%
2012-2013 3 839 925 92 233 R 28 987 415.00 2.40% 1.51%
Change 2 052 408 74 997 R 19 506 360.00 - -
% Change 114.82% 435.11% 205.74% - -
The information in the table above shows that:
• The number of infringements paid from 33 to 64 days increased by 74 997 (435.11%) from 17 236 in 2011-2012 to 92 233 in 2012-2013;
• The total penalty amount paid increased by R19 506 360.00 (205.74%) from R9 481 055.00 to R34 273 115.00 in 2012-2013;
• The percentage of infringements paid (in terms of number paid) increased from 0.96% in 2011-2012 to 2.40% in 2012-2013; and
• The percentage of infringements paid (in terms of Rand value) increased from 0.97% in 2011-2012 to 1.51% in 2012-2013.

ChangeAhead
ANNUAL REPORT 2012/13 ROAD TRAFFIC INFRINGEMENT AGENCY 135
The % of notices paid per month from 33 to 64 days during the 2011-2012 and 2012-2013 nancial years are also schematically reflected in the graph below.
The information above shows that:
• The average monthly number of notices paid increased from 0.96% in 2011-2012 to 2.40% in 2012-2013; and
• Payments in July increased from 0.51% in 2011-2012 to 5.34% in 2012-2013.

ANNUAL REPORT 2012/13 ROAD TRAFFIC INFRINGEMENT AGENCY136
Payments made in Enforcement Order StageThe table below represents the payments made whilst the infringements were in the enforcement order stage, which is after 64 days from the date that the infringement notice was served.
Notices and Payments made after 64 Days
MonthCaptured
Number of Infringements
Captured
Number of Infringements
paid after 64 days
Amount Paid after 64 days (Rand)
Percentage of Infringements
paid after 64 days (Number)
Percentage of Infringements paid
after 64 days (Rand)
Apr 12 174 083 15 833 R 4 792 075.00 9.10% 4.33%
May 12 253 454 16 729 R 5 112 969.00 6.60% 3.16%
Jun 12 183 360 17 967 R 5 341 715.00 9.80% 4.52%
Jul 12 179 404 29 662 R 8 702 507.05 16.53% 7.36%
Aug 12 209 997 29 175 R 8 901 790.00 13.89% 6.64%
Sep 12 244 947 18 079 R 5 633 385.00 7.38% 4.41%
Oct 12 336 558 20 432 R 6 625 929.96 6.07% 4.06%
Nov 12 287 143 22 097 R 7 503 005.02 7.70% 5.24%
Dec 12 244 174 20 474 R 6 567 244.96 8.39% 5.54%
Jan 13 595 803 18 028 R 6 094 865.00 3.03% 2.39%
Feb 13 582 529 18 863 R 6 522 590.02 3.24% 2.67%
Mar 13 548 473 20 833 R 8 126 715.00 3.80% 3.54%
Total 3 839 925 248 172 R 79 924 791.01 6.46% 4.15%
The information above indicates that:
• A total of 248 172 notices were paid after 64 Days amounting to R79 924 791.01;
• The months with the highest number of infringements being paid was July 2012, when a total of 29 662 infringements were paid, followed by August 2013 when a total of 29 175 infringements were paid; and
• The months with the highest value of infringements penalties being paid was August 2012, when a total amount of R8.901 million was paid, followed by July 2012 when a total of R8.702 million was paid.
The amounts paid per month are also reflected in the graph below.

ChangeAhead
ANNUAL REPORT 2012/13 ROAD TRAFFIC INFRINGEMENT AGENCY 137
A comparison between the number of infringements paid after 64 days after the notices were served and the total amounts paid per year for the 2011-2012 and 2012-2013 nancial years respectively is given in the table below.
Notices and Payments made after 64 Days
Year CapturedNumber of
InfringementsCaptured
Number of Infringementspaid after 64
days
Amount Paid after 64 days (Rand)
Percentage of Infringements
paid after 64 days (Number)
Percentage of Infringements
paid after 64 days (Rand)
2011-2012 1 787 517 97 609 R 52 700 959.98 5.46% 5.37%
2012-2013 3 839 925 248 172 R 79 924 791.01 6.46% 4.15%
Change 2 052 408 150 563 R 27 223 831.03 - -
% Change 114.82% 154.25% 51.66% - -
The information in the table above shows that:
• The number of infringements paid after 64 days increased by 150 563 (154.25%) from 97 609 in 2011-2012 to 248 172 in 2012-2013;
• The total penalty amount paid increased by R27 223 831.03 (51.66%) from R52 700 959.98 to R79 924 791.01 in 2012-2013;
• The percentage of infringements paid (in terms of number paid) increased from 5.46% in 2011-2012 to 6.46% in 2012-2013; and
• The percentage of infringements paid (in terms of Rand value) decreased from 5.37% in 2011-2012 to 4.15% in 2012-2013.

ANNUAL REPORT 2012/13 ROAD TRAFFIC INFRINGEMENT AGENCY138
The percentage (%) of Notices paid per month after 64 days during the 2011-2012 and 2012-2013 nancial years are also schematically reflected in the graph below.
The information above shows that:
• The average monthly number of Notices paid increased from 5.46% in 2011-2012 to 6.46% in 2012-2013; and
• Payments in July increased from 2.03% in 2011-2012 to 16.53% in 2012-2013.
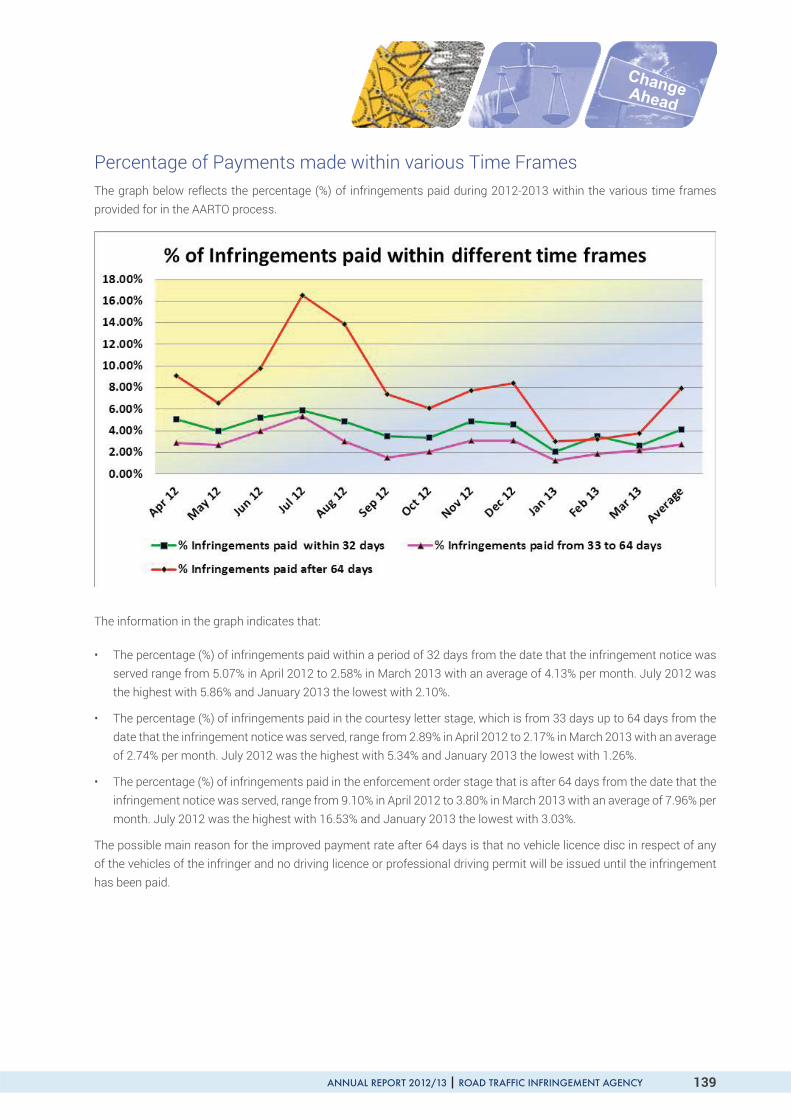
ChangeAhead
ANNUAL REPORT 2012/13 ROAD TRAFFIC INFRINGEMENT AGENCY 139
Percentage of Payments made within various Time FramesThe graph below reflects the percentage (%) of infringements paid during 2012-2013 within the various time frames provided for in the AARTO process.
The information in the graph indicates that:
• The percentage (%) of infringements paid within a period of 32 days from the date that the infringement notice was served range from 5.07% in April 2012 to 2.58% in March 2013 with an average of 4.13% per month. July 2012 was the highest with 5.86% and January 2013 the lowest with 2.10%.
• The percentage (%) of infringements paid in the courtesy letter stage, which is from 33 days up to 64 days from the date that the infringement notice was served, range from 2.89% in April 2012 to 2.17% in March 2013 with an average of 2.74% per month. July 2012 was the highest with 5.34% and January 2013 the lowest with 1.26%.
• The percentage (%) of infringements paid in the enforcement order stage that is after 64 days from the date that the infringement notice was served, range from 9.10% in April 2012 to 3.80% in March 2013 with an average of 7.96% per month. July 2012 was the highest with 16.53% and January 2013 the lowest with 3.03%.
The possible main reason for the improved payment rate after 64 days is that no vehicle licence disc in respect of any of the vehicles of the infringer and no driving licence or professional driving permit will be issued until the infringement has been paid.

ANNUAL REPORT 2012/13 ROAD TRAFFIC INFRINGEMENT AGENCY140
Correction of some data contained in the 2011-2012 Annual ReportThe table showing the total number of Infringement Notices paid during the 2011-2012 nancial year as printed on page 46 of the 2011-2012 Annual Report was not correct, and should be replaced with the following table:
Month Captured
Number of Infringements
Captured
Penalty Value of Infringements Captured
(Rand)
Number of Infringements
Paid
Total Amount Paid (Rand)
Percentage of Infringements
Paid (Number)
Percentage of Infringements
Paid (Rand)
Apr 11 109 573 R 56 641 200.00 18 964 R 8 420 994.98 17.31% 14.87%
May 11 219 619 R 110 543 100.00 23 722 R 10 474 795.00 10.80% 9.48%
Jun 11 133 722 R 69 770 000.00 31 287 R 14 444 265.00 23.40% 20.70%
Jul 11 171 898 R 87 700 700.00 9 212 R 3 611 500.00 5.36% 4.12%
Aug 11 106 372 R 55 042 050.00 10 986 R 4 778 265.00 10.33% 8.68%
Sep 11 111 885 R 59 555 500.00 13 125 R 5 937 365.00 11.73% 9.97%
Oct 11 121 264 R 69 679 400.00 9 292 R 4 250 320.00 7.66% 6.10%
Nov 11 176 775 R 99 421 550.00 12 979 R 6 071 880.00 7.34% 6.11%
Dec 11 120 343 R 63 414 600.00 13 413 R 6 284 345.00 11.15% 9.91%
Jan 12 170 008 R 97 912 750.00 12 836 R 6 288 355.00 7.55% 6.42%
Feb 12 164 761 R 99 294 450.00 16 239 R 8 177 265.00 9.86% 8.24%
Mar 12 181 297 R 111 525 650.00 14 940 R 7 814 165.00 8.24% 7.01%
Total 1 787 517 R 980 500 950.00 186 993 R 86 553 514.98 10.46% 8.83%
All Notices and Payments Captured
The total number of Notices paid during the 2011-2012 nancial year was 186 993 and not 251 125. This amendment also results in an amendment of the percentage (%) of Notices paid during the various months. The total amount paid remains R 86 553 514.96.
General Note:It should be noted that all the basic data on which the statistics contained under Section 4 above are based, were provided by the NaTIS contractor and is reflecting the data as captured on the National Contraventions Register (NCR) which operates as a module on eNaTIS.

ChangeAhead
ANNUAL REPORT 2012/13 ROAD TRAFFIC INFRINGEMENT AGENCY 141
Highlights and Achievements

ANNUAL REPORT 2012/13 ROAD TRAFFIC INFRINGEMENT AGENCY142
Section 5: Highlights and achievementsAudit Performance The Agency received an unquali ed audit opinion and this follows a similar one received in the last nancial year ended 31 March 2012.
The matters of impairment and under-funding have been noted by the Board and management to be sources of high risk for the Agency and even though both presently lie outside of its immediate control, are nevertheless receiving priority attention.
Legislative Framework The publication of the Amendment Bill in Government Gazette 36173 dated 20 February 2013 was the culmination of an initiative by the Agency to amend its enabling laws and regulations based on experience and intended to enhance operational ef ciency.
The process to amend the legislative framework has been an intensively interactive one, with the active participation of various stakeholders representing the public, labour and business under the umbrella of NEDLAC in particular.
Institutional Capacitation Whereas the Agency started with a total of 22 staff at the beginning of the nancial period, this was increased to a total of 38 at the end of the period. The additional staff of 16 was brought in to build capacity in the key areas of Audit and Risk Management, Information Technology and Debt Collection Units.
The pace of recruitment was constrained by the underfunding situation whereby the MTEF grant was R 5 million for the year and this was only supplemented at year end when the Department of Transport made a virement of R 14 million.
Infringement Penalty CollectionRTIA’s share of revenue from outstanding road traf c infringements penalties amounted to R 49 million against a revised target of R 50 million. The result compares well with the total share of revenue of R 28.5 million achieved last year.
Data Clean-up After experiencing problems of data integrity and the lack of enforcement of the address validation on the NCR, as well as the non-uploading of infringement payments on the NCR, the Agency embarked on a data cleaning project as a matter of priority this year.
The project made commendable progress in that a total of 79 440 transactions with a value of R 143.2 million were updated and this helped close the reconciliation gap of 107 000 transactions with a value of R 207 million that were still to be uploaded at the start of the report period.
Adjudications Performance The total number of Representations received was 35,552 from which 34,869 Representations were adjudicated. This is slightly less than the total number of Representations applications received in the preceding year.

ChangeAhead
ANNUAL REPORT 2012/13 ROAD TRAFFIC INFRINGEMENT AGENCY 143
Marketing and EducationThe AARTO national marketing and educational programmes were conducted through targeted publications, collaboration with the Department of Transport and other transport sector stakeholders mainly during Easter and Festive Season Road Safety campaigns. Key exhibitions were conducted, which targeted high-traf c areas and peak periods offering the highest impact, such as those executed during the launch of October Transport Month and the Rand Show in NASREC which increased public awareness of the RTIA brand and educated the public about their rights and responsibilities under the AARTO Act.
The Agency devised a programme to ‘take its services to the people’ through setting up kiosks in the various communication events. The kiosk project is geared to educate the public and encourage infringers to pay their outstanding infringements thus foster voluntary compliance with road traf c laws and take responsibility for their actions.

ANNUAL REPORT 2012/13 ROAD TRAFFIC INFRINGEMENT AGENCY144
PAY FULL AMOUNT AND ADMIN FEE ELECT TO BE TRIED IN COURT
PAY FULL AMOUNT AND ADMIN FEE ELECT TO BE TRIED IN COURT APPLY FOR REVOCATION OF ENFORCEMENT ORDER
PAY FULL AMOUNT AND ADMIN FEE MAKE A REPRESENTATION ELECT TO BE TRIED IN COURT
PAY THE DISCOUNTED AMOUNT (50%)
NOMINATE A DRIVER OR PERSON IN CONTROL MAKE A REPRESENTATION
ELECT TO BE TRIED IN COURT
ARRANGE TO PAY IN INSTALLMENTS
ARRANGE TO PAY IN INSTALLMENTS
SHERIFF COLLECTS MOVABLE PROPERTY TO SELL
AFTER A WARRANT OF EXECUTION HAS BEEN SERVED
AFTER RECEIVING AN ENFORCEMENT ORDER (3rd 32 DAY CYCLE)
AFTER RECEIVING A COURTESY LETTER (2nd 32 DAY CYCLE)
AFTER RECEIVING AN INFRINGEMENT NOTICE (1ST32 DAY CYCLE )
The AARTO Process ow:

ChangeAhead
ANNUAL REPORT 2012/13 ROAD TRAFFIC INFRINGEMENT AGENCY 145
Performance Information

ANNUAL REPORT 2012/13 ROAD TRAFFIC INFRINGEMENT AGENCY146
Section 6: Performance Information Report Overview of the Performance Management FrameworkFor the period under review, the Agency committed to the following strategic objectives:
2012/13 Strategic Objectives:1. To increase Agency revenue share from the outstanding road traf c infringement penalties.
2. Implementation of effective governance processes to achieve an unquali ed opinion.
3. Implementation of AARTO communication campaigns.
4. Implementation of effective adjudication processes.
5. Comprehensive legislative review.
6. Full transfer of AARTO functions to the RTIA.
Strategic objective 1 To increase the Agency’s revenue share from the outstanding road tra c infringement penalties.
Objective statement To ensure compliance with the AARTO Act by the users.
Baseline The RTIA currently receives minimal funding by the DoT/National Treasury and relies on revenue collected from AARTO pilot project sites.
Justi cation Improved compliance to the Road Traf c Laws by road users.
LinksTo contribute to the achievement of the objective of encouraging the payment of outstanding penalties as provided by the AARTO Act, requirements of the Public Finance Management Act and the DoT Strategic priorities
Included in Annual Performance Plan – annual targets:
Strategic objectiveStrategic Plan
target2012/13
Audited/Actual performance Estimated performance
2012/13
Medium-term targets
2009/10 2010/11 2011/12 2013/14 2014/15 2015/16
1.
To increase the Agency’s revenue share from the outstandingroad traf c infringementpenalties.
Introduction of debt collectors.
Uploadingof penalties relating to the JMPD on the eNaTIS system to facilitate collection of infringementpenalties
R292m R290m
Was R319.1m(Revised to R50m)
R351m R351m
Programme performance indicators identi ed above.
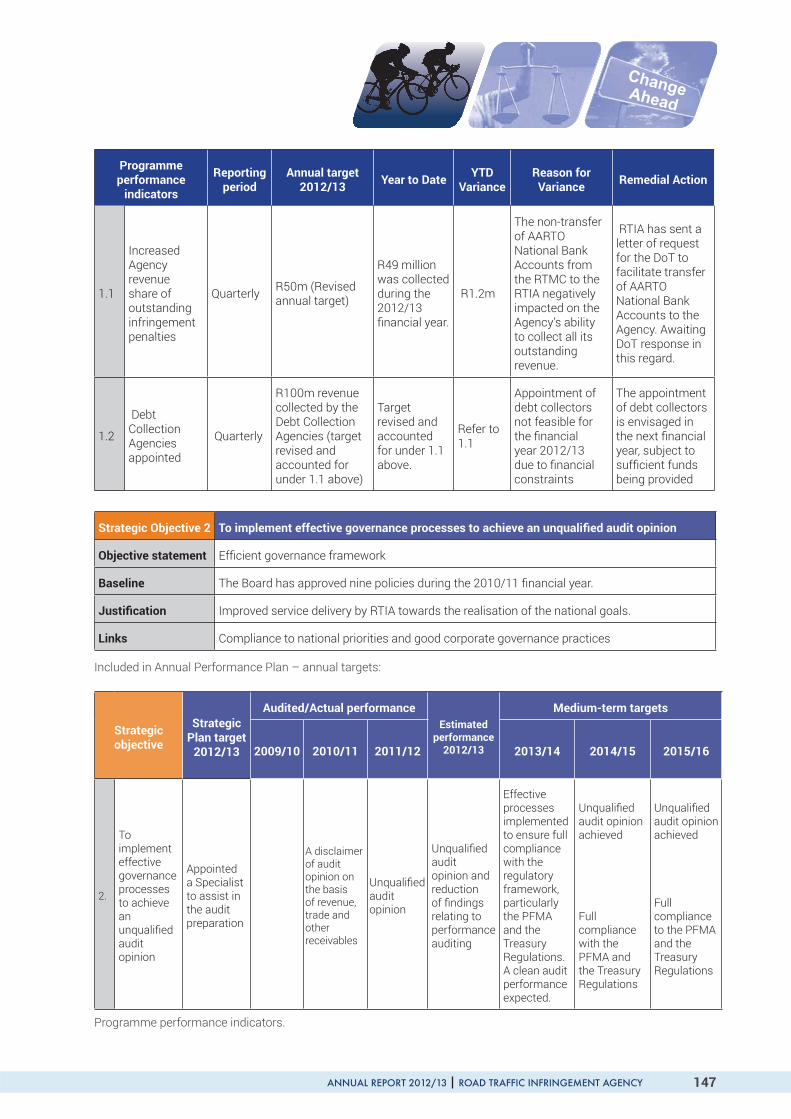
ChangeAhead
ANNUAL REPORT 2012/13 ROAD TRAFFIC INFRINGEMENT AGENCY 147
Programmeperformance
indicators
Reporting period
Annual target 2012/13 Year to Date YTD
VarianceReason for Variance Remedial Action
1.1
Increased Agencyrevenue share of outstandinginfringementpenalties
Quarterly R50m (Revised annual target)
R49 million was collected during the 2012/13 nancial year.
R1.2m
The non-transfer of AARTO National Bank Accounts from the RTMC to the RTIA negatively impacted on the Agency’s ability to collect all its outstandingrevenue.
RTIA has sent a letter of request for the DoT to facilitate transfer of AARTO National Bank Accounts to the Agency. Awaiting DoT response in this regard.
1.2
Debt CollectionAgenciesappointed
Quarterly
R100m revenue collected by the Debt Collection Agencies (target revised and accounted for under 1.1 above)
Target revised and accountedfor under 1.1 above.
Refer to 1.1
Appointment of debt collectors not feasible for the nancial year 2012/13 due to nancial constraints
The appointment of debt collectors is envisaged in the next nancial year, subject to suf cient funds being provided
Strategic Objective 2 To implement effective governance processes to achieve an unquali ed audit opinion
Objective statement Ef cient governance framework
Baseline The Board has approved nine policies during the 2010/11 nancial year.
Justi cation Improved service delivery by RTIA towards the realisation of the national goals.
Links Compliance to national priorities and good corporate governance practices
Included in Annual Performance Plan – annual targets:
Strategicobjective
StrategicPlan target
2012/13
Audited/Actual performanceEstimated
performance2012/13
Medium-term targets
2009/10 2010/11 2011/12 2013/14 2014/15 2015/16
2.
To implementeffective governance processes to achieve anunquali ed auditopinion
Appointeda Specialist to assist in the audit preparation
A disclaimer of audit opinion on the basis of revenue, trade and otherreceivables
Unquali ed auditopinion
Unquali ed auditopinion and reduction of ndings relating to performance auditing
Effective processes implementedto ensure full compliancewith the regulatory framework,particularly the PFMA and the Treasury Regulations.A clean audit performance expected.
Unquali ed audit opinion achieved
Full compliancewith the PFMA and the Treasury Regulations
Unquali ed audit opinion achieved
Full complianceto the PFMA and the Treasury Regulations
Programme performance indicators.

ANNUAL REPORT 2012/13 ROAD TRAFFIC INFRINGEMENT AGENCY148
Programme performance indicators
Reporting period
Annualtarget
2012/13Year To Date YTD
Variance
Reasonfor
Variance
RemedialAction
2.1
Unquali ed auditopinionachieved
AnnuallyUnquali ed auditopinion
Target achieved.
RTIA Strategic Plan, Annual Performance Plan, and Budget for 2012/13 were approved and tabled in Parliament on the 7th
March 2012
All quarterly reports were submitted to the Department of Transport on time.
Internal systems of control developed and implemented as a mechanism towards the achievement of clean administration.
N/A N/A N/A
Strategic objective 3 Implementation of effective AARTO communication campaigns
Objective statement To create awareness and form strategic partnerships
Baseline Draft RTIA communication strategy developed
Justi cation Improved awareness and brand recognition of RTIA.
Links Contribution to effective stakeholder relations
Included in Annual Performance Plan – annual targets:

ChangeAhead
ANNUAL REPORT 2012/13 ROAD TRAFFIC INFRINGEMENT AGENCY 149
Stra
tegi
c ob
ject
ive
Stra
tegi
c Pl
an
targ
et20
12/1
3
Audi
ted/
Actu
al p
erfo
rman
ceEs
timat
ed
perf
orm
ance
2012
/13
Med
ium
-ter
m ta
rget
s
2009
/10
2010
/11
2011
/12
2013
/14
2014
/15
2015
/16
3.
Impl
emen
tatio
nof
effe
ctiv
e AA
RTO
co
mm
unic
atio
npr
ogra
mm
es
Effe
ctiv
e Co
mm
unic
atio
nca
mpa
igns
deve
lope
d
Draf
tco
mm
unic
atio
nsst
rate
gydo
cum
ent w
as
deve
lope
d
Appr
oved
co
mm
unic
atio
nst
rate
gy
Impl
emen
tef
fect
ive
AART
O
natio
nal m
arke
ting
and
educ
atio
n pr
ogra
mm
es.
Impl
emen
t AAR
TO
med
ia c
ampa
igns
lin
ked
to n
atio
nal
road
saf
ety
prog
ram
mes
.
Roll
out e
ffect
ive
AART
O n
atio
nal
mar
ketin
g an
d ed
ucat
ion
prog
ram
mes
.
Impl
emen
t AAR
TO
med
ia c
ampa
igns
lin
ked
to n
atio
nal
road
saf
ety
prog
ram
mes
st
rate
gy
Sust
ain,
mon
itor
and
eval
uate
the
effe
ctiv
enes
s of
AA
RTO
mar
ketin
g an
d ed
ucat
iona
l pr
ogra
mm
es.
Sust
ain,
mon
itor
and
eval
uate
AAR
TO
med
ia c
ampa
igns
lin
ked
to n
atio
nal
road
saf
ety
stra
tegy
an
d pr
ogra
mm
es
Prog
ram
me
perf
orm
ance
indi
cato
rs.

ANNUAL REPORT 2012/13 ROAD TRAFFIC INFRINGEMENT AGENCY150
Prog
ram
me
perf
orm
ance
in
dica
tors
Repo
rtin
g pe
riod
Annu
al ta
rget
20
12/1
3Ye
ar T
o Da
teYT
D Va
rianc
eRe
ason
for
Varia
nce
Rem
edia
lAc
tion
3.1
Impl
emen
t ef
fect
ive
AART
O n
atio
nal
mar
ketin
g an
d ed
ucat
iona
lpr
ogra
mm
es.
AART
O m
edia
ca
mpa
igns
linke
d to
na
tiona
lro
ad s
afet
y pr
ogra
mm
es
Qua
rter
lyEf
fect
ive
AART
O n
atio
nal
mar
ketin
g an
d ed
ucat
ion
prog
ram
mes
im
plem
ente
d
Effe
ctiv
e AA
RTO
med
ia
cam
paig
nslin
ked
to
natio
nal
road
saf
ety
prog
ram
mes
de
velo
ped.
The
term
s of
refe
renc
e an
d bi
d do
cum
enta
tion
for
the
appo
intm
ent o
f a m
arke
ting
and
educ
atio
nal
serv
ice
prov
ider
on
AART
O a
nd n
atio
nal r
oad
safe
ty
prog
ram
mes
has
bee
n de
velo
ped.
Fest
ive
seas
on e
duca
tiona
l roa
d sa
fety
cam
paig
ns
wer
e he
ld in
the
2012
/13
fest
ive
seas
on re
achi
ng
mor
e th
an 5
000
mot
oris
ts a
nd p
asse
nger
s at
var
ious
m
ajor
rout
es s
uch
as th
e Ph
umla
ni T
oll P
laza
, N12
, N3
and
Joha
nnes
burg
Educ
atio
nal E
xhib
ition
at H
ando
ver T
orch
of P
eace
by
Min
iste
r of T
rans
port
to E
duca
tion
Min
iste
r rea
chin
g 30
0 gu
ests
Part
ners
hip
disc
ussi
ons
held
with
Equ
estr
a, S
AVRA
LA
and
C-BR
TA to
pre
pare
MO
Us
East
er R
oad
Safe
ty C
ampa
ign
and
educ
atio
nal
exhi
bitio
n in
Pol
okw
ane
reac
hed
mor
e th
an 1
500
peop
le
JHB
Wan
dere
rs T
axi R
ank
East
er R
oad
Safe
ty
Cam
paig
n br
and
activ
atio
n an
d ed
ucat
ion.
Rea
ched
m
ore
than
150
0 pe
ople
, tax
i driv
ers
and
pass
enge
rs
East
er R
and
Show
pub
lic a
war
enes
s an
d ed
ucat
iona
l ex
hibi
tion
from
28
Mar
ch to
01
April
201
3 re
achi
ng
over
250
0 pe
ople
AART
O e
duca
tion
and
awar
enes
s pr
ogra
mm
es w
ere
impa
rted
to
mor
e th
an 2
5000
rea
ders
of
Lead
ersh
ip
and
Safe
Tra
vel M
agaz
ines
whi
ch c
arrie
d fe
atur
es a
nd
pro
le o
f the
RTI
A in
bot
h pu
blic
atio
ns w
ith e
mph
asis
on
the
inf
ringe
men
ts s
tatu
s re
late
d to
AAR
TO,
Pay-
men
ts o
f inf
ringe
men
ts n
otic
es a
nd th
e op
tions
ava
il-ab
le to
infr
inge
rs in
rela
tion
to th
e in
frin
gem
ent n
otic
es.
AART
O p
rogr
amm
es f
or n
atio
nal,
prov
inci
al a
nd lo
cal
med
ia n
etw
ork
enga
gem
ent f
unct
ions
wer
e de
velo
ped.
Com
mun
icat
ion
and
Educ
atio
n Bi
ds e
nvis
aged
fo
r the
201
3/14
pe
riod
Urg
ent f
undi
ng
requ
ired
initi
atin
gsi
gni
cant
co
mm
unic
atio
nan
d ed
ucat
ion
prog
ram
mes
.
Depa
rtm
ent
of T
rans
port
ap
proa
ched
to
ass
ist
with
fund
ing
inje
ctio
n.
Part
ners
hips
on
pla
tfor
ms
esta
blis
hed
to
com
mun
icat
etr
ansp
ort
safe
ty re
late
d pr
ogra
mm
es
thro
ugho
ut th
e co
untr
y.

ChangeAhead
ANNUAL REPORT 2012/13 ROAD TRAFFIC INFRINGEMENT AGENCY 151
Stra
tegi
c ob
ject
ive
4To
dev
elop
e c
ient
adj
udic
atio
n pr
oces
s in
line
with
the
AART
O A
ct
Obj
ectiv
e st
atem
ent
To e
nsur
e in
crea
sed
rate
of p
aym
ent o
f inf
ringe
men
t pen
altie
s an
d co
mpl
ianc
e to
road
traf
c la
ws.
Base
line
Eigh
t Rep
rese
ntat
ion
of c
ers
appo
inte
d to
exe
cute
the
task
.
Just
i ca
tion
Enha
nced
com
plia
nce
to th
e AA
RTO
Act
and
Roa
d Tr
af c
Leg
isla
tion.
Link
sCo
ntrib
utio
n to
the
natio
nal p
riorit
ies
of g
over
nmen
t of e
nsur
ing
a sa
fe a
nd s
ecur
e tr
ansp
ort.
Incl
uded
in A
nnua
l Per
form
ance
Pla
n –
ann
ual t
arge
ts:
Stra
tegi
c ob
ject
ive
Stra
tegi
c Pl
an
targ
et20
12/1
3
Audi
ted/
Actu
al p
erfo
rman
ceEs
timat
edpe
rfor
man
ce20
12/1
3
Med
ium
-ter
m ta
rget
s
2009
/10
2010
/11
2011
/12
2013
/14
2014
/15
2015
/16
4.
To d
evel
op e
f ci
ent
adju
dica
tion
proc
esse
s in
line
with
the
AART
O
Act
179
520
AART
O
repr
esen
tatio
ns
adju
dica
ted.
8 40
8 re
pres
enta
tions
ad
judi
cate
d
4000
0 AA
RTO
re
pres
enta
tions
ad
judi
cate
d
179
520
AART
O
repr
esen
tatio
ns
adju
dica
ted
380
000
AART
O
repr
esen
tatio
ns
adju
dica
ted
780
000
AART
O
repr
esen
tatio
ns
adju
dica
ted
Prog
ram
me
perf
orm
ance
indi
cato
rs.
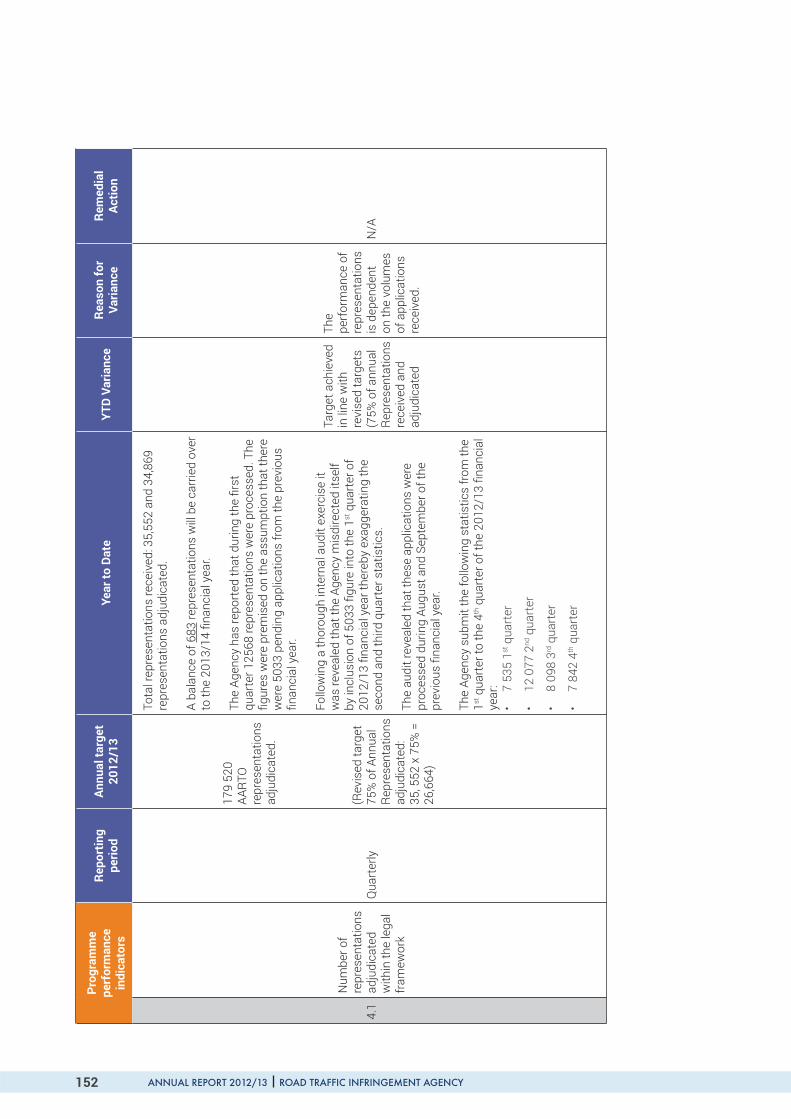
ANNUAL REPORT 2012/13 ROAD TRAFFIC INFRINGEMENT AGENCY152
Prog
ram
me
perf
orm
ance
in
dica
tors
Repo
rtin
g pe
riod
Annu
al ta
rget
20
12/1
3Ye
ar to
Dat
eYT
D Va
rianc
eRe
ason
for
Varia
nce
Rem
edia
lAc
tion
4.1
Num
ber o
f re
pres
enta
tions
ad
judi
cate
dw
ithin
the
lega
l fr
amew
ork
Qua
rter
ly
179
520
AART
O
repr
esen
tatio
ns
adju
dica
ted.
(Rev
ised
targ
et
75%
of A
nnua
l Re
pres
enta
tions
ad
judi
cate
d:35
, 552
x 7
5% =
26
,664
)
Tota
l rep
rese
ntat
ions
rece
ived
: 35,
552
and
34,8
69
repr
esen
tatio
ns a
djud
icat
ed.
A ba
lanc
e of
683
repr
esen
tatio
ns w
ill b
e ca
rrie
d ov
er
to th
e 20
13/1
4 n
anci
al y
ear.
The
Agen
cy h
as re
port
ed th
at d
urin
g th
e rs
t qu
arte
r 125
68 re
pres
enta
tions
wer
e pr
oces
sed.
The
g
ures
wer
e pr
emis
ed o
n th
e as
sum
ptio
n th
at th
ere
wer
e 50
33 p
endi
ng a
pplic
atio
ns fr
om th
e pr
evio
us
nan
cial
yea
r.
Follo
win
g a
thor
ough
inte
rnal
aud
it ex
erci
se it
w
as re
veal
ed th
at th
e Ag
ency
mis
dire
cted
itse
lf by
incl
usio
n of
503
3 g
ure
into
the
1st q
uart
er o
f 20
12/1
3 n
anci
al y
ear t
here
by e
xagg
erat
ing
the
seco
nd a
nd th
ird q
uart
er s
tatis
tics.
The
audi
t rev
eale
d th
at th
ese
appl
icat
ions
wer
e pr
oces
sed
durin
g Au
gust
and
Sep
tem
ber o
f the
pr
evio
us
nanc
ial y
ear.
The
Agen
cy s
ubm
it th
e fo
llow
ing
stat
istic
s fro
m th
e 1st
qua
rter
to th
e 4th
qua
rter
of t
he 2
012/
13
nanc
ial
year
: •
7 53
5 1st
qua
rter
• 12
077
2nd
qua
rter
• 8
098
3rd q
uart
er
• 7
842
4th q
uart
er
Targ
et a
chie
ved
in li
ne w
ith
revi
sed
targ
ets
(75%
of a
nnua
l Re
pres
enta
tions
re
ceiv
ed a
nd
adju
dica
ted
The
perf
orm
ance
of
repr
esen
tatio
ns
is d
epen
dent
on
the
volu
mes
of
app
licat
ions
re
ceiv
ed.
N/A
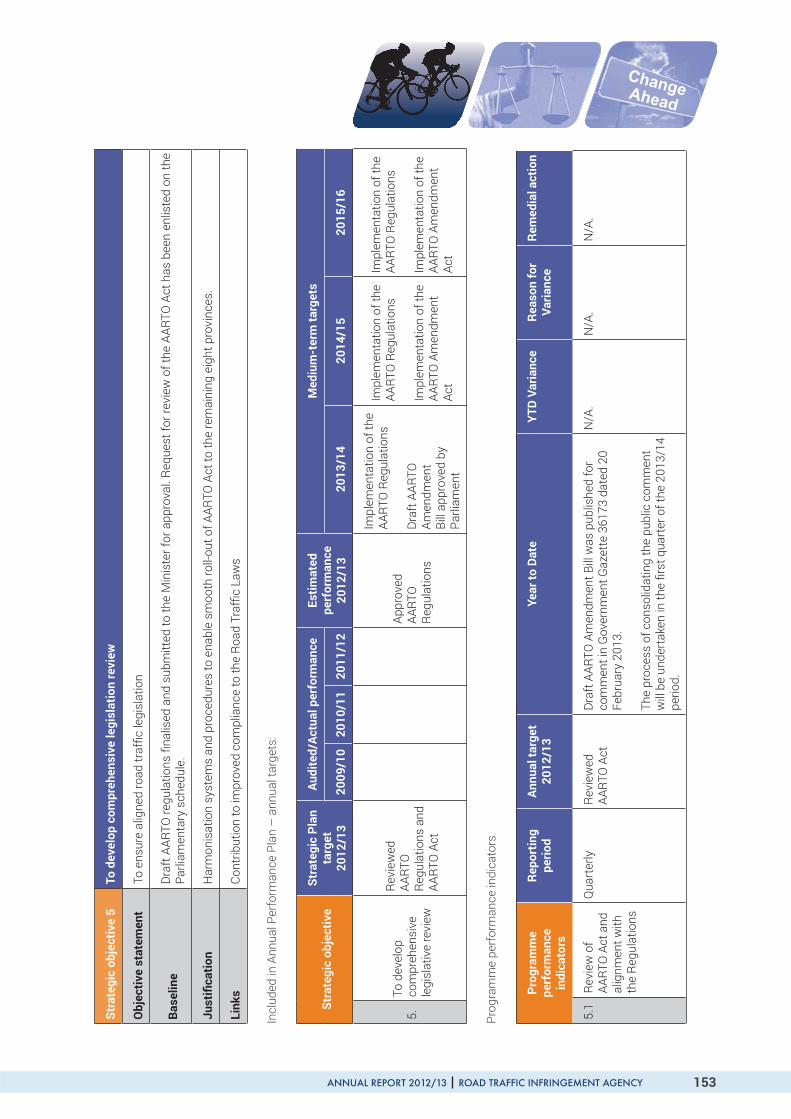
ChangeAhead
ANNUAL REPORT 2012/13 ROAD TRAFFIC INFRINGEMENT AGENCY 153
Stra
tegi
c ob
ject
ive
5To
dev
elop
com
preh
ensi
ve le
gisl
atio
n re
view
Obj
ectiv
e st
atem
ent
To e
nsur
e al
igne
d ro
ad tr
af c
legi
slat
ion
Base
line
Draf
t AAR
TO re
gula
tions
na
lised
and
sub
mitt
ed to
the
Min
iste
r for
app
rova
l. Re
ques
t for
revi
ew o
f the
AAR
TO A
ct h
as b
een
enlis
ted
on th
e Pa
rliam
enta
ry s
ched
ule.
Just
i ca
tion
Har
mon
isat
ion
syst
ems
and
proc
edur
es to
ena
ble
smoo
th ro
ll-ou
t of A
ARTO
Act
to th
e re
mai
ning
eig
ht p
rovi
nces
.
Link
sCo
ntrib
utio
n to
impr
oved
com
plia
nce
to th
e Ro
ad T
raf
c La
ws
Incl
uded
in A
nnua
l Per
form
ance
Pla
n –
ann
ual t
arge
ts:
Stra
tegi
c ob
ject
ive
Stra
tegi
c Pl
an
targ
et20
12/1
3
Audi
ted/
Actu
al p
erfo
rman
ceEs
timat
ed
perf
orm
ance
2012
/13
Med
ium
-ter
m ta
rget
s
2009
/10
2010
/11
2011
/12
2013
/14
2014
/15
2015
/16
5.To
dev
elop
co
mpr
ehen
sive
le
gisl
ativ
e re
view
Revi
ewed
AA
RTO
Re
gula
tions
and
AA
RTO
Act
Appr
oved
AA
RTO
Re
gula
tions
Impl
emen
tatio
n of
the
AART
O R
egul
atio
ns
Draf
t AAR
TO
Amen
dmen
tBi
ll ap
prov
ed b
y Pa
rliam
ent
Impl
emen
tatio
n of
the
AART
O R
egul
atio
ns
Impl
emen
tatio
n of
the
AART
O A
men
dmen
t Ac
t
Impl
emen
tatio
n of
the
AART
O R
egul
atio
ns
Impl
emen
tatio
n of
the
AART
O A
men
dmen
t Ac
t
Prog
ram
me
perf
orm
ance
indi
cato
rs
Prog
ram
me
perf
orm
ance
in
dica
tors
Repo
rtin
g pe
riod
Annu
al ta
rget
20
12/1
3Ye
ar to
Dat
eYT
D Va
rianc
eRe
ason
for
Varia
nce
Rem
edia
l act
ion
5.1
Revi
ew o
f AA
RTO
Act
and
al
ignm
ent w
ith
the
Regu
latio
ns
Qua
rter
lyRe
view
ed
AART
O A
ctDr
aft A
ARTO
Am
endm
ent B
ill w
as p
ublis
hed
for
com
men
t in
Gov
ernm
ent G
azet
te 3
6173
dat
ed 2
0 Fe
brua
ry 2
013.
The
proc
ess
of c
onso
lidat
ing
the
publ
ic c
omm
ent
will
be
unde
rtak
en in
the
rst q
uart
er o
f the
201
3/14
pe
riod.
N/A
.N
/A.
N/A
.
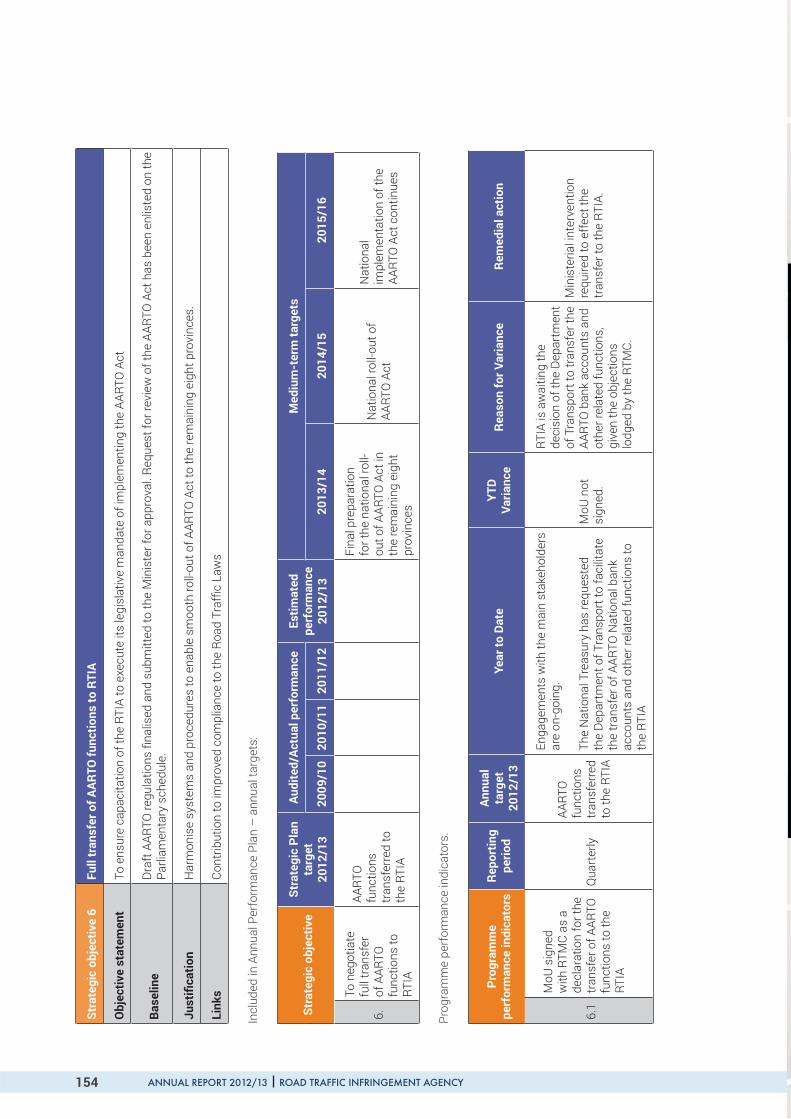
ANNUAL REPORT 2012/13 ROAD TRAFFIC INFRINGEMENT AGENCY154
Stra
tegi
c ob
ject
ive
6Fu
ll tr
ansf
er o
f AAR
TO fu
nctio
ns to
RTI
A
Obj
ectiv
e st
atem
ent
To e
nsur
e ca
paci
tatio
n of
the
RTIA
to e
xecu
te it
s le
gisl
ativ
e m
anda
te o
f im
plem
entin
g th
e AA
RTO
Act
Base
line
Draf
t AAR
TO re
gula
tions
na
lised
and
sub
mitt
ed to
the
Min
iste
r for
app
rova
l. Re
ques
t for
revi
ew o
f the
AAR
TO A
ct h
as b
een
enlis
ted
on th
e Pa
rliam
enta
ry s
ched
ule.
Just
i ca
tion
Har
mon
ise
syst
ems
and
proc
edur
es to
ena
ble
smoo
th ro
ll-ou
t of A
ARTO
Act
to th
e re
mai
ning
eig
ht p
rovi
nces
.
Link
sCo
ntrib
utio
n to
impr
oved
com
plia
nce
to th
e Ro
ad T
raf
c La
ws
Incl
uded
in A
nnua
l Per
form
ance
Pla
n –
ann
ual t
arge
ts:
Stra
tegi
c ob
ject
ive
Stra
tegi
c Pl
an
targ
et20
12/1
3
Audi
ted/
Actu
al p
erfo
rman
ceEs
timat
ed
perf
orm
ance
2012
/13
Med
ium
-ter
m ta
rget
s
2009
/10
2010
/11
2011
/12
2013
/14
2014
/15
2015
/16
6.
To n
egot
iate
fu
ll tr
ansf
er
of A
ARTO
fu
nctio
ns to
RT
IA
AART
O
func
tions
tran
sfer
red
to
the
RTIA
Fina
l pre
para
tion
for t
he n
atio
nal r
oll-
out o
f AAR
TO A
ct in
th
e re
mai
ning
eig
ht
prov
ince
s
Nat
iona
l rol
l-out
of
AART
O A
ct
Nat
iona
lim
plem
enta
tion
of th
e AA
RTO
Act
con
tinue
s
Prog
ram
me
perf
orm
ance
indi
cato
rs.
Prog
ram
me
perf
orm
ance
indi
cato
rsRe
port
ing
perio
d
Annu
alta
rget
2012
/13
Year
to D
ate
YTD
Varia
nce
Reas
on fo
r Var
ianc
eRe
med
ial a
ctio
n
6.1
MoU
sig
ned
with
RTM
C as
a
decl
arat
ion
for t
he
tran
sfer
of A
ARTO
fu
nctio
ns to
the
RTIA
Qua
rter
ly
AART
O
func
tions
tran
sfer
red
to th
e RT
IA
Enga
gem
ents
with
the
mai
n st
akeh
olde
rs
are
on-g
oing
.
The
Nat
iona
l Tre
asur
y ha
s re
ques
ted
the
Depa
rtm
ent o
f Tra
nspo
rt to
faci
litat
e th
e tr
ansf
er o
f AAR
TO N
atio
nal b
ank
acco
unts
and
oth
er re
late
d fu
nctio
ns to
th
e RT
IA
MoU
not
si
gned
.
RTIA
is a
wai
ting
the
deci
sion
of t
he D
epar
tmen
t of
Tra
nspo
rt to
tran
sfer
the
AART
O b
ank
acco
unts
and
ot
her r
elat
ed fu
nctio
ns,
give
n th
e ob
ject
ions
lo
dged
by
the
RTM
C.
Min
iste
rial i
nter
vent
ion
requ
ired
to e
ffect
the
tran
sfer
to th
e RT
IA.

ChangeAhead
ANNUAL REPORT 2012/13 ROAD TRAFFIC INFRINGEMENT AGENCY 155
Annual Financial Statements

ANNUAL REPORT 2012/13 ROAD TRAFFIC INFRINGEMENT AGENCY156 ANNUAL REPORT 2012/13 ROAD TRAFFIC INFRINGEMENT AGENCY156
Section 7: Annual Financial Statements for the year ended 31 March 2013Corporate Information
Directors Ms NE Rapoo (Non-Executive Chairperson)
Mr JR Chuwe (Registrar & Executive Director)
Adv. TE Dicker (Non-Executive Director)
Mr IS Jordaan (Non-Executive Director – resigned 26 July 2012)
Mr CM Manzini (Non-Executive Director)
Company Secretary Adv. MLT Bilikwana
Business address Waterfall Edge BHowick CloseWaterfall ParkBekker RoadMidrand
Postal addressP O Box 6341Halfway House1685
Auditors Auditor-General of South Africa

ANNUAL REPORT 2012/13 ROAD TRAFFIC INFRINGEMENT AGENCY157ANNUAL REPORT 2012/13 ROAD TRAFFIC INFRINGEMENT AGENCY
ChangeAhead
157
Contents ................................................................................................................Page
The reports and statements set out below comprise the Annual Financial Statements presented to the Minister of Transport:
Company Secretary’s Certi cate of Assurance .................................................................................................................158
Approval and Statement of Responsibility ..........................................................................................................................159
Accounting Authority Report .................................................................................................................................................160
Audit Committee Report .........................................................................................................................................................163
Report of the AuditorGeneral ................................................................................................................................................166
Statement of Financial Position ............................................................................................................................................169
Statement of Financial Performance ...................................................................................................................................170
Statement of Changes in Net Assets ...................................................................................................................................171
Cash Flow Statement ..............................................................................................................................................................172
Notes to the Financial Statements .......................................................................................................................................173
Reconciliation between Statement of Financial Performance and the Budget ..........................................................205

ANNUAL REPORT 2012/13 ROAD TRAFFIC INFRINGEMENT AGENCY158 ANNUAL REPORT 2012/13 ROAD TRAFFIC INFRINGEMENT AGENCY158
Company Secretary’s Certi cate of Assurance
In terms of Section 14(1) and (3) of the Administrative Adjudication of Road Traf c Offences Act, 1998 (Act No. 46 of 1998) and Section 40(1)(c) and (d) of the Public Finance Management Act, 1999 (Act No. 1 of 1999), I certify that for the nancial year ended 31 March 2013, the Road Traf c Infringement Agency has lodged with the Minister of Transport and
the National Treasury, the required annual nancial statements, performance information, annual report and the audit report as prescribed.
Adv. MLT Bilikwana
Company Secretary
ANNUAL REPORT 2012/13 ROAD TRAFFIC INFRINGEMENT AGENCY159ANNUAL REPORT 2012/13 ROAD TRAFFIC INFRINGEMENT AGENCY
ChangeAhead
159
Approval and Statement of ResponsibilityThe Board of Directors, which is the accounting authority of the Road Traf c Infringement Agency, is responsible for the maintenance of adequate accounting records and the preparation, integrity and fair presentation of the nancial statements of the Agency and related information. As at the reporting date, the RTIA had a functioning Board of Directors and hereby presents the Annual Financial Statements after due consideration and approval thereof.
The Auditor-General of South Africa is responsible for independently auditing and reporting on the fair presentation of the nancial statements in conformity with International Standards of Auditing. The accounting authority is also responsible
for the systems of internal nancial controls. These are designed to provide reasonable, but not absolute assurance as to the reliability of the nancial statements, and to adequately safeguard, verify and maintain accountability of assets, and to prevent and detect misstatements and losses. In spite of on-going challenges that the Agency continued to face and having partially managed to overcome some of them, there has not been anything that has come to the attention of the accounting authority to indicate that any material breakdown in the functioning of these controls, procedures and systems has occurred during the year under review.
The nancial statements have been prepared on the going concern basis, since the accounting authority has every reason to believe that the A gency, whilst not at its optimum capacity of resources, has nonetheless, the essential and critical elements and strategies required to continue with the operations of the Agency for the foreseeable future. The accounting authority is satis ed that the information contained in the nancial statements fairly presents the results of the operations for the year and the nancial position of the Agency at year end.
The annual nancial statements set out on pages 169 to 205 have been approved by the accounting authority and were signed on its behalf by the Chairperson.
Ms Nomini Rapoo
Chairperson: RTIA Board

ANNUAL REPORT 2012/13 ROAD TRAFFIC INFRINGEMENT AGENCY160 ANNUAL REPORT 2012/13 ROAD TRAFFIC INFRINGEMENT AGENCY160
Accounting Authority’s ReportThe accounting authority presents the audited annual nancial statements of the Road Traf c Infringement Agency for the year ended 31 March 2013, being the third set of nancial statements for the Agency since its scheduling in terms of the Public Finance Management Act, 1999.
IntroductionThe RTIA was established by section 3 of the Administrative Adjudication of Road Traf c Offences Act, 1998 (Act No. 46 of 1998) and is listed under Schedule 3 Part A of the Public Finance Management Act, 1999 (Act No. 1 of 1999).
The function of the Agency is to administer a procedure to discourage the contravention of road traf c laws and to support the adjudication of infringements; to enforce penalties imposed against persons contravening road traf c laws; provide specialised prosecution support services and undertake community education and awareness programmes in order to ensure that individuals understand their rights and options.
The Board of Directors are the accounting authority in terms of section 49 of the PFMA.
Review of ActivitiesDuring the period under review, the Agency continued to face critical challenges that impacted on its operations, which challenges were adequately brought to the attention of the Department and Shareholder for effective interventions. These challenges related to the following:
• Continued inadequate budget provision;
• Lack of enforcement of the Agency’s full mandate on AARTO and the control of the AARTO national bank accounts;
• Legislative de ciencies impeding the ef ciency and nancial viability of the Agency; and
• De ciencies of the National Contraventions Register.
FundingFor the nancial period 2012/13, the Agency received a government grant allocation of R 5 million and a further R14 million was granted at the end of the nancial year. In addition to its grant allocation, the Agency received funds stemming from its share of fees as provided for in section 13(1) of the AARTO Act which amongst others, allows the Agency to be funded through payments made on infringements after 32 days in order to pay for its operational costs and meet its obligations.
The average expenditure for the serving of courtesy letters was R 3 million per month and was projected to escalate to R 5.5 million per month with the enforcement orders served by registered mail. Due to the under-funding of the Agency, the Board resolved to drastically curb its expenditure by suspending the South African Post Of ce account for the serving of Courtesy Letters and Enforcement Orders. This decision was motivated by the huge costs related to the service of those documents, coupled with the related de ciencies and lack of data integrity on the address validation on the NCR, which ultimately could lead to fruitless expenditure. This decision will be reviewed regularly with a view to resuscitating the arrangement or to implement other low cost alternatives.
Contingent liabilitiesThe Agency was cited as a co-defendant in a legal action involving the alleged refusal of the Issuing Authority to issue an operator’s card to the plaintiff, Ngijulukile Logistics and Trading CC due to an enforcement order issued against its

ANNUAL REPORT 2012/13 ROAD TRAFFIC INFRINGEMENT AGENCY161ANNUAL REPORT 2012/13 ROAD TRAFFIC INFRINGEMENT AGENCY
ChangeAhead
161
name. Management believes that based on legal advice obtained from the Agency’s Legal Advisors, the action can be successfully defended and therefore no losses (including for costs) will be incurred by the Agency. The matter was not set down in court during the course of the 2012/13 nancial year, and is regarded as pending.
Enforcement of mandateThe Agency has raised the matter of the lack of enforcement of the AARTO mandate in respect of institutional arrangements with the RTMC. This related to the continued involvement of the RTMC in the AARTO process, which started with the provision of support services to the Agency as embodied in Chapter 2 of the AARTO Regulations 2008. In preparation for the national rollout, it is imperative for the Agency to be given its full mandate with the take-over of these functions, so that the Agency, as the custodian of the AARTO Act, becomes the authoritative entity in order to ensure that clear, uniform and standardised communication is disseminated to the public.
Legislative de ciencies With the continuation of the AARTO implementation, a number of legislative de ciencies were identi ed and the required interventions put in place. A two-phased approach was adopted by the Agency, entailing the Regulations Amendments, as well as the amendment to the AARTO Act. The Amendment Bill was published in Government Gazette 36173 dated 20 February 2013 for public comments. It is envisaged that the Amendment Bill will be nalised in the 2013/14 period and tabled at the National parliament for approval and promulgation.
The supporting regulations to the Act were also updated, taking into consideration the amended aspects in the Amendment Bill. A thorough consultative process was engaged upon by the Agency in order to ensure broad stakeholder participation and support for the amendments, ultimately leading to ef cient implementation of the AARTO process.
Institutional capacitationThe Agency continued to operate under severe shortage of critical staff, which impeded its ef cient performance, due to the lack of adequate funding. Notwithstanding these challenges, the Agency undertook a strategic and phased implementation process for capacitating itself. To that extent, a cautious recruitment approach resulted in the increase in staff capacity from 22 at the beginning of the nancial period to a total of 38 by 31 March 2013.
The arrangement made with the Department for the secondment of 4 staff at management level continued to the end of the nancial year, with the staff making a positive contribution to the development and operations of the Agency. A recruitment process was also started in February 2013 with advertisements for 18 posts to be lled and it is expected that these posts will be lled in the 2013/14 period, to reach a total of at least 75 staff.
Lack of Cooperation from Pilot SitesFor some considerable time through to December 2012 when the situation changed for the better, Johannesburg Metropolitan Police Department was not uploading their infringement records onto the NCR, and furthermore continued to serve Notices by ordinary mail, instead of registered mail, contrary to the provisions of the Act. This resulted in unprecedented negative publicity and criticism on the AARTO processes. Furthermore, the Agency was placed in a position of not serving Courtesy Letters and Enforcement Orders to the affected infringers since this would result in fruitless expenditure, given that the original Notices would not have been served as prescribed by the Act.
The Issuing Authorities continued to withhold payments of the infringement portion due to the RTIA, citing lack of service level agreements with the Agency and the inability to disburse the related infringement penalty fees paid by infringers into the AARTO national bank accounts that are held by the RTMC. Having elevated the matter regarding the enforcement of the mandate and the transfer of the AARTO national bank accounts from the RTMC to the RTIA, the Agency has been awaiting nalisation thereof from the Department. Once this has been fully resolved, the Agency will

ANNUAL REPORT 2012/13 ROAD TRAFFIC INFRINGEMENT AGENCY162 ANNUAL REPORT 2012/13 ROAD TRAFFIC INFRINGEMENT AGENCY162
be able to meet its obligations in relation to the nancial management and disbursement of infringement revenue due to various Issuing Authorities and receiving Agencies.
National Contraventions Register De cienciesWhereas signi cant progress had been made in addressing the de ciencies in the functionality of the National Contraventions Register, some aspects remain critical and may negatively impact on the Agency’s ef ciencies and performance. These have been brought to the attention of the Department of Transport to ensure the adequate prioritisation of all the required functionality supporting the Agency’s and AARTO implementation needs.
Given that the Issuing Authorities are the originators of the Infringement Notices captured, the lack of enforcement for address validations, leads to a tremendously negative impact on the Agency’s operations, particularly relating to the data integrity and correctness of addresses for the service of Courtesy Letters and Enforcement Orders. The Agency has engaged with the Department of Transport and is hopeful that the plan of action put in place will adequately address these problems.
Organisation StructureThe Board is the Accounting Authority which oversees the operations of the Agency.
The Board of Directors was appointed for a three year term with effect from 1 August 2010 to 31 July 2013. Whereas the Act provides for 7 Board Members including the Registrar, for the majority of the nancial year, the Board operated with four members due to the resignation of two members over the preceding two years and one member short that was not appointed at the beginning of the term and not replaced. The Registrar is the Accounting Of cer and supported by the Executive Committee, comprising of seven members. The Agency had four established operational divisions to cover adjudications, nance, communications and information technology and reached a total staff compliment of 38 at the end of the period under review.
DirectorsThe Board of Directors for the period ending 31 March 2013 was constituted as follows:
Ms NE Rapoo (Non-Executive Chairperson)
Mr JR Chuwe (Registrar and Executive Director)
Adv. TE Dicker (Non-Executive Director)
Mr IS Jordaan (Non-Executive Director – resigned 26 July 2012)
Mr CM Manzini (Non-Executive Director)
The shareholder was duly noti ed of the resignation of Mr Jordaan and the process for replacement and augmentation of the Board Members was started but not yet completed at the end of the nancial year.
Company SecretaryThe Company Secretary is Adv. MLT Bilikwana.
BankersThe Agency operates its bank account with the Centurion branch of the Standard Bank of South Africa.
AuditorsThe Auditor-General of South Africa is the designated auditor of the Agency.
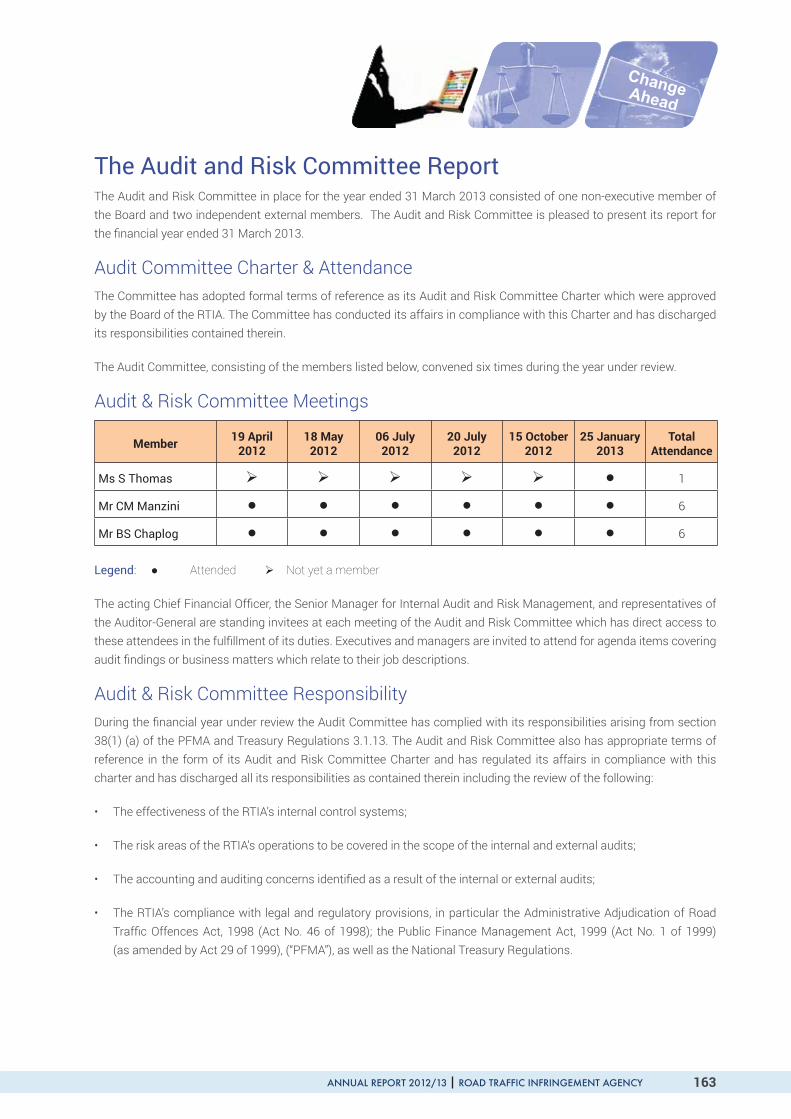
ANNUAL REPORT 2012/13 ROAD TRAFFIC INFRINGEMENT AGENCY163ANNUAL REPORT 2012/13 ROAD TRAFFIC INFRINGEMENT AGENCY
ChangeAhead
163
The Audit and Risk Committee ReportThe Audit and Risk Committee in place for the year ended 31 March 2013 consisted of one non-executive member of the Board and two independent external members. The Audit and Risk Committee is pleased to present its report for the nancial year ended 31 March 2013.
Audit Committee Charter & AttendanceThe Committee has adopted formal terms of reference as its Audit and Risk Committee Charter which were approved by the Board of the RTIA. The Committee has conducted its affairs in compliance with this Charter and has discharged its responsibilities contained therein.
The Audit Committee, consisting of the members listed below, convened six times during the year under review.
Audit & Risk Committee Meetings
Member 19 April 2012
18 May 2012
06 July 2012
20 July 2012
15 October 2012
25 January 2013
Total Attendance
Ms S Thomas 1
Mr CM Manzini 6
Mr BS Chaplog 6
Legend: Attended Not yet a member
The acting Chief Financial Of cer, the Senior Manager for Internal Audit and Risk Management, and representatives of the Auditor-General are standing invitees at each meeting of the Audit and Risk Committee which has direct access to these attendees in the ful llment of its duties. Executives and managers are invited to attend for agenda items covering audit ndings or business matters which relate to their job descriptions.
Audit & Risk Committee ResponsibilityDuring the nancial year under review the Audit Committee has complied with its responsibilities arising from section 38(1) (a) of the PFMA and Treasury Regulations 3.1.13. The Audit and Risk Committee also has appropriate terms of reference in the form of its Audit and Risk Committee Charter and has regulated its affairs in compliance with this charter and has discharged all its responsibilities as contained therein including the review of the following:
• The effectiveness of the RTIA’s internal control systems;
• The risk areas of the RTIA’s operations to be covered in the scope of the internal and external audits;
• The accounting and auditing concerns identi ed as a result of the internal or external audits;
• The RTIA’s compliance with legal and regulatory provisions, in particular the Administrative Adjudication of Road Traf c Offences Act, 1998 (Act No. 46 of 1998); the Public Finance Management Act, 1999 (Act No. 1 of 1999) (as amended by Act 29 of 1999), (“PFMA”), as well as the National Treasury Regulations.

ANNUAL REPORT 2012/13 ROAD TRAFFIC INFRINGEMENT AGENCY164 ANNUAL REPORT 2012/13 ROAD TRAFFIC INFRINGEMENT AGENCY164
Risk ManagementThe risk management function was established during the period under review. In line with the ARC charter, the committee has recommended for approval to the Board, the Risk Management Strategy, Policy and Risk Appetite. The strategic risk register was developed and monitored by quarterly reporting to ARC on implementation of action plans. Though risk management function is still in its infancy, the ARC is con dent that to date signi cant improvements have been made by the Agency.
Effectiveness of Internal Control SystemsThe systems of internal control are designed to provide cost effective assurance that assets are safeguarded and that liabilities and working capital are ef ciently managed. From the various reports of the in- house Internal Auditors and the Auditor-General, the Audit Committee noted some improvements as well as the continued existence of weaknesses in the internal control environment, and instances of non-compliance with laid down procedures.
During the period under review, an Internal Audit and Risk Management Unit was established. In line with the PFMA, Internal Audit plans which are developed from the strategic risk register are provided to the Audit Committee and to management with assurance that internal controls are appropriate and effective. This is achieved by means of an appropriate quarterly reporting process, as well as the identi cation of corrective actions and suggested enhancements to the controls and processes. Based on the audits conducted and presented to the Audit Committee for the 2012/13 nancial year, the Committee concludes overall that the internal controls evaluated during those audits were partially
adequate and effective.
Quality of Management ReportsThe Audit Committee is satis ed with the content and quality of the quarterly reports as prepared and issued by management during the year under review in terms of the PFMA regulations.
Going ConcernThe Audit Committee reviewed a documented assessment by management of the going concern premise before agreeing that the adoption of the going concern premise is appropriate in preparing the nancial statements.
Evaluation of the Financial Statements The Audit Committee has:
• reviewed and discussed with management and the Auditor-General the audited annual nancial statements and the Auditor-General’s report and audit opinion, to be included in the annual report;
• reviewed the Auditor-General’s management letter and management’s responses thereto;
• reviewed the appropriateness of accounting policies and practices; and
• reviewed signi cant adjustments, resulting from the annual audit.

ANNUAL REPORT 2012/13 ROAD TRAFFIC INFRINGEMENT AGENCY165ANNUAL REPORT 2012/13 ROAD TRAFFIC INFRINGEMENT AGENCY
ChangeAhead
165
The Audit Committee has evaluated the nancial statements of the RTIA for the year ended 31 March 2013 and concluded that they comply, in all material respects, with the requirements of the PFMA, and were prepared in accordance with the effective Standards of Generally Recognised Accounting Practices (“GRAP”) issued by the Accounting Standards Board (“ASB”). The Committee has discussed, concurs with and accepts the conclusions of the Auditor-General on the annual nancial statements contained in the Report of the Auditor-General to Parliament, and recommended these to the Accounting Authority for acceptance and inclusion in the Annual Report.
Mr Bryan S. ChaplogAudit & Risk Committee Chairperson

ANNUAL REPORT 2012/13 ROAD TRAFFIC INFRINGEMENT AGENCY166 ANNUAL REPORT 2012/13 ROAD TRAFFIC INFRINGEMENT AGENCY166
FINAL REPORT OF THE AUDITOR-GENERAL TO PARLIAMENT ON THE ROAD TRAFFIC INFRINGEMENT AGENCY REPORT ON THE FINANCIAL STATEMENTS Introduction 1. I have audited the nancial statements of the Road Traf c Infringement Agency set out on pages 169 to 205,
which comprise the statement of nancial position as at 31 March 2013, the statement of nancial performance, statement of changes in net assets and the cash flow statement for the year then ended, and the notes, comprising a summary of signi cant accounting policies and other explanatory information.
Accounting authority’s responsibility for the nancial statements2. The accounting authority is responsible for the preparation and fair presentation of these nancial statements in
accordance with South African Standards of Generally Recognised Accounting Practice (SA Standards of GRAP) and the requirements of the Public Finance Management Act of South Africa, 1999 (Act No.1 of 1999) (PFMA), and for such internal control as the accounting authority determines is necessary to enable the preparation of nancial statements that are free from material misstatement, whether due to fraud or error.
Auditor-General’s responsibility 3. My responsibility is to express an opinion on these nancial statements based on my audit. I conducted my audit
in accordance with the Public Audit Act of South Africa, 2004 (Act No. 25 of 2004) (PAA), the General Notice issued in terms thereof and International Standards on Auditing. Those standards require that I comply with ethical requirements and plan and perform the audit to obtain reasonable assurance about whether the nancial statements are free from material misstatement.
4. An audit involves performing procedures to obtain audit evidence about the amounts and disclosures in the nancial statements. The procedures selected depend on the auditor’s judgement, including the assessment of
the risks of material misstatement of the nancial statements, whether due to fraud or error. In making those risk assessments, the auditor considers internal control relevant to the entity’s preparation and fair presentation of the nancial statements in order to design audit procedures that are appropriate in the circumstances, but not for the purpose of expressing an opinion on the effectiveness of the entity’s internal control. An audit also includes evaluating the appropriateness of accounting policies used and the reasonableness of accounting estimates made by management, as well as evaluating the overall presentation of the nancial statements.
5. I believe that the audit evidence I have obtained is suf cient and appropriate to provide a basis for my unquali ed audit opinion.
Opinion6. In my opinion, the nancial statements present fairly, in all material respects, the nancial position of the Road
Traf c Infringement Agency as at 31 March 2013, and its nancial performance and cash flows for the year then ended, in accordance with South African Standards of Generally Recognised Accounting Practice (SA Standards of GRAP) and the requirements of the Public Finance Management Act of South Africa, 1999 (Act No.1 of 1999) (PFMA).
ANNUAL REPORT 2012/13 ROAD TRAFFIC INFRINGEMENT AGENCY167ANNUAL REPORT 2012/13 ROAD TRAFFIC INFRINGEMENT AGENCY
ChangeAhead
167
Emphasis of matter7. I draw attention to the matter below. My opinion is not modi ed in respect of this matter:
Material Impairment 8. As disclosed in note 5 to the nancial statements, a material impairment to the amount of R31 164 022 was incurred
as a result of the assessment made on the cash recoverability of the accounts receivable relating to the AARTO management process.
REPORT ON OTHER LEGAL AND REGULATORY REQUIREMENTS 9. In accordance with the PAA and the General Notice issued in terms thereof, I report the following ndings relevant to
performance against predetermined objectives, compliance with laws and regulations and internal control, but not for the purpose of expressing an opinion.
Predetermined objectives 10. I performed procedures to obtain evidence about the usefulness and reliability of the information in the annual
performance report as set out on pages 146 to 154 of the annual report.
11. The reported performance against predetermined objectives was evaluated against the overall criteria of usefulness and reliability. The usefulness of information in the annual performance report relates to whether it is presented in accordance with the National Treasury’s annual reporting principles and whether the reported performance is consistent with the planned objectives. The usefulness of information further relates to whether indicators and targets are measurable (i.e. well de ned, veri able, speci c, measurable and time bound) and relevant as required by the National Treasury Framework for managing programme performance information.
12. The reliability of the information in respect of the selected objectives is assessed to determine whether it adequately reflects the facts (i.e. whether it is valid, accurate and complete).
13. There were no material ndings on the annual performance report concerning the usefulness and reliability of the information.
Additional matter14. I draw attention to the matter below. My conclusion is not modi ed in respect of this matter:
Achievement of planned targets15. Of the total number of 6 targets planned for the year, 2 of the targets were not achieved during the year under review.
This represents 33% of total planned targets that were not achieved during the year under review. This was mainly due to the fact that indicators and targets were not suitably developed during the strategic planning process.
Compliance with laws and regulations 16. I performed procedures to obtain evidence that the entity has complied with applicable laws and regulations regarding
nancial matters, nancial management and other related matters. My ndings on material non-compliance with speci c matters in key applicable laws and regulations as set out in the General Notice issued in terms of the PAA are as follows:
ANNUAL REPORT 2012/13 ROAD TRAFFIC INFRINGEMENT AGENCY168 ANNUAL REPORT 2012/13 ROAD TRAFFIC INFRINGEMENT AGENCY168
Material misstatements in annual nancial statements subsequently corrected17. The accounting authority submitted nancial statements for auditing that were not prepared in all material aspects
in accordance with generally accepted accounting practice and supported by full and proper records as required by section 55 (1) (a) and (b) of the PFMA. Material misstatements identi ed by the AGSA were subsequently corrected.
Courtesy and Enforcement letters not issued18. During the review of the agency key performance drivers and overview of the national contravention register, we
noted that the agency did not issue and serve any courtesy and enforcement letters to traf c infringers for the period September 2012 to 31 March 2013 in contravention of section 19 and 20 of the AARTO Act 46 of 1998.
Internal control 19. I considered internal control relevant to my audit of the nancial statements, performance report and compliance
with laws and regulations. The matters reported below under the fundamentals of internal control are limited to the signi cant de ciencies that resulted in the basis for quali ed opinion and the ndings on compliance with laws and regulations included in this report.
Leadership20. Lack of oversight responsibility and proper review regarding the nancial statements preparation and related internal
controls.
21. Issuing authorities have not managed the infringement process in alignment with the AARTO Act and this has limited the RTIA to effectively execute its traf c infringement enforcement mandate.
Pretoria
31 July 2013

ANNUAL REPORT 2012/13 ROAD TRAFFIC INFRINGEMENT AGENCY169ANNUAL REPORT 2012/13 ROAD TRAFFIC INFRINGEMENT AGENCY
ChangeAhead
169
STATEMENT OF FINANCIAL POSITION as at 31 March 2013
Notes 2013 2012
R R
ASSETS
Non - Current Assets 643 257 750 779
Property, plant and equipment 3 608 934 693 637
Intangible asset 4 34 323 57 142
Current assets 14 631 609 6 850 327
Trade and other receivables 5 1 428 817 6 850 281
Cash and cash equivalents 6 13 202 792 46
Total Assets 15 274 866 7 601 106
Net Assets 12 890 676 6 280 803
Accumulated surplus 12 890 676 6 280 803
Current liabilities 2 384 190 1 320 303
Trade and other payables 7 2 384 190 1 320 303
Total net assets and liabilities 15 274 866 7 601 106

ANNUAL REPORT 2012/13 ROAD TRAFFIC INFRINGEMENT AGENCY170 ANNUAL REPORT 2012/13 ROAD TRAFFIC INFRINGEMENT AGENCY170
STATEMENT OF FINANCIAL PERFORMANCE
for the year ended 31 March 2013
Notes 2013 2012
R R
Revenue 68 011 052 45 579 863
Infringement fees 8 49 011 052 28 579 863
Grants received 8 19 000 000 17 000 000
Expenses (61 408 114) (34 467 651)
Impairment loss on receivables (31 164 022) -
Employment costs (10 538 186) (2 259 931)
Other operating expenses (19 451 089) (32 058 909)
Depreciation of property, plant and equipment (225 104) (105 718)
Amortisation of intangible assets (22 819) (16 298)
Assets written-off (6 894) (26 795)
Surplus from operations 9 6 602 938 11 112 212
Finance income 10.1 6 947 13 953
Finance costs 10.2 (12) (513)
Surplus for the period 6 609 873 11 125 652

ANNUAL REPORT 2012/13 ROAD TRAFFIC INFRINGEMENT AGENCY171ANNUAL REPORT 2012/13 ROAD TRAFFIC INFRINGEMENT AGENCY
ChangeAhead
171
STATEMENT OF CHANGES IN NET ASSETS
for the year ended 31 March 2013
Notes Accumulatedsurplus Total
R R
Restated opening balance as at 1 April 2011 (4 844 849) (4 844 849)
Surplus for the year 11 125 652 11 125 652
Opening balance as at 1 April 2012 6 280 803 6 280 803
Surplus for the year 6 609 873 6 609 873
Closing balance at 31 March 2013 12 890 676 12 890 676

ANNUAL REPORT 2012/13 ROAD TRAFFIC INFRINGEMENT AGENCYANNUAL REPORT 2012/13 ROAD TRAFFIC INFRINGEMENT AGENCY172
CASH FLOW STATEMENT
for the year ended 31 March 2013
Notes 2013 2012
R R
Cash ow from operating activities
Receipts
Opening balance of trade and other receivables 6 850 281 10 540 620
Infringement Receipts 17 847 030 28 579 863
Grant received 19 000 000 17 000 000
Closing balance of trade and other receivables (1 428 817) (6 850 281)
Receipts from customers and grants 42 268 494 49 270 202
Interest received 6 947 13 953
Total Receipts 42 275 441 49 284 155
Payments
Opening balance of trade and other payables (1 320 303) (15 393 103)
Employee costs (10 538 186) (2 259 931)
Suppliers (19 451 089) (32 058 909)
Closing balance of trade and other payables 2 384 190 1 320 303
Payments to suppliers and employees (28 925 388) (48 391 640)
Interest paid (12) (513)
Total Payments (28 925 400) (48 392 153)
Net cash in ow from operating activities 11 13 350 041 892 002
Cash ow from investing activities
Acquisition of property, plant and equipment (147 295) (818 516)
Acquisition of intangible assets - (73 440)
Net cash out ow from investing activities (147 295) (891 956)
Net increase in cash and cash equivalents 13 202 746 46
Cash and cash equivalents at the beginning of the year 46 -
Cash and cash equivalents at end of the year 6 13 202 792 46

ANNUAL REPORT 2012/13 ROAD TRAFFIC INFRINGEMENT AGENCY
ChangeAhead
ANNUAL REPORT 2012/13 ROAD TRAFFIC INFRINGEMENT AGENCY
NOTES TO THE FINANCIAL STATEMENTSfor the year Ended 31 March 2013
1. Basis of Presentation
1.1 Statement of Compliance
The annual nancial statements have been prepared in accordance with the effective Standards of Generally Recognised Accounting Practices (“GRAP”) issued by the Accounting Standards Board (“ASB”) in accordance with the Public Finance Management Act, 1999 (Act No.1 of 1999) (“PFMA”).
During the year, a number of standards of GRAP became effective for the current nancial period. A brief description of these standards as well as an estimate of the impact is contained in Note 19.
A summary of the signi cant accounting policies, which have been applied, are disclosed below. These accounting policies are consistent with the previous period.
1.2 Reporting Entity
The Road Traf c Infringement Agency (“RTIA or the Agency”) derives its mandate and functions from the Administrative Adjudication of Road Traf c Offences Act, 1998 (Act No.46 of 1998). The full responsibilities of the Agency are contained in this Act.
1.3 Basis of Measurement
The nancial statements have been prepared on the historical cost basis.
1.4 Functional and Presentation Currency
These nancial statements are presented in South African Rand, which is the Agency’s functional currency. All nancial information presented in Rand has been rounded to the nearest Rand.
1.5 Use of estimates and judgements
The preparation of nancial statements in conformity with GRAP requires management to make judgments, estimates and assumptions that affect the application of policies and reported amounts of assets, liabilities, income and expenses. Actual results may differ from these estimates. These judgments and estimates are reviewed annually by management. Revisions and accounting estimates are recognised in the period in which the estimate is revised and in any future periods affected.
The following signi cant areas of judgments and sources of estimation uncertainty were used during the nancial year:
• Asset lives and residual values
Property, plant and equipment are depreciated over their useful lives taking into account residual values, where appropriate. The actual lives of the assets and residual values are assessed annually and may vary depending on a number of factors. In re-assessing asset lives, factors such as technological innovation, product life cycles and maintenance programmes are taken into account. Residual value assessments consider issues such as future market conditions, the remaining life of the asset and projected disposal values.
For uncertainties that result from the assessment of useful lives and residual values on property, plant and equipment and intangible assets (see note 2.1 and 2.2).
173

ANNUAL REPORT 2012/13 ROAD TRAFFIC INFRINGEMENT AGENCYANNUAL REPORT 2012/13 ROAD TRAFFIC INFRINGEMENT AGENCY
NOTES TO THE FINANCIAL STATEMENTSfor the year ended 31 March 2013
• Provisions
The nature of the judgments and estimation uncertainties related to provisions. Provisions were raised and management determined an estimate based on the information available.
• Impairment testing
Key assumptions, judgments and/or estimates used with regards to impairment of property, plant and equipment and intangible assets.
Property, plant and equipment and intangible assets are considered for impairment if there is reason to believe that impairment may be necessary. Factors taken into consideration in reaching such a decision include the economic viability of the asset and where it is a component of a larger economic unit, the viability of that unit itself.
Future cash flows expected to be generated by the asset are projected, taking into account market conditions and the expected useful lives of the assets. The present value of these cash flows, determined using appropriate discount rates, is compared to the current net asset value and if lower, the assets are impaired to the present value.
• Impairment for doubtful debts
The Agency assesses its receivables for impairment at each balance sheet date. In determining whether impairment for doubtful debts should be recognised, management will make judgements as to whether there is objective evidence indicating that the nancial asset may be impaired.
2. Signi cant Accounting Policies
2.1 Property, plant and equipment
2.1.1 Recognition and measurement
An item of property, plant and equipment is recognized as an asset:
• When the Agency has full control over it and;
• It is probable that future economic bene ts will flow to the Agency and;
• The asset has a cost, or other determined value which can be measured reliably.
Property, plant and equipment is initially measured at cost, including all directly attributable costs necessary to bring the asset to its required working condition for its intended use. Subsequently property, plant and equipment is measured at cost less accumulated depreciation and accumulated impairment losses.
Property, plant and equipment cease to be recognised when it is disposed of or permanently withdrawn from use or when no future economic bene ts are expected from its use or disposal. Gains and losses arising from the retirement or disposal of property, plant and equipment are determined as the difference between the net disposal proceeds and carrying amount of the assets, these are recognised as income or expenses in surplus or de cit for the period.
174
ANNUAL REPORT 2012/13 ROAD TRAFFIC INFRINGEMENT AGENCY
ChangeAhead
ANNUAL REPORT 2012/13 ROAD TRAFFIC INFRINGEMENT AGENCY
NOTES TO THE FINANCIAL STATEMENTSfor the year ended 31 March 2013
The depreciation method used reflects the pattern in which the asset’s future economic bene ts are expected to be consumed by the Agency.
When property, plant and equipment comprises of major components with different useful lives, these components are accounted for as separate items and they are depreciated separately.
2.1.2 Subsequent costs
The Agency recognises in the carrying amount of an item of property, plant and equipment the cost of replacing part of such an item when that cost is incurred if it is probable that the future economic bene ts embodied within the item will flow to the Agency and the cost of the item can be measured reliably. The carrying amount of the replaced part is derecognised.
All other costs are recognised in surplus or de cit as an expense when they are incurred. Repairs and maintenance costs are generally charged to expenses when they are incurred. However, major renovations are capitalised and included in the carrying amount of the asset when it is probable that future economic bene ts in excess of the originally assessed standard of performance of the existing asset will flow to the Agency. Major renovations are depreciated over the remaining useful life of the related asset.
2.1.3 Depreciation
The useful life of an asset and residual values are reviewed annually, and if expectations differ from previous estimates, the changes are accounted for as a change in accounting estimate.
Depreciation on all property, plant and equipment commences when the items are available for use. Depreciation is recognised on a straight-line basis to write off the cost of assets to their residual values over the estimated useful lives.
The useful lives for items of property, plant and equipment have been assessed as follows:
Furniture & ttings 5 yearsOf ce equipment and appliances 5 yearsComputer equipment 3 years
Depreciation does not cease when the asset becomes idle or is retired from active use unless the asset is fully depreciated.
2.2 Intangible assets
2.2.1 Recognition and measurement
Intangible assets are initially measured at cost. Cost includes any directly attributable cost of preparing the asset for its intended use.
After initial recognition, intangible assets are carried at their cost less any accumulated amortisation and any accumulated impairment losses.
Intangible assets are derecognised on disposal or when no future economic bene ts are expected from its use or disposal.
175

ANNUAL REPORT 2012/13 ROAD TRAFFIC INFRINGEMENT AGENCYANNUAL REPORT 2012/13 ROAD TRAFFIC INFRINGEMENT AGENCY
NOTES TO THE FINANCIAL STATEMENTSfor the year ended 31 March 2013
2.2.2 Subsequent costs
Subsequent expenditure is capitalised only when it increases the future economic bene ts embodied in the speci c asset to which it relates. All other expenditure is recognised in surplus or de cit as incurred.
An internally-generated intangible asset arising from development (or from the development phase of an internal project) is recognised when:
• it is technically feasible to complete the asset so that it will be available for use or sale;
• there is an intention to complete and use or sell it;
• there is an ability to use or sell it;
• it will generate probable future economic bene ts;
• there are available technical, nancial and other resources to complete the development and to use or sell the asset; and
• the expenditure attributable to the asset during its development can be measured reliably.
Intangible assets with a nite useful life are amortised over that useful life of the product. Amortisation commences when the asset is available for use, i.e. when it is in the location and condition necessary for it to be capable of operating in the manner intended by management.
The useful life of an intangible asset is reviewed annually, and if expectations differ from previous estimates, the changes shall be accounted for as a change in accounting estimates.
The useful lives for items of intangible assets have been assessed as follows:
Computer software and licenses 3 yearsWebsite development costs 3 years
Amortisation does not cease when the asset becomes idle or is retired from active use unless the asset is fully depreciated.
2.3 Impairment
Financial assets
The entity assesses at each statement of nancial position date whether there is objective evidence that a nancial assets or the Agency assets are impaired.
Assets carried at amortised cost
If there is objective evidence that an impairment loss has been incurred, the amount of the loss is measured as the difference between the assets carrying amount and the present value of the estimated future cash flows (excluding future expected credit losses) discounted at the asset’s original effective interest rate.
Objective evidence that nancial assets are impaired can include default or delinquency by a debtor or indications that a debtor will enter into bankruptcy.
176
ANNUAL REPORT 2012/13 ROAD TRAFFIC INFRINGEMENT AGENCY
ChangeAhead
ANNUAL REPORT 2012/13 ROAD TRAFFIC INFRINGEMENT AGENCY
NOTES TO THE FINANCIAL STATEMENTSfor the year ended 31 March 2013
Signi cant nancial assets should be tested for impairment on an individual basis and the remaining nancial assets should be assessed collectively into groups of similar credit risk characteristics.
If, in a subsequent period, the amount of the impairment decreases and the decrease relates objectively to an event occurring after the impairment, it is reversed to the extent that the carrying value does not exceed the amortised cost. Any subsequent reversal of an impairment loss is recognised in surplus or de cit. A nancial asset is considered to be impaired if objective evidence indicates that one or more events have had a negative effect on the estimated future cash flows of that asset.
Non- nancial assets
The carrying amount of non- nancial assets is reviewed at each reporting date to determine whether there is any indication of impairment. If any such indication exists, then the asset’s recoverable amount is estimated. The recoverable amount of an asset is the greater of its value in use and its fair value less costs to sell. In assessing value in use, the estimated future cash flows are discounted to their present value using a pre-tax discount rate that reflects current market assessments of the time value of money and the risks speci c to the asset.
An impairment loss is recognised when the carrying amount of an asset exceeds its estimated recoverable amount. Impairment losses are recognised in surplus or de cit.
2.4 Financial Instruments
2.4.1 Initial recognition
Financial assets and nancial liabilities are recognised on the statement of nancial performance when the company has become a party to contractual provisions of the instrument. Financial assets are derecognised only when the contractual rights to the cash flows from the asset expire; or when nancial assets and substantially all the risks and rewards of ownership of the assets are transferred to another entity. Financial liabilities are derecognised when, and only when, the company’s obligations are discharged, cancelled or they expire.
2.4.2 Trade and other receivables
Trade and other receivables that have xed or determinable payments that are not quoted in an active market are classi ed as loans and receivables. Loans and receivables are measured at amortised cost using the effective interest method, less any impairment. Interest income is recognised by applying the effective interest rate, except for short-term receivables when the recognition of interest would be immaterial.
Trade receivables are carried at cost less provision made for impairment of these receivables.
2.4.3 Trade and other payables
Trade and other payables are initially measured at fair value and are subsequently measured at amortised cost, using the effective interest rate method.
2.4.4 Cash and cash equivalents
Cash and cash equivalents comprise cash on hand. This is measured at fair value.
177

ANNUAL REPORT 2012/13 ROAD TRAFFIC INFRINGEMENT AGENCYANNUAL REPORT 2012/13 ROAD TRAFFIC INFRINGEMENT AGENCY
NOTES TO THE FINANCIAL STATEMENTSfor the year ended 31 March 2013
2.5 Employee bene ts
Short-term employee bene ts
The cost of short-term employee bene ts, (those payable within 12 months after the service is rendered, such as paid vacation leave and sick leave, bonuses and non-monetary bene ts such as medical care), are recognised in the period in which the service is rendered and are not discounted.
The expected cost of compensated absences is recognised as an expense as the employees render services that increase their entitlement or, in the case of non-accumulating absences, when the absence occurs.
The expected cost of bonus payments is recognised as an expense when there is a legal or constructive obligation to make such payments as a result of past performance.
De ned Contribution
Payments to de ned contribution retirement bene t plans are recognised as an expense when employees have rendered service entitling them to the contributions.
Under a de ned contribution plan xed contributions are payable by the Agency and members. The Agency has no legal or constructive obligation to pay any further contributions other than these xed contributions.
2.6 Provisions
Provisions are made for unavoidable liabilities of which the amount can be estimated, but the settlement is uncertain. These provisions are recognised when the Agency has a present legal or constructive obligation as a result of past events, for which it is probable that an outflow of resources embodying economic bene ts will be required to settle the obligation, and a reliable estimate of the amount of the obligation can be made.
The carrying amount of each provision is reviewed at reporting date and adjusted, if necessary, to reflect the best estimate of the consideration required to settling the present obligation as at that date. Where the effect of the time value of money is material, the amount of a provision is the present value of the expenditures expected to be required to settle the obligation.
A provision is reversed to the extent that it is no longer probable that a future outflow of economic bene ts will be required to settle the obligation.
2.7 Revenue recognition
Grants and virements received
Government grants are recognised when there is reasonable assurance that:
• the Agency will comply with the conditions attaching to them; and
• the grants will be received.
Government grants are recognised as income in the year in which they are received or deferred when conditions for the grant are not met.
178

ANNUAL REPORT 2012/13 ROAD TRAFFIC INFRINGEMENT AGENCY
ChangeAhead
ANNUAL REPORT 2012/13 ROAD TRAFFIC INFRINGEMENT AGENCY
NOTES TO THE FINANCIAL STATEMENTSfor the year ended 31 March 2013
A government grant that becomes receivable as compensation for expenses or losses already incurred or for the purpose of giving immediate nancial support to the Agency with no future related costs is recognised as income in the period in which it becomes receivable.
Infringement fees
Infringement fees comprise of traf c penalties collected, courtesy letter fees, enforcement order fees, penalty fees and unsuccessful representation fees.
Infringement fees are recognised when the outcome of the transaction involving the collection of infringement fees can be estimated reliably, revenue associated with these transactions is recognised by reference to the stage of completion of the transaction. The outcome of these transactions can be reliably measured when all of the following conditions are satis ed:
• The amount of revenue can be measured reliably,
• It is probable that the economic bene ts or service potential associated with the transactions will flow to the Agency,
• The stage of completion of the transaction at the end of the nancial year can be measured reliably, and
• The costs incurred for the transaction and the costs to complete the transaction can be measured reliably.
These conditions are met at the point where fees are collected from the infringers.
2.8 Financing income
Interest income is recognised in surplus or de cit as it accrues, using the effective interest rate method.
2.9 Expenses
2.9.1 Financing costs
The interest expense is recognised in surplus or de cit using the effective interest method.
2.9.2 Lease payments
Payments made under operating leases are recognised in surplus or de cit on a straight-line basis over the term of the lease.
2.10 Operating leases
Leases where the lessor retains the risk and rewards of ownership of the underlying asset are classi ed as operating leases. Payments made under operating leases are recognised as expense on a straight-line basis over the term of the lease.
179
ANNUAL REPORT 2012/13 ROAD TRAFFIC INFRINGEMENT AGENCYANNUAL REPORT 2012/13 ROAD TRAFFIC INFRINGEMENT AGENCY
NOTES TO THE FINANCIAL STATEMENTSfor the year ended 31 March 2013
2.11 Taxation
The RTIA is exempt from taxation in terms of the provision of section 10 (1) (cA) (i) of the Income Tax Act, 1962 (Act No. 58 of 1962).
2.12 Related Parties
The RTIA operates in an economic environment currently dominated by entities directly or indirectly owned by the Department of Transport of the South African Government. Only parties within the Department of Transport will be considered to be related parties.
Key management is de ned as being individuals with the authority and responsibility for planning, directing and controlling the activities of the Agency. We regard all individuals from the level of Executive Management up to the Board of Directors as key management per the de nition.
Close family members of key management personnel are considered to be those family members who may be expected to influence, or be influenced by key management individuals in their dealings with the Agency.
The objective of the nancial statements is to provide relevant and reliable information and therefore materiality is considered in the disclosure of these transactions.
2.13 Irregular, Fruitless and Wasteful Expenditure
Irregular expenditure means expenditure incurred in contravention of, or not in accordance with, a requirement of any applicable legislation, including:
• The PFMA, or
• Any national legislation providing for procurement in that National Government.
Fruitless and wasteful expenditure is expenditure that was made in vain and could have been avoided had reasonable care been exercised.
Any irregular, fruitless and wasteful expenditure is charged against surplus or de cit in the period in which it is incurred.
180

ANNUAL REPORT 2012/13 ROAD TRAFFIC INFRINGEMENT AGENCY
ChangeAhead
ANNUAL REPORT 2012/13 ROAD TRAFFIC INFRINGEMENT AGENCY
NOTES TO THE FINANCIAL STATEMENTSfor the year ended 31 March 2013
O ce equipment&
appliancesFurniture& ttings
Computerequipment Total
R R R R
3. Property, plant and equipment
31 March 2013Cost 20 166 592 830 323 606 936 602
Accumulated depreciation (6 432) (173 133) (148 103) (327 668)
Net carrying value 13 734 419 697 175 503 608 934
Movement summary
Opening net carrying value 5 398 439 067 249 172 693 637
Additions 18 169 98 740 30 386 147 295
Assets written off - cost (6 999) - - (6 999)
Assets written off - accumulated depreciation 105 - - 105
Depreciation (2 939) (118 110) (104 055) (225 104)
Closing net carrying value 13 734 419 697 175 503 608 934
The residual values of property, plant and equipment have been assessed to be immaterial, as a result they have not been considered in the calculation of the depreciable amount.
181
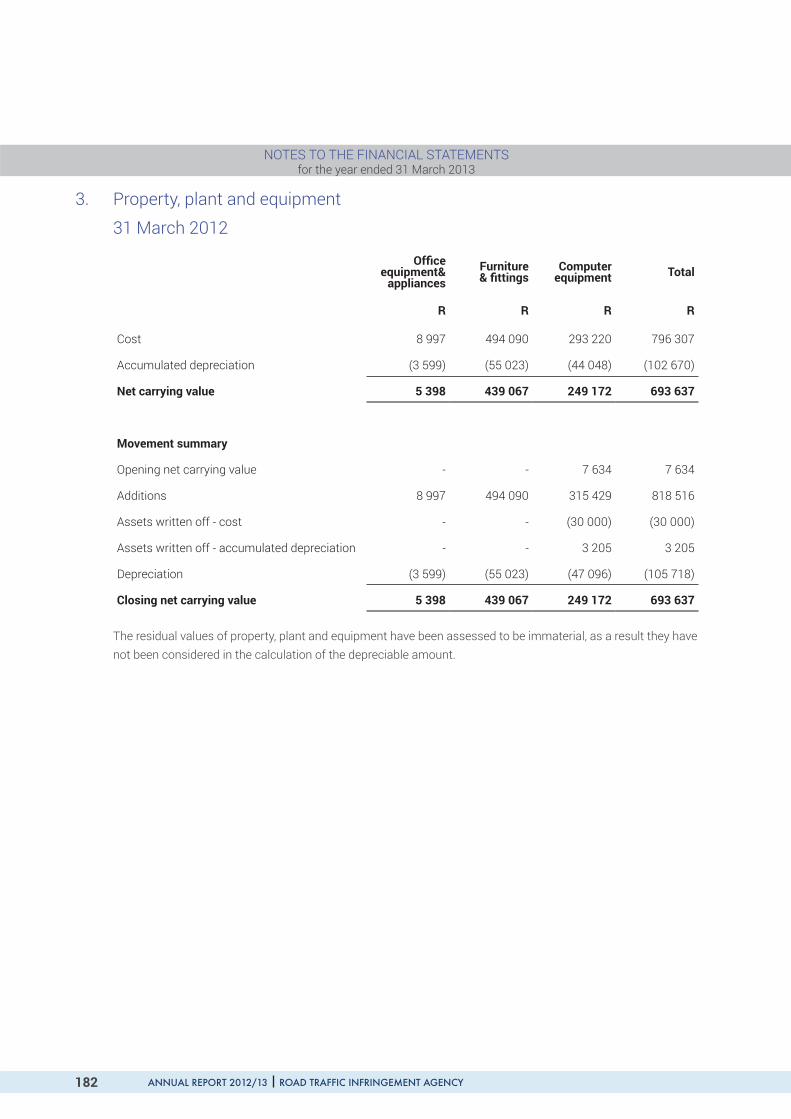
ANNUAL REPORT 2012/13 ROAD TRAFFIC INFRINGEMENT AGENCYANNUAL REPORT 2012/13 ROAD TRAFFIC INFRINGEMENT AGENCY
NOTES TO THE FINANCIAL STATEMENTSfor the year ended 31 March 2013
3. Property, plant and equipment
31 March 2012
O ce equipment&
appliancesFurniture& ttings
Computerequipment Total
R R R R
Cost 8 997 494 090 293 220 796 307
Accumulated depreciation (3 599) (55 023) (44 048) (102 670)
Net carrying value 5 398 439 067 249 172 693 637
Movement summary
Opening net carrying value - - 7 634 7 634
Additions 8 997 494 090 315 429 818 516
Assets written off - cost - - (30 000) (30 000)
Assets written off - accumulated depreciation - - 3 205 3 205
Depreciation (3 599) (55 023) (47 096) (105 718)
Closing net carrying value 5 398 439 067 249 172 693 637
The residual values of property, plant and equipment have been assessed to be immaterial, as a result they have not been considered in the calculation of the depreciable amount.
182

ANNUAL REPORT 2012/13 ROAD TRAFFIC INFRINGEMENT AGENCY
ChangeAhead
ANNUAL REPORT 2012/13 ROAD TRAFFIC INFRINGEMENT AGENCY
NOTES TO THE FINANCIAL STATEMENTSfor the year ended 31 March 2013
Computersoftware and
licenses
Website development
costsTotal
R R R
4. Intangible assets
31 March 2013Cost 53 440 20 000 73 440
Accumulated amortization (31 003) (8 114) (39 117)
Net carrying value 22 437 11 886 34 323
Movement summary
Opening net carrying value 38 585 18 557 57 142
Additions - - -
Amortization (16 148) (6 671) (22 819)
Closing net carrying value 22 437 11 886 34 323
183
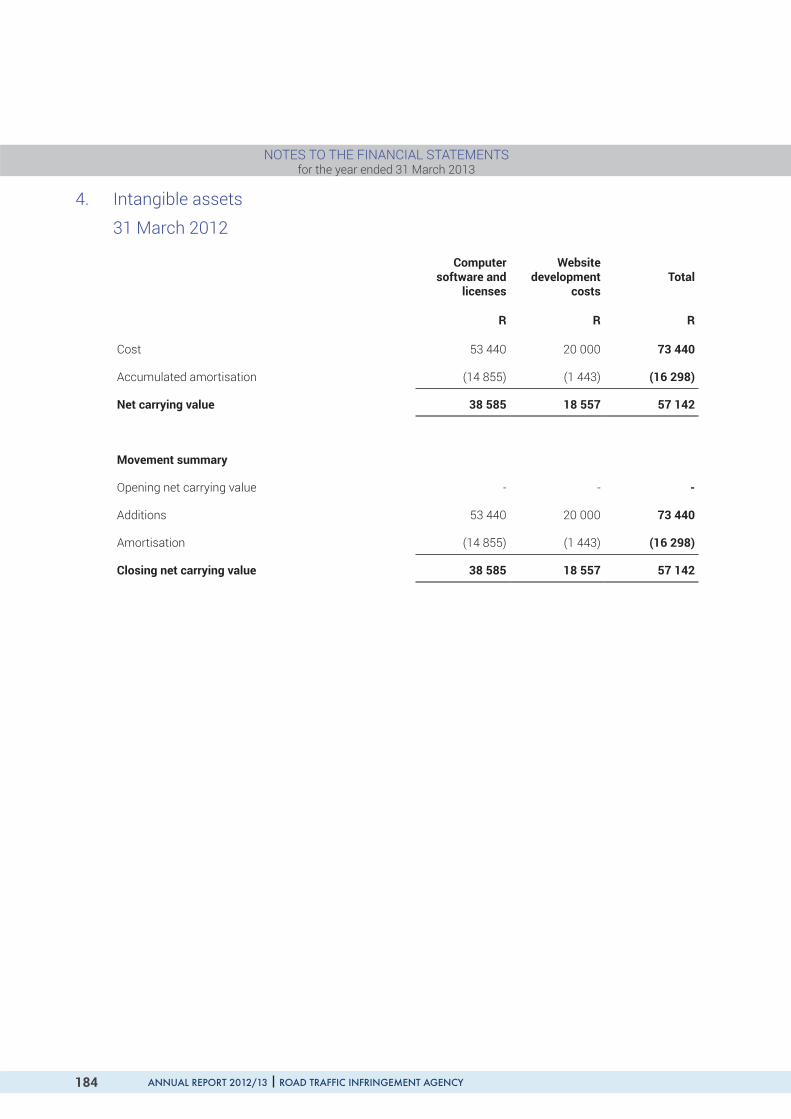
ANNUAL REPORT 2012/13 ROAD TRAFFIC INFRINGEMENT AGENCYANNUAL REPORT 2012/13 ROAD TRAFFIC INFRINGEMENT AGENCY
NOTES TO THE FINANCIAL STATEMENTSfor the year ended 31 March 2013
4. Intangible assets
31 March 2012
Computersoftware and
licenses
Website development
costsTotal
R R R
Cost 53 440 20 000 73 440
Accumulated amortisation (14 855) (1 443) (16 298)
Net carrying value 38 585 18 557 57 142
Movement summary
Opening net carrying value - - -
Additions 53 440 20 000 73 440
Amortisation (14 855) (1 443) (16 298)
Closing net carrying value 38 585 18 557 57 142
184

ANNUAL REPORT 2012/13 ROAD TRAFFIC INFRINGEMENT AGENCY
ChangeAhead
ANNUAL REPORT 2012/13 ROAD TRAFFIC INFRINGEMENT AGENCY
NOTES TO THE FINANCIAL STATEMENTSfor the year ended 31 March 2013
2013 2012
R R
5. Trade and other receivables
Deposit 1 426 128 -
Prepayments 2 689 1 542 301
Other receivables - 5 307 980
1 428 817 6 850 281
A deposit was made to the South African Post Of ce for opening an account.
Other receivables relates to the amount of the infringement fees collected by the Road Traf c Management Corporation (RTMC) on behalf of the Agency. RTMC is the custodian of the AARTO bank accounts in which infringement fees are paid into by the infringers and issuing authorities.
Other receivable are shown net of an impairment loss amounting to R31 164 022 (2012: R nil).
Other receivables impaired
As of 31 March 2013, other receivables of R31 164 022 (2012: R nil) were impaired and provided for.
The ageing of amounts past due and provided for is as follows:
0 – 60 days 8 359 969 -
60 – 90 days 3 727 409 -
90 + days 19 076 644 -
31 164 022 -
Other receivables which are less than 60 days past due were not considered to be impaired at 31 March 2013.
However management performed a further assessment in the post balance sheet period which resulted in indicators of impairment. As a result these amounts have been subsequently impaired.
Reconciliation of allowance on impairment
Balance at the beginning of the year - -
Allowance on impairment 31 164 022 -
Balance at the end of the year - -
31 164 022 -
185

ANNUAL REPORT 2012/13 ROAD TRAFFIC INFRINGEMENT AGENCYANNUAL REPORT 2012/13 ROAD TRAFFIC INFRINGEMENT AGENCY
NOTES TO THE FINANCIAL STATEMENTSfor the year ended 31 March 2013
2013 2012
R R
6. Cash and cash equivalents
Cash and cash equivalents comprise of:
Bank balance 13 202 792 46
7. Trade and other payables
Trade payables 806 776 5 613
Other payables 795 832 -
Board fees accrual - 134 259
General accruals 71 086 922 284
Leave pay accrual 552 077 79 271
Payroll accruals 83 629 125 318
Lease payments accrual 74 790 53 558
2 384 190 1 320 303
Other payables relates to expenses incurred by the RTMC on behalf of the Agency.
186

ANNUAL REPORT 2012/13 ROAD TRAFFIC INFRINGEMENT AGENCY
ChangeAhead
ANNUAL REPORT 2012/13 ROAD TRAFFIC INFRINGEMENT AGENCY
NOTES TO THE FINANCIAL STATEMENTSfor the year ended 31 March 2013
2013 2012
R R
8. Revenue
Infringement fees 49 011 052 28 579 863
- Collected Infringements 42 507 811 24 210 547
- Courtesy Fees 4 853 160 4 153 884
- Enforcement Fees 1 550 631 150 563
- Partial Payment Penalty Fees 85 650 64 364
- Unsuccessful Representation Fees 13 800 505
Grant received 19 000 000 17 000 000
- MTEF Allocation 5 000 000 5 000 000
- Virement received 14 000 000 12 000 000
68 011 052 45 579 863
The virement represents an additional government grant received over and above the Medium Term Expenditure Framework (“MTEF”) allocation. This is a once off grant that was made to meet the operational requirements of the Agency not met by the MTEF allocation and cash received from revenue receipts.
187
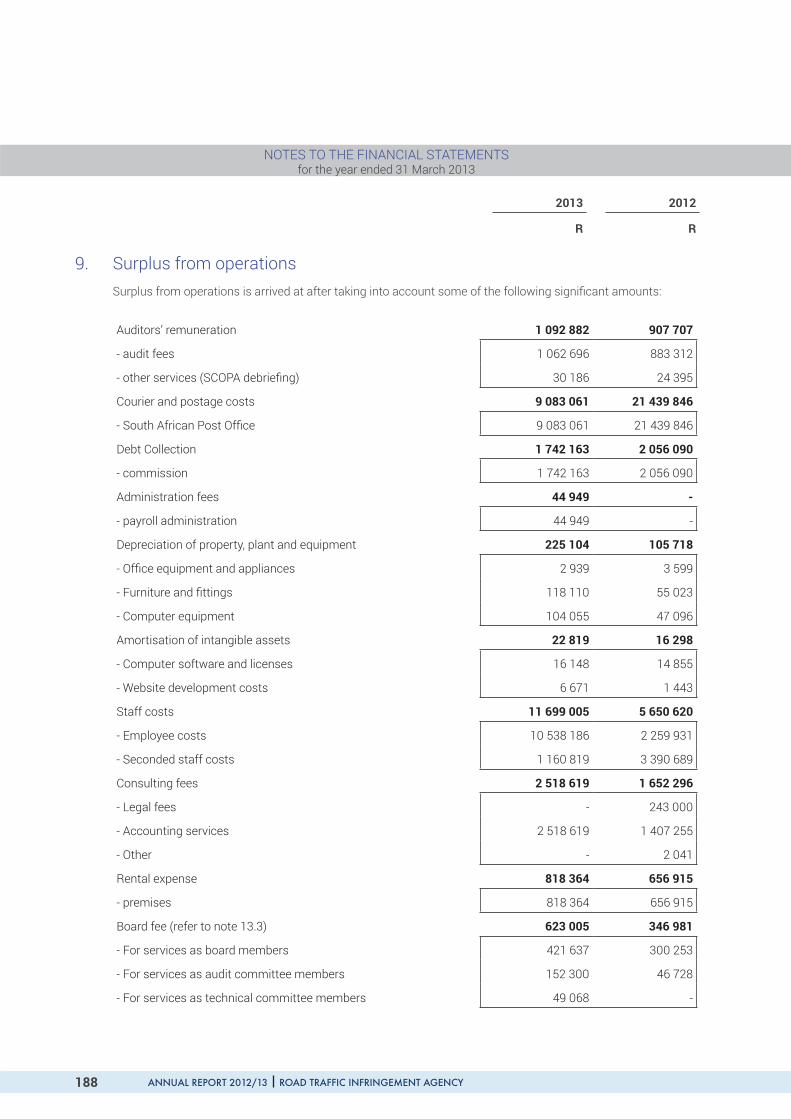
ANNUAL REPORT 2012/13 ROAD TRAFFIC INFRINGEMENT AGENCYANNUAL REPORT 2012/13 ROAD TRAFFIC INFRINGEMENT AGENCY
NOTES TO THE FINANCIAL STATEMENTSfor the year ended 31 March 2013
2013 2012
R R
9. Surplus from operationsSurplus from operations is arrived at after taking into account some of the following signi cant amounts:
Auditors’ remuneration 1 092 882 907 707
- audit fees 1 062 696 883 312
- other services (SCOPA debrie ng) 30 186 24 395
Courier and postage costs 9 083 061 21 439 846
- South African Post Of ce 9 083 061 21 439 846
Debt Collection 1 742 163 2 056 090
- commission 1 742 163 2 056 090
Administration fees 44 949 -
- payroll administration 44 949 -
Depreciation of property, plant and equipment 225 104 105 718
- Of ce equipment and appliances 2 939 3 599
- Furniture and ttings 118 110 55 023
- Computer equipment 104 055 47 096
Amortisation of intangible assets 22 819 16 298
- Computer software and licenses 16 148 14 855
- Website development costs 6 671 1 443
Staff costs 11 699 005 5 650 620
- Employee costs 10 538 186 2 259 931
- Seconded staff costs 1 160 819 3 390 689
Consulting fees 2 518 619 1 652 296
- Legal fees - 243 000
- Accounting services 2 518 619 1 407 255
- Other - 2 041
Rental expense 818 364 656 915
- premises 818 364 656 915
Board fee (refer to note 13.3) 623 005 346 981
- For services as board members 421 637 300 253
- For services as audit committee members 152 300 46 728
- For services as technical committee members 49 068 -
188
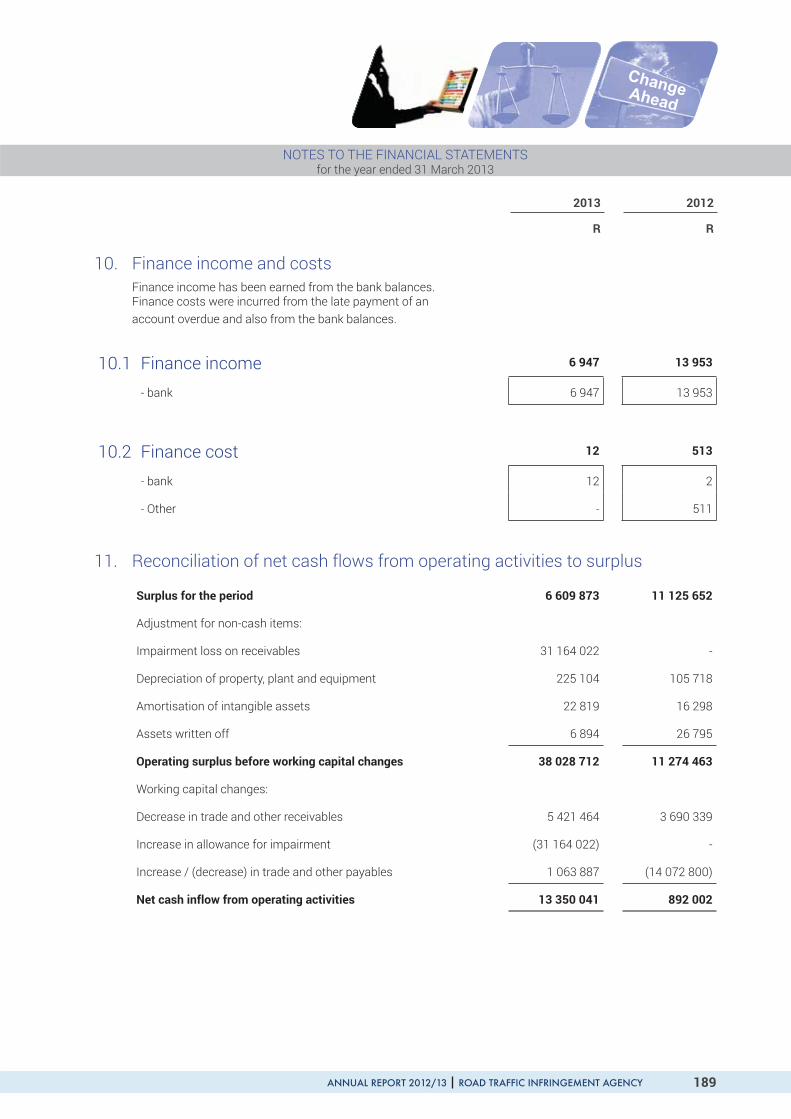
ANNUAL REPORT 2012/13 ROAD TRAFFIC INFRINGEMENT AGENCY
ChangeAhead
ANNUAL REPORT 2012/13 ROAD TRAFFIC INFRINGEMENT AGENCY
NOTES TO THE FINANCIAL STATEMENTSfor the year ended 31 March 2013
2013 2012
R R
10. Finance income and costsFinance income has been earned from the bank balances.Finance costs were incurred from the late payment of anaccount overdue and also from the bank balances.
10.1 Finance income 6 947 13 953
- bank 6 947 13 953
10.2 Finance cost 12 513
- bank 12 2
- Other - 511
11. Reconciliation of net cash flows from operating activities to surplus
Surplus for the period 6 609 873 11 125 652
Adjustment for non-cash items:
Impairment loss on receivables 31 164 022 -
Depreciation of property, plant and equipment 225 104 105 718
Amortisation of intangible assets 22 819 16 298
Assets written off 6 894 26 795
Operating surplus before working capital changes 38 028 712 11 274 463
Working capital changes:
Decrease in trade and other receivables 5 421 464 3 690 339
Increase in allowance for impairment (31 164 022) -
Increase / (decrease) in trade and other payables 1 063 887 (14 072 800)
Net cash in ow from operating activities 13 350 041 892 002
189

ANNUAL REPORT 2012/13 ROAD TRAFFIC INFRINGEMENT AGENCYANNUAL REPORT 2012/13 ROAD TRAFFIC INFRINGEMENT AGENCY
NOTES TO THE FINANCIAL STATEMENTSfor the year ended 31 March 2013
12. Operating lease commitments
Non-cancellable operating leases for future minimum lease payments are as follows:
31 March 2013
Building Parking Total
Due within 1 year 734 256 114 045 848 301
Between 1 and 5 years 187 833 29 174 217 007
922 089 143 219 1 065 308
31 March 2012
Building Parking Total
Due within 1 year 667 505 103 677 771 182
Between 1 and 5 years 922 089 143 219 1 065 308
1 589 594 246 896 1 836 490
RTIA entered into an operating lease agreement with the Public Investment Corporation on 1 July 2011.
The RTIA occupies of ce premises in the Waterfall Of ce Park which are under an operating lease. The parking lease relates to the rental of the parking bays in the leased property. The lease agreement period is three years, and is subject to an escalation clause at 10% per annum.
190

ANNUAL REPORT 2012/13 ROAD TRAFFIC INFRINGEMENT AGENCY
ChangeAhead
ANNUAL REPORT 2012/13 ROAD TRAFFIC INFRINGEMENT AGENCY
NOTES TO THE FINANCIAL STATEMENTSfor the year ended 31 March 2013
13.
Regi
stra
r and
Key
Man
agem
ent R
emun
erat
ion
31
Mar
ch 2
013
13.1
Re
gist
rar
Basi
cSa
lary
Serv
ice
Bonu
sAc
ting
Allo
wan
ce
Non
Pens
iona
ble
Cash
Mot
orVe
hicl
eAl
low
ance
Hou
sing
Allo
wan
ce
Cont
ribut
ions
to P
ensi
onSc
hem
e
Cont
ribut
ions
to M
edic
alSc
hem
e
Oth
erCo
sts
Tota
l
JR C
huw
e93
487
6-
-14
665
116
828
810
000
010
874
516
560
8173
21
556
852
934
876
--
146
651
168
288
100
000
108
745
16 5
6081
732
1 55
6 85
2
13.2
Ke
y m
anag
emen
t
*C M
atjie
--
364
020
--
--
-22
045
386
065
G B
otha
181
437
--
--
--
-2
112
183
549
SM A
mos
555
227
--
92 0
7418
654
0-
72 1
80-
15 0
4692
106
7
MLT
Bili
kwan
a 43
6 63
2-
-46
010
75 0
0010
8 85
855
682
-12
449
734
631
KF P
ooe
415
788
--
13 6
7810
9 32
497
815
54 0
52-
7 47
469
8 13
1
LV M
asan
go
422
644
--
63 4
5492
556
68 2
0154
945
-7
607
709
407
*J M
mek
oa-
-15
8 68
1-
--
--
14 8
4317
3 52
4
*F M
alin
dzis
a-
-34
2 00
2-
--
--
10 9
9835
3 00
0
2 01
1 72
8-
864
703
215
216
463
420
274
874
236
859
-92
574
4 15
9 37
4
* M
embe
r of s
enio
r man
agem
ent s
econ
ded
from
the
Depa
rtm
ent o
f Tra
nspo
rt, t
here
fore
not
em
ploy
ees
of th
e Ag
ency
.
191

ANNUAL REPORT 2012/13 ROAD TRAFFIC INFRINGEMENT AGENCYANNUAL REPORT 2012/13 ROAD TRAFFIC INFRINGEMENT AGENCY
NOTES TO THE FINANCIAL STATEMENTSfor the year ended 31 March 2013
13.
Regi
stra
r and
Key
Man
agem
ent R
emun
erat
ion
31
Mar
ch 2
012
13.1
Re
gist
rar
Basi
cSa
lary
Serv
ice
Bonu
sAc
ting
Allo
wan
ce
Non
Pens
iona
ble
Cash
Mot
orVe
hicl
eAl
low
ance
Hou
sing
Allo
wan
ce
Cont
ribut
ions
to P
ensi
onSc
hem
e
Cont
ribut
ions
to M
edic
alSc
hem
e
Oth
erCo
sts
Tota
l
JR C
huw
e45
4 89
0-
585
597
59 2
7716
8 28
8-
57 9
7616
560
15 3
201
357
908
454
890
-58
5 59
759
277
168
288
-57
976
16 5
6015
320
1 35
7 90
8
13.2
Ke
y m
anag
emen
t
*C M
atjie
-
-11
331
1-
--
--
150
711
481
8
P Bu
thel
ezi
288
704
--
76 9
8011
5 48
9-
--
5 20
548
6 37
8
SM A
mos
504
233
--
84 0
6518
654
0-
6555
0-
849
484
8 88
2
TP N
thot
so
396
191
31 0
9613
9 77
717
577
-55
152
5080
47
500
978
670
7 88
3
MLT
Bili
kwan
a 34
260
--
1838
6-
-4
454
-62
657
726
1
223
388
31 0
9625
3 08
819
7 00
830
2 02
955
152
120
808
7 50
025
618
2 21
5 68
7
*Mem
ber o
f sen
ior m
anag
emen
t sec
onde
d fro
m th
e De
part
men
t of T
rans
port
, the
refo
re n
ot e
mpl
oyee
s of
the
Agen
cy.
192

ANNUAL REPORT 2012/13 ROAD TRAFFIC INFRINGEMENT AGENCY
ChangeAhead
ANNUAL REPORT 2012/13 ROAD TRAFFIC INFRINGEMENT AGENCY
NOTES TO THE FINANCIAL STATEMENTSfor the year ended 31 March 2013
2013 2012
R R
13.3 Non-executive directors
Board members fee
For services as board members of the Agency:
Board members
NE Rapoo (Chairman) 153 166 118 114
HG Motau - 38 419
IS Jordaan 46 728 68 610
CM Manzini 221 743 75 110
TE Dicker* - -
421 637 300 253
For services as audit committee members of the Agency:
Audit Committee members
B Chaplog (Chairman) 133 218 46 728
S Thomas 19 082 -
152 300 46 728
For services as technical committee members of the Agency:
Technical Committee members
TE Dicker*(Chairman) - -
J Mokgoro 16 356 -
B Matinise 32 712 -
49 068 -
623 005 346 981
*TE Dicker is a representative from the National Prosecuting Authority, therefore he is not remunerated for participation in the board meetings.
193

ANNUAL REPORT 2012/13 ROAD TRAFFIC INFRINGEMENT AGENCYANNUAL REPORT 2012/13 ROAD TRAFFIC INFRINGEMENT AGENCY
NOTES TO THE FINANCIAL STATEMENTSfor the year ended 31 March 2013
13.4 Details of service contracts in respect of directors
Appointment Resignation Term
Board members
NE Rapoo (Chairman) 1 August 2010 - 3 years
IS Jordaan 1 August 2010 26 July 2012 3 years
CM Manzini 1 August 2010 - 3 years
TE Dicker 1 August 2010 - 3 years
JR Chuwe (Registrar) 11 March 2010 - 5 years
Audit Committee members
B Chaplog (Chairman) 8 December 2011 - 3 years
S Thomas 1 November 2012 - 3 years
Technical Committee members
J Mokgoro 1 November 2012 - 3 years
B Matinise 1 November 2012 - 3 years
194

ANNUAL REPORT 2012/13 ROAD TRAFFIC INFRINGEMENT AGENCY
ChangeAhead
ANNUAL REPORT 2012/13 ROAD TRAFFIC INFRINGEMENT AGENCY
NOTES TO THE FINANCIAL STATEMENTSfor the year ended 31 March 2013
2013 2012
R R
14. Related parties
14.1 Related party transactions
Revenue
- Department of Transport 19 000 000 17 000 000
14.2 Related party balances
Amounts owed by related party
Road Traf c Management Corporation
- Prepayments - 98 538
- Other receivables 31 164 024 5 307 980
31 164 024 5 460 518
Amounts owed to related party
Road Traf c Management Corporation
- Other payable 795 832 -
- Payroll accrual - 21 527
795 832 21 527
195

ANNUAL REPORT 2012/13 ROAD TRAFFIC INFRINGEMENT AGENCYANNUAL REPORT 2012/13 ROAD TRAFFIC INFRINGEMENT AGENCY
NOTES TO THE FINANCIAL STATEMENTSfor the year ended 31 March 2013
2013 2012
R R
15. Fruitless and Wasteful Expenditure
15.1 PABX Machine 37 059 18 530
A PABX machine was acquired with an intention to connecttelephone lines when the Agency moved out of the TASIMA premises into its own leased premises. Due to nancial constraints the Agency requested the Department of Transport to provide the telephone service to the Agencyfrom the eNaTIS site at no costs. As a result of this agreement, the PABX machine that had been acquired prior to the arrangement with the Department of Transport was redundant. However the Agency will be utilizing the machine in the future when proper infrastructure has been acquired.
15.3 Rental of telephone lines 10 414 23 758
Telephone lines were rented with the same intention as per the acquisition of the PABX machine (refer to note 15.1). The rental agreement of these lines has been terminated.
15.4 Software license - 3 785
In the prior year the Agency’s payroll function was performed by the RTMC. A software license for a payroll system was acquired with the intention of taking over the payroll function from the RTMC. Due to nancial constraints the Agency has not been able to
setup its own human resource function. Subsequently this license has not been renewed with the service provider.
47 473 46 073
196

ANNUAL REPORT 2012/13 ROAD TRAFFIC INFRINGEMENT AGENCY
ChangeAhead
ANNUAL REPORT 2012/13 ROAD TRAFFIC INFRINGEMENT AGENCY
NOTES TO THE FINANCIAL STATEMENTSfor the year ended 31 March 2013
2013 2012
R R
16. Irregular expenditure
Goods and services with a transaction value between 83 954 - R2 000 and R10 000 were procured without inviting at least three written price quotations from prospective suppliers and the deviation was not approved as per the National Treasury Practice Note 8 of 2007/2008.
Procurement of goods and services without 31 830 -a decision memorandum as required in terms of theTreasury Regulations Section 8.2.1 and 8.2.2.
Goods and services procured without the declaration of 40 950 - Interest in the SBD4 form.
In terms of the Preferential Procurement Regulations, 2011 398 195 -
an organ of state must:
(a) prior to making an invitation for tenders determine and stipulate the appropriate preference point system to be utilized in the evaluation and adjudication of the tenders (section 3(b))
(b) indicate if the tender will be evaluated on functionality(Section 4 (1))
(c) when evaluating for functionality the following must beclearly speci ed in the invitation (section 4 (3))
- evaluation criteria for measuring functionality;
- weight of each criterion;
- applicable values; and
- minimum qualifying score for functionality
the above requirements were not complied with in making
the request for quotations.
Closing balance 554 929 -
The irregular expenditure for the 2012 and 2011 nancial year ends has been condoned by the
Department of Transport.
197

ANNUAL REPORT 2012/13 ROAD TRAFFIC INFRINGEMENT AGENCYANNUAL REPORT 2012/13 ROAD TRAFFIC INFRINGEMENT AGENCY
NOTES TO THE FINANCIAL STATEMENTSfor the year ended 31 March 2013
17. Financial Risk ManagementThe Agency’s principal nancial instruments comprise of trade payables, trade receivables and cash balances which arise directly from its operations. The main purpose of these nancial instruments is to fund the Agency’s day to day operations. The Agency is mainly exposed to the liquidity risk of the nancial instruments.
17.1 Fair value of nancial instruments
At 31 March 2013 the carrying amounts of the nancial assets and liabilities, approximates their fair value.
Carryingvalue2013
R
Fairvalue2013
R
Carryingvalue2012
R
Fairvalue2012
R
Assets
Trade and other receivables 1 428 817 1 428 817 6 850 281 6 850 281
Cash and cash equivalents 13 202 792 13 202 792 46 46
Liabilities
Trade and other payables 2 384 190 2 384 190 1 320 303 1 320 303
17.2 Liquidity risk management
Liquidity risk is the risk that the Agency will not be able to meet its nancial obligations as they fall due. The Agency’s approach to managing liquidity is to ensure, as far as possible, that it will always have suf cient liquidity to meet its liabilities when due, under both normal and stressed conditions, without incurring unacceptable losses or risking damage to the Agency’s reputation. This implies maintaining suf cient cash resources and the availability of funding through Medium Term Expenditure Framework. The Agency receives a guaranteed subsidy from National Treasury through the Medium Term Expenditure Framework allocation process to meet all its current and future obligations.
The Agency monitors its risk to a shortage of funds by using cash flow forecasting. The cash flow forecasting evaluates cash requirements over the foreseeable future, as well as expected cash flows from operations. Cash flow forecasts are prepared and adequate utilised borrowing facilities are monitored.
198

ANNUAL REPORT 2012/13 ROAD TRAFFIC INFRINGEMENT AGENCY
ChangeAhead
ANNUAL REPORT 2012/13 ROAD TRAFFIC INFRINGEMENT AGENCY
NOTES TO THE FINANCIAL STATEMENTSfor the year ended 31 March 2013
The following table details the Agency’s remaining contractual maturity for its nancial liabilities. The table has been drawn up based on the undiscounted cash flows of nancial liabilities based on the earliest date on which the Agency can be required to pay.
< 1 year 1-2 years 2-5 years > 5 years
31 March 2013 R R R R
Trade and other payables 2 384 190 - - -
31 March 2012
Trade and other payables 1 320 303 - - -
17.3 Market risk
The Agency was not exposed to any market risk factors during the current nancial year.
17.4 Credit risk management
Credit risk refers to the risk that counterparty will default on its contractual obligations, which will result in nancial loss to the Agency. The Agency has adopted a policy of dealing with creditworthy customers.
17.5 Maximum exposure to credit risk
The carrying amount of nancial assets recorded net of impairment allowance, represents the Agency’s maximum exposure to credit risk.
199

ANNUAL REPORT 2012/13 ROAD TRAFFIC INFRINGEMENT AGENCYANNUAL REPORT 2012/13 ROAD TRAFFIC INFRINGEMENT AGENCY
NOTES TO THE FINANCIAL STATEMENTSfor the year ended 31 March 2013
18. Financial instruments
2013Loans
andreceivables
Financialinstruments
carried atamortised
cost
Total nancial
instrumentscarrying
amounts
Non- nancial
instruments
Totalcarryingamount
R R R R R
Assets
Non-current assets - - - 643 257 643 257
Property, plant and equipment - - - 608 934 608 934
Intangible asset - - - 34 323 34 323
Current Assets 14 631 609 - 14 631 609 - 14 631 609
Trade and other receivables 1 428 817 - 1 428 817 - 1 428 817
Cash and cash equivalents 13 202 792 - 13 202 792 - 13 202 792
Total assets 14 631 609 - 14 631 609 643 257 15 274 866
Net assets and Liabilities
Net assets - - - 12 890 676 12 890 676
Accumulated surplus - - - 12 890 676 12 890 676
Current liabilities - 2 384 190 2 384 190 - 2 384 190
Trade and other payables - 2 384 190 2 384 190 - 2 384 190
Total net assets and liabilities - 2 384 190 2 384 190 12 890 676 15 274 866
Management believes that the fair value of the nancial instruments approximates their carrying amount.
200
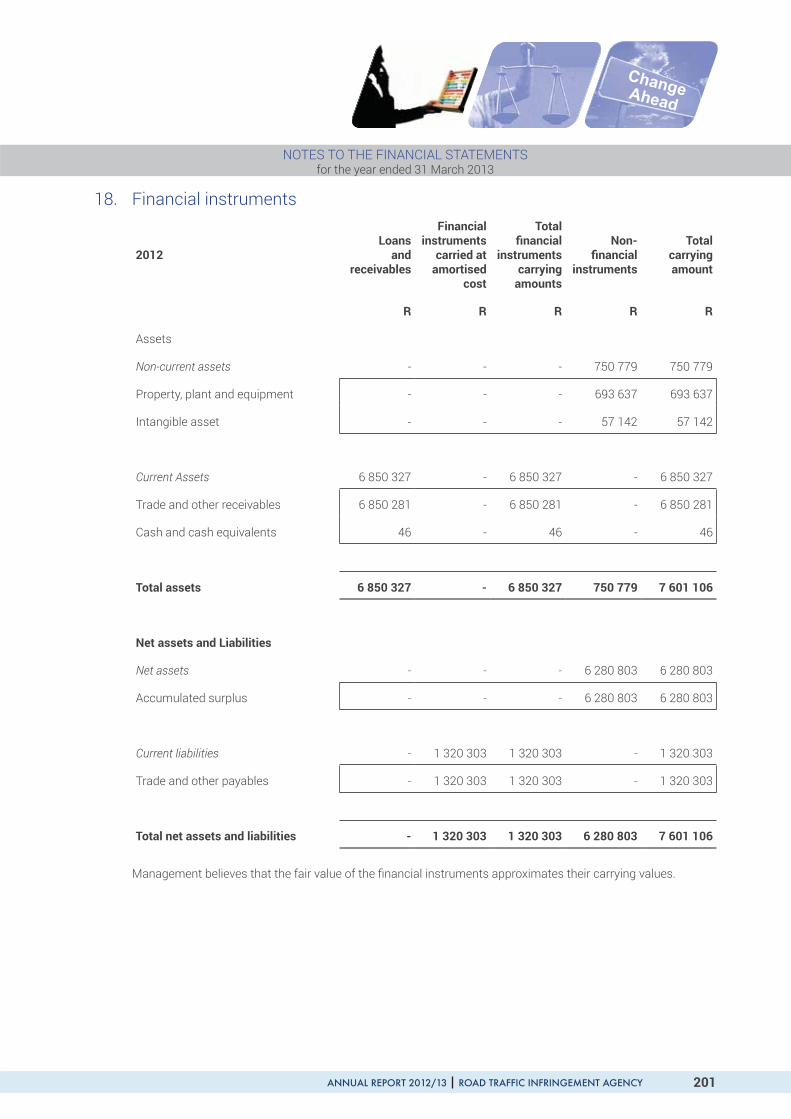
ANNUAL REPORT 2012/13 ROAD TRAFFIC INFRINGEMENT AGENCY
ChangeAhead
ANNUAL REPORT 2012/13 ROAD TRAFFIC INFRINGEMENT AGENCY
NOTES TO THE FINANCIAL STATEMENTSfor the year ended 31 March 2013
18. Financial instruments
2012Loans
andreceivables
Financialinstruments
carried atamortised
cost
Total nancial
instrumentscarrying
amounts
Non- nancial
instruments
Totalcarryingamount
R R R R R
Assets
Non-current assets - - - 750 779 750 779
Property, plant and equipment - - - 693 637 693 637
Intangible asset - - - 57 142 57 142
Current Assets 6 850 327 - 6 850 327 - 6 850 327
Trade and other receivables 6 850 281 - 6 850 281 - 6 850 281
Cash and cash equivalents 46 - 46 - 46
Total assets 6 850 327 - 6 850 327 750 779 7 601 106
Net assets and Liabilities
N et assets - - - 6 280 803 6 280 803
Accumulated surplus - - - 6 280 803 6 280 803
Current liabilities - 1 320 303 1 320 303 - 1 320 303
Trade and other payables - 1 320 303 1 320 303 - 1 320 303
Total net assets and liabilities - 1 320 303 1 320 303 6 280 803 7 601 106
Management believes that the fair value of the nancial instruments approximates their carrying values.
201
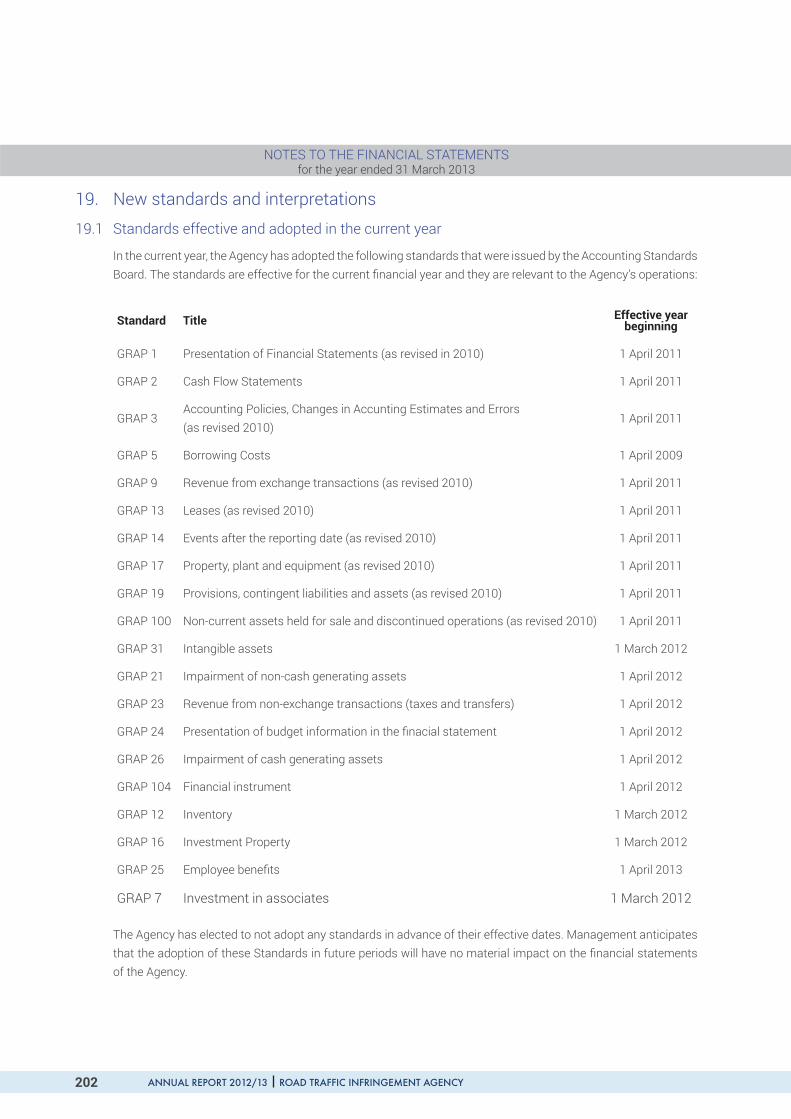
ANNUAL REPORT 2012/13 ROAD TRAFFIC INFRINGEMENT AGENCYANNUAL REPORT 2012/13 ROAD TRAFFIC INFRINGEMENT AGENCY
NOTES TO THE FINANCIAL STATEMENTSfor the year ended 31 March 2013
19. New standards and interpretations
19.1 Standards effective and adopted in the current year
In the current year, the Agency has adopted the following standards that were issued by the Accounting Standards Board. The standards are effective for the current nancial year and they are relevant to the Agency’s operations:
Standard Title Effective year beginning
GRAP 1 Presentation of Financial Statements (as revised in 2010) 1 April 2011
GRAP 2 Cash Flow Statements 1 April 2011
GRAP 3Accounting Policies, Changes in Accunting Estimates and Errors (as revised 2010)
1 April 2011
GRAP 5 Borrowing Costs 1 April 2009
GRAP 9 Revenue from exchange transactions (as revised 2010) 1 April 2011
GRAP 13 Leases (as revised 2010) 1 April 2011
GRAP 14 Events after the reporting date (as revised 2010) 1 April 2011
GRAP 17 Property, plant and equipment (as revised 2010) 1 April 2011
GRAP 19 Provisions, contingent liabilities and assets (as revised 2010) 1 April 2011
GRAP 100 Non-current assets held for sale and discontinued operations (as revised 2010) 1 April 2011
GRAP 31 Intangible assets 1 March 2012
GRAP 21 Impairment of non-cash generating assets 1 April 2012
GRAP 23 Revenue from non-exchange transactions (taxes and transfers) 1 April 2012
GRAP 24 Presentation of budget information in the nacial statement 1 April 2012
GRAP 26 Impairment of cash generating assets 1 April 2012
GRAP 104 Financial instrument 1 April 2012
GRAP 12 Inventory 1 March 2012
GRAP 16 Investment Property 1 March 2012
GRAP 25 Employee bene ts 1 April 2013
GRAP 7 Investment in associates 1 March 2012
The Agency has elected to not adopt any standards in advance of their effective dates. Management anticipates that the adoption of these Standards in future periods will have no material impact on the nancial statements of the Agency.
202

ANNUAL REPORT 2012/13 ROAD TRAFFIC INFRINGEMENT AGENCY
ChangeAhead
ANNUAL REPORT 2012/13 ROAD TRAFFIC INFRINGEMENT AGENCY
NOTES TO THE FINANCIAL STATEMENTSfor the year ended 31 March 2013
19.2 Interpretations effective in the current year and not yet adopted
The following interpretations were issued by the Accounting Standards Board and they are relevant to the Agency’s operations:
Standard Title Effective year beginning
IGRAP 1 Applying the probability test on initial recognition of exchange revenue 1 April 2013
IGRAP 1 Applying the Probability Test on Initial Recognition of exchange revenue 1 April 2009
IGRAP 3 Determining whether an arrangement contains a lease 1 April 2011
IGRAP 6 Loyalty programmes 1 April 2011
IGRAP 10 Assets received from customers 1 April 2011
IGRAP 13 Operating leases - Incentives 1 April 2011
IGRAP 14 Evaluating the substance of transaction involving the Legal form of a lease 1 April 2011
IGRAP8 Agreements for the Construction of Assets from Exchange Transactions 1 April 2009
IGRAP9 Distributions of Non-cash Assets to Owners 1 April 2011
IGRAP10 Assets Received from Customers 1 April 2011
IGRAP11 Consolidation - Special Purpose Entities -
IGRAP12 Jointly Controlled Entities - Non-Monerary Contributions by Venturers -
IGRAP13 Operating Leases – Incentives 1 April 2011
IGRAP15 Revenue - Barter Transactions Involving Advertising Services 1 April 2011
IGRAP16 Intangible Assets - Website Costs 1 April 2013
19.3 Standards in issue not yet adopted
At the date of authorisation of these nancial statements, the following standards were in issue but not yet effective. The effective date has not been determined by the Minister of Finance:
Standard Title Effective year beginning
GRAP 20 Related Party Disclosures -
GRAP 18 Segment Reporting -
GRAP 105 Transfer of Functions Between Entities Under Common Control -
GRAP 106 Transfer of Functions Between Entities Not Under Common Control -
GRAP 107 Mergers -
203

ANNUAL REPORT 2012/13 ROAD TRAFFIC INFRINGEMENT AGENCYANNUAL REPORT 2012/13 ROAD TRAFFIC INFRINGEMENT AGENCY
NOTES TO THE FINANCIAL STATEMENTSfor the year ended 31 March 2013
19.4 Pronouncements of other standard-setters
Standard Title Issued year
IFRS 7 Financial Instruments: Disclosures (with all subsequent amendments) August 2005
IAS 19 Employee Bene ts (with all subsequent amendments) February 1998
IAS 32 Financial Instruments: Presentation (with all subsequent amendments) December 2003
IAS 39Financial Instruments: Recognition and Measurement (with all subsequent amendments)
December 2003
20. Going concernThe annual nancial statements have been prepared on a going concern basis. This basis presumes that funds will be available to nance future operations of the Agency and that the realisation of assets and settlement of liabilities will occur in the ordinary course of business.
However we would like to draw your attention to note 8, which discloses a once off virement from the Department of Transport amounting to R14 million. Without this virement a de cit of R7 390 127 would have been incurred.
This is an indication that the Department of Transport will continue to support the Agency nancially as evidenced by the virement provided in the past two years.
21. Contingent LiabilitiesThe Agency is a defendant in a legal action involving the alleged failure to renew the specialised PrDP licence against the plaintiff Ngijulukile Logistics and Trading CC.
Management believes that based on legal advice obtained from the Agency legal advisors, the action can be successfully defended and therefore no losses (including for costs) will be incurred by the Agency. The matter has not set down in court during the course of the 2012/13 nancial year; therefore the matter is regarded to be pending a court date.
22. Retention of surplus for the periodThe National Treasury has approved the retention of the surplus for the period.
23. Events after balance sheet There were no matters which are material to the nancial affairs of the Agency that have occurred between the statement of nancial position date and the date of approval of the nancial statements.
24. Approval of nancial statementsThe nancial statements were approved by the board of directors and authorised for issue on 27 July 2013.
204

ANNUAL REPORT 2012/13 ROAD TRAFFIC INFRINGEMENT AGENCY
ChangeAhead
ANNUAL REPORT 2012/13 ROAD TRAFFIC INFRINGEMENT AGENCY
NOTES TO THE FINANCIAL STATEMENTSfor the year ended 31 March 2013
25. Reconciliation between the Statement of Financial Performance and the Budget for the year ended 31 March 2013
Actual Budget Variance
Revenue 68 011 052 50 000 000 18 011 052
Expenses 61 408 114 50 000 000 11 408 114Impairment loss on receivables 31 164 022 - 31 164 022Advertising and marketing 376 529 4 000 000 (3 623 471)Payroll administration 44 949 152 000 (107 051)Debt collection 1 742 163 800 000 942 163Audit fees 1 062 696 1 500 000 (437 304)Bank charges 56 541 22 000 34 541Catering 102 388 100 000 2 389Cleaning 2 420 - 2 420Computer expenses 11 359 500 000 (488 641)Consulting fees 2 530 280 2 700 000 (169 720)Consumables 24 204 100 000 (75 796)Courier and postage 9 083 061 20 696 000 (11 612 939)Depreciation 225 104 80 000 145 104Amortization 22 819 20 000 2 819Director fees 623 005 406 000 217 005Electricity 45 835 - 45 835Water and sewerage 48 058 50 000 (1 942)Insurance 8 028 - 8 028IT support costs 213 704 - 213 704Repairs and maintenance 44 595 250 000 (205 405)Printing and stationary 242 624 100 000 142 624Rent Paid 818 364 720 000 98 364Salaries 10 065 380 14 400 000 (4 334 620)Leave pay expense 472 806 - 472 806Staff training 15 375 154 000 (138 625)Staff seconded costs 1 160 820 - 1 160 820Employee bursaries - 500 000 (500 000)Subscriptions 15 478 - 15 478Cell phone costs 193 132 - 193 132Contractors - 1 500 000 (1 500 000)PABX Rental 37 059 - 37 059Legal fees - 1 000 000 (1 000 000)Telephone expenses 10 414 - 10 414Travel and accommodation 716 102 150 000 566 102Venues and facilities 65 421 50 000 15 421Research and development - 50 000 (50 000)Loss of revenue – Gauteng Law Administration 156 485 - 156 485Assets written off 6 894 - 6 894
Surplus from operations 6 602 938 - 6 602 938Finance income 6 947 - 6 947Finance costs (12) - (12)
6 609 873 - 6 609 873
The budgeted amounts were arrived at based on the National roll-out of AARTO. This implementation has been deferred to a future date. As a result there are signi cant variances between the budgeted amounts and the actual amounts.
205

ANNUAL REPORT 2012/13 ROAD TRAFFIC INFRINGEMENT AGENCY206
Abbreviations and AcronymsAARTO/(Act) Administrative Adjudication of Road Traf c Offences (Act)
AARTO 01 Infringement notice completed by hand at the roadside and served in person
AARTO 02 Infringement notice completed electronically at the roadside and served in person or by registered mail
AARTO 03 Infringement notice for camera and other infringements served by registered mail
AARTO 31 Notice in respect of unattended vehicle
AG Auditor-General
Agency Refers to the RTIA
CFO Chief Financial Of cer
CL/s Courtesy Letter/s
CPA Criminal Procedure Act
DLTC Driving Licence Testing Centre
DoJ & CD Department of Justice & Constitutional Development
EFT Electronic Funds Transfer
eNaTIS/NaTIS National Traf c Information System
EO/s Enforcement Order/s
EXCO Executive Committee of the Agency
FAR Fixed Asset Register
GRAP Generally Recognised Accounting Practise
GDoCS Gauteng Department of Community Safety
IA/s Issuing Authority/ies
IT Information Technology
JMPD Johannesburg Metropolitan Police Department
MOU Memorandum of Understanding
MTEF Medium Term Expenditure Framework
NCR National Contraventions Register
NDOT/DoT National Department of Transport
NRTA National Road Traf c Act
NT National Treasury
ANNUAL REPORT 2012/13 ROAD TRAFFIC INFRINGEMENT AGENCY
ChangeAhead
207
PDS Points Demerit System
PFMA Public Finance Management Act
PPP Public Private Partnerships
PrDP Professional Driving Permit
RO/s Representation Of cer/s
RTIA Road Traf c Infringement Agency
RTMC Road Traf c Management Corporation
RSA Republic of South Africa
SLA Service Level Agreement
SAPO South African Post Of ce
SAPS South African Police Service
SWOT Strengths, Weaknesses, Opportunities, Threats
TMPD Tshwane Metropolitan Police Department
TOR Terms of Reference
UNDoARS United Nations Decade of Action for Road Safety
VTS Vehicle Testing Station

ANNUAL REPORT 2012/13 ROAD TRAFFIC INFRINGEMENT AGENCY208
NOTES

Justice in Adjudication
ROAD TRAFFICINFRINGEMENT AGENCY
Waterfall Edge BHowick Close,Waterfall ParkBekker Road, Midrand
Tel: 011 256 1000Fax: 011 256 1011Fax: 086 620 7836
Website: www.rtia.co.zaemail: [email protected]
RP271/2013ISBN: 978-0-621-42185-9